Title I Unified Plan
64
NEW JERSEY DEPARTMENT OF EDUCATION OFFICE OF TITLE I 2015-2016 TITLE I SCHOOLWIDE PLAN* *This plan is only for Title I schoolwide programs that are not identified as a Priority or Focus Schools.
-
Upload
khangminh22 -
Category
Documents
-
view
1 -
download
0
Transcript of Title I Unified Plan

NEW JERSEY DEPARTMENT OF EDUCATION
OFFICE OF TITLE I
2015-2016 TITLE I SCHOOLWIDE PLAN*
*This plan is only for Title I schoolwide programs that are not identified as a Priority or Focus Schools.
SCHOOLWIDE SUMMARY INFORMATION - ESEA§1114
2
Principal’s Certification The following certification must be made by the principal of the school. Please Note: A signed Principal’s Certification must be scanned and included as part of the submission of the Schoolwide Plan. I certify that I have been included in consultations related to the priority needs of my school and participated in the completion of the Schoolwide Plan. As an active member of the planning committee, I provided input for the school’s Comprehensive Needs Assessment and the selection of priority problems. I concur with the information presented herein, including the identification of programs and activities that are funded by Title I, Part A.
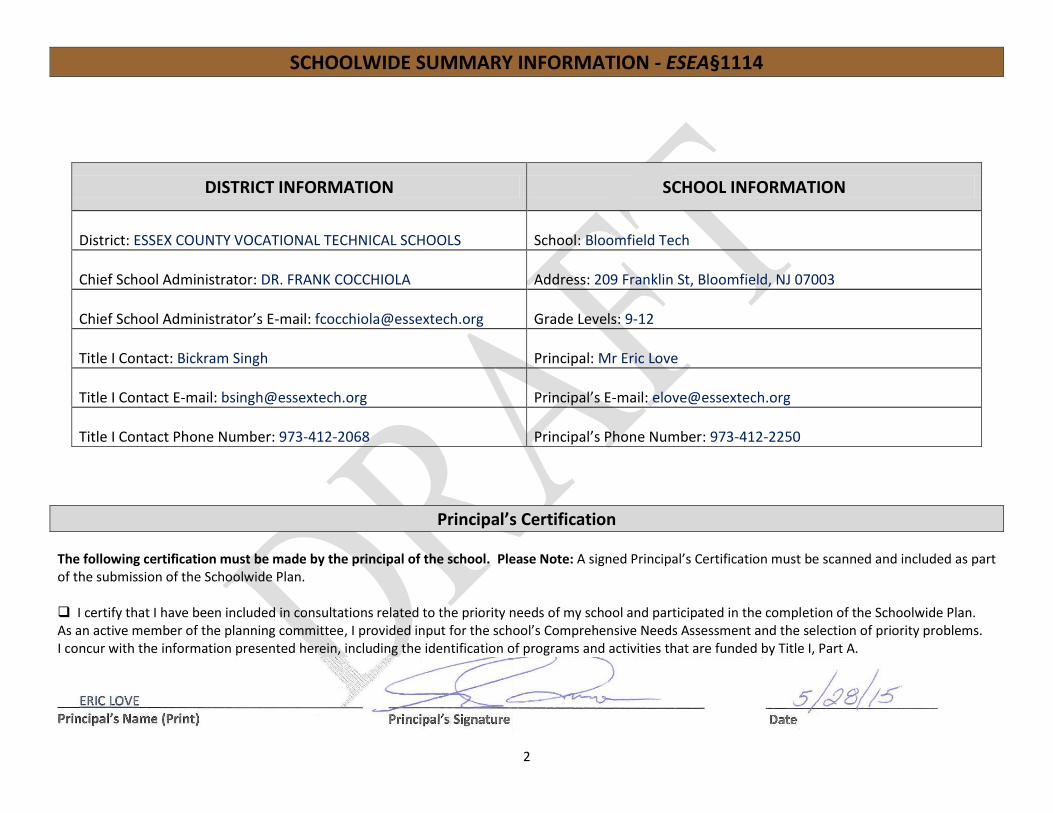
DISTRICT INFORMATION SCHOOL INFORMATION
District: ESSEX COUNTY VOCATIONAL TECHNICAL SCHOOLS School: Bloomfield Tech
Chief School Administrator: DR. FRANK COCCHIOLA Address: 209 Franklin St, Bloomfield, NJ 07003
Chief School Administrator’s E-mail: [email protected] Grade Levels: 9-12
Title I Contact: Bickram Singh Principal: Mr Eric Love
Title I Contact E-mail: [email protected] Principal’s E-mail: [email protected]
Title I Contact Phone Number: 973-412-2068 Principal’s Phone Number: 973-412-2250

SCHOOLWIDE SUMMARY INFORMATION - ESEA§1114
3
Critical Overview Elements
The School held ____36____________ (number) of stakeholder engagement meetings.
State/local funds to support the school were $ 40,413,969, which comprised 97.18% of the school’s budget in 2014-2015.
State/local funds to support the school will be $ 41,656,921 which will comprise 99.20% of the school’s budget in 2015-2016.
Title I funded programs/interventions/strategies/activities in 2015-2016 include the following:
Item Related to Priority
Problem # Related to
Reform Strategy Budget Line
Item (s) Approximate
Cost Salaries for math and LAL teachers 1 and 2 yes 100-100 $165,612
Parental Involvement 3 yes 200-100 100-600
$15,685
Academic Support 1 and 2 yes 100-100 $29,690
Instructional Supplies 1 and 2 yes 100-600 $4,750
Professional Development 1 and 2 yes 200-500 $4,620

SCHOOLWIDE COMPONENT: STAKEHOLDER ENGAGEMENT ESEA §1114(b)(2)(B)(ii)
4
ESEA §1114(b)(2)(B)(ii): “The comprehensive plan shall be . . . - developed with the involvement of parents and other members of the community to be served and individuals who will carry out such plan, including teachers, principals, and administrators (including administrators of programs described in other parts of this title), and, if appropriate, pupil services personnel, technical assistance providers, school staff, and, if the plan relates to a secondary school, students from such school;”
Stakeholder/Schoolwide Committee
Select committee members to develop the Schoolwide Plan. Note: For purposes of continuity, some representatives from this Comprehensive Needs Assessment stakeholder committee should be included in the stakeholder/schoolwide planning committee. Identify the stakeholders who participated in the Comprehensive Needs Assessment and/or development of the plan. Signatures should be kept on file in the school office. Print a copy of this page to obtain signatures. Please Note: A scanned copy of the Stakeholder Engagement form, with all appropriate signatures, must be included as part of the submission of the Schoolwide Plan. *Add lines as necessary.
Name Stakeholder Group
Participated in Comprehensive
Needs Assessment
Participated in Plan
Development
Participated in Program Evaluation
Signature
Dolores Wallace Parent Coordinator
Desiree Manning Parent-PTA President
Eric Love School Staff—Principal
Kristie Howard School Staff— Vice-Principal
Dr. Frank Cocchiola District-Staff Superintendent
Dicxiana Carbonell District Staff–Curriculum and Instruction
Bickram Singh District Staff–Program Accountability
Marybeth Landis District Staff—Math
John Dolan District Staff-Career & Technical Ed.
Kevin Jagniatkowski School Staff—Math teacher

SCHOOLWIDE COMPONENT: STAKEHOLDER ENGAGEMENT ESEA §1114(b)(2)(B)(ii)
5
Victoria Garrison School Staff—English teacher
Lisa Albano School Staff—Phy Ed teacher
Rebecca Morales School Staff—Science teacher
Miriam Diaz School Staff—Math teacher
Grisel Morales District Staff—LAL Specialist
Patricia Parisi School Staff—Guidance
Tennille Raney School Staff—Guidance
Diana Yamoah School Staff--Support
Russell Mattoon District Staff-Career & Technical Education
Lisa Ackershock School Staff—CTE teacher
Denise Restaino School Staff—CTE teacher
Turrell Jones School Staff—Math teacher
Steven A. Bezdecny, Ph.D. School Staff—Science teacher
Emily Bonilla School Staff—CTE teacher, ScIP member
Jennifer DaSilva School-Staff- Soc Stud teacher
ScIP member
Sandy Barrionuevo School-Staff- Soc Stud teacher
Salvatore Lima Teacher /district Staff – Sc Specialist
Cathleen Smith Teacher /district Staff – Soc Std Specialist

SCHOOLWIDE COMPONENT: STAKEHOLDER ENGAGEMENT ESEA §1114(b)(2)(B)(ii)
6
Stakeholder/Schoolwide Committee Meetings Purpose: The Stakeholder/Schoolwide Committee organizes and oversees the Comprehensive Needs Assessment process; leads the development of the schoolwide plan; and conducts or oversees the program’s annual evaluation. Stakeholder/Schoolwide Committee meetings should be held at least quarterly throughout the school year. List below the dates of the meetings during which the Stakeholder/Schoolwide Committee discussed the Comprehensive Needs Assessment, Schoolwide Plan development, and the Program Evaluation. Agenda and minutes of these meetings must be kept on file in the school and, upon request, provided to the NJDOE.
Date Location Topic Agenda on File Minutes on File
July 16, 2014 C.O Administrative Council, Principals meeting, QSAC, Summary of Teacher Evaluations. , Staffing, HSPA Analysis, HIB, Principal Evaluations., Prof. Dev.
Yes Yes
August 5, 19, 20, 27, 2014
C.O Staffing, New teacher Orientation Schedule, New Formative Evaluation, Policies, Website, Curriculum Matter, Teacher Evaluation. Revisions- Day 1 Program
Yes Yes
September 4, 9, 11, 18, 2014
C.O., WC Sept 22 Board Meeting, New Staffing, Mentoring, Monthly Meetings, New Science Dept. Chair, Return to district procedures, School Violence Awareness Week, Week of Respect
Yes Yes
October 2, 3, 7, 23, 29, 2014
C.O, Sch. Improvement, Mentors/Coaches, Monthly meeting, ESL program, PARCC Presentation, NJ SMART, IDE Consultants, SIOP Training, HSPA, Teachscape, SGO, PTA/PTSA, EVVRS Reporting, Student Failure procedure, Code of conduct, Principal/VP Goals, Calibration Update, Lesson Plans, EdConnect Technology inventory
Yes Yes
November 4, 13, 20, 24, 25, 2014
C.O., NT, WC Staffing, Teachscape, Testing, PARCC, Supv Obsrv., Standard 8 and 9 Naviance for SAT Prep, Summer Institute, End of Q1 LEP Students, NJCAN, JSTOR
Yes Yes

SCHOOLWIDE COMPONENT: STAKEHOLDER ENGAGEMENT ESEA §1114(b)(2)(B)(ii)
7
program, Academic Support, RAC walkthrough, Report Card Data, PD Requests, Student Suspensions and Absenteeism, Lesson Plans, edConnect, Framework for Teaching, Cycle 1 review, Admission Process
December 2, 10, 18, 2014
C.O, NT Grading guidelines, Grade book setup, Action plan for implementation, Principals Meeting, Policy Revision, Admission Process, edConnect, PARCC dates, Accessibility Features and Accommodations, Administrative Council Meetings
Yes Yes
January 6, 9, 13, 14, 29, 2015
WC, N13, C.O Staffing, Grading Procedures, Policy revision, Jan 16 SS PD day, admission process, TOY application Academic Support, AHSA training, SGO, WIA, JSTOR, PARCC Training, Benchmark assessment, RAC reviews, Administrative Council Meeting, IDE, CISCO
Yes Yes
February 5, 12, 27, 2015
CO, N13, WC Walk-Through, Policy Revision Website, PARCC preparation, administration, creating sessions for math and ELA, Reviewing of Cycle III data, OCR Secondary Admin Checklist
Yes Yes
March 3, 6, 2015 CO, N13 New School Project, PARCC, SGO, RAC3, SIP, Surveys, NJ School Digest, Prof. Dev. Sessions, ESL, Nurses, TNT-TBD, Benchmark Assessments, edConnect, non-tenure recommendations, Replacements for specific subjects, SAT registration
Yes Yes
April 7, 15, 2015 CO Terra Nova assessment, EOY assessment schedule revisions, Textbook needs, Policy Revision, Non-tenure teachers, replacements for September, April 10 SS Prof Dev day, AHSA, SAT, Student Athlete Cardiac Assessment. Walk-throughs, Curriculum Writing, CTE courses, Timeline for course request, mass enrolling, CTE staff reassignment, Consistency of reporting & dismissal time
Yes Yes

SCHOOLWIDE COMPONENT: STAKEHOLDER ENGAGEMENT ESEA §1114(b)(2)(B)(ii)
8
April 29, 2015 CO Needs assessment, Plan development, program evaluation
Yes Yes
May 5, 2015 CO Needs assessment, Plan development, program evaluation, Q3 performance, Academic Support, SAT prep, PARCC
Yes Yes
*Add rows as necessary.

SCHOOLWIDE COMPONENT: STAKEHOLDER ENGAGEMENT ESEA §1114(b)(2)(B)(ii)
9
School’s Mission
A collective vision that reflects the intents and purposes of schoolwide programs will capture the school’s response to some or all of these important questions:
What is our intended purpose?
What are our expectations for students?
What are the responsibilities of the adults who work in the school?
How important are collaborations and partnerships?
How are we committed to continuous improvement?
What is the school’s mission statement? The vision of the Essex County Vocational & Technical Schools, Bloomfield Campus is that all students are individuals capable of learning, and if they are provided with strong academic and technical instruction in a supportive environment are capable of achieving greatness.

SCHOOLWIDE COMPONENT: EVALUATION ESEA §1114(b)(2)(B)(iii)
10
24 CFR § 200.26(c): Core Elements of a Schoolwide Program (Evaluation). A school operating a schoolwide program must—(1) Annually evaluate the implementation of, and results achieved by, the schoolwide program, using data from the State's annual assessments and other indicators of academic achievement; (2) Determine whether the schoolwide program has been effective in increasing the achievement of students in meeting the State's academic standards, particularly for those students who had been furthest from achieving the standards; and (3) Revise the plan, as necessary, based on the results of the evaluation, to ensure continuous improvement of students in the schoolwide program.
Evaluation of 2014-2015 Schoolwide Program * (For schools approved to operate a schoolwide program in 2014-2015, or earlier)
1. Did the school implement the program as planned? Yes. The programs – curricular, instructional, professional development and parental involvement initiatives were successfully implemented. Minor modifications were made during the year as data was collected and analyzed. One area of challenge is the continuing quest to improve parental involvement.
2. What were the strengths of the implementation process? There was a strong accountability process where school and district leaders were held accountable for the completion of specific tasks as outlined in the district action plan. On a monthly basis, school leaders were asked to verify that specific indicators of success were completed by a pre-determined deadline. There were also frequent feedback sessions to monitor the progress of program implementation and to make adjustments when necessary. The plan relied heavily on the collection, disaggregation and analysis of student performance data throughout the year. With the implementation of a comprehensive assessment program, students were frequently assessed using locally developed benchmark and vendor driven instruments. The data was analyzed to identify and address students’ deficiencies. In addition, periodic snapshots of students’ performance were made to monitor student progress in all content areas throughout the year. Academic support was then offered to struggling students in a timely manner. There was also collaboration among stakeholders-administrators, teachers, parents and other community agencies to implement the plan. Teachers participated in meetings and training on the implementation of key initiatives, such as designing standards based lesson plans and assessments and using an electronic platform to administer periodic assessments. This facilitated more transparency of the process and gaining the support of staff.

SCHOOLWIDE COMPONENT: EVALUATION ESEA §1114(b)(2)(B)(iii)
11
3. What implementation challenges and barriers did the school encounter? Even though the school and district have always engaged in the building of capacity to sustain the successful implementation of programs, the limited number of administrators has been over stretched with added responsibilities. Often, timely reports on programs and the one to one dialogue with teachers were compromised as a result. In addition, it was challenging to get students to attend the academic support programs after school. Recruiting staff to work in the additional programs and securing board approval for them in a timely manner also presented challenges.
4. What were the apparent strengths and weaknesses of each step during the program(s) implementation?
The comprehensive assessment program has allowed the efficient collection of student performance data, which was analyzed to identify and address students’ deficiencies in a timely manner. Academic support was then offered in the before and after school programs and when necessary, during the school day. Using data to make decisions for placement, developing learning goals for accountability has also strengthened the instructional program. Moreover, there were frequent follow up meetings to monitor the progress and evaluate various initiatives-instructional and professional development. The regular use of supplemental instructional software by instructors and students to address deficiencies in math and language arts remained a challenge. There were also limitations on accessing programs due to lack of availability of technological devices such as laptop computers. Scheduling staff for professional development during the school day also posed logistical problems because of teacher availability and their other obligations. In addition, staff availability to work in the academic support program before and after school was an issue.
5. How did the school obtain the necessary buy-in from all stakeholders to implement the programs? The district promotes transparency and open processes in the implementation of programs. Teachers joined with administrators to participate in training sessions, which fostered trust and support among staff. There were also face to face training sessions with staff which allowed for candid feedback. In addition, representatives of the teachers’ association were members of various school panels, including the School Improvement Panel that monitored the implementation of programs and offered feedback for improvement. A concerted effort was made to maintain two-communication among stakeholders. Feedback on academic growth of students was generated and shared throughout the year. Administrators also conducted one to one dialogue with staff to offer technical support throughout the year.

SCHOOLWIDE COMPONENT: EVALUATION ESEA §1114(b)(2)(B)(iii)
12
6. What were the perceptions of the staff? What tool(s) did the school use to measure the staff’s perceptions? The staff is supportive of the school’s initiatives. This is indicated in their commitment to improved student outcomes. For its academic performance, the school has been recognized as a Title 1 Distinguished and Blue Ribbon school. It was nominated again to be honored as a Blue Ribbon school in 2015. The school has also achieved its performance goals for the past twelve years. The academic program has also been enhanced with students enrolled in AP classes in mathematics and English for the fourth consecutive year.
Domain % Rating
Physical Environment 94.3
Emotional Environment 68.6
Teaching and Learning 78.3
Relationships 79.0
Morale-School Community 91.4
Comm. Engagement 67.6
7. What were the perceptions of the community? What tool(s) did the school use to measure the community’s perceptions?
The community was supportive of the school. More students are applying to the school and requesting acceptance. Parents participated in school events such as attending back to school night and the school fair. They also attended monthly meetings to get updates on the progress of the school. In addition, over 96% of them logged into power school to monitor the performance of their children. Parents provided feedback to the district by completing a survey which was accessed from the district’s webpage.
8. What were the methods of delivery for each program (i.e. one-on-one, group session, etc.) Various methods were used to deliver the programs. There was emphasis on small group instruction and tutoring for struggling students that sometimes evolved to one-to-one assistance. The focus was on individual improvement. Technology was also leveraged to improve literacy with a one to one laptop initiative for groups of students. Even though ongoing support was provided to instructors throughout the year, training was done in small groups settings where participants gave candid feedback on the initiatives.
9. How did the school structure the interventions?
Student performance data was collected and analyzed throughout the year to identify and address deficiencies of individual students. These students were provided with academic support in the before and after school program for an additional hour of instruction in mathematics and language arts literacy. Additional support was also provided for a period during the school day. In addition, supplemental web based programs were used with laptop computers. Prior to their first year, incoming 9th graders were identified to attend a summer enrichment program for 4 weeks of instruction in which they were provided with focused instruction for four hours every day in mathematics and language arts. Emphasis was placed on using technology

SCHOOLWIDE COMPONENT: EVALUATION ESEA §1114(b)(2)(B)(iii)
13
to improve students’ knowledge and skills in the aforementioned content areas. In addition, identified 10th, 11th and 12th graders asked to attend summer academic support classes so that they could master required curricular standards at their respective grade levels.

SCHOOLWIDE COMPONENT: EVALUATION ESEA §1114(b)(2)(B)(iii)
14
10. How frequently did students receive instructional interventions? Students were identified and offered timely intervention throughout the year in the before and after school program and during the regular school day. Students attended classes for four days per week for an additional hour. Select students also attended classes in the summer for four hours a day for 5 weeks. In additional, students received targeted support in their regular scheduled classes.
11. What technologies did the school use to support the program?
There was always the emphasis on the use of technology in the delivery of programs. The assessment program consisted of assessments that were taken online. Students had access to and use computers in many of their courses, especially language arts where they were engaged in research projects. Students also used the TI-84, TI-Inspire calculators, smart boards and document cameras. Web based programs were also used to enhance and accelerate learning.
12. Did the technology contribute to the success of the program, and if so, how?
The use of technology had a tremendous impact to teaching and learning. The quality of instruction improved with the use of access to Internet resources, Moodle and the smartboard. Instructors researched and shared resources, lesson plans and planned interdisciplinary projects in the professional learning communities. Student engagement also improved with improved academic outcomes. Students worked more independently and took more control of their learning. With real time access to their performance, they continuously monitored their progress and made adjustments in a timely manner. Access to technology also accelerated the turnaround time to identify and address students’ deficiencies based on assessment data. The collection, disaggregation and analyses of data led to timely decision making in the improvement of key programs.
*Provide a separate response for each question.

SCHOOLWIDE COMPONENT: EVALUATION ESEA §1114(b)(2)(B)(iii)
15
Evaluation of 2014-2015 Student Performance State Assessments-Partially Proficient
Provide the number of students at each grade level listed below who scored partially proficient on state assessments for two years or more in English Language Arts and Mathematics, and the interventions the students received.
English Language Arts
2013-2014
2014-2015
Interventions Provided Describe why the interventions did or did not result in
proficiency (Be specific for each intervention).
Grade 11 0 6
Local Assess.
Students were provided with support prior to the results of state assessments. They attended summer academic support classes and received individualized support for an hour in the before and after school program.
Students attended academic support programs after school. Many improved in their performance-as of Q3, six students were still struggling in semester 2.
Grade 12 0 0
Students were provided with support prior to the results of state assessments. They attended summer academic support classes and received individualized support for an hour in the before and after school program.
All the students were proficient on the state test.
Mathematics 2013-2014
2014-2015
Interventions Provided Describe why the interventions did or did not result in
proficiency (Be specific for each intervention).
Grade 11 4 74
Students attended summer academic support classes and were provided with individualized support based on their scores in each standard. They also received additional instruction for a period during the school day and an hour in the afterschool program.
Students attended academic support programs after school and were provided with in class support. Many improved in their performance-as of Q3, five students were still struggling in semester 2.
Grade 12 1 4
Students were provided with individualized academic support that targeted their deficiencies in each standard during their scheduled class time. They also received additional instruction for a period during the school day and an hour in the before after school program.
The interventions were successful. All academic performance goals were achieved by all subgroups in mathematics in 2015. Only 4 students (3.1%) will graduate via the AHSA process in 2014-15.
SCHOOLWIDE COMPONENT: EVALUATION ESEA §1114(b)(2)(B)(iii)
16
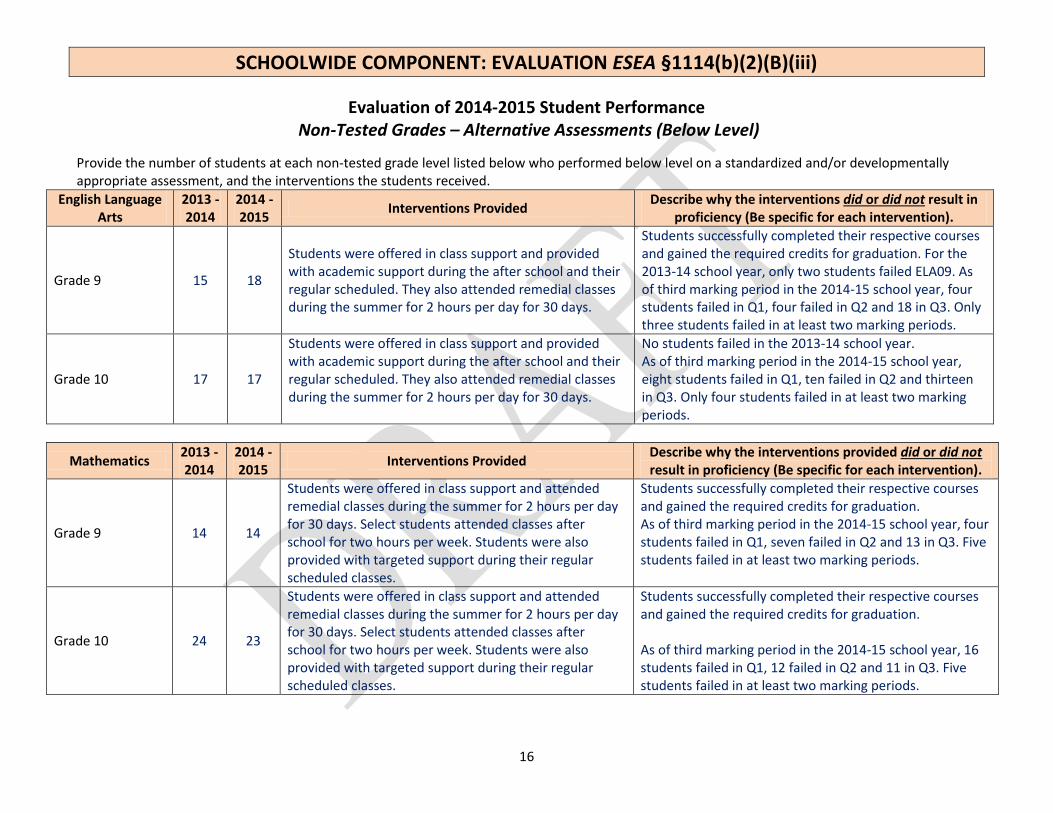
Evaluation of 2014-2015 Student Performance Non-Tested Grades – Alternative Assessments (Below Level)
Provide the number of students at each non-tested grade level listed below who performed below level on a standardized and/or developmentally appropriate assessment, and the interventions the students received.
English Language Arts
2013 -2014
2014 -2015
Interventions Provided Describe why the interventions did or did not result in
proficiency (Be specific for each intervention).
Grade 9 15 18
Students were offered in class support and provided with academic support during the after school and their regular scheduled. They also attended remedial classes during the summer for 2 hours per day for 30 days.
Students successfully completed their respective courses and gained the required credits for graduation. For the 2013-14 school year, only two students failed ELA09. As of third marking period in the 2014-15 school year, four students failed in Q1, four failed in Q2 and 18 in Q3. Only three students failed in at least two marking periods.
Grade 10 17 17
Students were offered in class support and provided with academic support during the after school and their regular scheduled. They also attended remedial classes during the summer for 2 hours per day for 30 days.
No students failed in the 2013-14 school year. As of third marking period in the 2014-15 school year, eight students failed in Q1, ten failed in Q2 and thirteen in Q3. Only four students failed in at least two marking periods.
Mathematics 2013 -2014
2014 -2015
Interventions Provided Describe why the interventions provided did or did not result in proficiency (Be specific for each intervention).
Grade 9 14 14
Students were offered in class support and attended remedial classes during the summer for 2 hours per day for 30 days. Select students attended classes after school for two hours per week. Students were also provided with targeted support during their regular scheduled classes.
Students successfully completed their respective courses and gained the required credits for graduation. As of third marking period in the 2014-15 school year, four students failed in Q1, seven failed in Q2 and 13 in Q3. Five students failed in at least two marking periods.
Grade 10 24 23
Students were offered in class support and attended remedial classes during the summer for 2 hours per day for 30 days. Select students attended classes after school for two hours per week. Students were also provided with targeted support during their regular scheduled classes.
Students successfully completed their respective courses and gained the required credits for graduation. As of third marking period in the 2014-15 school year, 16 students failed in Q1, 12 failed in Q2 and 11 in Q3. Five students failed in at least two marking periods.

SCHOOLWIDE COMPONENT: EVALUATION ESEA §1114(b)(2)(B)(iii)
17
Evaluation of 2014-2015 Interventions and Strategies
Interventions to Increase Student Achievement – Implemented in 2014-2015
1 Content
2 Group
3 Intervention
4 Effective Yes-No
5 Documentation of Effectiveness
6 Measurable Outcomes
(Outcomes must be quantifiable)
ELA, Math Science
Grades 9-12
Using Research based Instructional Strategies -Cooperative Learning -Homework and Practice - Setting Objectives and Providing Feedback
- Reinforcing Effort and Providing Recognition
- Summarizing and Note Taking - Identifying Similarities and Differences - Nonlinguistic Representations
Yes
Improved student performance on local and state assessments Differentiation of lesson design and delivery to address diverse learners Standards based lesson plans submitted Effective ratings on observations
Struggling students were identified and addressed in a timely manner. They attended academic support programs, which improved their performance. For all completed courses in the 2014-15 school year, 11 students failed their courses, including three in mathematics. Students continued to perform well on the state test. For the five of the last six years, 100% of the students were proficient in language arts literacy while over 90% of them were proficient in mathematics. Students also took the AP Literature and AP Calculus exam in 2014.
Math
Grades 9-12
Using student assessment data to improve teaching and learning - Continuously using student data
(formative and summative assessments) to inform and differentiate instruction to meet the academic needs of individual students.
yes
Using EdConnect to administer benchmark assessments Collecting and analyzing assessment student performance data Developing performance trend of students in class and school, including disaggregation of data by subgroups
Students’ individual needs were identified and addressed in a timely manner. Interventions were implemented and the student progress was monitored. All instructors logged into EdConnect and used performance data in their classroom to inform their instruction.
All content areas
Grades 9-12
Teaching students to examine their own data and set learning goals - Explaining expectations and assessment
criteria.
Yes Developing students’ performance targets Students monitoring their performance using their individual
Students monitored their progress throughout the year. Over 85% of them logged into Power Scholl to get feedback and follow their progress in
SCHOOLWIDE COMPONENT: EVALUATION ESEA §1114(b)(2)(B)(iii)
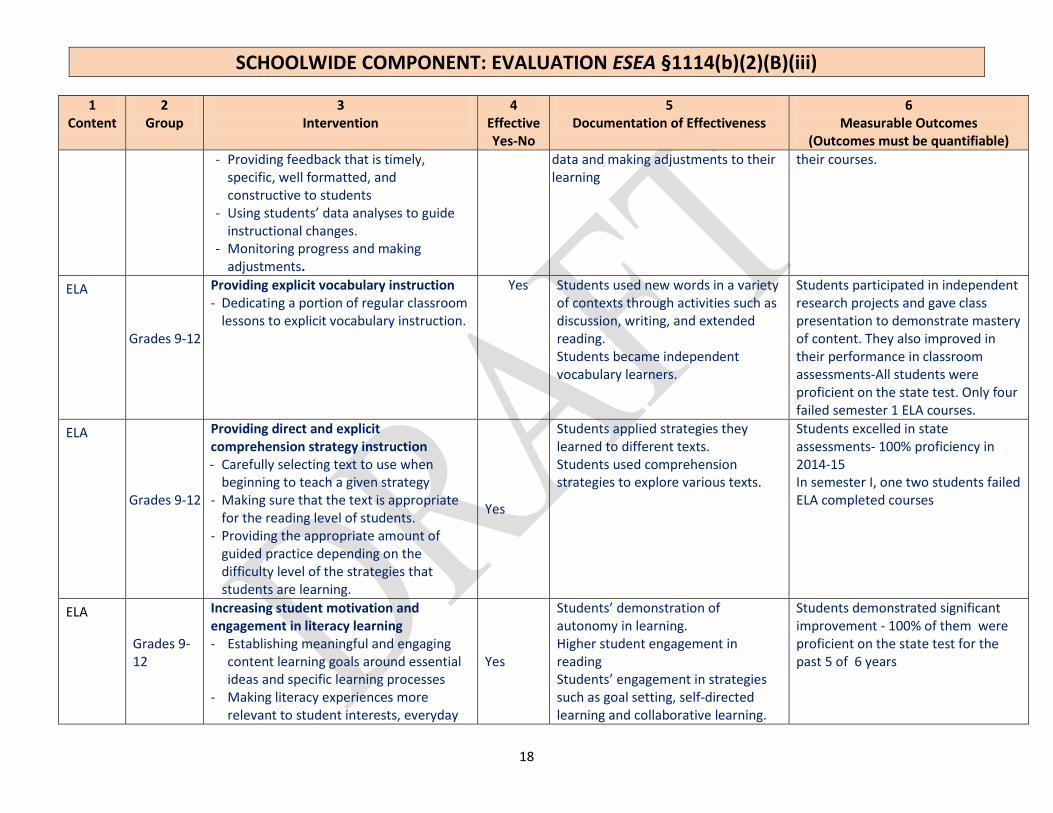
18
1 Content
2 Group
3 Intervention
4 Effective Yes-No
5 Documentation of Effectiveness
6 Measurable Outcomes
(Outcomes must be quantifiable)
- Providing feedback that is timely, specific, well formatted, and constructive to students
- Using students’ data analyses to guide instructional changes.
- Monitoring progress and making adjustments.
data and making adjustments to their learning
their courses.
ELA
Grades 9-12
Providing explicit vocabulary instruction - Dedicating a portion of regular classroom
lessons to explicit vocabulary instruction.
Yes Students used new words in a variety of contexts through activities such as discussion, writing, and extended reading. Students became independent vocabulary learners.
Students participated in independent research projects and gave class presentation to demonstrate mastery of content. They also improved in their performance in classroom assessments-All students were proficient on the state test. Only four failed semester 1 ELA courses.
ELA
Grades 9-12
Providing direct and explicit comprehension strategy instruction - Carefully selecting text to use when
beginning to teach a given strategy - Making sure that the text is appropriate
for the reading level of students. - Providing the appropriate amount of
guided practice depending on the difficulty level of the strategies that students are learning.
Yes
Students applied strategies they learned to different texts. Students used comprehension strategies to explore various texts.
Students excelled in state assessments- 100% proficiency in 2014-15 In semester I, one two students failed ELA completed courses
ELA
Grades 9-12
Increasing student motivation and engagement in literacy learning - Establishing meaningful and engaging
content learning goals around essential ideas and specific learning processes
- Making literacy experiences more relevant to student interests, everyday
Yes
Students’ demonstration of autonomy in learning. Higher student engagement in reading Students’ engagement in strategies such as goal setting, self-directed learning and collaborative learning.
Students demonstrated significant improvement - 100% of them were proficient on the state test for the past 5 of 6 years
SCHOOLWIDE COMPONENT: EVALUATION ESEA §1114(b)(2)(B)(iii)
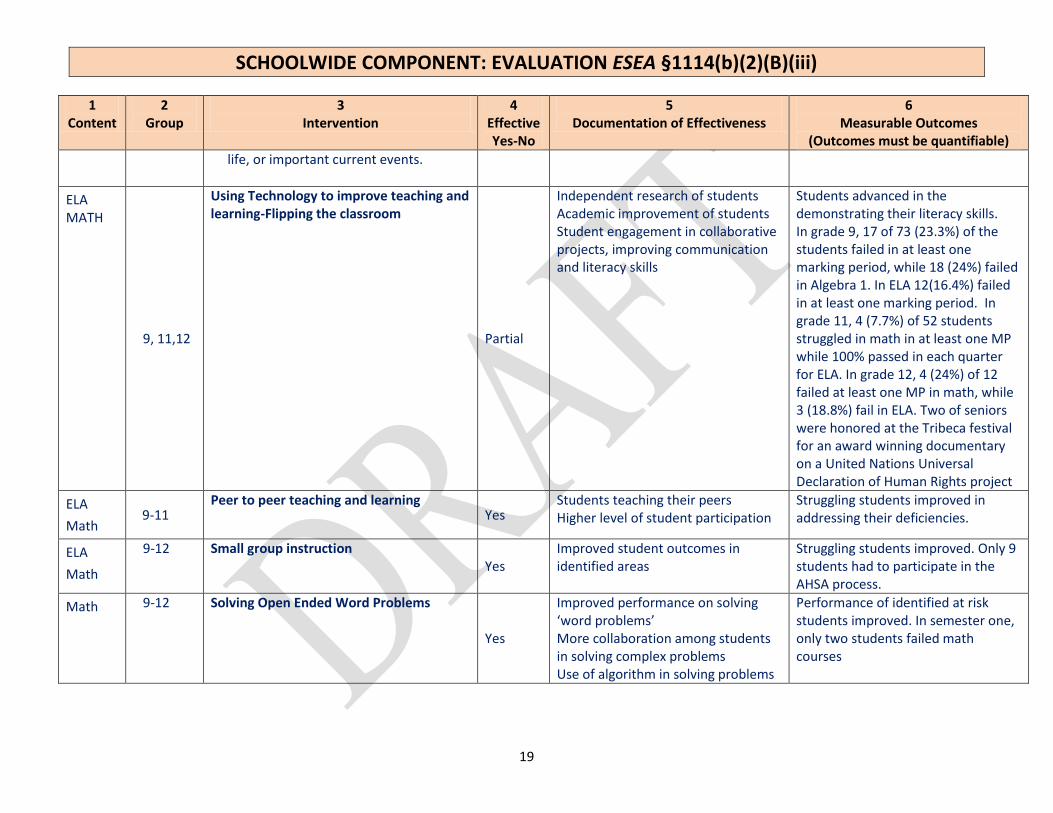
19
1 Content
2 Group
3 Intervention
4 Effective Yes-No
5 Documentation of Effectiveness
6 Measurable Outcomes
(Outcomes must be quantifiable)
life, or important current events.
ELA MATH
9, 11,12
Using Technology to improve teaching and learning-Flipping the classroom
Partial
Independent research of students Academic improvement of students Student engagement in collaborative projects, improving communication and literacy skills
Students advanced in the demonstrating their literacy skills. In grade 9, 17 of 73 (23.3%) of the students failed in at least one marking period, while 18 (24%) failed in Algebra 1. In ELA 12(16.4%) failed in at least one marking period. In grade 11, 4 (7.7%) of 52 students struggled in math in at least one MP while 100% passed in each quarter for ELA. In grade 12, 4 (24%) of 12 failed at least one MP in math, while 3 (18.8%) fail in ELA. Two of seniors were honored at the Tribeca festival for an award winning documentary on a United Nations Universal Declaration of Human Rights project
ELA
Math 9-11
Peer to peer teaching and learning Yes
Students teaching their peers Higher level of student participation
Struggling students improved in addressing their deficiencies.
ELA
Math
9-12 Small group instruction Yes
Improved student outcomes in identified areas
Struggling students improved. Only 9 students had to participate in the AHSA process.
Math 9-12 Solving Open Ended Word Problems
Yes
Improved performance on solving ‘word problems’ More collaboration among students in solving complex problems Use of algorithm in solving problems
Performance of identified at risk students improved. In semester one, only two students failed math courses

SCHOOLWIDE COMPONENT: EVALUATION ESEA §1114(b)(2)(B)(iii)
20
Extended Day/Year Interventions – Implemented in 2014-2015 to Address Academic Deficiencies
1 Content
2 Group
3
Intervention
4 Effective Yes-No
5 Documentation of Effectiveness
6 Measurable Outcomes
(Outcomes must be quantifiable)
ELA
MATH
Students with Disabilities
Small group Yes Improved performance in local assessments
Mastery of standards as demonstrated on local and state tests
ELA and Math
9-11 Partial proficient 12th graders
Academic Support (Increased Learning Time) for Struggling Students Students attend additional classes in language arts literacy in our before school, after school program and during school day
Partial
Student attendance to classes Improved individual performance of students in local and state assessments
Eight (66.7%) of 12 students were proficient in math in the Oct HSPA, while 100% of the students were proficient in ELA. In grade 9, identified students still struggled: 17 students failed Alg 1 at least one quarter while 20 failed at least one quarter in ELA. In grade 10, 20 and 22 students struggled in math and ELA respectively.
Math ELA
Incoming 9th graders
9th grade summer enrichment program
Yes Smooth transition of students to high school environment’ Improvement of knowledge and skills in content areas addressed
All programs had pre and post assessments, which were designed to measure the growth of the students. Students demonstrated improvement in their performance by the time they left the program. There was a gain of 7.4% in math and 6.1 % in ELA.
Math ELA
10th graders Academic Support-rising 10thgraders
Partial Improved performance in local assessments Mastery of standards as demonstrated on local and state tests
There was a gain of 8.9% in ELA but a loss of 8.8% in math. However, attendance was very sparse and the cohort of students hence very small.
Math ELA
12th graders Academic Support-Rising 12th graders
Math ELA
Improved performance in local assessments Mastery of standards as demonstrated on local and state tests
This program is part of the Intervention program. Struggling students are identified and selected to attend this program where their deficiencies are addressed. Eight of 12 students were proficient in math on

SCHOOLWIDE COMPONENT: EVALUATION ESEA §1114(b)(2)(B)(iii)
21
1 Content
2 Group
3
Intervention
4 Effective Yes-No
5 Documentation of Effectiveness
6 Measurable Outcomes
(Outcomes must be quantifiable)
the HSPA, while 100% was proficient in ELA
ELA, Math
11th and 12th graders
College Readiness -SAT, ACT, PSAT preparation AP Preparation
ELA, Math Student participation in test Student performance in Reading, Writing, mathematics
Students registered and took the tests. Here are the results of the PSAT:
Grade
9th Graders 9 10 11
Critical Reading 37.3 39.2 41.3
Mathematics 39.4 42.2 45.4
Writing Skills 34.9 36.8 39.2
Composite Scores 111.6 118.2 125.9

SCHOOLWIDE COMPONENT: EVALUATION ESEA §1114(b)(2)(B)(iii)
22
Evaluation of 2014-2015 Interventions and Strategies
Professional Development – Implemented in 2014-2015
1 Content
2 Group
3
Intervention
4 Effective Yes-No
5 Documentation of Effectiveness
6 Measurable Outcomes
(Outcomes must be quantifiable)
ELA Students with Disabilities
Participation in SIOP training
Yes Teacher participation
Modified lesson plans
Performance of students
All content areas: ELA Math Science Soc Studies Per Arts PhysEd
All teachers
Implementing the Common Core and state curriculum content Standards
Yes Lessons plans are aligned to the common core standards CCSS are addressed by all instructors Instructional materials are aligned to curricula
100% of teachers were trained on using EdConnect to design and submit standards based lesson plans 100% of the teachers submit standards based lesson plans
All content areas
All teachers and paraprofessionals
Using Teachscape, Learn to improve instructional practice using the Framework for Teaching
Partial Improved instructional practice as described in the evaluation instrument Instructors use of resources in Teachscape to improve their practice Instructors provide documents such as lesson plans, reflections electronically
Based on feedback only a small fraction of instructors completed PD training using Learn
Math, ELA Math and LAL teachers
Offering ongoing, high quality professional development to all staff
yes Improved instructional practice in addressing needs of diverse learners More collaboration among instructors in sharing best practices
Over 90% of instructors attended district sponsored PD in-service within the district. Over 90% of them are rated ‘effective’ or above on the teacher observation instrument.
All content areas
All teachers and paraprofessional
Maintaining a consistent focus on improving instruction
yes Instructors collect and analyze school-level data on student achievement to identify specific
Over 90% of instructors use EdConnect to administer benchmark assessments. They collected and analyzed data on individual

SCHOOLWIDE COMPONENT: EVALUATION ESEA §1114(b)(2)(B)(iii)
23
1 Content
2 Group
3
Intervention
4 Effective Yes-No
5 Documentation of Effectiveness
6 Measurable Outcomes
(Outcomes must be quantifiable)
gaps in student learning. Teachers use formative data to analyze their instruction in light of student progress toward goals. Instructors establishing priority areas for instructional focus and make necessary changes in those areas to strengthen teaching and improve student learning. School leaders and instructional staff monitor progress regularly, and systematically make adjustments to strengthen teaching and student learning.
student performance.
All content areas
All instructors
Differentiating instruction to address needs of diverse learners
yes Instructors continually assess students to obtain valid data and use this data to inform instructional decisions and determine appropriate grouping patterns. Instructors use grouping strategies to meet the individual needs of students within the broader group context and design instructional tasks for each group to align with educational goals. Instructors use differentiated instructional strategies to include ELL students in the general education curriculum and to respond to the unique needs of
100% of teachers designed and submitted lesson plans using EdConnect Many lesson plans indicate areas of modification
SCHOOLWIDE COMPONENT: EVALUATION ESEA §1114(b)(2)(B)(iii)
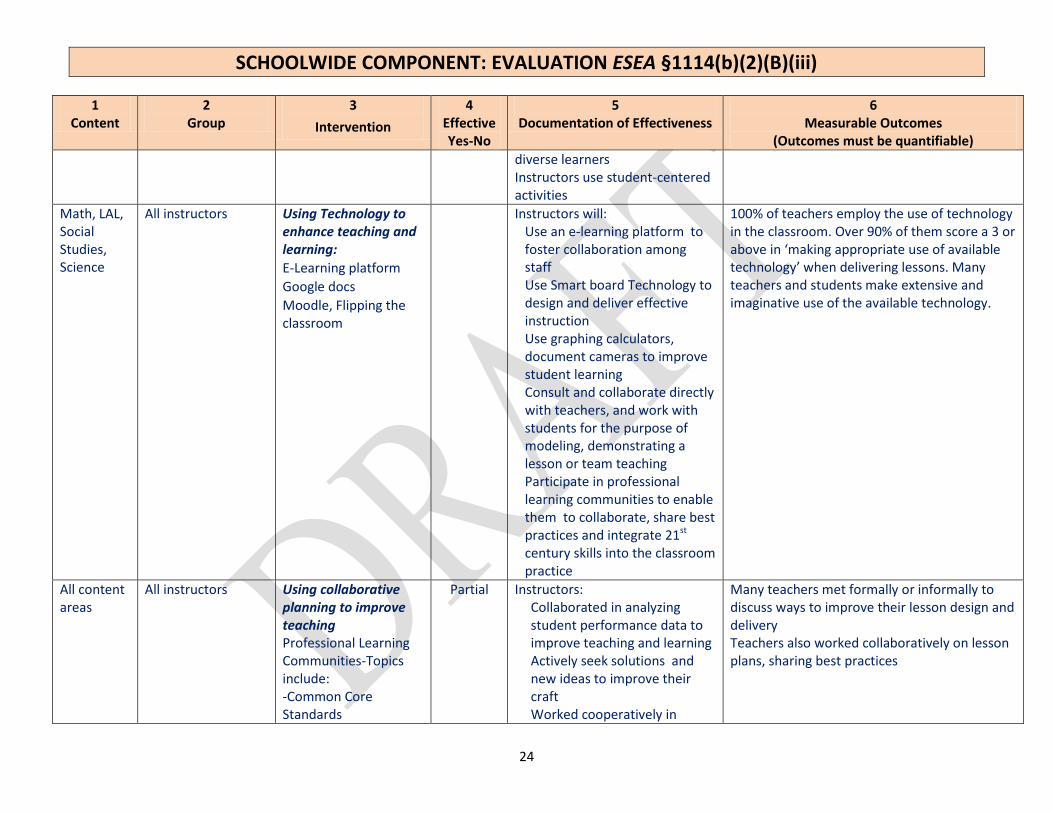
24
1 Content
2 Group
3
Intervention
4 Effective Yes-No
5 Documentation of Effectiveness
6 Measurable Outcomes
(Outcomes must be quantifiable)
diverse learners Instructors use student-centered activities
Math, LAL, Social Studies, Science
All instructors Using Technology to enhance teaching and learning:
E-Learning platform
Google docs
Moodle, Flipping the classroom
Instructors will: Use an e-learning platform to foster collaboration among staff Use Smart board Technology to design and deliver effective instruction Use graphing calculators, document cameras to improve student learning Consult and collaborate directly with teachers, and work with students for the purpose of modeling, demonstrating a lesson or team teaching Participate in professional learning communities to enable them to collaborate, share best practices and integrate 21st century skills into the classroom practice
100% of teachers employ the use of technology in the classroom. Over 90% of them score a 3 or above in ‘making appropriate use of available technology’ when delivering lessons. Many teachers and students make extensive and imaginative use of the available technology.
All content areas
All instructors Using collaborative planning to improve teaching Professional Learning Communities-Topics include: -Common Core Standards
Partial Instructors: Collaborated in analyzing student performance data to improve teaching and learning Actively seek solutions and new ideas to improve their craft Worked cooperatively in
Many teachers met formally or informally to discuss ways to improve their lesson design and delivery Teachers also worked collaboratively on lesson plans, sharing best practices

SCHOOLWIDE COMPONENT: EVALUATION ESEA §1114(b)(2)(B)(iii)
25
1 Content
2 Group
3
Intervention
4 Effective Yes-No
5 Documentation of Effectiveness
6 Measurable Outcomes
(Outcomes must be quantifiable)
-The Framework for Teaching -Authentic Learning and Assessment -Problem based learning -Integration of Academic and CTE -Differentiated instruction -Integration of technology in instruction
teams to achieve common goals Encouraged and used experimentation as an opportunity to learn Reflected on pedagogical strategies to improve on lessons taught
All content areas
All instructors Engage teachers in aligning instruction with standards and benchmarks. Align curricular units to the common core and state standards
Yes Design of curricular units in the various content areas Sharing of developed units among staff in school and district
Over 75% of instructors in the various content areas met and collaboratively designed curricular units and assessments
Math and LAL
Math and LAL teachers, seniors
Recruiting outside consultants to provide job embedded Professional Development
Yes Instructors will benefit from model lessons delivered Consultants will engage teachers in collaborative reflection and planning of lessons integrating the academic and Career and Technical Education programs. They also trained teachers on implementing the common core standards in all the content areas
Over 90% of the instructors attended sessions conducted by outside consultants offered for six sessions during the first six months of the school year

SCHOOLWIDE COMPONENT: EVALUATION ESEA §1114(b)(2)(B)(iii)
26
1 Content
2 Group
3
Intervention
4 Effective Yes-No
5 Documentation of Effectiveness
6 Measurable Outcomes
(Outcomes must be quantifiable)
Math, LAL, Science
Math, LAL and Science instructors
Using Student Performance Data to improve teaching and learning
Yes Instructors: Disaggregated assessment data to identify and address areas of weakness Used formative assessments more frequently to measure student progress Used assessment data to identify and address gaps in learning Improved lesson design and delivery
100% of instructors logged into EdConnect to administer standards based benchmark assessments. Instructors retrieved student performance data, which was disaggregated by standards and items from the platform and used the information to inform their lesson design and delivery.
All content areas
Instructors, counselors
District approved training and workshops-training to enhance implementation of AP courses
Yes Instructors designed and delivered more effective lessons Students were engaged in authentic learning activities Student achievement improved
Most instructors participated in out of district professional development training. At least three of them participated in AP training for Social Studies Instructors prepare students for AP Calculus and English Composition
All content areas
New teachers Improving practice of non-tenured teachers through mentoring/coaching
Yes New teachers transitioned successfully in the district Retention rate of teachers improved
All new teachers and mentors participated in new teacher orientation Retention rate of new teachers is very high

SCHOOLWIDE COMPONENT: EVALUATION ESEA §1114(b)(2)(B)(iii)
27
Family and Community Engagement Implemented in 2014-2015
1 Content
2 Group
3
Intervention
4 Effective Yes-No
5 Documentation of
Effectiveness
6 Measurable Outcomes
(Outcomes must be quantifiable)
All content areas
All students/parents
Frequent communication with parents
Yes
Support and input from parents Improved student performance Improved student response in class Offering academic support to parents –curriculum, assessment, PD. Providing periodic progress and report cards Providing online access to student performance
100% of the parents were mailed Quarterly Report Cards and Progress Reports. Parents were also mailed post cards to inform them of key events in the school.
All content areas
All students/ parents
Back to School Night Parents are informed of their children’s progress by individual instructors. They also experience being in the school environment and establish communication with school personnel.
Partial Improved attendance of parents and students to meet with teachers. Less disciplinary problems by students. Improved student performance Parent involvement policies, classroom visit policies, and homework policies are clear, constructive, and frequently communicated to parents and teachers.
150 parents attended the back to school event. However, parents monitor student progress by accessing student reports using Power School
All content areas
All parents Programs to Assist Students Academically
yes Student participation in extra-curricular activities Improved attendance of parents and students to
Parents attended -approximately 40 parents attended the event

SCHOOLWIDE COMPONENT: EVALUATION ESEA §1114(b)(2)(B)(iii)
28
1 Content
2 Group
3
Intervention
4 Effective Yes-No
5 Documentation of
Effectiveness
6 Measurable Outcomes
(Outcomes must be quantifiable)
school events. More active learning by students. Improved student performance
All content areas
ELLs Language Assistance for Parents
Yes Participation of parents and students in school activities Effective communication with parents
Parents attended meetings and conferences that address the needs of their children. Being the 1st cohort of ELL students, active interest was employed in the monitoring of their performance
All content areas
All parents Workshops HSPA, Financial Aid Workshop, NCLB
yes Parents and students will understand the importance of mastering the CCCS and plan for post secondary training or education. They will also be able to fill out the FAFSA and research colleges and institutions of higher learning
Approximately 40 parents attended this event. Parents were able to review sample materials of the HSPA test and asked questions. Financial Aid work shop was done in PowerPoint presentation and parents got an opportunity to review the FAFSA application and ask questions.
All content areas
All students/ parents
Parent-Teacher Conferences
Yes Increase in parental attendance at conferences Increase in passing rate of students Improvement of student attendance Decrease of disciplinary problems Parents are given opportunities to meet with teachers to discuss both their children’s progress in school and their children’s
Meetings were effective for parents, teachers and students. Individual academic needs and strengths were discussed.

SCHOOLWIDE COMPONENT: EVALUATION ESEA §1114(b)(2)(B)(iii)
29
1 Content
2 Group
3
Intervention
4 Effective Yes-No
5 Documentation of
Effectiveness
6 Measurable Outcomes
(Outcomes must be quantifiable)
home‐based study and reading habits.
All content areas
All students/ parents
Active participation of PTSA
Partial Frequent meetings with parents Improved parental engagement in school activities Improved school culture The faculty, students, and parents regularly discuss the school’s compact that outlines key expectations of students, parents, and teachers
Even though there were scheduled monthly meetings, it challenging for parents to attend. Instead, communication was done via the school website. Parents also attend fund raising events and other school activities. They also participated by following the progress of their children. Over 85% of them logged in to Power School to monitor their children’s performance.
All content areas
All students/ parents
Other: Freshmen orientation Senior Parent Meeting Adopt school-parent compact and distribute to parents and students
Yes Improved attendance by parents and students Consistent attendance of AHSA seniors to additional academic classes Parent policies, activities, and programs cultivate the ‘curriculum of the home.’ Parents receive regular, jargon-free communication about learning standards, their children’s progress, and the parents’ role in their children’s school success. Parents receive practical guidance to maintain regular and supportive verbal interaction with their
Most parents attended the orientation of their children to the new school environment.

SCHOOLWIDE COMPONENT: EVALUATION ESEA §1114(b)(2)(B)(iii)
30
1 Content
2 Group
3
Intervention
4 Effective Yes-No
5 Documentation of
Effectiveness
6 Measurable Outcomes
(Outcomes must be quantifiable)
children. Parents receive practical guidance to encourage their children’s regular reading habits at home. Parents receive practical guidance to model and encourage respectful and responsible behaviors
Math ELA
Parents of Grade 12 students
Build and maintain partnership with community-colleges, businesses, family and community
Yes Partnership with college Student enrollment in college courses
Over 80% of the students normally plan to attend a 4 or 2 year college. Students complete AP courses and attend college fairs.

SCHOOLWIDE COMPONENT: EVALUATION ESEA §1114(b)(2)(B)(iii)
31
Principal’s Certification The following certification must be completed by the principal of the school. Please Note: Signatures must be kept on file at the school. A scanned copy of the Evaluation form, with all appropriate signatures, must be included as part of the submission of the Schoolwide Plan. I certify that the school’s stakeholder/schoolwide committee conducted and completed the required Title I schoolwide evaluation as required for the completion of this Title I Schoolwide Plan. Per this evaluation, I concur with the information herein, including the identification of all programs and activities that were funded by Title I, Part A.

SCHOOLWIDE COMPONENT: COMPREHENSIVE NEEDS ASSESSMENT ESEA §1114 (b)(1)(A)
32
ESEA §1114(b)(1)(A): “A comprehensive needs assessment of the entire school [including taking into account the needs of migratory children as defined in §1309(2)] that is based on information which includes the achievement of children in relation to the State academic content standards and the State student academic achievement standards described in §1111(b)(1). ”
2015-2016 Comprehensive Needs Assessment Process Data Collection and Analysis
Multiple Measures Analyzed by the School in the Comprehensive Needs Assessment Process for 2014-2015
Areas Multiple Measures Analyzed
Overall Measurable Results and Outcomes
(Results and outcomes must be quantifiable)
Academic Achievement – Reading
Terra Nova, Local assessments, HSPA, PSAT
Many incoming students performed at or slightly above grade level when they were enrolled but a large cohort of them performed below grade level and were in need of academic support. Reading scores on the Terra Nova ranged from 0.3 to 12+. PSAT scores also lag the average of the state and nation. With timely intervention, many of them made gains in their local courses. However, some students continued to struggle. Below is as summary of the he performance of students in the PSAT in Oct 2014.
PSAT 2015 Mean Scores
Critical Reading State Nation BT
Grade 9 38.7 40.3 37.3
Grade 10 42.0 41.6 39.2
Grade 11 45.0 46.2 41.3
Over the past few years, students excelled in ELA on the state test. With the focus on student improvement a top priority, students should continue to do well in the new state test, PARCC. They will also be prepared to perform well on the PSAT, SAT and AP English Composition.

SCHOOLWIDE COMPONENT: COMPREHENSIVE NEEDS ASSESSMENT ESEA §1114 (b)(1)(A)
33
Areas Multiple Measures Analyzed
Overall Measurable Results and Outcomes
(Results and outcomes must be quantifiable)
Academic Achievement - Writing
Terra Nova, Local assessments, HSPA, PSAT
Students continue to struggle with their Writing as indicated by the PSAT writing scores. However, with timely intervention they normally make significant gains as they progress to the upper grades.
PSAT 2015 Mean Scores
Writing Skills State Nation BT
Grade 9 37.0 38.5 34.9
Grade 10 40.2 39.5 36.8
Grade 11 43.5 44.7 39.2
Scores on the HSPA over the last few years have been exceptional, with a proficiency rate of 100% for the past five consecutive years.
Academic Achievement - Mathematics
Terra Nova, Local assessments, HSPA, PSAT
Student performance on local assessment and the PSAT indicate that they have significant gaps in learning. By providing academic support to the identified students, they will perform close to grade level and be career ready by the time they graduate.
PSAT 2015 Mean Scores
Mathematics State Nation BT
Grade 9 41.2 41.5 39.4
Grade 10 44.3 42.8 42.2
Grade 11 47.6 47.9 45.4
Performance in mathematics on the state test has been consistently outstanding over the past few years. Over 96% of the students were proficient in the last four years.
Family and Community Engagement
Parent participation, survey
Parental involvement has improved incrementally over the past few years. There is a functioning PTSA that met throughout the year. Many parents also participated in back to school night, school fair and other activities. With the parent portal open, many parents monitor their children’s progress using the Internet and interact more with the staff.

SCHOOLWIDE COMPONENT: COMPREHENSIVE NEEDS ASSESSMENT ESEA §1114 (b)(1)(A)
34
Areas Multiple Measures Analyzed
Overall Measurable Results and Outcomes
(Results and outcomes must be quantifiable)
The results of the parent survey were very positive-students are safe and teachers are focused on teaching and learning
Professional Development
Observations
ScIP Feedback
The district has an approved PD plan which provides opportunities for staff to improve their craft. With the School Improvement Panel, effort was made to offer targeted professional development to staff. Over 85% of the instructors participated in district sponsored targeted professional development activities throughout the year. Based on observational feedback, instructional practices have also improved with no teacher required to complete a Corrective Action Plan for 2016.
Leadership Student Survey
The leadership of the school is stable. Academic outcomes of students have improved continuously over the past few years, especially on state standardized tests. The school is very safe, with staff providing a conducive social environment that promotes individual emotional safety. Over 82% of the staff indicated that the school is a supportive and inviting place for staff to work. The school leadership supports student development and pushes for various levels of instructional challenge and relevance, encouraging instructors and students to take ownership for teaching and learning. The leadership of the school also promotes personal pride in the success of students. Teachers at the school care whether or not the students are successful as indicated by the survey (94%). In addition, interpersonal communication between staff and school leaders is open and honest producing healthy, positive outcomes. School leadership also promotes community outreach and partnership with other agencies and institutions. Parents and community members are incorporated into the social and academic life of the school. And there is a strong and healthy partnership with other educational institutions. Over 60% of the parents are supportive of the school and its activities.
School Climate and Culture
Student Performance data, Survey
Survey results and student performance indicate that there is a positive culture in the school. There is high degree of open and honest communication among staff and between staff and school leaders. Many staff members volunteer to participate in extra-curricular activities that advance the cause of students and the school. The morale of the school community is high with staff and students taking pride in the process of teaching and learning. The environment fosters a culture for learning, which has contributed to a high degree of student success. Below is a summary of a ‘climate and culture’ staff survey conducted in the school.
SCHOOLWIDE COMPONENT: COMPREHENSIVE NEEDS ASSESSMENT ESEA §1114 (b)(1)(A)
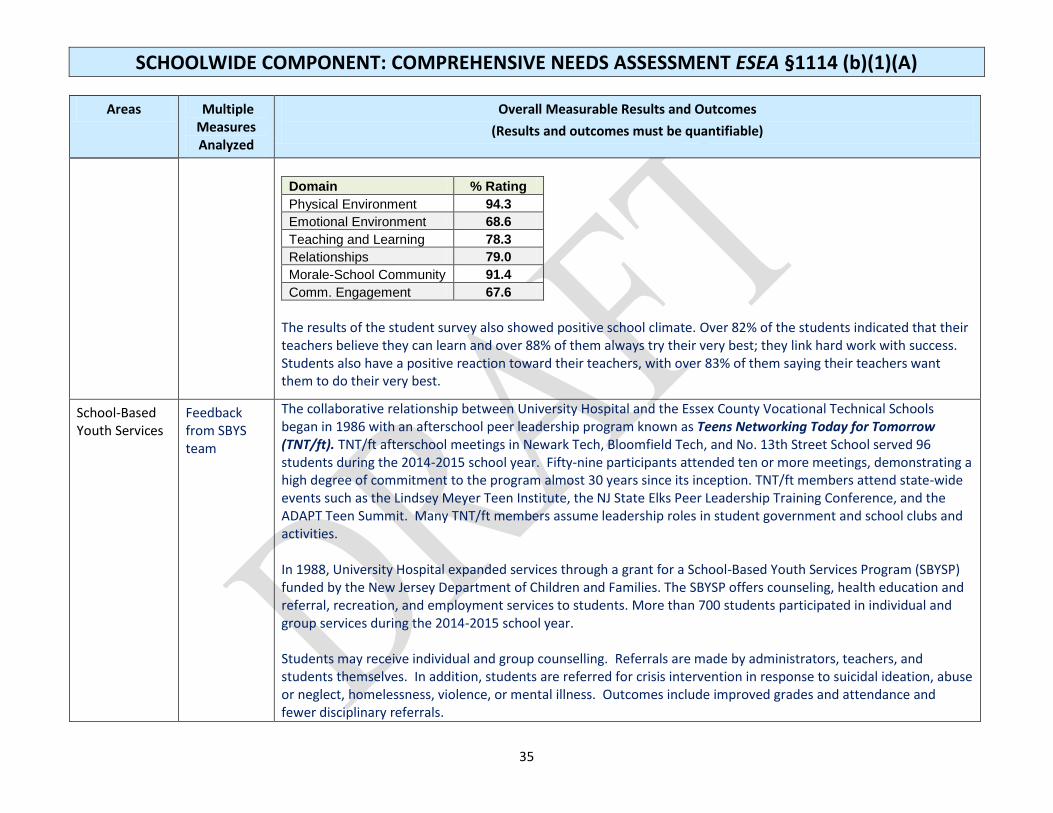
35
Areas Multiple Measures Analyzed
Overall Measurable Results and Outcomes
(Results and outcomes must be quantifiable)
Domain % Rating
Physical Environment 94.3
Emotional Environment 68.6
Teaching and Learning 78.3
Relationships 79.0
Morale-School Community 91.4
Comm. Engagement 67.6
The results of the student survey also showed positive school climate. Over 82% of the students indicated that their teachers believe they can learn and over 88% of them always try their very best; they link hard work with success. Students also have a positive reaction toward their teachers, with over 83% of them saying their teachers want them to do their very best.
School-Based Youth Services
Feedback from SBYS team
The collaborative relationship between University Hospital and the Essex County Vocational Technical Schools began in 1986 with an afterschool peer leadership program known as Teens Networking Today for Tomorrow (TNT/ft). TNT/ft afterschool meetings in Newark Tech, Bloomfield Tech, and No. 13th Street School served 96 students during the 2014-2015 school year. Fifty-nine participants attended ten or more meetings, demonstrating a high degree of commitment to the program almost 30 years since its inception. TNT/ft members attend state-wide events such as the Lindsey Meyer Teen Institute, the NJ State Elks Peer Leadership Training Conference, and the ADAPT Teen Summit. Many TNT/ft members assume leadership roles in student government and school clubs and activities. In 1988, University Hospital expanded services through a grant for a School-Based Youth Services Program (SBYSP) funded by the New Jersey Department of Children and Families. The SBYSP offers counseling, health education and referral, recreation, and employment services to students. More than 700 students participated in individual and group services during the 2014-2015 school year. Students may receive individual and group counselling. Referrals are made by administrators, teachers, and students themselves. In addition, students are referred for crisis intervention in response to suicidal ideation, abuse or neglect, homelessness, violence, or mental illness. Outcomes include improved grades and attendance and fewer disciplinary referrals.

SCHOOLWIDE COMPONENT: COMPREHENSIVE NEEDS ASSESSMENT ESEA §1114 (b)(1)(A)
36
Areas Multiple Measures Analyzed
Overall Measurable Results and Outcomes
(Results and outcomes must be quantifiable)
Assemblies, seminars and workshops on sexual health, dating violence, fitness and nutrition, bullying, and cyber safety are offered to encourage the social and emotional growth of students. Special initiatives include the following:
Peer to Peer Mentorship - Seniors at No. 13th Street School were trained to implement early morning convocation events as well as classroom presentations for freshmen that provided encouragement and strategies for a successful transition to high school.
Freshman Transition - All members of the incoming freshman Class of 2018 attended anti-bullying assemblies featuring Dr. Mykee Fowlin and teambuilding activities at YMCA Camp Bernie.
Pearls of Wisdom - A schedule of monthly events was created to empower female students to shape their own destiny.
My Life/My Choice – An 8 session curriculum on Human Trafficking for girls was delivered by Prevent Child Abuse NJ.
Male Empowerment - An 4 session curriculum on Human Trafficking for boys was delivered by Prevent Child Abuse NJ.
NJ Prep (Personal Responsibility Education Program) - Aimed at lowering the risk of HIV/STIs and pregnancy, “Making Smart Choices” is an evidence based curriculum that promotes abstinence as the responsible choice, while also addressing topics such as healthy relationships, adolescent health and parent-child communication.
Students with Disabilities
Local assessments
Students with disabilities attended on a shared time basis from N13 to complete academic courses. All students succeeded in their respective courses.
Homeless Students
N/A There was no homeless student in this school
Migrant Students
N/A There was no migrant student in this school
English Language Learners
Local assessments
Students struggled initially, especially in the first quarter. To further assist students in the transition, grades reflected a challenge in language barrier (LB). In Q2, four students continued to struggle in Algebra 1, while in Q3, two struggled in BG ESL Lit Survey and four in Algebra 1. Academic support was provided to at risk students during the school year.

SCHOOLWIDE COMPONENT: COMPREHENSIVE NEEDS ASSESSMENT ESEA §1114 (b)(1)(A)
37
Areas Multiple Measures Analyzed
Overall Measurable Results and Outcomes
(Results and outcomes must be quantifiable)
Economically Disadvantaged
Local assessments
Performance on State test
Over 80% of the students fall in this subgroup. Over the past eleven years, this subgroup has surpassed its performance target in both mathematics and language arts literacy. Over 96% of the students were proficient in mathematics over the past four consecutive years, while 100% of them were proficient in ELA.

SCHOOLWIDE COMPONENT: COMPREHENSIVE NEEDS ASSESSMENT ESEA §1114 (b)(1)(A)
38
2015-2016 Comprehensive Needs Assessment Process* Narrative
1. What process did the school use to conduct its Comprehensive Needs Assessment?
The needs assessment process at the Newark Tech campus is ongoing and very comprehensive. Various techniques were employed in the collection of data to measure the effectiveness of the various programs in the school. To identify the strengths and deficiencies of students, a comprehensive assessment program was implemented using various local and outside assessments that are appropriate to each grade level. Students were assessed throughout the school year and the performance data disaggregated and analyzed in detail using the subgroups. Using the performance data, trends were identified in the instructional program, and used to inform the decision making process. Frequent classroom observations of teachers by school and district administrators were also done to determine instructional quality and student engagement. The evaluation instrument used is based on The Framework for Teaching, which inherently supports effective teaching and professional learning. In addition, informal interviews and use of artifacts were used to gather evidence in the triangulation process. To measure school climate, leadership and the effectiveness of our professional development program, various surveys were administered. The data collected from the staff, student and parent surveys were analyzed to determine the areas of strengths and deficiencies. Information was also obtained at the various faculty and department meetings, where instructors provided feedback on the many programs we conducted in school. In addition, there were several meetings with teachers, consultants, administrators and other stakeholders that were designed to reflect on the past year and plans for next year.
2. What process did the school use to collect and compile data for student subgroups?
In all the schools there is a planned program to continuously collect and analyze student performance data throughout the school year. Before students are admitted and placed in one of the two programs of study that is customized to address their diverse needs, they are given the 3rd edition Terra Nova placement test, which is used to identify their grade level performance. After admission, teachers continue to assess students to ensure they are scheduled in the appropriate program. Throughout the year, standards based benchmark assessments were administered in all content areas to all students using an online platform, EdConnect. The performance data was compiled and analyzed by standards and items. Progress of students is also closely monitored individually with periodic snapshots of grades taken from the Student Information System. Approximately every four weeks, the performance of students is extracted from the SIS and analyzed to identify struggling students. Identifying and addressing the needs of these students is done at the individual level, including meeting class periods. This process identifies the at risk students in each subgroup in an expeditious manner so that timely intervention can be implemented.

SCHOOLWIDE COMPONENT: COMPREHENSIVE NEEDS ASSESSMENT ESEA §1114 (b)(1)(A)
39
In addition, the 9th, 10th and 11th graders also took the PSAT in October. Scores were analyzed to determine the level of student preparedness for college. As the school transition to the new PARCC assessments, emphasis will be placed on preparing students for a success in college and careers. Here is the demographic student information of Bloomfield Tech for 2014-15 school year.
BT # of Students
Subgroups 9th 10th 11th 12th Totals
Asian 0 0 0 1 1
Black 53 61 52 52 218
Hispanic 82 63 64 53 262
White 1 0 1 3 5
Pac Is/Other 2 2 1 2 7
Econ Dis 103 99 98 88 388
LEP 14 0 0 0 14
Totals 138 126 118 111 493
Data on student performance on state tests will be collected and analyzed as was done with the HSPA.
Below is an analysis of performance by subgroups of the 2014-15 cohort of students.
Bloomfield Tech March '14 October '14 Mar-Oct March '15 2015
Subgroups # students # Prof. # AP % Prof % Ad P %Prof students # Prof. % Prof Total % students # Prof. % Prof Total %
Asian 1 1 0 100.0 0.0 100.0 0 0 N/A 100.0 0 0 N/A 100.0
Black 57 41 8 71.9 14.0 86.0 8 4 50.0 93.0 4 1 25 94.7
Hispanic 56 39 13 69.6 23.2 92.9 4 4 100.0 100.0 0 0 N/A 100.0
White 2 2 0 100.0 0.0 100.0 0 0 N/A 100.0 0 0 N/A 100.0
Pac Is 2 2 0 100.0 0.0 100.0 0 0 N/A 100.0 0 0 N/A 100.0
Econ Dis 102 76 19 74.5 18.6 93.1 7 4 57.1 97.1 3 0 0 97.1
Total Students 118 85 21 72.0 17.8 89.8 12 8 66.7 96.6 4 1 25.0 97.5
Above: HSPA: Mathematics: 2014-15 cohort

SCHOOLWIDE COMPONENT: COMPREHENSIVE NEEDS ASSESSMENT ESEA §1114 (b)(1)(A)
40
Bloomfield Tech March '14 October '14 2015
Subgroups # students # Prof. # AP % Prof % Ad P Total % students # Prof. % Prof Total %
Asian 1 1 0 100.0 0.0 100.0 0 0 N/A 100.0
Black 57 44 13 77.2 22.8 100.0 0 0 N/A 100.0
Hispanic 56 46 9 82.1 16.1 98.2 1 1 0.0 100.0
White 2 2 0 100.0 0.0 100.0 0 0 N/A 100.0
Pac Is 2 1 1 50.0 50.0 100.0 0 0 N/A 100.0
Econ Dis 102 79 22 77.5 21.6 99.0 1 1 0.0 100.0
Total Students 118 94 23 79.7 19.5 99.2 1 1 0.0 100.0
Above: HSPA: Language Arts Literacy: 2014-15 cohort
3. How does the school ensure that the data used in the needs assessment process are valid (measures what it is designed to measure) and reliable (yields consistent results)? 1 Due to the relatively small size of this school, data is collected by grade level and content area from the entire student population. Trends are identified using detailed analyses of performance data over a few years. This information is used to guide adjustments to the program. Correlation of local assessment data to state test results are also done.
4. What did the data analysis reveal regarding classroom instruction?
Based on a comparison of the student performance data, there has been an incremental improvement in the proficiency rates in mathematics and language arts for the past 12 years. The performance in language arts has been exceptional over the past few years. In five of the past six years, 100% of the students were proficient. Student performance for first time test takers was also the highest in the history of the school. However, the improvement of instructional quality is ongoing in addressing the needs of all subgroups with regards to implementing the common core standards in preparing students for success in college are careers. The table below shows the comparison.
1 Definitions taken from Understanding Research Methods” by Mildred Patten
Patten, M. L. (2012). Understanding Research Methods. Glendale, California: Pyrczak Publishing

SCHOOLWIDE COMPONENT: COMPREHENSIVE NEEDS ASSESSMENT ESEA §1114 (b)(1)(A)
41
MATHEMATICS
LANGUAGE ARTS LITERACY BT Mar '09 Mar '10 Mar '11 Mar '12 Mar '13 Mar ‘14
BT Mar '09 Mar '10 Mar '11 Mar '12 Mar '13 Mar ‘14
Subgroups % prof
Subgroups % prof
Black 86.7 76.2 81.5 94.5 96.9 86.0
Black 82.2 97.6 100.0 100.0 100.0 100
Hispanic 70.4 82.5 87.0 95.3 98.3 92.9
Hispanic 87.0 89.5 98.1 100.0 100.0 98.2
Econ Disadv 78.3 79.6 84.4 97.7 96.0 93.1
Econ Disadv 85.9 92.5 99.0 100.0 100.0 99.0
Total Students 78.8 79.6 83.9 95.1 96.9 89.8
Total Students 85.6 93.2 99.1 100.0 100.0 99.2
Comparison of 1st time test takers, March 2014
MATH Performance Targets
LAL Performance Targets
Subgroup 2012 MPT? 2013 MPT? 2014 MPT?
Subgroup 2012 MPT? 2013 MPT? 2014 MPT?
Benchmarks 90 90 90
Benchmarks 90 90 90
Black 96.1 YES 98.2 YES 96.9 YES
Black 100.0 YES 100.0 YES 100.0 YES
Hispanic 96.3 YES 100.0 YES 98.3 YES
Hispanic 100.0 YES 100.0 YES 100.0 YES
Econ Disadv. 96.8 YES 100.0 YES 98.3 YES
Econ Disadv. 100.0 YES 100.0 YES 100.0 YES
Total Students 96.3 YES 99.0 YES 96.9 YES
Total Students 100.0 YES 100.0 YES 100.0 YES
Three year performance: 2012-2014
5. What did the data analysis reveal regarding professional development implemented in the previous year(s)?
The ongoing, high level professional development offered during the previous years has paid dividends. Many teachers have responded well by improving their quality of instructional. As mentioned above, student achievement has improved in significantly, not only in mathematics and language arts but in the other content areas as well. The school has also made it performance targets for the past eleven consecutive years and is poised to achieve it again in 2015. However, emphasis will be paced on implementing the common core standards, with an emphasis on the use of technology in designing and delivering effective lessons.
6. How does the school identify educationally at-risk students in a timely manner?
The student performance data on the Terra Nova 3rd edition test, which is administered in reading, language arts and mathematics, is used to identify students who need immediate academic support. Many of these students attend a summer enrichment program that offers targeted instruction in mathematics and language arts by highly qualified teachers. At the end of the program, instructors meet and discuss their performance so as to provide valuable information that will be used to schedule at-risk students with additional academic support during the

SCHOOLWIDE COMPONENT: COMPREHENSIVE NEEDS ASSESSMENT ESEA §1114 (b)(1)(A)
42
school year. In addition, during the first few weeks in the school year, instructors continuously assess students to identify those who are struggling so that they can be offered effective assistance.
In the comprehensive assessment program, students are assessed using local district-wide assessments throughout the year. Performance data are analyzed by classes and the performance of each student is examined in detail. Follow-up discussions on how best to address the needs of the at-risk students are done with the instructors and administrators.
There are also periodic snapshots of student performance that are designed to monitor the progress of all students. At risk students are identified in all the content areas and support is provided in a timely manner.

SCHOOLWIDE COMPONENT: COMPREHENSIVE NEEDS ASSESSMENT ESEA §1114 (b)(1)(A)
43
7. How does the school provide effective interventions to educationally at-risk students? Academic support for at-risk students is provided throughout the year using various programs. Identified students are required to attend the before and after school classes, which are closely monitored. In addition, students are provided with additional instruction in math and language arts for a period during the school day. In-class support is also available through peer teaching and learning. Moreover, students have access to web-based supplemental program that provides support in mathematics, language arts and science. In addition, at risk students attend a summer enrichment program that is designed to enhance their skills in mathematics and language art literacy with emphasis on using technology to accelerate learning.
8. How does the school address the needs of migrant students? This school does not have any migrant students. However, support is provided to all students who transfer within the school year.
9. How does the school address the needs of homeless students? This school does not have any homeless students.
10. How does the school engage its teachers in decisions regarding the use of academic assessments to provide information on and improve the instructional program? For many years, this school has relied heavily on the use of performance data to inform instructional practices. The frequent use of formative assessments by instructors was emphasized and supported. Instructors are intimately engaged in developing standards-based assessments and provide or suggest items in the development of the district-wide local assessments. Training was also provided to all language arts and math instructors in the use of data in making instructional decisions by district administrators. They also participate in ongoing discussions of the assessment data at departmental and faculty meetings. More importantly, they use the performance data to inform their instructional strategies. The input of teachers in valued in the school and their ideas and suggestions are always solicited. They play a crucial role in assessing and identifying students so that they are placed in the relevant instructional program. With their continuous input, student placement is always reviewed and the instructional program adjusted to match student needs. With regards to curriculum, teams of teachers provide the primary input in all alignment to state and common core standards. These projects are often guided by outside experts and administers. Teachers also take on leadership roles in mentoring teachers and implementing the evaluation system.

SCHOOLWIDE COMPONENT: COMPREHENSIVE NEEDS ASSESSMENT ESEA §1114 (b)(1)(A)
44
11. How does school help students transition from preschool to kindergarten, elementary to middle school and/or middle to high school? Bloomfield Tech ensures that all students transition smoothly to the new learning environment. Many of the incoming freshmen attend a 5-week summer enrichment program where they meet with some of their teachers who provide targeted instruct in mathematics and language arts literacy. Students also become aware of the expectations of the teachers and what is required of them. There is a freshmen orientation where students get a guided tour of the school and all the facilities available to them. Student s and parents also get to meet with the school leaders and other staff members who review school rules, policies and procedures of the school. In addition, the school has a partnership with Rutgers University through the Teen Network Teen (TNT) initiative, whose staff members meet with students to address their fears and concerns about life as a high school student. Students are informed of the counseling services offered by the partnership and are given opportunities to interact with their peers and practicing "stepping out of their comfort zone". Throughout the year, students are supported by school leaders, teachers, counselors and other staff. Their behavior and academic performance are closely monitored and timely intervention is provided when needed. There is also a Student Assistance Coordinator who is a member of the Intervention and Referral Services committee that provides targeted support.
12. How did the school select the priority problems and root causes for the 2015-2016 schoolwide plan?
The priority problems are identified using student performance data as measured by the various assessment instruments. Performance data is analyzed over an extended period of time so as to identify trends. Other evidence is also collected to determine the root cause of the problems. Where possible, triangulation of the evidence is employed to ascertain definitive priority problems. Even though this school has made the performance targets for the past eleven years, the priority is to improve student preparation for success in college and careers.
*Provide a separate response for each question.

SCHOOLWIDE COMPONENT: COMPREHENSIVE NEEDS ASSESSMENT ESEA §1114 (b)(1)(A)
45
2015-2016 Comprehensive Needs Assessment Process Description of Priority Problems and Interventions to Address Them
Based upon the school’s needs assessment, select at least three (3) priority problems that will be addressed in this plan. Complete the information below for each priority problem.
#1 #2
Name of priority problem
Closing the achievement gap in language arts literacy. Even though the performance on state test in ELA has been very strong over the past few years, the Oct PSAT results revealed that students still struggle in their goal to be college and career ready. The priority will be to maintain high student performance in ELA by all subgroups in each grade level as measured by career ready indicators such as PARCC, PSAT and AP English Lit & Composition.
Closing the achievement gap in mathematics. Even though the performance on state test in mathematics has been very strong over the past few years, the Oct PSAT results revealed that students still struggle in their goal to be college and career ready. The priority will be to maintain high student performance in mathematics by all subgroups in each grade level as measured by career ready indicators such as PARCC, PSAT and AP Calculus.
Describe the priority problem using at least two data sources
Based on Terra Nova and NJ ASK scores, many experience learning gaps in Reading and Language arts. The average PSAT scores in Reading and Writing were also below the state and National average, as shown below. Only 16% and 17.3% of the 10th and 11th graders respectively are on track to be career ready
PSAT 2015 Mean Scores
Critical Reading State Nation BT
Grade 9 38.7 40.3 37.3
Grade 10 42.0 41.6 39.2
Grade 11 45.0 46.2 41.3
PSAT 2015 Mean Scores
Writing Skills State Nation BT
Grade 9 37.0 38.5 34.9
Grade 10 40.2 39.5 36.8
Based on Terra Nova and NJ ASK scores, many experience learning gaps in Math. The average PSAT scores in Mathematics were also below the state and National average, as shown below. Only 16% and 17.3% of the 10th and 11th graders respectively are on track to be career ready
PSAT 2015 Mean Scores
Mathematics State Nation BT
Grade 9 41.2 41.5 39.4
Grade 10 44.3 42.8 42.2
Grade 11 47.6 47.9 45.4
In Calculus, the scores for 2014 were: Score # students 4 0

SCHOOLWIDE COMPONENT: COMPREHENSIVE NEEDS ASSESSMENT ESEA §1114 (b)(1)(A)
46
Grade 11 43.5 44.7 39.2
College Readiness State Nation BT
Grade 10 133 37.2% 16.0%
Grade 11 142 45.8% 17.3%
In English Lit & Composition, the scores for 2014 were: Score # students 4 1 3 8 2 22 1 8
3 2 2 1 1 18
Describe the root causes of the problem
Most of the incoming students enter the school lacking skills in the core content areas, struggling to perform at grade level. With timely identification and intervention, many of the students make the required gains by the time they graduate.
Most of the incoming students enter the school lacking skills in the core content areas, struggling to perform at grade level. With timely identification and intervention, many of the students make the required gains by the time they graduate.
Subgroups or populations addressed
Performance targets were met by all subgroups in 2015. For 2016, emphasis will be placed on maintaining high performance by all subgroups and on students scoring well in the AP courses, PSAT, SAT and PARCC
Performance targets were met by all subgroups in 2015. For 2016, emphasis will be placed on maintaining high performance by all subgroups and on students scoring well in the AP courses, PSAT, SAT and PARCC
Related content area missed (i.e., ELA, Mathematics)
Performance targets were achieved for the twelfth consecutive year
Performance targets were achieved for the twelfth consecutive year
Name of scientifically research based intervention to address priority problems
Using assessment data to inform teaching and learning Using formative assessments to accelerate learning Providing increased instructional time Using research-based instructional strategies Offering job-embedded, high quality professional development to instructors and in-class support. Using supplemental instructional program to improve writing and reading. Using the Framework of Teaching to improve instructional
Using assessment data to inform teaching and learning Using formative assessments to accelerate learning Providing increased instructional time Using research-based instructional strategies Offering job-embedded, high quality professional development to instructors and in-class support. Using supplemental instructional to improve skills in mathematics Using the Framework of Teaching to improve

SCHOOLWIDE COMPONENT: COMPREHENSIVE NEEDS ASSESSMENT ESEA §1114 (b)(1)(A)
47
quality. Using the nine research-based instructional strategies by Marzano.
instructional quality. Using the nine research-based instructional strategies by Marzano.
How does the intervention align with the Common Core State Standards?
The language arts literacy curriculum will be aligned to the common core standards. Lessons designed and delivered will be aligned to local curricula.
The mathematic curriculum will be aligned to the common core standards. Lessons designed and delivered will be aligned to local curricula.

SCHOOLWIDE COMPONENT: COMPREHENSIVE NEEDS ASSESSMENT ESEA §1114 (b)(1)(A)
48
2015-2016 Comprehensive Needs Assessment Process Description of Priority Problems and Interventions to Address Them (continued)
#3 #4
Name of priority problem Parental involvement and community outreach
Describe the priority problem using at least two data sources
Parental attendance and involvement at monthly meetings is sometimes less than 10%. Participation in school events can also be improved.
Describe the root causes of the problem
Employment obligations by parents, difficulty with transportation to school
Subgroups or populations addressed
All students, parents
Related content area missed (i.e., ELA, Mathematics)
None
Name of scientifically research based intervention to address priority problems
COMMUNICATING: Communicate with families about school programs and student progress through effective school-to-home and home-to-school communications. VOLUNTEERING: Improve recruitment, training, work, and schedules to involve families as volunteers and audiences at the school or in other locations to support students and school programs. DECISION MAKING: Include families as participants in school decisions, governance, and advocacy through PTSA, school councils, committees, and other parent organizations
How does the intervention align with the Common Core State Standards?
Parents can monitor student mastery of curricular standards which are aligned to the state and common core standards using various ways such as Progress and Report Cards and using PowerSchool.

SCHOOLWIDE COMPONENT: Reform Strategies ESEA §(b)(1)(B)(i-iii)
49
ESEA §1114(b) Components of a Schoolwide Program: A schoolwide program shall include . . . schoolwide reform strategies that . . . “ Plan Components for 2013
2015-2016 Interventions to Address Student Achievement
ESEA §1114(b)(I)(B) strengthen the core academic program in the school;
Content Area Focus
Target Population(s)
Name of Intervention Person
Responsible Indicators of Success
(Measurable Evaluation Outcomes)
Research Supporting Intervention (i.e., IES Practice Guide or What Works
Clearinghouse)
ELA, Mathematics Science
Grades 9-12
Using Research based Instructional Strategies -Cooperative Learning -Homework and Practice - Setting Objectives and Providing Feedback
- Reinforcing Effort and Providing Recognition
- Summarizing and Note Taking
- Identifying Similarities and Differences
- Nonlinguistic Representations
Ms Carbonell Ms Landis Ms Morales Mr Lima Mr. Love Mr. B. Singh
Improved student performance on local and state assessments Differentiation of lesson design and delivery to address diverse learners
Use of researched based instructional strategies have improved student outcomes
ELA, Mathematics Science
Grades 9-12
Using student assessment data to improve teaching and learning - Continuously using
student data to inform and differentiate instruction to meet the academic needs of individual students.
Ms Carbonell Ms Landis, Ms Morales Mr Lima Mr C. Singh Mr Love Mr. B. Singh
Assessing students frequently throughout the school year to determine progress toward performance targets Developing performance trend of students in class and school, including disaggregation of data by subgroups
Targeted instruction designed to address identified learning gaps enhances performance
All content areas
Grades 9-12
Teaching students to examine their own data and set learning goals - Explaining expectations
and assessment criteria.
Ms Morales Mr Love
Developing students’ performance targets Students monitoring their performance using their individual data and making adjustments to
Setting learning goals and working to achieve them with feedback along the way has improved student outcomes

SCHOOLWIDE COMPONENT: Reform Strategies ESEA §(b)(1)(B)(i-iii)
50
ESEA §1114(b)(I)(B) strengthen the core academic program in the school;
Content Area Focus
Target Population(s)
Name of Intervention Person
Responsible Indicators of Success
(Measurable Evaluation Outcomes)
Research Supporting Intervention (i.e., IES Practice Guide or What Works
Clearinghouse) - Providing feedback that is
timely, specific, well formatted, and constructive to students
- Using students’ data analyses to guide instructional changes.
- Monitoring progress and making adjustments.
their learning
ELA, Math 10, 12
Using Technology to improve teaching and learning-Flipping the classroom
Ms Morales Ms Landis Mr B. Singh
Independent research of students Academic improvement of students
Increased instructional time accelerates learning. Quick access to information facilitates learning
ELA, Math 9-12
Peer to peer teaching and learning
Mr Love
Students teaching their peers Higher level of student participation
Peer teaching and learning accelerates learning
ELA, Math
9-11 ELLs
Small group instruction Mr Love
Improved student outcomes in identified areas
One to one focused instruction is effective in addressing individual needs
Math
9-12 Solving Open Ended Word Problems
Ms Landis
Improved performance on solving ‘word problems’ More collaboration among students in solving complex problems Use of algorithm in solving problems
Solving word problems improve performance current and succeeding higher level courses
ELA 9-10 ELL students
Supplemental READ 180 Mr Lomba Mr Love
Increased lexile levels of students Improved performance in local and state tests Improved collaboration among students

SCHOOLWIDE COMPONENT: Reform Strategies ESEA §(b)(1)(B)(i-iii)
51
*Use an asterisk to denote new programs. 2015-2016 Extended Learning Time and Extended Day/Year Interventions to Address Student Achievement
ESEA §1114(b)(I)(B) increase the amount and quality of learning time, such as providing an extended school year and before- and after-school and summer programs and opportunities, and help provide an enriched and accelerated curriculum;
Content Area Focus
Target Population(s)
Name of Intervention Person
Responsible
Indicators of Success (Measurable Evaluation
Outcomes)
Research Supporting Intervention (i.e., IES Practice Guide or What Works
Clearinghouse)
ELA and Mathematics Science
Grades 9-11
Academic Support (Increased Learning Time) for Struggling Students Students attend additional classes in language arts literacy in our before school, after school program
Mr Love Mr C.Singh
Student attendance to classes Improved individual performance of students in local and state assessments
Increased targeted instruction enhances academic performance One on one and peer teaching enhances learning
Mathematics, ELA
Incoming 9th graders 9th grade summer enrichment program
C. Singh B. Singh D. Carbonell
Smooth transition of students to high school environment Improvement of knowledge and skills in content areas addressed
Additional targeted instruction on specific areas of need will close the learning gaps and improve students’ knowledge and skills in math and ELA
ELA, Math 11th and 12th graders
College Readiness -SAT preparation AP courses
Mr Love Ms Landis Ms Morales
Student participation in test Student performance in Reading, Writing, mathematics
Targeted instruction and review of specific strategies improve performance on SAT and AP courses
ELA Math
ELL students Small group/one to one instruction
Mr Love Ms Morales Mr Lomba
Improvement of student academic performance Smooth transition in school environment
Increased targeted instruction enhances academic performance One on one and peer teaching enhances learning
All Content Grades 10-12 Increased learning time using technology-one to one laptop program
Mr Love Ms Howard
Completion of additional college level courses, Improved student outcomes
Use of technology can enhance teaching and learning
*Use an asterisk to denote new programs.

SCHOOLWIDE COMPONENT: Reform Strategies ESEA §(b)(1)(B)(i-iii)
52
2015-2016 Professional Development to Address Student Achievement and Priority Problems
ESEA §1114 (b)(1)(D) In accordance with section 1119 and subsection (a)(4), high-quality and ongoing professional development for teachers, principals, and paraprofessionals and, if appropriate, pupil services personnel, parents, and other staff to enable all children in the school to meet the State's student academic achievement standards.
Content Area Focus
Target Population(s)
Name of Strategy Person
Responsible
Indicators of Success (Measurable Evaluation
Outcomes)
Research Supporting Strategy (i.e., IES Practice Guide or What Works
Clearinghouse)
All content areas: ELA Math Science
Soc Studies
Per Arts
Technical Education
All teachers
Implementing the Common Core and state curriculum content Standards
Mr Love
Mr C.Singh
Ms Carbonell
Ms Landis
Ms Morales
Mr B. Singh
Mr C. Singh
Lessons plans are aligned to the common core standards
CCSS are addressed by all instructors
Instructional materials are aligned to curricula
Implementing the common core standards is crucial for the transferability of skills and knowledge
Implementing the common core will prepare students to succeed in college and careers
All content areas
All teachers and paraprofessionals
Using Teachscape to improve instructional practice using the Framework for Teaching
Mr Love Mr C.Singh Ms Carbonell Ms Landis Ms Morales Mr B. Singh Mr C. Singh
Improved instructional practice as described in the evaluation instrument Instructors use of resources in Teachscape to improve their practice Instructors provide documents such as lesson plans, reflections electronically
Using the Framework for Teaching has improved student achievement
Math, LAL, Social Studies, Science
All instructors and paraprofessionals
Using Technology to enhance teaching and learning:
E-Learning platform
Google docs Moodle, Flipping the classroom
ScIP
Instructors will: Use an e-learning platform to foster collaboration among staff Use Smart board Technology to design and deliver effective instruction Use graphing calculators, document cameras to improve student learning Use webcast and
Use of technology can enhance teaching and learning

SCHOOLWIDE COMPONENT: Reform Strategies ESEA §(b)(1)(B)(i-iii)
53
ESEA §1114 (b)(1)(D) In accordance with section 1119 and subsection (a)(4), high-quality and ongoing professional development for teachers, principals, and paraprofessionals and, if appropriate, pupil services personnel, parents, and other staff to enable all children in the school to meet the State's student academic achievement standards.
Content Area Focus
Target Population(s)
Name of Strategy Person
Responsible
Indicators of Success (Measurable Evaluation
Outcomes)
Research Supporting Strategy (i.e., IES Practice Guide or What Works
Clearinghouse)
teleconferencing to enhance learning experience of students Consult and collaborate directly with teachers, and work with students for the purpose of modeling, demonstrating a lesson or team teaching Participate in professional learning communities to enable them to collaborate, share best practices and integrate 21st century skills into the classroom practice
All content areas
All instructors Using collaborative planning to improve teaching Professional Learning Communities-Topics include: -Common Core Standards -The Framework for Teaching -Authentic Learning and Assessment -Problem based learning -Integration of Academic and CTE -Differentiated instruction
ScIP Instructors will: Collaborate in analyzing student performance data to improve teaching and learning Actively seek solutions and new ideas to improve their craft Work cooperatively in teams to achieve common goals Encourage and use experimentation as an opportunity to learn Reflect on pedagogical strategies to improve on lessons taught
This is a research based strategy that proved to be successful in improving student achievement. The work of Dufour, Ford, NSDC and Eaker is widely known.

SCHOOLWIDE COMPONENT: Reform Strategies ESEA §(b)(1)(B)(i-iii)
54
ESEA §1114 (b)(1)(D) In accordance with section 1119 and subsection (a)(4), high-quality and ongoing professional development for teachers, principals, and paraprofessionals and, if appropriate, pupil services personnel, parents, and other staff to enable all children in the school to meet the State's student academic achievement standards.
Content Area Focus
Target Population(s)
Name of Strategy Person
Responsible
Indicators of Success (Measurable Evaluation
Outcomes)
Research Supporting Strategy (i.e., IES Practice Guide or What Works
Clearinghouse)
-Integration of technology in instruction
All content areas
All instructors Engage teachers in aligning instruction with standards and benchmarks. Align curricular units to the common core and state standards
Ms Carbonell Instructors will design curricular units in the various content areas Instructors will share developed units among staff in school and district
Instruction that is grounded in the state approved curriculum will address the core content to be learned. Mastery of the curriculum is linked to the alignment of lessons plans to the standards.
All content areas
Instructors, paraprofessionals, counselors
District approved training and workshops-training to enhance implementation of AP courses
Instructors Mr Love
Instructors will design and deliver more effective lessons Students will be engaged in authentic learning activities Student achievement will improve
DOE recommended training and other activities aligned to the PD standards are supported by the district
All content areas
New teachers Improving practice of non-tenured teachers through mentoring/coaching
ScIP New teachers will transition successfully in the district Retention rate of teachers will improve
On-going support for new teachers is crucial for their success
*Use an asterisk to denote new programs.

SCHOOLWIDE COMPONENT: Reform Strategies ESEA §(b)(1)(B)(i-iii)
55
24 CFR § 200.26(c): Core Elements of a Schoolwide Program (Evaluation). A school operating a schoolwide program must—(1) Annually evaluate the implementation of, and results achieved by, the schoolwide program, using data from the State's annual assessments and other indicators of academic achievement; (2) Determine whether the schoolwide program has been effective in increasing the achievement of students in meeting the State's academic standards, particularly for those students who had been furthest from achieving the standards; and (3) Revise the plan, as necessary, based on the results of the evaluation, to ensure continuous improvement of students in the schoolwide program.
Evaluation of Schoolwide Program* (For schools approved to operate a schoolwide program beginning in the 2015-2016 school year)
All Title I schoolwide programs must conduct an annual evaluation to determine if the strategies in the schoolwide plan are achieving the planned outcomes and contributing to student achievement. Schools must evaluate the implementation of their schoolwide program and the outcomes of their schoolwide program.
1. Who will be responsible for evaluating the schoolwide program for 2015-2016? Will the review be conducted internally (by school staff), or externally? How frequently will evaluation take place? Evaluation of all programs is done at the end of the school year. The Supervisor of Program Accountability is responsible for the evaluation which is done by district staff.
2. What barriers or challenges does the school anticipate during the implementation process? Based on student outcomes, implementation of various programs has been successful. Logistical challenges of scheduling teachers for training and improving attendance to academic support classes will be addressed. Instructors are fully supportive of the measures used in improving student academic outcomes.
3. How will the school obtain the necessary buy-in from all stakeholders to implement the program(s)? Ongoing meetings are conducted to inform stakeholders of the initiatives to be implemented. Instructional decisions are also made with the input from the representatives of the teachers’ association, which facilitates buy-in from teachers. Moreover, administrators recruit teachers to work in the academic support programs-summer, before/after school.
4. What measurement tool(s) will the school use to gauge the perceptions of the staff? To determine perceptions of staff, surveys are done. Evidence is also collected using ongoing conversations with staff.
5. What measurement tool(s) will the school use to gauge the perceptions of the community? Parents participate in a survey.

SCHOOLWIDE COMPONENT: Reform Strategies ESEA §(b)(1)(B)(i-iii)
56
6. How will the school structure interventions? Student performance data is collected and analyzed continuously to identify and address the needs of struggling students. Academic support is not only provided by teachers in the regular scheduled classes but also in the summer and the before and after school program. Identified students attend summer school enrichment classes for 100 hours in the summer where they benefit from high level instruction in math and ELA. In addition, select students are provided with a period of additional instruction in math and language arts during the school day.
7. How frequently will students receive instructional interventions? Students attend academic support classes for an hour a day before or after school for four days a week. Identified students also attend summer classes from 8:30 to 12: 45 for 5 weeks days.
8. What resources/ technologies will the school use to support the school wide program? There are many classrooms that have installed desk pcs with Internet access. There are also many laptop carts which are used to deliver and measure effective instruction with online resources. The bandwidth at the school has been upgraded to support efficient use of Internet resources. Staff and students are provided with other technological devices such as smart board, document cameras, instructional software, calculators (scientific and TI-84 Inspire.
9. What quantitative data will the school use to measure the effectiveness of each intervention provided? Student performance data is collected and analyzed on the various intervention programs. The progress of students is closely monitored throughout the school year, with several snapshots being taken before the end of a term. The data is analyzed and compared with previously collected dated so that performance trends can be established.
10. How will the school disseminate the results of the school wide program evaluation to its stakeholder groups? The results of school programs are disseminated at various forums-departmental meetings, faculty meetings, public board meetings, district website, and parent meetings.
*Provide a separate response for each question.

SCHOOLWIDE COMPONENT: FAMILY AND COMMUNITY ENGAGEMENT ESEA §1114 (b)(1)(F)
57
ESEA §1114 (b)(1)(F) Strategies to increase parental involvement in accordance with §1118, such as family literacy services
Research continues to show that successful schools have significant and sustained levels of family and community engagement. As a result, schoolwide plans must contain strategies to involve families and the community, especially in helping children do well in school. In addition, families and the community must be involved in the planning, implementation, and evaluation of the schoolwide program.
2015-2016 Family and Community Engagement Strategies to Address Student Achievement and Priority Problems
Content Area Focus
Target Population(s)
Name of Strategy Person
Responsible
Indicators of Success (Measurable Evaluation
Outcomes)
Research Supporting Strategy (i.e., IES Practice Guide or What Works Clearinghouse)
All content areas
All students/parents
Frequent communication with parents
Mr Love Ms Howard
Support and input from parents Improved student performance Improved student response in class Offering academic support to parents –curriculum, assessment, PD. Providing periodic progress and report cards Providing online access to student performance
Two-way, school-home communication is linked to improved learning. Helping parents to help their children meet standards will improve student achievement.
Connecting members of the school community to support student learning will boost school climate and culture for learning
All content areas
All students/ parents
Back to School Night/Annual Parent Meeting Parents are informed of their children’s progress by individual instructors. They also experience being in the school environment and establish communication with school personnel.
Mr Love Ms Howard Ms Wallace
Improved attendance of parents and students to meet with teachers. Less disciplinary problems by students. Improved student performance Parent involvement policies, classroom visit policies, and homework policies are clear, constructive, and frequently communicated to parents and teachers.
The research linking the degree of parental involvement to student achievement is well established.

SCHOOLWIDE COMPONENT: FAMILY AND COMMUNITY ENGAGEMENT ESEA §1114 (b)(1)(F)
58
Content Area Focus
Target Population(s)
Name of Strategy Person
Responsible
Indicators of Success (Measurable Evaluation
Outcomes)
Research Supporting Strategy (i.e., IES Practice Guide or What Works Clearinghouse)
All content areas
All parents Programs to Assist Students Academically Training on PARCC, Financial Aid, Common Core Standards
Ms Wallace Mr Love
Student participation in extra-curricular activities Improved attendance of parents and students to school events. More active learning by students. Improved student performance
Parents become more empowered in guiding and helping their children in preparing for the PARCC, PSAT, SAT and post-secondary education. Parents also are able to emulate their children in classroom settings to better understand the high school experience.
All content areas
ELLs Language Assistance for Parents Provide culturally and linguistically appropriate opportunities for parents to meet with one another to encourage the sharing of norms, standards, and parenting concerns and successes
Ms Wallace Mr Love
Participation of ESL parents and students in school activities Continued excellent performance by LEP students
Effective communication with parents can significantly optimize their participation and monitoring of their children’s school activities leading to improvement of student achievement.
All content areas
All students/ parents
Parent-Teacher Conferences Mr Love Ms Howard
Increase in parental attendance at conferences Increase in passing rate of students Improvement of student attendance Decrease of disciplinary problems Parents meet with teachers to discuss their children’s progress in school and home‐based study and reading habits.
The one-on-one conferences between teachers and parents are powerful in addressing the academic needs of the students.

SCHOOLWIDE COMPONENT: FAMILY AND COMMUNITY ENGAGEMENT ESEA §1114 (b)(1)(F)
59
Content Area Focus
Target Population(s)
Name of Strategy Person
Responsible
Indicators of Success (Measurable Evaluation
Outcomes)
Research Supporting Strategy (i.e., IES Practice Guide or What Works Clearinghouse)
All content areas
All students/ parents
Other: Freshmen orientation Senior Parent Meeting Adopt school-parent compact and distribute to parents and students
Ms Wallace Mr Love Ms Howard
Improved attendance by parents and students Consistent attendance of AHSA seniors to additional academic classes Parent policies, activities, and programs cultivate the ‘curriculum of the home.’ Parents receive regular, jargon-free communication about learning standards, their children’s progress, and the parents’ role in their children’s school success. Parents receive practical guidance to maintain regular and supportive verbal interaction with their children. Parents receive practical guidance to encourage their children’s regular reading habits at home. Parents receive practical guidance to model and encourage respectful and responsible behaviors.
Orientation of 9th grade students with their parents facilitate smooth transition of students to new school environment and to meet high school rigor and standards
All Subjects
All Students Build and maintain partnership with community-colleges, businesses, family and community
Mr Love Mr Gill Ms Landis Ms Morales
Partnership with college Student enrollment in college courses
Partnership with businesses and colleges will prepare students for success in college and careers
*Use an asterisk to denote new programs.

SCHOOLWIDE COMPONENT: FAMILY AND COMMUNITY ENGAGEMENT ESEA §1114 (b)(1)(F)
60
2015-2016 Family and Community Engagement Narrative
1. How will the school’s family and community engagement program help to address the priority problems identified in the comprehensive needs assessment? With more frequent communication with parents and the community, parents will be more engaged in the activities of the school. They will monitor their children’s performance more closely with the use of the parent portal, progress reports and report cards. With more up to date information on student progress, they will communicate with teachers and school leaders on an ongoing basis. With the focus on improved student outcomes, the priority problems will be addressed.
2. How will the school engage parents in the development of the written parent involvement policy?
With the assistance of the parent coordinator, regular meetings with parents will be facilitated. The Parent, Teachers Students Association (PTSA) meets on a monthly basis to discuss and review the progress of the school. The parent involvement policy will be developed with input from the PTSA.
3. How will the school distribute its written parent involvement policy?
The parent involvement policy will be distributed to parents at the freshmen orientation and at PTSA meetings. Copies will be mailed to those who do not attend. The policy will also be posted on the school’s website.
4. How will the school engage parents in the development of the school-parent compact?
With the assistance of the parent coordinator, regular meetings with parents will be facilitated. The Parent, Teachers Students Association (PTSA) meets on a monthly basis to discuss and review the progress of the school. The school-compact will be developed with input from the PTSA.
5. How will the school ensure that parents receive and review the school-parent compact? The school compact will be distributed to parents at the freshmen orientation and at PTSA meetings. A copy will be mailed to those who don’t receive it. The compact will also be posted on the school’s website.
6. How will the school report its student achievement data to families and the community? Student achievement data is provided to the public through PTSA meetings, school’s website, board meetings and reports, which are mailed to parents. Parents can also use the parent portal of PowerSchool to access data of the performance of their children.
7. How will the school notify families and the community if the district has not met its annual measurable achievement objectives (AMAO) for Title III? N/A

SCHOOLWIDE COMPONENT: FAMILY AND COMMUNITY ENGAGEMENT ESEA §1114 (b)(1)(F)
61
8. How will the school inform families and the community of the school’s disaggregated assessment results?
Student achievement data is provided to the public through PTSA meetings, school’s website, and board meetings. Data charts are also posted in the school. Instructors also use power point to present performance data to students.
9. How will the school involve families and the community in the development of the Title I Schoolwide Plan? Input from parents will be solicited at parent meetings. They also give their input by responding to an electronic survey. Information is analyzed and used to develop the plan.
10. How will the school inform families about the academic achievement of their child/children? Families are informed about the academic achievement of their children on a regular basis. Progress and report cards are mailed periodically. Parents can also access real time data on their children’s progress from the teachers’ grade books by logging into the parent portal of Power School. For at risk students, teachers and counselors will make personal contact with the parents.
11. On what specific strategies will the school use its 2014-2015 parent involvement funds? Funds will be used for the salary and benefits of the parent coordinator who will coordinate and manage the activities of the school. Funds will used be used to maintain the website in communicating with parents and other stakeholders. In addition, funds will be used to purchase pamphlets, parent literature and the mailing of parent letters.
*Provide a separate response for each question.

SCHOOLWIDE: HIGHLY QUALIFIED STAFF ESEA §(b)(1)(E)
62
ESEA §1114(b)(1)(E) Strategies to attract high-quality highly qualified teachers to high-need schools.
High poverty, low-performing schools are often staffed with disproportionately high numbers of teachers who are not highly qualified. To address this disproportionality, the ESEA requires that all teachers of core academic subjects and instructional paraprofessionals in a schoolwide program meet the qualifications required by §1119. Student achievement increases in schools where teaching and learning have the highest priority, and students achieve at higher levels when taught by teachers who know their subject matter and are skilled in teaching it.
Strategies to Attract and Retain Highly-Qualified Staff
Number & Percent
Description of Strategy to Retain HQ Staff
Teachers who meet the qualifications for HQT, consistent with Title II-A
42 100%
The district offers continuous support to teachers through its mentoring and coaching program. Non-tenured teachers participate in feedback sessions with their mentors, in which they are provided with the necessary skills and knowledge to successfully overcome any potential challenges. The support is done at no cost to the participants. Mentoring and coaching fees are paid by the district. Administrators also provide ongoing support for teachers by coaching them in areas that will improve their performance.
Teachers who do not meet the qualifications for HQT, consistent with Title II-A
0 0
Instructional Paraprofessionals who meet the qualifications required by ESEA (education, passing score on ParaPro test)
N/A
Paraprofessionals providing instructional assistance who do not meet the qualifications required by ESEA (education, passing score on ParaPro test)*
N/A

SCHOOLWIDE: HIGHLY QUALIFIED STAFF ESEA §(b)(1)(E)
63
* The district must assign these instructional paraprofessionals to non-instructional duties for 100% of their schedule, reassign them to a school in the district that does not operate a Title I schoolwide program, or terminate their employment with the district.

SCHOOLWIDE: HIGHLY QUALIFIED STAFF ESEA §(b)(1)(E)
64
Although recruiting and retaining highly qualified teachers is an on-going challenge in high poverty schools, low-performing students in these schools have a special need for excellent teachers. The schoolwide plan, therefore, must describe the strategies the school will utilize to attract and retain highly-qualified teachers.
Description of strategies to attract highly-qualified teachers to high-need schools Individuals Responsible
Partnerships with Universities The school district has a very good relationship with universities such as the NJCU and Montclair State. Many aspiring teachers are recommended to complete their teaching internship in our district. A few of these interns have been hired as teachers in the district. In addition, supervisors are pro-active in doing on site recruitment at various universities.
Ms Morales Ms Landis
Mentoring/Coaching/Induction The district has a very effective mentoring program that vigorously supports non-tenured teachers throughout the year. Mentors and mentees meet at once per week for 30 weeks (34 weeks for mentees with CE). New teachers with standard certificate also get coaching for the first three months after hire. New teachers and their mentors attend two-day induction training to the district in the summer prior to the beginning of the year. As an incentive, the mentoring fees for the mentor and the mentee are paid by the district.
District Mentoring Committee
Networking Principals and supervisors are part of a network of educators who share information with regards to recruiting highly qualified teachers. Many teachers have been recruited as a result of this network.
Principals, Supervisors