Thesis submitted to obtain the degree of Doctor (Ph.D.) in Sciences ...
179
IMPLEMENTATION OF NANO-LIQUID CHROMATOGRAPHY HYPHENATED TO T ANDEM MASS SPECTROMETRY FOR PROTEIN IDENTIFICATION IN GEL AND NON-GEL BASED PROTEOMICS Thesis submitted to obtain the degree of Doctor (Ph.D.) in Sciences: Biochemistry FRANK VANROBAEYS 2005 Promotor: Prof. Dr. J. Van Beeumen Department of Biochemistry, Physiology and Microbiology Laboratory of Protein Biochemistry and Protein Engineering Co-promotor: Prof. Dr. R. Van Coster Department of Pediatric Neurology and Metabolism
-
Upload
khangminh22 -
Category
Documents
-
view
1 -
download
0
Transcript of Thesis submitted to obtain the degree of Doctor (Ph.D.) in Sciences ...
IMPLEMENTATION OF NANO-LIQUID CHROMATOGRAPHY HYPHENATED TO TANDEM MASS SPECTROMETRY FOR PROTEIN IDENTIFICATION
IN GEL AND NON-GEL BASED PROTEOMICS
Thesis submitted to obtain the degree of Doctor (Ph.D.) in Sciences: Biochemistry
FRANK VANROBAEYS
2005
Promotor: Prof. Dr. J. Van Beeumen
Department of Biochemistry, Physiology and Microbiology Laboratory of Protein Biochemistry and Protein Engineering
Co-promotor: Prof. Dr. R. Van Coster
Department of Pediatric Neurology and Metabolism


“When a thing was new, people said, ‘It is not true’. Later, when the truth became obvious, people said, ‘Anyway, it is not important.’ And when its importance could not be denied, people said, ‘Anyway, it is not new.” William James (1842–1920)

DANKWOORD
Na vier jaar en negen maanden is het zover ..., een afgewerkt proefschrift. Zonder de hulp, inzet, motivatie van verscheidene mensen zou dit werk echter niet zijn wat het nu is. Daarom wens ik, in de meest gelezen rubriek van de proefschriften, een woord van dank te richten aan deze personen. Allereerst dank ik mijn promotor, Prof. Dr. J. Van Beeumen, niet alleen voor het ter beschikking stellen van zijn laboratorium, maar ook voor het vertrouwen die hij in mij als persoon gesteld heeft. Daarnaast, professor, heb ik bewondering hoe u in uw drukke agenda telkens de tijd kon vinden om, naast dit proefschrift, manuscripten grondig en deskundig na te lezen. Je interesse en bekommernis in ‘mijn’ onderzoek heb ik sterk gewaardeerd. Vervolgens dank ik Prof. Dr. B. Devreese voor de talloze hulp gedurende de voorbije jaren. Bart, tijdens dit doctoraat hebben we samen heel wat projecten onder handen genomen en heb je mij een enorme pak ‘massaspectrometrische’ en wetenschappelijke kennis meegegeven. Na uw promotie stond (en staat) uw deur altijd open voor een wetenschappelijke babbel. De hulp bij het oplossen van technische of wetenschappelijke problemen, de aanvoer van nieuwe ideeën en het advies tijdens het onderzoek heb ik enorm geapprecieerd. Mijn oprechte dank voor de schitterende begeleiding. Verder dank ik mijn co-promotor Prof. Dr. R. Van Coster. Uw enthousiasme heeft mij gedurende de voorbije jaren enorm gestimuleerd. Ik stond versteld van uw talloze ideeën die naar voor werden gebracht op onze ‘formele’ vergaderingen. De betrokkenheid bij het onderzoek en het openstellen van uw laboratorium zal ik niet snel vergeten. Bij deze wens ik ook Joél te danken voor het uitvoeren van de ‘blue-native’ elektroforese experimenten en Goedele voor het ‘opstarten’ van het myeline project. Ik dank mijn collega’s, enkelen zijn reeds ex-collega, van het Laboratorium voor Eiwitbiochemie en Eiwitengineering. Jullie hebben er niet alleen voor gezorgd dat er een aangename sfeer heerste op de ‘werkvloer’, de verscheidene samenwerkingen binnen het laboratorium, gepaard gaande met discussies en opmerkingen, hebben gezorgd voor een meer kritische geest en verruiming van mijn biochemische kennis. Ann, Bart, Bjorn, Frederik, Gonzy, Griet, Isabel, John, Kjell, Koen, Kris, Lina, Paco, Wesley, .... bedankt! Elke, voor jou een speciaal woord van dank. De inzet, gedrevenheid en hulp bij de (ontelbare) experimenten hebben zeker gezorgd voor een meerwaarde van dit proefschrift .... hartelijk dank! Onderzoek doe je nooit alleen! De voorbije jaren heb ik de waarde van samenwerkingen sterk kunnen ervaren. Zelf was ik verrast toen ik merkte dat ik in 'contact' ben gekomen met zoveel mensen tijdens het onderzoek in de verschillende

projecten. Ik vermeld niet iedereen afzonderlijk maar de dank is daarom niet minder, is welgemeend en gericht aan allen waar ik heb mee samengewerkt. Tenslotte dank ik mijn ‘kleine’ familie, broer en zus, en mijn ‘schone’ familie, schoonouders, Maxim, Nathalie voor de steun, interesse de voorbije jaren en de mooie momenten van ontspanning die soms broodnodig was. Als laatste.... mijn echtgenote. Stefanie, je hebt mij enorm gemotiveerd tijdens deze studies, je was een steun en toeverlaat. Soms werd mijn druk leven je iets te veel, dan zei je: “Weeral labo!?” Om deze momenten te verzachten en je te bedanken laat ik je terugdenken aan het volgende: ‘Bloemen verwelken, scheepjes vergaan, maar .....’
vi
TABLE OF CONTENTS
LIST OF PUBLICATIONS ix ABBREVIATIONS xi FOREWORD 1
PART I:
FROM GENOMICS TO PROTEOMICS Chapter I: Integrative approaches: discovery driven research 1. Introduction 4 2. The 21st century: the '-omics' world 5 2.1 Genomics 5 2.1.1. Large-scale gene deletion 6 2.1.2. Transcriptional profiling 7 2.1.3. Comments 8 2.2. Proteomics 9 2.2.1. Introduction 9 2.2.2. Challenges in proteomics 9 2.3. Metabolomics 10 3. Conclusions 10 4. References 11 Chapter II: Proteomics: technology driven-research 1. Introduction 14 2. Profiling proteomics 15 3. Functional proteomics: protein-protein interactions 15 3.1. Introduction 15 3.2. Technologies 16 3.2.1. Phage display technique 16 3.2.2. Two-hybrid approach 17 3.2.3. Protein microarrays 19 3.2.4. Affinity-based methods 20 3.2.5. Summary 22 4. Functional proteomics: protein-small molecule interactions 22 5. Structural proteomics 23 6. Conclusions 24 7. References 25 Chapter III: Profiling proteomics: mass spectrometry driven-research 1. Introduction 29 2. Mass spectrometry 30 2.1. Ion sources 30 2.1.1. Matrix-assisted laser desorption ionization 30 2.1.2. Electrospray ionization 31 2.2. Mass analyzers 32 2.2.1. Introduction 32
vii
2.2.2. The quadrupole mass filter 32 2.2.3. Time-of-flight 33 2.2.4. Ion trap 34 2.3. Tandem mass spectrometry 34 2.3.1. Introduction 34 2.3.2. Collision-induced dissociation 35 2.3.3. Instrumentation 36 2.3.3.1. Q-TOF 36 2.3.3.2. Q-TRAP 37 2.3.3.3. MALDI TOF-TOF 38 3. Strategies in profiling proteomics 39 4. Protein identification strategies 41 4.1. Introduction 41 4.2. Principles 41 4.2.1. Peptide mass fingerprint 41 4.2.2. Peptide fragmentation fingerprint 42 4.2.3. Peptide sequence tag 44 4.2.4. Summary 44 5. Conclusions 45 6. References 46 AIMS AND RATIONALE 51
PART II:
PROTEOMIC ANALYSIS BY TWO-DIMENSIONAL GEL
ELECTROPHORESIS AND MASS SPECTROMETRY
Chapter IV: Identification of proteins separated by gel electrophoresis using mass spectrometry 1. Introduction 55 2. Two-dimensional gel electrophoresis 55 3. Mass spectrometric analyses 56 3.1. NanoLC hyphenated to Q-TOF MS 56 3.2. NanoLC hyphenated to Q-TRAP MS 60 3.3. MALDI TOF-TOF MS 62 4. Conclusions 64 5. References 65 Chapter V: Shewanella oneidensis MR-1: a dissimilatory iron-reducing Bacterium 1. Introduction 67 2. Shewanella oneidensis: a versatile organism 67 3. Dissimilatory Fe(III)-reduction 68 3.1. Introduction 68 3.2. Mechanisms for dissimilatory iron reduction 69 3.2.1. Strategies for Fe(III) oxide reduction 69 3.2.2. Model for electron transfer 70 3.3. Conclusions 71 4. Proteomic analysis of Shewanella oneidensis MR-1 72 4.1. Introduction 72

viii
4.2. Results and discussion 73 4.2.1. Bacterial growth and 2D-PAGE analysis 73 4.2.2. Differentially displayed proteins 76 4.3. Conclusions 79 5. References 80 Chapter VI: Heat shock response in barley shoots 1. Introduction 87 2. Results and discussion 88 2.1. 2D-gel electrophoresis and image analysis 88 2.2. Mass spectrometry 93 2.3. Proteins identified by mass spectrometry 93 3. Conclusions 94
PART III:
PROFILING OF MEMBRANE PROTEINS IN MAMMALIAN SYSTEMS Chapter VII: Oxidative phosphorylation: a proteomic approach 1. Introduction 99 2. The mitochondrion 100 2.1. Introduction 100 2.2. The electron transport chain 100 2.3. Oxidative phosphorylation 102 3. BN-PAGE 102 4. Profiling of the oxphos complexes 104 4.1. Human heart tissue 104 4.2. Human liver tissue 111 4.3. A qualitative comparative analysis 116 4.4. Conclusions 120 5. References 121 Chapter VIII: Protein profiling of the myelin sheath 1. Introduction 126 2. Results and discussion 128 2.1. 2D-electrophoresis 128 2.2. Multi-dimensional liquid chromatography 131 2.3. Characteristics of the detected peptides and the identified proteins 136 2.4. Biological relevance of the identified proteins 139 3. Conclusions 140 4. References 141 SUMMARY AND GENERAL DISCUSSION 143 SAMENVATTING 145 Appendix A 148 Appendix B 151 Appendix C 154 Appendix D 157 Appendix E - Supplemental Table 160
ix
LIST OF PUBLICATIONS
THE FOLLOWING PAPERS ARE INCLUDED IN THIS THESIS:
PART II:
I Devreese, B.; Vanrobaeys, F.; Van Beeumen, J. Automated Nanoflow Liquid Chromatography/Tandem Mass Spectrometric Identification of Proteins from Shewanella putrefaciens Separated by Two- dimensional Polyacrylamide Gel Electrophoresis. RAPID COMMUNICATIONS IN MASS SPECTROMETRY 2001, 15, 50-56 II Vanrobaeys, F.; Devreese, B.; Lecocq, E.; Rychlewski, L.; De Smet, L.; Van Beeumen, J. Proteomics of the Dissimilatory Iron-reducing Bacterium Shewanella oneidensis MR-1, using a Matrix-assisted Laser Desorption/Ionization Tandem Time of Flight Mass Spectrometer. PROTEOMICS 2003, 3, 2249-2257 III Sule*, A.; Vanrobaeys*, F.; Hajos, G.; Van Beeumen, J.; Devreese, B. Proteomic Analysis of Small Heat Shock Protein Isoforms in Barley Shoots. PHYTOCHEMISTRY 2004, 65, 1853-1863 * Equal contribution to the work
PART III:
IV Devreese, B.; Vanrobaeys, F.; Smet, J.; Van Beeumen, J.; Van Coster, R. Mass Spectrometric Identification of Mitochondrial Oxidative Phosphorylation Subunits Separated by Two-dimensional Blue-native Polyacrylamide Gel Electrophoresis. ELECTROPHORESIS 2002, 23, 2525-2533 V Devreese, B.; Vanrobaeys, F.; Lecocq, E.; Smet, J.; Van Coster, R.; Van Beeumen, J. Automated Nanoflow Liquid Chromatography/Tandem Mass Spectrometric Identification of Liver Mitochondrial Proteins. In Handbook of Proteomic Methods 2003, pp. 181-191 Edited by: P. Michael Conn, Humana Press Inc., Totowa, NJ VI Vanrobaeys, F.; Van Coster, R.; Devreese, B.; Dhondt, G.; Van Beeumen, J. Profiling of Myelin Proteins by 2D-gel Electrophoresis and Multidimensional Liquid Chromatography Coupled to MALDI TOF-TOF Mass Spectrometry. JOURNAL OF PROTEOME RESEARCH 2005, in press
x
ADDITIONAL PAPERS
Devreese, B.; Janssen, K.P.; Vanrobaeys, F.; Van Herp, F.; Martens, G.J.; Van Beeumen, J. Automated Nanoflow Liquid Chromatography-Tandem Mass Spectrometry for a Differential Display Proteomic Study on Xenopus laevis Neuroendocrine Cells. JOURNAL OF CHROMATOGRAPHY A 2002, 976, 113-121
Kyndt, J.; Vanrobaeys, F.; Fitch, J.; Devreese, B.; Meyer, T.; Cusanovich, M.; Van Beeumen, J. Heterologous Production of Halorhodospira halophila Holo-photoactive Yellow Protein through Tandem Expression of the Postulated Biosynthetic Genes. BIOCHEMISTRY 2003, 42, 965-970
Pauwels, F.; Vergauwen, B.; Vanrobaeys, F.; Devreese, B.; Van Beeumen, J. Purification and Characterization of a Chimeric Enzyme from Haemophilus influenzae Rd that Exhibits Glutathione-dependent Peroxidase Activity. JOURNAL OF BIOLOGICAL CHEMISTRY 2003, 278, 16658-16666
Cardol, P.; Vanrobaeys, F.; Devreese, B.; Van Beeumen, J.; Matagne, R.F.; Remacle, C. Higher Plant-like Subunit Composition of Mitochondrial Complex I from Chlamydomonas reinhardtii: 31 Conserved Components among Eukaryotes. BIOCHIMICA ET BIOPHYSICA ACTA 2004, 1658, 212-224
Stove, C.; Vanrobaeys, F.; Devreese, B.; Van Beeumen, J.; Mareel, M.; Bracke, M. Melanoma Cells Secrete Follistatin, an Antagonist of Activin-mediated Growth Inhibition. ONCOGENE 2004, 23, 5330-5339
Donners, M.; Verluyten, M.J.; Bouwman F.G.; Mariman, E.C.; Devreese, B.; Vanrobaeys, F.; Van Beeumen, J.; van den Akker, L.H.; Daemen, M.; Heeneman, S. Proteomic Analysis of Differential Protein Expression in Human Atherosclerotic Plaque Progression. JOURNAL OF PATHOLOGY 2005, 206, 39-45
De Celle, T.; Vanrobaeys, F.; Lijnen, P.; Blankesteijn, W.M.; Heeneman, S.; Van Beeumen, J.; Devreese, B.; Smits, J.F.; Janssen, B.J. Alterations in Mouse Cardiac Proteome after in vivo Myocardial Infarction: Permanent Ischaemia versus Ischaemia-reperfusion. EXPERIMENTAL PHYSIOLOGY 2005, 90.4, 593-606
Peiren*, N.; Vanrobaeys*, F.; de Graaf, D.; Devreese, B.; Van Beeumen, J.; Jacobs, F. The Protein Composition of Honeybee Venom Reconsidered by a Proteomic Approach. BIOCHIMICA ET BIOPHYSICA ACTA 2005, in press * Equal contribution to the work
de Koning, L.; Kasper, P.; Back, J.W.; Nessen, M.; Vanrobaeys, F.; Van Beeumen, J.; Gherardi, E.; de Koster, C.; de Jong, L. Computer-assisted Mass Spectrometric Analysis of Naturally Occurring and Artificially Introduced Cross-links in Proteins and Protein Complexes. FEBS JOURNAL 2005, in press
xi
ABBREVIATIONS 1D one-dimensional 2D two-dimensional 3D three-dimensional aa amino acid ACN acetonitrile ADP adenosine 5'-diphosphate ATP adenosine 5'-triphosphate bp basepair(s) BN blue-native CBB Coomassie Brilliant Blue cDNA complementary DNA CHAPS 3-[3-(cholamidopropyl)-dimethylammonio]-1-propanesulfonate CID collision-induced dissociation CNS central nervous system CV coefficient of variation COX cytochrome c oxidase Da Dalton DC direct current DNA deoxyribonucleic acid DTT dithiothreitol ESI electrospray ionization EST expressed sequence tag FAD(H) flavin adenine dinucleotide Fe-S protein iron-sulphur protein FMN flavin mononucleotide FWHM full-width half maximum GST glutathione-S-transferase HPLC high-performance liquid chromatography HSP heat shock protein ICAT isotope-coded affinity tag IEF Isoelectric focusing IPG Immobilized pH gradient kDa kilodalton LB Luria Bertani broth LC liquid chromatography
xii
M molar MALDI matrix-assisted laser desorption ionization MDLC multi-dimensional liquid chromatography mRNA messenger ribonucleic acid MS mass spectrometry MS/MS tandem mass spectrometry mtDNA mitochondrial DNA Mw Molecular weight m/z mass-to-charge ratio NAD(H) nicotinamide adenine dinuleotide NADP(H) nicotinamide adenine dinucleotide phosphate nanoLC nano liquid chromatography NMR nuclear magnetic resonance ORF open reading frame OXPHOS oxidative phosphorylation PAGE polyacrylamide gel electrophoresis PCR polymerase chain reaction PFF peptide fragmentation fingerprint pI isoelectric point PMF peptide mass fingerprint PSD post-source decay PST peptide sequence tag Q quadrupole RF radio frequency RNA ribonucleic acid RP reversed-phase SCX strong cation exchange SDS sodium dodecyl sulphate TAP tandem affinity purification TIC total ion current TIS timed-ion selector TOF time-of-flight TRIS Tris[hydroxymethyl]-aminomethane UV ultraviolet

1
FOREWORD It is now more than fifty years since James Watson and Francis Crick deduced the structure of DNA and gave an impetus to the science of molecular biology. Although DNA was a difficult macromolecule for the biochemist to study until the early 1970s, the development of different recombinant technologies has made that DNA is now one of the easiest molecules to analyze. For example, it is possible to excise a specific region of DNA, to produce a virtually unlimited number of copies of it, and to determine the sequence of its nucleotides at a rate of hundreds of nucleotides a day. In particular, the development of DNA sequencing methods (chemical and enzymatic) has had a great impact on further scientific research. As these techniques were automated, the determination of the entire DNA sequence of a whole organism became possible. The shotgun genome sequence strategy resulted in the elucidation of the first genome in 1995. The complete bacterial genome of Haemophilus influenza (~1.8 Mbp) was published, and is one of the milestones in molecular microbiology. From that moment onwards, the pace at which new genomes are being sequenced has been constantly increasing. Six genome sequences were elucidated in 1996 alone, including the baker's yeast Saccharomyces cerevisiae genome. This got much of attention, as it was the first eukaryotic genome to be sequenced. Today, the genome sequences of more than 200 organisms have been determined. In 1990, the Human Genome Project was started in 20 different sequencing centres from six different countries. The goal was to decipher the human genome within the next 15 years, in order to provide us with a ‘dictionary of the human being’. This goal was accomplished in 2003, and is now available to anyone with an internet connection at multiple sites on the World Wide Web. The increasing availability of complete or partially sequenced genome sequences has removed the information bottleneck and significantly altered the scale of biological experiments. The access to an organism's or cell's genome paves the way for the development of technologies to study whole molecular systems. These comprehensive, global analysis techniques intend to better understand the biological processes in a cell or an organism, and all try to address an answer to one of the three following questions. First, what is the 'content' of the biological system (i.e. genes and their products)? Second, what is the functioning of each of these individual components, and thirdly, how are individual components working together? In this work, large-scale strategies for the separation and identification of proteins based on electrophoresis, nano-liquid chromatography and mass spectrometry were developed to investigate the protein content of particular bacterial, plant and mammalian systems. This thesis is divided into three parts. Part I deals with the current status of large-scale strategies for the analysis of proteins in biological systems. In Chapter I, genomics and the need to shift towards proteomic approaches are outlined. An overview of key technologies used in functional and structural proteomics is provided in Chapter II, whereas mass spectrometry and the strategies for profiling of proteins are discussed in detail in the final chapter of this part (Chapter III). Part II describes the analysis of cytosolic proteins by two-dimensional polyacrylamide gel electrophoresis and mass spectrometry. First, the techniques are highlighted that

2
were used to identify gel separated proteins, i.e. the implementation of nano-liquid chromatography and mass spectrometry (Chapter IV). The next two chapters are applications of the developed methodology in two case studies: the protein composition of the dissimilatory iron-reducing bacterium Shewanella oneidensis MR-1 grown on ferric oxide (Chapter V) and the effect of a short-term heat shock on the plant barley (Chapter VI). Part III deals with the development of alternative strategies for the analysis of membrane proteins. A special electrophoretic technique, i.e. blue-native polyacrylamide gel electrophoresis, in combination with mass spectrometry, was used for profiling the different subunits of the oxidative phosphorylation system (Chapter VII), while multi-dimensional liquid chromatography coupled to MALDI tandem mass spectrometry was used for the profiling of the proteins present in the murine myelin sheath (Chapter VIII).
PART I:
FROM GENOMICS TO PROTEOMICS
CHAPTER I
4
CHAPTER I
INTEGRATIVE APPROACHES:
DISCOVERY-DRIVEN RESEARCH
1. INTRODUCTION The goal of molecular biology research is to find out the function of genes and their products, i.e. proteins, allowing unraveling the pathways and networks in which they function. The ultimate goal is a detailed understanding of how a biological system works. In the past, biological questions have been mainly approached by studying individual genes and gene products. This was largely due to the lack of information and technologies capable of doing large scale investigations. Until 15 years ago, biological systems were mostly examined by a 'reductive' approach. Reductionism is the attempt to explain complex phenomena by defining the functional properties of the individual components that compose multi-component systems1. This focus on individual components was extremely successful and has led to the discovery of an impressive number of biological principles. In the future, these reductionist methods will certainly continue to be essential in biological research. However, this kind of research alone can not lead to a complete understanding of living organisms. Complex biological processes can not simply be unraveled by knowing the individual parts and how these work in isolation, because cells and organisms are definitely more than the sum of their parts. This integrative thinking already exists for a long time and has led to the discovery of several important regulatory circuits in the previous century. For example, the feedback inhibition of amino acid biosynthetic pathways was discovered in 19572,3. With the study of these regulatory mechanisms, molecular biologists began to apply system approaches to unravel the molecular components and their cellular processes. This science is termed Systems Biology and can be described as a comprehensive quantitative analysis of the manner in which all the components of a biological system interact functionally over time4,5. The final goal is an understanding of the information flow from gene to biological function. The original approaches were performed on a rather small scale and a major technological breakthrough, automated DNA sequencing, shifted integrative approaches in biological research to a larger scale. These methods are irrespective of any hypothesis and are discovery-driven. However, prior to the first published genome, most research was hypothesis-driven. Here, a hypothesis was put forward for a given observation, and an experiment was designed to prove or disprove it. Hence, these methods can provide complementary information to discovery-driven research and ideally, therefore, these two research strategies should be used in combination.

CHAPTER I INTEGRATIVE APPROACHES: DISCOVERY-DRIVEN RESEARCH
5
2. THE 21st CENTURY: THE '-OMICS' WORLD The complete set of genes in an organism (genome) is transcribed into a complete set of mRNA (transcriptome) and is finally translated into a complete set of proteins (proteome). The genome is static, context-independent, while the last two levels or dynamic or context-dependent. The transfer of information from the sequence in the genes to the functioning proteins is depicted in Figure 1. The modern systems biology approach to molecular biology has set out a new course and led to the introduction of a new terminology. While the term genome was already launched in 19206 (the elision of the words genes and chromosomes), the terms transcriptome and proteome are fairly new. High-throughput data rich methods in these novel fields of research are denoted as '-omic' approaches. The words genome, transcriptome, proteome and metabolome seem to have started a new trend, new '-ome' words being coined at an impressive rate. Examples include the glycome, secretome, physiome, phenome and localizome7. However, these '-ome' disciplines are more and more overlapping each other, and are not always referring to previously non-existent areas of research. A bizarre and sometimes ridiculous terminology has sprung up around these large-scale biological experiments, and has resulted in more than 100 "-omic" neologisms to date. A few of the more ghastly examples are foldomics, functomics, GPCRomics, inomics, ionomics, pharmacomethylomics and separomics8.
2.1. GENOMICS
The term ‘genomics’ covers many different technologies, all of which are related in some way to the information content of a cell, in other words, its DNA. High-throughput DNA sequencing has given a drive to genomics, and whole shotgun genome sequencing projects came up like mushrooms. A large number of completed sequences from prokaryotes, viruses and eukaryotes are now elucidated9. These completed genome sequences result in huge amounts of data, which must be reduced to useful information. After a genome sequence has been completed, the first step of genome analysis generally intends to identify the inventory of genes (gene prediction and annotation)10 and to compare this inventory with other genomes,
Figure 1. Overview of the transfer of information from the sequence in the genes to the functioning proteins of the cell (the central dogma) in a eukaryotic cell (schematic). The possible control mechanisms are indicated (red): (1) transcriptional control; (2) RNA editing control; (3) RNA processing control; (4) RNA transport control; (5) mRNA degradation control; (6) mRNA translational control; (7) protein activity control.
CHAPTER I INTEGRATIVE APPROACHES: DISCOVERY-DRIVEN RESEARCH
6
where emphasis is put on similarities, differences and uniqueness among genes11. Note that sequence (gene) similarity does not automatically imply functional and/or structural accordance, and vice versa12. Several powerful informatic tools are now available for analyzing genome sequence features other than gene comparisons. For example, codon bias, dinucleotide relative abundance, and repeat structures can all be determined once a genome sequence is completed13. Despite the advances in bioinformatics, the correct prediction of genes from genomic data is still low14,15. This makes that genomes are not fully annotated, and sometimes the gene inventory is hotly disputed. For example, the number of genes present in the human genome16-18 has not yet been defined precisely19. The estimated range for the number and the identity of the genes varies depending on the method or the criteria used20-23. Even the yeast genome, which was assembled in 1996, is still not completely annotated. People soon realized that extracting and interpreting the information couched in the genome was not as straightforward as initially thought, and it has become widely recognized that the genome only represents the first layer of complexity. How could we otherwise explain the biological diversity between humans (~30.000 genes), nematodes (~18.000 genes), fruit flies (~12.000 genes)24 and yeast (~6.000 genes)25. Therefore, a lot of genetic and biochemical tools are brought into play once a genome sequence has been completed, attempting to assign function to genes. This discipline, an outcome of genomics, is referred to as ‘functional genomics’. This type of genomics is defined as the link of information about function to knowledge of DNA sequence26. It is obvious that this definition is not stringent and, in the next two sections, we will discuss some key tools used in functional genomics at the DNA and mRNA level. As we can be far from complete in this expanding field, we refer to excellent reviews for further reading27,28.
2.1.1. LARGE-SCALE GENE DELETION
Functional information from genome sequences can be obtained by mutagenesis strategies, relying on prior advances in large-scale clone preparation and sequencing. Phenotypic analysis of mutants has been a powerful approach for determining gene function. Large-scale mutagenesis approaches can be divided into (i) mutagenesis by homologous recombination and (ii) random mutagenesis obtained by mutagenic chemicals, irradiation or by random insertion of DNA sequences. While the former needs the availability of a complete genome sequence, the latter does not. If these approaches are carried out on whole organisms, this is referred to as ‘phenomics’ because the phenotype of an organism is observed29. The power of systematic mutant analysis is well illustrated by an experiment in the yeast Saccharomyces cerevisiae30,31. A gene deletion strain was generated for every single gene and the resulting phenotypes analyzed. The developed tool also allowed quantitative measurements. The technique can compare function and expression and, therefore, goes beyond determining whether a gene is essential or not. Despite their power, genome-wide targeted deletions generated by homologous recombination have yet to be reported in other organisms than yeast. On the other hand, insertional mutagenesis studies have been successfully applied in different organisms, for example in yeast32 and Arabidopsis thaliana33, using transposons or T-DNA. However, main disadvantages compared to targeted gene deletion are: (i) some regions are hot spots or, on the contrary, not susceptible to insertion, (ii) position of integration can lead to complete or partial reduction and, therefore, the site of integration needs to be determined for every mutant of interest.
CHAPTER I INTEGRATIVE APPROACHES: DISCOVERY-DRIVEN RESEARCH
7
A more directed approach to silence the function of a target gene is RNA interference (RNAi)34. This technology is based on the observation from Caenorhabditis elegans that adding double-stranded RNA (dsRNA) interferes with gene function in a sequence-specific manner. RNAi has been shown to work in many model organisms and current applications are primarily in C. elegans35, Drosophila36, various plants37 and tissue culture cells of mammals38.
2.1.2. TRANSCRIPTIONAL PROFILING
Once a DNA sequence is transcribed, the transcript mRNA, is created. However, a single gene can give rise to different transcripts, due to alternative splicing, alternative promoter or polyadenylation site usage or RNA editing and, therefore, the complexity increases. On the other hand, the expression profile of a gene provides information about its role in the cell and functional links to other genes can be deduced. This function is most of the time predicted on the basis of the 'guilt-by-association' principle. Genes with similar expression profiles are likely to be involved in similar biological processes. Various clustering algorithms have been devised to identify co-expressed genes for functional annotation39,40. The development of novel technologies has allowed large-scale analysis at the mRNA level. The study of mRNA expression profiles on a global scale is termed ‘transcriptomics’, a term first used in 1997. Two major technologies that emerged from genomics, large-scale cDNA sequence sampling and the use of DNA arrays, are nowadays widely applied in transcriptomics. In sequence sampling, the mRNA is converted to a cDNA library and clones are randomly picked and sequenced (200-300bp). These clones are identified by comparison with a sequence database. The abundance of the clone determines the abundance of the corresponding transcript. If enough clones are sequenced, statistical analysis can be performed and an estimation of the relative mRNA levels can be made. Two or more samples may be compared by this method. However, this method is laborious and very expensive because large-scale sequencing is required. An alternative is serial analysis of gene expression (SAGE)41. This technique was first introduced in the transcriptome analysis of the S. cerevisiae mitotic cell cycle42. In this method, each cDNA molecule is reduced to a representative short sequence tag, and individual tags are concatenated into a single DNA clone. The clone is sequenced and the sequence tags are indicative for the presence of the corresponding mRNA sequences. Several other sequence sampling techniques are now available, like differential display PCR and ‘massively parallel signature sequencing’ (MPSS)43. Although sequence sampling techniques are very powerful, the method of choice in large-scale analysis of mRNA expression levels is the use of microarrays. These miniature devices occur in two major types. In mechanical spotting, the DNA molecules are immobilized onto a coated glass slide in the form of a grid and the mRNA expression levels are measured by hybridization44. The diauxic shift in S. cerevisiae was the first transcriptome analysis that made use of these Stanford cDNA microarrays45. Alternatively, the microarrays are produced by in situ oligonucleotide synthesis using a photolithographic process46. Photolithography was developed and marketed primarily by Affymetrix Inc. (Santa Clara, CA, USA)47,48 and is well known in the computer chip industry. Here, an ultraviolet light source is passed through a mask where a photochemical reaction, the oligonucleotide synthesis, will take place on the siliconized glass surface. The openings in the mask can be as small as a few
CHAPTER I INTEGRATIVE APPROACHES: DISCOVERY-DRIVEN RESEARCH
8
micrometers, allowing a density of several hundred thousands probes per square centimeter of glass. These are also known as high-density oligonucleotide chips or Affymetrix GeneChips. The mRNA expression profiles are again determined by hybridization.
2.1.3. COMMENTS
Transcriptome data contain a lot of information which sometimes can not be clearly deduced from the genome sequence. For example, analysis of the promotor regions of simultaneously expressed genes can reveal novel promotor elements49 and clustering of genes can be employed to characterize genes involved in related cellular processes50,51. Moreover, regulatory coupling is revealed by the systematic analysis of gene expression changes in knock-out mutants and is called regulatory network reconstruction52. However, the resulting phenotype, obtained by mutagenesis (2.1.1.) may not always be informative. Especially in genome-wide strategies, the loss of many proteins may be lethal. Although this is telling us that these proteins are essential, this does not reveal what these proteins actually do. Moreover, random mutagenesis can definitely provide important information, but there is unfortunately no systematic way to achieve this. Transcriptome analysis (2.1.2.) displays the relative abundance of the different transcripts in the cell. However, the mRNA expression profile is not always reflecting the abundance of the corresponding proteins, due to post-transcriptional gene regulation53. The rates of protein synthesis and protein turn-over will differ among transcripts and, therefore, the abundance of a transcript does not automatically reflect the abundance of the encoded protein. Notably, the pioneer studies of Anderson and Seilhamer54 showed that there is no good correlation between mRNA and protein levels in human liver, implying that mRNA-based expression data may be of limited value. The study compared the levels of 19 gene products and yielded a correlation coefficient of 0.48 between mRNA and protein abundance. This value is half way between perfect and no correlation at all. Even more so, not all mRNA molecules in a cell are translated into proteins and, therefore, the transcriptome may contain gene products that are not found in the proteome. Although tools for functional genomics at the DNA and/or mRNA level greatly enhance our understanding of molecular processes that occur during biological processes, nucleic acids are the 'information-carriers'. Therefore, functional genomics, be it either on the DNA or on the mRNA level, can only indirectly inform us about protein function. Oligonucleotides are without doubt important molecules in a cell but the real actors are proteins. Proteins are interacting with each other and with numerous other molecules (metabolites), and so they are responsible for almost all biochemical activity of a cell. A true understanding of a system can only come from a direct study of proteins, because they are the most functional, relevant components of a biological system. For example, mRNA profiling does not capture mechanisms of regulation involving changes in subcellular localization, post-translational modifications, turnover, and interaction with other proteins, as well as it does not capture functional aspects. In addition, several important biological targets like platelets, body fluids and cell secretions can not be analyzed by gene or mRNA arrays. Therefore, there is increasing interest in the field of proteomics, i.e. the large-scale analysis of proteins as a complement to genomics.
CHAPTER I INTEGRATIVE APPROACHES: DISCOVERY-DRIVEN RESEARCH
9
2.2. PROTEOMICS
2.2.1. INTRODUCTION
The word 'proteome' was coined by Wilkins and colleagues at the first 2D-electrophoresis conference in Siena (Italy) in September 1994, and was defined as the complete protein complement encoded by the genome55-57. However, this term does not take into account the dynamic aspect of the proteome. Therefore, the term should be broadened to include the set of proteins expressed both in space and time. The term proteomics, the study of the proteome, is generally used to encapsulate all of the technology currently available to analyze global patterns of gene expression at the protein level. A broad, appropriate definition for proteomics could be: "the effort to establish the identities, quantities, structures, and biochemical and cellular functions of all proteins in an organism, organ, or organelle, and how these properties vary in space, time, or physiological state". The idea to investigate systematically the proteins present in the human being and to build protein databases was already brought forward in the early 1980s (the human protein index58). However, absence of appropriate technologies prevented proteomics from becoming prominent before 199559.
2.2.2. CHALLENGES IN PROTEOMICS
The term protein was introduced in 1838 by J.J. Berzelius to describe a particular class of macromolecules made up of linear chains of amino acids. The term is derived from the Greek word 'proteios', meaning 'of the first order', to stress the central importance of these molecules. This definition is more and more suitable as our understanding of these macromolecules grows. Proteins can carry out very diverse functions, e.g. they play a role in structure, communication, regulation, and are involved in numerous biochemical reactions. Some proteins catalyze 'simple' reactions, e.g. phosphorylation and dephosphorylation, while others coordinate complex processes, e.g. DNA replication and transcription. Thousands of different proteins may be present in a cell and in addition, the protein abundance can span a five to six orders of magnitude range. Moreover, proteins are processed and modified in complex ways and may be the product of differential splicing. So, a relative low number of predicted genes from a genome sequence have the potential to generate a proteome of enormous and yet undetermined complexity. As a consequence, the development of technology to analyze proteins is extremely challenging. Proteomic technologies can not benefit from amplification methods, equivalent to the polymerase chain reaction, or make use of automated sequencing techniques. In addition, genome sequencing projects have a defined end point. Hence, the experimental complexity of proteomics is far beyond that of genomics, its nucleic acid-based counterpart. In the future, four main issues will need to be addressed for proteomics in order to play a substantial role in systems biology. First, proteomic technologies should be able to cope with the enormous complexity of the proteome. To date, the detection and molecular analysis of this complexity remains an unmatched task. Second, a general technology for the targeted manipulation of gene expression is needed. Systematic analysis of biological systems relies on targeted perturbations on the system and the systematic analysis of the consequences of each perturbation. A third challenge is throughput. Although today's proteomic technologies are referred to as 'high-throughput', these are still limited. The last challenge is the development
CHAPTER I INTEGRATIVE APPROACHES: DISCOVERY-DRIVEN RESEARCH
10
of a general, absolute quantification technique for proteins. This would have far-reaching implications, as quantification of proteins absolutely eliminates the need of a reference sample. In general, proteomics is a ‘young’ science and better materials, instrumental design and methodology will improve sensitivity, resolution and repeatability. The advances in proteomics will lead to a comprehensive analysis of complex biological systems.
2.3. METABOLOMICS
The level of metabolites in a cellular system is determined by proteins, in particular enzymes. A comprehensive view of the cell requires that these small molecules are studied. The large-scale discipline engaged in the characterization of small molecules, ‘metabolomics’, is part of the systems biology approach to define the phenotype of an organism and bridging the gap between the genotype and phenotype. Metabolomics was first defined by Oliver et al60 as the quantitative complement of all of the low molecular weight molecules present in cells in a particular physiological or developmental state. However, it should be mentioned that the definition of the metabolome is the theme of active debates. The experimental approaches in metabolomics make use of NMR61 or are based on gas chromatography and liquid chromatography coupled to mass spectrometry62,63. The non-targeted profiling of metabolites in biological samples is certainly complementary to proteomics and transcriptomics64. Metabolomics is a burgeoning field and a comprehensive discussion is beyond the scope of this work. Therefore, we refer to some useful recent surveys65-70.
3. CONCLUSIONS At the end of the last century, discovery-driven research made its entry and various technologies are nowadays available to study the complete set of (macro)molecules at the different levels. These integrative approaches try to unravel complex biological phenomena and their underlying biological processes, and are accompanied by an enormous amount of information. The various approaches are complementary and in combination, they can provide us with a detailed phenotype at both the transcription and the translation level. In particular the large-scale analysis of proteins is of utmost importance, because proteins are the real 'actors' in any living system. Although proteomics is a nascent technology, a plethora of state-of-the-art techniques have been developed the last decade to study protein expression profiles. These will be outlined in Chapter II and Chapter III. Finally, fueled by ever-growing DNA sequence information, we are at an information flood much greater than one could imagine a few years ago. The challenge is to make sense of all this information. We should think about integration at the informatic and experimental levels. The great complexity underlying biological processes can only be tackled by a combination of hypothesis-driven and complementary discovery-driven integrative approaches. This can ultimately lead to a thorough understanding of living organisms. This is the future, and it promises many challenges.

CHAPTER I INTEGRATIVE APPROACHES: DISCOVERY-DRIVEN RESEARCH
11
4. REFERENCES 1 Strange, K. The end of "naïve reductionism": rise of systems biology or renaissance of
physiology? Am. J. Physiol. Cell Physiol. 2005, 288, C968-C974
2 Umbarger, H.E.; Brown, B. Threonine deamination in Escherichia coli. II. Evidence for two L
threonine deaminases. J. Bacteriol. 1957, 73,105-112
3 Yates, R.A.; Pardee, A.B. Control by uracil of formation of enzymes required for orotate synthesis.
J. Biol. Chem. 1957, 227, 677-692
4 Aderem, A. Systems Biology: its practice and challenges. Cell 2005, 121, 511-513
5 Butcher, E.C.; Berg, E.L.; Kunkel, E.J. Systems biology in drug discovery. Nat. Biotechnol. 2004,
22, 1253-1259
6 Editorial, Genomics 1997, 45, 244-249
7 Greenbaum, D.; Luscombe, N.M.; Jansen, R. et al. Interrelating different types of genomic data,
from proteome to secretome: 'oming in on function. Genome Res. 2001, 11, 1463-1468. 2001
8 http://www.genomicglossaries.com/content/omes.asp
9 http://www.genomesonline.org
10 Mathe, C.; Sagot, M.; Schiex, T. et al. Current methods of gene prediction, their strengths and
weaknesses. Nucl. Acids Res. 2002, 30, 4103-4117
11 Koonin, E.V.; Mushegian, A.R.; Rudd, K.E. Sequencing and analysis of bacterial genomes. Curr.
Biol. 1996, 6, 404–416
12 Strauss, E.J.; Falkow, S. Microbial pathogenesis: genomics and beyond. Science 1997, 276:707–
712
13 Karlin, S.; Campbell, A.M.; Mrazek, J. Comparative DNA analysis across diverse genomes. Annu.
Rev. Genet. 1998, 32, 185-225
14 Claverie, J.M. Computational methods for the identification of genes in vertebrate genomic
sequences. Hum. Mol. Genet. 1997, 6, 1735-1744
15 Pandey, A.; Lewitter, F. Nucleotide sequence databases: a gold mine for biologists. Trends
Biochem. Sci. 1999, 24, 276-280
16 Collins, F.S.; Green, E.D.; Guttmacher, A.E. et al. A vision for the future of genomics research.
Nature 2003, 422, 835-847
17 Venter, J.C.; Adams, M.; Myers, E. et al. The sequence of the human genome. Science 2001, 291,
1304-1351
18 Lander, E.S.; Linton, L.; Birren, B. et al. Initial sequencing and analysis of the human genome.
Nature 2001, 409, 860-921
19 Aparicio, S.A. How to count human genes. Nat. Genet. 2000, 25, 129-130
20 Ewing, B.; Green, P. Analysis of expressed sequence tags indicates 35.000 human genes. Nat.
Genet. 2000, 25, 232-234
21 Roest-Crollius, H.; Jaillon, O.; Bernot, A. et al. Estimate of human gene number provided by
genome-wide analysis using Tetraodon nigroviridis DNA sequence. Nat Genet. 2000, 25, 235-238
22 Guigo, R.; Dermitzakis, E.T.; Agarwal, P. et al. Comparison of mouse and human genomes
followed by experimental verification yields an estimated 1.019 additional genes. Proc. Natl. Acad.
Sci. USA 2003, 100, 1140-1145
23 Flicek, P.; Keibler, E.; Hu, P. et al. Leveraging the mouse genome for gene prediction in human:
from whole-genome shotgun reads to a global synteny map. Genome Res. 2003, 13, 46-54
24 Adams, M.D.; Celniker, S.E.; Holt, R.A. et al. The genome sequence of Drosophila melanogaster.
Science 2000, 24, 2185-2195
25 Goffeau, A.; Barrell, B.G.; Bussey, H. et al. Life with 6000 genes. Science 1996, 274, 563-567

CHAPTER I INTEGRATIVE APPROACHES: DISCOVERY-DRIVEN RESEARCH
12
26 Goodfellow, P. A celebration and a farewell. Nature Genet. 1997, 16, 209-210
27 Steinmetz, L.M.; Davis, R.W. Maximizing the potential of functional genomics. Nature Rev. Genet.
2004, 5, 190-201
28 Bader, G.D.; Heilbut, A.; Andrew, B. et al. Functional genomics and proteomics: charting a
multidimensional map of the yeast cell. Trends Cell Biol. 2003, 13, 344-356
29 Paigen, K.; Eppig, J.T. A mouse phenome project. Mamm. Genome 2000, 11, 715-717
30 Giaever, G.; Chu, A.; Ni, L. et al. Functional profiling of the Saccharomyces cerevisiae genome.
Nature 2002, 418, 387–391
31 Winzeler, E.A.; Shoemaker, D.; Astromoff, A. et al. Functional characterization of the S. cerevisiae
genome by gene deletion and parallel analysis. Science 1999, 285, 901–906
32 Ross-Macdonald, P.; Coelho, P.; Roemer, T. et al. Large-scale analysis of the yeast genome by
transposon tagging and gene disruption. Nature 1999, 402, 413–418
33 Alonso, J.M.; Stepanova, A.; Leisse, T. et al. Genome-wide insertional mutagenesis of
Arabidopsis thaliana. Science 2003, 301, 653–657
34 Fire, A.; Xu, S.; Montgomery, M. et al. Potent and specific genetic interference by double-stranded
RNA in Caenorhabditis elegans. Nature 1998, 391, 806–811
35 Kamath, R.S.; Fraser, A.; Dong, Y. et al. Systematic functional analysis of the Caenorhabditis
elegans genome using RNAi. Nature 2003, 421, 231–237
36 Kennerdell, J.R.; Carthew, R.W. Heritable gene silencing in Drosophila using double-stranded
RNA. Nature Biotechnol. 2000, 18, 896–898
37 Gura, T. A silence that speaks volumes. Nature 2000, 404, 804–808
38 Elbashir, S.M.; Harborth, J.; Lendeckel, W. et al. Duplexes of 21-nucleotide RNAs mediate RNA
interference in cultured mammalian cells. Nature 2001, 411, 494–498
39 Eisen, M.B.; Spellman, P.; Brown, P. et al. Cluster analysis and display of genome-wide
expression patterns. Proc. Natl. Acad. Sci. USA 1998, 95, 14863–14868
40 Wu, L.F.; Hughes, T.; Davierwala, A. et al. Large-scale prediction of Saccharomyces cerevisiae
gene function using overlapping transcriptional clusters. Nat. Genet. 2002, 31, 255–265
41 Velculescu, V.E.; Zhang, L.; Vogelstein, B.; Kinzler, K.W. Serial analysis of gene expression.
Science 1995, 270, 484-487
42 Velculescu V.E.; Zhang, L.; Zhou, W. et al. Characterization of the yeast transcriptome. Cell 1997,
24, 243-251
43 Brenner, S.; Johnson, M.; Bridgham, J. et al. Gene expression analysis by massively parallel
signature sequencing (MPSS) on microbead arrays. Nature Biotech. 2000, 18, 630-634
44 Schena, M.; Shalon, D.; Davis, R.W. et al. Quantitative monitoring of gene expression patterns
with a complementary DNA microarray. Science 1995, 270, 467-470
45 DeRisi, J.L.; Lyer, V.R.; Brown, P.O. Exploring the metabolic and genetic control of gene
expression on a genomic scale. Science 1997, 24, 680-686
46 Lipshutz, R.J.; Fodor, S.P.; Gingeras, T.R. et al. High density synthetic oligonucleotide arrays. Nat.
Genet. 1999, 21, 20-24
47 Pease, A.C.; Solas, D.; Sullivan, E.J. et al. Light-generated oligonucleotide arrays for rapid DNA-
sequencing. Proc. Natl. Acad. Sci. USA 1994, 91, 5022-5026
48 Lipshutz, R.J.; Morris, D.; Chee, M. et al. Using oligonucleotide probe arrays to access genetic
diversity. Biotechniques 1995, 19, 442-447
49 Jensen, L.J.; Knudsen, S. Automatic discovery of regulatory patterns in promoter regions based
on whole cell expression data and functional annotation. Bioinformatics 2000, 16, 326-333

CHAPTER I INTEGRATIVE APPROACHES: DISCOVERY-DRIVEN RESEARCH
13
50 Eisen, M.B.; Spellman, P.T.; Brown, P.O. et al. Cluster analysis and display of genome-wide
expression patterns. Proc. Natl. Acad. Sci. USA 1998, 95, 14863-14868
51 Hughes, J.D.; Estep, P.W.; Tavazoie, S. et al. Computational identification of cis-regulatory
elements associated with groups of functionally related genes in Saccharomyces cerevisiae. J.
Mol. Biol. 2000, 296, 1205-14
52 Herrgard, M.J.; Covert, M.W.; Palsson, B. Reconstruction of microbial transcriptional regulatory
networks. Curr. Opin. Biotechnol. 2004, 15, 70-77
53 Abbott A. A post-genomic challenge: learning to read patterns of protein synthesis. Nature 1999,
402, 715-720
54 Anderson, L.; Seilhamer, J. A comparison of selected mRNA and protein abundances in human
liver. Electrophoresis 1997, 18, 533-537
55 Wilkins, M.R.; Sanchez, J.C.; Gooley, A.A. et al. Progress with proteome projects: why all proteins
expressed by a genome should be identified and how to do it. Biotechnol. Genet. Eng. Rev. 1996,
13, 19-50
56 Wilkins, M.R.; Pasquali, C.; Appel, R.D. et al. From proteins to proteomes: large scale protein
identifications by two-dimensional electrophoresis and amino acid analysis. Biotechnology 1996,
14, 61-65
57 Huber, L.A. Is proteomics heading in the wrong direction? Nat. Rev. Mol. Cell. Biol. 2003, 4, 74-80
58 Anderson, N.G.; Anderson, L. The human protein index. Clin Chem. 1982, 28, 739-748
59 Anderson, N.G.; Matheson, A.; Anderson, N.L. Back to the future: the human protein index (HPI)
and the agenda for post-proteomic biology. Proteomics 2001, 1, 3-12
60 Oliver, S.G.; Winson, M.; Kell, D. et al. Systematic functional analysis of the yeast genome.
Trends Biotechnol. 1998, 16, 373–378
61 Grivet, J.P.; Delort, A.M.; Portais, J.C. NMR and microbiology: from physiology to metabolomics.
Biochimie 2003, 85, 823-840
62 Fiehn, O.; Kopka, J.; Dormann, P. et al. Metabolite profiling for plant functional genomics. Nat.
Biotechnol. 2000, 18:1157–1161
63 Fiehn, O.; Kopka, J.; Trethewey, R.N. et al. Identification of uncommon plant metabolites based on
calculation of elemental compositions using gas chromatography and quadrupole mass
spectrometry. Anal. Chem. 2000, 72:3573–3580
64 Trethewey, R.N. Gene discovery via metabolic profiling. Curr. Opin. Biotechnol. 2001, 12, 135–
138
65 Mendes, P. Emerging bioinformatics for the metabolome. Brief Bioinform. 2002, 3, 134-145
66 Sumner, L.W.; Mendes, P.; Dixon, R.A. Plant metabolomics: large-scale phytochemistry in the
functional genomics era. Phytochemistry 2003, 62, 817-836
67 Fiehn, O. Metabolomics: the link between genotypes and phenotypes. Plant. Mol. Biol. 2002, 48,
155-171
68 Harrigan, G.G.; Goodacre, R. Metabolic profiling: its role in biomarker discovery and gene function
analysis. (2003) Boston, Kluwer Academic Publishers
69 Goodacre, R.; Vaidyanathan, S.; Warwick, B.D. et al. Metabolomics by numbers: acquiring and
understanding. Trends Biotech. 2004, 22, 245-252
70 Bino, R.J.; Hall, R.D.; Fiehn, O. et al. Potential of metabolomics as a functional genomics tool.
Trends Plant Sci. 2004, 9, 418-426
CHAPTER II
14
CHAPTER II
PROTEOMICS:
TECHNOLOGY DRIVEN-RESEARCH
1. INTRODUCTION Technologies to study oligonucleotides, such as sequencing and amplification strategies, are now mature technologies. Proteins can not be amplified, and therefore sufficient material must be extracted from the sample in order to be able to study proteins. It is worth mentioning that the first protein sequence, that of insulin, was determined ten years before the first RNA sequence was known, a yeast tRNA sequence. However, in these years, determination of a protein sequence by Edman degradation was tough, and protein science in general was slow and a difficult 'art' form. It is a frequently debated question whether technology drives biology or whether biology drives the development of new technologies1. Nonetheless, the tremendous technological advancements made during the past three decades has led to a huge burst of activity in protein science. New tools have also widened the scope of proteomics and fueled the explosion of interest in this discipline. This technology-driven research area has matured to become a multi-technological platform. Although technology is central to proteomics, there are still several limitations that impede the growth of proteomics and, therefore, more mature and potent technologies will need to be developed to overcome the existing limitations. The discipline proteomics can be currently divided into three distinct classes: profiling, functional, and structural proteomics. In the first section, we will slightly touch the application most popular to date, i.e. profiling proteomics. The very diverse range of tools and instruments will be further discussed in Chapter III. Functional proteomics, together with some key technological developments, will be discussed in the next sections of this chapter and we will conclude with a current status of structural proteomics.
CHAPTER II PROTEOMICS: TECHNOLOGY DRIVEN-RESEARCH
15
2. PROFILING PROTEOMICS The term proteomics has been traditionally associated with displaying large number of proteins on two-dimensional polyacrylamide gels2,3. In this sense, proteomics dates back to the late 1970s when protein databases were built using the two-dimensional gel electrophoretic technique4. The identification of these proteins, however, was difficult, due to the lack of a fast, sensitive analytical method for protein characterization. The development of mass spectrometry (MS) for the analysis of biomolecules was a turning point in protein analysis. From then on, protein profiling techniques were continuously improved and have resulted in a huge amount of information available today. Protein profiling consists of identifying the proteins present in a biological sample and results in a list of proteins present in a cell, tissue or organism. When proteins are characterized that are produced differentially (up- or down-regulated) between samples, the discipline is often referred to as expression proteomics5. A multitude of different techniques and instruments are currently used in this discipline of proteomics. However, we can distinguish two general strategies that are applied in different biological areas today: gel and non-gel based large scale analysis experiments6,7. The former uses (two-dimensional) polyacrylamide gel electro-phoresis (2D-PAGE) to separate the complex mixture of proteins, while the latter uses liquid chromatography (LC) as the separation technique. Protein characterization is in both tracks performed by MS. 2D-PAGE is a mature technique for more than 25 years, and it is since the development of MS that this technique has been widely used and has resulted in numerous applications in profiling proteomics. However, this well-established strategy, 2D-PAGE/MS, suffers from some shortcomings and, therefore, alternative approaches have been developed. These are non-gel based and were initially put forward as replacements; however it is more and more apparent that they will be complementary instead. For sure, 2D-PAGE/MS experiments are now routinely used, while 'gel-free' experiments are not and, conversely, are more complex. The variety of tools and strategies available in profiling proteomics will be discussed in Chapter III.
3. FUNCTIONAL PROTEOMICS: PROTEIN-PROTEIN INTERACTIONS
3.1. INTRODUCTION
Proteins carry out specific functions, and act rarely as single isolated species when performing their function in vivo8. Proteins involved in the same cellular processes can interact with each other9, and therefore the function of an unknown protein may be established by the determination of the interacting partners of which some have a known function. Interactions are central to every biological process and many analytical methods have been developed to investigate them. Most of these are developed for studying interactions on a small-scale and can not be used on a proteomics scale. However, large-scale studies produce a substantial amount of false -positives or -negatives and, therefore, small-scale strategies can be useful to confirm or reject interactions proposed by large-scale studies.

CHAPTER II PROTEOMICS: TECHNOLOGY DRIVEN-RESEARCH
16
Functional proteomics is a relatively novel discipline in which protein functions are tested directly on a large scale. This not only provides insight into protein function, but also allows modeling of functional pathways, which elucidates the molecular mechanism of cellular processes. One of the first reports was by Martzen and colleagues, who tested expressed proteins systematically for different enzymatic activities10. In the following sections, we will highlight some technologies used nowadays in functional proteomics. We will limit the discussion to key technologies which have proven their usefulness in proteomics for a couple of years. For a more detailed discussion, we refer the reader to useful reviews11-14.
3.2. TECHNOLOGIES
3.2.1 PHAGE DISPLAY TECHNIQUE
Phage display makes use of filamentous phages, bacteriophages, and is an expression cloning strategy in which ligands (proteins, antibodies, peptides, etc.) are expressed on the surface of these bacteriophages. This is achieved by cloning the gene for a ligand, or repertoire of ligands, into the phage genome, directly upstream to one of the genes encoding a phage coat protein. Bacterial cells, e.g. Escherichia coli, are either transfected with the recombinant phage DNA or are transduced with bacteriophages that have been packaged with the recombinant DNA in vitro. Transcription of the phage genome results in a fusion protein of the ligand and the coat protein, which will be incorporated into new phage particles produced within the bacteria. The mature phage will be subsequently released from the bacteria and purified 'fusion' phages will bind to any ligand that interacts with the component expressed on their surface. For large-scale protein-protein interaction studies, a phage display library is created in which each protein is displayed on the surface of the phage. A microtiter plate is prepared where each well is coated with a protein of interest, the bait. The phage display library is pipetted into the wells and the phages interacting with the protein will remain bound, while the other phages can be washed away. The interacting proteins, and their respective phages, can be characterized by
Figure 1. The principle of phage display as applied to high-throughput interaction screening. The bait protein is immobilized on the surface of microtiter wells. All other proteins in the proteome are expressed on the surface of bacteriophages. Phage-carrying interacting proteins will be retained and the DNA sequence of the interacting protein determined.

CHAPTER II PROTEOMICS: TECHNOLOGY DRIVEN-RESEARCH
17
infecting E. coli with the phages. The result is a massive amplification of the corresponding cDNA sequence insert, which can be sequenced (Figure 1). However, the technique has certain shortcomings, such as being limited to the study of small- to medium-sized proteins. Furthermore, this in vitro assay format would not allow proteins to adopt their native structure and thus, the proteins might be non-functional. Besides its use in interaction screening15, phage display technique can be employed in the production of antibodies, thereby bypassing immunization and the hybridoma technology16. Antibodies can be constructed as single chain Fv fragments (scFv), but also Fab fragments displayed on phages are very potent antibodies (Figure 2).
This technology was used for the development of scFv arrays containing over 18.000 probes17. The rapid and high-throughput production of recombinant antibodies can be used in protein chips or phage antibodies can reveal biomarkers and novel antigens using differential and subtractive selection methods18. In conclusion, the phage display technique is a powerful tool for the high-throughput production of antibodies.
3.2.2. TWO-HYBRID APPROACH
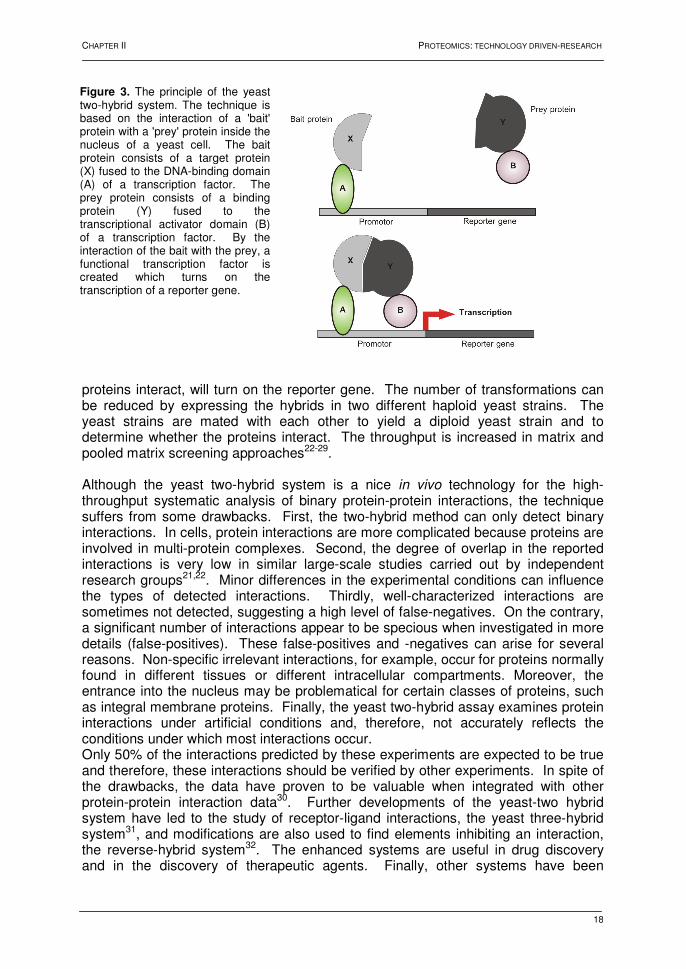
The yeast two-hybrid approach is a tool to study protein-protein interactions and was first used in 198919. To date, it is a mature and invaluable technology to study binary protein-protein interactions20. The assay is based on the principle of the assembly of an active transcription factor from two fusion proteins and the detection of this assembly by the activation of a reporter gene. The general scheme is given in Figure 3. The protein of interest, called the 'bait', is fused to the DNA binding domain of a transcription factor, such as GAL4, which lacks the transcription activation domain. The domain is expressed separately as a fusion with another protein, called the 'prey'. When both fusions are expressed and the proteins interact with each other, all elements are present to turn on the reporter gene. Thus, the reporter identifies cells in which these two proteins interact. The technique has been automated and successfully applied to various large-scale projects. In the classical high-throughput approach, two hybrid fusion proteins are constructed and yeast is simultaneously transformed21. Yeast colonies that incorporate both hybrids, and in which the
Figure 2. (left) A diagram of the immunoglobulin molecule. (right) Phage displayed antibody repertoires are constructed from variable-gene repertoires. Antibody fragments can be constructed in several ways. Most widely used is the single chain Fv fragments (scFv), but also Fab fragments can be produced.
CHAPTER II PROTEOMICS: TECHNOLOGY DRIVEN-RESEARCH
18
proteins interact, will turn on the reporter gene. The number of transformations can be reduced by expressing the hybrids in two different haploid yeast strains. The yeast strains are mated with each other to yield a diploid yeast strain and to determine whether the proteins interact. The throughput is increased in matrix and pooled matrix screening approaches22-29. Although the yeast two-hybrid system is a nice in vivo technology for the high-throughput systematic analysis of binary protein-protein interactions, the technique suffers from some drawbacks. First, the two-hybrid method can only detect binary interactions. In cells, protein interactions are more complicated because proteins are involved in multi-protein complexes. Second, the degree of overlap in the reported interactions is very low in similar large-scale studies carried out by independent research groups21,22. Minor differences in the experimental conditions can influence the types of detected interactions. Thirdly, well-characterized interactions are sometimes not detected, suggesting a high level of false-negatives. On the contrary, a significant number of interactions appear to be specious when investigated in more details (false-positives). These false-positives and -negatives can arise for several reasons. Non-specific irrelevant interactions, for example, occur for proteins normally found in different tissues or different intracellular compartments. Moreover, the entrance into the nucleus may be problematical for certain classes of proteins, such as integral membrane proteins. Finally, the yeast two-hybrid assay examines protein interactions under artificial conditions and, therefore, not accurately reflects the conditions under which most interactions occur. Only 50% of the interactions predicted by these experiments are expected to be true and therefore, these interactions should be verified by other experiments. In spite of the drawbacks, the data have proven to be valuable when integrated with other protein-protein interaction data30. Further developments of the yeast-two hybrid system have led to the study of receptor-ligand interactions, the yeast three-hybrid system31, and modifications are also used to find elements inhibiting an interaction, the reverse-hybrid system32. The enhanced systems are useful in drug discovery and in the discovery of therapeutic agents. Finally, other systems have been
Figure 3. The principle of the yeast two-hybrid system. The technique is based on the interaction of a 'bait' protein with a 'prey' protein inside the nucleus of a yeast cell. The bait protein consists of a target protein (X) fused to the DNA-binding domain (A) of a transcription factor. The prey protein consists of a binding protein (Y) fused to the transcriptional activator domain (B) of a transcription factor. By the interaction of the bait with the prey, a functional transcription factor is created which turns on the transcription of a reporter gene.

CHAPTER II PROTEOMICS: TECHNOLOGY DRIVEN-RESEARCH
19
developed to investigate interactions between membrane proteins, i.e. the 'split ubiquitin' system33-37, or to study interacting proteins from both prokaryotes and eukaryotes, such as the bacterial two-hybrid system38,39.
3.2.3. PROTEIN MICROARRAYS
Another approach for analyzing interactions of proteins is the use of protein microarrays. It should be mentioned that the terms protein chip, microchip, biochip, array and microarray are used interchangeable for a whole host of different devices and the choice is mostly a matter of personal preference. The concept of protein arrays is not new. In the 1980s, miniaturized, solid-phase immunoassays were developed using protein microdots manually spotted onto solid supports, e.g. nitrocellulose sheets. DNA microarrays, as described before, had a great impact on sequence analysis and expression profiling. The DNA microarray is not bigger than a stamp and allows analyzing thousands of genes in parallel. Moreover, they are very sensitive, easy to automate and, it is not thus surprising that similar devices are being developed for the analysis of proteins. As the materials, surface chemistries and printing technologies for DNA microarrays evolved, the technologies were modified and exploited to develop analogous devices for protein analysis. Protein microarrays are very versatile and may be classified in different ways according, for example, to their surface chemistry, their specificity, or to how they are made40. A major distinction can be made between analytical and functional arrays (Figure 4).
Analytical arrays are mostly used for expression profiling, while functional arrays are used to study interactions and biochemical activities. Several different ligands (e.g. proteins, peptides, antibodies, antigens, carbohydrates, small molecules) can be spotted onto the derivatized surface in analytical arrays, and the possibilities are almost endless. The most common type of chip is the antibody array, which is a
Figure 4. (A) Analytical arrays contain immobilized capture agents (which may be proteins) and the proteins under investigation are in the analyte. (B) Functional arrays, on the contrary, are constructed from immobilization of the proteins under investigation. These are used as probes to capture interacting molecules in the analyte.

CHAPTER II PROTEOMICS: TECHNOLOGY DRIVEN-RESEARCH
20
coated glass slide containing a high-density array of specific antibodies. The complex mixture, e.g. cell lysate, is passed over the surface allowing antigens to bind to their respective antibodies. The bound antigen is detected by using either fluorescently or radioactively labeled samples or by using a secondary antibody. The antibody arrays have been used in several studies. The activation of receptor tyrosine kinase pathways in tumor cells and the changes in quantities for a number of antigens in colon carcinoma cells, for example, have been investigated41,42. On the other hand, it is difficult to obtain and express a sufficient number of specific antibodies for large-scale studies43. Unlike analytical chips, functional chips are used to investigate the different properties of proteins. For example, arrays containing recombinant proteins monitor the binding properties of proteins, antibodies, small molecules and drugs44,45. Such a 'human' protein chip was used for antibody screening and protein profiling46. However, the development of functional chips is hampered by two problems: expressing large numbers of proteins and maintaining the proteins in a native state47,48. In addition, these are in vitro assays and therefore, in vivo interactions need to be verified. It should be mentioned that serious efforts are made to surmount the problems. For example, nearly all yeast protein kinases (119 out of 122) were produced in functional forms49 and, more recently, the first eukaryotic proteome microarray was prepared. The chip was composed of more than 5800 individually cloned, overexpressed, and purified proteins50. Despite these technological hurdles that remain to be overcome, protein chips represent the fastest growing sector of the proteomics market, with particular interest in the area of functional proteomics.
3.2.4. AFFINITY-BASED METHODS
Exploiting the affinity of a particular protein for its interaction partner can be done by affinity chromatography. Here, a particular protein (the 'bait') is expressed or purified and immobilized on a matrix, e.g. a column packing material. The immobilization can be achieved by expression the protein as a fusion with gluthatione-S-transferase (GST), which binds strongly to a column packing material coated with glutathione, or by conjugating antibodies specific for the protein to the matrix. The sample is passed through the column under controlled conditions and those proteins interacting with the bait will be retained. The proteins can be eluted by increasing ionic strength and identified by immunoblotting or mass spectrometry. Different large scale interaction analyses are based on this principle, and advantageous is the study of proteins in their 'natural' context. The first reports involved antibody-based affinity purification51. A less selective approach is the use of affinity tags. By its nature, these experiments identify protein complexes rather than binary interactions. Two such studies in yeast were reported in 200252,53. In one study, the bait proteins were expressed as fusions with the FLAG epitope. This short peptide is recognized by a specific antibody. Cell lysates were prepared from each yeast strain and passed through an anti-FLAG antibody containing affinity column. The captured proteins were eluted, separated by SDS-electrophoresis, and subsequently identified by mass spectrometry; this revealed a total of 3617 interactions. A second study used a tandem affinity purification (TAP) procedure54. The bait protein is a fusion of a calmodulin-binding peptide and the staphylococcal protein A. The two 'elements' are separated by a protease recognition site (Figure 5).

CHAPTER II PROTEOMICS: TECHNOLOGY DRIVEN-RESEARCH
21
Gene targeting was used to replace nearly 2000 genes with a TAP fusion cassette. The yeast strain was lysed, passed through an immunoglobulin affinity column and, after washing, the complexes were eluted by addition of the protease. In a second round of affinity chromatography, highly selective binding was established by using calmodulin as matrix in the presence of calcium ions. After elution by EGTA and gel electrophoresis, the proteins were identified by mass spectrometry. More than 4000 interactions were displayed of which 60% were novel. However, these two studies also showed a low degree of overlap when similar bait proteins were compared between the two studies or previous yeast two-hybrid studies8. On the other hand, both projects reported results consistent with already known complexes. Affinity based isolation of interacting proteins can also be achieved in solution by techniques such as co-immunopurification and GST pulldown. In co-immunopurification, antibodies specific for a protein will result in the precipitation of the antibody-antigen complex and will also precipitate the proteins interacting with the bait. The complexes are separated from the lysate by centrifugation and the interacting proteins are separated by electrophoresis and identified by mass spectrometry. In GST pull-down, an analogous technique is used. Here, the bait is expressed as a fusion to GST and added to the lysate. Glutathione-coated beads are added to capture the GST part of the fusion. After centrifugation, the beads are washed and the recovered proteins separated by electrophoresis and identified by mass spectrometry. A technique that uses immunopurification and protein tagging was developed by Figeys and colleagues for the study of human protein complexes in vivo55. Briefly, a full-length cDNA of a gene was cloned into a transfection vector, which is pre-encoded to add an epitope tag to either the N- or C-terminus of the protein. A culture of human cells is then transfected and the tagged proteins are expressed. Cells are collected and lysed, and an immobilized antibody is used to capture the epitope tag. Interacting proteins are separated by electrophoresis and identified by mass spectrometry.
Figure 5. The tandem affinity purification (TAP) cassette. It is made up of a PCR-derived gene-specific homology region for targeting each yeast gene, a spacer, a calmodulin-binding peptide, a protease cleavage site recognized by tobacco etch virus protease and Staphylococcal protein A.

CHAPTER II PROTEOMICS: TECHNOLOGY DRIVEN-RESEARCH
22
3.2.5. SUMMARY
The above described strategies all have their advantages and drawbacks and, are summarized in Table 1. In conclusion, no single high-throughput method is final, and the integration of multiple sets of data and the verification by alternative methods is always required before any clear-cut conclusion can be drawn.
4. FUNCTIONAL PROTEOMICS: PROTEIN-SMALL MOLECULE
INTERACTIONS
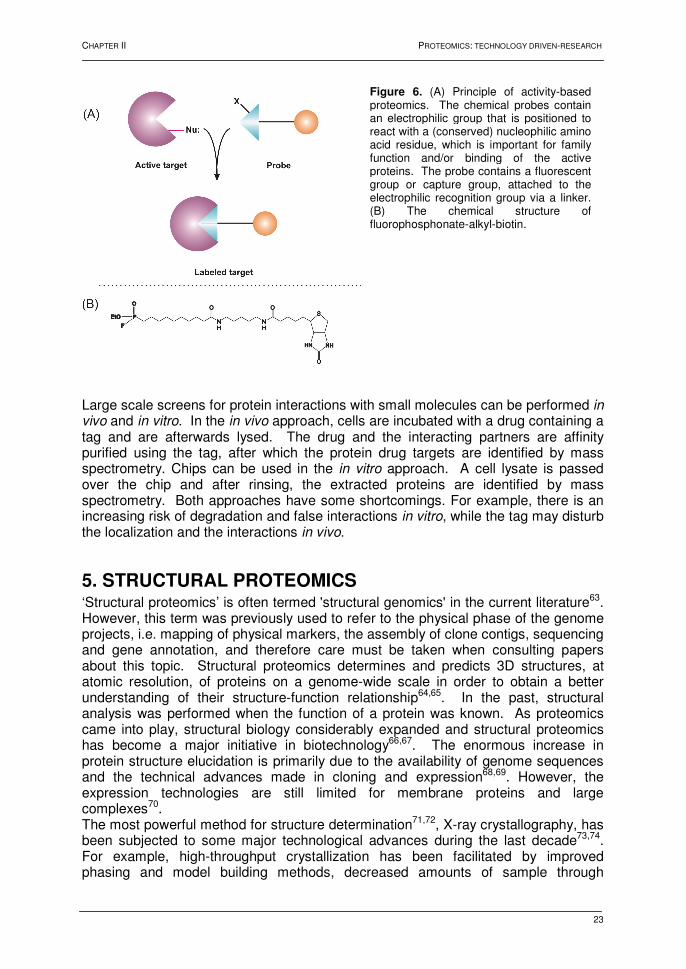
Proteins interact with small molecules, which can act as cofactors, enzyme substrates, ligands for receptors or allosteric modulators. In addition, many proteins transport or store particular molecules. Drug companies are particularly interested in the elucidation of protein-small molecule interactions, because most drugs act directly on proteins. Mapping these interactions can lead to the discovery of new protein targets and might help to explain side effects of a drug before launching it on the market. A promising discipline is activity-based proteomics57-59. This approach fractionates the proteome into families of proteins that are linked by common mechanistic functions in their active form. The principle is shown in Figure 6A; the pioneering work was done in the Cravatt Laboratory60. A fluorophosphonate probe (Figure 6B) was used to characterize protein members of the serine hydrolase family. The discipline using small molecules as 'bait' to fish for interacting proteins is also called chemiproteomics61,62.
Table 1. Comparison of Different Key Technologies in Functional Proteomics*.
Approach Application Advantage Disadvantage
Yeast two-hybrid
Protein-protein interaction; protein-DNA interactions
High-throughput and systematic to reveal protein interactions
No control over interaction condition; interactions are in the nucleus; high rate of false positives and false negatives; only binary interactions are investigated
Affinity tagging/MS
Dissecting protein complexes
In vivo interactions; multiple interactions partners
Transient or weak interactions may be missed; false positives are hard to identify
Antibody arrays
Protein profiling; clinical diagnostics
Sensitive; great potential in biomarker and drug development
Restricted by the quantity and quality of available antibodies
Functional protein arrays
Diverse, protein-protein, protein-small molecule, etc.
High-throughput; potential for analyzing biochemical activities
In vitro assays
* adapted from Zhu et al56.
CHAPTER II PROTEOMICS: TECHNOLOGY DRIVEN-RESEARCH
23
Large scale screens for protein interactions with small molecules can be performed in vivo and in vitro. In the in vivo approach, cells are incubated with a drug containing a tag and are afterwards lysed. The drug and the interacting partners are affinity purified using the tag, after which the protein drug targets are identified by mass spectrometry. Chips can be used in the in vitro approach. A cell lysate is passed over the chip and after rinsing, the extracted proteins are identified by mass spectrometry. Both approaches have some shortcomings. For example, there is an increasing risk of degradation and false interactions in vitro, while the tag may disturb the localization and the interactions in vivo.
5. STRUCTURAL PROTEOMICS ‘Structural proteomics’ is often termed 'structural genomics' in the current literature63. However, this term was previously used to refer to the physical phase of the genome projects, i.e. mapping of physical markers, the assembly of clone contigs, sequencing and gene annotation, and therefore care must be taken when consulting papers about this topic. Structural proteomics determines and predicts 3D structures, at atomic resolution, of proteins on a genome-wide scale in order to obtain a better understanding of their structure-function relationship64,65. In the past, structural analysis was performed when the function of a protein was known. As proteomics came into play, structural biology considerably expanded and structural proteomics has become a major initiative in biotechnology66,67. The enormous increase in protein structure elucidation is primarily due to the availability of genome sequences and the technical advances made in cloning and expression68,69. However, the expression technologies are still limited for membrane proteins and large complexes70. The most powerful method for structure determination71,72, X-ray crystallography, has been subjected to some major technological advances during the last decade73,74. For example, high-throughput crystallization has been facilitated by improved phasing and model building methods, decreased amounts of sample through
Figure 6. (A) Principle of activity-based proteomics. The chemical probes contain an electrophilic group that is positioned to react with a (conserved) nucleophilic amino acid residue, which is important for family function and/or binding of the active proteins. The probe contains a fluorescent group or capture group, attached to the electrophilic recognition group via a linker. (B) The chemical structure of fluorophosphonate-alkyl-biotin.
CHAPTER II PROTEOMICS: TECHNOLOGY DRIVEN-RESEARCH
24
miniaturization, as well as robotization and automation from the stage of crystallization up to that of structure determination. Various projects are currently under way for large-scale X-ray crystallography of proteins and domains, either by a large-scale crystallization effort75,76 or by systematic elucidation of domains. NMR spectroscopy has also provided insights into the structure-function relationship for a large number of proteins. However, the technique is limited by size constraints and lengthy data collection and analysis. Despite these current limitations, it may still play an important role in structural proteomics77. Although recent advances in X-ray crystallography78,79 and multidimensional NMR spectroscopy80 have resulted in the elucidation of many 3D protein structures, computational approaches become alternatives to predict 3D structures. The computational approaches for structure determination are either based on comparative structure prediction or on de novo structure prediction. When proteins are member of a gene family and at least one of the protein structures is determined by X-ray crystallography or NMR, it is possible to infer the structure of a new family member by reference to a known one81,82. An extension to this approach is to computationally fold up a protein based on assembling its primary sequence into a three-dimensional shape83,84. This remains a challenging task but is a very active area of current research. Computational methods are continuously being improved and accurate models may be predicted using these strategies in the future.
6. CONCLUSIONS Today, a powerful set of tools for the large scale analysis of proteins is available. The development of new tools in this discipline is still ongoing and demonstrates that proteomics research is powered by novel technologies. The development of biological mass spectrometry in the late 1980s, for example, has drastically speeded up profiling proteomics. Knowing the inventory of proteins of a cell or organism is important. However, proteins are also playing their role in protein-protein and protein-small molecule interactions. In functional proteomics, the function of proteins is determined. Several new technologies, e.g. protein microarrays, have already shown their great potential in determining protein functions on a bigger scale. Finally, structural proteomics is uncovering the 3D structures of proteins and provides a framework for the structural modeling of novel proteins. The determination and prediction of 3D protein structures will become increasingly important for studying protein-protein interactions. All of these high-throughput assays produce massive amounts of data and it has become obvious that the integration of different sets of data, obtained by different strategies, will greatly enhance the understanding of biological systems. This may ultimately lead to the creation of a 'virtual cell' which will allow biologists to approach the ultimate question: "How do living organisms operate as systems at the molecular level?".
CHAPTER II PROTEOMICS: TECHNOLOGY DRIVEN-RESEARCH
25
7. REFERENCES 1 Aebersold, R. A mass spectrometric journey into protein and proteome research. J. Am. Soc.
Mass Spectrom. 2003, 14, 685-695
2 Wilkins, M.R.; Pasquali, C.; Appel, R. et al. From proteins to proteomes: large scale protein
identification by two-dimensional electrophoresis and amino acid analysis. BioTechnology 1996,
14, 61-65
3 Anderson, N.G.; Anderson, N.L. Twenty years of two-dimensional electrophoresis past, present
and future. Electrophoresis 1996, 17, 443-453
4 O'Farrell, P.H. High resolution two-dimensional electrophoresis of proteins. J. Biol. Chem. 1975,
250, 4007-4021
5 Figeys, D. Proteomics approaches in drug discovery. Anal. Chem. 2002, 74, 413A-419A
6 Aebersold, R.; Mann, M. Mass spectrometry-based proteomics. Nature 2003, 422, 198-207
7 Lambert, J.P.; Ethier, M.; Smith, J.C. et al. Proteomics from gel based to gel free. Anal. Chem.
2005, 77, 3771-3787
8 Yanagida, M. Functional proteomics; current achievements. J. Chromatogr. B 2002, 771, 89-106
9 Von Mering, C.; Krause, R.; Snel, B. et al. Comparative assessment of large-scale data sets of
protein-protein interactions. Nature 2002, 417, 399-403
10 Martzen, M.R.; McCraith, S.M.; Spinelli, S.L. et al. A biochemical genomics approach for
identifying genes by the activity of their products. Science 1999, 286, 1153-1155
11 Sauer, S.; Lange, B.M.; Gobom, J. et al. Miniaturization in functional genomics and proteomics.
Nat. Rev. Genet. 2005, 6, 465-476
12 Monti, M.; Orrù, S.; Pagnozzi, D. et al. Functional proteomics. Clin. Chim. Acta 2005, 357, 140-
150
13 LaBaer, J.; Ramachandran, N. Protein microarrays as tools for functional proteomics. Curr. Opin.
Chem. Biol. 2005, 9, 14-19
14 Aggarwal, K.; Lee, K.H. Functional genomics and proteomics as a foundation for systems biology.
Brief Funct. Genomic. Proteomic. 2003, 2, 175-184
15 Tong, A.H.; Lesage, G.; Bader, G.D. et al. Global mapping of the yeast genetic interaction network.
Science 2004, 303, 808-813
16 Winter, G.; Griffiths, A.D.; Hawkins, R.E. et al. Making antibodies by phage display technology.
Annu. Rev. Immunol. 1994, 12, 433-455
17 De Wildt, R.M. Antibody arrays for high throughput screening of antibody antigen interactions.
Nature Biotechnol. 2000, 18, 989-994
18 Hoogenboom, H.R.; De Bruine, A.P.; Hufton, S.E. et al. Antibody phage display technology and its
applications. Immunotechnology 1998, 4, 1-20
19 Fields, S.; Song, O. A novel genetic system to detect protein-protein interactions. Nature 1989,
340, 245-246
20 Fromont-Racine, M.; Rain, J.C.; Legrain, P. Toward a functional analysis of the yeast genome
through exhaustive two-hybrid screens. Nat. Genet. 1997, 16, 277-282
21 Chien, C.T., Bartel, P.L.; Sternglanz, R. et al. The two-hybrid system: a method to identify and
clone genes for proteins that interact with a protein of interest. Proc. Natl. Acad. Sci. USA 1991,
88, 9578-9582
22 Uetz, P.; Giot, L.; Cagney, G. et al. A comprehensive analysis of protein-protein interactions in
Saccharomyces cerevisiae. Nature 2000, 403, 623-627
23 Ito, T.; Chiba, T.; Ozawa, R. et al. A comprehensive two-hybrid analysis to explore the yeast
protein interactome. Proc. Natl. Acad. Sci. USA 2001, 98, 4569-4574
CHAPTER II PROTEOMICS: TECHNOLOGY DRIVEN-RESEARCH
26
24 Giot, L.; Bader, J.S.; Brouwer, C. et al. A protein interaction map of Drosophila melanogaster.
Science 2003, 302, 1727-1736
25 Li, J.; Armstrong, C.M.; Bertin, N. et al. A map of the interactome network of the metazoan C.
elegans. Science 2004, 303, 540-543
26 Walhout, A.J.; Sordella, R.; Lu, X. et al. Protein interaction mapping in C. elegans using proteins
involved in vulval development. Science 2000, 287, 116-122
27 Boulton, S.J.; Gartner, A.; Reboul, J. et al. Combined functional genomic maps of the C. elegans
DNA damage response. Science 2002, 295, 127-131
28 McCraith, S.; Hotzam, T.; Moss, B. et al. Genome-wide analysis of vaccinia virus protein-protein
interactions. Proc. Natl. Acad. Sci. USA 2000, 97, 4879-4884
29 Rain, J.C.; Selig, L.; De Reuse, H. et al. The protein-protein interaction map of Helicobacter pylori.
Nature 2001, 409, 211-215
30 Schwikowski, B.; Uetz, P.; Fields, S. A network of protein-protein interactions in yeast. Nat.
Biotechnol. 2000, 18, 1257-1261
31 Licitra, E.J.; Liu, J.O. A three-hybrid system for detecting small ligand-protein receptor interactions.
Proc. Natl. Acad. Sci. USA 1996, 93, 12817-12821
32 Vidal, M.; Legrain, P. Yeast forward and reverse 'n'-hybrid systems. Nucleic Acids Res. 1999, 27,
919-929
33 Stagljar, I.; Korostensky, C.; Johnsson, N. et al. A genetic system based on split-ubiquitin for the
analysis of interactions between membrane proteins in vivo. Proc. Natl. Acad. Sci. USA 1998, 95,
5187-5192
34 Reinders, A.; Schulze, W.; Kuhn, C. et al. Protein-protein interactions between sucrose
transporters of different affinities co-localized in the same enucleate sieve element. Plant Cell
2002, 14, 1567-1577
35 Tsujimoto, Y.; Numaga, T.; Ohshima, K. et al. Arabidopsis tobamovirus multiplication (TOM) 2
locus encodes a transmembrane protein that interacts with TOM1. EMBO J. 2003, 22, 335-343
36 Wang, B.; Nguyen, M.; Breckenridge, D.G. et al. Uncleaved BAP31 in association with A4 protein
at the endoplasmic reticulum is an inhibitor of Fas-initiated release of cytochrome c from
mitochondria. J. Biol. Chem. 2003, 278, 14461-14468
37 Wittke, S.; Dunnwald, M.; Albertsen, M. et al. Recognition of a subset of signal sequences by
Ssh1p, a Sec61p-related protein in the membrane of endoplasmic reticulum of yeast
Saccharomyces cerevisiae. Mol. Biol. Cell. 2002, 13, 2223-2232
38 Dove, S.L.; Hochschild, A. A bacterial two-hybrid system based on transcription activation.
Methods Mol. Biol. 2004, 261, 231-246
39 Joung, J.K. Identifying and modifying protein-DNA and protein-protein interactions using a
bacterial two-hybrid selection system. J. Cell Biochem. Suppl. 2001, 37, 53-57
40 Schweitzer, B.; Kingsmore, S.F. Measuring proteins on microarrays. Curr. Opin. Biotechnol. 2002,
13, 14-19
41 Nielsen, U.B.; Cardone, M.H.; Sinskey, A.J. et al. Profiling receptor tyrosine kinase activation by
using Ab microarrays. Proc. Natl. Acad. Sci. USA 2003, 100, 9330-9335
42 Sreekumar, A.; Nyati, M.; Varambally, S. et al. Profiling of cancer cells using protein microarrays:
discovery of novel radiation-regulated proteins. Cancer Res. 2001, 61, 7585-7593
43 Haab, B.B.; Dunham, M.J.; Brown, P.O. Protein microarrays for highly parallel detection and
quantitation of specific proteins and antibodies in complex solutions. Genome Biol. 2001, 2,
research0004.1-4.13
44 Zhu, H.; Snyder, M. Protein arrays and microarrays. Curr. Opin. Chem. Biol. 2001, 5, 40-45

CHAPTER II PROTEOMICS: TECHNOLOGY DRIVEN-RESEARCH
27
45 Schweitzer, B.; Predki, P.; Snyder, M. Microarrays to characterize protein interactions on a whole-
proteome scale. Proteomics 2003, 3, 2190-2199
46 Lueking, A.; Possling, A.; Huber, O. et al. A non-redundant human protein chip for antibody
screening and serum profiling. Mol. Cell. Proteomics 2003, 12, 1342-1349
47 Braun, P.; LaBaer, J. High throughput protein production for functional proteomics. Trends
Biotechnol. 2003, 21, 383-388
48 Glokler, J.; Angenendt, P. Protein and antibody microarray technology. J. Chromatogr. B 2003,
797, 229-240
49 Zhu, H.; Klemic, J.F.; Chang, S. et al. Analysis of yeast protein kinases using protein chips. Nat.
Genet. 2000, 26, 283-289
50 Zhu, H.; Bilgin, M.; Bangham, R. et al. Global analysis of protein activities using proteome chips.
Science 2001, 293, 2101-2105
51 Neubauer, G.; Gottschalk, A.; Fabrizio, P. et al. Identification of the proteins of the yeast U1 small
nuclear ribonucleoprotein complex by mass spectrometry. Proc. Natl. Acad. Sci. USA 1997, 94,
385-390
52 Ho, Y.; Gruhler, A.; Heilbut, A. et al. Systematic identification of protein complexes in
Saccharomyces cerevisiae by mass spectrometry. Nature 2002, 415, 180-183
53 Gavin, A.C.; Bosche, M.; Krause, R. et al. Functional organization of the yeast proteome by
systematic analysis of protein complexes. Nature 2002, 415, 141-147
54 Rigaut, G.; Shevchenko, A.; Rutz, B. et al. A generic protein purification method for protein
complex characterization and proteome exploration. Nat. Biotechnol. 1999, 17, 1030-1032
55 Figeys, D.; McBroom, L.D.; Moran, M.F. Mass spectrometry for the study of protein-protein
interactions. Methods 2001, 24, 230-239
56 Zhu, H.; Bilgin, M.; Snyder, M. Proteomics. Annu. Rev. Biochem. 2003, 72, 783-812
57 Hemelaar, J.; Galardy, P.J.; Borodovsky, A. et al. Chemistry-based functional proteomics:
mechanism-based activity-profiling tools for ubiquitin and ubiquitin-like specific proteases. J.
Proteome Res. 2004, 3, 268-276
58 Speers, A.E.; Cravatt, B.F. Chemical strategies for activity-based proteomics. Chembiochem.
2004, 3, 41-47
59 Kozarich, J.W. Activity-based proteomics: enzyme chemistry redux. Curr. Opin. Chem. Biol. 2003,
7, 78-83
60 Liu, Y.; Patricelli, M.P.; Cravatt, B.F. Activity-based protein profiling: the serine hydrolases. Proc.
Natl. Acad. Sci. USA 1999, 96, 14694-14699
61 Henion, J.; Li, Y.T.; Hsieh, Y.L. et al. Mass spectrometric investigations of drug-receptor
interactions. Ther. Drug Monit. 1993, 15, 563-569
62 Sin, N.; Meng, L.; Auth, H. et al. Eponemycin analogues: syntheses and use as probes of
angiogenesis. Biorg. Med. Chem. 1998, 6, 1209-1217
63 Burley, S.K.; Almo, S.; Bonanno, J. et al. Structural genomics: beyond the human genome project.
Nat. Genet. 1999, 23, 151-157
64 Liu, H.L.; Hsu, J.P. Recent developments in structural proteomics for protein structure
determination. Proteomics 2005, 5, 2056-2068
65 Mittl, P.R.; Grütter, M.G. Structural genomics: opportunities and challenges. Curr. Opin. Chem.
Biol. 2001, 5, 402-408
66 Smith, T. A new era. Nat. Struct. Biol. Suppl. 2000, 7, 927-927
67 http://www.isgo.org
CHAPTER II PROTEOMICS: TECHNOLOGY DRIVEN-RESEARCH
28
68 Stevens, R.C. Design of high-throughput methods of protein production for structural biology.
Struct. Fold Des. 2000, 8, R177-R185
69 Lesley, S.A. High-throughput proteomics: protein expression and purification in the postgenomic
world. Protein Expr. Purif. 2001, 22, 159–164
70 Yokoyama, S. Protein expression systems for structural genomics and proteomics. Curr. Opin.
Chem. Biol. 2003, 7, 39-43
71 Ban, N.; Nissen, P.; Hansen, J. et al. The complete atomic structure of the large ribosomal subunit
at 2.4 A resolution. Science 2000, 289, 905-920
72 Zhang, G.Y.; Campbell, E.A.; Minakhin, L. et al. Crystal structure of Thermus aquaticus core RNA
polymerase at 3.3 A resolution. Cell 1999, 98, 811-824
73 Norin, M.; Sundström, M. Structural proteomics: developments in structure-to-function predictions.
Trends Biotechnol. 2002, 20, 79–84
74 Muchmore, S.W.; Olson, J.; Jones, R. et al. Automated crystal mounting and data collection for
protein crystallography. Structure Fold Des. 2000, 8, R243-R246
75 Stewart, L.; Clark, R.; Behnke, C. High-throughput crystallization and structure determination in
drug discovery. Drug Discov. Today 2002, 7, 187-196
76 Jhoti, H. High-throughput structural proteomics using X-rays. Trends Biotechnol. 2001, 19, S67-
S71
77 Christendat, D.; Yee, A.; Dharamsi, A. et al. Structural proteomics: prospects for high throughput
sample preparation. Nat. Struct. Biol. 2000, 7, 903–909
78 Abola, E.; Kuhn, P.; Earnest, T. et al. Automation of X-ray crystallography. Nat. Struct. Biol. 2002,
7, 973-977
79 Lamzin, V.S.; Perrakis, A. Current state of automated crystallographic data analysis. Nat. Struct.
Biol. 2000, 7, 978-981
80 Montelione, G.T.; Zheng, D.; Huang, Y. et al. Protein NMR spectroscopy in structural genomics.
Nat. Struct. Biol. 2000, 7, 982-985
81 Baker, D.; Sali, A. Protein structure prediction and structural genomics. Science 2001, 294, 93–96
82 Peitsch, M.C.; Guex, N. In: Proteome Research: New Frontiers in Functional Genomics. Edited by:
Wilkins, M.R.; Williams, K.L.; Appel, R.D.; Hochstrasser, D.F., Springer, Berlin 1997, pp.177-186
83 Simons, K.T.; Bonneau, R.; Ruczinski, I. et al. Ab initio protein structure prediction of CASP III
targets using ROSETTA. Struct. Funct. Genet. 1999, 37, 171–176
84 Holm, L.; Sander, C. Protein folds and families: sequence and structure alignments. Nucleic Acids
Res. 1999, 27, 244-247
Chapter III
29
CHAPTER III
PROFILING PROTEOMICS:
MASS SPECTROMETRY DRIVEN-RESEARCH
1. INTRODUCTION Determination of the protein composition in a sample is a complex analytical problem, as proteins show high physico-chemical variability. Different strategies have been developed to cope with this technically challenging task. These strategies all involve the separation of a complex protein or peptide mixture, followed by identification. The end result is a proteome 'map', i.e. the protein composition, of the investigated sample. In addition, samples can be compared with each other, resulting in a differential display of the proteins occurring. However, this goal can only be accomplished if a quantification technology is implemented in the profiling proteomics strategy. Mass spectrometry plays a key role in each strategy, regardless of the method used for separation of the complex protein mixture. Mass spectrometry (MS) is a reputable technique which measures an intrinsic property of a molecule, its mass. MS dates back to the studies performed by J.J. Thomson1 and his student F.W. Aston2 in the beginning of the 20th century. However, it was only from the early 1980s that MS started to play a significant role in biological sciences. It took that long because MS requires charged, gaseous molecules for analysis, and being large and polar, biomolecules are not easily ionized and transferred into the gas phase. The development of two 'soft' ionization techniques, electrospray ionization (ESI) and matrix-assisted laser desorption ionization (MALDI), has overcome the problems and these methods are now the basis for diverse, powerful instrumentation. In 2002, the inventors of those two key revolutionizing ionization techniques were awarded the Nobel Prize in Chemistry, showing the importance and influence of these technologies in biological science. In the same period that ESI and MALDI were becoming 'routine' in biological MS, the concept of proteomics was emerging. Further development of MS, i.e. more sensitive, accurate and high-throughput instruments, goes along with the expansion of proteomics, a trend that shows no signs to slow down. In this chapter, we will give some background on MS, followed by the implementation of the technique in profiling proteomics strategies.
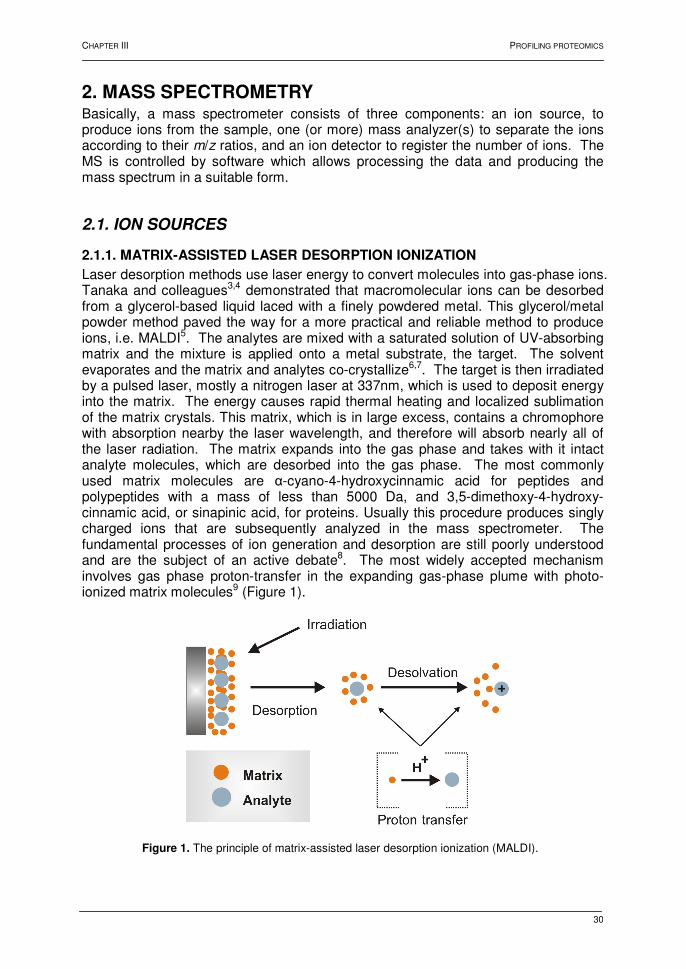
CHAPTER III PROFILING PROTEOMICS
30
2. MASS SPECTROMETRY Basically, a mass spectrometer consists of three components: an ion source, to produce ions from the sample, one (or more) mass analyzer(s) to separate the ions according to their m/z ratios, and an ion detector to register the number of ions. The MS is controlled by software which allows processing the data and producing the mass spectrum in a suitable form.
2.1. ION SOURCES
2.1.1. MATRIX-ASSISTED LASER DESORPTION IONIZATION
Laser desorption methods use laser energy to convert molecules into gas-phase ions. Tanaka and colleagues3,4 demonstrated that macromolecular ions can be desorbed from a glycerol-based liquid laced with a finely powdered metal. This glycerol/metal powder method paved the way for a more practical and reliable method to produce ions, i.e. MALDI5. The analytes are mixed with a saturated solution of UV-absorbing matrix and the mixture is applied onto a metal substrate, the target. The solvent evaporates and the matrix and analytes co-crystallize6,7. The target is then irradiated by a pulsed laser, mostly a nitrogen laser at 337nm, which is used to deposit energy into the matrix. The energy causes rapid thermal heating and localized sublimation of the matrix crystals. This matrix, which is in large excess, contains a chromophore with absorption nearby the laser wavelength, and therefore will absorb nearly all of the laser radiation. The matrix expands into the gas phase and takes with it intact analyte molecules, which are desorbed into the gas phase. The most commonly used matrix molecules are α-cyano-4-hydroxycinnamic acid for peptides and polypeptides with a mass of less than 5000 Da, and 3,5-dimethoxy-4-hydroxy-cinnamic acid, or sinapinic acid, for proteins. Usually this procedure produces singly charged ions that are subsequently analyzed in the mass spectrometer. The fundamental processes of ion generation and desorption are still poorly understood and are the subject of an active debate8. The most widely accepted mechanism involves gas phase proton-transfer in the expanding gas-phase plume with photo-ionized matrix molecules9 (Figure 1).
Figure 1. The principle of matrix-assisted laser desorption ionization (MALDI).

CHAPTER III PROFILING PROTEOMICS
31
2.1.2. ELECTROSPRAY IONIZATION
Electrospray is an atmospheric-pressure ionization method that produces small charged droplets from a liquid medium under the influence of an electric field. Although Dole and colleagues already transferred large molecules to the gas phase in the late 1960s10, the first electrospray mass spectra were reported in the late 1980s by the group of Fenn11,12 at Yale University. In conventional ESI, a liquid is passed through a thin conducting needle at high voltage (3-4kV) and a potential difference is applied between the needle and a counter electrode. Depending on the pH of the solvent, the analytes exist in an ionized form and alike charges will accumulate at the tip of the needle. The high density of charges at the tip leads to the formation of a Taylor cone13. When the repulsive forces become stronger than the surface tension at the tip of the cone, the liquid is ejected as a mist, which breaks up into smaller charged droplets when moving towards the counter electrode. This movement is directed by a potential and pressure gradient, and a counter-current flow of gas facilitates solvent evaporation. Solvent evaporation in the charged droplets results into droplets breaking up into smaller droplets14. This is caused by the surface Coulomb forces exceeding the surface tension, the Rayleigh limit15. The process continues until droplets with diameters in the nanometer range are generated. This process is schematically presented in Figure 2.
Two mechanisms, the charged-residue and the ion evaporation model16, have been proposed for the formation of gas phase ions out of these small charged droplets. In the charged-residue model, it is proposed that solvent evaporates and droplets break up until those with only a single analyte ion are created and the evaporation continues until a gas phase ion is formed. In the ion evaporation model, it is stated that droplets with a radius less than 10 nm allow direct emission of a gaseous ion (field desorption). The charge state of the ion will depend on the number of charges transferred from the droplet to the ion during desorption. As in MALDI, the mechanism of ionization is still under debate17-21. The ESI process occurs at relatively low temperature and large, polar molecules can thus be ionized without
Figure 2. Droplet production in the electrospray interface.

CHAPTER III PROFILING PROTEOMICS
32
decomposition. If several ionizable sites are present, multiple charged ions ([M + nH]n+) will be formed. Denatured proteins typically carry one charge per 1000 Da. The conventional ESI source, operating at a flow rate of a few µl/min, has been adapted to cope with higher22 and lower flow rates23-25. However, the first electrospray source without continuous infusion, operating at a low flow rate, was developed by Wilm and Mann26,27. In this nanospray source, the sample is sprayed from a metal-coated capillary with an orifice of 1-10 µm, which results in a flow rate of 20-50 nl/min. The orifice of the needle, the applied voltage, the viscosity and volatility of the solvent will all determine the flow rate.
2.2. MASS ANALYZERS
2.2.1 INTRODUCTION
When gaseous ions are formed, they are transported to the analyzer and separated according to their mass-to-charge (m/z) ratio. A mass analyzer mainly determines the quality of a mass spectrum and the characteristics for these devices are: (i) mass range, (ii) resolution and (iii) transmission. The mass range is the limit of m/z over which ions can be detected, while the resolution is defined as the smallest difference in mass still able to display two ions as separate peaks in the mass spectrum. The transmission is the ratio of ions reaching the detector and ions produced in the source (efficiency). Different mass analyzers are now available; they can be divided in two distinct classes: those of the electric-field type and those of the magnetic-field type. The first group comprises the quadrupole mass filter, the ion trap and the time-of-flight mass analyzer, while the latter includes the magnetic sector type and the ion cyclotron type. The mass analyzers are diverse in terms of design and performance. Hence, they differ in sensitivity, speed, mass accuracy, mass resolution and mass range, and may be used as stand-alone analyzers or in tandem. The four basic types currently in use for proteomics research are: the quadrupole, the ion trap, the time-of-flight and the Fourier transform ion cyclotron resonance analyzer. We will limit the discussion of mass analyzers to those implemented in the different tandem MS instruments used in this work, i.e. the quadrupole, the ion trap and the TOF analyzer.
2.2.2. THE QUADRUPOLE MASS FILTER
The quadrupole mass filter28, introduced in 195329, is constructed of four electrically conducting cylindrical rods, and mass selection is achieved by properly choosing a combination of radio frequency (RF) and direct current (DC) voltages. A two-dimensional quadrupole field is established between the four cylindrical, equidistantly-spaced electrodes and with the two opposite rods being connected electrically. One rod pair is connected to a positive DC voltage on which a sinusoidal RF voltage is superimposed. The other rod pair is connected to a negative DC voltage on which a sinusoidal RF voltage is superimposed. The DC and RF voltage are set such that only the ion of interest has a stable trajectory through the quadrupole. The mass filter is a continuous analyzer and can be set to transmit a single isotope or to scan over a wide m/z range.

CHAPTER III PROFILING PROTEOMICS
33
2.2.3. TIME-OF-FLIGHT
The principle of the time-of-flight (TOF) mass analyzer is to measure the flight time of ions accelerated from an ion source into a field-free drift tube to a detector30. The flight time is related to the m/z values of the ions according to the following formula:
The ions will be separated in the analyzer according to their m/z ratios, light ions reaching the detector earlier than heavy ones. The resolving power of this analyzer is limited by the initial spatial spread and initial velocity of the ions. For example, in a MALDI source, the ionization creates a burst of ions that will have different kinetic energies and the ions will be at different distances from the detector. Therefore, ions with the same m/z value but with different kinetic energy or at different distances will be detected at different times and will cause decreasing resolution. Two powerful techniques have been developed to compensate for temporal (time of ion formation), spatial (location of ion formation) and kinetic (energy of ion formation) distribution. The first technique is the introduction of ion mirrors, or reflectrons31, which compensates for the initial energy spread of the ions. The reflectron creates a retarding field that deflects the ions and sends them back through the flight tube (Figure 3).
The more energy the ion has, the further it penetrates the retarding field of the reflectron before it is being reflected. Therefore, a more energetic ion will travel a longer flight path and arrive at the detector at the same time as less energetic ions
Figure 3. Schematic of a reflectron time-of-flight mass analyzer. Two ions of the same mass but different initial kinetic energies, E1 and E2, are produced and extracted into the first field-free region. The ions are then reflected by the ion mirror, the reflectron, travel through the second field-free drift region and are detected at the same time by the reflecting detector.
CHAPTER III PROFILING PROTEOMICS
34
with the same mass. The kinetic energy distribution of ions is also the result from their acceleration through the gas-phase plume created during desorption32. Brown and Lennon33 have observed that both mass accuracy and mass resolution are significantly improved by introducing a delay between ion formation and extraction of the ions from the source. This time delay compensates for the wide spatial and temporal distributions.
2.2.4. ION TRAP
The ion trap consist of a chamber surrounded by a ring electrode and two end-cap electrodes and can be regarded as a quadrupole mass filter bent around on itself to form a closed loop34,35. Hence, the ion trap is also referred to as the 'quadrupole ion trap'. Unlike the quadrupole and TOF analyzers, which separate ions in space, the ion trap separates ions in time. Ions of all m/z values enter the trap at the same time and are subjected to oscillating electric fields generated by an RF voltage applied to the ring electrode only. As ions will repel each other, ion losses are prevented by introducing a gas inside the trap, typically helium, which will remove excess energy from the ions by collision. This has the effect of collisionally damping the ion motion and causes the ions to migrate to the center of the ion trap. The voltage applied to the ring electrode determines which ions remain in the trap. Ions above the threshold m/z ratio remain in the trap while others are ejected through small holes in the distal end-cap electrode. By gradually increasing the voltage in the ring electrode, ions of increasing m/z ratios are ejected over time. This process is called ‘mass-selective ejection’. Ions can also be selected for MS/MS analysis by using a RF voltage applied to the end caps to eject all ions in the trap, except for the chosen precursor ion. The kinetic energy of the selected ion population is then increased by applying a voltage resonant with the frequency of the precursor ion, causing more energetic collisions with the gas. The resulting fragments can then be ejected by 'ramping' the voltage of the ring electrode to generate an MS/MS spectrum.
2.3. TANDEM MASS SPECTROMETRY
2.3.1. INTRODUCTION
The determination of the intrinsic property, the mass, of an ion can now be readily and accurately achieved. However, this information does not provide data on the covalent structure of the ion. During the last two decades, new configurations of mass spectrometers have been developed to obtain protein or peptide primary structure information. Therefore, different mass analyzers are put in tandem, in order to obtain fragmentation of the protein or peptide. Tandem mass spectrometers36 mostly use collision-induced dissociation (CID)37,38 for the acquisition of MS/MS spectra. The mass spectrometric market in these instruments flourishes and different types of tandem mass spectrometers are nowadays commercially available, all having their own strong features. Traditionally, MALDI is coupled to TOF analyzers, while ESI is mostly coupled to quadrupoles and ion traps39,40. However, MALDI ion sources, in tandem mass spectrometers, have also been coupled to quadrupole-TOF analyzers and quadrupole-ion trap mass spectrometers41.

CHAPTER III PROFILING PROTEOMICS
35
2.3.2. COLLISION-INDUCED DISSOCIATION
In tandem mass spectrometry, a precursor ion is selected in the first analyzer and focused into a collision cell. In the cell, filled with an inert gas, collisions occur between the gas and the precursor ion and translational energy of the precursor ion will be partly converted into internal energy, exciting the ions to an unstable state. The precursor ions dissociate, i.e. fragment, to product ions. The masses of the product ions are then determined in a second mass analyzer. This process is called ‘collision-induced dissociation’, also referred to as ‘collision-activated dissociation’ (CAD). The product ions will have a charge either on the N-terminal or on the C-terminal side of the cleavage. The universally accepted nomenclature for the product ions is shown in Figure 442,43.
Although the general fragmentation mechanism of peptides is fairly well understood44-49, it remains a topic of investigation. The fragmentation of peptides is believed to be charge mediated. When non-selective cleavage occurs at multiple sites throughout the entire peptide backbone, the charge must be allowed to migrate from the initial site of protonation to the site of cleavage. This has been termed the 'mobile proton' or 'heterogeneously distributed' model50 and is one of the central tenants in peptide fragmentation mechanisms. The energy required to mobilize the proton from the thermodynamically favored site of protonation to less favored sites of protonation is provided by the collision energy imparted to the ion. The relative populations of the different protonated forms of a particular peptide depend on the internal energy content of the peptide and the gas phase basicities of potential sites of protonation. The initial population of protonated peptides is altered via collisional activation, the proton 'mobilizes', and the population of protonated forms with higher energy than that of the most stable structure increases. The proton is located at various backbone hetero-atoms in these excited molecules. Once the appropriate protonated precursors have been formed, an intramolecular process, a nucleophilic attack of amide bond or side chain, results in the cleavage of the peptide. Protonation at peptide backbone sites initiates cleavage of the peptide bond to produce b- and/or y-type fragments (Figure 5). The initial cleavage yields an ion-neutral complex, and proton transfer within this complex can account for the competition between formation of two types of ions, e.g. b- and y-ions. The energy required to relocate the proton to a position on the backbone, and hence induce dissociation, is dependent on the peptide composition51. Dissociation energy requirements are greatest for Arg-containing peptides and decrease in order of decreasing gas-phase basicity.
Figure 4. Nomenclature for the product ions generated in the fragmentation of peptides by tandem mass spectrometry.
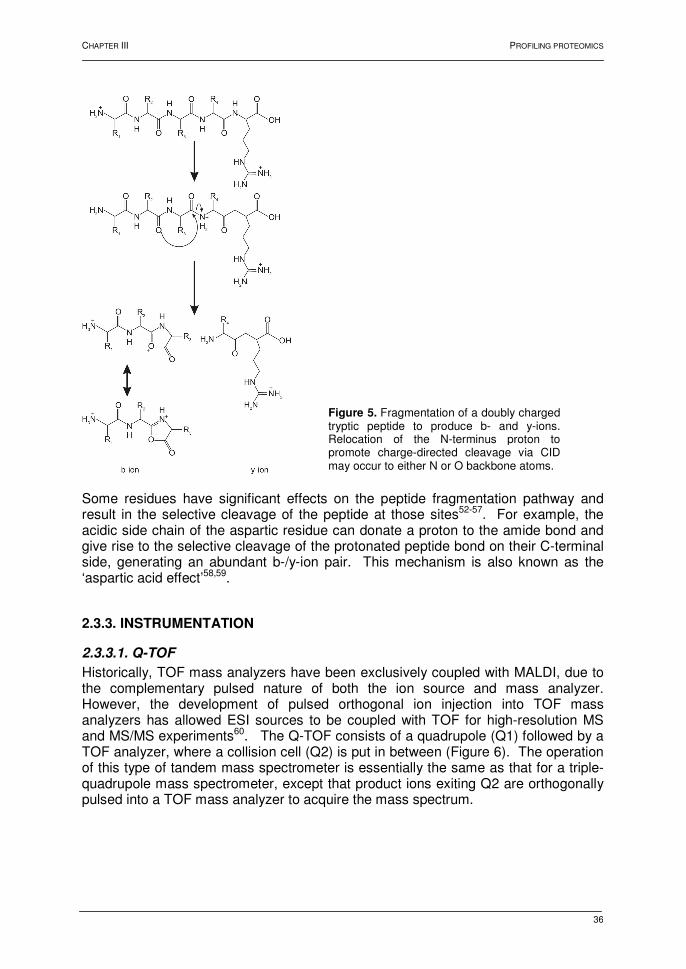
CHAPTER III PROFILING PROTEOMICS
36
Some residues have significant effects on the peptide fragmentation pathway and result in the selective cleavage of the peptide at those sites52-57. For example, the acidic side chain of the aspartic residue can donate a proton to the amide bond and give rise to the selective cleavage of the protonated peptide bond on their C-terminal side, generating an abundant b-/y-ion pair. This mechanism is also known as the ‘aspartic acid effect’58,59.
2.3.3. INSTRUMENTATION
2.3.3.1. Q-TOF
Historically, TOF mass analyzers have been exclusively coupled with MALDI, due to the complementary pulsed nature of both the ion source and mass analyzer. However, the development of pulsed orthogonal ion injection into TOF mass analyzers has allowed ESI sources to be coupled with TOF for high-resolution MS and MS/MS experiments60. The Q-TOF consists of a quadrupole (Q1) followed by a TOF analyzer, where a collision cell (Q2) is put in between (Figure 6). The operation of this type of tandem mass spectrometer is essentially the same as that for a triple-quadrupole mass spectrometer, except that product ions exiting Q2 are orthogonally pulsed into a TOF mass analyzer to acquire the mass spectrum.
Figure 5. Fragmentation of a doubly charged tryptic peptide to produce b- and y-ions. Relocation of the N-terminus proton to promote charge-directed cleavage via CID may occur to either N or O backbone atoms.
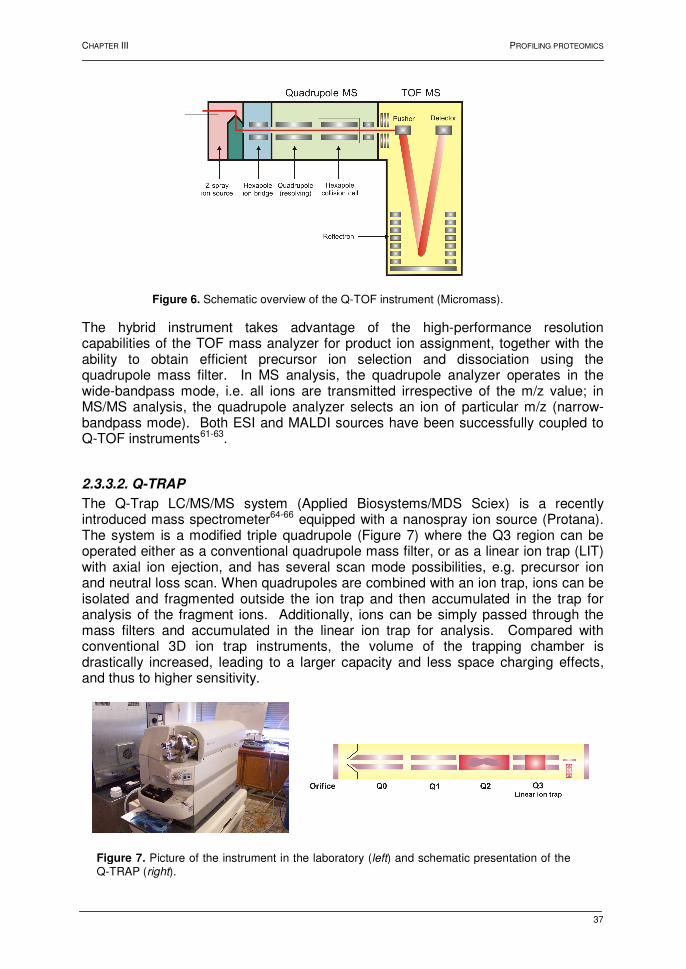
CHAPTER III PROFILING PROTEOMICS
37
The hybrid instrument takes advantage of the high-performance resolution capabilities of the TOF mass analyzer for product ion assignment, together with the ability to obtain efficient precursor ion selection and dissociation using the quadrupole mass filter. In MS analysis, the quadrupole analyzer operates in the wide-bandpass mode, i.e. all ions are transmitted irrespective of the m/z value; in MS/MS analysis, the quadrupole analyzer selects an ion of particular m/z (narrow-bandpass mode). Both ESI and MALDI sources have been successfully coupled to Q-TOF instruments61-63.
2.3.3.2. Q-TRAP
The Q-Trap LC/MS/MS system (Applied Biosystems/MDS Sciex) is a recently introduced mass spectrometer64-66 equipped with a nanospray ion source (Protana). The system is a modified triple quadrupole (Figure 7) where the Q3 region can be operated either as a conventional quadrupole mass filter, or as a linear ion trap (LIT) with axial ion ejection, and has several scan mode possibilities, e.g. precursor ion and neutral loss scan. When quadrupoles are combined with an ion trap, ions can be isolated and fragmented outside the ion trap and then accumulated in the trap for analysis of the fragment ions. Additionally, ions can be simply passed through the mass filters and accumulated in the linear ion trap for analysis. Compared with conventional 3D ion trap instruments, the volume of the trapping chamber is drastically increased, leading to a larger capacity and less space charging effects, and thus to higher sensitivity.
Figure 6. Schematic overview of the Q-TOF instrument (Micromass).
Figure 7. Picture of the instrument in the laboratory (left) and schematic presentation of the Q-TRAP (right).

CHAPTER III PROFILING PROTEOMICS
38
2.3.3.3. MALDI TOF-TOF
The MALDI-TOF mass spectrometer has already proven its use in proteomics. However, the major limitation to a MALDI-TOF instrument is the inability to perform true MS/MS. Although post-source decay (PSD) has been observed, the low precursor ion resolution, the poor mass accuracy, and the low abundance of product ions, together with the complexity of PSD spectra has made protein identification difficult using this method67-69. Medzihradszky and colleagues70 developed a tandem TOF mass spectrometer to use the high-speed capabilities of the mass analyzer to create a high-throughput tandem mass spectrometer (Figure 8). The 4700 Proteomics analyzer (Applied Biosystems) is a MALDI instrument equipped with a Nd:YAG laser which can operate at 200 Hz.
The instrument combines the advantages of high sensitivity for peptide analysis associated with MALDI and comprehensive fragmentation information provided by CID. The high kinetic energy of the ions entering the collision cell allows high-energy CID processes to be observed. So, a wider range of product ion types can be observed compared to those formed under low-energy CID conditions, including d-, v-, and w-type ions resulting from side-chain cleavages. These ions allow the isobaric amino acids, leucine and isoleucine to be differentiated. The instrument is divided into three sections based on their functionality: ion selection, collision region and the fragment detection. The ion selection and fragment detection are, respectively, achieved by the two TOF analyzers, while a collision cell is placed in between the two analyzers. For precursor selection, a novel timed-ion selector (TIS)71 has been developed (Figure 9). This process employs two tandem deflection gates that are quickly opened and closed when an ion of interest reaches the entrance. The first gate deflects low-mass ions and the second gate deflects high-mass ions. The synchronization of the opening and closing of these deflection gates is under software control.
Figure 8. (left) Picture of the 4700 Proteomics Analyzer in the laboratory. The insets are detailed photographs of the inside of the instrument. (right) Schematic overview of the MALDI TOF-TOF mass spectrometer. TIS= Timed-Ion Selector

CHAPTER III PROFILING PROTEOMICS
39
3. STRATEGIES IN PROFILING PROTEOMICS Two main routes may be distinguished in profiling proteomics: 'top-down' and 'bottom-up' proteomics. The former analyzes intact proteins, while the latter analyzes peptides originating from a proteolytic digest of the protein sample. In both approaches, the peptides or proteins are separated from each other in order to simplify the complex mixture, and the individual components are, most of the time, further identified by mass spectrometry. The two main and most powerful separation methods are liquid chromatography72 and electrophoresis73. For example, an established top-down approach consists in the separation of a protein mixture by two-dimensional gel electrophoresis, followed by in-gel digestion and analysis of the peptides by mass spectrometry. However, two-dimensional gel electrophoresis is not well suited for the analysis of certain classes of proteins and, therefore, alternative top-down strategies based on multi-dimensional chromatography have been developed74-76. Yet, these approaches are far from routine and require expensive mass spectrometric instrumentation. Hence, bottom-up 'shotgun' proteomic methods have gained in popularity. Shotgun proteomics involves solution proteolysis of a complex protein mixture into a collection of peptides, which are chromatographically separated prior to mass spectrometric identification. A schematic overview of the strategies used in profiling proteomics is given in Figure 10.
Figure 9. Schematic of the Timed-Ion Selector, showing the deflection of light ions (m1) by gate 1 and heavy ions (m3) by gate 2. Only ions of intermediate mass (m2) are allowed to pass into the collision cell. Each gate is open when both electrodes are grounded and is closed by applying +/- 950V.
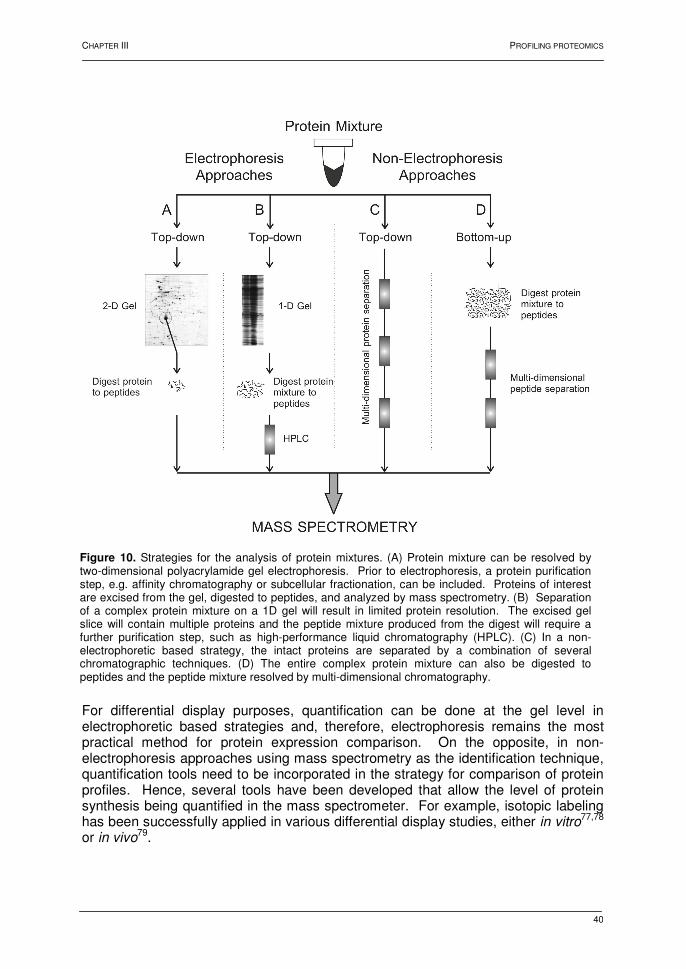
CHAPTER III PROFILING PROTEOMICS
40
For differential display purposes, quantification can be done at the gel level in electrophoretic based strategies and, therefore, electrophoresis remains the most practical method for protein expression comparison. On the opposite, in non-electrophoresis approaches using mass spectrometry as the identification technique, quantification tools need to be incorporated in the strategy for comparison of protein profiles. Hence, several tools have been developed that allow the level of protein synthesis being quantified in the mass spectrometer. For example, isotopic labeling has been successfully applied in various differential display studies, either in vitro77,78 or in vivo79.
Figure 10. Strategies for the analysis of protein mixtures. (A) Protein mixture can be resolved by two-dimensional polyacrylamide gel electrophoresis. Prior to electrophoresis, a protein purification step, e.g. affinity chromatography or subcellular fractionation, can be included. Proteins of interest are excised from the gel, digested to peptides, and analyzed by mass spectrometry. (B) Separation of a complex protein mixture on a 1D gel will result in limited protein resolution. The excised gel slice will contain multiple proteins and the peptide mixture produced from the digest will require a further purification step, such as high-performance liquid chromatography (HPLC). (C) In a non-electrophoretic based strategy, the intact proteins are separated by a combination of several chromatographic techniques. (D) The entire complex protein mixture can also be digested to peptides and the peptide mixture resolved by multi-dimensional chromatography.
CHAPTER III PROFILING PROTEOMICS
41
4. PROTEIN IDENTIFICATION STRATEGIES
4.1. INTRODUCTION
In proteomic analysis, several different techniques and methodologies are employed to identify the proteins in the sample. For example, techniques using antibodies that recognize unique epitopes may allow protein identification. However, these techniques have severe limitations, such as non-specific binding, the availability of antibodies, and the availability of complete genome sequences. Therefore, techniques have been developed for the determination of the primary structure of proteins. To date, automated N- or C- terminal sequencing and mass spectrometry can be used for obtaining amino acid sequence information of proteins, and numerous methods are applied using one of these techniques. However, the introduction of biological mass spectrometry has significantly altered the throughput of protein identifications and, concomitantly, the use of automated N- or C-terminal sequencing procedures has declined markedly. On the other hand, it must be emphasized that many biological problems require knowledge of the amino- or carboxyl-terminus of a polypeptide and that mass spectrometric methods to assign the amino or the carboxyl terminus of a protein or peptide are still limited in number. Therefore, these techniques are still valuable in proteomics and are currently the only methods that allow direct confirmation of the sequence at the termini of proteins80. The introduction of mass spectrometry provided the necessary technological breakthrough, i.e. a high-throughput and sensitive technique. Several methods are used in proteomic analyses. The determination of the N- or C- terminus of a protein in 'ladder sequencing' techniques81,82, for example, is based on mass spectrometry. The peptide fragments are generated, each differing from the next by a single residue, and analyzed by MS. Chemical procedures are mainly used in N-terminal approaches, while proteolytic digestion is the method of choice in C-terminal analysis of peptides. These strategies are valuable, but not often routinely used in high-throughput proteomic studies. In the next section, we will discuss the common protein identification methods using mass spectrometric data.
4.2. PRINCIPLES
4.2.1. PEPTIDE MASS FINGERPRINT
The first approach for characterization of complex protein mixtures was separation by two-dimensional gel electrophoresis followed by in-gel tryptic digestion of visible protein spots and subsequent off-line analysis of each digestion mixture by MALDI MS (Figure 11). The principle of the technique is that each protein can be uniquely identified by the masses of its constituent peptides, this unique signature being known as the ‘fingerprint’. In peptide mapping, also referred to as ‘peptide mass mapping’ or ‘peptide mass fingerprinting’ (PMF), proteins are identified by matching the list of observed peptide masses with a calculated list of all the expected peptide masses for each entry in a database. Five laboratories83-87, independent of each other, simultaneously developed algorithms allowing database searching on the basis of peptide mass data. Things that need to be considered for reliable protein identification are the quality and relative intensity of the peaks, the mass accuracy, and the coverage of the protein. Generally, at least five peptide masses, accurately measured, should fit to allow a reliable identification. Although the PMF technique is

CHAPTER III PROFILING PROTEOMICS
42
very robust, as the masses of the intact peptides are extremely discriminatory, this correlative searching can fail in protein identification, or even worse, can lead to incorrect protein identifications. There are several pitfalls in PMF analysis that can ultimately lead to false-positive protein identifications. There may be an error in the sequence database, which leads to incorrect predicted masses. Proteins might be post-translationally modified, or differences in mass may be the result of non-specific modifications introduced during sample preparation. Moreover, several proteins exist as polymorphic variants, differing in only a few amino acids. The protein may be non-specifically cleaved and the mass spectrum can be the result of the presence of multiple proteins. The result is that PMF is generally restricted to identifying simple protein mixtures (one or two proteins) from microorganisms with fully sequenced genomes.
4.2.2. PEPTIDE FRAGMENTATION FINGERPRINT
Important information is obtained by the acquisition of an MS/MS spectrum of one or more peptides. The CID spectrum provides primary structural information, which is not present in PMF and, therefore, protein identification is more reliable. As peptide masses are a fingerprint for a protein, the set of fragment ions generated by MS/MS act as a fingerprint for an individual peptide. In ‘peptide fragmentation fingerprinting’ (PFF)88, the un-interpreted fragment ion masses are used in a correlative database search to identify the peptide which yields a similar fragmentation pattern under similar conditions (Figure 12).
Figure 11. Principle of the Peptide Mass Fingerprint (PMF) method. This method does not apply to complex protein mixtures, as only peptide masses are measured. Therefore, this method is used for protein mixtures resolved by electrophoresis or for the identification of single proteins, e.g. quality control of recombinant proteins. Because MALDI generates singly charged ions, it is generally used in this type of analysis.

CHAPTER III PROFILING PROTEOMICS
43
Two or more peptides identified in this way are usually sufficient to unambiguously identify a protein. Several algorithms have been developed, Sequest89 and Mascot90 being the most popular. In the cross-correlation approach, Sequest, peptide sequences from a database are used to construct theoretical MS/MS spectra and the degree of overlap, the cross-correlation, between the experimental and theoretical MS/MS spectrum determines the best match. The Mascot method is a probability-based matching algorithm. The experimentally observed peaks are compared with the fragment ion masses calculated from peptide sequences in the database, and a score is calculated that reflects the statistical significance of the match. These programs have one main prerequisite: the sequence, either protein or nucleotide, must be known. Therefore, these database searching tools are excellent to study organisms of which the complete genome information is accessible. Advantageous to PMF, besides offering more reliable protein identification, un-interpreted fragment ion masses may be used to search in databases that contain incomplete gene information (e.g. EST's), and the identification of proteins from complex mixtures becomes possible. However, the algorithms used for searching MS/MS data are not fail-safe. The scoring schemes used in the database search programs are based on a simplified representation of the peptide fragmentation process91,92. Furthermore, the charge state of the precursor ion may not be known and many MS/MS spectra are of poor quality or are a mixture of different precursor ions. On the other hand, high-quality MS/MS spectra can be incorrectly assigned if the peptide concerned is not in the database. Therefore, manual verification is mostly required to avoid false-positive identifications.
Figure 12. Principle of the Peptide Fragmentation Fingerprint (PFF) method. A peptide is selected and subjected to MS/MS in the mass spectrometer. The obtained un-interpreted MS/MS spectrum is compared with in silico generated MS/MS spectra. The identified peptide is assigned to the protein.
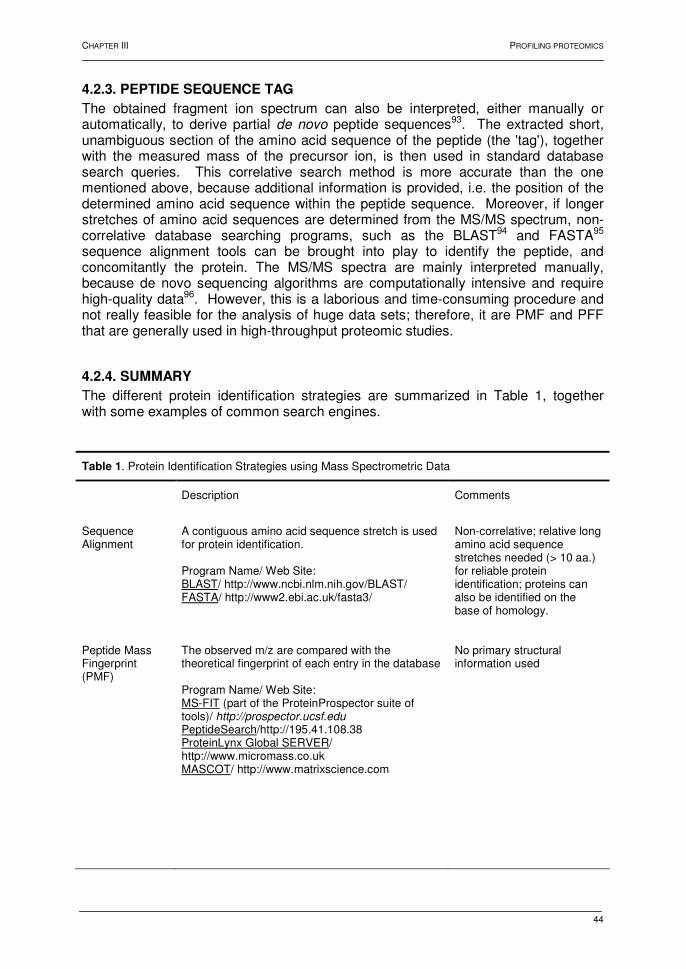
CHAPTER III PROFILING PROTEOMICS
44
4.2.3. PEPTIDE SEQUENCE TAG
The obtained fragment ion spectrum can also be interpreted, either manually or automatically, to derive partial de novo peptide sequences93. The extracted short, unambiguous section of the amino acid sequence of the peptide (the 'tag'), together with the measured mass of the precursor ion, is then used in standard database search queries. This correlative search method is more accurate than the one mentioned above, because additional information is provided, i.e. the position of the determined amino acid sequence within the peptide sequence. Moreover, if longer stretches of amino acid sequences are determined from the MS/MS spectrum, non-correlative database searching programs, such as the BLAST94 and FASTA95 sequence alignment tools can be brought into play to identify the peptide, and concomitantly the protein. The MS/MS spectra are mainly interpreted manually, because de novo sequencing algorithms are computationally intensive and require high-quality data96. However, this is a laborious and time-consuming procedure and not really feasible for the analysis of huge data sets; therefore, it are PMF and PFF that are generally used in high-throughput proteomic studies.
4.2.4. SUMMARY
The different protein identification strategies are summarized in Table 1, together with some examples of common search engines.
Table 1. Protein Identification Strategies using Mass Spectrometric Data
Description Comments
Sequence Alignment
A contiguous amino acid sequence stretch is used for protein identification. Program Name/ Web Site: BLAST/ http://www.ncbi.nlm.nih.gov/BLAST/ FASTA/ http://www2.ebi.ac.uk/fasta3/
Non-correlative; relative long amino acid sequence stretches needed (> 10 aa.) for reliable protein identification; proteins can also be identified on the base of homology.
Peptide Mass Fingerprint (PMF)
The observed m/z are compared with the theoretical fingerprint of each entry in the database Program Name/ Web Site: MS-FIT (part of the ProteinProspector suite of tools)/ http://prospector.ucsf.edu PeptideSearch/http://195.41.108.38 ProteinLynx Global SERVER/ http://www.micromass.co.uk MASCOT/ http://www.matrixscience.com
No primary structural information used
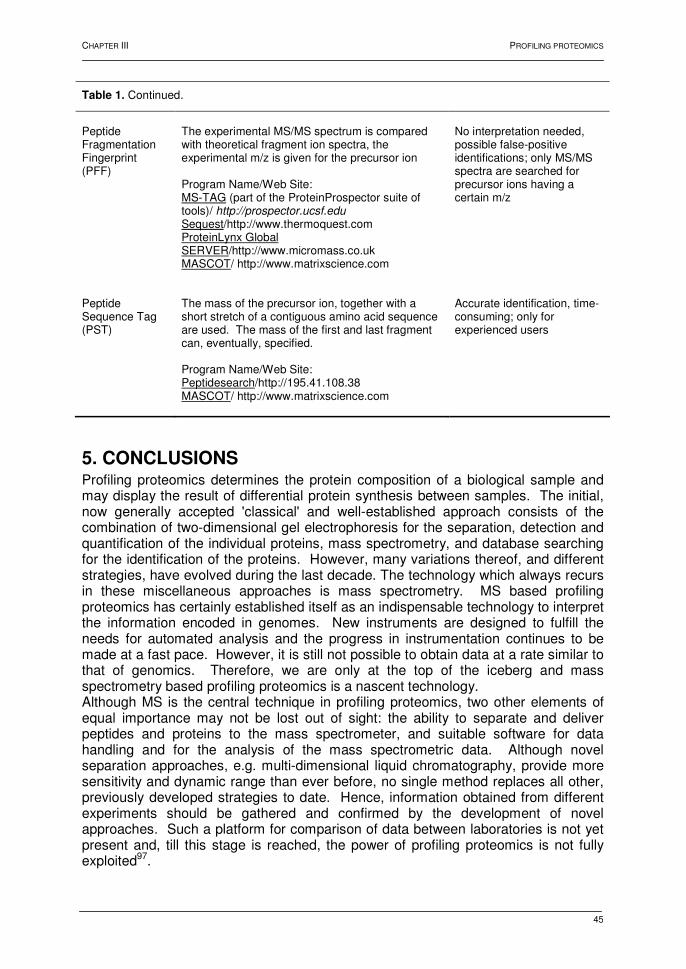
CHAPTER III PROFILING PROTEOMICS
45
Table 1. Continued.
Peptide Fragmentation Fingerprint (PFF)
The experimental MS/MS spectrum is compared with theoretical fragment ion spectra, the experimental m/z is given for the precursor ion Program Name/Web Site: MS-TAG (part of the ProteinProspector suite of tools)/ http://prospector.ucsf.edu Sequest/http://www.thermoquest.com ProteinLynx Global SERVER/http://www.micromass.co.uk MASCOT/ http://www.matrixscience.com
No interpretation needed, possible false-positive identifications; only MS/MS spectra are searched for precursor ions having a certain m/z
Peptide Sequence Tag (PST)
The mass of the precursor ion, together with a short stretch of a contiguous amino acid sequence are used. The mass of the first and last fragment can, eventually, specified. Program Name/Web Site: Peptidesearch/http://195.41.108.38 MASCOT/ http://www.matrixscience.com
Accurate identification, time-consuming; only for experienced users
5. CONCLUSIONS Profiling proteomics determines the protein composition of a biological sample and may display the result of differential protein synthesis between samples. The initial, now generally accepted 'classical' and well-established approach consists of the combination of two-dimensional gel electrophoresis for the separation, detection and quantification of the individual proteins, mass spectrometry, and database searching for the identification of the proteins. However, many variations thereof, and different strategies, have evolved during the last decade. The technology which always recurs in these miscellaneous approaches is mass spectrometry. MS based profiling proteomics has certainly established itself as an indispensable technology to interpret the information encoded in genomes. New instruments are designed to fulfill the needs for automated analysis and the progress in instrumentation continues to be made at a fast pace. However, it is still not possible to obtain data at a rate similar to that of genomics. Therefore, we are only at the top of the iceberg and mass spectrometry based profiling proteomics is a nascent technology. Although MS is the central technique in profiling proteomics, two other elements of equal importance may not be lost out of sight: the ability to separate and deliver peptides and proteins to the mass spectrometer, and suitable software for data handling and for the analysis of the mass spectrometric data. Although novel separation approaches, e.g. multi-dimensional liquid chromatography, provide more sensitivity and dynamic range than ever before, no single method replaces all other, previously developed strategies to date. Hence, information obtained from different experiments should be gathered and confirmed by the development of novel approaches. Such a platform for comparison of data between laboratories is not yet present and, till this stage is reached, the power of profiling proteomics is not fully exploited97.
CHAPTER III PROFILING PROTEOMICS
46
6. REFERENCES 1 Thomson, J.J. Rays of positive electricity and their applications to chemical analysis. Longmans
Green, London, 1913
2 Aston, F.W. Mass spectra and isotopes. Arnold, London, 1933
3 Tanaka, K.; Waki, H.; Ido, Y. et al. Protein and polymer analyses up to m/z 100.000 by laser
ionization time-of-flight mass spectrometry. Rapid Commun. Mass Spectrom. 1988, 2, 151-153
4 Tanaka, K. The origin of macromolecule ionization by laser irradiation (Nobel lecture). Angew.
Chem. Int. Ed. Engl. 2003, 42, 3860-3870
5 Karas, M.; Bachmann, D.; Bahr, U. et al. Matrix-assisted ultraviolet laser desorption of non-volatile
compounds. Int. J. Mass Spectrom. Ion Proces. 1987, 78, 53-68
6 Karas, M.; Hillenkamp, F. Laser desorption ionization of proteins with molecular masses
exceeding 10 000 Daltons. Anal. Chem. 1988, 60, 2299-2301
7 Hillenkamp, F.; Karas, M.; Beavis, R.C. et al. Matrix-assisted laser desorption/ionization mass
spectrometry of biopolymers. Anal. Chem. 1991, 63, 1193A-1203A
8 Cotter, R.J. Time-of-flight mass spectrometry: instrumentation and applications in biological
research. Am. Chemical Society, Washington, D.C. 1997, pp. 131-134
9 Hoffman, E.; Stroobant, V. Mass spectrometry: principles and applications. Wiley, Chichester,
2003
10 Dole, M.; Mach, L.L.; Hines, R.L. et al. Molecular beams of macroions. J. Chem. Phys. 1968, 49,
2240-2247
11 Meng, C.K.; Mann, M.; Fenn, J.B. Of protons or proteins. Z. Phys. D. 1988, 10, 361-368
12 Fenn, J.B.; Mann, M.; Meng, C.K. et al. Electrospray ionization for mass spectrometry of large
biomolecules. Science 1989, 246, 64-71
13 Taylor, G. Desintegration of water drops in an electric field. Proc. R. Soc. Lond. 1964, A280, 383-
397
14 Kebarle, P.; Ho, Y. On the mechanism of electrospray mass spectrometry. In: Electrospray
ionization mass spectrometry: fundamentals, instrumentation and applications. Edited by Cole,
R.B., Wiley, New York, 1997, pp. 3-63
15 Rayleigh, L. On the equilibrium of liquid conducting masses charged with electricity. Philos. Mag.
1882, 14, 184-186
16 Iribarne, J.V.; Thomson, B.A. On the evaporation of small ions from charged droplets. J. Chem.
Phys. 1976, 64, 2287-2294
17 Fenn, J.B. Ion formation from charged droplets: roles of geometry, energy, and time. J. Am. Soc.
Mass Spectrom. 1993, 4, 524-535
18 Kebarle, P.; Tang, L. From ions in solution to ions in the gas phase. Anal. Chem. 1993, 65, 972A-
986A
19 Cole, R.B. Electrospray ionization mass spectrometry: fundamentals, instrumentation and
applications, Wiley, New York, 1997
20 Kebarle, J. A brief overview of the present status of the mechanisms involved in electrospray
mass spectrometry. J. Mass Spectrom. 2000, 35, 804-817
21 Cole, R.B. Some tenets pertaining to electrospray ionization mass spectrometry. J. Mass
Spectrom. 2000, 35, 763-772
22 Bruins, A.P. Liquid chromatography-mass spectrometry with ionspray and electrospray interfaces
in pharmaceutical and biomedical research. J. Chromatogr. 1991, 554, 39,47
23 Gale, D.C.; Smith, R.D. Small volume and low flow-rate electrospray ionization mass spectrometry
of aqueous samples. Rapid Commun. Mass Spectrom. 1993, 7, 1017-1021
CHAPTER III PROFILING PROTEOMICS
47
24 Emmet, M.R.; Caprioli, R.M. Micro-electrospray mass spectrometry: ultra-high sensitivity analysis
of peptides and proteins. J. Am. Soc. Mass Spectrom. 1994, 5, 605-613
25 Andren, P.E.; Emmett, M.R.; Caprioli, R.M. Micro-electrospray: zeptomole/attomole per microliter
sensitivity for peptides. J. Am. Soc. Mass Spectrom. 1994, 5, 867-869
26 Wilm, M.S.; Mann, M. Electrospray and Taylor cone theory: Dole's beam of macromolecules at
last? Int. J. Mass Spectrom. Ion Proces. 1994, 136, 167-180
27 Wilm, M.; Mann, M. Analytical properties of the nano-electrospray ion source. Anal. Chem. 1996,
68, 1-8
28 Lane, C.S. Mass spectrometry-based proteomics in the life sciences. Cell. Mol. Life Sci. 2005, 62,
848-869
29 Paul, V.W.; Steinwedel, H. Ein neues massenspektrometer ohne magnetfeld. Z. Naturforsch. 1953,
8a, 448-450
30 Wiley, W.C.; McLaren, I.H. Time-of-flight mass spectrometer with improved resolution. Rev. Sci.
Instrum. 1955, 26, 1150-1157
31 Mamyrin, B.A.; Karataev, V.I.; Shmikk, D.V. et al. The mass reflectron, a new non-magnetic time-
of-flight mass spectrometer with high resolution. Sov. Phys. JETP 1973, 37, 45-48
32 Beavis, R.C.; Chait, B.T. Velocity distribution of intact high mass polypeptide molecule ions
produced by matrix-assisted laser desorption. Chem. Phys. Lett. 1991, 181, 479
33 Brown, R.S.; Lennon, J.J. Mass resolution improvement by incorporation of pulsed ion extraction
in a matrix-assisted laser desorption ionization linear time-of-flight mass spectrometer. Anal.
Chem. 1995, 67, 1998-2003
34 March, R.E. An introduction to quadrupole ion trap mass spectrometry. J. Mass Spectrom. 1996,
32, 351-369
35 Jonscher, K.R.; Yates, I.; John, R. The quadrupole ion trap mass spectrometer: a small solution to
a big challenge. Anal. Biochem. 1997, 244, 1-15
36 Hunt, D.F.; Yates, J.R. 3rd; Shabanowitz, J. et al. Protein sequencing by tandem mass
spectrometry. Proc. Natl. Acad. Sci. USA 1986, 83, 6233-6237
37 Jennings, K.R. Collision-induced decomposition of aromatic molecular ions. Int. J. Mass
Spectrom. Ion Phys. 1968, 1, 227-235
38 Mc Lafferty, F.W.; Bente, P.F. 3rd; Kornfeld, R. et al. Collision activation spectra of organic ions. J.
Am. Chem. Soc. 1973, 95, 2120-2129
39 Yost, R.A.; Boyd, R.B. Tandem mass spectrometry: Quadrupole and hybrid instruments. Methods
Enzymol. 1990, 193, 154-200
40 Wysocki, V.H. Triple quadrupole mass spectrometry. In mass spectrometry in the biological
sciences: A tutorial. Edited by Gross, M.L., Kluwer, Dortrecht, The Netherlands 1992, pp. 59-78
41 Krutchinsky, A.N.; Kalkum, M.; Chait, B.T. Automatic identification of proteins with a MALDI-
quadrupole ion trap mass spectrometer. Anal. Chem. 2001, 73, 5066-5077
42 Roepstorff, P.; Fohlmann, J. Proposal for a common nomenclature of sequence ions in mass
spectra of peptides. Biol. Mass Spectrom. 1994, 11, 601
43 Biemann, K. A ; Papayannopoulos, I.A. Amino-acid sequencing of proteins. Accts. Chem. Res.
1994, 27, 370-378
44 Yalcin, T.; Csizmadia, I.G.; Peterson, M.R. et al. The structure and fragmentation of Bn (n>3) ions
in peptide spectra. J. Am. Soc. Mass Spectrom. 1996, 7, 233-242
45 Yalcin, T.; Khouw, C.; Csizmadia, I.G. et al. Why are B ions stable species in peptide spectra? J.
Am. Soc. Mass Spectrom. 1995, 6, 1164-1174
CHAPTER III PROFILING PROTEOMICS
48
46 Nold, M.J.; Wesdemiotis, C.; Yalcin, T.; Harrison, A.G. Amide bond dissociation in protonated
peptides: structure of the N-terminal ionic and neutral fragments. Int. J. Mass Spectrom. Ion
Proces. 1996, 164, 137-153
47 Nair, H.; Somogyi, A.; Wysocki, V.H. Effect of alkyl substitution at the amide nitrogen on amide
bond cleavage: electrospray ionization/surface-induced dissociation fragmentation of substance P
and two alkylated analogs. J. Mass Spectrom. 1996, 31, 1141-1148
48 Summerfield, S.G.; Whiting, A.; Gaskell, S.J. Intra-ionic interactions in electrosprayed peptide ions.
Int. J. Mass Spectrom. Ion Proces. 1997, 162, 149-161
49 Tsaprailis, G.; Hair, H.; Somogyi, A. et al. Influence of secondary structure on the fragmentation of
protonated peptides. J. Am. Chem. Soc. 1999, 121, 5142-5154
50 Wysocki, V.H.; Tsaprailis, G.; Smith, L.L. et al. Mobile and localized protons: a framework for
understanding peptide dissociation. J. Mass Spectrom. 2000, 35, 1399-1406
51 Dongre, A.R.; Jones, J.L.; Somogyi, A. et al. Influence of peptide composition, gas-phase basicity,
and chemical modification on fragmentation efficiency: evidence for the mobile proton model. J.
Am. Chem. Soc. 1996, 118, 8365-8374
52 Summerfiel, S.G.; Whiting, A.; Gaskell, S.J. Intra-ionic interactions in electrosprayed peptide ions.
Int. J. Mass Spectrom. Ion Proces. 1997, 162, 149-161
53 Tsaprailis, G.; Hair, H.; Somogyi, A.; Wysocki, V.H.; Zhong, W.; Futrell, J.H. et al. Influence of
secondary structure on the fragmentation of protonated peptides. J. Am. Chem. Soc. 1999, 121,
5142-5154
54 Tsaprailis, G.; Somogyi, A.; Nikolaev, E.N.; Wysocki, V.H. Refining the model for selective
cleavage at acidic residues in arginine-containing protonated peptides. Int. J. Mass Spectrom.
2000, 195, 467-479
55 Tsaprailis, G.; Wysocki, V.H. Another selective cleavage in peptides: a common mechanism for
the formation of complementary b+/y+ or b2+ ions at protonated histidine. Proc. 48th ASMS Conf.
on Mass Spectrometry and Allied Topics, Long Beach, Calif
56 Schwartz, B.L.; Bursey, M.M. Some proline substituent effects in the tandem mass spectrum of
protonated penta-alanine. Biol. Mass Spectrom. 1992, 21, 92-96
57 Jonsson, A.P.; Bergman, T.; Jornvall, H. et al. Gln-Gly cleavage: a dominant dissociation site in
the fragmentation of protonated peptides. Rapid Commun. Mass Spectrom. 2001, 15, 713-720
58 Yu, W.; Vath, J.E.; Huberty, M.C. et al. Identification of the facile gas-phase cleavage of the Asp-
Pro and Asp-Xxx peptide bonds in matrix-assisted laser desorption time-of-flight mass
spectrometry. Anal. Chem. 1993, 65, 3015-3023
59 Gu, C.; Tsaprailis, G.; Breci, L. et al. Selective gas-phase cleavage at the peptide bond C-terminal
to aspartic acid in fixed-charge derivatives of Asp-containing peptides. Anal. Chem. 2000, 72,
5804-5813
60 Morris, H.R.; Paxton, T.; Dell, A. et al. High-sensitivity collisionally-activated decomposition
tandem mass spectrometry on a novel quadrupole orthogonal-acceleration time-of-flight mass
spectrometer. Rapid Commun. Mass Spectrom. 1996, 10, 889-896
61 Loboda, A.V.; Krutchinsky, A.N.; Bromirski, M. et al. A tandem quadrupole/time-of-flight mass
spectrometer with a matrix-assisted laser desorption/ionization source: Design and performance.
Rapid Commun. Mass Spectrom. 2000, 14, 1047-1057
62 Shevchenko, A.; Loboda, A.; Shevchenko, A. et al. MALDI quadrupole time-of-flight mass
spectrometry: a powerful tool for proteomic research. Anal. Chem. 2000, 72, 2132-2141
CHAPTER III PROFILING PROTEOMICS
49
63 Baldwin, M.A.; Medzihradszky, K.F.; Lock, C.M. et al. Matrix-assisted laser desorption/ionization
coupled with quadrupole/orthogonal acceleration time-of-flight mass spectrometry for protein
discovery, identification, and structural analysis. Anal. Chem. 2001, 73, 1707-1720
64 Hager, J.W. A new linear ion trap mass spectrometer. Rapid Commun. Mass Spectrom. 2002, 16,
512–526
65 Hager, J.W.; Le Blanc, J.C. Product Ion Scanning Using a Q-q-Qlinear ion trap (Q-TRAP) Mass
Spectrometer. Rapid Commun. Mass Spectrom. 2003, 17, 1056–1064
66 Le Blanc, J.C.; Hager, J.W.; Ilisiu, A.M. et al. Unique scanning capabilities of a new hybrid linear
ion trap mass spectrometer (Q TRAP) used for high sensitivity proteomics applications.
Proteomics 2003, 3, 859-869
67 Brown, R.S.; Lennon, J.J. Sequence-specific fragmentation of matrix-assisted laser-desorbed
protein/peptide ions. Anal. Chem. 1995, 67, 3990-3999
68 Spengler, B. Post-source decay analysis in matrix-assisted laser desorption/ionization mass
spectrometry of biomolecules. J. Mass Spectrom. 1997, 32, 1019-1036
69 Griffin, P.R.; MacCoss, M.J.; Eng, J.K. et al. Direct database searching with MALDI-PSD spectra
of peptides. Rapid Commun. Mass Spectrom. 1995, 9, 1546-1551
70 Medzihradszky, K.F.; Campbell, J.M.; Baldwin, M.A. et al. The characteristics of peptide collision-
induced dissociation using a high-performance MALDI-TOF/TOF tandem mass spectrometer. Anal.
Chem. 2000, 72, 552-558
71 Vestal, M.L.; Juhasz, P.; Hines, W.; Martin, S.A. In: Mass spectrometry in biology and medicine.
Edited by Burlingame, A.L.; Carr, S.A.; Baldwin, M.A., Humana Press, Totowa 2000, pp 1-16
72 Hearn, M.T. HPLC of proteins, peptides and polynucleotides, VCH, New York, 1991
73 Westermeier, R. Electrophoresis in practice: a guide to methods and applications of DNA and
protein separations. Wiley-VCH, Weinheim, 1997
74 Meng, F.; Du, Y.; Miller, L.M. et al. Molecular-level description of proteins from Saccharomyces
cerevisiae using quadrupole FT hybrid mass spectrometry for top down proteomics. Anal. Chem.
2004, 76, 2852-2858
75 Kelleher, N.L. Top-down proteomics. Anal. Chem. 2004, 76, 197A-203A
76 Bogdanov, B.; Smith, R.D. Proteomics by FTICR mass spectrometry: top down and bottom up.
Mass Spectrom. Rev. 2005, 24, 168-200
77 Gygi, S.P.; Rist, B.; Gerber, S.A. et al. Quantitative analysis of complex protein mixtures using
isotope-coded affinity tags. Nat. Biotechnol. 1999, 17, 994-999
78 Kirkpatrick, D.S.; Gerber, S.A.; Gygi, S.P. The absolute quantification strategy: a general
procedure for the quantification of proteins and post-translational modifications. Methods 2005, 35,
265-273
79 Ong, S.E.; Blagoev, B.; Kratchmarova, I. et al. Stable isotope labeling by amino acids in cell
culture, SILAC, as a simple and accurate approach to expression proteomics. Mol. Cell.
Proteomics 2002, 1, 376-386
80 Mann, M.; Jensen, O.N. Proteomic analysis of post-translational modifications. Nat. Biotech. 2003,
21, 255-261
81 Chait, B.T.; Wang, R.; Beavis, R.C.; Kent, S.B.H. Protein ladder sequencing. Science 1993, 262,
89-92
82 Samyn, B.; Sergeant, K.; Castanheira, P. et al. A new method for C-terminal sequence analysis in
the proteomic area. Nat. Methods 2005, 2, 193-200
CHAPTER III PROFILING PROTEOMICS
50
83 Henzel, W.J.; Billeci, T.M.; Stults, J.T. et al. Identifying proteins from 2-dimensional gels by
molecular mass searching of peptide-fragments in protein-sequence databases. Proc. Natl. Acad.
Sci. USA 1993, 90, 5011-5015
84 Pappin, D.J.C.; Hojrup, P.; Bleasby, A.J. Rapid identification of proteins by peptide mass
fingerprinting. Curr. Biol. 1993, 6, 327-332
85 Yates, J.R.; Speicher, S.; Griffin, P.R. et al. Peptide mass maps: a highly informative approach to
protein identification. Anal. Biochem. 1993, 214, 397-408
86 James, P.; Quadroni, M.; Carafoli, E.; Gonnet, G. Protein identification by mass profile
fingerprinting. Biochem. Biophys. Res. Commun. 1993, 195, 58-64
87 Mann, M.; Hojrup, P.; Roepstorff, P. Use of mass spectrometric molecular weight information to
identify proteins in sequence databases. Biol. Mass Spectrom. 1993, 22, 338-345
88 Chamrad, D.C.; Korting, G.; Stuhler, K. et al. Evaluation of algorithms for protein identification from
sequence databases using mass spectrometry data. Proteomics 2004, 4, 619-628
89 Eng, J.K.; McCormack, A.L.; Yates, J.R. III. An approach to correlate tandem mass spectral data
of peptides with amino acid sequences in a protein database. J. Am. Soc. Mass Spectrom. 1994,
5, 976-989
90 Perkins, D.N.; Pappin, D.J.; Creasy, D.M. et al. Probability-based protein identification by
searching sequence databases using mass spectrometry data. Electrophoresis 1999, 20, 3551-
3567
91 Breci, L.A.; Tabb, D.L.; Yates, J.R. III et al. Cleavage N-terminal to proline: analysis of a database
of tandem mass spectra. Anal. Chem. 2003, 75, 1963-1971
92 Kapp, E.A.; Schutz, F.; Reid, G.E. et al. Mining a tandem mass spectrometry database to
determine the trends and global factors influencing peptide fragmentation. Anal. Chem. 2003, 75,
6251-6264
93 Mann, M.; Wilm, M. Error tolerant identification of peptides in sequence databases by peptide
sequence tags. Anal. Chem. 1994, 66, 4390-4399
94 http://www.ncbi.nlm.nih.gov/BLAST
95 http://www.ebi.ac.uk/fasta33/index.html
96 Nesvizhskii, A.I.; Aebersold, R. Analysis, statistical validation and dissemination of large-scale
proteomics datasets generated by tandem MS. Drug. Discov. Today 2004, 9, 173-181
97 Prince, J.; Carlon, M.W.; Wang, R. et al. The need for a public proteomics repository. Nat.
Biotechnol. 2004, 22, 471-472

51
AIMS AND RATIONALE A core component of proteomics is the ability to systematically identify every protein present in a cell, tissue or organism, together with the determination of other relevant properties, e.g. abundance. This discipline is now commonly referred to as ‘profiling proteomics’ as explained in Chapter III. The technology for such analyses integrates the disciplines of separation science for the separation of peptides and proteins, of analytical science for the identification and quantification of the analytes, and of bioinformatics for data management and analysis. At the start of this work, many of these tools were not as mature as they are today and, moreover, the limited number of completed genome sequences hampered protein identification. For sure, the simplest procedure to identify a protein is to subject it to proteolysis, and to record the mass spectrum of the resulting peptides. The more accurate the experimentally determined peptide masses, the more likely the protein will be correctly identified. Although MALDI TOF was primarily used for the identification of 2D-PAGE separated proteins in the early days of profiling proteomics, peptide mass fingerprinting was most of the time not sufficient for accurate protein identification (Chapter III), especially if no sequence information is accessible. Therefore, peptide fragmentation information, using tandem mass spectrometry, is required for stringent protein identification. MALDI instruments with MS/MS capabilities were recently developed and, before this, mass spectrometers equipped with electrospray ionization sources were the solution for 'real' MS/MS analysis. In order to provide us with the necessary sensitivity and throughput, we coupled a miniaturized, nano-HPLC system to an ESI-Q-TOF mass spectrometer (Chapter IV). The automated system proved to be reliable and the significantly reduced sample quantities allowed us to identify protein spots from a single 2D-gel. In this respect, it is worth mentioning that protein spots could be identified by homology with proteins of better characterized related organisms, especially those of which the genome sequences have been sequenced. This was important as, for example, the genome sequence of the organism under investigation at the start of this work, Shewanella oneidensis MR-1, was published two years thereafter. The nanoLC was coupled to the Q-TRAP LC-MS/MS system for the analysis of gel separated proteins when this sensitive and fast mass spectrometer was introduced in the laboratory at the end of 2002 (Chapter IV). At the same time, a MALDI instrument with MS/MS capabilities became accessible and was used for protein identification (Chapter IV). Furthermore, the software delivered with these novel mass spectrometers also automated the process of database searching. The nanoLC-MS/MS was ready to be used for the identification of 2D-PAGE separated proteins and has been applied to two differential display studies. The first study fitted within a STWW program (IWT), entitled: "Shewanella putrefaciens: an omnipotent bacterium involved in microbial induced corrosion and bioremediation of dehalogenated compounds". The growth of this bacterium on a solid substrate, ferric oxide, has been investigated by 2D-PAGE/MS (Chapter V). The second differential display study was performed in the framework of a Socrates-Erasmus program and examined the effect of a short-term heat shock on barley (Chapter VI).

52
The 2D-PAGE separation technique suffers from some drawbacks as outlined in detail in Chapter III: membrane proteins and highly basic proteins are rarely represented, and the technique displays limited dynamic range. In collaboration with the Department of Pediatric Neurology and Metabolism (Univerity Hospital, UGent), we developed alternative strategies for profiling membrane proteins in order to provide answers to particular biological questions. In the first project, the aim was to profile the different subunits of the respiratory oxidative phosphorylation system (Chapter VII). The complexes were separated by the technique of ‘blue-native polyacrylamide gel electrophoresis’ and the subunits were identified by mass spectrometry. In a second project, we intended to profile the proteins present in a specialized membrane, the myelin sheath (Chapter VIII). Here, the protein sample was digested and analyzed by a non-gel based strategy, i.e. a shotgun bottom-up proteomic approach using multi-dimensional liquid chromatography. We tried to couple nanoLC to MALDI TOF-TOF MS for the analysis of the complex peptide mixture.
PART II:
PROTEOMIC ANALYSIS BY TWO-DIMENSIONAL GEL ELECTROPHORESIS AND MASS SPECTROMETRY

CHAPTER IV
54
CHAPTER IV
IDENTIFICATION OF PROTEINS SEPARATED
BY GEL ELECTROPHORESIS USING MASS SPECTROMETRY
This chapter describes different mass spectrometric techniques for the identification of gel separated proteins, which were further used in various expression proteomic experiments. In particular, the hyphenation of nanoflow liquid chromatography and tandem mass spectrometry, which allowed the unambiguous identification of proteins, is highlighted. The automated nanoflow LC-MS/MS only needed limited sample amount of a tryptic digest mixture obtained from a single Coomassie Blue stained 2D-spot. The sample was loaded on the nanoflow LC column using a preconcentration/desalting step, and analyzed on-line by either a hybrid quadrupole time-of-flight or a hybrid triple quadrupole/linear ion trap mass spectrometer using an automated MS to MS/MS switching protocol. The implementation of nanoflow liquid chromatography offers unique opportunities for automation of proteomic research.
CHAPTER IV IDENTIFICATION OF PROTEINS SEPARATED BY 2D-PAGE
55
1. INTRODUCTION Since the introduction of the term proteomics, different methodologies have been developed that allow global analyses of gene expression at the protein level. The original papers mainly describe the analysis of differential gene expression using two-dimensional gel electrophoresis (2D-PAGE). Today most protein separations in profiling proteomics are still accomplished by this technique. Major advantages for a gel-based strategy, in comparison with other methods, are: simplicity, reliability, and ready accessibility. In addition, gels allow for the visualization and selection of relevant proteins from a complex mixture. Although electrophoresis provides the opportunity to diagnose quantitative and qualitative differences in the protein composition of two or more samples, even long so before gene array techniques to measure gene expression were conceived, the technique by itself is essentially descriptive and relies on the accessibility of tools for the identification of the separated proteins. A key tool in this respect is mass spectrometry. The global approach involves excision of the gel band of interest, in situ digestion of the proteins in the band using the enzyme trypsin, followed by mass spectrometric analysis of the peptides produced. This chapter will deal with the mass spectrometric identification of gel separated proteins.
2. TWO-DIMENSIONAL GEL ELECTROPHORESIS Two-dimensional polyacrylamide gel electrophoresis (2D-PAGE) separates proteins in two dimensions, as its name implies, and was originally described by Klose and O'Farrell1-3. In the first dimension, proteins are separated by their isoelectric point (pI). The proteins migrate through a continuous pH gradient, under the influence of an electric field, towards the point where their net charges are zero. The pH gradient consists of a gradient of acidic and basic buffering groups (Immobilines), incorporated into a polyacrylamide gel, constituting an immobilized pH gradient (IPG)4. Proteins, being amphoteric molecules, carry either positive, negative or zero net charges depending on the pH of their environment. When a protein diffuses away from its pI, it gains charge and migrates back. Therefore, this process is called ‘isoelectric focusing’. In the second dimension, proteins are separated according to their molecular weight (Mw) using standard sodium dodecylsulfate polyacrylamide gel electrophoresis (SDS-PAGE). The technique is based on the exposure of denatured proteins to the detergent sodium dodecylsulfate (SDS) which binds stoichiometrically to the proteins and carries a negative charge. The intrinsic charge of the protein is masked by the SDS molecules, and proteins will therefore be separated only on the basis of their molecular weight in the polyacrylamide gel. The proteins separated in the two dimensions can be detected by various staining methods, using e.g. Coomassie brilliant blue, silver, or fluorescent Sypro Ruby. The visualized spot displays the experimental pI and Mw of the protein and, therefore, provides initial information on the identity of the protein. However, accurate protein identification is obtained using mass spectrometric techniques.
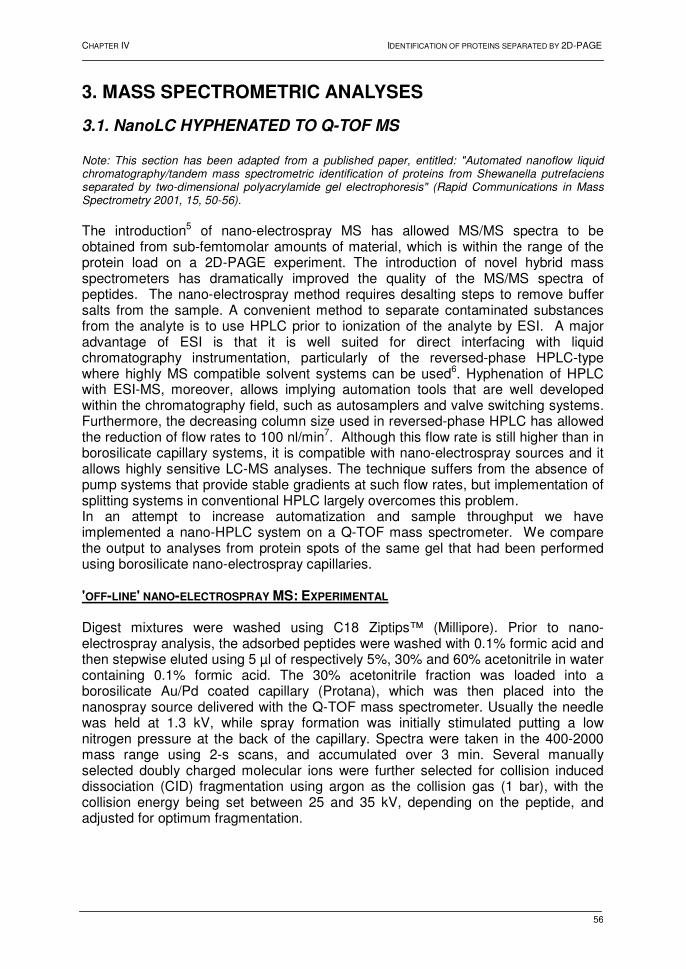
CHAPTER IV IDENTIFICATION OF PROTEINS SEPARATED BY 2D-PAGE
56
3. MASS SPECTROMETRIC ANALYSES
3.1. NanoLC HYPHENATED TO Q-TOF MS
Note: This section has been adapted from a published paper, entitled: "Automated nanoflow liquid chromatography/tandem mass spectrometric identification of proteins from Shewanella putrefaciens separated by two-dimensional polyacrylamide gel electrophoresis" (Rapid Communications in Mass Spectrometry 2001, 15, 50-56).
The introduction5 of nano-electrospray MS has allowed MS/MS spectra to be obtained from sub-femtomolar amounts of material, which is within the range of the protein load on a 2D-PAGE experiment. The introduction of novel hybrid mass spectrometers has dramatically improved the quality of the MS/MS spectra of peptides. The nano-electrospray method requires desalting steps to remove buffer salts from the sample. A convenient method to separate contaminated substances from the analyte is to use HPLC prior to ionization of the analyte by ESI. A major advantage of ESI is that it is well suited for direct interfacing with liquid chromatography instrumentation, particularly of the reversed-phase HPLC-type where highly MS compatible solvent systems can be used6. Hyphenation of HPLC with ESI-MS, moreover, allows implying automation tools that are well developed within the chromatography field, such as autosamplers and valve switching systems. Furthermore, the decreasing column size used in reversed-phase HPLC has allowed the reduction of flow rates to 100 nl/min7. Although this flow rate is still higher than in borosilicate capillary systems, it is compatible with nano-electrospray sources and it allows highly sensitive LC-MS analyses. The technique suffers from the absence of pump systems that provide stable gradients at such flow rates, but implementation of splitting systems in conventional HPLC largely overcomes this problem. In an attempt to increase automatization and sample throughput we have implemented a nano-HPLC system on a Q-TOF mass spectrometer. We compare the output to analyses from protein spots of the same gel that had been performed using borosilicate nano-electrospray capillaries. 'OFF-LINE' NANO-ELECTROSPRAY MS: EXPERIMENTAL Digest mixtures were washed using C18 Ziptips™ (Millipore). Prior to nano-electrospray analysis, the adsorbed peptides were washed with 0.1% formic acid and then stepwise eluted using 5 µl of respectively 5%, 30% and 60% acetonitrile in water containing 0.1% formic acid. The 30% acetonitrile fraction was loaded into a borosilicate Au/Pd coated capillary (Protana), which was then placed into the nanospray source delivered with the Q-TOF mass spectrometer. Usually the needle was held at 1.3 kV, while spray formation was initially stimulated putting a low nitrogen pressure at the back of the capillary. Spectra were taken in the 400-2000 mass range using 2-s scans, and accumulated over 3 min. Several manually selected doubly charged molecular ions were further selected for collision induced dissociation (CID) fragmentation using argon as the collision gas (1 bar), with the collision energy being set between 25 and 35 kV, depending on the peptide, and adjusted for optimum fragmentation.

CHAPTER IV IDENTIFICATION OF PROTEINS SEPARATED BY 2D-PAGE
57
'ON-LINE' NANOLC-MS: EXPERIMENTAL A commercial nano-HPLC system, i.e. an Ultimate Micro LC system combined with a FAMOS autosampler system (Dionex-LC Packings) was coupled to the Q-TOF mass spectrometer. The pump is a classical reciprocal pump system used at 150 µl/min. It has a built-in flow splitting system to reduce the flow rate to 100 nl/min. Essentials of the setup are out-lined in Figure 1 and are comparable with the design for the analysis of nucleosides described by Vanhoutte et al8.
The samples, 4 µl of the peptide extract, were loaded onto the column (PEPMAP, 75 µm I.D., 15 cm, Dionex-LC Packings) using an on-line preconcentration step on a micro precolumn (800 µm I.D., 2 mm) cartridge. This was proven to be an essential step for both reducing sample loading times and desalting. It should, indeed, be realized that loading the sample at a flow rate of 100 nl/min would significantly increase analysis time. The washing step was performed using 0.1% formic acid in water delivered at 10 µl/min by a 130A syringe pump (Applied Biosystems). After 10 min, valve A was switched to connect the pre-column to the separating column and the gradient was started. A linear gradient from 5% acetonitrile/ 0.1% formic acid in water to 80% acetonitrile/0.1% formic acid in water over a period of 50 min was applied. The column was connected to the UV detector, equipped with a U shaped-cell, and directly linked, via a 20 µm I.D. fused silica capillary, to a nano-LC electrospray device developed in the laboratory, using PTFE sleeves (Figure 2). This device holds a New Objective PicoTip needle (Woburn), which is an Au-Pd coated nano electrospray needle with a 10µm tip. The instrument was set to perform a MS survey scan of 2 s with m/z values of 400-1500. Any peak with a threshold of 100 counts/s was automatically detected and selected by the quadrupole for fragmentation. The collision gas was argon (1 bar) and the collision energy was kept at 40 V. The scan time was 1 s, with m/z ranging from 50 to 2000. The instrument was used in the positive ion mode and calibrated prior to analysis using horse myoglobin.
Figure 1. Setup of the nanoflow HPLC system.
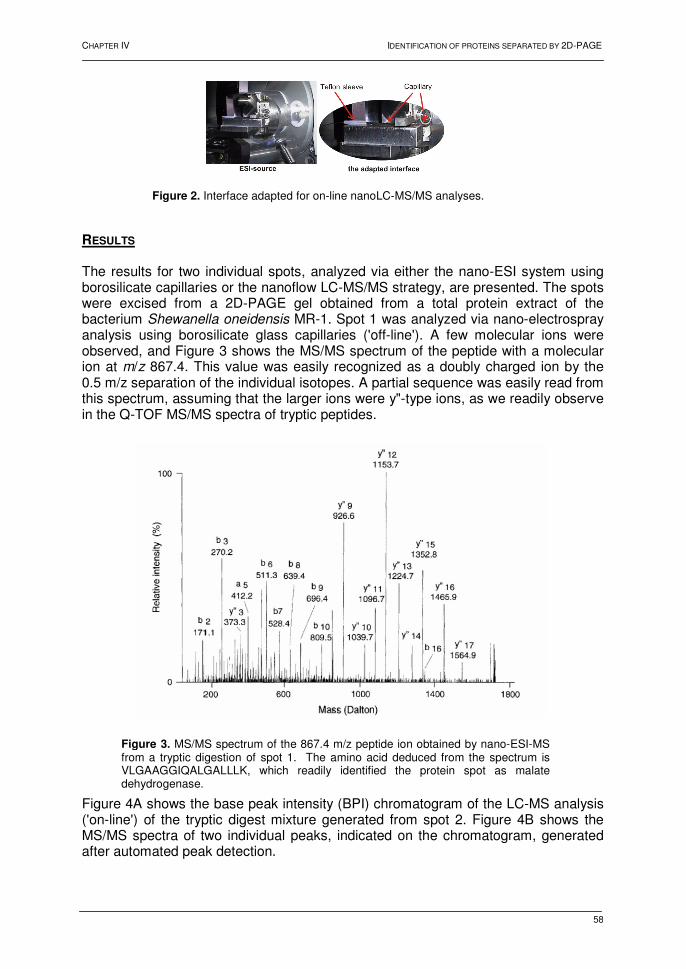
CHAPTER IV IDENTIFICATION OF PROTEINS SEPARATED BY 2D-PAGE
58
RESULTS The results for two individual spots, analyzed via either the nano-ESI system using borosilicate capillaries or the nanoflow LC-MS/MS strategy, are presented. The spots were excised from a 2D-PAGE gel obtained from a total protein extract of the bacterium Shewanella oneidensis MR-1. Spot 1 was analyzed via nano-electrospray analysis using borosilicate glass capillaries ('off-line'). A few molecular ions were observed, and Figure 3 shows the MS/MS spectrum of the peptide with a molecular ion at m/z 867.4. This value was easily recognized as a doubly charged ion by the 0.5 m/z separation of the individual isotopes. A partial sequence was easily read from this spectrum, assuming that the larger ions were y"-type ions, as we readily observe in the Q-TOF MS/MS spectra of tryptic peptides.
Figure 4A shows the base peak intensity (BPI) chromatogram of the LC-MS analysis ('on-line') of the tryptic digest mixture generated from spot 2. Figure 4B shows the MS/MS spectra of two individual peaks, indicated on the chromatogram, generated after automated peak detection.
Figure 2. Interface adapted for on-line nanoLC-MS/MS analyses.
Figure 3. MS/MS spectrum of the 867.4 m/z peptide ion obtained by nano-ESI-MS from a tryptic digestion of spot 1. The amino acid deduced from the spectrum is VLGAAGGIQALGALLLK, which readily identified the protein spot as malate dehydrogenase.
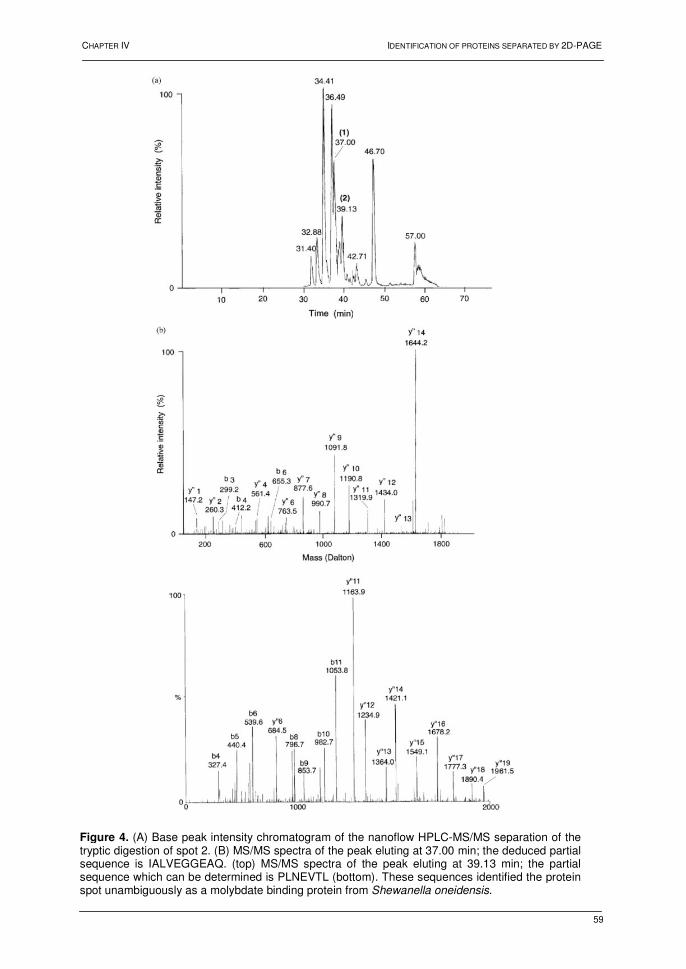
CHAPTER IV IDENTIFICATION OF PROTEINS SEPARATED BY 2D-PAGE
59
Figure 4. (A) Base peak intensity chromatogram of the nanoflow HPLC-MS/MS separation of the tryptic digestion of spot 2. (B) MS/MS spectra of the peak eluting at 37.00 min; the deduced partial sequence is IALVEGGEAQ. (top) MS/MS spectra of the peak eluting at 39.13 min; the partial sequence which can be determined is PLNEVTL (bottom). These sequences identified the protein spot unambiguously as a molybdate binding protein from Shewanella oneidensis.
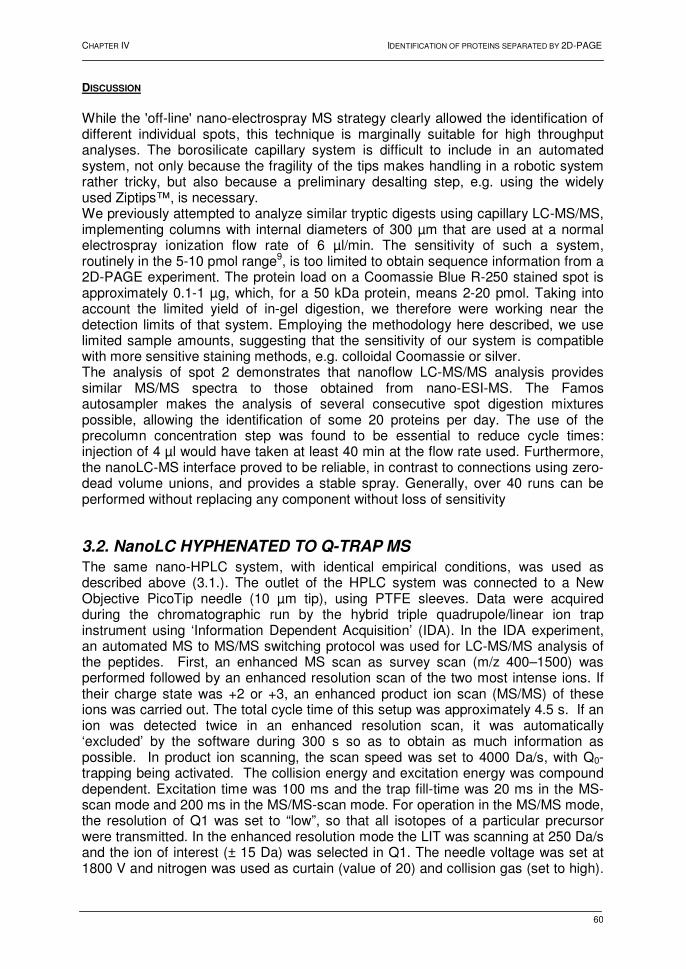
CHAPTER IV IDENTIFICATION OF PROTEINS SEPARATED BY 2D-PAGE
60
DISCUSSION
While the 'off-line' nano-electrospray MS strategy clearly allowed the identification of different individual spots, this technique is marginally suitable for high throughput analyses. The borosilicate capillary system is difficult to include in an automated system, not only because the fragility of the tips makes handling in a robotic system rather tricky, but also because a preliminary desalting step, e.g. using the widely used Ziptips™, is necessary. We previously attempted to analyze similar tryptic digests using capillary LC-MS/MS, implementing columns with internal diameters of 300 µm that are used at a normal electrospray ionization flow rate of 6 µl/min. The sensitivity of such a system, routinely in the 5-10 pmol range9, is too limited to obtain sequence information from a 2D-PAGE experiment. The protein load on a Coomassie Blue R-250 stained spot is approximately 0.1-1 µg, which, for a 50 kDa protein, means 2-20 pmol. Taking into account the limited yield of in-gel digestion, we therefore were working near the detection limits of that system. Employing the methodology here described, we use limited sample amounts, suggesting that the sensitivity of our system is compatible with more sensitive staining methods, e.g. colloidal Coomassie or silver. The analysis of spot 2 demonstrates that nanoflow LC-MS/MS analysis provides similar MS/MS spectra to those obtained from nano-ESI-MS. The Famos autosampler makes the analysis of several consecutive spot digestion mixtures possible, allowing the identification of some 20 proteins per day. The use of the precolumn concentration step was found to be essential to reduce cycle times: injection of 4 µl would have taken at least 40 min at the flow rate used. Furthermore, the nanoLC-MS interface proved to be reliable, in contrast to connections using zero-dead volume unions, and provides a stable spray. Generally, over 40 runs can be performed without replacing any component without loss of sensitivity
3.2. NanoLC HYPHENATED TO Q-TRAP MS
The same nano-HPLC system, with identical empirical conditions, was used as described above (3.1.). The outlet of the HPLC system was connected to a New Objective PicoTip needle (10 µm tip), using PTFE sleeves. Data were acquired during the chromatographic run by the hybrid triple quadrupole/linear ion trap instrument using ‘Information Dependent Acquisition’ (IDA). In the IDA experiment, an automated MS to MS/MS switching protocol was used for LC-MS/MS analysis of the peptides. First, an enhanced MS scan as survey scan (m/z 400–1500) was performed followed by an enhanced resolution scan of the two most intense ions. If their charge state was +2 or +3, an enhanced product ion scan (MS/MS) of these ions was carried out. The total cycle time of this setup was approximately 4.5 s. If an ion was detected twice in an enhanced resolution scan, it was automatically ‘excluded’ by the software during 300 s so as to obtain as much information as possible. In product ion scanning, the scan speed was set to 4000 Da/s, with Q0-trapping being activated. The collision energy and excitation energy was compound dependent. Excitation time was 100 ms and the trap fill-time was 20 ms in the MS-scan mode and 200 ms in the MS/MS-scan mode. For operation in the MS/MS mode, the resolution of Q1 was set to “low”, so that all isotopes of a particular precursor were transmitted. In the enhanced resolution mode the LIT was scanning at 250 Da/s and the ion of interest (± 15 Da) was selected in Q1. The needle voltage was set at 1800 V and nitrogen was used as curtain (value of 20) and collision gas (set to high).
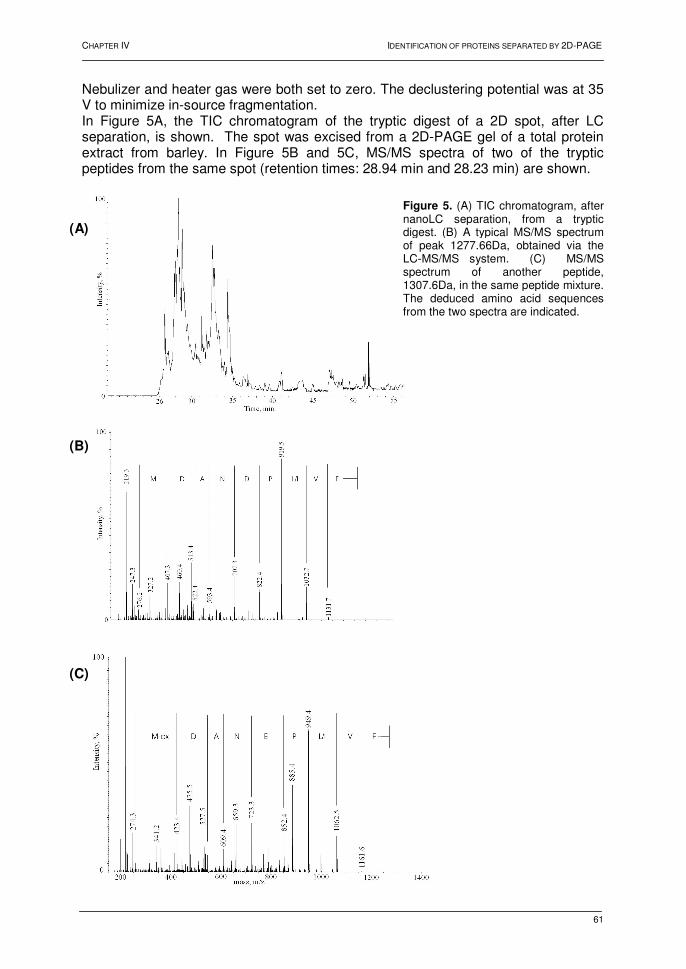
CHAPTER IV IDENTIFICATION OF PROTEINS SEPARATED BY 2D-PAGE
61
Nebulizer and heater gas were both set to zero. The declustering potential was at 35 V to minimize in-source fragmentation. In Figure 5A, the TIC chromatogram of the tryptic digest of a 2D spot, after LC separation, is shown. The spot was excised from a 2D-PAGE gel of a total protein extract from barley. In Figure 5B and 5C, MS/MS spectra of two of the tryptic peptides from the same spot (retention times: 28.94 min and 28.23 min) are shown.
Figure 5. (A) TIC chromatogram, after nanoLC separation, from a tryptic digest. (B) A typical MS/MS spectrum of peak 1277.66Da, obtained via the LC-MS/MS system. (C) MS/MS spectrum of another peptide, 1307.6Da, in the same peptide mixture. The deduced amino acid sequences from the two spectra are indicated.
(A)
(B)
(C)
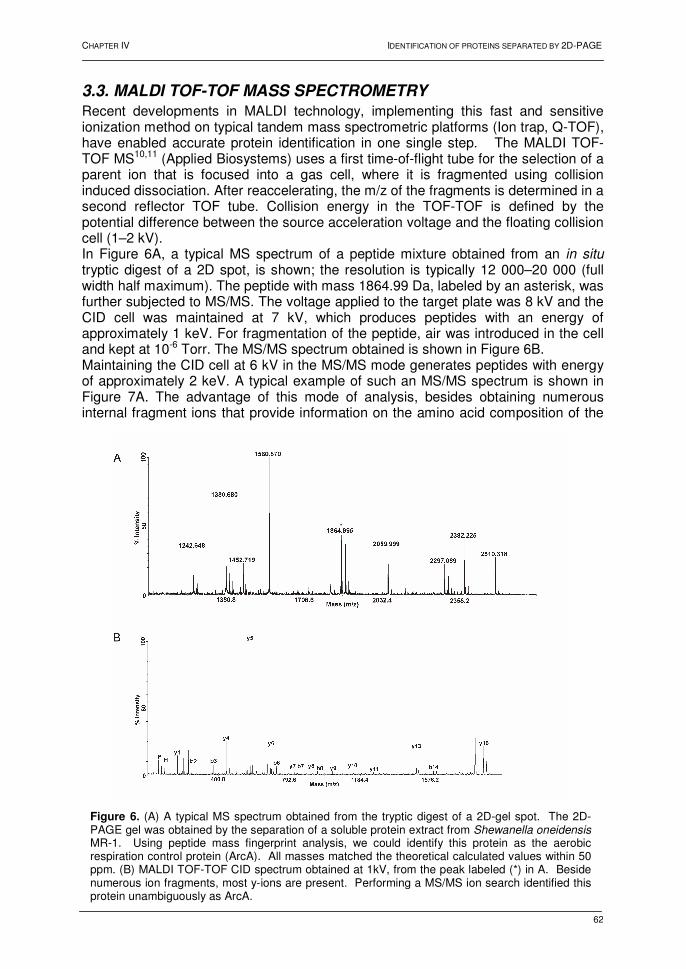
CHAPTER IV IDENTIFICATION OF PROTEINS SEPARATED BY 2D-PAGE
62
3.3. MALDI TOF-TOF MASS SPECTROMETRY
Recent developments in MALDI technology, implementing this fast and sensitive ionization method on typical tandem mass spectrometric platforms (Ion trap, Q-TOF), have enabled accurate protein identification in one single step. The MALDI TOF-TOF MS10,11 (Applied Biosystems) uses a first time-of-flight tube for the selection of a parent ion that is focused into a gas cell, where it is fragmented using collision induced dissociation. After reaccelerating, the m/z of the fragments is determined in a second reflector TOF tube. Collision energy in the TOF-TOF is defined by the potential difference between the source acceleration voltage and the floating collision cell (1–2 kV). In Figure 6A, a typical MS spectrum of a peptide mixture obtained from an in situ tryptic digest of a 2D spot, is shown; the resolution is typically 12 000–20 000 (full width half maximum). The peptide with mass 1864.99 Da, labeled by an asterisk, was further subjected to MS/MS. The voltage applied to the target plate was 8 kV and the CID cell was maintained at 7 kV, which produces peptides with an energy of approximately 1 keV. For fragmentation of the peptide, air was introduced in the cell and kept at 10-6 Torr. The MS/MS spectrum obtained is shown in Figure 6B. Maintaining the CID cell at 6 kV in the MS/MS mode generates peptides with energy of approximately 2 keV. A typical example of such an MS/MS spectrum is shown in Figure 7A. The advantage of this mode of analysis, besides obtaining numerous internal fragment ions that provide information on the amino acid composition of the
Figure 6. (A) A typical MS spectrum obtained from the tryptic digest of a 2D-gel spot. The 2D-PAGE gel was obtained by the separation of a soluble protein extract from Shewanella oneidensis MR-1. Using peptide mass fingerprint analysis, we could identify this protein as the aerobic respiration control protein (ArcA). All masses matched the theoretical calculated values within 50 ppm. (B) MALDI TOF-TOF CID spectrum obtained at 1kV, from the peak labeled (*) in A. Beside numerous ion fragments, most y-ions are present. Performing a MS/MS ion search identified this protein unambiguously as ArcA.
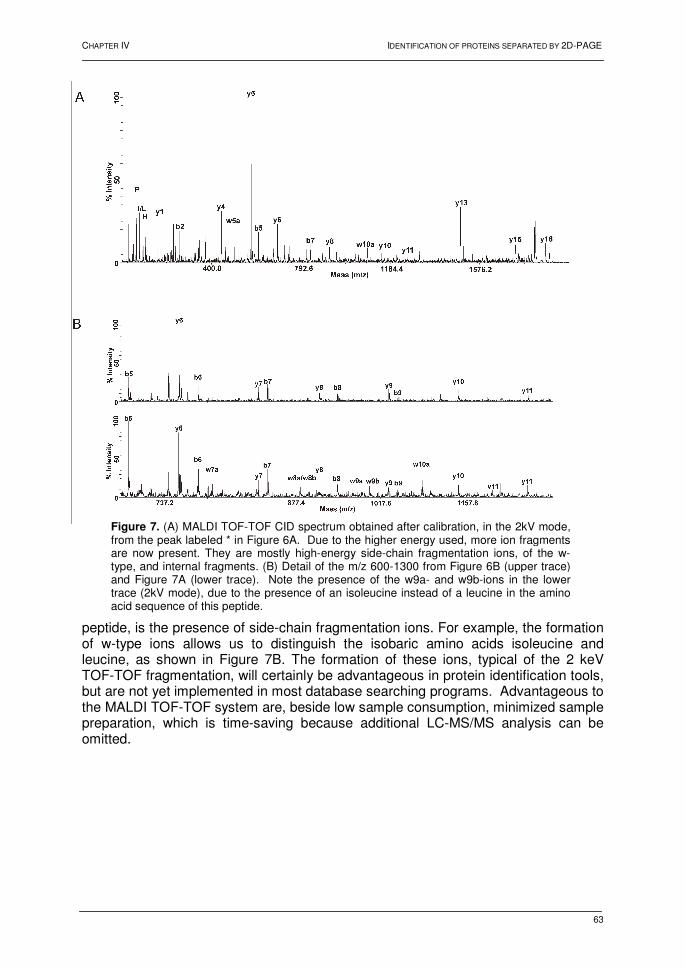
CHAPTER IV IDENTIFICATION OF PROTEINS SEPARATED BY 2D-PAGE
63
peptide, is the presence of side-chain fragmentation ions. For example, the formation of w-type ions allows us to distinguish the isobaric amino acids isoleucine and leucine, as shown in Figure 7B. The formation of these ions, typical of the 2 keV TOF-TOF fragmentation, will certainly be advantageous in protein identification tools, but are not yet implemented in most database searching programs. Advantageous to the MALDI TOF-TOF system are, beside low sample consumption, minimized sample preparation, which is time-saving because additional LC-MS/MS analysis can be omitted.
Figure 7. (A) MALDI TOF-TOF CID spectrum obtained after calibration, in the 2kV mode, from the peak labeled * in Figure 6A. Due to the higher energy used, more ion fragments are now present. They are mostly high-energy side-chain fragmentation ions, of the w-type, and internal fragments. (B) Detail of the m/z 600-1300 from Figure 6B (upper trace) and Figure 7A (lower trace). Note the presence of the w9a- and w9b-ions in the lower trace (2kV mode), due to the presence of an isoleucine instead of a leucine in the amino acid sequence of this peptide.

CHAPTER IV IDENTIFICATION OF PROTEINS SEPARATED BY 2D-PAGE
64
4. CONCLUSIONS We have shown that the implementation of a commercial nano-HPLC system, linked to a tandem mass spectrometer that permits an automated MS to MS/MS switching routine, has provided us with a robust, powerful hyphenated technique for the unambiguous identification of 2D-gel separated proteins. Moreover, a high degree of automation is obtained using this setup, and multiple proteins can now be identified in a day, with minor interference of the analyst. The introduction of two mass spectrometers in the laboratory in 2002, a Q-Trap LC-MS/MS system and a 4700 Proteomics Analyzer, has not only increased the throughput of identification, but also facilitated accurate protein identification. The former, as the Q-TOF MS, has been coupled to the nano-HPLC system, while the latter is an easy-to-use MALDI instrument which allows acquiring high quality MS and MS/MS spectra. When using this spectrometer, minimized sample handling and the speed of analysis are major improvements in the protein identification strategy. The above described tools, nanoLC-MS/MS and MALDI TOF/TOF MS, have been used for the analysis and identification of protein spots, and we have implemented them in two expression proteomic experiments (Chapters V and VI).
CHAPTER IV IDENTIFICATION OF PROTEINS SEPARATED BY 2D-PAGE
65
5. REFERENCES 1 Klose, J. Protein mapping by combined isoelectric focusing and electrophoresis of mouse tissues.
A novel approach to testing for induced point mutations in mammals. Humangenetik 1975, 26,
231-243
2 O'Farrell, P. High-resolution two-dimensional electrophoresis of proteins. J. Biol. Chem. 1975,
250, 4007-4021
3 O'Farrel, P.Z.; Goodman, H.M.; O'Farrell, P. High-resolution two-dimensional electrophoresis of
basic as well as acidic proteins. Cell 1977, 12, 1133-1141
4 Görg, A.; Postel, W.; Günther, S. The current state of two-dimensional electrophoresis with
immobilized pH gradients. Electrophoresis 1988, 9, 531-546
5 Wilm, M.; Shevchenko, A.; Houthaeve, T. et al. Femtomole sequencing of proteins from
polyacrylamide gels by nano-electrospray mass spectrometry. Nature 1996, 379, 466-469
6 Lee, E.D.; Muck, W.; Henion, J.D. et al. Online capillary zone electrophoresis ion spray tandem
mass-spectrometry for the determination of dynorphins. J. Chromatogr. 1988, 458, 313-321
7 Chervet, J.P.; Ursem, M.; Salzmann, J.B. Instrumental requirements for nanoscale liquid
chromatography. Anal. Chem. 1996, 68, 1507
8 Vanhoutte, K.; Van Dongen, W.; Hoes, I. et al. Development of a nanoscale liquid chromatography
electrospray mass spectrometry methodology for the detection and identification of DNA adducts.
Anal. Chem. 1997, 69, 3161-3168
9 Klarskov, K.; Roecklin, D.; Bouchon, B. et al. Analysis of recombinant schistosoma-mansoni
antigen rsmp28 by online liquid-chromatography mass spectrometry combined with sodium
dodecyl-sulfate polyacrylamide-gel electrophoresis. Anal. Biochem. 1994, 216, 127-134
10 Medzihradszky, K.F.; Campbell, J.M.; Baldwin, M.A. et al. The characteristics of peptide collision-
induced dissociation using a high-performance MALDI-TOF/TOF tandem mass spectrometer. Anal.
Chem. 2000, 72, 552-558
11 Yergey, A.; Coorssen, J.; Backlund, P. et al. De novo sequencing of peptides using MALDI/TOF-
TOF. J. Am. Soc. Mass Spectrom. 2002, 13, 784-791
CHAPTER V
66
CHAPTER V:
SHEWANELLA ONEIDENSIS MR-1: A DISSIMILATORY IRON-REDUCING BACTERIUM
Shewanella oneidensis MR-1, a gram-negative facultative aerobic bacterium, lives at oxic-anoxic interfaces in nature and is able to use a plasticity of terminal electron-acceptors. Remarkable is the reduction of metals and, therefore, the interest in this microorganism not only stems from its importance in geochemistry, but also from practical applications, such as bioremediation of contaminated environments. However, the genetic basis and regulation for these respiration processes in Shewanella remain vague, despite extensive research. In this chapter, we will discuss metal reduction by this microorganism. Furthermore, the results obtained by an expression profiling proteomic study using 2D-PAGE and mass spectrometry, in relation to ferric iron reduction, will be presented.
CHAPTER V PROTEOMICS OF S. ONEIDENSIS MR-1
67
1. INTRODUCTION Over 3.5 billion years ago, the first respiratory processes evolved in the reducing environment of early Earth, and would possibly have utilized either Fe(III) or S(0) as electron acceptors1. Although the ability of microorganisms to reduce ferric iron is already known since the beginning of the 20th century, the capacity to conserve energy to support growth via the oxidation of hydrogen or organic compounds was only discovered two decades ago. Since then, the interest in dissimilatory iron reduction has considerably increased. Shewanella oneidensis and Geobacter metallidurans were the first organisms explicitly shown to conserve energy for growth through the reduction of Fe(III)2-4. Since then, many species of Archea and Bacteria have been shown to be capable of growing with ferric iron as the sole electron acceptor. However, research has been mainly focused to a few bacteria, and for the moment, the best characterized Fe(III)-respiring bacteria are members of the genus Shewanella and Geobacter. The Shewanella is an interesting group of microorganisms and the great diversity of biological phenomena with which Shewanella is associated, is remarkable. For example, Shewanella species have been shown to be involved in metal-reduction5, dehalogenation of small halo-alkane compounds6,7, formation of biofilm8,9, corrosion phenomena10 and even isolated cases of infections11,12. Moreover, Shewanella oneidensis has been shown to have a rich repertoire of respiratory pathways leading to the reduction of over 20 electron-accepting compounds. This makes Shewanella oneidensis a model organism in studies of energy metabolism and of bioremediation and resulted in the foundation of a multiinstitutional consortium, the Shewanella Federation, funded by the U.S. Department of Energy13-15. The genome of Shewanella oneidensis has been sequenced, annotated16 and reannotated17, and the current estimate includes 4.467 predicted genes, 1.623 of which are annotated as hypothetical (36%)18,19. The availability of the genomic sequence makes large-scale analyses, such as proteomic and microarray technologies, feasible. Hence, we started a proteomic study of this remarkable species, with emphasis on metal reduction. The expression levels of proteins under different growth conditions were monitored by 2D-PAGE and the interesting spots identified by mass spectrometry. The results from this differential display study will be presented in this chapter but first, we give a brief biochemical and physiological overview of dissimilatory iron reduction.
2. SHEWANELLA ONEIDENSIS: A VERSATILE ORGANISM Members of the genus Shewanella are gram-negative facultative aerobic γ-proteobacteria. Shewanella contains diverse species occupying a wide range of habitats20,21 , including marine and freshwater sediments, the deep sea and oil brines. For example, Shewanella species have been isolated from Antarctic sea ice22, the Baltic Sea23 and the Amazon River24. The first Shewanella species, Achromobacter putrefaciens25, was isolated out of sour butter in 1931, and the name of the genus changed from Pseudomonas26 (1960), to Alteromonas27 (1977), into Shewanella28 (1985). Shewanella oneidensis MR-1, formerly known as Shewanella putrefaciens MR-129, was isolated from the Oneida Lake (USA)30 and found to be able to reduce iron and manganese31. To date, it is known that the strain MR-1 is able to “eat” and “breathe” many soluble or insoluble organic (fumarate, dimethylsulfoxide, trimethylamine-N-oxide and humic substances) and inorganic compounds (nitrate,
CHAPTER V PROTEOMICS OF S. ONEIDENSIS MR-1
68
nitrite, thiosulphate and sulphite)32, and therefore, plays an important role in geochemical processes33. In addition, a variety of toxic metals can be reduced, such as chromium34 and uranium35,36. The remarkable diverse respiratory capacities pitchfork S. oneidensis MR-1 into a metabolically versatile organism and a model organism for studying dissimilatory reduction. The directed or spontaneous activity in which microbiological processes are used to degrade or transform contaminants into less toxic or non-toxic forms is microbial bioremediation. S. oneidensis may be useful in bioremediation. The reduction from the dissolved liquid state of toxic metals into insoluble oxides by this organism, for example, can facilitate the removal of dilute metal pollutants in both contained-storage and natural sites. Additionally, S. oneidensis can produce sulphide from either elemental sulphur or thiosulphate37, which can be used to immobilize toxic metals through the formation of insoluble metal sulphides. However, it is important to consider that the activities of such metal-reducing bacteria can also have negative effects. Many organic pollutants are strongly bound to iron and manganese oxides, and when such oxides are reduced, the pollutants are solubilized. It is therefore essential to understand the biochemical pathways used for metal-reduction and for degradation of organic pollutants in this organism, before considering environmental bioremediation processes.
3. DISSIMILATORY Fe(III)-REDUCTION
3.1. INTRODUCTION
Iron, the most abundant transition metal on earth, can be found abundantly in soil and sediments or as trace element in aquatic habitats. While stable under anaerobic or acidic conditions, Fe(II) oxidizes chemically to Fe(III) under aerobic conditions, which readily react in moist environments to form hydroxide, oxide, phosphates or sulphate precipitates with very low solubility. Therefore, environments apparently rich in iron actually contain a limited concentration of free iron (<1µM). The availability of Fe(III) may be increased in environments rich in organic compounds, such as humic substances, which can chelate the metal ion. The chelator, e.g. citrate, may be specially synthesized by the microorganism, which makes the metal more accessible for reduction and/or cellular uptake38. A variety of microorganisms can reduce ferric iron (Fe3+) to the ferrous (Fe2+) state. The reduction potential of the Fe(III)/Fe(II) couple is very positive (E0'=0.77 V at pH 2, E0'= 0.2 V at pH 7), and because of this, Fe(III) reduction can be coupled to the oxidation of a wide variety of both organic and inorganic electron donors. Various organic compounds including aromatic compounds can be oxidized anaerobically by ferric iron reducers with electrons traveling through an electron transport chain. Such electron flow establishes a proton gradient that can be dissipated to generate ATP. The reduction process, which uses inorganic compounds as electron acceptor in the energy metabolism is called ‘dissimilative’ metabolism39.
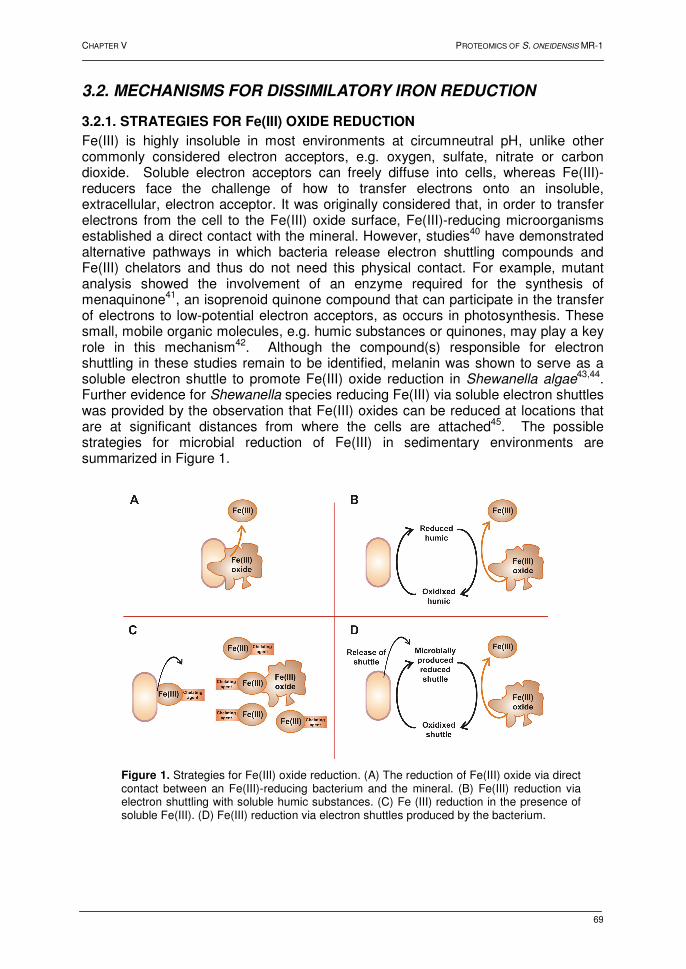
CHAPTER V PROTEOMICS OF S. ONEIDENSIS MR-1
69
3.2. MECHANISMS FOR DISSIMILATORY IRON REDUCTION
3.2.1. STRATEGIES FOR Fe(III) OXIDE REDUCTION
Fe(III) is highly insoluble in most environments at circumneutral pH, unlike other commonly considered electron acceptors, e.g. oxygen, sulfate, nitrate or carbon dioxide. Soluble electron acceptors can freely diffuse into cells, whereas Fe(III)-reducers face the challenge of how to transfer electrons onto an insoluble, extracellular, electron acceptor. It was originally considered that, in order to transfer electrons from the cell to the Fe(III) oxide surface, Fe(III)-reducing microorganisms established a direct contact with the mineral. However, studies40 have demonstrated alternative pathways in which bacteria release electron shuttling compounds and Fe(III) chelators and thus do not need this physical contact. For example, mutant analysis showed the involvement of an enzyme required for the synthesis of menaquinone41, an isoprenoid quinone compound that can participate in the transfer of electrons to low-potential electron acceptors, as occurs in photosynthesis. These small, mobile organic molecules, e.g. humic substances or quinones, may play a key role in this mechanism42. Although the compound(s) responsible for electron shuttling in these studies remain to be identified, melanin was shown to serve as a soluble electron shuttle to promote Fe(III) oxide reduction in Shewanella algae43,44. Further evidence for Shewanella species reducing Fe(III) via soluble electron shuttles was provided by the observation that Fe(III) oxides can be reduced at locations that are at significant distances from where the cells are attached45. The possible strategies for microbial reduction of Fe(III) in sedimentary environments are summarized in Figure 1.
Figure 1. Strategies for Fe(III) oxide reduction. (A) The reduction of Fe(III) oxide via direct contact between an Fe(III)-reducing bacterium and the mineral. (B) Fe(III) reduction via electron shuttling with soluble humic substances. (C) Fe (III) reduction in the presence of soluble Fe(III). (D) Fe(III) reduction via electron shuttles produced by the bacterium.
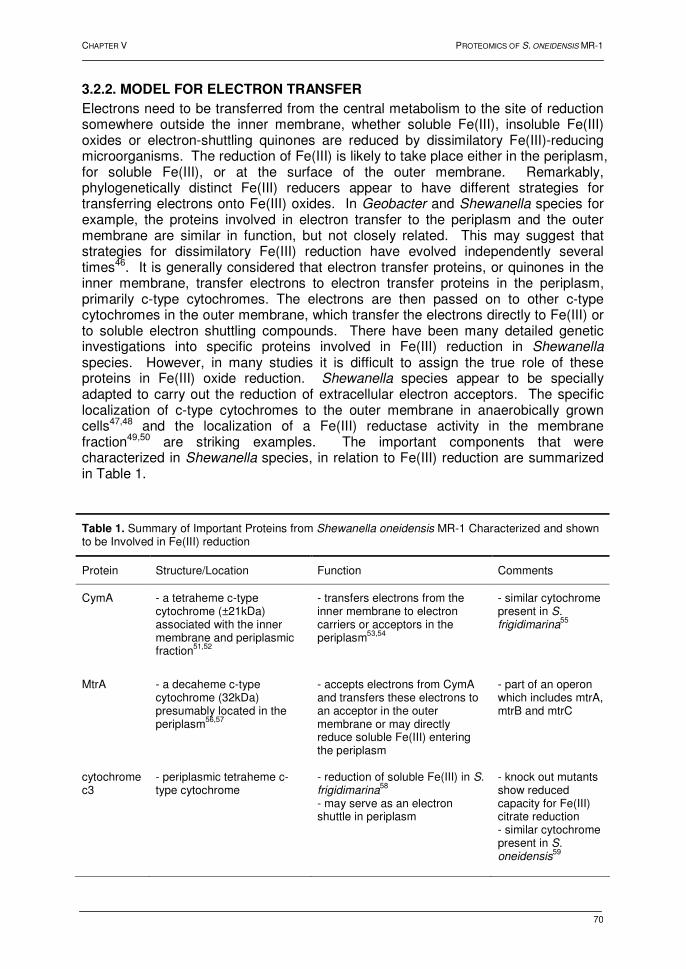
CHAPTER V PROTEOMICS OF S. ONEIDENSIS MR-1
70
3.2.2. MODEL FOR ELECTRON TRANSFER
Electrons need to be transferred from the central metabolism to the site of reduction somewhere outside the inner membrane, whether soluble Fe(III), insoluble Fe(III) oxides or electron-shuttling quinones are reduced by dissimilatory Fe(III)-reducing microorganisms. The reduction of Fe(III) is likely to take place either in the periplasm, for soluble Fe(III), or at the surface of the outer membrane. Remarkably, phylogenetically distinct Fe(III) reducers appear to have different strategies for transferring electrons onto Fe(III) oxides. In Geobacter and Shewanella species for example, the proteins involved in electron transfer to the periplasm and the outer membrane are similar in function, but not closely related. This may suggest that strategies for dissimilatory Fe(III) reduction have evolved independently several times46. It is generally considered that electron transfer proteins, or quinones in the inner membrane, transfer electrons to electron transfer proteins in the periplasm, primarily c-type cytochromes. The electrons are then passed on to other c-type cytochromes in the outer membrane, which transfer the electrons directly to Fe(III) or to soluble electron shuttling compounds. There have been many detailed genetic investigations into specific proteins involved in Fe(III) reduction in Shewanella species. However, in many studies it is difficult to assign the true role of these proteins in Fe(III) oxide reduction. Shewanella species appear to be specially adapted to carry out the reduction of extracellular electron acceptors. The specific localization of c-type cytochromes to the outer membrane in anaerobically grown cells47,48 and the localization of a Fe(III) reductase activity in the membrane fraction49,50 are striking examples. The important components that were characterized in Shewanella species, in relation to Fe(III) reduction are summarized in Table 1.
Table 1. Summary of Important Proteins from Shewanella oneidensis MR-1 Characterized and shown to be Involved in Fe(III) reduction
Protein Structure/Location Function Comments
CymA - a tetraheme c-type cytochrome (±21kDa) associated with the inner membrane and periplasmic fraction51,52
- transfers electrons from the inner membrane to electron carriers or acceptors in the periplasm53,54
- similar cytochrome present in S. frigidimarina
55
MtrA - a decaheme c-type cytochrome (32kDa) presumably located in the periplasm56,57
- accepts electrons from CymA and transfers these electrons to an acceptor in the outer membrane or may directly reduce soluble Fe(III) entering the periplasm
- part of an operon which includes mtrA, mtrB and mtrC
cytochrome c3
- periplasmic tetraheme c-type cytochrome
- reduction of soluble Fe(III) in S. frigidimarina
58 - may serve as an electron shuttle in periplasm
- knock out mutants show reduced capacity for Fe(III) citrate reduction - similar cytochrome present in S. oneidensis
59
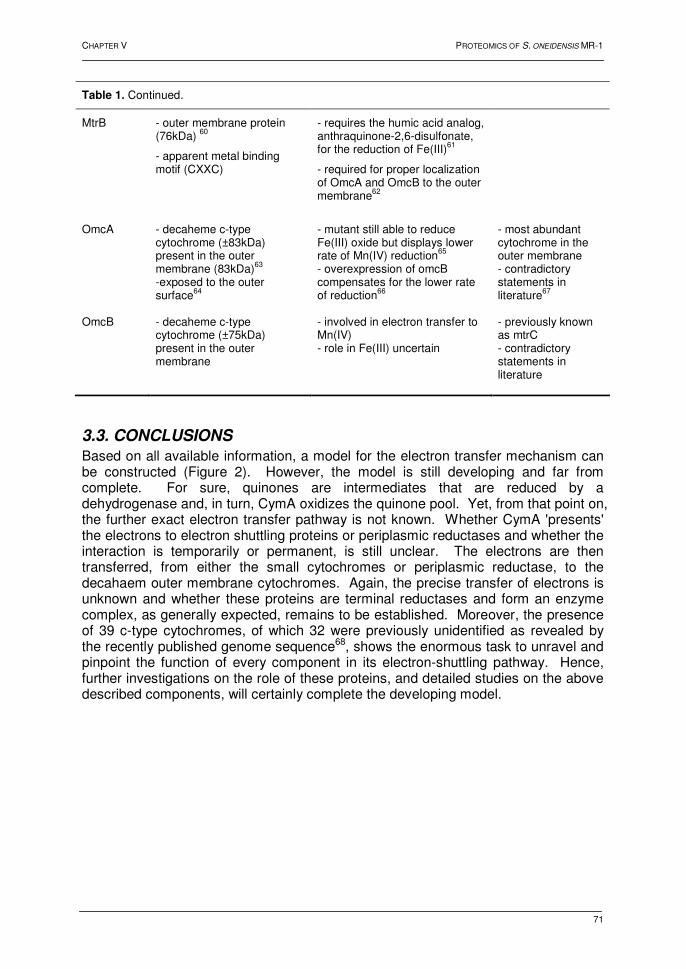
CHAPTER V PROTEOMICS OF S. ONEIDENSIS MR-1
71
Table 1. Continued.
MtrB - outer membrane protein (76kDa) 60
- apparent metal binding motif (CXXC)
- requires the humic acid analog, anthraquinone-2,6-disulfonate, for the reduction of Fe(III)61
- required for proper localization of OmcA and OmcB to the outer membrane62
OmcA - decaheme c-type cytochrome (±83kDa) present in the outer membrane (83kDa)63 -exposed to the outer surface64
- mutant still able to reduce Fe(III) oxide but displays lower rate of Mn(IV) reduction65 - overexpression of omcB compensates for the lower rate of reduction66
- most abundant cytochrome in the outer membrane - contradictory statements in literature67
OmcB - decaheme c-type cytochrome (±75kDa) present in the outer membrane
- involved in electron transfer to Mn(IV) - role in Fe(III) uncertain
- previously known as mtrC - contradictory statements in literature
3.3. CONCLUSIONS
Based on all available information, a model for the electron transfer mechanism can be constructed (Figure 2). However, the model is still developing and far from complete. For sure, quinones are intermediates that are reduced by a dehydrogenase and, in turn, CymA oxidizes the quinone pool. Yet, from that point on, the further exact electron transfer pathway is not known. Whether CymA 'presents' the electrons to electron shuttling proteins or periplasmic reductases and whether the interaction is temporarily or permanent, is still unclear. The electrons are then transferred, from either the small cytochromes or periplasmic reductase, to the decahaem outer membrane cytochromes. Again, the precise transfer of electrons is unknown and whether these proteins are terminal reductases and form an enzyme complex, as generally expected, remains to be established. Moreover, the presence of 39 c-type cytochromes, of which 32 were previously unidentified as revealed by the recently published genome sequence68, shows the enormous task to unravel and pinpoint the function of every component in its electron-shuttling pathway. Hence, further investigations on the role of these proteins, and detailed studies on the above described components, will certainly complete the developing model.
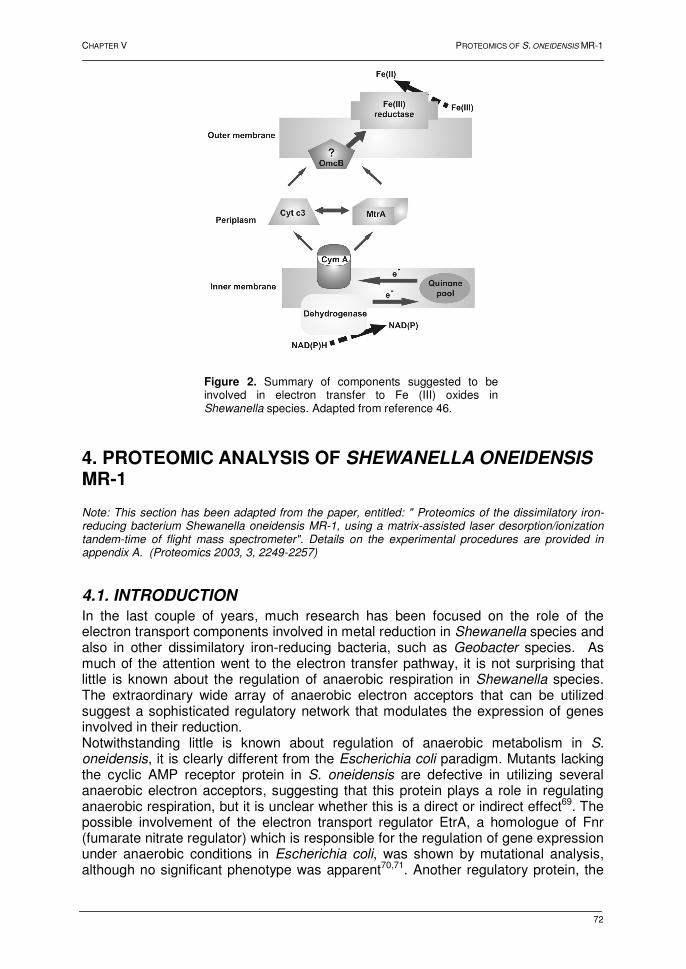
CHAPTER V PROTEOMICS OF S. ONEIDENSIS MR-1
72
4. PROTEOMIC ANALYSIS OF SHEWANELLA ONEIDENSIS MR-1 Note: This section has been adapted from the paper, entitled: " Proteomics of the dissimilatory iron-reducing bacterium Shewanella oneidensis MR-1, using a matrix-assisted laser desorption/ionization tandem-time of flight mass spectrometer". Details on the experimental procedures are provided in appendix A. (Proteomics 2003, 3, 2249-2257)
4.1. INTRODUCTION
In the last couple of years, much research has been focused on the role of the electron transport components involved in metal reduction in Shewanella species and also in other dissimilatory iron-reducing bacteria, such as Geobacter species. As much of the attention went to the electron transfer pathway, it is not surprising that little is known about the regulation of anaerobic respiration in Shewanella species. The extraordinary wide array of anaerobic electron acceptors that can be utilized suggest a sophisticated regulatory network that modulates the expression of genes involved in their reduction. Notwithstanding little is known about regulation of anaerobic metabolism in S. oneidensis, it is clearly different from the Escherichia coli paradigm. Mutants lacking the cyclic AMP receptor protein in S. oneidensis are defective in utilizing several anaerobic electron acceptors, suggesting that this protein plays a role in regulating anaerobic respiration, but it is unclear whether this is a direct or indirect effect69. The possible involvement of the electron transport regulator EtrA, a homologue of Fnr (fumarate nitrate regulator) which is responsible for the regulation of gene expression under anaerobic conditions in Escherichia coli, was shown by mutational analysis, although no significant phenotype was apparent70,71. Another regulatory protein, the
Figure 2. Summary of components suggested to be involved in electron transfer to Fe (III) oxides in Shewanella species. Adapted from reference 46.
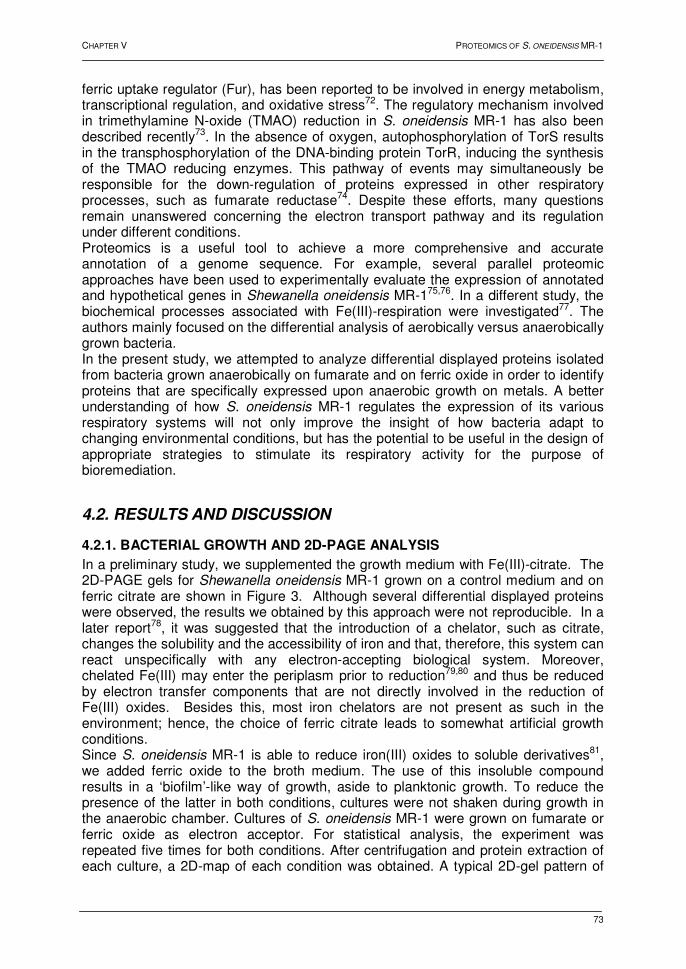
CHAPTER V PROTEOMICS OF S. ONEIDENSIS MR-1
73
ferric uptake regulator (Fur), has been reported to be involved in energy metabolism, transcriptional regulation, and oxidative stress72. The regulatory mechanism involved in trimethylamine N-oxide (TMAO) reduction in S. oneidensis MR-1 has also been described recently73. In the absence of oxygen, autophosphorylation of TorS results in the transphosphorylation of the DNA-binding protein TorR, inducing the synthesis of the TMAO reducing enzymes. This pathway of events may simultaneously be responsible for the down-regulation of proteins expressed in other respiratory processes, such as fumarate reductase74. Despite these efforts, many questions remain unanswered concerning the electron transport pathway and its regulation under different conditions. Proteomics is a useful tool to achieve a more comprehensive and accurate annotation of a genome sequence. For example, several parallel proteomic approaches have been used to experimentally evaluate the expression of annotated and hypothetical genes in Shewanella oneidensis MR-175,76. In a different study, the biochemical processes associated with Fe(III)-respiration were investigated77. The authors mainly focused on the differential analysis of aerobically versus anaerobically grown bacteria. In the present study, we attempted to analyze differential displayed proteins isolated from bacteria grown anaerobically on fumarate and on ferric oxide in order to identify proteins that are specifically expressed upon anaerobic growth on metals. A better understanding of how S. oneidensis MR-1 regulates the expression of its various respiratory systems will not only improve the insight of how bacteria adapt to changing environmental conditions, but has the potential to be useful in the design of appropriate strategies to stimulate its respiratory activity for the purpose of bioremediation.
4.2. RESULTS AND DISCUSSION
4.2.1. BACTERIAL GROWTH AND 2D-PAGE ANALYSIS
In a preliminary study, we supplemented the growth medium with Fe(III)-citrate. The 2D-PAGE gels for Shewanella oneidensis MR-1 grown on a control medium and on ferric citrate are shown in Figure 3. Although several differential displayed proteins were observed, the results we obtained by this approach were not reproducible. In a later report78, it was suggested that the introduction of a chelator, such as citrate, changes the solubility and the accessibility of iron and that, therefore, this system can react unspecifically with any electron-accepting biological system. Moreover, chelated Fe(III) may enter the periplasm prior to reduction79,80 and thus be reduced by electron transfer components that are not directly involved in the reduction of Fe(III) oxides. Besides this, most iron chelators are not present as such in the environment; hence, the choice of ferric citrate leads to somewhat artificial growth conditions. Since S. oneidensis MR-1 is able to reduce iron(III) oxides to soluble derivatives81, we added ferric oxide to the broth medium. The use of this insoluble compound results in a ‘biofilm’-like way of growth, aside to planktonic growth. To reduce the presence of the latter in both conditions, cultures were not shaken during growth in the anaerobic chamber. Cultures of S. oneidensis MR-1 were grown on fumarate or ferric oxide as electron acceptor. For statistical analysis, the experiment was repeated five times for both conditions. After centrifugation and protein extraction of each culture, a 2D-map of each condition was obtained. A typical 2D-gel pattern of
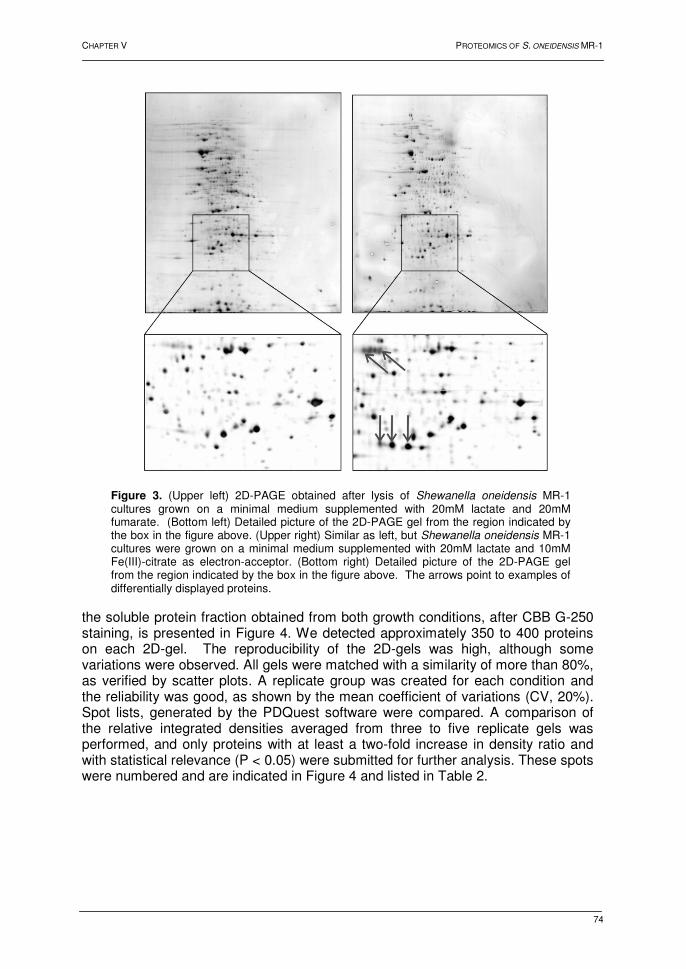
CHAPTER V PROTEOMICS OF S. ONEIDENSIS MR-1
74
the soluble protein fraction obtained from both growth conditions, after CBB G-250 staining, is presented in Figure 4. We detected approximately 350 to 400 proteins on each 2D-gel. The reproducibility of the 2D-gels was high, although some variations were observed. All gels were matched with a similarity of more than 80%, as verified by scatter plots. A replicate group was created for each condition and the reliability was good, as shown by the mean coefficient of variations (CV, 20%). Spot lists, generated by the PDQuest software were compared. A comparison of the relative integrated densities averaged from three to five replicate gels was performed, and only proteins with at least a two-fold increase in density ratio and with statistical relevance (P < 0.05) were submitted for further analysis. These spots were numbered and are indicated in Figure 4 and listed in Table 2.
Figure 3. (Upper left) 2D-PAGE obtained after lysis of Shewanella oneidensis MR-1 cultures grown on a minimal medium supplemented with 20mM lactate and 20mM fumarate. (Bottom left) Detailed picture of the 2D-PAGE gel from the region indicated by the box in the figure above. (Upper right) Similar as left, but Shewanella oneidensis MR-1 cultures were grown on a minimal medium supplemented with 20mM lactate and 10mM Fe(III)-citrate as electron-acceptor. (Bottom right) Detailed picture of the 2D-PAGE gel from the region indicated by the box in the figure above. The arrows point to examples of differentially displayed proteins.

CHAPTER V PROTEOMICS OF S. ONEIDENSIS MR-1
75
Table 2A. Proteins Displaying Significant Increased Abundance upon Growth on Fumarate compared to Growth on Fe2O3.
Spota Accession no.b Protein namec Mass (kDa)
pI
Density ratiod
1e 24371815 EF-Tu 43.3 5.20 6.58 2 24375418 Ribosomal Protein S6 15.0 5.34 3.88
3 24371820 Ribosomal Protein L10 17.7 9.35 3.71 4 24373064 Alcohol Dehydrogenase II 40.0 5.98 2.67
5 24372557 Fumarate Reductase 62.4 7.73 4.31
6 24372002 Thioredoxin 1 11.9 4.56 3.66 7 24376191 Conserved Hypothetical Protein 29.3 6.90 4.45
8 24373389 Conserved Hypothetical Protein 24.9 4.83 2.85 9 24373389 Conserved Hypothetical Protein 24.9 4.83 3.48
10 24375259 Conserved Hypothetical Protein 25.4 6.78 2.07
Table 2B. Proteins Displaying Significant Increased Abundance upon Growth on Fe203 compared to Growth on Fumarate.
Spota Accession no.b Protein namec Mass (kDa)
pI
Density ratiod
11 24375475 Aerobic Respiration Control Protein
27.2 5.66 2.80
12 24375475 Aerobic Respiration Control Protein
27.2 5.66 2.16
13 24376142 Enhancing Lycopene Biosynthesis
23.1 6.16 3.71
Figure 4. Coomassie G-250 stained 2D-PAGE gels of the soluble protein extract of cultures grown in: (A) LB medium and 20mM lactate and 20mM fumarate, or (B) LB medium supplemented with 20 mM lactate and 1.6 g/L Fe2O3. Protein spots displaying significant quantitative differences (P<0.05) are numbered.
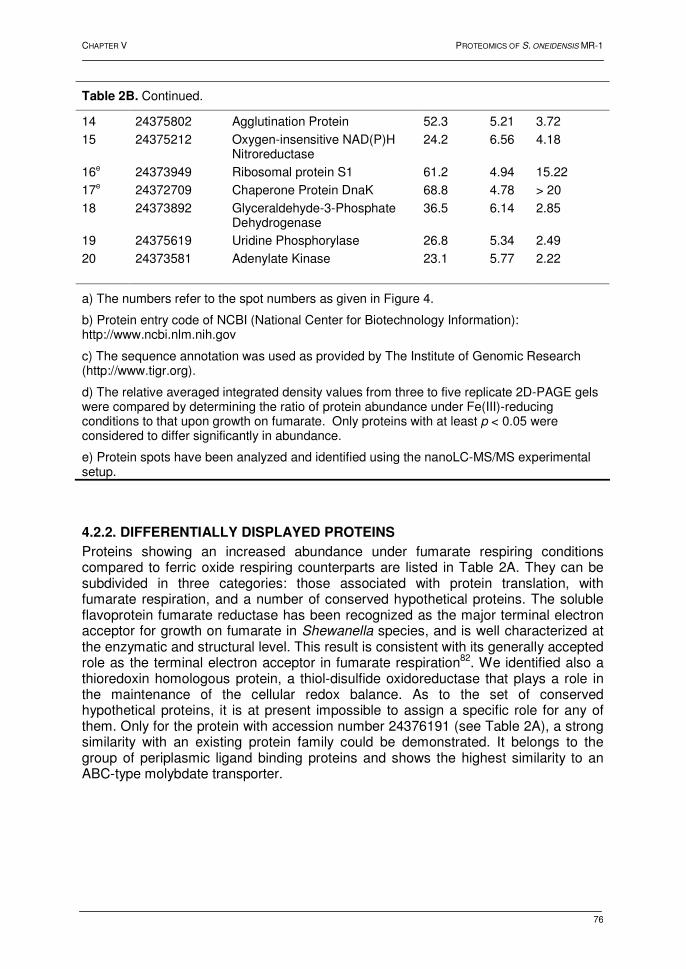
CHAPTER V PROTEOMICS OF S. ONEIDENSIS MR-1
76
Table 2B. Continued.
14 24375802 Agglutination Protein 52.3 5.21 3.72
15 24375212 Oxygen-insensitive NAD(P)H Nitroreductase
24.2 6.56 4.18
16e 24373949 Ribosomal protein S1 61.2 4.94 15.22
17e 24372709 Chaperone Protein DnaK 68.8 4.78 > 20
18 24373892 Glyceraldehyde-3-Phosphate Dehydrogenase
36.5 6.14 2.85
19 24375619 Uridine Phosphorylase 26.8 5.34 2.49
20 24373581 Adenylate Kinase 23.1 5.77 2.22
a) The numbers refer to the spot numbers as given in Figure 4.
b) Protein entry code of NCBI (National Center for Biotechnology Information): http://www.ncbi.nlm.nih.gov
c) The sequence annotation was used as provided by The Institute of Genomic Research (http://www.tigr.org).
d) The relative averaged integrated density values from three to five replicate 2D-PAGE gels were compared by determining the ratio of protein abundance under Fe(III)-reducing conditions to that upon growth on fumarate. Only proteins with at least p < 0.05 were considered to differ significantly in abundance.
e) Protein spots have been analyzed and identified using the nanoLC-MS/MS experimental setup.
4.2.2. DIFFERENTIALLY DISPLAYED PROTEINS
Proteins showing an increased abundance under fumarate respiring conditions compared to ferric oxide respiring counterparts are listed in Table 2A. They can be subdivided in three categories: those associated with protein translation, with fumarate respiration, and a number of conserved hypothetical proteins. The soluble flavoprotein fumarate reductase has been recognized as the major terminal electron acceptor for growth on fumarate in Shewanella species, and is well characterized at the enzymatic and structural level. This result is consistent with its generally accepted role as the terminal electron acceptor in fumarate respiration82. We identified also a thioredoxin homologous protein, a thiol-disulfide oxidoreductase that plays a role in the maintenance of the cellular redox balance. As to the set of conserved hypothetical proteins, it is at present impossible to assign a specific role for any of them. Only for the protein with accession number 24376191 (see Table 2A), a strong similarity with an existing protein family could be demonstrated. It belongs to the group of periplasmic ligand binding proteins and shows the highest similarity to an ABC-type molybdate transporter.
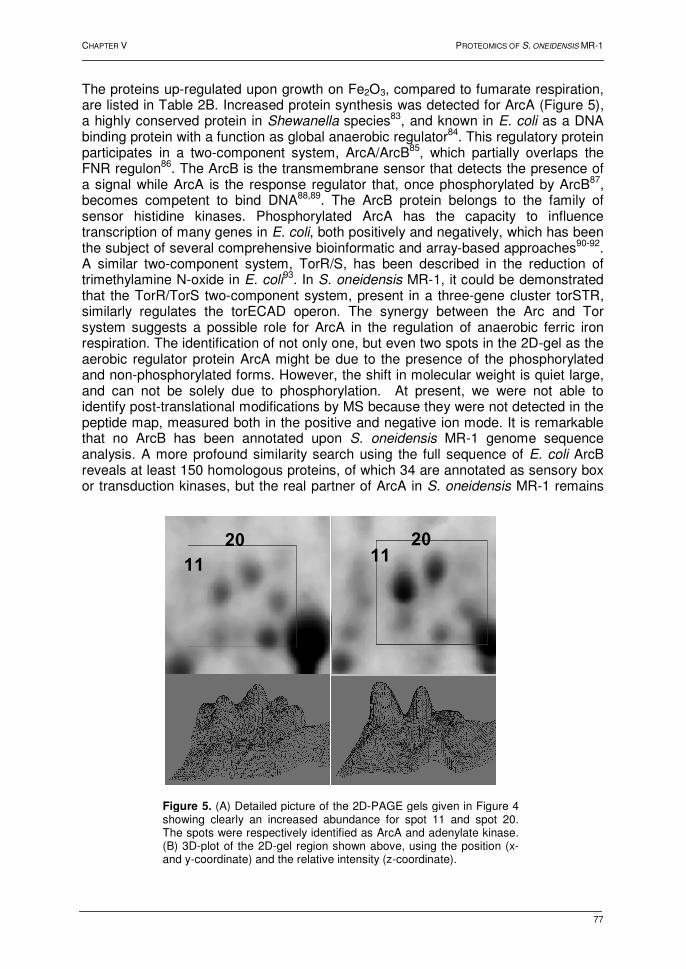
CHAPTER V PROTEOMICS OF S. ONEIDENSIS MR-1
77
The proteins up-regulated upon growth on Fe2O3, compared to fumarate respiration, are listed in Table 2B. Increased protein synthesis was detected for ArcA (Figure 5), a highly conserved protein in Shewanella species83, and known in E. coli as a DNA binding protein with a function as global anaerobic regulator84. This regulatory protein participates in a two-component system, ArcA/ArcB85, which partially overlaps the FNR regulon86. The ArcB is the transmembrane sensor that detects the presence of a signal while ArcA is the response regulator that, once phosphorylated by ArcB87, becomes competent to bind DNA88,89. The ArcB protein belongs to the family of sensor histidine kinases. Phosphorylated ArcA has the capacity to influence transcription of many genes in E. coli, both positively and negatively, which has been the subject of several comprehensive bioinformatic and array-based approaches90-92. A similar two-component system, TorR/S, has been described in the reduction of trimethylamine N-oxide in E. coli93. In S. oneidensis MR-1, it could be demonstrated that the TorR/TorS two-component system, present in a three-gene cluster torSTR, similarly regulates the torECAD operon. The synergy between the Arc and Tor system suggests a possible role for ArcA in the regulation of anaerobic ferric iron respiration. The identification of not only one, but even two spots in the 2D-gel as the aerobic regulator protein ArcA might be due to the presence of the phosphorylated and non-phosphorylated forms. However, the shift in molecular weight is quiet large, and can not be solely due to phosphorylation. At present, we were not able to identify post-translational modifications by MS because they were not detected in the peptide map, measured both in the positive and negative ion mode. It is remarkable that no ArcB has been annotated upon S. oneidensis MR-1 genome sequence analysis. A more profound similarity search using the full sequence of E. coli ArcB reveals at least 150 homologous proteins, of which 34 are annotated as sensory box or transduction kinases, but the real partner of ArcA in S. oneidensis MR-1 remains
Figure 5. (A) Detailed picture of the 2D-PAGE gels given in Figure 4 showing clearly an increased abundance for spot 11 and spot 20. The spots were respectively identified as ArcA and adenylate kinase. (B) 3D-plot of the 2D-gel region shown above, using the position (x-and y-coordinate) and the relative intensity (z-coordinate).
11
20 11 20
CHAPTER V PROTEOMICS OF S. ONEIDENSIS MR-1
78
to be verified experimentally. Genetic and molecular techniques were recently used for characterization of the Arc system in S. oneidensis94. The authors show that the locus, containing genes predicted to encode subunits of dimethyl sulfoxide reductase, is regulated by ArcA. They also identified a small protein, homologous to the histidine phosphotransfer domain of ArcB from E. coli, that is able to activate ArcA. However, this protein alone was unable to compensate for the lack of ArcB in E. coli, indicating that other proteins are required for the activation of ArcA. The authors conclude that the Arc system in S. oneidensis is similar to E. coli in that it uses a response regulator that is identical in function between the two organisms, but that the components involved in the activation of ArcA are different. The increased abundance of the enhancing lycopene biosynthesis protein is also noteworthy. A homologous protein of E. coli (55% identity and 69% similarity at the amino acid sequence level) has been shown to be involved in the early steps of isoprenoid biosynthesis95. An increase in quinone compounds might be a necessity upon growth on ferric oxide and, therefore, an increased protein production of an enhancing lycopene biosynthesis protein is a causative phenomenon. Isoprenoid quinones freely diffuse into membranes and serve as an electron shuttle in the respiratory chain. A previous report of a quinone-like molecule in S. oneidensis MR-1, having the function of an endogenous shuttle, hypothesizes an extracellular electron transfer mechanism during anaerobic ferric iron reduction96. Another remarkable identification is that of an agglutination protein. The protein already appeared in another differential analysis with respect to respiration, namely the study of the role of the ferric uptake regulator (Fur, an iron-responsive, transcriptional repressor) in the energy metabolism, using a knock-out mutant97. This suggested a possible involvement of this negative regulator in the production of the agglutination protein. Our finding of an increased protein synthesis for the agglutination protein points to a possible involvement in the reduction of ferric iron, and indeed indirectly suggests a role for Fur in dissimilative iron reduction. Another report demonstrates an increased protein synthesis of the agglutination protein under anaerobic versus aerobic circumstances98. However, no significant difference in abundance was detected with growth on fumarate and Fe(III)-citrate. This appears to be inconsistent with our results, but it should be stressed that we used an insoluble ferric substrate, which might be physiologically different from the citrate salt. The annotated biological function of the gene for the agglutination protein has not yet been verified experimentally and remains elusive. The protein is most closely related to a putative agglutination protein in Vibrio cholerae (40% identity and 61% similarity at the amino acid level) and to an agglutination protein in Pseudomonas putida (34% identity and 52% similarity at the amino acid level). The agglutination protein from P. putida is involved in the adherence of the bacterium to plant roots99. On the other hand, the agglutination protein from S. oneidensis MR-1 shows significant sequence similarity (Blast E-value = 4e-08) to the TolC domain of an outer membrane protein from the same organism. A protective role of TolC in the efflux of electron-shuttling molecules like anthraquinone-2,6-disulfonate, a humic substance analogue, has been previously reported100. Further research will be needed to investigate the nature of this protein and its specific role in dissimilatory iron-reducing bacteria.

CHAPTER V PROTEOMICS OF S. ONEIDENSIS MR-1
79
4.3. CONCLUSIONS
In addition to playing an important role in the natural cycle of carbon and metals, Fe(III)-reducing microorganisms appear to be useful tools for the bioremediation of contaminated environments. The understanding of the factors controlling the rate and extent of Fe(III) reduction in environments is currently rudimentary. In the present work, we investigated the proteins that are up-regulated upon growth of S. oneidensis MR-1 on ferric oxide, using a classical proteomic approach. Reproducible 2D-PAGE gels of soluble proteins from cells grown on fumarate and ferric oxide were obtained. It is important to note that the analysis was limited to a subset of the proteome of S. oneidensis MR-1, because only a small number of protein spots, approximately 400, were present on the 2D maps. For instance, not many proteins were visualized in the basic and acidic region of the 2D-PAGE gel. Proteins displaying altered protein production levels were successfully analyzed and identified by mass spectrometry. We detected an increased protein synthesis for the aerobic respiration control protein, known as a global transcriptional regulator in anaerobiosis in other species, growing S. oneidensis MR-1 on ferric oxide. The up-regulation of the enhancing lycopene biosynthesis protein and an agglutination protein are also apparent. The former protein is possibly involved in the synthesis of isoprenoid units, but the role of the latter remains obscure.
CHAPTER V PROTEOMICS OF S. ONEIDENSIS MR-1
80
5. REFERENCES 1 Vargas, M.; Kashefi, K.; Blunt-Harris, E.L. et al. Microbiological evidence for Fe(III) reduction on
early Earth. Nature 1998, 395, 65-67
2 Lovley, D.R.; Phillips, E.J.P.; Lonergan, D.J. Hydrogen and formate oxidation coupled to
dissimilatory reduction of iron or manganese by Alteromonas putrefaciens. Appl. Environ.
Microbiol. 1989, 55, 700-706
3 Lovley, D.R.; Stolz, J.F.; Nord, G.L. et al. Anaerobic production of magnetite by a dissimilatory
iron-reducing microorganism. Nature 1987, 330, 252-254
4 Myers, C.R.; Nealson, K.H. Bacterial manganese reduction and growth with manganese oxide as
the sole electron-acceptor. Science 1988, 240, 1319-1321
5 Nealson, K.H.; Little, B. Breathing manganese and iron: solid-state respiration. Adv. Applied
Microbiol. 1997, 45, 213-239
6 Collins, R.; Picardal, F. Enhanced anaerobic transformations of carbon tetrachloride by soil
organic matter. Environm. Toxicol. Chem. 1999, 18, 2703-2710
7 Ward, M.J.; Fu, Q.S.; Rhoads, K.R. et al. A derivative of the menaquinone precursor 1,4-
dihydroxy-2-naphthoate is involved in the reductive transformation of carbon tetrachloride by
aerobically grown Shewanella oneidensis MR-1. Appl. Microbiol. Biotechnol. 2004, 63, 571-577
8 Bagge, D.; Hjelm, M.; Johanson, C. et al. Shewanella putrefaciens adhesion and biofilm formation
on food processing surfaces. Appl. Environ. Microbiol. 2001, 67, 2319-2325
9 Little, B.; Wagner, P.; Hart, K. et al. The role of biomineralization in microbiologically influenced
corrosion. Biodegradation 1998, 9, 1-10
10 Potekhina, J.S.; Sherisheva, N.G.; Povetkina, L.P. et al. Role of microorganisms in corrosion
inhibition of metals in aquatic habitats. Appl. Microbiol. Biotechnol. 1999, 52, 639-646
11 Khashe, S.; Janda, J.M. Biochemical and pathogenic properties of Shewanella alga and
Shewanella putrefaciens. J. Clin. Microbiol. 1998, 36, 783-787
12 Chen, Y.S.; Liu, Y.; Yen, M. et al. Skin and soft-tissue manifestations of Shewanella putrefaciens
infection. Clin. Infect. Dis. 1997, 25, 225-229
13 Frazier, M.E.; Johnson, G.M.; Thomassen, D.G. et al. Realizing the potential of the genome
revolution: The Genomes to Life program. Science 2003, 300, 290-293
14 http://doegenomestolife.org
15 http://www.shewanella.org
16 Heidelberg, J.F.; Paulsen, I.T.; Nelson, K.E. et al. Genome sequence of the dissimilatory metal
ion-reducing bacterium Shewanella oneidensis. Nat. Biotech. 2002, 20, 1118-1123
17 Daraselia, N.; Dernovoy, D.; Tian, Y. et al. Reannotation of Shewanella oneidensis genome.
OMICS 2003, 7, 171-175
18 Serres, M.H.; Riley, M. Structural domains, protein modules, and sequence similarities enrich our
understanding of the Shewanella oneidensis MR-1 proteome. OMICS 2004, 8, 306-321
19 Kolker, E.; Picone, A.F.; Galperin, M.Y. et al. Global profiling of Shewanella oneidensis MR-1:
expression of hypothetical genes and improved functional annotations. Proc. Natl. Acad. Sci. USA
2005, 102, 2099-2104
20 Kato, C.; Li, L.; Nogi, Y. Extremely barophilic bacteria isolated from the Mariana Trench,
Challenger Deep, at a depth of 11.000 meters. Appl. Environ. Microbiol. 1998, 64, 1510-1513
21 Bowman, J.P.; McCammon, S.A.; Brown, M.V. et al. Diversity and association of psychrophilic
bacteria in Antarctic sea ice. Appl. Environ. Microbiol. 1997, 63, 3068-3078
22 Bowman, J.P.; McCammon, S.A.; Nichols, D.S. et al. Shewanella gelidimarina sp. nov. and
Shewanella frigidimarina sp. nov., novel Antarctic species with the ability to produce
CHAPTER V PROTEOMICS OF S. ONEIDENSIS MR-1
81
eicosapentaenoic acid (20:5 omega 3) and grow anaerobically by dissimilatory Fe(III) reduction.
Int. J. Syst. Bacteriol. 1997, 47, 1040-1047
23 Brettar, I.; Moore, E.R.; Hofle, M.G. Phylogeny and abundance of novel denitrifying bacteria
isolated from the water column of the Central Baltic Sea. Microb. Ecol. 2001, 42, 295-305
24 Venkateswaran, K.; Dollhopf, M.E.; Aller, R. et al. Shewanella amazonensis sp. nov., a novel
metal-reducing facultative anaerobe from Amazonian shelf muds. Int. J. Syst. Bacteriol. 1998, 48,
965-972
25 Derby, H.A.; Hammer, B.W. Bacteriology of butter. Bacteriological studies of surface taint butter.
Iowa Agric. Exp. Stn. Res. Bul. 1931, 145, 387-416
26 Shewan, J.M. The bacteriology of fresh and spoiling fish and the biochemical changes induced by
bacterial action. Proceedings of the conference on handling, processing and marketing of tropical
fish. Tropical Products Institute, London 1977, pp. 51-66
27 Lee, J.V.; Gibson, D.M.; Shewan, J.M. A numerical taxonomy study of some Pseudomonas-like
marine bacteria. J. Gen. Microbiol. 1977, 98, 439-451
28 MacDonell, M.T.; Colwell, R.R. Phylogeny of the Vibrionaceae and recommendation for two new
genera, Listonella and Shewanella. Syst. Appl. Microbiol. 1985, 6, 171-182
29 Venkateswaren, K.; Moser, D.P.; Dollhopf, M.E. et al. Polyphasic taxonomy of the genus
Shewanella and description of Shewanella oneidensis sp.nov. Int. J. Syst. Bacteriol. 1999, 49,
705-724
30 Myers, C.R.; Nealson, K.H. Bacterial manganese reduction and growth with manganese oxide as
the sole electron-acceptor. Science 1988, 240, 1319-1321
31 Myers, C.R.; Nealson, K.H. Microbial reduction of manganese oxides - Interactions with iron and
sulfur. Geochim. Cosmochim. Ac. 1988, 52, 2727-2732
32 Nealson, K.H.; Saffarini, D. Iron and manganese in anaerobic respiration: environmental,
significance, physiology, and regulation. Annu. Rev. Microbiol. 1994, 48, 311-343
33 Nealson, K.H.; Belz, A.; McKee, B. Breathing metals as a way of life: geobiology in action. Antonie
van Leeuwenhoek 2002, 81, 215-222
34 Myers, C.R.; Carstens, B.P.; Antholine, W.E.; et al. Chromium(VI) reductase activity is associated
with the cytoplasmic membrane of anaerobically grown Shewanella putrefaciens MR-1. Appl.
Microbiol. 2000, 88, 98-106
35 Abdelouas, A.; Lu, Y.M.; Lutze, W. et al. Reduction of U(VI) to U(IV) by indigenous bacteria in
contaminated ground water. J. Contam. Hydrol. 1998, 35, 217-233
36 Nealson, K.H.; Scott, J. Ecophysiology of the genus Shewanella. (2003) In: Prokaryotes, Vol. 2004,
Edited by Dworkin, M., New York, Springer-Verlag
37 Blakeney, M.D.; Moulaei, T.; DiChristina, T.J. Fe(III)-reduction activity and cytochrome content of
Shewanella putrefaciens grown on ten compounds as sole terminal electron acceptor. Microbiol.
Res. 2000, 155, 87-94
38 Guerinot, M.L. Microbial iron transport. Annu. Rev. Microbiol. 1994, 48, 743-772
39 Madigan, M.T.; Martinko, J.M.; Parker, J. Brock Biology of microorganisms. Prentice Hall
International, 1997, pp. 501-502
40 Nevin, K.P.; Lovley, D.R. Mechanisms for Fe(III) oxide reduction in sedimentary environments. J.
Geomicrobiol. 2002, 19, 141-159
41 Newman, D.K.; Kolter, R. A role for excreted quinones in extracellular electron transfer. Nature
2000, 405, 94-97
42 Hernandez, M.E.; Newman, D.K. Extracellular electron transfer. Cell. Mol. Life Sci. 2001, 58,
1562-1571

CHAPTER V PROTEOMICS OF S. ONEIDENSIS MR-1
82
43 Turick, C.E.; Tisa, L.S.; Caccavo, F. Melanin production and use as a soluble electron shuttle for
Fe(III) oxide reduction and as a terminal electron acceptor by Shewanella algae BrY. Appl.
Environ. Microbiol. 2002, 68, 2436-2444
44 Turick, C.E.; Caccavo, F.; Tisa, L.S. Electron transfer from Shewanella algae BrY to hydrous ferric
oxide is mediated by cell-associated melanin. FEMS Microbiol. Lett. 2003, 220, 99-104
45 Rosso, K.M.; Zachara, J.M.; Fredrickson, J.K. et al. Nonlocal bacterial electron transfer to
hematite surfaces. Geochem. Cosmochim. Acta 2003, 67, 1081-1087
46 Lovley, D.R.; Holmes, D.E.; Nevin, K.P. Dissimilatory Fe(III) and Mn(IV) reduction. Adv. Microbiol.
Physiol. 2004, 49, 219-286
47 Myers, C.R.; Myers, J.M. Localization of cytochromes to the outer membrane of anaerobically
grown Shewanella putrefaciens MR-1. J. Bacteriol. 1992, 174, 3429-3438
48 Myers, C.R.; Myers, J.M. Outer membrane cytochromes of Shewanella putrefaciens MR-1:
spectral analysis and purification of the 83-kDa c-type cytochrome. Biochim. Biophys. Acta 1997,
1326, 307-318
49 Myers, C.R.; Myers, J.M. Ferric reductase is associated with the membranes of anaerobically
grown Shewanella putrefaciens MR-1. FEMS Microbiol. Lett. 1993, 108, 15-22
50 Dobbin, P.S.; Powell, A.K.; McEwan, A.G. et al. The influence of chelating agents upon the
dissimilatory reduction of Fe(III) by Shewanella putrefaciens. BioMetals 1995, 8, 163-173
51 Myers, C.R.; Myers, J.M. Cloning and sequencing of cymA, a gene encoding a tetraheme
cytochrome c required for reduction of iron(III), fumarate, and nitrate by Shewanella putrefaciens
strain MR-1. J. Bacteriol. 1997, 179, 1143-1152
52 Myers, J.M.; Myers, C.R. Role of the tetraheme cytochrome CymA in anaerobic electron transport
in cells of Shewanella putrefaciens MR-1 with normal levels of menaquinone. J. Bacteriol. 2000,
182, 67-75
53 Myers, C.R.; Myers, J.M. Role of menaquinone in the reduction of fumarate, iron(III) and
manganese(IV) by Shewanella putrefaciens MR-1. FEMS Microbiol. Lett. 1993, 114, 215-222
54 Schwalb, C.; Chapman, S.K.; Reid, G.A. The tetraheme cytochrome CymA is required for
anaerobic respiration with dimethyl sulfoxide and nitrite in Shewanella oneidensis. Biochemistry
2003, 42, 9491-9497
55 Field, S.J.; Dobbin, P.S.; Cheesmand, M.R. et al. Purification and magneto-optical spectroscopic
characterization of cytoplasmic membrane and outer membrane multiheme c-type cytochromes
from Shewanella frigidimarina NCIMB 400. J. Biol. Chem. 2000, 275, 8515-8522
56 Beliaev, A.S.; Saffarini, D.A.; McLaughlin, J.L. et al. MtrC, an outer membrane decahaem c
cytochrome required for metal reduction in Shewanella putrefaciens MR-1. Mol. Microbiol. 2001,
39, 722-730
57 Pitts, K.E.; Dobbin, P.S.; Reyes-Ramirez, F. et al. Characterization of the Shewanella oneidensis
MR-1 decaheme cytochrome MtrA. J. Biol. Chem. 2003, 278, 27758-27765
58 Gordon, E.H.; Pike, A.D.; Hil, A.E. et al. Isolation and characterization of a novel cytochrome c3
from Shewanella frigidimarina that is involved in Fe(III) respiration. Biochem. J. 2000, 349, 153-
158
59 Leys, D.; Meyer, T.E.; Tsapin, A.S. et al. Crystal structures at atomic resolution reveal the novel
concept of "electron-harvesting" as a role for the small tetraheme cytrochome c. J. Biol. Chem.
2002, 277, 35703-35711
60 Beliaev, A.S.; Saffarini, D.A. Shewanella putrefaciens mtrB encodes an outer membrane protein
required for Fe(III) and Mn(IV) reduction. J. Bacteriol. 1998, 180, 6292-6297

CHAPTER V PROTEOMICS OF S. ONEIDENSIS MR-1
83
61 Shyu, J.B.H.; Lies, D.P.; Newman, D.K. Protective role of tolC in efflux of the electron shuttle
anthraquinone-2,6-disulfonate. J. Bacteriol. 2002, 184, 1806-1810
62 Myers, C.R.; Myers, J.M. MrtB is required for proper incorporation of the cytochromes OmcA and
OmcB in the outer membrane of Shewanella putrefaciens MR-1. Appl. Environ. Microbiol. 2002,
68, 5585-5594
63 Myers, J.M.; Myers, C.R. Isolation and sequence of omcA, a gene encoding a decaheme outer
membrane cytochrome c of Shewanella putrefaciens MR-1, and detection of omcA homologs in
other strains of S. putrefaciens. Biochim. Biophys. Acta 1998, 1373, 237-251
64 Myers, C.R.; Myers, J.M. Cell surface exposure of the outer membrane cytochromes of
Shewanella oneidensis MR-1. Lett. Appl. Microbiol. 2003, 37, 254-258
65 Myers, J.M.; Myers, C.R. Role for outer membrane cytochromes OmcA and OmcB of Shewanella
putrefaciens MR-1 in reduction of manganese dioxide. Appl. Environ. Microbiol. 2001, 67, 260-269
66 Myers, J.M.; Myers, C.R. Overlapping role of the outer membrane cytochromes of Shewanella
oneidensis MR-1 in the reduction of manganese(IV) oxide. Lett. Appl. Microbiol. 2003, 37, 21-25
67 Beliaev, A.S.; Saffarini, D.A.; McLaughlin, J.L. et al. MtrC, an outer membrane decahaem c
cytochrome required for metal reduction in Shewanella putrefaciens MR-1. Mol. Microbiol. 2001,
39, 722-730
68 Heidelberg, J.F.; Paulsen, I.T.; Nelson, K.E. et al. Genome sequence of the dissimilatory metal
ion-reducing bacterium Shewanella oneidensis. Nat. Biotech. 2002, 20, 1118-1123
69 Saffarini, D.A., Schultz, R.; Beliaev, A. Involvement of cyclic AMP (cAMP) and cAMP receptor
protein in anaerobic respiration of Shewanella oneidensis. J. Bacteriol. 2003, 185, 3668–3671
70 Maier, T.M.; Myers, C.R. Isolation and characterization of a Shewanella putrefaciens MR-1
electron transport regulator etrA mutant: reassessment of the role of EtrA. J. Bacteriol. 2001, 183,
4918-4926
71 Beliaev, A.; Thompson, D.; Fields, M. et al. Microarray transcription profiling of a Shewanella
oneidensis etrA mutant. J. Bacteriol. 2002, 184, 4612-4616
72 Thompson, D.K.; Beliaev, A.S.; Giometti, C.S. et al. Transcriptional and proteomic analysis of a
ferric uptake regulator (fur) mutant of Shewanella oneidensis: Possible involvement of fur in
energy metabolism, transcriptional regulation, and oxidative stress. Appl. Environ. Microbiol. 2002,
68, 881-892
73 Gon, S.; Patte, J.; Dos Santos, J. et al. Reconstitution of the trimethylamine oxide reductase
regulatory elements of Shewanella oneidensis in Escherichia coli. J. Bacteriol. 2002, 184, 1262-
1269
74 Gordon, E.; Pealing, S.; Chapman, S. et al. Physiological function and regulation of
flavocytochrome c(3), the soluble fumarate reductase from Shewanella putrefaciens NCIMB 400.
Microbiology 1998, 144, 937-945
75 VerBerkmoes, N.C.; Bundy, J.L.; Hauser, L. et al. Integrating "Top-down" and "Bottom-up" mass
spectrometric approaches for proteomic analysis of Shewanella oneidensis. J. Prot. Research
2002, 1, 239-252
76 Kolker, E.; Picone, A.F.; Galperin, M.Y. et al. Global profiling of Shewanella oneidensis MR-1:
expression of hypothetical genes and improved functional annotations. Proc. Natl. Acad. Sci. USA
2005, 102, 2099-2104
77 Beliaev, A.S.; Thompson, D.K.; Khare, T. et al. Gene and protein expression profiles of
Shewanella oneidensis during anaerobic growth with different electron acceptors. OMICS 2002, 6,
39-60
CHAPTER V PROTEOMICS OF S. ONEIDENSIS MR-1
84
78 Straub, K.L.; Benz, M.; Schink, B. Iron metabolism in anoxic environments at near neutral pH.
FEMS Microbiol. Ecol. 2001, 34, 181-186
79 Dobbin, P.S.; Powell, A.K.; McEwan, A.G. et al. The influence of chelating agents upon the
dissimilatory reduction of Fe(III) by Shewanella putrefaciens. BioMetals 1995, 8, 163-173
80 Dobbin, P.S.; Burmeister, L.M.R.; Heath, S.L. et al. The influence of chelating agents upon the
dissimilatory reduction of Fe(III) by Shewanella putrefaciens. Part 2. Oxo-and hydroxo-bridged
polynuclear Fe(III) complexes. BioMetals 1996, 9, 291-301
81 Kostka, J.E.; Nealson, K.H. Dissolution and reduction of magnetite by bacteria. Environ. Sci.
Technol. 1995, 29, 2535-2540
82 Tsapin, A.I.; Vandenberghe, I.; Nealson, K.H. et al. Identification of a small tetraheme cytochrome
c and a flavocytochrome c as two of the principal soluble cytochromes c in Shewanella oneidensis
strain MR1. Appl. Environ. Microbiol. 2001, 67, 3236-3244
83 Murray, A.E.; Lies, D.; Nealson, K. et al. DNA/DNA hybridization to microarrays reveals gene-
specific differences between closely related microbial genomes. Proc. Natl. Acad. Sci. USA 2001,
98, 9853-9858
84 Luchi, S.; Lin, E.C. ArcA (dye), a global regulatory gene in Escherichia coli mediating repression of
enzymes in aerobic pathways. Proc. Natl. Acad. Sci. USA 1988, 85, 1888–1892
85 Georgellis, D.; Kwon, O.; Lin, E.C.C. Quinones as the redox signal for the Arc two-component
system of bacteria. Science 2001, 292, 2314-2316
86 Liu, X.; De Wulf, P. Probing the ArcA-P modulon of Escherichia coli by whole genome
transcriptional analysis and sequence recognition profiling. J. Biol. Chem. 2004, 279, 12588–
12597
87 Kwon, O.; Georgellis, D.; Lin, E.C. Phosphorelay as the sole physiological route of signal
transmission by the arc two-component system of Escherichia coli. J. Bacteriol. 2000, 182, 3858–
3862
88 Lynch, A.S.; Lin, E.C. Responses to molecular oxygen. In Escherichia coli and Salmonella:
Cellular and Molecular Biology. Edited by: Neidhardt, F.C.; Curtiss, R.; Ingraham, J.L.; Lin, E.C.C.;
Low, K.B.; Magasanik, B.; et al., Washington, DC: American Society for Microbiology 1996, pp.
1526–1538
89 Lynch, A.S.; Lin, E.C. Transcriptional control mediated by the ArcA two-component response
regulator protein of Escherichia coli: characterization of DNA binding at target promoters. J.
Bacteriol. 1996, 178, 6238–6249
90 Lynch, A.S.; Lin, E.C. Transcriptional control mediated by the ArcA two-component response
regulator protein of Escherichia coli: characterization of DNA binding at target promoters. J.
Bacteriol. 1996, 178, 6238–6249
91 Liu, X.; De Wulf, P. Probing the ArcA-P modulon of Escherichia coli by whole genome
transcriptional analysis and sequence recognition profiling. J. Biol. Chem. 2004, 279, 12588–
12597
92 McGuire, A.M.; Wulf, P.D.; Church, G.M. et al. A weight matrix for binding recognition by the redox
response regulator ArcA-P of Escherichia coli. Mol. Microbiol. 1999, 32, 217–221
93 Jourlin, C.; Bengrine, A.; Chippaux, M. et al. An unorthodox sensor protein (TorS) mediates the
induction of the tor structural genes in response to trimethylamine N-oxide in Escherichia coli. Mol.
Microbiol. 1996, 20, 1297-1306
94 Gralnick, J.A.; Brown, C.T.; Newman, D.K. Anaerobic regulation by an atypical Arc system in
Shewanella oneidensis. Mol. Microbiol. 2005, 56, 1347-1357

CHAPTER V PROTEOMICS OF S. ONEIDENSIS MR-1
85
95 Hemmi, H.; Ohnuma, S.; Nagaoka, K. et al. Identification of genes affecting lycopene formation in
Escherichia coli transformed with carotenoid biosynthetic genes: Candidates for early genes in
isoprenoid biosynthesis. J. Biochem. 1998, 123, 1088-1096
96 Hernandez, M.E.; Newman, D.K. Extracellular electron transfer. Cell. Mol. Life Sci. 2001, 58,
1562-1571
97 Thompson, D.K.; Beliaev, A.S.; Giometti, C.S. et al. Transcriptional and proteomic analysis of a
ferric uptake regulator (fur) mutant of Shewanella oneidensis: Possible involvement of fur in
energy metabolism, transcriptional regulation, and oxidative stress. Appl. Environ. Microbiol. 2002,
68, 881-892
98 Beliaev, A.S.; Thompson, D.K.; Khare, T. et al. Gene and protein expression profiles of
Shewanella oneidensis during anaerobic growth with different electron acceptors. OMICS 2002, 6,
39-60
99 Buell, C.; Anderson, A. Genetic analysis of the AggA locus involved in agglutination and
adherence of Pseudomonas putida, a beneficial fluorescent Pseudomonad. Mol. Plant Microbe
Interact. 1992, 5, 154-162
100 Shyu, J.B.; Lies, D.P.; Newman, D.K. Protective role of tolC in efflux of the electron shuttle
anthraquinone-2,6-disulfonate. J. Bacteriol. 2002, 184, 1806-1810

CHAPTER VI
86
CHAPTER VI
HEAT SHOCK RESPONSE IN BARLEY SHOOTS
The analysis of stress-responsiveness in plants is an important route to the discovery of genes conferring stress tolerance and their use in breeding programs. High temperature is one of the environmental stress factors that can affect growth and quality characteristics of plants. We applied a differential display proteomic analysis to one of the most important crops in the world, barley, which is used in the malting industry and as feeding stuff. The effect of heat shock on the protein pattern of stress-tolerant and stress-susceptible cultivars was investigated by 2D-PAGE and the proteins spots were identified by mass spectrometry. The results will be outlined in this chapter. Note: This chapter has been adapted from a paper, entitled: "Proteomic analysis of small heat shock protein isoforms in barley shoots". Details on the experimental procedures are provided in Appendix B. (Phytochemistry 2004, 65, 1853-1863)
CHAPTER VI HEAT SHOCK RESPONSE IN BARLEY SHOOTS
87
1. INTRODUCTION Any living organism has to cope with conditions of stress. Specifically for plants, the possibilities to escape from stress are limited because plants are immobile1. In general, a typical response to environmental stress conditions is established by the induction of a set of stress proteins that protects the organism from cellular damage. The yield and quality of cereals are severely affected by heat stress in many countries2. Therefore, understanding the effect of high temperature on barley (Hordeum vulgare) is an important issue for the improvement of the quality of these crops in temperate and warm countries. In plants, a heat shock response is a ubiquitous phenomenon resulting in altered gene expression and protein translation. Most of the proteins produced are heat shock proteins (HSPs)3. The HSPs have either high (80-100 kDa, HMW HSPs), intermediate (68-73 kDa IMW- HSPs), or small molecular masses (15-20 kDa, sHSPs). The latter are classified as gene products of six gene families based on DNA sequence similarity, immunological cross-reactivity and intracellular localization4-6. The evolutionary conservation of HSPs has suggested that these proteins are involved in fundamental cellular functions. HSPs are associated with protein folding, protein translocation across membranes, assembly of oligomeric proteins, modulation of receptor activities, mRNA protection, prevention of enzyme- especially photosynthesizing- denaturation and their stress- induced aggregation, and with post-stress ubiquitin and chaperonin-aided repair. Based on these functions, HSPs have been termed ‘molecular chaperones’7,8. Apart from being synthesized as heat shock protein, HSPs are also accumulated in plants in response to a large number of other stress factors such as arsenite, ethanol, heavy metals, water stress, light, hormones, abscisic acid, wounding, excess NaCl, chilling, and anoxic conditions9-12. Proteomics is a very elegant approach for the understanding of cellular processes. This tool provides more fundamental insights into organism development and homeostatic control than provided by the genome sequence13. In a standard approach, two techniques, two-dimensional polyacrylamide gel electrophoresis (2D-PAGE) and mass spectrometry are combined. Electrophoresis is still the preferred separation technique of many researchers in a global, comparative analysis of proteins. In fact, the 2D-PAGE technique was established early on for barley14-16. In a differential analysis setup, this method provides powerful insights into the stress-responsiveness of genes17. Mass spectrometry, implementing fingerprinting and partial sequencing is the method of choice for the identification of differentially displayed proteins. The mass spectrometric identification of proteins strongly relies on the presence of sequence information in the databases. This is clearly a limitation for barley, for which the genome has not yet been sequenced. However, a large, publicly available expressed sequence tag (EST) database, which comprises 2028018 sequences to date, together with the genome sequence information of closely related organisms, such as rice (Oryza sativa), mainly circumvents this drawback. Several plant species, including barley, have already been investigated by a proteomic approach18-20. In these proteome studies, several authors mainly focused either on a more descriptive overview of occurring proteins21,22 or they investigated the changes in protein synthesis during seed development23. In other plant species, like wheat (Triticum aestivum), proteomics has already been applied to study the

CHAPTER VI HEAT SHOCK RESPONSE IN BARLEY SHOOTS
88
effects of heat shock at the protein expression level during grain filling24. These authors made a comparison between two cultivars (heat-susceptible and heat-tolerant), the analysis revealing differential expression of several sHSPs. In the present study, we investigated the influence of short-term (2 hours) heat stress on the protein expression levels of barley. We used a heat-tolerant and a heat-susceptible cultivar and attempted to analyze the differentially displayed proteins after shock treatment of both cultivars, in order to identify proteins responsible for heat tolerance. Such proteins are thought to be potential markers for heat tolerance of barley cultivars in breeding programs.
2. RESULTS AND DISCUSSION
2.1. 2D-GEL ELECTROPHORESIS AND IMAGE ANALYSIS
The composition of the soluble protein fraction of an abiotic stress-tolerant (Mandolina) and an abiotic stress-susceptible (Jubilant) cultivar, grown under different temperature conditions, was compared. Four barley batches of 25 seedlings of the Mandolina genotype were grown five days at 24°C, with a heat shock (40°C) of two hours allowed to act upon two of those samples. Concomitantly, a similar experiment was set up in which the abiotic stress-susceptible genotype was used. A representative CBB G-250 stained 2D-gel pattern of the soluble protein fraction of the control state and of heat shock shoots from both cultivars is presented in Figure 1.

CHAPTER VI HEAT SHOCK RESPONSE IN BARLEY SHOOTS
89
Figure 1. Coomassie G-250 stained 2D-PAGE gels of the soluble protein fractions of (A) the Mandolina cultivar, 24°C; (B) the Jubilant cultivar, 24°C; (C) the Mandolina cultivar, 40°C and (D) the Jubilant cultivar, 40°C.

CHAPTER VI HEAT SHOCK RESPONSE IN BARLEY SHOOTS
90
Approximately 400 to 500 proteins were detected on each gel. Two replicate groups were created for the Mandolina cultivar (24°C and 40°C) and two were created for the Jubilant cultivar (24°C and 40°C). The reproducibility of the gel patterns was high as reflected by the figures for the scatter plot tool (> 80%) and the mean coefficient of variations (CV < 35%). In a first analysis, the spot lists of the two genotypes at both temperatures were compared. Comparison of the proteomes at 24°C revealed one differential protein spot being present in the Mandolina cultivar, while comparison of the proteomes at 40°C revealed two proteins unique to the Jubilant cultivar. Because we were mainly interested in the influence of a short term heat shock on barley and due to the small differences between the two genotypes, we continued with two replicate groups. We created one replicate group for the 2D-images at 24°C and one group for the 2D-images at 40°C. This approach slightly improved the mean coefficient of variations. The spot lists of the two replicate groups were compared. A comparison of the relative integrated densities averaged from three or four replicate gels was performed, and only proteins with at least a two-fold increase in density ratio and with a statistical relevance (p<0.05) were submitted to further mass spectrometric analysis. The applied short term heat shock to both cultivars affected mainly the protein profile in the 15-30 kDa range and in the pH region of 4.0 to 8.5 (Figure 2). The spots were numbered, indicated in Figures 1 and 2 and listed in Table 1.
Figure 2. Detailed picture of the individual boxes in Figure 1.
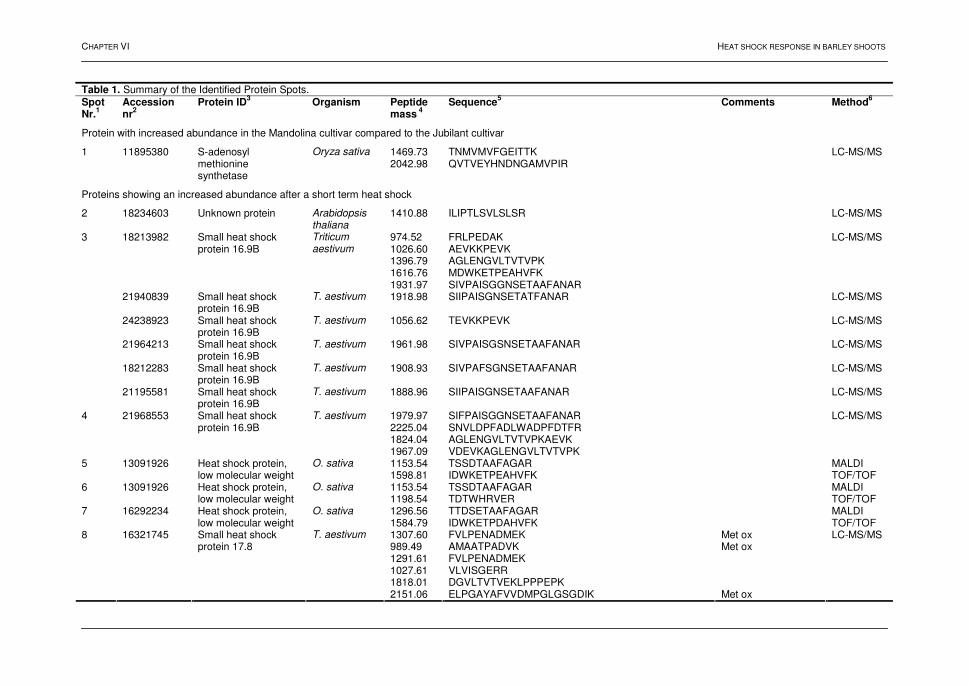
CHAPTER VI HEAT SHOCK RESPONSE IN BARLEY SHOOTS
Table 1. Summary of the Identified Protein Spots. Spot Nr.
1
Accession nr
2
Protein ID3 Organism Peptide
mass 4
Sequence
5 Comments Method
6
Protein with increased abundance in the Mandolina cultivar compared to the Jubilant cultivar
1469.73 TNMVMVFGEITTK 1 11895380 S-adenosyl methionine synthetase
Oryza sativa 2042.98 QVTVEYHNDNGAMVPIR
LC-MS/MS
Proteins showing an increased abundance after a short term heat shock
2 18234603 Unknown protein Arabidopsis thaliana
1410.88 ILIPTLSVLSLSR LC-MS/MS
974.52 FRLPEDAK 1026.60 AEVKKPEVK 1396.79 AGLENGVLTVTVPK 1616.76 MDWKETPEAHVFK
18213982 Small heat shock protein 16.9B
Triticum aestivum
1931.97 SIVPAISGGNSETAAFANAR
LC-MS/MS
21940839 Small heat shock protein 16.9B
T. aestivum 1918.98 SIIPAISGNSETATFANAR LC-MS/MS
24238923 Small heat shock protein 16.9B
T. aestivum 1056.62 TEVKKPEVK LC-MS/MS
21964213 Small heat shock protein 16.9B
T. aestivum 1961.98 SIVPAISGSNSETAAFANAR LC-MS/MS
18212283 Small heat shock protein 16.9B
T. aestivum 1908.93 SIVPAFSGNSETAAFANAR LC-MS/MS
3
21195581 Small heat shock protein 16.9B
T. aestivum 1888.96 SIIPAISGNSETAAFANAR LC-MS/MS
1979.97 SIFPAISGGNSETAAFANAR 2225.04 SNVLDPFADLWADPFDTFR 1824.04 AGLENGVLTVTVPKAEVK
4 21968553 Small heat shock protein 16.9B
T. aestivum
1967.09 VDEVKAGLENGVLTVTVPK
LC-MS/MS
1153.54 TSSDTAAFAGAR 5 13091926 Heat shock protein, low molecular weight
O. sativa 1598.81 IDWKETPEAHVFK
MALDI TOF/TOF
1153.54 TSSDTAAFAGAR 6 13091926 Heat shock protein, low molecular weight
O. sativa 1198.54 TDTWHRVER
MALDI TOF/TOF
1296.56 TTDSETAAFAGAR 7 16292234 Heat shock protein, low molecular weight
O. sativa 1584.79 IDWKETPDAHVFK
MALDI TOF/TOF
1307.60 FVLPENADMEK Met ox 989.49 AMAATPADVK Met ox 1291.61 FVLPENADMEK 1027.61 VLVISGERR 1818.01 DGVLTVTVEKLPPPEPK
8 16321745 Small heat shock protein 17.8
T. aestivum
2151.06 ELPGAYAFVVDMPGLGSGDIK Met ox
LC-MS/MS

CHAPTER VI HEAT SHOCK RESPONSE IN BARLEY SHOOTS
3122.53 AMAATPADVKELPGAYAFVVDMGLGSGDIK 2 x Met ox 2193.07 ELPDAFAFVVDMPGLGSGDIK Met ox 3148.54 AMAAPADVKELPDAFAFVVDMPGLGSGDIK Met ox
21967462 Small heat shock protein 17.8
T. aestivum
3164.54 AMAAPADVKELPDAFAFVVDMPGLGSGDIK 2 x Met ox
LC-MS/MS
1277.66 FVLPDNADMEK
16321080 Small heat shock protein 17.8
T. aestivum 1293.59 FVLPDNADMEK Met ox
LC-MS/MS
9 Not identified 10 Not identified 11 Not identified
Proteins showing decreased abundance, after a short-term heat shock
1242.66 QYYSITVLTR 1561.74 KNTDFVAYSGEGFK 2083.02 TADGDEGGKHQLITATVADGK
21146652 23 kDa oxygen evolving protein of photosystem II
T. aestivum
3048.51 KTITDYGSPEEFLSQVGFLLGQQSYGGK
LC MS/MS
1288.63 TNVSPEVAESTR 24963702 Triosephosphate isomerase
T. aestivum 1311.65 IIYGGSVTGASCK Carbamidomethyl
LC MS/MS
1262.69 VTFLDDAQVKK 16308176 Adenosine diphosphate glucose pyrophosphatase
Hordeum vulgare 2504.07 LTQDFCVADLSCSDTPAGYPCK 3 x Carbamidomethyl
LC MS/MS
1201.68 IFSTFVTFLK
12
12036592 Dehydroascorbate reductase
T. aestivum 1826.84 AAVGHPDTLGDCPFSQR Carbamidomethyl
LC MS/MS
1087.58 TFPQQAGAIR 1310.75 LPTDDVLLGQIK 1419.70 CHFVAIDIFNGK Carbamidomethyl 2216.06 KLEDIVPSSHNCDVPHVDR Carbamidomethyl
13 18228088 Translation initiation factor 5A
O. sativa
2769.34 TGFADGKDLILSVMSAMGEEQICAVK Carbamidomethyl
LC-MS/MS
1059.56 SVGGITGDNLK 1210.53 WDEGYDVTAR 1318.74 LKAGYVAANWVK 1778.87 DTNGIASTSGSTIELSAR
14 9743953 Hypothetical protein H. vulgare
2466.15 QVLSDASSFTWGIFNQPDPSDR
LC MS/MS
1. Numbers refer to the spot numbers given in Figure 1.
2. Nucleotide entry code of the National Center for Biotechnology Information (NCBI): http://ncbi.nlm.nih.gov.
3. Annotation of the protein sequence performed using the BLAST program (NCBI).
4. Theoretical molecular mass of the peptide.
5. Peptide sequence corresponding to the appropriate peptide mass. Parts of the sequence, determined by mass spectrometry, could indisputably confirm the peptide.
6. Protein spots analyzed and identified using either MALDI-TOF/TOF MS or nano-HPLC Q-TRAP MS. For detailed information, see appendix B and chapter IV.
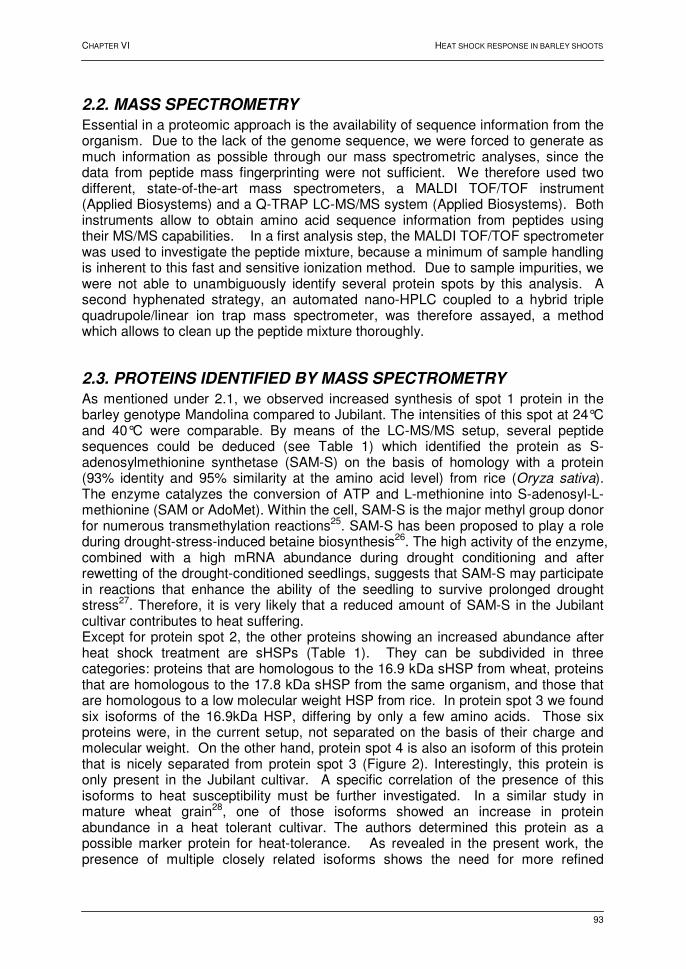
CHAPTER VI HEAT SHOCK RESPONSE IN BARLEY SHOOTS
93
2.2. MASS SPECTROMETRY
Essential in a proteomic approach is the availability of sequence information from the organism. Due to the lack of the genome sequence, we were forced to generate as much information as possible through our mass spectrometric analyses, since the data from peptide mass fingerprinting were not sufficient. We therefore used two different, state-of-the-art mass spectrometers, a MALDI TOF/TOF instrument (Applied Biosystems) and a Q-TRAP LC-MS/MS system (Applied Biosystems). Both instruments allow to obtain amino acid sequence information from peptides using their MS/MS capabilities. In a first analysis step, the MALDI TOF/TOF spectrometer was used to investigate the peptide mixture, because a minimum of sample handling is inherent to this fast and sensitive ionization method. Due to sample impurities, we were not able to unambiguously identify several protein spots by this analysis. A second hyphenated strategy, an automated nano-HPLC coupled to a hybrid triple quadrupole/linear ion trap mass spectrometer, was therefore assayed, a method which allows to clean up the peptide mixture thoroughly.
2.3. PROTEINS IDENTIFIED BY MASS SPECTROMETRY
As mentioned under 2.1, we observed increased synthesis of spot 1 protein in the barley genotype Mandolina compared to Jubilant. The intensities of this spot at 24°C and 40°C were comparable. By means of the LC-MS/MS setup, several peptide sequences could be deduced (see Table 1) which identified the protein as S-adenosylmethionine synthetase (SAM-S) on the basis of homology with a protein (93% identity and 95% similarity at the amino acid level) from rice (Oryza sativa). The enzyme catalyzes the conversion of ATP and L-methionine into S-adenosyl-L-methionine (SAM or AdoMet). Within the cell, SAM-S is the major methyl group donor for numerous transmethylation reactions25. SAM-S has been proposed to play a role during drought-stress-induced betaine biosynthesis26. The high activity of the enzyme, combined with a high mRNA abundance during drought conditioning and after rewetting of the drought-conditioned seedlings, suggests that SAM-S may participate in reactions that enhance the ability of the seedling to survive prolonged drought stress27. Therefore, it is very likely that a reduced amount of SAM-S in the Jubilant cultivar contributes to heat suffering. Except for protein spot 2, the other proteins showing an increased abundance after heat shock treatment are sHSPs (Table 1). They can be subdivided in three categories: proteins that are homologous to the 16.9 kDa sHSP from wheat, proteins that are homologous to the 17.8 kDa sHSP from the same organism, and those that are homologous to a low molecular weight HSP from rice. In protein spot 3 we found six isoforms of the 16.9kDa HSP, differing by only a few amino acids. Those six proteins were, in the current setup, not separated on the basis of their charge and molecular weight. On the other hand, protein spot 4 is also an isoform of this protein that is nicely separated from protein spot 3 (Figure 2). Interestingly, this protein is only present in the Jubilant cultivar. A specific correlation of the presence of this isoforms to heat susceptibility must be further investigated. In a similar study in mature wheat grain28, one of those isoforms showed an increase in protein abundance in a heat tolerant cultivar. The authors determined this protein as a possible marker protein for heat-tolerance. As revealed in the present work, the presence of multiple closely related isoforms shows the need for more refined
CHAPTER VI HEAT SHOCK RESPONSE IN BARLEY SHOOTS
94
analysis of the specific species that are present in the different cultivars, before they can be used as heat-tolerance markers. Protein spots 5, 6 and 7 were identified and found to be homologous (> 65% identity) to a low molecular weight HSP from rice. These three isoforms are nicely separated on the 2D gel (Figure 2). It was possible to differentiate spot 7 from spots 5 and 6, but the latter two were indistinguishable. Protein spot 7 is again unique in the stress-susceptible cultivar (cfr. spot 4). We also observed a decrease in abundance for three other proteins, listed in Table 1. In spot 12 we identified, besides other proteins, a 23kDa oxygen-evolving protein of photosystem II (98% identity). The exposure of photosynthetic organisms to temperatures above the normal physiological range often results in an irreversible inactivation of photosynthesis. Photosystem II (PSII) is one of the most susceptible protein complexes to heat among various components of the photosynthetic apparatus. Previous studies have indicated that heat-related inhibition of PSII is often attributed to damage of the thylakoid-membrane proteins29. Preczewski et al30 showed that the chloroplast small heat-shock protein referred to as ‘chip Hsp24’ protects photosystem II against heat stress, and that the phenotypic variation in the production of chip Hsp24 is positively related to PS II thermotolerance. Protein spot 13 was identified as being translation initiation factor 5A (eIF-5A). The function of this protein is to promote the formation of the first peptide bond during protein synthesis. Takeuchi et al31 have suggested that loss of the active form of eIF-5A upon 45 °C heat stress is an important factor in the irreversible process of heat stress-induced death of a human pancreatic cancer cell line, but similar behavior in plants has not been demonstrated before.
3. CONCLUSIONS
Our proteomic approach, high-resolution 2-D gel electrophoresis combined with mass spectrometry, proved to be a successful strategy in the study of heat shock associated proteins in different barley cultivars. The protein S-adenosylmethionine synthetase (SAM-S) displayed an increased protein synthesis in the stress-tolerant barley cultivar. SAM-S is known to participate in surviving prolonged drought stress. Loss of resistance of the Jubilant cultivar against abiotic stress factors could be partially due to the absence of this protein. In the differential analysis of the heat-treated Jubilant and Mandolina barley shoots, we detected an increased protein abundance of several sHSPs. One of them is highly homologous to the 16.9kDa HSP from wheat. In a different study, this protein was referred to as a potential marker for heat-tolerance in wheat grains. We showed the presence of several isoforms of this protein in barley. We also found two proteins (protein spots 4 and 7, see Figures 1 and 2) unique to the stress-susceptible cultivar. An in-depth analysis of those proteins and of their isoforms will be necessary in order to better understand their role in relation to heat-tolerance and –susceptibility.

CHAPTER VI HEAT SHOCK RESPONSE IN BARLEY SHOOTS
95
4. REFERENCES 1 Kuiper, P.J.C. Adaptation mechanism of green plants to environmental stress. The role of plant
sterols and the phosphatidyl linolenoyl cascade in the functioning of plants and the response of
plants to global climate change. In: Csermely , P., Stress of life. From molecules to man. Annals of
the New York Academy of Sciences New York 1998, Vol. 851, pp.209-215
2 Treglia, A.; Spano, G.; Rampino, P. et al. Identification by in vitro translation and Northern blot
analysis of heat shock mRNAs isolated from wheat seeds exposed to different temperatures
during ripening. J. Cereal Sci. 1999, 30, 33-38
3 Howarth, C.J. Molecular responses of plants to an increased incidence of heat shock. Plant Cell
Environ. 1991, 14, 831-841
4 Vierling, E. The roles of heat shock proteins in plants. Annu. Rev. Plant Physiol. Plant Mol. Biol.
1991, 42, 579-620
5 Waters, E.R.; Lee, G.J.; Vierling, E. Evolution, structure and function of the small heat shock
proteins in plants. J. Exp. Bot. 1996, 47, 325-338
6 Sun, W.; Van Montagu, M.; Verbruggen, N. Small heat shock proteins and stress tolerance in
plants. Biochim. Biophys. Acta 2002, 1577, 1-9
7 Georgopoulos, C.; Welch, W.J. Role of the major heat shock proteins as molecular chaperones.
Annu. Rev. Cell Biol. 1993, 9, 601-634
8 Leone, A.; Piro, G.; Leucci, M.R. et al. Membrane- cell wall-associated heat shock proteins in two
genotypes of barley seedlings. Plant Biosystems 2000, 134, 171-178
9 Prasad, M.N.; Rengel, Z. Plant acclimation and adaptation to natural and anthropogenic stress. In:
Stress of life. From molecules to man. Edited by Csermely, P., Annals of the New York Academy
of Sciences. 1998, Vol 851, pp. 216-223
10 Anderson. J.V.; Li, Q.B.; Hakell, D.W. et al. Structural organization of the spinach endoplasmatic
reticulum-luminal 70 kilo Dalton heat-shock cognate gene and expression of 70-heat- shock genes
during cold acclimation. Plant Physiol. 1994, 104, 1359-1370
11 Lee, Y.R.J.; Nagao, R.T.; Lin, C.Y. et al. Induction and regulation of heat- shock gene expression
by an amino acid analog in soybean seedlings. Plant Physiol. 1996, 110, 241-248
12 Sabehat, A.; Lurie, S.; Weiss, D. Expression of small heat-shock proteins at low temperatures.
Plant Physiol. 1998, 117, 651-658
13 Shihua, S.; Yuxiang, J.; Tingyun, K. Proteomics approach to identify wound-response related
proteins from rice leaf sheath. Proteomics 2003, 3, 527-535
14 Görg, A.; Postel, W.; Domscheit, A. et al. Two-dimensional electrophoresis with immobilized pH
gradients of leaf proteins from barley (Hordeum vulgare): method, reproducibility and genetic
aspects. Electrophoresis 1988, 9,681-692
15 Hurkman, W.; Tanaka, C. Polypeptide changes induced by salt stress, water deficit, and osmotic
stress in barley roots: a comparison using two-dimensional gel electrophoresis. Electrophoresis
1988, 9,781-787
16 Flengsrud, R.; Kobro, G. A method for two-dimensional electrophoresis of proteins from green
plant tissues. Anal. Biochem. 1989, 177, 33-36
17 Zivy, M.; de Vienne, D. Proteomics: a link between genomics, genetics and physiology. Plant. Mol.
Biol. 2000, 44, 575-580
18 Skylas, D.; Cordwell, S.; Hains, P. et al. Heat shock of wheat during grain filling: Proteins
associated with heat-tolerance. J. Cereal Sci. 2002, 35, 175-188
19 Prime, T.; Sherrier, D.; Mahon, P. et al. A proteomic analysis of organelles from Arabidopsis
thaliana. Electrophoresis 2000, 21, 3488-3499

CHAPTER VI HEAT SHOCK RESPONSE IN BARLEY SHOOTS
96
20 Haebel, S.; Kehr, J. Matrix-assisted laser desorption/ionization time of flight mass spectrometry
peptide mass fingerprints and post source decay: a tool for the identification and analysis of
phloem proteins from Cucurbita maxima Duch. separated by two-dimensional polyacrylamide gel
electrophoresis. Planta 2001, 213, 586-593
21 Kristoffersen, H.; Flengsrud, R. Separation and characterization of basic barley seed proteins.
Electrophoresis 2000, 21, 3693-3700
22 Finnie, C.; Svensson, B. Feasibility study of a tissue-specific approach to barley proteome
analysis: aleurone layer, endosperm, embryo and single seeds. J. Cereal Sci. 2003, 38, 217-227
23 Finnie, C.; Melchior, S.; Roepstorff, P. et al. Proteome analysis of grain filling and seed maturation
in barley. Plant Physiol. 2002, 129, 1308-1319
24 Skylas, D.; Cordwell, S.; Hains, P. et al. Heat shock of wheat during grain filling: Proteins
associated with heat-tolerance. J. Cereal Sci. 2002, 35, 175-188
25 Boerjan, W.; Guy, B.; Van Montagu, M. et al. Distinct phenotypes generated by overexpression
and suppression on S-adenosyl-L-methionine synthetase reveal developmental patterns of gene
silencing in tobacco. Plant Cell 1994, 6, 1401-1414
26 Hanson, A.D.; Rivoal, J.; Burnet, M. et al. Biosynthesis of quaternary ammonium and tertiary
sulphonium compounds in response to water deficit. In: Environment and Plant Metabolism:
Flexibility and Acclimation, Edited by Davies, W.J. 1995, pp.190-199
27 Mayne, M.B.; Coleman, J.R.; Blumwald, E. Differential expression during drought conditioning of a
root-specific S-adenosylmethionine synthetase from jack pine (Pinus banksiana Lamb.) seedlings.
Plant Cell Environ. 1996, 19, 958-966
28 Skylas, D.; Cordwell, S.; Hains, P. et al. Heat shock of wheat during grain filling: Proteins
associated with heat-tolerance. J. Cereal Sci. 2002, 35, 175-188
29 Berry, J.; Björkman, O. Photosynthetic response and adaptation to temperature in higher plants.
Annu. Rev. Plant Physiol. 1980, 31, 491-543
30 Preczewski, P.J.; Heckathorn, S.A.; Downs, C.A. et al. Photosynthetic thermotolerance is
quantitatively and positively correlated with production of specific heat-shock proteins among nine
genotypes of Lycopersicon (tomato). Photosynthetica 2000, 38, 127-134
31 Takeuchi, K.; Nakamura, K.; Fujimoto, M. et al. Heat stress-induced loss of eukaryotic initiation
factor 5A (eIF-5A) in a human pancreatic cancer cell line, MIA PaCa-2, analyzed by two-
dimensional gel electrophoresis. Electrophoresis 2002, 23, 662-669
PART III:
PROFILING OF MEMBRANE PROTEINS
IN MAMMALIAN SYSTEMS
CHAPTER VII
98
CHAPTER VII
OXIDATIVE PHOSPHORYLATION:
A PROTEOMIC APPROACH
Blue-native polyacrylamide gel electrophoresis is an excellent technique for the separation of intact membrane protein complexes, such as the five multi-polypeptide complexes of the oxidative phosphorylation system. This process provides energy to the cell, so that defects in genes coding for these proteins result in a reduced energy production and, concomitantly, in the dysfunction of energy-dependent tissue. A proteomic approach, using BN-PAGE, can be clinically used to analyze mitochondrial diseases. However, in order to use this technique for conclusive and comprehensive diagnostic purposes and to link changes in protein expression with different forms of mitochondrial disorders, all of the proteins present in each of the complexes need to be identified. We present the results for the profiling of the different subunits of the oxidative phosphorylation system, obtained by a combination of blue-native polyacrylamide gel electrophoresis and mass spectrometry.

CHAPTER VII MS OF BN-PAGE SEPARATED OXPHOS PROTEINS
99
1. INTRODUCTION Mitochondria are the power 'stations' of the eukaryotic cell, i.e. they play a central role in cellular metabolism by providing the location for energy production in the cell. A typical eukaryotic cell can contain 100 to more than 1,000 mitochondria which differ in structure, shape and size depending on the tissue and the physiological status of the cell. The cellular energy is generated as ATP through oxidative phosphorylation (OXPHOS). Four essential multi-enzyme complexes provide the proton gradient across the mitochondrial inner membrane during electron transport, while the fifth enzyme, ATP synthase, uses this gradient to drive the generation of ATP from ADP and phosphate. Defects in the genes coding for the OXPHOS enzymes and for associated proteins cause serious health problems. Children and adults who are unable to generate sufficient energy at the cellular level suffer from the malfunctioning of muscles, or other energy dependent tissues, classified as myopathies, encephalopathies or encephalo-myopathies. There are many diverse forms of the diseases, which may appear at different ages. The linkage between a specific mutation in mitochondrial DNA and a specific disease was first established in 19881,2. Since then, more diseases related to mutations and rearrangements of mitochondrial and nuclear DNA were found. While many typical diseases are already associated with a particular gene defect, most of them remain unexplained. An approach to screen for differences in gene expression in diseased cells is profiling proteomics3. To study the protein components of the OXPHOS-system, we have separated the five intact membrane protein complexes by ‘blue-native polyacrylamide gel electrophoresis’ (BN-PAGE) followed by sodium dodecyl sulfate polyacrylamide gel electrophoresis, and identified the different subunits by mass spectrometry. Since the distribution of OXPHOS proteins is strongly tissue-dependent, especially of the complexes that are known to have tissue-specific isoforms, we analyzed human heart and liver tissue. The results will be presented in this chapter, and in addition, the study of a patient who deceased from a mitochondrial disorder will be discussed. Prior to this discussion, we give a concise overview of the methodology used and the biochemical mechanisms of electron transport and oxidative phosphorylation.

CHAPTER VII MS OF BN-PAGE SEPARATED OXPHOS PROTEINS
100
2. THE MITOCHONDRION
2.1. INTRODUCTION
The mitochondrion is one of the most complex and important organelles found in eukaryotic cells. In addition to their central role in energy metabolism, mitochondria are involved in many cellular processes and mitochondrial dysfunctions have been associated with apoptosis, aging, and a number of pathological conditions4,5. Mitochondria are characterized by the presence of two membranes (Figure 1). On the outside, the mitochondrion is surrounded by the mitochondrial envelope (outer membrane), while the inside of a mitochondrion contains an extensively invaginated inner membrane. Two internal sub-compartments, namely the inter-membranous space and the mitochondrial matrix, are thus created. The number of invaginations, called cristae, varies with the respiratory activity of the type of cell. The matrix contains substrates, nucleotide cofactors, inorganic ions and soluble proteins, e.g. citric acid cycle enzymes. Mitochondria are peculiar in the sense that they are under control of two genomic systems: apart from the nuclear DNA, they have their own DNA. The mammalian mitochondrial genome is a small, double stranded, circular DNA molecule of approximately 16,500 bp6 and encodes the 12S and 16S rRNAs, 22 tRNAs, and 13 polypeptides, which are essential components of the respiratory chain. The genetics of mammalian mtDNA are characterized by the following unique features: (i) maternal inheritance, (ii) high mutation rate, and (iii) polyploidy. The low complexity of the mitochondrial genome implicates that the majority of the mitochondrial proteins (estimated to be 1500) are encoded by the nuclear genome7. These proteins have to be transported into the mitochondria, and this is a complex system involving chaperones, receptors and other proteins8,9.
2.2. THE ELECTRON TRANSPORT CHAIN
The protein components of the respiratory chain are oligomeric complexes located in the inner mitochondrial membrane of mitochondria and are referred to as the multi-subunit electron transport complexes I, II, III, and IV10,11. The mitochondrial oxidative phosphorylation system is composed of these complexes along with ATP synthase. The respiratory process in mitochondria involves the donation of electrons by low-redox-potential electron donors, such as NADH and FADH2, and is followed by electron transfer through a range of protein-bound redox centers. Finally, the process ends in the reduction of the high-redox-potential acceptor, oxygen (Figure 2). The free energy of electron transfer is coupled to ATP synthesis.
Figure 1. Schematic picture of a mitochondrion. They are typically ellipsoids of ~0.5 µm diameter and 1 µm length (about the size of a bacterium).
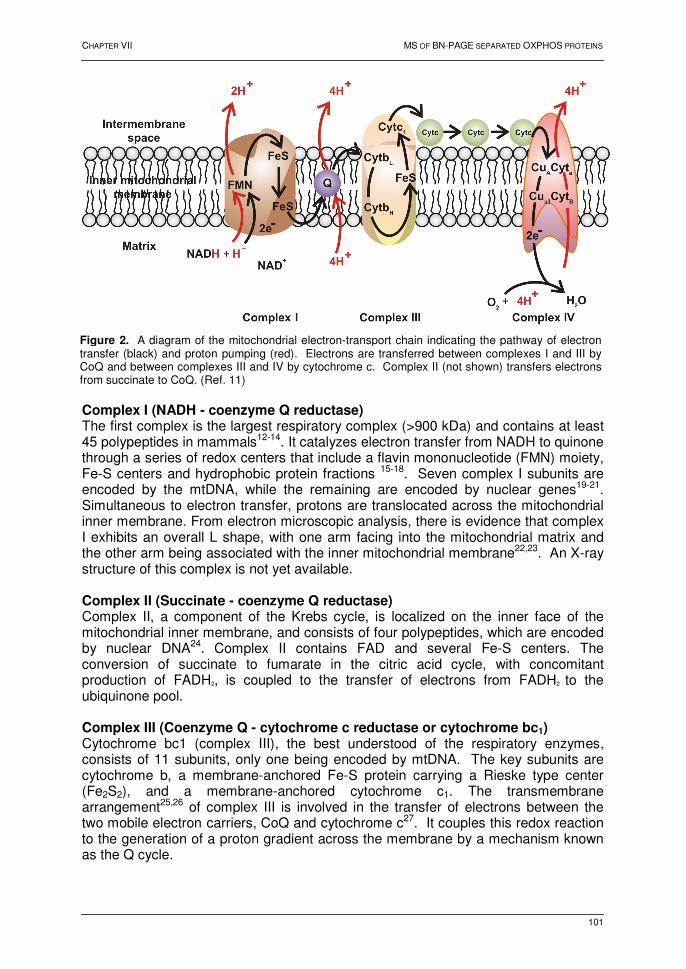
CHAPTER VII MS OF BN-PAGE SEPARATED OXPHOS PROTEINS
101
Complex I (NADH - coenzyme Q reductase) The first complex is the largest respiratory complex (>900 kDa) and contains at least 45 polypeptides in mammals12-14. It catalyzes electron transfer from NADH to quinone through a series of redox centers that include a flavin mononucleotide (FMN) moiety, Fe-S centers and hydrophobic protein fractions 15-18. Seven complex I subunits are encoded by the mtDNA, while the remaining are encoded by nuclear genes19-21. Simultaneous to electron transfer, protons are translocated across the mitochondrial inner membrane. From electron microscopic analysis, there is evidence that complex I exhibits an overall L shape, with one arm facing into the mitochondrial matrix and the other arm being associated with the inner mitochondrial membrane22,23. An X-ray structure of this complex is not yet available. Complex II (Succinate - coenzyme Q reductase) Complex II, a component of the Krebs cycle, is localized on the inner face of the mitochondrial inner membrane, and consists of four polypeptides, which are encoded by nuclear DNA24. Complex II contains FAD and several Fe-S centers. The conversion of succinate to fumarate in the citric acid cycle, with concomitant production of FADH2, is coupled to the transfer of electrons from FADH2 to the ubiquinone pool. Complex III (Coenzyme Q - cytochrome c reductase or cytochrome bc1) Cytochrome bc1 (complex III), the best understood of the respiratory enzymes, consists of 11 subunits, only one being encoded by mtDNA. The key subunits are cytochrome b, a membrane-anchored Fe-S protein carrying a Rieske type center (Fe2S2), and a membrane-anchored cytochrome c1. The transmembrane arrangement25,26 of complex III is involved in the transfer of electrons between the two mobile electron carriers, CoQ and cytochrome c27. It couples this redox reaction to the generation of a proton gradient across the membrane by a mechanism known as the Q cycle.
Figure 2. A diagram of the mitochondrial electron-transport chain indicating the pathway of electron transfer (black) and proton pumping (red). Electrons are transferred between complexes I and III by CoQ and between complexes III and IV by cytochrome c. Complex II (not shown) transfers electrons from succinate to CoQ. (Ref. 11)
CHAPTER VII MS OF BN-PAGE SEPARATED OXPHOS PROTEINS
102
Complex IV (Cytochrome c oxidase) The final member of the mitochondrial electron transport chain generating a transmembrane proton gradient is the terminal cytochrome oxidase (~200 kDa). In mammals this enzyme consists of 13 polypeptides, three of which are encoded by mtDNA28-31 and has four redox metal centers, CuA, heme a, heme a3, and CuB. Electrons are first transferred from cytochrome c to CuA, subsequently to cytochrome a, and finally to the binuclear center a3 CuB , where they reduce oxygen to two water molecules. Complex V (ATP synthase) The final component of the oxidative phosphorylation system, F1F0 ATPase, is made up of 16 different proteins in mammals32 (>500 kDa), two of them are coded by mtDNA33. The process of ATP synthesis, the catalytic activity, is located in the F1
segment. The F0 contains a specific channel for passive movement of protons back into the mitochondrial matrix segment, and spans the mitochondrial inner membrane34,35.
2.3. OXIDATIVE PHOSPORYLATION
ATP, the universal ‘energy currency’ of the living cell, is produced in mitochondria as a result of oxidative phosphorylation. Although the chemiosmotic theory proposed by Mitchell36 in 1961 remained controversial until the mid-1970s, it appears to be the model most consistent with the experimental evidence37. It postulates that transport of electrons (generated by oxidation of substrates) through the respiratory chain is coupled to translocation of protons from the matrix into the intermembrane space, presumably at the level of complex I, III, and IV, so as to create an electrochemical proton gradient across the inner mitochondrial membrane. The electrochemical potential of this gradient is harnessed to synthesize ATP. This chemiosmotic hypothesis explains several observations. For example, oxidative phosphorylation requires an intact membrane and a measurable electrochemical gradient across the inner mitochondrial membrane is created. The free energy sequestered by the resulting electrochemical gradient, drives the synthesis of ATP from ADP and Pi by complex V. Assuming 100% efficient coupling of respiration and phosphorylation, oxidation of one mole of NADH will generate three moles of ATP. Because one proton translocation site is bypassed in the oxidation of FADH2 (i.e. complex I), one mole of FADH2 will generate only two moles of ATP instead of three. However, in vivo, coupling of respiration and phosphorylation is not entirely efficient, because the mitochondrial inner membrane has a proton leak, so that a proportion of the protons translocated by the respiratory chain return via this leak rather than driving ATP synthesis38-40.
3. BN-PAGE Blue-native polyacrylamide gel electrophoresis (BN-PAGE) is an electrophoretic method able to resolve native hydrophobic proteins and membrane protein complexes. In this technique, membranes are first suspended in an aminocaproic acid buffer, which keeps the protein complexes intact upon solubilization and electrophoresis. Protein complexes are then solubilized using a mild detergent, e.g. dodecyl maltoside41 or Triton X-10042; afterwards the dye Coomassie Brilliant Blue G-250 is added, exchanging for the initial detergent. The Coomassie introduces a

CHAPTER VII MS OF BN-PAGE SEPARATED OXPHOS PROTEINS
103
negative charge-shift that enhances the migration of the proteins in a 'native' discontinuous electrophoretic system. After the first electrophoretic step, the protein complexes can be denatured using SDS, and the subunits become resolved according to their molecular mass by SDS-PAGE in the second dimension. This strategy provides information on the functional membrane protein complexes and proved to be superior to 2D-PAGE for the solubilization of hydrophobic proteins. The method allows resolving large protein complexes, and is thus an excellent separation tool for intact membrane protein complexes43,44. BN-PAGE has been mainly used for the separation and isolation of the five multi-enzyme complexes responsible for oxidative phosphorylation (OXPHOS), the energy-gaining pathway executed in mitochondria. Catalytic activity of the enzymes is partially maintained45. The designers of the method already indicated the intrinsic capacity of the method in the study of protein defects in inborn mitochondrial myopathies. Zerbetto et al46 applied histochemical staining on BN-PAGE separated OXPHOS complexes to quantify enzyme function and showed that it can be used to demonstrate deficient complex I activity in patients. Activity staining in the gel can also be used for visualization of the complexes II, IV and V47. This method was used as a diagnostic tool in the investigation of deficiencies of individual OXPHOS complexes, associated with different clinical phenotypes, such as early infantile encephalo-cardiomyopathy and Leigh syndrome. Combining BN-PAGE with SDS-PAGE reveals a two-dimensional pattern showing the individual subunits of the five OXPHOS complexes. In patients with defects in structural proteins, or with mutations of a gene resulting in a wrong assembly of an OXPHOS complex, this will be visualized by a different migration in the first dimension, while the altered subunit composition can be evaluated in the second dimension. The approach allows screening for the presence or absence of these subunits in patients, as was first shown by Klement et al48 in cultured human fibroblasts, and later by Bentlage et al49 who applied the technique in a study of patients with different forms of mitochondrial encephalomyopathies. Houstek et al50 used the method for the diagnosis of cytochrome c oxidase deficiency at the prenatal level, showing a significant decrease of all complex IV subunits. Others applied the method in the analysis of patients with diseases that are now generally accepted to be caused by mitochondrial defects, such as Parkinson’s disease51,52. In order to use two-dimensional BN-PAGE as routine clinical diagnostic tool, it is essential to reveal unambiguously the identity of the individual bands. The molecular weights of some of the subunits are too similar for complete separation, and irregular migration during SDS-PAGE is possible, which limits the reliability of the molecular weight estimation on the basis of protein standards. Although proteins can be stained and analyzed by Western blotting after the first53 or second dimension54, antibodies are available against only a limited number of subunits, so that detection by Western blotting is only partially useful. Moreover, the sample preparation methods that are routinely used are rather limited, so that co-migration with other mitochondrial membrane proteins, and even matrix proteins, is likely to occur. On the other hand, mass spectrometry is a powerful tool for the identification of gel separated proteins. Recently, proteomic studies on plant mitochondria (Arabidopsis) were published in which a few BN-PAGE spots were identified using mass spectrometry55,56.
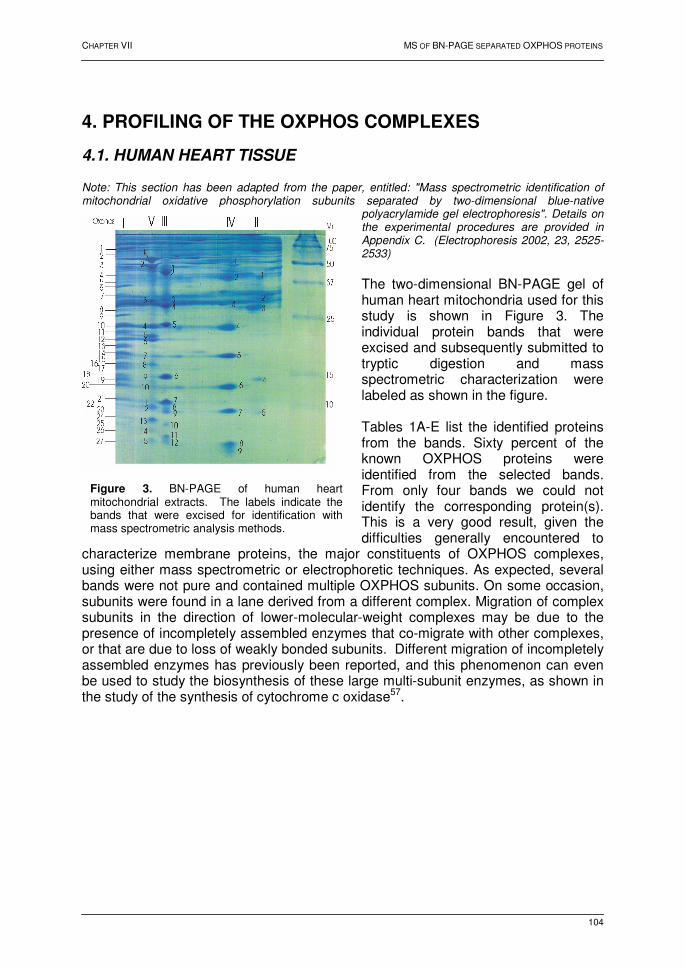
CHAPTER VII MS OF BN-PAGE SEPARATED OXPHOS PROTEINS
104
4. PROFILING OF THE OXPHOS COMPLEXES
4.1. HUMAN HEART TISSUE
Note: This section has been adapted from the paper, entitled: "Mass spectrometric identification of mitochondrial oxidative phosphorylation subunits separated by two-dimensional blue-native
polyacrylamide gel electrophoresis". Details on the experimental procedures are provided in Appendix C. (Electrophoresis 2002, 23, 2525-2533)
The two-dimensional BN-PAGE gel of human heart mitochondria used for this study is shown in Figure 3. The individual protein bands that were excised and subsequently submitted to tryptic digestion and mass spectrometric characterization were labeled as shown in the figure. Tables 1A-E list the identified proteins from the bands. Sixty percent of the known OXPHOS proteins were identified from the selected bands. From only four bands we could not identify the corresponding protein(s). This is a very good result, given the difficulties generally encountered to
characterize membrane proteins, the major constituents of OXPHOS complexes, using either mass spectrometric or electrophoretic techniques. As expected, several bands were not pure and contained multiple OXPHOS subunits. On some occasion, subunits were found in a lane derived from a different complex. Migration of complex subunits in the direction of lower-molecular-weight complexes may be due to the presence of incompletely assembled enzymes that co-migrate with other complexes, or that are due to loss of weakly bonded subunits. Different migration of incompletely assembled enzymes has previously been reported, and this phenomenon can even be used to study the biosynthesis of these large multi-subunit enzymes, as shown in the study of the synthesis of cytochrome c oxidase57.
Figure 3. BN-PAGE of human heart mitochondrial extracts. The labels indicate the bands that were excised for identification with mass spectrometric analysis methods.
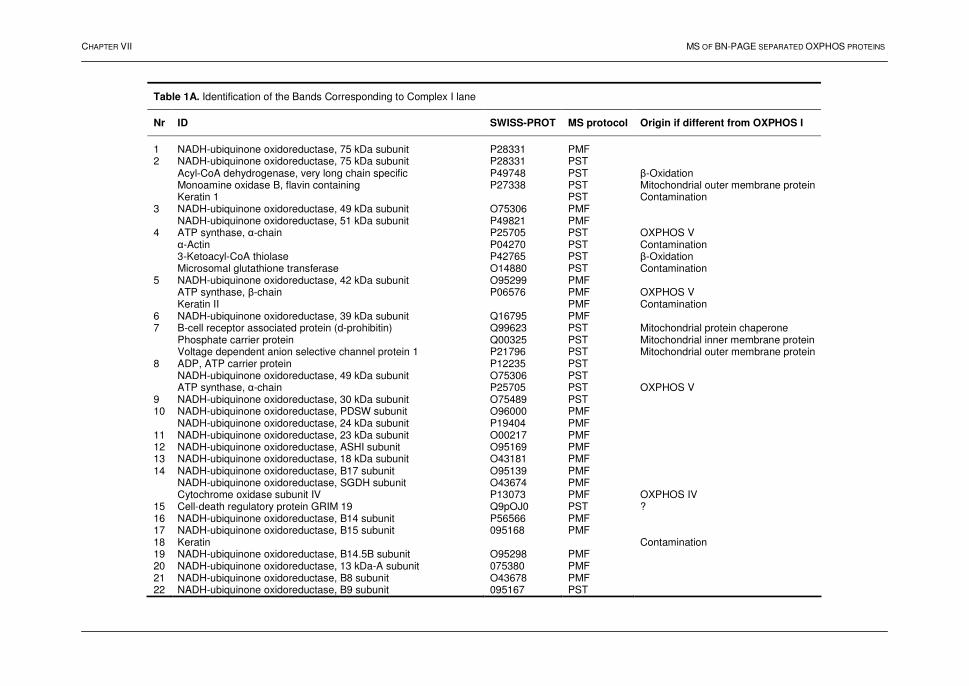
CHAPTER VII MS OF BN-PAGE SEPARATED OXPHOS PROTEINS
Table 1A. Identification of the Bands Corresponding to Complex I lane
Nr ID SWISS-PROT MS protocol Origin if different from OXPHOS I
1 NADH-ubiquinone oxidoreductase, 75 kDa subunit P28331 PMF 2 NADH-ubiquinone oxidoreductase, 75 kDa subunit
Acyl-CoA dehydrogenase, very long chain specific Monoamine oxidase B, flavin containing Keratin 1
P28331 P49748 P27338
PST PST PST PST
β-Oxidation Mitochondrial outer membrane protein Contamination
3 NADH-ubiquinone oxidoreductase, 49 kDa subunit NADH-ubiquinone oxidoreductase, 51 kDa subunit
O75306 P49821
PMF PMF
4 ATP synthase, α-chain α-Actin 3-Ketoacyl-CoA thiolase Microsomal glutathione transferase
P25705 P04270 P42765 O14880
PST PST PST PST
OXPHOS V Contamination β-Oxidation Contamination
5 NADH-ubiquinone oxidoreductase, 42 kDa subunit ATP synthase, β-chain Keratin II
O95299 P06576
PMF PMF PMF
OXPHOS V Contamination
6 NADH-ubiquinone oxidoreductase, 39 kDa subunit Q16795 PMF 7 B-cell receptor associated protein (d-prohibitin)
Phosphate carrier protein Voltage dependent anion selective channel protein 1
Q99623 Q00325 P21796
PST PST PST
Mitochondrial protein chaperone Mitochondrial inner membrane protein Mitochondrial outer membrane protein
8 ADP, ATP carrier protein NADH-ubiquinone oxidoreductase, 49 kDa subunit ATP synthase, α-chain
P12235 O75306 P25705
PST PST PST
OXPHOS V
9 NADH-ubiquinone oxidoreductase, 30 kDa subunit O75489 PST 10 NADH-ubiquinone oxidoreductase, PDSW subunit
NADH-ubiquinone oxidoreductase, 24 kDa subunit O96000 P19404
PMF PMF
11 NADH-ubiquinone oxidoreductase, 23 kDa subunit O00217 PMF 12 NADH-ubiquinone oxidoreductase, ASHI subunit O95169 PMF 13 NADH-ubiquinone oxidoreductase, 18 kDa subunit O43181 PMF 14 NADH-ubiquinone oxidoreductase, B17 subunit
NADH-ubiquinone oxidoreductase, SGDH subunit Cytochrome oxidase subunit IV
O95139 O43674 P13073
PMF PMF PMF
OXPHOS IV
15 Cell-death regulatory protein GRIM 19 Q9pOJ0 PST ? 16 NADH-ubiquinone oxidoreductase, B14 subunit P56566 PMF 17 NADH-ubiquinone oxidoreductase, B15 subunit 095168 PMF 18 Keratin Contamination 19 NADH-ubiquinone oxidoreductase, B14.5B subunit O95298 PMF 20 NADH-ubiquinone oxidoreductase, 13 kDa-A subunit 075380 PMF 21 NADH-ubiquinone oxidoreductase, B8 subunit O43678 PMF 22 NADH-ubiquinone oxidoreductase, B9 subunit 095167 PST
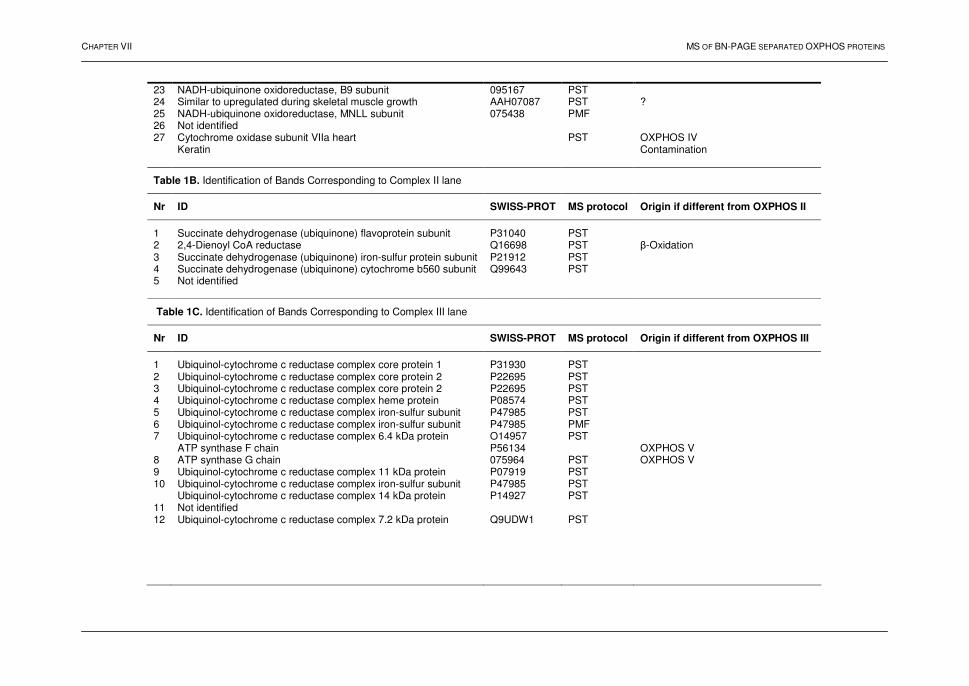
CHAPTER VII MS OF BN-PAGE SEPARATED OXPHOS PROTEINS
23 NADH-ubiquinone oxidoreductase, B9 subunit 095167 PST 24 Similar to upregulated during skeletal muscle growth AAH07087 PST ? 25 NADH-ubiquinone oxidoreductase, MNLL subunit 075438 PMF 26 Not identified 27 Cytochrome oxidase subunit VIIa heart
Keratin
PST
OXPHOS IV Contamination
Table 1B. Identification of Bands Corresponding to Complex II lane
Nr ID SWISS-PROT MS protocol Origin if different from OXPHOS II
1 Succinate dehydrogenase (ubiquinone) flavoprotein subunit P31040 PST 2 2,4-Dienoyl CoA reductase Q16698 PST β-Oxidation 3 Succinate dehydrogenase (ubiquinone) iron-sulfur protein subunit P21912 PST 4 Succinate dehydrogenase (ubiquinone) cytochrome b560 subunit Q99643 PST 5 Not identified
Table 1C. Identification of Bands Corresponding to Complex III lane
Nr ID SWISS-PROT MS protocol Origin if different from OXPHOS III
1 Ubiquinol-cytochrome c reductase complex core protein 1 P31930 PST 2 Ubiquinol-cytochrome c reductase complex core protein 2 P22695 PST 3 Ubiquinol-cytochrome c reductase complex core protein 2 P22695 PST 4 Ubiquinol-cytochrome c reductase complex heme protein P08574 PST 5 Ubiquinol-cytochrome c reductase complex iron-sulfur subunit P47985 PST 6 Ubiquinol-cytochrome c reductase complex iron-sulfur subunit P47985 PMF 7 Ubiquinol-cytochrome c reductase complex 6.4 kDa protein
ATP synthase F chain O14957 P56134
PST OXPHOS V
8 ATP synthase G chain 075964 PST OXPHOS V 9 Ubiquinol-cytochrome c reductase complex 11 kDa protein P07919 PST 10 Ubiquinol-cytochrome c reductase complex iron-sulfur subunit
Ubiquinol-cytochrome c reductase complex 14 kDa protein P47985 P14927
PST PST
11 Not identified 12 Ubiquinol-cytochrome c reductase complex 7.2 kDa protein
Q9UDW1 PST
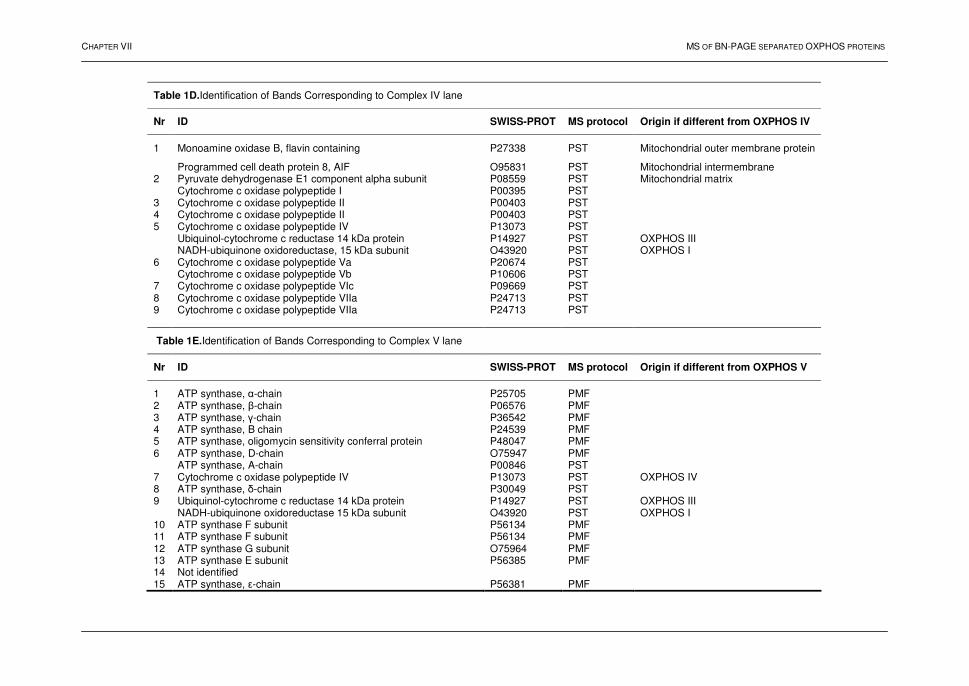
CHAPTER VII MS OF BN-PAGE SEPARATED OXPHOS PROTEINS
Table 1D.Identification of Bands Corresponding to Complex IV lane
Nr ID SWISS-PROT MS protocol Origin if different from OXPHOS IV
1 Monoamine oxidase B, flavin containing
Programmed cell death protein 8, AIF
P27338
O95831
PST
PST
Mitochondrial outer membrane protein
Mitochondrial intermembrane 2 Pyruvate dehydrogenase E1 component alpha subunit
Cytochrome c oxidase polypeptide I P08559 P00395
PST PST
Mitochondrial matrix
3 Cytochrome c oxidase polypeptide II P00403 PST 4 Cytochrome c oxidase polypeptide II P00403 PST 5 Cytochrome c oxidase polypeptide IV
Ubiquinol-cytochrome c reductase 14 kDa protein NADH-ubiquinone oxidoreductase, 15 kDa subunit
P13073 P14927 O43920
PST PST PST
OXPHOS III OXPHOS I
6 Cytochrome c oxidase polypeptide Va Cytochrome c oxidase polypeptide Vb
P20674 P10606
PST PST
7 Cytochrome c oxidase polypeptide VIc P09669 PST 8 Cytochrome c oxidase polypeptide VIIa P24713 PST 9 Cytochrome c oxidase polypeptide VIIa
P24713 PST
Table 1E.Identification of Bands Corresponding to Complex V lane
Nr ID SWISS-PROT MS protocol Origin if different from OXPHOS V
1 ATP synthase, α-chain P25705 PMF 2 ATP synthase, β-chain P06576 PMF 3 ATP synthase, γ-chain P36542 PMF 4 ATP synthase, B chain P24539 PMF 5 ATP synthase, oligomycin sensitivity conferral protein P48047 PMF 6 ATP synthase, D-chain
ATP synthase, A-chain O75947 P00846
PMF PST
7 Cytochrome c oxidase polypeptide IV P13073 PST OXPHOS IV 8 ATP synthase, δ-chain P30049 PST 9 Ubiquinol-cytochrome c reductase 14 kDa protein
NADH-ubiquinone oxidoreductase 15 kDa subunit P14927 O43920
PST PST
OXPHOS III OXPHOS I
10 ATP synthase F subunit P56134 PMF 11 ATP synthase F subunit P56134 PMF 12 ATP synthase G subunit O75964 PMF 13 ATP synthase E subunit P56385 PMF 14 Not identified 15 ATP synthase, ε-chain P56381 PMF

CHAPTER VII MS OF BN-PAGE SEPARATED OXPHOS PROTEINS
108
In the present work, some subunits were detected in lanes corresponding to higher-molecular-weight complexes. Some of these, like the ATP synthase α- and β-chains in the complex I lane, are reflecting the relatively low resolution in the first dimension, as the separation of complex I and V was generally incomplete. The detection of traces of complex IV subunits in the lane of complex I was more surprising, since complex I and IV normally migrate relatively distinctly in the BN-PAGE gel. Traces of subunit 4 of complex IV, for example, were detected in spot 14 of lane I, which is located at the same position as band 5 of the complex IV lane. This can be explained by the effect of streaking, due to aggregation and/or partial precipitation of the complex during the first dimension of the separation. From the current experiments it was impossible to quantify the degree of cross-contamination of the lower molecular weight complexes in the lane corresponding to complex I. The tailing was also observed using histochemical staining methods on one-dimensional BN-PAGE separations58. Apart from the identification of the major constituents of the OXPHOS complexes, we made observations that deserve to be mentioned. Among the peptides identified, we discovered a new variant of the cytochrome c oxidase VIc subunit that results from a change of Glu40 to an Asp residue (Figure 4). The occurrence of polymorphisms in several subunits has been reported in the literature, amongst others in the subunits IV59 and VIIa. A point mutation of the latter subunit has been associated with mitochondrial myophathies60. The variant of the cytochrome c oxidase subunit demonstrated here was caused by a neutral mutation with probably no effect on the function of this subunit, since the samples used in our study were from a patient in whom no OXPHOS deficiency was found.
We obviously detected proteins that are not a constituent part of OXPHOS complexes. The sample preparation was apparently not restricted to the five OXPHOS complexes. The detection of keratins and actin was not totally unexpected as these are ubiquitous contaminants. Other non-OXPHOS proteins that were identified belong to different mitochondrial enzyme systems, such as the β-oxidation enzymes that are expected to be abundantly present in mitochondria. Examples of such proteins were the very long chain acyl-CoA dehydrogenase (VLCAD), 3-ketoacyl-CoA synthase, and also some membrane channel proteins like the
Figure 4. MS/MS of the doubly charged ion with m/z 805.1 of a peptide eluting from the nanoLC run of the in situ digest of the lane containing complex IV, band 7. The deduced sequence corresponds to an E40D variant in the sequence of COX subunit VIc.

CHAPTER VII MS OF BN-PAGE SEPARATED OXPHOS PROTEINS
109
ADP/ATP carrier and the phosphate carrier protein. It is expected that the abundance of these proteins is strongly tissue-dependent. BN-PAGE profiles from liver tissue, for example, look much less resolved than those from heart61, and indicate relatively higher amounts of proteins from different metabolic pathways (see below 4.2.). We also detected D-prohibitin, reportedly found to be a chaperone for the stabilization of mitochondrial proteins, and to co-elute with BAP-37 (not detected here) forming a molecular complex of 1 MDa62. In our study, the fact that it co-migrated with the 750 kDa complex I may reflect the size of the protein complex to which it belongs. For other proteins, the origin of the co-migration with complex I is at present much less clear. VLCAD, for example, is said to form a 120 kDa homodimer63, and reports on larger heterocomplexes are not available. We assume that, under the native conditions used in BN-PAGE, this and other membrane proteins form aggregates that co-migrate with the largest OXPHOS complex. Anyway, it is apparent from these results that the migration behavior of proteins under BN-PAGE conditions is less predictable than in IEF-SDS-PAGE, and identification, e.g. using mass spectrometric methods or specific antibodies, is necessary for the unambiguous localization of a particular OXPHOS-component on a two-dimensional BN-PAGE gel. Surprisingly, we detected proteins associated with the process of cell death, a phenomenon in which mitochondria and cytochrome c in particular are known to play a central role: the programmed cell death protein 864 and the cell-death regulatory protein GRIM 1965. The former is a ubiquitous flavoprotein identified as a caspase-independent apoptosis inducing factor66,67. GRIM 19 is one of the proteins involved in tumor cell death, upon induction using a combination of β-interferon and retinoic acid. A recent report suggested that this protein is a subunit of bovine complex I, since it was found as a band during a SDS-PAGE separation of the hydrophilic arm of the enzyme68. Our observation supports this finding. The MS/MS spectra that prove the presence of this protein are given in Figure 5.
Several subunits could not be identified from this gel (Table 2). It is of concern that almost half of the subunits of complex I were absent. Some subunits may be missing because the appropriate band was not cut from the gel. Bands were selected on the basis of the expected molecular weight of the subunits, but some of these may migrate anomalously upon SDS-PAGE. Moreover, several subunits in this complex have similar molecular weights and they are not separated during SDS-PAGE. This
Figure 5. MS/MS spectrum of a doubly charged ion with m/z 727.1 of a peptide eluting from the nanoLC run of the in situ digest of the lane corresponding to complex I, band 15. The deduced sequence and the mass data revealed that the peptide is from GRIM 19, a programmed cell death associated protein.

CHAPTER VII MS OF BN-PAGE SEPARATED OXPHOS PROTEINS
110
may cause problems to detect specific subunits, especially using an automated PMF approach which not always succeeds in identifying all of the proteins in a complex mixture. Currently, many new software tools are being developed to overcome this problem. Last but not least, most of the missing proteins are either extremely hydrophobic (the membrane spanning subunits) or small (less than 10 kDa). In both cases, the proteins contain few tryptic cleavage sites, generating only a limited number of peptides in the mass range that can be used for PMF and peptide sequencing (1000–3500 kDa) and which, therefore, are difficult to detect by automated MS approaches. This is particularly true when such proteins are present in a band that contains multiple species. A more directed search, specifically looking for expected masses, should overcome the problem of detecting the small subunits.
The difficulties associated with proteomics of proteins smaller than 150 residues have been discussed by Rudd et al69. Membrane spanning proteins in particular are
Table 2. List of Missing Subunits.
Complex Name Mw (kDa)
Explanation
I Acyl carrier protein 9.6 < 10 kDa NADH-ubiquinone oxidoreductase subunit B14.5A 12.4 NADH-ubiquinone oxidoreductase subunit B17.2 17.1 NADH-ubiquinone oxidoreductase subunit B12 11.3 NADH-ubiquinone oxidoreductase subunit B18 16.3 NADH-ubiquinone oxidoreductase subunit B22 21.7 NADH-ubiquinone oxidoreductase AGGGsubunit 8.6 < 10 kDa NADH-ubiquinone oxidoreductase KFYI 5.9 < 10 kDa NADH-ubiquinone oxidoreductase MWFE 8.1 < 10 kDa NADH-ubiquinone oxidoreductase chain 1 36 Extremely hydrophobic NADH-ubiquinone oxidoreductase chain 2 39 Extremely hydrophobic NADH-ubiquinone oxidoreductase chain 3 13.2 Hydrophobic NADH-ubiquinone oxidoreductase chain 4 51.6 Hydrophobic NADH-ubiquinone oxidoreductase chain 5 67 Hydrophobic NADH-ubiquinone oxidoreductase chain 6 18.6 Large peptides, hydrophobic NADH-ubiquinone oxidoreductase 13 kDa subunit B 13.3 NADH-ubiquinone oxidoreductase 20 kDa subunit 19.7 NADH-ubiquinone oxidoreductase chain 4L 10.7 Only 1 trypsin cleavage site NADH-ubiquinone oxidoreductase MLRQ 9.4 < 10 kDa NADH-ubiquinone oxidoreductase 9 kDa 8.5 < 10 kDa NADH-ubiquinone oxidoreductase 19 kDa subunit
19.9
II Succinate dehydrogenase cytochrome b small subunit
10.9 Limited number of peptides
III Ubiquinol-cytochrome c reductase complex ubiquinone binding protein
11.2 Limited number of peptides
cytochrome b
42.7 Hydrophobic, large peptides
IV Cytochrome c oxidase polypeptide 3 30 Limited number of peptides, hydrophobic
Cytochrome c oxidase polypeptide VIa 9.5 < 10 kDa Cytochrome c oxidase polypeptide VIb 10 < 10 kDa Cytochrome c oxidase polypeptide VIIb 6.3 < 10 kDa Cytochrome c oxidase polypeptide VIIc 5.4 < 10 kDa Cytochrome c oxidase polypeptide VIII
4.9 < 10 kDa
V ATP synthase lipid binding protein (proteolipid P1=P2=P3)
7.6 < 10 kDa
ATP synthase protein 8 8.0 < 10 kDa

CHAPTER VII MS OF BN-PAGE SEPARATED OXPHOS PROTEINS
111
giving problems, because most of their tryptic peptides are expected to be in the mass range in which PMF or peptide sequence tag (PST) cannot generally be applied. Moreover, many of these peptides may be lost prior and during LC-MS, due to hydrophobicity70. Figure 6 displays a schematic overview of the subunits of complex V identified in this analysis.
4.2. HUMAN LIVER TISSUE
Note: This section has been adapted from a book chapter, entitled: "Automated nanoflow liquid chromatography/tandem mass spectrometric identification of liver mitochondrial proteins". Experimental procedures (sample preparation, electrophoresis and mass spectrometric analyses) were similar to that for the heart mitochondrial analysis and therefore, we also refer to Appendix C. Important changes are mentioned throughout the text. (Handbook of Proteomic Methods 2003, pp. 181-191)
The effect of genetic deficiencies in the OXPHOS- and related genes is often tissue-dependent, and for some subunits, even tissue-specific isoforms exist72. Therefore, we also attempted to analyze the liver OXPHOS proteome. The mitochondrial proteome map of this tissue is shown in Figure 7. All the labeled protein spots from the map were excised from the gel, digested with trypsin, and the resulting digestion mixtures analyzed by mass spectrometry. The results are summarized in Table 3.
Figure 6. Identified subunits from ATP synthase, complex V. The model approximates the precise positioning of the subunits in the complex. The identified subunits are highlighted in yellow, while the subunits in pink were not identified. Note that only a few, mainly the transmembrane subunits, were not detected. Adapted from ref. 71

CHAPTER VII MS OF BN-PAGE SEPARATED OXPHOS PROTEINS
112
Table 3. Identification of the Excised Bands from the Human Liver Mitochondrial Proteome Map
Nr. Protein ID Mw (kDa) pI SWISS-PROT
1 Not identified - - - 2 Prohibitin 29.80 5.57 P35232 3 ATP synthase α-chain 55.21 8.28 P25705 4 ATP synthase β-chain 51.77 5.00 P06576 5 ATP synthase γ-chain 30.17 9.02 P36542 6 ATP synthase B-chain 24.63 9.10 P24539
7 ATP synthase α-chain ATP synthase O subunit
55.21 20.88
8.28 9.81
P25705 P48047
8 ATP synthase A-chain ATP synthase D-chain
24.82 18.36
10.09 5.22
P00846 O75947
9 Not identified - - - 10 ATP synthase E chain 7.80 9.35 P56385 11 60 kDa Heat shock protein
Ubiquinol-cytochrome c reductase complex core protein 2 57.96 46.78
5.24 7.74
P10809 P22695
12 ADP/ATP carrier protein 2,4-dienoyl-coA isomerase
35.38 32.15
9.86 8.79
Q59EI9 Q16698
13 Cytochrome c1 27.35 6.49 P08574 14 Superoxide dismutase [Mn] 22.20 6.86 P04179 15 Cytochrome c oxidase polypeptide Va
Cytochrome c oxidase polypeptide Vb Dopachrome tautomerase
12.51 10.61 56.69
4.88 6.33 6.59
P20674 P10606 P40126
16 Cytochrome c oxidase polypeptide VIIa-L 6.72 6.44 P14406 17 Catalase
60 kDa Heat shock protein Liver Carboxylesterase 1
59.62 57.96 62.52
6.95 5.24 6.15
P04040 P10809 P23141
18 Glutamate dehydrogenase 56.01 6.71 P00367 19 Hemoglobin β-chain 15.87 6.81 P02023 20 Glutamate dehydrogenase 56.01 6.71 P00367 21 Aldehyde dehydrogenase 54.44 5.69 P05091 22 Electron transfer flavoprotein α-subunit 35.08 8.62 P13804 23 Electron transfer flavoprotein β-subunit
Enoyl-coA hydratase 27.84 28.34
8.25 5.88
P38117 P30084
24 Aldehyde dehydrogenase 54.44 5.69 P05091 25 Electron transfer flavoprotein α-subunit 35.08 8.62 P13804 26 Electron transfer flavoprotein β-subunit 27.84 8.25 P38117 27 Cytochrome c oxidase polypeptide II 25.57 4.67 P00403
Figure 7| BN-PAGE of human liver mitochondrial extracts; 900 µg of protein extract was loaded. The labels indicate the bands that were excised for identification by mass spectrometric analysis methods.

CHAPTER VII MS OF BN-PAGE SEPARATED OXPHOS PROTEINS
113
Table 3. Continued.
28 Microsomal glutathione S-transferase 1 ATP synthase δ-chain
17.60 15.02
9.41 4.53
P10620 P30049
29 Not identified - - - 30 Not identified - - - 31 Propionyl-coA carboxylase α-chain 75.00 6.26 P05165 32 3-Ketoacyl-coA thiolase 41.92 8.32 P42765 33 Acyl-coA dehydrogenase 41.72 6.15 P16219 34 2,4-Dienoyl-coA reductase 32.15 8.79 Q16698 35 Enoyl-coA hydratase 31.35 8.50 P30084 36 Cytochrome b5
Cytochrome c oxidase polypeptide IV 15.20 17.20
4.88 9.16
P00167 P13073
37 Thioredoxin dependent peroxide reductase 27.69 7.68 P30048 38 NADH-ubiquinone oxidoreductase MLRQ subunit 9.37 9.42 O00483
Although the main pattern is similar, the BN-2D-PAGE of liver mitochondria displays some differences compared with that of heart. Therefore, we also focused on those proteins of which the bands were outside the OXPHOS lane to make a global analysis of the liver BN-2D-PAGE map and in order to have more information on the presence of other, potentially interesting, mitochondrial protein complexes. As the relatively poor resolution of the BN-PAGE technique generates spots that very often contain mixtures of multiple proteins, and because some of the proteins are very small or membranar and have a limited number of tryptic peptides, MS/MS data is mostly needed for unambiguous protein identification. By way of example, the identification of spot 31 by nanoLC-MS/MS is shown in Figure 8. The top part of the figure shows the total ion current chromatogram. From each peak, a MS spectrum, and a MS/MS spectrum has been taken, the latter on condition that the MS signal intensity reached a particular value. The MS spectrum of the labeled peak is shown in Figure 8B and the MS/MS spectrum in Figure 8C.
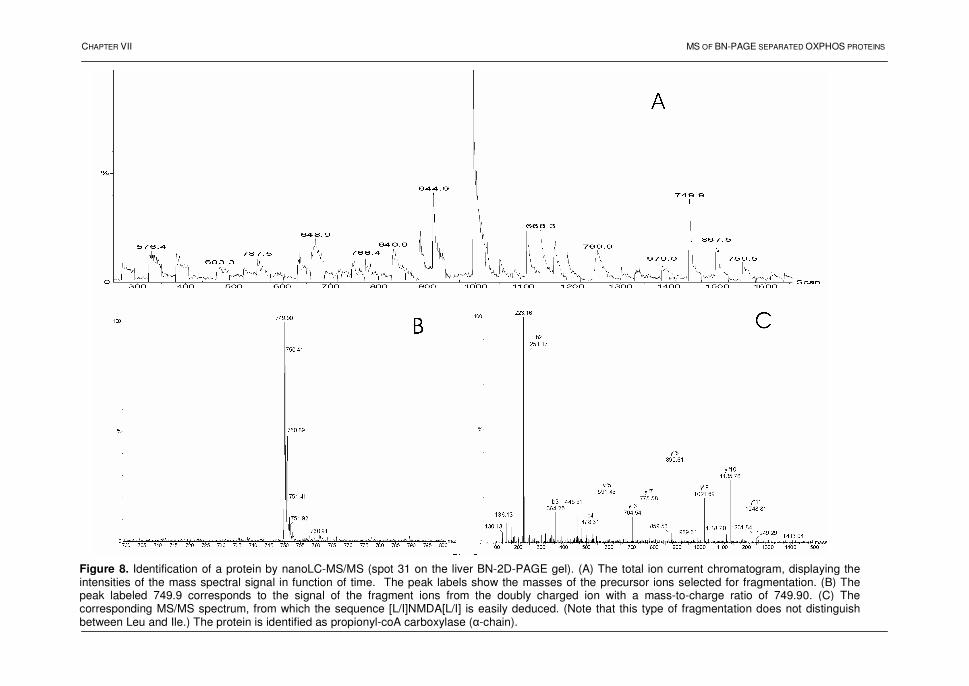
CHAPTER VII MS OF BN-PAGE SEPARATED OXPHOS PROTEINS
Figure 8. Identification of a protein by nanoLC-MS/MS (spot 31 on the liver BN-2D-PAGE gel). (A) The total ion current chromatogram, displaying the intensities of the mass spectral signal in function of time. The peak labels show the masses of the precursor ions selected for fragmentation. (B) The peak labeled 749.9 corresponds to the signal of the fragment ions from the doubly charged ion with a mass-to-charge ratio of 749.90. (C) The corresponding MS/MS spectrum, from which the sequence [L/I]NMDA[L/I] is easily deduced. (Note that this type of fragmentation does not distinguish between Leu and Ile.) The protein is identified as propionyl-coA carboxylase (α-chain).
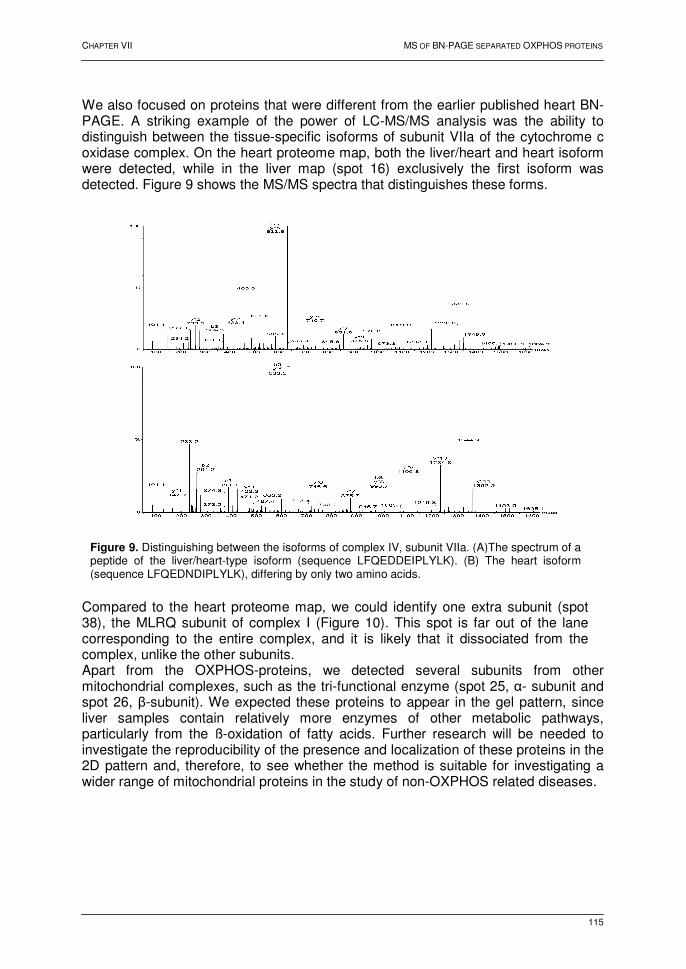
CHAPTER VII MS OF BN-PAGE SEPARATED OXPHOS PROTEINS
115
We also focused on proteins that were different from the earlier published heart BN-PAGE. A striking example of the power of LC-MS/MS analysis was the ability to distinguish between the tissue-specific isoforms of subunit VIIa of the cytochrome c oxidase complex. On the heart proteome map, both the liver/heart and heart isoform were detected, while in the liver map (spot 16) exclusively the first isoform was detected. Figure 9 shows the MS/MS spectra that distinguishes these forms.
Compared to the heart proteome map, we could identify one extra subunit (spot 38), the MLRQ subunit of complex I (Figure 10). This spot is far out of the lane corresponding to the entire complex, and it is likely that it dissociated from the complex, unlike the other subunits. Apart from the OXPHOS-proteins, we detected several subunits from other mitochondrial complexes, such as the tri-functional enzyme (spot 25, α- subunit and spot 26, β-subunit). We expected these proteins to appear in the gel pattern, since liver samples contain relatively more enzymes of other metabolic pathways, particularly from the ß-oxidation of fatty acids. Further research will be needed to investigate the reproducibility of the presence and localization of these proteins in the 2D pattern and, therefore, to see whether the method is suitable for investigating a wider range of mitochondrial proteins in the study of non-OXPHOS related diseases.
Figure 9. Distinguishing between the isoforms of complex IV, subunit VIIa. (A)The spectrum of a peptide of the liver/heart-type isoform (sequence LFQEDDEIPLYLK). (B) The heart isoform (sequence LFQEDNDIPLYLK), differing by only two amino acids.
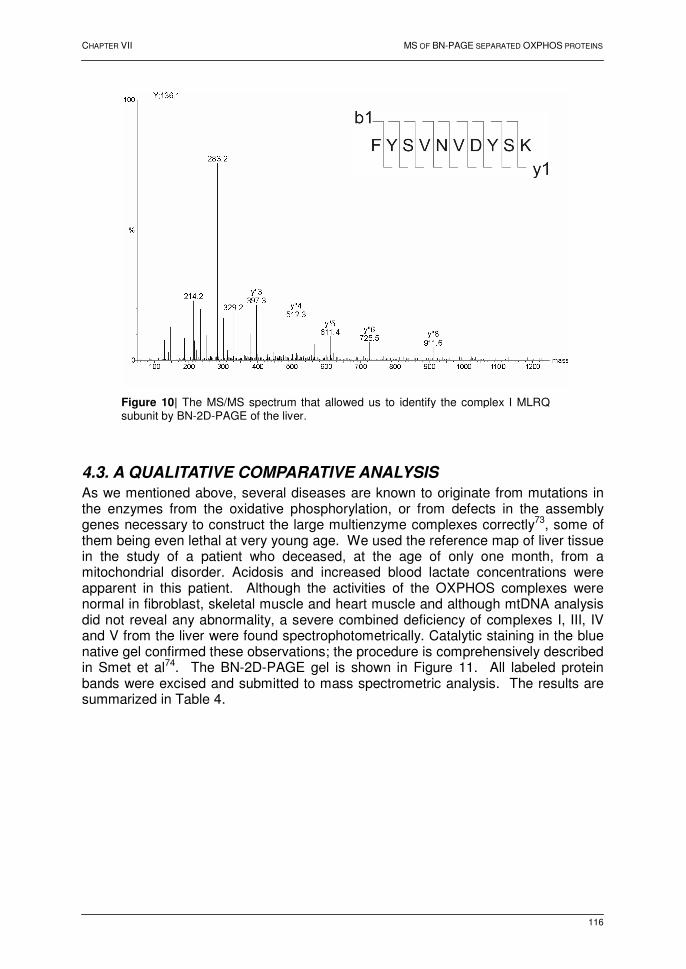
CHAPTER VII MS OF BN-PAGE SEPARATED OXPHOS PROTEINS
116
4.3. A QUALITATIVE COMPARATIVE ANALYSIS
As we mentioned above, several diseases are known to originate from mutations in the enzymes from the oxidative phosphorylation, or from defects in the assembly genes necessary to construct the large multienzyme complexes correctly73, some of them being even lethal at very young age. We used the reference map of liver tissue in the study of a patient who deceased, at the age of only one month, from a mitochondrial disorder. Acidosis and increased blood lactate concentrations were apparent in this patient. Although the activities of the OXPHOS complexes were normal in fibroblast, skeletal muscle and heart muscle and although mtDNA analysis did not reveal any abnormality, a severe combined deficiency of complexes I, III, IV and V from the liver were found spectrophotometrically. Catalytic staining in the blue native gel confirmed these observations; the procedure is comprehensively described in Smet et al74. The BN-2D-PAGE gel is shown in Figure 11. All labeled protein bands were excised and submitted to mass spectrometric analysis. The results are summarized in Table 4.
Figure 10| The MS/MS spectrum that allowed us to identify the complex I MLRQ subunit by BN-2D-PAGE of the liver.

CHAPTER VII MS OF BN-PAGE SEPARATED OXPHOS PROTEINS
117
Table 4. Identification of the Excised Bands from the Liver BN-2D-PAGE Map of the Patient
Nr. Protein ID Mw (kDa) pI SWISS-PROT
1 Not identified - - - 2 Prohibitin 29.80 5.57 P35232 3 ATP synthase α-chain 55.21 8.28 P25705 3a ATP synthase α-chain
UTP-Glucose-1-phosphate uridylyltransferase δ-1-Pyrroline-5-carboxylate dehydrogenase
55.21 56.82 59.03
8.28 7.67 6.96
P25705 Q07131 P30038
4 ATP synthase β-chain 51.77 5.00 P06576 5 ATP synthase γ-chain 30.17 9.02 P36542 6 ATP synthase B-chain
Superoxide dismutase [Mn] 24.63 22.20
9.10 6.86
P24539 P04179
7 ATP synthase α-chain ATP synthase β-chain ATP synthase D-chain
55.21 51.77 18.36
8.28 5.00 5.22
P25705 P06576 O75947
8 ATP synthase α-chain 55.21 8.28 P25705 9 ATP synthase α-chain
ATP synthase F chain 55.21 10.79
8.28 9.70
P25705 P56134
10 ATP synthase E chain 7.80 9.35 P56385 11 Trifunctional enzyme β-subunit 47.48 9.24 P55084 14 Superoxide dismutase [Mn]
ATP synthase D chain 22.20 18.36
6.86 5.22
P04179 P56385
15 ATP synthase F chain Ubiquinol-cytochrome C reductase complex 14 kDa protein
10.79 13.40
9.70 8.75
P56134 P14927
17 Catalase 60 kDa Heat shock protein Liver Carboxylesterase 1
59.62 57.96 62.52
6.95 5.24 6.15
P04040 P10809 P23141
17a Glutamate dehydrogenase Aldehyde dehydrogenase
56.01 54.44
6.71 5.69
P00367 P05091
18 Glutamate dehydrogenase 1, mitochondrial 56.01 6.71 P00367 19 Hemoglobin β-chain 15.87 6.81 P68871 19a Glutamate dehydrogenase 56.01 6.71 P00367 20 Glutamate dehydrogenase 56.01 6.71 P00367 21 Aldehyde dehydrogenase 54.44 5.69 P05091 23 Electron transfer flavoprotein β-subunit 27.84 8.25 P38117 24 Aldehyde dehydrogenase
Fumarate hydratase 54.44 50.08
5.69 6.99
P05091 P07954
25 Electron transfer flavoprotein α-subunit 35.08 8.62 P13804
Figure 11. (A) BN-PAGE of human liver mitochondrial extracts from an one month old patient. The labels indicate the bands that were excised for identification by mass spectrometric analyses.

CHAPTER VII MS OF BN-PAGE SEPARATED OXPHOS PROTEINS
118
Table 4. Continued. 26 Electron transfer flavoprotein β-subunit
Aldehyde dehydrogenase 27.84 54.44
8.25 5.69
P38117 P05091
30 3-Ketoacyl-coA thiolase Carbamoyl-phosphate synthase
41.92 160.55
8.32 5.92
P42765 P31327
32 3-Ketoacyl-coA thiolase 41.92 8.32 P42765 33 Acyl-coA dehydrogenase 41.72 6.15 P16219 34 2,4-Dienoyl-coA reductase
Enoyl-coA hydratase 32.15 28.34
8.79 5.88
Q16698 P30084
35 Enoyl-coA hydratase 31.35 8.50 P30084 36 Cytochrome B5 15.20 4.88 P00167 37 Thioredoxin-dependent peroxide reductase 27.69 7.68 P30048 38 Chaperonin 10 10.80 8.91 P61604 A ATP synthase β-chain
4-aminobutyrate aminotransferase 60 kDa Heat shock protein
51.77 53.27 57.96
5.00 7.19 5.24
P06576 P80404 P10809
B Ferritin light chain ATP synthase α-chain 60 kDa Heat shock protein Trifunctional enzyme α-subunit
19.89 55.21 57.96 79.01
5.51 8.28 5.24 8.98
P02792 P25705 P10809 P40939
C Electron transfer flavoprotein α-subunit Ornithine carbamoyltransferase Peroxisomal bifunctional enzyme
35.08 36.35 79.21
8.62 7.24 9.22
P13804 P00480 Q08426
Comparison of the protein pattern of the patient with the reference map clearly shows the absence of subunits from complex IV. In agreement with this, no single subunit was found from this complex, although some subunits could be identified in the reference map. Furthermore, one extra band was present on the BN-2-D-PAGE gel (Figure 12), and ATP synthase α subunit was identified in it. In addition, multiple 'forms' of the α and β subunits of ATP synthase were found all over the gel (Table 4). For example, the ATP synthase β subunit was identified by MALDI TOF-TOF MS in spot A, which is definitely not its proper position (Figure 13). These observations may be, speculatively, due to truncation or misfolding of the ATP synthase α and β subunits. The abnormal subunit composition of complex V was also confirmed by immunoblotting, using antibodies against complex V subunits.
Figure 12. (left) Detail of the upper left region of the human liver reference map (see Figure 7). (right) Detail of the picture provided in Figure 11 (upper left).

CHAPTER VII MS OF BN-PAGE SEPARATED OXPHOS PROTEINS
119
Figure 13. (A) A typical MS spectrum obtained with the MALDI TOF-TOF mass spectrometer from the tryptic digest of spot A in Figure 11. Using peptide mass fingerprint analysis, we could identify this protein as ATP synthase, β subunit. All the indicated masses match the theoretical values within 50 ppm. (B) MALDI TOF/TOF CID spectrum, obtained in the 1 kV mode, of the peak 1921.97 Da , labeled (*) in (A). Numerous ion fragments are present and the complete amino acid sequence (nl. DQEGQDVLLFIDNIFR) can be deduced from this spectrum. Logically, a MS/MS ion search (Mascot) identified this protein unambiguously as ATP synthase, β subunit. (Inset): Detail of the MS/MS spectrum in the 1kV (upper trace) and in the 2kV mode (lower trace) from the peak labeled in (A). Due to the higher energy used in 2kV mode, more high-energy side-chain fragmentation ions are present, allowing to distinguish isobaric amino acids.

CHAPTER VII MS OF BN-PAGE SEPARATED OXPHOS PROTEINS
120
Finally, the ubiquinol cytochrome c reductase core protein 2 was not detected in the gel, while this protein was well detected, and at the right position, in the reference map. Again, immunoblotting against this subunit clearly showed a decrease in abundance for the patient and, therefore, confirmed our result. In conclusion, the BN-2-D-PAGE liver proteome map of this patient reveals some indications on the deficiency in the oxidative phosphorylation.
4.4. CONCLUSIONS The technique of blue native polyacrylamide gel electrophoresis uses specific detergents, and has shown to be powerful in the analysis of membrane proteins. We identified a large number of the OXPHOS-related proteins by this technique, combined in a two-dimensional approach with SDS-PAGE, of the human heart mitochondrial proteome. On the other hand, the BN-2D-PAGE of liver mitochondria showed some differences compared with that of heart. We could profile less subunits of the OXPHOS system, possibly due to the presence of several other mitochondrial proteins involved in different metabolic pathways, such as the ß-oxidation of fatty acids. The reference map from human heart and liver are of considerable use for further analysis of post mortem material or bioptic samples, and can be used for the diagnosis of mitochondrial diseases due to defects in OXPHOS complexes or to proteins closely linked to these complexes. The fingerprints displayed by this technique rapidly show the absence of individual subunits, or even of complete shifts, in the pattern. For example, the map of human heart that we presented in our paper has been successfully utilized by others as a reference for the analysis of the mitochondrial proteome in response to chronic ethanol abuse75. We also used this approach for a qualitative comparative analysis of a patient, displaying a severe mitochondrial defect. Serious defects in the oxidative phosphorylation were revealed by comparison of the proteome maps, control and patient, from liver tissue. Further research will be needed to investigate the underlying biochemical cause(s) of this particular mitochondrial disorder.

CHAPTER VII MS OF BN-PAGE SEPARATED OXPHOS PROTEINS
121
5. REFERENCES
1 Holt, I.J.; Harding, A.E.; Morgan Hughes, J.A. Deletions of muscle mitochondrial DNA in patients
with mitochondrial myopathies. Nature 1988, 331, 717-719
2 Wallace, D.C.; Singh, G.; Lott, M.T. et al. Mitochondrial DNA mutation associated with Leber’s
hereditary optic neuropathy. Science 1988, 242, 1427-1430
3 Anderson, N.L.; Matheson, A.D.; Steiner, S. Proteomics: applications in basic and applied biology.
Curr. Opin. Biotech. 2000, 11, 408-412
4 McDonald, T.G.; Van Eyk, J.E. Mitochondrial proteomics: undercover in the lipid bilayer. Basic
Res. Cardiol. 2003, 98, 219-227
5 Lopez, M.F.; Melov, S. Applied Proteomics: mitochondrial proteins and effect on functions. Circ.
Res. 2002, 90, 380-389
6 Anderson, S.; Bankier, A.T.; Barrell, B.G. et al. Sequence and organization of the human
mitochondrial genome. Nature 1981, 290, 457-465
7 Westermann, B.; Neupart, W. ‘Omimics of the mitochondrion’: two complementary proteomics
approaches promise to move us closer to definition of the complete complement of proteins that
make up a mitochondrion. Nat. Biotechnol. 2003, 21, 239-240
8 Taylor, R.D.; Pfanner, N. The protein import and assembly machinery of the mitochondrial outer
membrane. Biochim. Biophys. Acta 2004, 1658, 37-43
9 Truscott, K.N.; Brandner, K.; Pfanner, N. Mechanisms of protein import into mitochondria. Curr.
Biol. 2003, 13, R326-337
10 Saraste, M. Oxidative phosphorylation at the fin de siecle. Science 1999, 283, 1488–1493
11 Voet, D.; Voet, J.G. Biochemistry, 2nd edition, Wiley & Sons, Inc. 1995, pp. 563-598
12 Walker, J.E.; Skehel, J.M.; Buchanan, S.K. Structural analysis of NADH:ubiquinone
oxidoreductase from bovine heart mitochondria. Methods Enzymol. 1995, 260, 14-34
13 Skehel, J.M.; Fearnley, I.M.; Walker, J.E. NADH: ubiquinone oxidoreductase from bovine heart
mitochondria: sequence of a novel 17.2-kDa subunit. FEBS Lett. 1998, 438, 301-305
14 Carroll, J.; Shannon, R.J.; Fearnley, I.M. et al. Definition of the nuclear encoded protein
composition of bovine heart mitochondrial complex I - Identification of two new subunits. J. Biol.
Chem. 2002, 277, 50311–50317
15 Hatefi, Y. The mitochondrial electron transport and oxidative phosphorylation system. Annu. Rev.
Biochem. 1985, 34, 1015-1069
16 Ohnishi, T. Iron-sulfur clusters/semiquinones in complex I. Biochim. Biophys. Acta 1998, 1364,
186–206
17 Friedrich, T.; Scheide, D. The respiratory complex I of bacteria, archaea and eukarya and its
module common with membrane-bound multi-subunit hydrogenases. FEBS Lett. 2000, 479, 1–5
18 Yano, T.; Magnitsky, S.; Ohnishi, T. Characterization of the complex I-associated ubisemiquinone
species: toward the understanding of their functional roles in the electron/proton transfer reaction.
Biochim. Biophys. Acta 2000, 1459, 299–304
19 Schuelke, M.; Loeffen, J.; Mariman, E. et al. Cloning of the human mitochondrial 51 kDa subunit
(NDUFV1) reveals a 100% antisense homology of its 3’UTR with the 5’UTR of the α-interferon
inducible protein (IP-30) precursor: is this a link between mitochondrial myopathy and
inflammation? Biochem. Biophys. Res. Commun. 1998, 245, 599-606
20 Loeffen, J.; van den Heuvel, L.; Smeets, R. et al. cDNA sequence and chromosomal localization
of the remaining three human nuclear encoded iron sulphur protein (IP) subunits of complex I: the
human IP fraction is completed. Biochem. Biophys. Res. Commun. 1998, 247, 751-758

CHAPTER VII MS OF BN-PAGE SEPARATED OXPHOS PROTEINS
122
21 Loeffen, J.; Triepels, R.H.; van den Heuvel, L.P. et al. cDNA of eight nuclear encoded subunits of
NADH:ubiquinone oxidoreductase: human complex I cDNA characterization completed. Biochem.
Biophys. Res. Commun. 1998, 253, 415-422
22 Grigorieff N. Three-dimensional structure of bovine NADH : Ubiquinone oxidoreductase (Complex
I) at 22 angstrom in ice. J. Mol. Biol. 1998, 277, 1033–1046
23 Guenebaut, V.; Schlitt, A.; Weiss, H.; Friedrich, T. Consistent structure between bacterial and
mitochondrial NADH : ubiquinone oxidoreductase (complex I). J. Mol. Biol. 1998, 276, 105–112
24 Kadenbach, B.; Scheneyder, B.; Mell, O. et al. Respiratory chain proteins. Rev. Neurol. 1991, 147,
436-442
25 Trumpower, B.L.; Gennis, R.B. Energy transduction by cytochrome complexes in mitochondrial
and bacterial respiration - the enzymology of coupling electron-transfer reactions to
transmembrane proton translocation. Annu. Rev. Biochem. 1994, 63, 675–716
26 Berry, E.A.; Guergova-Kurus, M.; Huang, L. et al. Structure and function of cytochrome bc
complexes. Annu. Rev. Biochem. 2000, 69, 1005–75
27 Mathews, C.K.; Van Holde, K.E. Biological oxidations, electron transport, and oxidative
phosphorylation. In: Biochemistry, 2nd edition. Edited by: Scanlan-Rohrer, A.; Parlante, S.; With,
L., Melon Park, Benjamin/Cummings, Inc. 1996, pp. 520-553
28 Yoshikawa, S.; Shinzawa-Itoh, K.; Tsukihara, T. X-ray structure and the reaction mechanism of
bovine heart cytochrome c oxidase. J. Inorg. Biochem. 2000, 82, 1–7
29 Ludwig, B.; Bender, E.; Arnold, S. et al. Cytochrome c oxidase and the regulation of oxidative
phosphorylation. Chembiochem. 2001, 2, 392–403
30 Takamiya, S.; Lindorfer, M.A.; Capaldi, R.A. Purification of all thirteen polypeptides of bovine heart
cytochrome c oxidase from one aliquot of enzyme. FEBS Lett. 1987, 218, 277-282
31 Buse, G.; Meinecke, L.; Bruch, B. The protein formula of beef heart cytochrome c oxidase. J. Inorg.
Biochem. 1985, 23, 149-153
32 Lutter, R.; Saraste, M.; Vanwalraven, H.S. et al. F1F0-ATP synthase from bovine heart
mitochondria - development of the purification of a monodisperse oligomycin-sensitive ATPase.
Biochem. J. 1993, 295, 799–806
33 Kadenbach, B.; Scheneyder, B.; Mell, O. et al. Respiratory chain proteins. Rev. Neurol. 1991, 147,
436-442
34 Walker, J.E.; Collinson, I.R.; van Raaij, M.J. et al. Structural analysis of ATP synthase from bovine
heart mitochondria. Methods Enzymol. 1995, 260, 163-190
35 Walker, J.E. Determination of the structures of respiratory enzyme complexes from mammalian
mitochondria. Biochim. Biophys. Acta 1995, 1271, 221-227
36 Mitchell, P. Vectorial chemistry and the molecular mechanics of chemiosmotic coupling: power
transmission by proticity. Biochem. Soc. Trans. 1976, 4, 398-430
37 Rottenberg, H. Decoupling of oxidative phosphorylation and photophosphorylation. Biochim.
Biophys. Acta 1990, 1018, 1-17
38 Brown G.C. Control of respiration and ATP synthesis in mammalian mitochondria and cells.
Biochem. J. 1992, 284, 1-13
39 Rolfe, D.F.; Brand, M.D. Contribution of mitochondrial proton leak to skeletal muscle respiration
and to standard metabolic rate. Am. J. Physiol. 1996, 271, C1380-1389
40 Rolfe, D.F.; Newman, J.M.; Buckingham, J.A. et al. Contribution of mitochondrial proton leak to
respiration rate in working skeletal muscle and liver and to SMR. Am. J. Physiol. 1999, 276, C692-
699
CHAPTER VII MS OF BN-PAGE SEPARATED OXPHOS PROTEINS
123
41 Schägger, H.; von Jagow, G. Blue native electrophoresis for isolation of membrane protein
complexes in enzymatically active form. Anal. Biochem. 1991, 199, 223-331
42 Poetsch, A.; Neff, D.; Seelert, H. et al. Dye removal, catalytic activity and 2D crystallization of
chloroplast H+-ATP synthase purified by blue native electrophoresis. Biochim. Biophys. Acta 2000,
1466, 339-349
43 Heazlewood, J.L.; Howell, K.A.; Whelan, J. et al. Towards an analysis of the rice mitochondrial
proteome. Plant Physiol. 2003, 132, 230-242
44 Schägger, H.; von Jagow, G. Blue native electrophoresis for isolation of membrane protein
complexes in enzymatically active form. Anal. Biochem. 1991, 199, 223-331
45 Schägger, H.; Cramer, W.A.; von Jagow, G. Analysis of molecular masses and oligomeric states
of protein complexes by blue native electrophoresis and isolation of membrane protein complexes
by two-dimensional native electrophoresis. Anal. Biochem. 1994, 217, 220-230
46 Zerbetto, E.; Vergani, L.; Dabbeni-Sala, F. Quantification of muscle mitochondrial oxidative
phosphorylation enzymes via histochemical staining of blue native polyacrylamide gels.
Electrophoresis 1997, 18, 2059-2064
47 Van Coster, R.; Smet, J.; George, E. et al. Blue native polyacrylamide gel electrophoresis: a
powerful tool in diagnosis of oxidative phosphorylation defects. Pediatric Res. 2001, 50, 658-665
48 Klement, P.; Nijtmans, L.G.; Van den Bogert, C. et al. Analysis of oxidative-phosphorylation
complexes in cultured human fibroblasts and amniocytes by blue-native-electrophoresis using
mitoplasts isolated with the help of digitonin. Anal. Biochem. 1995, 231, 218-224
49 Bentlage, H.; De Coo, R.; ter Laak, H. et al. Human-diseases with defects in oxidative-
phosphorylation: decreased amounts of assembled oxidative-phosphorylation complexes in
mitochondrial encephalomyopathies. Eur. J. Biochem. 1995, 227, 909-915
50 Houstek, J.; Klement, P.; Hermanska, J. et al. Complex approach to prenatal diagnosis of
cytochrome c oxidase deficiencies. Prenat. Diagn. 1999, 19, 552-558
51 Schägger, H. Quantification of oxidative phosphorylation enzymes after blue native
electrophoresis and two-dimensional resolution: Normal complex I protein amounts in Parkinson's
disease conflict with reduced catalytic activity. Electrophoresis 1995, 16, 763-770
52 Schägger, H.; Ohm, T.G. Human diseases with defects in oxidative phosphorylation: F1F0 ATP-
synthase defects in Alzheimer disease revealed by blue native polyacrylamide gel electrophoresis.
Eur. J. Biochem. 1995, 227, 916-923
53 Culvenor, J.G.; Ilaya, N.T.; Ryan, M.T. et al. Characterization of presinilin complexes from mouse
and human brain using Blue Native gel electrophoresis reveals high expression in embryonic brain
and minimal change in complex mobility with pathogenic presinilin mutations. Eur. J. Biochem.
2004, 271, 375-385
54 Rasmusson, A.G.; Agius, S.C. Rotenone-insensitive NAD(P)H dehydrogenases in plants:
immuno-detection and distribution of native proteins in mitochondria. Plant Physiol. Biochem. 2001,
39, 1057-1066
55 Kruft, V.; Eubel, H.; Jänsch, L. et al. Proteomic approach to identify novel mitochondrial proteins in
Arabidopsis. Plant Physiol. 2001, 127, 1694-1710
56 Millar, H.; Sweetlove, L.; Giege, P. et al. Analysis of the Arabidopsis mitochondrial proteome.
Plant Physiol. 2001, 127, 1711-1727
57 Nijtmans, L.G.J.; Taanman, J.W.; Muijsers, A.O. et al. Assembly of cytochrome-c oxidase in
cultured human cells. Eur. J. Biochem. 1998, 254, 389-394
58 Van Coster, R.; Smet, J.; George, E. et al. Blue native polyacrylamide gel electrophoresis: a
powerful tool in diagnosis of oxidative phosphorylation defects. Pediatric Res. 2001, 50, 658-665

CHAPTER VII MS OF BN-PAGE SEPARATED OXPHOS PROTEINS
124
59 Van Kuilenburg, A.B.P.; Van Beeumen, J.J.; Demol, H. et al. Subunit IV of human cytochrome c
oxidase, polymorphism and a putative isoform. Biochim. Biophys. Acta 1992, 1119, 218-224
60 Van Beeumen, J.J.; Van Kuilenburg, A.B.P.; Van Bun, S. et al. Demonstration of 2 isoforms of
subunit VIIa of cytochrome c oxidase from human skeletal muscle: implications for mitochondrial
myopathies. FEBS Lett. 1990, 263, 213-216
61 Schägger, H. Quantification of oxidative phosphorylation enzymes after blue native
electrophoresis and two-dimensional resolution: Normal complex I protein amounts in Parkinson's
disease conflict with reduced catalytic activity. Electrophoresis 1995, 16, 763-770
62 Nijtmans, L.G.J.; de Jong, L.; Sanz, M.A. et al. Prohibitins act as a membrane-bound chaperone
for the stabilization of mitochondrial proteins. EMBO J. 2000, 19, 2444-2451
63 Souri, M.; Aoyama, T.; Hoganson, G. et al. Very-long-chain acyl-CoA dehydrogenase subunit
assembles to the dimer form on mitochondrial inner membrane. FEBS Lett. 1998, 426, 187-190
64 Susin, S.A.; Lorenzo, H.K.; Zamzami, N. et al. Molecular characterization of mitochondrial
apoptosis-inducing factor. Nature 1999, 397, 441-446
65 Angell, J.E.; Lindner, D.J.; Shapiro, P.S. et al. Identification of GRIM-19, a novel cell death-
regulatory gene induced by the interferon-beta and retinoic acid combination, using a genetic
approach. J. Biol. Chem. 2000, 275, 33416-33426
66 Daugas, E.; Nochy, D.; Ravagnan, L. et al. Apoptosis-inducing factor (AIF): a ubiquitous
mitochondrial oxidoreductase involved in apoptosis. FEBS Lett. 2000, 476, 118-123
67 Lorenzo, H.K.; Susin, S.A. Mitochondrial effectors in caspase-independent cell death. FEBS Lett.
2004, 557,14-20
68 Fearnley, I.M.; Carroll, J.; Shannon, R.J. et al. GRIM-19, a cell death regulatory gene product, is a
subunit of bovine mitochondrial NADH : Ubiquinone oxidoreductase (complex I). J. Biol. Chem.
2001, 276, 38345-38348
69 Rudd, K.E.; Humphery-Smith, I.; Wasinger, V.C. et al. Low molecular weight proteins: A challenge
for post-genomic research. Electrophoresis 1998, 19, 536-544
70 van Montfort, B.A.; Canas, B.; Duurkens, R. et al. Improved in-gel approaches to generate peptide
maps of integral membrane proteins with matrix-assisted laser desorption/ionization time-of-flight
mass spectrometry. J. Mass Spec. 2002, 37, 322–330
71 Patton, W.F.; Schulenberg, B.; Steinberg, T.H. Two-dimensional gel electrophoresis; better than a
poke in the ICAT? Curr. Opin. Biotechnol. 2002, 13, 321-328
72 Van Kuilenburg, A.B.P.; Van Beeumen, J.J.; Van der Meer, N.M. et al. Subunits VIIa,b,c of human
cytochrome c oxidase. Identification of both 'heart-type' and 'liver-type' isoforms of subunit VIIa in
human heart. Eur. J. Biochem. 1992, 203, 193-199
73 Schoffner, J.M. An introduction: oxidative phosphorylation diseases. Semin. Neurol. 2001, 21,
237-250
74 Smet, J.; Devreese, B.; Van Beeumen, J. et al. Non-denaturing polyacrylamide gel electrophoresis
as a method for studying protein interactions: applications in the analysis of mitochondrial
oxidative phosphorylation complexes. Cell Biology 2005, pp. 259-264
75 Venkatraman, A.; Landar, A.; Davis, A.J. et al. Modification of the Mitochondrial Proteome in
Response to the Stress of Ethanol-dependent Hepatotoxicity. J. Biol. Chem. 2004, 279, 22092-
22101

CHAPTER VIII
125
CHAPTER VIII
PROTEIN PROFILING OF
THE MYELIN SHEATH
Multi-dimensional liquid chromatography has been shown to be successful in the analysis of membrane proteins and highly basic proteins. We have applied this strategy for profiling the protein composition of the myelin sheath. This specialized membrane contains a specific selection of proteins and, moreover, is overwhelmingly dominated by just two types of protein, the myelin basic protein and proteolipid protein. The identification and characterization of the other proteins, in this context, is thus a real challenge. In this chapter, we will present and discuss the results from our proteomic approach, using multi-dimensional liquid chromatography in combination with MALDI TOF-TOF mass spectrometry. A comparison between this strategy and a classical approach, i.e. two-dimensional gel electrophoresis and mass spectrometry, is given and discussed. Note: This chapter has been adapted from the paper, entitled: "Profiling of myelin proteins by 2D-gel electrophoresis and multidimensional liquid chromatography coupled to MALDI TOF-TOF mass spectrometry". Details on the experimental procedures are provided in appendix D. (Journal of Proteome Research 2005, in press)

CHAPTER VIII PROTEOMIC ANALYSIS OF THE MYELIN SHEATH
126
1. INTRODUCTION The myelin sheath is formed by oligodendrocytes in the central nervous system (CNS) that wrap layer upon layer of their own membrane (up to a hundred times) around an axon in a tight spiral, thereby forming an electrically insulating sheath1 (Figure 1). This sheath plays a key role in the function of the nervous system by allowing fast saltatory conduction of nerve pulses. Serious neurological disorders can occur due to loss, or damage, of this specialized membrane2. Multiple sclerosis, for example, is a frequently occurring disease in adults, characterized by plaques of demyelination in the CNS3. More generalized demyelination is seen in several diseases, affecting mainly children, due to congenital defects in lysosomal and peroxisomal proteins4. Much less defined is the large group of dysmyelinating diseases where the myelin is not degraded but has never been well formed. A defect has been found in only one of these diseases; it turned out to be located in the proteolipid protein (PLP)5.
The myelin sheath is a specialized membrane containing very little water, high amounts of lipids (~70%) and a specific selection of proteins (~30%). The protein fraction is dominated by a few major proteins, including myelin basic protein (MBP), proteolipid protein (PLP) and its alternatively spliced isoforms (DM-20), which account for most of the protein mass (~30% and ~50%, respectively)6. However, the identity and function of many minor proteins are beginning to be revealed. The protein composition of the myelin sheath has already been investigated by several proteomic strategies7-9. In these studies, proteins were separated by two-dimensional gel electrophoresis (2D-PAGE), using different experimental conditions, followed by identifications using Western blotting. Recently, Taylor and co-workers10 reported the first proteome map of the myelin sheath, namely that of mice. In that study, 98 unique proteins were identified using 2D-PAGE, followed by mass spectrometry (MS) and/or 2D-immunoblotting. To date, the most widely used strategy in proteomics is still 2D-PAGE, followed by enzymatic digestion and MS analysis11. Although the resolving power is excellent, 2D-PAGE suffers from some major drawbacks12,13. The dynamic range of the technique is limited, which makes the analysis of low abundant proteins difficult. This is particularly the case for myelin, given the before mentioned dominance of MBP and PLP. Moreover, myelin consists mainly of membrane proteins and basic proteins, two classes of proteins rarely represented in a 2D-gel14,15. Some of these important
Figure 1. Detail of the myelin sheath. Action potentials propagate via saltatory conduction in myelinated nerves. Action potentials are generated at the initial segment and propagate to and are refreshed at the nodes of Ranvier, the periodic interruptions between myelin segments.
CHAPTER VIII PROTEOMIC ANALYSIS OF THE MYELIN SHEATH
127
shortcomings can be overcome by using chromatography coupled to MS detection. In this alternative approach, commonly referred to as 'shotgun proteomics', the proteins are digested and the generated peptides are separated by multidimensional liquid chromatography (MDLC). The peptides are then further identified by MS. The combination of various chromatographic techniques has already been successfully applied in a variety of proteomic approaches. The different orthogonal strategies are discussed and reviewed in two references16,17. In particular, the combination of SCX chromatography in the first dimension and RP chromatography in the second dimension is the most frequently used approach for the separation of complex peptide mixtures17. For example, Yates and co-workers18 analyzed the proteome of Saccharomyces cerevisiae via the Multidimensional Protein Identification Technology (MudPIT) using a biphasic column. Approximately 1500 proteins of the yeast proteome could be identified using this approach. In other applications, the SCX chromatographic and RP chromatographic steps are carried out using two distinct columns. The peptides are thereby eluted stepwise by plugs of increasing salt concentrations or by applying a semi-continuous gradient, are 'on-line' trapped on a short enrichment column, and are further separated on a nano-RP column19,20. The peak capacity of a two-dimensional liquid chromatography (2D-LC) system can be significantly increased in an 'off-line' 2D-LC setup21-23. In this strategy, the peptide mixture is eluted by applying a linear salt gradient followed by collection of the fractions. The fractions are then subjected to RP chromatography. This off-line setup appeared to be more flexible and superior to on-line variants22. In shotgun proteomics, electrospray ionization (ESI) is usually the interface of choice between the column effluent and the mass spectrometer. However, the chromatographic separation limits the analysis time, and not all peptides in a complex sample are amenable to tandem mass spectrometry (MS/MS). Several experimental schemes, such as peak parking24 and the use of exclusion lists, have been developed to circumvent this problem. Although these efforts increase the total number of peptides analyzed, many of them remain unidentified. This is especially true for low abundance species coeluting with more abundant ones. On the other hand, the use of MALDI in shotgun proteomics offers several advantages compared to ESI25,26. The sample analysis can be performed independently from the separation, and immobilization of the column effluent enables archiving of the sample. In addition, the number of peaks analyzed by MS/MS in a given spot is theoretically almost unlimited and precursor selection can be done in a result-dependent manner. By also analyzing the minor components, eventually co-eluting with more abundant ones, the sample coverage can be comprehensively improved. In the present study, we evaluate a bottom-up shotgun proteomic approach and compare the results with those obtained by a classical 2D-PAGE approach. In the electrophoretic based strategy, proteins were separated by 2D-PAGE and identified by either MALDI TOF-TOF or nanoLC-MS/MS. In the 2D-LC MALDI TOF-TOF setup, the isolated myelin proteins were proteolytically digested, separated by strong cation exchange (SCX) chromatography and fractionated. The fractions were then further analyzed by reversed-phase (RP) chromatography. The column effluent was spotted 'on-line' onto a MALDI target and further analyzed by MALDI TOF-TOF MS.
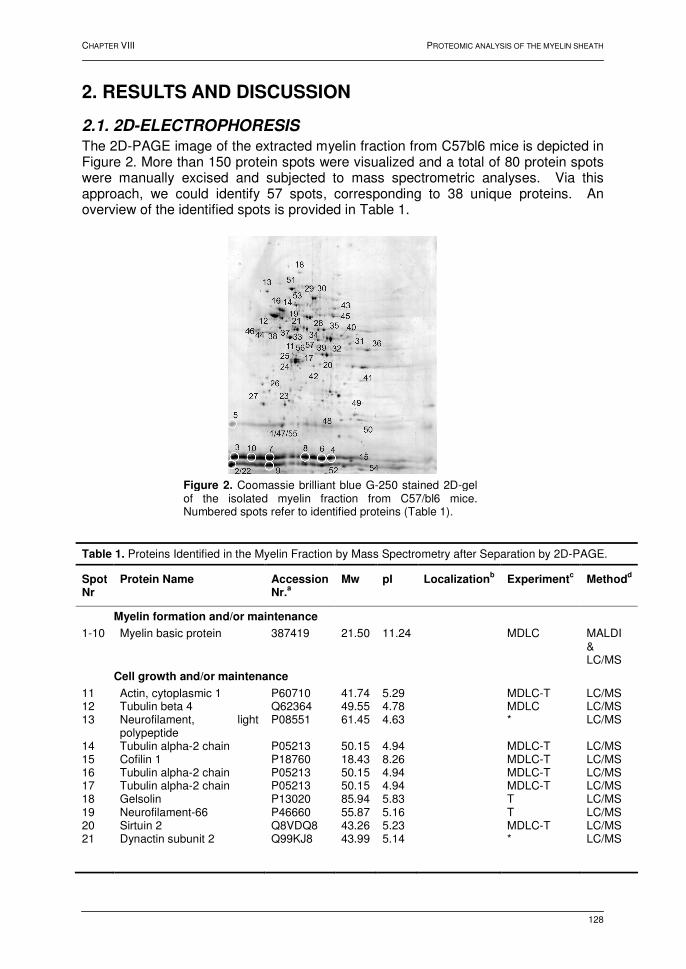
CHAPTER VIII PROTEOMIC ANALYSIS OF THE MYELIN SHEATH
128
2. RESULTS AND DISCUSSION
2.1. 2D-ELECTROPHORESIS
The 2D-PAGE image of the extracted myelin fraction from C57bl6 mice is depicted in Figure 2. More than 150 protein spots were visualized and a total of 80 protein spots were manually excised and subjected to mass spectrometric analyses. Via this approach, we could identify 57 spots, corresponding to 38 unique proteins. An overview of the identified spots is provided in Table 1.
Table 1. Proteins Identified in the Myelin Fraction by Mass Spectrometry after Separation by 2D-PAGE.
Spot Nr
Protein Name Accession Nr.
a
Mw pI Localizationb Experiment
c Method
d
Myelin formation and/or maintenance
1-10 Myelin basic protein 387419 21.50 11.24 MDLC MALDI & LC/MS
Cell growth and/or maintenance
11 Actin, cytoplasmic 1 P60710 41.74 5.29 MDLC-T LC/MS 12 Tubulin beta 4 Q62364 49.55 4.78 MDLC LC/MS 13 Neurofilament, light
polypeptide P08551 61.45 4.63 * LC/MS
14 Tubulin alpha-2 chain P05213 50.15 4.94 MDLC-T LC/MS 15 Cofilin 1 P18760 18.43 8.26 MDLC-T LC/MS 16 Tubulin alpha-2 chain P05213 50.15 4.94 MDLC-T LC/MS 17 Tubulin alpha-2 chain P05213 50.15 4.94 MDLC-T LC/MS 18 Gelsolin P13020 85.94 5.83 T LC/MS 19 Neurofilament-66 P46660 55.87 5.16 T LC/MS 20 Sirtuin 2 Q8VDQ8 43.26 5.23 MDLC-T LC/MS 21 Dynactin subunit 2
Q99KJ8 43.99 5.14 * LC/MS
Figure 2. Coomassie brilliant blue G-250 stained 2D-gel of the isolated myelin fraction from C57/bl6 mice. Numbered spots refer to identified proteins (Table 1).
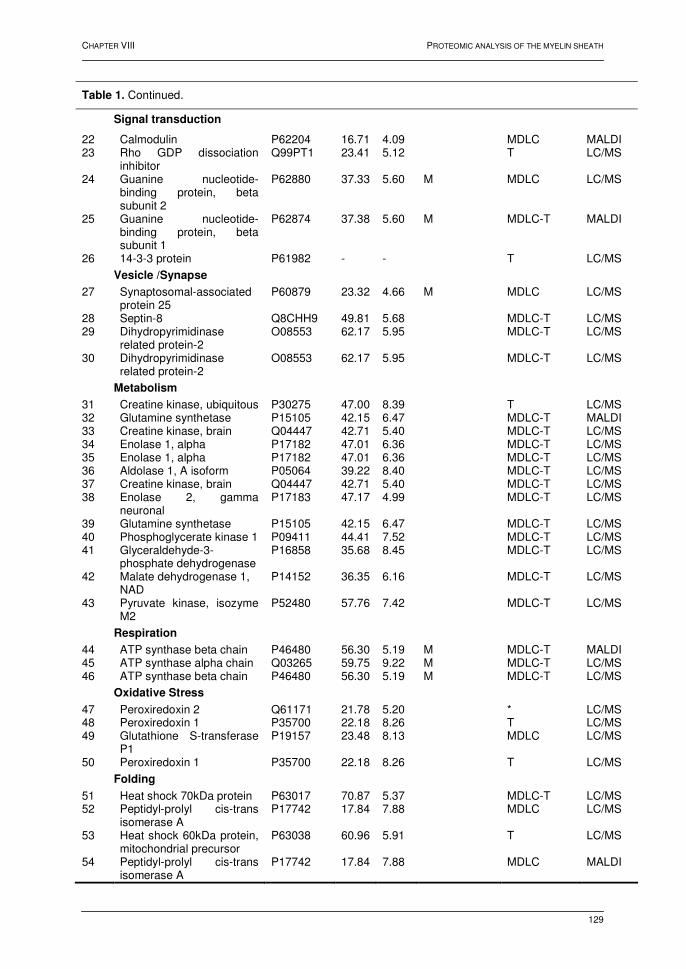
CHAPTER VIII PROTEOMIC ANALYSIS OF THE MYELIN SHEATH
129
Table 1. Continued.
Signal transduction
22 Calmodulin P62204 16.71 4.09 MDLC MALDI 23 Rho GDP dissociation
inhibitor Q99PT1 23.41 5.12 T LC/MS
24 Guanine nucleotide-binding protein, beta subunit 2
P62880 37.33 5.60 M MDLC LC/MS
25 Guanine nucleotide-binding protein, beta subunit 1
P62874 37.38 5.60 M MDLC-T MALDI
26 14-3-3 protein P61982 - - T LC/MS
Vesicle /Synapse
27 Synaptosomal-associated protein 25
P60879 23.32 4.66 M MDLC LC/MS
28 Septin-8 Q8CHH9 49.81 5.68 MDLC-T LC/MS 29 Dihydropyrimidinase
related protein-2 O08553 62.17 5.95 MDLC-T LC/MS
30 Dihydropyrimidinase related protein-2
O08553 62.17 5.95 MDLC-T LC/MS
Metabolism
31 Creatine kinase, ubiquitous P30275 47.00 8.39 T LC/MS 32 Glutamine synthetase P15105 42.15 6.47 MDLC-T MALDI 33 Creatine kinase, brain Q04447 42.71 5.40 MDLC-T LC/MS 34 Enolase 1, alpha P17182 47.01 6.36 MDLC-T LC/MS 35 Enolase 1, alpha P17182 47.01 6.36 MDLC-T LC/MS 36 Aldolase 1, A isoform P05064 39.22 8.40 MDLC-T LC/MS 37 Creatine kinase, brain Q04447 42.71 5.40 MDLC-T LC/MS 38 Enolase 2, gamma
neuronal P17183 47.17 4.99 MDLC-T LC/MS
39 Glutamine synthetase P15105 42.15 6.47 MDLC-T LC/MS 40 Phosphoglycerate kinase 1 P09411 44.41 7.52 MDLC-T LC/MS 41 Glyceraldehyde-3-
phosphate dehydrogenase P16858 35.68 8.45 MDLC-T LC/MS
42 Malate dehydrogenase 1, NAD
P14152 36.35 6.16 MDLC-T LC/MS
43 Pyruvate kinase, isozyme M2
P52480 57.76 7.42 MDLC-T LC/MS
Respiration
44 ATP synthase beta chain P46480 56.30 5.19 M MDLC-T MALDI 45 ATP synthase alpha chain Q03265 59.75 9.22 M MDLC-T LC/MS 46 ATP synthase beta chain P46480 56.30 5.19 M MDLC-T LC/MS
Oxidative Stress
47 Peroxiredoxin 2 Q61171 21.78 5.20 * LC/MS 48 Peroxiredoxin 1 P35700 22.18 8.26 T LC/MS 49 Glutathione S-transferase
P1 P19157 23.48 8.13 MDLC LC/MS
50 Peroxiredoxin 1 P35700 22.18 8.26 T LC/MS
Folding
51 Heat shock 70kDa protein P63017 70.87 5.37 MDLC-T LC/MS 52 Peptidyl-prolyl cis-trans
isomerase A P17742 17.84 7.88 MDLC LC/MS
53 Heat shock 60kDa protein, mitochondrial precursor
P63038 60.96 5.91 T LC/MS
54 Peptidyl-prolyl cis-trans isomerase A
P17742 17.84 7.88 MDLC MALDI
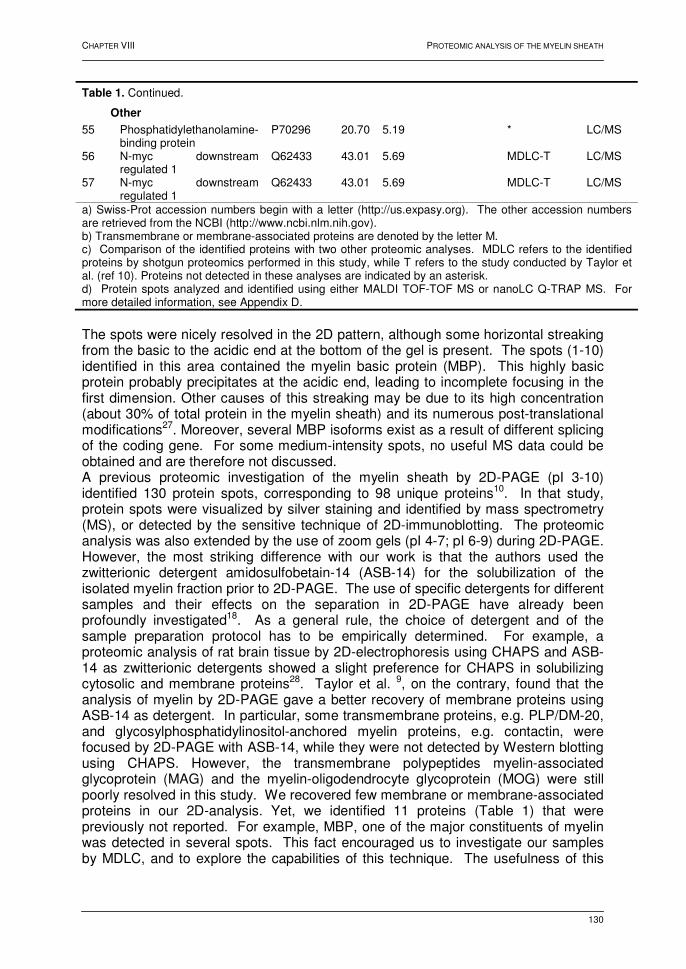
CHAPTER VIII PROTEOMIC ANALYSIS OF THE MYELIN SHEATH
130
Table 1. Continued.
Other
55 Phosphatidylethanolamine-binding protein
P70296 20.70 5.19 * LC/MS
56 N-myc downstream regulated 1
Q62433 43.01 5.69 MDLC-T LC/MS
57 N-myc downstream regulated 1
Q62433 43.01 5.69 MDLC-T LC/MS
a) Swiss-Prot accession numbers begin with a letter (http://us.expasy.org). The other accession numbers are retrieved from the NCBI (http://www.ncbi.nlm.nih.gov). b) Transmembrane or membrane-associated proteins are denoted by the letter M. c) Comparison of the identified proteins with two other proteomic analyses. MDLC refers to the identified proteins by shotgun proteomics performed in this study, while T refers to the study conducted by Taylor et al. (ref 10). Proteins not detected in these analyses are indicated by an asterisk. d) Protein spots analyzed and identified using either MALDI TOF-TOF MS or nanoLC Q-TRAP MS. For more detailed information, see Appendix D.
The spots were nicely resolved in the 2D pattern, although some horizontal streaking from the basic to the acidic end at the bottom of the gel is present. The spots (1-10) identified in this area contained the myelin basic protein (MBP). This highly basic protein probably precipitates at the acidic end, leading to incomplete focusing in the first dimension. Other causes of this streaking may be due to its high concentration (about 30% of total protein in the myelin sheath) and its numerous post-translational modifications27. Moreover, several MBP isoforms exist as a result of different splicing of the coding gene. For some medium-intensity spots, no useful MS data could be obtained and are therefore not discussed. A previous proteomic investigation of the myelin sheath by 2D-PAGE (pI 3-10) identified 130 protein spots, corresponding to 98 unique proteins10. In that study, protein spots were visualized by silver staining and identified by mass spectrometry (MS), or detected by the sensitive technique of 2D-immunoblotting. The proteomic analysis was also extended by the use of zoom gels (pI 4-7; pI 6-9) during 2D-PAGE. However, the most striking difference with our work is that the authors used the zwitterionic detergent amidosulfobetain-14 (ASB-14) for the solubilization of the isolated myelin fraction prior to 2D-PAGE. The use of specific detergents for different samples and their effects on the separation in 2D-PAGE have already been profoundly investigated18. As a general rule, the choice of detergent and of the sample preparation protocol has to be empirically determined. For example, a proteomic analysis of rat brain tissue by 2D-electrophoresis using CHAPS and ASB-14 as zwitterionic detergents showed a slight preference for CHAPS in solubilizing cytosolic and membrane proteins28. Taylor et al. 9, on the contrary, found that the analysis of myelin by 2D-PAGE gave a better recovery of membrane proteins using ASB-14 as detergent. In particular, some transmembrane proteins, e.g. PLP/DM-20, and glycosylphosphatidylinositol-anchored myelin proteins, e.g. contactin, were focused by 2D-PAGE with ASB-14, while they were not detected by Western blotting using CHAPS. However, the transmembrane polypeptides myelin-associated glycoprotein (MAG) and the myelin-oligodendrocyte glycoprotein (MOG) were still poorly resolved in this study. We recovered few membrane or membrane-associated proteins in our 2D-analysis. Yet, we identified 11 proteins (Table 1) that were previously not reported. For example, MBP, one of the major constituents of myelin was detected in several spots. This fact encouraged us to investigate our samples by MDLC, and to explore the capabilities of this technique. The usefulness of this
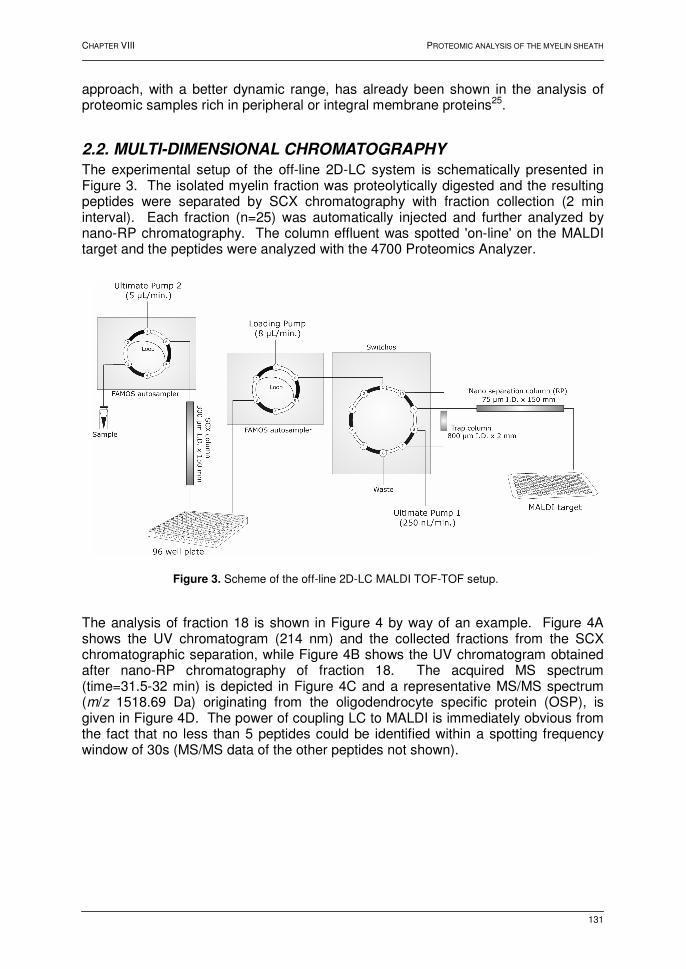
CHAPTER VIII PROTEOMIC ANALYSIS OF THE MYELIN SHEATH
131
approach, with a better dynamic range, has already been shown in the analysis of proteomic samples rich in peripheral or integral membrane proteins25.
2.2. MULTI-DIMENSIONAL CHROMATOGRAPHY
The experimental setup of the off-line 2D-LC system is schematically presented in Figure 3. The isolated myelin fraction was proteolytically digested and the resulting peptides were separated by SCX chromatography with fraction collection (2 min interval). Each fraction (n=25) was automatically injected and further analyzed by nano-RP chromatography. The column effluent was spotted 'on-line' on the MALDI target and the peptides were analyzed with the 4700 Proteomics Analyzer.
The analysis of fraction 18 is shown in Figure 4 by way of an example. Figure 4A shows the UV chromatogram (214 nm) and the collected fractions from the SCX chromatographic separation, while Figure 4B shows the UV chromatogram obtained after nano-RP chromatography of fraction 18. The acquired MS spectrum (time=31.5-32 min) is depicted in Figure 4C and a representative MS/MS spectrum (m/z 1518.69 Da) originating from the oligodendrocyte specific protein (OSP), is given in Figure 4D. The power of coupling LC to MALDI is immediately obvious from the fact that no less than 5 peptides could be identified within a spotting frequency window of 30s (MS/MS data of the other peptides not shown).
Figure 3. Scheme of the off-line 2D-LC MALDI TOF-TOF setup.
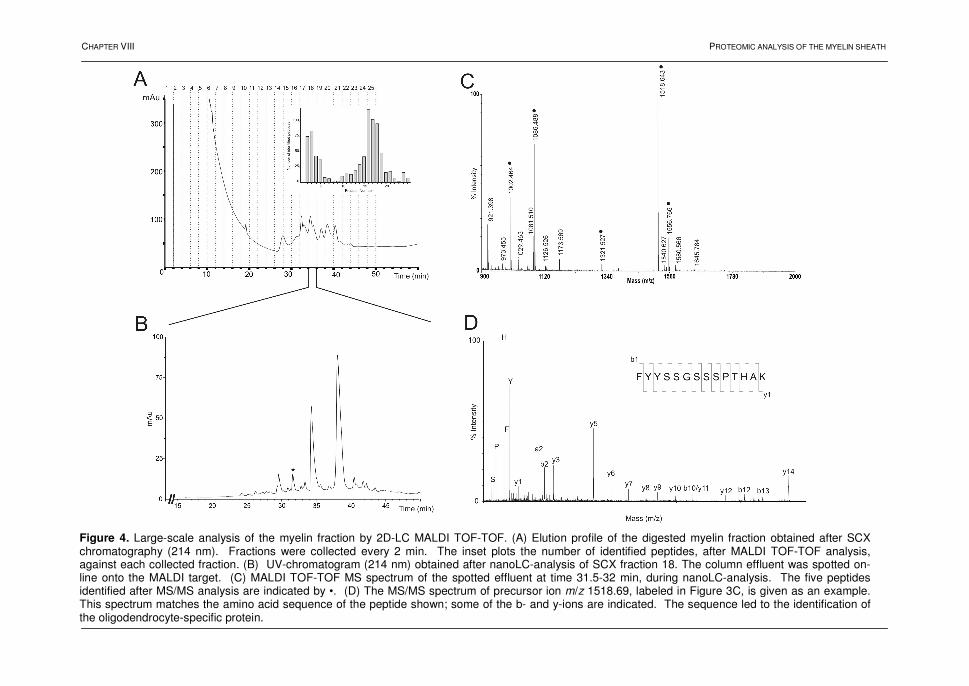
CHAPTER VIII PROTEOMIC ANALYSIS OF THE MYELIN SHEATH
Figure 4. Large-scale analysis of the myelin fraction by 2D-LC MALDI TOF-TOF. (A) Elution profile of the digested myelin fraction obtained after SCX chromatography (214 nm). Fractions were collected every 2 min. The inset plots the number of identified peptides, after MALDI TOF-TOF analysis, against each collected fraction. (B) UV-chromatogram (214 nm) obtained after nanoLC-analysis of SCX fraction 18. The column effluent was spotted on-line onto the MALDI target. (C) MALDI TOF-TOF MS spectrum of the spotted effluent at time 31.5-32 min, during nanoLC-analysis. The five peptides identified after MS/MS analysis are indicated by •. (D) The MS/MS spectrum of precursor ion m/z 1518.69, labeled in Figure 3C, is given as an example. This spectrum matches the amino acid sequence of the peptide shown; some of the b- and y-ions are indicated. The sequence led to the identification of the oligodendrocyte-specific protein.

CHAPTER VIII PROTEOMIC ANALYSIS OF THE MYELIN SHEATH
133
The spotting frequency was chosen with care, considering factors such as (i) sample complexity, (ii) chromatographic run time and, probably most importantly (iii) conservation of chromatographic resolution. For a given peak width, the analyte will be distributed in multiple spots if the spot time is decreased. On the other hand, if the spot frequency is too slow, separated analytes will be re-pooled and the MS sensitivity will be affected by ion suppression effects. To optimize the spotting frequency, we used four standard peptides (des-Arg-bradykinin; angiotensin I; Glu-fibrino-peptide B, and adrenocorticotropic hormone (ACTH), clip (1-17)). The peptides were separated by nano-RP chromatography and spotted on the target, using the 30 s spotting frequency. Figure 5 shows the extracted ion chromatogram for the four components. The data show this the spotting frequency (Figure 5B) was appropriate and in good correlation with the UV data (Figure 5A). Moreover, no loss of chromatographic resolution or carry-over is observed in the MALDI-analysis. Carry-over from peptides from one spot to the other can indeed be expected by direct contact of the capillary to the target. However, the column effluent contacting the target plate dissolves the dried matrix, which adsorbs the peptides, and afterward recrystallizes. By doing so, the spot is dissolved starting from the middle to the edge, where almost all sample gets concentrated. To make a nice homogeneous microcrystalline layer, we therefore applied 0.1 µL of matrix solution containing 20% ethanol to recrystallize the spot.
Figure 5. Preservation of chromatographic resolution during LC/MALDI. (A) UV-trace (214 nm) of 4 standard peptides, des-Arg-Bradykinin; Angiotensin I; Glu-Fibrino-peptide B and Adrenocorticotropic hormone (ACTH), clip (1-17), after nanoLC-analysis. (B) Extracted ion chromatogram of the 4 peptides detected by MALDI TOF-TOF MS. The X-axis shows as the spot number as well as the time of collection.
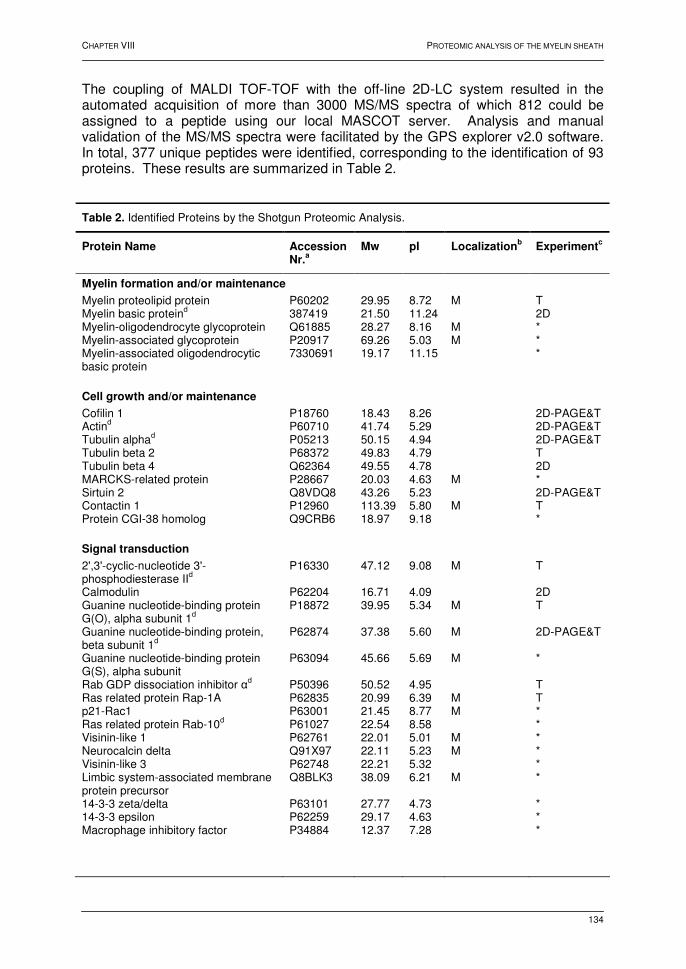
CHAPTER VIII PROTEOMIC ANALYSIS OF THE MYELIN SHEATH
134
The coupling of MALDI TOF-TOF with the off-line 2D-LC system resulted in the automated acquisition of more than 3000 MS/MS spectra of which 812 could be assigned to a peptide using our local MASCOT server. Analysis and manual validation of the MS/MS spectra were facilitated by the GPS explorer v2.0 software. In total, 377 unique peptides were identified, corresponding to the identification of 93 proteins. These results are summarized in Table 2.
Table 2. Identified Proteins by the Shotgun Proteomic Analysis.
Protein Name Accession Nr.
a
Mw pI Localizationb Experiment
c
Myelin formation and/or maintenance
Myelin proteolipid protein P60202 29.95 8.72 M T Myelin basic proteind 387419 21.50 11.24 2D Myelin-oligodendrocyte glycoprotein Q61885 28.27 8.16 M * Myelin-associated glycoprotein P20917 69.26 5.03 M * Myelin-associated oligodendrocytic basic protein
7330691 19.17 11.15 *
Cell growth and/or maintenance
Cofilin 1 P18760 18.43 8.26 2D-PAGE&T Actind P60710 41.74 5.29 2D-PAGE&T Tubulin alphad P05213 50.15 4.94 2D-PAGE&T Tubulin beta 2 P68372 49.83 4.79 T Tubulin beta 4 Q62364 49.55 4.78 2D MARCKS-related protein P28667 20.03 4.63 M * Sirtuin 2 Q8VDQ8 43.26 5.23 2D-PAGE&T Contactin 1 P12960 113.39 5.80 M T Protein CGI-38 homolog Q9CRB6 18.97 9.18 *
Signal transduction
2',3'-cyclic-nucleotide 3'-phosphodiesterase IId
P16330
47.12 9.08 M T
Calmodulin P62204 16.71 4.09 2D Guanine nucleotide-binding protein G(O), alpha subunit 1d
P18872 39.95 5.34 M T
Guanine nucleotide-binding protein, beta subunit 1d
P62874 37.38
5.60 M 2D-PAGE&T
Guanine nucleotide-binding protein G(S), alpha subunit
P63094 45.66 5.69 M *
Rab GDP dissociation inhibitor αd P50396 50.52 4.95 T Ras related protein Rap-1A P62835 20.99 6.39 M T p21-Rac1 P63001 21.45 8.77 M * Ras related protein Rab-10d P61027 22.54 8.58 * Visinin-like 1 P62761 22.01 5.01 M * Neurocalcin delta Q91X97 22.11 5.23 M * Visinin-like 3 P62748 22.21 5.32 * Limbic system-associated membrane protein precursor
Q8BLK3 38.09 6.21 M *
14-3-3 zeta/delta P63101 27.77 4.73 * 14-3-3 epsilon P62259 29.17 4.63 * Macrophage inhibitory factor P34884 12.37 7.28 *

CHAPTER VIII PROTEOMIC ANALYSIS OF THE MYELIN SHEATH
135
Table 2. Continued.
Cell adhesion
Oligodendrocyte-specific protein Q60771 22.11 8.23 M T Neural cell adhesion molecule 1 P13595 119.35 4.73 M T Thy-1 membrane glycoprotein precursor
P01831 18.08 9.16 M *
Junctional adhesion molecule C Q9D8B7 34.84 6.60 M * Membrane glycoprotein/immunoglobulin superfamily member 4C
19068139 42.70 5.92 M *
Membrane glycoprotein/immunoglobulin superfamily member 4B
19068137 42.94 5.50 M *
Immunoglobulin superfamily member 8
32189434 64.97 7.96 M *
Vesicle /Synapse
Synaptosomal-associated protein 25 P60879 23.32 4.66 M 2D Syntaxin 1B P61264 33.24 5.25 M * Dihydropyrimidinase related protein-2 O08553 62.17 5.95 2D-PAGE&T Septin-7 O55131 50.55 8.73 T Septin-2 P42208 41.53 6.10 T Septin-8 Q8CHH9 49.81 5.68 2D-PAGE&T EH-domain containing 1d Q9WVK4 60.60 6.35 T
Metabolism
Aldolase 1, A isoform P05064 39.22 8.40 2D-PAGE&T Enolase 1, alpha P17182 47.01 6.36 2D-PAGE&T Enolase 2, gamma neuronal P17183 47.17 4.99 2D-PAGE&T Glutamine synthetase P15105 42.15 6.47 2D-PAGE&T Isocitrate dehydrogenase 3 alpha subunit
Q9D6R2 39.64 6.27 *
Isocitrate dehydrogenase 3 beta subunit
Q91VA7 42.19 8.76 *
Malate dehydrogenase 1 P14152 36.35 6.16 2D-PAGE&T Malate dehydrogenase 2 P08249 35.60 8.82 T Phosphoglycerate mutase 1 Q9DBJ1 28.70 6.75 T Phosphoglycerate kinase 1 P09411 44.41 7.52 2D-PAGE&T Triosephosphate isomerase P17751 26.58 7.09 * Pyruvate kinase, isozyme M2 P52480 57.76 7.42 2D-PAGE&T Creatine kinase, B chain Q04447 42.71 5.40 2D-PAGE&T Glyceraldehyde-3-phosphate dehydrogenase
P16858 35.68 8.45 2D-PAGE&T
Transketolase P40142 67.63 7.23 T Carbonic anhydrase II P00920 28.96 6.52 T Nucleoside diphosphate kinase A P15532 17.21 6.84 T Nucleoside diphosphate kinase B Q01768 17.36 6.97 T Adenine nucleotide translocase 1 P48962 32.77 9.73 M * Aspartate aminotransferase P05202 47.11 9.13 * Ectonucleotide pyrophosphatase/phosphodiesterase 6
Q8B6N3 50.62 6.87 M *
Elongation factor 1-alpha 1 P10126 50.11 9.10 *
Respiration
Sodium/potassium-transporting ATPase alpha-1 chain
Q8VDN2 112.98 5.30 M *
Sodium/potassium-transporting ATPase beta-1 chain
P14094 35.19 8.83 M *
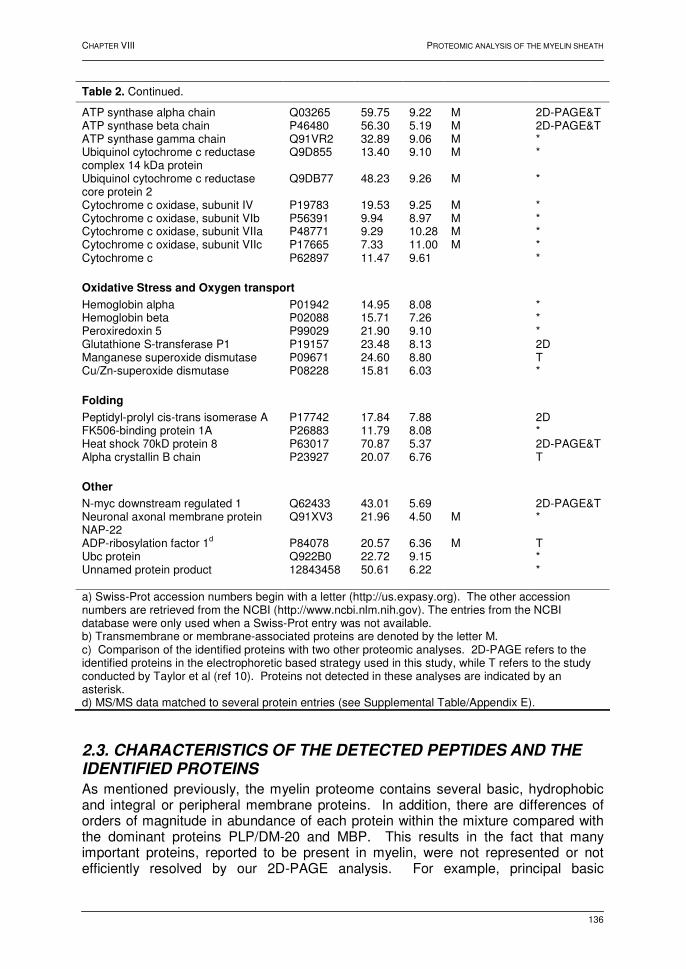
CHAPTER VIII PROTEOMIC ANALYSIS OF THE MYELIN SHEATH
136
Table 2. Continued.
ATP synthase alpha chain Q03265 59.75 9.22 M 2D-PAGE&T ATP synthase beta chain P46480 56.30 5.19 M 2D-PAGE&T ATP synthase gamma chain Q91VR2 32.89 9.06 M * Ubiquinol cytochrome c reductase complex 14 kDa protein
Q9D855 13.40 9.10 M *
Ubiquinol cytochrome c reductase core protein 2
Q9DB77 48.23 9.26 M *
Cytochrome c oxidase, subunit IV P19783 19.53 9.25 M * Cytochrome c oxidase, subunit VIb P56391 9.94 8.97 M * Cytochrome c oxidase, subunit VIIa P48771 9.29 10.28 M * Cytochrome c oxidase, subunit VIIc P17665 7.33 11.00 M * Cytochrome c P62897 11.47 9.61 *
Oxidative Stress and Oxygen transport
Hemoglobin alpha P01942 14.95 8.08 * Hemoglobin beta P02088 15.71 7.26 * Peroxiredoxin 5 P99029 21.90 9.10 * Glutathione S-transferase P1 P19157 23.48 8.13 2D Manganese superoxide dismutase P09671 24.60 8.80 T Cu/Zn-superoxide dismutase P08228 15.81 6.03 *
Folding
Peptidyl-prolyl cis-trans isomerase A P17742 17.84 7.88 2D FK506-binding protein 1A P26883 11.79 8.08 * Heat shock 70kD protein 8 P63017 70.87 5.37 2D-PAGE&T Alpha crystallin B chain P23927 20.07 6.76 T
Other
N-myc downstream regulated 1 Q62433 43.01 5.69 2D-PAGE&T Neuronal axonal membrane protein NAP-22
Q91XV3 21.96 4.50 M *
ADP-ribosylation factor 1d P84078 20.57 6.36 M T Ubc protein Q922B0 22.72 9.15 * Unnamed protein product
12843458 50.61 6.22 *
a) Swiss-Prot accession numbers begin with a letter (http://us.expasy.org). The other accession numbers are retrieved from the NCBI (http://www.ncbi.nlm.nih.gov). The entries from the NCBI database were only used when a Swiss-Prot entry was not available. b) Transmembrane or membrane-associated proteins are denoted by the letter M. c) Comparison of the identified proteins with two other proteomic analyses. 2D-PAGE refers to the identified proteins in the electrophoretic based strategy used in this study, while T refers to the study conducted by Taylor et al (ref 10). Proteins not detected in these analyses are indicated by an asterisk. d) MS/MS data matched to several protein entries (see Supplemental Table/Appendix E).
2.3. CHARACTERISTICS OF THE DETECTED PEPTIDES AND THE
IDENTIFIED PROTEINS
As mentioned previously, the myelin proteome contains several basic, hydrophobic and integral or peripheral membrane proteins. In addition, there are differences of orders of magnitude in abundance of each protein within the mixture compared with the dominant proteins PLP/DM-20 and MBP. This results in the fact that many important proteins, reported to be present in myelin, were not represented or not efficiently resolved by our 2D-PAGE analysis. For example, principal basic
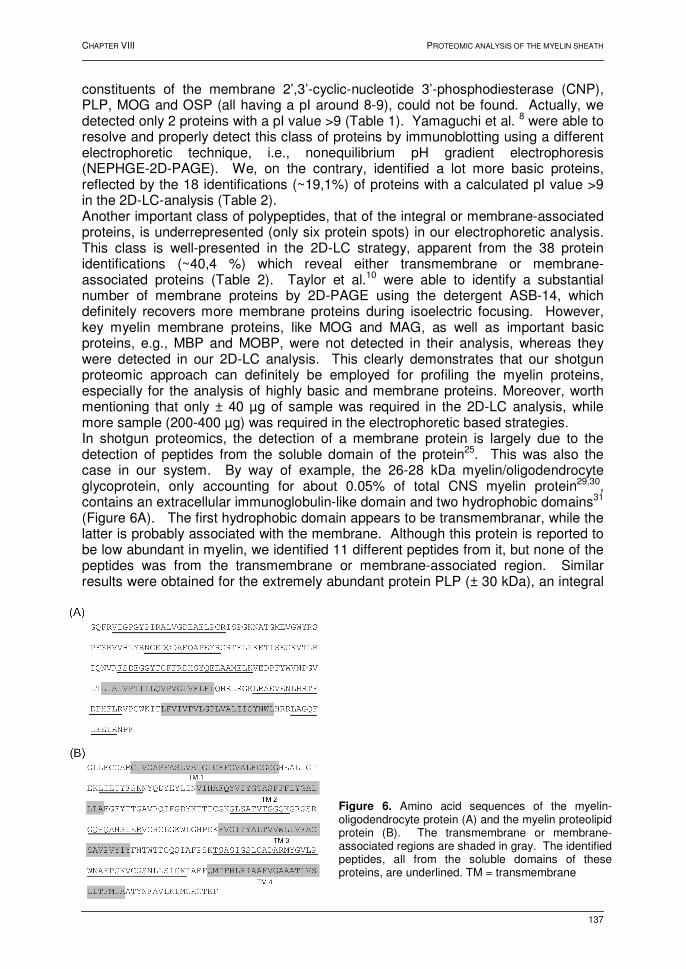
CHAPTER VIII PROTEOMIC ANALYSIS OF THE MYELIN SHEATH
137
constituents of the membrane 2’,3’-cyclic-nucleotide 3’-phosphodiesterase (CNP), PLP, MOG and OSP (all having a pI around 8-9), could not be found. Actually, we detected only 2 proteins with a pI value >9 (Table 1). Yamaguchi et al. 8 were able to resolve and properly detect this class of proteins by immunoblotting using a different electrophoretic technique, i.e., nonequilibrium pH gradient electrophoresis (NEPHGE-2D-PAGE). We, on the contrary, identified a lot more basic proteins, reflected by the 18 identifications (~19,1%) of proteins with a calculated pI value >9 in the 2D-LC-analysis (Table 2). Another important class of polypeptides, that of the integral or membrane-associated proteins, is underrepresented (only six protein spots) in our electrophoretic analysis. This class is well-presented in the 2D-LC strategy, apparent from the 38 protein identifications (~40,4 %) which reveal either transmembrane or membrane-associated proteins (Table 2). Taylor et al.10 were able to identify a substantial number of membrane proteins by 2D-PAGE using the detergent ASB-14, which definitely recovers more membrane proteins during isoelectric focusing. However, key myelin membrane proteins, like MOG and MAG, as well as important basic proteins, e.g., MBP and MOBP, were not detected in their analysis, whereas they were detected in our 2D-LC analysis. This clearly demonstrates that our shotgun proteomic approach can definitely be employed for profiling the myelin proteins, especially for the analysis of highly basic and membrane proteins. Moreover, worth mentioning that only ± 40 µg of sample was required in the 2D-LC analysis, while more sample (200-400 µg) was required in the electrophoretic based strategies. In shotgun proteomics, the detection of a membrane protein is largely due to the detection of peptides from the soluble domain of the protein25. This was also the case in our system. By way of example, the 26-28 kDa myelin/oligodendrocyte glycoprotein, only accounting for about 0.05% of total CNS myelin protein29,30, contains an extracellular immunoglobulin-like domain and two hydrophobic domains31 (Figure 6A). The first hydrophobic domain appears to be transmembranar, while the latter is probably associated with the membrane. Although this protein is reported to be low abundant in myelin, we identified 11 different peptides from it, but none of the peptides was from the transmembrane or membrane-associated region. Similar results were obtained for the extremely abundant protein PLP (± 30 kDa), an integral
Figure 6. Amino acid sequences of the myelin-oligodendrocyte protein (A) and the myelin proteolipid protein (B). The transmembrane or membrane-associated regions are shaded in gray. The identified peptides, all from the soluble domains of these proteins, are underlined. TM = transmembrane

CHAPTER VIII PROTEOMIC ANALYSIS OF THE MYELIN SHEATH
138
membrane protein that contains four transmembrane domains32 (TM) (Figure 6B), two soluble extracellular loops (between TM1-TM2 and TM3-TM4) and one large soluble cytoplasmic domain (TM2-TM3). We identified six peptides belonging to one of these soluble domains, but we could not distinguish PLP from its spliced variant DM-20. In general, bottom-up shotgun proteomics may underestimate the complexity of a sample33. For example, we detected two peptides unique to PLP and four peptides common between PLP and the DM-20 splice variant. PLP is definitely present, due to the detection of the unique peptides, but the common peptides can as well be from PLP as from the DM-20 splice variant. Proteins that share common peptides with the proteins listed in Table 2, but from which no unique peptide has been discovered are not listed. On the contrary, where the MS/MS data matched several protein entries in the database and no unique peptide could be detected, a single representative protein entry for this set of identified peptides is given in Table 2. The complete list of derived peptide sequences is given in the Supplemental Table, provided in Appendix E. A Venn diagram comparing the number of identified proteins in our two proteomic approaches (2D-PAGE/MS and MDLC) and those of the previous study is given in Figure 7. A few proteins identified in our 2D-PAGE/MS analysis were not observed in the 2D-LC experiment. The lack of identification of these proteins can have several causes. The peptides can be missed either due to ionization efficiency, because they are too hydrophobic or because of their size. Compared to the previous published proteome map of myelin, 46 proteins were not detected via MDLC. As mentioned, different solubilization agents were used. Notwithstanding this difference, we confirmed 53.1% of this proteomic map in our study, lending increased confidence to these identifications. It is obvious that several methods and the use of several detergents are required to tackle this complex protein mixture and unravel the myelin proteome.
Figure 7. Venn diagram comparing the number of proteins identified in the present study and those previously reported (ref 10). 2D-PAGE/MS and MDLC refer to the proteomic strategies based on electrophoresis and multidimensional liquid chromatography respectively. (*) Guanine nucleotide-binding protein α1 and α 2, Rab GDP dissociation inhibitor α en β2, PLP/DM20 and CNP I/CNP II, identified as unique proteins in the previous study, could not be distinguished in the shotgun proteomic approach (see Supplemental Table). These proteins were classified in the overlap 'MDLC/previous study'. By analogy with this, we classified the guanine nucleotide-binding protein β2 in the overlap 'MDLC/2D-PAGE/MS'.
CHAPTER VIII PROTEOMIC ANALYSIS OF THE MYELIN SHEATH
139
2.4. BIOLOGICAL RELEVANCE OF THE IDENTIFIED PROTEINS
Via shotgun proteomics, we extended the myelin proteome map by the identification of several known myelin proteins, previously not detected in other proteomic analyses. For example, myelin-associated oligodendrocytic basic protein (MOBP), a major component of the CNS myelin34, has never been reported in any proteomic analysis. The identification of all these known myelin proteins in a single analysis offers unique possibilities for comparative studies in white matter disorders. Although our shotgun proteomic analysis was not quantitative, our experimental setup can be easily extended by various labeling strategies that allow quantification of these proteins. Reagents such as ICAT and iTRAQ have already proven their utility in the study of protein expression profiles35,36. Certainly, detection and quantitation of the myelin proteins is essential, since many are involved in various demyelinating and dysmyelinating diseases. Among the new identified proteins, we detected several mitochondrial proteins (Table 2). Early electron microscopy revealed the presence of mitochondria in the myelin of the peripheral nervous system37, and mitochondrial proteins were also found in the proteome map of CNS myelin10. Mitochondria are involved in various neurodegenerative diseases where demyelination is observed38, showing the importance of detection and profiling of this class of proteins. Furthermore, the proteome map was expanded by the identification of a variety of proteins involved in actin (re)organization, protein trafficking, vesicular transport and membrane biogenesis. Myelin contains a high lipid to protein ratio and the isolation of this membrane is based on the ability to float to a characteristic density in a sucrose gradient. However, myelin is closely associated with the axolemmal membrane through adhesive protein complexes and it has been shown that significant bidirectional signaling occurs between the myelin and the axon39,40. Menon et al. 41 investigated the distribution, due to these high-affinity interactions, of specific myelin proteins in the different regions of the sucrose gradient and tried to obtain 'pure myelin'. In fact, specific myelin and axolemmal proteins were enriched in different regions of the sucrose gradient. However, the high-affinity interactions seem to persist, despite rigorous homogenization, high-salt shocks and several sucrose density centrifugation steps. The authors suggest that the isolated fraction is an interacting unit, the myelin-axolemmal complex, and conclude that it is difficult, if not impossible, to purify the myelin membrane to homogeneity. Therefore, the exact localization of some of the identified proteins in our proteomic analyses should be further examined by other techniques, e.g. immunofluorescence microscopy. In this respect, the new identified membrane proteins as well as three membrane glycoproteins with immunoglobulin-like domains are of interest. Additional experiments will be needed to establish the role and function of these proteins in the myelin-axolemmal complex.
CHAPTER VIII PROTEOMIC ANALYSIS OF THE MYELIN SHEATH
140
3. CONCLUSIONS The protein composition of myelin in C57/bl6 mice was investigated by two different proteomic strategies. A classical proteomic approach, 2D-PAGE followed by MS, identified 38 unique proteins. However, myelin contains many tissue specific basic and membrane proteins and only few of these have been detected. Therefore, the sample was further investigated by a shotgun proteomic approach. Here, sample was digested and the resultant peptides were separated by an off-line 2D-LC setup. The resolved peptides were spotted on-line onto a MALDI target. The method proved to be reliable and no less than 812 peptides could be successfully identified, accounting for the detection of 93 unique proteins. Highly basic proteins and membrane proteins were all present. Moreover, many known proteins, such as MOG, MAG, CNP, MBP, PLP, and MOBP were all detected in this analysis. Previous proteomic strategies failed in the detection of these proteins in a single analysis. Moreover, a limited amount of sample was required in our shotgun proteomic approach. Further development, like implementation of labeling strategies, can result in the quantification of these important myelin proteins. In time, this approach can be the key to comparative studies and applications associated with white matter disorders. A proteome map of myelin using 2D-PAGE and MS was previously published by Taylor et al.10. Although a different zwitterionic detergent was used, we confirmed more than 50% of the proteins by our proteomic analyses. On the other hand, we could add a substantial number of proteins to the myelin proteome. A comprehensive profile of the proteins present in myelin is unmistakably essential in order to better understand the biological role of this membrane and the many diseases that are associated with it.
CHAPTER VIII PROTEOMIC ANALYSIS OF THE MYELIN SHEATH
141
4. REFERENCES 1 Morell, P.; Norton, W. T. Myelin. Scientific American 1980, 242, 88-118
2 Di Rocco M.; Biancheri R.; Rossi A. et al. Genetic disorders affecting white matter in the pediatric
age. Am. J. Med. Genet. B 2004, 129, 85-93
3 Matute, C.; Pérez-Cerda, F. Multiple Sclerosis: novel perspectives on newly forming lesions.
Trends Neurosci. 2005, 28, 173-175
4 Lyon, G.; Adams, R.D.; Kolodny E.H. Neurology of hereditary metabolic diseases of children, 2nd
ed.; McGraw-Hill:New York, 1996
5 Woodward, K.; Malcolm, S. Proteolipid protein gene: Pelizaeus-Merzbacher disease in humans
and neurodegeneration in mice. Trends Genet. 1999, 15,125-128
6 Pfeiffer, S. E.; Warrington, A. E.; Bansal, R. The oligodendrocyte and its many cellular processes.
Trends Cell Biol. 1993, 3, 191-197
7 Persson, H.; Överholm, T. Two-dimensional electrophoresis of membrane proteins: separation of
myelin proteins. Electrophoresis 1990, 11, 642-648
8 Yamaguchi, Y.; Pfeiffer, S. E. Highly basic myelin and oligodendrocyte proteins analyzed by
NEPHGE-two-dimensional gel electrophoresis: recognition of novel developmentally regulated
proteins. J. Neurosci. Res. 1999, 56,199-205
9 Taylor, C. M.; Pfeiffer, S. E. Enhanced resolution of glycosylphosphatidylinositol-anchored and
transmembrane proteins from the lipid-rich myelin membrane by two-dimensional gel
electrophoresis. Proteomics 2003, 3, 1303-1312
10 Taylor, C. M.; Marta, C. B.; Claycomb, R. J. et al. Proteomic mapping provides powerful insights
into functional myelin biology. Proc. Natl. Acad. Sci. U.S.A. 2004, 101, 4643-4648
11 Gorg, A.; Weiss, W.; Dunn, M. J. Current two-dimensional electrophoresis technology for
proteomics. Proteomics 2004, 4, 3665-3685
12 Peng, J.; Gygi, S. P. Proteomics: the move to mixtures. J. Mass Spectrom. 2001, 36, 1083-1091
13 Zhu, H.; Bilgin, M.; Snyder, M. Proteomics. Annu. Rev. Biochem. 2003, 72, 783-812
14 Liu, H.; Lin, D.; Yates, J. R., III. Multidimensional separations for protein/peptide analysis in the
post-genomic era. Biotechniques 2002, 32, 898-911
15 Wu, C.C.; Yates, J.R., III. The application of mass spectrometry to membrane proteomics. Nat.
Biotechnol. 2003, 21, 262-267
16 Wang, H.; Hanash, S. Multidimensional liquid-phase based separations in proteomics. J.
Chromatogr. B 2003, 787, 11-18
17 Issaq, H. J.; Chan, K. C.; Janini, G. M. et al. Multidimensional separation of peptides for effective
proteomic analysis. J. Chromatogr. B 2005, 817, 35-47
18 Washburn, M. P.; Wolters, D.; Yates, J.R., III. Nat. Biotechnol. Large-scale analysis of the yeast
proteome by multidimensional protein identification technology. 2001, 19, 242-247
19 Nägele, E.; Vollmer, M.; Hörth, P. Two-dimensional nano-liquid chromatography-mass
spectrometry system for applications in proteomics. J. Chromatogr. A 2003, 1009, 197-205
20 Neverova, I.; Van Eyk, J. E. Role of chromatographic techniques in proteomic analysis. J.
Chromatogr. B 2005, 815, 51-63
21 Peng, J.; Elias, J. E.; Thoreen, C. C. et al. Evaluation of multidimensional chromatography
coupled with tandem mass spectrometry (LC/LC-MS/MS) for large-scale protein analyss: the yeast
proteome. J. Proteome Res. 2003, 2, 43-50
22 Vollmer, M.; Hörth, P.; Nägele, E. Optimization of two-dimensional off-line LC/MS separations to
improve resolution of complex proteomic samples. Anal. Chem. 2003, 76, 5180-5185

CHAPTER VIII PROTEOMIC ANALYSIS OF THE MYELIN SHEATH
142
23 Nägele, E.; Vollmer, M.; Hörth, P. Improved 2D nano-LC/MS for proteomics applications: a
comparative analysis using yeast proteome. J. Biomolecular Technol. 2004, 5, 134-143
24 Davis, M. T.; Lee, T. D. Rapid protein identification using a microscale electrospray LC/MS system
on an ion trap mass spectrometer. J. Am. Soc. Mass Spectrom. 1998, 9, 194-201
25 Retjar, T.; Hu, P.; Juhasz, P. et al. Off-line coupling of high-resolution capillary electrophoresis to
MALDI-TOF and TOF/TOF MS. J. Proteome Res. 2002, 1, 171-179
26 Bogan, M. J.; Agnes, G. R. Preliminary investigation of electrodynamic charged droplet processing
to couple capillary liquid chromatography with matrix-assisted laser desorption/ionization mass
spectrometry. Rapid Commun. Mass Spectrom. 2004, 18, 2673-2681
27 Harauz, G.; Ishiyama, N.; Hill, C. M. et al. Myelin basic protein-diverse conformational states of an
intrinsically unstructured protein and its roles in myelin assembly and multiple sclerosis. Micron.
2004, 35, 503-542
28 Carboni, L.; Piubelli, C.; Righetti, P. G. et al. Proteomic analysis of rat brain tissue: comparison of
protocols for two-dimensional gel electrophoresis analysis based on different solubilizing agents.
Electrophoresis 2002, 23, 4132-4141
29 Delarasse, C.; Daubas, P.; Mars, L. T. et al. Myelin/oligodendrocyte glycoprotein-deficient mice
reveal lack of immune tolerance to MOG in wild type mice. J. Clin. Invest. 2003, 112, 544-553
30 Marta, C. B.; Taylor, C. M.; Coetzee, T. et al. Antibody cross-linking of myelin oligodendrocyte
glycoprotein leads to its rapid repartitioning into detergent-insoluble fractions, and altered protein
phosphorylation and cell morphology. J. Neurosci. 2003, 23, 5461-5471
31 Kroepfl, J. F.; Viise, L. R.; Charron, A. J. et al. Investigation of myelin/oligodendrocyte glycoprotein
membrane topology. J. Neurochem. 1996, 67, 2219-2222
32 Greer, J. M.; Lees, M. B. Myelin proteolipid protein-the first 50 years. Int. J. Biochem. Cell Biol.
2002, 34, 211-215
33 Pedersen, S. K.; Harry, J. L.; Sebastian, L. et al. Unseen proteome: mining below the tip of the
iceberg to find low abundance and membrane proteins. J. Proteome Res. 2003, 2, 303-311
34 Yool, D.; Montague, P.; McLaughlin, M. et al. Phenotypic analysis of mice deficient in the major
myelin protein MOBP, and evidence for a novel MOBP isoform. Glia 2002, 39, 256-267
35 Sechi, S.; Oda, Y. Quantitative proteomics using mass spectrometry. Curr. Opinion. Chem. Biol.
2003, 7, 70-77
36 DeSouza, L.; Diehl, G.; Rodrigues, M. J. et al. Search for cancer markers from endometrial tissues
using differentially labeled tags iTRAQ and cICAT with multidimensional liquid chromatography
and tandem mass spectrometry. J Proteome Res. 2005, 4, 377-386
37 Mugnaini, E.; Osen, K. K.; Schnapp, B. et al. Distribution of Schwann cell cytoplasm and
plasmalemmal vesicles (caveolae) in peripheral myelin sheaths. An electron microscopic study
with thin sections and freeze-fracturing. J. Neurocytol. 1977, 6, 647-668
38 Jellinger, K. A. General aspects of neurodegeneration. J. Neural Transm. Suppl. 2003, 65, 101-
144
39 Charles, P.; Reynolds, R.; Seilhean, D. et al. Re-expression of PSA-NCAM by demyelinated
axons: an inhibitor of remyelination in multiple sclerosis? Brain 2002, 125, 1972-1979
40 Franzen, R.; Tanner, S. L.; Dashiell, S. M. et al. Microtubule-associated protein 1B: a neuronal
binding partner for myelin-associated glycoprotein. J. Cell Biol. 2001, 155, 893-898
41 Menon, K.; Rasband, M. N.; Taylor, C.M. et al. The myelin-axolemmal complex: biochemical
dissection and the role of galactosphingolipids. J. Neurochem. 2003, 87, 995-1009
SUMMARY AND GENERAL DISCUSSION
143
SUMMARY AND GENERAL DISCUSSION Profiling proteomics is widely applied to analyze global protein synthesis as an indicator of gene expression. This tool is helpful in the understanding of an organism's metabolism, as outlined in Part I. However, no single analytical separation technique is able to solve the diversity and extent of proteome complexity. While the separation strategies may still vary, the identification technique of choice in profiling proteomics is mass spectrometry. Developments in mass spectrometry have made efforts to improve performance and produce new capabilities. This has resulted in improved mass accuracy and resolution, speed and new types of instruments. The implementation of these and future instruments into proteomic strategies will definitely result into improved capabilities. Two-dimensional gel electrophoresis and mass spectrometry is an established, powerful strategy for the analysis of quantitative and qualitative differences in two or more samples, and is particularly well suited for differential quantitative analysis of metabolic processes such as protein synthesis and stress response. In Chapter V, we discussed a differential display study from Shewanella oneidensis MR-1 in relation to its growth on ferric oxide, while the effect of a short term heat shock on barley was outlined in Chapter VI. To be able to identify these gel separated proteins, we coupled nanoLC to ESI-Q-TOF and ESI-Q-TRAP MS (Chapter IV). These methods are robust, reliable and clearly allowed unambiguous protein identification. In addition, sample throughput and automatization were obtained and opened up ways for 'high throughput' proteomic research. Furthermore, the very good signal-to-noise ratio in the spectra, and the observation that many spectra are strongly dominated by y”-ion series makes manual interpretation feasible. The nice quality of the spectra very often enables to deduce a peptide sequence of significant length that can be used in similarity search programs such as FASTA or BLAST. This permits proteins to be identified of which little database information is available (homology searching). Any proteomic approach largely depends on the accessibility of genome sequence information. The characterized genome sequence of Shewanella oneidensis MR-1 allowed us to successfully identify the differential displayed proteins in our study. Due to the presence of this information, different appropriate genome-scale physiological studies can now be performed and this will greatly expand the understanding of the physiology of the organism under different environmental conditions in the future. The result will be a more complete picture of the electron transport and metabolic capacities of this bacterium. On the other hand, the barley genome is not yet available and, therefore, we relied on expressed sequence tag databases and genome sequence information of closely related organisms. However, we were able to identify most of the proteins displaying differential protein synthesis. This is largely due to the improvements, sensitivity and MS/MS capabilities in the mass spectrometric analyses, enabling to perform 'de novo sequencing' and, consequently, to identify more protein spots. The strength of the hyphenation of nanoLC and mass spectrometry is also shown by the identification of no less than six isoforms of a small heat shock protein in one single spot. In conclusion, the hyphenated setup proved to be very useful, in particular for the analysis of protein spots for which limited genome sequence information was available.
SUMMARY AND GENERAL DISCUSSION
144
2D-PAGE is still superior to other techniques when it comes to high resolution separation of several proteins, especially when quantitative data rather than qualitative data are needed. The results presented of the two differential display studies also revealed the major limitation of this approach, i.e. only the relative abundance of a subset of cellular, soluble proteins can be investigated. Although these 'small-scale' methods only provide the clue to a small part of the big puzzle, they open the way for the identification of both regulatory and structural genes critical to specific metabolic pathways. For example, the ArcA protein of Shewanella oneidensis MR-1 was shown to be involved in dissimilatory iron reduction. Such studies can then be pursued via specific mutagenesis and physiological analyses. Therefore, these approaches will remain to be important and crucial for the elucidation of complex biochemical pathways in the future. As two-dimensional gel electrophoresis is less suited for the analysis of certain classes of proteins, such as membrane and low abundant proteins, alternative tools are needed. The separation of membrane proteins, as opposed to water-soluble cytosolic proteins, is problematic because they often precipitate in the isoelectric focusing step, due to the formation of aggregates, even in the presence of detergents. However, membrane proteins can comprise a large fraction of the total gene product population, and proteomics of this type of proteins is therefore essential for the understanding of cellular function. We applied two alternative proteomic strategies, gel and non-gel based, for profiling of membrane proteins in mammalian systems. The different components of the oxidative phosphorylation were investigated by an electrophoretic based strategy, i.e. BN-2D-PAGE in combination with mass spectrometry (Chapter VII). The implementation of nanoLC hyphenated to ESI-Q-TOF MS again proved its efficacy, and proteome maps of the OXPHOS components from human heart and liver were obtained. These reference maps can be further used in comparative analyses. We made a qualitative comparison between the control and the OXPHOS liver map of a patient who was diagnosed with a mitochondrial disorder, revealing serious defects in the oxidative phosphorylation system. A different approach, multi-dimensional liquid chromatography, was used for the profiling of membrane proteins present in the myelin sheath (Chapter VIII). This 'hydrophobic' proteome contains a specific selection of proteins and is dominated by only a few of them. We successfully coupled nanoLC to MALDI TOF-TOF MS, as the experimental setup proved to be reproducible and reliable. This bottom-up shotgun proteomic approach identified a substantial number of additional, but in quantity minor, proteins compared with the 2D-PAGE/MS strategy.
SAMENVATTING
145
SAMENVATTING De grootste uitdaging binnen de bio-wetenschappen is het streven naar een volledig begrip van hoe een cel op moleculair niveau functioneert. Een belangrijke verwezenlijking in dit fundamenteel onderzoek is ongetwijfeld de opheldering van de totale genoomsequentie van diverse organismen, dankzij de ontwikkeling van automatische DNA-sequentietechnieken. De opheldering van de eerste volledige genoomsequentie, van Haemophilus influenzae in 1995, is één van de mijlpalen in de moleculaire microbiologie. Sindsdien werden meer dan 200 genomen opgehelderd en de snelheid waarmee dit gebeurt stijgt stelselmatig. Recent werd zelfs het volledige menselijke genoom gesequeneerd. De toenemende informatiestroom op DNA-niveau heeft er voor gezorgd dat veel biologische experimenten nu op een grotere schaal uitgevoerd worden. De technieken die hierbij gebruikt worden hebben tot doel de biologische processen in een cel of organisme beter te begrijpen en een antwoord te bieden op één van de volgende drie vragen. Ten eerste, wat is de ‘inhoud’ van het biologische systeem? Ten tweede, hoe werken elk van deze individuele componenten, en tenslotte, hoe werken deze individuele componenten samen? In dit werk werden methodes voor de scheiding en identificatie van eiwitten ontwikkeld, gebaseerd op elektroforese, nano-vloeistofchromatografie en massaspectrometrie. De ontwikkelde strategieën werden gebruikt om de eiwit- inhoud van specifieke bacteriële, planten- en zoogdiersystemen te onderzoeken. Het werk bestaat uit drie grote delen. In Deel I, opgedeeld in drie hoofdstukken, wordt de huidige status van grootschalige methodes voor analyse van biologische systemen behandeld. In Hoofdstuk I worden de disciplines ‘genomics’, ‘transcriptomics’ en ‘proteomics’ toegelicht en wordt de noodzaak van proteoomanalyses (‘proteomics’) aangetoond. Proteomics is een middel om genoominformatie in verband te brengen met functionaliteit en is in essentie de studie van de eigenschappen van eiwitten (expressieniveaus, post-translationele modificaties, interacties, ...) om een globaal, geïntegreerd zicht te krijgen op ziekteprocessen, cellulaire processen, .... op eiwitniveau. In Hoofdstuk II maakt de lezer kennis met de drie hoofddisciplines binnen proteomics: ‘profiling’, functionele, en structurele ‘proteomics’. Er wordt een overzicht gegeven van de voornaamste technologieën die heden gebruikt worden in functionele en structurele proteoomanalyses, terwijl de verscheidene mogelijkheden om eiwitten te ‘mappen’, profiling proteomics, worden besproken in Hoofdstuk III. Laatstgenoemde discipline is een belangrijk onderdeel van proteomics en probeert systematisch elk eiwit in een cel, weefsel of organisme te identificeren, samen met de bepaling van andere relevante eigenschappen, zoals o.m. abundantie. In het hoofdstuk worden de verschillende mogelijkheden om eiwitten te scheiden, te analyseren en te identificeren m.b.v. massaspectrometrie uitvoerig beschreven. Deel II is eveneens opgebouwd uit drie hoofdstukken en behandelt de analyse van cytosolische eiwitten gescheiden via tweedimensionale gelelektroforese en geïdentificeerd via massaspectrometrie (2D-PAGE/MS). Deze strategie is binnen de discipline profiling proteomics, een krachtige analysetechniek om kwalitatieve en kwantitatieve verschillen in twee of meerdere stalen te onderzoeken. In het bijzonder is het uitermate geschikt om wijzigingen in metabolische processen, zoals eiwitsynthese, te onderzoeken via een differentiële kwantitatieve analyse. In
SAMENVATTING
146
Hoofdstuk IV worden de verschillende massaspectrometrische technieken beschreven die gebruikt werden voor de identificatie van gel-gescheiden eiwitten. In het hoofdstuk wordt voornamelijk de experimentele set-up, dit is de koppeling van nano-vloeistofchromatografie en massaspectrometrie, toegelicht. Om de eiwitten te identificeren uit gel werd een nanoLC-systeem gekoppeld aan ofwel een ESI-Q-TOF of een ESI-Q-TRAP massaspectrometer. De koppeling is robuust en betrouwbaar en is bovendien volledig automatisch, wat de snelheid van de analyses merkelijk verhoogt. De ontwikkelde methodes werden verder gebruikt in verschillende proteoomanalyses (Hoofdstukken V en VI). Eerst wordt een differentiële kwantitatieve analyse besproken van Shewanella oneidensis MR-1 (Hoofdstuk V). Deze gram-negatieve facultatief aërobe bacterie is in staat om tal van elektronen-acceptoren te gebruiken, en opmerkelijk hierbij is de reductie van metalen. De interesse komt niet alleen van het belang van deze bacterie in het domein van de geochemie, maar ook van praktische toepassen, zoals het ‘biologisch opruimen’ (bioremediatie) van gecontamineerde milieus. Ondanks uitgebreid onderzoek is de kennis van deze respiratoire processen in Shewanella echter nog vaag. In het hoofdstuk wordt metaalreductie besproken en worden de resultaten voorgesteld van een proteoomanalyse van Shewanella oneidensis MR-1 met betrekking tot groei op ijzeroxide. De analyse van de respons op de toestand van stress van planten is belangrijk om genen te ontdekken met betrekking tot stress-tolerantie. Eén van de factoren die de groei en kwaliteit van planten sterk kan beïnvloeden is temperatuur. In Hoofdstuk VI wordt het effect van een korte hitte-schok op gerst besproken. De resultaten van een differentiële proteoomanalyse, 2D-PAGE/MS, van één van de meest belangrijke gewassen in de wereld worden voorgesteld. Daarnaast wordt de kracht van de koppeling van nanoLC en massaspectrometrie nogmaals benadrukt door de identificatie van niet minder dan zes isovormen van een klein 'heat shock’ eiwit in één enkele spot. Tweedimensionale gelelektroforese is een uitgelezen techniek wanneer een hoge resolutie voor de scheiding van verschillende eiwitten noodzakelijk is, en zeker wanneer eerder kwantitatieve dan kwalitatieve data vereist zijn. De besproken resultaten van de twee differentiële proteoomanalyses toonden echter ook de grootste beperking van deze techniek aan. Enkel specifieke cellulaire, goed oplosbare, eiwitten konden worden onderzocht. Deze strategie reveleert m.a.w. slechts een klein deel van de (soms) grote puzzel. Anderzijds kunnen regulatorische en structurele eiwitten geïdentificeerd worden die belangrijk zijn in welbepaalde metabolische processen. Zo werd bijvoorbeeld aangetoond dat het ArcA eiwit van Shewanella oneidensis MR-1 betrokken is in het proces van dissimilatorische ijzer reductie. Dergelijke studies kunnen dan opgevolgd worden door specifieke mutagenese en fysiologische experimenten en zullen daarom in de toekomst belangrijk en cruciaal blijven in de opheldering van complexe biochemische processen. In Deel III worden alternatieve strategieën voorgesteld en toegepast in het gebied van profiling proteomics. Vermits tweedimensionale gelelektroforese minder geschikt is voor de analyse van bepaalde klassen van eiwitten, zoals membranaire en laag abundante eiwitten, zijn alternatieve strategieën vereist. De scheiding van membraaneiwitten met behulp van de techniek van iso-elektrische focussering wordt, bijvoorbeeld, bemoeilijkt doordat eiwitten door vorming van aggregaten neerslaan, zelfs in aanwezigheid van detergenten. Membraaneiwitten kunnen echter een groot
SAMENVATTING
147
deel uitmaken van de totale eiwitpopulatie en een proteoomanalyse van deze eiwitten is daarom essentieel teneinde bepaalde cellulaire functies beter te kunnen begrijpen. Wij hebben twee alternatieve proteoomanalyses toegepast, gel en niet-gel gebaseerd, voor het profileren van membraanproteïnen. Ten eerste werden de verschillende componenten van de oxidatieve fosforylatie geanalyseerd via de techniek van ‘blue-native’ polyacrylamide gelelektroforese in combinatie met massaspectrometrie (Hoofdstuk VII). Een proteoommap van de verschillende subeenheden van deze complexen, zowel van menselijk hart- als leverweefsel, wordt voorgesteld en besproken. De referentie-proteoommappen kunnen verder gebruikt worden in vergelijkende proteoomanalyses, en een vergelijkende analyse van leverweefsel werd uitgevoerd tussen een controle en een patiënt die een sterk verstoord mitochondriaal metabolisme vertoonde tijdens een doktersdiagnose. De bekomen resultaten van de vergelijkende proteoomanalyse worden besproken in het hoofdstuk. In een tweede, alternatieve strategie wordt multidimensionale vloeistofchromatografie gebruikt voor de analyse van membraaneiwitten in de myelineschede (Hoofdstuk VIII). Dit ‘hydrofoob’ proteoom bestaat uit een specifieke selectie van eiwitten en wordt bovendien qua kwantiteit gedomineerd door slechts enkele eiwitten. Na de scheiding werden de eiwitten geïdentificeerd m.b.v. massaspectrometrie. Hiervoor werd nano-vloeistofchromatografie gekoppeld met MALDI TOF-TOF MS. In dit hoofdstuk wordt de experimentele set-up uitvoerig beschreven en de resultaten van deze ‘bottom-up’ proteoomanalyse worden vergeleken met de ‘klassieke’ 2D-PAGE/MS aanpak.
APPENDIX A
148
APPENDIX A BACTERIAL GROWTH AND PREPARATION OF EXTRACTS: Shewanella oneidensis MR-1 was grown aerobically in 20 ml Luria-Bertani (LB) medium in a rotary shaker at a speed of 200 rpm and at 28°C up to the exponential phase (OD600 =± 1). From these cultures, 1 ml was used to inoculate 200 ml of anaerobically prepared LB broth supplemented with lactic acid (20 mM) as electron donor and either one of the electron acceptors, 20 mM sodium fumarate or 1.6 g/L ferric oxide (Fe2O3). The medium was adjusted to pH 7. Five cultures of each of these were grown in an anaerobic chamber (Coy Laboratory Products) at 28°C for 16 h, and then harvested. Analytical test strips (Merck) were used to detect the formation of ferrous iron. After washing twice using a 50 mM Tris-HCl solution, pH 8, bacteria were placed in an ultrasonic bath on ice for 2 x 30 s, followed by protein extraction in 9 M urea, 4% CHAPS, 1% DTT and 1 mM PMSF. After centrifugation at 14 000 rpm (4°C) for 20 min, the supernatant containing the soluble protein fraction was recovered. TWO-DIMENSIONAL GEL ELECTROPHORESIS AND ANALYSIS: After determination of the protein concentration using the Protein Assay Kit (Bio-Rad), approximately 300 µg of protein of each culture was applied on an IPG strip (pH 3–10 L) via a 7 h passive in-gel rehydration protocol1. The IEF was performed in a Multiphor II system (Amersham Biosciences) running a standard program provided by the manufacturer. The temperature was kept at 18°C. After completion of the program, the IPG strips were equilibrated for 10 min in a 50 mM Tris-HCl solution, pH 8.8, containing 6 M urea, 30% glycerol, 2% SDS and with 1% DTT, after which the solution was replaced by the same solution, but DTT was now being replaced by 2.5% iodoacetamide. The strips were then placed on vertical SDS-PAGE gels cast in-house (12.5%T and 2.6%C), and subjected to electrophoresis in a Protean Plus Dodeca Cell system (Bio-Rad) at 10 mA/gel for 15 min, followed by a ± 5 h run at 20 mA/gel, until the bromophenol blue front reached the bottom of the gel. Staining was performed using CBB G-250, according to Anderson et al.2. The 2D gel images were digitized with a 12-bit GS-710 calibrated densitometer (Bio-Rad) and analyzed with the accompanying PDQuest 7.1 software (Bio-Rad). After spot detection, the 2D maps were automatically aligned, followed by manual optimization. Landmark spots were manually defined and spot editing was carried out to increase the correlation between the different 2D maps. Statistical analysis of the relative abundance of each matched protein spot was accomplished by using a two-tailed t-test, as described3. Proteins displaying quantitative differences with a P-value of at least < 0.05 were considered to differ significantly in abundance. IN-GEL DIGESTION: In-gel digestion was performed according to Rosenfeld et al.4, with minor modifications. Briefly, the spots were excised from the gels and washed twice with 200 mM ammonium bicarbonate in 50% acetonitrile/water (20 min at 30°C), and where then allowed to dry at room temperature. The tubes were chilled on ice and 8 µl of digestion buffer (50mM ammonium bicarbonate, pH 7.8) containing 150 ng modified trypsin (Promega) were added. The samples were kept on ice for 45 min to allow the enzyme to enter the gel piece. A volume of 15 µl digestion buffer was then added and the samples were incubated overnight at 37°C. The supernatant was
APPENDIX A
149
recovered, and the remaining peptides were extracted from the gel piece by washing twice with 60% acetonitrile/0.1% formic acid in water. The extracts were combined and the samples were dried in a Speedvac. The samples were dissolved in 10 µl of 0.1% formic acid. PROTEIN IDENTIFICATION AND MASS SPECTROMETRY: The peptide mixture was measured on a 4700 Proteomics Analyzer, a MALDI TOF-TOF mass spectrometer (Applied Biosystems), equipped with a Nd:YAG laser set at a Hz rate of 200. The digest mixture (1 µl) was co-crystallized with an equal volume of matrix solution (7mg/ml α-cyano-4-hydroxycinnamic acid, dissolved in 50% v/v acetonitrile/0.1% TFA in water) and applied on the MALDI target. Prior to analysis, the mass spectrometer was externally calibrated with a standard mixture (angiotensin I, Glu-fibrino-peptide B, adenocorticotropic hormone (ACTH) (clip 1–17) and ACTH (clip 18–39)) as outlined by the manufacturer. For MS/MS experiments, the instrument was externally calibrated with fragments of Glu-fibrino-peptide. In the MS mode, a total of 2000 shots were typically collected (40 sub-spectra accumulated from 50 laser shots each). After MS data acquisition, peptides were selected and subjected to MS/MS analysis. Here, a total of 3000 shots (40 sub-spectra accumulated from 75 laser shots each) were in general acquired, and the timed-ion selector window was set to 250 resolution (FWHM), while the metastable suppressor was switched on. If identification was still ambiguous, the samples were loaded on an automated nano-HPLC system (LC Packings-Dionex) and the separated peptides were detected on-line by an ESI-Q-TOF mass spectrometer (Micromass), as previously described5. In this method, an automated MS to MS/MS switching protocol was used for on-line LC-MS/MS analysis of the peptides. For identification, we generally performed a database search using a local MASCOT server6. FUNCTIONAL ANALYSIS AND STRUCTURE PREDICTION: Sequences of the genome of S. oneidensis MR-1 were downloaded from The Institute of Genomic Research and inserted as a separate dataset into the Gene Relational Database (GRDB)7. For each sequence, a family profile and secondary structure prediction was calculated as required by the ORFeus sequence alignment program8, which represents the main similarity search component of the GRDB system. The system also facilitates sequence alignments using PSI-Blast9 and RPS-Blast. The datasets include families extracted from Pfam10, from COGs11 and other resources. The system was used to find homology between selected sequences from S. oneidensis MR-1 and protein families with known function.
APPENDIX A
150
REFERENCES:
1 Sanchez, J.C.; Rouge, V.; Pisteur, M. et al. Improved and simplified in-gel sample application
using reswelling of dry immobilized pH gradients. Electrophoresis 1997, 18, 324-327
2 Anderson, L; Hofmann, J.P.; Anderson, E. et al. Technical improvements in two-dimensional gel
quality and reproducibility using the iso-dalt system. Electrophoresis 1988, 9, 621-621
3 Giometti, C.S.; Taylor, J. In: The application of two-dimensional electrophoresis mutation studies,
advances in electrophoresis. Edited by Dunn, M.J., Walter de Gruyter, New York 1991
4 Rosenfeld, J.; Capdevielle, J.; Guillemot, J.C. et al. In-gel digestion of proteins for internal
sequence analysis after one- or two-dimensional gel electrophoresis. Anal. Biochem. 1992, 203,
173-179
5 Devreese, B.; Vanrobaeys, F.; Van Beeumen, J. Automated nanoflow liquid
chromatography/tandem mass spectrometric identification of proteins from Shewanella
putrefaciens separated by two-dimensional polyacrylamide gel electrophoresis. Rapid Commun.
Mass Spectrom. 2001, 15, 50-56
6 Perkins, D.N.; Pappin, D.J.; Creasy, D.M. et al. Probability-based protein identification by
searching sequence databases using mass spectrometry data. Electrophoresis 1999, 20, 3551-
3567
7 https://grdb.bioinfo.pl
8 Ginalski, K.; Pas, J.; Wyrwicz, L.S. et al. ORFeus: Detection of distant homology using sequence
profiles and predicted secondary structure. Nucleic Acids Res. 2003, 31, 3804-3807
9 Schaffer, A.A.; Aravind, L.; Madden, T.L. et al. Improving the accuracy of PSI-BLAST protein
database searches with composition-based statistics and other refinements. Nucleic Acids Res.
2001, 29, 2994-3005
10 Bateman, A.; Birney, E.; Cerruti, L. et al. The Pfam protein families database. Nucleic Acids Res.
2002, 30, 276-280
11 Tatusov, R.L.; Koonin, E.V.; Lipman, D.J. A genomic perspective on protein families. Science
1997, 278, 631-637

APPENDIX B
151
APPENDIX B PLANT GROWTH: Barley (Hordeum vulgare) genotypes (Jubilant, abiotic stress-susceptible, spring type and Mandolina, abiotic stress-tolerant, spring type) were sterilized with 3% H2O2 for 30 min, and were soaked thereafter in MilliQ water, with frequent changes, for 2 hours. Grains were germinated under sterile conditions on wet filter paper in Petri dishes (25 grains/dish), in the dark and in a thermostat (24°C) for 5 days. After this period of growth, half of the barley seedlings were subjected to a heat shock treatment at 40ºC for 2 hours, and protein extraction was immediately performed. PROTEIN EXTRACTION OF THE BARLEY SHOOTS: Barley shoots were crushed in liquid nitrogen and then homogenized with 10% TCA and 0.07% β-mercaptoethanol in cold acetone. Proteins were allowed to precipitate 1 h at -20°C. After centrifugation (10 min at 16000g, 4°C), the pellets were washed twice with cold acetone containing 0.07% β-mercaptoethanol (1 h at -20°C). The supernatants were discarded and the pellets were vacuum-dried and dissolved in an extraction buffer (25µl per mg of dry matter) for 30 min on a shaker at 37°C. This buffer consisted of 8 M urea, 40mM Tris-base, 4% CHAPS and 1mM PMSF. After centrifugation (10 min at 16000g, 4°C), the supernatant containing the soluble protein fraction was recovered and the protein concentration was determined using the Bradford Kit Assay (Bio-Rad, Hercules, Ca, USA). The samples were stored at -80°C until use. TWO-DIMENSIONAL GEL ELECTROPHORESIS Approximately 550 µg of protein was loaded on 18 cm immobilized pH gradient (IPG) strips, pH range 3-10L (Bio-Rad) via the passive in-gel rehydration protocol. The isoelectric focusing (IEF) was performed on a Multiphor II system (Amersham Biosciences, Uppsala, Sweden) running a standard program provided by the manufacturer. The temperature was kept at 18°C. After completion of the IEF program, the strips were equilibrated for 10 min in a 50mM Tris-HCl solution (pH 8.8) containing 6 M urea, 30% glycerol, 2% sodium dodecylsulfate (SDS) and 1% dithiothreitol (DTT). Thereafter, the solution was replaced by the same Tris-HCl solution, except that DDT was exchanged for 2.5% iodoacetamide. The strips were then placed on home-casted SDS-PAGE gels (12.5% T and 2.6% C). Electrophoresis was carried out in a Protean Plus Dodeca Cell system (Bio-Rad) at 10mA/gel for 15 min, followed by a +/-10h run at 200 V, until the bromophenol blue front reached the bottom of the gel. Staining was performed using Coomassie Brillant Blue G-250 according to Anderson et al1. The gel images were digitized with a 12-bit GS-710 calibrated densitometer (Bio-Rad) and analyzed with the PDQuest 7.1 software (Bio-Rad). After spot detection, the 2D maps were automatically aligned followed by manual spot editing to increase the correlation between the different 2D maps. Statistical analysis of the relative abundance of each matched protein spot was accomplished by using a two-tailed t-test. Only quantitative differences with a p-value of at least < 0.05 were considered. IN-GEL DIGESTION: Protein digestion was performed according to Rosenfeld et al2, with minor modifications. In short, the spots were excised from the gel and washed twice with
APPENDIX B
152
150 µl of 200mM ammonium bicarbonate in 50% acetonitrile/water (20 min at 30 ºC). After drying at room temperature, for 10 min, the tubes were chilled on ice. Afterwards, 8 µl of digestion buffer was added (50mM ammonium bicarbonate, pH 7.8), containing 0.002 µg/µl trypsin. The samples were kept on ice (45 min), and 20 µl of digestion buffer was added. After overnight incubation (37°C), the supernatant was recovered and the remaining peptides were extracted from the gel piece (60% acetonitrile/0.1% formic acid in water). For mass spectrometric analysis, the samples were dried and then dissolved in 12 µl of 0.1% formic acid. PROTEIN IDENTIFICATION - MASS SPECTROMETRIC ANALYSES: The genome of Hordeum vulgare has not been fully sequenced, but several expressed sequence tag (EST) databases can be accessed on the World Wide Web. Such a suitable Hordeum vulgare EST database (www.ncbi.nlm.nih.gov) was downloaded and formatted to make it accessible via the database searching program MASCOT (www.matrixscience.com). If mass spectral data fitted a translated EST sequence, this sequence was loaded into a BLAST query for annotation. Tryptic peptide mixtures were measured on a MALDI TOF/TOF mass spectrometer (Applied Biosystems, Framingham, CA, USA). In the MS mode, the generated ions are accelerated at the source (20kV) and are separated in the second TOF tube. In the MS/MS mode, the parent ion is focused into the gas cell where the peptide is fragmented using collision induced dissociation (CID). The fragments formed are reaccelerated (15kV) and the m/z-values are then determined in the second TOF tube. The voltage applied to the source was 8 kV and to the gas cell 7 kV; air (1 x 10 -6 Torr) was introduced in the cell as fragmenting gas. The peptide mixture (1 µl) was co-crystallized with an equal volume of matrix solution (100mM α-cyano-4-hydroxycinnamic acid dissolved in 50% v/v acetonitrile/0.1% TFA in water) and applied to the target plate. Prior to analysis, the instrument was externally calibrated with a standard peptide mixture, as outlined by the manufacturer. When the peptide mass fingerprinting was not conclusive, several peptides were subjected to further MS/MS analysis. Mass spectral data were then submitted for database searching to our local MASCOT server for protein identification. If the identification was uncertain, the peptide mixture was separated by nano-HPLC and detected on-line by an ESI-Q-TRAP mass spectrometer (Applied Biosystems). The experimental setup of the separation system has been described elsewhere3. Briefly, the samples were loaded onto the nano-column (PEPMAP, 150 mm x 75 µm I.D) using an in-line pre-concentration step on a micro pre-column cartridge (2 mm x 800µm I.D.). Afterwards, peptides were separated using a linear gradient from 5% acetonitrile/0.1% formic acid in water to 80% acetonitrile/0.1% formic acid in water, running over a period of 50 min. The eluted peptides were ‘on-line’ detected by the Q-TRAP mass spectrometer. In this method, an automated MS to MS/MS switching protocol was used. First, an enhanced MS scan as survey scan (m/z 400 -1500) was performed, followed by an enhanced resolution scan of the two most intense ions. The last scan allowed to determine the charge state of the ions. If their charge state was two or three, an enhanced product ion scan (MS/MS) of these ions was performed. The total cycle time of this setup was approximately 4.5 sec.

APPENDIX B
153
REFERENCES:
1 Anderson, L; Hofmann, J.P.; Anderson, E. et al. Technical improvements in two-dimensional gel
quality and reproducibility using the iso-dalt system. Electrophoresis 1988, 9, 621-621
2 Rosenfeld, J.; Capdevielle, J.; Guillemot, J.C. et al. In-gel digestion of proteins for internal
sequence analysis after one- or two-dimensional gel electrophoresis. Anal. Biochem. 1992, 203,
173-179
3 Devreese, B.; Janssen, K.; Vanrobaeys, F. et al. Automated nanoflow liquid chromatography-
tandem mass spectrometry for a differential display proteomic study on Xenopus laevis
neuroendocrine cells. J. Chromatogr. A 2002, 976, 113-121

APPENDIX C
154
APPENDIX C ISOLATION OF MITOCHONDRIA : Mitochondria were isolated according to the method described by Scholte et al1. The heart tissue specimen used for isolation of mitochondria weighed 2.4 g. A volume of 46 ml of buffer (10 mM Tris-HCl, 0.25 M sucrose, 2 mM EDTA, 50 U/ml heparine, pH 7.4) was added to the heart tissue sample for homogenization in a glass/glass pestle. The homogenate was then centrifuged (5.600 x g) for 1 min. The supernatant was kept on ice. The pellet was suspended, homogenized and centrifuged again, and this procedure was repeated twice. The combined supernatant was centrifuged (37.500 x g) for 3 min. The resulting pellet was suspended once more in 46 ml homogenization buffer, and centrifuged (37.500 x g) for 3 min. The final pellet, containing the mitochondria (around 17 mg of protein), was kept frozen at -80°C.
SOLUBILIZATION OF THE OXPHOS COMPLEXES: The solubilization of the complexes was performed according to a modified protocol of Schägger and von Jagow2. The mitochondrial pellet was suspended in 4 ml buffer (750 mM aminocaproic acid, 50 mM Bis-Tris, 20 µM PMSF, pH 7) and 500 µl 10% laurylmaltoside, and the mixture was subsequently centrifuged (100.000 x g) for 15 min. Because of the large sample volume, a Beckman L8–70M ultracentrifuge equipped with a T55 rotor and sample tubes with a maximal volume of 5 ml were used. The supernatant containing the OXPHOS enzyme complexes was divided into aliquots of 1ml and kept at -80°C.
PREPARATION OF SAMPLES The protein concentration of the sample containing the dissolved OXPHOS complexes, assayed according to Bradford’s method3, was 1.9 µg/µl. To 350 µl of each sample, 18 µl of a 5% Serva Blue G solution in 750 mM aminocaproic acid was added before homogenization. The protein load of the lane was around 650 µg.
FIRST-DIMENSIONAL ELECTROPHORESIS - BN-PAGE: BN-PAGE was performed in the Bio-Rad Protean II Xi cell using 20 x 20 x 0.15cm glass plates. The 5%–13% polyacrylamide gradient, as well as the buffers used for electrophoresis, was prepared as described by Schägger4. To remove small contaminating particles, the gel reagents were filtered using a 0.2 µm Acrodisc filter, diameter 32mm (Gelman Laboratory). The cathodal and anodal buffers were filtered using a 0.2 µm Nalgene filter of 50mm diameter (Nalge Nunc International). A premixed 30% acrylamide solution from Bio-Rad was used; the volumes and amount of bisacrylamide added were recalculated to result in a stacking and resolving gel identical to those described in Schägger’s article. The gels were run at 4–7°C. Electrophoresis was started at 75 V until the entry of the protein sample into the stacking gel was achieved. The cathode buffer containing Serva Blue G was replaced by a buffer without the dye before the electrophoresis was continued overnight at 150 V. The experiment was stopped when the dye front had run off completely from the gel.
SECOND-DIMENSIONAL ELECTROPHORESIS - TRICINE SDS-PAGE: The reagents for gel formation were prepared according to a protocol from Schägger et al.2. Filtration of gel reagents and buffers was as described for the first dimension. A 30% premixed acrylamide solution (Bio-Rad) was used; the volumes and amount

APPENDIX C
155
of bisacrylamide added were recalculated to result in a stacking and resolving gel identical to those described in reference 2. The excised lane (10 x 1.5 mm) was transferred to a 20 x 20 cm glass plate at the position of the sample gel and soaked with 1% SDS and 1% mercaptoethanol for 2 h. One millimeter spacers were positioned, a glass plate was placed above the gel and clamps were fixed. While still horizontal, mercaptoethanol was soaked off with a paper towel. The spacers and glass plates were aligned and vertically placed in the casting stand. The acrylamide solution (for a 16.5% T, 3% C Tricine-SDS-gel) was then injected between the glass plates up to 3 cm from the first-dimensional gel strip. The freshly poured gel was overlaid with a small amount of water. After polymerization, the water was decanted and a 2 cm layer of 10% T, 3% C Tricine-SDS-gel mixture was added. The gel was completely immersed in water and polymerized overnight. Finally, a 10% native gel was cast around the gel lane without covering it. In that gel, a cut comb between the gel lane and the spacer was placed in order to create a sample well for loading the molecular weight standards. The gel strip was covered with a 2 mm layer of solution containing 4% SDS, 10% glycerol, 2% mercaptoethanol, 0.03% Serva Blue G, 50 mM Tris adjusted to pH 7. Fifteen microliters of molecular weight markers (Kaleidoscope prestained standard from Bio-Rad) was loaded. Electrophoresis was performed at room temperature, starting for 3 h at 75 V; the voltage was raised to 150 V overnight (max. 50 mA).
PROTEIN STAINING OF THE TRICINE SDS-PAGE GELS: The gels were stained with the Coomassie G-250 stain (Bio-Rad), and incubated under constant shaking for 30 min in a solution containing 40% methanol and 10% acetic acid. The gel was subsequently washed three times for 5 min in 400 ml water. After removal of the water, 100 ml of Coomassie stain was added. The gel was gently shaken for 1 h and washed overnight with water. The gels were scanned using a Sharp JX-330 scanner. On the printout we located the 2527 MS of BN-PAGE separated OXPHOS proteins spots to be excised and added an identification label. The gel was kept by –80°C up to the moment of excision of the spots.
DIGESTIONS: Individual bands were excised and recuperated in Eppendorf tubes. The bands were washed twice with 150 µl of 200 mM ammonium bicarbonate in 50% acetonitrile. The washing procedure was repeated using 50 mM ammonium bicarbonate. The gel slices were allowed to dry in air and the tubes were placed on ice. Depending on the band intensity, 8–26 µl of a solution containing 2 ng/µl trypsin dissolved in 20 mM ammonium bicarbonate (sequencing-grade modified trypsin; Promega) were added and allowed to enter in the gel for 40 min while keeping the tube on ice. Then, 50 µl of 20 mM ammonium bicarbonate was added to cover the gel slice completely with digestion buffer, and the tubes were incubated overnight at 37°C. After digestion, the supernatant was recovered, together with the peptide extracts obtained after adding 50 µl of 50% acetonitrile/0.1% formic acid. The combined fractions were dried in a Speedvac concentrator (Thermo Savant).
MASS SPECTROMETRIC IDENTIFICATION: The dried peptide mixtures were dissolved in 12 µl of 5% acetonitrile/0.1% formic acid in water. One microliter of this sample was used for MALDI-TOF mass spectrometric analysis. It was mixed with an equivalent amount of matrix, 50 mM α-cyano-hydroxycinnamic acid dissolved in 40% ethanol/59.9% acetonitrile/0.1% formic acid. The mixture was applied on the target and allowed to dry by air. MALDI-TOF
APPENDIX C
156
analyses were performed on a M@ldi mass spectrometer (Micromass). The remainder solution was used for nanoflow LC-MS/MS analysis on a Q-TOF mass spectrometer (Micromass). The setup for this experiment was previously published5. Basically, we used an Ultimate µLC system connected to a FAMOS autosampler (Dionex - LC-Packings). Samples were loaded onto the separating column after preliminary desalting/concentration on a precolumn using a column switching protocol. The peptide mixture was separated on a Pepmap C18 column, connected to the nanoflow source of the Q-TOF mass spectrometer. Compared to the published setup we slightly modified the source, now using a fused-silica spraying capillary (New Objective) connected to the column tubing with a simple Teflon sleeve. Interpretation of the MS/MS data was performed mainly manually, implementing MAXENT3 and PEPSEQ software tools delivered with the instruments. Database searching was performed using Protein Globalserver (Micromass), or the internet tools MASCOT (www.matrixscience.com) and Peptidesearch (www.narrador.embl-heidelberg.de).
REFERENCES:
1 Scholte, H.R.; Ross, J.D.; Blom, W. et al. Assessment of deficiencies of fatty acyl-CoA
dehydrogenases in fibroblasts, muscle and liver. J. Inherit. Metab. Dis. 1992, 15, 347-352
2 Schägger, H.; von Jagow, G. Blue native electrophoresis for isolation of membrane protein
complexes in enzymatically active form. Anal. Biochem. 1991, 199, 223-331
3 Bradford, M.M. A rapid and sensitive method for the quantitation of microgram quantities of protein
utilizing the principle of protein-dye binding. Anal. Biochem. 1976, 72, 248-254
4 Schägger, H. Quantification of oxidative phosphorylation enzymes after blue native
electrophoresis and two-dimensional resolution: Normal complex I protein amounts in Parkinson's
disease conflict with reduced catalytic activity. Electrophoresis 1995, 16, 763-770
5 Devreese, B.; Vanrobaeys, F.; Van Beeumen, J. Automated nanoflow liquid
chromatography/tandem mass spectrometric identification of proteins from Shewanella
putrefaciens separated by two-dimensional polyacrylamide gel electrophoresis. Rapid Commun.
Mass Spectrom. 2001, 15, 50-56

APPENDIX D
157
APPENDIX D ISOLATION AND EXTRACTION OF MYELIN: Brain tissue of 8 weeks old mice (C57/bl6, Harlan Netherlands) was used for the isolation of myelin. Myelin was purified as previously described1-3 , with some modifications. All steps were carried out at 4°C, unless otherwise stated. Briefly, the brains of eight animals were pooled and homogenized with a glass homogenizer in 0.32M sucrose buffer. The homogenate was then layered over a 0.85M sucrose buffer. After ultracentrifugation (SW-55 rotor, 28.000 rpm for 35 min, Beckman), the interface of the 0.32M/0.85M sucrose was recovered. This fraction was washed twice in deionized water, stirred for 30 min and centrifuged at 28.000 rpm for 15 min. The pellet was suspended in 0.32M sucrose and layered over a 0.85M sucrose buffer. The ultracentrifugation step was repeated and the interface collected. Afterwards, the washing step in deionized water was repeated. This pellet was then delipidated four times with ether-ethanol 3:24. Samples were dried in a Speedvac and suspended in 500 µl buffer containing 7M urea/2M thio-urea, 4% CHAPS (w/v) and 1% DTT. The tube was sonicated and stirred for 30 min at room temperature. After centrifugation at 13.200 rpm (Eppendorf) for 15 minutes, the supernatant containing the soluble protein fraction was separated from the detergent-insoluble pellet and the protein concentration was determined using the Protein Assay Kit (Bio-Rad).
TWO-DIMENSIONAL GEL ELECTROPHORESIS: The protocol for 2D-PAGE has been published in detail elsewhere5. Briefly, 400µg protein of the soluble protein fraction was applied on an IPG strip (pH3-10L) via passive in-gel rehydration. Iso-electric focusing (IEF) was performed using a Multiphor II system, followed by equilibration of the IPG strips. Afterwards, the IPG strips were placed on top of a SDS-gel (12.5%T and 2.6%C) and subjected to electrophoresis. The 2D-gels were stained with CBB G-250.
IN-GEL DIGESTION - PROTEIN SPOT IDENTIFICATION: For more details about in-gel digestion, protein extraction, mass spectrometric analyses and protein identification strategy for 2D-PAGE separated proteins, we refer to previous published work6. Briefly, the excised spots were washed, air-dried, and then digested overnight with 0.02 µg modified trypsin (Promega, Madison, USA) per spot, in 50 mM ammonium bicarbonate at 37°C. Peptides were extracted with 60% ACN/0.1% formic acid in water, dried and dissolved in 10 µl of 0.1% formic acid. Two mass spectrometric strategies were used for further analysis of the samples. In a first attempt, we attempted to identify the protein spots by MALDI TOF/TOF MS (Applied Biosystems). Here, 1 µl sample was mixed with 1 µl matrix (100 mM a-cyano-4-hydroxycinnamic acid in 50% ACN/0.1% TFA in water) and the resultant mixture was applied onto a target. Samples that could not be identified by MALDI analysis were loaded on an automated nanoLC system (Dionex-LC Packings) coupled to a hybrid triple quadrupole/linear ion trap (Q-TRAP LC-MS/MS system, Applied Biosystems).
PROTEIN IN-SOLUTION DIGESTION: To reduce and alkylate the protein mixture prior to injection to 2D-LC, 10 µl 10mM DTT was added to 100 µl of the sample (5µg/µl). The Eppendorf tube was incubated for 30 min at 60°C. After cooling for 5 min down to room temperature, 10 µl 100mM iodoacetamide was added and the mixture was placed in the dark for 30 min. Then, 20 µl out of the 120 µl of the reduced and alkylated sample was digested. This
APPENDIX D
158
sample was diluted in 60 µl 0.1% SDS/50mM Tris, pH 7.4, and 20 µl ACN, and incubated overnight with 100 µl 0.1µg/µl trypsin (Promega). The peptide mixture was dried in a Speedvac (Thermo Savant). The sample was then dissolved in 20 µl 0.1% formic acid. MULTIDIMENSIONAL LIQUID CHROMATOGRAPHY: An Ultimate Plus Dual-Gradient Capillary/Nano LC system (Dionex-LC Packings) was used in the study. This 2D-LC system consists of a capillary LC pump for the separation in the first dimension and a nano LC pump for the separation in the second dimension. Both pumps are capable of delivering a gradient and are equipped with an active flow control system, using capillary and nano flow sensors. For the SCX chromatographic analyses, the sample (± 40 µg) was injected, using a Famos microautosampler (Dionex-LC packings) onto a 0.3 mm x 150 mm cation exchange column packed with POROS 10S; the injection loop had a volume of 10 µl loop. The capillary LC pump operated at a continuous flow rate of 5 µl/min. The mobile phases were as follows: (A) KH2PO4/5% ACN in water (pH 3), (B) 5mM KH2PO4/5% ACN/500mM KCl in water (pH 3). The gradient profile used consisted of 0% B for the first 20 min, a linear gradient of 0-40% B over 30 min, followed by a linear gradient of 40% to 100% B over 15 min. The eluted peptides were fractionated in a 96 micro well-plate (conical shaped) at 2 min intervals using a Probot device. The column effluent was monitored using a 45 nl UV flow cell. The 96 micro well plate was then placed in the microautosampler and the samples were, one after the other, loaded onto a RP trapping column (Pepmap C18, 800µm x 5mm) using the SWITCHOS device (Dionex-LCPackings), equipped with two micro 2-position/10-port valves. This loading pump was operated at 8 µl/min, and 0.05% TFA in water was used as mobile phase. After 8 min, the valve was switched and the sample was eluted onto the analytical separation column (PepMap C18, 75 µm x 150 mm) in the back-flush mode, using the nanoLC pump operated at 250 nl/min. The mobile phases used were 5% ACN/0.1% TFA (v/v) for Buffer A and 80% ACN/0.1% TFA (v/v) for Buffer B. Peptides were resolved by gradient elution using a gradient of 0-50% Buffer B over 25 min, followed by a gradient of 50-100% Buffer B over 10 min. Column effluent was monitored using a 3 nl UV flow cell (214 nm), and spotted directly onto a MALDI target using the Probot device.
LC/MALDI MS: Prior to nanoLC analysis, a 192 well MALDI target was manually spotted with 0.4 µl MALDI matrix (8 mg/ml alfa-cyano-4-hydroxycinnamic acid dissolved in 50% ACN/0.1% TFA (v/v) containing 2mM dibasic ammonium citrate). During separation in the second dimension, the column effluent was spotted onto this target at 30s intervals using the Probot as spotting device. Here, the capillary outlet (a fused silica capillary of 20 µm ID) was placed in direct contact with the MALDI target. After fractionation was completed, a saturated matrix solution (0.1 µl of 50% ACN/20% ethanol/0.1% TFA in water) was added on top of each spot and allowed to dry at open air. The sample spots were then ready for both MALDI MS and MALDI MS/MS analysis. The MALDI TOF-TOF MS was externally calibrated prior to analysis, as outlined by the manufacturer. The result-dependent MS/MS experiments were performed on a 4700 Proteomics Analyzer equipped with GPS Explorer version 2.0, using the job-wide interpretation method. In this strategy, the MS spectra were collected first, and masses were chosen for fragmentation from the spots in which they were the most intense. The spot to spot precursor selection was set to 200 ppm,
APPENDIX D
159
and the S/N ratio of the parent ion was at least 40. MS/MS analysis was performed from the highest to the least intense peak. For MS data acquisition, a total of 2000 shots were collected (40 sub-spectra accumulated from 50 laser shots each). All MS/MS data was acquired in the 1keV MS/MS mode using air as the collision gas (1.2 x 10⁻⁷ torr). A total of 3000 shots (40 sub-spectra accumulated from 75 laser shots each) were acquired and the timed-ion-selector window was set to 250 resolution (FWHM).
PEPTIDE IDENTIFICATION METHOD: The MS/MS data collected during a LC-MALDI run were submitted to the search software Mascot v1.97 using the GPS explorer v2.0 software. Preliminary protein identifications were obtained by comparing experimental data to the NCBInr and Swiss-Prot databases. The taxonomy was set to Mus musculus (mouse); carbamidomethyl and methionine oxidation were selected as variable modifications, and one missed cleavage was allowed with trypsin as the cleaving agent. Searches were done with a tolerance of 100 ppm for the precursor ion and 0.4 Da in the MS/MS mode. The MS/MS data was re-submitted to MASCOT with the same parameters, except that the cleaving agent was now set to 'none'. The raw data were inspected manually for confirmation prior to acceptance.
REFERENCES:
1 Norton, W.T.; Poduslo, S.E. Myelination in rat brain: changes in myelin composition during brain
maturation. J. Neurochem. 1973, 21, 749-757
2 Corneliuson, O.; Berthold, C.H.; Freedman, P. Isolation of myelinoid Marchi-positive bodies from
normal rabbit spinal cord. Brain Res. 1987, 416, 43-53
3 Huber, L.A.; Madison, D.L.; Simons, K. et al. Developmental regulation of low molecular weight
GTP-binding proteins. FEBS Lett. 1994, 347, 273-278
4 Greenfield, S.; Norton, W.T.; Morell P. Quaking mouse: isolation and characterization of myelin
protein. J. Neurochem. 1971, 18, 2119-2128
5 Vanrobaeys F.; Devreese B.; Lecocq E. et al. Proteomics of the dissimilatory iron-reducing
bacterium Shewanella oneidensis MR-1, using a matrix-assisted laser desorption/ionization-
tandem-time of flight mass spectrometer. Proteomics 2003, 3, 2249-2257
6 Süle, A.; Vanrobaeys, F.; Hajos, G. et al. Proteomic analysis of small heat shock protein isoforms
in barley shoots. Phytochemistry 2004, 65, 1853-1863
7 Perkins, D.N.; Pappin, D.J.; Creasy, D.M. et al. Probability-based protein identification by
searching sequence databases using mass spectrometry data. Electrophoresis 1999, 20, 3551-
3567
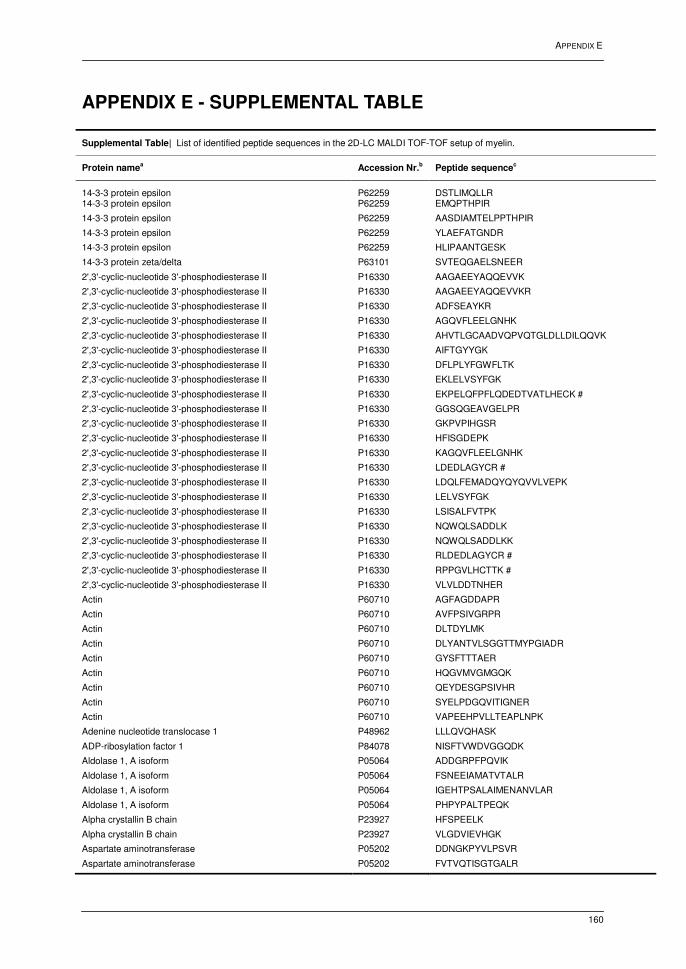
APPENDIX E
160
APPENDIX E - SUPPLEMENTAL TABLE
Supplemental Table| List of identified peptide sequences in the 2D-LC MALDI TOF-TOF setup of myelin.
Protein namea Accession Nr.
b Peptide sequence
c
14-3-3 protein epsilon P62259 DSTLIMQLLR 14-3-3 protein epsilon P62259 EMQPTHPIR
14-3-3 protein epsilon P62259 AASDIAMTELPPTHPIR
14-3-3 protein epsilon P62259 YLAEFATGNDR
14-3-3 protein epsilon P62259 HLIPAANTGESK
14-3-3 protein zeta/delta P63101 SVTEQGAELSNEER
2',3'-cyclic-nucleotide 3'-phosphodiesterase II P16330 AAGAEEYAQQEVVK
2',3'-cyclic-nucleotide 3'-phosphodiesterase II P16330 AAGAEEYAQQEVVKR
2',3'-cyclic-nucleotide 3'-phosphodiesterase II P16330 ADFSEAYKR
2',3'-cyclic-nucleotide 3'-phosphodiesterase II P16330 AGQVFLEELGNHK
2',3'-cyclic-nucleotide 3'-phosphodiesterase II P16330 AHVTLGCAADVQPVQTGLDLLDILQQVK
2',3'-cyclic-nucleotide 3'-phosphodiesterase II P16330 AIFTGYYGK
2',3'-cyclic-nucleotide 3'-phosphodiesterase II P16330 DFLPLYFGWFLTK
2',3'-cyclic-nucleotide 3'-phosphodiesterase II P16330 EKLELVSYFGK
2',3'-cyclic-nucleotide 3'-phosphodiesterase II P16330 EKPELQFPFLQDEDTVATLHECK #
2',3'-cyclic-nucleotide 3'-phosphodiesterase II P16330 GGSQGEAVGELPR
2',3'-cyclic-nucleotide 3'-phosphodiesterase II P16330 GKPVPIHGSR
2',3'-cyclic-nucleotide 3'-phosphodiesterase II P16330 HFISGDEPK
2',3'-cyclic-nucleotide 3'-phosphodiesterase II P16330 KAGQVFLEELGNHK
2',3'-cyclic-nucleotide 3'-phosphodiesterase II P16330 LDEDLAGYCR #
2',3'-cyclic-nucleotide 3'-phosphodiesterase II P16330 LDQLFEMADQYQYQVVLVEPK
2',3'-cyclic-nucleotide 3'-phosphodiesterase II P16330 LELVSYFGK
2',3'-cyclic-nucleotide 3'-phosphodiesterase II P16330 LSISALFVTPK
2',3'-cyclic-nucleotide 3'-phosphodiesterase II P16330 NQWQLSADDLK
2',3'-cyclic-nucleotide 3'-phosphodiesterase II P16330 NQWQLSADDLKK
2',3'-cyclic-nucleotide 3'-phosphodiesterase II P16330 RLDEDLAGYCR #
2',3'-cyclic-nucleotide 3'-phosphodiesterase II P16330 RPPGVLHCTTK #
2',3'-cyclic-nucleotide 3'-phosphodiesterase II P16330 VLVLDDTNHER
Actin P60710 AGFAGDDAPR
Actin P60710 AVFPSIVGRPR
Actin P60710 DLTDYLMK
Actin P60710 DLYANTVLSGGTTMYPGIADR
Actin P60710 GYSFTTTAER
Actin P60710 HQGVMVGMGQK
Actin P60710 QEYDESGPSIVHR
Actin P60710 SYELPDGQVITIGNER
Actin P60710 VAPEEHPVLLTEAPLNPK
Adenine nucleotide translocase 1 P48962 LLLQVQHASK
ADP-ribosylation factor 1 P84078 NISFTVWDVGGQDK
Aldolase 1, A isoform P05064 ADDGRPFPQVIK
Aldolase 1, A isoform P05064 FSNEEIAMATVTALR
Aldolase 1, A isoform P05064 IGEHTPSALAIMENANVLAR
Aldolase 1, A isoform P05064 PHPYPALTPEQK
Alpha crystallin B chain P23927 HFSPEELK
Alpha crystallin B chain P23927 VLGDVIEVHGK
Aspartate aminotransferase P05202 DDNGKPYVLPSVR
Aspartate aminotransferase P05202 FVTVQTISGTGALR
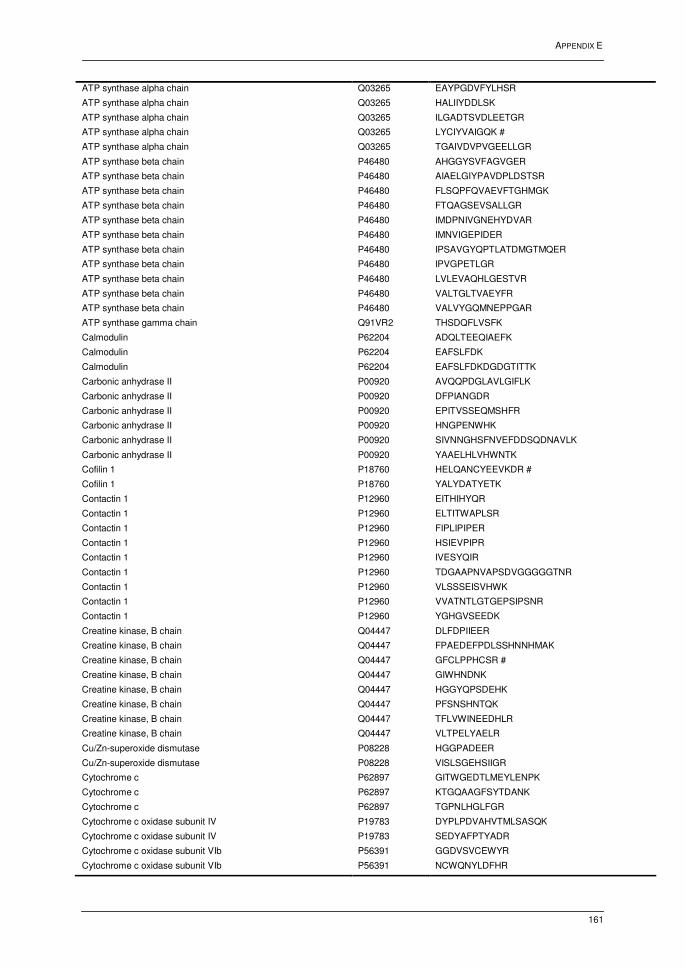
APPENDIX E
161
ATP synthase alpha chain Q03265 EAYPGDVFYLHSR
ATP synthase alpha chain Q03265 HALIIYDDLSK
ATP synthase alpha chain Q03265 ILGADTSVDLEETGR
ATP synthase alpha chain Q03265 LYCIYVAIGQK #
ATP synthase alpha chain Q03265 TGAIVDVPVGEELLGR
ATP synthase beta chain P46480 AHGGYSVFAGVGER
ATP synthase beta chain P46480 AIAELGIYPAVDPLDSTSR
ATP synthase beta chain P46480 FLSQPFQVAEVFTGHMGK
ATP synthase beta chain P46480 FTQAGSEVSALLGR
ATP synthase beta chain P46480 IMDPNIVGNEHYDVAR
ATP synthase beta chain P46480 IMNVIGEPIDER
ATP synthase beta chain P46480 IPSAVGYQPTLATDMGTMQER
ATP synthase beta chain P46480 IPVGPETLGR
ATP synthase beta chain P46480 LVLEVAQHLGESTVR
ATP synthase beta chain P46480 VALTGLTVAEYFR
ATP synthase beta chain P46480 VALVYGQMNEPPGAR
ATP synthase gamma chain Q91VR2 THSDQFLVSFK
Calmodulin P62204 ADQLTEEQIAEFK
Calmodulin P62204 EAFSLFDK
Calmodulin P62204 EAFSLFDKDGDGTITTK
Carbonic anhydrase II P00920 AVQQPDGLAVLGIFLK
Carbonic anhydrase II P00920 DFPIANGDR
Carbonic anhydrase II P00920 EPITVSSEQMSHFR
Carbonic anhydrase II P00920 HNGPENWHK
Carbonic anhydrase II P00920 SIVNNGHSFNVEFDDSQDNAVLK
Carbonic anhydrase II P00920 YAAELHLVHWNTK
Cofilin 1 P18760 HELQANCYEEVKDR #
Cofilin 1 P18760 YALYDATYETK
Contactin 1 P12960 EITHIHYQR
Contactin 1 P12960 ELTITWAPLSR
Contactin 1 P12960 FIPLIPIPER
Contactin 1 P12960 HSIEVPIPR
Contactin 1 P12960 IVESYQIR
Contactin 1 P12960 TDGAAPNVAPSDVGGGGGTNR
Contactin 1 P12960 VLSSSEISVHWK
Contactin 1 P12960 VVATNTLGTGEPSIPSNR
Contactin 1 P12960 YGHGVSEEDK
Creatine kinase, B chain Q04447 DLFDPIIEER
Creatine kinase, B chain Q04447 FPAEDEFPDLSSHNNHMAK
Creatine kinase, B chain Q04447 GFCLPPHCSR #
Creatine kinase, B chain Q04447 GIWHNDNK
Creatine kinase, B chain Q04447 HGGYQPSDEHK
Creatine kinase, B chain Q04447 PFSNSHNTQK
Creatine kinase, B chain Q04447 TFLVWINEEDHLR
Creatine kinase, B chain Q04447 VLTPELYAELR
Cu/Zn-superoxide dismutase P08228 HGGPADEER
Cu/Zn-superoxide dismutase P08228 VISLSGEHSIIGR
Cytochrome c P62897 GITWGEDTLMEYLENPK
Cytochrome c P62897 KTGQAAGFSYTDANK
Cytochrome c P62897 TGPNLHGLFGR
Cytochrome c oxidase subunit IV P19783 DYPLPDVAHVTMLSASQK
Cytochrome c oxidase subunit IV P19783 SEDYAFPTYADR
Cytochrome c oxidase subunit VIb P56391 GGDVSVCEWYR
Cytochrome c oxidase subunit VIb P56391 NCWQNYLDFHR
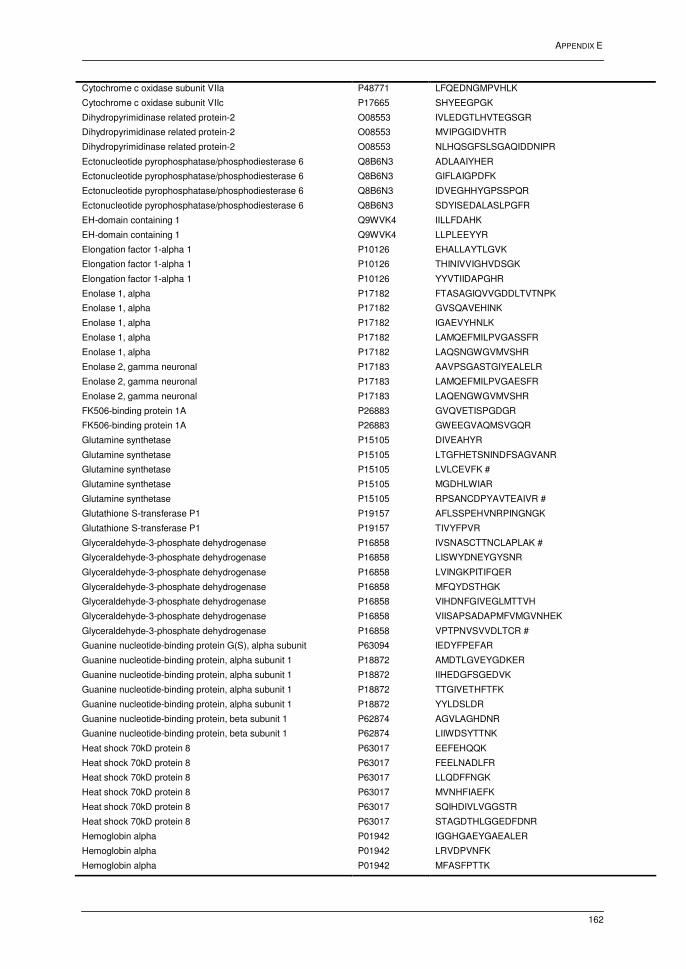
APPENDIX E
162
Cytochrome c oxidase subunit VIIa P48771 LFQEDNGMPVHLK
Cytochrome c oxidase subunit VIIc P17665 SHYEEGPGK
Dihydropyrimidinase related protein-2 O08553 IVLEDGTLHVTEGSGR
Dihydropyrimidinase related protein-2 O08553 MVIPGGIDVHTR
Dihydropyrimidinase related protein-2 O08553 NLHQSGFSLSGAQIDDNIPR
Ectonucleotide pyrophosphatase/phosphodiesterase 6 Q8B6N3 ADLAAIYHER
Ectonucleotide pyrophosphatase/phosphodiesterase 6 Q8B6N3 GIFLAIGPDFK
Ectonucleotide pyrophosphatase/phosphodiesterase 6 Q8B6N3 IDVEGHHYGPSSPQR
Ectonucleotide pyrophosphatase/phosphodiesterase 6 Q8B6N3 SDYISEDALASLPGFR
EH-domain containing 1 Q9WVK4 IILLFDAHK
EH-domain containing 1 Q9WVK4 LLPLEEYYR
Elongation factor 1-alpha 1 P10126 EHALLAYTLGVK
Elongation factor 1-alpha 1 P10126 THINIVVIGHVDSGK
Elongation factor 1-alpha 1 P10126 YYVTIIDAPGHR
Enolase 1, alpha P17182 FTASAGIQVVGDDLTVTNPK
Enolase 1, alpha P17182 GVSQAVEHINK
Enolase 1, alpha P17182 IGAEVYHNLK
Enolase 1, alpha P17182 LAMQEFMILPVGASSFR
Enolase 1, alpha P17182 LAQSNGWGVMVSHR
Enolase 2, gamma neuronal P17183 AAVPSGASTGIYEALELR
Enolase 2, gamma neuronal P17183 LAMQEFMILPVGAESFR
Enolase 2, gamma neuronal P17183 LAQENGWGVMVSHR
FK506-binding protein 1A P26883 GVQVETISPGDGR
FK506-binding protein 1A P26883 GWEEGVAQMSVGQR
Glutamine synthetase P15105 DIVEAHYR
Glutamine synthetase P15105 LTGFHETSNINDFSAGVANR
Glutamine synthetase P15105 LVLCEVFK #
Glutamine synthetase P15105 MGDHLWIAR
Glutamine synthetase P15105 RPSANCDPYAVTEAIVR #
Glutathione S-transferase P1 P19157 AFLSSPEHVNRPINGNGK
Glutathione S-transferase P1 P19157 TIVYFPVR
Glyceraldehyde-3-phosphate dehydrogenase P16858 IVSNASCTTNCLAPLAK #
Glyceraldehyde-3-phosphate dehydrogenase P16858 LISWYDNEYGYSNR
Glyceraldehyde-3-phosphate dehydrogenase P16858 LVINGKPITIFQER
Glyceraldehyde-3-phosphate dehydrogenase P16858 MFQYDSTHGK
Glyceraldehyde-3-phosphate dehydrogenase P16858 VIHDNFGIVEGLMTTVH
Glyceraldehyde-3-phosphate dehydrogenase P16858 VIISAPSADAPMFVMGVNHEK
Glyceraldehyde-3-phosphate dehydrogenase P16858 VPTPNVSVVDLTCR #
Guanine nucleotide-binding protein G(S), alpha subunit P63094 IEDYFPEFAR
Guanine nucleotide-binding protein, alpha subunit 1 P18872 AMDTLGVEYGDKER
Guanine nucleotide-binding protein, alpha subunit 1 P18872 IIHEDGFSGEDVK
Guanine nucleotide-binding protein, alpha subunit 1 P18872 TTGIVETHFTFK
Guanine nucleotide-binding protein, alpha subunit 1 P18872 YYLDSLDR
Guanine nucleotide-binding protein, beta subunit 1 P62874 AGVLAGHDNR
Guanine nucleotide-binding protein, beta subunit 1 P62874 LIIWDSYTTNK
Heat shock 70kD protein 8 P63017 EEFEHQQK
Heat shock 70kD protein 8 P63017 FEELNADLFR
Heat shock 70kD protein 8 P63017 LLQDFFNGK
Heat shock 70kD protein 8 P63017 MVNHFIAEFK
Heat shock 70kD protein 8 P63017 SQIHDIVLVGGSTR
Heat shock 70kD protein 8 P63017 STAGDTHLGGEDFDNR
Hemoglobin alpha P01942 IGGHGAEYGAEALER
Hemoglobin alpha P01942 LRVDPVNFK
Hemoglobin alpha P01942 MFASFPTTK
APPENDIX E
163
Hemoglobin alpha P01942 TYFPHFDVSHGSAQVK
Hemoglobin alpha P01942 VADALANAAGHLDDLPGALSALSDLHAHK
Hemoglobin beta P02088 DFTPAAQAAFQK
Hemoglobin beta P02088 GTFASLSELHCDK #
Hemoglobin beta P02088 KVITAFNDGLNHLDSLK
Hemoglobin beta P02088 LHVDPENFR
Hemoglobin beta P02088 LLGNMIVIVLGHHLGK
Hemoglobin beta P02088 LLVVYPWTQR
Hemoglobin beta P02088 VITAFNDGLNHLDSLK
Hemoglobin beta P02088 VNADEVGGEALGR
Hemoglobin beta P02088 VVAGVAAALAHK
Hemoglobin beta P02088 YFDSFGDLSSASAIMGNAK
Immunoglobulin superfamily, member 8 32189434 ATLQEVVGLHSDMAVEAGAPYAER
Immunoglobulin superfamily, member 8 32189434 AVLAHVDVQTLSSQLAVTVGPGER
Immunoglobulin superfamily, member 8 32189434 DSQFSYAVFGPR
Immunoglobulin superfamily, member 8 32189434 HAAYSVGWEMAPAGAPGPGR
Immunoglobulin superfamily, member 8 32189434 LVAQLDTEGIGSLGPGYEDR
Immunoglobulin superfamily, member 8 32189434 VLPDELQVSAAPPGPR
Isocitrate dehydrogenase 3 alpha subunit Q9D6R2 HMGLFDHAAK
Isocitrate dehydrogenase 3 alpha subunit Q9D6R2 IAEFAFEYAR
Isocitrate dehydrogenase 3 beta subunit Q91VA7 HNNLDLVIIR
Isocitrate dehydrogenase 3 beta subunit Q91VA7 KLDLFANVVHVK
Isocitrate dehydrogenase 3 beta subunit Q91VA7 SVIGHLHPHGG
Junction adhesion molecule C Q9D8B7 DDSGQYYCIASNDAGAAR
Junction adhesion molecule C Q9D8B7 HDGVNYIR
Limbic system-associated membrane protein precursor Q8BLK3 EFEGEEEYLEILGITR
Malate dehydrogenase 1 P14152 FVEGLPINDFSR
Malate dehydrogenase 1 P14152 GEFITTVQQR
Malate dehydrogenase 2 P08249 IFGVTTLDIVR
Malate dehydrogenase 2 P08249 VNVPVIGGHAGK
Malate dehydrogenase 2 P08249 FVFSLVDAMNGK
Manganese superoxide dismutase P09671 HHAAYVNNLNATEEK
MARCKS-related protein P28667 DEAAAAAGGEGAAAPGEQAGGAGAEGAAGGEPR
Membrane glycoprotein/immunoglobulin superfamily member 4B 19068137 KGDQELHGDQTR
Membrane glycoprotein/immunoglobulin superfamily member 4B 19068137 LLLHCEGR #
Membrane glycoprotein/immunoglobulin superfamily member 4C 19068139 GSYLTHEASGLDEQGEAR
Membrane glycoprotein/immunoglobulin superfamily member 4C 19068139 IHASQAVVR
Membrane glycoprotein/immunoglobulin superfamily member 4C 19068139 LHQYDGSIVVIQNPAR
Membrane glycoprotein/immunoglobulin superfamily member 4C 19068139 QTQYVLDVQYSPTAR
Myelin basic protein 387419 DENPVVHFFK
Myelin basic protein 387419 DTGILDSIGR
Myelin basic protein 387419 DTGILDSIGRF
Myelin basic protein 387419 ENPVVHFFK
Myelin basic protein 387419 FSWGAEGQK
Myelin basic protein 387419 FSWGAEGQKPGFGYGGR
Myelin basic protein 387419 GAEGQKPGFGYGGR
Myelin basic protein 387419 GAYDAQGTLSK
Myelin basic protein 387419 HRDTGILDSIGR
Myelin basic protein 387419 NPVVHFFK
Myelin basic protein 387419 PGLCHMYK #
Myelin basic protein 387419 SKYLATASTMDHAR
Myelin basic protein 387419 SRPGLCHMYK #
Myelin basic protein 387419 TASTMDHAR
Myelin basic protein 387419 TQDENPVVHF
APPENDIX E
164
Myelin basic protein 387419 TQDENPVVHFFK
Myelin basic protein 387419 TQDENPVVHFFKNIVTPR
Myelin basic protein 387419 TTHYGSLPQK
Myelin basic protein 387419 TTHYGSLPQKSQHGR
Myelin basic protein 387419 VPWLKQSR
Myelin basic protein 387419 YLATASTMDHAR
Myelin proteolipid protein P60202 GLSATVTGGQK
Myelin proteolipid protein P60202 GQHQAHSLER
Myelin proteolipid protein P60202 LIETYFSK
Myelin proteolipid protein P60202 MYGVLPWNAFPGK
Myelin proteolipid protein P60202 TSASIGSLCADAR
Myelin proteolipid protein P60202 VCGSNLLSICK
Myelin-associated glycoprotein P20917 FDFPDELRPAVVH
Myelin-associated glycoprotein P20917 NLYGTQSLELPFQGAHR
Myelin-associated glycoprotein P20917 NVTESSSFSGGDNPHVLYSPEFR
Myelin-associated glycoprotein P20917 NYPPVVFK
Myelin-associated glycoprotein P20917 SGLLLTSILTIR
Myelin-associated glycoprotein P20917 SNPEPSVAFELPSR
Myelin-associated glycoprotein P20917 TQVVHESFQGR
Myelin-associated oligodendrocytic basic protein 7330691 FSEHFSIHCCPPFTFLNSK #
Myelin-associated oligodendrocytic basic protein 7330691 HQPAASPVVVR
Myelin-associated oligodendrocytic basic protein 7330691 KEEDWICCACQK #
Myelin-associated oligodendrocytic basic protein 7330691 SPLMPAKPR
Myelin-associated oligodendrocytic basic protein 7330691 SPPRPAKPR
Myelin-oligodendrocyte glycoprotein Q61885 AEVENLHR
Myelin-oligodendrocyte glycoprotein Q61885 ALVGDEAELPCR #
Myelin-oligodendrocyte glycoprotein Q61885 DHSYQEEAAMELK
Myelin-oligodendrocyte glycoprotein Q61885 DQDAEQAPEYR
Myelin-oligodendrocyte glycoprotein Q61885 FSDEGGYTCFFR #
Myelin-oligodendrocyte glycoprotein Q61885 LAGQFLEELR
Myelin-oligodendrocyte glycoprotein Q61885 LAGQFLEELRNPF
Myelin-oligodendrocyte glycoprotein Q61885 LRAEVENLHR
Myelin-oligodendrocyte glycoprotein Q61885 NGKDQDAEQAPEYR
Myelin-oligodendrocyte glycoprotein Q61885 TFDPHFLR
Myelin-oligodendrocyte glycoprotein Q61885 VIGPGYPIR
Neural cell adhesion molecule 1 P13595 AGEQDASIHLK
Neural cell adhesion molecule 1 P13595 ALASEWKPEIR
Neural cell adhesion molecule 1 P13595 DIQVIVNVPPTVQAR
Neural cell adhesion molecule 1 P13595 EANMEGIVTIMGLKPETR
Neural cell adhesion molecule 1 P13595 FFLCQVAGDAK #
Neural cell adhesion molecule 1 P13595 FIVLSNNYLQIR
Neural cell adhesion molecule 1 P13595 HIFSDDSSELTIR
Neural cell adhesion molecule 1 P13595 LASEWKPEIR
Neural cell adhesion molecule 1 P13595 LPSGSDHVMLK
Neural cell adhesion molecule 1 P13595 NVDKNDEAEYVCIAENK #
Neural cell adhesion molecule 1 P13595 SLGEESWHFK
Neurocalcin delta Q91X97 DCPSGHLSMEEFKK
Neurocalcin delta Q91X97 IYGNFFPYGDASK
Neurocalcin delta Q91X97 LSLEEFIR
Neurocalcin delta Q91X97 MPEDESTPEKR
Neuronal axonal membrane protein NAP-22 Q91XV3 AGEASAESTGAADGAAPEEGEAK
Neuronal axonal membrane protein NAP-22 Q91XV3 APAPAAPAAAEPQAEAPAAAASSEQSVAVK
Neuronal axonal membrane protein NAP-22 Q91XV3 APAPAAPAAAEPQAEAPAAAASSEQSVAVKE
Neuronal axonal membrane protein NAP-22 Q91XV3 ESEPQAAADATEVK
APPENDIX E
165
Neuronal axonal membrane protein NAP-22 Q91XV3 ETPAASEAPSSAAK
Neuronal axonal membrane protein NAP-22 Q91XV3 KTEAPAAAGPEAK
Neuronal axonal membrane protein NAP-22 Q91XV3 TEAPAAAGPEAK
N-myc downstream regulated 1 Q62433 EEIHNNVEVVHTYR
Nucleoside diphosphate kinase A P15532 DRPFFTGLVK
Nucleoside diphosphate kinase A P15532 TFIAIKPDGVQR
Nucleoside diphosphate kinase A P15532 VMLGETNPADSKPGTIR
Nucleoside diphosphate kinase B Q01768 GDFCIQVGR #
Nucleoside diphosphate kinase B Q01768 NIIHGSDSVESAEK
Oligodendrocyte-specific protein Q60771 FYYSSGSSSPTHAK
Oligodendrocyte-specific protein Q60771 GLWADCVMATGLYH #
p21-Rac1 P63001 HHCPNTPIILVGTK #
p21-Rac1 P63001 TVFDEAIR
Peptidyl-prolyl cis-trans isomerase A P17742 EGMNIVEAMER
Peptidyl-prolyl cis-trans isomerase A P17742 FEDENFILK
Peptidyl-prolyl cis-trans isomerase A P17742 IIPGFMCQGGDFTR #
Peptidyl-prolyl cis-trans isomerase A P17742 VNPTVFFDITADDEPLGR
Peroxiredoxin 5 P99029 THLPGFVEQAGALK
Phenylpyruvate tautomerase P34884 LLCGLLSDR #
Phenylpyruvate tautomerase P34884 PMFIVNTNVPR
Phosphoglycerate kinase 1 P09411 FHVEEEGK
Phosphoglycerate kinase 1 P09411 LGDVYVNDAFGTAHR
Phosphoglycerate mutase 1 Q9DBJ1 HYGGLTGLNK
Phosphoglycerate mutase 1 Q9DBJ1 VLIAAHGNSLR
Protein CGI-38 homolog Q9CRB6 VINYEEFKK
Pyruvate kinase, isozyme M2 P52480 IENHEGVR
Pyruvate kinase, isozyme M2 P52480 LNFSHGTHEYHAETIK
Rab GDP dissociation inhibitor a P50396 NTNDANSCQIIIPQNQVNR #
Ras related protein Rab-10 P61027 LQIWDTAGQER
Ras related protein Rab-10 P61027 NIDEHANEDVER
Ras related protein Rap-1A P62835 INVNEIFYDLVR
Ras related protein Rap-1A P62835 SALTVQFVQGIFVEK
Ras related protein Rap-1A P62835 YDPTIEDSYR
Septin-2 P42208 YLHDESGLNR
Septin-7 O55131 DVTNNVHYENYR
Septin-7 O55131 FEDYLNAESR
Septin-7 O55131 SPLAQMEEERR
Septin-8 Q8CHH9 SLFDYHDTR
Sirtuin 2 Q8VDQ8 CYTQNIDTLER #
Sirtuin 2 Q8VDQ8 EYTMGWMK
Sirtuin 2 Q8VDQ8 FFSCMQSDFSK #
Sirtuin 2 Q8VDQ8 HPEPFFALAK
Sirtuin 2 Q8VDQ8 KHPEPFFALAK
Sirtuin 2 Q8VDQ8 LLDELTLEGVTR
Sirtuin 2 Q8VDQ8 NLFTQTLGLGSQK
Sirtuin 2 Q8VDQ8 VICLVGAGISTSAGIPDFR #
Sodium/potassium-transporting ATPase alpha-1 chain Q8VDN2 VDNSSLTGESEPQTR
Sodium/potassium-transporting ATPase alpha-1 chain Q8VDN2 VIMVTGDHPITAK
Sodium/potassium-transporting ATPase beta-1 chain P14094 AYGENIGYSEK
Sodium/potassium-transporting ATPase beta-1 chain P14094 EGKPCIIIK #
Sodium/potassium-transporting ATPase beta-1 chain P14094 ERGDINHER
Sodium/potassium-transporting ATPase beta-1 chain P14094 SYEAYVLNIIR
Sodium/potassium-transporting ATPase beta-1 chain P14094 TEISFRPNDPK
Sodium/potassium-transporting ATPase beta-1 chain P14094 VAPPGLTQIPQIQK

APPENDIX E
166
Synaptosomal-associated protein 25 P60879 AWGNNQDGVVASQPAR
Synaptosomal-associated protein 25 P60879 TLVMLDEQGEQLER
Syntaxin 1B P61264 IEYNVEHSVDYVER
Thy-1 membrane glycoprotein precursor P01831 DNSIQHEFSLTR
Thy-1 membrane glycoprotein precursor P01831 HVLSGTLGIPEHTYR
Thy-1 membrane glycoprotein precursor P01831 VTSLTACLVNQNLR #
Transketolase P40142 LDNLVAIFDINR
Triosephosphate isomerase P17751 DLGATWVVLGHSER
Triosephosphate isomerase P17751 HVFGESDELIGQK
Triosephosphate isomerase P17751 TATPQQAQEVHEK
Tubulin alpha P05213 AFVHWYVGEGMEEGEFSEAR
Tubulin alpha P05213 AVCMLSNTTAIAEAWAR #
Tubulin alpha P05213 AVFVDLEPTVIDEVR
Tubulin alpha P05213 EDAANNYAR
Tubulin alpha P05213 EIIDLVLDR
Tubulin alpha P05213 FDGALNVDLTEFQTNLVPYPR
Tubulin alpha P05213 IHFPLATYAPVISAEK
Tubulin alpha P05213 LIGQIVSSITASLR
Tubulin alpha P05213 NLDIERPTYTNLNR
Tubulin alpha P05213 QLFHPEQLITGK
Tubulin alpha P05213 TIQFVDWCPTGFK #
Tubulin beta 2 P68372 AILVDLEPGTMDSVR
Tubulin beta 2 P68372 EIVHIQAGQCGNQIGAK
Tubulin beta 2 P68372 FPGQLNADLR
Tubulin beta 2 P68372 IREEYPDR
Tubulin beta 2 P68372 ISEQFTAMFR
Tubulin beta 2 P68372 LAVNMVPFPR
Tubulin beta 2 P68372 MSATFIGNSTAIQELFK
Tubulin beta 2 P68372 NSSYFVEWIPNNVK
Tubulin beta 2 P68372 SGPFGQIFRPDNFVFGQSGAGNNWAK
Tubulin beta 2 P68372 EVDEQMLNVQNK
Tubulin beta 2 P68372 FPGQLNADLRK
Tubulin beta 2 P68372 INVYYNEAAGNK
Tubulin beta 2 P68372 YLTVAAIFR
Tubulin beta 2 Q62364 LHFFMPGFAPLTSR
Tubulin beta 2 Q62364 LTTPTYGDLNHLVSATMSGVTTCLR
Tubulin beta 2 Q62364 TAVCDIPPR
Tubulin beta 4 Q62364 GHYTEGAELVDSVLDVVR
Tubulin beta 4 Q62364 ALTVPELTQQMFDAK
Tubulin beta 4 Q62364 AVLVDLEPGTMDSVR
Tubulin beta 4 Q62364 INVYYNEATGGNYVPR
Tubulin beta 4 Q62364 IREEFPDR
Tubulin beta 4 Q62364 YLTVAAVFR
Ubc protein Q922B0 EGIPPDQQR
Ubc protein Q922B0 ESTLHLVLR
Ubiquinol cytochrome c reductase complex 14 kDa protein Q9D855 YEEDKFYLEPYLK
Ubiquinol cytochrome c reductase core protein 2 Q9DB77 IIENLHDVAYK
Ubiquinol cytochrome c reductase core protein 2 Q9DB77 YEDSNNLGTSHLLR
Unnamed protein product 12843458 ADSVCDGHAAGQK #
Unnamed protein product 12843458 DTENSPTTSANLK
Unnamed protein product 12843458 EPAPCVQPPTVEANAMQTGDK #
Unnamed protein product 12843458 HKDTENSPTTSANLK
Unnamed protein product 12843458 SCSPPPPPPEPTSEGR #
Unnamed protein product 12843458 TPSPPEPEPAGTAQK

APPENDIX E
167
Visinin like-3 P62748 EFIIALSVTSR
Visinin like-3 P62748 IYANFFPYGDASK
Visinin-like 1 P62761 EFICALSITSR #
Visinin-like 1 P62761 MNEDGLTPEQR
Visinin-like 1 P62761 NGDGTIDFR
Visinin-like 3 P62748 FFPYGDASK
a) Protein names are ordered alphabetically b) Swiss-Prot accession numbers begin with a letter (http://us.expasy.org). The other accession numbers are retrieved from the NCBI (http://www.ncbi.nlm.nih.gov). c) The sequence of the peptide identified by MS/MS. # indicates the presence of a carbamidomethyl-cysteine residue


![Degree of Doctor of Philosophy [Ph.D.,] - Manonmaniam ...](https://static.fdokumen.com/doc/165x107/631d000f6c6907d368018f38/degree-of-doctor-of-philosophy-phd-manonmaniam-.jpg)