THÈSE - Commod
405
THÈSE pour l’obtention du grade de Docteur en géographie humaine, économique et régionale de l’Université Paris Ouest Nanterre-La Défense présentée et soutenue publiquement le 8 avril 2011 par Tayan Raj Gurung Analyse comparée de l'usage de la modélisation d'accompagnement pour faciliter la gestion adaptative de l'eau agricole au Bhoutan JURY Dr. Pema Choephyel, Directeur, Bhutan Trust Fund, President Dr. Rhodora Medina Gonzalez, Professeur associée, Université des Philippines, Rapporteur Dr. Frédéric Landy, Professeur, Université de Paris Ouest Nanterre-La Défense, Directeur de thèse Dr. Christophe Le Page, Chercheur au Cirad, Examinateur Dr. Walter Roder, Directeur national, Helvetas-Bhoutan, Rapporteur Dr. Guy Trébuil, Chercheur habilité à diriger des recherches, Cirad, Co-directeur
-
Upload
khangminh22 -
Category
Documents
-
view
0 -
download
0
Transcript of THÈSE - Commod

THÈSE
pour l’obtention du grade de
Docteur en géographie humaine, économique et régionale
de l’Université Paris Ouest Nanterre-La Défense
présentée et soutenue publiquement le 8 avril 2011
par
Tayan Raj Gurung
Analyse comparée de l'usage de la modélisation d'accompagnement pour
faciliter la gestion adaptative de l'eau agricole au Bhoutan
JURY Dr. Pema Choephyel, Directeur, Bhutan Trust Fund, President Dr. Rhodora Medina Gonzalez, Professeur associée, Université des Philippines, Rapporteur Dr. Frédéric Landy, Professeur, Université de Paris Ouest Nanterre-La Défense, Directeur de thèse Dr. Christophe Le Page, Chercheur au Cirad, Examinateur Dr. Walter Roder, Directeur national, Helvetas-Bhoutan, Rapporteur Dr. Guy Trébuil, Chercheur habilité à diriger des recherches, Cirad, Co-directeur


i
ACKNOWLEDGEMENTS
At the outset let me express my heartfelt appreciation to Dr. Guy Trébuil who literally
held my finger through this journey which I would not have completed without his constant
reminder, unfailing support, encouragement and above all the guidance. In addition the
commitment of Dr. Francois Bousquet and Dr. Guy Trébuil in making a genuine effort to arrange
funds for the research is highly appreciated. Amidst several attempts to drop due to my inability
to manage the research, I managed to make this hard journey only with the support of Dr. Guy
Trébuil. The very close support provided by Dr. Francois Bousquet and Dr. Christophe Le Page
in developing the models and exploration of scenarios was a great help without which I would
not have completed the most important part of the research.
The support and encouragement from Dr. Pema Gyamtsho, His Excellency Minister of
Agriculture and Forests and Dr. Tashi Samdup, Director of CoRRB has been a primary driver for
me to take up this study. In particular my profound and honest appreciation goes to Dr. Tashi
Samdup for giving me moral support and encouragement to complete the research.
I wish to express my appreciation to Professor Frédéric Landy for accepting me as his
student in the Paris Quest University and his kind words and tips at the beginning of this research
to remain focus to my study and constantly keep advancing always lingered in my ears and that
kept me going. My sincere appreciation to also goes to Dr. Pema Choephyel, Director of Bhutan
Trust Fund who kindly accepted the invitation to be member of my jury.
The support of different projects like Asia IT&C, Ecole-Commod, and PN25-CPWF in
sponsoring trainings, participation in many project seminars and workshops, allowing me to use
the data for the comparative study is highly acknowledged. My sincere gratitude to leader of
PN25 for consenting to extend my study period by one year. I would like to earnestly convey my
gratitude to Dr. Martine Antona, Head of the GREEN Research unit, Centre de coopération
internationale en recherche agronomique pour le Développement (CIRAD), Montpellier, France
for sponsoring my travel and stay in CIRAD to work in GREEN laboratory. My sincere
appreciation goes to national researchers like Mr. Aita Kumar Bhujyel, Mr. Gyembo Dorji, Mr.
Cheki Nima, Mr. Rinzin Choney, Ms. Yeshi Lhamu, Ms. Yangchen Lhamu, Mr. KR Chettri, Mr.
Domang, Mr. Lhap Dorji, Mr. Sangay Duba, Mr. Danapati Dhungyel and many more who

ii
contributed to the implementation of Ecole-Commod and PN25-CPWF project. Their support in
the field work had been crucial.
Since I took up this research in 2008, I have been almost disconnected from most of the
family affairs, as I had to work outside my office time and without affecting my official duty. As
I used to locked up myself in my study, I am so fortunate to have received all the moral support,
love and care from my wife Mrs. Hari M. Gurung despite her heavy teaching duty, tirelessly kept
thing moving without any problem. During the last four years, she lost her foster parents and
paternal uncle, yet she managed to restore order in the house and singlehandedly managed the
loss of her loved ones. I am indebted for all her sacrifices. My two sons who always encouraged
me and often forced me to my study room have really contributed in completion of this research.
I would also like to thank my mother, sisters and brothers who was always there to help me in
times of need and during my absence from my home.
Last but not the least, this research would not have been completed without the
information collective from the two communities. For all the time and energy people of
Lingmuteychu and Kengkhar spent in sharing invaluable information, I would like to personally
express my sincere appreciation to each and every one of them. For their hospitability, kind
gestures and ingenuity during the entire community visit I would like to offer my prayers for
their success in sustaining their efforts to live in harmony and prosper collectively.

iii
CONTENTS ACKNOWLEDGEMENTS .......................................................................................................... i
CONTENTS ................................................................................................................................. iii
CHAPTER 1 INTRODUCTION .................................................................................................. 1
1.1 Justification of this research .............................................................................................. 2
1.2 Choice of research approach .............................................................................................. 5
1.3 Choice of study sites: natural resource management context ......................................... 6
1.4 General research question and general hypotheses ....................................................... 10
1.5 Research objectives ........................................................................................................... 11
1.6 Thesis structure ................................................................................................................. 12
PART I: SITUATIONAL ANALYSIS AT MULTIPLE SCALES TO U NDERSTAND THE SPECIFICITIES OF THE BHUTANESE CONTEXT................................................ 14
CHAPTER 2 BHUTAN: MAINSTREAMING NATURAL RESOURCE MANAGEMENT ........................................................................................................................................... 14
2.1 Introduction ....................................................................................................................... 14
2.2 Historical perspectives on natural resource management ............................................ 15
2.3 Natural resources – distribution and dynamics ............................................................. 18
2.3.1 Timber .......................................................................................................................... 18
2.3.2 Non-timber forest products .......................................................................................... 20
2.3.3 Water resources ........................................................................................................... 22
2.3.4 Natural resource dynamics .......................................................................................... 25
2.4 Decentralisation of natural resources management ....................................................... 27
2.5 Policy environment ............................................................................................................ 30
2.5.1 Development philosophy: Gross National Happiness ................................................. 30
2.5.2 Constitution of Bhutan ................................................................................................. 31
2.5.3 Environment and forest policies .................................................................................. 31
2.5.4 People participation ..................................................................................................... 32
2.6 Institutional environment ................................................................................................. 33
2.6.1 Government institutions linked to NRM ..................................................................... 33
2.6.2 Traditional institutions associated to NRM ................................................................. 36
2.7 Effect of NRM policies and institutions on environment and livelihood .................... 38

iv
2.8 Perspective of national development philosophy and NRM ......................................... 42
2.8.1 Gross National Happiness policy and its relationship to sustainable development and the social ecological systems framework .................................................................... 42
2.8.2 Commercialization of natural resource and its impact at different levels ................... 44
2.9 Issues related to natural resources .................................................................................. 45
2.10 Synthesis ............................................................................................................................ 48
CHAPTER 3 AGRICULTURAL TRANSFORMATIONS IN BHUTAN AS SEEN FROM TWO STUDY SITES ...................................................................................................... 49
3.1 Bhutanese agriculture ...................................................................................................... 49
3.1.1 Distribution of agricultural production systems .......................................................... 57
3.1.2 Trends in agricultural area and production in AEZ .................................................... 63
3.1.3 Linkage between AEZ................................................................................................. 64
3.2 Agricultural policies ......................................................................................................... 65
3.3 Participatory diagnostic studies ...................................................................................... 67
3.4 Agrarian systems analysis ................................................................................................ 68
3.5 Participatory zoning and general description of water problems in two agrarian systems of Western and Eastern Bhutan ...................................................................... 69
3.5.1 Lingmuteychu sub-watershed ..................................................................................... 71
3.5.2 Kengkhar ..................................................................................................................... 73
3.5.3 Socio-ecological landscapes........................................................................................ 74
3.5.3.1 Lingmuteychu .................................................................................................................. 74
3.5.3.2 Kengkhar ......................................................................................................................... 76
3.5.4 Natural resources, their interactions and management ............................................... 79
3.5.4.1 Lingmuteychu .................................................................................................................. 79
3.5.4.2 Kengkhar ......................................................................................................................... 80
3.5.4.3 Interactions among natural resources and their management ................................... 81
3.5.4.4 Land holding in Lingmuteychu and Kengkhar ............................................................ 84
3.5.4.5 Crops and cropping patterns ......................................................................................... 85
3.5.4.4 Livestock .......................................................................................................................... 90
3.5.4.5 Livelihoods, constraints and opportunities. .................................................................. 91
3.6 Recent agricultural transformations at the two study sites .......................................... 96
3.6.1 1950-1970: Land reform and subsistence farming...................................................... 96

v
3.6.2 1970-1990: Government initiatives to agriculture development and semi-subsistence farming ....................................................................................................................... 102
3.6.3 1990-2009: Semi-commercial agrarian systems ........................................................ 104
3.6.4 Characterization of water resource management systems in two sites ...................... 107
3.6.5 Extent of socio-economic differentiation among households ................................... 111
3.6.6 Sequences of agrarian systems in both sites .............................................................. 116
3.6.7 Importance of the water resource issue and corresponding relevance of different types of stakeholders ........................................................................................................... 122
CHAPTER 4 BHUTAN: WATER AS VITAL RESOURCE – CHANGING DYNAMICS ......................................................................................................................................... 125
4.1 Multi-functionality of water ........................................................................................... 125
4.2 Water resource and its distribution ............................................................................... 130
4.2.1 Water bodies and watersheds ..................................................................................... 130
4.2.2 Profile of major river systems .................................................................................... 134
4.3 Water in development ..................................................................................................... 140
4.3.1 Domestic use : changing scenarios ............................................................................ 141
4.3.2 Agricultural use: irrigation systems and their evolution............................................ 143
4.3.3 Hydropower: potentials and current status ................................................................ 146
4.4 Policy on water resource ................................................................................................. 151
4.4.1 Evolution of policies on water ................................................................................... 151
PART II: CONCEPTUALIZATION OF RESEARCH AND IMPLEMENT ATION ........ 156
CHAPTER 5 STATE OF THE ART ON RESOURCE GOVERNANCE, INSTITUTIONS AND WATER MANAGEMENT ................................................................................. 156
5.1 Governance of a common property resource ............................................................... 156
5.2 Institutions ....................................................................................................................... 159
5.3 Water resource management ......................................................................................... 165
CHAPTER 6 ............................................................................................................................... 175
STATE OF THE ART IN COLLABORATIVE MODELLING .......................................... 175
6.1 Collaborative modelling and NRM ................................................................................ 175
6.2 Origin of Companion Modelling .................................................................................... 177
6.3 Theoretical background .................................................................................................. 180
6.3.1 Science of complexity ................................................................................................ 180

vi
6.3.2 Post-normal science .................................................................................................. 181
6.3.3 Constructivist epistemology ...................................................................................... 182
6.4 Principles and objectives of ComMod .......................................................................... 184
6.5 Implementation of ComMod processes and tools ........................................................ 188
CHAPTER 7 RESEARCH METHODOLOGY ..................................................................... 197
7.1 Companion Modelling for water management ............................................................ 197
7.1.1 Use of ComMod in social change and water governance ......................................... 197
7.1.2 Overview-Design concepts-Details protocol for model description ......................... 201
7.2 ComMod methodological framework used at the two sites ........................................ 202
7.2.1 Conceptual framework .............................................................................................. 202
7.2.2 Conception of Companion Modelling processes for the two sites ........................... 203
7.2.3 Objective ................................................................................................................... 205
7.2.4 Role-play games and simulations ............................................................................. 205
7.2.5 Individual interviews and plenary debates ................................................................ 210
7.2.6 First gaming session and participatory workshop ..................................................... 210
7.2.7 Gaming and simulation processes ............................................................................. 212
7.2.8 Dissemination of gaming and simulation results ...................................................... 218
7.2.9 Collective action and development supports............................................................. 220
7.2.10 Monitoring and evaluation ........................................................................................ 220
PART 3: COMPARATIVE ANALYSIS OF FINDINGS AT THE TWO SITES .............. 222
CHAPTER 8 COMMOD PROCESS IN LINGMUTEYCHU .............................................. 222
8.1 Contextual feature .......................................................................................................... 222
8.1.1 Stakeholder diversity ................................................................................................. 222
8.1.2 Water resource in Social-ecological systems ............................................................ 224
8.2 Analysis of the water management problem ................................................................ 225
8.3 Companion modelling process in Lingmuteychu ........................................................ 227
8.3.1 Conception of the model ........................................................................................... 229
8.3.2 The twelve steps of the ComMod process in Lingmuteychu ................................... 230
8.3.3 Description of the seven Village model .................................................................. 233
8.3.3.1 Overview ........................................................................................................................ 233

vii
8.4 Analysis of gaming and simulation sessions.................................................................. 241
8.4.1 Shared representation of context and participants understanding ............................. 241
8.4.2 Identification of scenarios from gaming sessions ..................................................... 243
8.4.3 Analysis of simulation results of the different scenarios ........................................... 244
8.4.3.1 Resource stress ............................................................................................................... 244
8.4.3.2 Equity in resource allocation ....................................................................................... 245
8.4.3.3 Resource sharing ............................................................................................................ 246
8.4.3.4 Satisfaction of water needs ............................................................................................ 247
8.4.4 Interview of players and new learning ...................................................................... 248
8.4.5 Collective actions ....................................................................................................... 249
8.4.6 Identification of scenarios for further computer simulations ................................... 251
8.4.6.1 Scenarios simulated with the 7villages agent-based model ........................................ 251
8.4.7 Analysis of simulation results of scenarios with the computer agent-based model .. 254
8.4.7.1 Traditional management model ................................................................................... 254
8.5 Effects and impacts of ComMod process in Lingmuteychu ........................................ 263
8.5.1. Direct and indirect effects .......................................................................................... 263
8.5.2. Impact domains .......................................................................................................... 264
8.6. Factors influencing the effects and impacts of the process ......................................... 267
8.6.1. Enabling factors ......................................................................................................... 267
8.6.2. Impeding factors ........................................................................................................ 268
CHAPTER 9 COMMOD PROCESS IN KENGKHAR......................................................... 269
9.1 Contextual diversity of Kengkhar ................................................................................. 269
9.1.1 Stakeholder diversity ................................................................................................. 269
9.1.2 Drinking water resource social-ecological systems ................................................... 270
9.2 Analysis of drinking water problem in Kengkhar ....................................................... 272
9.3 Companion modelling process ....................................................................................... 273
9.3.1 Model conception ...................................................................................................... 274
9.3.2 The twelve steps of the ComMod process ................................................................. 275
9.3.3 Description of the Omchu RPG and conceptual Model ............................................. 278
9.4 Analysis of gaming and simulation sessions.................................................................. 288
9.4.1 Shared representation of the context and participants understanding ....................... 288

viii
9.4.2 Identification of scenarios from the gaming sessions ............................................... 289
9.4.3 Analysis of Scenarios ................................................................................................ 290
9.4.3.1 Resource stress .............................................................................................................. 290
9.4.3.2 Equity in resource allocation ....................................................................................... 291
9.4.3.3 Resource sharing ........................................................................................................... 291
9.4.3.4 Satisfaction of water needs ........................................................................................... 292
9.4.4 Interviews of RPG players about new learning ........................................................ 293
9.4.5 Collective actions ...................................................................................................... 294
9.4.6 Identification of scenarios for more simulations with the agent-based model......... 296
9.4.6.1 Traditional regime ........................................................................................................ 297
9.4.7 Analysis of scenarios with the Omchu agent-based model from Kengkhar ............. 299
9.4.7.1 Traditional water sharing ............................................................................................ 299
9.4.7.2 Tank networking ........................................................................................................... 301
9.5 Comparison of the effects and impacts of the ComMod process in Kengkhar......... 306
9.5.1 Direct and indirect effects ......................................................................................... 306
9.5.1.1 Impact domains ............................................................................................................. 307
9.6 Factors influencing the effects and impacts of the process ......................................... 310
9.6.1 Enabling factors ........................................................................................................ 310
9.6.2 Impeding factors........................................................................................................ 311
PART IV: DISCUSSION AND CONCLUSION .................................................................... 312
CHAPTER 10 DISCUSSION ................................................................................................... 312
10.1 About the diversity of ComMod effects ........................................................................ 312
10.2 Multi-level management of renewable natural resources and institutional change . 314
10.3 Evolution of power relationships: comparison before and after the ComMod process ......................................................................................................................................... 315
10.4 Critical analysis of the implementation of ComMod processes ................................. 317
10.4.1 Positive development ................................................................................................ 317
10.4.2 Negative development ............................................................................................... 318
10.4.3 Potentials and means to improve............................................................................... 320
10.5 Generic features and outcomes of the ComMod processes ......................................... 321
10.6 Success and sustenance of initiative on common pool resource regime .................... 322
10.7 Social self-organization triggered by ComMod ........................................................... 323

ix
CHAPTER 11 CONCLUSION ................................................................................................. 325
11.1 Conclusion ........................................................................................................................ 325
11.1.1 Enhancing a shared understanding of water resource use and management dynamics 325
11.1.2 Adaptive capacity and collective-decision making ................................................... 326
11.1.3 Resilience and water management ............................................................................. 326
11.1.4 Applicability of models ............................................................................................. 327
11.1.5 Sustainability ............................................................................................................. 327
11.2 Perspectives ...................................................................................................................... 328
11.2.1 Length of the process ................................................................................................. 328
11.2.2 Simulation platform ................................................................................................... 328
11.2.3 Stakeholder representation ......................................................................................... 328
11.2.4 Process Monitoring and Evaluation ........................................................................... 329
11.3 Application of ComMod for future research ................................................................ 329
11.3.1 Dynamics of multi-level management in natural resource management ................... 329
11.3.2 Payment for environmental services: ......................................................................... 330
11.3.3 Climate change and livelihood security: .................................................................... 330
11.3.4 Biodiversity management: ......................................................................................... 330
11.4 Challenges in application of ComMod .......................................................................... 331
11.4.1 Development areas ComMod can support ................................................................. 331
11.4.2 Out-scaling ComMod research impacts..................................................................... 331
11.4.3 Applicability of ComMod in pro-poor development pathways ................................. 331
11.4.4 Support necessary to promote application of ComMod ............................................ 332
11.5 Way forward .................................................................................................................... 332
REFERENCES .......................................................................................................................... 333
List of Figures ............................................................................................................................ 366
List of Tables .............................................................................................................................. 374
APPENDICES ............................................................................................................................ 378
ABSTRACT................................................................................................................................ 392
ABSTRACT................................................................................................................................ 393

1
CHAPTER 1
INTRODUCTION
A country’s natural resources (NR) are major source of national income and prosperity.
However, mismanaged and unjustly shared NR can be a major cause of conflict and instability
(Peters, 2004). As in any countries, Bhutanese has been depending on its natural resources for
their livelihood, culture and well being (NEC, 1998). However, over the years, with population
increase and NR management systems change, competitions and conflicts in NR use have been
arising and impinging on the Bhutanese social fabrics. The traditional norms and well-
established relationships among users constituted a broadly respected customary regime of
natural resource management (NRM), which has resulted from blending of appreciation for the
value of natural resources and recognition of their dependence. Over the years with economic
development, and rapid transformation in social values, local institutions and traditional
perceptions (FAO, 1999), there is over exploitation of natural resources. As Bhutan opened itself
to modern development in mid 1990s, the age old traditions and customary norms to manage NR
faced greater challenges to cope with threats from variety of developmental sources like
urbanization, industrialization, and commercialization (Gurung and Turkelboom, 2000). The arising
cases of legal battles on water sharing conflicts, looming water resources, rapid degradation of
natural resources and non-recognition of traditional norms, there is urgent need to redefine the NRM
strategies. As Holling (1978) illustrates, the concept of adaptive management recognizes that a
complex social agro-ecological system requires flexible, diverse strategies, and regulation, as
well as monitoring procedures leading to corrective responses, and experimental probing of the
ever changing reality. Because management of NR revolves within ecological, economic, and
social background it makes a complex system (Berkes and Turner, 2006). In view of NR
governance being complex due to the multiplicity of stakeholders and arrangements to govern their
use and exploitation, there are no one-size-fits-all solutions to handle NRM issues. The cautious
move to embrace development is vivid in the words of past Bhutanese Planning Minister, “We will
not be rushed into an uncritical adoption of all things that are modern: we will draw on the
experience of those who have trod the path of development before us and undertake modernisation
with caution, at a pace that is consistent with our capacity and needs” (NEC, 1998). With 69% of the
kingdom under forest, NR (forest, water, minerals, land and biodiversity) form a principal source of

2
revenue for supporting development of the country. Therefore, there is a strong commitment to
conserve the NR and strike a balance between economic development and environmental
conservation by looking for “The Middle Path” (PCS, 2002).
1.1 Justification of this research
Rising from the North-eastern plains of India at 100m elevation to 7550m in the North,
Bhutan is characterized by high mountains and deep narrow valleys resulting in extreme
variation in climate, geography and biodiversity. The 69% of forest cover with its associated
resources represents a large and valuable pool of NR for the country. Being landlocked with
more than 80% of the population dependent on small-scale mountain agriculture and livestock
farming (Duba, et al., 2006), use of NR remains an essential component in livelihood and culture
of Bhutanese people. Patterns of resource use have historically reflected low population density,
low technology, subsistence use, and isolation from international trade. From among the NR
water resource occupies an important position for the nation, as Bhutan considers harnessing
water resource for hydropower as the principal development avenue (NEC, 1998). Despite the
abundance of water resources, its location and distance poses a daunting challenge for using it.
As such water scarcity in Bhutan can be classified as economic water scarcity1 (IWMI, 2008),
which is impacting on agricultural production and fast becoming a critical issue for most farming
communities. The steep precipitous slopes dominating the topography of the country give rise to
multiple watersheds of various sizes which drains into four major river systems (Figure 1.1).
1 Indicators of water scarcity: (i) Little or no water scarcity. Abundant water resources relative to use, with less than 25% of water from rivers withdrawn for human purposes, (ii) Physical water scarcity (water resources development is approaching or has exceeded sustainable limits). More than 75% of river flows are withdrawn for agriculture, industry, and domestic purposes (accounting for recycling of return flows). This definition—relating water availability to water demand—implies that dry areas are not necessarily water scarce, (iii) Approaching physical water scarcity. More than 60% of river flows are withdrawn. These basins will experience physical water scarcity in the near future. (iv) Economic water scarcity (human, institutional, and financial capital limit access to water even though water in nature is available locally to meet human demands). Water resources are abundant relative to water use, with less than 25% of water from rivers withdrawn for human purposes, but malnutrition exists.

3
Figure 1.1. Altitudinal zones and the four major river basins in Bhutan.
The annual discharge from the four major river systems is estimated at more than 50,000
million cubic meters with hydropower potential of 20,000MW (MoA, 2002). The annual per
capita water availability of 75,000m3 of water (BWP, 2003) projects a false water security, as in
reality the country is often challenged with localized and seasonal water shortages for drinking
and agricultural purposes. Today only 78% of the population has access to safe drinking water
and only about 27% of the arable land is irrigated (GNHC, 2008), water scarcity is expanding
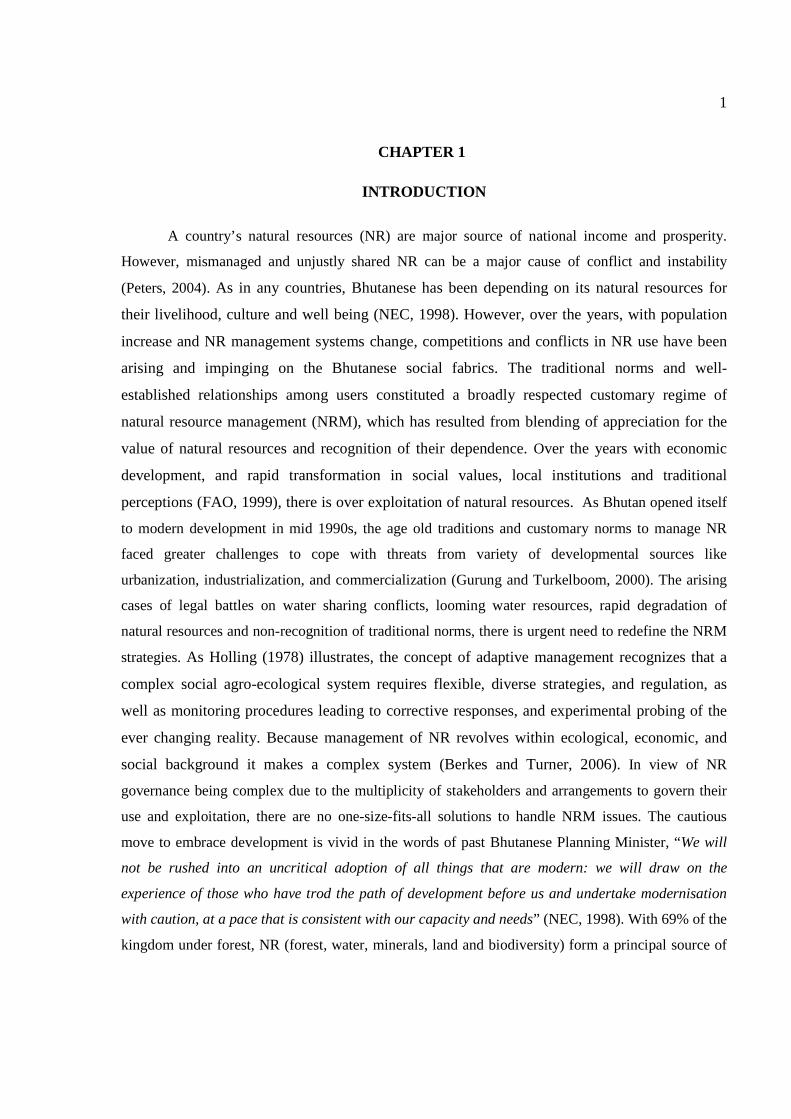
and fast becoming pervasive. The issue of water scarcity is related to the location of settlements
in uplands and inaccessibility of water from major river systems as they flow in deep gorges
(Figure 1.2), the uneven distribution of precipitation, the high cost of developing and maintaining
irrigation systems in mountainous terrain, landslides and flash floods. In the lower valleys and
plains, it is further aggravated by competing water demands from urbanization and hydropower
projects, and the lack of legal and institutional arrangements to regulate water distribution.
4
Figure 1.2. Perennial river (Mochu) flowing through a deep gorge in Gasa District, west-central
Bhutan.
According to the International Water Management Institute (IWMI), Bhutan falls under
economic water scarcity zone where water resources are abundant to meet human demands but
lack human, institutional and financial capital to access water (IWMI, 2008).
The inaccessibility to water has impacted on the basic household water need, livestock
productivity and crop productivity. Every summer, rice farmers in Bhutan face acute shortage of
irrigation water to cultivate their paddies due to declining water supply and competing usages,
while their counterparts in the uplands struggle to satisfy their household water demand as
sources dry. For instance decline in stream discharge and drying up of natural lakes are a
common phenomena (Refer to chapter 4). Such state of affairs can be seen as the emergence
from the complex interactions between natural and social dynamics. Water scarce situation may
further reflect social, political and economic inequities. Given that all water bodies in Bhutan are
state property (Forest and Nature Conservation Act 1995), water resource principally is a
common-pool resource facing the problem of free riding, over harvesting and crowding
(Ostrom, 2002). In the absence of definite legal provisions, the traditional practices of water
resource management and conflict resolution system prevails. Most recently, with water related
woes pouring in from across the country, most policy makers are pointing to the lack of water
law as the culprit. As reported by a national newspaper “Bhutan’s traditional water sharing
system is corrupt, unjust, feudal and exploitative, not taking into account ground realities of land

5
and number of households” (Kuensel 26 July, 2008). Realizing the dearth of legislation on water
resources, the Government of Bhutan initiated the formalization of a Water Act and a Water
Policy in 2003. In July 2010 the Water Act was enacted by the National Assembly and the
National Environmental Commission was subsequently assigned to be the focal agency to
implement the Water Act (Water Act, 2010). Until water policies are formalized and
implemented, many issues related to water resource management will continue to escalate.
In the wake of uncertain administrative and legal footing, stakeholders manoeuvre within
a fuzzy property rights thereby avoiding conflicts. In any management regime, it is the resiliency
of the resource base which becomes the prime objective. If resilience is the capacity of a system
to absorb disturbance and reorganize while undergoing change to sustain its function, structure,
identity and feedbacks (Walker et al. 2004), users have a definite role to influence the degree of
resiliency. Therefore, it is of paramount importance to innovate by trying out participatory
approaches to engage resource users, enhance their capacity to communicate, initiate collective
decisions and actions fostering on higher system productivity, equity and resiliency.
1.2 Choice of research approach
The natural resource management system characterised by multiplicity of resources and resource
users, power relations, scale, non-linearity, uncertainty, emergence, and self-organization
presents a complex situation to comprehend (Berkes, et al., 2003). The ability to respond to such
issues depends on information, governance, social processes and structure (Adams et al. 2003). It
merits a methodological approach which can appreciate systems emergence. Participatory
approaches and practices are said to enhance lower and poor people in general to express and
analyze their individual and shared realities (Chambers, 1997) leading to ownership of the
process (Pretty et al., 1995). Such processes can become a means for both social and technical
change (Groot and Maarleveld, 2000). Participatory approaches needs to be process oriented,
involving people from the initial stage of problem definition to completion of the problem
solving process (Narayan, 1996). To exploit the potential of participatory approaches, a great
level of self-reflection, critical awareness, and continuous learning/improving on the part of
researchers and other implementers are necessary (Chambers (2002) cited in Probst and
Hagmann, 2003). While many participatory approaches like participatory learning and action

6
(Pretty, 1995), participatory mapping (Chambers, 2006), different types of NRM models (Bots
and van Daalen, 2008) exists, collaborative modelling is seen as a one of the promising way to
foster integrated natural resource management (INRM) and decision-making processes.
Collaborative modelling approaches, such as Companion Modelling (ComMod) using multi-
agent simulation (Bousquet et al. 1999), rely on stakeholder participation not only in the use of
the model, but also in its construction supports knowledge integration and ability to capture and
represent different point of views provides an innovative posture, methods and tools for INRM.
1.3 Choice of study sites: natural resource management context
Apart from harnessing water resources for hydropower generation for export earning, the
essential use of water is for domestic use (safe drinking water and sanitation), agricultural use
(irrigated rice, vegetable, orchards, and livestock), and cultural use. In agriculture, with only
28% of arable land being irrigated, there is always a strong drive to generate maximum output
from the limited water resource. This competition for every declining water volume due to
irregular rainfall pattern and drying up of source, often results in water sharing conflict.
Correspondingly the drying up of upland natural springs and perennial streams have drastically
impacted on the availability of safe drinking water both at rural communities and urban centres.
From among different locations badly hit by the above situation (i) rice-based community in
Lingmuteychu watershed where water sharing conflict for irrigated rice has become a perpetual
problem, and (ii) maize-based upland community in Kengkhar where drinking water has become
the scarcest resource are the two discussed cases in this dissertation.
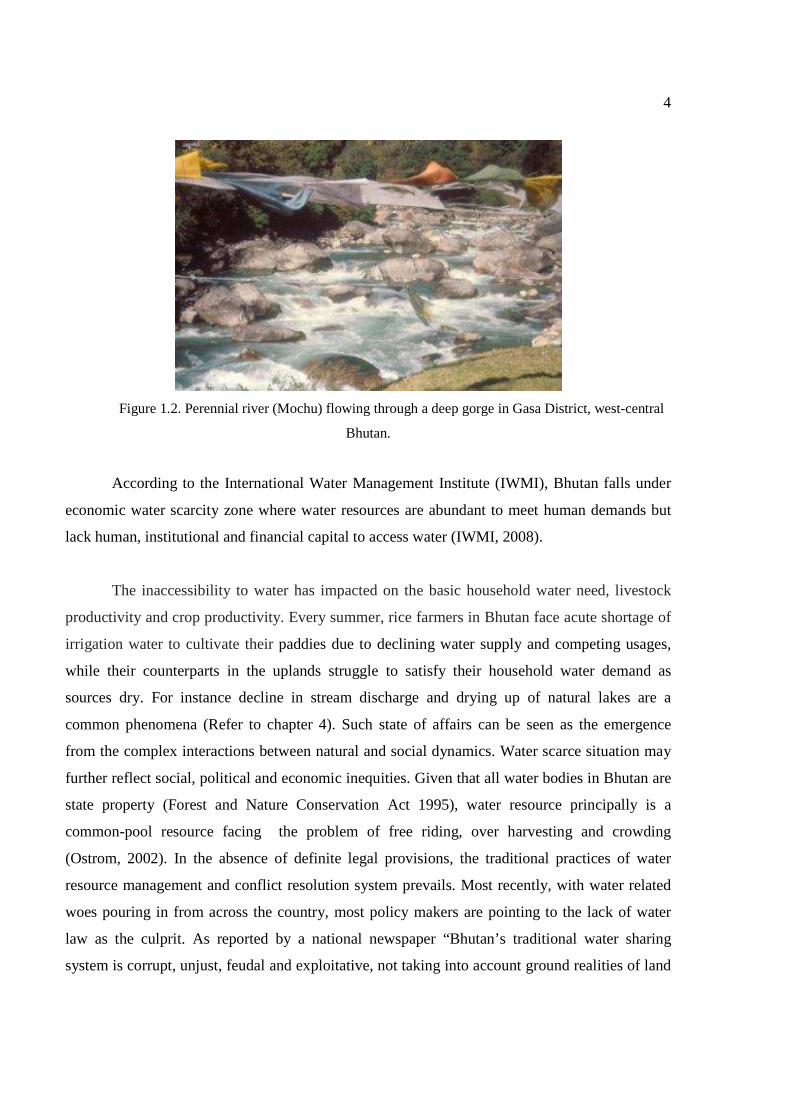
The Punakha-Wangdi valley (Figure 1.3) where Lingmuteychu is located in the west-
central part of the country is known for its local varieties of red-pericarp (“map”) and white-
pericarp (“kaap”) rice. It is also the site where modern rice varieties have been extensively tested
and modern semi-dwarf rice varieties like IR64 and IR20913 are widely cultivated. Although a
major river system (Punatshangchu) drains the valley, all rice fields are irrigated with water from
small seasonal streams flowing into Punatshangchu.
7
Figure 1.3. Terraced rice fields in Punakha-Wangdi valley.
With 90% of households from seven villages in Lingmuteychu dependent on rice farming
and operating within a traditional arrangement of water sharing, local rice growers often
encounter conflicting situation that sometimes escalates into physical fights. Indeed every rice
transplanting season it is common to see farmers from Lingmuteychu attending legal cases in
district courts following disputes on irrigation water sharing. In the absence of a legal framework
and water resource management system, as the users increased amidst declining water resource,
irrigators have been manoeuvring through the age-old customary norms. Over the years as the
number of users increased, cropping systems changed, and competition for irrigation water
expanded; the traditional water sharing arrangements became irrelevant and conflicts beyond
water resource emerge between villages that impinge on broader social fabrics.
Correspondingly the Eastern part of the country is predominated by upland environments
farmed with maize-based cropping systems (Figure 1.4). The landscape in the Eastern region is
highly incised by swift flowing rivers resulting in steep slopes and gorges.

8
Figure 1.4. Ploughing a dryland farm with Mithun bulls in Eastern Bhutan.
As lower stretches of hills are mostly steep and rocky they are not suitable for cultivation,
most farmlands are located in upper half of the hills where slopes are gentler (Figure 1.5).
Eastern landscapes are also devoid of natural water reservoir (or lakes) that could possibly feed
the slopes. As such one of the most limiting natural resource is water for both domestic use and
agriculture. While eastern people mostly depend on maize, water for irrigating crops is not very
important. However, access to potable water is challenged by distance and cost of building and
managing water supply schemes.

9
Figure 1.5. Location of human settlement.
One of the communities severely affected by dwindling drinking water is Kengkhar in
Mongar district. People of Kengkhar for ages have depended on natural spring ponds for
drinking water. However, as natural spring ponds gradually reduced from 30 two decades ago to
just 4 now (Own survey, 2007) people with the support of Government agencies tried different
alternatives to resolve the water scarcity. Attempts to bring piped water from distant sources
could not be sustained due to frequent breakdown and high maintenance cost. At one time people
were even proposed to resettle to a lower reach in Jimjorong where water is in plenty.
Manoeuvring in the resource scarce situation confined within the customary norms,
resource users have often looked at the government support of physical intervention to address
the issue. Apart from direct material support to build canal and drinking water supply schemes,
there is no record of well intended consultative process or community engagement focusing to

10
build their collective capacities to comprehend the issue and also stimulate them with capacities
to initiate collective action locally.
Considering the two principal uses of water and the common problem related to it, ComMod
approach may provide a way for water users to come together to analyze and understand their
water resource management situations.
1.4 General research question and general hypotheses
In view of the two contrasting contexts and water management issues in the research
sites, the general research question was framed as: Can the ComMod approach facilitate in
building social capital2 to enhance equitable water sharing and management? Based on this
general question, more specific and complementary questions to be investigated are as follows:
- How have communities in contrasting (spatial, social, economic and political) settings
marked by accelerating economic changes been adapting water resource management in
recent years?
- How does social capital enhance the resiliency of the water resource thus contributing to
higher system productivity, equity, and stability?
- Can the ComMod approach enable shared understanding and collective ability to better
comprehend the local situation?
- What are the effects and impacts of ComMod processes in these two sites and can they be
systematically compared?
The associated hypotheses for this research are as follows:
- Enhancing the social capital in the community can enrich the local competence in managing
water resources by enabling them to self-organize and set up innovative institutional
arrangements for adaptive management3.
2 Social capital is the feature of social organization such as networks, norms, and social trust that facilitate coordination and cooperation for mutual benefit (Putnam 1995). 3 Adaptive management is an integrated, multidisciplinary approach for confronting uncertainty in natural resources issues (Holling 1978, Walters 1986).

11
- The network of resource users and public infrastructure in association can enhance the
efficiency of water resource management.
- ComMod processes generate and sustain effects and impacts that promote shared
communication and learning, collective action and self-organization.
1.5 Research objectives
The general objectives of this research followed the two main objectives of ComMod
processes implemented to support collective decision-making on resource management as
follows:
1 To enhance understanding of water resource use and management dynamics by developing
shared representations of the water systems and collectively exploring them with the
resource users.
2 To improve shared communication and learning, adaptive management capacity, to facilitate
collective decision making in water resource management.
The following specific objectives were pursued:
1 To study the dynamics of water resource use and management and how farmers address the
issue of water sharing conflict.
2 To understand how stakeholders adapt their decision-making process under constrained
water resource situation.
3 To develop conceptual models of integration of water resource, its uses and collective
management.
4 To validate the conceptual model with stakeholders using multi-agent modelling tools, in
order to share scientific and indigenous knowledge on the issue being examined.
5 To identify and simulate co-management scenarios identified by the stakeholders in order to
facilitate communication among them and to support the inclusive and creative negotiation
of agreed upon collective action acceptable to the parties to mitigate the current conflicts.

12
1.6 Thesis structure
The dissertation is structured in four main parts namely (i) Situational analysis at multiple
scales to understand the specificities of the Bhutanese context, (ii) Conceptualization of research
and implementation, (iii) Comparative analysis of findings at the two contrasted sites, and (iv)
Discussion and conclusions.
Following this brief introduction of the context and rationale in chapter 1, chapter 2
provides perspectives of how NRM systems have been mainstreamed at different levels in
Bhutan. It comprehensively provides a historical perspective of NRM, issues related to natural
resources, traditional institutions associated to NRM, and effects of NRM policies and
institutions - on environment and livelihood. An attempt has been made to present the Gross
National Happiness (GNH) policy in relation to sustainable development and the selected social-
ecological framework. Alongside a detailed enquiry of water resource from social, cultural and
economic dimensions is presented to better understand the issue. Chapter 3 provides an overview
of agrarian systems in Bhutan with a detailed analysis of their evolution in the midst of the
changes in governance. An attempt has also been made to relate how commercialization and
globalization has influenced the agricultural development in Bhutan. The analysis of policies
from the perspectives of sustainable development is also included in the chapter. Chapter 4
provides an overview of water resources in the country and their key role in national
development. A short description of the cultural perspective of water is also provided to enhance
understanding of its value. A detailed presentation of water bodies and watersheds in the country
is made for better understanding of their distribution. It also presents policies related to water
resources and its evolution in the country.
The second part of the dissertation discusses the use of ComMod to facilitate change in
water management. Chapter 5 presents the state of the art on governance, institution, resource
management and social capital. It focuses on the complexities of social-ecological systems and
their management. The trend in integrated water resource management research and development
is also presented. Chapter 6 provides a description of the state of the art in collaborative
modelling and how it has been used in NRM and more specifically on water resources
management. The review converges on the use of ComMod in NRM. It also provides a

13
theoretical background of the research in relation to the science of complexity, post normal
science, and the constructivist epistemology. Chapter 7 provides details of the research
methodology. It also links to the past research done in both sites. In particular, in the case of
Lingmuteychu the present application of ComMod is the up-scaling of a previous more limited
intervention in the two uppermost villages. The detailed steps and sequences of the two
ComMod processes are presented for better understanding of the reflexive progression.
Part three includes result presentation in Chapter 8 (Lingmuteychu) and 9 (Kengkhar), where a
detailed analysis of the processes, effects and impacts at the two sites are presented. It is
attempted to make specific analyses of how and why certain patterns emerge. Evolution of the
ABM constructed from the RPG and their use in laboratory experiment is also presented.
Part 4 is composed of chapters 10 and 11 providing a discussion of the research findings,
and a conclusion and perspectives section for further research and/or application.

14
PART I: SITUATIONAL ANALYSIS AT MULTIPLE SCALES TO UNDERSTAND THE SPECIFICITIES OF THE BHUTANESE CONTEXT
CHAPTER 2
BHUTAN: MAINSTREAMING NATURAL RESOURCE MANAGEMENT
2.1 Introduction
In the Eastern Himalayas, land-locked between China in the north and India in the south,
east and west lies a nation state Bhutan covering an area of 38,394 square kilometres (Figure
2.1). The land rises from an elevation of about 100 metres in the south to over 7,550 metres in
the north, providing a characteristic land feature of the country. The characteristic high
mountains and deep valleys results in extreme variation in climate, geography and bio-diversity
(MoA, 1997). With pristine condition of nature and strong policy for nature conservation, Bhutan
holds the greatest potential for conservation of unique Eastern Himalayan ecosystems4. With
60% of the total land to be preserved as forest (RGOB, 2008) and its associated natural resources
(water, flora and fauna), it represents a large and valuable pool of natural resources for the
country.
Figure 2.1. Map of Bhutan with its location in South Asia and twenty districts.
4 The Eastern Himalayas are recognized as one of the global hotspots for biological diversity. It is reported that Bhutan Himalayas harbour over 100 species of wild mammals, over 620 species of birds and over 5400 species of vascular plants (300 of which are used in traditional medicine). About 46 species of rhododendrons and 600 species of orchids have been recorded so far (BAP, 2002).

15
Bhutan is largely an agrarian country with 79% of the total population of 634,982
inhabitants in 2008 depending for their livelihood on small-scale mountain agriculture and
livestock farming (PPD, 2008). Due to the rugged terrain and altitudinal variations, total
agriculture area is estimated at 8% of the total land in the country (Table 2.1). With average
landholding of 1.2 hectares which are mostly marginal land, around 29% of population fall
below the poverty line5 (NSB, 2007). The low crop productivity forces the rural population to
depend substantially on off-farm livelihood sources. Therefore the use of natural resources,
especially forest resources (including pasture within forest areas), remain an essential component
in most Bhutanese people’s livelihood and culture.
Table 2.1. Land cover in Bhutan. Category % Total (38,394 sq. km) Forests 72.5 Agriculture 7.9 Pasture 3.9 Settlements 0.1 Others 15.7
Source: PPD, 2008.
In recent times Bhutan has been experiencing the pressure of increasing population and
demand on its small natural resource base (27,835 sq. km of forest area). For instance, timber
consumption increased by 20% during 1997 to 2006 (PPD, 2008). The overharvesting of natural
resources in the fragile environment influenced by rugged terrains and incessant rains during the
wet monsoon increases the vulnerability to soil erosion, landslides and flash floods (PCS, 1999).
2.2 Historical perspectives on natural resource management
The land-locked and inaccessible mountainous terrain and forest cover isolated Bhutan
from the outside world for centuries leading to the construction of a distinct pattern of
civilization, social, economic, religious and political institutions (Hasrat, 1980). Within the
regime of self-imposed isolation, ensuring the integrity of forests, rivers and soil was vital for the
survival in inhospitable environments, which forged unique social-ecological relationships that
ensured sustenance of near-pristine environment (NEC, 1998). As the livelihood revolved around
5 Poverty line= Euro 11.29 (1 Euro=Nu. 61) per person per month which is estimated to meet the cost of a food basket providing the nutritional requirements of 2,124 calorie per person per day.

16
the surrounding forests and renewable resources thereof, the locally defined roles and rules to
regulate access to and use of these natural resources evolved over generations. Such local
management regimes existed within communities and between users from different communities.
In some situations, there were clearly defined boundaries for resource utilization and means to
resolve conflicts; in other situations, competition for renewable resources was regulated by
temporal arrangements. These indigenous community-level responses resulted from a
combination of appreciation for the value of the natural resources and recognition of the need to
prevent overuse (MoA, 2002). In the absence of formal national policy and legislations
associated to NRM, local practices and traditions constituted customary regimes of NRM to
achieve social and ecological objectives. Traditionally the farmers operated in self-contained
subsistence farming within the limits of available natural resources, production capacities of the
arable land, and bartering among the neighbourhood. Prior to the 1960s when systematic
planning and development was launched, the forest and natural resources were privately owned
either by individuals or the village community.
The landmark in the history of natural resources policy, legislation and management in
Bhutan is the enactment of the Forest Act in 19696 and the subsequent nationalization of forests7.
In nationalization of forest within the framework of the Forest Act 1969, all the natural
resources8 on public and private lands came under the jurisdiction of the state. According to
Namgyel and Chophel (2001), the nationalisation of forest resources in Bhutan was influenced
by the forest legislation in India that continued the British colonial policy of centralization of
forest resources to serve the primary interest of the state. Although the intent of state to
nationalize was to ensure protection and sustainable use of forest (RGOB, 1969), the principle
flaw was disregard to the local capacities to manage resources within a given socio-ecological
context. As the responsibility and control of forest and natural resources shifted to the state, it led
to the disappearance of many of the indigenous knowledge systems and community-based
regimes for NRM as communities lost their customary rights and control over local forest
6 The most critical dimension of the Act was definition of Forest as “forests means any land under forest which no person has acquired a permanent, heritable, and transferable right of use and occupancy” and it was declared as Government Reserved Forest. Further the Act invalidated the customary laws and instituted prescriptive norms. 7 Government Reserved Forests include all land that no person has acquired a permanent, heritable and transferable right of use and occupancy. 8 Resources within forest included trees, Non-Timber Forest Products (NTFP), water, wildlife, stone and sand.
17
resources (Messerschmidt et al., 2001). In a situation where the state was not able to take the
full control of the nation forest and in the absence of community based norms, natural resource
degradation due to human and consequently natural factors became a major problem (Namgyel
and Chophel, 2001).
As the natural resource mismanagement became rampant, in 1974 the first National
Forest Policy was ratified to ensure forest management, development and utilization of forest
resources and maximize revenue. Further to minimize the forest degradation due to over
harvesting, the policy stipulated to maintain at least 60% of the total size of the country under
forest cover. To broaden the scope of policy, it was revised in 1991 to include (i) protection of
the land, its forest, soil, water resources and biodiversity against degradation, such as loss of soil
fertility, soil erosion, landslides, floods and other ecological devastation and the improvement of
all the degraded forestlands, through proper management systems and practices; (ii) contribution
to the production of food, water, energy and other commodities by effectively coordinating
forestry and agriculture; (iii) meeting the long-term needs of Bhutanese people for wood and
other forest products by managing the production forests sustainably; and (iv) contribution to the
growth of national and local economies, including exploitation of export opportunities, through
fully developed forest-based industries, and to contribute to balanced human resource
development, through training and creation of employment opportunities. It was the National
Forest Policy 1991 that introduced the concept of scientifically prepared forest management
plans with the objectives to conserve fragile environment, ensure sustainable supply of timber
and NTFP for local consumption, and to promote value-added forest based industries.
The revision of Forest Act 1969 in 1995 was a key turning point in the way forest and the
NRM regimes evolved. The Forest and Nature Conservation Act 1995 emphasized the protection
and sustainable use of forests, wildlife and related natural resources for the benefit of present and
future generations. The Act also introduced the concept of social forestry and community
forestry which aims at building on the engagement of people in management of forest.
Subsequent to revision of Forest Act, rules and regulations for social forestry was framed and as
of May 2008, Ministry of Agriculture and Forests have approved 72 community forestry
schemes covering 9,099 hectares managed by 3,940 member households (PPD, 2008).

18
2.3 Natural resources – distribution and dynamics
Forest resources are important for economic and ecological sustainability. An over-riding
policy of maintaining 60% of land under forest cover ensures the sustenance of resources
(RGOB, 2008). For the purpose of this study, natural resources are grouped into four groups as
timber, non-timber forest products (NTFP), water resources are presented here leaving aside
biodiversity and minerals which are equally important, if not more.
2.3.1 Timber
Forest in Bhutan can be roughly classified into chirpine forest in temperate zones representing
29% of forest, transition zone where chirpine and broadleaf species cover 4% of forest area, and
the sub-tropical zone characterised by a humid climate with extensive broadleaf forest covering
67% of forest area (Table 2.2).
Table 2.2: Distribution of forest area by type of forest in four regions of Bhutan, 2004 (hectares).
Type of forest Regions
Total Western West-Central East-central Eastern
Coniferous9 37008 19672 7438 8221 72339
Bluepine 17235 3817 4247 838 26137
Chirpine 719 10062 230 5850 16861
Fir 3068 994 201 170 4433
Mixed conifer 15986 4799 2760 1363 24908
Conifer/Broadleaf 2591 3637 1743 3282 11253
Broadleaf 56897 39738 23297 48471 168403
Total 96496 63047 32478 59974 251995 Source: PPD, 2008.
These forests act as pool of natural resources. Timber and timber products are inevitable to
Bhutanese livelihood as they use it for building houses, prayer flags, firewood for cooking,
fencing farm land, and woodcraft. As per annual average consumption of number of trees for
2004 to 2007, Bhutanese consume 38 trees per head annually (NSB, 2009). Traditionally,
9 Coniferous group: Bluepine (Pinus wallichiana), Chirpine (Pinus roxburghii), Fir (Abies spp.)

19
Bhutanese architecture is timber intensive with intricate sculpturing on it, except for the wall
which is generally built with rammed clay or chiselled stone, all other parts of the building
including roof are made from wood (Figure 2.2). The culture of hoisting 108 prayer flags for
every death and varying numbers for different religious purpose is a common use which
consumes substantial amount of timber. Further the practice of using log splits as fence in high
altitude villages result in high timber consumption.
Figure 2.2. A typical Bhutanese house.
Table 2.3 provides an overview of timber products used from 2003 to 2007, a general
trend of reduction in consumption of some products is due to the use of alternative construction
materials which are now available. The abrupt increase in the use of firewood is linked to
opening of several institutions like schools with boarding facilities, monastic institutions and
training institutions across the country. These establishments run mess with improved wood
stoves which are gradually being replaced by electric ones. In five years there was an increase of
272% in consumption of logs which is the principle revenue generator (Figure 2.3).
Table 2.3. Quantity of forest products supplied from 2003 to 2007. Product Type10 Unit 2003-04 2004-05 2005-06 2006-07 Standing Tree Nos. 22921 18316 26955 12465
Shinglep Nos. 2593 2565 2260 13
Cham Nos. 67113 45893 65103 19864
Tsims Nos. 33048 26401 51373 11884
Dangchung Nos. 24831 37256 41084 4393
Flag post Nos. 42457 39483 40255 28569
Fencing post Nos. 20728 33080 39990 24422
Fuel wood M3 34737 32491 29900 1462614
10 Singlep=1.5m long planks (shingles) for roof, Cham – Baton, Tsims – poles for frames to hold Singlep on the roof, and Dangchung – Truss

20
Logs M3 15883 32346 38132 59137
Sawn timber M3 722 145 1101 195 Bamboo Nos. 419182 447572 628870 479549
Figure 2.3. Average annual revenue generated by selling different resources from forest in
Bhutan, (2003-2007).
According to the Department of Forest and Park Services (DoFPS), the total log
production potential for 2014 is projected as 105,900 m3 (PPD, 2008). To ensure sustainable
forest resource utilization, a forest resource development programme has been initiated. Under
the program there are 15 Forest Management Units in operation covering 127,362 hectares.
2.3.2 Non-timber forest products
As in many developing countries, NTFP continue to play a significant role in the
economic and cultural lives of virtually all rural households in Bhutan. Bhutan’s NTFP resource
base is rich and includes a broad range of products (Thinlay, 2004) from medicines to dyes, oil
seeds and nuts, incense, forest vegetables, fruits and nuts, bamboo and cane, spices, resins and
high value mushrooms (see details in appendix 1). Among the species used as food, yams,
orchids, bamboo shoots, mushroom, ferns and fresh water algae are the most popular. They are
even sold in urban centers by farmers and generate substantial income (Figure 2.4). As a part of
daily diet, Bhutanese use prickly ash (Zanthoxylum spp.) in the form of spice. As mushroom
cultivation is not common, most mushroom consumed are harvested in the forest. From around
94 mushroom species, some of the commonly consumed mushrooms are "jilli namcho"
(Auricularia auricula), which grows on rocks and rotten logs; "jichu kangroo" (Calvaria spp.);
48
16
325
38
75
0
50
100
150
200
250
300
350
Standing tree Fuel wood Logs Stone Sand
Va
lue
US
$ '0
00
Resources from forest

21
"ga shamu" (Clitocybe odora); "sisishamu" (Cantherellus cibarius); "taa shamu" (Polyporus
spp.); and "sangey shamu" (Tricholoma matsutake). Of the entire mushroom, matsutake is the
most prized (US$ 13/kg – in Bumthang during 2010 season) and is even exported to Japan (11
tones in 1998 which has drastically reduced by 70-80% now due to poor quality control
systems).
Figure 2.4. Ferns and wild mushroom sold in local markets.
Locally woven clothes are still popular among the population. While the fabrics are
imported from India, dyeing is done using local vegetable dyes available in the wilds. There are
specialized weavers who can formulate quality dyes from leaf, bark, flower-fruit, and stem and
root. Making of baskets and containers from wood, bamboo and cane are very popular artistry
(Figure 2.5). All the craftsmen derive raw materials from the forest. Indeed, there are
communities whose livelihood depends on handicrafts. They also use latex from trees to glue
wood and bamboo crafts.
Figure 2.5. Weaving, cask making, and curving wooden mask are important artistry in Kengkhar.

22
Associated with the Buddhist culture, Bhutanese use large quantities of incense in
household altars and community temples. Incense is locally made using plant species
(Nardostachys jatamansi, Tanacetum tibeticum, Juniperus spp., Rhododendron, anthopogon,
Rhododendron, setosum, Abies densa, and Delphenium brunonium) found in high mountains.
Among the all the NTFP, cordyceps11 (Cordyceps sinensis) is the most priced commodity
as it is exported to USA and Taiwan to be used as aphrodisiac. With annual production capacity
of 700 kg, in 2007 a kilogram of cordyceps was sold at US$ 10,000 a highest ever reported. In
Bumthang, Wangduephodrang, Thimphu and Paro farmers devote substantial time and resource
to harvest cordyceps in 4000-4500m altitude sites.
2.3.3 Water resources
Situated in the Eastern Himalayas, the northern part of the country is under snow cover
almost year round. The glaciers which feed rivers in Bhutan cover around 10% of the total land
area. There are 2674 glacial lakes (Mool et al., 2001) that serve as a perennial source of water for
the four major river systems in the country: the Drangme Chhu; the Puna Tsang Chhu; the Wang
Chhu; and the Amo Chhu (Figure 2.6).
11 Cordyceps sinensis, commonly called cordyceps or caterpillar fungus (locally known as dbyar-rtsa-dgun-bub), is a rare and highly prized medicinal ingredient that grows at altitudes of 4000 – 4500 masl. The body of a dead caterpillar jointed to a fungal stroma at the head is 3-5 cm long, 3-8 mm in diameter and has 20-30 annulations. Head is reddish brown with two bright red conspicuous eyes. There are 8 pairs of feet and the stroma is 4-7 cm long and 3 mm in diameter. Odour is fleshy and the taste slightly sweet. In Bhutan, Cordyceps sinensis is found in Lingshi, Laya, Lunana, Menla Karchung (Bumthang), Dagala and Trashi Yangtse.

23
Figure 2.6. Main river systems and in Bhutan.
All these river systems swiftly meander through deep gorges and narrow valleys to drain
into the Brahmaputra in India, dropping from an altitude of above 5500 m to 200m within a
distance of 250 km (Figure 2.7).
Figure 2.7. Schematic representation of the profile of two major river systems – Punatshang chu and Dangme chu – in Bhutan.
The quick drop within a short distance provides tremendous hydropower potential of
around 30,000 MW (GNHC, 2008a). The hydropower sector generates around 60% of the
national revenue and contributed 19.1% of the GDP in 2008 (NSB, 2009). Apart from revenue
generation, the electrical power sector has hastened the development in all sectors such as
industry, education and health services. The rural electrification program which aims at the
electrification of all settlements by 2020 (GNHC, 2008a) will help in the reduction of fuel
wood use, improve hygiene and health, increase working time in the evenings, introduce
electrical appliances thereby support in poverty alleviation. It is estimated that agriculture
utilizes 54% of the water for irrigating crops followed by domestic use accounting for an extra
36%, and industries which are gradually coming up takes up 10% of water volumes
(EarthTrends, 2003).
Laya Lingsi
4000
6000
8000
ManasKengkharSerichuChazam
Phongme
Sakten
Kalikhola
Burichu
WangdiPunakha
Gasa
Distance (Km)
215160110855000
2000
DrangmechuPunatshangchu

24
As the main rivers flow swiftly down south at the bottom of deep gorges, their water is
rarely used in agriculture. In addition to its accessibility problem, low temperature from glacial
melt makes it harmful to crop production. As such small seasonal streams and spring ponds are
used for domestic and agriculture purposes. The annual renewable freshwater resource per capita
is estimated to be 58,930 cubic metres (PCS, 2007) and seems insufficient with increasing
demand from rapid industrialization and urbanization. In agriculture, there are 19,522.81
hectares of wetland where irrigated rice is cultivated (Figure 2.8). Only 40% of the wetlands are
fed with 591 km of concrete lined irrigation canals built by the Department of Agriculture
(GNHC, 2008b). Remaining wetland fields are either irrigated with the help of earthen canals
built by communities or depend on rainfall.
Figure 2.8. Wetland area and corresponding number of irrigation schemes in each districts of
Bhutan.
For domestic use water from natural spring and stream is collected, filtered and treated to
supply to urban centres. In rural areas the Rural Water Supply Scheme (RWSS), a government
program construct simple concrete tanks to collect and supply piped water in the village by
constructing tap stands in the village. Although (Figure 2.9) official reports indicate population
access to safe drinking water as 80.5% (NSB, 2007) there are many situations where schemes
have been rendered non-functional due to drying up of water sources (e.g. Kengkhar in Mongar).
0
40
80
120
160
200
0
1000
2000
3000
4000
5000
Sam
tse
Ha
Par
o
Ch
hu
kha
Th
imph
u
Gas
a
Pu
nak
ha
Wan
gd
ue
Tsi
ran
g
Dag
ana
Tro
ng
sa
Bu
mth
ang
Zh
emga
ng
Sar
pan
g
Lh
uen
tse
Mon
gar
Tra
shig
ang
Tra
shiy
ang
tse
Pem
agat
shel
Sam
durp
jon
khar
Irri
gatio
n sc
hem
e (N
o.)
Wet
land
are
a (H
a)
DistrictsWetland area (Ha) Irrigation scheme (No.)

25
Similarly many drinking water sources have been washed away by land slides and flash floods in
Tsirang, Samtse, Phongme and Mongar, depriving the communities of safe drinking water.
Figure 2.9. Percentage coverage of safe drinking water by districts in Bhutan.
2.3.4 Natural resource dynamics
Natural resources use and management is increasingly becoming complex with the
inevitable interactions of biophysical, economic, ecological, and social aspects. The dynamics of
natural resources in Bhutan can be best represented as illustrated in Figure 2.10, which is built on
the theory of “induced innovation” and “Homma’s model of extractivism” (Homma, 1992).
0
25
50
75
100
Acc
ess
to s
afe
drin
kng
wat
er (
%)
Districts

26
Figure 2.10. Induced innovation in natural resources management (adapted from Kerr, 1998).
The four phases of Homma’s model of induced innovation in Figure 2.10 may be taken to
correspond to the social, political and institutional development in Bhutan. Phase A represents
the period until the mid 20th century, when the country was isolated from outside influences,
people fully depended on naturally occurring resources for almost all purposes from food to
cloths. In absence of centralized governance of natural resources communities managed it within
the customary norms that minimized unscrupulous extraction of natural resources. Phase A can
be equated to the “expansion” phase of Homma’s model during which extraction rapidly
increases as the resources are in abundance.
The second phase (B) is analogous to the mandatory registration of land, nationalization
of forest and introduction of a taxation policy during 1950s. As the state took over the forest and
the resources therein, rampant extraction of forest resource took place leading to severe
degradation of resources and the ecosystem. Realizing the disadvantage of the nationalization
policy and the way it was implemented which led to severe damage of the natural environment;
the government introduced the concept of management plans for sustainable harvesting of the
natural resources. The involvement of stakeholders in forest management was re-considered. As
such resource rehabilitation became a primary focus of the phase. Starting in the mid of phase B
to mid of phase C, a balance between supply and demand seemed to be attained due to increasing
prices. Phase C also saw the approval of 31community forest plantations (Beukeboom and
(A) (B) (C) (D)
I
II
III
Dependence on
naturally occuring
resources(e.g. natural forest,
NTFPs, water, fauna)
Resource
degradation
(e.g. deforestation,
land slides, loss of
biodiversity, dwindling
water sources)
Resource
rehabilitation and
transition to intensive
management
(e.g. regulation on
management, tree
plantation in private,
community and state
forest
(e.g. agro-forestry,
water user groups,
community forestry
Time, Population and/or Market Pressure
Dependence on user
managed resources
Resource extractionResource supply

27
Temphel, 2006) across the country that transferred management responsibilities and ownership
to community members. These initiatives led to the last phase D wherein natural resources are
managed by users to the extent that NTFP like Swertia chirata12, orchids, star anise, and
mushroom are being domesticated. In this process of management regime change, several
species in the flora and fauna13 are either endangered or lost. In the absence of detailed previous
studies on the effects of such management regimes on natural resources, one of the noticeable
landmarks is the increased occurrence of degraded forest and deep ravines in the different parts
of the country.
2.4 Decentralisation of natural resources management
Traditionally the livelihood of Bhutanese people was intimately associated with their
natural environment that ensured the integrity of forests, rivers and soil for survival in the high
valleys of the Eastern Himalayas (NEC, 1998). This association forged over centuries within the
local norms helped in sustaining the resource base. Abundance of resources, low population,
self-reliant subsistence societies, and lack of national policies resulted in commonly accepted
traditions and social relationships among users. Such traditional norms collectively comprised
the customary regime of NRM which ensured collective benefits. Within the customary regimes,
societies designated oldest trees, rock, natural spring, source of streams, and pass as holy and
seat for local deities. The local prescriptions to avoid littering the natural lakes, cutting trees, and
make undue noise, actually helped in preserving the niche ecosystem. For instance,
eutrophication of lakes is avoided as there is a local belief that littering the lake can result in
dreadful curse from the local deities.
Resource use rights play important roles in determining how natural resources are used,
by defining who has rights to use and the relationships among individuals and groups as they
12 It is one of the most important medicinal plants found in Bhutan. In Shingkhar Lauri (East Bhutan) people use this species to treat different human ailments such as fever, fungal infections, coughs and colds, worms, body pain, malaria, gout and headaches. Locally it is known as “Khalu” due to its bitter taste. 13 Globally Threatened Mammal Species found in Bhutan: Pygmy Hog Sus salvanius, Golden Langur Trachypithecus geei, Capped Langur Trachypithecus pileatus, Dhole/ Wild Dog Cuon alpines, Red Panda Ailurus fulgens, Bengal Tiger Panthera tigris tigris, Snow Leopard Uncia uncial, Asian Elephant Elephas maximus, One-horned Rhinoceros Rhinoceros unicornis, Asiatic Water Buffalo Bubalus bubalis, Hispid Hare Caprolagus hispidus, Ganges River Dolphin Platanista gangetica

28
benefit from the resources. A number of different types of use rights can be recognised as
(Schlager and Ostrom, 1992):
• Access: The right to enter, exclude and alienate a defined physical property and how the right may be transferred.
• Withdrawal: The right to obtain the products of a resource.
• Management: The right to regulate internal use patterns and transform the resource by making improvements.
Traditional rules based on the user rights concepts of the Bhutanese significantly ensured
sustainability of the natural environment until recent times. However, during the 1960s when
forest and all natural resources within forest were brought under the purview of the National
Forest Act, the traditional rules were rendered obsolete. Since then the forest became a state
property, access to which was highly regulated. In a highly regulated situation with minimum or
no monitoring in the field, the forest around the settlement were completely stripped off and
overgrazed leading to severe land degradation (Radi, Phongme, Lumang in Trashigang districts
are some of the examples) Figure 2.11.

29
Figure 2.11: Land degradation in Trashigang district in the eastern region of Bhutan.
In 1981, when the civil administration introduced District development committees with
the objective of decentralizing the decision making process, and subsequently block development
committee in 1991 to empower and promote local socio-economic development strategies, it
provided an impetus to also engage users in forest management. This decentralization drive, also
influenced to enact the Forest and Nature Conservation Act (FNCA) in 1995, provided
provisions for establishment of community forests. Up to 2008, there were 72 community forests
covering an area of more than 9,000 hectares (PPD, 2008). In conjunction to this, people are also
allowed to develop and maintain private forest areas.
A: Major landslides in Lumang, Trashigang district.
B: A natural lake dries up in Radi, Trashigang district.
C: A overgrazed pasture and indiscriminate lopping of trees in Radi, Trashigang district D: Land slide in Radi, Trashigang district

30
To formalize the decentralization process, bylaws for district and block14 development
committee were passed in 2002. These bylaws specify the role of development committees and
village head in managing the natural resources in their jurisdiction. Indeed the responsibilities to
delineate critical watershed and catchment, approval for timber harvesting and other resource
uses for the rural population were transferred to the block development office.
2.5 Policy environment
With 72.5% of the country under forest cover and a population density of 16 person/sq.
km, there is no apparent menace to the natural resource. But the policy environment stresses the
sustainable management of natural resources for all times to come. The commitment of Bhutan
to maintain 60% of the country under forest covers (PCS, 1999) provides an overriding policy
setting that favours NRM. Some of the broad policy frameworks that touch upon NRM are
briefly detailed below.
2.5.1 Development philosophy: Gross National Happiness
Gross National Happiness (GNH) is the development philosophy of Bhutan which stresses
development as a process which seeks to maximize happiness rather than economic growth alone
(PCS, 1999). Unique to Bhutan the concept emphasizes that development has several dimensions
other than those associated with the Gross Domestic Product (GDP). Analogous to Buddhist
principles of containment, in the words of Frederick Keonig, “We tend to forget that happiness
doesn't come as a result of getting something we don't have, but rather of recognizing and
appreciating what we do have.”15. Thus GNH places the individual at the centre of development
efforts, in recognition of the spiritual and emotional needs of that individual, in addition to the
material needs. The four pillars of GNH are the preservation and promotion of culture,
sustainable and equitable development, promotion of good governance, and conservation of the
environment (Thinlay, 1999). They holistically emphasize on sustainability and equity issues
comparable to sustainable development concepts, except that GNH also stresses the spiritual
14 Block (locally called as Geog) is the cluster of villages and the lowest administrative unit. The block is headed by a elected headman (Gup) who serve as chairman of the Block development committee. 15 http://thinkexist.com/quotes/frederick_keonig/

31
needs of human beings and advocates achieving a harmonious balance between the material and
non-material dimensions of development (GNHC, 2008a).
These elements give a tangible expression to the central tenets of GNH and embody the
guiding principles related to the independence, sovereignty and security of the country. The
concept of GNH rejects the notion that there is a direct relationship between wealth and
happiness.
2.5.2 Constitution of Bhutan
The constitutional reforms initiated with the establishment of the National Assembly of
Bhutan in 1953 and transforming the country into a constitutional monarchy was the first step to
the adoption of democratic principles of governance (Hasrat, 1980). Subsequently the
decentralization policy of 1981 further strengthened grassroots participation in governance. The
enactment of the Constitution of the Kingdom of Bhutan in 2008 and successive launch of
democratically elected government was a land mark in engaging people in governance. Within
the constitution, there is a specific mention in Article 6 which relates to the environment and
elucidates the maintenance of 60% forest cover for all time to come and the role of Bhutanese
citizen to protect their natural environment, and conserve biodiversity (RGoB, 2008). As an
overriding decree, it provides enabling background for sustainable management of natural
resources.
2.5.3 Environment and forest policies
As a custodian of state forest, the DoFPS operates within the broad policy framework as
prescribed in the Acts related to forestry. While rights and concessions were given, the Forest
Act of 1969 makes special mention that concessions are permitted within the limits of protection
of the environment and public property (MTIF, 1969). In 1974, the Department of Forest under
the Ministry of Trade, Industries and Forests formulated the National forest policy of Bhutan
with the objectives of forest conservation, utilization, and revenue generation (DoF, 1974). The
strong point of the 1974 policy was the conservation – where the need to maintain 60% forest
was already envisioned. Further the inclusion of watershed management and domestication of
NTFP highlights the Bhutanese government’s commitment to mainstream NRM. The

32
comprehensive forest policy of 1974 was more holistic and encompassing than the provisions of
the Bhutan Forest Act 1969. Realizing the mismatch between Act and policy, the Forest and
Nature Conservation Act was enacted in 1995 (FNCA) superseding the 1969 Act. FNCA
broadened the scope of the Act and introduced the concept of management of forest and natural
resources by state and stakeholders. While conservation through national parks and biological
corridors was maintained within the Act, soil and water conservation was included giving the
impetus to watershed/catchment management. To effectively deliver the services within the
FNCA 1995, Ministry of Agriculture formulated the Forest and Nature Conservation Rules of
Bhutan in 2006. It details procedural aspects supported by series of administrative forms to
facilitate implementation (DoF, 2006).
The National Environment Commission (NEC) as an autonomous agency of the Royal
Government of Bhutan that oversees all issues related to environment in Bhutan. To curtail the
ill-effects of development projects and avoid environmental harm, the Environmental
Assessment Act was enacted in 2000. It requires all projects to acquire environmental clearance
certificate from NEC prior to implementation (NEC, 2000). Considering the need to maintain or
enhance health, diversity and productivity of environment and natural resource for the future
generation while maximizing the benefit now, the National Environmental Protection Act was
enacted in 2007 which ordained that all Acts and regulations governing the use of land, water,
forests, minerals and other natural resources shall be in coherence to this Act (NEC, 2007).
The long awaited policy framework on water resource was finally cleared by the fifth
session of Parliament in July 2010 as the “Water Bill of Bhutan 2010”. The Act is aimed at
ensuring the protection, conservation and management of water resources in an economically
efficient, socially equitable and environmentally sustainable manner (Water Act, 2010).
2.5.4 People participation
The participation of people in decision making and governance dates back to 1953 with
the installation of the National Assembly as the highest decision making body constituted by
people’s representatives and government officials. Although decentralization started in 1981
when District development committees were instituted, the working modalities were formalized
only in 2002 after the District development committee bylaws (Dzongkhag Yargay Tshogdu
Chathrim) and the Block development committee bylaws (Gewog Yargay Tshogchhung

33
Chathrim) were approved. The responsibilities of committees and rural people in managing
natural resources were clearly pronounced. More specifically the involvement of people in
management of water resources started when the irrigation policy was launched by the
Department of Agriculture in 1991, wherein the concept of water users association was applied
to involve the users in managing the irrigation schemes. Similarly rural people were given the
responsibility to manage forest through social and community forestry program since its
inclusion in 1995 FNCA. The above development committee bylaws have been superseded by
The Local Governments’ Act of Bhutan, 2007 to facilitate direct participation of the people in
the development and management of their own social, economic and environmental wellbeing
through decentralization and devolution of power and authority.
Participation of people in commercialization of agriculture could not materialize due to
low economy of scale. Thus to provide opportunity for people with common farming interest and
economic objectives to come together, the Cooperative Act was approved in 2001. As enshrined
in the Act, communities can organize in groups to manage, harvest and market certain natural
resources from the locality or even operate group business. There are already small groups of
farmers specializing on chirata (Swertia chirata) in Samdrupjongkhar, pipla (Piper longum) in
Pemagatshel, amla (Emblica officinalis) and Lemongrass in Mongar. In line with the cooperative
act, area development projects like the Agriculture marketing and enterprise promotion program
(AMEPP) in the Eastern region provide financial grant to support micro-initiatives on agri-
business. To further promote people participation beyond rural communities, the Civil Society
Organization Act was enacted in 2007 to support organizations that work on mutual benefit and
public benefit principles.
2.6 Institutional environment
2.6.1 Government institutions linked to NRM
Institutional transformation in Bhutan has been motivated by strong cultural heritage
which serves as a powerful, unifying and integrating factor of social harmony and cohesiveness.
This gradual institutional change has over time fostered Bhutanese society to gain more control
over their own destiny, and orient the development pace within the internal capacity of resource
endowment and absorptive ability. Some of noteworthy initiatives in institutional development

34
related to natural resources are presented in Table 2.4. These institutions aim at enabling the
NRM initiatives and engagement of population in sustaining the efforts.
Table 2.4. Introduction of institutions related to natural resource management in Bhutan.
Year Institutions Roles and comments 1952 Department of Forest as the first department of Government
was established Regulate forest resource use
1953 Tshogdu – National Assembly was established by 3rd King Highest legislative body 1961 Department of Agriculture and Department of Animal
husbandry were established under Ministry of Development Technical department with implementation responsibilities
1961 Geological Survey of India establish mineral exploration program in Bhutan
Inventory of minerals
1963 Lodey Tshogday – Royal Advisory Council was established Advices the King on matter of national importance, acts as bridge between governments and people, ensures implementation of laws and decisions of National Assembly.
1968 High Court was established
1968 Cabinet (Lhengye Zhungtshog) was established Highest executive body
1969 Department of Trade and Industries was established Forest Act 1969
1981 20 Dzongkhag Yargey Tshogchung (DYT) (or District Development Committee) with 572 elected members nationwide was established
To promote people’s participation in the decision making process.
1991 201 Gewog Yargey Tshogchung (GYT) (or Block Development Committee) with 2614 elected members at the national level was established
To promote local socio-economic development strategies and initiatives by empowering the people to make decisions on their plans and programs.
1991 Bhutan Trust Fund for environmental conservation was established
To sustain financing of environmental conservation
1998 Council of Elected Ministers Devolution of full executive power
1998 National Biodiversity Centre was established Implement biodiversity action plan
2008 Democratically elected government with 47 constituencies and 20 member National council
Democratic governance
2010 Department of Agriculture Marketing and Cooperative established
Implement Cooperatives Act
Considering the need to regulate forest and natural resources in the country, the
Government instituted the first department as the Department of Forest. The management of
forest and natural resources were gradually centralized and regulated as state property. As the
department it could play a critical role in positioning the forest resources in overall development
policies and processes. With the highest decision making body, the National Assembly
consolidated the people’s voices and put together the Forest Act in 1969. To provide greater

35
impetus to the Department of Forest, it was put under the Ministry of Trade and Industries so that
forest resources including water could become vital economic commodity. The indiscriminate
exploitation of forest resources leading to widespread degradation following the nationalization
led to gradual decentralization of natural resource management responsibilities. Decentralization
was formalized through enactment of District and Geog development committees and their
associated bylaws. In parallel as the check-and-balance mechanisms, non-government agencies
like National Environment Commission played the role of coordinating NRM initiatives.
The institutions associated with natural resources can also be identified at three levels
where they operate and regulate. Looking at seven major natural resources, it is vivid that while
at macro levels there are different agencies involved in specific resource there are only few
institutions at the micro level (Table 2.5). There are even cases where a single institution covers
all the three macro, meso and micro levels. Such differences have created misunderstandings by
misinterpreting the policy or inability to fully deliver the services when required.
Table 2.5. Natural resources and associated institutions at different levels in Bhutan. Resources Macro Meso Micro Forest (State, community, social, and private)
Department of Forest, National Environment Commission
Territorial forest office District forestry extension, Range/Beat office, Geog extension office
Water resource (including watershed, major rivers, glaciers)
Department of Agriculture, Department of Energy, National Environment commission, Department of Forest, Department of Geology and Mines
Regional Research and Development centers, Territorial forest office
District agriculture extension, District environment office, Range/Beat office, Geog extension office
NTFPs Department of Forest, ITMS, National Mushroom Centre
Territorial forest office, Regional Research and Development centers
District Forest extension, Range/Beat office, Geog extension office
Wildlife Department of Forest, World Wildlife Fund
National Parks, Territorial forest office
District Forest extension, Park, Range/Beat office, Geog extension office
Biodiversity (Flora and Fauna)
National Biodiversity Centre, Department of Forest, Royal Society for Protection of Nature
Territorial forest office, Regional Research and Development centers, Parks
District Forest extension, Park, Range/Beat office, Geog extension office
Minerals Department of Forest, Department of Geology and Mines
Territorial forest office Range/Beat office
Natural pastures Department of Forest, Department of Livestock
Territorial forest office, Regional Research and Development centers
District Livestock extension, Geog extension office

36
2.6.2 Traditional institutions associated to NRM
Prior to nationalization of forest in 1969, the resources used for collective benefit were
managed by age-old institutions which had been tested over centuries. The most prominent ones
related to the study are presented in Table 2.6. Although there is no written operational
mechanism, the system has been passed over generations with minor changes.
Table 2.6. Traditional institutions related to natural resource management in Bhutan. Local Institution Resource Boundary Role Sanction Status
Reesup (Village forest guard)
Forest Village To ensure all households have adequate firewood and timber, apply ban to access forest "reedum" during specific period.
Yes Replaced by Forest guard
Meesup (Forest fire watcher)
Forest Village Monitor forest fire, and mobilize community is case of forest fire
No Do not exist
Chusup (Drinking and irrigation water watcher)
Water Irrigated field
Ensure access to drinking water and proper distribution of irrigation water
Yes Formalized in the Land Act and still in practice
Shingsungpa (Agriculture crop damage arbitrator)
Agriculture crops
Village Protect crop from cattle damage and arbitrate crop damage disputes
Yes Formalized in the Land Act and still in practice
Among the four institutions mentioned in Table 2.6, reesup or the village forest guard was
the most common and every village in the country had it. Considering the forest as the primary
source of most resources community depended on, reesup had a crucial task of protecting it from
intruders, internal exploitation, and equitable allocation of firewood and timber. Associated with
reesup was the forest fire watcher (meesup) who had the difficult role to watch for any forest fire
during dry seasons and mobilize community in fire fighting. While the meesup had no authority
to penalize the defaulters, the reesup had the power to penalize them in the form of free
community labour and to abandon one’s provisions. This may be because the management
responsibility is collective impinging the whole community, which indirectly helps in
minimizing intentional fires. Further it also promoted collective monitoring.

37
Next two categories of traditional institutions are related to farming. In all villages where
rice cultivation is practiced, community designated on an annual rotational basis a member of the
community as water guard (chusup). Chusup had to ensure equitable distribution of water for
drinking and irrigation. Traditionally, villages used water from the irrigation canal for drinking
until very lately when rural water supply scheme introduced piped water supply. As irrigation
water had to be conveyed in an open earthen canal, it needed a regular maintenance. Chusup had
to organize seasonal canal cleaning and repair prior to the rice growing season. Whenever a canal
collapsed or went dry, the chusup rapidly mobilized users to attend to the problem. In addition,
every community had a person with high integrity and respect who served as agriculture crop
damage arbitrator (shingsungpa). The shingsungpa had the role of ensuring that crops were not
damaged by domestic animals. In view of scattered settlements and proximity of fields to forest,
wild animal damage was inevitable. Therefore, the shingsungpa also had some role in
monitoring the crop damage by wild animals. The principle responsibility of the shingsungpa
was to arbitrate the crop damage compensation in a just manner.
The above institutions functioned under close guidance and scrutiny of village elders, who
generally acted as village council. Even if they appeared informal, people cherished the time
when community managed resources locally. With the enactment of the Bhutan Forest Act in
1969, the reesup and meesup were rendered obsolete and all forest management responsibilities
were taken over by department of forest. However, in 1985 the Department of Forest realized
that the reesup could play a key role in providing local knowledge and information, interpreting
the concept of sustainable forest management, and developing useful institutional links with the
local people in managing the forests. The responsibilities of the reesup was reinstated with
additional responsibilities of explaining government policies, rules and regulations regarding
sustainable forest management, and supporting in monitoring of forest (Wangchuk, 1998).
Similarly when the national irrigation policy was launched in 1991, it was built on the
concept of farmer managed irrigation systems operating in the country. Within the policy, the
chusup was included to play a crucial role in making water users association functional. The
shingsungpa too was formalized in the Land Act 1979 and is still in practice. Its role in crop
damage assessment has become more important with the crop devastation becoming a regular
phenomenon.

38
2.7 Effect of NRM policies and institutions on environment and livelihood
As enshrined in the Constitution of Bhutan 1953 (Hasrat, 1980), all decisions on nation
building are to be done through a consultative mode to achieve the happiness and prosperity
objective. Within this premise all the policies and institutions enacted and instituted largely
maintained the welfare and were people centred as the basis. Despite the benevolence, due to the
social, cultural and economic differences the effects of policies and institutions have been varied,
mostly planned but many unexpected.
The four traditional institutions explained in Table 2.6 which emerged from within the
community were valued and abided by all. While one person was assigned of the duty, the whole
community took collective responsibilities as it is them who identify the responsible person and
even prescribe the rules. The well intended formal NRM policies and institutions could not
harness wholesome commitment of the community members. Table 2.7 presents some effects of
policies as experienced by people.
Table 2.7. Successive policies related to natural resources and their effect on environment and livelihood in Bhutan.
NRM Policies Year Environment Livelihood (Agriculture) Forest Act 1969 Commercialization of timber and inability to
monitor led to rampant clearing of forest and extraction of timber. (Namgyel and Chophel, 2001).
Access to resources became highly regulated, dependence of sedentary agriculture increased.
Forest policy 1974 Designation of wildlife sanctuary, commercialization logging in broadleaf forest area.
Commercialization of natural resources in accessible areas leads to decline in NTFP supplies.
Land Act 1978 Sokshing (forest to collect leaf litter) and tsamdo (grazing land) used beyond carrying capacity, sign of decline in many areas.
Land ceiling and access to land for all secured the livelihood of people. Supply of forest litter for composting declining, population dependent on livestock faced with grazing problem.
Forest and Nature Conservation Act
1995 Scientific extraction and management helped in sustaining the resource base, reforestation of logged areas.
Community involvement in forest plantation and management assured better access to resources, litter, water, timbers and grazing areas.
Ban on shifting cultivation by 70th Session of National Assembly
1995 Damage by uncontrolled forest fire reduced and forest cover increased.
Shifting cultivators deprived of their livelihood source, agro-biodiversity loss, population shift to off-farm employment.
Bhutan 2020 1999 Integrated management approach to environment put in plan.
Sustainable development of agriculture.

39
Table 2.7 (Continued) Successive policies related to natural resources and their effect on environment and livelihood in Bhutan.
NRM Policies Year Environment Livelihood (Agriculture) Environmental Assessment Act
2000 Saved fragile environment and ecosystems from major development work.
Protection from environmentally unfriendly projects and technologies.
Forest and Nature Conservation Rules
2006 Increased forest cover through reforestation and regulated use.
Ownership of trees from community forestry acts as source of income for the community.
Land Act 2007 Increased forest areas as natural pastures and forest used for collecting litters were nationalized, centrally manage degraded areas.
Uncertainty for livestock dependent farmers, source of organic matter may be curtailed
Local Government Act 2007 Environmental management activities at village and block level gets priority.
Management of crop and livestock predation by wild animals initiated in bigger scale
Civil Society Organization Act
2007 Awareness program and environmental campaign helped in restoring environment (RSPN, NEC, WWF).
Livelihood support program in remote poverty stricken communities, handicraft promotions, and small agro-based businesses.
Constitution of the Kingdom of Bhutan
2008 Environmental management is a constitutional responsibility.
Cooperatives Act (2001 revised in 2009)
2009 Minimize individual exploitation of natural resources (NTFP).
Maximize profit from agri-business and NTFP, as an alternative source of livelihood.
Water Bill of Bhutan 2010 Water resource management in holistic manner, watershed management in place.
Equitable water sharing and agriculture water prioritized second only to domestic use.
The drive to nationalize forest drawn from colonial India was flawed by lack of state’s
capacity to monitor and manage such an unexplored extensive forest (Namgyel and Chophel,
2001, and Wangchuk, 2005). In the process the public property became state property exposing
itself to indiscriminate exploitation. There are several landmarks like overgrazed pasture in Radi
(Gurung et. al. 1999), land slides in Lumang (Wangchuk and Turkelboom, 2010), ravines in
Lingmuteychu (RNRRC Bajo, 1997), flash flood in Bomdeling (TDA, 2008) which are
reminders for policy makers. Such devastations consequently led to the loss of agricultural land
(eg. Rice fields in Radi and Bomdeling, dryland fields in Lumang) and deprivation of pasture in
Radi, Phongme and Songphu. It hit the livelihood of several resource-poor farmers (Levaque,
2005). The Land Act with the noble idea of land reform secured the livelihood of landless and
tenant farmers. The designation of natural pasture and woodland used for collection of leaf-litters

40
(sokshing16) as Government Reserved Forest and giving only the user rights without management
responsibilities resulted in excessive use. The Forest Act and policies indeed broaden the gap
between resource users and the government institutions responsible for NRM (Wangchuk, 2005).
In spite of the withdrawal of provisions to practice shifting cultivation by Forest Act 1969,
people continued to make a living from this type of farming. However, when the 70th session of
National Assembly imposed complete ban on shifting cultivation in 1995, people were left
without any alternative which deprived them of the basic livelihood source. The revision of Land
Act in 2007, completely took over the pasture and sokshing to be let on leasehold arrangement.
Forest and Nature Conservation Act of 1995 and its related rules introduced scientific
management of forest and engagement of people in managing forest and natural resources. Even
the most recent Water Bill 2010, reaffirms the reinstating of chupeon (water guard-same as
chusup as described in Table 2.6) and involvement of beneficiaries in management of water
resources and related infrastructures.
The development of institutions had far reaching effects on the environment and
livelihood. It seems the effects of institutions were more far reaching than the policies, due to
variations in translations of policies by different institutions during implementations (Table 2.8).
For instance, shifting cultivation practices which were banned in 1969 still continues in remote
areas, may be with slight changes (Kerkhoff and Sharma, 2006). Similarly the conservation
policy on wildlife which prohibit killing17 of wildlife is applied differently. Further the conflict
in policy of conservation and crop production makes it practically difficult for implementing
agencies. For instance, expansion crop areas in all the districts without appropriate measures for
crop protection from wildlife damage (elephant, wild boar, monkey, etc) is a major concern for
the farmers.
16 A oak forest in the periphery of a community is used exclusively for collecting leaf litters to make compost. It can be individually or collectively owned with only user right. Such woodlots are locally termed as sokshing. They form an important source of organic nutrient for farming. 17 Chapter VII of the Forest and Nature Conservation Act 1995 (FNCA 1995).

41
Table 2.8. Institutions related to natural resources and their effects on environment and livelihood. Organization Institutions Environment Livelihood (Agriculture)
Department of Forest Community forestry, Social forestry, reesup and meesup, Watershed management committee, Community based NRM group (Chirata, Pipla, Bamboo-cane).
During 1950-70 there was indiscriminate logging leading to widespread deforestation, after which conservation and protection of forest.
Nationalization of forest in 1969 deprived people of NTFPs and also timber, however gradually people friendly policies gradually brought back people to forest management, provision to domesticate and scientifically harvest high value NTFP enhanced livelihood, stringent wildlife conservation policy hit hard on people (still a major issue).
National Environment Commission
Environmental clearance committee.
Mainstreaming of environmental issues in government policies and programs helped in environmental management (NEC, 1998).
Ensure sustainability of livelihood program.
Department of Agriculture
Water users' association, self-help group, chusup, Community based NRM group (MAP-lemongrass).
Expansion of farming in fragile areas and continuation of shifting cultivation lead to severe land degradation (Upadhaya, 1988), construction of farm road and irrigation structures in fragile areas initiated degradation (Gurung et. al., 1999; PCS 2002).
Support crop production by promoting technological options, inputs and credit, commercialization of farming, poverty alleviation (MoA, 2007).
Department of Livestock
Dairy development groups, community based pasture development.
The pastures in high altitude areas are heavily overgrazed with consequential damage to forests and erosion of soil (Jambay, 1993).
Modern livestock management systems, pasture development, and better livestock breeds helped in enhancement of livelihood (GNHC, 2008b).
Department of Agriculture Marketing and Cooperatives
Farmer groups and cooperatives.
As a unified group, exploitation of environment is drastically reduced.
Protecting farmers and provide an effective response to market forces, enhance household income (GNHC, 2008b).
Ministry of Home and cultural Affairs
District and Block development committee.
Local decision to manage environment by prioritizing the activities ensures sustenance.
Environmental management programs linked with the livelihood support systems (bamboo-cane in Zhemgang area, Bohemeria in Kengkhar, lemongrass in Mongar.
After two decades of failure in managing the environment and natural resources,
reinstating the traditional institutions within the new policy framework was a positive move. The
reesup, meesup, chusup, and shingsungpa incorporated in different policies helped in bringing
back the community in environmental management. As these traditional institutions were either
not found in all communities or operated in different modes the blanket application of the
concept may not be uniformly accepted (Wangchuk, 2005). Since the launch of the community
forestry program, water user association, management committees and producer-marketing
groups it has gradually enhanced the capacity of community as well as government’s role in

42
managing the environment. It can also be observed that formalizing the institutions have
facilitated mainstreaming the environmental management principles.
2.8 Perspective of national development philosophy and NRM
Dirlik (1998) argues that global is associated with capital, space, history and the power to
transform and local being place, labour, tradition and, not infrequently, women, indigenous
people, peasants and others who are still attached to place, signifies the subordination of local by
global. Subordination can also be an internal phenomenon as lack of education was considered as
a factor for backwardness in Bhutan, as mentioned in the preambles of Constitution of Bhutan
1953 (Hasrat, 1980). To avoid subordinations, Bhutan borrowed ideas from developed nations,
initially for education and later for governance. Although it is said that only in global partnership
nations can achieve integration of environment and development to fulfil basic needs (UN,
2009), experiences of western development in developing nations has led to the dissolution of
indigenous cultural, political, and economic systems leading to increased inequalities in
livelihood systems and access to natural resources (Porter and Sheppard, 1998). Bhutan, despite
its prior self-imposed isolation, was swirled into the development pathways by the regional and
global movement after 1960s. Realizing the development as a double-edged sword, Bhutan took
cautious and proactive measures to ensure development as mutually inclusive of socio-economic,
environmental, and cultural integrity for long term viability (NEC, 1998, Pommaret, 1998).
Based on this premise of development, the fourth King of Bhutan, His Majesty Jigme Singye
Wangchuck, articulated the concept of Gross National Happiness (GNH) as early as 1972 (NEC,
1998). Since then GNH has been the development philosophy of Bhutan.
2.8.1 Gross National Happiness policy and its relationship to sustainable development and the
social ecological systems framework
Within the Bhutanese value system where development is equated to knowledge
acquisition and self containment as the goal, the GNH concept comprehensively relates to all
spheres of social welfare. It is possible to identify common ground between the GNH principles

43
posited as a development philosophy in Bhutan with the movement of sustainable development18
based on United Nations’ Agenda 2119 and Social Ecological Systems (SES)20 framework. The
elements of these three concepts can be presented through their economic, social, environmental
and institutional components (Figure 2.12). All concepts emphasize sustainability and equity
issues. Their focus on mainstreaming marginalized and disadvantaged groups is another common
concern. Cultural plurality and promotion, social freedom, political stability and strength of
traditional institutions are common features of all these three concepts. The environment is a
central tenet to all of them as all emphasize nature and biodiversity conservation, and sustainable
environmental management. Finally collective-choice rule and collective decision making, broad
based participation, political accountability and transparency are some of the shared aims of
governance. To a large extent, their common principles focus on welfare and sustenance:
18 Sustainable development is development which meets the needs of the present without compromising the ability of future generations to meet their own needs.6 (World Commission on Environment and Development (1987). 19 Agenda 21 is a comprehensive plan of action to be taken globally, nationally and locally by organizations of the United Nations System, Governments, and Major Groups in every area in which human impacts on the environment. Agenda 21, the Rio Declaration on Environment and Development, and the Statement of principles for the Sustainable Management of Forests were adopted by more than 178 Governments at the United Nations Conference on Environment and Development (UNCED) held in Rio de Janerio, Brazil, 3 to 14 June 1992. 20 A SES is an ecological system intricately linked with and affected by one or more social systems.
• Gross National Happiness - Maximise happiness of all to enable them achieve full and innate potential as human beings.
• Sustainable Development - Fulfill needs of the present without compromising the ability of future generations to meet their own needs.
• Resilient Social ecological systems
- Prevent an SES from moving into undesirable configurations

44
Figure 2.12. Relationship of Gross National Happiness (GNH) to sustainable development and
Social Ecological Systems (SES) concepts.
2.8.2 Commercialization of natural resource and its impact at different levels
Depending on the resources from the wild for ages, it has become a traditional practice of
harvesting natural resources for domestic use. Extraction and use of natural resources like leaf
litter, wild vegetables, medicinal plants and bamboo are intimately associated with traditional
culture, that many are still in practiced even if there is little or no economic rationale for their
use. There is a steady rise in commercial demand for wild vegetables (damroo – Elatostema spp.,
fresh water algae – Ulva spp., ferns and mushroom) and some medicinal plants like chirata,
pipla, and cordyceps. Likewise the traditional culture of using wooden mask (bap), wooden bowl
(dapa), wooden cup (phop), cane basket (bangchung), and wooden cask (palang) for day to day
use at home and public functions is still a common practice. As there is no factory locally,
villagers extract raw materials from forest and manually develop into different products and sell
them in local markets. While the domestic demand is steady, the demand from the tourism sector
is overwhelming. The natural resources commercially exploited can be broadly grouped into two,
first as timber and timber-based products and second as non-timber forest products. Since 2003
on an average Bhutan earned revenue of US$ 568,400 annually from the sale of natural
resources, but this figure rose to almost a million dollar in 2006-07 (NSB, 2009). In terms of
proportion, timber product dominates with 74% of revenue generated with only 26 % coming
from non-timber forest products (Figure 2.13).
Sustainable and
equitable economic
development
Preservation and
promotion of
culture
Promotion of good
governance
Conservation of
environment
Gross National
Happiness pillars
(Ura, 2008)
Distributional equity
Provision of social
servicesEnvironmental
Sustainable
development
principles (Harris,
2002)
Socio, economic
and political settingResource users
Promotion of good
governance
Social ecological
systems elements
(Ostrom, 2007)
Economic
Social
Institutional
Resource unit
Related
ecosystems
Resource systems

45
Figure 2.13. Proportion of revenue generated by sales of natural resources (July 2003 to June
2008).
There are around 33 natural resources that are commercialized and for which records are
available, of which 10 are timber based products, 13 being NTFP and the remaining 10 are
minerals which are mined (Appendix 3).
2.9 Issues related to natural resources
Since 1969 when systematic commoditization of natural resources to generate revenue at
macro level was initiated, the country has passed through dynamic changes and emerged as a
nation fostered on strong policy foundation. However, on the NRM front there are several issues
the country is grappling with now.
Tragedy of commons: When the state took over the responsibility to manage the forest in 1952, it
did not realize the extent of forest and corresponding human resource to stringently protect it.
Bhutanese territory being pristine and historically known for its wealth of medicinal plants and
rare animals, resources were always at risk of being poached. To protect such valuable wealth
with very limited manpower and regulatory tools, it became the inherent problem. When the
ownership of natural resources was taken over from the community and in the absence of
0%
25%
50%
75%
100%
2003-04 (345) 2004-05 (596) 2005-06 (723) 2006-07 (944) 2007-08 (234)
Pro
port
ion
of r
even
ue
Fiscal year (Total revenue in '000 US$)
Timber products Non-timber products

46
consistent monitoring, resources were indiscriminately exploited leading to the well known
“tragedy of the commons” paradigm (Hardin, 1968). Subsequent to realization of the weakness
of nationalization of forest, painstaking efforts have been initiated to bring back people into
management regime. There are numerous cases in point to illustrate the inability of policies to
bridge people and national policies. The poaching of endangered species like tiger, musk deer,
black bear, and Chinese caterpillar (Cordyceps sinensis) is a flourishing business generally
influenced by demand from outside the country.
Resource degradation: Provision of free access to natural resources in the Government Reserved
Forest by any Bhutanese citizen actually led to over-exploitation. Further the building of logging
roads in virgin mountain environment changed the landscape which in many instances was the
starting point of land degradation (Figure 2.14). The scar such roads leave in not just the road,
but as it disturbs the waterways and faunal feeding routes, it changes the ecosystem. Further
down the slope damage due to rolling stones and dumping of debris are irreversible.
Figure 2.14. Fresh scar from the construction of farm road.
Governance: In the absence of monitoring mechanisms, rapid change in SES, limited social
network in relation to the resource, and free access to outsiders resulted in ineffective
governance of the natural resource (Dietz et al., 2003).
Breakage of social fabrics: The society whose tradition and culture has evolved through
generation of association with nature is characterised by multitude of norms (Choden, 2008) that

47
acted as bonding force for small societies amidst vulnerability. The nationalization of forest and
disregard of customary rules created a society without a functional social network. Within the
state property regime, the secret sites of local deities in the forest, mountain, rock and rivers
became irrelevant. People and society were disconnected from the vital resource they had
depended on and mimicked the forest ecosystem to adapt agriculture and livelihood system. The
detachment from the forest and natural environment, the need to frequently interact and organize
community teams to go to forest for harvesting resources did not arise (Dietz et al., 2003), it
became more costly to individually harvest resources. All these slowly disintegrated the social
capital that kept the society moving forward. The attempt to reintroduce and recreate a
community role in forest through community forestry program did not quite serve the purpose
due to the uncertainty of rights to use the products from the community forest.
Frequent change in rules: In the process of regulating and deregulating forest and natural
resources, there are more than ten Acts and several policies associated to natural resources. The
frequency and plurality of policies suggest the importance and sometimes perverse feature of the
natural resource. This link to governance change adds on to the confusion. While it is reasonable
for a remotely located farming community not to be aware of new policies, but it is an irony that
even some of the implementers too are unaware of new policies. Such discrepancies arise from
the frequent policy changes and poor policy dissemination, which leads to manipulation and
mismanagement of natural resources.
Conservation policy: In pursuit of sustaining the pristine environment, Bhutan has crafted
conservation policies which are globally applauded (Wang, 2008). Notwithstanding the positive
impact the conservation policy has perpetrate, it has also hindered development in some areas.
For instance, the strong environmental conservation policies have affected the pace of
implementing energy projects due to the lengthy procedures such as environment impact
assessments and securing road clearances (ADB, 2008). The conservation of wildlife and
increased crop production has also been in conflict for years.
Institutional coordination: The assortment of policies and legislations related to natural resources
are mandated to various institutions depending on their main function. Viewed for their

48
respective national mandates, the NR policies are either implemented in piece-meal or
interpreted differently by different implementing agencies. For instance the Land Act is
responsibility of National Land Commission, while Forest Act with Department of Forestry,
Mines Act with Department of Geology and Mines, Nature conservation with Nature and
Conservation Division (NCD), Biodiversity Act with National Biodiversity Centre, Water Act
and Environmental Protection Act with National Environmental Commission. The coordination
among these institutions would not only simplify the implementation of vital policies but most
importantly clarify and enhance grassroots’ understanding of the policies which would facilitate
implementation.
2.10 Synthesis
In spite of the prudent policies and timely interventions, the nationalization of forest and
outright control over forest by the state during a decade put the customary resource management
regime in absolute disarray. Looking through the NRM regime can be segregated into three main
phases, each characterized by distinct problems and opportunities. Until the 1950s the main
NRM regime was mainly a common property one with some individually-owned and jointly-
owned private property. From 1952 to 1974, with absolute control of the state over forest and
natural resources, the state property regime became dominant. It was during this period that over
exploitation of renewable natural resources was rampant. The present period (1974-till date)
characterized by people participation in most functions through integrated programs can be
broadly designated as public property regime with occurrence of all other forms of regimes.
Although the current forest cover is much higher than the 60% threshold set as an eternal
target, the natural resource degradation is widespread and its consequences as flash floods, land
slides and water scarcity have become a serious threat to livelihoods. In this context, natural
resource degradation, and loss of biodiversity are detrimental because they increase
vulnerability, undermine system health, and reduce resilience.

49
CHAPTER 3
AGRICULTURAL TRANSFORMATIONS IN BHUTAN AS SEEN FROM TWO STUDY
SITES
The evolution of agriculture from ancient form of gathering from the wild to a highly
specialized form is indeed a result of evolving ecological and economic conditions of the farmers
(Trébuil and Dufumier, 1993). To establish a well founded understanding of an agrarian system
and its transformation, a holistic analysis that provides scope to investigate within a time-scale
the social, economic, and ecological factors and their interactions is crucial. Among such tools,
the agrarian system diagnosis methodology which combines agro-ecological zoning, historical
profile and analysis of recent transformations, classification of production systems into farmer
typologies has been extensively used in understanding successions of agrarian systems at a given
place (Trébuil, 1989; Trébuil and Dufumier, 1993; Dumrongrojwatthana, 2010). Most of the data
presented in this chapter were generated either by using structured questionnaires, focused group
discussions and key informant surveys in two sites, one in Western and other in Eastern part of
the country.
3.1 Bhutanese agriculture
Bhutanese agriculture is still largely based on the traditional subsistence oriented mixed
farming systems that integrate cropping, livestock rearing, and use of forest products. It has
evolved over a long period of time characterised by diversity of ecological conditions and a high
degree of self reliance. The unique mountain agriculture system characterised by diversity,
variability over time and heterogeneity over space has led to the development of diverse farming
systems specific to different localities. The integration between forest, crop and livestock system
is built on the principle of input-output relationship (Figure 3.1). In the centre of the web, the
farm household manipulates the level of resources appropriated from one system to the other to
optimize the benefit. The two basic factors that influence the resource flow are the physical
environment and the socio-economic, cultural and institutional environment. Operating in a
closely integrated production system, Bhutanese agriculture is largely organic with low use of
inorganic fertilizer and pesticides. Agricultural production is basically sustained with application
of organic fertilizers at the average rate of 10-12 tons/ha (RNRRC Bajo, 2008) in the form of

50
farm yard manure and compost. However, in actual the flow of nutrient into the farm may be
higher by way of irrigation water and also animal tethering and free grazing.
Figure 3.1: Key interactions in integrated farming systems in Bhutan.
Farmers painstakingly sweep the floor of designated woodlot from where leaf litters can
be collected (sokshing), use them as animal bedding and heap it for composting. The semi-
decomposed compost is applied in the field (Figure 3.2).
Figure 3.2. Leaf litter in the sokshing, farmer bringing home a load of leaf litter, and heaps of
farmyard manure in paddy fields in Lingmuteychu, Punakha district.
Forest
ecosystem
Farm household
Livestock
systemCrop system
Non-
wood
products
Timber,
fuelwood,
drinking
water
Leaf-litter, irrigation water, nature
conservation
Leaf-litter, fo
dder, g
razing, water, m
anure
Draft power, Farmyard manure
Crop residue, fodder
Ash, food, cash
Milk, m
eat, feed
Socio-economic, cultural and institutional environment
Physical environment (land, soil, water, nutrient, energy)

51
In Bhutanese agrarian society land is the primary asset in the composition of wealth.
Despite rapid socio-economic development land ownership is still a valuable indicator of wealth
or poverty (PCS, 2002). Fragmentation of land is highly influenced by inheritance and
encroachment of arable land by infrastructure development. Nationwide, about 41 percent of
farm households own less than 0.4 ha of arable land. Around 47% of farm households (HH) own
0.4 to 2 ha (MoA, 2009). Owing to the 8% arable land at the national level and difficult terrain,
the potentiality of the agriculture land is marginal. Low productivity and small land holdings
inflicts poverty in Bhutan, as such land is considered as main indicator of poverty. After the
revision of Land Act 2007 and subsequent nationalization of pasture land (tsamdro) and woodlot
for collecting litters (sokshing), individual land ownership is only on three land categories (Table
3.1). From among three land categories, dryland account for 62% of the total area followed by
28% for wetland and 10% for orchards.
Table 3.1. Agriculture land use categories, acreage and number of holders, 2009.
Land use types Area (ha) Households Wetland 36,326 11,000 Dry land 79,096 49,000 Orchard 12,367 12,367
Source: RNR Statistics, 2009.
On average around 75% of land holders own below 1.2 ha of arable land (Figure 3.3) and
only 3.6% of the population own more than 4 hectares of land (MoA, 2009). It is the population
owning less than 1.2 ha/HH who represents the majority of the farming population. Farm parcels
are small, numerous and scattered making it difficult to fully commercialize agricultural
production. Around 25% of dryland holders own more than 2 ha, mainly because of the recent
reclassification of shifting cultivation into dryland. Majority of Bhutanese farmers are small and
marginal and subsist on 1.66 hectares of farm land.

52
Source: RNR Census 2009
Figure 3.3. Distribution of land holding sizes in Bhutan, 2008.
Agriculture in Bhutan is labour intensive with relatively low intensity of use of external
farm inputs. An annual average of 27 kg/ha of chemical fertilizer is used on farm land by 38%
farmers and 7 kg/ha of commercial pesticides by 20% of farmers predominantly involved in
growing rice, potato, apple, and citrus (MoAF, 2009). Although the overall share of agriculture
contribution to GDP has been declining from 26% in 2001 to 19% in 2008 (NSB, 2009),
agriculture remains to be one of the most important sector of the Bhutanese economy. The 7.8%
of the total land area used as agriculture serves as the major source of livelihood to about 80
percent of the rural population. Further, a majority of the farms are located at a distance of
roughly five to six hours walk from the nearest road head (MoAF, 2009).
The Bhutanese farmer subsists by growing crops ranging from rice, wheat, maize,
buckwheat, potatoes and barley depending on the climatic conditions. Livestock rearing is
integral part of the farming life, as it supports food, draught power and nutrient recycling. The
major crops cultivated in Bhutan include paddy, maize, wheat, barley, buckwheat, millet, potato
and mustard. In acreage terms maize and paddy accounted for the largest share, covering around
27,227 hectares and 19,356 hectares respectively (Table 3.2).
0
10
20
30
40
50
60
< 0.4 0.4-1.2 1.2-2.0 2.0-4.0 > 4.0
Pro
port
ion
of H
old
ers
(%)
Frequency of land holding size (Hectare)Wetland Dry land OrchardLegend:

53
Table 3.2: Crop area and production in Bhutan, 2008.
Crops Area (Hectares) Production (x1000 Kg) Paddy 19,356 77,314 Maize 27,227 66,780 Wheat 3,189 5,647 Barley 1,314 2,051 Buckwheat 3,438 5,138 Millet 3,519 5,024 Potato 5,560 52,959 Mustard 1,940 3,580 Chilli 3,826 7,313
Source: RNR Census 2008, MoAF 2009.
Rice based systems dominate irrigated terraced land up to an altitude of 2,500 m (Figure
3.4), while maize and potato based systems are commonly practised on upland slopes (Figure
3.5). At altitudes between 2500-3000m, buckwheat, wheat, and barley are the traditional crops.
Rice and maize are the main cereals grown in all zones except the western cool temperate zone
where wheat, buckwheat, barley, mustard and potatoes predominate. Wetland crops in winter
include wheat, mustard and potatoes. Mustard is also grown under dryland conditions which
occupy the largest cropped area. The only new basic food crop is the potato being cultivated in
the temperate zone mainly for export purposes. Current production levels account for only 50,
65, and 59 percent self sufficiency in rice, wheat, and oilseeds respectively (DoA, 2008). The
deficit is met through imports. The gap between domestic production and national requirement is
widening as consumption rates increase due to increasing preference for agricultural
commodities not produced in the country like palm oil, sunflower oil and changing food habits to
fast food.
Figure 3.4. Typical rice-based farm and ladies threshing paddy and drying the straw in Gasa.

54
Figure 3.5. Maize and potato-based farms in upland environment in eastern region of the country.
Owing to the improved communication facilities in the country, there is an increasing
tendency to cultivate cash crops like apples in the temperate north; oranges, areca nut and
cardamom in the subtropical south (Table 3.3). Other cash crops that are exported include ginger,
chillies and various kinds of vegetables.
Table 3.3: Fruit production and households with orchards in Bhutan, 2008.
Crops No of plants (‘000) Production (x1000Kg)
Households (%)
Apple 245 5410 9 Mandarin orange 1123 38183 39 Areca nut 487 4082 11 Peach 31 961 20 Pear 18 1204 13 Plum 85 414 9 Walnut 13 338 11 Mango 17 610 10
Source: MoAF, 2009.
The farm production is supplemented by keeping different kinds of domestic animals
such as cattle for draught and milking purpose, chicken for eggs and pigs for meat etc. Among
the livestock, 24% of the households rear Mithun21 and Mithun-cross cattle both for dairy and
21 The Mithun (Bos frontalis) is a bovine species indigenous to the south-eastern parts of the Himalayas and the adjacent mountain ranges in north-east India. This bovine species, which is very little known elsewhere, is believed

55
draught power (Figure 3.6). Jersey and Brown Swiss cattle introduced through the Swiss
Cooperation during 1960s are popular dairy cattle.
Figure 3.6. Mithun bulls kept for ploughing.
Poultry as a source of egg has become very popular as egg is considered to be an
auspicious item for gifts, around 16% of rural households raise poultry (Table 3.4). At higher
altitudes, yaks and sheep are the principal source of livelihood (Figure 3.7). Yak herders still
practice a migratory pastoral system where the family moves along with their yak herds before
the winters in September to warmer area. For instance herders from Merak and Sakten in
Trashigang, eastern Bhutan migrate to Radi, Phongme and Khaling in winters. While the yaks
graze on natural pastures in warm areas, herders move around the villages to barter the cheese,
butter, and meat with grains and chilli.
to have originated from the Gaur (Bos gauris). Mithun is the pride animal called as ‘Cattle of Hilly Region’ of north-eastern hilly region of India and tropical rain forest of China.

56
Figure 3.7. Yak a principal source of livelihood for high altitude people.
Table 3.4: Livestock population and proportion of households raising them, 2008.
Livestock Population (No.) Households rearing (%)
Nublang22 cattle 184,014 24 Poultry 197,766 16 Jersey cattle 50,443 9 Mithun cattle 68,885 9 Horses and mules 22,335 6 Pigs 18,963 6 Goats 34,176 5 Sheep 12,116 1 Brown Swiss 5,253 0.67 Yaks 40,482 0.65 Other cattle 1,476 0.17
Source: MoAF 2009.
Livestock products like cheese and butter are part of the Bhutanese diet with key dishes
like “ema-datshi” (chili cooked with cheese) and drink like “suja” (butter-salt tea). With the
support of MoAF, milk cooperatives supply urban centres, making it one of the important
commodities marketed (Table 3.5). Egg is another commodity which can be remunerating as
imported eggs are highly regulated due to avian-flu outbreaks in neighbouring countries. Most of
the commodities are locally sold without proper processing and packaging.
22 Nublang is the traditional cattle breed of Bhutan since its presence dates back to time immemorial. It is a Bos indicus breed of cattle which is believed to have originated from the Sangbay geog of Haa in the western part of the country. The Nublang is a priority breed for conservation since it is facing numerous threats to its existence such as the introduction of high yielding exotic breeds in the country and restricted forest grazing.

57
Table 3.5. Livestock products produced and sold in Bhutan, 2000-2008.
Livestock products
Unit 2000 2005 2008
Milk Liters 24,837 19,927 25,840 Butter Ton 1,316 1,552 1,727 Cheese Ton 2,172 4,790 2,029 Beef Ton 1,409 547 477 Pork Ton 186 1,649 248
Mutton Ton 35 54 34 Wool Ton 11 31 10,552 Fish Ton 0 0 16
Chicken Ton 21 151 90 Egg ′000 Dozen 5,718 5,397 459
Source: MoAF, 2009.
3.1.1 Distribution of agricultural production systems
Bhutan can be divided into six main agro-ecological zones (AEZs) based on elevation,
annual rainfall and air temperature (Table 3.6). These AEZs are further influenced by the
mountainous terrain and valleys (Figure 3.6). These diverse agro-ecological conditions and
topographic features have direct bearing on the farming systems practiced in each of them.
Table 3.6: Main agro-ecological zones of Bhutan.
Agro-ecological Zone
Altitude Range
(m.a.s.l)
Annual Rainfall (mm)
Average annual Air Temperature Max °C Min °C Mean °C
Alpine
Cool Temperate
Warm Temperate
Dry Subtropical
Humid Subtropical
Wet Subtropical
3600-4600
2600-3600
1800-2600
1200-1800
600-1200
150-600
<650
650-850
650-850
850-1200
1200-2500
2500-5500
12.0
22.3
26.3
28.7
33.0
34.6
-0.9
0.1
0.1
3.1
4.6
11.6
5.5
9.9
12.5
17.2
19.5
23.6
Source: Gyamtsho, 1996.

58
Figure 3.8: Distribution of the main agro-ecological zones of Bhutan.
A simple classification of crop, livestock and NTFP across these main AEZs provides a
clear differentiation and understanding of the diversity of agricultural production systems (Table
3.7). The interaction of crop-livestock-forest resources and topography in different social
systems leads to further niche production systems even within the same AEZ. For instance in the
humid zone, while the farming system in Tsirang is an irrigated rice-based system, farmers in
Pemagatshel and Zhemgang depend on maize-based and swidden farming systems. Similarly in
the dry zone a difference can be seen between Mongar and Wangduephodrang: irrigated rice-
based systems dominate in Wangduephodrang and Mongar is predominantly rainfed maize-
based. The difference in production systems is also closely associated with the livelihood system
and agro-ecological setting. The diversity of production systems of each AEZ is briefly
explained in the following paragraphs.

59
Table 3.7: Major crops, livestock and NTFP in different agro-ecological zones in Bhutan.
Agro-ecological Zone
Crops Livestock NTFPs
Alpine None Yak, sheep Cordyceps, Nardostachys, Jatamansi, Rhododendron, Anthopogon
Cool Temperate Potato, Barley, mustard, wheat
Cattle, yak, sheep Cordyceps, Nardostachys Jatamansi, Rhododendron, Anthopogon
Warm Temperate Potato, Barley, buckwheat, maize, wheat, mustard, apple, pear, peach, plum, vegetable
Nublang, Mithun, Jersey, Jersey-cross, pigs, poultry
Mushroom, orchids, asparagus, dyes.
Dry Subtropical Rice, maize, wheat, mustard, millets, orange, banana, guava, vegetable
Nublang, Mithun, Jersey-cross, pigs, poultry
Rattan and cane, ferns, mushroom, staranise (Illicium spp.) used as spice.
Humid Subtropical
Rice, wheat, maize, mustard, millets, ginger, areca nut, orange, large cardamom, Guava
Cattle, goat, pigs, poultry, buffalo
Rattan and cane, ferns, mushroom, chirata
Wet Subtropical Rice, wheat, maize, mustard, millets, ginger, areca nut, orange
Cattle, goat, pigs, poultry, buffalo
Ferns, bamboo shoot, mushroom, Nettle grass23, Pipla, chirata
In the alpine and cool-temperate zone (above 3600m amsl), semi-nomadic communities
(Brokpas) practise a pastoral production system with yak rearing as the main source of
livelihood, lately they also rear small herds of sheep. They grow crops like high altitude barley,
potato, buckwheat (Figure 3.9), mustard and few short season vegetables during the summer
season in their backyard in areas above 3000m. During winter when they migrate to warmer
valleys, it is common to see yak herders in their traditional attire visiting houses to barter their
cheese, butter, meat and wool with rice, chilli, and beans (Figure 3.9).
23 Three species of nettle grass is found in Bhutan - Girardiana palmate, Laportea terminalis, and Urtica dioia. Their tender leaves and inflorescence is consumed as vegetable. While from the matured shoots, fibre can be extracted for weaving cloths and making rope.

60
Figure 3.9. Yak herders from Lunana in their winter camp.
In the cool temperate areas, livestock rearing is still dominant with more cropping than in
alpine zone. Farmers rear both cattle and yaks besides other livestock types like sheep and mules.
Cattle graze the pastures in summer and yaks in winter. Higher proportions of people engage in
farming and grow buckwheat, barley, wheat and potato in dryland (Figure 3.10). Farmers in this
zone maintain large tracks of natural pastures where they paddock their livestock.
Figure 3.10. Buckwheat field in Bumthang valley and buckwheat pancake a delicacy in high altitude community.
The warm temperate zone is comparatively more fertile than other zones, as most mid
altitude valleys like Thimphu, Paro, Ha, Punakha and Wangdue are drained by river systems that
deposit alluvial soil in the flat floor valley (Figure 3.11). Fertile soil and mild climate favours

61
cultivation of different crops like paddy in irrigated terraced areas, mustard, chilli and wheat as
second crops. Potato and barley are major crops in dryland fields. This zone also represents the
major temperate fruit growing area (apple, pear, peach, plum and walnut). Livestock is another
important component of the farming systems, particularly as a source of draught power and
manure. Lingmuteychu is located in this zone.
Figure 3.11. Punakha-Wangdue valley with Punatshangchu river in foreground and rice fields in the background.
Predominated by maize cultivation, the dry sub-tropical zone provides an upland farming
environment where mostly rainfed crops are grown and irrigation water is the most limiting
resource to crop development (Figure 3.12). Crops like millets (finger millet and fox-tail millet
are the most common), and beans (phaseolus beans, kidney bean, soya beans) are the most
popular ones. Potato is fast spreading as a cash crop. Lemongrass is found in abundance as
undergrowth of chirpine and is extensively harvested, distilled and sold. With low productivity
of land people still practices slash and burn agriculture with shorter fallow periods of 2-3 years.
Burning also helps in new flush of grass including lemongrass, thus used as a management tool.
Cattle, mules and pigs are other important sources of income.

62
Figure 3.12. Typical upland maize field in the eastern region.
The zone with altitudinal range of 150 to 1200m amsl receives annual rainfall of 1200-
5500mm is classified as humid and wet sub-tropical zone. With abundance of water, irrigated
rice production in terraces is the dominant cropping practice. Growing pulses on rice bunds,
mustard and wheat after rice are common practices (Figure 3.13). This zone also represents the
major mandarin orange production belt. Large cardamom, although wiped out by wilt, used to be
an important cash crop. In the low foothills, areca nut and ginger are extensively grown and
generate substantial income. Local breeds of cattle, goat and poultry constitute livestock which
helps in household income and farmyard manure.
Figure 3.13. Cowpea grown of rice bunds and areca nut in the background a common feature in the southern foothills of Bhutan.

63
3.1.2 Trends in agricultural area and production in AEZ
During the last decade (1999-2009) there has been some significant change in crop areas
and production across these AEZ (Figure 3.14). Except in the dry sub-tropical and humid sub-
tropical zones, there has been a dramatic decline in cropped area. Maximum decline of 30% and
24% in cropped areas was observed in the wet sub-tropical and cool temperate zones
respectively. Although empirical data is absent, this decline may be linked to encroachment of
arable land for infrastructural development in temperate zone and lack of agricultural
infrastructure like irrigation canal and crop predation by wild animals. An increase in cropped
areas of around 7% in the humid sub-tropical and 5% in dry sub-tropical may be associated to
the conversation of shifting cultivation land to dry land and the opening of farm roads in remote
settlements. Similarly a drastic decline in total crop production ranged from 15% in the alpine
zone to as high as 35% in the cool temperate zone. Reduction in crop production, particularly in
the cool temperate zone, may be associated to reduction of farming population the continuous
use of local varieties of buckwheat, barley and wheat under poor crop management practices. A
substantial production increase of 28% in the warm temperate zone is associated to the use of
improved crop varieties, farm mechanization, irrigation development, and more access to support
services.
Source: MoAF, 2000; MoAF, 2009.
Figure 3.14: Trend in cropped area and production during 1999 - 2009 in the main agro-ecological zones of Bhutan.
0
12000
24000
36000
48000
60000
0
1
2
3
4
5
6
Alpine Cool temperate Warm temperate
Dry sub-tropical
Humid sub-tropical
Wet sub-tropical
Tota
l pro
duct
ion
('00
0 K
g)
Cro
pped
are
a (
'000
Ha
)
Agro-ecological zone
Crop Area 1999 Crop Area 2009 Total production 1999 Total production 2009

64
3.1.3 Linkage between AEZ
The fact that these six AEZs specialize in particular production systems which is
exclusive from the others, results in inter-dependence between these zones. While there is an
apparent up-stream and down-stream linkage between communities, their basic linkage is related
to livelihood systems (Table 3.8). For instance people in the alpine zone are handicapped with
the harsh climate and solely depend on yak rearing and produce excess of dairy products during
summer. In winters when herders migrate to warmers areas with their yak herds, they carry along
butter and cheese to barter with grains and cloth. Yak herders move down as far as the dry sub-
tropical zone and trade their goods. This age old trade network is vital to maintain the social
system in the different zones. When the alpine dwellers move down in winters, they also bring
rare high altitude herbs widely used in traditional medicines and incense. Similarly there is also a
close inter-dependence between communities of temperate and sub-tropical zones. The
dependence is based broadly on crop products like red rice, potatoes, and apples from temperate
zone and maize, citrus and vegetables from the sub-tropical zone.
Table 3.8. Dominant farming systems, representative communities, major products and their linkages in the main agro-ecological zones of Bhutan.
The seasonal variations in these different AEZ also force people to move during harsh
winters from high altitude areas to warmer valleys and foothills. As the temperature rises during
March-April they migrate back to their villages. This practice of seasonal migration resulted in

65
most of the families having summer and winter homes. The migration to south during winter is
also forced as pasture are barren and covered with snow, taking their animals to south gives them
access to grazing areas. There are even situations where western farmers of Paro, Thimphu and
Ha districts own grazing land in Chukha. As people move their house, even today the monastic
body maintain a winter base at Punakha Dzong and during summer the monk body resides in
Tashichodzong in Thimphu. This movement of population between different AEZ has helped in
maintaining close social networks between different ethno-cultural groups. For instance, the
close linkage between herders from Ha and farmers of Dorokha in Samste and Sambeykha in Ha
is well known.
3.2 Agricultural policies
Since the launch of planned development in the form of five year plans in 1961,
agriculture has been the priority sector. In the first five year plan, three Departments of
agriculture, animal husbandry, and forest were established to demonstrate new crops, animal
breeds and improved production technology and expand the production base. Conservation of
forest and judicious utilization of forest resources was emphasised. In the subsequent plans, the
development objective of the farm sector focused on enhancing self-reliance in food production
and conservation of natural resources (Table 3.9).
Table 3.9. Development objectives of the farm sector in Bhutan, 1961-2013.
Five year plans (Period) Development objectives First (1961-66) - Promote and increase fruit and vegetable production area, conservation of forest, livestock
production development Second (1966-71) - Policy to increase food production through regional specialization of crops, conservation
of natural resource Third (1971-76) - Improving crop production and cooperative marketing, conservation of natural resource
Fourth (1976-81) - Major emphasis on development of agriculture and animal husbandry, conservation of natural resource
Fifth (1981-87) - Self reliance in food production, conservation of natural resources (NR) Sixth (1987-92) - Self reliance in food production, enhancing rural income, conservation of NR Seventh (1992-96) - Self reliance in food production, enhancing rural income, conservation of NR Eight (1996-2002) - Self reliance in food production, enhancing rural income, conservation of NR Ninth (2002-2008) - Enhancing rural income; achieving national food security; conserving and managing
natural resources; and generating employment opportunities. Tenth (2008-13) - Poverty reduction, income generation, employment generation and environmental
conservation
Source: Hasrat, 1980; GHNC, 2008a.

66
Roughly, the succession from first to tenth plan can be categorized into three phases. First
the humble beginning of providing people with land rights and production technologies when the
focus was on subsistence farming. A second phase of semi-subsistence economy emerged and
consequently cooperative marketing promoting people to produce surplus and state run auction
and bulk marketing were launched. From the 1990s, when beneficiaries were charged for the
production inputs like seed and planting materials, fertilizer, chemicals, tools, and machineries,
the objective of maximizing income became the priority of farmers. Coherently, since the 1990s
the farm sector development focused on cooperative or collective based large-scale production,
development of post-harvest processing, enterprise development and marketing, thus leading to
semi-commercial farming. The policy of the farm sector therefore clearly indicates the trajectory
from traditional subsistence farming to specialized commercial farming in the years to come.
The policy of food self sufficiency was debated for more than a decade, and concluded
that it was un-realistic (FAO, 1991). Subsequently a 70% food self sufficiency goal was adopted
in the seventh five year plan (1992-96). As the goal has been far-fetched, it has been maintained
even in the current tenth five year plan to increase national food self sufficiency level from 50%
to 70% (GNHC, 2008a). The concern over food security and self-sufficiency stems from the
increased reliance on the importation of staple foods, particularly due to the growth in urban
consumers and increases in the general level of income. The ultimate goal of specialization and
commercialization is challenged by the limited scale of production and the resource capacity of
the farmers. To enhance and sustain food production capacities, the protection of wetland and
consolidation of land use types into wetland and dryland (Land Act, 2007) promotes landuse
options to farmers. The provision of rural credit for commercial farming by the Bhutan
Development Finance Corporation has significantly facilitated farmers’ capacity to purchase
agricultural inputs and farm machinery. While all had access to rural credit only 15% of the
farmers availed the credit (PCS, 2007). The poor access to rural credit may be related to the high
interest rates (10%), poor repayment capacity, and the risk. Electricity, roads, piped water, and
rural credit are considered as the four most effective interventions in improving household
incomes (PCS, 2007). Similarly irrigation development, improvement of agricultural marketing
facilities, and cooperative development are expected to boost the farmers’ capacity to increase
crop production.

67
As indicated in Table 3.9 the strong hold of development policy has been the
conservation of nature. An impact assessment study by Planning Commission has revealed a
mixed opinion on the impact of conservation policy. While some gave credit to nature
conservation policy for forest regeneration and increased availability of NTFP, there are many
who opined that the stringent forest rules have prevented their access to valuable natural
resources which supported their livelihood (PCS, 2007). The crop and livestock predation by
wildlife is a major problem encountered by farmers.
3.3 Participatory diagnostic studies
The initiation of research in both sites was based on requests from the community. In
Lingmuteychu it was a case of up-scaling of the initial ComMod process carried out in two
upstream villages in 2003 where participants requested for inclusion of all seven village
communities in the sub-watershed (Gurung, 2004). While in the case of Kengkhar, the
community appealed the district administration to help them in resolving the acute shortage of
drinking water. With this backdrop and water being a multifunctional resource connected to all
facets of the SES, a detailed diagnoses of the problem situation was conducted by using the
agrarian systems analysis methodology (Figure 3.15).
Figure 3.15. Agrarian systems diagnosis in Lingmuteychu and Kengkhar (based on FAO, 1999).

68
3.4 Agrarian systems analysis
The way farmers exploit the environment within the limits and ability to reproduce by
using the relations and interactions that occur between all of its social and physical components,
can be considered as an agrarian system (Sacklokham and Baudran, 2005). The agrarian system24
takes into account the relationships between the production systems and the general social and
economic organization of the whole society. This concept takes a historical perspective by taking
dynamically into account ecological and social systems and other interactions and provides a
better understanding of the complexity of the present dynamics, the socio-economic structures
and the mode of exploitation of the ecosystem. Different types of production systems in
interaction co-exist in a given agrarian system (Figure 3.16). Although agrarian system analysis
can be conducted in different ways, broadly it can be implemented in four distinct steps: (i) agro-
ecological zoning, (ii) analysis of recent transformations, (iii) in-depth farm household survey
and construction of a farmer typology, and (iv) economic analysis of each main type of
production system (Trébuil and Dufumier, 1993; FAO, 1999).
Figure 3.16. The agrarian system: a complex open system made of two main sub-systems (FAO, 1999).
Compared to the concept of SES originating in the field of ecology, the agrarian system is
emphasizing agricultural production and the economic survival of its different types of 24 Prof. Mazoyer (1985) defined an agrarian system as “a mode of exploiting the environment historically created and sustainable, a system of production forces adapted to the bioclimatic conditions of a given space and responsive to the social conditions and needs of the moment”.

69
production systems. But there are many similarities between these two concepts such as the
focus on interactions between agro-ecological and social and economic dynamics, the
importance given to processes of adaptation to change and transformation (change from one
system to another one having a different domain of viability and functioning rules), the use of
key indicators or performance, thresholds and tipping points for example.
3.5 Participatory zoning and general description of water problems in two agrarian
systems of Western and Eastern Bhutan
As geo-databases are not well developed for these two sites, participatory mapping was
used in the form of resource mapping and delineation of areas for specific purposes. Zoning was
done based on local knowledge and field observations. It was done to segregate areas into units
of similar characteristics to identify and localize agro-ecological and socio-economic constraints
and potentials. Apart from agro-ecological zone and resource maps prepared based on key
informants and transects, an important demarcation illustrated in both sites (Figure 3.17A) is the
irrigation water network and user groups in Lingmuteychu which is based on local knowledge.
Similarly in Kengkhar zoning was prepared to show how villages share natural spring water
(Figure 3.17B).
Figure 3.17. Zoning of water users in (A) Lingmuteychu and (B) Kengkhar.
Farmers in Bhutan are experiencing localized and seasonal water shortages for drinking
and agricultural purposes. The present water resources management by different sub-sectors
hinges on water utilization or abstraction rather than the integrated management of water, land
GYT Office
RNR Office
+
Basic Health UnitLower Secondary School
Daiphodrang
Rotpari
Bartshangri
Wangkhochi
Ebee and Archong
Dokthang
Risingma
Kraipo
Pangthang
Farmer HouseInstitutionsFootpathSpring Pond
LEGEND
Sketch Not To Scale
N
From
Mongar
To Pemag
atshel
Secondary usersPrimary users
A: Lingmuteychu Figures not to scale B: Kengkhar
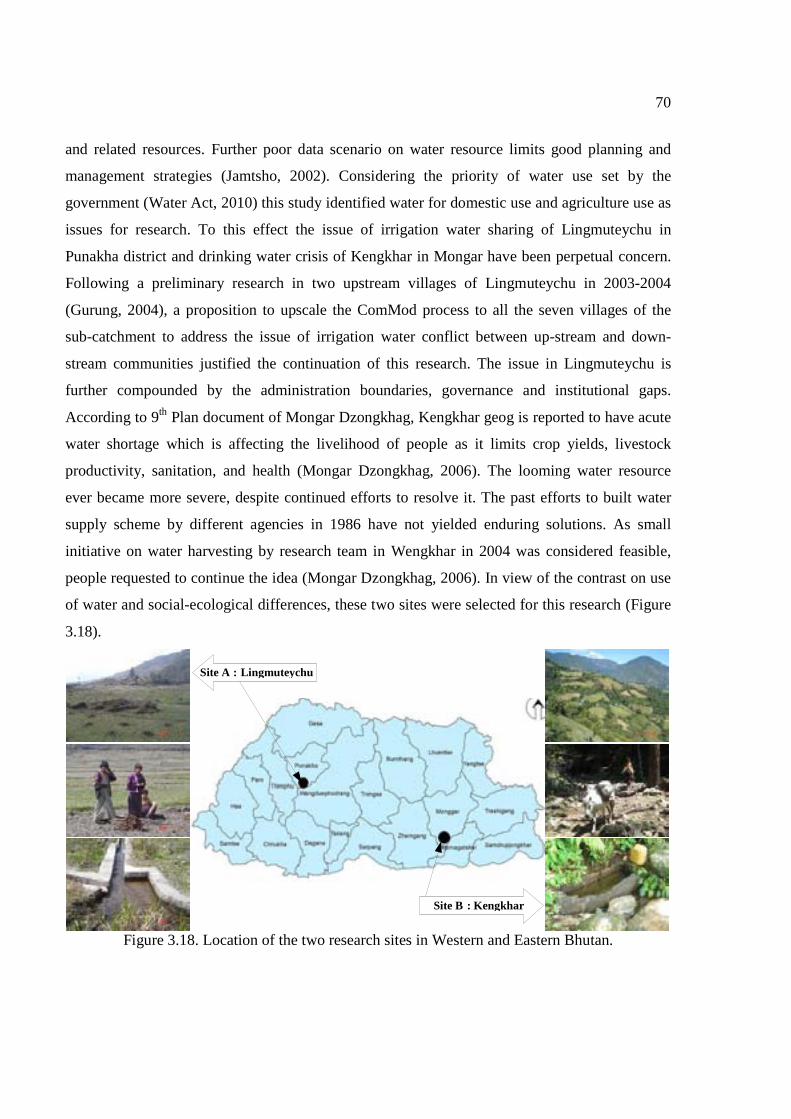
70
and related resources. Further poor data scenario on water resource limits good planning and
management strategies (Jamtsho, 2002). Considering the priority of water use set by the
government (Water Act, 2010) this study identified water for domestic use and agriculture use as
issues for research. To this effect the issue of irrigation water sharing of Lingmuteychu in
Punakha district and drinking water crisis of Kengkhar in Mongar have been perpetual concern.
Following a preliminary research in two upstream villages of Lingmuteychu in 2003-2004
(Gurung, 2004), a proposition to upscale the ComMod process to all the seven villages of the
sub-catchment to address the issue of irrigation water conflict between up-stream and down-
stream communities justified the continuation of this research. The issue in Lingmuteychu is
further compounded by the administration boundaries, governance and institutional gaps.
According to 9th Plan document of Mongar Dzongkhag, Kengkhar geog is reported to have acute
water shortage which is affecting the livelihood of people as it limits crop yields, livestock
productivity, sanitation, and health (Mongar Dzongkhag, 2006). The looming water resource
ever became more severe, despite continued efforts to resolve it. The past efforts to built water
supply scheme by different agencies in 1986 have not yielded enduring solutions. As small
initiative on water harvesting by research team in Wengkhar in 2004 was considered feasible,
people requested to continue the idea (Mongar Dzongkhag, 2006). In view of the contrast on use
of water and social-ecological differences, these two sites were selected for this research (Figure
3.18).
Figure 3.18. Location of the two research sites in Western and Eastern Bhutan.
Site A : Lingmuteychu
Site B : Kengkhar

71
3.5.1 Lingmuteychu sub-watershed
Lingmuteychu is a small sub-watershed, occupying an area of 34 km2 located at on the
east bank of the Punatshangchu river in west-central Bhutan. It is located in Limbukha block of
Punakha district. It is drained by an 11 km long Limtichu stream that originates as a spring from
a rock face at an altitude of 2,400 m north of Limbukha village (Figure 3.19). It is a rainfed
stream since the Antakarchu and Darchula ranges that confine this sub-watershed are below the
snow line. The stream serves five irrigation systems supporting 11 irrigation channels that
irrigate about 242 ha of terraced wetland belonging to 206 households of seven villages (Own
survey, 2009). While six villages share irrigation water from Limtichu stream within a broadly
respected customary regime, the seventh lowest village use water from another catchment. Until
2008, four villages (Limbukha, Dompola, Omtekha, and Nabchee) fell under Limbukha block of
Punakha district, two villages (Matalangchu and Wangjokha) under Baap block of Thimphu
district, and one (Bajothangu) under Thetsho block of Wangdue district. This administrative
jurisdiction further added to confusion of water resource management. In 2008 when the
democratic process was launched at the national scale constituency for election were delimited.
In the process two of these villages under Thimphu district were merged with the Limbukha
geog while the last and the lowest one which used water from another catchment continued to
belong to Wangdue district.

72
Figure 3.19. North-South longitudinal transects line of Lingmuteychu sub-watershed in west-central Bhutan. December, 2009.
District Punakha Thimphu Wangdue Whole catchment Villages Limbukha Dompola Nabchee Omteykha Matalumchu Wangjokha Bajothang
Altitude (masl)
2170 2100 1870 1600 1500 1300 1300 1300-2170
Vegetation Broadleaf forest Coniferous forest Clay to sandy loam Access to
forest (distance)
Good Moderate Good Poor Poor None
Soil Type Dark brown clay Dark brown and sandy loam
Shallow and deep brown sandy loam Sandy loam
Irrigated rice land (ha)
38.46 28.97 4.24 40.08 49.58 33.97 47.06 242.36
Dryland (ha) 6.75 7.48 7.00 1.83 1.99 14.80 6.03 45.88 Major Crops Rice, potato Rice, maize,
wheat, vegetable
Maize, Rice Rice, mustard Rice, Wheat, mustard Rice, Wheat, mustard
Rice, wheat, mustard
Households 35 31 22 24 27 18 49 206 Main income source
Potato, Rice Vegetable, Rice NWFP, Maize, vegetable, off-farm within watershed
Rice, Vegetable Vegetable, Rice Rice, Vegetable, off-farm Rice and vegetable
Problems Wild animals Water shortage and wild animals
Wild animals and water shortage
Water shortage Water shortage and market
Irrigation water shortage
Irrigation water shortage
Irrigation water shortage
Potentials Potato and rice production
Rice and vegetable production
Maize, potato and vegetable
production
Rice, mustard and vegetable production
Rice, wheat, mustard Rice, mustard,
wheat Rice, Wheat,
mustard
Increased crop production

73
3.5.2 Kengkhar
Kengkhar is a small highland settlement located on the confluence of Kurichu and
Gangrichu in Mongar district. It is one of the remote block without motorable road access and
electricity. It takes 8 hours of brisk walking to reach this village from the nearest road head at
Gyelposhing. The block spreads over an area of 156 km2, with a population of 380 households
clustered in 7 hamlets. The altitude ranges from 860m to 2400m and the area experiences cold
winter and warm summer. Kengkhar is popularly known for intricately carved wooden mask
(bap), cask (palang), and altar (tsho-sam). The study site comprised of four hamlets: Munma,
Aring, Drongphu and Kengkhar (Figure 3.20).
Village Munma Aring Drongphu-Sherkong Kengkhar Vegetation Mixed broadleaf Problem of water
Severe Severe Medium Medium
Soil type Sandy loam No. of household
20 12 27 30
Dryland (Ha)
8 5 10 12
Major crops Maize, mungbean and mandarin orange Income source
Mandarin orange and handicrafts
Problems Land degradation, water shortage
Water shortage
Potentials Sustainable land management
Mitigation of water shortage by networking spring ponds
Figure 3.20. Transect line of Kengkhar in Mongar district, Eastern Bhutan, 2009.
Altitude
m a
sl

74
3.5.3 Socio-ecological landscapes
The complexity of SES, uncertainties and nonlinearities arise from internal feedbacks and
interactions with structures and processes operating at other scales (Gunderson and Holling,
2002), resulting in multiple alternate stable states (Scheffer and Carpenter, 2003). Further
intricacy is induced by the complex mixture of ecosystem goods and services, each with their
own set of stakeholders (Walker et al. 2002, Lebel, 2004). Uncertainties blend to form key
features of social ecological landscape (Lebel et al., 2006). Resource use and interacting SES
steer the function and patterns of landscapes (Brunckhorst, 2005). As such the SES landscape
can be a basis to understand complexity as it provides a useful conceptual context for integration.
3.5.3.1 Lingmuteychu
The social-ecological landscape of Lingmuteychu is illustrated is Figure 3.21 by using
the three main elements of rural socio-ecological systems (Schouten, et al., 2009). Physically
Lingmuteychu can be represented by two steep slopes draining to a seasonal stream – Limtichu
forming a narrow (approximately 11 km long, 1.5 km wide) valley.
Figure 3.21. Components of the rural socio-ecological system and their interactions at Lingmuteychu in West-central Bhutan.
Timber, fodder, fuel w
ood,
grazing land, forest litter,
water for drinking and
irrigation
Deforestation,
declining water
discharge
Food, in
come
Employm
ent (on-
farm and off-
farm), user
groups, self-help
group

75
The altitude ranges from 1300 to 3100m amsl which provides agro-ecological features of
warm temperate and dry sub-tropical zones. There are basically two types of forest vegetations:
broadleaf forest above 1600m and coniferous forest below. Together they cover 69% of the sub-
watershed area. A detailed longitudinal zonation of the sub-watershed along a transect line,
locating the vegetation types, soils, and altitudinal differences influencing crop choices and other
land-use decisions is provided in Figure 3.22. There is a small stretch of highly degraded barren
land in the lower reach of the sub-watershed, which results from over grazing and poor forest
regeneration (Gurung, 2004). Irrigated wetlands covering 242.36 ha predominates land use.
Source: Own survey, 2009
Figure 3.22. Schematic representation of landscape profile at Lingmuteychu site, West-central Bhutan.
Farmers divert water from Limtichu stream for irrigating the rice fields. From the early
days the local communities have framed customary norms to share and manage water from this
Lumpa
Matalangchu
Omtekha
TsirinaLimbukha
Dompola
Limti Chuu
(Stream)
Nabchee
Antakarchu (3100 m)
Forest (Mixed Broadleaf)
2400
0
1300
3100
2100
1900
1600
v
Wangjokha
Temple
(Lhakhang)
1 23
Altitude (m asl)
Distance (Km)
Road
Irrigation canal
Paddy field Dryland Village TempleIrrigation canal Farm roadStreamLEGEND:

76
seasonal river. The customary rights created during a time when the resource was abundant with
few users is still in practice and are found to be feudalistic and unfair (Kuensel, 2008). For
instance, the well-off families who own large land holdings have greater say over the resource
allocation. Major income sources can be categorized into three categories: (i) agricultural
commodities (rice, potato, mushroom, dairy products, and NTFP) (Figure 3.23), (ii) off-farm
employment (construction, skilled and semi-skilled work), and (iii) remittances (family member
employed in public and corporate sectors). Lingmuteychu has most of the basic amenities in
place (school, health unit, electricity supply, telephone connectivity, piped water supply, and dirt
road), and the community has rapidly transformed from subsistence to semi-commercial farming
(see below for details). Being accessible, people are aware of most of the policies of the
government.
Figure 3.23. Rice and puffed rice as important commodity of trade from Lingmuteychu.
3.5.3.2 Kengkhar
The landscape of Kengkhar is representative of the eastern region of the country which is
dominated by dryland. The study site is a south-east facing slope covering 30% of the Kengkhar
block at an altitudinal range of 600 to 1400m amsl. Figure 3.24 provides a sketch of Kengkhar
area with dryland concentrated and dominating one-half of the area. The community has a
temple (Dungkhar Goenpa) overlooking the settlement and considered as the residence of a
guardian deity. All the government service centres, including the local government office is
located in the study area, making it a hub of the block.
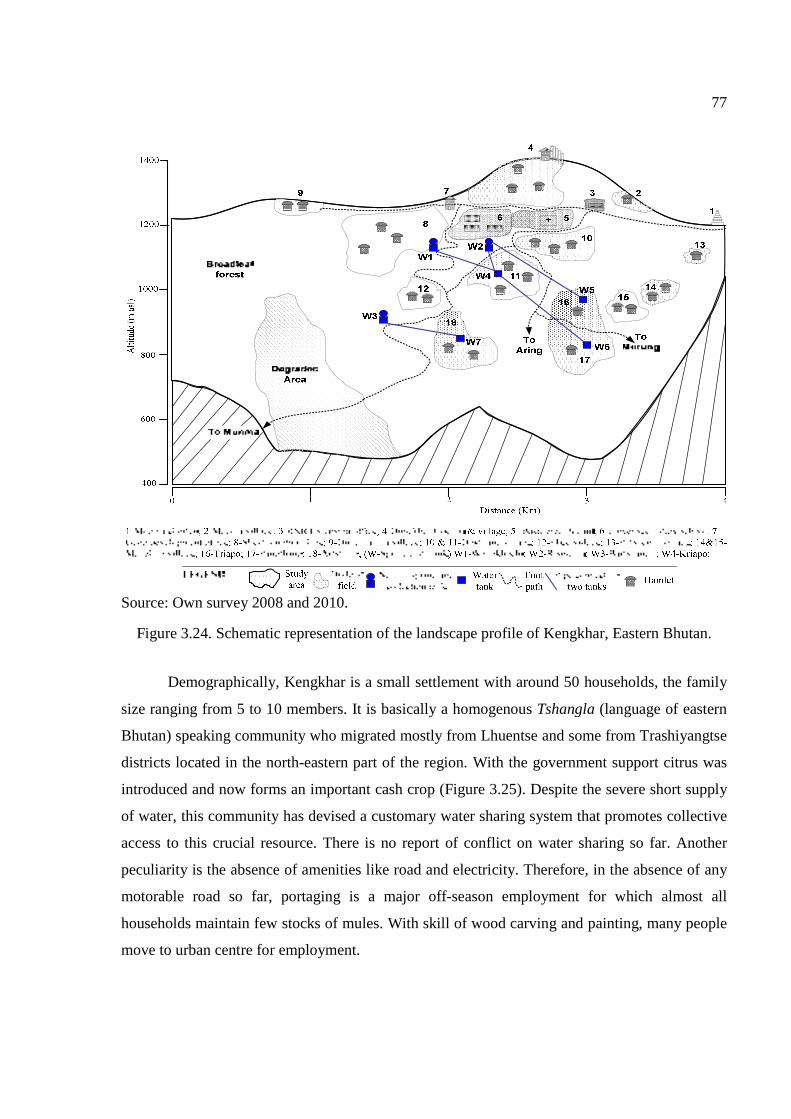
77
Source: Own survey 2008 and 2010.
Figure 3.24. Schematic representation of the landscape profile of Kengkhar, Eastern Bhutan.
Demographically, Kengkhar is a small settlement with around 50 households, the family
size ranging from 5 to 10 members. It is basically a homogenous Tshangla (language of eastern
Bhutan) speaking community who migrated mostly from Lhuentse and some from Trashiyangtse
districts located in the north-eastern part of the region. With the government support citrus was
introduced and now forms an important cash crop (Figure 3.25). Despite the severe short supply
of water, this community has devised a customary water sharing system that promotes collective
access to this crucial resource. There is no report of conflict on water sharing so far. Another
peculiarity is the absence of amenities like road and electricity. Therefore, in the absence of any
motorable road so far, portaging is a major off-season employment for which almost all
households maintain few stocks of mules. With skill of wood carving and painting, many people
move to urban centre for employment.

78
Figure 3.25. Mandarin orange as important cash crop of Kengkhar.
The interactions among the three components of the local socio-ecological system are
displayed in Figure 3.26. While a detailed study was not done, community members too perceive
the decline of natural spring water and land degradation as an effect of indiscriminate harvesting
of timber. So much that, as they cannot find suitable timber in the community, the craftsmen
bring the timber from the neighbouring Pemagatshel district (a 6 hours walk toward the south) to
make their famous wooden casks.
Figure 3.26. Components of the rural social-ecological system and their interactions at Kengkhar
site in Eastern Bhutan.
Timber, fodder, fuel w
ood,
grazing land, forest litter,
water for drinking
Deforestation,
declining water
discharge
Food, in
come
Employm
ent (o
n-
farm
and off-fa
rm)

79
3.5.4 Natural resources, their interactions and management
3.5.4.1 Lingmuteychu
The natural resources available in the study can be broadly grouped into three groups: as
forest, crop production, and livestock based. The status of natural resources in Lingmuteychu is
presented in Table 3.10. It is evident from the status that people have abundance of arable land
and livestock compared to resources derived from the forest. Among the natural resources NTFP,
sokshing, and grazing land are scarce, while timber and water are moderately available. It was
revealed from the survey that the main cause of loss of timber was the nationalization of forest in
1969 when anyone with a permit could access the forest and harvest trees. From the total sub-
watershed area of 34 km2 only 6.3% is arable land and the remaining falls under the government
reserved forest (GRF). This GRF area actually represents scrub forest and vast barren land. The
broadleaf forest in the upstream looks fairly healthy.
Table 3.10. Status of natural resources in Lingmuteychu.
Natural Resources Abundance Threat Subsistence usage
Commercial usage
Community rules
Timber xx xxx xxx - x Communal sokshing x xxx xxx xx NTFP x xx x Xx x Communal pasture x xx xxx x Water (irrigation and drinking) xx xxx xxx xxx Community forests x xxx X x Arable land xxx x x xxx xx Field crops xxx xx xxx Xx Horticulture crops xx x x xxx Feed and fodder x x Cattle xxx x xxx xxx Poultry xx xx xx xxx Piggery x - xxx xxx Horses x - x X
Scale: blank = non-existent, x = low, xx = medium, xxx = high.
Dwindling water resource has been a perpetual problem of the community. One of the
reasons for declining discharge of water is associated with the small catchment area. NTFP is
also an important natural resource that support livelihood, as household depend on ferns,
mushroom, orchids and wild fruits for domestic consumption. The provision to use designated
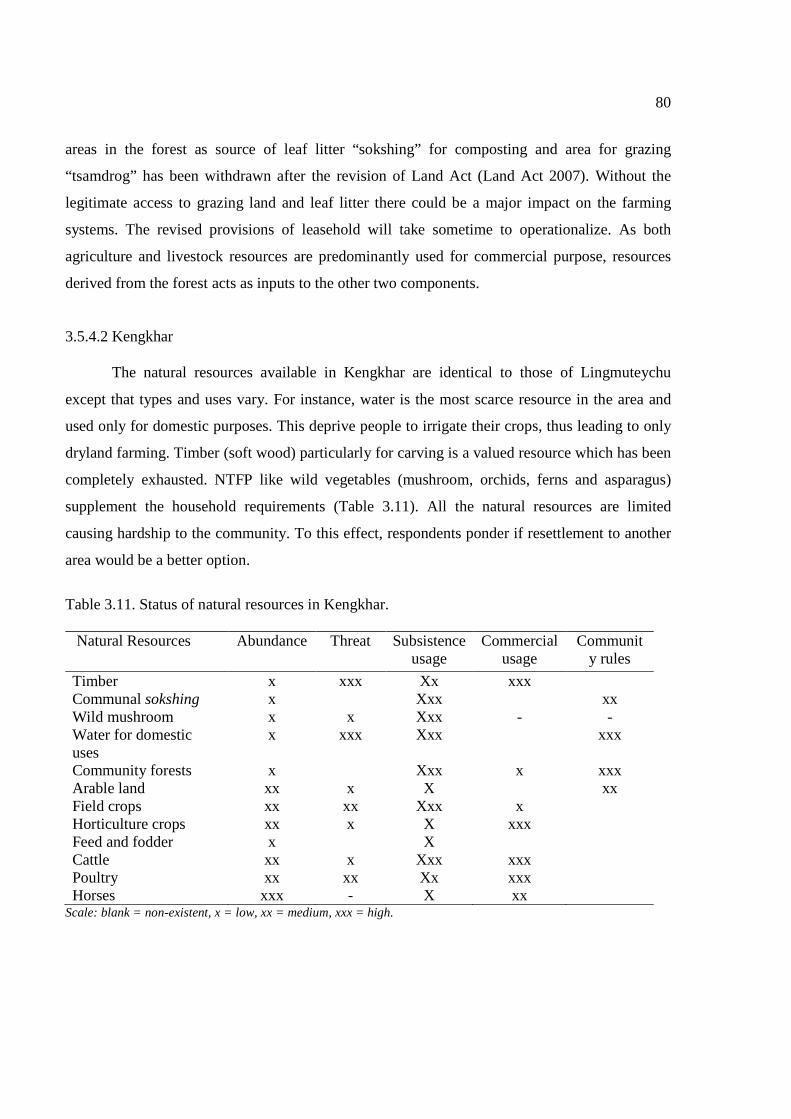
80
areas in the forest as source of leaf litter “sokshing” for composting and area for grazing
“tsamdrog” has been withdrawn after the revision of Land Act (Land Act 2007). Without the
legitimate access to grazing land and leaf litter there could be a major impact on the farming
systems. The revised provisions of leasehold will take sometime to operationalize. As both
agriculture and livestock resources are predominantly used for commercial purpose, resources
derived from the forest acts as inputs to the other two components.
3.5.4.2 Kengkhar
The natural resources available in Kengkhar are identical to those of Lingmuteychu
except that types and uses vary. For instance, water is the most scarce resource in the area and
used only for domestic purposes. This deprive people to irrigate their crops, thus leading to only
dryland farming. Timber (soft wood) particularly for carving is a valued resource which has been
completely exhausted. NTFP like wild vegetables (mushroom, orchids, ferns and asparagus)
supplement the household requirements (Table 3.11). All the natural resources are limited
causing hardship to the community. To this effect, respondents ponder if resettlement to another
area would be a better option.
Table 3.11. Status of natural resources in Kengkhar.
Natural Resources Abundance Threat Subsistence usage
Commercial usage
Community rules
Timber x xxx Xx xxx Communal sokshing x Xxx xx Wild mushroom x x Xxx - - Water for domestic uses
x xxx Xxx xxx
Community forests x Xxx x xxx Arable land xx x X xx Field crops xx xx Xxx x Horticulture crops xx x X xxx Feed and fodder x X Cattle xx x Xxx xxx Poultry xx xx Xx xxx Horses xxx - X xx
Scale: blank = non-existent, x = low, xx = medium, xxx = high.

81
3.5.4.3 Interactions among natural resources and their management
The dynamic interactions among these three groups of natural resources are influenced by
the household that regulates the interplay. Within a household, three elements of food, shelter
and income as basic needs can be theoretically linked to different resources to represent these
interactions are shown in Figure 3.27. All resource flows into household from where it flows out
of the system to market to generate income and fulfil other needs. Although it could not be
accurately quantified, it is evident from the representation that forest is a primary source of
resources that feed the other sub-systems.
Figure 3.27. Natural resources flow and interactions in Lingmuteychu and Kengkhar farming households.
Broadly there can be three management regimes depending on the resource involved. In
the case of Lingmuteychu and Kengkhar, resources are mostly under the state management
within the prescribed rules (Table 3.12). At both sites there are forestry officials to regulate the
use. As these officials have no litigation responsibilities, the resource sharing conflicts are
addressed by local government offices (represented by the Block headman). Severe cases are
reported to the District court. For example farmers of Lingmuteychu have to often attend such
legal cases, the most recent one was in August 2009, when a group of irrigators from Omtekha
Organic manure
Irrigation water
Building
materials
Food
Drinking
water
Food
GO
VE
RN
AN
CE
MA
RK
ET

82
village dismantled the irrigation weir. Despite such rules, customary rights on water and NTFP
are duly considered (Water Act, 2010). Agriculture and livestock resource although privately
owned, they are protected from exploitation by policies. Particularly the protection of wetland
from being used for other uses (Land Act, 2007).

83
Table 3.12. Natural resource management regimes in Lingmuteychu and Kengkhar.
Resources Management regimes Forest based State management Community management Private management Timber Chapter V of the Forest and Nature Conservation Rules,
2006 specifies the allocation of timber
Bamboo and cane Chapter V Article 54 (5) of Forest and Nature Conservation Rules (FNCR) 2006 permits access and use
Community regulates the schedule to access forest areas
Sokshing (Woodlot for collecting forest litter for composting)
Chapter 11(Use of sokshing) of the revised Land Act 2009 withdraws rights from both individual and community and declared as Government reserved forest, thereafter it is allowed on leasehold basis
Wild mushroom Chapter 3 Article 15 (c) allows individuals to harvest mushroom for domestic consumption without permit
Community based management approaches are applied
Communal pasture Chapter 10 (Article 235 - Use of tsamdro) of the revised Land Act 2007 withdraws rights from both individual and community and declared as Government reserved forest, thereafter it is allowed on leasehold basis
Water for irrigation and drinking purposes
Water Act 2010 provisions right to access water for domestic and agriculture use on priority basis. FNCR, 2006 have special provisions to protect and manage catchment areas
Customary rules and rights to access water supply
Community (& plantation) forests
Chapter 4 of FNCR 2006 promotes community involvement in forest management
Agriculture based Arable land Land Act 2007 is the overriding legal framework that
protects land
Crops Provision for development support Planting and harvesting schedules
Primary decisions to raise crop and management levels
Livestock based: Domestic animals Provision for development support Migratory schedules and track Individual decision to raise
livestock and management levels

84
3.5.4.4 Land holding in Lingmuteychu and Kengkhar
As any typical Bhutanese community, Lingmuteychu and Kengkhar are also sparsely
populated communities living within the realms of traditional cultures (Figure 3.28).
Lingmuteychu is predominantly a rice growing community with around 84% arable land devoted
to irrigated wetland. While Kengkhar represents a distinctive dryland environment with 88% of
arable land used for dryland cultivation (Table 3.13). There is no wetland in Kengkhar and
similarly Lingmuteychu community has not invested in orchards.
Figure 3.28. Lady (in red shirt) from Lingmuteychu offering tea, while lady from Kengkhar (in blue Tego) offers ara (locally brewed alcohol) to guest.
Table 3.13. Landuse and households at Lingmuteychu and Kengkhar study sites, 2008. (Hectares).
Study sites Wetland Dryland Orchard Households Lingmuteychu 242 45 0 206 Kengkhar 0 53 7 52 Source: RNR Census 2009.
The land distribution between the two study sites is contrasting (Figure 3.29).
Distribution in Lingmuteychu is equitable as around 92% of the farmers own less than 1.2 ha of
arable land. Just 1% of the population has more than 4 ha. In the case of Kengkhar, more than
71% of the farmers hold more than 1.2 ha. with only around 6% owning less than 0.4 ha.

85
Source: MoAF, 2009.
Figure 3.29. Distribution of land holding size in Lingmuteychu and Kengkhar.
3.5.4.5 Crops and cropping patterns
In view of the differences in land use at these two sites, it is useful to present the crops
and cropping patterns separately. Further, as seven upstream to downstream villages are involved
in Lingmuteychu, it is better to show their cropping patterns individually to understand the
overlaps.
Lingmuteychu
All farmers in the seven villages of Lingmuteychu sub-watershed grow different varieties
of rice (local red rice, local white rice, IR64, IR20913) on average in 1 ha/HH. In general people
grow 5 cereal crops and 3 vegetables (Figure 3.30). Maize is mostly grown by Nabchee farmers.
Potato is fast becoming a popular cash crop, although it was started only in 2003 by Limbukha
farmers as a pre-rice crop, now downstream communities have also introduced potato before
rice. Chili and mustard are other crops which are grown in small plots by most farmers.
0
10
20
30
40
50
60
< 0.4 0.4-1.2 1.2-2.0 2.0-4.0 > 4.0
Pro
port
ion
of h
old
ers
(%)
Frequency of land holding size (Hectare)
Limbukha KengkharLegend:

86
Source: Own survey, 2009.
Figure 3.30. Crops grown in Lingmuteychu and their productivity.
As a potential rice growing area, the yield levels of rice and millet are 13% and 11%
higher than the national average yields25 respectively. The cropping calendars presented in
Figure 3.31 provide a glimpse of how seven communities implement their cropping activities on
a village basis but under the influence of other upstream communities.
25 National average yield (t/ha) over nine years: paddy=2.8; maize=2.4; wheat=1.2; barley=1.3; buckwheat=0.9; millet=1.0; and potato=10.2 (Source: MoA, 2009)
0.0
0.6
1.2
1.7
2.3
2.9
3.5
0.00
0.20
0.40
0.60
0.80
1.00
1.20
Rice Wheat Mustard Maize Millet Potato Chili Radish Buckwheat
Yiel
d (T
/Ha.
)
Aver
age
Are
a (H
a./H
ouse
hold
)
Crops
Area Yield

87
Source: Own survey, 2009.
Figure 3.31. Cropping patterns of seven villages in Lingmuteychu sub-watershed.
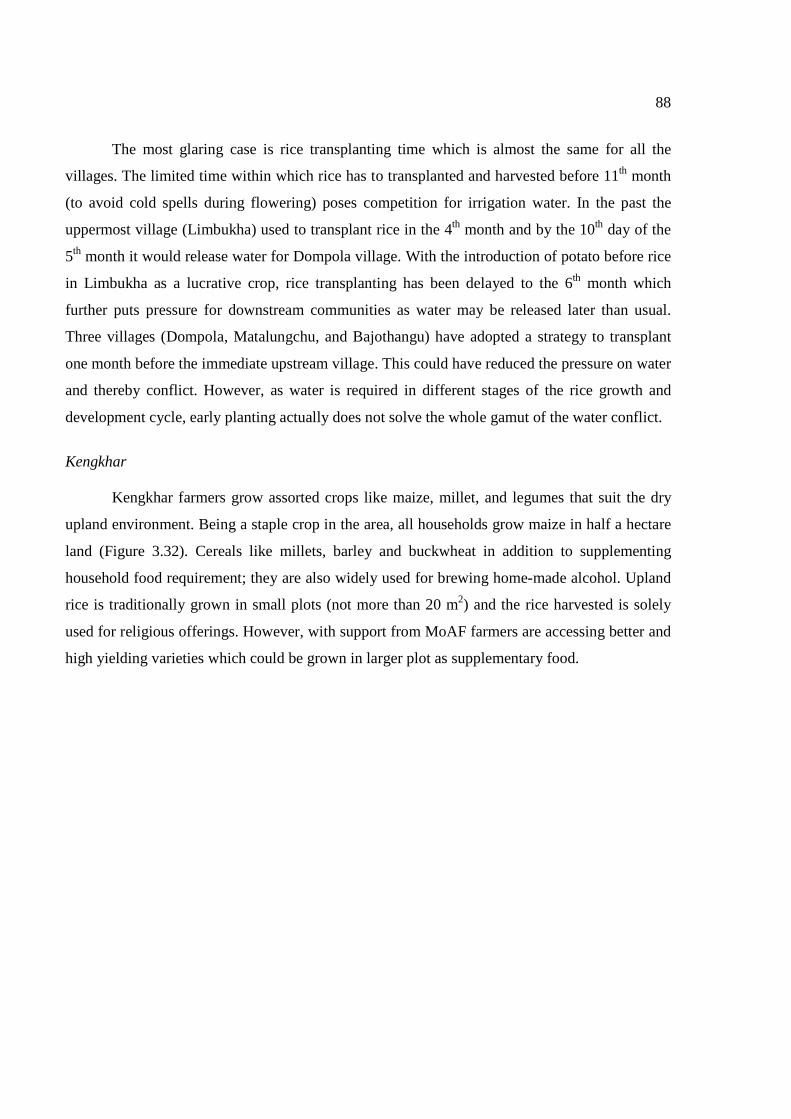
88
The most glaring case is rice transplanting time which is almost the same for all the
villages. The limited time within which rice has to transplanted and harvested before 11th month
(to avoid cold spells during flowering) poses competition for irrigation water. In the past the
uppermost village (Limbukha) used to transplant rice in the 4th month and by the 10th day of the
5th month it would release water for Dompola village. With the introduction of potato before rice
in Limbukha as a lucrative crop, rice transplanting has been delayed to the 6th month which
further puts pressure for downstream communities as water may be released later than usual.
Three villages (Dompola, Matalungchu, and Bajothangu) have adopted a strategy to transplant
one month before the immediate upstream village. This could have reduced the pressure on water
and thereby conflict. However, as water is required in different stages of the rice growth and
development cycle, early planting actually does not solve the whole gamut of the water conflict.
Kengkhar
Kengkhar farmers grow assorted crops like maize, millet, and legumes that suit the dry
upland environment. Being a staple crop in the area, all households grow maize in half a hectare
land (Figure 3.32). Cereals like millets, barley and buckwheat in addition to supplementing
household food requirement; they are also widely used for brewing home-made alcohol. Upland
rice is traditionally grown in small plots (not more than 20 m2) and the rice harvested is solely
used for religious offerings. However, with support from MoAF farmers are accessing better and
high yielding varieties which could be grown in larger plot as supplementary food.

89
Source: Own survey, 2009.
Figure 3.32. Crops grown in Kengkhar and their productivity.
While potato is planted as a sole crop and pulses/legumes (rajma-Phaseolus vulgaris,
soybean-Glycine max, and mungbean- Vigna radiata) are popularly cultivated as intercrops in
maize. Potato and beans are sold in nearby towns to earn cash income. The yield levels of all
crops are extremely low, for instance the maize yield is around 70% lower than the national
average and the potato yield is almost 90% lower.
The cropping calendar (Figure 3.33) provides a general understanding of how maize
cultivation takes most of the farmer’s time in crop production. There seems to be lots of overlap,
which could be one reason for poor crop yields. It also provides a sense of subsistence farming
and food security with short cycles of multiple crops continuously providing some food diversity
for the household.
0.00
0.13
0.26
0.39
0.52
0.65
0.78
0.0
0.1
0.2
0.3
0.4
0.5
0.6
Summer maize
Winter maize
Barley Millet Buck wheat
Beans Mung bean
Soybean Potato Upland rice
Yie
ld (
T/H
a.)
Ave
rage
are
a (H
a./h
ouse
hold
)
Crops
Area Yield

90
Source: Own survey, 2009
Figure 3.33. Cropping patterns at Kengkhar.
3.5.4.4 Livestock
Livestock system serves an important role to supplement household with animal protein,
in addition to the vital draught power and manure it provides to farming. In addition to the
wealth indicator, people maintain large herds of livestock as a source of farm yard manure
(FYM) which is applied in large quantities on the fields. For instance, farmers apply 7 to 10 tons
of FYM/hectare/year in Lingmuteychu, while Kengkhar farmers apply 5-6 tons of
FYM/hectare/year and tether their cattle in the field. Farmers rear eight types of livestock in both
sites (Table 3.14).
Table 3.14. Livestock types and their population in Lingmuteychu and Kengkhar in 2008.
Mithun Nublang Jersey Brown Swiss Mule Goat Pig Poultry Lingmuteychu 90 680 85 0 66 11 7 281 Kengkhar 572 918 182 3 166 9 30 799
Source: RNR Census, 2009.
Cattle form the most important group with four different breeds (Mithun, Nublang,
Jersey, and Brown Swiss), followed by poultry. Farmers in Kengkhar maintain more local cattle

91
for the purpose of ploughing fields (Figure 3.34). In Lingmuteychu ploughing is done by the 10
power tillers available in the sub-watershed (Figure 3.34). Most households in Kengkhar own
mules to transport goods as the community is still not connected by road. In contrast although
there is a motorable road in Lingmuteychu, some well-off households still own mules which are
used for transporting FYM from homestead to fields.
Figure 3.34. Ploughing the field with power tiller in Lingmuteychu and use of Mithun bulls in Kengkhar.
Until the year 2000, they used mules for transporting goods to the nearby town of
Wangdue. Raising few cockerels in every home is a traditional practice; however poultry
farming is of recent introduction by MoAF’s initiatives. Currently many households rear more
than 10 improved breed of layers supplied by the Department of Livestock, which is a
supplementary source of income from selling eggs.
3.5.4.5 Livelihoods, constraints and opportunities.
Lingmuteychu and Kengkhar provide contrasting strategies for livelihood adopted by
communities in two different situations. A simple schematic representation of resource inflows
and outflows describe the livelihood sources of the two communities in Figure 3.35. The inputs
for both cases are almost similar, except that they vary in terms of volume and proportion of
households using them. The inputs come from two sources: from the forest and from external
sources like the market. Kengkhar farmers consider rice as input to the system, as they fully
depend on it from external sources. In Lingmuteychu, to operate the intensive rice farming,

92
farmers heavily depend on chemical fertilizers, pesticides and herbicides. Further they consume
higher proportions of forest produces like leaf litter and timber.
The outflow from the system indicates a rice and potato specialization in the case of
Lingmuteychu. The products are specially targeted to the market and produced in large
quantities. In comparison, Kengkhar farmers produce several items in small quantities, which
may be sold. From 14 items, Kengkhar people consider woodcrafts and citrus as the prime
products that are targeted for the market. Fundamentally it can be deduced that livelihood of
Lingmuteychu is based on semi-commercial rice production system, while in Kengkhar
livelihood depends on semi-subsistence farming supplemented by micro wood-based cottage
industry.

93
Source: Own survey, 2009. Figure 3.35. Farming household resource in-flow and out-flow in Lingmuteychu and Kengkhar.
At the national level the principal limiting factor in the farm sector is crop damage and
livestock predation by wildlife (Figure 3.36). 34% of the respondents in a nation wide

94
agricultural census raised wildlife as the most important issue. It was most prevalent in the
eastern region and lowest in the west-central region. It was followed by insufficient irrigation
water (19%) which made difficult to cultivate rice. The issue of irrigation water was more
prevalent in the west and west-central regions where rice is a dominant crop. Shortage of arable
land was raised as a limiting factor to crop production by 14% of the respondents. Access to
market, pest and diseases, and unproductive land are also constraining agricultural development.
Source: RNR Census 2009.
Figure 3.36. Constraints to agricultural development in Bhutan, 2009.
The constraints at our two study sites correspond to the national scenario with the water
issue as a primary concern in Lingmuteychu and access as main limiting factor in Kengkhar
(Figure 3.37). In Lingmuteychu 67% of respondents (n=50) indicated the water issue as a major
constraint followed by wild animal damage in upstream villages. Flood during the wet monsoon
from the Punatshangchu river is a problem in Bajothangu lower village. Farmers in Kengkhar
seem to be surrounded by numerous problems ranging from labour shortage to access. About
41% of the respondents (n=52) pointed the lack of road as a major constraint of the community.
With a motorable road now under construction, access to market can be improved in the near
future. Drinking water scarcity was also raised as an issue by 15% of them.
0
20
40
60
80
100
West West-central East-central East
Pro
port
ion
of re
spon
dent
s (%
)
Region
Crop lost to wildlife Insufficient Irrigation Land Shortage
Limited Market Access Insect /Diseases Unproductive Land
Legend:

95
Source: Own survey, 2009.
Figure 3.37. Problem definition in (A) Lingmuteychu and (B) Kengkhar.
Despite the problems, opportunities exist which can facilitate development of these
communities. In Lingmuteychu cropping intensification and improvement of crop yields are
major opportunities. 14% of the respondents considered that commercialization of agriculture
through the expansion of potato cultivation (12%) have a high potential in the area. To address
the issue of water shortage, there is a potential for collective management of the resource and
water harvesting particularly in Nabchee area (Figure 3.38).
Source: Own survey, 2009. Figure 3.38. Opportunities for agricultural development in (A) Lingmuteychu and (B) Kengkhar.
Road41%
Water scarcity
15% Small holding
7%
Market20%
Labour shortage
1%
Timber for woodcraft
5%Religious sentiments
4%
Pest and
disease3%
Wild animal
1%
Low soil fertility
3%
Water shortage
50%
Flood 4% Wild
animal33%
No water source13%
Citrus orchard
development44%
Vegetable cultivation
20%
Maize processing
6%
Potato cultivation
13%
Rice cultivation
4%
Handicraft5%
Piggery4%
Private forest4%
Increase crop yield26%
Commercial farming
14%
Collective management
8%
Crop intensification
26%
Potato production
12%
Fruit production
4%
Water harvesting
10%

96
Similarly, in Kengkhar, cultivation of citrus, vegetable and potato are opportune
interventions. People consider the future new highway linking Gyelposhing to Nanglam that will
connect the area to Assam, India and the farm road being built in the study area as motivation to
expand cash crop cultivation. Although woodcraft is an important livelihood source, only 5% of
the respondents considered it as an opportunity because other thinks that it is highly dependent
on the availability of timber which is already in short supply and has to be imported from a
neighbouring province.
3.6 Recent agricultural transformations at the two study sites
Ever since the country was unified in 1907, there has been a chain of socio-economic and
political events either planned or incidental that led to transformation of agro-ecological
conditions. From a sparsely inhabited and self-contained farm families migrating with herds of
livestock and practicing shifting cultivation, in two decades it evolve into the present landscape
where farming is driven by income generation objectives and people competing for (both local
and external) renewable resources. 55 farmers in Lingmuteychu and 40 in Kengkhar were
consulted to generate historical profiles to document and understand the evolution of the local
socio-economic contexts and their associated influence on agro-ecological conditions.
Respondents felt comfortable to share information on events that occurred only after the early
1950s when serfdom and feudalism was abolished. Some reasoned that few powerful people
controlled the socio-economic system. Based on the historical timeline, the agrarian
transformations in both sites summarized in Tables 3.16 and 3.17 can be grouped into three
main phases as (i) 1950-1970: Subsistence farming by predominantly shifting cultivators, (ii)
1970-1990: self-subsistence to part-commercial, and (iii) 1990-2009: Semi-commercial farming
dominate.
3.6.1 1950-1970: Land reform and subsistence farming
Prior to the 1950s, slavery and serfdom prevailed in Bhutan and it was only in 1952 when
a land ownership ceiling was set at 10-12 hectares per individual, serfdom abolished and King
granted land to landless people (Hasrat, 1980) leading to the emergence of an independent
household based mode of farming free of the bondage (Table 3.15).

97
Lingmuteychu: a wetland dominant community
Despite the land allocation and entitlements, farmers followed the traditional method of
cropping and production systems for the subsistence purpose. People practised a shifting
cultivation system (locally termed as tseri) as it suited best for households who had to migrate
with their livestock herds seasonally. As they followed long fallow periods (more than 12 years)
tseri helped rebuilding the production potential and ensured better harvests especially by
controlling weed infestation. With the abundance of forest resource and open barren lands,
farmers used them as grazing land and source of timber and firewood indiscriminately. Within
the predominantly rice-growing farmers, in 1952 few families from the eastern part of the
country were resettled in Nabchee, who brought along maize cultivation into the sub-watershed;
even today Nabchee farmers still depend on maize. During early 1960s, Government provided
subsidy for terracing their field and conversion of dryland to rice fields. In 1969 when taxation
was changed from kind to cash, farmers started growing a larger diversity of crops (like chilli,
cabbages, radish, beans and rice) that could be easily sold to civil servants in Punakha and
Wangdiphodrang towns. People narrate of long early morning treks in the nearby forest to
harvest ferns, orchids and mushrooms which fetched little income. It was evident from the
discussion with the respondents that no one took responsibility of degraded forest on the top of
Antakarchu mountain which is a primary catchment for the Limtichu stream that drains the
watershed. Elderly respondents expressed how freely and irresponsibly people harvested
resources (timbers, litter, and NTFP). The fragmentation of fields as large as 25 acres into
smaller individually owned fields as small as a langdo26 led to division of irrigation water shares
to multiple users.
26 Langdo is a local unit of land which is a piece of land than can be generally ploughed by a pair of bullock in a day. It is roughly 0.1 Ha.

98
Table 3.15. Evolution of socio-economic conditions and related agro-ecological transformations in Lingmutechu watershed, Punakha District, West-central Bhutan. Agro-ecological transformations Year Socio-economic changes S
ubsisten
ce 27 farm
ing
- Abundance of primary forest and natural resources
- Before 1950
- Feudalistic, scanty villages and migratory population
- Few land owners with large land holdings, producing local red rice varieties
- Shifting cultivators producing meagre maize and millets
1952 - Abolition of serfdom - Land ceiling up to 10-12 ha per household
- Resettlement of people in Nabchee from eastern Bhutan
- Crop diversification – maize, millets, legumes, vegetables
- Clear felling of forest in Nabchee and start of maize
1969 - Start of taxation in the form of cash - Nationalization of forest and natural resources
Se
mi-sub
sisten
ce 28 farmin
g
- Production of varieties of crops for the market to generate income.
- Indiscriminate felling of trees
1979 - Implementation of Land Act which standardized land ownership and tenancy
- Irrigation development programs
- Increased cropping intensity in rice-wheat system
- Conversion of dry land into terraced wetland
- Competition for water resources
1984 - Community participate in rehabilitation of irrigation canals (Maryuwa and Baryuwa channel in 1984 and Omtekha channel in 1986)
- Agriculture research centre in Bajo established
- Efficient water diversion and conveyance to farms
- Introduction of high yielding rice varieties
1987 - Households received technical and material (inputs) support from donor funded projects
- Farmers have access to rural credit with low interest to expand agricultural production
- Cropping intensity and rice yields increase by 30%
- Vegetable production expands to all villages
1991 - Empowerment of people to make decisions on their community plans and programs
- Implementation of national irrigation policy S
em
i-com
mercia
l
- Farmers take responsibilities to manage the local irrigation scheme
- Plantation of community forestry in barren land
1997-99 - Construction of feeder road to Limbukha - Renovation of Limbukha-Dompola irrigation canal
- Abolition of free labour contribution for development activities (gungdawoola)
- Delayed rice planting in Limbukha delays water availability to lower catchment villages
2003 - All households get electric power supply through the rural electrification program
27 A subsistence farm is one that produces food mainly to feed the farm family, with very limited surplus for sale or barter. 28 A semi-subsistence farm is one which produces surplus beyond family’s needs, to sell for regular income (McConnell and Dillon, 1997).
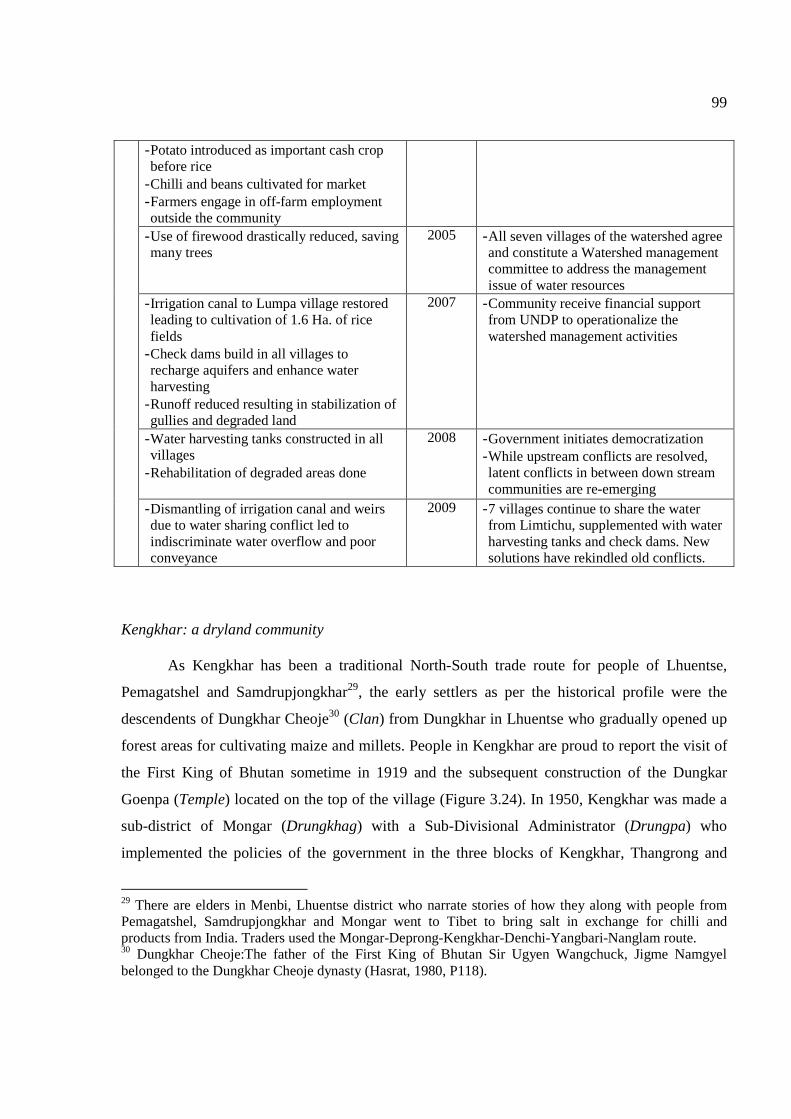
99
- Potato introduced as important cash crop before rice
- Chilli and beans cultivated for market - Farmers engage in off-farm employment outside the community
- Use of firewood drastically reduced, saving many trees
2005 - All seven villages of the watershed agree and constitute a Watershed management committee to address the management issue of water resources
- Irrigation canal to Lumpa village restored leading to cultivation of 1.6 Ha. of rice fields
- Check dams build in all villages to recharge aquifers and enhance water harvesting
- Runoff reduced resulting in stabilization of gullies and degraded land
2007 - Community receive financial support from UNDP to operationalize the watershed management activities
- Water harvesting tanks constructed in all villages
- Rehabilitation of degraded areas done
2008 - Government initiates democratization - While upstream conflicts are resolved, latent conflicts in between down stream communities are re-emerging
- Dismantling of irrigation canal and weirs due to water sharing conflict led to indiscriminate water overflow and poor conveyance
2009 - 7 villages continue to share the water from Limtichu, supplemented with water harvesting tanks and check dams. New solutions have rekindled old conflicts.
Kengkhar: a dryland community
As Kengkhar has been a traditional North-South trade route for people of Lhuentse,
Pemagatshel and Samdrupjongkhar29, the early settlers as per the historical profile were the
descendents of Dungkhar Cheoje30 (Clan) from Dungkhar in Lhuentse who gradually opened up
forest areas for cultivating maize and millets. People in Kengkhar are proud to report the visit of
the First King of Bhutan sometime in 1919 and the subsequent construction of the Dungkar
Goenpa (Temple) located on the top of the village (Figure 3.24). In 1950, Kengkhar was made a
sub-district of Mongar (Drungkhag) with a Sub-Divisional Administrator (Drungpa) who
implemented the policies of the government in the three blocks of Kengkhar, Thangrong and
29 There are elders in Menbi, Lhuentse district who narrate stories of how they along with people from Pemagatshel, Samdrupjongkhar and Mongar went to Tibet to bring salt in exchange for chilli and products from India. Traders used the Mongar-Deprong-Kengkhar-Denchi-Yangbari-Nanglam route. 30 Dungkhar Cheoje:The father of the First King of Bhutan Sir Ugyen Wangchuck, Jigme Namgyel belonged to the Dungkhar Cheoje dynasty (Hasrat, 1980, P118).

100
Chaskar. In 1952 when land ceiling and taxation in cash were introduced in the country, the
household with land holdings of less than 0.1 Ha., were exempted from land taxation (Table
3.16). It was during this time that people from Trashigang, Trashiyangtse and Lhuentse came and
settled in Kengkhar, which the respondents related to people escaping the tax and free labour
contribution to the development activities in their original domicile. It was during this time that
forest was cleared in several areas and scattered settlements were built. People harvested
bamboos to build houses from bamboo mats, and opened up forest areas for cattle grazing. In
1960, two monks31 started making wooden cask (palang) from a locally available tree (locally
named Dongtshushing): Boehmeria regulosa) and wooden mask32 (bap).
Table 3.16. Evolution of socio-economic conditions and related agro-ecological transformations
in Kengkhar, Mongar District, East Bhutan.
Agro-ecological transformation Year Socio-economic changes
Su
bsistence
agriculture
- Abundance of primary forest and renewable resources (including water)
Before 1950
- Feudalistic, few households, shifting cultivation, few crops with low yields
- Few farmers own large land holdings - Large tracks of forest being cleared and burnt for cultivation
1952 - Land ceiling up to 10-12 ha per household - People from Trashigang starts to settle in Kengkhar
- Clearing forest for cultivation, opening large tracks for cattle grazing
- Pressure on water source 1960
- Start of craft making at household level
- Wood carving leads to felling of trees 1963 - School was built in Kengkhar - Cultivation of crops like maize, millet, nigerseed, chilli, legumes in parcels less than 0.1 Ha.
- Cultivation in fallow dryland with maize
1969 - Start of taxation in the form of cash - Nationalization of forest and natural resources
Se
mi-S
ubsistence
- Started production of crops like kidney beans and field beans for the market to generate income
- Indiscriminate felling of trees for woodcraft and house building
- Land slide near Ebee village damaging spring pond and agriculture land
1979 - Implementation of Land Act which standardized the land ownership and tenancy
- Rural water supply scheme implemented under development programs
- Multiple land use systems to maximize crop production
1980-1984
- UNICEF grant for the supply of drinking water
31 Tiku Rinzin from Murung and Tiku Mindu from Shaytongbi started making palang and Lopen Phujay initiated painting in Kengkhar. 32 While the best mask is made from Bombax ceiba, it is commonly made from chirpine (Pinus roxburghii) and in that matter any softwood is used for making mask.

101
- Neglect of catchment area for natural ponds
- Landslides expands in Ebee damaging more forest area
- Expansion of citrus plantation
1990
- Citrus marketing in Pemagatshel started
Se
mi-C
omm
ercial a
griculture
- Cultivation of citrus in dryland and along the farm boundaries, enhance better vegetative cover
- Landslide in Mogola – piped drinking water defunct as landslide damage the spring pond and pipes
1998
- Construction of Basic Health Unit in Kengkhar
- Appreciation of local healing practices, complementing with modern treatments.
- Water share with health facility 2000
- Water source protected, introduction of high yielding maize and vegetable variety, more human resource in the geog
- Protection and rehabilitation of all natural spring ponds in the catchment 2002
- Extension office constructed - Initiated water harvesting using large ponds and plastic drums
- Access to extension advice and guidance in cropping and renewable resource management
- Few check dams/ponds were dug-lined with plastic sheet to collect roof water during rainy season
- People contribute labour to construct 17Km long Larjap Water supply: it is unreliable and non-functional
2005
- Small shop started in Kengkhar
- Neglect of natural spring ponds within the village and catchment area degraded as people fell trees
2007 - Community collectively request to District administration for support to address water supply problem
- Construction of 6 concrete tanks and connecting them with HDPE33 pipe as network to transfer water
- Catchment protection for all operational spring ponds.
2008-2009
- Peer pressure to Block development committee to mobilize people to develop and manage the new tank network
- 6 member tank network management group led by a monk is established
- Community has access to clean water supply scheme
The wooden mask and cask is the trademark of Kengkhar now and forms a major
livelihood source for households. Around same time a local monk, Lopen Phujay started
painting of wooden mask and altar (Choesum). With the start of woodcraft, people
indiscriminately fell trees. In 1963 with the construction of a school in Kengkhar, many children
were forced to the school as parents did not readily enroll them for fear of loosing farm labour.
Most predominant agro-ecological change was the opening of new farm land and the
33 High density polyethylene (HDPE) pipe.
102
introduction of upland crops like finger millet (Eleusine coracana), nigerseed34 (Guizotia
abyssinica), Perilla or Chinese Basil (Perilla frutescens), upland rice, mustard by the resettled
populations.
3.6.2 1970-1990: Government initiatives to agriculture development and semi-subsistence
farming
In the agricultural development of Bhutan this period was the most crucial as enactment
of Land Act and nationalization of forest occurred during the 1970s. Further development of
irrigation occurred, and rural credit and technical support for agricultural production were also
launched during the 1980s to the 90s.
Lingmuteychu: Crop production increase and income generation
The nationalization of forest (Forest Act, 1969) and start of taxation in cash during 1969
induced a major socio-economic change as the (both individual and collective) responsibility to
manage forest resources in and around watersheds as the responsibilities to protect, manage, and
control access to forest was transferred to the forestry department (Wangchuk, 2005). It was
reported that indiscriminate felling of trees and access to forest resource by other communities35
was the starting point of forest degradation and intrusion of primary catchment areas. As rice
growing area, when irrigation development programs were launched by Department of
agriculture (DoA) in 1979, farmers terraced and built bunds in most of the dryland areas under
the terracing program supported by DoA and converted dryland slopes into wetland. During the
3rd Five year plan (1971-76), DoA implemented soil conservation program that promoted
terracing and bunding. Farmers were provided financial support (Nu. 300 for every acre terraced-
bunded. This resulted into expansion of rice cultivation in all six36 villages except Nabchee
where resettled families depended on maize cultivation in dryland fields. Along with rice
cultivation, farmers started cultivating pre-rice chilli in down stream villages and radish and
34 Guizotia abyssinica is an annual herb grown for its seed to extract edible oil and pickling. 35 Within the provision of Forest Act 1979, people from down-stream communities fell trees of their choice based on the permit issued by the forestry officials. Outsiders here imply people/community previously not included as users of the forest resource. 36 Limbukha (including Sirina), Dompola, Omtekha, Matalungchu, Omtekha and Thangu are the villages within the watershed.

103
turnip in upstream villages. Respondents also reported the introduction of rapeseed-mustard and
wheat by DoA as winter crop after rice. With the expansion of paddy fields in the watershed, a
major rehabilitation of irrigation schemes (Maryuwa, Baryuwa and Omtekha canals) involving
beneficiaries for labour and materials from DoA were done in 1984 which helped in improving
the irrigation water conveyance. The rehabilitation of major canals (Figure 3.17) resulted in
diverting all the stream water during rice transplanting season virtually drying up the stream. As
people diverted most water into their rice fields and in absence of tail end water management, the
overflow of irrigation water opened up several gullies leading to land degradation. Even today
one can see the Wangdi-Sengana road blocked by red soil flowing down from Omtekha area.
With irrigation development, provision of technical and material support from DoA and opening
up of local markets, farmers gradually targeted their production to market thus income objective
was driving the agriculture production.
Kengkhar: Sedentary semi-subsistence farming
As woodcraft became popular, timber in the locality became the most sought after
resource. Some respondents related the excessive felling of trees from catchment areas and on
the upper reach, both for construction of houses and woodcraft, as a possible cause for the drying
up of natural springs in Kengkhar. The Land Act 1979 was a major incentive for the farmers in
remote place like this as it provided the legitimate rights to the plots they were cultivating, and it
was during this time people started fencing, protecting and regularly cultivating their fields. Even
today it is a common feature to see live fences with Jatropa (Physic nut: Jatropha curcas) or
other commonly found shrubs. However, as people only had dryland fields, they grew local
varieties of maize, chilli and beans. Household maintained 2-3 cattle heads, cows for milk and ox
for draught power. In Kengkhar farmers use powerful Mithun bulls to plough field with 3-4
males helping the ploughman (Figure 3.39).

104
Figure 3.39: Mithun bulls used for ploughing sloping land in Bhutan.
As the number of households permanently residing increased people started to feel the
insufficiency of drinking water. In 1980, the government, through the rural water supply scheme,
provided materials (pipes and cement) to tap water from Mogola. Under this program, a network
of tap-post was constructed. However, 2-3 years later the source was washed away by land slides
and the scheme became non-functional. People abandoned the scheme including the tap-post
(their remains can be seen in several locations now). The network of pipe water supply scheme
in the area made people complacent, and they tend to ignore the natural springs and their
catchment conditions. Some respondents reported of complete degradation of catchment above
Rotapari spring pond when a land slide washed away the pond in 1983; even now the area has
not been stabilized.
3.6.3 1990-2009: Semi-commercial agrarian systems
This period saw major social, political, and economic changes in the country. Among
them the decentralization and empowerment of community to make decisions at local level
gradually changed the way people managed their farms and resources. While people were made
responsible to manage natural resources, government took up infrastructure development like
building roads, irrigation schemes, schools and hospitals. With modernization and introduction
of television, internet and mobile phones, the need to generate income from farming became a
primary objective. Depending on the location, communities started specialized farming targeting

105
the market. Another fundamental development during this period was the democratization of the
governance and involvement of local population is decision-making processes.
Lingmuteychu: Semi-commercial farming under resource constrained situation
In 1991 coinciding with the start of Block development committee, DoA launched the
National Irrigation Policy (NIP) which transferred the responsibility of managing irrigation
schemes to the beneficiaries. Under NIP, water users associations (WUA) were created for each
irrigation scheme. In the case of Lingmuteychu watershed, WUA never actually took off due to
critical shortage of irrigation water, confusion on administrative jurisdiction37, and the still
prevalent traditional water sharing rules which suited dominant social groups in the uppermost
village. Under the NIP some communities, like Omtekha, started community plantations with
chirpine saplings to protect degraded areas in the catchment. Local Thangu and Wanjokha
communities participated in WUA of Bajo canal38 which was one of the active WUA in the
country and managed the scheme optimally. Although there may not be a formal WUA today,
beneficiaries of Bajo canal still function in a coordinated manner. Despite the severe problem of
irrigation water, agriculturally the sub-watershed has a high potential for crop production within
its diverse agro-climatic zones. Farmers with large land holdings (more than 2 hectares per
household) during this period, coinciding with the technical support in crop production and
marketing, started producing crops for markets, while the small farmers sold their surplus in the
local market. Among the cash crops, potato was introduced in the sub-watershed and farmers
grew it as a pre-rice crop. The 18 km long feeder road from Samthang (diversion from Wangdi-
Shengana road at 6 km from Wangdi town towards Punakha) to Limbukha commissioned in
1997 provided an impetus to commercial production of crops like rice, potato, chilli, beans and
dairy products (Gurung, 2004). Further with the electrification of all households in the sub-
watershed in 2003, the working time was extended by almost 3 hours in evenings and most
importantly it drastically reduced the consumption of firewood as people switched to electrical
37 Among the 7 villages in the sub-watershed, Limbukha, Dompola, Nabchee, Omtekha are under Limbu geog of Punakha district; Matalumchu, and Wangjokha under Baap geog of Thimphu district, and Thangu under Thetsho geog of Wangduephodrang district. 38 Bajo canal brings water from another catchment 9 km east of Wangdi town with its command area in Phangyul, Bajo, Wanjokha and Thangu. As water is hardly ever left in the Limtichu stream during the rice transplanting season, these two lower villages access water from Bajo canal, an arrangement in existence since a long time (no one could give us a rough idea on when and how it started).

106
home appliances. During the same period, to take advantage of the market demand, farmers
formed self-help groups and growers association to produce mushroom and market the produce
collectively. As the conflict in water sharing was escalating, seven communities came together to
institute a watershed management committee (See Chapter 8) which took the initiative for
community mobilization for collective actions to address the watershed management issues
(Gurung et al. 2006). Some of its noteworthy activities are the rehabilitation of a canal in Lumpa
which had been defunct for more than 10 years, while the construction of check dams and water
collection tanks in all villages have revitalized the community for collective responsibility. The
watershed also received financial support from UNDP in 2007 to implement collective activities.
In 2008, when the government launched the democratic process and delimitation of constituency,
Matalungchu was included under Wangduephodrang district while Omtekha was clubbed into
Limbu geog of Punakha district. While this union helped in consolidating the voters for the
democratic process, the latent water sharing conflict between the two villages reached the highest
point with farmers dismantling the water distribution weirs and chasing out the researchers who
were assigned by the district administrators to help resolve the issue (Kuensel, 2009).
Kengkhar: Woodcraft and citrus as major income sources
The south facing slope of Kengkhar is best suited for cultivating mandarin orange. The
traders market oranges from Kengkhar in Pemagatshel. With the production potential and
marketability of orange, DoA distributed free orange seedlings to the farmers. During 1990
almost all households took 5-10 seedlings to plant in their homestead. With the promotion of
citrus, woodcraft and citrus became the principal livelihood sources for the kengkharpas (people
of Kengkhar). Even today, the lack of a motorable road has not deterred the people to
painstakingly take orange in horseback to Pemagatshel and Mongar where they fetch substantial
income. A major blow to the drinking water came in 1998 when the Mogola land slide
completely washed the water source and pipes. With the land slide in Mogola and Rotpari,
people had to go back to the natural spring ponds which were only used for livestock. With
declining spring discharges, the water became a scarce resource as local farmers, government
establishments and students had to depend on the same source. In 2002, agriculture research
initiated rain water harvesting, wherein people constructed large tanks lined with plastic sheets to
harvest rain water and people were trained on roof water harvesting in plastic jars. As a key

107
development need for the community, Mongar district helped community to tap water from
Larjap which is 17 km away. Due to its length and the course it follows along the ridge, the
scheme was irregular with frequent breakdown putting pressure on people for maintenance. This
massive investment did not ease the water problem and once again people had to go back to their
old spring ponds. The democratic process initiated in 2008 provided an opportunity to people to
collectively seek support from research and development agencies to resolve the issue. In 2009
the research centre in Wengkhar (near Mongar district town) helped the community to build
concrete tanks to collect spring water and share it among the tanks by linking them in a network.
This effort has also helped people to collectively restore the catchment areas for respective
spring ponds and manage it sustainably. With the dwindling water resource, people of Kengkhar
had expanded their practice of upland cropping and citrus have become a definite saviour for
them which generates substantial household income.
3.6.4 Characterization of water resource management systems in two sites
These successions of three agrarian systems provide a scope to characterize the water
resource management systems and their evolution in these two sites.
Lingmuteychu: Irrigation system as a lifeline
As in most irrigated systems, prior to the nationalization of forest and institutionalization
of a national irrigation policy, people operated open earthen gravity-fed canals to divert stream
water to their fields within a logic of ‘first-come-first-serve” (Jamtsho, 2002) meaning the early
settlers had greater access and rights to water. The traditional water sharing system framed when
water was plenty and users few appeared sound (Brand and Jamtsho, 2002). Based on field
survey, until 1970 there were only around 75 households in Lingmuteychu cultivating roughly
100 ha of irrigated rice which rapidly increased to 166 households cultivating 179 ha of wetland
terraces in 1996 (RNRRC, 1997), and 206 household cultivating 242 ha of rice in 2008 (Table
3.17 ).

108
Table 3.17. Evolution of irrigation systems in Lingmuteychu, 1950-2009. Variable Components
1950-1979 1979-1996 1996-2009
Resource user size (Households)
75 166 206
Command area - Ha (Ha/HH)
100 (5-10) 179 (1-5) 242 (0.5-1)
Conveyance systems
Earthen canals, in some points wooden troughs and bamboo splits
3 major irrigations canals (10 km): concrete canals with metal flumes, some earthen canals
All canals with cement and metal flumes, except Omtekha canal which is earthen
Construction and maintenance
Farmers constructed canals collectively, maintenance by tenants
Government financed construction of irrigation canals, major maintenance by government and seasonal/regular maintenance by users
Accessing rules “first-come-first serve” early settlers get priority, more access to those who invested in canal construction, upper catchment villages has full rights to divert water, Matalungchu village have access to water that seeps from Omtekha canal, Wangjokha and Thangu use water from another sub-watershed
Institutions related to irrigation systems
Water guard (chusup), assigned annually on rotational basis, monitored irrigation canal and water distribution.
Water user association for each canal was established with government initiative. (but it did not last long)
Water guards per village (or canal), block development committee; in 2005 a Watershed Management Committee (WMC) was put in place
User categories 4 categories (Thruelpa, cheep, chatro, and lhangchu)39 in Limbukha and Dompola; in downstream villages thecategories are based on investment in canal construction and early/late settlers
Conflicts Except for water stealing at plot level no major issue
Multiple users lead to regulated system delay by one user had multiplier effects to subsequent users, water holding and non-release on time. Reduced stream discharge and complete diversion by upper-catchment villages effects lower villages
Conflict resolution systems
Village headman and elders
Water user association (did not function well in the upper sub-watershed), Block development committee, District court and High courts relying on customary laws
State interventions
Irrigation development program and nationalization of forest and natural resources (including water)
Construction of Maryuwa and Baryuwa channels in 1984 and Omtekha channel in 1986, initiation of water user association
Concrete lining of all canals and installation of concrete weirs for water distribution from source and water gates at intake point for secondary canals
Constraints related to water
High conveyance loss and land degradation due to poor tail end water management
Water stealing and inequitable water allocation
Upstream-downstream conflict in water sharing, poor coordination and in-efficient water use systems
39 They are four water sharing categories is Lingmuteychu :thruelpa is entitled to half the flow in the canal (½ of canal flow); cheep is entitled to half of thruelpa (¼ of canal flow); chatro is entitled to half of cheep (1/8 of canal flow), and lhangchu has no entitlement and has to beg for water from other categories.

109
This expansion of rice cultivation is associated with the support provided by the
government in the form of irrigation development, farm mechanization, technological support,
and road construction. With the expansion of the rice area and number of users, the demand and
conflict on irrigation water intensified to a point that communities had to spend long hours of
water guarding as physical damages of irrigation structures occurred. Some respondents
associate the rivalry for water to the social structure that prevailed in the past (Gurung, 2004),
and the nationalization of irrigation systems disregarding the traditional arrangements which
were crafted to suit the local context. For instance until the 70s, irrigation systems were managed
locally by community assigned water guards who were rotated annually among all households.
While village to village water sharing was managed by groups of village elders, disagreements
were resolved amicably within the sub-watershed. However, with the introduction of the NIP,
farmers felt detached from the responsibility of managing the systems and waited for the
government assistance to rehabilitate the scheme, as in the case of the Lumpa irrigation canal
during the last decade40 (Gurung et. al., 2006.).
Kengkhar: Drinking water system
The crisis of drinking water in Kengkhar became apparent when several natural springs
dried up due to land slides, expansion of agriculture farms and poor maintenance of the
catchment. As the population increased from around 72 inhabitants in 1950s to 310 inhabitants
in 2009 the settlement area expanded to a point where the catchments of some natural springs
also came into cultivation, while in some cases trees were fell for house construction leading to
degradation of forest and subsequent land slides. Considering the small size of the user group
there is no social strata in terms of accessing water and all have equal rights to access water from
any tank (Table 3.18).
40 Lumpa is a small hamlet under Omtekha village with approximately 2.8 Ha. of paddy fields. The 4 km irrigation canal became non-functional after the discharge at source reduced to bare minimum and the canal started to crack in several points, the paddy fields had been left fallow for 10 years.

110
Table 3.18. Evolution of drinking water system in Kengkhar.
Variable Components
1950-1970 1970-2000 2000-2009
Resource user size
12 farming HH, 3 officials HH, 100 school children
30 farming HH, 9 officials HH, 175 school children
52 farming HH, 20 officials HH, 350 school children
Resource supply system
20 springs with open ditch or wooden trough next to natural spring pond
10 natural springs, Piped water supply (dysfunctional after 3 years), check dams and open tanks to collect rain water
5 natural springs, 17 Km piped water (unreliable, frequent breakage and costly to maintain), concrete tanks and network after 2009
Command population
184 persons + 60 livestock 391 persons + 150 livestock 742 persons + 260 livestock
Conveyance systems
Fetch from the spring pond and livestock drink directly from the pond
Fetch from the pond. In Kriapo used pipe to take water from private pond, rural water supply scheme
Collect spring water in concrete tank and use tap, tanks are connected to share water from upper to lower tanks
Construction and maintenance
Open access, dug a pond to trap spring water, in some places wooden trough used to collect water
Government financed construction of water supply scheme, major maintenance by users
Government project financed construction of water tank and its network, managed by a 6 member user group
Accessing rules Open access and rely on the“first-come-first serve” rule Institutions related to water supply systems
None Management group with support from RNR office and geog administration
Constraints related to water
Difficult to fetch water, long hours of wait and walk
Spring ponds drying and water brought in pipe from distance places become non-functional and costly to maintain
However, a general norm which people follow is first to visit the tank closest to the
respective hamlet and go to the next in case the first one is dry. While customarily everyone is
supposed to directly access from the spring pond there is one household in Kriapo who owns a
private tank next to his house connected to a spring pond some 500m away. The lack of
durability of different interventions in the past was attributed to the non-involvement of
beneficiaries in finding solution and assignment of management responsibilities. In the most
recent case of the 17 Km water supply scheme originating from another block, beneficiaries are
faced with the problem of the long length of pipe to maintain that passes through difficult terrain.
In the process of bringing water from distant locations outside the community in the past, people
neglected the natural spring ponds and their catchments within the community.

111
3.6.5 Extent of socio-economic differentiation among households
The transformation of these two agrarian systems from a feudalistic period in the 1950s
to self-managed semi-commercial farming after the 1990s has led to the emergence of distinct
categories of farmers characterized by discrete socio-economic features.
Lingmuteychu: productive assets and income differentiation
Socio-economically the present farming households can be classified into four distinct
types which have influence on the way the water resource is used and managed. Based on
common criteria, 50 households (survey sample) can be categorized into four main types as
follows:
Type A: This group represents the resource poor farmers who own 0.5 ha of land of
which wetland area vary from 0 to 0.3 ha (Figure 3.40). They have 1 to 3 farm labour to work
and a meagre herd of 2 heads of cattle to operate their small farm. There is one household in the
group who does not possess both land and cattle, this household is dependent on Type A and B.
The livelihood sources of these households depend predominantly on crops (62%) and off-farm
employment (19%). Remittances from in-laws working outside the district account for 13% of
their total income. Sale of dairy products, ferns and mushroom harvested from the wild provide
roughly 3% of the overall income. Households grow seven different types of crops, using local
varieties and traditional methods which lead to lower physical productivity. In general they
devote 51% of the arable area for irrigated rice cultivation and 26% for maize. Other crops are
raised as preceding or succeeding crop to rice or maize. 25% of the farmers in this group lease in
on an average 1.7 ha of rice field on a share cropping basis. The one landless member in this
group always leased in 1.2 ha of wetland from a Type D farmer. 16% of the HH belong to this
type.
Type B: With 44% of the farmers in this group, it is a common category in the sub-
watershed with small farms and multiple owners depending on the water resource. This group
also owns less than 1 ha of total arable land and irrigated rice fields. On average they rear 3 cattle
for milk and draught power. Growing eight types of crops, and selling them in local market
generates 70% of the average annual household income of US$ 560. As Type A, they also

112
engage in seasonal off-farm employment in nearby construction sites and earn around 15% of the
annual income for this source. There is one household who weave to earn extra income for the
family. Smaller income is also generated by sale of dairy products and NTFP. More than 45% of
farmers from this group lease in wetland from Type C and D and share crop 1.1 ha of rice on
average. As most land owners prefer it, the sharecroppers grow quality rice, and they sell their
share fetching substantial income.
Type C: They represent economically stable group with larger land holding ranging from
1.2 to 1.9 ha. This group has maximum farm labour of 3 to 7 heads who work in their farms.
85% of the household income comes from the sale of crops like rice, wheat, maize, potato and
mustard. With larger parcel size, adequate cattle herd (average of 5 heads per household), and
working hand they try to maximize their agricultural production. According to the respondents of
this group, among all groups their productivity levels are generally higher compared to others as
they have animals to produce farmyard manure and the workforce to take care of the crops. They
also generate household income from off-farm employment (6%), remittance (4%), sale of wild
ferns and mushroom (3%), and dairy products that contributes 2% of their total annual income
averaging US$ 585. Even in Type C, there are 20% of the farmers involved in share cropping.
Type C comprise of 24% HH in the sub-watershed.
Type D: With 16% of the farmers in the group, they represent the most affluent group of
the locality. They are traditional elite families who have large land holdings (3 to 6 ha of
wetland) and herds of cattle (7 to 12 heads of cattle) which are traditionally associated to the
wealth of the household. With higher proportion of wetland, they grow rice in almost 70% of
their arable land and the remaining is devoted to other crops. Their average annual income is
US$ 815 which is predominantly generated by selling rice (80%). It was reported that most of
the grain received from sharecroppers are either directly sold as rough rice from the field or
milled and marketed in Thimphu, Punakha or Wangdue markets.

113
Figure 3.40. Present farmer typology in Lingmuteychu, 2009.
Land holding
0 to 0.5 ha
Land holding
3.0 to 5.6 ha
Land holding
1.2 to 1.9 ha
Land holding
0.5 to 1.0 ha
Rice47%
Wheat1%
Mustard5%
Maize33%
Potato11%
Chilli2%
Radish1%
Rice40%
Wheat9%
Mustard9%
Maize12%
Potato18%
Chilli4%
Radish3%
Buckwheat5%
Rice30%
Wheat14%
Mustard14%
Maize21%
Millet5%
Potato11%
Chilli5%
Rice48%
Wheat14%
Mustard9%
Maize9%
Potato11%
Chilli5%
Radish4%
Wetland 0-0.3 ha
Farm labour 1-3 Types of crops and proportion
of cultivated area
Wetland 0-1.0 ha
Farm labour 1-6Types of crops and proportion
of cultivated area
TYPE A
TYPE B
Wetland 0.4-1.6 ha
Farm labour 3-7Types of crops and proportion
of cultivated area
TYPE C
TYPE D
Types of crops and proportion
of cultivated area
Wetland 3.0-5.6 ha
Farm labour 2-6
Proportion of annual income from
different sources
Proportion of annual income from
different sources
Proportion of annual income from
different sources
Proportion of annual income from
different sources
Cattle Herd
0 to 4
(Avg. 2)
Cattle Herd
0 to 3
(Avg. 3)
Cattle Herd
3 to 7
(Avg. 5)
Cattle Herd
7 to 12
(Avg. 9)
Crops62%Off-farm
19%
Livestock3%
Remittance13%
NTFPs3%
Annual income US$ 225
No weaving
Crops70%
Off-farm15%
Livestock3%
Remittance9%
NTFPs2%
Weaving1%
Annual income
US$ 560
Crops85%
Off-farm6%
Livestock2%
Remittance4%
NTFPs3%
Annual income US$ 585
No weaving
Crops80%
Livestock4%
Remittance16%
Annual income
US$ 815
No off-farm, NTFPs, and weaving

114
Kengkhar
Based on the semi-structured questionnaire survey of 55 villagers and household visits,
the present households can be categorized into three main socio-economic types as follows:
Type A: Majority of farmers (45%) fall within this group (Figure 3.41). They represent
the resource poor group who farm less than 1 ha of land. With maximum family size of 2 to 7
they earn 42% of their annual income by transporting goods from Kengkhar to Gyelposhing, a
distance of 8 hours of brisk walk. Carrying a load of 20 kg they earn US$ 3 for one-way, which
is equivalent to one day wage. Second most important source of income is woodcraft
contributing 40% of their average annual income of US$ 383 (minimum of US$36 and
maximum of US$ 1357). Many of them do carpentry and make altar and cabinets. Some sell
vegetable and citrus generating 10% of the income. While all farmers own and operate dryland
fields, only 39% of them have planted citrus orchards.
Type B: Type B farmers are more skilful in making wooden mask and cask, which are
sold at US$ 34 a pair, and earns 43% of the annual income of US$ 433 on average (minimum of
US$22 and maximum of US$ 2776 They also have small land holding (0.1 to 1.2 ha), but all
cultivate dryland and 62% of them own citrus orchards. As in the case of Type A farmers, the
sale of crops contribute only 10% of their annual income. As they own mules and 2-5 family
members residing in home, portering form a second important income source generating 26% of
total income. 32% of the local HH fall into this type.
Type C: They are the prosperous group owning 2 to 4.5 ha land of which 60% is dryland,
26% tseri and 10% planted to citrus orchard. Only 23% of the local farmers fall into this group,
whose principal sources of income are crops (oranges for 53%) and remittances (38%). As they
own mules, while they transport their goods to market, they also transport goods on payment.
Portering earns them 9% of their average annual income of US$ 506 (minimum of US$265 and
maximum of US$ 745). As in Type A and B, all farmers in this group own and operate dryland
and 89% of them also have citrus orchards.

115
Figure 3.41. Present farmer typology in Kengkhar. 2009.
Dryland Holding
0.1 to 0.7 ha
(59% of total land)
Family Size
2-7 Proportion of farmers
cultivating different landuseProportion of annual income from different sources
Dryland Holding
0.1 to 1.2 ha
(55% of total land)
Family Size
2-5
Proportion of annual income from different sources
Dryland Holding
0.4 to 4.0 ha
(60% of total land)
Family Size
3-6Proportion of annual income from different sources
TYPE A
TYPE B
TYPE C
45% of Farmers
33% of Farmers
23% of Farmers
Crop 10%
Dairy 3%
Woodcraft 40%
Porterage 42%
Remittance 5%
Avg. Annual income
US$ 383
Proportion of farmers
cultivating different landuse
Proportion of farmers
cultivating different landuse
Crop 10%
Dairy 0%
Woodcraft 43%
Porterage 26%
Remittance 21%
Avg. Annual income
US$ 433
Crop 53%
Dairy 0%
Woodcraft 0%Porterage 9%
Remittance 38%
Avg. Annual income
US$ 506
Dry land 100%
Tsheri 50%
Kitchen Garden
39%
Orchard 39%
Dry land 100%
Tseri 69%Kitchen
Garden 54%
Orchard 62%
Dry land 100%
Tseri 78%
Kitchen Garden
67%
Orchard 89%

116
3.6.6 Sequences of agrarian systems in both sites
The pace at which the transformations of the agrarian systems occurred over the last 6
decades in these two sites varies considerably. Prior to the 1950s, in the midst of primary forest,
people practiced shifting cultivation and reared large herds of cattle. After government initiated
official enumeration of population and registered the land they tilled, people gradually started
sedentary farming using local varieties and traditional practices. The progression from
subsistence farming to semi-commercial farming has primarily happens to satisfy the social
needs (Trébuil, 1989) influenced by the changing social, ecological, economic and political
environment.
Lingmuteychu: three successive agrarian systems leading to increased farmer differentiation
A small sub-watershed with sparse population was endowed with abundant natural
resources and fertile land. Elders narrate of the time not very far into the past, when there was no
tension on use of water or accessing forest resources. With the increase in population and
commercialization, there is competition in accessing resource, producing best quality, and
securing the maximum price and income. People narrate that the shift from use of traditional
method of crop production and animal rearing systems to modern methods happened so rapidly
that some farmers are trapped in the absence of old systems and cannot afford modern farming
methods.
Although a majority of the farmers operated subsistence farms, they were self-sufficient
in food. With basic food produced within their farms dependence to external sources was rare.
As the market opened in nearby towns and need for cash to pay tax, buy clothes and household
items, the subsistence farming evolved into semi-subsistence during the 1970 (Table 3.19). With
the objective to produce more (surplus), people started looking for production techniques which
could enhance their productions. The support from government in terms of free seed, chemicals
and advisory services gave thrust for the change from subsistence to semi-subsistence. To
maintain the income people increased the cropping intensity, which lowered the productivity
level of the farm. With decreasing livestock population and reduced farm yard manure, people
depended on chemical fertilizers to improve soil fertility. In the 1990s, with the farm road
constructed in the area and access to subsidized farm tools and machineries, the drudgery of

117
farming was greatly reduced. However, as the dependence on external inputs and services
intensified the need for cash to pay went up. Therefore to generate higher income, there was a
gradual move to semi-commercialized agriculture. Farmers introduced crops like potato and
vegetables which could be sold readily and fetched high prices. They even started to grow low
yielding local rice (red pericarp and white japonica type with mild aroma) specifically for niche
markets. While the local red rice cost around US$ 1/Kg imported common rice cost only US$
0.6/Kg. As they fetch high price, there are instances when farmer sell all the traditional rice and
buy cheaper imported rice for their daily consumption, this is a strategy adopted to supplement
the income gap.
Table 3.19 Sequence of agrarian systems in Lingmuteychu sub-watershed, West-central Bhutan.
AS Variable Components
1970 1990
Subsistence Semi-subsistence Semi-commercial Ecological events Extensive prime forest with
tracks of wetland in flat areas and dryland in gentle slopes
Expansion of cultivation areas into forest, conversion of dryland into wetland, diversion of stream
Patchy forest area, reduced stream discharge, degraded areas, and barren land
Means of production
Local varieties, manual tools, draught animals, earthen canal/wooden trough, farmyard manure, traditional methods
Local and few modern varieties, farmyard manure supplemented with chemical fertilizer, manual tools, draught animals, concrete canals
Improved varieties with few local varieties, farmyard manure with chemical fertilizer, chemicals, hand tractors, improved hand tools, few draught animal
Techniques applied
Integrated crop-livestock-forest systems, slash and burn in dryland fields, irrigated rice-fallow systems
Use of modern varieties and recommended production practices, rice-wheat /vegetable cropping system, fertilizer and pesticides used
Mechanization of farm (Power tillers for ploughing and transportation, electric operated rice mills), semi-wet bed nursery and poly-tunnel nursery for rice.
Production 1 rice crop a year in irrigated field and 1 crop of maize in upland fields and chilli, dependence on wild vegetables, roots and fruits
Wheat, oats, mustard, vegetables as new crop following rice and maize
Potato and vegetable crops like cabbage, beans, lettuce following rice in irrigated field and after maize in upland fields.
Demographic pressure
13 inhabitants/Sq km (75 HH estimate by village elders)
29 inhabitants/Sq km (166 HH in 1996)
36 inhabitants/Sq km (206 HH in 2009)
Marketing conditions
Bartering, family exchange Use of mules to carry rice, wild vegetables and fruits to local markets in Wangdue and Punakha towns
With motorable roads buyers come to the village, rice and vegetable taken as far as Thimphu and Phuntsholing, even participate in auction of vegetables in Phuntsholing
Farm supplies (inputs, equipment)
Forest litter and compost carried manually/mules, farm tools locally made by village craftsman
Inputs supplied by District agriculture extension
Inputs (fertilizers, seed) sold by agriculture commission agents, pesticides by extension staff, tools and

118
machinery by agriculture machinery centre
Rural credit patterns
No monetary credit system, exchange of input with labour
Individual rural credit system supported by BDFC (Bhutan Development Finance Corporation), available at district
Agricultural credits available from different financial institutions/banks, easy access for group lending
Land tenure patterns
Large land holding by elite families operated by serfs or tenants on fixed rents
Most own land but there is disparity, higher proportion of wetland to dryland, sharecropping (50:50, or 75:25)
Share cropping by those having farm labour; mechanization (power tiller) helped in reducing labour requirement
Labour market Family labour of the tenants, community labour during peak season (group operation in turns)
Hired labour used for transplanting and harvesting rice
Hired machinery and labour
State interventions
Eradication of serfdom, introduction of land ceiling, land grants to those landless and resettlement
Training, supply of new crop varieties, fertilizers and pesticides, marketing support, subsidy
Subsidy, marketing support, credit and institutionalization of collective/cooperative farming, link with tourism
Farmer income, productivity
Non-monetized production, self sufficiency
Rice production predominantly subsistence, vegetable for market, some surplus rice being sold in local towns.
Red rice and potato as principal income sources fetch (US$ 1/kg of rice and US$ 0.5/kg of potato), off-farm employment lucrative
Extent of farm differentiation
Very low High High
Kengkhar: Gradual agrarian system change
In contrast to swift change over in Lingmuteychu, the transformations in Kengkhar were
gradual (Table 3.20). In the early 1950s when the national level registration of citizens was done,
elders narrate the presence of scattered households in most gentle slopes close to the natural
spring ponds. In the middle of thick mixed-broadleaved forest there used to be 10-12 open space
where people built houses and did farming. The practice of slashing and burning large tracks of
forest during January to April was common. Now in his 70s, an elder respondent expressed with
excitement the blazing fire line spread he watched at night. As the productivity of shifting
cultivation was low, farmers looked for fertile patches in the forest, cleared and did farming
there. Moving around with herds of cattle, everyone produce enough to sustain their livelihood.
With nationalization of forest and land reform policy, the operational space for the community
drastically reduced, and they gradually started cultivating their designated plots with low
yielding traditional crop varieties. As the productivity of land was low and access to modern
technology limited, people expanded the woodcraft trade and currently around 80% of

119
households depend on woodcraft for their livelihood. With the small boom of the woodcraft
industry linked to the expanding tourism industry at the national level, the major effect has been
over harvesting of trees from the nearby forest. Opening the forest area in such terrain has
accelerated drying of spring ponds and in some fragile areas land slides washed away spring
ponds. As upland crops like maize and millets yields were low, with the support of the
Department of Agriculture they introduced mandarin orange during the early 80s, which has now
become the principal cash crop in Kengkhar. Currently 83% of households grow orange in areas
ranging from 0.1 to 0.8 ha per household. Although there is no road connection to Kengkhar, yet
people tirelessly bring their orange on mules to Mongar and Pemagatshel markets. Apart for
economic benefit from orange, extension officials in the area say that orange plants have helped
in increasing the tree cover. With the two principal sources of income, people now operate a
semi-subsistence farm all striving to produce surplus for market. In the early 2000s, when the
government decided to develop a major North-South national highway between Gyelposhing and
Nanglam41 (GNHC, 2008a) which passes along the Kurichu river at the lowest reach of
Kengkhar, the community submitted a petition to the District requesting a farm road.
Subsequently the area development project42 agreed to support its construction in the 9th plan
(2002-2007). As the construction of the national highway got delayed by 2-3 years, the
construction of the farm road could only start in 2009. The success of citrus production and the
established market for woodcraft are boosted with the approval of road. In fact since 2000,
orange plantation on a small scale was taken up by all households. There is one progressive
farmer, who has devoted most of his area into a commercial nursery for citrus and Boehmeria
regulosa (tree species preferred for making top quality palang-cask). As farmers operate semi-
commercial farming systems, there is going to be two major differentiation features between
those dependent on woodcraft (Type A and B) and those specializing in citrus production (Type
C) who currently earn 53% of their annual income from mandarin oranges.
41 Nanglam is a Sub-district of Pemagatshel district and is an important town connecting to Assam in India. 42 An area development project under the MoAF – Agriculture Marketing and Enterprise Promotion Program (AMEPP) sponsored by the International Fund for Agriculture Development (IFAD) support most agriculture development activities in the Eastern region (6 districts in the East).
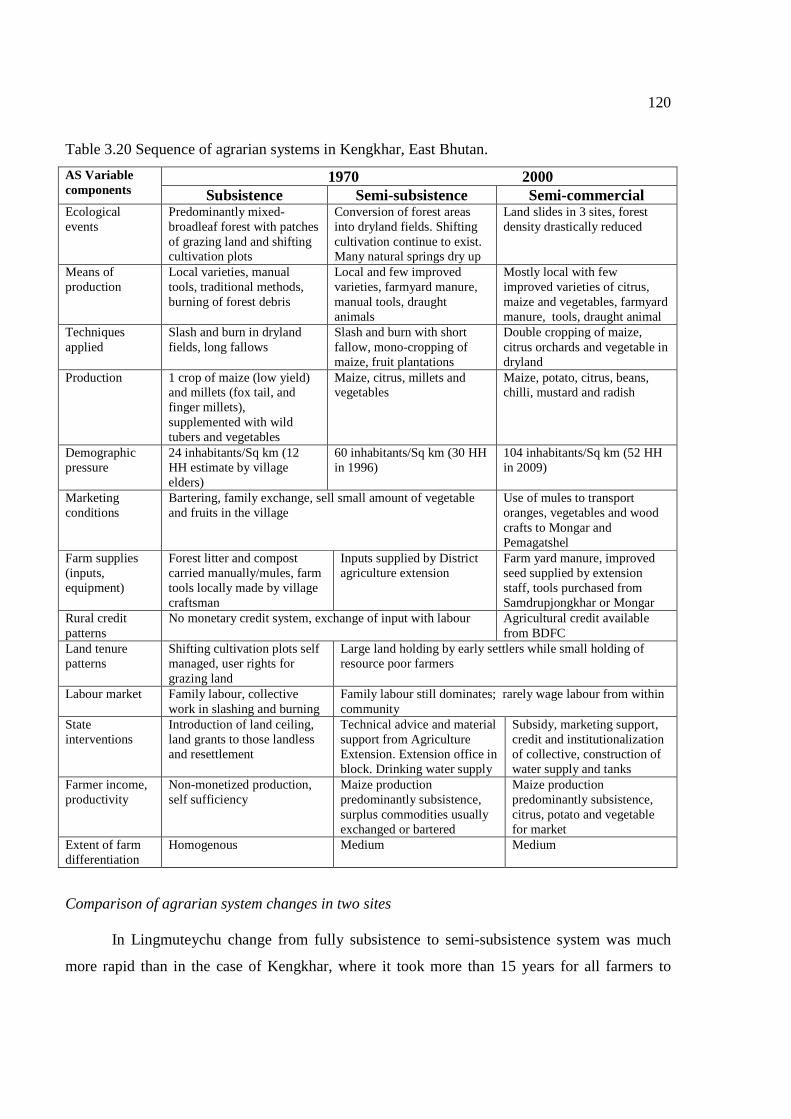
120
Table 3.20 Sequence of agrarian systems in Kengkhar, East Bhutan.
AS Variable components
1970 2000 Subsistence Semi-subsistence Semi-commercial
Ecological events
Predominantly mixed-broadleaf forest with patches of grazing land and shifting cultivation plots
Conversion of forest areas into dryland fields. Shifting cultivation continue to exist. Many natural springs dry up
Land slides in 3 sites, forest density drastically reduced
Means of production
Local varieties, manual tools, traditional methods, burning of forest debris
Local and few improved varieties, farmyard manure, manual tools, draught animals
Mostly local with few improved varieties of citrus, maize and vegetables, farmyard manure, tools, draught animal
Techniques applied
Slash and burn in dryland fields, long fallows
Slash and burn with short fallow, mono-cropping of maize, fruit plantations
Double cropping of maize, citrus orchards and vegetable in dryland
Production 1 crop of maize (low yield) and millets (fox tail, and finger millets), supplemented with wild tubers and vegetables
Maize, citrus, millets and vegetables
Maize, potato, citrus, beans, chilli, mustard and radish
Demographic pressure
24 inhabitants/Sq km (12 HH estimate by village elders)
60 inhabitants/Sq km (30 HH in 1996)
104 inhabitants/Sq km (52 HH in 2009)
Marketing conditions
Bartering, family exchange, sell small amount of vegetable and fruits in the village
Use of mules to transport oranges, vegetables and wood crafts to Mongar and Pemagatshel
Farm supplies (inputs, equipment)
Forest litter and compost carried manually/mules, farm tools locally made by village craftsman
Inputs supplied by District agriculture extension
Farm yard manure, improved seed supplied by extension staff, tools purchased from Samdrupjongkhar or Mongar
Rural credit patterns
No monetary credit system, exchange of input with labour Agricultural credit available from BDFC
Land tenure patterns
Shifting cultivation plots self managed, user rights for grazing land
Large land holding by early settlers while small holding of resource poor farmers
Labour market Family labour, collective work in slashing and burning
Family labour still dominates; rarely wage labour from within community
State interventions
Introduction of land ceiling, land grants to those landless and resettlement
Technical advice and material support from Agriculture Extension. Extension office in block. Drinking water supply
Subsidy, marketing support, credit and institutionalization of collective, construction of water supply and tanks
Farmer income, productivity
Non-monetized production, self sufficiency
Maize production predominantly subsistence, surplus commodities usually exchanged or bartered
Maize production predominantly subsistence, citrus, potato and vegetable for market
Extent of farm differentiation
Homogenous Medium Medium
Comparison of agrarian system changes in two sites
In Lingmuteychu change from fully subsistence to semi-subsistence system was much
more rapid than in the case of Kengkhar, where it took more than 15 years for all farmers to

121
make the change. State interventions and access to supports helped the speedy change in
Lingmuteychu while the remoteness constrained the shift in Kengkhar (Figure 3.42). As the
decentralization was launched, a motorable road was built followed by electricity and telephone
connections to Lingmuteychu. In fact the road was the principal driver for commercialization.
While the market demand for wooden mask, cask, altar, and late season citrus from Kengkhar is
high, the lack of road and reduction of porters are deterrent to shift over a semi-commercial
system. Although gradual the trend is picking fast, as government has approved a 5 Km farm
road from Jimjurung to Tongla from where it is gentler and takes only 3 hours on foot to reach
Kengkhar.
Figure 3.42. Comparison of chronological change over of agrarian systems in the two sites.
As stated in earlier section, change-over is also influenced by accessibility to information
and external inputs/services. For instance farmers in Lingmuteychu benefit from prompt support
services and are more equipped to swiftly react to the market forces. Being next to the satellite
town of Wangduephodrang and the capital, people are more aware of the policies within which
they manoeuvre to maximize their objectives. In other words they have higher bargaining power.
1950 1970 1990 2009
Subsistence agriculture Semi-Commercial agricultureSemi-subsistence agriculture
Kengkhar
Lingmuteychu
Proportio
n of fa
rmers changing th
eir p
roductio
n systems
10
90
80
70
60
50
40
30
20
10
90
80
70
60
50
40
30
20
Year
A.S 1
A.S 1
A.S 2
A.S 2
A.S 3
A.S 3

122
In contrast, people in Kengkhar are deprived of the opportunity of access to services and
information. When farmers are not confident on the outcome of development efforts, they
continue to maintain old practices. Some glaring examples are (i) 63% of the farmers still
practice shifting cultivation despite the ban introduced in the 1980s and exclusion of this land
use type in the record from 2007, and (ii) the presence of wooden trough next to the natural
spring pond. The sequence was also different in the two sites, mainly because livelihood sources
vary between them, rice in Lingmuteychu and woodcraft in Kengkhar.
3.6.7 Importance of the water resource issue and corresponding relevance of different types of
stakeholders
Consultation with different stakeholders to outline their relative importance and influence
to the problem of water (Figure 3.43) helped in eliciting the position and role each stakeholder
could take. The stakeholder with the highest stake are the Type C and D farmers in
Lingmuteychu and all farmers in Kengkhar, as the resolution of the problem lies on how they
organize and manage the resource. In the case of Lingmuteychu, Type A and B farmers have
small wetland holdings and do sharecropping, although the issue is highly important, they have
low influence to address the issue. Similarly, downstream farmers are most affected by the
conflict however they have low influence as they represent late settlers in the sub-watershed. In
both sites, research and development agencies that have been playing a mediator role too have
very minimum influence, rather they are considered as source of support for development
activities.
While the government institutions do not appear as stakeholder in Lingmuteychu, all such
establishments in Kengkhar have substantial influence on the issue. For instance the health unit
through their hygiene and sanitation program can enhance the awareness on how clean water
enhances hygiene and sanitation. Similarly, RNR extension collectively can mobilize farmers in
scientifically managing catchment areas and enhance aquifer recharge. The travellers, for whom
the issue in not important, have a tremendous influence on it as respondents often blame
travellers for dirtying or damaging the natural springs. In fact after the construction of tank and
network, breakeage of several taps were blamed to the travellers. The newly formed watershed

123
management committee in Lingmuteychu, is expected to have high influence on the issue. With
the mandate of water resource, the National Environment Commission through enactment of Act
and Policy has significant influence on how such issues on water are resolved.
Figure 3.43. Importance of resource issues and corresponding relevance of different stakeholders.
While the resources at stake in two sites are the same, the purposes are different. While
water is a direct input to the household in Kengkhar, it is used as a mean to produce irrigated rice
on terraces in Lingmuteychu, providing two critical perspectives of water as a multifunctional
resource. The differentiation among resource users in Lingmuteychu are discrete and
traditionally ingrained in the society, which acts as a barrier for negotiation. Further the single
source of resource poses yet another issue of jurisdiction. To add to the complexity, there is a
traditional rule that favours few “powerful” households which the favoured group always tussle
to uphold. In contrast with no clear differentiation among farmers in Kengkhar which directly
influence the resource in question, it is a case of collective problem. As water needs for
Kengkhar farmers is basic, the issue impinges directly to their livelihood. Looking for solutions
outside and in different watershed has lured away the focus from managing the vital resource
base (natural spring and aquifer) within the community. Even after investing a huge budget to
INFLUENCE
Low
High

124
bring water from distant places, in the absence of beneficiary responsibility to manage the supply
scheme and catchment, it has become a temporary and short lived achievement.
The analysis and lessons of past agricultural transformations in these two sites provide a
prospect for application of a broad-based and all-inclusive research approach. Broad based as it
should encompass all issues arising from the renewable resource in question and inclusive to
include all stakeholders within the context. To further enhance the understanding of water
resource and its management issues a broader SES in integrated water resource management is
considered beyond agrarian systems centred on agriculture. A detailed analysis of water
resources status and prospects is presented in the following chapter.

125
CHAPTER 4
BHUTAN: WATER AS VITAL RESOURCE – CHANGING DYNAMICS
Water for a Buddhist is more an element of life than a mere infinite renewable resource.
Buddhists believe that the nature is composed of four elements (jung-wa-zhi) which are revered:
soil (sa), water (chu), fire (mey) and air (luung) (RSPN, 2006). As a revered abundant renewable
resource, water has not only helped the nation to sustain its cultural heritage but also helped in
earning much needed capital for nation building, a true lifeline for Bhutan. Thus water has an
explicit significance to ecological, social, cultural, economic and political spheres of Bhutan. The
detailed accounts on the cultural perspective of water are given by Zürcher and Choden (2004) in
their book Bhutan-Land of spirituality and modernization: Role of water in daily life.
4.1 Multi-functionality of water
Socio-cultural function
Water forms an integral part in the belief systems and rituals of both Vajrayana
Buddhism and Hinduism in Bhutan. As a natural resource accessible to all including the poorest
of the poor, water is especially important as a symbol of offering in household altars and
temples. In a Bhutanese household the day starts with water offering in the altar and ends with
emptying the water bowls. Water offerings in seven bowls represents water for washing face
‘argam’, water for washing feet ‘pangden’, flower ‘peupey’, incense ‘dugpoe’, light ‘alokey’,
perfume ‘gyendhen’, and food ‘niuti’ (RSPN, 2006). Culturally water is considered as a medicine
and is associated with cleansing and purification (Zurcher and Choden, 2004). The age old
tradition of sprinkling water with the peacock feather in all religious proceedings in both
Buddhism and Hinduism to signify consecration is still practised. In today’s globalized
technology driven world affairs, Bhutanese still associate water with divinities, spirit, and
demons (ibid.). For instance, the myth of serpent (lu) in lakes and water bodies as a Buddhist
belief and the Hindu belief of water sources and springs as site of deities (devithan) are innately
woven in the social systems. One of the common uses of free flowing water is to turn the prayer
wheels (Figure 4.1) which are a common sight in rural areas. The sight of brightly painted water
driven prayer wheels often with a sound of brass bell that hits every rotation the wheel makes,

126
add sanctity to the environment. The reverence of water has indirectly helped in building a
society and nation that is conscious and invests in the conservation of renewable resources.
Figure 4.1. Prayer wheel driven by free flowing water – a common sight in rural Bhutan.
The country is also known for its hot springs (tshachhus), hot stone baths (menchhus) and
clean spring water (drupchhus) for consumption (Figure 4.2). The local residents use these hot
springs as part of their traditional treatment for diseases and physical ailments. The well known
hot springs in high demand are found in Gasa, Punakha, Lunana, Bumthang, Gelephu, Zhemgang
and Trongsa (not functional) Dzongkhags. There are also a number of hot stone baths using
spring water in various places that are popularly used by the locals for healing purposes
including rest and restoration.
Figure 4.2. Hot spring in Gasa, hot stone bath in Punakha, and clean spring water in Bumthang.

127
Economic aspects
A landlocked nation opened only to the rest of the world in the early 1960s started the
pace of development with pristine forest and traditional society. Bhutan has been blessed with
abundant water resource which has accelerated the pace of development. With only 17.7% of
arable land suitable for irrigated agriculture and 20% of population cultivating irrigated wetland
(PPD, 2009), water acts as a vital resource for irrigated rice growers. Rice being the staple crop
and with only 50% self sufficiency at the national level, increase in rice production has been a
farfetched vision of the agriculture sector (GHNC, 2008b).
With limited use of the water from the major river systems in agriculture, the role of
water in hydro-power generation is indeed the most alluring and pragmatic use for Bhutan. Apart
from providing cheap electricity to people, hydropower projects earn about US$ 234 million in
2008 from export of electricity to India (NSB, 2009).
The rivers flowing through a narrow meandering course and with limited accessibility
offers adventurous locations for recreational kayaking and rafting. Tourism is an important
revenue earner (US$ 29 Million in 2007) in the country (GNHC, 2008a). With the plan to
increase its share in the national revenue, water sport is considered as a new and potential
product to attract tourists (Figure 4.3).
Source: North West Rafting Company, 2011.
Figure 4.3. Water Rafting in Paro chu in Bhutan.

128
Bottled spring water is fast becoming a lucrative business. Currently mountain spring
water is bottled in Thimphu by Bhutan Agro Industries and Kurje Drubchu bottled in Bumthang
by Himalayan Dew. Although there is no data on production and marketing of bottled water
mainly due to the import of bottled water, with the availability of natural springs and demand for
bottled water its production is expected to increase.
Bio-physical aspects
Originating from glacial lakes in high Himalayas the major river systems have incised the
country into deep gorges (Figure 4.4) with narrow valleys through which it meanders down
South to drain into the Brahmaputra in India. In addition to the four major river systems (Figure
4.11), small perennial and seasonal streams too have changed the landscape. Traditionally
watersheds have been used to demarcate regional and district boundaries. It is also remarkable to
note that each district has a major river system flowing through it, probably it would not have
been done deliberately but it gives a sense of delimitation of administrative jurisdictions based
on natural resources.
Figure 4.4. Meandering river in Trashigang district, Eastern Bhutan.
The water bodies, particularly marshy wetlands in high altitudes serve as habitat for
wildlife. The Phubjikha and Bumdelling valleys are breeding grounds for globally threatened

129
black-necked cranes Grus nigricollis that roost in large numbers during winter. Although it has
not been properly assessed, there are 50 freshwater fish species in Bhutanese rivers. The main
indigenous fish species include the Himalayan trout Barilius spp and mahseer tor tor (MoA,
2009).
In the highlands during the rainy season, runoff velocity rapidly builds up resulting into
frequent flash floods and landslides (Figure 4.5) which have become a principal natural force for
landscape change. For instance the 2004 flash flood across the country left behind major scars in
the landscapes. Similarly the glacial outburst in 1994 in Punakha and 2004 flash flood in
Trashigang have drastically changed the land features of the area (Figure 4.6).
Figure 4.5. Major landslide affected area in Lumang in Trashigang district.
Figure 4.6. Village settlement in Lungtenzampa and rice terraces damaged in Udzorong by a flash flood on Radi, Trashigang district.

130
4.2 Water resource and its distribution
The World Resource Institute estimated the per capita renewable freshwater resource in
Bhutan at 43,214 m3 per person signifying its richness, compared to per capita availability of
1822m3 in India, 8703m3 in Nepal, 8444m3 in Bangladesh, 1384m3 in Pakistan (Earth Trends,
2003). To reiterate, among all the natural resources, water surpasses all in terms of the benefit
the country derives from. Currently with four hydropower projects around 86% of electricity
generated is exported to India which earns around 60% of the annual export earning (Table 4.1)
making it the highest ranked export commodity.
Table 4.1. Top ten commodities exported from Bhutan, 2008.
Commodity Million US $ Electrical energy 234.74 Ferro-silicon: containing weight more than 55 % of silicon 59.82 Pozzolana cement 21.82 Carbides, whether or not chemically defined: of calcium 18.14 Other: refined copper wire 16.37 Manganese and articles thereof, including waste and scrap 13.19 Vegetable fats and oils and their fractions 11.22 Other of free cutting steel 8.52 Other (semi finished products of iron or non alloy steel) 7.47 Total 391.27
Source: NSB, 2009. 4.2.1 Water bodies and watersheds
Bhutan stretched over 340 km East to West and 175 km North to South with altitudinal
variation of 200 to over 7000 m amsl, with around 20.5% of its total area above 4200 m amsl
(MoA, 1997). Most of the area above 4200 m amsl is covered by the perpetual snow and ice
forming the glaciers and glacial lakes (Figure 4.7). Based on ICIMOD43 study (Mool et al.,
2001), it is reported that there are 677 glaciers and 2674 glacial lakes covering an area of 1317
km2 and 107 km2 respectively. The glacier forms a mighty ice reserve of 127 km3 which is a
43 ICIMOD - International Centre for Integrated Mountain Development is a regional knowledge development and learning centre serving the eight regional member countries of the Hindu Kush-Himalayas – Afghanistan, Bangladesh, Bhutan, China, India, Myanmar, Nepal, and Pakistan – and is based in Kathmandu, Nepal. It aims to assist mountain people to understand these mountain ecosystem changes, adapt to them, and make the most of new opportunities, while addressing upstream-downstream issues.

131
perpetual and crucial source of water for most river systems in the country and downstream in
India and Bangladesh.
Figure 4.7. Distribution of glaciers and glacial lakes in Bhutan.
Global climate change has caused the shrinkage or retreat of glaciers resulting in the
formation of a large number of glacial lakes, many of which can become unstable as their
volume increases or they are subjected to surge waves as a result of ice and rock avalanches
striking their surface that cause them to overtop their end moraine dams (Ives et al., 2010). A
number of glacial lake outburst floods (GLOF) have occurred in Bhutan in recent years and have
caused considerable damage (Table 4.2).
Table 4.2. Known glacial lake outburst flood events in Bhutan.
Year River basin Lake Cause of GLOF 1957 Pho chhu Tarina Tsho Unknown 1960 Pho chhu Unnamed Unknown 1960 Chamkhar chhu Bachamancha Tsho Unknown 1997 Pho chhu Luggye Tsho Moraine collapse Source: Ives et al., 2010.

132
From the mosaic of numerous sub-watersheds, broadly nine main watersheds (Figure 4.8)
can be defined running West to East (FAO, 1999). The perpetual stock of water in the form of
glaciers in the Northern part and 72% of forest cover ensure healthy watershed status. The
sudden rise from 100 m amsl to over 7000 m amsl and mountainous terrain intensify drainage
during rainfall resulting in rapid swelling of streams. Such events of swift swelling of streams
sometime lead to flash flood causing severe damage.
Source: FAO, 1999.
Figure 4.8. Nine principal watersheds in Bhutan.
Among the nine main watersheds, Sunkosh, which is drained by Phochu and Mochu at
Punakha, Dangchu and Phobjikhachu in Wangdue, Burichu in Tsirang is the biggest watershed
spreading over 9892 Km2 followed by Mangdey basin covering an area of 6110 Km2. Sunkosh
has the highest number of sub-watersheds and 81 mini watersheds. Other watersheds are fairly
uniform with area ranging from 3290 to 4520 Km2. Gasa is the smallest basin with only 1260
Km2 and only 1 sub-watershed (Figure 4.9).

133
Source: FAO, 1999.
Figure 4.9. Bhutan nine principal watersheds spread and their secondary and tertiary watersheds from West to East.
Based on meteorological data over 4 years (2004-2007), the two watersheds Torsa in the
West and Nyeraam in the East receive the highest amount of annual rainfall of 4500mm and
3900 mm respectively (Figure 4.10). Rainfall in other basins ranges from 800 to 1400mm.
Rainfall significantly contributes to watershed discharge and base flow of the streams. In many
places in the highlands, rainfall is the only source for seasonal streams like in Lingmuteychu and
natural springs which serves a primary source of drinking water like in Kengkhar study site.
Incessant rain often is a threat as it causes major landslides and flash floods. During 2004 heavy
rains lead to swelling of Gamrichu in Trashigang and Kholongchu in Trashiyangtse that ravaged
large areas of paddy field in Rangjung and Bumdeling respectively, including lives (Figure 4.11).
0
20
40
60
80
100
0
2
4
6
8
10
Torsa Raidak Gasa Sunkosh Mangdey Bumthang Kurichu Drangme Nyera Am
Num
ber o
f wat
ersh
eds
Are
a ('0
00 K
m2 )
Watersheds
Watershed area
Number of sub-watersheds
Number of mini-watersheds

134
Source: FAO, 1999.
Figure 4.10. Average annual rainfall in nine watersheds of Bhutan (2004-07).
Figure 4.11. Paddy fields damaged by flash flood in Bumdeling, Eastern Bhutan in 2004.
4.2.2 Profile of major river systems
As presented in Chapter 2 (Figure 2.6) the network of streams and rivers has been
clustered into 8 major river basins, from west to east they are Amo Chhu (Torsa), Wang Chhu,
Puna Tsang Chhu (Sunkosh), Drangme Chhu (Manas), Samtse, Gelegphu Area, Samdrup
Jongkhar, and Shingkhar-Lauri (Table 4.3).
0
1000
2000
3000
4000
5000
Torsa Raidak Gasa Sunkosh Mangdey Bumthang Kurichu Drangme Nyera Am
Tota
l ann
ual r
ain
fall
(mm
)
Watersheds

135
Table 4.3. Main river systems of Bhutan. Main river basin Tributaries Basin
area (km2)
Glacier number
Glacier area (km2)
Ice reserve (km3)
Amo Chhu (Torsa)
- 2,400 0 0 0
Wang Chhu Thim Chhu, Pa Chhu, Haa Chhu
4,689 36 48.92 3.55
Puna Tsang Chhu (Sunkosh)
Mo Chhu, Pho Chhu, Dang Chhu, Daga Chhu
10,355 272 503.11 43.28
Drangme Chhu (Manas)
Mangde Chhu, Chume Chhu, Chamkhar Chhu, Kuri Chhu, Kholong Chhu, Gongri Chhu
16,599 310 376.95 28.77
Samtse multi-river 962 0 0 0 Gelegphu Area multi-river 1,956 0 0 0 Samdrup Jongkhar
multi-river 2,279 0 0 0
Shingkhar-Lauri multi-river 779 0 0 0 40,019 618 929 76
Source: Water Resources Management Plan, Department of Energy, 2003.
The orientation and agro-ecological settings of the watersheds have greatly influenced the
human settlement and land use patterns in the country (FAO, 1999). For instance, the Sunkosh
watershed (or Punatshang chu) represented in Figure 4.12 is one of the biggest watershed
traversing the country North to South from Lunana to Kalikhola. It provides a fair representation
of how watershed bio-physical features have affected the land use and settlement. Pho chu
originates from the numerous glaciers in the Lunana valley fed by Tarina and Lunana glaciers.
Right at the upstream, a narrow valley is occupied by a small settlement of yak herders who
depend on pastoral farming systems. After draining Lunana valley, Pho chu flows through deep
gorges and rugged terrain to join Mo Chu immediately south of Punakha Dzong to form
Punatsang chu.

136
Figure 4.12. Schematic representation of Sunkosh watershed with agro-ecological features, settlements and infrastructures, Pho chu (Punatshang chu).
As Pho chu reaches Samadingkha it opens into the widest valley in Bhutan which
stretches around 30 km long and 5 km wide to form Punakha-Wangdue valley a major rice
growing area in the country. As it leaves the valley at Hesothangkha (just below
Wangduephodrang Dzong), a 1095 MW hydropower project “Punatshang chu Phase I” is being
constructed since 2009. From the point where the dam is built to Kalikhola, a length of around
100 km, Punatshang chu flows in deep gorges without any settlement except few restaurants
along the Wangdue-Tsirang highway. At 120 km point a 64 MW power plant has been built on
the right bank of Punatshang chu utilizing water from two tributaries: Baso chu and Ruri chu. As
Punatshang chu reaches Kalikhola, it is called Sunkosh which spreads in the plains of the
southern foothills draining the tropical Manas Wildlife Sanctuary. The profiles of four other river
systems in different regions of the country are presented in Figure 4.13 and described below.
Altitude
(m a
sl)

137
Figure 4.13. Profiles of four major river systems in Bhutan.
0
1000
2000
3000
4000
5000
0 40 80 120 160 200Distance (Km)
Wangchhu (Western region)
Pachhu
Paro
Chukha
Raidak
0
1000
2000
3000
4000
5000
0 40 80 120 160 200Distance (Km)
Kurichhu (Eastern region)
Kurichhu
Lhuentse
MongarManas
0
1000
2000
3000
4000
5000
0 40 80 120 160 200Distance (Km)
Amochhu (Western region)
Sombaykha
DorokhaPhuntsholing

138
Amo chu : One of the smallest river systems (NSB, 2009) originates in Chumbu valley in China
(Tibet) and enters into Bhutan from Yatung. Within Bhutan it does not have any tributaries other
than seasonal drainage during the wet monsoon. The river mostly flows in Samtse district
covering around 170 km of deep gorges and spreads out in Phuntsholing as Torsa and flows in
the plains of West Bengal before draining its water into the Brahmaputra. Within Bhutan its
water is not used for any purpose.
Wang chu: Wang chu is one of the most important river systems as it serves two major
hydropower projects (Chukha and Tala dams) commissioned in 1988 (Chukha) and 2007 (Tala).
Wang chu has 3 tributaries, which drain through the 3 important districts of Thimphu (Capital),
Paro (Airport), and Ha, are named Thimchu, Pachu and Hachu based on the main towns they
pass through. Thimchu and Pachu meets at Chuzom (Confluence), both have narrow valleys
where high altitude rice can be grown. With warm temperate climate this area is also best suited
for apples, peach and plum which are cash crops in the region. The two rivers join with Hachu to
form Wangchu. Along the Hachu there is only one settlement at Ha where the Ha Dzong and
army training facilities are located. Wangchu has a total basin area of 2865 km2 with 48.92 Km2
of glaciers that feed the rivers. Its mean annual discharge is recorded as 76 m3/sec (Table 4.4).
As it flows swiftly, its water is tapped through tunnel and used for operating two hydropower
projects. Other than the use in hydropower it is not used for agriculture purposes. Wangchu also
drains into the Brahmaputra after exiting from Raidak in Southern Bhutan.
Table 4.4. Annual discharge of water from river systems.
River system Principal tributaries Discharge recording site
Altitude (m )
Catchment area (Km2)
Mean annual discharge (m3/sec)
Wang chu Hachu Damchuzam 2,690 336 10.6
Wang chu Tam chu 1,990 2,520 65.7
Punatshang chu Mo chu Yebsa 1,230 2,320 116
Pho chu and Mo chu Wangdi 1,190 5,640 291
Sankosh Dubani 263 8,050 387
Drangme chu Chamkhar chu Kurjey 2,600 1,350 53.7
Mangde chu Bji 1,860 1,390 65.7
Mangde chu Tingtibi 565 3,200 150
Gongri chu Uzorong 570 8,569 256
Kuri chu Kurizampa 540 8,600 293 Source: Mool et al., 2001. No data for Amochhu.

139
Punatshang chu: The longest river in Bhutan measuring around 250 km (Mool et al., 2001) and
formed by the merger of Pho chu (male river) originating from Kula Gangri in Lunana with Mo
chu (female river) flowing in from Zhomolhari in Laya. With its catchment area of 16,010 km2
and ice reserve of 43.28 km3, its mean annual water discharge is recorded as 794 m3/sec (Table
4.4), it is one of the mst important and dependable source of water (Figure 4.14). It is considered
important as it drains the important rice growing areas and dependable as it is fed by tributaries
originating from the glaciers. It drains out of Bhutan from the Southern town of Kalikhola.
Source: Mool et al., 2001.
Figure 4.14. Four major river systems, number of corresponding glacial lakes and their sizes.
Drangme chu: the largest river system covering nine of the 20 districts and spreading over
almost 43% of the country (38,394 km2). There are 310 glaciers that account for 44% of the area
under glacier in the country. In the West, Mangdechu which originates from Gangkar Punsum
peak is the main river of Trongsa district that joins with Chamkhar chu coming in from
Bumthang. While there is hardly any flat area in Mangde chu basin, Chamkhar chu has a wide
and beautiful valley in Bumthang where the district headquarters and popular Buddhist temples
are located. Its catchment area extends to 23109 Km2 and discharges 768 m3/sec of water
annually, making it a potential target basin for hydropower projects (Table 4.4).
71
221
980
1383
0
15
30
45
60
0
400
800
1200
1600
Amo Chu Wang Chu Punatsang Chu Drangme Chu
Lake
are
a (S
q.K
m)
No.
of g
laci
al la
kes
River systems
Lake area Glacial lakeLegend:

140
There are four rivers flowing in from the Eastern region: Kuri chu in Lhuentse, Kholong chu and
Gongri in Trashiyangtse and Gamri chu in Trashigang that join with Mangde chu in Pangbang to
form Drangme chu. Except a small stretch (10 km long and 2 km wide) of flat area in
Gyelposhing along Kuri chu where the Kurichu Hydropower Project is located, the rest of the
river flows in deep gorges and narrow valleys until it exits in the plains of Manas in the South
from where it drains into India.
Others: The remaining four basins (Samtse, Gelephu, Samdrupjongkhar, and Shingkhar Lauri)
are small river systems not connected to the main above mentioned ones. There are multiple
seasonal streams fully dependent on the wet monsoon rains and some are formed by
consolidating seepages from natural springs and drainage. Among them, Samdrupjongkhar river
system, also called Nyere Ama Chu basin has the biggest basin of 2279 km2 and a 185m long
glacial lake (Mool et al., 2001). It drains out into the plains of Assam in Daranga causing chaos
during wet monsoon. The remaining three are completely dependent on rainfall. While most of
them are dry during winters, they turn into violent rivers with incessant monsoon rain causing
rampant destructions. Unlike the four principal river systems, these seasonal rivers form a major
source of irrigation water for rice cultivation in the Southern foothills from Sipsu in Samtse to
Daifam in Samdrupjongkhar.
4.3 Water in development
Bhutan has a narrow economic base and the main support for economic growth should
come from the exploitation of hydropower and establishment of natural resource-based industries
that make use of cheap power (ADB, 2005). The driving forces for rapid development of Bhutan
since 1961 are the rich resource endowments such as water and environmental biodiversity (Ura,
2004). Water is considered vital for social and economic development of the country, which is
vivid from the priority placed in accessing water. Despite the abundance of water resources, the
national policy prioritizes water access in the order of (i) drinking and sanitation; (ii) agriculture;
(iii) energy; (iv) industry; (v) tourism and recreation; and (vi) other uses. This aptly captures the
four prominent uses highlighted by Her Majesty the Queen Ashi Dorji Wangmo Wangchuck
(Zürcher and Choden, 2004). The following sections present the use of water as a key resource in
national development.

141
4.3.1 Domestic use : changing scenarios
Water is the principal renewable natural resource which has influenced the human
settlement and early civilizations in the Indus valley. In Bhutan too the important seats of
religion and royalty have been in fertile valleys with perennial river flowing as a lifeline for the
settlement. For instance, Thimphu, Paro, Punakha, Wangdue, Bumthang, and Ha are the most
important settlements from where development emanated in Bhutan. Prior to 1960s people used
water for domestic purposes directly from canal, streams and ponds by carrying it from long
distances (Zürcher and Choden, 2004). In rural Bhutan, domestic water use comprise of
drinking/cooking/washing (47%), animal feeding (28%), and irrigation (25%) (Domang et al.,
2007). While in urban areas almost all the water is used only for drinking, cooking, and washing.
In view of the close association of incidence of infectious diseases like diarrhoea, typhoid
and cholera to drinking water, the provision of safe drinking water to improve the health status of
the population has been a priority since development began in the 1960s and targets for universal
access for safe drinking water and the total sanitation is targeted by 2013 (GHNC, 2009a). It is
evident from the gradual development that universal access seems an attainable goal (Figure
4.15).
Source: PCS, 1999; GNHC, 2008; NSB, 2009.
Figure 4.15. Proportion of population with access to potable water, Bhutan, 1977-2009.
0
25
50
75
100
1977 1987 2000 2009
Pro
port
ion
of p
opul
atio
n (%
)
Years

142
While the figure looks convincing there is a drastic difference between situations in urban
and rural areas. With 69% of the population still based in rural areas, access to potable water to
the rural population continues to be a concern in most remote areas. Although water is abundant
in Bhutan, it is limited by distance and seasonality. In 2005, while 54% of the urban population
had piped water within their houses, only 9.2 % of rural folks had access to it. In contrast, 69%
of rural households had access to piped water outside their house. It is also interesting to note
that almost 22% of the rural population depended on natural springs, rainfall and tube wells
(NSB, 2008). The use of water from open sources may be the reasons for the prevalence of water
borne diseases (MoH, 2009). The disparity is also obvious across the districts (Figure 4.16),
where districts with remote geogs, like Laya in Gasa, Drujeygang in Dagana, Dorokha in Samtse,
Patalay in Tsirang, Goshing in Zhemgang, Kengkhar in Mongar, and Bjena in Wangdue,
households still depending on water from natural springs, streams, ponds, and wells (OCC,
2006).
Source: OCC, 2006.
Figure 4.16. Proportion of households accessing drinking water from different sources by districts in Bhutan, 2005.
0 25 50 75 100
SamtseHa
ParoChukha
ThimphuGasa
PunakhaWangdue
TsirangDaganaSarpang
ZhemgangTrongsa
BumthangLhuentseMongar
TrashigangPemagatshel
Samdrupjongkhar
Proportion of water accessed (%)
Dis
trict
s
Piped water within house Piped water outside houseSpring/river/pond Others

143
Despite the priority and focus on enhancing access to safe drinking water, studies have
shown that 30% of rural water supply schemes (RWSS) are either poorly managed or non-
functional (MoH, 2009). In many cases dysfunctional water supply schemes are due to source
drying up of source (Domang, et al., 2008) while poor maintenance is another main cause.
Water in the early days was a free and abundant renewable resource, and even when
planned development was launched in 1961 government took all the responsibilities to develop
and manage safe drinking schemes. As the population increased, water sources dwindled, and
use of water diversified from household use to irrigation, hydropower generation and industries,
thereby competition for water increased rapidly. To sustain a safe drinking water program, water
is metered in urban areas, while in rural areas community members participate in the
construction and maintenance of the schemes.
4.3.2 Agricultural use: irrigation systems and their evolution
The farm sector uses the largest share of water (54%) followed by the domestic sector
(36%) and industry (10%) (Zürcher and Choden, 2004). In 2008, approximately 19,274 ha of
agricultural land was irrigated and cultivated with rice. (MoA, 2009). As explained above, the
profiles of the river systems that follow deep gorges do not permit its water to be used for
irrigation. Even in valleys, as bulk of the river water comes from snow melt its temperatures are
below 10-12°C which could be harmful to crops. Further some attempts as in Bajo,
Wangduephodrang to pump water from Punatshang chu and storing it is large open reservoirs to
increase its temperature prior to use, has come out to be expensive, but it works. This leaves only
with seasonal streams sustained with rainfall and underground aquifers to be used for irrigation.
Prior to 1969, when the National Forest Act was enacted and forest nationalized, farmers
had free access to water resources (DoF, 1969). Wealthy families constructed private irrigation
canals named after them diverting water during rice seasons. For instance Thapa kulo in
Tsholingkhor, Tsirang in 1910, Bawanikulo in Barshong, Tsirang in 1921, and Churalum in
Guensari, Punakha in 1950 (Communication from Irrigation Division, DoA, 2010). Similarly, in
areas like Lingmuteychu in Punakha, early settlers contributed resources (labour, food and
materials) and constructed irrigation canals (Litmus Consult, 2002). Depending on the

144
investment to construct irrigation canals, local water distribution arrangements were established.
In Peljorling village of Samtse, where the 5 km long Diwan Kulo diverts water from Sipsukhola,
it is first used by the owner and subsequently the tenants and other villagers. In addition a quarter
of the water flow was always reserved for the owner. In a collectively built canal as in Limbukha
village in Punakha, four distinct classes of irrigators: Thruelpa, cheep, chatro, and
lhangchushare water within traditional norm which even persist today (Gurung, 2004).
Much before nationalization of forest in 1969, the Government supported the
construction of irrigation canals in potential rice-growing areas. In 1946 two canals in Senghe
village of Sarpang district were constructed by the government to support rice cultivation in the
plains. The canals were named as Mazan and Baral canals and are still functional today. Since
then the government has constructed 968 irrigation canals across the country totalling a length of
2590 km. In general the lengths of irrigation canals in different districts have been in relation to
the extent of wetland areas (Figure 4.17). However, the distinct difference in Samtse is mainly
due to the facts that they practice rainfed lowland and not irrigated rice.
Source : DoA, 2010.
Figure 4.17. Wetland areas and total length of irrigation canals in different districts of Bhutan, 2010.
0
40
80
120
160
200
0
1000
2000
3000
4000
5000
Bu
mth
ang
Ch
hu
kha
Dag
an
a
Ga
sa Ha
Lh
ue
nts
e
Mon
gar
Pa
ro
Pe
ma
gats
he
l
Pu
nak
ha
Sa
mdu
rpjo
nkh
ar
Sa
mts
e
Sa
rpa
ng
Th
imp
hu
Tra
shig
an
g
Tra
shiy
an
gtse
Tro
ngs
a
Tsi
ran
g
Wan
gdu
e
Zh
emga
ng
Irri
gatio
n sc
hem
e (N
o.)
Wet
land
are
a (H
a)
Districts
Wetland areaIrrigation scheme

145
In total there are 1101 canals measuring a total length of around 3022 km of which only
971 canals are functional (Table 4.5). Although the potential command area is 25,956 hectares
(Figure 4.18), effectively may be only 40% of the total wetland is actually irrigated (DoA, 2010).
The government is the principal investor in irrigation development with the construction of 69%
of the 1101 canals (Figure 4.19). There are 15 donor assisted projects which helped in the
construction of 11% of the canals, among them 50 were built in the eastern region of the country
by IFAD funded area development projects (FEZAP, SEZAP and AMEPP)44 over a period of 15
years. In addition 10% of the canals were built by communities and the remaining 10% privately.
The poor canal management and on farm water management is the primary reason for the failure
of many irrigation schemes in the country. This is further aggravated by the absence of canal
management institutions. According to the Irrigation Division of DoA, presently only 24 water
users associations (WUA) are functional despite the initiative of this Irrigation Division in 1991
when the National Irrigation Policy was enacted. Only Trashiyangtse, Samtse, and
Samdrupjongkhar have 12, 11, and 1 WUA respectively managing their schemes efficiently.
Source: DoA, 2010. Figure 4.18. Functional irrigation canals and their command areas against the constructed canals,
Bhutan, 2010.
44 IFAD – International Fund for Agriculture Development which provided soft loan to support FEZAP-First Eastern Zone Agriculture Project, SEZAP – Second Eastern Zone Agriculture Project, and AMEPP – Agriculture Marketing and Enterprise Promotion Program.
2438
110/479490
13/16
426
34/18
766
55/115
38
6/1.4
149
9/13
1042
59/256
528
60/119
1705
35/81
123
5/8
2561
111/374
623
21/53
977
17/49
3370
80/183
3008
32/101
650
28/86
2320
45/1081662
78/223
1653
137/248
1425
36/82
Command area ( Ha)
Number of irrigation canal/Total length of canal (Km)Legend

146
Figure 4.19. Construction of irrigation canals by different agencies in Bhutan.
Table 4.5. Water users associations (WUA) in Bhutan, 2010. Dzongkhag No. of
WUA Name of the Irrigation Scheme Length (Km)
Command Area (Ha)
Samdrupjongkhar 1 Rekhey 1.5 6
Samtse 11
Ugyentse, Tendruk, Sipsu, Chengmari, Yoseltse, Chengmari, Chargharey, Tading, Biru 32.3 272
Trashiyangtse 12
Tshalign Daksa, Nangkhar, Buyang, Wangningmo, Shami, Mangtey chu, Manchu, Phuyang, Yalang, Rollam, Namthi, Bayling 42.3 88
Source: Irrigation Division, DoA, 2010. 4.3.3 Hydropower: potentials and current status
The rich endowment of water resources and typical profile of Himalayan river systems
following the narrow gorges makes it ecologically, technically, and economically friendly to
harness river for hydropower generation. Bhutan has an estimated hydropower potential of
30,000 MW with an average development potential of 781 kW in a square kilometer of
catchment (Tshering and Tamang, 2005). Similarly the hydropower potential of Nepal and India
are 43,000 MW and 120,000 MW respectively. Although the Power System Master Plan
identified 91 potential hydropower sites with a capacity of more than 10000 MW, in 2002-03 the
feasibility capacity for exploitation was estimated to be more than 23000 MW (ADC, 2005). The
first hydropower plants built during the first plan (1961-66) were in Khasadrap chu in Thimphu
and Shari in Paro with installed capacity of 400 kW each. At the same time 250 kW on daily
Government69%
Community10% Private
10% Donor support Projects
11%

147
basis was imported from India for Samtse and Phuntsholing (Hasrat, 1980). As these 3 sources
tremendously boosted the local development, the government rapidly expanded the construction
of micro and mini (10 to 1500 kW) hydropower projects in different districts and remote
settlements as shown in Table 4.6.
Table 4.6. Micro and Mini hydropower projects in operation across Bhutan, 2005.
Year Hydropower project
Location (District) Installed capacity (kW)
1966 2 Gidakom (Thimphu), Sari (Paro) 400, 400
1974 5 Hesothangkha (Wangdi), Chumey
(Bumthang),Khalanzi (Mongar), Chenary and
Rangjung (Trashigang)
300, 1500,
1350, 750, 2200
1975-
2004
16 Thinleygang, Lingzhi, and Jungina (Thimphu),
Chachey (Tsirang), Darachhu (Dagana), Surey,
Kikhar and Tingtibi (Zhemgang), Bubja and Trongsa
(Trongsa), Ura and Tamshing (Bumthang), Rukubji
(Wangdue), and Gangzur and Rongchu (Lhuentse),
Khaling (Trashigang)
30, 8, 360, 200,
200, 70, 20, 50,
30, 50, 50, 30,
40, 120, 200,
600
Source: Tshering and Tamang, 2005.
With its low population and limited electricity dependent industries, Bhutan’s domestic
electricity demand and consumption will remain much below the production potentials. The
surplus energy can be easily absorbed by the enormous demand in India providing Bhutan with
much needed foreign exchange to finance its development (NVE, 2009). In 1974 the government
conceived the plan to harness the hydropower generation capacity of Wang chu for export. In
1986 the first mega hydropower project was commissioned with installed capacity of 336 MW.
Most of the energy generated by the Chukha Hydropower Project (CHPP) is exported to India
making it a net earner (DGPC, 2009). Hydropower projects in operations are detailed in Table
4.7.

148
Table 4.7: Hydropower Projects in operation in Bhutan as of 2010. Hydropower Project
Rivers
Installed capacity
(MW)
Power Generation
(Million Unit)
Year installed
Chukha HPP Wang chu 336 1800 1986-88 Kuri chu HPP Kuri chu 60 400 2001-02 Baso chu HPP Baso chu and Ruri chu 64 290 2002-05 Tala HPP Wang chu (Downstream of
Chukha) 1020 4800 2006-07
From the successful commissioning of CHPP, 3 more hydropower projects were
constructed. A dam along the river Kuri chu was constructed in Gyelposhing in Mongar to install
the Kuri chu Hydropower Project with capacity of 60 MW. It caters to the whole of East and
Central Bhutan. During the peak power generation season, over 60% of the power generated
from the plant is exported to India (DGPC, 2009). Subsequently, with the support of the Austrian
Government a 64 MW hydropower project at Baso chu in Wangduephodrang was commissioned
in 2005. In the down stream of Chukha HPP, Tala Hydropower Project (THPP) was
commissioned in 2006. It is the biggest hydropower plant in Bhutan with installed capacity of
1020 MW and the total energy from THPP is fully exported to India.
From the total electricity generated, only 26% account for domestic use and the
remaining is exported to India. After Chukha and Kuri chu HPP were commissioned more than
1300 million units are exported earning around US$ 50 Million per year. After Basochu HPP
came into operation it released energy from Chukha and Kuri chu HPP for export further adding
more than US$ 20 Million. The export earning increased by more than twofold from 78 to 178
million (based on 2000 price) after the 1020 MW Tala HPP was commissioned (Figure 4.20).

149
Source: NSB, 2009.
Figure 4.20. Electricity generation, domestic consumption, exports and their contribution to GDP in Bhutan, 2000-2008.
Until 2004 the farm sector (agriculture, forest and livestock) dominated the GDP with a
24% share followed by construction, social services, and transport. The hydropower sector then
contributed a meagre 8.4%. However with the installation of mega hydroprojects, in 2008
electricity and water sector surpassed all sectors by contributing 19.1% of GDP as shown in
Figure 4.21.
48 4954 54
61
78
169 173
0
50
100
150
200
0
2,000
4,000
6,000
8,000
2000-01 2001-02 2002-03 2003-04 2004-05 2005-06 2006-07 2007-08
GD
P c
ontr
ibut
ion
(Mill
ion
US
$)
Ele
ctric
ity (
Mill
iom
Uni
ts)
Fiscal Year*
GDP Electricity generation Exports Domestic useLegend:
* The fiscal year July of current year to June of following year

150
Source: NSB, 2009.
Figure 4.21. Share of GDP by different sectors in Bhutanese economy, 2004 and 2008.
With 8 projects planned and some already under construction (Table 4.8), it is expected
that hydropower will dominate the foreign exchange earning for many decades to come. Energy
is an essential input for all socio-economic development activities in Bhutan. Like every other
developing country, energy is recognized as a priority sector in Bhutan for poverty reduction and
sustainable development. While industry has been an engine of growth in the past, growth has
been singularly dominated by the hydropower sector (GNHC, 2009a), and it appears that in the
future hydropower will become the backbone of the Bhutanese economy.
24.10
18.40
8.40
7.30
0.50
7.30
1.40
0.50
12.20
3.90
10.50
5.50
18.90
11.50
19.10
9.30
1.10
8.50
2.30
0.50
11.00
2.90
9.90
5.00
0 5 10 15 20 25
Agriculture
Construction
Electricity and water
Financing & insurance
Hotels & restaurants
Manufacturing
Mining & quarrying
Private social
Social services
Taxes
Transport & communication
Wholesale & retail trade
Share of GDP (%)
Sec
tors
2008 (1152) 2004 (665)
Figures in parenthesis represents annual GDP at current price - Million US$
Legend:

151
Table 4.8. Planned hydropower projects in Bhutan. River basin Project name Installed
capacity-MW Construction period
Punatshang chu Punatshang chu I HEP 1095 2007-2014
Mangde chu Mangde chu HEP 670 2009-2016
Punatsang chu Punatsang chu-II HEP 990 2009–2016
Amo chu Amo chu HEP 500 2010-2018
Nika chu Nika chu HEP 210 2010-2018
Drangme chu Kholong chu 485 2014-2020
Bumthang chu Chamkar chu-I 670 2014-2020
Bumthang chu Chamkar chu-II 570 2017-2022
Cumulative capacity by 2022 5190
4.4 Policy on water resource
Culturally, Bhutanese consider water as god-gifted and life giver, the purest of all and
revere it as divine. However, socially water is considered as a common resource with free access.
Traditionally as there was no written policy or norms for water management, communities
crafted water accessing and sharing systems that best suited them. The traditional oral system
passed through generations has evolved as social culture which people still respects and follows.
Even after the advent of planned development and emergence of several policies water is still
basically managed by traditional institutions, norms, and rules (Litmus Consult, 2003; MoA,
2002b). As Buddhists, people conscientiously follow the religious perspective of hydrological
cycles and plan cropping systems, by referring to monks and lunar calendars.
4.4.1 Evolution of policies on water
Considering the definition of "Forest" means any land and water body, whether or not
under vegetative cover, in which no person has acquired a permanent and transferable right of
use and occupancy.” (FNCA, 1995) holds true, water resource in Bhutan was nationalized in
1969 following the enactment of National Forest Act 1969 (MoTIF, 1969). Since 1969 there has
been series of Acts and policies linked to the water resource, which distinctly show the
commitment of the government to manage the resource and sustainably use it for the

152
development of the country (Table 4.9). Corresponding to the commitment, the state had very
limited (financial, human and physical) resources to effectively implement the legislation.
Withdrawal of local customary rights and the absence of regulatory mechanisms led to open
access resulting in mismanagement and over exploitation of the resource leading to the “tragedy
of the commons”.
Table 4.9. Act and policies related to water in Bhutan. Year Act/Policy Provision
1969 National Forest Act - Conservation of catchment areas of streams reserved for supply of water for drinking and hydroelectric projects.
1974 Forest Policy - Whole country was declared as catchment area for all rivers originating either from China or inside the country
- Watershed management and riparian protection 1992 National Irrigation
Policy - Set the foundation for a sustainable approach to irrigation
development through the effective participation of the water users 1995 Forest and Nature
Conservation Act - Introduced the concept of critical watershed for protecting the
supply of water for drinking, irrigation, flood control and hydroelectric project
- Prohibition of blocking and diverting water courses, polluting water bodies, felling of trees within 100 feet from river bank
- Soil and water conservation measures 2003 National Water
Policy - Priority of water use, domestic use as first followed by irrigation
Emphasised on water resources management within river basins and aquifers, including both upstream and downstream water users
- Assured access to adequate, safe and affordable water to maintain and enhance the quality of their lives
2006 Forest and Nature Conservation Rules
- In addition to above provisions, it permitted watershed management to be included in the community forest plan
2008 Forest Policy - Watershed as source of high quality water for domestic use, irrigation and hydropower project included in policy
- Participatory watershed management approach to enhance ecosystem services and local development
- River basin planning as an organizing concept 2010 Water Act of Bhutan - Ensures that the water resources are protected, conserved and/or
managed in an economically efficient, socially equitable and environmentally sustainable manner
- Assign institutions to address the issue of water resource

153
The change in the regime affected irrigation water the most. During the same period
government constructed many irrigation schemes across the country to expand rice cultivation.
In 1990 when the irrigation program was evaluated, it was found that irrigation development did
not make the desired impact on agriculture production (DoA, 1992). This review resulted in
enactment of a National Irrigation Policy (NIP) which in principle, aimed at assigning the
responsibility for operation and maintenance of irrigation schemes to the beneficiaries. It also
emphasised the need for water users to take ownership and engage in decision-making processes
in scheme operation and maintenance (DoA, 1993). However, the recent report on irrigation
schemes by DoA indicates that only 24 WUAs are in operation. Some of the reasons farmers
give for the discontinuation of NIP-WUA are its prescriptive nature, non-legal status of WUA,
drying of water sources, and limited capacity to build fund from membership to invest in canal
maintenance. With the failure of WUA, farmers retracted to the traditional system of organizing
themselves based on the age old protocol, often guided by a village elder and managed by local
water guard (chusup – see chapter 3). Within the scope of the United Nations initiated Global
Water Partnership (GWP) which was founded in 1996 to foster integrated water resources
management (IWRM), the Bhutan Water Partnership (BWP) was launched in 2001 to coordinate
all programs related to water resource management (RGoB, 2003). Through its inter-ministerial
body, it formulated the Bhutan’s Water Policy which was released in 2003. It assures access to
adequate, safe and affordable water to maintain and enhance the quality of people lives. It also
highlights the status of water as the principal resource for the country and the need for its
management within river basins and aquifers, including both upstream and downstream water
users (RGoB, 2003).
Forest and Nature Conservation Rules of Bhutan released in 2006 introduced the concept
of watershed management within the community forest which prompted communities to take
initiatives to manage catchments. It broadened the functional understanding of community forest
as a source of timber to the concept of natural resources. In 2008, MoAF took yet another
initiative to revisit and revise the Forest Policy through a wider consultative process. It was
warranted with the change in governance and start of democratic governance. Further as
enshrined in the Article 5 of the Constitution of the Kingdom of Bhutan that “Every Bhutanese is
a trustee of the Kingdom’s natural resources and environment” (The Constitution of the
Kingdom of Bhutan, 2005) it was deemed necessary to revise the Forest Policy which is an

154
umbrella policy for natural resources and environment. Forest Policy 2008 further reiterated
watershed as source of quality water for domestic, agricultural and hydropower project but it
introduced the participatory watershed management approach to enhance ecosystem services and
local development (MoA, 2008).
The status of water resources in Bhutan was finally acknowledged when the 5th Session
of the First Parliament endorsed the new Water Bill in July 2010. The Water Bill 2010 proclaims
the state as the sole authority of water resource and ensures access to safe, affordable and
sufficient water for basic human needs for which the state will protect, conserve and/or managed
water in accordance to IWM principles. While the policy is silent on the customary rights, it is
explicit that policy encourages formation of WUA which can be federated into Basin
Management Committee and promotes equitable sharing of water. At the macro policy level, it
emphasises payment for environmental services (PES), particularly to generate funds to invest in
watershed management activities in upstream areas. Operationally it was only in November 2010
that a Yakpugang sub-watershed in Mongar was formally declared as PES pilot site. Under the
agreement between Yakpugang community and Mongar municipality, the municipality annually
pays around US$ 1,100 to the community for sub-watershed management.
The 10th Five Year Plan period 2008-13 derives essence of natural resource management
from the above policies for operational plans. For instance one of the five specific policy
objectives of the 10th Plan is to “Conserve and promote sustainable commercial utilisation of
forest and water resources”. In line with this policy objective, different agencies are
implementing activities to better manage water resources (GNHC, 2008b). For instance, the 10th
plan program of Ministry of Agriculture include development of watershed management plan
and sustainable management of water resources, Ministry of Health Services emphasises
strengthening advocacy for conservation and safe utilization of water resources, while Ministry
of Economic Affairs stresses sustainable water resources development and management and
safeguard against water related hazards .
In the country where GNH is the development philosophy, a natural resource which is
woven so intimately into social and cultural aspects of Bhutanese life deserves the highest
commitment from the people and government to conserve it. Without access to clean water the
very basic social chore of praying in the morning with offering of seven water bowls get
disturbed. Further, the globalization and the development drives to achieve higher socio-

155
economic goals, water in abundance used for electricity generation has become the most
important source of export earnings. As widely recognized, water is the principal natural
resource that will drive the economy of Bhutan.
Although the commitment of government in sustainably managing the water resource is
vivid in the policies and Acts, there are signs of imbalances in the implementation. One of the
prominent scenarios is the collapse of irrigation systems along with its associated institutions
which has hampered irrigated rice cultivation, in contrast to the expansion of hydropower
projects getting higher priority. Although the four commissioned hydropower project (Table 4.7)
did not displace any farming population, the displacement of around 100 farming households
from upper Gaselo in Wangduephodrang district by Punatshang chu Phase I has is the new
challenge for upholding the peoples’ aspirations in the face of development. The disregard of
customary rights/norms and traditional social systems, could cause heavy damage to the nation
as the generation old understanding and strategies for NRM is lost.
While the policy instruments seem right, the limitation may be lack of manpower and
institutional mechanisms to systematically follow through the implementation. Sometime poorly
implemented policy (and regulations) may lead to greater damage than operation in informal
setting within a broad consensual arrangement. The rapid depletion of forest resources in the
1960s and 70s was a case of poorly implemented policies. The efforts of government to re-
engage people in management of natural resources is legitimate, however the half-hearted
devolution may be futile. Here people with their best traditional practices should be taken on
board rather than simply as subjects to follow the prescriptive guidelines.
Within the premise of changing social, ecological, and political environment vis-à-vis
globalization, water as a basic renewable resource has emerged into a primary revenue earner to
support national development. As the water evolved as a multi-functional resource, it has
escalated complexities in competition and conflict over water resources. Such evolution demands
the need for congruent and enduring social capacities, institutions and governance systems. In
chapter 5 a detailed review on the state of art on resource governance, institution and water
management in proposed to enhance a better understanding about how they can cope with the
evolution of water resource management.

156
PART II: CONCEPTUALIZATION OF RESEARCH AND IMPLEMENTATION
CHAPTER 5
STATE OF THE ART ON RESOURCE GOVERNANCE, INSTITUTIONS AND WATER
MANAGEMENT
The rapidly changing political environment, socio-economic conditions, climate change,
and globalization are escalating complexities in competition and conflict over natural resources
demanding for reforms in the social institutions which govern these resources in Bhutan (GNHC,
2008a). Causes for failure to preserve ecosystems are poor correspondence of scale of human
system and ecosystem, failure to introduce governing institution, and lack of appropriate
knowledge (Cutler et al., 1995). Although grounded in the ecological science (Holling, 1973),
resilience45 has increasingly been tested and applied by natural and social scientists to examine a
range of communities linked into social–ecological systems (Berkes and Folke, 1998; Berkes et
al., 2003; Gunderson and Holling, 2002) and institutional and organizational arrangements
(Folke, 2006).
5.1 Governance of a common property resource
Social-ecological systems (SES) are complex adaptive systems46 in which heterogeneity,
multiple scales, multiple domains of attraction, surprise, and fundamental uncertainty of the
functioning of the ecosystem prevails. The proposition of panarchy47 in resource and
environmental management (Holling et al., 2002) has brought in a shift from reductionist,
command and control science and management to a more integrated, adaptive, systems-based
approach (Berkes and Folke, 1998). Therefore, such integrated management concerns must be
tackled by complex array of political, economic, institutional and social processes by which
society govern an SES (Moench et al., 1999), otherwise governance. 45 Resilience is the ability of the ecological systems to absorb changes of state variables, driving variables, and parameters, and still persist (Holling, 1973). 46 Complex adaptive system is the co-evolutionary interactions between the natural resource base, social institutions and the behaviour of individual actors relevant for natural resource management systems (Rammel et al., 2007). 47 Panarchy is the hierarchical structure in which systems of nature and humans, as well as combined human–nature systems and social-ecological systems are interlinked in never-ending adaptive cycles of growth, accumulation, restructuring, and renewal (Holling, 2001).

157
The management of a Common property resource (CPR) is a widely discussed topic, ever
since Garrett Hardin remarked that “Ruin is the destination toward which all men rush, each
pursuing his own best interest in a society that believes in the freedom of the commons” in his
seminal article titled “The Tragedy of the Commons” (Hardin, 1968). According to him when
property rights to natural resources are absent or unenforced, i.e. when there is open access, no
individual bears the full cost of resource degradation. The result is 'free riding' and over-
exploitation, what Hardin termed the 'Tragedy of the Commons'. He insistently put forth that the
state control and management is a solution to ‘tragedy of the commons’. This notion of state
control and disregard on local management strategies has led to widespread and long lasting
controversies. Cox (1985) and Berkes (1989) disagree to the Hardin’s proposition and relate the
decline of resources to the breakdown of existing commons systems due to disruptions that have
originated externally to the community. Similarly, Dove (1993) and Berkes (1989) associated the
tragedy of the commons to institutional failure to control access to resources, and to make and
enforce internal decision for collective use, which could be either due to the inability to
coordinate internally or due to an incursion of outsiders. While the privatization of the commons
was considered as a means to increase efficiency of their management (Demsetz, 1964 and
1967), decentralized collective management of CPR by their users was found to be an
appropriate means to avoid such 'tragedy of the commons' (Berkes, 1989; Wade, 1987; Jodha,
1986; Chopra et al. 1989; Ostrom, 1990). For a successful CPR regime, congruence of
ecosystem and governance boundaries, specification and representation of interests, matching of
governance structures to ecosystem characteristics, containment of transaction costs, and
establishment of monitoring, enforcement and adoption processes at appropriate scale is
necessary (Eggertsson, 1990; Ostrom, 1990; Bromley, 1991; Hanna, 1992). As an effective means
to govern and manage CPR, Schlager and Ostrom (1992) proposed “bundle of rights” as follows:
• Access—a right to enter a defined physical property,
• Withdrawal—a right to harvest the products of a resource such as timber, water, or food
for pastoral animals,
• Management—a right to regulate the use patterns of other harvesters and to transform a
resource system by building improvements,

158
• Exclusion—a right to determine who else will have the right of access to a resource and
whether that right can be transferred, and
• Alienation—a right to sell or lease any of the above for rights.
Through governance individuals and groups articulate their interests, mediate their
differences and exercise their legal rights, obligations and mediate their differences for which
decision-makers are held to account (UNDP 1997; Plumptre and Graham, 2000; Leach et. al.
2007; Moktan and Nicoll, 2008), implying the interplay of various forms of power that suits top-
down control paradigm (Olsson et al., 2006). However top-down control of renewable natural
resources has been said to stimulate unsustainable use of the resource (Janssen and Ostrom,
2004).
In such situation, the involvement of local resource users in decision making, and how
local government is accountable to these users, influences the effectiveness of local government
in natural resource sectors (Agrawal and Ostrom, 2001; Blair, 2000). Engaging users creates new
spaces for citizen involvement as the ‘owners’, and to some extent the ‘makers and shapers’,
rather than simply ‘users and choosers’ of services (Cornwell et. al., 2001) which enhances the
efficiency of management regime. To sustain such initiatives, Agrawal (2001) suggested four
factors as critical enabling conditions: (i) resource system characteristics, (ii) group
characteristics that depend on resource, (iii) institutional regimes through which resources are
managed, and (iv) external forces and authorities such as market, state and technology. However,
as management of natural resource revolves within ecological, economic, and social background
(Berkes and Turner, 2006), the ability to respond to resource management issues depends on
information, governance, social processes and structure (Adams et al. 2003).
Similarly the environmental problems which cannot be dealt with conventional science
and management require alternative management and resilience thinking (Folke et al., 2002).
Perhaps the ability to manage resilience may influence the form of governance (Lebel et al.,
2006). Resilience is about system (social and ecological) flexibility in the face of change (Berkes
and Turner, 2006). This flexibility in turn depends on the degree at which the system can self-
organize and build its capacity to adapt. For building resilience and adaptive capacity, Folke et
al., (2003) identified four factors that interact across temporal and spatial scales necessary for

159
dealing with dynamics in SES. They are: (i) learning to live with change and uncertainty, (ii)
nurturing diversity for reorganization and renewal, (iii) combining different types of knowledge
for learning, and (iv) creating opportunity for self-organization toward social-ecological
sustainability. Based on studies in Nepal, Hemant et al. (2008) suggests that the challenge of
achieving equitable governance of renewable natural resources is related to the ways through
which diverse knowledge systems come into deliberative interface to transform or reproduce
relations of power and rules of practices. Sharp differences in power and in values across
interested parties make conflict inherent in environmental choices. Beyond power and rules,
Putnam (1994) suggested that higher levels of trust and co-operation which is self-reinforcing
and cumulative leading to reciprocity, civic engagement and collective well-being facilitates
better governance, which he terms as social capital. Many authors distinguish factors of social
capital formation especially trust, reciprocity and collective learning (Sobels, 2002; Valentinov,
2004; Putnam, 1993). Social capital is conceived as possession of a durable network of
institutionalized relationships of mutual acquaintance or recognition (Bourdieu, 1985), social
life, norms and trust (Putnam, 1995), and as rules that reduce transaction costs of monitoring and
enforcement of these rules (Ostrom and Ahn, 2003).
Governing the commons is always a struggle as effectiveness of rules change with
constantly changing SES and when human drives to evade the rules. Therefore, rules should
evolve for successful governance (Dietz, et al., 2003). Developing trust and reciprocity is crucial
to build the social capital needed to create workable property rights (Ostrom, 1998; Ahn and
Ostrom, 2008). In addition to trust, Heinmiller (2009) identified common preferences, shared
knowledge, collaborative experiences, focusing events and expectations of future interactions as
factors affecting the success of CPR governance.
5.2 Institutions
The evolutionary nature of the concept of Institution is well presented by Holling (1986),
comparing institutions to ecosystems which become "brittle" over time, triggered by resource
crises leading to breakdown (release) and reorganization building resilience. Resource
management institutions have been extensively discussed in the literatures (Uphoff, 1986;
Rungs, 1992; Ostrom, 1992) and broadly considered as a set of formal and informal norms, laws,

160
rights, sanctions and conflict resolution mechanisms, designed to manage resources. In a SES,
patterns of interrelations, sets of norms and rules and systems of values that control and organise
the natural resource have evolved over generations and have shaped patterns of behaviour giving
rise to unique institutional arrangements. Institutions are therefore considered as enduring
regularities of human action in repetitive situations structured by rules, norms and shared
strategies constituted and reconstituted by human interaction, as well as the physical world
(Crawford and Ostrom, 1995), or simply a set of working rules (Ostrom, 1986) and a formal
means to manage pluralism and power relations (Leach and Fairhead, 2001). Thus institutions
that shape social behaviour and transported by various carriers, such as cultures, structures, and
routines over generations can facilitate collective action and the solution of common pool
resource problems thus avoiding the “tragedy of the commons” (Ostrom, 1990). Such social
behaviours evolve into formal (policies and law) or informal (social norms) prescriptions that
forbid, permit, or require some action or outcome (Ostrom, 1986, Crawford and Ostrom, 1995).
Ostrom (1990) in her book “Governing the commons: evolution of institutions for collective
actions” introduced design principles of institutions for governing sustainable resources, as
follows:
1. Clearly defined boundaries: The boundaries of the resource system (e.g., irrigation
system or fishery) and the individuals or households with rights to harvest resource units
are clearly defined.
2. Proportional equivalence between benefits and costs: Rules specifying the amount of
resource products that a user is allocated are related to local conditions and to rules
requiring labour, materials, and/or money inputs.
3. Collective-choice arrangements: Most individuals affected by harvesting and protection
rules are included in the group who can modify these rules.
4. Monitoring: Monitors, who actively audit biophysical conditions and user behaviour, are
at least partially accountable to the users and/or are the users themselves.
5. Graduated sanctions: Users who violate rules-in-use are likely to receive graduated
sanctions (depending on the seriousness and context of the offense) from other users,
from officials accountable to these users, or from both.

161
6. Conflict-resolution mechanisms: Users and their officials have rapid access to low-cost,
local arenas to resolve conflict among users or between users and officials.
7. Minimal recognition of rights to organize: The rights of users to devise their own
institutions are not challenged by external governmental authorities, and users have long-
term tenure rights to the resource.
For resources that are parts of larger systems:
8. Nested Enterprises: Appropriation, provision, monitoring, enforcement, conflict
resolution, and governance activities are organized in multiple layers of nested
enterprises.
Although the design principles are neither a panacea nor abstract concepts, the validity of
the framework has been studied at several sites and found legitimate in design of the institutions
for governance of CPR. From 33 such studies, 75% of the cases are either moderately or highly
supportive of the usefulness of the design principles (Ostrom, 2008). However, as CPR may or
may not have formal or informal property rights, balancing the multiple interests and property
regimes often is a major concern in management (Steins and Edward, 1999). Thus the absence of
an institutional framework and top-down approach in management of CPR gives rise to co-
management initiatives (Röling, 1994) which regards management issues from perspectives of
common understanding of resources, joint actions and cooperation by stakeholders. Introduction
of nested platforms for resource use negotiation is considered a way forward to deal with the
management of CPR (Steins and Edward, 1999, Gonzalez, 2000). The key aspect of such
platform is the concept of “social learning” emerging from complex interdependent stakeholder
relationship in a multiple property regime. It is also suggested that important issues for collective
actions through such nested platforms are:
• Ability of the individual user groups to influence decision-making within the platform,
• Influence of the collective choice and legislative institutional frameworks on the
effectiveness of the platforms,
• Role of social learning, and
• Need for a third party to facilitate nested platforms.

162
The property regimes are not static but tend to appear and disappear and change in form
and function in correspondence to SES changes (Ostrom, 1990), this shift can be considered as
institutional capital (Ostrom, 1994). Such change helps to maintain a balance between vertical
(federal) and horizontal (local) control by dispersing across stakeholders the capacity (e.g.,
knowledge, power, and resources) to solve complex problems (Imperial, 1999). Analyzing the
governance system of the wetland landscape of Kristianstad (Figure 5.1), Hahn et al. (2006)
suggests 6 key characteristics for a successful collaboration within a social network of dynamic
horizontal and vertical interactions:
• A flexible ‘bridging organization’ and ‘adhocracy’ (an organization that does not have a
fixed bureaucratic structure and can adapt to changing circumstances or a model of
management or decision-making in which various groupings of individuals reach
consensus by responding in an ad hoc fashion to frequently changing priorities),
• Leadership through trust-building and conflict resolution,
• Generating and communicating SES knowledge,
• Collaboration and value formation conditional on fixed objectives, and
• The interplay between formal and informal institutions.

163
Figure 5.1. Successful adaptive approaches for ecosystem management. (Adapted from Hahn et
al., 2006)
After the failure of nationalized management approaches to CPR, the involvement of
communities has strongly come forth as a pragmatic management regime. This decentralization
by empowering local communities enhances the capability of local-level institutions to learn and
develop to respond to environmental feedbacks faster than do centralized agencies (Berkes and
Folke, 1998), as centralized system delays or blocks information from the resource in the form of
feedbacks (Holling et al., 1998). Even in situations where local institutions did not historically
exist for a particular resource, new institutions may evolve over time, especially if higher-level
institutions provide a social and political environment conducive to such development (Berkes,
2000).
Similar to the design principles of Ostrom, from multiple empirical studies Deitz et al.
(2003) identified two broad principles for robust institutions managing localized resources as (i)
regional and global principles: analytical deliberation, institutional variety, and nesting, and (ii)
local principles: rules congruent with ecological conditions, clearly defines boundaries,
accountability mechanisms, graduated sanctions, and conflict resolution. These principles are
meant to satisfy governance requirements as provision of information, conflict resolution,
compliance rules, infrastructure, adaptation and change. In human institutions the knowledge-
DISTURBANCES
External drivers, changes and surprises
Ecosystem functions
and dynamics
INSTITUTION
Social norms and rules
SELF-ORGANIZATION
External drivers, changes
and surprises
Capacity to deal with disturbance
KNOWLEDGE SYSTEM
Ecological knowledge into
adaptive management
practices
Supporting flexible
institutions and multilevel
governance system
Ecological knowledge
into institutional
learning

164
power linkage is enacted, contested and resisted in governance practices (Lusthaus et al., 2002).
The treatment of knowledge in isolation of power gives an incomplete view of learning and
innovation systems. Institutions are often influenced by cultural norms and customs that include
a society’s habits, ways of thinking, values, and informal unwritten standards. Further these
socio-cultural forces operate at local, regional and national levels, and have a profound influence
on the way organizations conduct their business and what they value in terms of outputs and
effects. The institutional transformation linked to the concept of “social learning” and
“innovation systems” results from the interaction among multi-layered sources of knowledge.
According to Röling (2002), social learning aims at a transformation from reductionism
to holistic perspectives, from a positivist to a constructivist perspective to tackle complex
problems as the outcome of human activity and critical thinking. As the concept of social
learning implies knowledge sharing among stakeholders as a key mechanism for building
sustainable societies, it is compatible with the idea of soft systems thinking (Checkland, 1981;
Röling and Wagemakers, 1998) and the concept of adaptive management (Holling, 1995).
Knowledge and organisation have been identified as the most important aspects of farmer
empowerment, that form a basis for establishing higher-level farmers’ organisations that could
represent their interests in the local government and influence national policy (Friis et al., 2008).
Within this organized engagement, there is learning from sharing of diverse perspectives and
experiences to develop a common framework of understanding and creation of collective action
thereby building institutional learning (Schusler et al., 2003). When institutional learning
happens within networks there is a change in mutual norms and institutions. The degree of
consistency and collaboration among the networks influences the usefulness of interactions
between institutions at different organizational levels (Young, 2002). Favourable interactions
enable adaptive co-management48 within the existing social capacity to understand and respond
to environmental feedbacks over time and space, and to sustain and enhance ecosystem resilience
(Berkes and Folke, 1998). In relation to the idea of existing social capital, Ostrom (1990)
demonstrated that communities have relied on institutions resembling neither the state nor the
48 “adaptive management” stands for learning from deliberate experimentation and “co-management” is collaboration among local actors as well as with higher level organizations and institutions.

165
market to govern some resource systems with reasonable degrees of success over long periods of
time, implying that functional local arrangements and institutions existed within communities.
However, in a highly globalized world, broad influences of global trade and multilateral
institutions like World Trade Organization, the World Bank, and International Monetary Fund
have increasingly influenced environmental governance institutions (Dietz et al., 2003).
5.3 Water resource management
Water sustains life and all social and environmental processes, yet it is one of the
endangered natural resource (Simonovic, 2009) which raises the question of ownership,
management, and technological development (Coopey et al., 2005). Globally, around 70% of
water withdrawals are for agriculture, with remaining 30% for domestic, industrial and leisure
uses depending on access, quantity, quality and socio-economic conditions. Overall, global water
consumption has increased almost tenfold from 1990 to 2000 (FAO, 1993). Growth in
population, increased economic activity and improved standards of living lead to increased
competition for and conflicts over the essential but limited freshwater resource (GWP, 2000).
Basically human actions bring about water scarcity in three ways: through population growth,
misuse and inequitable access (FAO, 1993). Freshwater which is inevitable for human,
agriculture, industries and natural environment has become scarce (WWF, 1989) and is a full-
scale emergency (UNEP, 1999).
The International Water Management Institute (IWMI) highlighted the issue of access to
safe and affordable domestic water supply and sanitation, and the perceived physical scarcity of
water as the most widely discussed issues on water (IWMI, 2004). According to the
comprehensive assessment of water for agriculture, a third of the world’s inhabitants now face
physical water scarcity49 and economic water scarcity50. One-quarter of the world’s population
now live in river basins where water is physically scarce and around one-sixth inhabit
catchments where water is economically scarce (Comprehensive Assessment, 2007). Water
resource management is influenced by the limits of biophysical, socio-political and economic
49 where there is not enough water to meet human and environmental demands 50 where water may be plentiful in nature but there is insufficient investment or human capacity to satisfy demand for water

166
processes to meet goals like production and especially food security, its profitability, risk
aversion and wider community goals such as poverty alleviation, welfare of future generations,
and environmental conservation (Campbell et al., 2001). All NRM systems involve multiple
stakeholders, with multiple perceptions and objectives operating through interacting
mechanisms. The interactions in water management can be considered as upstream-downstream
relations, farm level trade-off, food security, risk aversion, environmental conservation, thus
posing complexities for management. Such complexities arise from (Campbell et al., 2003):
• Multiple scale of interaction (from the field to the watershed levels),
• High frequency of non-linearities, uncertainty, and time lags in complex systems,
• Multiple stakeholders with often contrasting objectives,
• Context specificity of INRM sites, and
• Problems of maintaining integration in the face of numerous components and
interactions.
As a water resource system comprises of individual, organization, society and
environment, it is very closely associated with the social system in a given ecological context.
Within this complexity, neither regulation nor economic incentives, nor education or shifts in
property rights, is the “right” management strategy. The challenge for the water resource
manager is to manage these elements within the environment and across individuals,
organizations and the society to achieve sustainable management (Simonovic, 2009). Further,
against the backdrop of above complexities, management effectiveness will always be limited by
incomplete knowledge and understanding of dynamic interactions between natural and social
systems. The knowledge which stakeholders use to define the problems of resource use falls into
three realms: knowledge of the empirical context; knowledge of laws and institutions; and
beliefs, myths, and ideas (Adams et al., 2003). The variation in knowledge and understanding
results in inherent conflict which needs to be taken into account for developing strategies to
address NRM issues (Bullock, 2008). Through irrigation technology, societies controlled and
manipulated natural water supplies to improve crop production. The result was often reliable and
ample food supplies were produced which led to the creation of stable agricultural villages and
nation states, the division of labour and economic surpluses (FAO, 1993). Water resource use
and management has evolved through generations of stewardship, control and technologies. For

167
ages water resources have been appropriated and used for benefit of humanity, which is best
explained by “Water is the patrimony of mankind” (GCWC, 1998), as adaptation of water use
and management in an evolutionary context over generations.
It is evident that past initiatives on water management (drinking, irrigation, flood control,
land reclamation) mostly came from the state in the form of structural interventions like
reservoirs and canals (Table 5.1). Among several traditional water management schemes, one is
the primary pond (Sayama-Ike= mother pond), secondary and tertiary field ponds interconnected
with canals near Osaka, Japan. Technological innovation has helped in restoring the system
which is still in use. The water sharing among the users is done through water users associations
and their federation. In 1980, the Japanese government enacted the Irrigation Association Law
which promotes the federation of water users for sustainable water use (Coopey et al., 2005).
Many countries actually used the approach of river basin committees to manage water resources
to address local management issues. In China as the resource and system is owned by the state,
users have to pay a water rent which curtailed mismanagement and ensured sustainable use.
France adopted a centralized public utility model of water allocation where its “Agences de
bassin" (Basin Agencies) were assigned with the responsibility to develop long term plans and
manage water resources sustainably. India from the very early age used water tanks to collect
rain water and well to draw ground water, to manage the network of tanks, village committees
and water user associations were established. However, water diverted from multipurpose dams
is regulated by the state. From the above cases (Table 5.1), it is evident that efforts to equitably
allocate water and sustainably using it had been an everlasting strategies in all countries,
otherwise a scenario of supply driven management systems. However, dwindling water volumes
and increasing users pose multiple challenges in providing sustainable and equitable water
services. In 1994, experiencing the increased freshwater stress due to rapidly increasing demand
worldwide, the UN Commission for Sustainable Development conducted the Comprehensive
Assessment of the Freshwater Resources of the World. The study concluded that a complex web
of physical, social, economic and political interrelationship is necessary to enhance the efficiency
of water systems to support both strategies of health and sustainability. It reiterates the need to
increase understanding of water related problems and potentials (Kjellén and Mcgranahan,
1997).

168
Table 5.1. Examples of water management systems in different countries.
Country Management system Reference
Chile - Comprehensive water allocation system that establishes tradable property rights. - Chile's water law: allows trade between and among economic sectors; protects third party rights; establishes compulsory
water user associations and a national water authority to resolve conflicts; and allows for judiciary solutions to those conflicts not resolved by water user organizations or the water authority. Water transfers require authorization at two levels : those of the local water user associations and the national water authority.
FAO, 1993b.
China - River basin committee (6 for the Yangtze, Yellow River, Huaihe, Songliaohe, Haihe, Pearls and Tai Lake) that manage water resource management at the national level.
- Water resource bureau at prefecture and county level. At district level irrigation districts and field canal committee manages the local schemes.
Liao et al., 2008
France - Centralized public utility model of water allocation (River Basin Committee – RBC- and Basin Agency) - The RBCs approve 20- or 25-year water development plans and, every five years, establish action plans to improve water
quality. They also set two fees to be paid by water users: one for water consumption and the other for point source pollution. The fees provide incentives for users and also form a fund to encourage better water use through grants or soft loans. The RBCs include representatives from national, regional and local government administrations as well as individuals from industrial, agricultural and urban interests.
FAO, 1993b.
India - Tank systems, developed ingeniously and maintained over the centuries, have provided insulation from recurring droughts, floods, vagaries of the monsoon, and offered the much needed livelihood security to the poor living in fragile semi-arid regions.
- Use of village council: supervisory and regulatory task for equitable water sharing. - Water User Associations.
Sakthivadivel et al., 2004
India - Institutional arrangement (i) ‘collective choice situations’ that may involve decisions about planning, development and management of the resources and sources, (ii) ‘entry’ and ‘exit’ rules that concern exclusion of potential beneficiaries and seek to regulate access and use of the village water resources and sources, (iii)‘operational rules’ that regulate the use and day-to-day maintenance of the water sources.
Singh, _______
Iran - In 2000 BC village councils were formed to assign water rights of village inhabitants for irrigation and other purposes. Marjanizadeh et al., 2009
Japan - Use of Sayama-Ike (mother tank) and secondary and tertiary tanks to share and use water for irrigation is a worthy example of use of technology to enhance access of water (River Act 1896).
- Federation of water users association (Irrigation Association Law 1980).
Hatcho and Matsuno, 2005
Nigeria - River basin development authority and Water users association – cooperative management of public sector scheme. Bala et al., 2005
Australia - Relatively decentralized and based on entitlements or rights to specific quantities of water. FAO, 1993b.
The Netherlands - Reclamation of land with dykes since the 14th century. Establishment of water boards to develop better local and regional water management. In the 21st century established a State Committee for Water Management.
Bruin et al., 2005
United States - "First in time, first in right", private individuals cannot "own" water but have "usufructuary" rights. The state retains ownership and determines which uses are beneficial.
FAO, 1993b

169
According to the World Water Council the pressing issues related to water resource are
access to safe and affordable water, destruction of wetlands and its biodiversity, limited use of
water conservation technologies, exploitation of ground water, and the sectoral management of
water (WWC, 2000). The first ‘Conference on the human environment’ forum is 1972 included
natural resources (air, water, land, flora and fauna) in its declaration as one of the principles and
urged in safeguarding it for the benefit of present and future generations through careful planning
or management (UNEP, 1972). Subsequently, the International Conference on Water and the
Environment (ICWE, 1992) highlighted the serious risk posed by the mismanagement and
scarcity of fresh water, and drew the following four principles for management of freshwater as:
(i) freshwater is a finite and vulnerable resource, essential to sustain life, development and the
environment; (ii) water development and management should be participatory—involving users,
planners, and policy makers at all levels; (iii) women are central to providing, managing, and
safeguarding water; and (iv) water has an economic value in all its competing uses and should be
recognized as an economic good. These principles came to be known as the Dublin Principles
which form the heart of the integrated water resource management (IWRM) concept (ICWE,
1992) as is became widely accepted that the water crisis is associated to many interacting trends
in a complex system for which real solutions require an integrated approach to water resource
management. The three primary objectives of IWRM (WWC, 2000) are to:
- Empower women, men, and communities to decide on their level of access to safe water and
hygienic living conditions and on the types of water-using economic activities they desire
and to organize to achieve them.
- Produce more food and create more sustainable livelihoods per unit of water applied (more
crops and jobs per drop), and ensure access for all to the food required for healthy and
productive lives.
- Manage human water use to conserve the quantity and quality of freshwater and terrestrial
ecosystems that provide services to humans and all living things.
IWRM can be considered as the way in which water can be managed to contribute to the
achievement of the objectives of sustainable development (GWP, 2009). It is an approach that

170
reflects the need to achieve a balance among the three Es of IWRM: Environment, Equity and
Economy (Figure 5.2).
Figure 5.2. Three Es of Integrated Water Resource Management (Adapted from Ker Rault and Jeffrey, 2008).
Various initiatives by international organizations resulted in founding the Global Water
Partnership in 1996 to foster IWRM which is defined as the coordinated development and
management of water, land, and related resources in order to maximize economic and social
welfare without compromising the sustainability of vital environmental systems (GWP, 2010).
GWP operates through its 13 regional networks51 and 74 Country Water Partnerships which
provide a neutral and multi-stakeholder platform for dialogue and facilitating change processes.
They manage and govern themselves, and bring about solutions that are tailored to local
conditions and informed by local experiences.
The fundamental goal of water resource management seems to assure fair distribution of
the resource, promote user participation in management, and ensure sustainability of the
51 They are the Caribbean, Central Africa, Central America, Central and Eastern Europe, Central Asia and Caucasus, China, Eastern Africa, Mediterranean, South America, South Asia, Southeast Asia, Southern Africa and West Africa networks.

171
resource. However, as the management of renewable resources involves the interactive roles of a
diversity of stakeholders characterized by different perspectives, experiences, knowledge and
interests in the management of the resource to be shared, they have varying level of access to
and control over, decision-making, and specific knowledge about NRM processes. This
difference often leads to power relations between stakeholders which are negotiated over space
and time depending on various factors in the local context (Cornwall, 2000). Based on these
principles, something resembling a standard package of water reforms to national water policy
and law has been developed in most countries.
The study of water governance in the Mekong region (Williams and Weale, 2006)
revealed that IWRM has been applied as a ‘blueprint’ and one-size-fits-all approach without
considering the diversity of the social, political, and ecological contexts. As a result the
relevance of water policies are questionable. The prescriptive approach of IWRM in situations
where watersheds overlap with other jurisdictions like administrative and political ones makes it
difficult to implement (Butterworth et al., 2010). Williams and Weale considered IWRM as
‘off-the-shelf’ generic reforms that may not work in local situations. The lessons from
implementing IWRM in South Africa (Anderson et al., 2008) highlights the need for a concerted
effort towards identifying implementation mechanisms and approaches rather than debating on
the definition of IWRM. As IWRM over emphasised policy and legislations, it hardly brought
any tangible change or promoted poverty reduction at the grassroots level. South African cases
indicated a long gestation period which disillusioned people leading to reversal to old practices.
They showed that IWRM is most effective when initiatives actively empower disadvantaged
groups through their involvement in projects that serve to improve the livelihoods and well-being
of communities. While the benefits exist, the implementation has been slow, due to uses of a
'command and control' regime to manage water demand across a river basin by IWRM approach
(Lankford and Hepworth, 2010).
The three objectives of IWRM are conflicting and difficult to achieve together (Figure
5.2). As a result, the entire process appears to be naturally steered by the state leading to
paternalistic, technocratic and bureaucratic top-down approaches (Molle, 2008). This author
found that efforts to improve water management, for instances through the introduction of

172
irrigation management transfer (IMT) in Sri Lanka, tradable water rights in Sri Lanka, Bolivia,
Ecuador and Peru, participatory irrigation management (PIM) in Pakistan, irrigation water
pricing in Thailand, have not actually picked up, instead citizens have resisted. According to him
the beneficial impact of the IWRM movement has been to disseminate socially and
environmentally sensitive concepts and, perhaps, to inspire a new generation of water
professionals. Butterworth et al. (2010) reason out that the vagueness of the concept itself could
be the primary cause for delayed achievement of impacts from IWRM implementation. Further
non-inclusion of concerns of poor and marginalized people in IWRM projects is often a cause for
grievance (Merrey, 2009). Some of the common criticisms on IWRM (Butterworth et al., 2010)
are listed below:
• Vague concept: in terms of what aspects to be integrated, how, by whom,
• Not sufficiently people-centred and limited stakeholder participation,
• Non conformity to adaptive management principles,
• Ignorance of customary/traditional/local water management strategies, and
• Over emphasis on legitimacy.
GWP substantiates the drawbacks of IWRM to application as the blueprint does not
deliver concrete benefits. As there is the risk of linking too many variables without clear
objectives which can stall IWRM processes (GWP, 2009). However, the effectiveness of the
IWRM approach can be enhanced by uses of the right mix of hard and soft tools. Despite the
criticisms, GWP claims that social and economic life is more secure in areas where IWRM is
implemented than it otherwise would have been, as an outcome of better water management
(GWP, 2009). GWP also enlisted the key lessons from the review of the case studies as follows:
• IWRM is not a one-size-fits-all prescription and cannot be applied as a checklist of
actions. Pragmatic, sensibly sequenced institutional approaches that respond to contextual
realities have the greatest chance of working in practice.
• Water resource planning and management must be linked to a country’s overall
sustainable development strategy and public administration framework.

173
• Water management must ensure that the interests of the diverse stakeholders who use and
impact water resources are taken into account.
• Approaches to water resources management will evolve as the pressures on the resource
and social priorities change. The challenge is to develop institutions and infrastructure
that can adapt to changing circumstances.
• While the river basin is an important and useful spatial scale at which to manage water,
there are often cases where it is appropriate to work at smaller sub-basin scale or at a
regional multi-basin level.
The command and control approach in NRM does not work, even for water. A top-down
approach, without a shared legitimacy of decision over water, indeed leads to non-compliance of
rules and over-exploitation of resources (Lankford and Hepworth, 2010). Multi-stakeholder
platform (MSP) is a negotiation approach which helps in legitimizing, at least in part, by
demonstrating a high-quality process. To do so requires attaining and maintaining high standards
of deliberation, facilitation, inclusiveness, information exchange and communication with the
participants and wider constituency (Dore et al., 2010). Not discerning the well-tested
approaches, the three basic types of "water rights" systems will always prevail and are: (i)
riparian - only those owning the land in physical contact with a natural watercourse have a right
to use it; (ii) prior appropriation - based on beneficial and actual use; and (iii) public
administration - a public authority authorizes water distribution and use. Prior appropriation and
public administration are the most common systems in use throughout the world (FAO,
1993).With uncertainty of IWRM impact and basic water rights systems, concepts which are
more decentralised, local based, collectively owned and oriented to locally agreed standards have
been proposed. Among them Polycentric52 WRM appears to be a pragmatic management
approach with micro-catchments as sub-units of basin built of legal framework of customary
laws and reflexive law which is self-regulating, self-referenced and rationale. It is also more self-
regulating compared to IWRM which is less open to a decentralised, modular and informal
mode, on to which more formality and federalisation may be associated in the future (Lankford
and Hepworth, 2010).
52 Polycentric is the term that most appropriately characterises the alternative to IWRM; it denotes the division of the basin into a mosaic of nested subunits rather than integrating it into a hierarchical whole (Ostrom, 2009).

174
Water resource management poses both challenges and opportunities. The challenges
arise mostly from two aspects. The first one is related to “power and control” over the water
resources. The challenges further arise from the way the state operates a centralized regulatory
approach to manage the resources and when the bureaucratic process ignores local institutions,
and norms, there is always a tension of non-compliance of legal frameworks. Further any well
intended interventions of the state are considered as top-down and have the problem of
legitimacy. Secondly the mismatch between the global and local issues and strategies could be a
major hurdle in many developing countries as local capacities vary extremely. In addition when
the governments of developing countries agree to global movements of natural resource
management like IWRM, Participatory irrigation management (PIM), and Irrigation management
transfer (IMT) the issues consolidated at the global level often do not have local essence.
Therefore the strategies too are inconsistent to the local issues.
In parallel the water management issue provides opportunity mainly as it can vertically
be linked from local to regional to national, and now global, which can provide a prospect to
enhance citizen engagement in governance within the principles of polycentric governance. As a
broad-based planning platform polycentric WRM helps in realizing the multifunctional nature of
water resources, its linkages and influences which broaden the scope, relevance and ownership
of the intervention.
This review provides a better understanding of the need for generating knowledge,
capacities (social and institutional), and communication through trust building, collaboration and
value formation. This new found social capital should lubricate interplay between formal and
informal institutions and bridge them to promote adaptive management. It is also evident that
within the constantly changing SES there will always be a need for adaptive management
systems, vibrant institutional arrangements, and polycentric governance which too evolves.
Chapter 6 will examine if and how collaborative modelling can help in generating such
knowledge, capacities, communication, trust building, collaboration and value formation as the
way forward in water management.

175
CHAPTER 6
STATE OF THE ART IN COLLABORATIVE MODELLING
Social-ecological systems (SES) are often referred as complex adaptive systems with
heterogeneous domains and functional diversity (Janssen et al., 2004) and the ability of society
to respond to resource management issues depends on information, governance, social processes
and structure (Adams et al., 2003). In such situation, it is important to enhance communication
by reducing complexity to help people find meanings and shared understanding (Sierhuis and
Selvin, 1996). Models have been used to simulate the human process of learning in systems
thinking and practices to communicate complex interrelationships, communicate concepts,
search for new insights about how systems functions, and evaluate scenarios (Wilson and
Morren, 1990). Models also have the ability to represent the system structure and dynamics in a
simplified form to enhance understanding of social and bio-physical processes (Kolfschoten et
al., 2008). Since models developed by researchers alone are of little use in situations of joint
management of natural resources, collaborative modelling approaches facilitate to effectively
share and generate new knowledge, and relate information for better understanding of the
systems and guide management decisions (Costanza and Ruth, 1998). Importantly collaborative
modelling helps segregate factual conflicts from value conflicts aiding to build trust in the
analysis and to arrive at a shared vision of how the system can work. Collective shared
understanding of key factual issues enables beneficial debate on the issues. Collaborative
modelling also fosters learning among stakeholders and decision makers about both the system
and the stakeholder’s needs (Lorie and Cardwel, 2006).
6.1 Collaborative modelling and NRM
The scope of NRM is so wide that no single institution has jurisdictional responsibility
(Bellamy et al. 2002, 2005). NRM takes place in complex human landscapes with multiple
stakeholders such as local people, various levels of government, non-governmental
organizations, and private sector actors who have different perspectives, interests, entitlements,
knowledge, capabilities, values and power (McDougall and Braun, 2002). Often the NRM
policies are vague, persistent, socially constructed and often disputed for being top-down (Rittel

176
and Webber, 1973). Such complexities pose difficulty to comprehend the issues in a holistic
manner and conceive relevant management strategies. Modelling helps to unravel and simplify
complexity in natural resource management systems and supports a shared contextual
understanding among stakeholders as base for dialogue oriented interactions (Rammel et al.,
2007). Although local knowledge is a vital source of indigenous knowledge, it alone is not
sufficient for rural development (Ostrom et al., 1993). Traditionally, models were constructed by
experts and scientists who are much more detached from the decision-making process than the
actors who have a stake in the NRM issue that is decided upon. In contrast collaborative or
participatory modelling approach is one means to integrate knowledge of local stakeholders in
the modelling process to elucidate the interrelationship between users and resources (van
Walsum et al., 2007; Zorilla et al., 2009), and the common understanding it develops helps to set
up sustainable management strategies (Foster and Loucks, 2006). This implies that a NRM
model should represent the physical aspects of the resource, the social aspects of its utilization,
and the interactions between these aspects (Bots and van Daalen, 2008). While a collaborative
modelling process is a positive way for stakeholders to express their views and interests in
managing a resource, and encourage collaborative learning through participation (Purnomo et al.,
2003), there is always a mismatch between what models can deliver to what is expected by the
participating stakeholders. Sometimes the time taken to process the data may wane off
participants. As specified by Bots and van Daalen (2008) the outputs of models deal with six
different purposes: research and analysis, design and recommend, provide strategic advice,
mediate, democratize, and clarify arguments and values. Therefore in participatory modelling,
model applicability, accessibility and accuracy needs to be evaluated and understood by
participants and modellers (Johnson, 2009). The success of the collaborative modelling exercise
will depend on the choice of the model, the integration of participants’ knowledge and opinion,
the transparency of the process, the continuity of participation, application of model by the local
stakeholders and the efficiency of the modeller (Johnson, 2009; Purnomo et al., 2003).
Voinov and Bousquet (2010) posits participatory modelling as a powerful tool to enhance
stakeholders knowledge and understanding of a system and clarify the impacts of solutions to a
given problem to support decision making, policy, regulation or management. Their elaborate
review on modelling with stakeholders listed group model building, mediated modelling,

177
companion modelling, participatory simulation, and shared vision planning as some of the
modelling tools where stakeholders are engaged. Based on the review (ibid), Companion
Modelling can be classified as one of the collaborative modelling approach that supports generic
principles of good participatory modelling (Table 6.1).
Table 6.1. Some generic principles of good participatory modelling.
- Flexible and focused on the process rather than the product. - Opens and evolving - Promotes adaptive management and adaptive decision making - Maintains societal and scientific openness, and transparency of methods and models. - Relies on collaborative research, and open source models - Always be aware of social and group dynamics, special interests, power and hierarchies - Facilitates and encourages learning from each other and the process - Supports iterations - Accommodates uncertainty and non-traditional metrics of success
(Source: Voinov and Bousquet, 2010) 6.2 Origin of Companion Modelling
The management of SES characterized as a complex ecosystem has shifted from
reductionist, command and control science and management to a more integrated, adaptive,
systems-based approach (Berkes and Folke, 1998; Holling et al., 2002). Similarly during 1970s
the analytical tools also shifted from static to dynamic systems. To handle the complex dynamics
of SES and its interactions, Multi-agent systems (MAS, also referred as agent-based modelling)
are considered as promising tools (Janssen, 2002). Computer MAS provide an innovative
perspective to represent human agents in modelling by making use of the cellular automata
technology to represent agents53 as computerised independent entities capable of acting flexibly
(goal-directed, reactive, and interacting with other agents) and autonomously in a common
53 Minimal definition of agent and MAS: An agent can be a physical or virtual entity that can act, perceive its environment (in a partial way) and communicate with others, is autonomous and has skills to achieve its goals and tendencies. It is in a multi-agent system (MAS) that contains an environment, objects and agents (the agents being the only ones to act), relations between entities, a set of operations that can be performed by the entities and the changes of the universe in time and due to these actions (Ferber, 1999).

178
environment having its own dynamic. A MAS is an assembly of agents54 with specific goals
capable of perceiving, communicating, interacting and acting in an environment with other
agents (Ferber, 1999) (Figure 6.1).
Figure 6.1. Multi-agents system general organization and principles (adapted from Ferber, 1999).
The potential for increased understanding of how changes in individual behaviour affect
the behaviour of the SES at larger scales is part of the motivation of what has come to be called
multi-agent modelling in the resource management and ecological economics literature (Janssen,
2002). MAS also bring a radically new solution to the concept of modelling and simulation in
environmental sciences by offering the possibility of directly representing individuals, their
behaviour and interactions (Ferber 1999). In resource management, the underlying principle of
MAS as the interaction between agents provides potentials to understand the relationships among
agent behaviours, their interactions, and the resulting dynamics at different levels of organization
(Barreteau et al., 2001; Anderies, 2002; Bousquet et al., 2002). MAS with the capacity to create
virtual societies can be used to simulate dynamics and associated feedbacks in resource systems.
Based on the constructivism theory, people construct reality within their capacity of
experiences, and knowledge (Röling, 1996). This theory broadened the scope for the collective
54 Three different kinds of agents can be distinguished: humans who differ in mental maps, goals, locations, and abilities; non-humans such as animals and plants; and passive agents such as non-living entities (Janssen, 2002).
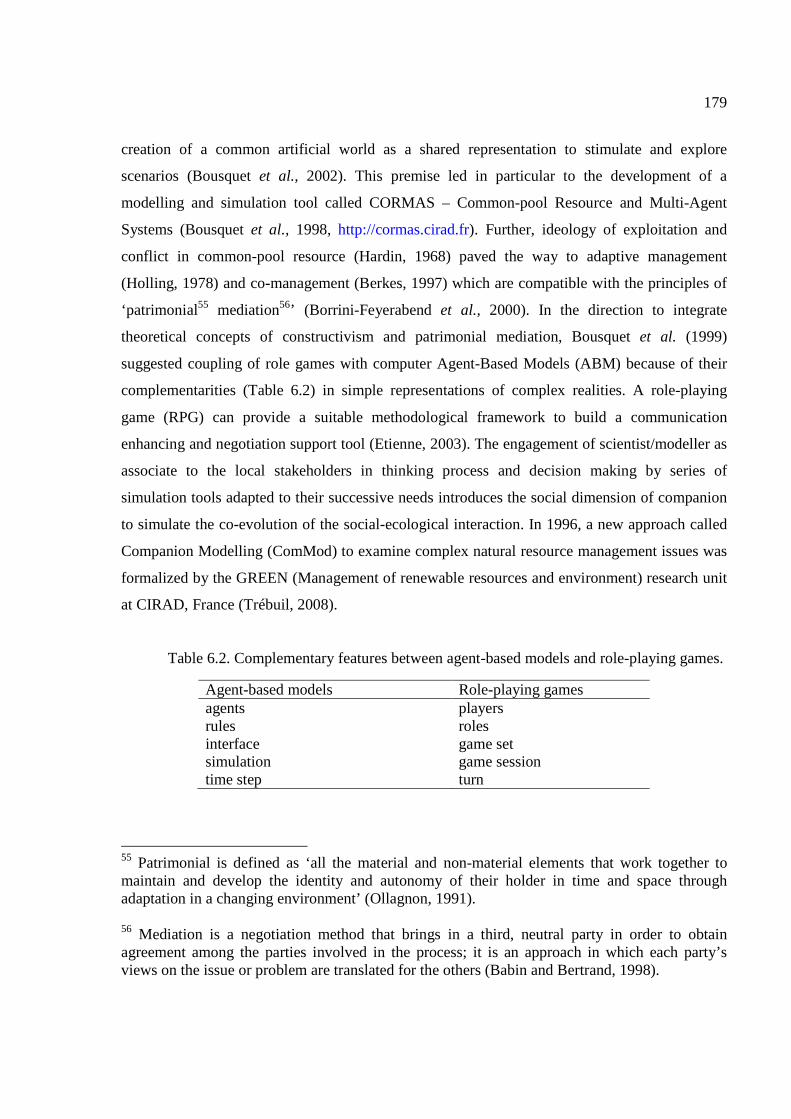
179
creation of a common artificial world as a shared representation to stimulate and explore
scenarios (Bousquet et al., 2002). This premise led in particular to the development of a
modelling and simulation tool called CORMAS – Common-pool Resource and Multi-Agent
Systems (Bousquet et al., 1998, http://cormas.cirad.fr). Further, ideology of exploitation and
conflict in common-pool resource (Hardin, 1968) paved the way to adaptive management
(Holling, 1978) and co-management (Berkes, 1997) which are compatible with the principles of
‘patrimonial55 mediation56’ (Borrini-Feyerabend et al., 2000). In the direction to integrate
theoretical concepts of constructivism and patrimonial mediation, Bousquet et al. (1999)
suggested coupling of role games with computer Agent-Based Models (ABM) because of their
complementarities (Table 6.2) in simple representations of complex realities. A role-playing
game (RPG) can provide a suitable methodological framework to build a communication
enhancing and negotiation support tool (Etienne, 2003). The engagement of scientist/modeller as
associate to the local stakeholders in thinking process and decision making by series of
simulation tools adapted to their successive needs introduces the social dimension of companion
to simulate the co-evolution of the social-ecological interaction. In 1996, a new approach called
Companion Modelling (ComMod) to examine complex natural resource management issues was
formalized by the GREEN (Management of renewable resources and environment) research unit
at CIRAD, France (Trébuil, 2008).
Table 6.2. Complementary features between agent-based models and role-playing games.
Agent-based models Role-playing games agents players rules roles interface game set simulation game session time step turn
55 Patrimonial is defined as ‘all the material and non-material elements that work together to maintain and develop the identity and autonomy of their holder in time and space through adaptation in a changing environment’ (Ollagnon, 1991). 56 Mediation is a negotiation method that brings in a third, neutral party in order to obtain agreement among the parties involved in the process; it is an approach in which each party’s views on the issue or problem are translated for the others (Babin and Bertrand, 1998).

180
As per the ComMod charter (Barreteau et al., 2003), this approach is designed to deliver
an improved understanding of the complex processes through a mutual recognition of collective
representation of the issue at stake to enrich the decision-making process in terms of technical
information and social aspects. A general feature of ComMod is that the models are designed and
refined in a process involving the participation of stakeholders and experts (Scott, 2008). Based
on the above principles, the most important theoretical foundation of ComMod are the science of
complexity, post-normal science, and the constructivist epistemology.
6.3 Theoretical background
6.3.1 Science of complexity
Complexity refers to a simple event at micro level leading to the emergence of complex
phenomena at macro level (Jiggens and Röling, 2002). Complexity elaborates how physical and
social phenomena persist to exist within the constant order and disorder displaying multiple
equilibrium and with interactions between elements. Thus complex systems are potentially
unstable but also unpredictable (Urry, 2005). The complexity of living systems of people and
nature emerges not from a random association of a large number of interacting factors but rather
from a smaller number of controlling processes (Holling, 2000). The concept of complexity is
the notion that “any complex whole is more than the sum of its parts” (Haynes, 2003). A
complex system is one in which numerous independent elements continuously interact and
spontaneously organize and reorganize themselves into more and more elaborate structures over
time, as small set of critical processes create and maintain this self-organization (Holling, 2001).
In other words, complex systems are characterized by emergent structures on a macro scale
influenced by interactions between micro level agents (Janssen, 2002). Within this frame, SES
can be seen as complex adaptive systems (Janssen et al., 2004). Social and natural worlds are
interdependent and co-evolving, subject to discontinuities and shocks stemming from various
dynamic sources. As such social science emphasizes the complex, self-organizing, non-linear
characteristics of social, technical and natural interactions (Urry, 2005).
The 10 key concepts of complexity science and their key characteristics put into three
sets by Bennet et. al. (2008) provide a way of better describing and understanding dynamics and

181
processes of change found in a range of physical and biological phenomena. (i) systems –
interconnected-interdependent elements, feedback processes, and emergence, (ii) change –
nonlinearity, sensitivity to initial conditions, phase space, chaos and edge of chaos, and (iii)
agency – adaptive agent, self-organization, and co-evolution. These characteristics of complex
systems also lead to uncertainty in outcome therefore poses difficulty in modelling (Holling,
2001). The SES with its complexity features has self-reinforcing mechanisms that prevent shifts
into other configurations (Folke et al,. 1998, Gunderson and Holling, 2002) which will be
important to understand and capture. The emergent phenomena of the complex SES can be
studied and predicted (Bradbury, 2002) as it provides insights as to how simple local rules lead
to emergent macro-level structures (Janssen, 2002).
Considering the diversity of stakeholders (agents) and spatial settings (distribution of
resources in an environment), MAS is a promising approach that focus to understand persistent
emergent phenomena arising from context dependent, non-linear interactions of the objects and
rules (Janssen, 2002; Holland, 1998). In the SES, the local individual actions generate emergent
global dynamics, and modelling individual behaviour of interacting heterogeneous agents to
understand changes in collective NRM inspired MAS applications (Anderies, 2002).
6.3.2 Post-normal science
In search of scientific means to enquire phenomena (or processes) of biological
organization and human interaction, Gregory Bateson first made reference of a new kind of
science in 1958 which later came to be known as ‘post-normal science’ (Tognetti, 1999). The
management of natural resources in a rapidly changing environment is not straight forward, as
social factor loom large (Wilson and Morren, 1990). Further the difficulty arises from the
tendency of ecosystems to change over time in an unprecedented manner, more so when the
resource is under pressure. In an overexploited ecosystem change is rapid and outcomes are
unpredictable both quantitatively and qualitatively (Holling, 1986; Gunderson et al., 1995). This
unpredictable emergence further adds to the complexity of SES. To fully understand the
complexities of uncertainties, plurality of legitimate perspectives, and their services have been
considered beyond the realm of science (Watzold and Schwerdtner, 2005; Hulme 2007; Francis,
2009). Conventionally a system is defined based on its elements and their interaction from the

182
researcher’s perspective (in economics, forestry, hydrology, etc.) disregarding others as simply
systems noise (Waltner-Toews et al., 2003), implying that inability of normal science to capture
holistically. In situation where “facts are uncertain, values in dispute, stakes high and decisions
urgent”, post-normal science is an appropriate methodology for managing complex issues
(Funtowicz and Ravetz 1993, 1994). Post-normal science also provides a means of enquiry of the
relationship between humans and environment in a hierarchical framework of systems (Tognetti,
1999), thus engaging stakeholders impacted by decision and the process as in the case of SES
(Hemmati, 2002).
Collaborative modelling draws the essence of using local knowledge from the theory of
post-normal science. This is in contrast with normal science, characterized as an extension of
laboratory, puzzle-solving approaches that externalize uncertainty and are not appropriate for
addressing complex global environmental problems. The key challenge in post-normal science is
the need for reflexive discourse in the decision process that allows for diverse kinds of
knowledge and perspectives to facilitate mutual learning among public officials and other
stakeholders as to what the trade-offs and uncertainties are, including how they are distributed
(Tognetti, 1999).
The ComMod approach which involves stakeholders from conceptualization to model
building, to gaming and scenario simulation is built on the ambition to support multiple and
diverse perspectives, broadening the frame of reference and view problems in a larger context. It
also promotes reflexive discourses to establish shared learning and to enhance collective
decision-making process.
6.3.3 Constructivist epistemology
Jean Piaget’s concept of the ability to accurately represent the world and perform logical
operations on mental representations of concepts grounded in interactions with the world was
decisive to introduce the theory which von Glasersfeld (1985) formulated as ‘constructivism’.
Constructivism, unlike nativist57 and empiricism58 theories asserts that we construct our cognitive
57 which describes cognitive development as the unfolding of innate knowledge and abilities.

183
abilities through self-motivated action in the world. Two principles dominate the theory of
constructivist epistemology as (i) radical constructivism: knowledge is actively built by
cognizing subject, and (ii) cognition is adaptive: it serves the organization of the experimental
world and not the discovery of ontological reality (von Glasersfeld, 1985). Radical
constructivism is radical because it breaks with convention and develops a theory in which
knowledge does not reflect an “objective” ontological reality, but exclusively an ordering and
organization of a world constituted by our experience. The radical constructivist has relinquished
“metaphysical realism” once and for all, and finds himself in full agreement with Piaget, who
said: “intelligence organizes the world by organizing itself.” Knowledge as multiple perceptions
are not the logic of reality, rather it is always the logic of your experiences (Bettoni and Eggs,
2010). Knowledge is always the result of a constructive activity rather than the accumulation of
propositional data (such as position and heights of mountains). In other words, constructivism
shifts the focus of attention from the propositional “knowing that” to the pragmatic “knowing
how.” (Riegler, 2005). Central to constructivism is its conception of learning. von Glasersfeld
(1984) argues that "from the constructivist perspective, learning is not a stimulus-response
phenomenon. It requires self-regulation and the building of conceptual structures through
reflection and abstraction".
Chiari and Nuzzo (1996) argue that constructivism is an approach to overcome the
realism-idealism dichotomy, and distinguish two broad categories of constructivism:
"epistemological" and "hermeneutic". While epistemological constructivism believes that the
external reality (complex systems) can be represented in several ways, hermeneutic
constructivism implies that knowledge is an interpretation which can be contextually verified.
Constructivist approaches demand the inclusion of stakeholders in scientific explanations and
favours a process-oriented approach rather than a substance-based perspective. The cornerstone
of the ComMod approach is the active participation of the stakeholders in constructing reality
and developing shared representations of it to facilitate collective learning and acquisition of
knowledge. It is process-oriented and integrates new learning, sharing of multiple points of view,
58 which describe cognitive development as the gradual acquisition of knowledge through experience

184
and rely on fundamental principles and key tools to enhance the relevance of the process
outcomes.
6.4 Principles and objectives of ComMod
The flexibility of the MAS approach and the versatility of the RPG tool leads to an
incremental, progressive and iterative process to support inquiry of NRM in a complex SES
(D’Aquino et al., 2002). The diversity of stakeholders’ perceptions and unpredictability of the
change provides opportunity for application of ComMod (Bousquet and Trébuil, 2005). As such
the ComMod approach requires an enduring iterative confrontation between reality and theories
(Barreteau et al., 2003). Therefore, the principles of ComMod are (i) a constructivist approach,
(ii) an enduring iterative and engaged research process in which researchers are seen as one
category of stakeholders, (iii) systematic evolution of hypothesis by field actors in a transparent
way, and (iv) acceptance of all point of views as a priori legitimate ones.
Construction of an artificial world : In a highly complex world, ComMod provides a means to
integrate multiple perceptions of stakeholders including those of researchers to simplify the
biophysical and social environment representation the whole complexity of the system in a
holistic way (Bousquet et al., 2002). This posture is based on the theoretical concept of
constructivist epistemology recognizing that knowledge and understandings are constructed
based on the perceptions. In a ComMod process, the researcher becomes an actor of the system
under study and a facilitator of exchanges among its stakeholders. The researcher’s point of view
is only one among other legitimate ones (Trébuil, 2008). As specified in the ComMod Charter
(http://cormas.cirad.fr/ComMod/en ; Barreteau et al., 2003) this approach leads to process-
oriented research dealing with genuine stakes and an implementation in the field with the
concerned stakeholders. ComMod considers that stakeholders’ decision making processes need
to be elicited to understand interactions (Bousquet and Trébuil, 2005). Dealing with the
combination of complex and dynamic NRM issues, ComMod will take into account all multiple
legitimate points of view. Further to ensure consistent legitimacy of research findings, ComMod
emphasises conduct of fieldwork and modelling in unison (Bousquet et al., 2002) and systematic
monitoring and evaluation of the effects and impacts (Trébuil, 2008).

185
Enduring iterative process: ComMod approach being process-oriented and dealing with SES
issues characterised by complexity and unpredictability, it poses supports validation of process
feedback iterative cycles (Bousquet et al., 2002; Barreteau et al., 2003). This principle of
repeated iteration between the field and the laboratory is based on the principles of having
systematic refutation of all hypotheses made. The strength of ComMod lies on the several self-
reinforcing sequences alternating theoretical, analytical, and modelling activities with field work
(specific surveys, sensitizing activities, field workshops including gaming sessions and/or
participatory simulations, plenary debates, interviews, etc.) in an iterative but evolving fashion.
At the end of each loop, the conceptual model representing the system under study is revised as
well as the research hypotheses. The process facilitates stakeholders’ interactions to identify and
scope resource management problems to be discussed and negotiated. The simulation models are
used to collectively assess scenarios selected by stakeholders and may lead to new questions,
new discussions, and changes in the model (Barreteau, 2003). The principle can be best
represented by a continuum of cyclic loops of iterative sessions of RPG and ABM simulations
(Figure 6.2).
Figure 6.2. Schematic representation of a ComMod process on catchment management in Mae
Salaep, Chiang Rai, Thailand (Adapted from Barnaud et al., 2007).
In brief, the leading methodological principle of the ComMod approach is to develop simulation
models integrating various stakeholders’ point of view to use them for collective learning and

186
decision/negotiation support in a given context and on a given concrete NRM problem (Bousquet
and Trébuil, 2005).
Objectives of ComMod approach
As a modelling and simulation approach where stakeholders (people, researchers,
development workers and decision makers) participation is the basis for model design,
development and evaluation of scenarios, the general objectives of the ComMod approach is to
facilitate dialogue, shared learning, and collective decision-making through interdisciplinary and
implicated action-oriented research to strengthen the adaptive management capacity of the local
community (Bousquet and Trébuil, 2005; Trébuil, 2008; Ducrot and Botta, 2009). Based on this
general objective, there are two specific objectives which forms the foundation of the ComMod
approach (ComMod Charter - http://cormas.cirad.fr/ComMod/en ), they are:
• Understanding complex environments, and
• Supporting collective decision-making processes in complex situations.
Understanding complex environments
An important feature of ComMod is its ability to integrate various stakeholders’ points of
view and provide a means to identify acceptable form of simplification to better understand how
a given social agro-ecological system is structured and is evolving (Bousquet et al., 2002;
Trébuil, 2008). This can be achieved using two perspectives, (i) researchers using a positivist
paradigm to discover the objective truth to unravel the natural laws driving the system, and (ii)
from the constructivist epistemology paradigm, it is assumed that people construct their own
realities through learning along social processes (Bousquet and Trébuil, 2005). For centuries
farmers have innovated and developed knowledge about NRM by relating to the whole system of
concepts, beliefs and perceptions that people hold about the SES (Warburton and Martin, 1999).
Local knowledge of natural resources is made up of three types of information: 1) accumulated
cultural knowledge, 2) knowledge modified through contact with other cultures, and 3)
progressive learning of the environment (Niamir, 1990). While it is vital to capture and
understand such local knowledge when intervening in any society, it is necessary to be aware of

187
possible differences and complexities in how people view the world around them, and in how
they interact with each other. Without romanticizing local knowledge, a blend of formal science
and local knowledge may prove to be an effective development approach (Niamir, 1990). The
dialogue among researchers, the model and the field actors in the ComMod process is an iterative
research one aiming at a better understanding of the system under study, particularly the
interface between its ecological and social dynamics, and the various points of view facing each
other in the local stakeholders’ arena (Trébuil, 2008). The common vision/understanding on
resource management would lead to the identification of new shared representations of the
system to be improved, indicators of ecological (state of the resource) and socio-economic
(including equity among types of stakeholders) performances, monitoring procedures,
information systems, and the negotiation of concrete alternatives for action (Bousquet and
Trébuil, 2005).
Procedurally, researchers use participatory diagnostic surveys and literature reviews to
collate existing knowledge (field-based and pre-connived) on the problem at stake to build a first
preliminary conceptual model. The researcher’s perspective in the form of a model is presented
to the stakeholders most of the time as a RPG which generates new understandings and
viewpoints resulting in the revision of the model to address new questions or to improve dealing
with the initial one. The new version of the model is again put to the stakeholders and further
generates new phenomena both in terms of model output and knowledge exchange and
acquisition. This iterative process and cycles generates a family of models with specific
hypotheses and objectives. It can build up into a legitimate knowledge-base to deliver improved
understanding of the local socio-ecological processes (Berkes and Folke, 1998).
Support collective decision-making processes in complex situations
Managing a SES characterized by unpredictable future functions (Janssen et al., 2004)
poses challenge in decision-making. As such a complex and continuously changing state call for
series of imperfect and adaptive decisions (Brehmer, 1992). Complex systems often display
regions of extreme sensitivity to the particular assumptions, while at the same time exhibit
important regularities of macro behaviour posing deep uncertainty of a type that strains the

188
traditional59 methods of decision analysis, vital to the systematic examination of policy
alternatives (Lempert, 2002). As the complexity intensifies, decision-making at all levels must
increasingly rely on their intuition and judgment (Bennet and Bennet, 2008). However, with the
help of simulators, decision-makers construct insights by watching and discussing the outcomes
of a variety of scenarios generated by the model and reach consensus on strategies even when the
members cannot agree on the most likely future (Lempert, 2002). Through its iterative processes,
the ComMod approach can significantly contribute to the stimulation of mediation and
negotiation among the concerned stakeholders elucidating shared point of view (Barreteau et al.,
2003; Trébuil, 2008). ComMod supports both models of dynamic decision-making approach, (i)
individual difference approach where behaviour of groups differing in performance is compared
and (ii) experimental approach where the effects of system characteristics, such as complexity
and feedback delays, are considered for dynamic decision-making (Brehmer, 1992).
6.5 Implementation of ComMod processes and tools
A ComMod process is made of three main stages which can follow iterations based on
the objective of research (Bousquet and Trébuil, 2005).
1. Formulation of hypothesis for modelling,
2. Modelling,
3. Simulations and assessment of scenarios.
Step 1: Formulation of hypothesis for modelling
The process starts with problem definition, review of information and literature on the
issue to be studied. Based on which a team of researchers will interact with stakeholders to
gather relevant information on the system under study (Bousquet et al., 2002). From the premise
of constructivism, stakeholders possess diversity of local knowledge, perceptions and belief
system which has evolved over generations (Warburton and Martin, 1999). Knowledge can be
sourced internally and externally, internal would imply the knowledge of the local stakeholders
at the study site while external would mean regional, national and international sources (Svetina
59 Traditional decision analysis rests on key assumptions about the types of information available to the decision-maker.

189
and Prodan, 2008). While the researchers (modellers) bring the external knowledge, the real time
local realities can come from the collaborative stakeholders. Several participatory techniques
focusing on agents, the resource at stake, and their interactions are used to make a diagnostic
analysis for establishing hypotheses for modelling (Bousquet and Trébuil, 2005). Agrarian
system diagnosis (see chapter 3), stakeholder and institutional analyses are valuable tools to be
used at this stage as the challenge of the initialization phase is to enable stakeholders to express
their perceptions of the present situation and of its evolution, in order to characterize the
diversity of points of view in the stakeholders’ arena (Trébuil, 2008). Through this process, it
ensures a co-construction of hypotheses that becomes a basis for modelling and enhances the
ownership of the process.
Step 2: Modelling
This step focuses on the conceptualization and co-design of models. With the shared
understanding from step 1, most often researchers conceptualize the way shared knowledge can
be represented in the model and submit their propositions to the stakeholders in the form of RPG
for them to assess, improve or reject (Bousquet et al., 2002). Actor-Resource-Dynamics-
Interactions (ARDI, see also below) is a participatory technique which can facilitate the
involvement of stakeholders in developing a diagrammatic shared representation and in co-
designing a conceptual agent - based model related to the NRM issue to be examined (Etienne et
al., 2008). In addition to ARDI, conceptualization can be further strengthened through
discussions, reviews of the existing knowledge from various sources, and specific field surveys.
To elucidate agents (social, ecological, and physical types) and their interactions graphically, the
Unified Modelling Language (UML60) can be effectively used as it facilitates elicitation and
participation in conceptualization. Based on the conceptual model, a RPG can be constructed or /
and a computer ABM programmed in the CORMAS platform. The model usually in the form of
RPG is shared with the stakeholders to see if it adequately represents the realities as perceived by
the stakeholders. To enhance stakeholder’s participation and understanding, the computer ABM
60 UML, or Unified Modelling Language, is a specification language that is used in the software engineering field. It can be defined as a general purpose language that uses a graphical designation which can create an abstract model.

190
is translated and implemented in the form which is used to play with the society. The coupling of
ABM and RPG tools helps in:
- Understanding the model, and more precisely the difference between the model and reality,
- Validation by examining the individual behaviour of agents and the properties of the whole
system emerging from their interactions, and by proposing modifications, and
Enabling to understand and follow ABM simulations run on the computer, and to propose
scenarios to be collectively assessed and discussed following their simulations.
This process helps in the validation of the model parameters and its ability to simulate
scenarios to interact with the users for joint exploration.
Step 3: Simulation
The final RPG and computer ABM are used interactively to challenge the former
understanding of the system with new emergent understandings from simulations (Bousquet and
Trébuil, 2005). Computer ABM have definitive advantage of generating multiple scenarios over
a long range which RPG cannot handle due to difficulty in managing the players over long and
repeated sessions and handling voluminous data generated from the RPG (Trébuil, 2008).
Collective identification of parameters and tentative scenarios, which can be simulated over an
agreed time frame helps in bridging computer model and the stakeholders, and legitimizes the
scenarios thus generated. Comparing and exploring scenarios help in the generation of shared
learning that can improve communication and coordination among stakeholders to mitigate the
problem at stake.
The twelve steps of a ComMod process
From the methodological perspective, a ComMod process can be further subdivided into
five main phases: (i) initialization of the process, (ii) co-construction and conceptualization of
models with stakeholders, (iii) implementation and validation of models, (iv) scenario
identification, exploration and assessment, and (v) monitoring and evaluation. These phases are
further segregated into 12 steps as shown in Table 6.2.

191
Table 6.3. The 12 Steps of a companion modelling process.
Step Description Sensitization Introduction of the ComMod approach to key stakeholders requesting to
look into a given development question, and assessment of its suitability and possibility to use it in the local context
Problem definition Definition of the key question to be examined, by the process leaders and, sometimes, other stakeholders as well
Enumeration of knowledge
Inventory of relevant scientific, expert, and indigenous knowledge available through literature review & complementary diagnostic surveys to fill the gaps
Inquiry/Probing Knowledge elicitation for modelling via surveys and interviews Conceptualization Co-design of the conceptual model with stakeholders concerned by the
question being examined Implementation of model
Choice of the tool (computer-based or not) and model implementation
Verification of model Model verification, validation and calibration with local stakeholders
Definition of scenario Identification and definition of scenarios with local stakeholders
Exploration of scenario Exploratory simulations with local stakeholders Communicating the output
Dissemination of the outputs towards stakeholders who did not participate in the process
Monitoring and evaluation
Monitoring-evaluation of the effects of the ComMod process on participants (awareness, knowledge, communication, behaviour, decision, practices, etc.)
Training Training of interested stakeholders on using the tools produced during the collaborative modelling process
Tools used in ComMod approach
As ComMod is an action-oriented approach it heavily depends on the quality of
information fed to the system. Despite the two main tools of ComMod (computer ABM and
RPG), there is no fixed protocol in terms of type of tools and structure used (Trébuil, 2008;
Dumrongrojwatthana, 2010). In the absence of specificity, it is important to use appropriate tools
in a logical sequence depending on the situation and the issue to be examined. This is to facilitate
unconditional knowledge elicitation from diverse sources to support envisioning collective
consequences of individual decisions, based on which negotiation can happen to formulate a
common goal and action plan based on collective decisions (Souchère et al., 2008).

192
Actor, Resource, Dynamic, and Interaction (ARDI) technique
The ARDI technique (or any similar one) can be used to collectively identify the
principal stakeholders concerned with the key question, their management entities, the resources
used and the main processes driving changes affecting these resources (Etienne et al., 2008a).
ARDI is a participatory tool focusing on (i) principal resources of the territory, (ii) main
stakeholders involved in the use and management of resources, and (iii) main processes that
influence changes in resource dynamics. After the actors (stakeholders) and resources are
identified, main processes that induce changes in the system (ecological, economic, and social
dynamics61) are elucidated. Subsequently, stakeholders collectively identify interactions and
linkages between resources and actors. The outcome of these four steps is a graphical
representation of how stakeholders perceive the system to function – truly a shared mental model
(Etienne et al., 2008b).
Role-playing game
The computer ABM as explained earlier is resourceful for laboratory experiments, its full
utility can only be achieved if it can be used in the field where the natural resource problem
exists. In this context, the use of a RPG helps to open the computer ABM black box (Barreteau,
et al., 2001).
While RPG is generally used as a tool in training, research or policy making (Bousquet,
2001; Barreteau, 2003), it can also be used as a communication enhancing, knowledge exchange
and negotiation support tool. RPG finds its uses in creating a situation for players that is
comparable to one they might encounter and from which they learn the consequences of the
reactions they might have. A RPG can also be used to study behavioural patterns in contrasting
situations (Barreteau, 2003). In ComMod, depending on the situation, the MAS conceptual
model is simplified into a RPG to support participatory exploration and validation of the model
and to identify suitable scenarios to plan simulations. In most cases, the final version of the RPG
61 Examples of ecological dynamics are: vegetation transitions or water flow; economic dynamics (market price-changes, subsidies amount), and social dynamics (social cohesion, knowledge transfer, etc.).

193
is coded into a computer ABM to allow time efficient simulations of multiple scenarios and
leave enough time for the joint exploration of their outcomes.
Agent-based modelling
The trajectory of NRM models from optimal control of a simple system to an approach
that facilitated progressive learning to manage the given resource base through active
experimentation, was influenced by the realization that the scientific understanding necessary to
define the problem sufficiently to apply control was either too costly or altogether impossible
(Anderies, 2002). Considering the variety of problems, their scale, and its influence to livelihood,
stakeholders will deny to experiment with their livelihood (ibid.). In such situation the principles
of Cellular Automata and Agent opened up the opportunity to model social agents and virtual
societies (Bousquet et al., 2002; Janssen, 2002), within a prescribed rules, as in reality (Ostrom,
1994). In ComMod models, types of agents, rules, interface, time steps and protocols are
collectively defined with the stakeholders, which can be derived from the ARDI exercise
(Etienne et al., 2008a). An abstract model is developed to study and understand the generic
properties of interacting processes, based on which an applied model is formalized which is used
for experimentation (Bousquet et al., 2002).
Most of the ComMod process uses the CORMAS platform as the simulating framework.
It has been developed to provide a multi agent environment for simulating the interactions
between heterogeneous agents and a shared environment (Bousquet et al., 1998).
Monitoring framework and tools
In an attempt to formalize a monitoring process, logbooks have been effectively used to
maintain chronological records of actions by all stakeholders and their effects
(Dumrongrojwatthana, 2010). This dataset can precisely locate interventions and occurrence of
regular tendencies or unexpected emergence. As the information maintained comes from
individual stakeholders, it also ensures tracking the process and allows a detailed analysis of
what happened along the way.

194
The Most Significant Change (MSC) technique is another participatory monitoring and
evaluation tool that can be used. It is a monitoring tool as it can be applied during the process
and an evaluation means as it can provide impact and outcome data to assess the performance
(Davies and Dart, 2005). MSC involves the collection of significant change stories emanating
from the field level and selecting (or collating) the most representative MSC story. This can be
very rapidly assembled with minimum preparation and can enhance the legitimacy of the
narration and verifiability of the impact.
The conscious process of incorporating multiple domains (bio-physical, socio-political,
economic) in INRM (Campbell et al., 2001) becomes complex owing to multiple scale of
interaction; high frequency of nonlinearities, uncertainty, and time lags in complex system
(Campbell et al., 2003; CGIAR Task Force on INRM, 2001). Considering the complexity in
INRM, impact assessment and evaluation are indispensable to play more self-critical learning
roles. Such studies need to address the ‘why?’ questions and most importantly, what are the
drivers that determine success or failure (Mackay and Horton, 2003). Often the outcomes of any
interventions in INRM paradigm which happens over a period are influenced by other actors and
factors (Campbell et al., 2001; Douthwaite et al., 2003; Springer-Heinze et al., 2003). Therefore,
in contrast to ex-ante impact assessment of set priorities and ex-post impact assessment of
attribute, evaluation of INRM needs assessment within project cycles to support the learning of
all stakeholders and supporting adaptive project management. Impact Pathway Evaluation (IPE)
is a monitoring and evaluation approach that includes the processes by which stakeholders learn
and negotiate based on evaluation findings (Douthwaite et al., 2003).
As a given ComMod process is characterized by a sequence of tools and procedures used
in an iterative mode, its monitoring and evaluation framework should capture the reflexive
dimension (Jones, 2008) in order to understand why and how the approach works that foster
experiential knowledge (Webler, 1999). The framework for evaluating such participatory
modelling processes proposed by Jones et al. (2008) provides a frame to analyze change in the
context due to process effects (Figure 6.3). Identifying underlying theories is based on the
“theory based evaluation” model. Theory based evaluation allows an in-depth understanding of
the project activities and their interactions thus identify steps to be monitored (World Bank,

195
2004). Thus this framework seeks to capture the espoused theory to identify the sequence of
methods used and their anticipated effects. To capture the holistic understanding of the
theoretical logic, both project team and participants’ experiences are documented and analyzed.
Figure 6.3. Monitoring and evaluation framework of a ComMod process (adapted from Jones et
al., 2008).
The multiplicity of actors with diverse perspectives, interests, entitlements, knowledge,
capabilities, values and power in the management of a dwindling natural resource
influenced by local and global trends, pose challenges to comprehend and envisage
management strategies. The invention of high capacity computers and methodological
advancement has broadened the capacity to make in-depth examination and exploration
of such interactions and dynamics. The shift from top-down, command and control type
of research to adaptive, knowledge-based and collaborative approaches indeed amplified
the role of participatory methodologies into learning, research and policy making. The
flexibility of methodologies to apply in synergy with multiple tools and their joint ability
to integrate stakeholders’ perceptions and knowledge has tremendously enhanced the
research competency and relevance (Barnaud et al., 2006).
Among several collaborative modelling approaches, particularly in SES research, the
ComMod approach has emerged as a resourceful one supporting collective shared learning based
on simplification of SES structure and dynamics to focus on a given NRM problem (Etienne et
al., 2003). Its strength specifically lies on self-reinforcing theoretical, analytical, and modelling

196
activities with field work in an iterative yet evolving fashion. While it is often said that the use of
a RPG helped in opening the black box of the computer ABM, the synergy between these two
key tools has indeed removed the impregnable gap between people ( resource users) and science
(the research team); people (citizens) and politics (policies), and act as a bridging tool
(Barreteau, 2003).
The flexibility of the ComMod approach in terms of tools and integrating other
mainstream research approaches such as the agrarian system analysis to characterize the context
of a collaborative modelling process, could pose a possible problem of derailing the purpose of
the planned ComMod process. Further with diversity of tools, outputs and effects from the
process, monitoring and evaluation of ComMod processes still remains a challenge. In recent
years, the ComMod approach has been extensively used in collaborative NRM research
(Barreteau et al., 2007) and therefore its use is proposed for this study. Chapter 7 presents the
detail methodology used in the research.

197
CHAPTER 7
RESEARCH METHODOLOGY
Water, a renewable natural resource abundant in Bhutan has truly exhibited its
multifunctional nature and varying benefits at different levels. While Bhutan depends on water
resources for more than 50% of its GDP at the national level, there is a dire situation of water
shortage at community and household levels in some parts of the country or at some critical
stages of the cropping calendar. Water shortage is further escalated by the absence of definite
legal provisions, uncertain administrative mechanisms, and most importantly the recent dismissal
of customary management systems. While societies have been manoeuvring within a fuzzy
property rights, conflicts are inevitable when the water resource base is declining and user base is
broadening. In such situation, crafting a research methodology which can take on board
stakeholders to elicit local perceptions, facilitate their exchange, and integrate them with external
knowledge to augment the role of stakeholders in enhancing the resilience of SES is essential.
7.1 Companion Modelling for water management
7.1.1 Use of ComMod in social change and water governance
The use of the ComMod approach in several case studies in water management has
demonstrated its versatility (Barreteau and Bousquet 2000; Daré and Barreteau 2003 ; Gurung et
al., 2006; Barnaud et al., 2007; Dung, 2008; Farolfi et al., 2008; Naivint, et al. 2010). We
identified seven case studies dealing with water management issues that used the ComMod
approach from the perspective of social change62 and governance (Table 7.1). Creating space and
opportunity for reflective63 and reflexive64 practices are known to facilitate change in people
leading to greater congruence. To become reflective and reflexive, learning and knowledge is
necessary. Knowledge is a means of legitimizing and communicating the acceptable and
relegating less worthy knowledge, thereby stimulating positive social change (Taylor et al., 62 Process of dialogue, debate and action resulting in major shifts in social norms, and generally characterized by the highlighting and legitimating of discordant voices, particularly of those marginalized in society, and leading to improvements in their rights, entitlements and living conditions (Taylor et al., 2006). 63 How we see, understand and position ourselves in relation to our experience and action. 64 How we reflect on the way we do things.

198
2006). The ComMod approach has been widely used for examining NRM issues and often cited
to generate new knowledge (Gurung et al., 2006; Etienne et al., 2008; Barnaud et al., 2010;
Worrapimphong, 2010).
Table 7.1. Past case studies relying on the ComMod approach to study water management issues.
Case Studies Social change Governance Reference Viability of irrigated systems in the Senegal River Valley
− Tool for simulating scenarios of collective rules and individual behaviours for social organization and institution
Barreteau, and Bousquet, 2000
Negotiation in irrigated system in the Senegal river valley
− Revealed social relationships for negotiation to share irrigation water
Daré and Barreteau, 2003
Sharing Irrigation Water in the Lingmuteychu Watershed, Bhutan
− Mediation process of developing an efficient water-sharing system, leads to release of irrigation water 5 days earlier than the traditional date
− Establishment of watershed management committee with representative of all villages in the watershed
Gurung et al., 2006
Catalyze collective water management in Northern Thailand (Mae Salaep)
− Collective empowerment through the creation of alliances
Barnaud et al., 2007
Local water governance in South Africa
− Transformation of ethnicity based irrigation board to all inclusive water user association
− Facilitating institutionalization of catchment management agency and water user association
− Develop catchment management plan
Farolfi et al., 2008
Institutional engagement for land and water management in a Northern Thailand watershed (Mae Hae).
− Agreement limiting the number and size of irrigation pipes in the upstream area was achieved
− Institutional networking at all levels for negotiation
Promburom and Bousquet, 2008
Understand conflicts arising from the water demanded by rice and shrimp farmers in Bac Lieu, Vietnam
− Share knowledge, opinions on water demand; better understanding and collaboration on water management
Dung, 2008
Sharing knowledge about land, water use and labour migrations in rainfed lowland rice in Lam Dome Yai watershed, Northeast Thailand
− Labour management across broader social network
Naivinit et al., 2010

199
Taylor et al. (2006) proposed a conceptual framework for dialogue which implies
knowledge and learning as the core of the social change process (Figure 7.1). The framework
also indicates a continuous and non-linear process which ensures change depending on the
information fed to the system. This process of communicating, learning, and sharing knowledge,
engaging people in their multiple roles as individuals, as part of communities, and as members of
organizations can influence individual and collective behaviour, which can stimulate social
change (IHDP, 2008). However, behavioural change requires not only new insights, but also the
willingness to change. Therefore there is a need to enhance both the individual and collective
motivation to accept the change.
Figure 7.1. Conceptual framework of social change (Adapted from Taylor et al., 2006).
ComMod by way of facilitating individual and collective learning has stimulated social
change (Table 7.1). Social change has taken place in two broad categories (i) negotiated water
sharing and management systems from traditionally biased systems (Daré and Barreteau, 2003;
Gurung et al., 2006; Promburom and Bousquet, 2008; Dung, 2008) and (ii) stakeholders creating
more heterogeneous and broad based social networks from individual or ethnic based groups
(Barnaud et al., 2007; Farolfi et al., 2008; Naivinit et al., 2010).
Since the adoption of Agenda 21 and linkages among economic and social development
and environmental protection in 1992 by the Earth Summit in Rio de Janeiro, Brazil, sustainable
development has become a global objective. In the midst of complex SES compounded with
uncertain future, the sustainable development can be approached with governance (van Zeijl-
Rozema et al., 2007). Governance can be considered as a shared responsibility of the state,
market and civil society to address societal problems. Merging the sustainable development

200
perspectives with modes of governance, van Zeijl-Rozema et al. (2007) proposed a governance
framework shown in Figure 7.2. The four quadrants represent four types of governance for
sustainable development: rational state, rational society, normative state and normative society.
While the hierarchical governance is featured as state led (top-down) regime, the co-governance
benefits from the collectivism where state too become part of the management regime. Quadrant
IV (Normative society) views governance as the way to predefined goals and outcome, as an
open deliberate and reflexive process, wherein state is a part of the dynamics that is governed.
The ComMod approach being an action-oriented research approach promotes reflexive
governance or normative society. For instance in the Senegal river valley, it helped in testing
individual and collective rules for irrigation management (Barreteau and Bousquet, 2000). In
Bhutan and South Africa, ComMod facilitated development of sub-watershed/catchment
management committees including the negotiation of collective action plans (Gurung et al.,
2006; Farolfi et al., 2008).
Norm
ativ
e
Rational/obje
ctiv
e

201
Figure 7.2. Conceptual framework of governance (Adapted from van Zeijl-Rozema et al., 2007).
7.1.2 Overview-Design concepts-Details protocol for model description
Models to represent ecological dynamics are built using either microscopic or
macroscopic phenomena. Balancing appropriate details to comprehensively represent the
dynamics and to understand is a fundamental liability of models (Deutschman et al., 1997).
With the extensive application of the ABM approach in different scientific disciplines, it has
become essential to use a standard protocol for the description of such models to make them
easier for readers to understand (Grimm et al., 2006) and to allow others to interpret and re-
implement them (Hales et al., 2003). Based on the two following principles (i) a general
structure for describing ABM, thereby making a model’s description independent of its specific
structure, purpose and form of implementation, and (ii) separating verbal considerations from a
mathematical description of the equations, rules, and schedules that constitute the model, Grimm
et al. (2006) proposed the so-called Overview, Design concepts, Details (ODD) protocol as a
framework for describing ABM. The ODD protocol uses seven elements grouped into three
blocks to describe the model (Table 7.2).
Table 7.2. The seven elements of the Overview, Design Concepts, Details protocol (Source: Grimm et al., 2006). Blocks Elements Explanation Overview • Purpose • A clear, concise and specific information to inform
about the need to build a complex model, and use of the model.
• State variables and scales
• Enumerate entities and describe their attributes and structure including hierarchical levels if any. Describe the temporal and spatial resolution of the model.
• Process overview and scheduling
• Describe all the processes and their effects included in the model. Explain in details the schedule of the different processes in the model.
Design concepts • Design concepts • Explain the model design within a broad framework of emergence, adaptation, fitness, prediction, sensing, interaction, stochasticity, collectives, and observation.
Details • Initialization • Detail the initial value of state variables and how the process is initiated.
• Input • All input data associated to state variables necessary to run the model needs to be explained.
• Sub-models • All sub-models for each process including the parameters are explained.

202
The first block called “Overview” provides the overall purpose and structure of the model
by describing its state variables and scales, process and scheduling. The second “Design
concepts” block describes the general concepts of the model and interactions. The last block on
“Details” comprises three elements i.e. initialization, inputs, and sub-models and provides all the
information necessary to independently replicate the model.
7.2 ComMod methodological framework used at the two sites
7.2.1 Conceptual framework
Figure 7.3 displays the conceptual framework of the research composed of four main
stages lay out as a process. They are (i) diagnosis and definition of the problem, (ii) collaborative
modelling and simulation, (iii) collective action, and (iv) monitoring and evaluation. They are
closely associated to the specific objectives of the research.
The diagnosis and definition of the problem helped to achieve objective (1) and (2) by
studying resource dynamics, management and decision-making process. The second phase aimed
at developing conceptual models submitted to the stakeholders as RPG for validation and
simulating different scenarios fulfilling the objectives (3) to (5). The third stage related to
collective actions arising from the process helping to achieve objectives (2) and (5). Finally the
last stage of monitoring and evaluation served as feedback to the process and stimulated a critical
reflection on it.

203
Figure 7.3. Conceptual framework of the research.
7.2.2 Conception of Companion Modelling processes for the two sites
The diagnostic study, literature review and extensive consultation with farmers and
extension officials provided information to conceptualize and adapt ComMod processes in two
sites (See chapter 3). The graphical unified modelling language (UML) was used in the model
conceptualization phase as it helps in focusing and progressively constructs components of the
model and their interactions (Bousquet and Trébuil, 2005). It also supported the indication of the
New knowledge and
common understanding
Community mobilization
for collective action
Problem definition and
characterization of context
Model
conceptualization
Gaming and
simulation
workshops
Role Playing
Game
Agent-Based
Model
Community consultation
Collective
management

204
key parameters of these interactions. However, at the start of these two case studies, a simple
flow diagram (Figure 7.4 and 7.5) was used to depict how people perceive and operate their
particular water resource systems. Based on these descriptive flow diagrams, it was fairly
straightforward to construct the different kinds of UML diagrams (class and sequence diagrams
mainly) for both models.
Figure 7.4. Preliminary conceptualization of the Companion Modelling process in
Lingmuteychu.
Figure 7.5. Preliminary conceptualization of the Companion Modelling process in Kengkhar.
Climate
(Rainfall)
If good
rainfall High stream
flow
Irrigation water in
canal (Water
allocation to village)
Diverted
to canal
Fallow field Plant rice in field
Water share among
farmers
If water is not enough
If water is not
enough request
from farmer or
share
Traditional
water sharing
system
Full canal – or in some cases
traditional water sharing system

205
7.2.3 Objective
The similarity of the type of resource in both sites (irrigation and domestic water in
Lingmuteychu and Kengkhar respectively) and the two different (but related) issues of conflict
about resource sharing in the case of Lingmuteychu and sharing a dwindling resource in
Kengkhar provided a challenge to apply the research methodology to enhance understanding and
facilitate improvement in these differing water management situations. In line with the objective
of (i) understanding local adaptive strategies, and (ii) possibility to enhance renewable resource
resilience through this research, the objectives of applying the Companion modelling approach at
these two sites were as follows:
• To study the dynamics of water resource use and management and to understand how
farmers either individually or collectively address the more (Lingmuteychu) or less
(Kengkhar) conflicting issue of water sharing.
• To understand how different stakeholders adapt their decision-making processes to the
change in water resource status.
• To develop simple conceptual models integrating the resource status, its uses and
management rules.
• To construct and implement a family of MAS models (computer-assisted Role-Playing
Games and Agent-Based Models) to validate this conceptual model with the concerned
stakeholders, and for further sharing scientific and indigenous knowledge on the issue
being examined,
• To identify and simulate co-management scenarios identified by the stakeholders in order
to facilitate communication among them and to support the inclusive and creative
negotiation of agreed collective action acceptable to the different parties to mitigate the
current conflict or improve the present water sharing situation.
7.2.4 Role-play games and simulations
In both case studies, based on the conceptual model and systems analysis, RPG were
designed by keeping the minimum number of parameters that would broadly represent the local
context and features that would facilitate vibrant interactions among the players (Table 7.3).
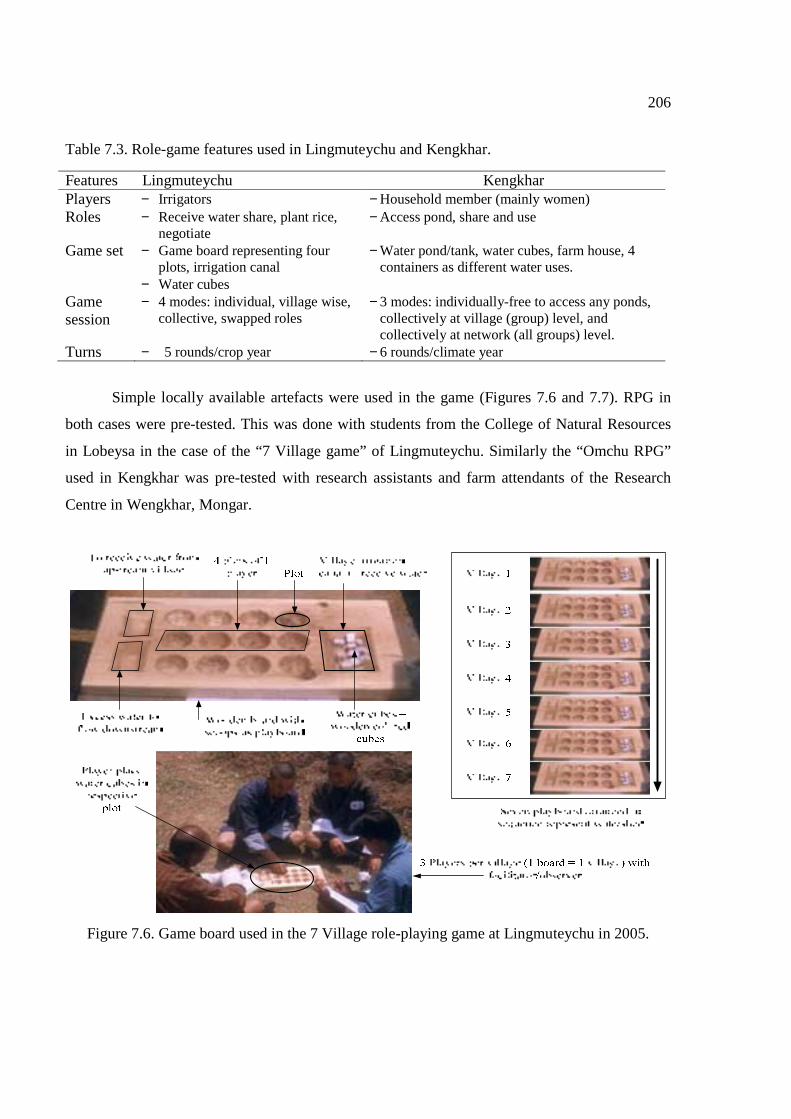
206
Table 7.3. Role-game features used in Lingmuteychu and Kengkhar.
Features Lingmuteychu Kengkhar Players − Irrigators − Household member (mainly women) Roles − Receive water share, plant rice,
negotiate − Access pond, share and use
Game set − Game board representing four plots, irrigation canal
− Water cubes
− Water pond/tank, water cubes, farm house, 4 containers as different water uses.
Game session
− 4 modes: individual, village wise, collective, swapped roles
− 3 modes: individually-free to access any ponds, collectively at village (group) level, and collectively at network (all groups) level.
Turns − 5 rounds/crop year − 6 rounds/climate year
Simple locally available artefacts were used in the game (Figures 7.6 and 7.7). RPG in
both cases were pre-tested. This was done with students from the College of Natural Resources
in Lobeysa in the case of the “7 Village game” of Lingmuteychu. Similarly the “Omchu RPG”
used in Kengkhar was pre-tested with research assistants and farm attendants of the Research
Centre in Wengkhar, Mongar.
Figure 7.6. Game board used in the 7 Village role-playing game at Lingmuteychu in 2005.

207
Figure 7.7. Materials used in the Omchu role-playing game in Kengkhar 2008.
In case of Lingmuteychu the traditional game “ta-dang-no” (“tiger and cattle”) was
adapted in the RPG (Figure 7.8). Because of their close relationship to the players’ actual
circumstances and daily activities the processes simulated in the gaming sessions was
comprehensible. The process was effective and efficient in engaging participants in collectively
generating unique situations as emergence from their interactions. However, this depends on the
effectiveness of initialization of the process. In both situations, after a detailed briefing and
introduction of the RPG setting, there was a mock session where participants tried the game for
two to three rounds. The first round normally took one to one and half hour, as the players
needed to get familiar with the game. After that, the rounds of plays were smooth and took only
half of the initial time. As a RPG session is time consuming and cannot be repeated without
player fatigue it was possible to explore scenarios for five rounds each in Lingmuteychu (Figure
7.8) and six rounds in Kengkhar (Figure 7.9).

208
Figure 7.8. Glimpses of role-playing game session in Lingmuteychu.
Collective mode with seven game board placed in order of village 1 to 7
Players interact actively, facilitators observes the process
Inter village mode located in order (village 1 to 7)
Three players as one village in village level mode with one observer
Seven game boards placed in order of village 1 to 7 before the start of the game
Players interacting before making the moves, while observers discusses in the background

209
Figure 7.9. Role-playing game in Kengkhar.
A player collects her water share in individual mode
Players interact with facilitator ensuring she took the right water share in inter village mode
Players in collective mode allocate their water share for different uses
Players interacting before making the moves, while facilitator records the discussion
Setting for collective mode where players discuss and decide the water share and use
Data entry done simultaneously

210
7.2.5 Individual interviews and plenary debates
After the RPG sessions, all players were individually interviewed using a structured
questionnaire (Figure 7.10 and 7.11). The interview was targeted to elucidate the actions of each
player in the gaming sessions. The preliminary results from the RPG sessions and outcome of the
individual interviews were presented to the plenary. The discussions in the plenary helped in the
identification of scenarios of collective interest to be simulated.
Figure 7.10. Interview of individual player and plenary discussion on RPG outputs in
Lingmuteychu.
Figure 7.11. Interview of individual player and plenary in Kengkhar.
7.2.6 First gaming session and participatory workshop
In both sites there was only one gaming workshop. In the case of Lingmuteychu, as it was
a follow-up from the two sessions of the Dompola RPG (Gurung, 2004) it could also be

211
considered as a 3rd session including the five new villages of the sub-watershed and adapting
accordingly the rules of the game. Five rounds of play of each game were played (Table 7.4).
Three members each from seven villages were identified with the help of local
extension officer. The 21 players with observers from block and district administration played
five rounds each of 3 protocols of individual at village level, inter village with collective
decision, and swapped collective decision. As the issue in Lingmuteychu was related to a water
sharing conflict, the primary school in the sub-watershed was selected as the workshop venue
that provided a common and a neutral setting. After the RPG session, a participatory workshop
was organized to present the output of RPG and also to develop action plans. A rigorous
consultation was organized to conceptualize and draft ideas for collective management approach,
which later emerged as a watershed management committee.
Table 7.4. Proceedings of role-playing game (RPG) sessions in Lingmuteychu and Kengkhar.
Day Lingmuteychu Kengkhar 1 - Introduction of the RPG tool
- Played 5 rounds of individual mode and 5 rounds of collective mode
- Resource persons and participants visit the tanks
- Introduction of the RPG to the community and mock gaming session
- Played 6 rounds as individuals with free access
2 - Played 5 rounds of swapped collective mode - During late afternoon participants, district
officers, extension staff and researchers brainstormed on the development of the watershed management committee
- Played 2nd session : Free communication at group level and free flowing water
- 3rd gaming session: Communication at the group level for water use and tank accessing, with water accumulation
- 4th session: Collective mode with water accumulation and water sharing
3 - Research team presented the report on the watershed management committee
- All participants in the gaming sessions were individually interviewed
- Individual interview of players, plenary session and closing
4 - Presentation of preliminary results of gaming sessions and recommendations
- Participants and local government officials finalized a collective plan and pledged to formalize the watershed management committee

212
The gaming sessions in Kengkhar were organized with 18 participants over 3 days in the
Block development office. In Kengkhar it took few rounds of trial sessions and briefing before
the participants felt confident to play with the RPG. As the issue in Kengkhar was more general
and in absence of any conflicting situation, organizing the participatory workshop in the
development office was most appropriate as it also ensured a close participation of the Block
development officials.
7.2.7 Gaming and simulation processes
In contrast to case studies where RPG tools were used to simplify and validate an ABM
model (Trébuil et al., 2002; Barnaud et al., 2008; Naivinit et al., 2010; Worrapimphong et al.,
2010), in both case studies based on the conceptualization of our study, the RPG sessions were
first organized and the RPG tools were later implemented as computer MAS models. The
description of the gaming features are presented in Table 7.5.

213
Table 7.5. Detailed description of the role-playing game features in Lingmuteychu and Kengkhar.
Particulars Lingmuteychu Kengkhar Situation before the RPG
2 Village RPG in 2003 to resolve water sharing conflict between two up-stream villages in the watershed, not resolved but suggested to include all communities in the process.
Used water from natural spring collected in open ditch or wooden trough. Collectively construct 7 water collection tanks and their network to transfer/share water between tanks (village).
Objectives To facilitate exchanges among the 7 villages regarding NRM at the watershed level To enhance the understanding of the stakeholders and of the resource use dynamics at the watershed level
To enhance understanding of stakeholders on resiliency of spring pond and its management as network. To facilitate mobilization of community for collective water resource management.
Participants 3 from each village (7 villages in the watershed) representing irrigator, water guard, and village representative.
3 from cluster of natural spring user (6 clusters of primary users of spring pond) representing female member of household, guard, and village representative.
Game settings 7 groups with 3 members representing were their respective villages made, positioned in distant places during individual mode and placed in close proximity in sequence as in real setting during collective mode. Each group has a game board Market place to settle the account after each time step Announcer of rainfall pattern and associated water quantity before each time step – randomly picked Allocator of village water share
3 groups (5 players each for group 1 and 2, and 8 for group 3) Based on the number of player in a group, they have individual miniature house placed in groups of 5, 5, 8 representing 3 villages. 3 plastic jar (=pond) placed away from the group but visible. Announcer of rainfall pattern (randomly picked) and water availability in each round. Market place to update water use information
Scenarios 3 Communication mode – individual, collective and swapped role 4 Rainfall patterns and 4 water shares based on rainfall Rainfall Village 1 Village 2 Village 3 to 7 severe wet 2565 9 13 wet 19 7 10 moderately dry
13 5 7
dry 7 3 4
3 Communication mode – inter village, intra village and collective 2 water accumulation or collection 3 water uses – domestic, vegetable irrigation, livestock, religious 3 rainfall patterns – severe wet, wet and dry and 3 water accumulation in tanks Rainfall Tank 1 Tank 2 Tank 3 severe wet 5066 80 50 wet 38 60 38 dry 13 20 13
Expected outputs Understanding on how players manage water in different scenario Observe interactions and document emergence
To understand how drinking water scheme can be made resilient Identify areas for collective management
65 One water unit (represented by a cube) is equivalent to the volume of water required to raise ¼ of an acre (need to convert in international unit system = ha) which is represented as one plot on the game board. 66 One water unit (represented by a plastic ball) is equivalent to 25 liters.

214
In Lingmuteychu RPG, during the first scenario, three players with their game boards
took position away from the other members of the group to discuss and strategize in isolation.
When they got water shares, they discussed and shared water based on their own criteria. A
facilitator took record of all the proceedings. After completion of the first turn, the players went
to the market place (the accounting desk) to assess their crop yields. In the same manner five
rounds were played to simulate the first scenario (Figure 7.12). In the second scenario (inter-
village communication allowed), each group was placed in one row in order from upper to lower
villages. While the internal sharing among three players was the same as in the first scenario, the
group had the option to share any extra volume of water to the immediate down-stream group.
Similarly, the down-stream village could request water from the upstream group. After each
round, yields were estimated and the water balance recorded by the accounting desk. Five rounds
were played. The final scenario was collective with swapped roles. Here the game boards were
placed on a raised platform (table top) in order of upper to lower villages. All the players were
systematically swapped into different groups. After rainfall and water was declared, the total
water of the seven groups was released at one time at the top most canals and sequentially used
and passed down. This generated different experiences and new perceptions of how the system
operates for the players in another context. After the final scenario, on the following day, all the
players were individually interviewed to elucidate their strategies in the game, to assess the tools
used and their underlying conceptual models, and to plan the next steps of the ComMod process.
In Kengkhar, the gaming and simulation exercise was scheduled after the completion of
constructing seven tanks and their networking pipes to collect spring water and share between
hamlets. In view of the new infrastructure which people have not used yet, the Omchu RPG was
in a way theoretically testing how the services of the scheme could be efficiently utilized. The
Omchu RPG was used in four successive gaming sessions simulating as many scenarios: 1-
Individual free access, 2- Free communication at the user group level with free flowing water, 3-
Communication at the group level for water use and tank accessing, with water accumulation, 4 -
Collective mode with water accumulation and water sharing. With a preliminary briefing and
two rounds of a mock session, with lots of undecided players, the game started with drawing of
rainfall pattern, announcing the water discharge, and allocation of water in three tanks (Figure
7.13). In the first scenario representing the real life situation, the players were individuals with

215
no consultation, accessing the tanks freely as desired and not sharing water. After collecting
water (balls) from the tank they allocated the water based on his/her priority in four cups
designated as “domestic use”, “vegetable irrigation”, “livestock”, and “religious rites” (See
section 9.4.2). The number of water units allocated by each player was recorded by group
facilitators who updated the information at the accounting desk. The same sequence was played
for six rounds.

216
Figure 7.12. The gaming and simulation process in Lingmuteychu, 2005.
Declare Rain and
water share
After the 3rd
scenario all
players were
individually
interviewed
After every round
players go to
Market desk to
assess yield and
water balance
Scenario 1:
Individual village
level sharing (5
rounds)Scenario 3:
Collective swapped
role
(5 rounds)
Scenario 2:
Inter-village water
sharing (5 rounds)
The
preliminary
result was
presented to
plenary
The results and the
collective action
plans were presented
to a forum of players
with block and
district
administration
Participants
agree to adopt
the resolution
by signing the
document
Lingmuteychu
watershed
management
committee
emerges

217
Figure 7.13. The gaming and simulation process in Kengkhar, 2008.

218
In the second scenario, the players were allowed to discuss within the group of users on
strategies about water accessing the tank, water allocation and water sharing. As in reality spring
water is not collected, any water unit in the tank was taken back by the game organizer to depict
free flowing. Rainfall and water discharge were announced. After discussing the players went to
the tank as planned, collected water and allocated it in the user cups. Data were recorded after
each round until the sixth one. In the third scenario, six rounds followed the same sequence
except that water accumulation was introduced in the game (any balance water from the round
was added to the discharge of the next round, and carried until the 6th round). The final scenario
was played in collective (merging of all three groups) mode. After the announcements of rainfall
and discharge, the players discussed about tank accessing and water sharing in the whole group.
On the third day all the individual players were interviewed separately to elucidate how they
played in the gaming sessions and to record their views on the process, the simulation tool and its
uses.
7.2.8 Dissemination of gaming and simulation results
The results of the gaming and simulation sessions were presented in different stages in
both cases. On the last day of the gaming and simulation workshop, preliminary results were put
together and presented as slide shows to the payers and observers with the primary objective of
informing the participants on the outcome of the process and also validating these results. In the
case of Lingmuteychu, this presentation of the preliminary results was attended by district
officers (agriculture, livestock, and forestry) and local government office bearers. While in
Kengkhar result presentation was also attended by farmers who did not participate in the gaming
exercise (Figure 7.14).
Figure 7.14. Dissemination of result of gaming and simulation by way of slide presentation in
Lingmuteychu and Kengkhar.

219
Later the RPG used at the two sites was coded as ABM under the CORMAS simulation
platform (7.15). These ABM were used for laboratory experiments to explore different scenarios.
Upon request by the watershed management committee in Lingmuteychu, the simulated
scenarios of the ABM of the “7 Village game” were presented to all the irrigators in the sub-
watershed by organizing short workshops in all the seven villages. Similarly, in Kengkhar, six
months after the gaming and simulation field workshop, the computer version of the RPG was
also presented to the players.
Figure 7.15. Concept for tank network, game board, village game, and agent-based model in Lingmuteychu and Kengkhar.
Lingmuteychu: RPG to ABM
Kengkhar: Water sharing network and RPG to ABM

220
7.2.9 Collective action and development supports
As an action research, the ComMod approach is relevant to tackle complex and dynamic
social systems sharing common resources by way of group decision support tools to promote
information exchange between stakeholders (Daré and Barreteau, 2003). Further when the issue
has become a long-lasting problem, there was tendency to propose collective actions. The
ComMod approach that encourages information exchange and communication fosters trust to
commit for collective actions (Ostrom, 2007).
In both sites after the preliminary results were presented, the participants proposed
activities that could be implemented collectively for the common good of all (Section 8.4.5 and
9.4.5). After long deliberations, the groups settled with few activities that urgently needed to be
implemented within the following six months (e.g renovation of irrigation canal at Lumpa in
Lingmuteyhcu and fencing the catchment area in Kengkhar). In view of their limited financial
resources, the participants in both sites requested the assistance of the local research centre to
facilitate fund sourcing.
7.2.10 Monitoring and evaluation
As explained in earlier section 6.5, in both sites, the same evaluation framework of the
participatory modelling activities was broadly used. The local facilitator (the agriculture
extension officer) posted in the site continuously monitored the process and actions of the
participants. A self evaluation by the site coordinator was also done using structured
questionnaires, interviews, field visits, and group discussions. In Lingmuteychu a detailed
external evaluation was done by external evaluators using the Most Significant Change67 (MSC)
67 The most significant change (MSC) technique is a form of participatory monitoring and evaluation. It involves collection of significant change (SC) stories emanating from the field level, and the systematic selection of the most significant of these stories by panels of designated stakeholders or staff. The designated staff and stakeholders are initially involved by ‘searching’ for project impact. Once changes have been captured, various people sit down together, read the stories aloud and have regular and often in-depth discussions about the value of these reported changes. When the technique is implemented successfully, whole teams of people begin to focus their attention on program impact (Davies and Dart, 2005).

221
technique and the Actor Network Analysis (ANA) frame. While in Kengkhar an external
evaluation also happened in the form of district officials and engineers visiting the tank network.
The shift in individual and collective behaviours influenced by knowledge,
communication, and role enhances level of commitment for change and can stimulate social
change. Past works have indicated that the ComMod approach has potentials to accelerate social
change largely by creating broad-based social networks and mediated processes. Although the
synergy of RPG and computer ABM simulation tools into a ComMod processes was used only in
laboratory in this research, the synergy and its ability to integrate other tools and representations
have expanded the research abilities to study complex SES. Development of frameworks such as
ODD protocol (Overview, Design Concepts, Details) and evaluation framework (Grimm, et al.,
2006) provides an instrument to further build ComMod as a vibrant tool for understanding and
co-managing complex SES. The next two chapters present the detailed outcomes and results of
the ComMod processes implemented in the two sites.

222
PART 3: COMPARATIVE ANALYSIS OF FINDINGS AT THE TWO SITES
CHAPTER 8
COMMOD PROCESS IN LINGMUTEYCHU
This chapter provides the situational context from the renewable natural resource point of
view and its associated problems in Lingmuteychu. The ComMod process and its main outcomes
are presented. The ABM model is also described by using the ODD protocol.
8.1 Contextual feature
8.1.1 Stakeholder diversity
There are broadly five categories of stakeholders in Lingmuteychu who have some
relationship to the issue of management of irrigation water (Figure 8.1). The diversity of
stakeholders and their stake poses both a challenge and an opportunity. They pose a challenge for
the coordination and mediation, while they also provide an opportunity to consolidate the
strength of each stakeholder and to create a collective momentum to initiate and sustain change.
Figure 8.1. Diversity of stakeholders in the Lingmuteychu.

223
Figure 8.2. Diversity of stakeholders and their relative role in water issues in Lingmuteychu.
The stakeholders were mapped according to their relative influence on the outcome of the
issue being examined and its relative importance to them (Figure 8.2) through consultative
process. The result indicates the position of farmers (a small majority in this case) highest in
importance and lowest in influence. In Lingmuteychu the water resource is controlled by early
settlers who are also large farmers with highest influence in water issue. But resolving the issue
does not seem to be in their interest as they would be deprived of their existing benefits. In the
same frame, late settlers and medium size farmers for whom it very important to resolved the
water sharing issue only have partial influence on its outcome. Considering the issue of irrigation
water in Lingmuteychu, the agriculture extension office and local area development projects in
the region can have a substantial influence in terms of prioritizing the development agenda in the
sub-watershed. The way categories of farmers are dispersed in the influence-importance matrix,
it demonstrates the opportunity for coordination or networking among the farmers.
The renewable natural resources (RNR68) research has the lowest level of importance and
influence on the resource issues. However, research being external to the problem and having
68 The Ministry of Agriculture and Forests in Bhutan is also referred as renewable natural resources sector, as agriculture, forest and livestock form the three principal component of agriculture sector.
IMPORTANCE
INFL
UE
NC
E
Low
High
Low High
Small farmers
Early Settlers
Block Development OfficeLate Settlers
District
Medium farmersLocal Area Development Agency
Research Team
Agriculture Extension office

224
limited control on the outcome, it can play a significant role in exploring the issue and evolving
strategies to manage the NRM issue.
8.1.2 Water resource in Social-ecological systems
The SES from the perspectives of water resource can be represented as in Figure 8.3. It
provides a holistic representation of how water is integrated into the social, economic, and bio-
physical components of the system. Water for irrigating ever expanding rice terraces is primarily
limited by the seasonality of the stream flow and short rice transplanting season. Irrigators who
operate in a customary right that favoured upstream and richer farmers create the divide among
farmers as the topmost village dictates the allocation of water resources. The intervention of the
infrastructure provider, the Ministry of Agriculture and Forests (MoAF) provides financial
support for the construction and renovation of irrigation schemes. The infrastructures built with
modern specifications were probably flawed by the lack of operational mechanisms or scheme
operations which did not correspond to the traditional water sharing systems that existed in the
community. Further in a sub-watershed where farmers in upstream and downstream strategize
water resource use to suit the local situation of water release (in terms of volume and schedule)
from upstream community always over use water and delay in release. Such age old
understanding restrains infrastructural development. In such situation, each canal and user has
different water requirement and sharing system which cannot be fulfilled with standard formal
rule (Gillingham, 1999). The spatial and temporal variation in water requirements even in such
small sub-watershed exhibits the complexity of the situation.

225
Figure 8.3. Representation of water in Lingmuteychu social-ecological system.
8.2 Analysis of the water management problem
A simple framework is used to give a better insight of the sites in relation to water
management issues in Lingmuteychu (Table 8.1). The principle focus in both sites is associated
to water management concern which has evolved over generations. In Lingmuteychu the issue is
associated with sharing irrigation water which is very closely related to declining water,
increasing users, and absence of formal legislations.
Irrigators
Irrigation canals and
Weirs
Ministry of
Agriculture &
Forests, District and
Block
Water
(Irrigation)
Customary water sharing systems favours
early settlers and upstream farmers
Increased
water demand
Seasonality,
dependent of
rainfall, reduced
stream flow
Destruction of canals and weirs to
illegally divert water
Poor water conveyance
Spatial variation in
irrigation water sharing
system between villages
Limited participation in
irrigation development (Modern
structure vis-à-vis traditional
norms) Seasonal stream, declining stream
flow, short rice planting season

226
Table 8.1. The problem of water from Social-ecological systems perspectives in Lingmuteychu.
Entities Lingmuteychu Resources - Water for irrigation (declining resource and conflict in sharing) Resource users - Farmers cultivating irrigated rice, 4 categories – thrulpa, cheep, chatro,
lhangchu - Traditional rules, stealing, mismanagement
Public infrastructure providers
- Government agencies – Agriculture - Multiple administrative jurisdiction, non-existence of water act and policy
Public Infrastructure
- Irrigation canals and distribution weirs - Local norms to use seepage water by downstream village, water stealing,
low stream flow, poor maintenance External Environment
- Policy and legal, political, administration, climate, economy - No clear legal and policy environment, focus of development programs,
changes in rainfall intensity and patterns, market demand
The assessment of the severity of the water problem is based on the proportion of
stakeholders affected. It can be classified as high in Lingmuteychu with 89% of households
affected. It was evident from the respondents that the problem has intensified every passing year.
Most of the development interventions like the construction of weirs and irrigation canals in
Lingmuteychu have not helped to resolve the issue. As some respondents opined, these efforts
actually fuelled the problem, as with the hope of benefiting from the infrastructures, the
communities neglected the existing structures and resource. The failure of public infrastructure
in Lingmuteychu is the weir built in the Limti chu stream to share water between Omteykha and
Matalangchu in 2009. Considering the legitimacy of the issue, research collaborated with the
Lingmuteychu community since 1987 to introduce new crops and production technologies,
followed by on-farm water management studies in the mid 1990s, comprehensive diagnostic
study of the whole watershed in 1997, and the launch of a CBNRM research project. For instance
creating a means to resolve the irrigation water sharing conflict in Lingmuteychu will have direct
impact on rice production, wetland expansion, and increased systems productivity.
Eliciting the problems associated to each entity of SES further clarifies the seriousness
and importance of the problem (Table 8.1). For instance, in the case of Lingmuteychu, the local
rules, arrangements and institutions are well established and without including these customary
regimes any intervention will be futile. Even though the new water policies may emphasize

227
equitable water sharing, Lingmuteychu communities will and have to continue the traditional
social stratifications they use beyond water. With the enactment of the Water Act 2010, many of
the operational legal issues may be resolved, but an integrated approach is needed to solve issues
such as in Lingmuteychu, which is entwined in the fabrics of the local society whose livelihood
depends on rice for which water is a pre-requisite. Indirectly water is a determining factor of
influence, power, wealth, and food security in many parts of Bhutan (Chapter 4). Therefore, the
challenge is more about declining water availability rather an organizational issue.
8.3 Companion modelling process in Lingmuteychu
The process in Lingmuteychu started with situational analysis followed by
conceptualization of model, gaming and simulation (Figure 8.4). Chronologically the process in
Lingmuteychu started in 2002, However, the baseline study in 1997 formed the basis to apply the
ComMod approach. Considering the impending conflict between the two uppermost villages
(Limbukha and Dompola), two early ComMod cycles were implemented in May and December
2003 with these two villages (Gurung, 2004). The request from the participants to upscale the
process to include all seven communities within the sub-watershed resulted in the development
and implementation of the 7 villages role-playing game in 2005. The process resulted into the
creation of a Watershed Management Committee (WMC), the renovation of irrigation canals and
the construction of check dams.

228
Figure 8.4. Chronology of the ComMod process in Lingmuteychu.

229
8.3.1 Conception of the model
Conception of the model was done initially by the local research and extension team
using the information collected from the diagnostic study and literature review. The framework
was discussed with farmers in two different ways. As it was up-scaling of a two-village game
into a seven-village game, the basic framework of the earlier version was used with some
amendments. As explained in Chapter 7, a simple diagram was used to discuss the conceptual
model of the ComMod process with the Block development officer and the district extension
officer. The final features of the RPG were as shown in Table 8.2.
Table 8.2. Features of the 7 village role-playing game in Lingmuteychu.
Features Lingmuteychu 7 village game Players Irrigators: different categories, from up to downstream villages Roles Receive village water share, irrigate plots, share, monitor, voice
Rules of the game Declare rainfall, allocate village water share, share among three within a village, communication according to three modes
Game sets Playing board, with wooden cubes representing water unit Turns (round of play) 1 year Gaming session: 4 days
Some of the aspects, like sharing rules and the decision-making process, were left open
so that the interaction among the players will be vibrant and free, allowing them to create rules as
the game proceeded. The turns used in Lingmuteychu was 1 year representing a rice season.
While most farmers practice double cropping of potato or mustard or wheat after rice, only rice
was included in the RPG as it is the only crop linked to water shortage issue.
The first version of the 7 villages RPG was pre-tested with Natural Resources Training
Institute (NRTI) students (now College of Natural Resources). Coincidently as there was one of
the students in the group from Lingmuteychu, it was appropriate that he could relate the game to
the reality and explain its relevance for the benefit of the group. The information generated from
the gaming session was analysed using a spreadsheet which was useful to communicate to the
students. The trainees expressed the need for a facilitator in each group to record observations

230
and exchanges for further analysis. The pre-testing was also useful to calibrate the game. Based
on the pre-testing, seven facilitators were introduced in the 7 village game. To develop a
computer ABM based on this RPG, the entities presented in Table 8.3 were identified and UML
diagrams built to conceptualize the model.
Table 8.3. Model entities in Lingmuteychu.
Entity 7 Village RPG Social Farmer, village, management group Spatial Paddy field Passive Climate, water, rice crop
8.3.2 The twelve steps of the ComMod process in Lingmuteychu
The formal sequence of twelve steps implemented in the case of Lingmuteychu is
presented in Table 8.4. The sequence clearly displays the flexibility of the approach and the
recurrence of steps along the process. This resembles cases implemented in the Lam Dome Yai
watershed of Northeast Thailand (Naivinit et al., 2010) and Bac Lieu province of the Mekong
delta (Dung et al., 2009) where sensitization happened after the initial field activities. Similarly,
training was another step which was important as capacity development was an output of the
process. In addition to enhancement of capabilities of farmers, researchers were also trained
though formal training programs. Unlike in case studies in Thailand and Vietnam where the
ComMod approach was used, monitoring and evaluation of the process effects was continuously
conducted by an on-site researcher.
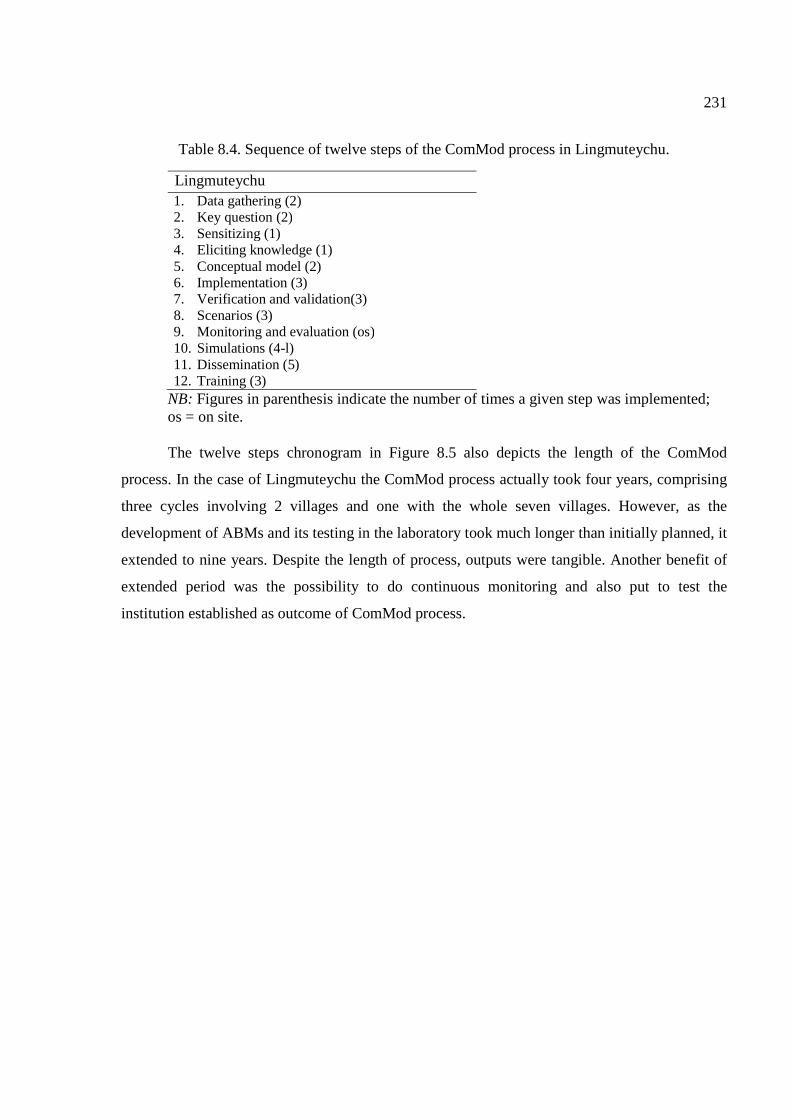
231
Table 8.4. Sequence of twelve steps of the ComMod process in Lingmuteychu.
Lingmuteychu 1. Data gathering (2) 2. Key question (2) 3. Sensitizing (1) 4. Eliciting knowledge (1) 5. Conceptual model (2) 6. Implementation (3) 7. Verification and validation(3) 8. Scenarios (3) 9. Monitoring and evaluation (os) 10. Simulations (4-l) 11. Dissemination (5) 12. Training (3)
NB: Figures in parenthesis indicate the number of times a given step was implemented; os = on site. The twelve steps chronogram in Figure 8.5 also depicts the length of the ComMod
process. In the case of Lingmuteychu the ComMod process actually took four years, comprising
three cycles involving 2 villages and one with the whole seven villages. However, as the
development of ABMs and its testing in the laboratory took much longer than initially planned, it
extended to nine years. Despite the length of process, outputs were tangible. Another benefit of
extended period was the possibility to do continuous monitoring and also put to test the
institution established as outcome of ComMod process.

232
Legend: a: training, b: trip to Bhutan, c: preliminary diagnosis, d: first RPG (2 villages), e: first ABM (2 villages), f: simulations in the laboratory, g: presentation, h: monitoring by local facilitator stationed at the research site, i: second RPG (7 villages), k: second ABM (7 village game), m: presentation to all the community, n: AKB post-graduate diploma, o: third & final ABM (7 villages). Figure 8.5. Chronograms of ComMod processes implemented at Lingmuteychu watershed to facilitate collective management of resources.
1 2 3 4 5 6 7 8 9 10 11 12 1 2 3 4 5 6 7 8 9 10 11 12 1 2 3 4 5 6 7 8 9 10 11 12 1 2 3 4 5 6 7 8 9 10 11 12
1 Sensitizing a2 Key question b3 Data gathering c4 Eliciting knowledge5 Conceptual model6 Implementation d d d d e e e i k7 Verification & Validation d d e i k8 Scenarios d d e i k9 Simulations f f
10 Dissemination l g11 Monitoring & Evaluation12 Training
Twelve Steps
h
2002 2003 2004 2005
1 2 3 4 5 6 7 8 9 10 11 12 1 2 3 4 5 6 7 8 9 10 11 12 1 2 3 4 5 6 7 8 9 10 11 12 1 2 3 4 5 6 7 8 9 10 11 12 1 2 3 4 5 6 7 8 9 10 11 12
1
2
3
4
5
6 k k o o o7 k k o o o8 k k o o o9 f f f f f
10 g m m11
12 a a nh
20102006 2007 2008 2009

233
8.3.3 Description of the seven Village model
8.3.3.1 Overview
The process of companion modelling work in Lingmuteychu watershed dates back to
May 2002 when first RPG between 2 villages in the upper catchment was organize to better
understand irrigation water sharing conflict between Limbukha and Dompola in the watershed. A
computer ABM was developed in Common-pool Resource and Multi-agent Systems (CORMAS)
platform and was used only in laboratory for the purpose of generating scenarios and making
comparative analysis (Gurung, 2002). During the final debriefing workshop of the December
2003 RPG, participants requested for up-scaling the RPG to 7 villages within the watershed. A 7
village RPG was organized in April 2005 with the objectives of (i) to facilitate exchanges among
the 7 villages regarding NRM at the watershed level; (ii) to enhance understanding of
stakeholders and of the resource use dynamics at the watershed level; (iii) to accompany the
creation of a Watershed Management Committee (WMC) in Lingmuteychu; and (iv) to define
the next steps toward the establishment of a formal WMC before late 2005 and to plan several
short-term priority actions in NRM. Later on, the 7 Village RPG was implemented in the
CORMAS platform to further explore scenarios.
Purpose
The purpose of the 7 village RPG was to bring together the seven villages in the sub-
watershed to discuss and explore different strategies to resolve the long standing water sharing
problem. While the computer aided ABM could not be developed immediately and applied in the
field, ABM was developed to explore scenarios in the laboratory. The AMB was also used to
present different scenarios to community and the watershed management committee, so that they
could foresee and understand the consequences of different management options.
State variables and scale
The model uses seven variables classified into three categories of entities: spatial, social,
and passive (Table 8.5). As the issue is related to irrigation, water actions are based at the plot
level defined spatially as two to four plots per player. The plot can hold a maximum of two units
of water and two land use features as rice or fallow. The social entities comprise of three farmers

234
per village who are clustered into seven villages. All the villages are represented in the
management committee with one member each. Each farmer owns two to four plots of land
which they can irrigate and grow rice. The management committee takes collective decisions to
allocate water to villages and declare awards based on the water use. Passive entities in the
model are the rainfall, water and the rice crop. The climate is used to represent four rainfall
patterns, i.e. dry, moderately dry, wet and severely wet, based on which irrigation water share is
allocated to each village. After the water allocation, players share and allocate to their field based
on the protocol. The hierarchies of entities are presented in Figure 8.6 as a UML class diagram.
Table 8.5. Variables of the 7 Village model used in Lingmuteychu.
Entity Parameter Default value Unit
Spa
tial Plot Water use 0..2 Number
Land use Fallow, rice Fallow Village Households 3 Number Water share 7 to 25 Units
Soc
ial Farmer plot per farmer 4 Plots
Management Group Number of village 7 Villages Reward 1000-4000 Ngultrum69
Pas
sive
Climate Rainfall Dry, Moderately Dry,
Wet, Severe Wet State Water Water for village 1 during dry climate 7 Water unit Water for village 1 during moderately dry climate 13 Water unit Water for village 1 during wet climate 19 Water unit Water for village 1 during severe wet climate 25 Water unit Water for village 2 during dry climate 3 Water unit Water for village 2 during moderately dry climate 5 Water unit Water for village 2 during wet climate 7 Water unit Water for village 2 during severe wet climate 9 Water unit Water for village 3 to 7 during dry climate 4 Water unit
Water for village 3 to 7 during moderately dry climate 7 Water unit
Water for village 3 to 7 during wet climate 10 Water unit
Water for village 3 to 7 during severe wet climate 13 Water unit
Crop Crop type when water cube is present Rice crop type
Crop type when plot is empty no crop Maximum crop yield per plot 700 Kg Crop yield/plot when water is maximum 500 Kg Crop loss due to late planting 30 % Crop loss due to dry season 50 % Crop loss due to severe wet 40 %
69 1 Euro = Nu. 60.00

235
Figure 8.6: UML class diagram showing the attributes and methods associated to each entity in Lingmuteychu 7 villages model. Process overview and scheduling
The model is scheduled on annual time step representing a rice season. Depending on the
climate water share for each village is computed based on which water is shared among the
farmers. The model calculates rice yield, income and the reward (Figure 8.7).
The model is programmed based on three communication and water sharing profiles as
individual, village and collective (Figure 8.8). In the individual scenario, water sharing is based
on the preference of the individual, which in village preference and watershed level preference is
calculated for village and collective level respectively. The diversity of the farmers is represented
in the model by three categories based on the number of plot each owns. Depending on the
number of plots assigned to each farmer in a village, water is shared as indicated in Figure 8.9.

236
Figure 8.7: UML sequence diagram of the 7 villages model in Lingmuteychu.
Figure 8.8. Activity diagram presenting the decision making process to allocate water in the paddy field in the 7 villages model of Lingmuteychu.

237
Figure 8.9: Activity diagram displaying the decision making process to share water among three categories of farmers in Lingmuteychu 7 villages model.
The model runs with three communication scenarios (Table 8.6). First as case-as-usual
where each village operates individually and choices individual preference of water units to use
in plot. In the village mode it acts as a unified group with an internal water sharing system. In
first scenario, there is no interaction between villages and no exchange of water. In the collective
mode, all the seven groups are placed in one row sequentially represent upstream and
downstream villages (Figure 7.8). Players are allowed to freely communicate between groups
and even seek surplus water from upstream village. The final collective scenario with swapped
roles was organized in a manner that players were randomly assigned to different villages. The
seven game boards were placed in a row and the players surrounded the array of game boards to
play. Players could monitor all the moves, and make suggestions for collective good.
Share water
Out of Model
Water for village
Calculate water
share
3 classes of
farmers in village
Y
Share 0.58, 0.28 and 0.14
among three
All 3 farmers of
same class
Y
Share 33% each among
three
2 superior class
and 1 inferior
Y
Share 40% each to 2 superior
and 20% to inferior
1 superior and 2
inferior
Y
Share 50% to superio and
25% each to 2 inferior
N
N
N
N

238
Table 8.6. Mode of communication and scenarios used in the 7 village model in Lingmuteychu.
Modes Rounds Communication modes 1 Individual 5 The decision to allocate water is based on
individual choice and water-yield representation 2 Village 5 Water allocation to plot is based on village
decision which is the best based on village level water-yield representation
3 Collective 5 Water allocation is based on the management committee – i.e. all village information is put together and decision is based on the collective best.
Design Concepts
The model using the three scenarios moves from the traditional (existing) system, to
village level interactions, and finally to a collective mode of communication where all villages
within the sub-watershed make collective decisions. The individual mode is designed to replay
the behaviour of farmers who behave independently to decide amount of water for each plot and
also the plot which will be cropped. The way three players strategize water use can lead to the
emergence of a unique pattern, and also a common interest group and collective strategies to take
benefit of the resource. It will be useful to make comparison of strategies across the seven
villages on water use. The emergence may change when the agents decide collectively.
All agents have individual identity representing the real situation where irrigators are
grouped into four groups based on water rights. They are Thruelpa, Cheep, Chatro, and
Lhangchu (Gurung, 2004). In the model the first three are used as they have definite water
allocation of 58%, 28%, and 14% respectively. The last category is not included as this group is
made of generally landless water beggars. Three agents are grouped into a village sequenced
from one to seven representing the communities in the sub-watershed. All the seven communities
are grouped into the management institution of the sub-watershed. As such all agents have to
memorize the features and their location, plot number and water share. The three agent
categories and differing composition in each village that act on the water share, depending on
rainfall randomly assigned, is expected to be the principal source of interaction. In view of
agents behaving based on the random water share influenced by random rainfall pattern, the
model can be considered as stochastic. The model was tested using multiple simulations to

239
observe the consistency of agent behaviours. The computer ABM version was first presented to
the WMC after which it was presented to all the seven villages so that all irrigators could observe
the simulations and be aware of the scenarios and their consequences.
Details
Initialization
Each agent is assigned with a number from one to twenty one and is grouped into seven
clusters as villages. All farmers are randomly assigned with a given farmer class (Thruelpa,
Cheep, and Chatro). These initial features of the eighteen farmers were kept constant for all time
steps and rounds to allow them to explore the varying resource level.
Every time step is initiated by randomly picking rainfall patterns as represented in Table
8.7. Four variations are used to indicate rainfall patterns as in the 7 village RPG. Depending on
the rainfall pattern, a given village level water share is allocated to each village. Across the
rainfall pattern, broad allocations among villages are used as village two gets 30% of the first
village, and village three to seven receive 50% of the first village share.
Table 8.7. Rainfall patterns and corresponding water shares (units) for each village in the 7 village model used in Lingmuteychu.
Weather Village
1 2 3 4 5 6 7 Severe wet 25 9 13 13 13 13 13 Wet 19 7 10 10 10 10 10 Moderately dry 13 5 7 7 7 7 7 Dry 7 3 4 4 4 4 4
Input
The comprehensive diagnostic survey of Lingmuteychu sub-watershed in 1997 identified
four farmer categories with well defined water shares. It was also revealed that the top village
(Limbukha) in the catchment, from where Limtichu stream originates. Limbukha being the first
settler in watershed dominates water use with the customary rule of “first-come-first-served”.

240
There is distinct water sharing proportions between villages followed ever since rice cultivation
started.
Based on stream flow and plot water utilization measurement, a rough relation between
rainfall and stream flow was established. Four rainfall patterns would result in water volume as
100 units during severe wet, 75 units in wet season, 50 units in moderately dry and only 30 units
during dry, implying a base flow of 30 units. Irrespective of rainfall pattern, the water shares
between the seven villages are set as 25% for the first village, 9% for the second village and 13%
each to the remaining villages. The water allocations were based on the local understanding that
second village gets one-third of first village’s share, while the remaining five villages gets half of
what first village uses. As the individual water use pattern is dependent on the profile of the
agents, water allocation is also set as individual, village level, or watershed level.
Spatial configuration and interface
The spatial settings are a grid with a 24 rows x 6 columns tessellation to represent a
virtual landscape on which plots (paddy fields) are located. Each row has six cells representing a
space for the agent (first cell), 2 to 4 plots of rice fields (cell two to five) belonging to one agent,
and the 6th cell represents the irrigation canal. There are twenty one rows assigned to as many
agents. Three rows in series are grouped as a village, i.e. rows one to three make village one
and rows four to six is village two and so on (Figure 8.10). A water unit is represented by a
coloured circle and each village is assigned with one different colour.

241
Figure 8.10: CORMAS interface of the seven village agent-based model used in Lingmuteychu.
8.4 Analysis of gaming and simulation sessions
8.4.1 Shared representation of context and participants understanding
As stipulated by the posture of the ComMod approach, the integration of points of view
of all stakeholders, including those of the modeller, to construct the model enhances its relevance
and use. According to the constructivist approach, reality is constructed creatively with their
language, labour, and technology which is dynamic and changes as the circumstance changes
(Röling, 1996). From the cognitive perspective, representations are mentally constructed using a
set of symbols and logical inferences (Johnson-Laird, 1983). In the case of Lingmuteychu, three
broad categories of stakeholders were identified and their representations can be simply
described as given in Table 8.8.
Farm 1
Farm 7
Farm 6
Farm 5
Farm 4
Farm 3
Farm 2
Farm 8
Farm 14
Farm 13
Farm 12
Farm 11
Farm 10
Farm 9
Farm 19
Farm 18
Farm 17
Farm 16
Farm 15
Agent
Village 1
Farm 21
Farm 20
Village 7
Village 6
Village 5
Village 4
Village 3
Village 2
4 Plots of rice fieldWater unit

242
Table 8.8. Simplified representation of the mental maps or perceptions of the situation by three different categories of stakeholders in Lingmuteychu.
Site (resource) Stakeholders Representation Method to capture the initial representation
Lingmuteychu (water for irrigating rice)
Irrigator
Participatory resource mapping & envisioning
Infrastructure providers
Consultation and development plans
Researchers
Field trials and literature reviews
The ComMod approach was efficient to recognize the shared representations of the
context and use them in elucidating the details on how they manage the system and how they
foresee the future. The consultative process was the first effort to create a preliminary
representation which was further improved with more clarity in expressing the mental frame. The
schematic representation in Figure 8.11 presents how initial individual points of view converge
into a shared representation which facilitates new understanding and potentially change these
individual points of view.

243
Figure 8.11. Co-designing of shared representation of the water management problem in the companion modelling process implemented in Lingmuteychu.
The study showed that farmers always perceive natural resource depletion and their
marginalization despite their dream of ultimate improvement with external support. Similarly in
both cases, the support service agency sees structural intervention like a network of canals and
weirs in Lingmuteychu and laying pipes. The third agent in this case was the researcher who had
very limited understanding of the situation, therefore used preliminary field observations and
literature reviews to construct his own perception.
8.4.2 Identification of scenarios from gaming sessions
The RPG used rainfall patterns as the random factor which determined the resource
endowment. Before every turn rainfall was randomly picked. While four rainfall patterns were
used in 7-village game. Against the rainfall patterns, a set of protocols were used as a constant
factor to induce variation in behaviour. Traditionally as irrigators interact only within the village
this system was considered as a first protocol in the RPG representing the existing water sharing
system. To make a comparison of different water sharing protocols, a second protocol was
introduced with an open “collective” social network allowing sharing water within and between
Shared representations
leads to…...
Social EnvironmentalResource
Common ground
for stakeholders
Individual
representations
leads to…….
New understanding
of individual
representations
Social
Environmental
Resource

244
villages. The third protocol was formed by swapping the roles of each player and maintaining an
open social network. The combination of four rainfall patterns and three protocols generates
twelve scenarios which can be compared against parameters associated to water as shown in
Table 8.9.
Table 8.9. Scenarios derived from the 7 village gaming sessions executed in Lingmuteychu.
Protocol Rainfall pattern Severe wet (R1)
Wet (R2) Moderately dry (R3)
Dry (R4)
P1.Village wise: interaction and water sharing only within village
S1=P1R1 S2=P1R2 S3=P1R3 S4=P1R4
P2.Collective: interaction and water sharing within village and between villages
S5=P2R1 S6=P2R2 S7=P2R3 S8=P2R4
P3.Swapped and collective: open interaction and free water sharing (all irrigators operate as one single community)
S9=P3R1 S10=P3R2 S11=P3R3 S12=P3R4
8.4.3 Analysis of simulation results of the different scenarios
For the purpose of comparison, four aspects related to water use efficiency are analysed.
8.4.3.1 Resource stress
One of the visible parameter players considered for efficient water use system is the
balance of water. The RPG was efficient to generate interactions among different players.
Scenario S5 (Table 8.10) resulted in an overall water balance of almost 90 units followed by
Scenario S1 with only little above 30 units of water. All other scenarios had water balances of
less than 20 units. The traditional water sharing system (S3 and S4) and collective swapped (S11
and S12) under the influence of moderate dry and dry situation used all the water (Figure 8.12).

245
Figure 8.12. Water balance from the simulation of twelve scenarios with the 7village role-
playing game in Lingmuteychu.
8.4.3.2 Equity in resource allocation
In a situation where famers are segregated using customary rules for access and sharing
of natural resource, there is always an issue of inequality in resource allocation. This is further
aggravated as allocations are done in terms of time and proportion of flow. In an attempt to make
a comparison among scenarios simulated in gaming sessions, the Gini coefficient70 is used to
assess the way each scenario influences equity in water allocation. In such situations it is
relevant to assess the balancing power any strategy can introduce. The Gini coefficient has been
used in measuring water use inequality in South Africa (Cullis and van Koppen, 2007).
70 The Gini coefficient is a measure of the inequality of a distribution, a value of 0 expressing total equality and a value of 1 maximal inequality. The Gini index is computed as follows:
Where G= Gini index; fi= proportion of households in interval i; pi= the proportion of water allocation received by households in interval i and all lower intervals
0
20
40
60
80
100
S1 S2 S3 S4 S5 S6 S7 S8 S9 S10 S11 S12
Wa
ter u
nits
(N
o.)
Scenario

246
In Lingmuteychu water shares among players in each scenario was evaluated and
compared across the twelve simulated scenarios and the results are presented in Figure 8.13.
Figure 8.13. Inequality in water shares across twelve simulated scenarios in Lingmuteychu.
It appears fairly equitable in terms of water share allocations, however variations exists.
For instance scenario (S5) characterized by free interactions and sharing within and among
villages fosters total equality. The remaining scenarios can be clustered into two groups (i) those
below coefficient of 0.10 – S1, S2, S5, S6, S9, and S10, and (ii) those above 0.15 coefficient – S3,
S4, S7, S8, S11, and S12. This difference can be associated to rainfall pattern, as cluster (i) closer to
perfect equality represents condition of high rainfall pattern and second cluster receives lower
rainfall.
8.4.3.3 Resource sharing
In the gaming sessions, vibrant exchange and interactions among players were observed.
As such the exchange of water units (sharing) is an interesting indicator to compare different
scenarios (Figure 8.14).
0.08
0.038
0.197 0.197
0
0.055
0.165
0.194
0.061
0.043
0.197 0.197
0.00
0.05
0.10
0.15
0.20
0.25
S1 S2 S3 S4 S5 S6 S7 S8 S9 S10 S11 S12
Gin
i coe
ffic
ient
Scenario

247
Figure 8.14. Number of water units shared in different scenarios in Lingmuteychu.
Water sharing was exceptionally high in scenario S5 where players freely interacted
within and among villages and the rainfall pattern was favourable. Otherwise, exchange of water
was limited under scenarios corresponding to severe wet and wet patterns, and in all other
scenarios there was no exchange. This is again influenced by low water availability. The
maximum water sharing in S5 also fostered equitable distribution as indicated above.
8.4.3.4 Satisfaction of water needs
The fulfilment of water needs, both individually and collectively, is another factor players
considered as a tangible effect of any strategy. Based on the outputs of the gaming sessions, a
simple assessment of satisfaction level was done by (i) calculating the proportion of irrigated
plots by all players in each scenario. Satisfaction level was heavily influenced by the rainfall
pattern, higher rainfall giving very logically a higher satisfaction as shown in Figure 8.15.
0
25
50
75
100
S1 S2 S3 S4 S5 S6 S7 S8 S9 S10 S11 S12
Wat
er s
hare
d (u
nits
)
Scenario

248
Figure 8.15. Proportion of players fulfilling their water requirement in different scenarios in
Lingmuteychu.
Scenario (S5), where collective interaction and water sharing within village and between
villages happens under high rainfall pattern, was the only situation where all plots were irrigated.
The influence of low rainfall was also distinct in limiting the satisfaction level below 36%
irrespective of the protocol (see for S4, S8, and S12).
8.4.4 Interview of players and new learning
At the end of the RPG sessions, all the players were individually interviewed using
structured questionnaire with an objective of (i) to learn more about players’ decisions regarding
land use and water management, and (ii) to elucidate some of the decisions made during the
gaming sessions.
After referring to the past two ComMod cycles during 2003, they considered four new
learning by participating in the process. They are water conservation, collective management,
sequencing (re-scheduling) of rice planting time, and learning alternative strategies from the
members in the game (Figure 8.16).
0.00
0.25
0.50
0.75
1.00
S1 S2 S3 S4 S5 S6 S7 S8 S9 S10 S11 S12
Sat
isfa
ctio
n le
vel
(%)
Scenario
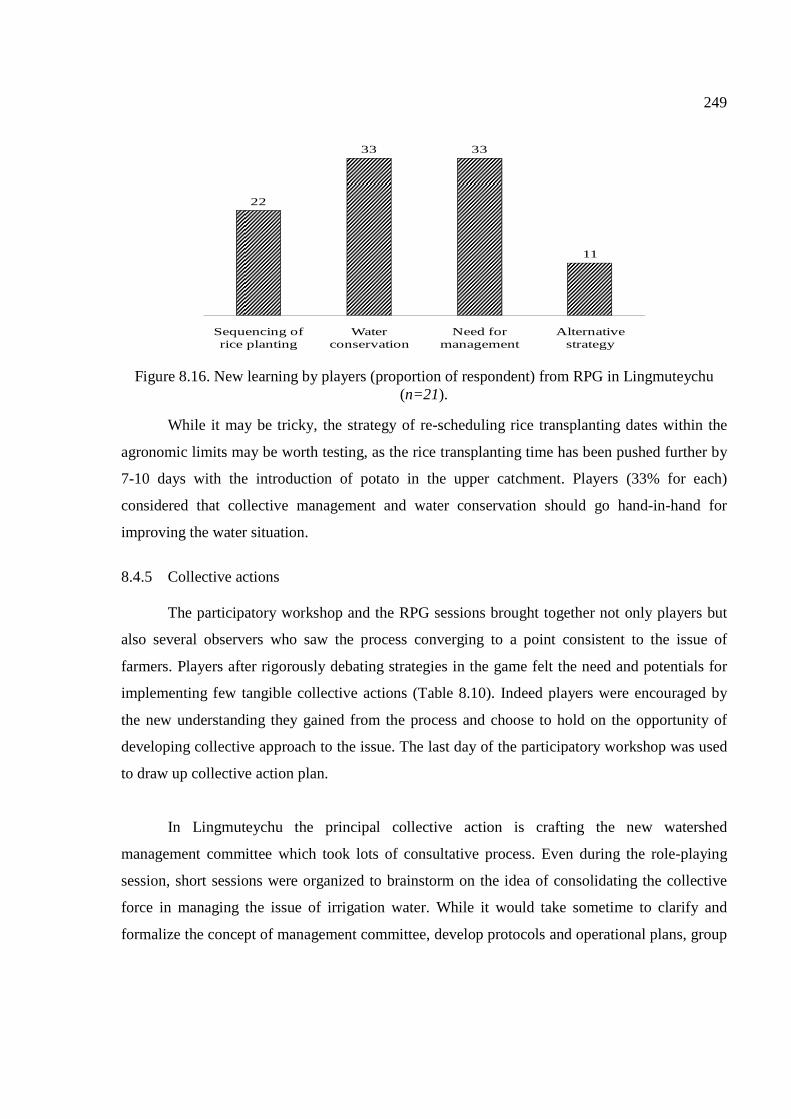
249
Figure 8.16. New learning by players (proportion of respondent) from RPG in Lingmuteychu (n=21).
While it may be tricky, the strategy of re-scheduling rice transplanting dates within the
agronomic limits may be worth testing, as the rice transplanting time has been pushed further by
7-10 days with the introduction of potato in the upper catchment. Players (33% for each)
considered that collective management and water conservation should go hand-in-hand for
improving the water situation.
8.4.5 Collective actions
The participatory workshop and the RPG sessions brought together not only players but
also several observers who saw the process converging to a point consistent to the issue of
farmers. Players after rigorously debating strategies in the game felt the need and potentials for
implementing few tangible collective actions (Table 8.10). Indeed players were encouraged by
the new understanding they gained from the process and choose to hold on the opportunity of
developing collective approach to the issue. The last day of the participatory workshop was used
to draw up collective action plan.
In Lingmuteychu the principal collective action is crafting the new watershed
management committee which took lots of consultative process. Even during the role-playing
session, short sessions were organized to brainstorm on the idea of consolidating the collective
force in managing the issue of irrigation water. While it would take sometime to clarify and
formalize the concept of management committee, develop protocols and operational plans, group
22
33 33
11
Sequencing of rice planting
Water conservation
Need for management
Alternative strategy

250
suggested some immediate collective actions which could be kept on hold. The collective actions
agreed by the group are given in Table 8.10.
Table 8.10. Collective actions decided in Lingmuteychu sub-watershed at the end of the ComMod process.
SL. No
What Where Why When Who Implementer Collaborator
1 Plantation in water sources (catchment)
Individual villages
To protect all water sources
June 2005 to July 2006
Tshogpa and farmers
RNRRC Bajo and Extension office
2 Rehabilitating 7 acres of abandoned wetland
Lumpa Wetland fields in Lumpa had been abandoned due to breakdown of irrigation scheme
June 2006 Gup (Block head)
RNRRC Bajo
3 Construction of check dams
All villages As there is no natural ponds and lake runoff is an issue, so check dams can facilitate water conservation
June 2005 to July 2007
Gup (Block head)
RNRRC Bajo
4 Institutionalizing Watershed management committee
Lingmuteychu watershed
To collectively manage NRM issues in the watershed
June 2005to July 2007
Gup (Block head)
RNRRC Bajo and Extension office
Although it took sometime to start the planned activities, all the above activities (Table
8.11) were completed by middle of 2010 as detailed below:
- The drafting of bye laws for the watershed management committee started in May 2005.
The bye-law was submitted to district administration, district court, policy and planning
division of the MoAF, and irrigation division of the DoA for review and approval. After
the document was approved the 10 member Lingmuteychu watershed management
committee institution was formally launched in early 2006 with village headman as the
chairman.
- By early 2006 the irrigation canal in Lumpa which was abandoned for more than 10 years
was rehabilitated bring back 7 acres of terraced paddies into cultivation.

251
- Re-plantation of catchment areas took time as organizing suitable planting materials was
difficult. Plantation of degraded area in all villages started by 2008. Further with
community forestry plantation launched in Limbukha, the pressure to community to
reforest the catchment was reduced.
- Community members under the guidance of research and extension staff dug several
check dams in their village. However, the most prominent action is the construction of
village level water harvesting tanks during 2008.
- All the above activities are still continuing in the sub-watershed.
8.4.6 Identification of scenarios for further computer simulations
As described earlier, the RPG sessions were efficient to support the exploration of simple
scenarios within a short time frame. Although the results show definite trends and helped in
generating a shared representation of the resource situation, it was not possible to introduce new
parameters and test combinations with other parameters for longer periods. As highlighted
earlier, the unpredictable characteristics of SES over a longer time frame cannot be modelled
into a RPG. To complement gaming results, if all known factors and their parameters can be
integrated, computer ABM has the ability to generate rapidly simulated scenarios over a several
time-steps. After presenting the RPG-based ABM (cRPG – Computerized RPG) to the
community members, different versions of the ABM were developed by incorporating new ideas
which emerged from the onsite ComMod process. It was unfortunate that the ABM could not be
applied on site allowing players to explore different scenarios. The inability of field application
was the lack of researcher’s skill to use CORMAS thereby dependence on the experts. Further
the endless revisions of the parameter to make it easily comprehensible to the research team took
longer time. After the model was finalized during early 2010, it was used to laboratory study for
exploring the scenarios. However, the research team still hopes to use the ABM in the site and as
an application to demonstrate to other communities facing similar problem of natural resource
management.
8.4.6.1 Scenarios simulated with the 7villages agent-based model
Three versions of the 7 villages ABM were developed, each representing three broad
concepts as (i) traditional regime, (ii) payment for environmental services, and (iii) trust and

252
reciprocity. Each version is briefly explained and the scenarios identified for exploration are
described below.
8.4.6.1.1 Traditional regime version
The traditional regime model attempts to replicate the customary regime which is
characterized by agents having varying land holding and water rights. All of them operate under
uniform climatic conditions of random rainfall which has a consistent effect on water availability
for irrigation. As described in earlier sections, there are four categories of irrigators each having
different water use rights. For instance type A has full rights over water, type B can get 50% of
what type A receives, type C receives 50% of type B’s share, and type D has no water allocation.
Type D traditionally do not own wetland, as such no water share, but if any one owned or share
cropped rice they had the rights to beg (or request) water from other users. A scenario based on a
fixed configuration of plots and water share was explored over 250 time steps and with ten
repetitions to study its effects on water use efficiency (Table 8.11).
Table 8.11. Number of plots per farmer and their configuration in each village in the traditional regime version of the 7 villages agent-based model in Lingmuteychu.
Parameter Farmer Village
1 Village
2 Village
3 Village
4 Village
5 Village
6 Village
7
Number of Plots
1 2 2 1 2 1 3 2 2 3 2 2 3 2 2 2 3 4 3 2 4 3 4 4
Water share
1 14% 25% 20% 14% 14% 28% 25% 2 28% 25% 40% 28% 28% 14% 25% 3 58% 50% 40% 58% 58% 58% 50%
8.4.6.1.2 Scenario based on payment for environmental services
In the 7 villages RPG, although there were rice yield and income as indicators for
individual performances, a means to indicate collective performance was introduced by paying
financial incentive based on quantity of water saved at the plot level or flowing out of the sub-
watershed. Using different reward levels (0 to 10 with interval of 2.5) for both parameters under
the influence of 2 sharing rules (1: Allocate water cubes looping on the farmers and giving them
one cube as long as they need and as long as water remains, and 2: Allocate water to farmer

253
based on the proportion of plots) a combination of twenty scenarios were identified as shown in
Table 8.12.
Table 8.12. Scenarios use for the reward for environmental services version of the 7 village agent-based model in Lingmuteychu.
Sharing rule Reward on plot Reward on exit flow
Maximum reward 0 2.5 5 7.5 10 0 2.5 5 7.5 10
1 S1 S2 S3 S4 S5 S6 S7 S8 S9 S10
2 S11 S12 S13 S14 S15 S16 S17 S18 S19 S20
8.4.6.1.3 Scenarios for the 7 villages agent-based version based on trust and reciprocity
The non-confrontational interactive process during the gaming and simulation sessions
generates results which are not based on scientific assumptions. According to Chaudhuri et al.
(2002) such deviations of behavioural patterns from homoeconomicus assumptions are due to
trust and reciprocity. Although not explicit during the collective mode in the gaming sessions, we
observed the gradual emergence of coherent community. This feature could not be tested in
gaming session because of data handling limitations and the inability or difficulty to set
parameters for an intangible concept like trust. In such group dynamics there ought to be a
relation of mutual dependence. To check if agents are trustworthy, the idea of punishment was
introduced along with the concept of reciprocity (Table 8.13). From this third version of the 7
villages ABM, the following parameters were identified to generate scenarios:
- Social network: to set social observation space of 2 representing one agent is observed or
monitored by two agents (a village) and 20 signifying that an agent is monitored by all
20 agents (the watershed) (as 21 represented the whole watershed in the RPG).
- Cost to punish: all defaulters have to pay the cost of defaulting, but it also involves cost
to monitor and punish the cheater. Four levels of cost (0, 150, 350, and 450) are proposed
to see how it affects the total income.
- Perception rule for water sharing: two rules were used as (i) average of farmer share, and
(ii) equitable sharing.

254
- Trust threshold: The trust (Trust = 1- number of cheaters/social observation space) levels
of five (0, 0.25, 0.5, 0.75, and 1 implying 0 as no trust and 1 as full trust or no cheating)
are used to assess how agents behave under different threshold.
Overall the concept of punishment and reciprocity were introduced as: if farmer has
punished another agent during the last three time steps, then punisher will follow the
management group rule. If the agent was unsatisfied for the last two time steps, he will follow
his own perception. If the trust is greater than the trust threshold, the agent follows the
prescription of the management group. If not agent follows its own perception. To ensure
trustworthy behaviour, if an agent has punished another agent the counter of time for reciprocity
is increased, after which it will be reset to zero. The two basic parameters of rainfall and number
of plots are set at random and fixed respectively.
Table 8.13. Scenarios used with the 7 village trust and reciprocity version of the 7 village agent-based model in Lingmuteychu.
Perception rule for water
sharing
Trust threshold
Social network 2 20
Cost to punish 0 150 350 450 0 150 350 450
1
0 S1 S2 S3 S4 S5 S6 S7 S8 0.25 S9 S10 S11 S12 S13 S14 S15 S16 0.5 S17 S18 S19 S20 S21 S22 S23 S24 0.75 S25 S26 S27 S28 S29 S30 S31 S32
1 S33 S34 S35 S36 S37 S38 S39 S40
2
0 S41 S42 S43 S44 S45 S46 S47 S48 0.25 S49 S50 S51 S52 S53 S54 S55 S56 0.5 S57 S58 S59 S60 S61 S62 S63 S64 0.75 S65 S66 S67 S68 S69 S70 S71 S72
1 S73 S74 S75 S76 S77 S78 S79 S80
8.4.7 Analysis of simulation results of scenarios with the computer agent-based model
8.4.7.1 Traditional management model
This traditional management model was a means to validate the consistency of its
behaviour. With all agents fulfilling their water needs and exhausting the water completely, there

255
were clear differences in total outcome between agents. The differences in outcomes were related
to how each agent strategized water allocation (Figure 8.17).
Figure 8.17. Average cash and water demand in open access individual mode simulated with the traditional management regime of the 7villages agent-based model in Lingmuteychu.
For instance agents 15, 18, and 21 although they have the same number of plots
(representing village 5-agent 13, 14, 15; village 6-agent 16, 17, 18; and village 7-agent 19, 20,
21) and equal water shares, there is clear a difference in their outputs. Similarly among the
villages 1, 4, and 6 having 9 plots each and equal units of water used, village 1 clearly
outperforms other two in terms of total output. It indeed produces 22% and 31% higher than
village 4 and 6 respectively. Agents 1, 10, and 17 who have only 2 plots each exceptionally have
demand of 4 units of water (highest) while all others take only 2 units of water.
Except for three agents (1, 10, and 17) who had highest water demand which could have
been influenced by random, there is a trend for balancing the water demand among the agents
within a village. Although there was distinct variation in the output of farmers, it showed the
village level performance. The difference in the total cash earned from cropping is dependent on
plot size.
0
0.75
1.5
2.25
3
3.75
4.5
0
500
1000
1500
2000
2500
3000
1 2 3 4 5 6 7 8 9 10 11 12 13 14 15 16 17 18 19 20 21
Village 1 Village 2 Village 3 Village 4 Village 5 Village 6 Village 7
Wat
er u
nits
Tota
l out
com
e (C
ash)
Village and agents
Outcome Water Demand

256
8.4.7.1.1 Reward for water saving version
The concept of rewarding for saving of water was tested at two levels, one at the plot
level (reward rule 1) and the second level based on the flow of excess water from the sub-
watershed (reward rule 2). Water savings at these two levels were influenced by two water
sharing rules of (i) share water equally (distribute one each at a time as long as water remains)
and (ii) share water proportional to plot. Depending on the water savings, reward was set at 0 to
10. Figure 8.18 displays the results of the simulation of twenty scenarios based on average cash,
satisfaction and resource stress.
Figure 8.18. Average cash generated from 20 scenarios.
There is a distinct pattern of output between the two reward rules. When the reward is
based at the plot level water savings there is a high correlation between increasing maximum
reward and increase in average output (r2=0.99). While the output based on the exit flow seems
indifferent to the increasing maximum reward. There is also no significant difference between
the outputs from two water sharing rules in reward rule 2.
The reward and sharing scenario seem to restrain satisfaction level to only 49 to 66%
which may be due to tendency to save water thereby not fulfilling individual water requirement.
0
600
1200
1800
0 2.5 5 7.5 10 0 2.5 5 7.5 10
Reward rule 1 Reward rule 2
Ave
rag
e C
ash
(Nu
)
Maximum reward under 2 reward rules
Sharing rule 1 Sharing rule 2

257
There is slightly higher satisfaction level from sharing rule 1 when reward is based on plot level,
and in the other hand sharing rule 2 tends to foster higher satisfaction level when the reward is
based on exit flow (Figure 8.19).
Figure 8.19. Level of satisfactions in two reward rules.
Although the satisfaction level is low, there is only around 20% water stress which seems
unaffected by either the sharing rule or reward rule (Figure 8.20). In addition the balance of
water ranging from 1 to 4 which is estimated here as an exit flow may actually lower the water
stress if they were fully utilized. On an average across all scenarios around 2 units of water
consistently remained as balance from the system. There is a clear influence of reward rule and
sharing rule in water balance. For instance, rewarding based on exit flow in sharing rule 2 had
the maximum water flow of 2.5 units followed by R1S2 and R1S1. The lowest exit flow of 1.4
was recorded from scenarios of reward rule 2 and sharing rule 1.
0
0.25
0.5
0.75
1
0 2.5 5 7.5 10 0 2.5 5 7.5 10
Reward rule 1 Reward rule 2
Ave
rag
e ca
sh (N
u)
Maximum reward under two reward rules
Sharing rule 1 Sharing rule 2

258
Figure 8.20. Water stress and exit flow influenced by reward scenarios.
Trust and reciprocity model
The eighty scenarios generated from two levels of perception rules and five levels of
trust thresholds simulated against two network sizes and four levels of cost to punish provides a
consistent influence on output and the water resource. Figure 8.21 indicates the differential
influence of the two perception rules. When the management group uses average of farmer’s
preferred water quantity to decide the allocation of water (i.e. perception rule 1) the average
outcome (or income) is about 20% higher than in perception rule 2 where available water is
allocated equitably.
0.00
0.05
0.10
0.15
0.20
0.25
0
0.9
1.8
2.7
3.6
4.5
0 2.5 5 7.5 10 0 2.5 5 7.5 10
Reward rule 1 Reward rule 2
Wat
er s
tres
s (%
)
Exi
t flo
w (W
ater
uni
ts)
Maximum reward
Exit Flow - sharing rule 1 Exit Flow - sharing rule 2
Water stress - sharing rule 1 Water stress - sharing rule 2

259
Figure 8.21. Average income under the influence of trust and perception rule.
The pattern of influence of scenarios on level of water stress was uniform varying from
16% to 34% (Figure 8.22). The use of average water by individual farmer as a water allocation
rule clearly lowered the water stress in comparison to equitable sharing of water. Initially
although very small in difference, at trust threshold level of zero in both networks (2 as village
network and 20 as watershed network) and without any cost to punish, seem to lower water
stress in perception rule 1 and increase stress in perception rule 2. However, as trust threshold
increases the village network, without cost to punish, tends to have a greater influence in
reducing the water stress in perception rule 1 in contrast to escalating effect in perception rule 2.
0
500
1000
1500
(0x1
)
(0x2
)
(0.2
5x1
)
(0.2
5x2
)
(0.5
x1)
(0.5
x2)
(0.7
5x1
)
(0.7
5x2
)
(1x1
)
(1x2
)
Trust Threshold x Perception Rule
Ave
rage
inco
me
(Nu.
)

260
Figure 8.22. Average water stress as influenced by different scenarios of trust and perception
rule.
In contrast to the lower average income and higher water stress is influenced by
perception rule 2, it actually enhances the fulfilment of water requirement (represented by
satisfaction level in the model) from 6.7% at full trust level to 10.7% at trust level of zero.
(Figure 8.23). While the village network had lesser influence on satisfying the water
requirement under perception rule 1, it distinctly had some influence on the increased satisfaction
level under perception rule 2. The overall satisfaction level in all scenarios was consistently
above 75%, which corresponds to Gini coefficient of 0.043 in water distribution among 21
farmers.
0
0.1
0.2
0.3
0.4
(0x1
)
(0x2
)
(0.2
5x1)
(0.2
5x2)
(0.5
x1)
(0.5
x2)
(0.7
5x1)
(0.7
5x2)
(1x1
)
(1x2
)
Trust Threshold x Perception Rule
Wat
er s
tress
(P
ropo
rtion
)

261
Figure 8.23. Level of satisfaction in meeting water demands in different scenarios.
During the gaming sessions it appeared that congenial and interactive exchanges were
facilitated by the trust built among the players during the ComMod process. The trust and
reciprocity scenarios can have varying influences on the trust level of players. From the trust
threshold of 0.25 to 75% there is almost 100% trust among the players in all levels of
punishment cost and both social networks. At 100% trust threshold level the overall trust falls to
minimum as shown in Figure 8.24.
Figure 8.24. Level of trust of players in different scenarios of trust and perception rule.
0
0.25
0.5
0.75
1
(0x1
)
(0x2
)
(0.2
5x1)
(0.2
5x2)
(0.5
x1)
(0.5
x2)
(0.7
5x1)
(0.7
5x2)
(1x1
)
(1x2
)
Trust Threshold x Perception Rule
Sat
isfa
ctio
n le
vel (
%)
0.00
0.25
0.50
0.75
1.00
(0x1) (0x2) (0.25x1)(0.25x2) (0.5x1) (0.5x2) (0.75x1)(0.75x2) (1x1) (1x2)
Trust Threshold x Perception Rule
Trus
t lev
el (%
)

262
From the individual probes generated from the simulations, it was apparent that all
players except player 1 all defaulted. They were also actively involved in monitoring and
punishing the defaulters. Although the average trust level was as high as 95%, from the average
number of punishments imposed by the players it can be concluded that there were as high 190
instances of defaulting (Figure 8.25).
Figure 8.25. Average number of punishment and cost to punish across 80 scenarios.
The 7 village model was able to facilitate exploration of scenarios that was beyond the
ability of RPG. The testing of rewards and sharing rules helped to exhibit that collective
rewarding based on watershed level water saving assured higher satisfaction level. Likewise as
the trust threshold level increased there was corresponding increase the village network, without
cost to punish, tends to have a greater influence in reducing the water stress. It was evident that
trust level further reduced the defaulters.
Although this model was not directly applied in the field, it was used as a briefing tool to
the management committee. Presenting the model to the committee and to some villagers was
useful to show them the multiple scenarios and its implications on water management issues. The
combination of RPG and ABM was capable to let farmer participants to compare the reality and
the conceptual aspects like trust, reciprocity and rewards. The following sections presents tries
0
5
10
15
20
25
0
50
100
150
200
250
1 2 3 4 5 6 7 8 9 10 11 12 13 14 15 16 17 18 19 20 21
Inst
ance
s o
f p
un
ish
men
t (N
o.)
Co
st to
pu
nis
h (
Nu
.)
Farmers
Total cost to punish No. of punishments

263
to analyse the effects and impacts of ComMod process in Lingmuteychu and factors that
influence them.
8.5 Effects and impacts of ComMod process in Lingmuteychu
The ComMod approach is useful to represent and facilitate the co-evolution of human-
environment systems in complex SES (Trébuil, 2008). It can make problem-solving logical by
dividing the necessary knowledge into subunits, by associating an intelligent independent agent
to each subunit, and by coordinating these agents’ activities (Bousquet and Le Page, 2004). As
ComMod revolves within a co-learning process through free exchange among different actors
(Bousquet and Trébuil, 2005), it is bound to have effects and impacts in different domains and at
various organizational levels.
8.5.1. Direct and indirect effects
Table 8.15 provides a summary of the effects of the ComMod process in Lingmuteychu.
The effects can be segregated into individual, collective, institutional and biophysical.
Table 8.14. Direct and indirect effect of the ComMod process in Lingmuteychu.
Sites Level of effects Individual Collective Institutional Biophysical
Direct effects Increased awareness
on managing irrigation water
Increased awareness of problem faced by other farmers
Creation of a watershed management committee
Improved channel conveyance, construction of check dams, and water collection tanks
Indirect effects Individual farmer
have become open to new management
Respect for the needs of other farmers
Less confrontation among the sub-watershed communities
Stabilization of slopes, increase water flow in stream
The direct individual effects in both sites are the enhanced awareness of the individual
situation and strategy to improve it. It was this individual new learning that helped in
establishing a shared common understanding to facilitate collective decision-making and actions.
The most tangible effect at institutional level has been in the creation of a new watershed
management committee established to manage the water related issues among others. The

264
collective actions and institutional facilitation helped in the renovation of irrigation canals which
improved water conveyance efficiency from earlier 30% to 60%, check dams, water tanks, and
community forest plantations are some of the direct effects on the biophysical component of
Lingmuteychu SES.
The concurrent indirect effects of the process are changes in individual behaviours in
resource access and use. With higher level of understanding, individuals are also more open and
ready to discuss the issues in a consultative mode. With the implementation of collective actions,
indirectly the process also facilitated better community mobilization and social cohesion. The
indirect effects on biophysical aspects can be seen in the gradual stabilisation of degraded areas
due to irrigation water leakages from the canals and the extended period of water flow in the
Limti chu stream.
8.5.2. Impact domains
In view of the process orientation and close interactions, the ComMod process had a
significant influence on the knowledge, understanding and behaviour of the participating farmers
that built trust and confidence among the stakeholders to work collectively to resolve the
impending NRM issues. As such it is valuable to assess how far the approach impacts on the
immediate timeframe or what can be envisioned as a longer term impact. Broadly the impacts of
ComMod can be associated to four comprehensive domains: technical, individual (personal),
collective (social), and external agencies (outsiders) as shown in Figure 8.25.

265
Figure 8.26. Impact domains and impacts of the ComMod process in immediate and long term timeframes in Lingmuteychu.
Technical domain
The action research ComMod approach can use technical options related to problem
issues as a basis to better understand it and develop shared representations. The integration of
technologies and techniques proven successful elsewhere also provided confidence in its
application. In Lingmuteychu, immediate impacts in the technical domain were adoption of
technological options like new crop varieties (potato, short duration rice varieties) which spread
to downstream villages to adjust with the delay in water availability, check dams, and water
weirs. The understanding of bio-physical dynamics and adaptation to local circumstances, and
the improvement of researchers’ capacity were immediate impact which lubricated the process.
In the longer term, it is expected that these village communities equipped with greater awareness
of bio-physical dynamics and co-management skills will engage in a more sustainable
management of renewable resources and will adopt management norms that suit the changing
situations.
DO
MA
IN

266
Personal (individual) domain
Although only a limited sample of the population was involved in the gaming and simulation
exercises, the involvement of the remaining households of the study site through
conceptualization, debriefing workshops, interviews, and model presentation have empowered
individuals to better understand the roles of different stakeholders and their consequences on
resource management. Farmers acquired improved skill of problem diagnosis and representation,
better communication for equitable resource sharing and networking which was evident from
free exchange of views and seeking support to develop irrigation system. With better individual
capacities, it is expected that these persons will engage in purposeful monitoring of resource
state and take initiatives in their management.
Social domain
The tangible immediate impact on social domain is the shared understanding of the NRM
issue and vibrant communication and networking in sharing responsibilities to manage the issue.
The collective initiative to build a WMC is an exemplary impact of the process. The commitment
to work together and manage the highly contested water resource may in future promote
harmonious society built on the principle of shared objective and collective responsibility. Over
the five years after instituting WMC, the committee with support from research centre received
funding to implement collective actions such as community plantation, construction of water
harvesting tank, and farmers training. WMC has also been active in receiving visitors and
presenting the details on the watershed management issues and actions. The local level
functional institution of watershed management can be a successful model for replication in the
country.
External domain
In Lingmuteychu, external agencies like research and development agencies had a
decisive role in facilitating to resolve the issue. The research centre in Bajo took the lead in
facilitating the process both within the community and outside mainly to mobilize donor support.
The individual and social impacts that created a cohesive social network in relation to the
resource in question, fostered collective bargaining power to garner donor support. The internal

267
efforts also encouraged and attracted donors to support. It is expected that this model of
community-donor collaboration can be replicated in other situations.
8.6. Factors influencing the effects and impacts of the process
The effects and impacts of this ComMod process were influenced by several contextual
factors. To make clear differentiation between these factors they have been classified into
internal and external segregated by their positive and negative influences in the process (Figure
8.26).
Figure 8.27. Internal and external factors that enable or impede the ComMod process.
8.6.1. Enabling factors
The crucial enabling factors existed within the community, in the form of severity and
legitimacy of the impending issue had inflicted differences leading to weakening of social
fabrics. The looming worsening situation actually resulted in a willingness to cooperate by
redefining the needs of water resource (Uphoff, 1986, Castro and Nielsen, 2001). The presence
of few influential elders who are proactive and have genuine desires to resolve the long lasting
conflict too enabled the process. Synchronized with the internal enabling factors, some of the
critical external factors that facilitated the process are existing vibrant research-extension
Internal Factors
External F
actors

268
linkages which were the main channel of information flow and the initiation of collaborative
research activities which fueled the process. The confidence of the community on the institution
also helped in securing the process. The past involvement of research and development agencies
in both sites also helped in gaining access to the community. Through the research centre, it was
also easier to access support from potential donor agencies to implement collective actions.
8.6.2. Impeding factors
Alongside there were also factors that hindered the ComMod process. The presence of a
very strong traditional water sharing system upheld by upper most villages and few advantaged
households emerged time and again during the process. The case of destruction of weirs and
blocking the canals were frequently encountered by irrigators. While the process of collectivity
gradually glued people into a user network, few community members selfishly kept out of the
process instigating those who were undecided. Despite the agreement to engage in collective
actions, the destruction of structures by stray cattle set back the process. Two of the primary
internal factor that hindered the ComMod process were the inability of all the affected
households to participate in the process and the limited capacity of local leaders to follow up the
process. Beside the internal factors, the absence of a legal framework for water resource
management encouraged people to use the traditional norms to the advantage of few.
The ComMod process provided an opportunity to not only test the methodology but also
make a real impact on enhancement of water productivity and water security. The flexibility of
the process and versatility of its application in helping to comprehend the long lasting conflict
situation, opened a platform for reconciliation and development of commonly agreed solutions.
While the ABM could not be used directly in the field with the local actors, the gaming and
simulation sessions really proved to be a resourceful tool that suited in the cultural setting of
rural Bhutan to break the communication barrier and build trust to bring together the
communities. The computer aided RPG or RPG-based ABM were useful to let the community
understand the long term perspectives of the system to be collectively managed under different
scenarios. The next chapter presents the ComMod process in Kengkhar where the NRM issue
relates to dwindling drinking water resource in an upland situation.
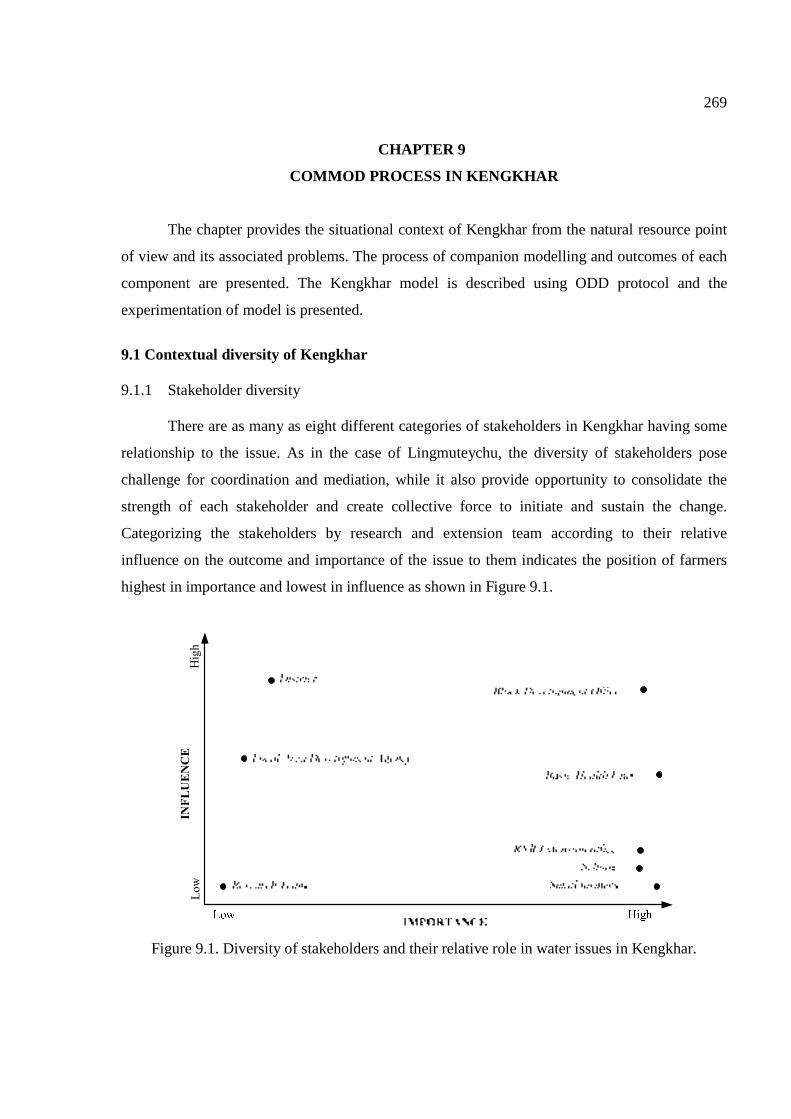
269
CHAPTER 9
COMMOD PROCESS IN KENGKHAR
The chapter provides the situational context of Kengkhar from the natural resource point
of view and its associated problems. The process of companion modelling and outcomes of each
component are presented. The Kengkhar model is described using ODD protocol and the
experimentation of model is presented.
9.1 Contextual diversity of Kengkhar
9.1.1 Stakeholder diversity
There are as many as eight different categories of stakeholders in Kengkhar having some
relationship to the issue. As in the case of Lingmuteychu, the diversity of stakeholders pose
challenge for coordination and mediation, while it also provide opportunity to consolidate the
strength of each stakeholder and create collective force to initiate and sustain the change.
Categorizing the stakeholders by research and extension team according to their relative
influence on the outcome and importance of the issue to them indicates the position of farmers
highest in importance and lowest in influence as shown in Figure 9.1.
Figure 9.1. Diversity of stakeholders and their relative role in water issues in Kengkhar.
INFLU
EN
CE
Low
High

270
In Kengkhar all affected households expect the problem of water scarcity to be resolved
but they are marginalized by their limited resource capacity and therefore have very little
influence on addressing the issue. One of the principal advantages in Kengkhar is the presence of
government establishment (School with boarding facility, Basic health unit, RNR extension
office, and Forest range office) in the area, who also uses water from the village spring ponds
and can exercise pressure to their line agencies for possible support. Among the village public
offices the basic health unit with the mandate on safe water and sanitation is in a better position
to influence improvement of the situation. The block development office located in the same area
has the highest importance and influence to address the issue as it holds administrative power
and financial resources for infrastructure development. As a public institution, although research
can have significant role in generating awareness about the issues through research outputs, it
has the limited direct influence on the issue.
9.1.2 Drinking water resource social-ecological systems
The SES from the perspectives of water resource in Kengkhar is represented in Figure
9.2. It provides a holistic representation of how water resource is integrated into the social,
economic, and bio-physical components of the system. Kengkhar with its remoteness and
situated on a ridge in a dry upland site poses a desperate situation as safe drinking water has been
a perpetual developmental issue (Figure 9.3). Fetching water from distant natural spring ponds
has become a daily household chore for women who generally manage household and livestock.
Despite the remote location, government intervention has been significant in terms of services
(health, school, administration, and technical-agriculture) available in the community. This
emphasis has been mainly as Kengkhar falls in the traditional trade route and served as one of
the camping sites for the traders and travelers. The efforts in improving water situation are vivid
from the remnants of structures in the community. As the ground water recharge system is
interrupted due to indiscriminate felling of trees in catchment areas and disturbance in the close
vicinity of the natural springs have resulted in drying up of spring ponds. The SES analysis
provides evidence about the failure of technology and the community’s inability to monitor and
manage water availability.

271
Figure 9.2. Representation of drinking water in social-ecological system of Kengkhar.
Figure 9.3. Settlement in steep slope in Kengkhar.

272
9.2 Analysis of drinking water problem in Kengkhar
In Kengkhar the scarcity of drinking water for six hamlets has been a major issue which
is escalating as perennial water bodies are drying and there is no reliable water source in the
close proximity as shown in Table 9.1.
Table 9.1. Site characterization and specificity of the water issue in Kengkhar. Topics Features Problem - Scarcity of water for all purpose (primarily for drinking)
Scale of the problem - 52 households in 6 hamlets
Age and evolution of the problem
- Ever since the population started to increase and natural forest declined roughly around 1950
Severity of the problem - Severe in all 6 hamlets, 4 months severe scarcity period
Researchers-stakeholders linkage
- In 2000, researchers went to introduce the roof water harvesting technology
Origin of demand and legitimacy.
- Highly legitimate as this issue was raised in the District development committee
Opportunities/incentives to act
- Access to safe drinking water and networking, ensure water security, hygiene and saves time for other activities.
The severity based on the proportion of stakeholders affected can be classified as severe
in Kengkhar with 100% of the households (52) being affected. It was apparent that the problem
existed and has intensified every passing year. When the past efforts to install drinking water
supply scheme failed, reverting to the old neglected resource base and system was difficult as the
Kengkhar natural spring ponds were in dilapidated condition. The involvement of research in
Kengkhar occurred much later, in 2000, when a research team visited the area to examine the
issue of acute drinking water shortage raised in the District development meetings, to study the
situation, and assess the potentials for introduction of rain water harvesting technologies. In
Kengkhar the incentive for research exists in testing and adapting research methodology for
possible replication in similar situations.
Based on problems against each entity of SES further clarifies the seriousness and
importance of the problem in Kengkhar (Table 9.2). For instance, water stress in Kengkhar is
severe as all past efforts to bring water from distant places have been unsuccessful. The past
actions are the best lessons for Kengkhar. For instance, when UNICEF supported rural drinking
water scheme which failed in 1987 people went back to the natural spring ponds. Again in 2005

273
when the 17 km long Largap water supply was implemented, the community ignored the spring
ponds only to come back to them as the Larjap scheme could never be fully operational. With no
water sources in proximity, the pragmatic approach is to invest in managing the natural spring
ponds in the community. In Kengkhar although not directly linked to water, their principle
livelihood source “wood craft” has probably played its toll. With the very noble intention of
maintaining age old tradition of wood craft, people have tried making products from all available
timber species. This has possibly led to loss of prime forest on the upper reach which
ecologically served the purpose of trapping rainwater. Currently with only scrub forest with
hardly any undergrowth rainfall rather poses a threat of landslides.
Table 9.2. Components of the social-ecological systems in Kengkhar.
Entities Features Resources - Water for domestic use (Drying up springs and scarcity) Resource users - Farmers and public institutions ( free flowing, open access
resource) Public infrastructure providers
- Government agencies-Works and human settlements (No dependable water source in close proximity, high cost of maintenance)
Public infrastructure - 17 km HDPE pipe, 2 water reservoirs for school (unreliable supply, exclusivity)
External environment - Governance, Climate (unclear development priority, changes in rainfall intensity and patterns)
9.3 Companion modelling process
The ComMod process in Kengkhar was little different from Lingmuteychu in respect to
the sequence of intervention particularly the development of infrastructure (Figure 9.2).
Following the diagnostic study conducted in early 2007 it was realized that the issue of drinking
water shortage was very severe in a broadly cohesive community. The research team in
consultation with the community started the process with the construction of seven concrete
tanks of varying capacities to collect water from the spring ponds in early 2008. Following their
construction, a participatory for gaming and simulations workshop was organized in April 2008.
The objectives of introduction of ComMod process was bring together the resource users to
explore and understand the water resource dynamics and introduce mechanism to better manage
the water sharing network.

274
Figure 9.4. Chronology and phases of the ComMod process in Kengkhar.
9.3.1 Model conception
The conception of the model was done initially by the research and extension team using a layout
plan of the water collection tanks and their network. During the discussion simple rules like
quantity each individual can collect and the uses of water were established. The features of the
Kengkhar model used in the construction of the corresponding RPG are given in Table 9.3.
Table 9.3. Features of the role-playing game used in Kengkhar.
Features Details
Players Household members (mainly women)
Roles Access pond, draw water, allocate use, share
Rules of the game Declare rainfall, allocate water to ponds, player access pond, allocate to uses, share, 3 modes of communication
Game sets Pond, water units, house with 4 cups-uses,
Turns (Round of play) 1 day
Gaming session 3 days
The sharing rules and decision-making process were left open so that interactions among
players would be vibrant and free, allowing them to create new rules as the game proceeded. The
time step for each turn used in Kengkhar was 1 day as every water collection relates to a day’s
water requirement. The gaming and simulation session was scheduled for three days.
The Kengkhar RPG was pretested with farm attendants and research assistants in the
Research center at Wengkhar, near Mongar. It was very difficult to explain to the players about
2005
Research
requested for study
Drying spring pond,
severe problem,
potential for
improvement
Drinking water scarcity
in Kengkhar raised as
critical issue in the
District development
committee
2007
Diagnostic
study
2008
Construction 5 tanks to
collect spring water and
their network
Gaming and simulation
sessions in the village
Awareness and
adoption of water
sharing and tank
network coordination
2009
Participants requested
to include roof water
harvesting in the model
Revised cRPG with
individual tanks for roof
water harvesting
Organized the
workshop to present
the revised model –
farmer lead
All 52 household came
to the workshop,
including officials
working in the area.
Monk took the responsibility to
coordinate and monitor the
tank network with help from
village focal person
2010
Distribution of 5
individual tanks
Monitoring
Pre ComMod ComMod Process Potential for ComMod Physical infrastructure

275
this RPG components and its various steps as none of the test players were familiar with the
spring ponds and water collection based on different needs. The steps were kept simple and
straight forward and the spreadsheet used to record data and calculate the results of a session was
calibrated. Based on the pre-testing, a mock session was planned to explain the characteristics
and use of the RPG to the actual players. A simple computer ABM based on this RPG was
developed using household and hamlet as social entity; farm, tank, and pipe as spatial ones; and
Rainfall, water source, jerrican (water), family size, water uses (domestic, animal, vegetable,
rimdo71) as passive entities.
9.3.2 The twelve steps of the ComMod process
The process in Kengkhar adopted a slightly different sequence (Table 9.4) when
compared to the process in Lingmuteychu (Section 8.3.2). While the core steps (4 to 9 in Figure
9.5) of modelling and simulations follow a similar sequence, sensitization, which is the key step
in mobilizing the community, happened only after data gathering and finalization of the key
question. In a way this gave opportunity for researchers to assess the appropriateness of the
approach prior to sensitizing the community about its relevance and usefulness.
Table 9.4. Sequence of twelve steps of the ComMod process in Kengkhar.
Sequence Steps 1 Key question (1) 2 Data gathering (1) 3 Sensitizing (1) 4 Eliciting knowledge (1) 5 Conceptual model (1) 6 Implementation (3) 7 Verification and validation (3) 8 Scenario (1) 9 Monitoring and evaluation (os) 10 Training (3) 11 Simulation (2) 12 Dissemination (2 – all)
Note: Figures in parenthesis indicate the number of times a step was implemented, os = on site, all = all households using the resource.
71 Rimdo is an annual ritual conducted by all household, where most family members gather and celebrate the annual festival.

276
The twelve steps chronogram shown in Figure 9.4 also depicts the length of the relatively
shorter and rapid process, as the issue was related to water scarcity that encompassed all the
households in a harmonious community. Following the field data collection and identification of
the key issue, the research team in collaboration with beneficiaries first constructed seven tanks
to collect water from three spring ponds. Following which sensitizing for ComMod approach
was done. A simple RPG imitating the tank network and rainfall pattern, helped in developing
ways to manage this new tank network.

277
Legend: a: TRG; b: discussion with site c: preliminary diagnosis; d: role playing game; e: new staff; f: onsite monitoring: local facilitator stationed in the research site; g: all water users; h: training in BKK; k: first agent-based model (replaying the game): TRG+MAS modeller; o: second agent-based model (network of water tanks): TRG+MAS modeller.
Figure 9.5. Chronogram of the ComMod process implemented at Kengkhar to create water collection and distribution systems.
1 2 3 4 5 6 7 8 9 10 11 12 1 2 3 4 5 6 7 8 9 10 11 12 1 2 3 4 5 6 7 8 9 10 11 12 1 2 3 4 5 6 7 8 9 10 11 12
1 Sensitizing b
2 Key question a
3 Data gathering c
4 Eliciting knowledge
5 Conceptual model
6 Implementation d k k o
7 Verification & Validation d k k o
8 Scenarios d
9 Simulations
10 Dissemination g g
11 Monitoring & Evaluation f
12 Training e h h
2007 2008 2009 2009Kengkhar

278
9.3.3 Description of the Omchu RPG and conceptual Model
Overview
Purpose
In April 2008 a RPG-based gaming and simulation field workshop was organized in the
village. After the gaming sessions, the Omchu72 model was designed to capture the Omchu RPG
for replay and to explore different scenarios for better understanding and communicating water
collection and sharing issues in the community. The use of the simple autonomous computer
ABM was developed to generate, simulate and assess scenarios with multiple tanks.
State variables and scale
The model comprises three types of entities i.e. spatial, social and passive ones. They are
represented with their attributes and interactions in Figure 9.5. The social entity is composed of
three hamlets designated by a number as hamlet 1, 2 and 3. Each hamlet has households ranging
from five for two hamlets and eight in one hamlet. For each hamlet there is one water tank to
collect water from natural spring ponds which is shared among the households. The tank have
capacity ranging from 2,308 to 1,375 litres (Table 9.5).
Table 9.5. Variables of the Omchu model used in Kengkhar.
Entity Parameter Default value Unit Spatial Tank capacity 1375 to 2308 Litres Social Household Family size 2-5 Number Livestock size 1-3 Number Vegetable size 0,2 Plot
Water use Domestic, livestock, vegetable, rimdo Type of uses
Hamlet household 5-8 Number Passive Climate State of rainfall Dry, wet, and very wet State Water Source types Rainfall, tank Source Output of water from Roof Collector 150, 350, 550 Litres Output of water from small Spring 325, 950, 1250 Litres Output of water from large Spring 500, 1500, 2000 Litres
72 Omchu means water from natural spring pond.

279
Figure 9.6. UML class diagram showing the attributes and methods associated to each entity of
the Omchu model used in Kengkhar.
The water in tank depends on the rainfall pattern which has three states (dry, wet, and
very wet). The social hierarchy is represented by three clusters of households as hamlets linked
by a network for accessing water within their respective hamlet (Figures 9.7). The members of
each hamlet can also collect water from tanks of other hamlets when their assigned tank dries up.
Households prioritize their water use among four usages as domestic use (drinking, cooking and
washing), livestock use, growing vegetable and rimdo.

280
Figure 9.7. Network of households and hamlets in accessing water in Kengkhar village.
Process overview and scheduling
The model runs on a daily basis. Figure 9.8 provides a snap shot of a day in a year
corresponding to a given rainfall pattern as a sequence diagram. The process in a day starts with
randomly allocating one household within a hamlet that should perform rimdo. Then households
to grow vegetables are decided on a random basis (Figure 9.9). It is followed by agents collecting
water units based on their requirements. The collection of water is based on the availability of
water in the nearest tank (Figure 9.10). Six rounds representing as many years were repeated
anticipating that three rainfall patterns occurred at least twice to see their effects on water
availability and use.
Once the agents collect water from tanks, they decide to allocate it based on the following
sequence: if it has to perform rimdo, this cultural event receives the first priority. However when
agents are not assigned with rimdo, first priority is given to domestic use followed by livestock
and growing vegetables (Figure 9.11).

281
Figure 9.8. Sequence diagram of Omchu ABM.

282
Figure 9.9. Decision to allocate water to plant vegetables.
Figure 9.10. Process to collect water.
Figure 9.11: Decision to use water.

283
The model runs within four communication scenarios, first as case-as-usual where
farmers operate on an independent mode and goes to any tank which has water. In the
independent mode tanks assigned at the hamlet level also function independent of each other. In
the second mode, players are allowed to discuss at the hamlet level to share water available at
each round and even their movements to other tanks are discussed. In the third scenario, farmers
still communicate at the hamlet level but the three tanks are networked to allow flow of water
from a tank with excess water to the tank with a lower water volume. Finally, in the final
scenario, all three hamlets were put as one large group where players discuss to share water at
the community level (Table 9.6).
Table 9.6. Mode of communication in the scenarios used in the Kengkhar Omchu model.
Modes Rounds Communication modes 1 Individually-free to access any ponds 6 Without any interaction, complete
freedom for accessing any tank 2 Collectively at the hamlet level 6 Free interaction within hamlet 3 Collectively at hamlet level with tank network 6 Interaction among all hamlets and
collective decision 4 Collectively at village level and tank network 6 Inter-hamlets
Design concepts
The model is designed to represent the behaviour of farmers who behave in an
individualistic manner to select tank and collect water. As some players become successful to
fulfil their water demand, there is a tendency for other farmers within a hamlet to copy the
behaviour of the most successful farmer. This can lead to the emergence of a common interest
group and collective strategies to take benefit of the resource. Further there is also the possibility
for other hamlets to see and imitate the group satisfying their water requirements. All the
farmers have to remember their hamlet group to remain within the cluster. Most importantly each
one memorizes the family size and livestock size based on which they collect water and allocate
it. In every time step there is a random assignment of growing vegetables and organizing a
rimdo. At the whole system level, prioritization of water use has been set as domestic, livestock
and vegetable with rimdo taking the first in case of farmer who has been randomly picked to
perform it.

284
The principal interaction in the model is how players, either individually or as a group,
react to water availability. There is a clear interacting effect of rainfall to water collected in tanks
and subsequently its use depending on the four above-mentioned communication modes. The
model is probabilistic as it deals with the behaviour of players corresponding to randomly set
rainfall patterns. Further as players visit the nearest tank with sufficient water, it is highly
dependent on how the other players behave to access different tanks. Therefore with parameters
set at random, the model can be considered as stochastic. For the purpose of model testing,
several simulations were run to observe the behaviour of some players if they followed some
kind of pattern. The ABM simulation tool was also presented to the people who participated in
the gaming sessions and farmers were quick to observe and indicate the rationale of the way they
behaved in the gaming sessions which was captured by the ABM simulation.
Details
Initialization
Each farmer is assigned with a number from 1 to 18 and the participants are grouped into
three clusters as hamlets as indicated in Table 9.8. All farmers are randomly assigned with a
family size (2 to 5) and a livestock size (1 to 3). These initial features of the eighteen farmers
were kept constant for all time steps and rounds to allow them to explore the varying resource
level.
Table 9.7: Details of farmers and their location in three hamlets of the Kengkhar model.
Hamlet No. 1 2 3
Farmer No. 1 2 3 4 5 6 7 8 9 10 11 12 13 14 15 16 17 18
Family size 4 3 2 4 3 2 3 3 3 5 4 5 2 4 5 5 4 5
Livestock size 2 3 1 1 1 1 3 2 3 2 1 1 1 2 1 1 1 3
Every time step is initiated with randomly picking a rainfall pattern represented by
pictograms as moderately dry, wet and severe wet (Figure 9.12). Within each hamlet one tank is
located that received a predefined volume of water based on the rainfall pattern (Table 9.8).

285
Farmers collect water from the tank on the basis of water units (1 unit represents 1 Jerrican = 25
Litres). Following the discussion with the players, two additional types of tanks were introduced
in the model. A collective tank with capacity of 5000 litres was added which could be used as a
common tank for all the hamlets. The second type was individual tank located next to the house
for harvesting rainwater from the roof.
Figure 9.12: Cards representing three rainfall patterns (Low, Medium and High rainfall) in the Omchu model used in Kengkhar.
Table 9.8. Rainfall pattern and corresponding amount of water (Litres) collected in different tanks in the Omchu model used in Kengkhar.
Rainfall Tank at hamlet level
Collective tank Private tank 1 2 3
Very wet 1250 2000 1250 5000 550
Wet 950 1500 950 3800 350
Moderately dry 325 500 325 1300 150
Note: 1 water unit=25 Litres.
Input
Based on the interviews with stakeholders, the measurement of rainfall using a simple
rain gauge over half a year, and of the water discharges measured from five spring ponds
(Risingma, Bartshangri, Rotpari, Wangkhochi, and Daiphodrang springs) using the “volumetric
measurement73” method it was roughly generalized that the three of dry, wet and very wet
73 Use a container of known volume, record time to fill the container, repeat the process three times. This method is applied to small springs (1 gallon per minute).

286
rainfall patterns yielded discharges of 0.01, 0.02 and 0.03 litre/second respectively. Based on the
collection time of twelve hours (overnight) when water use is minimal and within three rainfall
patterns, water collection in the three tanks was estimated as given in Table 9.8. In the model one
of the most important inputs is the rainfall pattern which has much influence. The 2006 survey
also revealed that on average, a local household used 688 litres of water on a daily basis for
domestic use, livestock, and vegetable irrigation. In terms of its internal allocation, 47% of the
water was used for domestic purposes (cooking and washing) followed by 29% going to
livestock and 25% for garden irrigation. It was also implied that when any household has to
perform a religious ceremony, all give priority to this particular use.
Spatial configuration and interface
The spatial settings of the Omchu model are represented by a grid with a 150 rows x 150
columns tessellation indicating the landscape on which households, hamlets, and water tanks are
located. There are 18 squares corresponding to 18 farmers with 4 quadrates representing as
many types of uses of water. There are three rectangular boxes representing water tanks
positioned within the three hamlets. After each farmer collects water units as small cubes (1 cube
= 1 jerrican = 25 litres of water) they place cubes on the quadrate. Water units from the three
tanks are identified by colours (blue cubes from tank 1, pink from tank 2 and green from tank 3).
These colours help to indicate movement of water from all tanks to different households (Figure
9.13).

Figure 9.13. C
Tank
Household
Player Name
Family Size
Livestock Size
CORMAS interface of the Omchu model used in Kengkhar.
Household
Simulator
Religious
Vegetable
287
Rainfall State

288
9.4 Analysis of gaming and simulation sessions
9.4.1 Shared representation of the context and participants understanding
As stipulated by the ComMod posture, the integration of the points of view of all
stakeholders, including those of the researcher and the modeller, to construct the model enhances
the relevance and use of model in Kengkhar. The co-construction of representation of such
artificial world helps in creating a shared representation which forms a basis for simulating
scenarios for dialogue, shared learning, and collective decision-making. In Kengkhar, three
broad categories of stakeholders were identified and their representations are simply described in
Table 9.9.
Table 9.9. Simplified representations of mental map or perceptions of the situation by different stakeholders in Kengkhar.
Site (and resource)
Stakeholders Representation Method to capture the initial representation
Kengkhar (water for domestic use)
Household
Participatory resource mapping & envisioning
Infrastructure providers
Consultation and development plans
Researchers
Field monitoring, discussion and literature reviews
The model conceptualization through a consultative process was the first effort to create a
preliminary representation which was further improved with more clarity in expressing these
mental frames. The schematic representation in Figure 9.14 provides a tentative process of how
initial individual points of view evolve into a shared representation which can facilitate the
emergence of new understandings and potentially change in the individuals’ points of view,
behaviour, decision-making and practices.

289
Figure 9.14. Co-design of a shared representation in the companion modelling process on water collection in Kengkhar.
Similarly the support service agency sees structural intervention like network laying
pipes and installation of taps in Kengkhar as an ultimate solution. The third agent, the researcher
who had very limited understanding of the situation, therefore used preliminary field
observations and literature reviews to constitute a more theoretical perception.
9.4.2 Identification of scenarios from the gaming sessions
The RPG used rainfall patterns as the random factor which determined the resource
volume. The interactions between the four above-mentioned protocols for communication among
the players and three rainfall patterns produce twelve scenarios displayed in Table 9.10.
Shared representations
leads to…...
Social EnvironmentalResource
Common ground
for stakeholders
Individual
representations
leads to…….
New understanding
of individual
representations
Social
Environmental
Resource

290
Table 9.10. Scenarios from the Kengkhar role-playing game. Protocol (P) Rainfall pattern (P)
Very wet Wet Moderate dry Individual free access, no sharing and no water accumulation
S1=P1R1 S2=P1R2 S3=P1R3
Communicate within group, share water within sub-group, and no water accumulation
S4=P2R1 S5=P2R2 S6=P2R3
Communicate within group, share water within sub-group, and water accumulation
S7=P3R1 S8=P3R2 S9=P3R3
Collective, share water and water accumulation S10=P4R1 S11=P4R2 S12=P4R3 9.4.3 Analysis of Scenarios
9.4.3.1 Resource stress
The water balance74 in Kengkhar gaming sessions were influenced by the rainfall pattern
and communication protocol. The collective networking mode with free sharing and collection of
water in a high rainfall situation (S10) gave the highest water balance. Water accumulation and
networking helped in sustaining the water which is evident from comparing S3 and S6 having no
water balance against S9 and S12 which have positive water balances. Communication and social
networking also helped in more efficient water use thereby resulting balance of water as
indicated by S4 (Figure 9.15).
Figure 9.15. Water balance in Kengkhar RPG.
74 Water balance here implies the water remaining in the tank after all players have taken their share in a given time step.
0
20
40
60
80
100
120
140
S1 S2 S3 S4 S5 S6 S7 S8 S9 S10 S11 S12
Un
its o
f w
ater
Scenario

291
9.4.3.2 Equity in resource allocation
The issue of accessibility to looming drinking water source influence social network in
Kengkhar. In an attempt to make credible comparison among scenarios, Gini Coefficient is used
to assess the way each scenario influences water allocation. The inequality analysis was done on
the quantity of water collected from the tank by individual players, indicating the resource
distribution pattern. Compared to Lingmuteychu case, there was more variation in the coefficient
and no instance of perfect equality. Scenario (S6) with free interaction within hamlet and low
rainfall caused the highest inequality (Figure 9.16). The analysis also reveals that the
accumulation of water does not promote an equitable distribution, but it is the interaction
(networking) and sharing which ensured equitable access to water. There is also a definite
influence of low rainfall pattern leading to lower discharges that create disparity among the
players, as early visitors take more within the traditional norms of “first-come-first-served”.
Figure 9.16. Inequality in water shares across 12 scenarios in Kengkhar.
9.4.3.3 Resource sharing
Vibrant exchanges and interactions among players were observed in the gaming
sessions. As such, and as in the previous case (chapter 8), the sharing of water unit can be a
useful and rather a comprehensible indicator to compare different scenarios. During the gaming
0.157
0.227
0.307
0.1540.142
0.499
0.2320.227
0.286
0.136
0.23 0.237
0
0.1
0.2
0.3
0.4
0.5
S1 S2 S3 S4 S5 S6 S7 S8 S9 S10 S11 S12
Gin
i Coe
ffic
ient
Scenario

292
sessions exchanges were best observed in the way players visited different tanks during each
turn. Although there were few instances of water sharing between players, people fundamentally
in real life situation suffice their water requirements by accessing water from any tanks that has
water. Therefore, to assess the efficiency of scenarios in promoting networking, a comparison of
average number of tanks visited during each gaming session of six rounds by the players across
the twelve scenarios was made and the results are presented in Figure 9.17. The traditional
system of free access (S1, S2, and S3) irrespective of rainfall pattern prompted higher frequency
of accessing others tanks.
Figure 9.17. Number of time players access different water tanks in different scenarios in
Kengkhar.
As sharing of water was introduced in the protocol of traditional system, the number of
visits to other tanks significantly decreased (Scenarios S4 to S6). Further the instances of
accessing other tanks became lesser as accumulation of water was included in the protocol. This
clearly showed the benefits of networking and water collection for natural springs.
9.4.3.4 Satisfaction of water needs
Fulfilment of water needs both individually and collectively is yet another factor players
considered as a tangible effect of any strategy. Based on the output of the gaming sessions, a
0
5
10
15
20
25
S1 S2 S3 S4 S5 S6 S7 S8 S9 S10 S11 S12
Num
ber o
f vi
sit
to th
e ta
nk
Scenario
Own Tank
Others' Tank
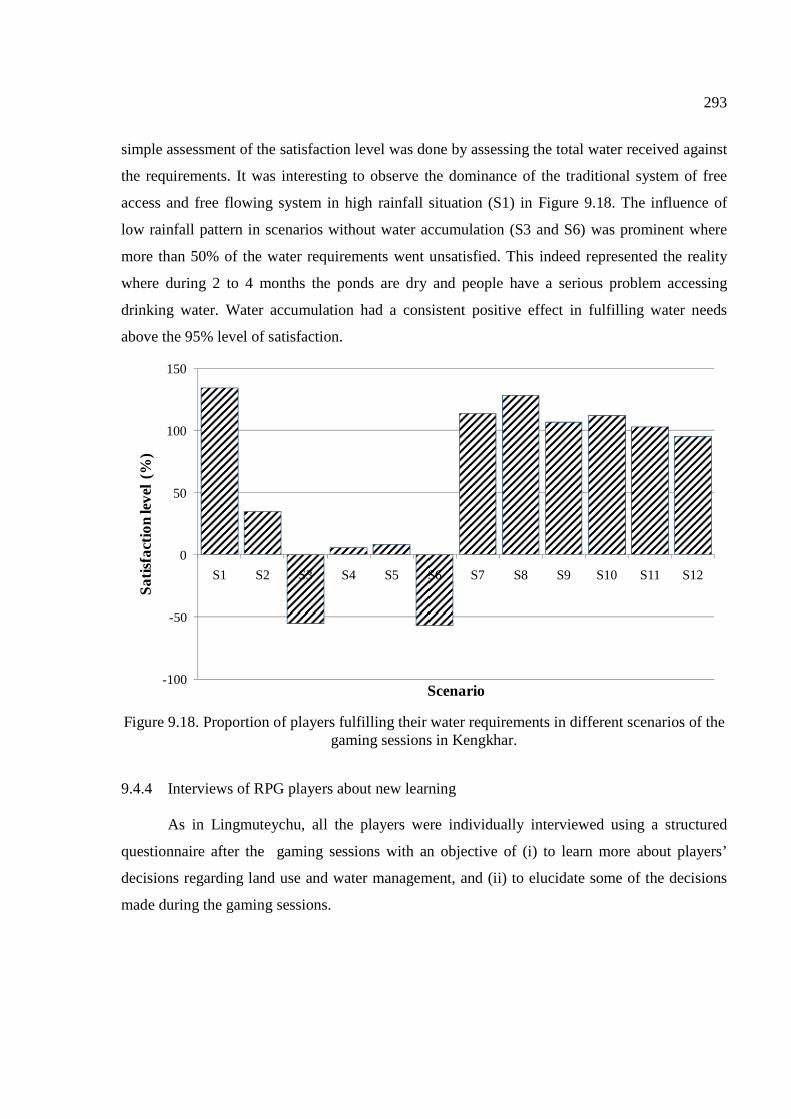
293
simple assessment of the satisfaction level was done by assessing the total water received against
the requirements. It was interesting to observe the dominance of the traditional system of free
access and free flowing system in high rainfall situation (S1) in Figure 9.18. The influence of
low rainfall pattern in scenarios without water accumulation (S3 and S6) was prominent where
more than 50% of the water requirements went unsatisfied. This indeed represented the reality
where during 2 to 4 months the ponds are dry and people have a serious problem accessing
drinking water. Water accumulation had a consistent positive effect in fulfilling water needs
above the 95% level of satisfaction.
Figure 9.18. Proportion of players fulfilling their water requirements in different scenarios of the
gaming sessions in Kengkhar.
9.4.4 Interviews of RPG players about new learning
As in Lingmuteychu, all the players were individually interviewed using a structured
questionnaire after the gaming sessions with an objective of (i) to learn more about players’
decisions regarding land use and water management, and (ii) to elucidate some of the decisions
made during the gaming sessions.
-100
-50
0
50
100
150
S1 S2 S3 S4 S5 S6 S7 S8 S9 S10 S11 S12
Sat
isfa
ctio
n le
vel
(%)
Scenario

294
53% of the players considered water sharing by collecting and storing as a new learning
as shown in Figure 9.19. Further they realized that to sustain the water resource, there is a need
for proper prioritization of water use and conservation through community participation. As in
reality, 56% of the players chose the tank to collect water depending on the quantity of water in
it, while the remaining considered nearness to the tank as a means to decide accessing a tank. All
households considered drinking as the first priority in water use, followed by livestock, rimdo
and vegetable cultivation. A majority of the players faced a shortage of water in the gaming
sessions but managed by borrowing from other players, which they considered as a possibility by
seeking stored water in respective tanks. During the discussion in the gaming sessions and
interviews it was time and again mentioned that sharing in reality does not happen at the
individual level but that it is possible for people to visit other ponds. Players also referred to the
network of tanks where water is transferred from one tank to the other as a possible strategy.
Figure 9.19. New learning by players (proportion of respondent) from the gaming sessions held
in Kengkhar (n=18).
9.4.5 Collective actions
The participatory workshop and the RPG sessions brought together not only players but
also several observers who saw the process converging to a point consistent to the issue of
farmers. Players felt the need and potentials for implementing few tangible collective actions.
0
20
40
60
Prioritizing water use
Community cooperation
Water sharing Water conservation
Per
cen
tag
e o
f res
po
nd
ents
New learnings

295
Indeed players were encouraged by the new understanding they gained from the process and
choose to hold on the opportunity of developing collective approach to the issue. The last day of
the participatory workshop was used to draw up a collective action plan.
In contrast, participants in Kengkhar had several activities proposed as collective actions.
It was more of an overwhelming situation with the opportunity to envision collectively.
However, the joint discussion helped them to focus the plan and remain within the core issue of
accessing drinking water (Table 9.11). The main advantage for Kengkhar was the completion of
the important new infrastructure made of water collection tanks and linked as a network which
was implemented as a collective action prior to the gaming session. Therefore most of collective
actions suggested below are to maintain or sustain the structure and their network. In addition to
the tanks and its network, another significant collective decision was to propose a new water
source in Dochuri (Activity 6). It was encouraging to see that it has been put up to the district
administration and is currently being implemented (Monitoring visit in September 2010). To
ensure that all these activities are implemented as planned, the group also put in place a six
member working group led by a monk.

296
Table 9.11. Collective actions decided at the end of the ComMod process in Kengkhar. SL. No
What Where Why When Who Implementer Collaborator
1 Identification of catchments and looking for its critical status for management
Resingma, Wangkhochi, Bartshangri
For good water quality and quantity
May 2009 The beneficiaries of the watershed
Research, EA, Gewog
2 Maintaining sanitation of the water tanks and catchment area
Resingma, Wangkhochi, Bartshangri
Save water for drinking
Every after 3 months starting from May
Beneficiaries of the respective water source
3 Changing the network pipe
Resingma to Kripo
Water leakage on the way
May-June Benefiacires of the Kripo tank
Research
4 Sourcing fund Geog yargey tshodey (GYT) (Block development committee)
The group is in the initial stage to support them self
May-June The beneficiaries of the watershed will seek help from GYT
Research
5 Target to store water for all times in the water tanks
All the water tanks
To supply water for 24 hours for all communities
May-June Chairperson of the group
EA, Research
6 Water tapping from Dochuri
For the communities of Dokthang, Pangthang, Ebee
Insufficient water from the existing spring ponds
2009-2010
All beneficiaries of the community
GYT
7 Catchment fencing by barbed wire
Bartshangri catchment
Protection from animals
May-June Benefiacires of Ebee
Group chairman
8 Provision of cattle water drinking
Wangkhochi No provision of tough for cattle feeding in the existing system
May-june Benefiacires of Wangkhochi
Group chairman
9 Water harvesting from the roof
Putsturmi, Dungmanma, Dokthang, Zhorthung
Insufficient water supply and far away catchments
May-June Beneficiaries of the respective community
Group, chairman
9.4.6 Identification of scenarios for more simulations with the agent-based model
As described in earlier sections, the RPG sessions were efficient to support exploration of
simple scenarios within a short time frame. Although the results show definite trends and helped
in generating a shared representation of the resource situation, it was not possible to introduce
new parameters and to test new combinations with other parameters for longer periods. As
highlighted earlier, the unpredictable characteristics of SES over a longer time frame cannot be

297
modelled into a RPG. To complement gaming information, if all known factors and their
parameters can be integrated, the computer ABM tool has the ability to generate rapidly
simulated scenarios over several time-steps. Like in the case of Lingmuteychu, the Omchu ABM
was used for such a purpose in Kengkhar site.
The Omchu RPG-based Kengkhar ABM was presented to the participants in the gaming
sessions and they could easily understand and explain the movement of the agents. Compared to
the RPG the ABM produced a clear visualization of water accumulation in the tanks which was
convincing to farmers. As only six time steps each for four scenarios could be played during
Kengkhar field workshop, this limited the analysis from long-term perspectives. Therefore using
the RPG-based ABM with twenty time steps and ten repetitions of three possible combinations
of parameters to generate multiple scenarios was a very complementary investigation.
9.4.6.1 Traditional regime
Farmers in Kengkhar have been following an open access water resource system, but
without any resource management responsibilities. This has resulted into a mindset to use the
water resource until the spring pond dries with no one really taking any initiatives to protect or
restore. In the RPG, the traditional regime fostered highest satisfaction and equality in resource
allocation. Therefore, the traditional scenario represented random rainfall, free flowing spring
pond and accessing of ponds in order of “first visit own village pond, if there is no water move to
the next nearest pond” (Table 9.12).
Table 9.12. Scenarios of the traditional regime for the Kengkhar agent-based model.
Rainfall Water accumulation Mine first then others Random No S1
9.4.6.1.1 Tank networking
One of the principal interventions in Kengkhar was the construction of water collection
tanks and establishing a network by connecting some of them with HDPE pipe to transfer water.
As per the design, two tanks (Risingma and Wangkhochi) with higher water discharge rates and
located at a higher location have been designed to let flow the excess water (excess to a day’s

298
requirement of the primary users) to the immediate lower tank. As the requirement of primary
user may change over time, the overflow after a certain volume collected does not appear
suitable. A concept of sharing using the collective decision-making process could be a strategy
for the future. Therefore a two step method of making decision was formulated as follows:
- Households agree to share: An agent agrees to share if it attained 60% satisfaction in last
two consecutive time steps. This condition of sharing is included as farmers considered as
drinking, washing and cooking which is the most important water need requires only
around 60% of their water requirement
- Hamlet agrees to release water: If two-third of its households agree to share, the hamlet
will release water to the next tank.
Using the five levels (0, 0.25, 0.5, 0.75, and 1.0) of household satisfaction and the
proportion of households agreeing to share water in a situation when water is accumulated in the
tank, 25 scenarios have been identified for experimentation as shown in table 9.13. These
scenarios were relevant when water was accumulated in a tank as such non-accumulation
situation is not included here.
Table 9.13. Scenarios for tank networking to be simulated with the Omchu model used in Kengkhar.
Water accumulation Hamlet agrees to share
(proportion)
Households agree to share (proportion)
0 0.25 0.5 0.75 1
Yes
0 S1 S2 S3 S4 S5 0.25 S6 S7 S8 S9 S10 0.5 S11 S12 S13 S14 S15 0.75 S16 S17 S18 S19 S20
1 S21 S22 S23 S24 S25

299
9.4.7 Analysis of scenarios with the Omchu agent-based model from Kengkhar
9.4.7.1 Traditional water sharing
The simulation results of the Kengkhar ABM representing the traditional situation
depicted the uses of water as in real circumstances with domestic use dominating water use with
48%, followed by use in vegetable cultivation (24%), livestock use took 21%, and annual
household rites consumed only 6% of water. There was consistency in the proportion of water
used for domestic purpose depending on family size (Figure 9.20).
Figure 9.20. Average water uses by 12 agents over 20 simulations.
Irrespective of the rainfall pattern and water volume received by each hamlet, all farmers
face shortage of water (Figure 9.21). The satisfaction level of eighteen players across twenty
time steps varied from 75% (farmers 8, 9 and 10) to 90% (farmers 3, 5 and 15). This may be due
the random allocation of rimdo.
0%
25%
50%
75%
100%
1 2 3 4 5 6 7 8 9 10 11 12 13 14 15 16 17 18
Pro
po
rtio
n o
f use
s
Agents
Domestic Livestock Vegetable Rimdo

300
Figure 9.21. Average satisfaction level of 18 farmers in 10 simulations.
Although there is a sort supply of water and relatively low satisfaction level, the model
presents a fair equality in the distribution of water over ten repeated simulations with an average
Gini coefficient ranging between 0.09 and 0.13. There is also the creation of an overall water
balance of about 200 to 600 units (Figure 9.22). Among the ten repeated simulations there was
correspondingly a high proportion of satisfaction among the agents.
0
0.25
0.5
0.75
1
0
3
6
9
12
1 2 3 4 5 6 7 8 9 10 11 12 13 14 15 16 17 18
Sat
isfa
ctio
n (
%)
Wat
er u
nits
(N
o.)
Farmers
Need Consumption Satisfaction level

301
Figure 9.22. Water balance, equality in water distribution and satisfaction in Kengkhar ABM.
9.4.7.2 Tank networking
In the tank networking scenario, the 25 scenarios (five individual sharing rules by five
hamlet sharing rules) provided an opportunity to generate substantial water balances. In each
scenario, collectively around 126 to 152 units of water were received in the three tanks. On an
average about 6.5 units were used per household achieving a satisfaction level higher than 75%
(Figure 9.23). Across the 25 scenario, there was a water balance ranging from 17 to 30 units
which served as a principal advantage of the tank networking.
0.109 0.098 0.114 0.117 0.111 0.099 0.129 0.12 0.095 0.096
0
120
240
360
480
600
0.0
0.2
0.4
0.6
0.8
1.0
1 2 3 4 5 6 7 8 9 10
Wat
er b
alan
ce (
Un
its)
Gin
i co
effic
ien
t
Simulation
Gini coefficient Water balance

302
Figure 9.23. Water consumption and balance.
The balance indicated in the each scenario was contradicting the average situation each
player was facing. As per Figure 9.24, all the eighteen farmers were consuming lower amounts
of water than what they actually need. The gap between the need and consumption was fairly
uniform across the eighteen players. Further the Gini-coefficient of 0.09 for water consumption
indicated an equitable distribution. This indicated a collective saving of water, and actually
corresponds to the real situation where people fetch from different tanks without hampering the
requirement of all.
0
50
100
150
200
1 2 3 4 5 6 7 8 9 10 111213141516171819202122232425
Wat
er u
nits
Scenarios
Total water in all tanks Balance

303
Figure 9.24. Average water need and consumption of 18 farmers.
Analysing from the total number of times each farmer do not get any water across 25
scenarios, it can be seen from the Figure 9.25 that all faced short supply of water ranging from
10% to 29% of the instances. In general scenarios (S11, S13, and S16) corresponding to 50% and
75% households agreeing to share at 0 to 50% fulfilment of individual needs tend to have
increasing water scarcity, while scenarios S2, S3, S4, and S5 that corresponds to no household
agreeing to share water result in high proportions of water scarce situations. However, they do
not have definitive trends. When more than 75% hamlets agree to share water irrespective of
individual’s agreement, scenarios S17 to S21 presents a mixed situations of water scarcity. The
results do not show any definitive trend in water scarcity due to sharing.
0
2
4
6
8
10
12
1 2 3 4 5 6 7 8 9 10 11 12 13 14 15 16 17 18
Wat
er u
nits
(N
os.
)
Agent (Farmers)
Consumption Need

304
Figure 9.25. Instance when agents did not have any water at all.
Based on the water scarcity, farmers strategize differently to cope with the situation. In
Kengkhar, it is based on the water use priority. As indicated in Figure 9.26 the first water use
they sacrifice is the irrigation of vegetables followed by feeding livestock, and finally the
domestic use, implying that domestic water need is the most important need.
Figure 9.26. Average number of water scarcity situation for different uses.
0
5
10
15
20
25
1 2 3 4 5 6 7 8 9 10 11 12 13 14 15 16 17 18 19 20 21 22 23 24 25
Inst
ance
s w
ithou
t wat
er (%
)
Scenarios
0
5
10
15
20
1 2 3 4 5 6 7 8 9 10 11 12 13 14 15 16 17 18
Inst
ance
s o
f wat
er s
carc
ity (
%)
Farmers
Domestic Livestock Vegetable

305
All scenarios provide a satisfaction (consumption/need) level above 75% (Figure 9.27).
Although the differences between scenarios are non-significant, household satisfaction level of
50% with 25%, 75% and 100% of them agreeing to share in a hamlet potentially provides higher
overall satisfaction level. A situation where water is not shared (zero proportion of households
agreeing to share) represented by the first cluster too have overall satisfaction level of 75%,
which could be due to the accumulation of water in respective tanks, and agents fulfilling their
requirements from their individual hamlet tank.
Figure 9.27. Satisfaction level based on sharing rules in different scenario.
As indicated above, water collection in tanks and networking not only satisfied the water
demands, it could also facilitate water saving to a substantial level. As represented in Figure
9.28, all three tanks across 25 scenarios show appreciable amounts of water balance. The water
balance ranged from 30% in tank 1, 21% in tank 2, and 10% in tank 3. The overall balance from
the system is around 18%, which may be one of the incentives for networking the tanks.
0.00
0.25
0.50
0.75
1.00
0 0.25 0.5 0.75 1
Hamlet - proportion of households agreeing to share
Sat
isfa
ctio
n le
vel (
%)
Household level of satisfaction 0 Household level of satisfaction 0.25Household level of satisfaction 0.5 Household level of satisfaction 0.75

306
Figure 9.28. Initial and final volumes of water (in units) in the three tanks across twenty five
scenarios.
The simulation of multiple scenarios provided the opportunity to display that collectively
water can be saved by networking and sharing. It was also efficient to depict the existing water
use dynamics like farmers accessing water from multiple tanks. The quick understanding of the
model helped in one of the RPG player taking over the process of briefing non-RPG participants
during the community meeting. With the successful construction of water collection tank and
presentation of different water sharing scenarios, resulted in tangible effects and impacts. The
details of the effects and impacts are presented in following section.
9.5 Comparison of the effects and impacts of the ComMod process in Kengkhar
9.5.1 Direct and indirect effects
Table 9.14 provides a summary of the effects of the ComMod process in Kengkhar.
These effects can be segregated into individual, collective, institutional and biophysical. The
direct individual effects are again the enhanced awareness of the individual situation and strategy
to improve it. It was this individual new learning that helped in establishing a shared common
understanding to facilitate collective decision-making and actions. In Kengkhar bringing together
the institutions, like the basic health unit, school, agriculture extension office under the block
development, was the prominent direct effect, and the creation of the small group to manage the
tank network. The important biophysical effect in Kengkhar is the initiatives of managing
0
20
40
60
80
1 2 3
Wat
er (
No
. of u
nits
)
Tanks
Initial volume Final volume

307
catchment are and operation of water collection tanks and their networking which has improved
the water availability regime.
The simultaneous indirect effects of the process are the way people started valuing the
water and its quality. With the protection of the catchments, use of concrete tanks, cover and
distribution system, the indirect effects on biophysical features in Kengkhar lead to an improved
water recharge of natural spring ponds by catchment protection and stabilization of degraded
slopes.
Table 9.14. Direct and indirect effects of the ComMod process in Kengkhar. Sites Level of effects
Individual Collective Institutional Biophysical Direct effects Water available
for 2 additional months and reliable network of tanks
Participation in consultation and collective actions
Tank network management committee formed
Catchment protection and tank networks
Indirect effects
Access to clean water, time saved from water collection
Social mobilization
Cooperation and understanding for collective action
Natural spring recharge enhanced, greening of catchment, reduced land degradation
9.5.1.1 Impact domains
In view of the process orientation and close interactions, ComMod activities had
significant influence on the knowledge, understanding and behaviour of the participating
farmers, that builds trusts and confidence of the stakeholder to work collectively to resolve the
impending NRM issues. As such it is valuable to assess how far the approach impacts on
immediate timeframe or what can be envisioned as a long term impact. Broadly the impacts of
ComMod can be associated to four comprehensive domains: technical, individual, collective
(social), and external agencies (outsiders) as shown in Figure 9.29.

308
Figure 9.29. Impact domains and impacts of ComMod approach in immediate and long term
timeframe in Kengkhar.
Technical domain
In view of the researcher leading the ComMod process in Kengkhar, the immediate
impacts in technical domains were the adoption of technological options like water harvesting
and tank networking. The understanding of bio-physical dynamics and adaption to local
situation, and improvement of research capacity of research and extension staff were immediate
impacts which lubricated the process. In the longer term, the development agencies including the
Block development office will emphasise constant monitoring and management of the water
distribution system.
Individual domain
Although only a small sample of the population was involved in the gaming and
simulation exercises, the involvement of the remaining households of the study sites through
conceptualization, debriefing workshops, interviews, and model presentation have empowered
individuals with information on strategies and their consequences helping them to take
appropriate decisions. Farmers acquired improved skills of problem diagnosis and representation,
better communication and decision making for equitable resource sharing and networking. With
Bio-physical dynamics and co-management Sustainable management of forest cover and
resources
TECHNICAL
OUTSIDER
SOCIAL
PERSONAL
Initiative and improved participation in NRM
Vibrant communication, networking, responsibility sharing
Better understanding and local adaptation
Initiation of management rules
Understanding of individual’s role and consequences
Common concerns, proper monitoring and collective
actions
Felt need for communication, coordination and institution
Functional local level institution for NRM
Positive attitude and support of external agencies
New technologies adopted by farmers
Improve research capacity on conflict and NR management
Better communication and decision making
Harmonious society
Equitable resource sharing
Strong collective voice to access support
LONG TERM (Expected)IMMEDIATEIMPACTS
DO
MA
IN

309
the better individual capacities, it is expected that these individuals will engage in purposeful
monitoring and taking collective initiatives to sustain the network of water collection tanks.
Social domain
The tangible immediate impact on social domain is the shared understanding of the NRM
issue and vibrant communication and networking in sharing responsibilities to manage the issue.
In Kengkhar the spontaneous consent to collectively build the tanks and establish a network for
water sharing can have long lasting benefits. The commitment to work together and manage the
water resource may promote an harmonious society built on the principle of shared objective and
collective responsibility.
External domain
With the involvement of external agencies like research and development agencies in the
process, local people gained confidence in consolidating their needs and put collective pressure
to access support. The internal cohesion and common goal assured donor support for sustainable
impact from the interventions. The Block development committee has used this small
intervention as a testimony of the community to work collectively to improve water situation.
The positive response on the water collection tanks and their network from the community, has
attracted people from other regions to study the system for possible replication.

310
9.6 Factors influencing the effects and impacts of the process
The factors that influenced the effects and impacts of the ComMod process in Kengkhar
are presented in Figure 9.30 with detailed explanation in following sections.
Figure 9.30. Internal and external factors that enable or impede the ComMod process in Kengkhar.
9.6.1 Enabling factors
Here too, the most important enabling factors were the severity and legitimacy of acute
water scarcity in Kengkhar. The presence of influential members enabled the process. The
existing water sharing systems despite the shortage, that lead to close communication and
interactions was the entry point to mobilize the community in collective actions.
In parallel, some of the external factors that facilitated the process were vibrant research-
extension linkages which were the main channel of information flow and initiation of
collaborative research activities that facilitated the process. The confidence of the community on
the institution, particularly agriculture extension, also helped in securing the process and in
gaining access to the community. Through the research centre, it was also easier to access
support from potential donor agencies to implement collective actions.
Internal Factors
External F
actors

311
9.6.2 Impeding factors
Alongside there were also factors that hindered the ComMod process. Despite the
agreement to engage in collective actions, damaging the tap heads and scooping water from the
tank by students set back the process. Two of the primary internal factors that hindered the
ComMod process were the inability of all the affected households to participate in the process
and the limited capacity of local leaders to follow up the process. Beside these internal factors,
two external factors also partially slowed down the process. In case of Kengkhar the repeated
damage of tap heads and tanks by travelers almost became a disincentive to people who invested
their time and energy to construct the structure.
The ComMod process positively impacted on the enhancement of water productivity and
water security. Although the computer ABM tool was mainly used in the field to test scenarios,
its demonstration helped in better understanding of the water tank networking concept and the
players who took part in the gaming sessions were quick to conceive and explain its features and
operating rules to the non-players. The detailed discussions on the analysis and findings of case
studies are presented in the next chapter.

312
PART IV: DISCUSSION AND CONCLUSION
CHAPTER 10
DISCUSSION
The two research sites provide complementary contextual situations to formulate a
stimulating comparison on the use of the ComMod approach to facilitate management of water
resources. The chapter provides an analysis of the changes, effects and how the processes
evolved in the two sites.
10.1 About the diversity of ComMod effects
The fundamental principles of collaboration among actors and co-learning in ComMod
(Bousquet and Trébuil, 2005) makes it powerful tool to improve local problem-solving capacities
thereby enhancing the adaptive capacity of natural resource managers. The interactive
engagement of actors in all stages of the process leads to enduring effects and impacts at
different levels as shown at the end of the two previous chapters. This was prominent in
Lingmuteychu and Kengkhar despites their contextual differences. The tangible effects of the
application of ComMod approach in these two sites were the progressive evolution of the
individual and collective capacity to better understand the problem at stake, communicate and
manage the water resource issues. The integration of local understanding and expert insight of
the context into ComMod tools and the interactive engagement of the concerned population in
the process helped in following areas:
• Knowledge acquisition: In both sites community members could comprehend the dynamics
of renewable resource systems coupled with features of the socio-economic context. Specific
knowledge acquired related to agro-ecological, technical, economic, social, and institutional
aspects.
• Understanding and awareness of the problem: The initial knowledge helped in enhancing
awareness about the complexity of the problem and developing a better understanding of the
issues leading to the identification of appropriate management options.

313
• Change in perceptions: The reflective insight and understanding of the complex issues
changed the perception of the participants in the way the issue needed to be appraised and
handled. The new outlook removed the barrier of non-confidence for communication,
networking, and decision making thus promoting self-confidence both at individual and
collective levels.
• Change in decision-making (individual, collective, and institution): When the community
members have a better understanding and perception of the issue, they engage in a process of
information based decision making, consultative negotiated process, management based, and
change in individual decision process. The progressive exploration of traditional water
resource sharing system to multiple scenarios helped in co-construction of shared
representations and co-learning that resulted in novel idea of collective management in the
form of watershed management committee in Lingmuteychu. Like wise the shared
representations of how water collection and networking can possibly enhance the resilience
of water resource helped farmers in Kengkhar to change the way they neglected the
dwindling water resource.
• Change in behaviours (individual, collective, institution); communication, networking and
engagement: The process as a neutral and non-confrontational platform promoted trust
among actors and prompted disadvantaged groups to voice out at equal footing. For instance
the downstream communities particularly from Lumpa hamlet in Lingmuteychu had never
raised the issue of defunct irrigation canal. Similarly the Archong and Pangthang hamlet in
Kengkhar never raised the issue of lack of spring pond/tank in their hamlet. In view of the
seriousness of water sharing conflict in Lingmuteychu, ComMod approach was efficient in
providing levelled playing field wherein up-stream and down-stream communities could
have unrestricted interactions to find a common approach to address the issue. In both the
sites, the process gave an opportunity to integrate the primary resource users with other
stakeholders. The process encouraged a broad based consultation based on wider social
networks and engagement in participatory consultation and collective actions.

314
10.2 Multi-level management of renewable natural resources and institutional change
The water sharing issue in Lingmuteychu has been a perpetual social–ecological issue
that crosses the interest of multiple scales. Further the traditional water sharing system, range of
administrative jurisdiction and stakeholder diversity also added to the complexity of interests at
different scales. The ComMod process facilitating iterative and learning-based co-management
of complex water sharing system in Lingmuteychu helped in stimulating stakeholders to
collectively recognize the need for a new institution and management system that would address
the current status of the water sharing and management issue. It was evident from the ComMod
process and subsequent discussions that neither top-down (command and control) nor bottom-up
(demand based) management systems was capable of containing the short and long-term water
management issues.
The most tangible outcome of the ComMod process in Lingmuteychu was the
establishment of watershed management committee (WMC), a collective body that pledged to
bring on board the common issues, secure financial resources, and coordinate watershed
management activities. However, the water sharing issues at the village levels are best managed
by the irrigators under the leadership of village representatives in the WMC. In effect, there are
seven water users groups corresponding to seven villages which are represented in the WMC by
their elected village representative. This represents a partition of the sub-watershed into a mosaic
of seven nested sub-units (Ostrom, 2009) that operate under the WMC.
To be consistent to the national administrative system, Lingmuteychu falls within the
administration of Limbukha gewog75 (Block) and Punakha district. The engagement of the Block
development committee and district officials in the ComMod process on request of the
community members in Lingmuteychu was strategic as the WMC initiatives were easily
accepted as a legitimate management body. Thus the process encapsulated the co-construction
and co-management of strategies for water resource management as a unit that functioned
internally yet nested together to give a wider management scope. Such internal mechanisms
minimized transaction costs associated with several groupings of irrigators across the sub-
watershed. 75 Gewog is the smallest administrative unit.

315
One of the outstanding advantages of the multi-level management approach in
Lingmuteychu was the resolution of the water resource related problems through incremental
dialogue-based phases. Such an approach helps in sustaining conditional agreements and
reflexive by-laws closely linked to customary practices thereby making water resource
management more adaptive.
Similarly in Kengkhar, the water collection tanks and its network was a new
infrastructural intervention in the community. With ComMod approach exploring how to manage
the system, led to setting up of a management group to take care of the tank network. However
as in Lingmuteychu, the management of individual tank remained the responsibility of the
hamlet to which the tank is assigned. This ensured two level of management, the tank level have
higher responsibility as the success of the system depended on the proper management of the
tank.
10.3 Evolution of power relationships: comparison before and after the ComMod process
In both sites there was a definitive influence of power relationships on water resource
management that was inflicting the tensions. However, considering the water sharing conflict, it
was more distinct and complicated in Lingmuteychu.
In this sub-watershed, the Limbukha village spatially located at the uppermost presented
a position of hegemony. As the stream (Limti chu) originated from Limbukha, its households
were always considered as the first beneficiaries. As explained earlier, water sharing was
controlled by few customary rules like: (i) first-come-served, (ii) earlier settlers have absolute
rights over water, (iii) water release dates are fixed. Nowadays, these rules are considered biased,
as they were set when users were few and the water resource in abundance. They also disregard
the new water needs and users. In 2003, when the initial application of ComMod was conceived,
researchers and extension officials of MoAF indicated the potential risk of non-participation by
Limbukha people and possible failure of the initiative. In contrast, the ComMod team was
overwhelmed to find farmers eager to participate and enthusiastic about the process. However,
the influence of dominance and lack of commitment to the outcome of different actors was

316
recurring along the process. Initially the late arrival in the group meetings and taking the
opportunity to make final remarks on any of the resolutions appeared to be the act of power
exhibition. This was apparent from the actions of many Limbukha farmers and an elder member
in particular used his detailed knowledge on customary water sharing rules to construct a
discourse that hindered the process. It was also evident from the non-compliance of the
agreement to release water five days earlier than traditionally agreed, with a reason that the
agreement was never formally signed.
As the ComMod process was up-scaled from two villages to include all the seven
villages, there was a gradual change in the behaviour of these dominant individuals. Some of the
specific changes that helped in the process were elders from Limbukha taking the role of
facilitators and even taking initiatives to suggest activities that could benefit downstream
communities. The series of consultations, field visits, and active engagement in the ComMod
process demanded exhaustive disclosure of traditional rules and terms of water sharing. It is
assumed that this shared understanding of the situation and mutual aspiration to improve,
induced trust among the community members. Further as the ComMod process in Lingmuteychu
stimulated formation of the WMC, it progressively levelled out many differences thus providing
a common platform bestowing the authority to manage the watershed problems. Observing the
manner the WMC has been functioning over the last five years, it appears that it has maintained
to keep up the expectation of the community and has been able to harness support, both
internally and externally, to initiate and support development activities in the sub-watershed.
In the case of Kengkhar, although there was no issue of power relationship in terms of
water sharing, there was one instance where one household owned a private water tank. In the
past the household had exclusive rights over the water. The household was included in the
ComMod process deliberately as the owner was an important actor in water resource
management in the area. Initially he was unreceptive and unaffected by the process, however as
majority of the participants started to get a sense of assurance and consolidated their claims for
common good, he too became pro-active in the process. As the tank network and water sharing
system was discussed, the private tank was also included thereby harmonizing the water resource
system in the community.

317
10.4 Critical analysis of the implementation of ComMod processes
10.4.1 Positive development
Comprehensible, transparency and ownership: With the detailed situational analysis using for
example the agrarian systems analysis and PARDI technique, a ComMod process starts with a
strong diagnostic basis. The in-depth characterization of the actors, situational context and their
interactions which is used in model conceptualization and the design and application of RPG
tools makes it comprehensible to the stakeholders despite their diversity. The engagement of
principle stakeholders in all stages of the process ensures its transparency, thus promoting
ownership of its outcomes. The adaptation and use of local artefacts, traditional games, and local
terms in the RPG essentially enhanced simplicity and comprehensibility of the process.
Steady built-up of the collective understanding and trust: The basic perception of the researcher
as one of the actor in the process balances out the differences among the actors. As researchers
engaged in the ComMod process also begin from the common point of entry (Section 7.2.1), they
provide confidence to the participating farmers to steadily develop collective and common
understanding of the problem situation. The gradual built up of this collective understanding
smoothen the progress of co-conception, co-design and co-learning. As the extent of involvement
and constructive interactions increased along the process, there is a definite improvement of trust
among the stakeholders. The trust indeed facilitated unrestricted sharing of information and
opinion among the participants which helped in formulating realistic actions.
Empowering and creation of platforms for mutual discourses: The repetitive gaming and
simulation sessions which were partly conceptualized by the stakeholders and applied to explore
scenarios empowered them with information and skills to enhance engagement and mutual
commitment. The non-confrontational platform provided opportunity for free exchanges of
opinions and introduction of innovative game rules, like need for consultation in water
application and monitoring of the actions of upstream players. Such platforms helped in
extending the discussions to interesting ideas like replenishing the water with water from another
catchment and building water collection dam at the village level. This resulted in the collective
planning of options which became strategies for the newly formed WMC committee. The

318
monitoring indicators like the time spent of water guarding, availability of water, restoration of
irrigation canal, and minimizing water scarcity periods has helped the management committee to
monitor the systems performance.
Progressive decision process, legitimacy, and collective action plans: The iterative cycles of the
ComMod process and the inclusion of officials from the Block development committee, district
officials, local research and extension offices, and from the irrigation department helped in
progressively make decisions that were legitimate from local, regional, up to national
perspectives. Decisions like the restoration of a long abandoned irrigation canal, the construction
of check dams, the maintenance of irrigation canals, and drafting of by laws for the WMC were
within the scope of the water policy being drafted then. The Lingmuteychu WMC were also the
first farmer group with whom national water policy was discussed, which further provided
impetus to WMC to become active.
Flexibility: Despite the definition of a ComMod process in twelve steps, during its
implementation it proved to be flexible, permitting the adaptation as per the field situation and
the process dynamics. Even after the conceptualization of the process, participants could
introduce new agents and rules in the game which fostered the evolution of the process. The way
observers were introduced with a specific role helped in fortifying the demand for change in
management regimes. The ABM tools developed based on the RPG ones demonstrated options
for the redefinition of state for its replication in different situations.
10.4.2 Negative development
Length of the process: Sometime the flexibility and provision for iterative cycles with multiple
scenarios could prolong the process to an endless course. As the process enhances co-learning
and empowerment, the enthusiasm for exploring further to find better scenario is always there.
For instance when the process in Lingmuteychu started with two villages in 2003, their genuine
proposition to include all seven villages was considered. The inclusion broadened the scope of
the study and features to incorporate also expanded. It took three years to institute the WMC as a
key outcome of the process while the monitoring of the aftermath of ComMod activities is still
going on. The process in Kengkhar took four years. The issue is not only the length of the

319
process but also the concern of funding and maintaining the motivation of the stakeholders
without a definitive outcome of the process.
Limited participation: Considering the design of RPG tools, factors used in the game, and the
management ability of RPG facilitators only few stakeholders could full heartedly participate in
the process. In a conflict situation like in Lingmuteychu, non-participating farmers often
withdraw and remain non-responsive to many decisions. Probably due to the fear of being
opposed and the risk of abandonment by a majority of non-participating households, there were
repetitive demands from the participants to involve all the households of the sub-watershed in the
process. As it was beyond the researcher’s capacity to include all in the gaming sessions, a series
of debriefings using the ABM tool was conducted in all seven villages. However, during the
monitoring activities, many still express their ignorance of the ComMod process and this could
be counter productive. This situation may have been triggered mainly for two reasons, firstly that
farmers considered the debriefing workshops as simply a process of legitimizing what was
already decided, and secondly that not all issues are included in the process. There were also
instances of non-participating households making an issue of research favouring a selected group
or community. One peculiar incidence non-inclusion of localized issue and users’ reaction was
the dismantling of weir in water diversion point of Matalungchu and Omtekha which fuelled a
serious legal battle between two communities during 2009.
To be assured of total agreement or at least awareness, in the case of Kengkhar, all 52
households using the water tank and its network including the representatives from schools and
local offices were involved during the debriefing of the ComMod process.
Computational impediment and application of scenarios: In both sites, the biggest setback was
the inability of the researcher to use the ABM tools in the field to identify protocols and explore
scenarios in a timely manner. The use of ABM was limited to laboratory experimentation and
field demonstrations at the end of the processes, mainly because of the difficulty to master the
use of the simulation platform. As it is often developed without the involvement of the principal
stakeholders (in laboratories away from the community), it often appears magical and captivating
when the model is presented. While the Kengkhar model was fairly easy to understand by those

320
involved in the gaming sessions, making the Lingmuteychu community members understand the
different versions of the 7 villages ABM has been a difficult task.
Risk of tall expectation: Following the intense and intimate engagement of stakeholders in the
process there is an empathy developed within the participating farmers and also between farmers
and the researchers. The empathy and trust gradually extends to hope of resolving ‘all’ the issues
by the research team. This was evident in both sites, when participants started proposing
collective actions that were beyond their financial capacities. For instance as a part of the
collective action plan in Lingmuteychu, the group discussed and proposed the first activity to
rehabilitate an irrigation canal in Lumpa hamlet which has been defunct for more than ten years.
This was a genuine proposal as a collective commitment, but the group had no resources to
implement it. In such situation, the researchers had to divert funds to implement the activity to
reassure the commitment. Similarly in Kengkhar, the participants expected the construction of a
major water supply scheme and the development of roof-water harvesting in all households.
10.4.3 Potentials and means to improve
Although advantages of ComMod processes surpass their limitations, there are potentials
to improve them to derive greater benefits from their implementation. Based on these two case
studies, the following suggestions are made as means to improve:
Process length: The ComMod approach as applied in the two sites clearly presented a two
distinct phases of first as field and RPG-based and second being centered on the development
and use of the computer ABM tool. The design of RPG with its elaborate steps and computations
did not accommodate major changes in the game, except some game rules. As ABMs have
capabilities to allow revisions, earlier use of the ABM tool may help in minimizing the tedious
work of redesigning the RPG, testing and applying it. However, the design and application of the
ABM have its own share of problems. Simplification of programming and making the simulation
platform user friendly from the generic codes may help in use of computer-aided RPG. However,
to keep participants within the research, design and application of ABM tools should happen
simultaneously, so that the feeling of the ABM being external is removed. This also will keep the

321
players connected to the ABM with greater understanding of the computations and scenarios. If
the RPG and ABM can be computerized, the involvement of participants may not be a problem.
Risk of tall expectation: Although the researchers claim to be one type of actor in the process,
who bring in external knowledge and technical knowhow, the display of computers often present
a hi-tech team in the remote village. The close rapport, hi-tech impression, and presence of
foreigners immediately give a false signal to the community of potential source for unlimited
supports. Clarity in the process, particularly about what it could do is still missing. Although it
much depends on the scope of the project, the non-acceptance of the people’s demand could
jeopardise the process. Therefore, it is always appropriate to clarify the scope of the research and
limitations of the ComMod process.
10.5 Generic features and outcomes of the ComMod processes
Social learning: One of the prominent and stable outcomes of a ComMod process is the social
learning in most of the sites. The new learning on water resource management indeed provided a
new direction of solidarity. The social learning process takes place in a natural/technical and a
social (institutional, cultural) context (Pahl-Wostl et. al., 2008). Farmers who participate in a
ComMod process engage in the iterative process of collective learning in a shared domain of
natural resource (Wenger, 1998). Social learning is helping to build and sustain the capacity for
communicating different perspectives to resolve conflicts and competence to come to shared
agreements as demonstrated in the two case studies presented in this dissertation (Pahl-Wostl et.
al., 2008).
Building trust: In both sites, the intensive and repetitive engagement in the process enhanced the
capacity of the participants in reasoning and sensitivity thereby building new knowledge and
belief. The cognitive development basically supports building of trust among the stakeholders.
The trust evolved progressively acts as an important lubricant of a social system (Arrow, 1974).
As Parks and Hulbert (1995) suggest, trust on others to ‘do the right thing’ (or cooperate) will
cultivate enduring cooperation over time. The degree of trust among individuals influences long-
term interdependence (Pruitt and Kimmel, 1977). Particularly, in a situation of social dilemmas,
higher levels of trust results in increased cooperation (Parks et al., 1996; Chaudhuri et al., 2002).

322
Empowerment and decision-making for collective action and self-organization: The co-learning
supported by the ComMod process balances out the differences of knowledge and understanding
found in the initial context. The new knowledge and information empowered the participants to
have unprejudiced dialogue on water resource management. The impartial dialogues and
conviction also helped in consolidating collective demand and exerting pressure to development
agencies for support. The shared goal to improve water resource management indeed helped in
making knowledge-based decisions for collection action. The collective actions and cooperation
improved the capacity for self-organization to enhance collective coping mechanism.
Participatory monitoring and evaluation: The introduction of a multi-level management
approach of hamlet level user groups associated to the sub-watershed level management
committee has greatly minimized the transaction cost. Each user group trying to outperform the
other user group in managing the water resource induces participatory check and balance. The
use of locally developed indicators to monitor the systems performance enhances commitment
and observance to the agreed framework. As they are easily observable, it prompts users to
engage in participatory monitoring of water resource use. The regular evaluations through
consultative meetings of WMC help in redefining their management regimes.
ComMod and seeking opportunities for favourable transformations: ComMod approach is
competent to take advantage of stakeholders’ knowledge through integration different tools for
co-create multiple scenarios. Such scenarios are efficient means to explore possible
transformation pathways. Even after the particular decision has been made, the opportunity for
changes based on the scenarios remains an option that could be tested by the community. Further
the possibility to adjust the specific parameter in the model depending on the changed context,
offer a practical means to test the assumption to explore its consequences.
10.6 Success and sustenance of initiative on common pool resource regime
Although it is too early to make any conclusive discourse from the two case studies, it
provide a basis to articulate that success of water resource management regime depends on
congruence of natural resource and administrative boundaries, representation of interests,
matching governance structures to ecosystem characteristics, containment of transaction costs,

323
and establishment of monitoring, enforcement and adoption processes at appropriate scale
(Eggertsson, 1990; Bromley, 1991; Hanna, 1992). Further the success of management regime
seems to endure with clarity of definition of bundle of rights: access, withdrawal, management,
exclusion, and alienation (Schlager and Ostrom, 1992). Additionally, the sustenance of
management committee and their initiatives in both sites will depend on enabling conditions.
According to Agrawal (2001), four critical factors that influence sustenance of such initiatives
are (i) resource system characteristics, (ii) group characteristics that depend on resource, (iii)
institutional regimes through which resources are managed, and (iv) external forces and
authorities such as market, state and technology. Although top-down control of NR is referred to
stimulate unsustainable use of the resource (Janssen et al., 2004), in the two sites the top-down
control of NR seemed to have the benefit if correct level of interplay of local control with top-
down control regime is maintained. With the successful launch of first local institution on water
resource management, it served as a working model for adapting the management by-laws of
other natural resources like pasture in Radi and chirata in Singkharlauri.
10.7 Social self-organization triggered by ComMod
The co-learning through ComMod process seemed to encourage rational thinking among
participants that progressively promote communication and networking. As people use the
network within their peer group, there is clearing understanding of social roles which fosters
collective actions. From the experience in both research sites, it appeared that ComMod served
as a platform for water resource use negotiation. The use of new shared understanding and trust
seemed to encourage social self-organization helping the emergence of a common platform to
draw their collective strength (Figure 10.1). The ability to self-organize in both sites, proved
positive mainly to consolidate their strength into a management committee that reinforce their
bargaining power to external agencies for support to their cause. Such platforms are considered
as a way forward to deal with CPR management (Steins and Edward, 1999 and Gonzalez, 2000).
However, using such platforms for collection actions are associated with ability of the individual
user groups to influence decision-making within the nested platform, influence of the collective
choice and legislative institutional frameworks on the effectiveness of the platforms, social
learning and the need for a third party to facilitate nested platforms. Among these four issues, the
role of third party was very prominent in both the sites. The role started with organizing the

324
members, developing project proposals, and guiding the group through the process. In
Lingmuteychu the extension officer had to serve as member secretary on the request of WMC.
Figure 10.1. Social self-organization triggered by ComMod
The new learning and self organization facilitated bonding within the community clusters
which further helped in bridging the much needed linkage between the community and external
stakeholders and public service providers. With the building of social capital and ability to self-
organize, it was a case of empowering the people to generate adaptive management strategies
thereby enhancing the resilience of social-ecological system.
Social Capital,
Collective
adaptation strategy
Learning by participants
directly involved in the
process – (Cognition)
Information sharing with
family and others
(Communication)
Collective learning and
common understanding
(Co-learning)
Peer groups with
common objective
( Network)
Collective actions
and Social roles
(Cooperation)
EXTERNAL
( policy, financial,
administrative,
technical)
Local management
committee
Self organizationCrafting of local
institutionalCom
Mod
Bonding
Bonding
Brid
ging

325
CHAPTER 11
CONCLUSION
11.1 Conclusion
In situations where the past public interventions in resolving the water resource related
issues were unsuccessful, community members always had reservations of achieving any
tangible output from the new involvements. The entry with such pessimism was a challenge for
this research to bring together the conflicting stakeholders and their insight on water resource to
a common level of understanding. The application of the ComMod approach in two such
situations in Lingmuteychu and Kengkhar has exhibited the ability of the approach to fulfil the
research questions and objectives. The research shows how the methodology helped in the
mediation and transformation of unsettled situations of water resource management into
enduring strategies based on shared understanding, self-organization and collective action.
The agrarian systems analysis and SES framework helped in analysing the situation and
bringing out the perspectives of water resource management issues discreetly. The two
perspectives facilitated to appreciate the issue of water from agrarian point of view and link it to
the holistic SES framework. The shared understanding of the issues from a common point of
view facilitated conceptualization of the ComMod process. In both sites, it was evident that the
use of local artefacts and perceptions in designing RPG tools was efficient in simplifying the
concept and making it easily comprehensible for the participants. The ABM based on the RPG
was useful in laboratory exploration of scenarios; however, their application in the field was
limited to debriefing the community members on water management scenarios. Within the scope
of this research, the ComMod approach demonstrated its versatility and efficiency in
accomplishing the objectives.
11.1.1 Enhancing a shared understanding of water resource use and management dynamics
In situations where stakeholders are apathetic about the outcome of the process, it was
crucial for this research to jointly identify and define stakeholders and their roles in the ComMod
process at different stages to understand where each one is located both in terms of resource use
and decision process. The idea of engaging the stakeholders by assigning multiple roles and

326
swapping their roles during the process fostered confidence and ownership of the process.
Assuring them of their social status, reminding and stimulating them to change roles and act
collectively in the research process seemed to promote unrestricted communication across the
board. With the participation of a complete range of concerned stakeholders in the process, and
letting them to stick to their user groups (e.g seven villages in the Lingmuteychu RPG and three
clusters of 52 households in Kengkhar RPG represented by the farmers from their respective
villages) guaranteed real situations in abstract forms. The abstractions by using locally familiar
objects and concepts facilitated speedy adoption of the game and the game board. The
organization of the RPG mimicking the reality in terms of location of villages and flow of
irrigation water in Lingmuteychu and village clusters and location of water tank in the case of
Kengkhar provided familiar circumstances which removed the inhibition to participate often seen
with farmers. This helped in co-learning, communication and better understanding of the water
resource use and management dynamics.
11.1.2 Adaptive capacity and collective-decision making
The ComMod process was resourceful to recognize the differences among the
stakeholders yet capitalize on their knowledge and strengths. Further as the process allowed
autonomy in expressions and actions, it was able to expose the way one would manage the
resource situation. One’s ability to act independently and involve in open interactions gradually
converged into confidence and building trust. The new learning and trust fostered in bonding the
user groups and at the same time bridging the different stakeholder cluster. On the basis of such
associations the participants were quick to propose collective actions with specific roles that
would sustain the cooperation. The whole process exhibited a conscious consolidation of
strengths to organize them to enhance their adaptive capacities. The management committee that
emerged from the ComMod process carried out in Lingmuteychu indeed was an example of
linking the society to external agencies concerned with NRM.
11.1.3 Resilience and water management
The simulation of scenarios by using the RPG and ABM complementary tools were
proficient to demonstrate the consequences of the strategies in fairly comprehensible manners. It

327
fostered both individual and collective new knowledge on how water resources can be best
shared equitably and managed in a sustainable way. The multi-level institutional arrangement in
Lingmuteychu sub-watershed and water collection tanks and their network in Kengkhar have
demonstrated its ability in enhancement of resiliency of the water resource systems. The
equitable water accessibility and extending water availability period not only enhanced the
productivity of water, but it also contributed to higher systems productivity. For instance the
reduction of water guarding and collection time has saved their time for other productive
activities. Particularly in Kengkhar, accessibility to clean drinking water and provisions for
washing areas helped in improving the hygiene of the community. With drastic reduction in time
to walk to natural spring pond, fill the container in turns, the female members of households in
Kengkhar have more time to attend to their household chores and families. Further with the
availability of additional water, people in Kengkhar can think of irrigating their vegetable
gardens which will also add to the household nutrition.
11.1.4 Applicability of models
The models in both sites represent different water resource management regimes. For
instance, the traditional regime, reward for water saving, and trust and reciprocity were three
paradigms in 7 Village model. While the traditional regime and tank-networking were the two
paradigms in Omchu model. The experimentation with these management regimes has helped in
conceptualization and broadening of the mental models on water resource management both for
farmers and researchers. In both sites, the ideas from these models have been incorporated in
their management strategies. Except that the reward for water saving model in Lingmuteychu
could not be applied directly in the field. However with the launch of PES piloting in the
country, reward for water saving model may be applied in future.
11.1.5 Sustainability
The effects of ComMod process in acquisition of knowledge, change in perception,
behaviour, decision-making process, organizations, and actions seem to be something that will
persist. With the legitimacy of the water resource problem originated from the community and
the enabling political environment, the management committee emerging from the process in

328
Lingmuteychu has been operating for five years and is expected to sustain the outcome of the
ComMod process. The water collection tanks and its network in Kengkhar is another
infrastructural intervention of the process, which will continue to supplement water requirement
of the community, if they maintain the system properly. In addition to the sustainability of the
outcomes, they also have become workable solutions which can be replicated in similar
situations.
11.2 Perspectives
The two case studies provide a scope to critically assess the ComMod approach and find
areas of improvement. The experience for this research also highlights some of the potential
application of the approach.
11.2.1 Length of the process
Although the iteration and cyclic process is a part of ComMod approach, the time it took
to develop ABM tools prolonged the process. Longer it took, fatigue off participation and
uncertainty of outcome could take over. In addition the validity of data and information could
change over time. If the RPG and ABM were done in the research site, much of the time lapse
could have been minimized. Further development of computer ABM outside also completely
disconnected the farmers from this tool. Later when the computer model was taken for
presentation, it did not motivate any farmers to make use of it.
11.2.2 Simulation platform
The complication of MAS has been mentioned by several researchers, even in this
research the inability to fully utilize the MAS model and simulation with the farmers was the
principal problem. If the usability of MAS modelling can be developed, it can facilitate greater
participation in the process and possibly increase the relevance of the outcome.
11.2.3 Stakeholder representation
The relevance of the process can be enhanced by ensuring full representation of the
stakeholders. Although it was attempted in the research in two sites, often their level of

329
commitment varied leading to failure to implement collective actions. As seen in the two sites,
stakeholders took full ownership of a specific stage and output, while they gave no heed to step
they were not party to. This situation was evident in case of RPG and ABM outputs. While
involving administrators as observers had definite benefits, building their role in the ComMod
approach probably would have fostered better results. In case of Lingmuteychu at some stage,
observers were more than RPG players. Concern is if the observers really contributed to the
ComMod process, other than legitimizing the process and its outcome.
11.2.4 Process Monitoring and Evaluation
One of the crucial steps in the ComMod approach is seen as monitoring and evaluation.
From the experiences of two sites, it was evident that many consultations and agreements are
made outside the framework of ComMod approach. For instance, in both cases, during the RPG
sessions several late night discussions and debriefing by the participants to their peers in the
village would have influenced the process in some ways. Further during the gap between RPG
and ABM presentation to the community, the interactions both within and out the communities
would have some influence. While attempts were made in two sites to monitor the process, a
more systematic monitoring as to how the network and social capital evolved would have given
better understanding of the process.
11.3 Application of ComMod for future research
This research exhibited the potentials of the ComMod approach in three specific areas
(i) mediation of ongoing conflict in water resource, (ii) emergence of multi-level management
strategy, and (ii) adoption of technology. In view of its success in addressing the water resource
issues in two critical areas of Bhutan, the approach can be potentially applied in following
research areas.
11.3.1 Dynamics of multi-level management in natural resource management
With the experience of successfully crafting the polycentric watershed management with
a nodal management committee in Lingmuteychu, it may be useful to apply the research
approach in similar context with the objective of understanding the dynamics of multi-level

330
management regime of renewable natural resources. Further with the enactment of Water Act in
2010, the legal environment has changed compared to what was during implementation of this
research. Further with the opening of Watershed Management office within the Ministry of
Agriculture and Forests, the way water resources will be managed may change. Therefore, use of
ComMod in this new environment will provide a different perspective to the research
methodology.
11.3.2 Payment for environmental services:
The payment for environmental services as a management tool is currently being piloted with
small community in Yakpugang, Mongar from where the Mongar municipality get their drinking
water. As a management tool it is not tested yet, therefore the use of ComMod to assess the
benefits of PES in the Bhutanese context could be a relevant area for action research.
11.3.3 Climate change and livelihood security:
The impact of climate change in the Himalayan region, and more so in Bhutan, is often referred
serious with receding glaciers and flash floods due to glacial lake outburst. Climate change has
immensely impacted on the livelihood of people with loss of arable land, livestock, property and
life. As the climate change adaptation is becoming a major topic of discussion, application of
ComMod approach in climate change adaptation studies will be a new area.
11.3.4 Biodiversity management:
With 72% of country under forest cover, Bhutanese forest hold over 100 species of wild
mammals, over 620 species of birds and over 5400 species of vascular plants, making it one of
the biodiversity hot-spot. With the rapidly changing land use systems, climate change vis-à-vis
the policies on natural resource management and trade, biodiversity may be impacted
significantly. Furthermore the ever increasing demand for natural herbs and non-timber forest
products may result in over-exploitation of the resources. Thus biodiversity as a wealth of the
country needs to be sustainably managed to sustain its benefit. ComMod can be effectively
applied in better understanding social-ecological dynamics of the biodiversity and exploring
strategies for its sustainable management.

331
11.4 Challenges in application of ComMod
As the application of ComMod in natural resource management research is expanding the
challenges it faces are many. Some of the pertinent questions raised in global forums and
confronted in field research are as follows:
11.4.1 Development areas ComMod can support
As explained in section 11.3 there are numerous areas where ComMod can be applied. With the
exploitation of natural resources beyond its renewal capacity and impacts manifested in the
forms of natural disaster, ComMod may be a versatile approach to enhance wider understanding
of principles of resilience and generation of coping mechanisms. Further as the interaction
between society and natural environment is decreasing due to modern alternatives, ComMod as a
collaborative modelling may find a place in educating about the need of maintaining society-
natural environment respectable interface to foster sustainability of the SES.
11.4.2 Out-scaling ComMod research impacts
From the experience of this research, the competence of ComMod approach to engage multiple
stakeholders according to their role facilitates stable impacts at individual, community, and
institutional level. The legitimacy of the research process and blending the existing NR policies
and governance with local management option during formalization of scenarios can be a way
forward to promote impacts at local, regional and national level. This is expected to happen with
the coherence of ComMod output to the broader policy and governance environment.
11.4.3 Applicability of ComMod in pro-poor development pathways
Applications of ComMod in Thailand, Vietnam and Bhutan have shown the ability of the
approach to balance local power relationship and provide a levelled field for negotiation and
consultation. The approach acknowledging the social structure and customary norms provides an
opportunity to the stakeholders to explore multiple scenarios and compare them to have shared
understanding and collective wisdom for decisions. Further as ComMod capitalizes on co-

332
learning and communication, it fosters trust building among all sections of the society. This trust
and confidence on emerging social network essentially helps in mainstreaming the poor (and
disadvantaged) section of the community. This was evident in two sites in Bhutan, where the
first collective action was to restore an abandoned irrigation canal of a small hamlet left out from
the mainframe development plans for a decade. Similarly, the effort of Kengkhar community to
seek support from the research team to provide small water collection plastic drum each for poor
and isolated households was truly a well intended gesture.
11.4.4 Support necessary to promote application of ComMod
Within the family of collaborative modelling, ComMod is still evolving. While the scope for its
applications is unrestricted, based on this research there are some critical aspects that needs to be
resolved. As reiterated by other researchers, the approach needs to be further simplified.
Particularly the modelling aspects of the approach may need some attention to enhance its
applicability.
11.5 Way forward
The future plans based on the research in two sites are very modest. Firstly, the
possibility to replicate the research in other sites where water resource is fast becoming a serious
issue despite the enactment of Water Act and polices. Secondly, considering the blend of two
MAS tools in ComMod, there is option to apply ComMod in Gross National Happiness research.
With additional capacity development, the experience in two sites is Bhutan could be used as
teaching module in the newly launched degree program in College of Natural Resource in
Lobeysa, Bhutan.

333
REFERENCES
Adams, W.M., Brockington. D, Dyson, J., and Vira, B. 2003. Managing Tragedies:
Understanding Conflict over Common Pool Resources www.sciencemag.org SCIENCE
Vol 302. pp. 1915-1916. URL:
www.sciencemag.org/cgi/content/full/302/5652/1915/DC1
Agrawal, A. 2001. Common Property Institutions and sustainable governance of resources.
World Development Vol. 29 No. 10, pp. 1649-1672.
Agrawal, A., and Ostrom, E. 2001. Collective action, property rights, and decentralization in
resource use in India and Nepal. Politics and Society, 29(4), 485–514.
Allen, W.J., Bosch, O.J.H., Kilvington, M.J., Harley, D. and Brown, I. 2001. Monitoring and
adaptive management addressing social and organizational issues to improve information
sharing. Natural Resources Forum 25(3): 225-233.
Anderies, J. M., Janssen, M. A., and Ostrom, E. 2004. A framework to analyze the robustness of
social-ecological systems from an institutional perspective. Ecology and Society 9(1): 18.
[online] URL: http://www.ecologyandsociety.org/vol9/iss1/art18
Anderies, J. M., Rodriguez, A.A., Janssen, M.A., and Cifdaloz, O., 2007. Panaceas, uncertainty,
and the robust control framework in sustainability science PNAS _ September 25, 2007 _
vol. 104 _ no. 39. Pp: 15194–15199. URL:
http://www.pnas.org_cgi_doi_10.1073_pnas.0702655104
Anderies, J.M., 2002. The transition from local to global dynamics: a proposed framework for
agent-based thinking in social-ecological systems. In: In: Janssen, M.A.(Ed.), 2002.
Complexity and ecosystem management: the theory and practice of multi-agent systems.
Edward Elgar Publishing, Ins. Northhamton, Massachusetts, USA. pp: 13-34.
Anderson, A., Karar, E., and Farolfi, S., 2008. Synthesis: IWRM lessons for implementation.
Water SA Vol. 34 No. 6 (IWRM Special Edition). URL: http://www.wrc.org.za
Arrow, K., 1974. The limits of organization. New York: Norton,
ASIAN DEVELOPMENT BANK (ADB), 2005. Country strategy and program 2006–2010 –
Bhutan, prepared by Abid Hussain, Senior Economist/Country Programs Specialist,
South Asia Regional Department.

334
Asian Development Bank (ADB), 2008. Proposed Loans, Asian Development Fund Grant,
Technical Assistance Grant, and Administration of Grant, Report and Recommendation
of the President to the Board of Directors, Project Number: 37399, Bhutan: Green Power
Development Project.
ATLAS, 1997. Atlas of Bhutan, Land cover & Area Statistics of 20 Dzongkhags, Land Use
Planning Project. 1994. Ministry of Agriculture, Thimphu, Bhutan, Royal Government of
Bhutan.
Austrian Development Cooperation (ADC), 2005. Bhutan sub-program Energy 2005-2007,
Support of Rural Energy, Hydropower Generation and Capacity Building, Federal
Ministry for Foreign Affairs, Austrian Development Cooperation, Minoritenplatz 8, 1014
Vienna, Austria
Babin, D. and Bertrand, A., 1998. Managing pluralism: subsidiarity and patrimonial mediation,
Unasylva, 49. Pp 19-25.
Bala, S.M., Musa, I.K., and Abdulkadir, S.D., 2005. Agency/farmer participation in the
management of public sector irrigation scheme: Lessons from Nugeria’s Kano River
Irrigation Project. In: Coopey, R., Fahlbusch, H., Hatcho, N., and Jansky, L. (Eds.), 2005.
A history of water issues: Lessons to learn. United Nations University, Jingumar,
Shibuya-ku, Tokyo, Japan.
BAP, 1998. Biodiversity Action Plan for Bhutan. 1998. Ministry of Agriculture, Royal
Government of Bhutan
Barnaud C., Promburom P., Trébuil G. and Bousquet F. 2008. Interactive models to catalyze
collective water management: a companion modelling approach in northern Thailand.
Proceedings of Second International Forum on Water and Food (IFWF2), CPWF-
CGRAI, 16-18 November 2008. Addis Ababa, Ethiopia.
Barnaud C., Promburom P., Trébuil G., Bousquet F., 2010. In: Negotiate toolkit: case studies,
IUCN Water Programme. P- 3
Barnaud, C., Promburom T., Trébuil G. and Bousquet F., 2007. An evolving simulation/gaming
process to facilitate adaptive watershed management in northern mountainous Thailand.
Simulation Gaming Online First, published on May 23, 2007 as
doi:10.1177/1046878107300670.

335
Barnaud, C., Promburom, P., Gurung, T.R., Le Page, C., and Trébuil, G. 2006. Companion
Modelling for Collective Learning & Action in Water Management: Lessons learnt from
three case studies in northern Thailand and Bhutan. Communication presented at the
International Symposium Towards Sustainable Livelihoods and Ecosystems in
Mountainous Regions, Chiang Mai, Thailand, 7-9 March 2006. P-14.
Barnaud, C., Promburom. T., Trébuil G, and Bousquet, F., 2007. Evolving simulation and
gaming to support collective watershed management in mountainous Northern Thailand.
Simulation Gaming 38: 398–420.
Barreteau O, Le Page C, Perez P, 2007. Contribution of simulation and gaming to natural
resource management issues: an introduction. Simulation and Gaming 38(2):185
Barreteau, O. and Bousquet, F. 2000. SHADOC: a Multi-Agent Model to tackle viability of
irrigated systems. Annals of Operations Research 94: 139-162
Barreteau, O., 2003. The joint use of role-playing games and models regarding negotiation
processes: characterization of associations. Journal of Artificial Societies and Social
Simulation vol. 6, no. 2. URL: http://jasss.soc.surrey.ac.uk/6/2/3.html
Barreteau, O., 2003. The joint use of role-playing games and models regarding negotiation
processes: characterization of associations. Journal of Artificial Societies and Social
Simulation, 6(2).
Barreteau, O., and others, 2003. Our Companion Modelling Approach. Journal of Artificial
Societies and Social Simulation vol. 6, no. 1. URL:
http://jasss.soc.surrey.ac.uk/6/2/1.html
Barreteau, O., Bousquet, F., and Attonaty, J.M, 2001. Role-playing games for opening the black
box of multi-agent systems: method and lessons of its application to Senegal River
Valley irrigated systems. Journal of Artificial Societies and Social Simulation vol. 4, no.
2, URL: http://www.soc.surrey.ac.uk/JASSS/4/2/5.html
Bellamy, J. and G. McDonald, 2005, Through multi-scaled lenses: A systems approach to
evaluating natural resource management policy and planning, In: Bellamy. J., (Ed.),
2005. Regional natural resource management planning: the challenges of evaluation as
seen through different lenses, CIRM Monograph Series, June 2005, The State of
Queensland, Department of Natural Resources and Mines, Indoor oopilly, pp.3-10, URL:
http://www.cirm.org.au/publications/Monograph.pdf

336
Bellamy, J., Ross H., Ewing S. and Meppem T., 2002, Integrated Catchment Management:
Learning from the Australian Experience for the Murray-Darling Basin. Final Report.
January 2002. A Report for the Murray Darling Basin Commission, CSIRO Sustainable
Ecosystems, Brisbane. URL:
http://www.mdbc.gov.au/naturalresources/icm/icm_aus_x_overview.html
Bennet, A. and Bennet, D., 2008. The Decision-Making Process for Complex Situations in a
Complex Environment. In: Burstein, F. and Holsapple, C.W. (Eds.), 2008. Handbook on
Decision Support Systems. New York: Springer. URL:
http://www.carlisle.army.mil/proteus/docs/bennet-the-decision-making.pdf
Berkes, F. (ed), 1989. Common Property Resources - Ecology and Community Based
Sustainable Development. London: Belhaven Press.
Berkes, F. and Folke, C (Eds.). 1998. Linking social and ecological systems: Management
practices and social mechanisms for building resilience. New York: Cambridge
university press.
Berkes, F. and Turner, N. J., 2006. Knowledge, learning and the evolution of conservation
practice for social-ecological system resilience. Human Ecology, Vol. 34, No. 4, pp-479-
494
Berkes, F., Colding, J., and Folke, C. 2003. Introduction. In Costanza, R., Low B.S., Ostrom, E.,
and Wilson, J. (Eds.) Institutions, Ecosystems, and Sustainability. Cambridfe University
Press, United Kingdom. pp-1-29
Bettoni, M.C. and Eggs, C., 2010. User-Centred Knowledge Management: A Constructivist and
Socialized View. Constructivist Foundations vol. 5, No. 3. URL:
http://www.univie.ac.at/constructivism/journal/articles/ConstructivistFoundations5(3).pdf
Beukeboom, H. and Temphel, K.J. 2006. Community Forestry Contributes to the National and
Millennium Goals without Compromising the Forest Policy. Social Forestry Division.
Department of Forest, MoA, Thimphu.
Bhutan Water partnership, 2003. Bhutan water policy, Royal Government of Bhutan, Thimphu.
pp-17.
Bhutan Water partnership, 2003. Bhutan water policy, Royal Government of Bhutan, Thimphu
Bhutan: traditional water-sharing system 'feudal and unfair' Updated - Wednesday 20 August
2008. URL: http://www.irc.nl/page/43014

337
Blair, H. 2000. Participation and accountability at the periphery: democratic local governance in
six countries. World Development, 28(1), 21–39.
Borrini-Feyerabend, G., Farver, M., Nguiringuiri, J.C., and Ndangang, V.A., 2000. Co-
management of natural resources: organizing, negotiation and learning by doing,
Heidelbery Germany.
Bots, P.W.G and van Daalen, C.E., 2008. Participatory Model Construction and Model Use in
Natural Resource Management: a Framework for Reflection. Syst Pract Action Res 21.
Pp 389–407
Bots, P.W.G and van Daalen, E., 2008. Participatory Model Construction and Model Use in
Natural Resource Management: a Framework for Reflection. Syst Pract Action Res. 21:
389–407.
Bourdieu, P., 1986. The forms of capital. In: Richardson, J. (Ed.), Handbook of Theory and
Research for the Sociology of Education. Greenwood Press, Westport, CT, pp. 249–262.
Bousquet, F., and Trébuil, G. 2005. Introduction to companion modeling and multi-agent
systems for integrated natural resource management in Asia. In: Bousquet, F., Trébuil, G.
and Hardy, B. (eds.), Companion modelling and multi-agent systems for integrated
natural resource management in Asia, pp: 1-17. Los Banos (Philippines): International
Rice Research Institute.
Bousquet, F., Bakam, I., Proton, H., and Le Page, C., 1998. ‘Cormas: Common-pool resources
and multi-agent systems’, Lecture Notes in Artificial Intelligence, 1416: 826-38.
Bousquet, F., Barreteau, O., d’Aquino, P., Etienne, M., Boissau, S., Aubert, S., LePage, C.,
Babin, D., and Castella, J., 2002. Multi-agent systems and role games: collective learning
process for ecosystem management. In: Janssen, M.A.(Ed.), 2002. Complexity and
ecosystem management: the theory and practice of multi-agent systems. Edward Elgar
Publishing, Ins. Northhamton, Massachusetts, USA. pp: 248-285.
Bradbury, R., 2002. Future, predictions and other follishness. In Complexity and Ecosystems
Management: The Theory and Practice of Multi Agent Approaches, ed. M. Janssen, 48-
62, Edward Elgar. Cheltenham.
Brand, L. and Jamtsho K. 2002. Water management in the small farmer managed irrigation
schemes in the Lingmuteychu watershed in Bhutan. Liquid Gold Paper No. 7.

338
International Institute for Land Reclamation and Improvement (ILRI), Wageningen, The
Netherlands. 32p.
Brehmer, B. 1992. Dynamic decision making: Human control of complex systems Acta
Psychologica. Volume 81, Issue 3, pp: 211-241
Bromley, D. W. 1991. Environment and Economy: Property Rights and Public Policy. Oxford,
UK, Oxford University Press.
Bruin, Dick D. and Schultz, B., 2005. Lessons learned in the history of Dutch water
management. In: Coopey, R., Fahlbusch, H., Hatcho, N., and Jansky, L. (Eds.), 2005. A
history of water issues: Lessons to learn. United Nations University, Jingumar, Shibuya-
ku, Tokyo, Japan.
Brunckhorst, D. J., 2005. Integration research for shaping sustainable regional landscapes.
Journal of Research Practice, 1(2), Article M7. URL:
http://jrp.icaap.org/index.php/jrp/article/view/16/35
Bullock, R and Kevin H., 2008. 'Community Forestry: Mitigating or Creating Conflict in British
Columbia?', Society & Natural Resources, 21:1, 77 – 85
Butterworth, J.; Warner, J.; Moriarty, P.; Smits, S. and Batchelor, C. 2010. Finding practical
approaches to Integrated Water Resources Management . Water Alternatives 3(1): 68-81
Cambell, B.M., Sayer J.A., Frost P., Vermeulen S., Perez M.R., Cunningham A., and Prabhu R.,
2003. Assessing the performance of natural resource systems. In: Campbell, B.M and
J.A. Sayer (Eds.), Integrated Natural Resource Management, Linking productivity, the
environment and development. CABI International. pp. 267-292.
Campbell, B., Sayer, J.A., Frost, P., Vermeulen, S., Ruiz-Perez, M., Cunningham, A. and Ravi,
P., 2001. Assessing the performance of natural resource systems. Conservation Ecology
5(2), 22. URL: http://www.consecol.org/vol5/iss2/art22/index.html
Castro, A.L. and Nielsen E. 2001. Indigenous people and co-management: implications for
conflict management. Environmental Science and Policy 4: 229–239.
Chamber, R. 1997. Whose reality counts? Putting the first last. Intermediate Technology
Publications, Bath, Great Britain, 297p.
Chambers, R. 2006. Participatory mapping and geographic information systems: Whose map?
Who is empowered and who disempowered? Who gains and who loses?. The Electronic
Journal of Information Systems in Developing Countries. 25, 2 pp 1-11.

339
Chaudhuri, A., Sopher, B., and Strand, P., 2002. Cooperation in social dilemma, trust and
reciprocity. Journal ofEconomic Psychology 23 (2002) 231–249. URL:
http://www.elsevier.com/locate/joep
Chiari, G., & Nuzzo, M. L. (1996). Psychological constructivisms: A metatheoretical
differentiation. Journal of Constructivist Psychology, 9, 163-184.
Choden, K., 2008. Chilli and Cheese, Food and society of Bhutan. White Lotus Co. ltd.,
Bangkok, Thailand.
Chopra, K., Kadekodi C., and Murthy M., 1989. “People's Participation and Common Property
Resources”. Economic and Political Weekly, Vol (24) pp: A.189-A.195.
Ciracy-Wantrup, S.V. and Bishop R.C.,1975. “Common Property as a Concept in Natural
Resource Policy”. Natural Resource Journal, Vol (15). pp: 713-727.
Comprehensive Assessment of Water Management in Agriculture (CA),. 2007. Water for food,
water for life: A comprehensive assessment of water management in agriculture. London:
Earthscan, and Colombo: International Water Management Institute.
Coopey, R., Fahlbush, H., Hatcho, N., and Jansky, L., 2005. A history of water issues: lessons to
learn. United Nations University, Jingumar, Shibuya-ku, Tokyo, Japan.
Cornwall, A. 2000. Making a Difference: Gender and Participatory Development. IDS
Discussion Paper 378. Sussex: Institute of Development Studies.
Cornwell, A. and Gaventa, J. 2001. Bridging the gap: citizenship, participation and
accountability. PLA Notes 40. pp 32-36
Costanza, R. and M. Ruth. 1998. Using Dynamic modeling to scope environmental problems and
build consensus. Environmental Management. 22:(2). 183-195.
Cox, S. J. B., 1985. “ No Tragedy on the Commons”. Environmental Ethics, Vol.7, pp 49-61.
Crawford, S. E. S., and E. Ostrom. 1995. A grammar of institutions. American Political Science
Review 89(3). Pp.582–600.
Cullis, J.; van Koppen, B. 2007. Applying the Gini Coefficient to measure inequality of water
use in the Olifants River Water Management Area, South Africa. Colombo, Sri Lanka:
International Water Management Institute. (IWMI Research Report 113). 25p.
Cutler, C., Costanza, R., Eggertson, T., Fortman, L., Low, B., McKean, M., Ostrom, E., Wilson,
J. and Young, O. (1995). The Relationship between Ecosystems and Human Systems:
Scale Challenges in Linking Property Rights Systems and Natural Resource

340
Management. 5th Conference of the International Association for the Study of Common
Property, Bodo, Norway.
D’Aquino, P., O. Barreteau, M. Etienne, S. Boissau, S. Aubert, F. Bousquet, C. Le Page, and W.
Daré. 2002. The role playing games in an ABM participatory modelling process:
Outcomes from five different experiments carried out in the last five years. pp. 275-280.
URL: http://www.iemss.org/iemss2002/proceeding/pdf/volume%20due/192_daquino.pdf
Daré, W. and O. Barreteau. 2003. A role-playing game in irrigated system negotiation: between
play and reality. Journal of Artificial Societies and Social Simulation vol. 6:3.
http://jasss.soc.surrey.ac.uk/6/3/6.html
Davies, R and Dart, J. 2005. The ‘Most Significant Change’ (MSC) Technique: A Guide to Its
Use. CARE International, United Kingdom. p-104.
Davies, R. and Dart, J., 2005. The ‘Most Significant Change’ (MSC) technique: A guide to its
use. CARE International, United Kingdom. pp-104.
Demsetz, H., 1964. “The Exchange and Enforcement of Property Rights” Journal of Law and
Economics, Vol. 70 (4) pp: 414-30.
Demsetz, H., 1967. “Towards a Theory of Property Rights”. American Economic Review,
Vol.52, No.2, pp: 347-379.
Department of Agriculture (DoA), 1992. National Irrigation Policy, Department of Agriculture,
Ministry of Agriculture, Thimphu, Bhutan.
Department of Agriculture (DoA), 2008. Agriculture statistics, 2008, Department of Agriculture,
Ministry of Agriculture, Thimphu.
Department of Energy (DoE), 2003. Water Resources Management Plan Final Report, Volume
A-Executive Summary and National Thematic Maps. Department of Energy, Ministry of
Trade and Industry, Thimphu, Bhutan.
Deutschman, D.H., Levin, S.A., Devine, C., Buttel, L., 1997. Scaling from trees to forests:
analysis of a complex simulation model. Science 277, 1688, URL:
http://www.sciencemag.org/feature/data/deutschman/index.htm
Dhital, D. B, 1998. Forest Management Plan (July 1998 - June 2008) for Khotokha Forest
Management Unit. 1998. Royal Government of Bhutan, Ministry of Agriculture, Forestry
Services Division, FRDS, Bhutan.

341
Dietz, T., Ostrom, E., and Stern, P.C., 2003. The Struggle to Govern the Commons. SCIENCE
Vol. 302, pp-1097-1912
Dirlik, A., 1998. Globalism and the Politics of Place, Development, vol. 41, No. 2 (June 1998),
at p. 7.
DoF, 1974. National Forest Policy. Department of Forests, Ministry of Trade, Industries and
Forest, Royal Government of Bhutan, Thimphu, Bhutan.
DoF, 2006. Forest and nature conservation rules of Bhutan. Department of Forests, Ministry of
Agriculture, Royal Government of Bhutan, Thimphu, Bhutan.
Domang, Nima, C., Lhamo, Y., Choni, R., and Gurung, T.R., 2007. Water Resource a
Development priority in Kengkhar, Mongar - based on Diagnostic Study, RNRRC,
Wengkhar, Mongar.
DOP, 1990, Household Energy Survey, Rural Energy Division, Department of Power, Ministry
of Trade and Industry, Thimpu, Bhutan
Dore, J., Robinson, J. and Smith, M., 2010. Negotiate – Reaching agreements over water. Gland,
Switzerland: IUCN.
Dorjee, Kinlay , 1995: An Analysis of Comparative Advantage and Development Policy Options
in Bhutanese Agriculture. 1995. Doctoral Thesis, Swiss Federal Institute of Technology,
Zurich (unpublished).
Douthwaite, B., Kuby, T., van de Fliert, E. and Schulz, S. (2003) Impact pathway evaluation: an
approach for achieving and attributing impact in complex systems. Agricultural Systems
78(2), 243–265.
Dove, M. R. (1993) “A Revisionist View of Tropical Deforestation and Development”.
Environment Conservation, Vol 20, pp 17-24.
Druk Green Power Corporation (DGPC), 2009. Druk Green at Work. Druk Green Power
Corporation, Thimphu, Bhutan
Duba, S., Gurung, T.R., and Ghimiray, M., 2006. Land Use Policies and Sustainable Agriculture
and Rural Development in the Mountains : A Case Study of Bhutan. RNRRC, Bajo,
Bhutan. Pp-54
Ducrot, R. and A. Botta, 2009. Strategies to institutionalize companion modeling approaches.
18th World IMACS / MODSIM Congress, Cairns, Australia 13-17 July 2009. URL:
http://mssanz.org.au/modsim09

342
Ducrot, R. and Botta, A., 2009. Strategies to institutionalize companion modelling approach.
18th World IMACS/MODSIM Congress, Cairns, Australia 13017 July, 2009. URL:
http://mssanz.org.au/modsim09
Dumrongrojwattana P., C. Barnaud, N. Gajaseni, and G. Trébuil. 2007. Companion modelling to
facilitate adaptive forest management in Nam Haen sub-watershed, Nan Province,
northern Thailand. In Proceedings of the 2nd International Conference on Asian
Simulation and Modelling (ASIMMOD): Towards Sustainable Livelihood and
Environment. pp. 327-333. January, 9-11, in Chiang Mai, Thailand.
Dumrongrojwatthana, P., 2010. Interactions between cattle raising and reforestation in the
highland socio-ecosystem of Nan Province, Northern Thailand: a Companion modelling
process to improve landscape management. Coutelle: thèse de docteur en géographie
humaine, économique et régionale de l’Université Paris Ouest Nanterre-La Défense et
PhD in Agricultural Technology, Faculty of Science, Chulalogkorn University, Thailand.
pp-325.
Dung L. C., Hoanh C. T., Le Page C., Bousquet F., and Gajaseni N. 2009. Facilitating dialogue
between aquaculture and agriculture: lessons from role-playing games with farmers in the
Mekong Delta, Vietnam. Water Policy 11(S1): 80–93.
Dung, L.C, 2008. Environmental and Socio-economic impacts of rice-shrimp farming:
Companion modelling case study in Bac Lieu, province, Mekong delta, Vietnam. PhD
Dissertation, Faculty of Science, Chulalongkorn University, Thailand
Earth Trends, 2003. Water Resources and Freshwater Ecosystems – Bangladesh. Available
online: URL: http://earthtrends.wri.org/pdf_library/cp/wat_cou_050.pdf
EarthTrends, 2003. Water Resources and Freshwater Ecosystems – Bhutan. Available online:
URL: http://earthtrends.wri.org/pdf_library/cp/wat_cou_064.pdf
EarthTrends, 2003. Water Resources and Freshwater Ecosystems – India. Available online:
URL: http://earthtrends.wri.org/pdf_library/cp/wat_cou_356.pdf
EarthTrends, 2003. Water Resources and Freshwater Ecosystems – Nepal. Available online:
URL: http://earthtrends.wri.org/pdf_library/cp/wat_cou_524.pdf
EarthTrends, 2003. Water Resources and Freshwater Ecosystems – Pakistan. Available online:
URL: http://earthtrends.wri.org/pdf_library/cp/wat_cou_586.pdf

343
Eggertsson, T. 1990. Economic Behaviour and Institutions. Cambridge, UK, Cambridge
University Press.
ESCAP, 1992. Towards environmentally sound and sustainable development of water resources
in Asia and the Pacific. Bangkok: Economic and Social Commission for Asia and the
Pacific (United Nations)
ESCAP, 1995. Guide book to water resources, use and management in Asia and the Pacific
Vol.1 – Water resources and water use. New York: Economic and Social Commission for
Asia and the Pacific (United Nations)
Etienne, M, Monteil, C., and Legras, M., 2008. Teaching companion modelling to agronomy
students: an original way to integrate concepts in agriculture and environment. 8th
European IFSA Symposium, 6 - 10 July 2008, Clermont-Ferrand (France) 979-983.
Etienne, M. 2003. SYLVOPAST: A multiple target role-playing game to assess negotiation
processes in sylvopastoral management planning. J. of Artificial Societies and Social
Simulations. URL: http://www.jass.soc.surrey.ac.uk/6/2/s.html
Etienne, M., Du Toit, D., and Pollard, P. 2008. ARDI: a co-construction method for participatory
modelling in natural resources management. International Congress on Environmental
Modelling and Software: Integrating Sciences and Information Technology for
Environmental Assessment and Decision Making, 4th Biennial Meeting of iEMSs: 886-
873. 7-10 July 2008, Universitat Politècnica de Catalunya, Barcelona, Spain.
Etienne, M., Le Page, C., and Cohen, M., 2003. A Step-by-step Approach to Building Land
Management Scenarios Based on Multiple Viewpoints on Multi-agent System
Simulations. Journal of Artificial Societies and Social Simulation vol. 6, no. 2
<http://jasss.soc.surrey.ac.uk/6/2/2.html>
FAO, 1991. Wood Energy Sectoral Analysis. 1991. Master Plan for Forestry Development in
Bhutan. (GCP/RAS/131/NET). Field Document No. 32. FAO, Bangkok.
FAO, 1999. Forest resources of Bhutan Country report, Forest Resources Assessment
Programme Working Paper 14, FAO, Rome. URL:
http://www.fao.org/docrep/007/ad103e/AD103E00.htm#TopOfPage
Farolfi, S., Gumede, H., Rowntree, K., and Jones, N., 2008. Local water governance in South
Africa: to which extent participatory approaches facilitate multi-stakeholder negotiations?

344
The Kat River Valley experience. Proceeding of the 13th World Water Congress, 1-4
September 2008, Montpellier, France. P-15.
Ferber, J. 1999. Multi-Agent Systems: An introduction to distributed artificial intelligence.
Addison Wesley Longman, Essex, England. 509p.
FNCA, 1995. Forest and Nature Conservation Act of Bhutan. 1995. Royal Government of
Bhutan, Thimpu. pp-46.
Folke, C., Carpenter, S.R., Elmqvist, T., Gunderson, L.H., Holling, C.S., Walker, B.H.,
Bengtsson, J., Berkes, F., Colding, J., Danell, K., Falkenmark, M., Gordon, L.,
Kaspersson, R., Kautsky, N., Kinzig, A., Levin, S.A., Ma¨ ler, K.-G., Moberg, F.,
Ohlsson, L., Olsson, P., Ostrom, E., Reid, W., Rockstro¨ m, J., Savenije, S., Svedin, U.,
2002. Resilience and Sustainable Development: Building Adaptive Capacity in a World
of Transformations. Science Background Paper commissioned by the Environmental
Advisory Council of the Swedish Government in preparation for the World Summit on
Sustainable Development. Report for the Swedish Environmental Advisory Council
2002:1. Ministry of the Environment, Stockholm, www.mvb.gov.se and also ICSU Series
on Science for Sustainable Development No. 3, 2002. International Council for Science,
Paris.
Folke, C., Colding, J., Berkes, F., 2003. Synthesis: building resilience and adaptive capacity in
social–ecological systems. In: Berkes, F., Colding, J., Folke, C. (Eds.), Navigating
Social–Ecological Systems: Building Resilience for Complexity and Change. Cambridge
University Press, Cambridge, UK, pp. 352–387.
Food and Agriculture Organization (FAO), 1993b. The State of Food and Agriculture 1993.
Water policies and agriculture. III. Water policies and demand management.
Series title: FAO Agriculture Series - 26 , ISBN: 9251033609. URL:
http://www.fao.org/docrep/003/t0800e/t0800e0c.htm#b2-
Water%20allocation%20systems
Food and Agriculture Organization (FAO), 1999. Guidelines for Agrarian systems diagnosis.
Land Tenure Service, Rural development division, Sustainable development department ,
Food and agriculture organization Rome, Italy. p-70.

345
Foster, S. / D. P. Loucks (eds.) (2006): Non-renewable groundwater resources: A guidebook on
socially sustainable management for water policy makers, Paris: UNESCO, IHP-VI,
Series on Groundwater, 10
FRA, 1990. Forest Resources Assessment 1990. 1993. Forestry Paper 112, FAO, Rome.
FRA, 1998. FRA 2000 Terms and Definitions. 1998. FRA Programme, Working Paper 1,
Forestry Department, FAO, Rome.
Francis, R.A., 2009. Ecosystem prediction and management. In: N. Castree, D. Demeritt, D.
Liverman & B. Rhoads (Eds.), A companion to environmental geography pp. 421-441.
London: Blackwell.
Friis-Hansen, E., 2008. Impact Assessment of Farmer Institutional Development and
Agricultural Change: Soroti District, Uganda. In Development in Practice, Vol. 18, No. 2.
Funtowicz, S.O, and Ravetz, J.R. 1994. The worth of a songbird: ecological economics as a
post-normal science. Ecological Economics 10 (1994) 197-207.
Funtowicz, S.O., and Ravetz, J.R. 1993. Science for the Post-Normal Age. Futures.
Gillingham, M.E., 1999. Gaining access to water: formal and working rules of indigenous
irrigation management on Mount Kilimanjaro, Tanzania. Natural Resources Journal, Vol.
39. Pp 419-441
Glasersfeld, E. von, 1985. Declaration of the American Society for Cybernetics (Annual Meeting
of the ACS 1981). American Society of Cybernetics Newsletter 24: 1–4. Reprinted as:
Glasersfeld, E. von (1992) Cybernetics In: Negoita, C. V. (ed.) Cybernetics and applied
systems. Marcel Decker: New York, pp. 1–5.
Global Committee for the Water Contract (GCWC), 1998. The water manifesto-The right to life.
Lisbon, Valencia, Brussels
Global Water Partnership (GWP), 2009. Lessons from Integrated Water – Policy Brief 9.
Resources Management in Practice.
Global Water Partnership (GWP), 2010. History - Global Water Partnership: Towards a water
secure world. URL: http://www.gwp.org/en/About-GWP/History/
Global Water Partnership-Technical Advisory Committee (TAC) 2000. Integrated Water
Resources Management. TAC Background Papers No. 4. Global Water Partnership, SE -
105 25 Stockholm, Sweden

346
GNHC, 2008a. Tenth Five Year Plan [2008-2013] vol. I: Main document, GNH commission
Royal Government of Bhutan, Thimphu, pp-151.
GNHC, 2008b. Tenth Five Year Plan [2008-2013] vol. II: Program Profiles, GNH commission
Royal Government of Bhutan, Thimphu, pp-334.
Gonzalez, R. 2000. Platforms and terraces: bridging participation and GIS in joint learning for
watershed management with the Ifugaos of the Philippines. Dissertation, ITC-
Wageningen University, Wageningen, the Netherlands.
Grierson, A. J. C. and D. G. Long . 1983. Flora of Bhutan: Vol. 1. Parts 1-3. Royal Botanical
Garden, Edinburgh, Scotland.
Grimm V., Berger U., Bastiansen F., Eliassen S., Ginot V., Giske J., Goss-Custard J., Grand T.,
Heinz S.K., Huse G., Huth A., Jepsen J.U., Jorgensen C., Mooij W.M., Muller B., Pe’er
G., Piou C., Railsback S.F., Robbins A.M., Robins M.M., Rossmanith E., Ruger N.,
Stand E., Souissi S., Stillman R.A., Vabo R., Visser U., Deangelis D.L., 2006. A standard
protocol for describing individual-based and agent-based models. Ecological Modelling,
vol.198, p. 115-126.
Groot, A. and M. Maarleveld. 2000. Demistifying facilitation in participatory development.
Gatekeeper series No. 89. IIED, London. 22p.
Gunderson, L. H., and C. S. Holling, editors. 2002. Panarchy: understanding transformations in
human and natural systems. Island Press, Washington, D.C., USA.
Gunderson, L., Holling, C.S, and Light, S., (Eds.), 1995. Barriers and bridges to the renewal of
ecosystems and institutions, Columbia University Press, New York.
Gupta, P. N. 1992. Bhutan- Distribution of Landuse and Vegetation Types. 1992. Danish
International Development Assistance.
Gurung, T. R and Turkelboom, F., 2000. A framework for community based natural resource
management for Bhutan. A discussion paper. DRDS, MoA RNRRC Khangma.
Gurung, T. R., F. Bousquet, and G. Trébuil. 2006. Companion modelling, conflict resolution, and
institution building: sharing irrigation water in the Lingmuteychu Watershed, Bhutan.
Ecology and Society 11(2): 36. URL:
http://www.ecologyandsociety.org/vol11/iss2/art36/

347
Gurung, T.R., 2004. Use of multi-agent system to improve irrigation water sharing in
Lingmuteychu watershed, Bhutan. Master Thesis. Graduate school. Chiang Mai
University, Thailand.
Gyamtsho, P, 1996: Assessment of the Condition and Potential for Improvement of High
Altitude Rangelands of Bhutan. 1996. Doctoral Thesis, Swiss Federal Institute of
Technology, Zurich (unpublished).
Hahn, T., Olsson, P., Folke, C., and Johansson, K., 2006. Trust-building, Knowledge Generation
and Organizational Innovations: The Role of a Bridging Organization for Adaptive Co-
management of a Wetland Landscape around Kristianstad, Sweden. Hum Ecol (2006)
34:573–592. DOI 10.1007/s10745-006-9035-z
Hales D., Rouchier J., Edmonds B., 2003. Model-to-Model Analysis. Journal of Artificial
Societies and Social Simulation, vol.6 (4). URL: http://jasss.soc.surrey.ac.uk/6/4/5.html
Hanna, S., 1992. Lessons from Ocean Governance from History, Ecology and Economics. In B.
C. J. N., D. W. Cicinsain (eds.) Ocean Governance: A New Vision. Center for the Study
of Marine Policy, Graduate College of Marine Studies, University of Delaware, New
York.
Hardin, G., 1968. The Tragedy of the Commons. Science Vol. 162, p-1243-1248.
Harris, J. M., 2000. Basic Principles of Sustainable Development. Global development and
environment institute working paper 00-04. Tufts University, Medford MA 02155, USA.
URL: http://ase.tufts.edu/gdae
Hasrat, B.J., 1980. History of Bhutan: Land of the peaceful dragon. Education Department,
Royal Government of Bhutan, Thimphu, Bhutan. pp-241
Hatcho, N and Matsuno, Y., 2005. The participatory approach of managing water in Japan. In:
Coopey, R., Fahlbusch, H., Hatcho, N., and Jansky, L. (Eds.), 2005. A history of water
issues: Lessons to learn. United Nations University, Jingumar, Shibuya-ku, Tokyo, Japan.
Haynes, P. 2003. Managing complexity in the public services, Berkshire: Open university press.
Heinmiller, B.T., 2009. Path dependency and collective action in common pool governance.
International Journal of the Commons Vol. 3, no 1 May 2009, Publisher: Igitur, Utrecht
Publishing & Archiving Services for IASC. URL:http://www.thecommonsjournal.org pp.
131–147

348
Hemant R Ojha,H.R., Chhetri, R.B., Timsina, N.P., and Paudel, K.P.2008. Knowledge Systems
and Deliberative Interface in Natural Resource Governance: An Overiew. In: Hemant R
Ojha,H.R., Chhetri, R.B., Timsina, N.P., and Paudel, K.P. (Eds.) Knowledge Systems and
Natural Resources-Management, Policy and Institutions in Nepal. International
Development Research Centre, Published by Cambridge University Press India Pvt. Ltd.
and the International Development Research Centre. www.idrc.ca/[email protected]. ISBN (e-
book) 978-1-55250-371-3
Hemmati, M., 2002. Multi-Stakeholder Processes for Governance and Sustainability. Beyond
Deadlock and Conflict. Earthscan Ed., London.
Holling, C. S., 1973. Resilience and Stability of Ecological Systems. Annual Review of Ecology
and Systematics, Vol. 4, pp. 1-23. URL:
Holling, C. S., 1978. Adaptive environmental assessment and management, John Wiley, London.
In Janssen, M.A. (Ed.), Complexity and Ecosystem Management: The theory and
practices of Multi-agent systems. Edward Elgar Publishing Ltd., United Kingdom. pp.
248-284.
Holling, C. S., 2001. Understanding the Complexity of Economic, Ecological, and Social
Systems. Ecosystems (2001) 4: 390–405.
Holling, C. S., Lance G. Gunderson and Garry D. Peterson. 2002. Sustainability and Panarchies.
In. Gunderson, L.H and Holling, C.S (eds) Panarchy: Understanding Transformations in
Human and Natural Systems. Island Press, Washington and London, Chapter 3, 63-102.
Holling, C.S., 1986. The resilience of terrestrial ecosystems: local surprise and global change. In:
Clark, W.C. and Munn, R.E. (Eds.) Sustainable Development of the Biosphere, pp. 292-
317. Cambridge University Press, Cambridge.
Homma, Alfredo K. O. 1992. The dynamics of extraction in Amazônia: a historical perspective.
Advances in Economic Botany 9: 23-31.
Hulme, M., 2007. The application of science. The Guardian. 14 March 2007. URL:
http://www.guardian.co.uk/society/2007/mar/14/scienceofclimatechange.climatechange/
Hummelbrunner, R., 2005. Process Monitoring of Impacts: Towards a new approach to monitor
the implementation of Structural Fund Programmes. ÖAR, Vienna, Fichtegasse 2,
Austria. URL: http://oesterreich.gv.at/DocView.axd?CobId=14624

349
Imperial, M.T., 1999. Institutional Analysis and Ecosystem-Based Management: The
Institutional Analysis and Development Framework. Environmental Management Vol.
24, No. 4, pp. 449–465
International Conference on Water and the Environment (ICWE), 1992. Economic value of
water, women, poverty, resolving conflicts, natural disasters, awareness, International
Conference on Water and the Environment, 26-31 January 1992, Dublin, Ireland. URL:
http://www.un-documents.net/h2o-dub.htm
International Human Dimension Program on Global Environmental Change (IHDP), 2008.
Knowledge and Social Learning for Societal Change and Sustainability: Developing a
new Cross-Cutting Research Theme for IHDP. IHDP Secretariat, UN Campus, Hermann-
Ehlers-Str., Bonn, Germany. Pp: 11. URL:
http://www.ihdp.unu.edu/file/public/Knowledge...+Concept+Note
International Water Management Institute (IWMI), 2004. Strategic Plan 2004-2008, Sunil
Mawatha, Pelawatte, Battaramulla, Sri Lanka
Ives, JD; Shrestha, RB; Mool, PK, 2010. Formation of glacial lakes in the Hindu Kush-
Himalayas and GLOF risk assessment. Kathmandu: ICIMOD. URL:
http://books.icimod.org/uploads/tmp/icimod-
formation_of_glacial_lakes_in_the_hindu_kush-
himalayas_and_glof_risk_assessment.pdf
IWMI, 2008. Strategic Plan, 2009-2013-water for a food-secure world. International Water
Management Institute, Colombo, Sri Lanka. Pp-22. URL:
http://www.iwmi.cgiar.org/About_IWMI/PDF/Strategic_Plan_2009-2013.pdf
Jamtsho, K., 2002. Strategic Planning and Management of Water Resources in Bhutan. Paper
presented in the Sub-regional Workshop for South Asia on Application of the Guidelines
on Strategic Planning and Management of Water Resources Development. 10-13
September 2002, Colombo, Sri Lanka.
Janssen, M.A, and Ostrom, E., 2004. Governing social-ecological systems. In: Handbook of
Computational Economics II: Agent-Based Computational Economics, Edited by
Kenneth L. Judd and Leigh Tesfatsion.

350
Janssen, Marco A. & Anderies, John M. & Walker, Brian H., 2004. Robust strategies for
managing rangelands with multiple stable attractors, Journal of Environmental
Economics and Management, Elsevier, vol. 47(1), pages 140-162.
Jiggens, J. and Rolling, N., 2002. Adaptive management: Potential and limitations for ecological
governance of forests in a context of normative pluriformity. In J.A.E. Olglethorpe (Ed.),
Adaptive Management: From theory to practice (pp. 93-104). Gland, Switzerland.
Jodha, N.S., 1985a. “Population Growth and the Decline of Common Property Resources in
Rajasthan”. Population and Development Review, Vol.11 (2), pp: 247-64.
Jodha, N.S., 1985b. “Market Force and Erosion of Common Property Resources in the
Agricultural Markets in the Semi-Arid Tropics”. In Proceedings of the International
Workshop at ICRISAT Centre, India.
Jodha, N.S., 1986. “Common Property Resources and the Rural Poor in Dry Regions of India”.
Economic and Political Weekly. Vol .21 (27), pp: 169-181.
Johnson, K. L., T. D. Nadik and others , 1987. Village Voices in Rural Development and Energy
Planning: Participatory Action Research in Nepal, Bangladesh and Bhutan. 1987. East
West Center, and Planning Commission, Bhutan.
Johnson, M.S., 2009. Public Participation and Perceptions of Watershed Modeling. Society and
Natural Resources, 22:79–87
Johnson-Laird, P. N. 1983. Mental Models: Towards a Cognitive Science of Language,
Inference, and Consciousness. Cambridge: Cambridge University Press; Cambridge, MA:
Harvard University Press.
Jones, N.A., Perez, P., Measham, T.G., Kelly, G.J., D’Aquino, P., Daniell, K., Dray, A., and
Ferrand, N., 2008. Evaluating participatory modeling: Developing a framework for cross-
case analysis. Socio-Economics and the environmental discussion CSIRO Working
Paper Series 2008-11. 41p.
Ker Rault, Ph. A. and Jeffrey, P. J. 2008. Deconstructing public participation in the Water
Framework Directive: implementation and compliance with the letter or with the spirit of
the law? Water and Environment Journal. Vol 22 Issue 4. p 241–249.
Kerkhoff, E. and Sharma, E., 2006. Debating shifting cultivation in the eastern Himalayas:
Farmers’ innovations as lessons for policy. ICIMOD, Kathmandu, Nepal.

351
Kjellén, M. and Mcgranahan, G., 1997. Comprehensive assessment of the freshwater resources
of the world. Urban water – Towards Health and sustainability. Stockholm Environment
Institute, Box 2142, S-103 14 Stockholm, Sweden
Kolfschoten, G., Frantzeskaki, N., Haan, A., and Verbraeck, A. 2008. Collaborative modeling
Lab to increase learning engagement. Innovation, Good Practice and Research in
Engineering Education, The Higher Education Academy Engineering Subject Centre and
the UK Centre for Materials Education. P-8
Kuensel Corporation Limited (KCL), 2009. Water feud that just won’t quit - Two villages, two
dzongkhags and one watershed add up to a big headache. URL: Error! Hyperlink
reference not
valid.http://www.kuenselonline.com/modules.php?name=News&file=article&sid=13134
Kuensel, 2008. Thirsting for the Water Act-The traditional water sharing system is found feudal
and unfair. Vol. 23 No. 57 July 26, 2008.
Kuensel, 2009. One snow leopard a year lost to poaching. Kuensel Corporation Limited,
Thimphu, Bhutan. URL:
http://www.kuenselonline.com/modules.php?name=News&file=article&sid=12729
Land Act of Bhutan, 2007. National Land Commission, Royal Government of Bhutan, Thimphu,
pp-86.
Lankford, B. and Hepworth, N. 2010. The cathedral and the bazaar: Monocentric and polycentric
river basin management. Water Alternatives 3(1): 82-101
Leach, M. and Fairhead, J. (2001) ‘Plural perspectives and institutional dynamics: challenges for
local forest management’, Int. J. Agricultural Resources, Governance and Ecology, Vol.
1, Nos. 3/4, pp. 223-242.
Leach, M., Bloom, G., Ely, A., Nightingale, P., Scoones, I., Shah, E. and Smith, A. (2007)
Understanding Governance: pathways to sustainability, STEPS Working Paper 2,
Brighton: STEPS Centre.
Lebel, L. 2004. The politics of scale in environmental assessment. USER Working Paper. WP
2004-07. Unit for Social and Environmental Research, Chiang Mai University, Chiang
Mai,
Lebel, L., Anderies J. M., Campbell B., Folke C., Hatfield-Dodds S., Hughes T. P.. and Wilson J.
2006. Governance and the capacity to manage resilience in regional social-ecological

352
systems. Ecology and Society 11(1): 19. URL:
http://www.ecologyandsociety.org/vol11/iss1/art19/
Lempert, R.J., 2002. A new decision sciences for complex systems. Proceeding of the National
Academy of Science. PNAS vol. 99 (3). Pp: 7309–7313. URL:
www.pnas.org_cgi_doi_10.1073_pnas.082081699
Levaque, L., 2005. Disaster management analysis in Bhutan, UN Disaster Management Team,
UNDP, Thimphu, Bhutan.
Liao, Y.,Gao,Z., Bao, Z.,Huang, Q., Feng, G., Xu, D., Cai, J., Han, H., and Wu, W., 2008.
China’s Water Pricing Reforms for Irrigation: Effectiveness and Impact. Comprehensive
Assessment of Water Management in Agriculture, Discussion Paper 6. International
Water Management Institute. P O Box 2075, Colombo, Sri Lanka.
Litmus Consult. 2002. Traditional water rights study. Integrated water resources management
project, Ministry of Agriculture, Thimphu, Bhutan. 15p.
Lorie, M.A and Cardwel, H.E, 2006. Collaborative Modeling for Water Management, Institute
for Water Resources, U.S. Army Corps of Engineers. URL:
http://www.swhydro.arizona.edu/archive/V5_N4/feature6.pdf
Lusthaus, C. Adrien M. H., Anderson G., Carden F. and Montalvan G. 2002. Organizational
assessment: a framework for improving performance. Washington, D.C. and Ottawa,
Canada: Inter-American Development Bank and IDRC.
Marjanizadeh, S., Qureshi, A.S., Turral, H., and Talebzadeh, P., 2009. From Mesopotamia to the
Third Millennium: The Historical Trajectory of Water Development and Use in the
Karkheh River Basin, Iran. IWMI Working Paper 135, International Water Management
Institute, Sri Lanka.
McDougall, C., and Braun, A., 2002. Navigating Complexity, Diversity and Dynamism:
Reflections on Research for Natural Resource Management. In: Pound,B., Snapp,S.,
McDougall, C., and Braun, A. (Eds.), 2002. Managing Natural Resources for Sustainable
Livelihoods, IRDC, Canada. URL: http://www.idrc.ca/en/ev-43432-201-1-
DO_TOPIC.html
Mehra, G. N. 1974. Bhutan: Land of Peaceful Dragon. 1974. Vikas Publishing House, New
Delhi.

353
Merrey, J.D. 2009. African models for transnational river basin organisations in Africa: An
unexplored dimension. Water Alternatives 2(2): 183G204
Messerchmidt D., K. J. Temphel, J. Davidson, and W. D. Incol. 2001. Bamboo in the high forest
of eastern Bhutan. Kathmandu (Nepal): International Center for Integrated Mountain
Development. 30p.
Michel Etienne, M., Monteil, C., and Legras, M., 2008. Teaching companion modelling to
agronomy students: an original way to integrate concepts in agriculture and environment
8th European IFSA Symposium, 6 - 10 July 2008, Clermont-Ferrand (France) 979-983
Ministry of Agriculture (MoA), 1997. Atlas of Bhutan, 1:250,000, Land Cover and Area
Statistics of 20 Dzongkhags; Land Use Planning Project, Bhutan. Thimphu, Bhutan: Land
Use Planning Section, Policy and Planning Division in the Ministry of Agriculture.
Ministry of Agriculture (MoA), 2008. National Forest Policy, Ministry of Agriculture, Royal
Government of Bhutan, Thimphu, Bhutan.
Ministry of Agriculture (MoA), 2009. Bhutan-Biodiversity Action Plan, National Biodiversity
Centre, Ministry of Agriculture, Royal Government of Bhutan, Thimphu.
Ministry of Agriculture (MoA). 2002. Community-based natural resource management in
Bhutan. Department of Research and Development Services, Ministry of Agriculture,
Royal Government of Bhutan, Thimphu, Bhutan. 150p.
Ministry of Agriculture (MoA). 2002. RNR Census 2000. Volume 1. Ministry of Agriculture,
Royal Government of Bhutan, Thimphu, Bhutan. 121p.
Ministry of Agriculture and Forests (MoAF), 2009. RNR Census 2009. Ministry of Agriculture
and Forests, Royal Government of Bhutan, Thimphu. Pp-127.
Ministry of Health (MoH), 2009. Joint Health Sector Review 2009. Ministry of Health,
Thimphu, Bhutan. Pp-33
Moench, M., Caspari, E., and Dixit, A., 1999. Rethinking the mosaic: Investigations into Local
Water Management. Nepal Water Conservation Foundation, Kathmandu, and the Institute
for Social and Environmental Transition, Boulder, Colorado, U.S.A. pp-315.
Moktan, K., and Nicoll S., 2008. Governance and Sustainable Development: The Asian
Development Bank Perspective. No.3. ADB Sustainable Development Working Paper
Series. ADB, The Philippine,. P-15.

354
Molle, F. 2008. Nirvana concepts, narratives and policy models: Insight from the water sector.
Water Alternatives 1(1): 131-156
Mongar Dzongkhag, 2006. Kengkhar gewog, Ninth plan (2002-2007), Mongar Dzongkhag,
Royal Government of Bhutan, Mongar. PP-10.
Mool , P.K., Wangda, D., Bajracharya, S.R., Kunzang, K., Gurung, D.R., and Joshi, S.P., 2001.
Inventory of glaciers, glacial lakes and glacial lake outburst floods monitoring and early
warning systems in the Hindu Kush-Himalayan Region, Bhutan. In cooperation with
United Nations Environment Programme Regional Resource Centre — Asia and the
Pacific (UNEP/RRC-AP), International Centre for Integrated Mountain Development,
Mountain Environment and Natural Resources’ Information Systems, Kathmandu, Nepal.
Moss, S., 2008. Alternative Approaches to the Empirical Validation of Agent-Based Models.
Journal of Artificial Societies and Social Simulation Vol. 11, No. 15. URL:
MPFD, 1991. Master Plan for Forestry Development, Main Report. 1991. Ministry of
Agriculture, Department of Forestry, Royal Government of Bhutan.
MTIF, 1969. The Bhutan Forest Act, Ministry of Trade, Industries and Forests, Royal
Government of Bhutan, Thimphu.
Naivinit W., Trébuil G., Le Page C. 2010. An agent-based simulator co-designed with farmers
for sharing knowledge about land & water use and labour migrations in rainfed lowland
rice. Communication orale au XIème Congrès de l’European Society of Agronomy
(ESA) Agro 2010, 29 August - 3 September 2010, Le corum, Montpellier, France.
Session S4 “Innovation and Decision Support in Agriculture: Which Roles and
Partnership for Research?”. 991-992
Naivinit, W., Le Page C., Trébuil. G., and Gajaseni. N,. 2010. Participatory agent-based
modeling and simulation of rice production and labor migrations in Northeast Thailand.
Environmental Modelling and Software 25(11): 1345-1358.
Namgyel, P and Chophel, T., 2001. Social forestry rules: taking the bulls by the horns -
Analysing the gap between forest legislation and implementation. Thimphu p.1-8.
Narayan, D. 1996. What is participatory research? In: Toward participatory research, World
Bank Technical Paper 307. Washington D.C, World Bank. pp. 17-30.
National Environment Commission (NEC). 1998. The middle path: national environment
strategy for Bhutan. Thimphu (Bhutan): NEC. 95p.

355
National Statistical Bureau (NSB), 2004. Poverty Analysis Report (PAR) 2004. Planning
Commission, Thimphu, Bhutan.
National Statistical Bureau (NSB), 2007. Poverty analysis report, National Statistical Bureau,
Thimphu
National Statistical Bureau (NSB), 2008. Socio-economic and demographic indicators 2005,
National Statistical Bureau, Royal Government of Bhutan, Thimphu, Bhutan.
National Statistical Bureau (NSB), 2009. Statistical yearbook of Bhutan 2009. National
Statistical Bureau, Thimphu, pp-184.
NEC, 2000. Environmental Assessment Act. National Environmental Commission, Royal
Government of Bhutan, Thimphu, Bhutan.
NEC, 2007. National Environmental Protection Act. National Environmental Commission,
Royal Government of Bhutan, Thimphu, Bhutan.
Niamir, M., 1990. Community Forestry: Herders' Decision-Making in Natural Resources
Management in Arid and Semi-arid Africa (CF Note 4). Food and Agriculture
Organization of The United Nations, Rome
North West Rafting Company, 2011. Rafting & Cultural Tour of Bhutan Named 2011 Outside
Trip of the Year. URL: www.nwrafting.com/riversrafting-in-bhutan.
Norwegian Water Resources and Energy Directorate, 2009. Advanced Hydropower
Development Program. Drammensveien 211, Postboks 5091 Majorstua, 0301 Oslo,
Norway. URL: http://www.nve.no/en/About-NVE/International-work/Institutional-
cooperation/Bhutan-Phase-II/
Office of the Census Commissioner (OCC), 2006. Results of population and housing census of
Bhutan 2005, Royal Government of Bhutan, Thimphu. ISBN 99936-688-0-X.
Ollagnon, H., 1991. Vers une gestion patrimoniale de la protection qualité biologique des forêts,
Forest, trees and people Newsletter, 3. Pp 2-35.
Olsson, P., Gunderson, L.H., Carpenter, S.R., Ryan, P., Lebel, L., Folke, C. and Holling, C.S.,
2006 ‘Shooting the Rapids: Navigating Transitions to Adaptive Governance of Social-
ecological Systems’, Ecology and Society 11.1: art.18
Ostrom, E and Ahn, T.K. (eds.), 2003. Foundation of Social Capital. Cheltenham, UK: Edward
Elgar.

356
Ostrom, E. 1992. The rudiments of a theory of the origin, survival, and performance of common
property institutions, In: Daniel W. Bromley (ed.), Making the Commons Work: Theory,
Practice, and Policy, 1st ed. Institute for Contemporary Studies, San Francisco, USA. pp.
293-318.
Ostrom, E. 2007. Collective Action and Local Development Processes. Sociologica, 3/2007 -
Copyright © 2007 by Società editrice il Mulino, Bologna. P-31.
Ostrom, E. 2009. A polycentric approach for coping with climate change. Policy Research
Working Paper No. 5095. Background Paper to the 2010 World Development Report.
Washington, DC, USA: The World Bank, Development Economics, Office of the Senior
Vice President and Chief Economist.
Ostrom, E., 1990.Governing the Commons: The Evolution of Institutions for Collective Action.
Cambridge University Press.
Ostrom, E., 1992. Crafting Institutions for Self-Governing Irrigation Systems. San Francisco,
CA: Institute of Contemporary Studies.
Ostrom, E., 1999. Coping with Tragedies of the Commons. Annual Review of Political Science,
Vol. 2.
Ostrom, E., 2002. Type of good and collective action. Workshop in Political Theory and . Policy
Analysis, Center for the Study of Institutions, Population, and Environmental Change.
Indiana University. P-47
Ostrom, E., 2007. Sustainable social-ecological systems: An impossibility? Paper presented at
the 2007 Annual Meetings of the American Association for the Advancement of Science,
“Science and Technology for Sustainable Well-Being,” 15–19 February in San Francisco,
USA. URL: http://oac.esmtg.pt/OLD_SITE/Docs/159rnprb324cm3qnpp28.pdf
Ostrom, E., 2008. Design principles of robust property-rights institutions: What have we
learned? Presented at the conference on “Land Policies and Property Rights,” Lincoln
Institute of Land Policy, Cambridge, MA, June 2–3, 2008. Pp – 28. URL:
http://dlc.dlib.indiana.edu/dlc/bitstream/handle/10535/3785/W08-
19_Ostrom_DLC.pdf?sequence=1
Ostrom, E., Gardner, R., abd Walker, J., 1994. Rules, games, and common-pool resources. The
university of Michigan press. Pp: 369.

357
Ostrom, E., Schroeder, L., and Wynne, S., 1993. Institutional incentives and sustainable
development: Infrastructure policies in perspective, Wesview Press, Boulder.
Pahl-Wostl, C., Tàbara, D., Bouwen, R., Craps, M., Dewulf, A., Mostert, E., Ridder, D., and
Taillieu, T. 2008. The importance of social learning and culture for sustainable water
management. Ecological economics 64, pp-484-495.
Parks, C. D., & Hulbert, L. G., 1995. High and low trusters’ responses to fear in a payoff matrix.
Journal of Conflict Resolution, 39 (4), 134–151.
Parks, C. D., Henager, R. F., & Scamahorn, S. D., 1996. Trust and reactions to messages ofintent
in social dilemmas. Journal of Conflict Resolution, 40 (1), 718–730.
Peters, P.E., 2004. Inequality and Social Conflict Over Land in Africa. Journal of Agrarian
Change, Vol. 3 No. 4. July 2004. Pp- 269-314.
Planning Commission Secretariat (PCS), 1999. Bhutan 2020: A vision for peace, prosperity and
happiness, Thimphu, Bhutan. Pp-101.
Planning Commission Secretariat (PCS), 2007. Rapid impact assessment of rural development.
Planning Commission Secretariat, Royal Government of Bhutan, Thimphu. Pp-122
Planning Commission Secretariat (PCS). 2002. 9th Five-Year Plan Document (2002-2007). PCS,
Royal Government of Bhutan, Thimphu, Bhutan. 130p.
Plumptre, T, and Graham, J. 2000. Governance in the New Millennium: Challenges for Canada.
Institute on Governance, 122 Clarence Street, Ottawa, Canada K1N 5P6. pp-15.
Policy and Planning Division (PPD), 2008. Compendium of RNR Statistics, Policy and Planning
Division, Ministry of Agriculture, Thimphu, Bhutan. Pp-52.
Policy and Planning Division (PPD), 2009. RNR Census 2009, Policy and Planning Division,
Ministry of Agriculture and Forests, Thimphu, Bhutan.
Pommaret, F., 1998. Bhutan. Passport Book, 4255 W, Touhy Avenue, USA.
Porter, P. W. and Sheppard, E.S., 1998. “Views form the Periphery: Encountering
Development,” in Porter and Sheppard, A World of Difference: Society, Nature, and
Development. New York: Guilford Press.
Pretty J N. 1995. Participatory learning for sustainable agriculture. World Development 23 (8),
1247-1263
Pretty, J. 2003. Social capital and the collective management of resources. Science. 302: 1912-
1914.

358
Pretty, J., Guijt, I., Thompson, J., and I. Scoones. 1995. A trainer’s guide for participatory
learning and action, IIED, London.
Probst, K. and J. Hagmann. 2003. Understanding participatory research in the context of natural
resource management - paradigms, approaches and typologies. AgREN er No. 130. Odi –
Agricultural Research and Extension Network. pp. 16.
Promburom , P. and Bousquet, F., 2008. Role-playing games and institutional engagement for
modelling land and water management in a northern Thailand watershed. Paper presented
at "Second International Forum on Water and Food, 10-14 November 2008". Addis
Ababa, Ethiopia.
Promburom P., and Bousquet F. 2008. Role-playing games and institutional engagement for
modeling land and water management in a northern Thailand watershed. In Proceedings
of the Second International Forum on Water and Food (IFWF2), CPWF-CRIAR,
November 16-18, in Addis Ababa, Ethiopia.
Pruitt, D. G. and Kimmel, M. J., 1977. Twenty years of experimental gaming: critique, synthesis,
and suggestions for the future. Annual Review of Psychology, 28, 363–392.
Purnomo, H., Yasmi, Y., Prabhu, R., Hakim, S., Jafar, A., and Suprihatin, 2003. Collaborative
modelling to support forest management: qualitative systems analysis at Lumut
mountain, Indonesia. Small-scale Forest Economics, Management and Policy, 2(2): 259-
275.
Putnam, R. D., 1993. Making Democracy Work: Civic Traditions in Modern Italy, Princeton
University Press, Princeton, NJ.
Putnam, R., 1994. Making Democracy Work: Civic Tradition In Modern Italy, Princeton,
Princeton University Press, p. 177.
Putnam, R., 1995. Tuning In, Tuning Out: The Strange Disappearance of Social Capital in
America. Political Science and Politics XXVIII, 664-83.
Rammel, C., Stag, S., and Wilfing, H. 2007. Managing complex adaptive systems — A co-
evolutionary perspective on natural resource management. Ecological economics, 63, 9-
21.
Renewable Natural Resources Research Center (RNRRC). 1997. Characteristics of
Lingmuteychu, problem diagnosis and major research themes. In: Community-based

359
natural resources management (CBNRM) research in Lingmuteychu watershed. Bajo
(Bhutan): RNRRC. 21p.
RGOB, 1969. The Bhutan Forest Act. Ministry of Trade, Industries and Forests, Royal
Government of Bhutan, Thimphu. Pp-10
RGOB, 2008. The Constitution of Kingdom of Bhutan, Thimphu, Bhutan.
Riegler, A., 2005. Editorial. The Constructivist Challenge. Constructivist Foundations, Vol. 1,
No. 1, Vrije Universiteit Brussel,
Rittel, H.W.J. and M.M. Webber, 1973, ‘Dilemmas in a general theory of planning’, Policy
Sciences, vol. 4, pp.155-169.
RNRRC, 2008. National field crops research strategy and program. Tenth five year plan (2008
2013). Renewable Natural Resources Research Centre, Bajo, Wangduephodrang, Bhutan.
PP-44.
Röling, N. 1996, Towards an interactive agricultural science, Eurpoean Journal of Agricultural
Education and Extension, 2(4). pp-35-48.
Röling, N. G., 1994. Communication support for sustainable natural resource management. IDS
Bulletin 25: 125–133.
Royal Government of Bhutan (RGoB), 2003. Bhutan water policy, Bhutan Water Partnership,
Royal Society for Protection of Nature, Thimphu, Bhutan.
Royal Society for Protection of Nature (RSPN), 2006. Buddhism and the Environment. Royal
Society for Protection of Nature, Thimphu, Bhutan.
Runge, F.R. 1992. Common Property and Collective Action in Economic Development, pp- 17-
39. In: Daniel W. Bromley (ed.) Making the Commons Work: Theory, Practice, and
Policy, 1st ed. Institute for Contemporary Studies, San Francisco, USA. pp. 17-39.
Sacklokham, S. and Baudran, E., 2005. Using agrarian systems analysis to understand
agriculture, NAFRI, Laos. Pp-222-229.
Sakthivadivel, R., Gomathinayagam, P., and Shah, T., 2004. Rejuvenating Irrigation Tanks
through Local Institutions Economic and Political Weekly, pp- 3521-3526. URL:
http://www.iwmi.cgiar.org/iwmi-tata/files/pdf/EPW/EPW11.pdf
Scheffer, M., and S. R. Carpenter. 2003. Catastrophic regime shifts in ecosystems: linking theory
to observation. Trends in Ecology and Evolution 18:648-656.

360
Schlager, E. and Ostrom, E. 1992. Property-Rights Regimes and Natural Resources: A
Conceptual Analysis. Land Economics 68(3): 249-62.
Schouten, M., Van Der Heide, M., and Heijman, W. 2009. Resilience of social-ecological
systems in European rural areas: Theory and prospects. Paper prepared for presentation at
the 113th EAAE Seminar “The role of knowledge, innovation and human capital in
multifunctional agriculture and territorial rural development”, Belgrade, Republic of
Serbia, December 9-11, 2009. p-18.
Schusler, T.M., Decker, D.J., Pfeffer, M.J., 2003. Social learning for collaborative natural
resource management. Society and Natural Resources 15, 309–326.
Sierhuis, M. and Selvin, A.M., 1996. Towards a Framework for Collaborative Modeling and
Simulation. Workshop on Strategies for Collaborative Modeling & Simulation, NYNEX
Science & Technology, Inc., 400 Westchester Avenue, White Plains, NY, USA. URL:
http://www.agentisolutions.com/documentation/papers/SierhuisSelvin.PDF
Simonovic, S.P., 2009. Managing Water Resources: Methods and Tools for a Systems Approach,
UNESCO and Earthscan, Paris and London. Davies, E. G. R., and Simonovic, S. P.
(2006). The Importance of Social-economic-climatic Feedbacks for Water Resources
Management, XXIII Conference of the Danubian Countries on the Hydrological
Forecasting and Hydrological Bases of Water Management, Belgrade,
Singh, N., _______. , Water management traditions in rural India: Valuing the unvalued.
Department of Land and Water Resources Engineering, Royal Institute of Technology
(KTH), Teknikringen 76, SE-100 44 Stockholm, Sweden
Sobels, J., Curtis, A., Lockie, S., 2001. The role of Landcare group networks in rural Australia:
exploring the contribution of social capital. Journal of Rural Studies 17, 265–276.
Souchère, V., Millair, L., Echeverria, J., Bousquet, F., Le Pageb, C., and Etienne, M., 2008.
Companion modelling approach for participatory land management: the case of erosive
runoff in Upper Normandy. 8th European IFSA Symposium, 6 -10 July 2008, Clermont-
Ferrand, France. pp: 137-139
Springer-Heinze, A., Hartwich, F., Henderson, J.S., Horton, D. and Minde, I. (2003) Impact
pathway analysis: an approach to strengthening the impact orientation of agricultural
research. Agricultural Systems 78(2), 267–385.

361
Steins, N.A and Edwards, V.M, 1999. Platforms for collective action in multiple-use common-
pool resources. Agriculture and Human Values 16: 241–255
Svetina, A.C. and Prodan, I., 2008. How Internal and External Sources of Knowledge Contribute
to Firms’ Innovation Performance. Managing Global Transitions 6 (3): 277–299
Task Force on INRM. 2001. Integrated Management for Sustainable Agriculture, Forestry and
Fisheries: A brief report on the INRM workshop held at CIAT, Cali, Colombia, 28-31
August.
Taylor, P., Deak, A., Pettit, J., and Vogel, I. 2006. Learning for Social Change: Exploring
concepts, methods and practice. Institute of Development Studies 2006, University of
Sussex, Brighton, UK. Pp: 43
Taylor, P., Deak, A., Pettit, J., and Vogel, I. 2006. Learning for Social Change: Exploring
concepts, methods and practice. Institute of Development Studies. University of Sussex
Brighton BN1 9RE, UK. pp-48
The Constitution of the Kingdom of Bhutan, 2005. Royal Government of Bhutan, Thimphu,
Bhutan.
Thinlay, J.Y. 1999. Values and development: Gross National Happiness. Gross National
Thinlay, U., 2004. Know the plants of Bhutan. Vol. 1 (2nd Edition), Thimphu, Bhutan, pp-130.
Tognetti, S.S, 1999. Science in a double-bind: Gregory Bateson and the origins of post-normal
science, Futures 31 (1999) 689–703.
Trashi Yangtse Dzongkhag Administration (TDA), 2008. Causes, assessment & remedial
measures for Bumdelling Flood, Kholong River Training Project, Trashi Yangtse, Bhutan
Trébuil G., 2008. Companion modelling for resilient and adaptive social agro-ecological systems
in Asia. In: of the Fourth National Agricultural Systems Conference, 27-28 may 2008,
Chiang Mai, Thailand.
Trébuil, G and Dufumier, M, 1993. Regional agrarian systems and sustainability of agricultural
production systems in Thailand. Journal of Asian Farming Systems Association. Vol 1.
Pp 557-568
Trebuil, G., 1989. Research on the transformations and differentiation of regional agrarian
systems: A macro analysis complementary to farming systems research and development.
Proceeding of the 6th Thailand National Farming Systems Seminar, 27-30 March 1989,
Khon Kaen, Thailand.

362
Trébuil, G., Baron, C., Bousquet, F., and Shinawatra-Ekasingh, B. 2002. Collective Creation of
Artificial Worlds Helps the Governance of Concrete Natural Resources Management
Problems. International Symposium on Sustaining Food Security and Managing Natural
Resources in Southeast Asia: Challenges for the 21st Century. Chiang Mai, Thailand.
Tshering, S. and Tamang, B., 2005. Hydropower - Key to sustainable, socio-economic
development of Bhutan. Paper presented in United Nations Symposium on Hydropower
and Sustainable Development to be held from 27 to 29 October 2004 in Beijing, China.
UN, 1992. Earth Summit - United Nations Conference on Environment and Development
(UNCED), Rio de Janeiro, Brazil, 3-14 June 1992. UNCED secretariat, [online] URL:
http://www.un.org/geninfo/bp/enviro.html
UNDP, 2002. Handbook on Monitoring and Evaluating for Results. New York: UNDP
Evaluation Office.
UNEP (United Nations Environment Programme). 1999. Global Environmental Outlook 2000.
London, Earthscan Publications.
United Nations Environment Programme (UNEP), 1972. Declaration of the United Nations
Conference on the Human Environment. The United Nations Conference on the Human
Environment, having met at Stockholm from 5 to 16 June 1972.
URL:http://www.unep.org/Documents.Multilingual/Default.asp?DocumentID=97&Articl
eID=1503
Uphoff, N. 1986. Local institutional development: An analytical source book with cases.
Kumarian Press, USA. pp. 20-21.
Uphoff, N., Ramamurthy and R. Steiner. 1991. Managing irrigation: Analyzing and improving
the performance of bureaucracies. New Delhi, Sage Publications.
Ura, K., 2004, The Bhutanese development story. URL:
http://www.bhutanstudies.org.bt/pubFiles/mono-1en-bt-dev-stry.pdf
Ura, K., 2008. Explanation of GNH Index. Centre for Bhutan Studies. URL:
http://www.grossnationalhappiness.com/gnhIndex/intruductionGNH.aspx
URL: http://www.whobhutan.org/EN/Section4_26.htm
Urry, J., 2005. Complexity. Special issue of Theory, Culture and Society 22. Pp-1-270.

363
van Walsum, P. E. V., Siderius, 2007. Waterwise – a planning tool for adaptive land and water
management. Proceedings of the European Symposium of Spatial Planning Approaches
towards Sustainable River Basin Management, Rovaniemi, pp 76-77.
van Zeijl-Rozema, A., Cörvers, R., and Kemp, R., 2007. Governance for sustainable
development: a framework. Paper for Amsterdam Conference on “Earth System
Governance: theories and strategies for sustainability”, 24-26 May 2007. International
Centre for Integrated assessment and Sustainable development. P-19.
Vernooy, R., 2005. Monitoring and Evaluating Participatory Research and Development: Some
Key Elements. In: Gonsalves, J., T. Becker, A. Braun, D. Campilan, H. De Chavez, E.
Fajber, M. Kapiriri, J. Rivaca-Caminade and R. Vernooy (eds). 2005. Participatory
Research and Development for Sustainable Agriculture and Natural Resource
Management: A Sourcebook. Volume 1: Understanding Participatory Research and
Development. International Potato Center-Users' Perspectives with Agricultural Research
and Development, Laguna, Philippines and International Development Research Centre,
Ottawa, Canada.
Voinov, A. and Bousquet, F. 2010. Modelling with stakeholders. Environmental Modelling &
Software 25. pp-1268-1281.
von Glasersfeld, E., 1984. An introduction to radical constructivism. In P. Watzlawick (Ed.),
The invented reality. New York: Norton. (originally published in P. Watzlawick (Ed.),
Die erfundene Wirklichkeit. München: Piper, 1981)
von Glasersfeld, E.,1984. An Exposition of Constructivism: Why Some Like it Radical In: R. B.
Davis, C. A. Maher, & N. Noddings (Eds.), Monographs of the Journal for Research in
Mathematics Education, #4. Reston, VA: National Council of Teachers of Mathematics,
19–29, 1990.
Wade, R., 1987. The Management of Common Property Resources: Collective Action as an
Alternative to Privatisation or State Regulation. Cambridge Journal of Economics, Vol
(11) pp: 95-106.
Wade, R., 1988. Village Republics: Economic Conditions for Collective Action in South India.
Cambridge University Press.

364
Walker, B. H., C. S. Holling, S. Carpenter, and A. Kinzig. 2004. Resilience, adaptability, and
transformability in social-ecological systems. Ecology and Society 9(2):5 [online] URL:
http://www.ecologyandsociety.org/vol9/iss2/art5/
Walker, B., S. Carpenter, J. Anderies, N. Abel, G. S. Cumming, M. Janssen, L. Lebel, J.
Norberg, G. D. Peterson, and R. Pritchard. 2002. Resilience management in social-
ecological systems: a working hypothesis for a participatory approach. Conservation
Ecology 6(1): 14. [online] URL: http://www.consecol.org/vol6/iss1/art14/
Waltner-Toews, D., Kay, J.J., Neudoerffer, C., and Gitau, T., 2003. Perspective changes
everything: managing ecosystems from the inside out. Frontiers in Ecology and the
Environment Vol. 1, No. 1. pp. 23-30.
Wang, S.W., 2008. Understanding ecological interactions among Carnivores, ungulates and
farmers in Bhutan's Jigme Singye Wangchuck National Park. A Dissertation presented to
the Faculty of the Graduate School of Cornell University In Partial Fulfillment of the
Requirements for the Degree of Doctor of Philosophy, p-137.
Wangchuk, S. 1998. Local Perceptions and Indigenous Institutions as Forms of Social
Performance for Sustainable Forest Management in Bhutan. 1998, Doctoral Thesis,
Department Wald-und Holzforschung, Swiss Federal Institute of Technology, Zurich.
Wangchuk, S., 2005. Indigenous natural resource management institutions of Bhutan, DSB
Publication, Thimphu, Bhutan.
Warburton, H. and Martin, A., 1999. Local people’s knowledge in natural resources research.
Socio-economic Methodologies for Natural Resources Research. Chatham, UK: Natural
Resources Institute. Pp-15.
Water Act, 2010. Royal Government of Bhutan, Thimphu
Webler, T., 1999. The craft and theory of public participation: a dialectical process: Journal of
Risk Research 2(1): 55-71.
Wenger, E. 1998. Communities of practice: learning, meaning, and identity. Cambridge
Williams, S.E. and Weale J.C., 2006. Water governance in the Mekong region: the need for more
informed policy-making. Water Policy Briefing Series No. 22. International Water
Management Institute, Colombo, Sri Lanka
Wilson, K. and Morren, G.E.B., 1990. Systems approaches for improvement in agriculture and
resource management. Macmillian Publishing Company, New York. Pp-361.

365
World Bank, 2004. Monitoring and Evaluation : Some Tools, Methods & Approaches.
Washington D.C., The World Bank. URL: http://www.agence-nationale-
recherche.fr/documents/aap/resultatADD05.pdf
World Health Organization (WHO), 2006. Overview of external support to the water and
sanitation sectors, WHO Bhutan, Thimphu.
World Water Council (WWC), 2000. World Water Vision: Making Water Everybody’s
Business. Earthscan Publications Ltd, London
World Wide Fund for Nature (WWF). 1998. Living Planet Report 1998: Overconsumption is
Driving the Rapid Decline of the World’s Natural Environments. Gland, Switzerland.
Worrapimphong, K., Gajaseni, N., LePage, C., and Bousquet, F., 2010. A companion modelling
approach applied to fishery management. Environmental Modelling & Software 25. Pp:
1334-1344.
WRI, 1994. World Resources 1994-1995: a guide to globe environment. New York: World
Resources Institute.
Young, O.R., 2002. The Institutional Dimensions of Environmental Change: Fit, Interplay, and
Scale. MIT Press, Cambridge, MA.
Zorrilla, P., Carmona G., De la Hera Á., Varela-Ortega C., Martínez-Santos P., Bromley J. and
Jorgen Henriksen H., 2009. Evaluation of bayesian networks as a tool for participatory
water resources management: application to the upper guadiana basin in spain. Ecology
and Society 15(3): 12. [online] URL: http://www.ecologyandsociety.org/vol15/iss3/art12/
Zurcher, D., and Choden, K., 2004. Bhutan: land of spirituality and modernization role of water
in daily life, New Dawn Press group, Berkshire, UK.

366
List of Figures
Figure 1.1. Altitudinal zones and the four major river basins in Bhutan. ........................................ 3
Figure 1.2: Perennial river (Mochu) flowing through a deep gorge in Gasa District, west-central
Bhutan. ............................................................................................................................. 4
Figure 1.3: Terraced rice fields in Punakha-Wangdi valley. ........................................................... 7
Figure 1.4: Ploughing a dryland farm with Mithun bulls in Eastern Bhutan. ................................. 8
Figure 1.5. Location of human settlement. ...................................................................................... 9
Figure 2.1. Map of Bhutan with international boundaries and twenty districts. ........................... 14
Figure 2.2. A typical Bhutanese house. ......................................................................................... 19
Figure 2.3. Average annual revenue generated by selling different resources from forest in
Bhutan, (2003-2007). ..................................................................................................... 20
Figure 2.4. Ferns and wild mushroom sold in local markets. ........................................................ 21
Figure 2.5. Weaving, cask making, and curving wooden mask are important artistry in Kengkhar.
........................................................................................................................................ 21
Figure 2.6. Main river systems and in Bhutan. .............................................................................. 23
Figure 2.7. Schematic representation of the profile of two major river systems – Punatshang chu
and Dangme chu – in Bhutan. ........................................................................................ 23
Figure 2.8. Wetland area and corresponding number of irrigation schemes in each districts of
Bhutan. ........................................................................................................................... 24
Figure 2.9. Percentage coverage of safe drinking water by districts in Bhutan. ........................... 25
Figure 2.10. Induced innovation in natural resources management (adapted from Kerr, 1998). .. 26
Figure 2.11: Land degradation in Trashigang district in the eastern region of Bhutan. ................ 29
Figure 2.12. Relationship of Gross National Happiness (GNH) to sustainable development and
Social Ecological Systems (SES) concepts. ................................................................... 44
Figure 2.13. Proportion of revenue generated by sales of natural resources (July 2003 to June
2008). ............................................................................................................................. 45
Figure 2.14. Fresh scar from the construction of farm road. ......................................................... 46
Figure 3.1: Key interactions in integrated farming systems in Bhutan. ........................................ 50
Figure 3.2. Leaf litter in the sokshing, farmer bringing home a load of leaf litter, and heaps of
farmyard manure in paddy fields in Lingmuteychu, Punakha district. .......................... 50

367
Figure 3.3. Distribution of land holding sizes in Bhutan, 2008. .................................................... 52
Figure 3.4. Typical rice-based farm and ladies threshing paddy and drying the straw in Gasa. .... 53
Figure 3.5. Maize and potato-based farms in upland environment in eastern region of the country.
........................................................................................................................................ 54
Figure 3.6. Mithun bulls kept for ploughing. ................................................................................. 55
Figure 3.7. Yak a principal source of livelihood for high altitude people. .................................... 56
Figure 3.8: Distribution of the main agro-ecological zones of Bhutan. ......................................... 58
Figure 3.9. Yak herders from Lunana in their winter camp. .......................................................... 60
Figure 3.10. Buckwheat field in Bumthang valley and buckwheat pancake a delicacy in high
altitude community. ........................................................................................................ 60
Figure 3.11. Punakha-Wangdue valley with Punatshangchu river in foreground and rice fields in
the background. ............................................................................................................... 61
Figure 3.12. Typical upland maize field in the eastern region. ...................................................... 62
Figure 3.13. Cowpea grown of rice bunds and areca nut in the background a common feature in
the southern foothills of Bhutan. .................................................................................... 62
Figure 3.14: Trend in cropped area and production during 1999 - 2009 in the main agro-
ecological zones of Bhutan. ............................................................................................ 63
Figure 3.15. Agrarian systems diagnosis in Lingmuteychu and Kengkhar (based on FAO, 1999).
........................................................................................................................................ 67
Figure 3.16. The agrarian system: a complex open system made of two main sub-systems (FAO,
1999). .............................................................................................................................. 68
Figure 3.17. Zoning of water users in (A) Lingmuteychu and (B) Kengkhar. ............................... 69
Figure 3.18. Location of the two research sites in western and eastern Bhutan. ........................... 70
Figure 3.19. North-South longitudinal transects line of Lingmuteychu sub-watershed in west-
central Bhutan. December, 2009. ................................................................................... 72
Figure 3.20. Transect line of Kengkhar in Mongar district, eastern Bhutan, 2009. ....................... 73
Figure 3.21. Components of the rural socio-ecological system and their interactions at
Lingmuteychu in west-central Bhutan. ........................................................................... 74
Figure 3.22. Schematic representation of landscape profile at Lingmuteychu site, west-central
Bhutan. ............................................................................................................................ 75
Figure 3.23. Rice and puffed rice as important commodity of trade from Lingmuteychu. ........... 76

368
Figure 3.24. Schematic representation of the landscape profile of Kengkhar, Eastern Bhutan. ... 77
Figure 3.25. Mandarin orange as important cash crop of Kengkhar. ............................................ 78
Figure 3.26. Components of the rural social-ecological system and their interactions at Kengkhar
site in eastern Bhutan. .................................................................................................... 78
Figure 3.27. Natural resources flow and interactions in Lingmuteychu and Kengkhar farming
households. ..................................................................................................................... 81
Figure 3.28. Lady (in red shirt) from Lingmuteychu offering tea, while lady from Kengkhar (in
blue Tego) offers ara (locally brewed alcohol) to guest. ............................................... 84
Figure 3.29. Distribution of land holding size in Lingmuteychu and Kengkhar. .......................... 85
Figure 3.30. Crops grown in Lingmuteychu and their productivity. ............................................. 86
Figure 3.31. Cropping patterns of seven villages in Lingmuteychu sub-watershed. ..................... 87
Figure 3.32. Crops grown in Kengkhar and their productivity...................................................... 89
Figure 3.33. Cropping patterns at Kengkhar. ................................................................................ 90
Figure 3.34. Ploughing the field with power tiller in Lingmuteychu and use of Mithun bulls in
Kengkhar. ....................................................................................................................... 91
Figure 3.35. Farming household resource in-flow and out-flow in Lingmuteychu and Kengkhar.
........................................................................................................................................ 93
Figure 3.36. Constraints to agricultural development in Bhutan, 2009. ........................................ 94
Figure 3.37. Problem definition in (A) Lingmuteychu and (B) Kengkhar. ................................... 95
Figure 3.38. Opportunities for agricultural development in (A) Lingmuteychu and (B) Kengkhar.
........................................................................................................................................ 95
Figure 3.39: Mithun bulls used for ploughing sloping land in Bhutan. ....................................... 104
Figure 3.40. Present farmer typology in Lingmuteychu, 2009. ................................................... 113
Figure 3.41. Present farmer typology in Kengkhar. 2009. .......................................................... 115
Figure 3.42. Comparison of chronological change over of agrarian systems in the two sites. ... 121
Figure 3.43. Importance of resource issues and corresponding relevance of different stakeholders.
...................................................................................................................................... 123
Figure 4.1. Prayer wheel driven by free flowing water – a common sight in rural Bhutan. ....... 126
Figure 4.2. Hot spring in Gasa, hot stone bath in Punakha, and clean spring water in Bumthang.
...................................................................................................................................... 126
Figure 4.3. Water Rafting in Paro chu in Bhutan. ....................................................................... 127

369
Figure 4.4. Meandering river in Trashigang district, Eastern Bhutan. ......................................... 128
Figure 4.5. Major landslide affected area in Lumang in Trashigang district. .............................. 129
Figure 4.6. Village settlement in Lungtenzampa and rice terraces damaged in Udzorong by a
flash flood on Radi, Trashigang district. ...................................................................... 129
Figure 4.7. Distribution of glaciers and glacial lakes in Bhutan. ................................................. 131
Figure 4.8. Nine principal watersheds in Bhutan. ........................................................................ 132
Figure 4.9. Bhutan nine principal watersheds spread and their secondary and tertiary watersheds
from West to East. ........................................................................................................ 133
Figure 4.10. Average annual rainfall in nine watersheds of Bhutan (2004-07). .......................... 134
Figure 4.11. Paddy fields damaged by flash flood in Bumdeling, Eastern Bhutan in 2004. ....... 134
Figure 4.12. Schematic representation of Sunkosh watershed with agro-ecological features,
settlements and infrastructures, Pho chu (Punatshang chu). ......................................... 136
Figure 4.13. Profiles of four major river systems in Bhutan. ....................................................... 137
Figure 4.14. Four major river systems, number of corresponding glacial lakes and their sizes. . 139
Figure 4.15. Proportion of population with access to potable water, Bhutan, 1977-2009. .......... 141
Figure 4.16. Proportion of households accessing drinking water from different sources by
districts in Bhutan, 2005. .............................................................................................. 142
Figure 4.17. Wetland areas and total length of irrigation canals in different districts of Bhutan,
2010. ............................................................................................................................. 144
Figure 4.18. Functional irrigation canals and their command areas against the constructed canals,
Bhutan, 2010. ................................................................................................................ 145
Figure 4.19. Construction of irrigation canals by different agencies in Bhutan. ......................... 146
Figure 4.20. Electricity generation, domestic consumption, exports and their contribution to GDP
in Bhutan, 2000-2008. .................................................................................................. 149
Figure 4.21. Share of GDP by different sectors in Bhutanese economy, 2004 and 2008. ........... 150
Figure 5.1. Successful adaptive approaches for ecosystem management. (Adapted from Hahn et
al., 2006) ....................................................................................................................... 163
Figure 5.2. Three Es of Integrated Water Resource Management (Adapted from Ker Rault and
Jeffrey, 2008). ............................................................................................................... 170
Figure 6.1. Multi-agents system general organization and principles (adapted from Ferber, 1999).
...................................................................................................................................... 178

370
Figure 6.2. Schematic representation of a ComMod process on catchment management in Mae
Salaep, Chiang Rai, Thailand (Adapted from Barnaud et al., 2007). .......................... 185
Figure 6.3. Monitoring and evaluation framework of a ComMod process (adapted from Jones et
al., 2008). ..................................................................................................................... 195
Figure 7.1. Conceptual framework of social change (Adapted from Taylor et al., 2006). ......... 199
Figure 7.2. Conceptual framework of governance (Adapted from van Zeijl-Rozema et al., 2007).
...................................................................................................................................... 201
Figure 7.3. Conceptual framework of the research. ..................................................................... 203
Figure 7.4. Preliminary conceptualization of the Companion Modelling process in Lingmuteychu.
...................................................................................................................................... 204
Figure 7.5. Preliminary conceptualization of the Companion Modelling process in Kengkhar. 204
Figure 7.6. Game board used in the 7 Village role-playing game at Lingmuteychu in 2005. ..... 206
Figure 7.7. Materials used in the Omchu role-playing game in Kengkhar 2008. ....................... 207
Figure 7.8. Glimpses of role-playing game session in Lingmuteychu. ....................................... 208
Figure 7.9. Role-playing game in Kengkhar. .............................................................................. 209
Figure 7.10. Interview of individual player and plenary discussion on RPG outputs in
Lingmuteychu. ............................................................................................................. 210
Figure 7.11. Interview of individual player and plenary in Kengkhar. ....................................... 210
Figure 7.12. The gaming and simulation process in Lingmuteychu, 2005. ................................. 216
Figure 7.13. The gaming and simulation process in Kengkhar, 2008. ........................................ 217
Figure 7.14. Dissemination of result of gaming and simulation by way of slide presentation in
Lingmuteychu and Kengkhar. ...................................................................................... 218
Figure 7.15. Concept for tank network, game board, village game, and agent-based model in
Lingmuteychu and Kengkhar. ...................................................................................... 219
Figure 8.1. Diversity of stakeholders in the Lingmuteychu. ....................................................... 222
Figure 8.2. Diversity of stakeholders and their relative role in water issues in Lingmuteychu. . 223
Figure 8.3. Representation of water in Lingmuteychu social-ecological system. ....................... 225
Figure 8.4. Chronology of the ComMod process in Lingmuteychu. ........................................... 228
Figure 8.5. Chronograms of ComMod processes implemented at Lingmuteychu watershed to
facilitate collective management of resources. ............................................................ 232

371
Figure 8.6: UML class diagram showing the attributes and methods associated to each entity in
Lingmuteychu 7 villages model. ................................................................................... 235
Figure 8.7: UML sequence diagram of the 7 villages model in Lingmuteychu. .......................... 236
Figure 8.8. Activity diagram presenting the decision making process to allocate water in the
paddy field in the 7 villages model of Lingmuteychu. ................................................. 236
Figure 8.9: Activity diagram displaying the decision making process to share water among three
categories of farmers in Lingmuteychu 7 villages model. ............................................ 237
Figure 8.10: CORMAS interface of the seven village agent-based model used in Lingmuteychu.
...................................................................................................................................... 241
Figure 8.11. Co-designing of shared representation of the water management problem in the
companion modelling process implemented in Lingmuteychu. ................................... 243
Figure 8.12. Water balance from the simulation of twelve scenarios with the 7village role-
playing game in Lingmuteychu. ................................................................................... 245
Figure 8.13. Inequality in water shares across twelve simulated scenarios in Lingmuteychu. .... 246
Figure 8.14. Number of water units shared in different scenarios in Lingmuteychu. .................. 247
Figure 8.15. Proportion of players fulfilling their water requirement in different scenarios in
Lingmuteychu. .............................................................................................................. 248
Figure 8.16. New learning by players (proportion of respondent) from RPG in Lingmuteychu
(n=21). .......................................................................................................................... 249
Figure 8.17. Average cash and water demand in open access individual mode simulated with the
traditional management regime of the 7villages agent-based model in Lingmuteychu.
...................................................................................................................................... 255
Figure 8.18. Average cash generated from 20 scenarios. ............................................................. 256
Figure 8.19. Level of satisfactions in two reward rules. .............................................................. 257
Figure 8.20. Water stress and exit flow influenced by reward scenarios. .................................... 258
Figure 8.21. Average income under the influence of trust and perception rule. .......................... 259
Figure 8.22. Average water stress as influenced by different scenarios of trust and perception
rule. ............................................................................................................................... 260
Figure 8.23. Level of satisfaction in meeting water demands in different scenarios. .................. 261
Figure 8.24. Level of trust of players in different scenarios of trust and perception rule. ........... 261
Figure 8.25. Average number of punishment and cost to punish across 80 scenarios. ................ 262

372
Figure 8.26. Impact domains and impacts of the ComMod process in immediate and long term
timeframes in Lingmuteychu. ...................................................................................... 265
Figure 8.27. Internal and external factors that enable or impede the ComMod process. ............ 267
Figure 9.1. Diversity of stakeholders and their relative role in water issues in Kengkhar. ......... 269
Figure 9.2. Representation of drinking water in social-ecological system of Kengkhar. ............ 271
Figure 9.3. Settlement in steep slope in Kengkhar. ..................................................................... 271
Figure 9.4. Chronology and phases of the ComMod process in Kengkhar. ................................ 274
Figure 9.5. Chronogram of the ComMod process implemented at Kengkhar to create water
collection and distribution systems. ............................................................................. 277
Figure 9.6. UML class diagram showing the attributes and methods associated to each entity of
the Omchu model used in Kengkhar. ........................................................................... 279
Figure 9.7. Network of households and hamlets in accessing water in Kengkhar village. ......... 280
Figure 9.8. Sequence diagram of Omchu ABM. ......................................................................... 281
Figure 9.9. Decision to allocate water to plant vegetables. ......................................................... 282
Figure 9.10. Process to collect water. .......................................................................................... 282
Figure 9.11: Decision to use water. ............................................................................................. 282
Figure 9.12: Cards representing three rainfall patterns (Low, Medium and High rainfall) in the
Omchu model used in Kengkhar. ................................................................................. 285
Figure 9.13. CORMAS interface of the Omchu model used in Kengkhar. ................................. 287
Figure 9.14. Co-design of a shared representation in the companion modelling process on water
collection in Kengkhar. ................................................................................................ 289
Figure 9.15. Water balance in Kengkhar RPG. ........................................................................... 290
Figure 9.16. Inequality in water shares across 12 scenarios in Kengkhar. .................................. 291
Figure 9.17. Number of time players access different water tanks in different scenarios in
Kengkhar. ..................................................................................................................... 292
Figure 9.18. Proportion of players fulfilling their water requirements in different scenarios of the
gaming sessions in Kengkhar. ...................................................................................... 293
Figure 9.19. New learning by players (proportion of respondent) from the gaming sessions held
in Kengkhar (n=18). .................................................................................................... 294
Figure 9.20. Average water uses by 12 agents over 20 simulations. ........................................... 299
Figure 9.21. Average satisfaction level of 18 farmers in 10 simulations. ................................... 300

373
Figure 9.22. Water balance, equality in water distribution and satisfaction in Kengkhar ABM. 301
Figure 9.23. Water consumption and balance. ............................................................................. 302
Figure 9.24. Average water need and consumption of 18 farmers. ............................................. 303
Figure 9.25. Instance when agents did not have any water at all. ................................................ 304
Figure 9.26. Average number of water scarcity situation for different uses. ............................... 304
Figure 9.27. Satisfaction level based on sharing rules in different scenario. ............................... 305
Figure 9.28. Initial and final volumes of water (in units) in the three tanks across twenty five
scenarios. ...................................................................................................................... 306
Figure 9.29. Impact domains and impacts of ComMod approach in immediate and long term
timeframe in Kengkhar. ................................................................................................ 308
Figure 9.30. Internal and external factors that enable or impede the ComMod process in
Kengkhar. ...................................................................................................................... 310
Figure 10.1. Social self-organization triggered by ComMod ....................................................... 324

374
List of Tables
Table 2.1. Land cover in Bhutan. .................................................................................................. 15
Table 2.2. Distribution of forest area by type of forest in four regions of Bhutan, 2004 (hectares).
....................................................................................................................................................... 18
Table 2.3. Quantity of forest products supplied from 2003 to 2007. ............................................ 19
Table 2.4. Introduction of institutions related to natural resource management in Bhutan. ......... 34
Table 2.5. Natural resources and associated institutions at different levels in Bhutan. ................ 35
Table 2.6. Traditional institutions related to natural resource management in Bhutan. ............... 36
Table 2.7. Successive policies related to natural resources and their effect on environment and
livelihood in Bhutan. ..................................................................................................................... 38
Table 2.8. Institutions related to natural resources and their effects on environment and
livelihood. ..................................................................................................................................... 41
Table 3.1. Agriculture land use categories, acreage and number of holders, 2009. ..................... 51
Table 3.2: Crop area and production in Bhutan, 2008. ................................................................. 53
Table 3.3: Fruit production and households with orchards in Bhutan, 2008. ............................... 54
Table 3.4: Livestock population and proportion of households raising them, 2008. .................... 56
Table 3.5. Livestock products produced and sold in Bhutan, 2000-2008. .................................... 57
Table 3.6: Main agro-ecological zones of Bhutan. ....................................................................... 57
Table 3.7: Major crops, livestock and NTFP in different agro-ecological zones in Bhutan......... 59
Table 3.8. Dominant farming systems, representative communities, major products and their
linkages in the main agro-ecological zones of Bhutan.................................................................. 64
Table 3.9. Development objectives of the farm sector in Bhutan, 1961-2013. ............................. 65
Table 3.10. Status of natural resources in Lingmuteychu. ............................................................ 79
Table 3.11. Status of natural resources in Kengkhar. ................................................................... 80
Table 3.12. Natural resource management regimes in Lingmuteychu and Kengkhar. ................. 83
Table 3.13. Landuse and households at Lingmuteychu and Kengkhar study sites, 2008.
(Hectares). ..................................................................................................................................... 84
Table 3.14. Livestock types and their population in Lingmuteychu and Kengkhar in 2008. ....... 90
Table 3.15. Evolution of socio-economic conditions and related agro-ecological transformations
in Lingmutechu watershed, Punakha District, West-central Bhutan. ........................................... 98

375
Table 3.16. Evolution of socio-economic conditions and related agro-ecological transformations
in Kengkhar, Mongar District, East Bhutan. ............................................................................... 100
Table 3.17. Evolution of irrigation systems in Lingmuteychu, 1950-2009. ................................ 108
Table 3.18. Evolution of drinking water system in Kengkhar. .................................................... 110
Table 3.19 Sequence of agrarian systems in Lingmuteychu sub-watershed, West-central Bhutan.
..................................................................................................................................................... 117
Table 3.20 Sequence of agrarian systems in Kengkhar, East Bhutan. ........................................ 120
Table 4.1. Top ten commodities exported from Bhutan, 2008. ................................................... 130
Table 4.2. Known glacial lake outburst flood events in Bhutan. ................................................. 131
Table 4.3. Main river systems of Bhutan. .................................................................................... 135
Table 4.4. Annual discharge of water from river systems. .......................................................... 138
Table 4.5. Water users associations (WUA) in Bhutan, 2010. .................................................... 146
Table 4.6. Micro and Mini hydropower projects in operation across Bhutan, 2005. .................. 147
Table 4.7: Hydropower Projects in operation in Bhutan as of 2010. .......................................... 148
Table 4.8. Planned hydropower projects in Bhutan. .................................................................... 151
Table 4.9. Act and policies related to water in Bhutan. ............................................................... 152
Table 5.1. Examples of water management systems in different countries. ................................ 168
Table 6.1. Some generic principles of good participatory modelling. ........................................ 177
Table 6.2. Complementary features between agent-based models and role-playing games. ...... 179
Table 6.3. The 12 Steps of a companion modelling process. ...................................................... 191
Table 7.1. Past case studies relying on the ComMod approach to study water management
issues. ........................................................................................................................................... 198
Table 7.2. The seven elements of the Overview, Design Concepts, Details protocol (Source:
Grimm et al., 2006). .................................................................................................................... 201
Table 7.3. Role-game features used in Lingmuteychu and Kengkhar. ........................................ 206
Table 7.4. Proceedings of role-playing game (RPG) sessions in Lingmuteychu and Kengkhar. 211
Table 7.5. Detailed description of the role-playing game features in Lingmuteychu and
Kengkhar. ..................................................................................................................................... 213
Table 8.1. The problem of water from Social-ecological systems perspectives in Lingmuteychu.
..................................................................................................................................................... 226
Table 8.2. Features of the 7 village role-playing game in Lingmuteychu. .................................. 229

376
Table 8.3. Model entities in Lingmuteychu. .............................................................................. 230
Table 8.4. Sequence of twelve steps of the ComMod process in Lingmuteychu. ...................... 231
Table 8.5. Variables of the 7 Village model used in Lingmuteychu........................................... 234
Table 8.6. Mode of communication and scenarios used in the 7 village model in Lingmuteychu.
..................................................................................................................................................... 238
Table 8.7. Rainfall patterns and corresponding water shares (units) for each village in the 7
village model used in Lingmuteychu. ......................................................................................... 239
Table 8.8. Simplified representation of the mental maps or perceptions of the situation by three
different categories of stakeholders in Lingmuteychu. ............................................................... 242
Table 8.9. Scenarios derived from the 7 village gaming sessions executed in Lingmuteychu. .. 244
Table 8.10. Collective actions decided in Lingmuteychu sub-watershed at the end of the
ComMod process. ....................................................................................................................... 250
Table 8.11. Number of plots per farmer and their configuration in each village in the traditional
regime version of the 7 villages agent-based model in Lingmuteychu. ...................................... 252
Table 8.12. Scenarios use for the reward for environmental services version of the 7 village
agent-based model in Lingmuteychu. ......................................................................................... 253
Table 8.13. Scenarios used with the 7 village trust and reciprocity version of the 7 village agent-
based model in Lingmuteychu. ................................................................................................... 254
Table 8.14. Direct and indirect effect of the ComMod process in Lingmuteychu...................... 263
Table 9.1. Site characterization and specificity of the water issue in Kengkhar. ....................... 272
Table 9.2. Components of the social-ecological systems in Kengkhar....................................... 273
Table 9.3. Features of the role-playing game used in Kengkhar. .............................................. 274
Table 9.4. Sequence of twelve steps of the ComMod process in Kengkhar. .............................. 275
Table 9.5. Variables of the Omchu model used in Kengkhar. ................................................... 278
Table 9.6. Mode of communication in the scenarios used in the Kengkhar Omchu model........ 283
Table 9.7: Details of farmers and their location in three hamlets of the Kengkhar model. ........ 284
Table 9.8. Rainfall pattern and corresponding amount of water (Litres) collected in different
tanks in the Omchu model used in Kengkhar.............................................................................. 285
Table 9.9. Simplified representations of mental map or perceptions of the situation by different
stakeholders in Kengkhar. ........................................................................................................... 288
Table 9.10. Scenarios from the Kengkhar role-playing game. ................................................... 290

377
Table 9.11. Collective actions decided at the end of the ComMod process in Kengkhar. .......... 296
Table 9.12. Scenarios of the traditional regime for the Kengkhar agent-based model. .............. 297
Table 9.13. Scenarios for tank networking to be simulated with the Omchu model used in
Kengkhar. ..................................................................................................................................... 298
Table 9.14. Direct and indirect effects of the ComMod process in Kengkhar. ........................... 307

378
APPENDICES

379
Appendix 1. Non-Timber Forest Products widely used in Bhutan.
Plant species used as food from forest
Scientific name Local name Parts used Quantity available
Distribution
Dioscorea spp. Wild yam (Eng) Tuber Abundant Found in southern Bhutan Calamus spp. Cane (Eng)
Shoot Abundant Found mostly in cool, moist sub-tropical
forests Girardiana palmata Nettle Plant (Eng) Inflorescence Abundant Tropical and sub-tropical regions Adhatoda vasica Bashaka (Dz)
Flower Abundant Tropical and sub-tropical regions
Elatostema spp. Damroo (Dz)
Stem and leaves
Abundant Cool, moist sub-tropical regions
Ulva spp. Algae (Eng) Whole plant Abundant Found on boulders in rivers Bambusa spp. So (Sh)
Bans (N) Shoot Abundant Tropical regions
Ferns Nakey (Dz) New shoots Abundant In every district of Bhutan Bidens spp. Zumphirobu (Sh) Leaves Abundant Sub-tropical regions Orchid spp. Ola-chhoto (Dz) Flower Rare Sub-tropical regions Note: (B) = Bumthap, (Dz) =Dzongkha, (Eng) = English, (M) = Medical, (N) = Nepali, (Sh) = Sharchop-kha.
Spices in Bhutanese Forests
Botanical name Local name Parts used Quantity available
Distribution
Cinnamomum tamala Cuinnamomum zylanicum
Tezpata (N)
Leaves Abundant All southern districts
Piper nigrum Pipla (N) Fruit Moderate Sarpang, Samtse and Samdrup Jongkhar Piper nigrum Round Pipla Fruit Abundant All southern parts of Bhutan Myrica negi (small) Tsutsusey (Sh) Fruit Abundant Temperate zones Myrica spp. (big) Omsha tsutsusey
(Sh) Fruit Abundant Temperate zones
Rubus eliptica Sergong (Sh) Ainselu (N)
Fruit Abundant Temperate zones
Muraya koenigii Curry patta (Eng/N)
Leaves Abundant Tropical regions
Amaranthes spp. Zimtsi (Dz) Naam (Sh)
Whole plant
Abundant Temperate regions
Zanthoxylum alatum Thingne (Dz) Fruit Abundant Sub-tropical regions Z. budrunga Bokey Timbur
(N) Fruit Fairly abundant Sub-tropical regions
Note: (Dz) =Dzongkha, (Eng) = English, (M) Medical, = (N) = Nepali, (Sh) = Sharchop-kha.

380
Fruits in Bhutanese Forests
Scientific name Local name Parts used
Quantity available
Distribution
Juglans regia Tashing (Dz)
Fruit Abundant Wangdue, Punakha, Paro, Haa, Chhukha, Mongar, Lhuntshi, Zhemgang, Trashigang, Trashiyangtse and Pemagatshel
Diplocknama butareace
Yika (Dz)
Fruit Abundant Rare; Punakha, Wangdue, Mongar, Trashigang, Dagana, Samtse, Sarpang and Samdrup Jongkha
Cornus capitata Poitsi (Dz) Fruit Abundant Punakha, Wangdue, Trashigang and Mongar Cornus macrophylla
Poitsi (Dz) Fruit Abundant Punakha, Wangdue, Trashigang and Mongar
Elagnus latifolia Dangbur (Sh) Fruit Abundant Found only in Montane Zone Docynia indica Mel (N) Fruit Abundant Punakha, Wangdue, Trashigang, Zhemgang, Trongsa,
Trashiyangtse, Tshirang and Pemagatshel Aegle marmelos Bell (N) Fruit Moderate Cultivated in southern Bhutan Zizyphus spp. Khankarisey
(Sh) Baer (N)
Fruit Abundant Samtse, Sarpang, Samdrup Jongkha, Trashigang and Trashiyangtse
Phyllanthes emblica
Chhorengsey (Dz) Amla (N)
Fruit Abundant Trashigang, Mongar, Wangdue, Punakha and Trashiyangtse
Eugenea spp. Nasi or Nyasey (Dz)
Fruit Fairly abundant
Punakha, Wangdue, Trongsa, Trashigang, Mongar and Lhuntshi
Fragaria spp. Sagang (Sh) Fruit Abundant Found in all pine forests Morus spp. Kimbu (N)
Tshadey (Dz) Fruit Rare Found scattered throughout all districts.
Randia spp. Nertingaey (Sh) Fruit Abundant Found in sub-tropical regions Eleocarpus varuna
Badrasey (N)
Fruit Abundant Sub-tropical regions
Rhus hookeri Tarsishing (Sh) Fruit Abundant Temperate to sub-tropical alpine climates Calamus spp. Tikir (Sh) Fruit Abundant Temperate areas - Thakal (N) Fruit Rare Temperate areas Solanum spp. Khalanji (Sh) Fruit Rare Tropical and sub tropical regions Rhus chinensis Chakashig (Kh) Fruit Abundant Tropical and sub tropical regions Machilus edulis Guli (Sh) Fruit Abundant Moist, sub-tropical regions Spondius spp. Lapsi (N) Fruit Abundant Sub-tropical regions Spondius spp. Amarsey (Sh) Fruit Abundant Sub-tropical regions Artocarpus spp. Lathar (N) Fruit Rare Sub-tropical regions Symplocos paniculata
Pangtshi (Dz) Fruit Abundant Sub-tropical regions
Phyllanthus emblica
Churoo (Dz)
Fruit Abundant Sub-tropical regions
Note: (B) = Bumthap, (Dz) =Dzongkha, (Eng) = English, (M) = Medical, (N) = Nepali, (Sh) = Sharchop-kha.

381
Forest Mushrooms in Bhutan
Scientific name Commercial name
Local name Quantity available
Distribution
Auricularia auricula Jew's ear Jilli namchu Common Temperate regions Amanita caesarea Caesar's Conngsey Fairly common Clavaria spp. Bjichu kangro Common Clitocybe odora Green milk Ga shamu Fairly common Coprinus atramentatius Ink cap Ruru shamu Fairly common Clitocybe aggregate Ga shamu Fairly common Cantherellus cibarius Chanterelles Sisishamu Fairly common Temperate regions Clavaria botrytis Purple coral Jichu kangru Common Copricus comatus Ink cap Ruru shamu Common Fistulina hepatica Beefsteak Chimp shamu Fairly common Lycoperdon perlatum Puff ball Daybongthe Common Lentinus edodes Oak Soke shamu Common Peziza aurantia Kangchu shamu Fairly common Polyporus sulphureus Taa shamu Common Polyporus frondosus Myetake Taa shamu Common Pleurotus cornucopiae Oyster Nakey Common Pleurotus eryngii Oyster Nakey Common Pleurotus ostreatus Oyster Nakey Common Pleurotus sajor caju Oyster Nakey Common Russula cyanoxantha Green Damsha Fairly common Russula lepida Maley sha Fairly common Tremella mesentrica Golden jelly Tsili sha Common Tricholoma matsutake Matsutake Sangay shamu Common Genekha, Ura, Isuna and
Betekha (2.5 tons). Exported Morchella esculenta Morel Gep shamu Rare Temperate regions Schizophyllum commune Split gill Cinchiring (Sh) Common Volvariella volvacea Straw Sorbang Bamu Rare Lingmethang; tropical to
temperate regions Source: Project Mushroom, Simtokha.
Natural Vegetable Dyes in Bhutan
Botanical name Local name Parts used Colour of dye obtained
Distribution
Mallotus phillipenensis
Sinduri (N) Powder of fruit
Red Found in subtropical areas
Acacia catechu Khair (N) Heart-wood Dark brown Kalikhola, Samtse and Sarpang Symplocos ramosissima
Domzim (Dz)
Leaves Yellow Available in every district
Symplocos paniculata
Pangtsi (Dz) Zimshing (Sh) Leaves Yellow Found only in patches in western Bhutan
Strobilanthes flaccidifolius
Ram/Tsangja (Dz) Yangshaba (Sh)
Leaves Blue Mongar, Trashigang, Pemagatshel, and Trashiyangtse
Lacifer lacca Jatsho (Dz) Tshos (Sh) Encrustation
Red Mongar, Trashigang, Pemagatshel and Trashiyangtse
Choenomeles lagenaria
Khomang (Sh) Mentsim (Dz)
Fruit Mordant Southern Bhutan, Mongar, Bumthang and Trashiyangtse
Rubia manjit Choid (Dz) Lanyi roo (Sh) Whole plants
Red Trashigang, Mongar, Pemagatshel, Punakha Wangdue, Thimphu and Paro
Rhus chinensis Bhakimlo (N) Fruit Mordant Tsirang, Sarpang, Manas and Samtse Holicia nilagirica Potorshing (Sh) Potala(Dz) Wood Yellow Found in warm, broad-leaved forests Indigofera spp. Indigo (Eng) Leaves Indigo Thimphu, Trashigang, Paro and Mongar Rheum emodi Chumtsa (M) Yellow Alpine Barberis aristata Korshuen (M) Alpine

382
Gums in Bhutanese Forests
Botanical name Local name Parts used Quantity available
Distribution
Ficus elastica Brongshig (Sh) Exude Rare Found in tropical forest Bombax ceiba Simal (N)
Exude Abundant Samtse District. It is also found scattered
throughout southern Bhutan. Acacia catechu Khair (N)
Toeja (Dz) Jasenshing (Sh)
Heart-wood Abundant Bukatading, Kalapani and Pugli in Samtse District. It is also found scattered throughout southern Bhutan.
Bauhinia retusa Semla gum Exude Abundant Found in Samtse, Tsirang, Sarpang and Samdrup Jongkha
Note: (Dz) =Dzongkha, (Eng) = English, (M) Medical, = (N) = Nepali, (Sh) = Sharchop-kha.
Waxes in Bhutanese Forests
Scientific name
Local name Parts used
Quantity available Distribution
Apis dorsata Mouri (N) Wagoma (Sh) Beehive - Found in Tsirang, Genekha and Jimina. Also found in other districts in limited numbers.
Apis apis Mouri (N) Mizuma (Sh) Beehive Moderate Apis sp. Putka (N) Yingburing(Sh) Beehive Moderate Topical and sub-tropical regions. Note: (Dz) =Dzongkha, (Eng) = English, (M) Medical, = (N) = Nepali, (Sh) = Sharchop-kha.
Forest Plants Used As Incense in Bhutan
Botanical name Local name Parts used Quantity available
Distribution
Juniperus spp. Shup (Dz) Dhup (N) Shugposhing (Sh)
Whole plant Abundant Gasa, Thimphu, Trongsa, Bumthang, Wangdue, Trashigang, Haa, Paro, Lhuntse, Trashiyangtse and Mongar
Nardostachys jatamansi
Pang Poi (Dz) Roots In pockets Alpine region
Rhododendron, anthopogon
Baloo (Dz/Sh) Sunnpatte (N)
Whole plant Abundant Alpine region
Cupressus spp. Tsendenshing (Sh) Dhupi (N) Tsendey (Dz)
Whole plant Rare; found only in patches
Kukuchhu, Lunana, Dangchhu, and Nobding; found planted in patches
Aquilaria agallocha
Agaroo (Dz) Agur (Sh)
Infected heartwood
Extremely rare Manas and Phipsoo Game Sanctuaries and Samdrup Jongkha
Cannarium sikkimensis
Poikar (Dz) Poskar (Sh)
Exude Extremely rare Sarpey in Samtse, Samdrup Jongkha and Sarpang
Shorea robusta Sal dhup (N) Exude Abundant Southern low land Cinnamomum cecidodaphne
Phagpanengshing (Sh) Malagiri (N)
Wood Abundant Punakha, Mongar and Samdrup Jongkha
Terminalia bellerica
Baroo (Dz/Sh) Barra (N)
Fruit Abundant Abundant in tropical forests
Note: (Dz) =Dzongkha, (Eng) = English, (M) Medical, = (N) = Nepali, (Sh) = Sharchop-kha.

383
Appendix 2. Quantity and value (US$) of forest products supplied, 2004 to 2008.
Commodity Unit Average of five years (2004 to 2008) Volume Value (US$)
Tree (standing tree) Numbers 21563 44661 Shinglap (Plank) Numbers 2374 2475 Cham (Baton) Numbers 51337 38225 Tsims Numbers 31482 9209 Dangchung Numbers 24328 24473 Poles Numbers 42188 4834 Post Numbers 35915 4901 Firewood Cubic Meter 343255 25573 Log forms Cubic Feet 1040203 260536 Sawn timber Cubic Feet 16550 1095 Bamboo Numbers 484506 4171 Stones Truck Load 50169 34781 Sand Truck Load 38306 66186 Stone chips Truck Load 9537 7400 Top Soil Truck Load 378 302 Billet Numbers 8347 170 Resin Kilogram 25578 1739 Cordycep Kilogram 194 451010 Daphne Kilogram 6776 92 Lemon grass Kilogram 3380 254 Leaf mould Truck Load 253 142 Cane Bundle 384 36

384
Appendix 3. Quantity of minerals produced from mines in Bhutan during 2002-2007.
Minerals Unit 2002 2003 2004 2005 2006 2007 Dolomite Tons 388,056 367,402 452,336 388,711 388,711 578,552 Gypsum Tons 105,658 122,829 131,236 150,585 150,585 189,198 Slate Tons 6,100 57,970 126,789 2,908 2,908 105,261 Coal Tons 88,567 66,324 29,631 85,279 85,279 12,071 Quartzite Tons 47,464 52,058 42,599 52,694 52,694 64,049 Talc Tons 23,118 23,101 39,797 42,791 42,791 62,015 Stone Tons 319,702 316,068 252,207 146,767 146,767 388,721 Granite Sq. ft 5,559 11,579 2,152 9,436 9,436 14,430 Lime stone Sq. ft 506,268 551,525 560,807 536,030 536,030 543,964 Marble Sq. ft 3,207 6,228 3,385 4,005 4,005 78,107
Source: National Statistical Bureau, 2007 and 2008

385
Appendix 4. Livestock population in Bhutan, 2008.
Dzongkhags All Livestock Population (Nos.)
Mithun Cattle
Nublang Cattle
Jersey Cattle
Swiss Brown
Other Cattle Yaks Horses Sheep Goats Pigs Poultry
Thimphu 321 2,130 1,162 140 117 9,981 1,057 2 6 100 1,018
Paro 2,030 7,360 4,311 185 21 3,773 1,548 27 111 822 5,217
Ha 1,627 3,939 2,088 74 55 4,652 922 20 72 605 2,611
Chhukha 2,445 17,351 3,457 0 0 0 460 1,091 5,330 2,598 18,471
Samtse 749 33,504 2,394 39 427 0 433 3,556 12,266 1,840 35,925
Punakha 2,259 7,612 2,166 33 0 0 616 8 76 892 4,291
Gasa 288 426 113 158 0 5,694 994 4 4 23 339
Wangdue 4,644 16,004 2,317 505 4 2,753 1,143 2,393 156 1,347 4,982
Tsirang 399 8,487 4,727 44 236 0 243 749 5,588 1,530 23,225
Dagana 1,933 14,690 3,112 0 80 0 445 540 5,036 2,557 18,295
Bumthang 2,229 3,616 1,439 2,671 41 3,197 1,237 467 5 0 534
Trongsa 1,969 6,180 1,505 354 0 138 308 430 2 70 2,000
Zhemgang 6,167 2,945 1,400 42 0 0 1,754 0 46 864 6,074
Sarpang 2,488 18,664 4,023 54 167 0 358 954 3,920 1,264 28,306
Lhuentse 4,732 6,099 1,201 229 17 241 1,426 63 18 229 5,654
Mongar 12,526 8,818 3,972 332 0 0 2,449 40 153 1,231 14,530
Trashigang 9,594 9,779 3,272 112 165 8,780 2,927 1,528 192 1,019 10,444
Trashiyangtse 3,347 5,347 1,694 48 112 400 1,336 39 82 710 1,397
Pemagatshel 2,950 2,975 3,076 55 0 0 1,377 3 37 678 4,968
SamdrupJongkhar 6,403 7,699 2,922 73 26 0 1,268 70 942 565 9,849
Bhutan 68,885 184,014 50,443 5,253 1,476 40,482 22,335 12,116 34,176 18,963 197,766

386
Appendix 5. Poster on Kengkhar for disseminating the result.

387
Appendix 6. Abbreviation
ABM Agent Based Model ADB Asian Development Bank ADC Austrian Development Corporation AEZs Agr-ecological Zones AMEPP Agriculture Marketing and Enterprise Promotion Program amsl Above mean sea level ANA Actor network analysis ARDI Actor Resource Dynamic Interactions BAP Biodiversity Action Plan BC Before Christ BDFC Bhutan Development Finance Corporation BKK Bangkok BWP Bhutan Water Partnership CBNRM Community Based Natural Resource Management CGIAR Consultative Group on International Agriculture Research CHPP Chukha Hydro Power Project CIRAD Centre de coopération internationale en recherche agronomique pour le
développement ComMod Companion Modelling CORMAS Common-Pool Resource and Multi-Agent Systems CoRRB Council for RNR Research of Bhutan CPR Common property resource cRPG Computerized Role playing game DGPC Druk Green Power Corporation DoA Department of Agriculture DOF Department of Forest DoFPS Department of Forests and Park Services DYT Dzongkhag Yargey Tshogdey FAO Food and Agriculture Organization FEZAP First Eastern Zonal Agriculture Project FNCA Forest and Nature Conservation Act FNCR Forest and Nature Conservation Rules FYM Farmyard manure GCWC Global Committee for the Water Contract GDP Gross domestic product GIS Geographic information system GLOF Glacial lake outburst flood GNHC Gross National Happiness Commission GREEN Management of renewable resources and environment research unit at CIRAD
388
GRF Government reserved forest GWP Global water partnership GYT Geog yargey tshogdey Ha Hectare HDPE High density polyethylene HEP Hydro-electric project HH Household HPP Hydro power project ICIMOD International Centre for Integrated Mountain Development ICWE International Conference on Water and the Environmen IFAD International Fund for Agriculture Development IHDP Integrated Horticulture Development Project IMT Irrigation management transfer INRM Integrated Natural Resource Management IPE Impact pathway evaluation IR International Rice ISNAR International Service for National Agriculture Research IWM Integrated water management IWMI International Water Management Institute IWRM Integrated Water Resource Management Km Kilometer kW Kilowatt Ls Liters M Meter MAP Medicinal and Aromatic Plants MAS Multi-Agent Systems mamsl Meter above mean sea level MoA Ministry of Agriculture MoAF Ministry of Agriculture and Forest MOH Ministry of Health MoTIF Ministry of Trade, Industry and Forest MSC Most Significant Change MSP Multi-stakeholder platform MT Metric ton MU Million Unit MW Mega Watt NCD Nature Conservation Division NEC National Environment Commission NIP National Irrigation Policy NR Natural resource NRM Natural resource management

389
NRTI Natural Resources Training Institute NSB National Statistical Bureau NTFP Non-timber forest products Nu Ngultrum OCC Office of the Census Commissioner ODD Overview Design Detail PCS Planning Commission Secretariat PIM Participatory irrigation management PPD Policy and Planning Division RBC RGOB Royal Government of Bhutan RNR Renewable Natural Resource RNRRC Renewable Natural Resources Research Centre RPG Role-playing Game RSPN Royal Society for Preservation of Nature RWSS Rural water supply scheme SES Social-ecological systems SEZAP Second eastern zonal agricultural project Sq Km Square kilometre t/ha Ton per hectare THPP Tala hydroelectric power project TRG Training UML Unified modelling language UN United Nations UNCED United Nations Conference on Environment and Development UNDP United Nations Development Program UNEP United Nations Environment Programme UNICEF United Nations WHO World Health Organization WMC Watershed management committee WRI World Resource Institute WUA Water Users Association WWC World Water Council WWF World Wildlife Fund

390
Appendix 7. Map of Bhutan showing places referred in the text.

391
Appendix 8. List of publications.
Peer-reviewed Journal articles
Gurung, T.R, F. Bousquet, G, Trébuil, 2006. Companion modelling, conflict resolution, and Institution building: sharing irrigation water in the Lingmuteychu watershed, Bhutan. Ecology and Society Vol. 11, No2, Art 36. Ralph Yorque Memorial Prize of this journal for 2006.
Other Journal articles Bousquet, F., T.R.Gurung, G.Trébuil, 2005. The Game of Life – A fresh approach to the challenge of sharing agricultural resources has rice farmers playing games with scientists. Rice Today, IRRI, Philippines. Conference proceedings/Reports Gurung, T.R., Promburom, P., Naivinit W., Thongnoi, M., Barnaud, C. and Trébuil G. 2008. Effects of companion modeling on water management: comparative analysis across five sites in Bhutan and Thailand. Proceedings of Second International Forum on Water and Food (IFWF2), CPWF-CGRAI, 16-18 November 2008. Addis Ababa, Ethiopia. Hoanh, C. T., Le Page C., Barreteau O., Trébuil G., Bousquet F., Cernesson F., Barnaud C., Gurung, T. R., Promburom P., Naivinit W., Dung L. C., Dumrongrojwatthana P. and Thongnoi, M. 2008. Agent-based modeling to facilitate resilient water management in Southeast and South Asia. Proceedings of the Second International Forum on Water and Food (IFWF2), CPWF-CGRAI, 16-18 November 2008.p.4. Addis Ababa, Ethiopia. Barnaud, C., P. Promburom, T.R.Gurung, C.L.Page, G.Trébuil., 2006. Companion Modeling for collective learning and action in water management: lessons learnt from three case studies in northern Thailand and Bhutan. Presented in International Symposium towards sustainable livelihood and ecosystems in mountain regions, Chiang mai, Thailand, 7-9 March 2006 Posters
Gurung, T.R., Ekasingh, B., Ekasingh, M., Bousquet, B., and Trébuil, G. 2004. Companion modeling to improve irrigation water sharing among rice growers in west-central Bhutan.
Gurung, T.R., Le Page, C., Dorji, L., Choney, R., and Trébuil, G. 2010. Companion modeling to facilitate understanding of grazing land conflict in Sheythimi, Radi, Eastern Bhutan.
Gurung, T.R., Le Page, C., Dorji, L., Nime, C., Choney, R., Landy, F., and Trébuil, G. 2010. Companion modeling to enhance spring water collection and sharing in Eastern Bhutan.

392
COMPARATIVE ANALYSIS OF USING COMPANION MODELLING TO FACILITATE ADAPTIVE MANAGEMENT OF AGRICULTURAL WATER IN
BHUTAN
ABSTRACT The customary regime of natural resource management in Bhutan faces greater challenges from economic development, rapid transformation of social values, local institutions and traditional perceptions on NR. Although Bhutan is projected rich in water resource for hydropower potentials, water for agriculture and domestic use is fast becoming scarcer and highly contested. As the water becomes scarce the people living in highlands are most hard hit. A detail diagnostic study of two communities, Lingmuteychu dependent on irrigated rice and Kengkhar dependent on dryland farming presents two situations of water resource issues. In Lingmuteychu the conflict of irrigation water sharing for cultivation of rice among seven villages has been inflicting resentment in all aspect of society. In contrary, community in Kengkhar has been facing drinking water scarcity with four months of dried natural spring ponds, which forces people to walk for more than five hours to fetch water from the river. In these two sites Companion Modelling was applied to enhance understanding of water resource management dynamics and improve shared communication and learning to facilitate adaptive management strategies. The study provides a comparison of the process followed in two sites with analysis of impacts and effects from the process. The research illustrates how ComMod process helped to develop trust and commitment in the conflicting community and pave pathways to develop social capital for adaptive management of water resource. The process was able to foster shared learning and co-construct collective actions which were implementable. The research also revealed the important role of the researchers in furthering and sustaining newly achieved cooperation. The ABMs provided an opportunity to re-create different water resource management strategies which could be used as options for the community. The research also demonstrates the feasibility of applying the ComMod approach in different field of NRM. Key words Companion modelling, multi-agent systems, water resources, social capital, conflict resolution, natural resource management, Bhutan.
Thesis in human, economic and regional geography Laboratoire Gecko (Laboratoire de Géographie Comparée des Suds et des Nords),
EA 375, Université Paris Ouest Nanterre-La Défense,, 92000 Nanterre. &
UPR Green (Gestion des ressources renouvelables et environnement), Département Environnements et Sociétés, CIRAD, F-34398, Montpellier.

393
ANALYSE COMPARÉE DE L'USAGE DE LA MODÉLISATION D'ACCOMPAGNEMENT POUR FACILITER LA GESTION ADAPTATIVE DE L'EAU
AGRICOLE AU BHOUTAN
ABSTRACT Key words
Thesis in human, economic and regional geography Laboratoire Gecko (Laboratoire de Géographie Comparée des Suds et des Nords),
EA 375, Université Paris Ouest Nanterre-La Défense, 92000 Nanterre. &
UPR Green (Gestion des ressources renouvelables et environnement), Département Environnements et Sociétés, CIRAD, F-34398, Montpellier.


![thèse - Pneusol / Tyresoil [Nguyen Thanh Long]](https://static.fdokumen.com/doc/165x107/63366c6d8b2b97315b0f6e95/these-pneusol-tyresoil-nguyen-thanh-long.jpg)