Thèse de Doctorat - DIGITAL.CSIC, el repositorio institucional
Upload
khangminh22Category
view
1download
0
HAL Id: tel-00829419https://tel.archives-ouvertes.fr/tel-00829419
Submitted on 3 Jun 2013
HAL is a multi-disciplinary open accessarchive for the deposit and dissemination of sci-entific research documents, whether they are pub-lished or not. The documents may come fromteaching and research institutions in France orabroad, or from public or private research centers.
L’archive ouverte pluridisciplinaire HAL, estdestinée au dépôt et à la diffusion de documentsscientifiques de niveau recherche, publiés ou non,émanant des établissements d’enseignement et derecherche français ou étrangers, des laboratoirespublics ou privés.
A virtual reality-based approach for interactive andvisual mining of association rules
Zohra Ben Said
To cite this version:Zohra Ben Said. A virtual reality-based approach for interactive and visual mining of associationrules. Software Engineering [cs.SE]. Université de Nantes, 2012. English. �tel-00829419�

Thèse de Doctorat
Zohra Ben Said -
GuefrechMémoire présenté en vue de l’obtention du
grade de Docteur de l’Université de Nantes
sous le label de l’Université de Nantes Angers Le Mans
Discipline : InformatiqueSpécialité : Génie LogicielLaboratoire : Laboratoire d’informatique de Nantes-Atlantique (LINA)
Soutenue le 25 octobre 2012
École doctorale : 503 (STIM)Thèse n°: ED 503-175
A virtual reality-based approach for interactiveand visual mining of association rules
JURY
Rapporteurs : M. Gilles VENTURINI, Professeur, Ecole Polytechnique de l’Universite de Tours
M. Mustapha LEBBAH, Maître de conférences - HDR, Université Paris 13
Examinateurs : M. Colin DE LA HIGUERA, Professeur, Ecole Polytechnique de l’Universite de Nantes
Mme Hanene HAZZAG, Maître de conférences, Université Paris 13
Invités : M. Julien BLANCHARD, Maître de conférences, Ecole Polytechnique de l’Universite de Nantes
M. Fabien PICAROUGNE, Maître de conférences , Ecole Polytechnique de l’Universite de Nantes
Directeur de thèse : M. Fabrice GUILLET, Professeur, Ecole Polytechnique de l’Universite de Nantes
Co-encadrant de thèse : M. Paul RICHARD, Maître de conférences - HDR, Université d’Angers

�

Abstract
This thesis is at the intersection of two active research areas: Association RuleMining and Virtual Reality.
The main limitations of the association rule extraction algorithms are that (i)they produce large amount of rules and (ii) many extracted rules have no interest tothe user.
In practise, the amount of generated rule sets limits severely the ability of the userto explore these rule sets in a reasonable time. In the literature, several solutions havebeen proposed to address this problem such as, post-processing of association rules.Post-processing allows rule validation and extraction of useful knowledge. Whereasrules are automatically extract by combinatorial algorithms, rule post-processing isdone by user. Visualisation can help the user deal with large amount of data byrepresenting it in visual form to improve cognition for acquisition and the use ofnew knowledge. In order to find relevant knowledge in visual representations, thedecision-maker needs to freely rummage through large amount of data. Therefore itis essential to integrate him/her in the data mining process through the use of effi-cient interactive techniques. In this context, the use of Virtual Reality techniques isvery relevant: it allows the user to quickly view and select rules that seem interesting.
This work addresses two main issues: the representation of association rules toallow user quickly detection of the most interesting rules and interactive explorationof rules. The first requires an intuitive metaphor representation of association rules.The second requires an interactive exploration process allowing the user searchinginteresting rules.
The main contributions of this work can be summarised as follows:
1. Classification for Visual Data Mining based on both 3D representa-tions and interaction techniques
We present and discuss the concepts of visualisation and visual data mining.Then, we present 3D representation and interaction techniques in the contextof data mining. Furthermore, we propose a new classification for Visual DataMining, based on both 3D representations and interaction techniques. Such aclassification may help the user choose a visual representation and an interactiontechnique for a given application. This study allows us to identify limitationsof the knowledge visualisation approaches proposed in the literature.
i

ii Abstract
2. Metaphor for association rule representation
We propose a new visualisation metaphor for association rules. This newmetaphor takes into account more accurately the attributes of the antecedentand the consequent, the contribution of each one to the rule, and their correla-tions. This metaphor is based on the principle of information visualisation foreffective representation and more particularly to enhance rules interestingnessmeasures.
3. Interactive rules visualisation
We propose a methodology for the interactive visualisation of association rules:IUCEAR (Interactive User-Centred Exploration of Association Rules) that isintended to facilitate the user task when facing large sets of rules, taking intoaccount his/her cognitive capabilities. In this methodology, the user buildshimself/herself a reference rule which will be exploited by local algorithms inorder to recommend better rules based on the reference rule. Then, the userexplores successively a small set of rules using interactive visualisation relatedwith suitable interaction operators. This approach is based on the principles ofinformation cognitive processing.
4. Local extraction of association rules
We develop specific constraint-based algorithms for local association rules ex-traction. These algorithms extract only the rules that our approach is considersinteresting for the user. These algorithms use powerful constraints that signif-icantly restrict the search space. Thus, they give the possibility to overcomethe limits of exhaustive algorithms such as Apriori (the local algorithm ex-tracts only a small sub set of rules at each user action). By exploring rulesand changing constraints, the user may control both rules extraction and thepost-processing of rules.
5. The Virtual Reality visualisation tool IUCAREVis
IUCAREVis is a tool for the interactive visualisation of association rules. Itimplements the three previous approaches and allows rules set exploration, con-straints modification, and the identification of relevant knowledge. IUCAREVisis based on an intuitive display in a virtual environment that supports multipleinteraction methods.
Keywords: Association Rules Mining, Virtual Reality, Visualisation, Visual DataMining, Interactive Rules Exploration.

Acknowledgments
The following dissertation, while an individual work, benefited from the insightsand direction of several people.
This thesis would not have been possible unless it was financially supported byPays de la Loire Region of France; MILES project was in charge with the adminis-tration of my financial contract. Thus, I would like to thank the council of the Paysde la Loire Region for giving me the possibility to follow my dreams...
I owe my deepest gratitude to Mr. Fabrice Guille, Mr. Paul Richard, Mr. FabienPicarougne and Mr. Julien Blanchard my PhD supervisors. Mr. Fabrice Guilletbelieved in me, guided me and gave me precious advices throughout this work. Hegave me the possibility to get this far by always encouraging me to go further. Mr.Paul Richard co-supervised my PhD, he provided timely and instructive commentsand evaluation of my work allowing me to progress in my research. Our discussionswere both constructive and enlightening, and I thank him.
I wish to express my gratitude to Mr. Gilles Venturini and Mr. Mustapha Leb-bah, for the honor that they made me by accepting to review my thesis and for alltheir constructive remarks that allowed me to improve my dissertation. I would likealso to thank Mr. Colin De La Higuera and Ms. Hanene Hazzag, for making me thehonor to accept being examinators.
I had the pleasure to work in the COnnaissances et Decisions - KnOwledge andDecisions (KOD) research team of Nantes-Atlantique Computer Science Laboratory(LINA UMR 6241), in the Computer Science Department of Ecole polytechnique ofUniversity of Nantes. I am grateful to Ms. Pascale Kuntz for giving me the greatprivilege of joining the research team that she pilots. She was always there bringingme priceless answers and advices. My colleagues were always sources of laughter, joy,and support. They made my days less harder than they seemed to be.
In all of the ups and downs that came my way during the PhD years, I knewthat I had the support of my husband, I would like to thank him – he was alwaysthere, listening and encouraging me, and always understanding; thank you.
Without you, my family, I would be nothing.
iii

iv Acknowledgments

Contents
Abstract i
Acknowledgments iii
Introduction 1
1 Knowledge Discovery in Databases and Association Rules 9
1.1 Introduction . . . . . . . . . . . . . . . . . . . . . . . . . . . . . . . . . 10
1.2 Knowledge Discovery in Databases . . . . . . . . . . . . . . . . . . . . 10
1.2.1 Data Pre-Processing . . . . . . . . . . . . . . . . . . . . . . . . 11
1.2.2 Data Mining . . . . . . . . . . . . . . . . . . . . . . . . . . . . 12
1.2.3 Post-processing of Discovered Patterns . . . . . . . . . . . . . . 13
1.3 Association Rule Mining . . . . . . . . . . . . . . . . . . . . . . . . . . 14
1.3.1 Presentation . . . . . . . . . . . . . . . . . . . . . . . . . . . . 14
1.3.2 Terminology and Annotations . . . . . . . . . . . . . . . . . . . 15
1.4 Algorithms for Association Rule Extraction . . . . . . . . . . . . . . . 19
1.4.1 Exhaustive Algorithms . . . . . . . . . . . . . . . . . . . . . . . 19
1.4.1.1 Apriori – Classical Association Rule Mining . . . . . 21
1.4.1.2 Other algorithms . . . . . . . . . . . . . . . . . . . . . 26
1.4.2 Constraint-based Association Rule Mining . . . . . . . . . . . . 28
1.4.2.1 Constraints . . . . . . . . . . . . . . . . . . . . . . . . 29
1.4.2.2 Algorithms . . . . . . . . . . . . . . . . . . . . . . . . 30
1.4.3 Which approach to choose ? . . . . . . . . . . . . . . . . . . . . 32
1.5 Problematic of Association Rules and Solutions . . . . . . . . . . . . . 32
1.5.1 Interestingness Measures . . . . . . . . . . . . . . . . . . . . . . 33
1.5.2 Redundancy Rule Reduction . . . . . . . . . . . . . . . . . . . 35
1.5.3 Interactive Rule Post-processing . . . . . . . . . . . . . . . . . 36
1.5.3.1 Interactive Exploration and Extraction of AssociationRules . . . . . . . . . . . . . . . . . . . . . . . . . . . 37
1.5.3.2 Interactive Visual Exploration and extraction of As-sociation Rules . . . . . . . . . . . . . . . . . . . . . . 40
1.6 Conclusion . . . . . . . . . . . . . . . . . . . . . . . . . . . . . . . . . 49
2 Virtual Reality Technology 51
2.1 Introduction . . . . . . . . . . . . . . . . . . . . . . . . . . . . . . . . . 51
2.2 Concepts and definition of VR . . . . . . . . . . . . . . . . . . . . . . 52
v

vi Contents
2.2.1 Immersion . . . . . . . . . . . . . . . . . . . . . . . . . . . . . . 54
2.2.2 Autonomy . . . . . . . . . . . . . . . . . . . . . . . . . . . . . . 56
2.2.3 Interaction . . . . . . . . . . . . . . . . . . . . . . . . . . . . . 56
2.3 Virtual Environments . . . . . . . . . . . . . . . . . . . . . . . . . . . 56
2.4 From 2D toward 3D and Virtual Reality . . . . . . . . . . . . . . . . . 57
2.4.1 2D versus 3D . . . . . . . . . . . . . . . . . . . . . . . . . . . . 57
2.4.2 Toward Virtual Reality . . . . . . . . . . . . . . . . . . . . . . 59
2.5 Interaction techniques and metaphors . . . . . . . . . . . . . . . . . . 60
2.5.1 Navigation . . . . . . . . . . . . . . . . . . . . . . . . . . . . . 61
2.5.2 Selection and manipulation . . . . . . . . . . . . . . . . . . . . 69
2.5.3 System control . . . . . . . . . . . . . . . . . . . . . . . . . . . 74
2.5.3.1 2D solutions in 3D environments . . . . . . . . . . . . 74
2.5.3.2 3D menus . . . . . . . . . . . . . . . . . . . . . . . . . 75
2.6 Visual Display Configurations . . . . . . . . . . . . . . . . . . . . . . . 77
2.6.1 Immersive configurations . . . . . . . . . . . . . . . . . . . . . 79
2.6.2 Non-Immersive Configurations . . . . . . . . . . . . . . . . . . 81
2.7 Conclusion . . . . . . . . . . . . . . . . . . . . . . . . . . . . . . . . . 82
3 Overview of Visual Data Mining in 3D and Virtual Reality 85
3.1 Introduction . . . . . . . . . . . . . . . . . . . . . . . . . . . . . . . . . 86
3.2 Visualisation . . . . . . . . . . . . . . . . . . . . . . . . . . . . . . . . 87
3.2.1 Why is visualisation important ? . . . . . . . . . . . . . . . . . 88
3.2.2 The Visualisation Process . . . . . . . . . . . . . . . . . . . . . 90
3.2.3 Semiology of graphics . . . . . . . . . . . . . . . . . . . . . . . 93
3.3 Visual Data Mining (VDM) . . . . . . . . . . . . . . . . . . . . . . . . 96
3.3.1 3D Visual Representation for VDM . . . . . . . . . . . . . . . . 98
3.3.1.1 Abstract visual representations . . . . . . . . . . . . . 99
3.3.1.2 Virtual worlds . . . . . . . . . . . . . . . . . . . . . . 102
3.3.2 Interaction for VDM . . . . . . . . . . . . . . . . . . . . . . . . 103
3.3.2.1 Visual exploration . . . . . . . . . . . . . . . . . . . . 104
3.3.2.2 Visual manipulation . . . . . . . . . . . . . . . . . . . 106
3.3.2.3 Human-centred approach . . . . . . . . . . . . . . . . 107
3.4 A New Classification for VDM . . . . . . . . . . . . . . . . . . . . . . 107
3.4.1 Pre-processing . . . . . . . . . . . . . . . . . . . . . . . . . . . 108
3.4.2 Post-processing . . . . . . . . . . . . . . . . . . . . . . . . . . . 111
3.4.2.1 Clustering . . . . . . . . . . . . . . . . . . . . . . . . 112
3.4.2.2 Classification . . . . . . . . . . . . . . . . . . . . . . . 113
3.4.2.3 Association rules . . . . . . . . . . . . . . . . . . . . . 114
3.4.2.4 Combination of methods . . . . . . . . . . . . . . . . 115
3.5 Conclusion . . . . . . . . . . . . . . . . . . . . . . . . . . . . . . . . . 116
4 Interactive Extraction and Exploration of Association Rules 117
4.1 Introduction . . . . . . . . . . . . . . . . . . . . . . . . . . . . . . . . . 118
4.2 Constraints of the Interactive Post-processing of Association Rules . . 119
4.2.1 Importance of the Individual Attributes of Rules . . . . . . . . 120

Contents vii
4.2.1.1 Attribute importance . . . . . . . . . . . . . . . . . . 120
4.2.1.2 Attribute interaction . . . . . . . . . . . . . . . . . . 121
4.2.2 Hypothesis About The Cognitive Processing of Information . . 121
4.3 IUCEAR: Methodology for Interactive User-Centred Exploration ofAssociation Rules . . . . . . . . . . . . . . . . . . . . . . . . . . . . . . 123
4.3.1 Items Selection . . . . . . . . . . . . . . . . . . . . . . . . . . . 124
4.3.2 Local mining: anticipation functions . . . . . . . . . . . . . . . 124
4.3.3 Association Rule Visualisation, Validation, and Evaluation . . 127
4.3.4 Browsing History . . . . . . . . . . . . . . . . . . . . . . . . . . 127
4.3.5 Interactive process . . . . . . . . . . . . . . . . . . . . . . . . . 128
4.4 New Association Rules Metaphor . . . . . . . . . . . . . . . . . . . . . 128
4.4.0.1 Rendering Mapping of Association rule metaphor . . 128
4.4.0.2 Spring-embedded like algorithm . . . . . . . . . . . . 130
4.4.1 Validation of Association rule metaphors . . . . . . . . . . . . . 132
4.4.1.1 Objective . . . . . . . . . . . . . . . . . . . . . . . . . 132
4.4.1.2 Task . . . . . . . . . . . . . . . . . . . . . . . . . . . . 132
4.4.1.3 Protocol . . . . . . . . . . . . . . . . . . . . . . . . . 134
4.4.2 Results . . . . . . . . . . . . . . . . . . . . . . . . . . . . . . . 135
4.4.2.1 Response Time . . . . . . . . . . . . . . . . . . . . . . 135
4.4.2.2 Error rate . . . . . . . . . . . . . . . . . . . . . . . . . 139
4.4.2.3 Subjective Aspects . . . . . . . . . . . . . . . . . . . . 140
4.4.3 Discussion . . . . . . . . . . . . . . . . . . . . . . . . . . . . . . 141
4.5 Interactive Visualisation of Association Rules withIUCEARVis . . . . . . . . . . . . . . . . . . . . . . . . . . . . . . . . . 142
4.5.1 Items Selection . . . . . . . . . . . . . . . . . . . . . . . . . . . 143
4.5.1.1 Data Transformations . . . . . . . . . . . . . . . . . . 143
4.5.1.2 Rendering Mappings . . . . . . . . . . . . . . . . . . . 143
4.5.1.3 View Transformation . . . . . . . . . . . . . . . . . . 145
4.5.2 Association Rule Exploration, Evaluation and Validation . . . 146
4.5.2.1 Data Transformation . . . . . . . . . . . . . . . . . . 146
4.5.2.2 Rendering Mappings . . . . . . . . . . . . . . . . . . . 148
4.5.2.3 View Transformation . . . . . . . . . . . . . . . . . . 150
4.5.3 Browsing History . . . . . . . . . . . . . . . . . . . . . . . . . . 152
4.5.3.1 Rendering Mappings . . . . . . . . . . . . . . . . . . . 152
4.5.3.2 View Transformation . . . . . . . . . . . . . . . . . . 155
4.6 Conclusion . . . . . . . . . . . . . . . . . . . . . . . . . . . . . . . . . 155
5 IUCEARVis Tool Development 157
5.1 Introduction . . . . . . . . . . . . . . . . . . . . . . . . . . . . . . . . . 157
5.2 Interactive Rule Local Mining With IUCEARVis . . . . . . . . . . . . 158
5.2.1 Constraints in IUCEARVis . . . . . . . . . . . . . . . . . . . . 159
5.2.2 Association Rule Extraction in IUCEARVis . . . . . . . . . . . 159
5.3 Implementation . . . . . . . . . . . . . . . . . . . . . . . . . . . . . . . 161
5.3.1 Virtual Reality Technology . . . . . . . . . . . . . . . . . . . . 161
5.3.2 Tool Architecture . . . . . . . . . . . . . . . . . . . . . . . . . . 165

viii Contents
5.4 Interaction in IUCEARVis . . . . . . . . . . . . . . . . . . . . . . . . . 1675.4.1 Object Selection and Manipulation . . . . . . . . . . . . . . . . 1675.4.2 System Control . . . . . . . . . . . . . . . . . . . . . . . . . . . 170
5.5 Case Study . . . . . . . . . . . . . . . . . . . . . . . . . . . . . . . . . 1725.6 Conclusion . . . . . . . . . . . . . . . . . . . . . . . . . . . . . . . . . 178
Conclusion and Perspectives 179References . . . . . . . . . . . . . . . . . . . . . . . . . . . . . . . . . . . . . 185

List of Figures
1.1 An overview of the KDD process. . . . . . . . . . . . . . . . . . . . . . 12
1.2 Search space lattice. . . . . . . . . . . . . . . . . . . . . . . . . . . . . 20
1.3 Tree of the frequent itemset generation. . . . . . . . . . . . . . . . . . 24
1.4 The RSetNav rules browser [115] . . . . . . . . . . . . . . . . . . . . . 38
1.5 The ConQuestSt’s pattern browser window [34] . . . . . . . . . . . . . 39
1.6 An association rule representation using bar chart for one rule visu-alisation (a), grid-like visualisation for multiple rules visualisation (b)and parallel-coordinate visualisation (c) [171]. . . . . . . . . . . . . . . 41
1.7 Visualisation of item associations [297]. . . . . . . . . . . . . . . . . . 42
1.8 Association rules representation with Mosaic Plots [146]. . . . . . . . . 43
1.9 A scatter plot of 5807 rules with TwoKey plot [280]. . . . . . . . . . . 44
1.10 A grid-based visualisation of association rules [271]. . . . . . . . . . . 44
1.11 A parallel coordinates visualisation of association rules [300]. . . . . . 45
1.12 A graph-based visualisation of 27 association rules [99]. . . . . . . . . 46
1.13 Rule visualisation / rule graph ([170]). . . . . . . . . . . . . . . . . . . 47
1.14 Discovering rules from the selected frequent items [174]. . . . . . . . . 49
2.1 Triangle of Virtual Reality proposed by Burdea and Coiffet [54]. . . . 53
2.2 Triangle of Virtual Reality proposed by Burdea and Coiffet[54]. . . . . 53
2.3 The AIP cube : autonomy, interaction, presence [307]. . . . . . . . . . 54
2.4 Immersion, interaction, andautonomy in VR [274]. . . . . . . . . . . . 55
2.5 Bowman’s taxonomy for travel techniques [44]. . . . . . . . . . . . . . 63
2.6 Arns’s 2000 [11] taxonomy for rotation techniques. . . . . . . . . . . . 65
2.7 Arns’s 2002 [11] taxonomy of translation techniques. . . . . . . . . . . 66
2.8 Examples of locomotion devices : (a): a walking-pad [35], (b): a dancePad [22], and (c): a chair-based interface[22]. . . . . . . . . . . . . . . 66
2.9 Pinch Gloves [36]: (a): User wearing Pinch Gloves (b): Two-handednavigation technique . . . . . . . . . . . . . . . . . . . . . . . . . . . . 67
2.10 Physical (left) and virtual (right) view of map navigation metaphor [39]. 68
2.11 Taxonomies proposed by Bowman 1998 [44] for selection (a) and objectmanipulation (b) in VEs. . . . . . . . . . . . . . . . . . . . . . . . . . 71
2.12 The flexible pointer selecting a partially occulted object without inter-fering with the occluding object [212]. . . . . . . . . . . . . . . . . . . 73
2.13 The tulip menu proposed by Bowman and Wingrave 2001[43]. . . . . . 76
2.14 Immersive wall of the PREVISE platform [154]. . . . . . . . . . . . . . 77
2.15 Example of immersive dome [126]. . . . . . . . . . . . . . . . . . . . . 78
ix

x List of Figures
2.16 Example of immersive rooms [166]. . . . . . . . . . . . . . . . . . . . . 78
2.17 Example of workbench [262]. . . . . . . . . . . . . . . . . . . . . . . . 79
2.18 Example of the CAVE-like system [205]. . . . . . . . . . . . . . . . . . 79
2.19 Example of head-mounted display [234]. . . . . . . . . . . . . . . . . . 80
2.20 Illustration of a non-colocalised configuration [65]. . . . . . . . . . . . 81
2.21 Illustration of a colocalised configuration [213]. . . . . . . . . . . . . . 82
3.1 Illustration of the KDD process. . . . . . . . . . . . . . . . . . . . . . 87
3.2 An organisation chart. A pattern requires at least one paragraph todescribe it. . . . . . . . . . . . . . . . . . . . . . . . . . . . . . . . . . 88
3.3 Four various visual representations of a hypothetical clinical trial. [240]. 89
3.4 Scientific visualisation and information visualisation examples: (a):visualization of the flow field around a space shuttle (Laviola 2000[177]) (b): GEOMIE (Ahmed et al. 2006 [4])information visualisationframework . . . . . . . . . . . . . . . . . . . . . . . . . . . . . . . . . 90
3.5 The visualisation process at a high level view [60]. . . . . . . . . . . . 93
3.6 Poor use of a bar chart . . . . . . . . . . . . . . . . . . . . . . . . . . . 93
3.7 Better use of scatter plot . . . . . . . . . . . . . . . . . . . . . . . . . . 94
3.8 The most effective use of Bertins retinal variables [173]. . . . . . . . . 96
3.9 An example of graph representations: (a) Ougi[214], (b) Associationrules: Haiku [230], (c) DocuWorld [95] . . . . . . . . . . . . . . . . . . 101
3.10 An example of tree representing ontology classification : SUMO [53] . 102
3.11 Different 3D scatter plots representations: (a) VRMiner [14], (b) 3DVDM[203], (c) DIVE-ON [8], (d) Visualisation with augmented reality[192] 103
3.12 Example of virtual worlds representation: Imsovision [190]. . . . . . . 103
3.13 Illustration of a navigation technique based on the use of a data glove[17]. . . . . . . . . . . . . . . . . . . . . . . . . . . . . . . . . . . . . . 105
3.14 Illustration of the human-centred approach. . . . . . . . . . . . . . . . 108
3.15 Visualisation of earthquakes data using a 4K stereo projection system[210]. . . . . . . . . . . . . . . . . . . . . . . . . . . . . . . . . . . . . . 110
3.16 Representation of a file system with 3D-nested cylinders and spheres[285]. . . . . . . . . . . . . . . . . . . . . . . . . . . . . . . . . . . . . . 111
3.17 ArVis : a tool for association rules visualisation [31]. . . . . . . . . . . 114
4.1 Expert role in the association rule generation process . . . . . . . . . . 119
4.2 Exploration of limited subsets of association rules in R . . . . . . . . . 123
4.3 Each relation adds a selected item to the antecedent or to the consequent.124
4.4 Anticipation functions associate each association rule chosen or con-structed by the user to a subset of rules. . . . . . . . . . . . . . . . . . 125
4.5 To navigate from one subset of rules to another, the user can chooseone rule from the current subset of rules or change the selected items. 125
4.6 Illustration of the anticipation functions. . . . . . . . . . . . . . . . . . 126
4.7 Illustration of rules navigation card. . . . . . . . . . . . . . . . . . . . 128
4.8 Interactive process description for the IUCEAR methodology. . . . . . 129
4.9 The visual association rule metaphor. . . . . . . . . . . . . . . . . . . 130

List of Figures xi
4.10 Illustration of an association rules set. The distance between the an-tecedent and the consequence stresses the rules with a high interest-ingness measure (support of confidence) . . . . . . . . . . . . . . . . . 131
4.11 The 4 metaphors of association rule : (a) Metaphor 1 (b) Metaphor 2(c) Metaphor 3 (d) Metaphor 4 . . . . . . . . . . . . . . . . . . . . . . 133
4.12 The test conditions. . . . . . . . . . . . . . . . . . . . . . . . . . . . . 135
4.13 Response time to question 1 for different metaphors. . . . . . . . . . . 136
4.14 Response time to question 1 for different conditions. . . . . . . . . . . 136
4.15 Response time to question 2 for different metaphors. . . . . . . . . . . 137
4.16 Response time to question 2 for different conditions. . . . . . . . . . . 137
4.17 Response time to question 3 for different metaphors. . . . . . . . . . . 138
4.18 Response time to question 3 for different conditions. . . . . . . . . . . 139
4.19 Response time to question 4 for different metaphors. . . . . . . . . . . 139
4.20 Response time to question 4 for different conditions. . . . . . . . . . . 140
4.21 Error rates of the questions for different metaphors. . . . . . . . . . . 140
4.22 Error rates of the questions for different conditions. . . . . . . . . . . . 141
4.23 Illustration of IUCEARVis approach. . . . . . . . . . . . . . . . . . . . 142
4.24 Item Selection interface. . . . . . . . . . . . . . . . . . . . . . . . . . . 144
4.25 Objects present is the item Selection interface. . . . . . . . . . . . . . 145
4.26 Interface for association rules exploration, validation, and evaluation. . 149
4.27 The different colours of links to encode rules score: (a): score 0 (whitecolour), (b): score 1 (azure colour), (c): score 2 (medium blue colour),(d): score 3 (dark blue colour). . . . . . . . . . . . . . . . . . . . . . . 150
4.28 Linking and brushing: a selected rule is simultaneously highlighted inthe 3D scatter plot. . . . . . . . . . . . . . . . . . . . . . . . . . . . . . 151
4.29 System control commands available in the rules exploration, evaluationand validation interface. . . . . . . . . . . . . . . . . . . . . . . . . . . 152
4.30 A cursor can be displayed at the user request to change a rule note. . 153
4.31 Interface for browsing history. . . . . . . . . . . . . . . . . . . . . . . . 153
4.32 The rule positions on the scale are based on the interestingness measurevalues. . . . . . . . . . . . . . . . . . . . . . . . . . . . . . . . . . . . . 154
5.1 General architecture of the IUCEARVis tool. . . . . . . . . . . . . . . 165
5.2 Interactive process description of IUCEARVis. . . . . . . . . . . . . . 166
5.3 Bimanual interaction. . . . . . . . . . . . . . . . . . . . . . . . . . . . 168
5.4 Illustration of the different possibilities of camera controlled movements.169
5.5 Automation governing the distance camera - object. . . . . . . . . . . 169
5.6 Automaton governing camera rotation. . . . . . . . . . . . . . . . . . . 171
5.7 Illustration of the interaction possibilities with the extraction algorithms.172
5.8 Illustration 1. . . . . . . . . . . . . . . . . . . . . . . . . . . . . . . . . 173
5.9 Illustration 2. . . . . . . . . . . . . . . . . . . . . . . . . . . . . . . . . 174
5.10 Illustration 3. . . . . . . . . . . . . . . . . . . . . . . . . . . . . . . . . 174
5.11 Illustration 4. . . . . . . . . . . . . . . . . . . . . . . . . . . . . . . . . 175
5.12 Illustration 5. . . . . . . . . . . . . . . . . . . . . . . . . . . . . . . . . 175
5.13 Illustration 6. . . . . . . . . . . . . . . . . . . . . . . . . . . . . . . . . 176

xii List of Figures
5.14 Illustration 7. . . . . . . . . . . . . . . . . . . . . . . . . . . . . . . . . 1775.15 Illustration 8. . . . . . . . . . . . . . . . . . . . . . . . . . . . . . . . . 177
List of Tables
1.1 Supermarket transaction dataset . . . . . . . . . . . . . . . . . . . . . 151.2 Frequent itemset generation in an Apriori algorithm (Agrawal and
Srikant 1994 [3]). . . . . . . . . . . . . . . . . . . . . . . . . . . . . . . 221.3 Supermarket database sample for the Apriori algorithm example. . . . 231.4 Rule generation step in Apriori algorithm [3]. . . . . . . . . . . . . . . 251.5 Examples of monotonic and anti-monotonic constrains on an itemset
S. I is a set of items, V is a numeric value . . . . . . . . . . . . . . . 30
2.1 Qualitative performance of the various VEs [164]. . . . . . . . . . . . 57
3.1 Differences among the post-processing of association rules methodsfrom the visualisation process point of view. . . . . . . . . . . . . . . 94
3.2 Bertin’s graphical vocabulary [24]. . . . . . . . . . . . . . . . . . . . . 953.3 Matching graphic variables and variables [24]. . . . . . . . . . . . . . . 973.4 Dimension modalities . . . . . . . . . . . . . . . . . . . . . . . . . . . . 1083.5 3D VDM tool summary for pre-processing KDD task. . . . . . . . . . 1093.6 3D VDM tool summary for clustering KDD task . . . . . . . . . . . . 1123.7 3D VDM tool summary for classification KDD task . . . . . . . . . . . 1133.8 3D VDM tools: summary for association rules in KDD tasks. . . . . . 1153.9 3D VDM tool : combination of methods. . . . . . . . . . . . . . . . . . 115
4.1 The placement algorithm. . . . . . . . . . . . . . . . . . . . . . . . . . 1314.2 A supermarket transaction data set. . . . . . . . . . . . . . . . . . . . 147
5.1 The local association rule extraction algorithm. . . . . . . . . . . . . . 1605.2 The local specialisation anticipation function algorithm. . . . . . . . . 1625.3 The modified local specialisation anticipation function algorithm. . . . 1635.4 The local generalisation anticipation function algorithm. . . . . . . . . 1645.5 Behavioral traits . . . . . . . . . . . . . . . . . . . . . . . . . . . . . . 173
xiii

xiv List of Tables
Introduction
Context
The progress made in day’s current technology allows computer systems to storevery large amounts of data. Never before has data been stored in such large volumesas today (Keim 2002 [168]). The data are often automatically recorded by computer,even for each simple transaction of every day life, such as paying by credit card orusing a mobile phone. The data are collected because people believe that they couldpotentially be advantageous for management or marketing purposes.
This accumulation of information in databases has motivated the developmentof a new research field: Knowledge Discovery in Databases (KDD) (Frawley et al.1992 [105]) which is commonly defined as the extraction of potentially useful knowl-edge from data. KDD is an iterative process and requires interaction with the decisionmaker both to make choices (pre-processing methods, parameters for data mining al-gorithms, etc.) and to examine and validate the produced knowledge.
One of the most frequently-used data mining methods is: Association Rules. Incognitive science, several theories of knowledge representation are based on rules(Holland et al. 1986 [147]). Generally, the rules are of the following form: ”if an-tecedent then consequence”, noted Antecedent → Consequent where the antecedentand the consequence are conjunctions of attributes of the database and values thatthey should take. Association rules have the advantage of presenting knowledge ex-plicitly which can be easily interpreted by an non-expert user. Association rules wereinitially introduced by Agrawal et al. 1993 [2] for discovering regularities betweenproducts in large scale databases recorded by supermarkets. It finds combinationsof products that are often purchased together in a supermarket. For example, if acustomer buys milk, then he/she probably also buys bread.
Since the Apriori algorithm proposed by Agrawal and Srikant 1994 [3] which isthe first proposed algorithm for extracting association rules, many other algorithmshave been presented over-time. These algorithms use two interestingness measures(support and confidence) to validate the extracted association rules. The extractedrules should be validated beyond a user-specified minimum support and above a user-specified minimum confidence level. The support measure is the proportion of trans-actions in the database that satisfies the antecedent and the consequent (for example3% of customers buy milk and bread ). The confidence measure is the proportion oftransactions that verify the consequent among those that verify the antecedent (for
1
2 Introduction
example 95% of customers who buy milk buy also bread). The association rules gen-eration algorithm is usually separated into two steps. Firstly, a minimum support isapplied to find all frequent itemsets in a database. Secondly, these frequent itemsetsare used to form rules whose confidence is above the minimum confidence constraint.
Problematic
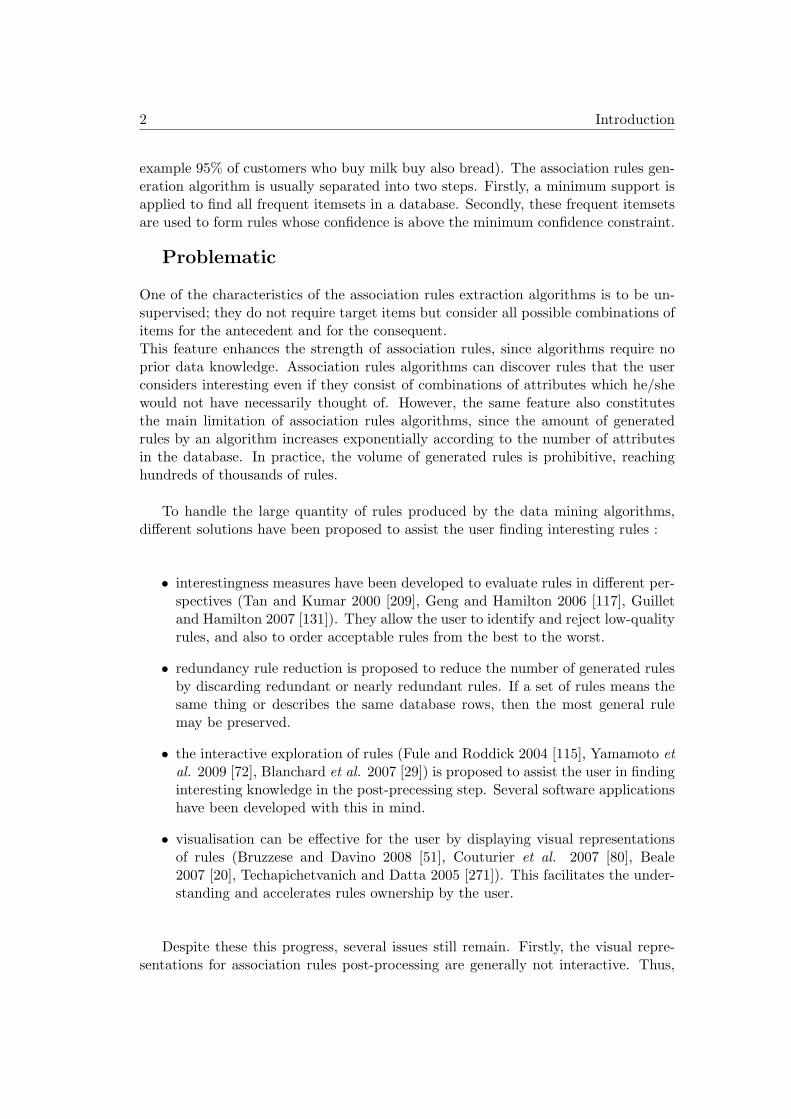
One of the characteristics of the association rules extraction algorithms is to be un-supervised; they do not require target items but consider all possible combinations ofitems for the antecedent and for the consequent.This feature enhances the strength of association rules, since algorithms require noprior data knowledge. Association rules algorithms can discover rules that the userconsiders interesting even if they consist of combinations of attributes which he/shewould not have necessarily thought of. However, the same feature also constitutesthe main limitation of association rules algorithms, since the amount of generatedrules by an algorithm increases exponentially according to the number of attributesin the database. In practice, the volume of generated rules is prohibitive, reachinghundreds of thousands of rules.
To handle the large quantity of rules produced by the data mining algorithms,different solutions have been proposed to assist the user finding interesting rules :
• interestingness measures have been developed to evaluate rules in different per-spectives (Tan and Kumar 2000 [209], Geng and Hamilton 2006 [117], Guilletand Hamilton 2007 [131]). They allow the user to identify and reject low-qualityrules, and also to order acceptable rules from the best to the worst.
• redundancy rule reduction is proposed to reduce the number of generated rulesby discarding redundant or nearly redundant rules. If a set of rules means thesame thing or describes the same database rows, then the most general rulemay be preserved.
• the interactive exploration of rules (Fule and Roddick 2004 [115], Yamamoto etal. 2009 [72], Blanchard et al. 2007 [29]) is proposed to assist the user in findinginteresting knowledge in the post-precessing step. Several software applicationshave been developed with this in mind.
• visualisation can be effective for the user by displaying visual representationsof rules (Bruzzese and Davino 2008 [51], Couturier et al. 2007 [80], Beale2007 [20], Techapichetvanich and Datta 2005 [271]). This facilitates the under-standing and accelerates rules ownership by the user.
Despite these this progress, several issues still remain. Firstly, the visual repre-sentations for association rules post-processing are generally not interactive. Thus,

3
they are used as complementary tools to present results in a more understandableform, but do not allow the user to look for interesting rules or to adjust the pa-rameters of the association rules extraction algorithms. In addition, interactivity inthe association rules post-processing is often poor. Thus, interactions are not fullyadapted to the interactive character of the post-processing approach, and in par-ticular do not take into account the special status of data. To better consider theuser’s interactivity needs, KDD processes must not only be viewed from the datamining perspective but also from the user perspective such as in user-centred systemsfor decision support. Finally, most of the approaches are massively limited to the”support/confidence” framework. Alone, these two measures does not allow the userto evaluate the pertinence of an association rule. Furthermore, the displayed rulesinterestingness measures are weakly enhanced although they are crucial indicatorsfor post-processing. On the other hand, all proposed representations for associationrules visualisation have been developed to represent association rules without payingattention to the relations between attributes which make up the antecedent and theconsequent, and the contribution of these to the rule, in spite of the fact that theassociation rule attributes may be more informative than the rule itself (Freitas 1998[109]).
The need for visualisation and interaction
Information visualisation can help the user deal with large amount of data by rep-resenting it in visual form to improve cognition for acquisition and the use of newknowledge. Unlike scientific visualisation which is constructed from measured or sim-ulation data representing objects associated with phenomena from the physical world,information visualisation is therefore a visual representation of information that hasno obvious representation. Visualisation improves cognitive tasks since it is based onthe perceptual abilities of the human visual system. Without considering cognitivepsychology, it can be said that visualisation improves the following attributes (Cardet al. 1999 [60], Ceglar et al. 2003 [63], Ware 2004 [287], Ward et al. 2010 [286]):
• identification of similarities;
• identification of singularities;
• identification of structures;
• memorisation.
In particular, some visual information such as, position, size or colour are pro-cessed unconsciously and very rapidly by the human brain (Card et al. 1999 [60],Bertin 1984 [24]). A human can instantly and accurately determine the most popu-lous city among a hundred other cities on a histogram. Executing the same task fromtextual information requires much more time and effort. With the arrival of the com-puter, visualisation has become dynamic; it is now an interactive activity. Visual Data

4 Introduction
Mining (VDM) (Michalski et al. 1998 [195]), has been defined by Ankerst 2001 [10]as ”a step in the Data Mining process that utilises visualisation as a communica-tion channel between the computer and the user to produce novel and interpretablepatterns”. VDM is an approach dedicated to interactive exploration and knowledgediscovery that is built on the extensive use of visual computing (Gross 1994 [129]). Inhis ecological approach to visual perception Gibson 1996 [120] established that per-ception is inseparable from the action. Thus, VDM studies do not only produce thebest representations to improve cognition, but also the best interaction to implementthese representations.
In 2D space, VDM has been studied extensively. More recently, hardware progresshas led to the development of real-time interactive 3D data representation and immer-sive Virtual Reality (VR) techniques. VR lies at the intersection of several disciplinessuch as computer graphics, computer aided design (CAD), simulation and collabora-tive work. It uses hardware devices and multimodal interaction techniques to immerseone or more users in a Virtual Environment (VE). These techniques are based on hu-man natural expression, action and perception abilities (Burdea and Coiffet 1993 [54]Fuchs et al. 2003 [112]). Thus, aesthetically appealing element inclusion, such as 3Dgraphics and animation, increases the intuitiveness and memorability of visualisation.Also, it makes the perception of the human visual system easier (Spence 1990 [255],Brath et al. 2005 [47]). In addition VR is flexible, in the sense that it allows differentrepresentations of the same data to better accommodate different human perceptionpreferences. In other words, VR allows for the construction of different visual repre-sentations of the same underlying information, but with a different look. Thus, theuser can perceive the same information in different ways. On the other hand, VRalso allows the user to be immersed and thereby provides a way to navigate throughthe data and manipulate them from inside. VR hence creates a living experience inwhich the user is not a passive observer, but an actor who is part of the world, infact, part of the information itself. In VR, the user may see the data sets as a whole,and/or focus on specific details or portions of the data. Finally, in order to interactwith a virtual world, no mathematical knowledge is required, only minimal computerskills (Valdes 2003 [283]).
In this context, the use of VR techniques is very relevant: it allows the user toquickly view and select rules that seem interesting. The selection can be made in-tuitively, via the use of a gestural interface such as tracking devices or a dataglovein immersive configurations, or by mouse clicks in desktop configurations. The ad-vantage of immersive configurations, (large screen and stereoscopic viewing) is thatit improves data visualisation and may support multi-user work. However, VR tech-niques are still relatively little used in the context of VDM. We believe that thistechnological and scientific approach has a high potential to efficiently assist the userin analytical tasks.

5
Contribution
The contribution of the thesis is divided into 5 topics. Firstly, we elaborate anoverview of interaction techniques and 3D representations for data mining. Then,we propose a new association rule metaphor to represent items that make up theantecedent and the consequent of an association rule. In addition, we propose a newapproach to assist the user in the post-processing of association rules: interactiverules visualisation. Then, we adapt the extraction rules to the interactive nature ofpost-processing by developing specific algorithms for local association rules extrac-tion. Finally, we implement our approach in the Virtual Reality visualisation toolwe call IUCAREVis (Interactive User-Centered Association Rules Exploration andVisualisation).
1. Classification for Visual Data Mining based on both 3D representa-tions and interaction techniques
We present and discuss the concepts of visualisation and visual data mining.Then, we present 3D representation and interaction techniques in the context ofdata mining. Furthermore, we propose a new classification for VDM, based onboth 3D representations and interaction techniques. Such a classification mayhelp the user choose a visual representation and an interaction technique for agiven application. This study allows us to identify limitations of the knowledgevisualisation approaches proposed in the literature.
2. Metaphor for association rule representation
We propose a new visualisation metaphor for association rules. This newmetaphor takes into account more accurately the attributes of the antecedentand the consequent, the contribution of each one to the rule, and their correla-tions. This metaphor is based on the principle of information visualisation foreffective representation and more particularly to enhance rules interestingnessmeasures.
3. Interactive rules visualisation
We propose a methodology for the interactive visualisation of association rules:IUCEAR (Interactive User-Centred Exploration of Association Rules) that isintended to facilitate the user task when facing large sets of rules, taking intoaccount his/her cognitive capabilities. In this methodology, the user buildshimself/herself a reference rule which will be exploited by local algorithms inorder to recommend better rules based on the reference rule. Then, the userexplores successively a small set of rules using interactive visualisation relatedwith suitable interaction operators. This approach is based on the principles ofinformation cognitive processing.

6 Introduction
4. Local extraction of association rules
We develop specific constraint-based algorithms for local association rules ex-traction. These algorithms extract only the rules that our approach is considersinteresting for the user. These algorithms use powerful constraints that signif-icantly restrict the search space. Thus, they give the possibility to overcomethe limits of exhaustive algorithms such as Apriori (the local algorithm ex-tracts only a small sub set of rules at each user action). By exploring rulesand changing constraints, the user may control both rules extraction and thepost-processing of rules.
5. The Virtual Reality visualisation tool IUCAREVis
IUCAREVis is a tool for the interactive visualisation of association rules. Itimplements the three previous approaches and allows rules set exploration, con-straints modification, and the identification of relevant knowledge. IUCAREVisis based on an intuitive display in a virtual environment that supports multipleinteraction methods.
Thesis Organisation
This manuscript is organised as follows:
Chapter 2 is concerned with Knowledge Discovery in Databases (KDD), and moreprecisely by Association Rule Mining techniques. It provides formal definitions andconsiders the limits of the classic algorithms for association rules generation and theproposed solutions found in the literature.
Chapter 3 introduces the visualisation and the VDM. We describe 3D representationand interaction techniques for VDM. Then, we present a new classification of visual-isation tools in data mining, regardless of the mining method used – pre-processingmethods, post-processing methods (association rules, clustering, classification, etc.)
Chapter 4 provides a detailed presentation of virtual reality (VR) and virtual en-vironments (VEs). We presents and analyses the various interaction devices andinterfaces commonly used in VR. In addition, we review existing 3D interaction tech-niques and metaphors used in VR applications. Then, we propose a classification ofhardware configurations and visual displays enabling user immersion in VEs. Finally,we present a comparison between 2D, 3D and virtual reality techniques in the contextof information visualisation and VDM.
Chapter 5 is dedicated to the post-processing IUCARE approach and IUCAREVistool; we describe the IUCARE methodology with reference to the principle of infor-mation visualisation and cognitive principles of information processing. We present

7
the visualisation metaphor used to represent association rules, basic choices, and avalidation study. We also present IUCAREVis features that have been achieved, anddescribe their implementation in detail.
Chapter 6 provides the association rules local mining algorithms. It present thearchitecture of IUCAREVis and discusses its choices that we made during the devel-opment. Also, it details the interaction techniques proposed in IUCAREVis.
Chapter 7 presents the conclusion of our contribution and give some proposals forfuture work.

8 Introduction

1Knowledge Discovery in Databases and
Association Rules
Contents
1.1 Introduction . . . . . . . . . . . . . . . . . . . . . . . . . . . . . . . . . 101.2 Knowledge Discovery in Databases . . . . . . . . . . . . . . . . . . . 10
1.2.1 Data Pre-Processing . . . . . . . . . . . . . . . . . . . . . . . . . . . . 111.2.2 Data Mining . . . . . . . . . . . . . . . . . . . . . . . . . . . . . . . . 121.2.3 Post-processing of Discovered Patterns . . . . . . . . . . . . . . . . . . 13
1.3 Association Rule Mining . . . . . . . . . . . . . . . . . . . . . . . . . . 141.3.1 Presentation . . . . . . . . . . . . . . . . . . . . . . . . . . . . . . . . 141.3.2 Terminology and Annotations . . . . . . . . . . . . . . . . . . . . . . . 15
1.4 Algorithms for Association Rule Extraction . . . . . . . . . . . . . 191.4.1 Exhaustive Algorithms . . . . . . . . . . . . . . . . . . . . . . . . . . . 19
1.4.1.1 Apriori – Classical Association Rule Mining . . . . . . . . . 211.4.1.2 Other algorithms . . . . . . . . . . . . . . . . . . . . . . . . . 26
1.4.2 Constraint-based Association Rule Mining . . . . . . . . . . . . . . . . 281.4.2.1 Constraints . . . . . . . . . . . . . . . . . . . . . . . . . . . . 291.4.2.2 Algorithms . . . . . . . . . . . . . . . . . . . . . . . . . . . . 30
1.4.3 Which approach to choose ? . . . . . . . . . . . . . . . . . . . . . . . . 321.5 Problematic of Association Rules and Solutions . . . . . . . . . . . 32
1.5.1 Interestingness Measures . . . . . . . . . . . . . . . . . . . . . . . . . . 331.5.2 Redundancy Rule Reduction . . . . . . . . . . . . . . . . . . . . . . . 351.5.3 Interactive Rule Post-processing . . . . . . . . . . . . . . . . . . . . . 36
1.5.3.1 Interactive Exploration and Extraction of Association Rules 371.5.3.2 Interactive Visual Exploration and extraction of Association
Rules . . . . . . . . . . . . . . . . . . . . . . . . . . . . . . . 401.6 Conclusion . . . . . . . . . . . . . . . . . . . . . . . . . . . . . . . . . . 49
9

10 Knowledge Discovery in Databases and Association Rules
1.1 Introduction
Knowledge Discovery in Databases (KDD) is the process of extracting interesting pat-terns from data. The KDD process is commonly defined in three successive stages:Data Pre-Processing; Data Mining; and finally Post-Processing. In Data Mining,different techniques can be applied among which association rule mining is one of themost popular.
The association rule mining method proposes the discovery of knowledge in theform of IF Antecedent THEN Consequent noted Antecedent → Consequent. In anassociation rule, the antecedent and the consequent are conjunctions of attributes ina database. More particularly, an association rule Antecedent → Consequent ex-presses the implicative tendency between the two conjunctions of attributes – fromthe antecedent toward the consequent.
The main advantage of the association rule mining technique is the extraction ofcomprehensible knowledge. On the other hand, the main disadvantage of this methodis the volume of rules generated which often greatly exceeds the size of the database.Typically only a small fraction of that large volume of rules is of any interest to theuser who is very often overwhelmed by the massive amount of rules. The cognitiveprocessing of thousands of rules takes much more time then generating them even bya less efficient tool. Imielinski et al. 1998 [152] believe that the main challenge facingassociation rule mining is what to do with the rules after having generated them.
To increase the efficiency of the rule generation process (to reduce the numberof discovered rules) several methods have been proposed in the literature. Firstly,different algorithms have been developed to reduce the number of generated rules.Secondly, several methods have been proposed to help the user to filter the algorithmresults. In this chapter we will look at mainly three of these methods: interestingnessmeasures, redundancy rule reduction, and interactive rule post-processing.
This chapter starts with a brief presentation of Knowledge Discovery in Databases.The second part is dedicated to association rule mining, definitions and notations.The third part presents algorithms for association rule extraction. Finally, the forthpart presents the problematic of association rule techniques and the solutions pro-posed in the literature to fulfil it.
1.2 Knowledge Discovery in Databases
Knowledge Discovery in Databases (KDD) was defined by Frawley et al. 1992 [105],and revised by Fayyad et al. 1996 [101], as the non-trivial process of identifying valid,novel, potentially useful, and ultimately understandable patterns in data.
1.2 Knowledge Discovery in Databases 11
KDD is a multi-disciplinary field, being integrated in areas such as artificial intel-ligence, machine learning, neural networks, data bases, information retrieval and datavisualisation. Furthermore, the KDD process is applied in various research fields. Inthe 1990s, there were only a few examples of knowledge discovery in real data. Nowa-days, more and more domains benefit from the utilisation of KDD techniques, suchas medicine, finance, agriculture, social work, marketing, military, and many others.
The KDD process aims at the extraction of hidden predictive information fromlarge databases. KDD methods browse databases to find hidden knowledge that ex-perts may miss because it is outside their expectations. Most companies alreadycollect and refine massive quantities of data and KDD is becoming an increasinglyimportant technique to transform this data into knowledge. Thus, KDD is commonlyused in a wide range of domains, and is characterised as being a non-trivial processbecause it can decide whether the results are interesting enough to the user. Thisdefines the degree of evaluation autonomy.
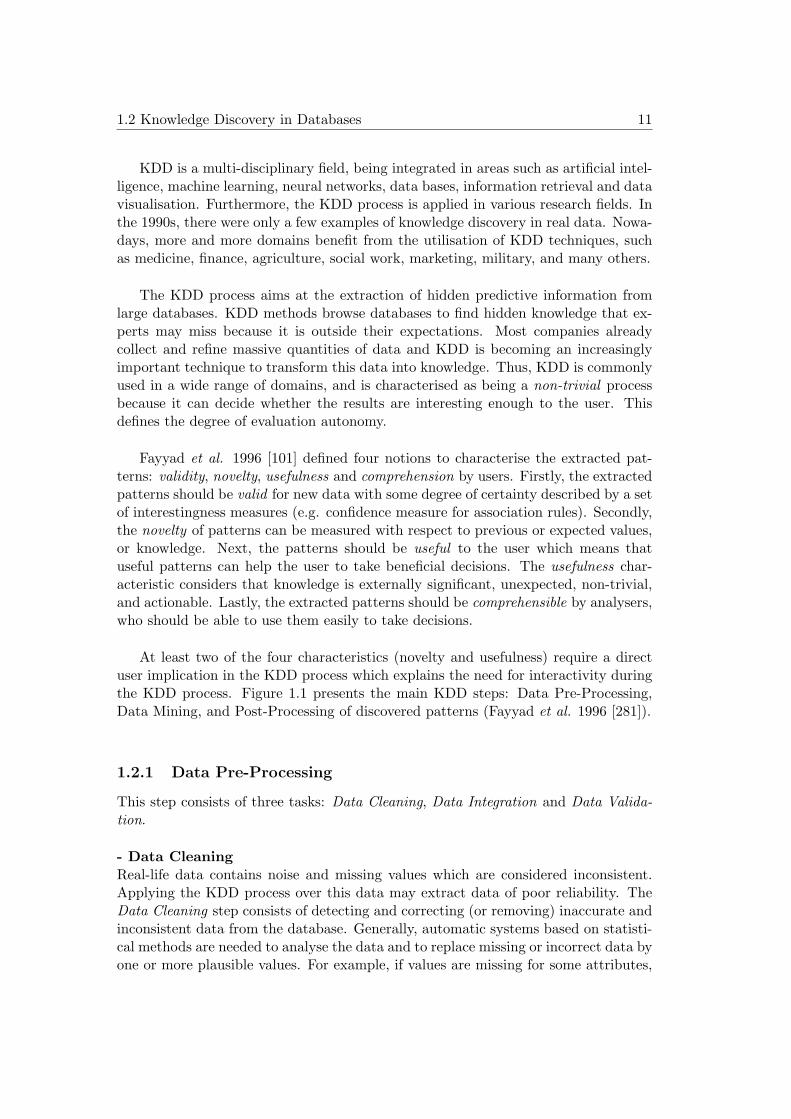
Fayyad et al. 1996 [101] defined four notions to characterise the extracted pat-terns: validity, novelty, usefulness and comprehension by users. Firstly, the extractedpatterns should be valid for new data with some degree of certainty described by a setof interestingness measures (e.g. confidence measure for association rules). Secondly,the novelty of patterns can be measured with respect to previous or expected values,or knowledge. Next, the patterns should be useful to the user which means thatuseful patterns can help the user to take beneficial decisions. The usefulness char-acteristic considers that knowledge is externally significant, unexpected, non-trivial,and actionable. Lastly, the extracted patterns should be comprehensible by analysers,who should be able to use them easily to take decisions.
At least two of the four characteristics (novelty and usefulness) require a directuser implication in the KDD process which explains the need for interactivity duringthe KDD process. Figure 1.1 presents the main KDD steps: Data Pre-Processing,Data Mining, and Post-Processing of discovered patterns (Fayyad et al. 1996 [281]).
1.2.1 Data Pre-Processing
This step consists of three tasks: Data Cleaning, Data Integration and Data Valida-tion.
- Data CleaningReal-life data contains noise and missing values which are considered inconsistent.Applying the KDD process over this data may extract data of poor reliability. TheData Cleaning step consists of detecting and correcting (or removing) inaccurate andinconsistent data from the database. Generally, automatic systems based on statisti-cal methods are needed to analyse the data and to replace missing or incorrect data byone or more plausible values. For example, if values are missing for some attributes,

12 Knowledge Discovery in Databases and Association Rules
Figure 1.1: An overview of the KDD process.
this step allows them to be computed by using heuristics. Another example is whensome values are inserted into the data by error. In this case, a set of methods can beapplied in order to determine which values are incorrect.
- Data IntegrationData Integration is used to collect data from multiple sources and to provide userswith a unified view of these data. The resulting database can presents incoherenceand the Data Integration step proposes solutions for this kind of problem. A valuableexample is redundancy. If an attribute A can be determined from another attributeB, then A is redundant compared to B. Another type of redundancy is the existenceof two attributes from different sources with different names, but which represent thesame information. One of them should be removed from the final data.
- Data ValidationThe goal of Data Cleaning and Data Integration is to generate a database whichcontains modified data. This data makes future analysis processes easier. Once thedatabase has been created, Data Validation is used to achieve two goals. The firstis to verify if the database was well developed during the Data Cleaning and theData Integration phases; if needed, data can be re-cleaned. The second goal of thisstep is to transform (or to reduce) the data allowing the KDD process to applya knowledge discovery technique. Data Mining can only uncover patterns alreadypresent in the data. The target dataset must be large enough to contain these patternswhile remaining concise enough to be mined within an acceptable time frame.
1.2.2 Data Mining
Data Mining step is central in the KDD process. Data Mining consists of applyingdata analysis and discovery algorithms to produce knowledge. Four main classes oftasks have been developed in the literature in order to extract interesting patterns.
1.2 Knowledge Discovery in Databases 13
- ClassificationClassification builds a model in order to map each datum into one of several pre-defined classes. The classification is composed of two phases. The first one is thelearning phase – the description of a set of classification rules called a learning model.The second phase is classification – verifying the precision of the classification rulesgenerated during the first phase by using test data. For instance, an e-mail programmight attempt to classify an email as legitimate or spam. The main classificationtechniques are: Decision Trees, Bayesian Classification, and Neural Networks.
- ClusteringThe clustering technique identifies a finite set of classes or clusters which describedata. This method partitions the data into classes in such a way that the intraclasssimilarity be maximised and the interclass similarity be minimised. In a first step,all the adequate classes are discovered, then the data are classified into those classes.Compare to classification, the classes are not known from the beginning, they arediscovered using a set of observations. Different methods of clustering have been de-veloped, among which the K-means method.
- Regression analysisRegression analysis is the oldest and best-known statistical technique used in DataMining. Basically, regression analysis takes a numerical dataset and develops a mathe-matical formula that fits the data. To create a regression model, a specific parametersvalue – which minimise the measure of the error, should be found. A large body oftechniques for carrying out regression analysis has been developed. Familiar methodssuch as linear regression and least squares (Legendre 1805 [179]) are presented.
- Association RulesThis technique aims to discover interesting rules from which new knowledge can bederived. Finding association rules consists of finding regularities in data by searchingfor relationships among variables (Piatetsky-Shapiro and Frawley 1991 [219]).Association rules is a frequent implications in data of the type IF X THEN Y ; X and Yrepresent respectively the antecedent and the consequent. The association rule miningsystem’s role is to facilitate the discovery and to enable the easy exploitation andcomprehension of results by humans. Association rules have been found to be usefulin many domains such as business, medicine, etc. For example a supermarket mightgather data on customer purchasing habits which aims to predict user behaviour.Using association rule mining, the supermarket can determine which products arefrequently bought together and uses this information for marketing purposes.
1.2.3 Post-processing of Discovered Patterns
Usually called post-processing (Baesens et al. 2000 [15]) or post-mining, this phaseis the final step of the KDD process. The Data Mining algorithm discovers a listof patterns with a given level of interest; the purpose of this step is to verify if theproduced patterns can be considered as a knowledge. Not all patterns found by the

14 Knowledge Discovery in Databases and Association Rules
data mining algorithms are necessarily valid.
The notion of interest or interestingness was defined by Silberschatz and Tuzhilin,1996 [248] to describe the interest of a pattern. This notion is presented as a generalmeasure over nine characteristics: conciseness, coverage, reliability, peculiarity, diver-sity, novelty , surprisingness, utility and actionnability. Thus, a pattern which meetsone or more criteria is consider as interesting and can be validated as a knowledge.
In most cases, it is the user who evaluates the discovered patterns, i.e. to deter-mine if the extracted pattern is interesting or not, in the post-processing step. Severaluser-driven methods and statistical database-oriented methods are available to assistthe user in this task. For example, it is common for the classification algorithms tofind patterns in the training set which are not present in the general data set; thisis called overfitting. In this case, it is important that the user be able to eliminatethem. For instance, a Data Mining algorithm trying to distinguish spam from legiti-mate e-mails would be trained on a training set of sample e-mails. Once trained, thelearned patterns would be applied to the test set of e-mails which had not been usedfor training. The accuracy of these patterns can then be measured by how many e-mails were correctly classified. Another method of pattern evaluation and validationis visualisation, which is related to the model of extracted patterns (see Chapter 3.3).
1.3 Association Rule Mining
Association rule mining, the task of finding correlations between attributes in adataset, has received considerable attention, particularly since the publication of theAIS and Apriori algorithm by Agrawal et al. 1993 [2] and Agrawal and Srikant 1994[3]. Initial research was largely motivated by the analysis of market data. The resultof these algorithms allows companies to better understand purchasing behaviour, and,as a result, better target market audiences. Association rule mining has since beenapplied to many different domains – all areas in which relationships among objectsprovide useful knowledge. In this section, we present association rules and formallydescribe the main notions, since they are at the very foundation of this thesis.
1.3.1 Presentation
Research in association rules was first motivated by the analysis of market basketdata. But, how could a set of shopping tickets produce some modifications in super-market layout?
In a first analysis of shopping basket data of a supermarket searching for purchas-ing behaviour, the decision-maker found a strong correlation between two productsA and B, of the form X → Y , where X (antecedent) and Y (consequent) are non-intersecting sets of attributes. For instance, milk → bread is an association rulesaying that when milk is purchased, bread is likely to be purchased as well. Suchextracted information can be used to make decisions about marketing activities such

1.3 Association Rule Mining 15
as promotional pricing or product placement. In our example, we could more effi-ciently target the marketing of bread through marketing to those clients that purchasemilk but not bread. Increasingly, association rules are currently employed in manyapplication areas including Web use pattern analysis (Srivastava et al. 2000 [260]),intrusion detection (Luo and Bridges 2000 [186]) and bioinformatics (Creighton andHanash 2003 [81]).
1.3.2 Terminology and Annotations
In general, the association rule mining technique is applied over a database D ={I, T}. Let us consider I = {i1, i2, . . . , im} a set of m binary attributes, called items.Let T = {t1, t2, . . . , tn} be a set of n transactions, where each transaction ti representsa binary vector, with ti[k] = 1 if ti contains the item ik, and ti[k] = 0 otherwise. Aunique identifier is associated to each transaction, called TID. Let X be a set of itemsin I. A transaction ti satisfies X if all the items of X exist also in ti, formally, wecan say that ∀ik ∈ X, ti[k] = 1. In conclusion, a transaction ti can be viewed as asubset of I, ti ⊆ I.
Definition 1.3.1An itemset X = {i1, i2, . . . , ik} is a set of items X ⊆ I. We can denote the
itemset X by i1, i2, . . . , ik, the comma being used as a conjunction, but most commonlyit is denoted by i1i2 . . . ik, omitting the commas.
Example 1.3.2 Let us consider a sample supermarket transaction dataset:
Tuple Milk Bread Eggs
1 1 0 1
2 1 1 0
3 1 1 1
4 1 1 1
5 0 0 1
Table 1.1: Supermarket transaction dataset
Suppose that D is the transaction table shown in Table 1.3.2, which describesfive transactions (rows) involving three items: milk, bread, and eggs. In the table, 1signifies that the item occurs in the transaction and 0 means that it does not.
The Tuple 4 = Milk Bread Eggs (or Milk, Bread, Eggs) is an itemset composedby three items: Milk, Bread and Eggs.
Definition 1.3.3An itemset X is a k-itemset if X is an itemset X ⊆ I and if it contains k items:
|X| = k.

16 Knowledge Discovery in Databases and Association Rules
Example 1.3.4 The itemset Milk, Bread, Eggs is a 3 -itemset.
Definition 1.3.5Let X ⊆ I and ti ∈ T . t(X) is the set of all transactions which contain the
itemset X. t(X) is defined by:
t : P(I) → T, t(X) = {ti ∈ T | X ⊆ ti}.
In a first attempt, an association rule was defined as an implication of the formX → yi, where X is an itemset X ⊆ I and yi is an item yi ∈ I with {yi} ∩ X = ∅Agrawal et al. 1993 [2].
Later, the definition was extended to an implication of the form X → Y , where Xand Y are itemsets and X ∩Y = ∅ (Agrawal and Srikant 1994 [3]). The former, X, iscalled the antecedent of the rule, and the latter, Y , is called the consequent of the rule.
A rule X → Y is described by two important statistical factors: support andconfidence.
Definition 1.3.6The support of an association rule is defined as the support of the itemset created
by the union of the antecedent and the consequent of the rule
supp(X → Y ) = supp(X ∪ Y ) = |t(X ∪ Y )| =P (X ∪ Y )
T.
The support presents the proportion of transactions in the data set which containsboth X and Y. If supp(X → Y ) = s, s% of transactions contain the itemset X ∪ Y .
Definition 1.3.7The confidence of an association rule is defined as the probability that a trans-
action containing Y also contains X. Therefore, the confidence is the ratio (c%) ofthe number of transactions that contain X, as well as Y :
confidence(X → Y ) =supp(X → Y )
supp(X)=
supp(X ∪ Y )
supp(X).
In most cases, association rules extraction algorithms seek to satisfy a user-specified minimum support threshold and a user-specified minimum confidence thresh-old at the same time. The association rule generation is always a two-step process:firstly the minimum support threshold is applied to find all frequent itemsets in adatabase, then these frequent itemsets and the minimum confidence threshold con-straint are used to validate the extracted rules.
Definition 1.3.8We note the minimum support threshold provided by the user as minSupp, and

1.3 Association Rule Mining 17
the minimum confidence threshold as minConf . An association rule X → Y is validif:
• the support of the rule is greater than minSupp: supp(X → Y )minSupp;
• the confidence of the rule is greater than minConf : conf(X → Y )minConf .
Example 1.3.9 Let us consider a sample of supermarket transaction dataset shownin Table 1.3.2:The association rule AR: Milk → Bread can be generated from D. The level of rulesupport is 60% because the combination of Milk and Bread occurs in three of thefive transactions, and the confidence is 75% because Bread occurs in three of the fourtransactions that contain Milk
Definition 1.3.10The lift was firstly defined by Brin et al. 1997 [48] pointing out the importance
of the correlation between the antecedent and the consequent.
The lift is defined as :
Lift(X → Y ) =P (X,Y )
P (X)P (Y )=
supp(X ∪ Y )
supp(X)supp(Y )=
Confidence(X,Y )
P (Y )
The Lift measures the degree of deviation from an independent case. A rule isconsidered independent if X and Y are independent: P (X ∪ Y ) = P (X)P (Y ).
Let us compute the lift value in the case of independence:
lift(X → Y ) =P (X,Y )
P (X)P (Y )=
P (X)P (Y )//independence case
P (X)P (Y )= 1.
Accordingly, the more that lift is greater than 1, the greater the interest of therule.
Example 1.3.11 Let us consider a simple association rule Milk → Bread [C =75%] – in 75% of cases, when we have Milk in a supermarket basket, we also haveBread. The confidence evaluates the rule as being interesting. On the other hand,the lift value could prove the contrary. The result depends on the support of theBread item in the database. Two cases are possible:
• supp(Bread) = 75%: alone, Bread item appears in 75% of baskets. Thus, it isnot surprising to have a confidence of 75%, because in reality, Milk does not

18 Knowledge Discovery in Databases and Association Rules
increase its chances to be in a supermarket basket. In consequence, computingthe lift as Lift(AR) = 1, indicate that there is no dependence between the twoitems Milk and Bread. Therefore, the rule is not interesting.
• supp(Bread)! = 75%: the more the support of Bread is different from 75%, themore the rule is interesting.
Definition 1.3.12The Information Gain was defined by Freitas 1999 [107] to evaluate the Infor-
mation Gain of rule antecedent attributes. The Information Gain is defined as :
InfoGain(Ai) = Info(G)− Info(G|Ai)
Info(G) = −n∑
j=1
Pr(Gj)logPr(Gj)
Info(G|Ai) =m∑
k=1
Pr(Aik)(−n∑
j=1
Pr(Gj|Aik))
where :
• n: the number of consequent attribute values;
• m: the number of values of the anticipation attribute Ai;
• InfoGain(Ai): the information gain of each attribute Ai in the rule antecedent;
• Info(G): the information of the rule consequent.
• Info(G|Ai): the information of the consequent attributes G given the antecedentattribute Ai, Aij denotes the j-th value of attribute Ai;
• Gj: the j-th value of the consequent attribute G;
• Pr(X): the probability of X;
• Pr(X|Y ): the conditional probability of X given Y.
The Information Gain measure can be positive or negative. An item with highpositive Information Gain is considered as a good predictor for the rule consequence.An item with high negative Information Gain is considered as a bad one and should beremoved from the association rule. From a rule interest perspective, the user alreadyknows the most important attributes for its field, and the rules containing these itemsmay not be very interesting. At the same time, a rule including attributes with lowor negative information gain (logically irrelevant for the association rule consequence)can surprise the user in cases where attribute correlation can make an irrelevant iteminto a relevant one.

1.4 Algorithms for Association Rule Extraction 19
Example 1.3.13 Let us consider a simple association rule Milk,Bread → Eggs.Lets suppose that the Information Gain of Milk and the Information Gain of Breadare:
InfoGain(Milk) = −0.7
InfoGain(Bread) = 0.34
We can conclude that Bread is more interesting than Milk which has a nega-tive Information Gain. Each time the consumer purchases Bread, he/she purchasesEggs but he/she does not purchase Milk. The Information Gain indicates that theimplication Milk → Eggs is not valid.
1.4 Algorithms for Association Rule Extraction
Association mining analysis is a two part process. Firstly the identification of sets ofitems or itemsets within the dataset. Secondly, the rule generation from these item-sets. As the complexity of the itemset identification is significantly greater than thatof rule generation, the majority of research in association rule extraction algorithmshas focused on the efficient discovery of itemsets. Given n distinct items ( n = ‖I‖)within the search space, there are 2n−1 (excluding the empty set which is not a validitemset) possible combinations of items to explore. This is illustrated in Figure 1.2which shows the search space lattice resulting from I = Milk, Bread, Eggs, Apples,Pears. Most of the time n is large, therefore naive exploration techniques are oftendifficult to solve.
Since the exhaustive reference algorithm proposed by Agrawal and Srikant 1994[3], called Apriori, many algorithms inspired by Apriori have been proposed to effi-ciently extract association rules. In parallel, many constraint-based algorithms havebeen developed to extract association rules with constraints other than support andconfidence. To summarise, relevant research can be organised into two groups of al-gorithms:
• Exhaustive algorithms
• Constraint-based algorithms
1.4.1 Exhaustive Algorithms
Exhaustive algorithms for association rule extraction all run on the same determin-istic task: given a minimum support threshold and a minimum confidence threshold,they produce all rules that have support above the threshold (generality constraint)and a confidence above the threshold (validity constraint). Many adaptations andgeneralisations of association rules have been also studied. The main ones are: the

20 Knowledge Discovery in Databases and Association Rules
����������
ABCC
DECF�������
DECF�������
��������
DECF ����� ��� ���C� ����
DECF����� DECF�����C� DECF������ ����������C� ����������� ��������C� ��������� ���C�������
DECF�������
�������C�
DECF�������
���������
DECF�����
������C�
DECF�����
��������
DECF�����C�
��������
����������
�������C�
����������
����������
����������C�
�����������
��������C�
���������
DECF�����������������C�������
Figure 1.2: Search space lattice.
numeric association rules –involving quantitative variables (Srikant and Agrawal 1996[257], Fukuda et al. 2001 [114]), the generalised association rules –to operate a hier-archy of concepts (Srikant and Agrawal 1997 [259], Han and Fu 1995 [135]), a nd thesequential patterns extracted from temporal data (Srikant and Agrawal 1996 [258],Mannila et al. 1997 [191], Zaki 2001 [306]).
Association rule extraction algorithms are often decomposed into two separatetasks:
• discover all frequent itemsets having support above a user-defined thresholdminSupp.
• generate rules from these frequent itemsets having confidence above a user-defined threshold minConf .

1.4 Algorithms for Association Rule Extraction 21
Differences in performance between the different exhaustive algorithms dependmainly on the first task (Ng et al. 1998 [207]). The identification of valid itemsets iscomputationally expensive, because it requires the consideration of all combinationsof distinct items in I (or 2n − 1 subset). The search space growth is exponential as nincreases. Therefore, it is the first step that requires maximum efforts to optimise theassociation rule extraction algorithm. Itemset identification research thus focuses onreducing the number of passes over the data and on constraining exploration. Thesecond task (rule generation) is less expensive. Nevertheless, there are two majorproblems with association rules generation:
• too many rules are generated (rule quantity problem).
• not all the rules are interesting (rule quality problem).
Both problems are not entirely independent. For example, knowledge about thequality of a rule can be used to reduce the number of generated rules.
1.4.1.1 Apriori – Classical Association Rule Mining
The fundamental exhaustive algorithm is Apriori which was designed by Agrawaland Srikant 1994 [3]. To generate frequent itemsets the Apriori algorithm uses thebottom-up, breadth-first method. This algorithm takes advantage of the downwardclosure property (also called anti-monotonic) of support to reduce the search spaceof the frequent itemset extraction: if an itemset is not frequent then any of it super-itemsets is frequent.
The Apriori algorithm has two main parts (i)frequent itemset generation and (ii)association rule generation.
Table 1.4.1.1 presents a frequent itemset generation task of Apriori which is car-ried out level by level. The set of candidates L1 is formed by the set of items I,given k = 1, otherwise it is based on generating-itemset function involving membersof Lk−1. More precisely, The algorithm gradually generates the set of itemsets from1-itemsets to k-itemsets. In the first pass over the data (line 1 in the algorithm),support for the 1-itemsets is computed in order to select only the frequent ones. Inthe next steps (lines 2 to 10), the algorithm starts from the (k-1)-itemsets and usesthe downward closure property to generate k-itemsets.
Thus, the function generating-itemset (line 3) generates new potentially frequentk-itemsets from the frequent (k-1)-itemsets already generated in the previous step.Potentially frequent itemsets are called candidates. During a new pass over the data,the support of each candidate is computed (lines 4 to 8). Then frequent candidates,that have support above the threshold, are validated.

22 Knowledge Discovery in Databases and Association Rules
Input: Database D
Output: L: a set of couple (I, sp(I)) when I is an itemset and sp(I) its support
1. L1 = {1-itemsets}
2. forall (k = 2;Lk−1 6= ∅; k ++) do begin
3. Ck = generating-itemset(Lk−1)
4. forall transactions t ∈ D do begin
5. Ct = subset(Ck, t)
6. forall candidates c ∈ Ct do
7. c.count++
8. endfor
9. Lk = {c ∈ Ck | c.count ≥ minsup}
10. endfor
generating-itemset(Lk−1)
12. forall itemsets c ∈ Ck do begin
13. forall (k-1)-subsets s of c do begin
14. if (s ∈ Lk−1) then
15. delete c from Ck
16. endfor
17. endfor
18. return L
Table 1.2: Frequent itemset generation in an Apriori algorithm (Agrawal and Srikant1994 [3]).
The Apriori algorithm has the particularity of using a support counting method.The function subset (line 5) receives the set of candidates and a transaction t of thedatabase and returns the set of candidates satisfying the transaction. In line 7 thesupport of each candidate is increased. In line 9, the frequent k-itemsets are selectedand they become the entry for the next step of the algorithm. The algorithm endswhen no frequent itemset is generated.
Example 1.4.1 Let us consider a sample of the supermarket transaction database(Table 1.4.1) and a minimum support threshold of 50%.
In Figure 1.3, we present the process of generating frequent itemsets using bythe Apriori algorithm. The algorithm starts with an empty list of candidates, and,during the first pass, all 1 -itemsets are generated. Only the itemsets satisfying thesupport constraint (50%) become candidates (black). Therefore, the itemsets that

1.4 Algorithms for Association Rule Extraction 23
Tuple Transaction
1 Milk, Bread, Eggs, Apples
2 Milk, Bread, Apples
3 Bread, Eggs
4 Milk, Bread, Eggs, Pears
Table 1.3: Supermarket database sample for the Apriori algorithm example.
have support above the threshold (50%) are eliminated (red). The itemset {Pears}with the support of 25% does not satisfy the support constraint and consequently isconsidered as a non-frequent item and, thus, is not kept as a candidate.
In the next passes, to reduce time execution the not-frequent itemsets are notcomputed. The k -itemsets which include an infrequent (k-1)-itemsets are consid-ered as not frequent. For instance, the {Bread, Pears} {Eggs, Pears} {Milk, Pears}and {Apples, Pears} 2 -itemsets are not generated. The itemsets not containing the{Pears} itemset are potentially frequent.
On the other hand, not all generated 2 -itemsets are frequent. For instance, theitemset {Eggs, Apples} is not frequent even though { Apples} and {Eggs} are fre-quent. A (k+1)-itemsets is frequent when all sub (k-1)-itemsets are frequent. Forinstance, the {Milk, Bread, Eggs} is frequent because the three 2 -itemsets composingit are frequent {Milk, Bread}, {Milk, Eggs} and {Bread, Eggs}. On the contrary,the {Milk, Eggs, Apples} itemset is not frequent because one of the three 2 -itemsets({Eggs, Apple}) composing it is not frequent even though {Milk, Eggs} and {Milk,Apples} are frequent.
The second step of the Apriori algorithm is rule generation. This step aims tocreate association rules from the frequent itemsets generated in the first step. Thealgorithm is presented in Table 1.4.1.1.
The method used for rule extraction is very simple. Let us consider the set offrequent itemsets L. Considering li ∈ L, the method finds all subsets a of li, a ⊆ li,and proposes a set of rule candidates of the form a → (li − a). Only rules that havea confidence level above the threshold are generated.
In lines (1-2) the recursive procedure generate − rules is called for each set ofk-itemsets. generate− rule generates recursively the sub-itemsets level by level (line4) to produce rules which are further tested against the confidence level.

24 Knowledge Discovery in Databases and Association Rules
����������
ABCC
DECF�������
DECF�������
��������
DECF ����� ��� ���C� ����
DECF����� DECF�����C� DECF������ ����������C� ����������� ��������C� ��������� ���C�������
DECF�������
�������C�DECF�������
���������
DECF�����
������C�
DECF�����
��������
DECF�����C�
��������
����������
�������C�
����������
����������
����������C�
�����������
��������C�
���������
DECF�����������������C�������
DECF�������
��������C�
DECF�������
���������
DECF�������
���C�������DECF�����
���C�������
����������
���C�������
�������� � ���� ���
���� ��� ��� ���� ���� ��� ���� ���� ���� �
��� ��� ���� ���� ���� � ���� � �����
���� ���� � � �
�
Figure 1.3: Tree of the frequent itemset generation.
Example 1.4.2 Let us consider the itemset l1 = {Milk, Bread, Eggs} [S = 50%].six association rules can be extracted:
• R1: Milk, Bread → Eggs conf(R1) = 66%
• R2: Milk, Eggs → Bread conf(R2) = 100%
• R3: Bread, Eggs → Milk conf(R3) = 66%
• R4: Milk → Bread,Eggs conf(R4) = 66%
• R5: Bread → Milk,Eggs conf(R5) = 50%
• R6: Eggs → Milk, Bread conf(R6) = 66%

1.4 Algorithms for Association Rule Extraction 25
Input: Set of itemsets l
Output: Set of association rules Rules
1. forall itemsets lk, k ≥ 2 do
2. call generate− rules(lk, lk);
3. procedure generate− rules(lk: k-itemset, am: m-itemset)
4. A = {(m− 1)-itemsets am−1 | am−1 ⊂ am }
5. forall am−1 ∈ A do begin
6. conf = support(lk)/support(am−1)
7. if (conf ≥ minConf) then
8. R = am−1 ⇒ (lk − am−1)
9. if (m− 1 > 1) then
10. call generate− rules(lk, am−1)
11. Rules = Rules ∪R
12. return Rules
Table 1.4: Rule generation step in Apriori algorithm [3].
We define the confidence threshold minConf = 80%. Only R2 is generated bythe algorithm.
The algorithm provides all frequent itemsets and their support which are neces-sary to calculate the rules for interestingness measures. For cases where the user isnot interested by all itemsets and their support, algorithms for extracting maximalfrequent itemsets have been developed (Bayardo and Roberto 1998 [18], Teusan etal. 2000 [272], Gouda and Zaki 2001 [123], Burdick 2001 [55]). Maximum frequentitemsets are frequent itemsets in which any of it’s super-itemsets are frequent. Theycan easily find the frequent itemsets since all the frequent itemsets are composed ofthe set of maximal frequent itemsets and their sub-itemsets.
The efficiency of the Apriori algorithm depends on both the minimum supportthreshold and the studied data. From a qualitative point of view, we call sparsedata (respectively dense) when the items present in the transactions are infrequent(respectively frequent) compared to the non-present items (proportion of 1 comparedto 0). For a given support threshold:
• the more the data is sparse, the more the anti-monotonic property is effectiveto reduce the search space. Therefore, the algorithm can handle a large numberof items;
• the more the data is dense, the less the anti-monotonic property is effective
26 Knowledge Discovery in Databases and Association Rules
to reduce the search space. Therefore, the algorithm cannot support a largenumber of items.
If the number of frequent itemsets generated by an algorithm makes it unusable,the only way to process the data is to increase the support threshold.
In this section, we saw that the Apriori algorithm is able to extract a set of asso-ciation rules from a database. In this context, two problems concerning the qualityof the algorithm emerge: the rapidity and the efficiency.
• the rapidity : deals with the capacity of the algorithm to generate the expectedresults in a reasonable time without using large quantities of resources. Thefrequent itemset generation step is the critical phase of the process. Itemsetgeneration is an exponential problem, the search space to enumerate all thefrequent itemsets is 2n−1, where n is the number of items. Moreover, the algo-rithm makes several passes over data depending on the length of the generateditemsets. These tasks imply an exponential growth of the resources employedduring the rule mining process and an considerable increase of the executiontime. On the other hand, the rule generation step doesn’t need new passes overthe database, and hence, the execution time is not very high.
• the efficiency : deals with the capacity of the algorithm to produce interestingresults. The main drawback of classical association rule mining techniques suchas the Apriori algorithm is the huge number of produced rules which are quasiunusable by the user (millions of association rules can be extracted from largedatabases with a reduced support threshold). To address this shortfall, muchresearch work has been carried out to reduce the number of extracted rules. InSection 1.5 we make a survey of rule number reduction methods.
1.4.1.2 Other algorithms
An important number of algorithms, based on Apriori in most cases, have been pro-posed with the aim of optimising frequent itemset generation step by introducingcondensed representations, dataset partitioning, dataset pruning or dataset access re-duction. Among the new algorithms we outline the most important ones: FP-Growth(Han and Pei 2000 [136]), AprioriTID (Agrawal and Srikant 1994 [3]), Partition(Savasere et al. 1995 [243]), and Dynamic Itemset Couting (DIC) (Brin et al. 1997[48]).
To generate frequent itemsets, the major part of association rule extraction algo-rithms generate candidates and then check their support from database transactions.This is the most expensive step in exhaustive algorithms. The Pattern Growth algo-rithms have been introduced to eliminate the need for candidate generation and thusreduce the algorithms execution time. Instead of the candidate generation method,Pattern Growth algorithms use complex hyperstructures that contain representations

1.4 Algorithms for Association Rule Extraction 27
of the itemsets within the dataset.
The best known Pattern Growth algorithm is the FP-Growth algorithm introducedby Han and Pei 2000 [136]. Later, in 2005, Grahne and Zhu 2005 [124] developedthe FP-Growth* algorithm which improves the previous algorithm performance dueto FP-array, a new data structure which allows the passes over the FP-tree to beimproved.
FP-Growth is a memory-based algorithm and was developed to process dense data.The algorithm does not work directly on the data but on a condensed representationof it (FP-tree) to improve performance and efficiency of the frequent itemset step.The FP-tree is constructed by passing over all the itemsets in depth first (contrary toApriori). The construction step needs two passes over the data. First, the algorithmconstructs an FP-tree using the set of frequent singleton itemsets. Then, it mapseach database transaction into a tree path.
After the construction step, the algorithm generates all frequent itemsets of vari-ous cardinalities from the FP-tree representation by successively concatenating thosefrequent singleton itemsets found in the tree path. If the FP-tree does not fit into thememory, recursive projections and partitioning are required to break such databasesinto smaller pieces. As a result there will be a corresponding performance overheadwhich will be similar to the Apriori algorithm. To overcome this limitation, severalimprovements of the FP-tree structure FP-Growth algorithm have been proposed(Cheung and Zaiane 2003 [69], Coenen et al. 2004[76], Li 2001 et al.[182]).
By using a new database for counting the itemset support, the AprioriTID al-gorithm, developed by Agrawal and Srikant 1994 [3], extends Apriori by eliminatingmultiple passes over of the database D. The new database has the form < TID,Ci
k >,where TID is the identifier of an itemset, and Ci
k represents the subsets of the itemsetTID of length k. Thus, transactions are represented by the k-itemsets that describethem. For example, if D = (bread,milk, apples), then equivalently Ci
1 = ({bread},{milk}, {apples}, {pears}), however, Ci
2 contains all potential 2-itemsets within D,hence Ci
2= ({bread,milk}, {bread, apples}, {bread, pears}, {milk, apples}, {milk, pears}, {apples, pears}).It is apparent from this example that this new database may be larger than D. Thus,if Ci
k fits in memory AprioriTID is faster than Apriori, but when Cik is too big it
cannot fit in the memory, and the computation time becomes much longer than Apri-ori. A new algorithm called AprioriHybrid was proposed to fulfil the AprioriTIDalgorithm and the Apriori algorithm drawbacks.
As its name denotes, Partition algorithm, developed by Savasere et al. 1995 [243]is based on the idea of partitioning the database in several parts which may be fittedinto the memory. To be frequent in the complete data, an itemset must be at leastfrequent in one part. The Partition algorithm computes all itemsets that are frequentlocally within a part. Therefore the Partition algorithm analyses each part like theApriori algorithm, except that the itemset supports are not computed by counting

28 Knowledge Discovery in Databases and Association Rules
the occurrences. Indeed, the part is written in a better format suited to memoryprocessing which reverses individuals and variables – instead of describing each indi-vidual with the items, the algorithm describes each item with the list of individualswhich make it, called theid-list (every individual is designed by an id). Each item alsohas its id-list, and the number of occurrences of an itemset is given by the number ofinputs in it’s id-list. So to determine the support of an itemset I in a part, it sufficesto calculate the intersection between the id-lists of two of its sub-itemset A and Bsuch that I = A and B. After analysing all parts, Partition checks for each itemsetfound frequently on a one part if it is often frequent in the complete data. Ultimately,the algorithm makes only two passes over the full data: the first to partition the dataand the second to verify the frequent itemsets.
The Dynamic Itemset Couting (DIC) algorithm, introduced by Brin et al. 1997[49], is a relaxed version of Apriori. The DIC algorithm reduces the number of passesover the database by introducing a new interesting idea: possible frequent itemsets –(k + 1) candidates are computed from the k pass. When a k-itemset is consideredfrequent, all the (k+1)-itemset candidates that the latter can produce are generated.The basic principle is: during a pass over the data, if the occurrences of an itemsetis already sufficiently high so that we know that it is common, then the itemset canalready be used as a candidate for the next level. Therefore, counting occurrencesof k-itemset candidates will be started as soon as the counters of all its sub-itemsetsof length k-1 are high enough toward the support threshold. If the counting of thenew candidate begins on the x-th individual, it will stop on (x-1)-th individual in thefollowing passes. Finally, DIC makes fewer passes over the data then Apriori.
A comparison of the main association rule mining algorithms has been made byHipp et al. 2000 [58], and by Goethals and Zaki 2003 [122] on various real andsynthetic data sets. They show that the algorithm performance may vary accordingto the studied data. There is no one better algorithm than an other.
1.4.2 Constraint-based Association Rule Mining
At the same time when exhaustive algorithms were being developed, constraint-basedalgorithms which were introduced by Fu and Hah 1995[111]. Constraint-based algo-rithms extract specific association rules with additional constraints in conjunctionwith support and confidence thresholds. Nevertheless, even if these two constraintsare basic, it is quite difficult to find the right values which produce interesting rules.Using wrong thresholds could have two consequences: firstly, the algorithm may misssome interesting rules and, secondly, it could generate trivial ones. Furthermore,users could have difficulties to understand the meaning of data-oriented constraintsand to set minimal thresholds for these constraints. Constraint-based mining pro-vides the user with the possibility to impose a set of constraints over the content ofthe discovered rules. Those constraints can significantly reduce the exploration spacewhile improving the quality or interest of the results.

1.4 Algorithms for Association Rule Extraction 29
1.4.2.1 Constraints
Constraint-based algorithms use constraints to reduce the search space in the frequentitemset generation step (the association rule generating step is identical to that ofexhaustive algorithms). The most common constraint is the support minimum thresh-old. If a constraint is reflexive, its inclusion in the mining process can provide signif-icant reduction of the exploration space due to the definition of a boundary withinthe search space lattice, above or below which exploration is not required. Generally,constraints (C) are provided by means of different formalisms: user knowledge con-straints, data constraints, dimensional constraints, interestingness constraints, andrule constraints.
The role of constraints is very well-defined: they generate only association rulesthat are interesting to users (Zhao and Bhowmick 2003 [310], Hipp and Guntzer 2002[145]). The technique is quite trivial: the rules space is reduced whereby remainingrules satisfy the constraints. If we take the example of the shopping basket, the con-straints can be:
1. association rules must end with a product whose price is lowest minprice;
2. the total price of products in the rule antecedent must be less then the totalprice of the products in the rule consequent;
3. the rules must include only textile products.
These examples illustrate two important issues. On the one hand, the constraintscan focus on a numerical characteristic of the items (product prices in the examples1 and 2). On the other hand, the constraints can be expressed using a taxonomy ofconcepts describing the items (in example 3, a taxonomy that distinguishes textileproducts).
The two main categories of constraints that have been studied are anti-monotonicconstraints and monotonic constraints:
• monotonic constraints are constraints that when valid for an itemset are in-evitably valid for any of its super-itemsets. For example, consider a rule con-straint (sum(S) ≥ 50$). If an itemset (S) satisfies the constraint that is thesum of the prices in the set is greater then 50$, further additional items to Swill increase the cost and will always satisfy the constraint.
• anti-monotonic constraints are constraints that when invalid for an itemset,are also invalid for any of its super-itemsets. For example, consider a ruleconstraint (sum(S) ≤ 50$), if an itemset (S) does not satisfy the constraint(the price summation of the itemset is more than 50$), then this itemset can

30 Knowledge Discovery in Databases and Association Rules
be pruned from the search space since adding more items into the set will makeit more expensive and thus will never satisfy the constraint.
Therefore, the monotonic constraint is the negation of the anti-monotonic con-straint and vice-versa. Thus, a constraint-based algorithm is optimised to one con-strain category among others.
In relation with itemset identification, a reflexive constraint is one that never de-creases (monotonic constraint) or increases (anti-monotonic constraint) as the numberof items within an itemset increases. Reflexive constraint inclusion can, therefore, re-duce search space by effectively eliminating all super-itemsets of an invalid itemset.For example, the support threshold constraint is an anti-monotonic constraint. Givenan invalid itemset whose supportitemset ¡ minsup, all super-sets of this item can beeliminated. The support constraint was first introduced within the Apriori algo-rithm (Agrawal and Srikant 1994 [3]). Examples of monotonic and anti-monotonicconstraints are shown in Table 1.4.2.1.
Monotonic constraints Anti-monotonic constraints
S ⊇ I S ⊆ I
min(S) ≤ V min(S) ≥ V
max(S) ≤ V max(S) ≤ V
sum(S) ≤ V sum(S) ≤ V
length(S) ≥ V length(S) ≤ V
Table 1.5: Examples of monotonic and anti-monotonic constrains on an itemset S. I is aset of items, V is a numeric value
1.4.2.2 Algorithms
Most of the constraint-based algorithms are generalisations of the exhaustive Apriorialgorithm (Agrawal and Srikant 1994 [3]). As Apriori used an anti-monotonic con-straint (support), all constraint-based algorithms descended from Apriori can exploitthese constraints effectively.
An anti-monotonic constraint can be used before the pass over the data (afterline 4 of the algorithm Table 1.4.1.1), because it needs data reading (like the supportminimum threshold constraint tested in line 9 of the algorithm 1.4.1.1). However, amonotonic constraint can be used after itemset candidate generation (between line3 and line 4 in the algorithm Table 1.4.1.1), because it does not need data reading.Monotonic constraints are able to generate itemsets without generating candidateitemsets which make them more difficult to use.

1.4 Algorithms for Association Rule Extraction 31
The problem with monotonic constraints as presented by Jeudy and Boulicaut2002 [160] is that monotonic constraints can deteriorate the anti-monotonic con-straints by pruning performance (see example below). In this situation, the introduc-tion of monotonic constraints in the process of frequent itemset generation increasesthe size of the research space instead of decreasing it. An other approach that can bemore efficient is to use constraints in the post-processing of the association rule stage– after generating the frequent itemsets, to filter the obtained results.
Example 1.4.3 Let us consider the data described by a set of items I = (Milk,Bread,Eggs). The anti-monotonic constraint C1 is the minimum support threshold,and the monotonic constraint C2 is a constraint which requires that the item Milkmust be in the itemset.
At the end of the algorithm’s first iteration (level k = 2). The sets of itemsetsthat verify the two constraints are F2 = ({Milk,Bread}, {Milk,Eggs}). The itemset{Bread,Eggs} is does not in F2 – it not verify the constraint C2 and, thus, it is notgenerated as a candidate for the next level. In the next iteration (level k = 3), theset of candidate itemsets F3 = ({Milk,Eggs,Bread}) is generated, then it should bepruned because it does not verify the constraint C1. Suppose that {Bread, Eggs}does not verify the constraint C1. This information is unknown by the algorithmsince this itemset has not been generated as a candidate from the lower level. There-fore it is impossible to predict that {Milk, Bread, Eggs} does not verify C1. Whenin doubt, {Milk, Bread, Eggs} is kept in F3. The problem is that some itemsetscan be discarded after using the monotonic constraint C2 whereas the anti-monotonicconstraint C1 could prune large parts of the search space.
These general principles for constraint use has been exploited by different re-searchers. The CAP algorithm proposed by Ng et al. 1998 [207] investigated ap-plying item constraints (monotonic constraints) to generate frequent itemsets. Theyrestricted the items or the combinations of items that are allowed to participate inthe mining process. Earlier, in 1992, Smyth and Goodman 1992 [254] describeda constraint-based rule miner integrating an interestingness constraint described bythe dimension of rules, thus, long rules are considered less interesting. The FP-growthalgorithm has also been adapted in constraint-based algorithm. FIC (Pei and Han2000 [218]) and FPS (Leung et al. 2002 [180]) (extensions of FP-growth algorithm)were proposed to exploit constraints for mining constrained frequent sets. Jeudyand Boulicaut 2002 [160] proposed an extension of the Apriori algorithm that usesa conjunction of monotonic and anti-monotonic constraints. Finally, despite thesevarious publications, finding the best way to exploit the constraint combinations ofanti-monotonic constraints and monotonic constraints whatever the data remains anopen problem.

32 Knowledge Discovery in Databases and Association Rules
1.4.3 Which approach to choose ?
If the user wants to exploit constraints in order to target association rule extractionresults that interest him/her, then he/she must choose between two alternatives:
• run a constraint-based algorithm;
• run an exhaustive algorithm, then apply constraints in the post-processing stepto filter the algorithm results.
The first solution presents two advantages. The first one is that using constraintsallows the research space to be reduce. This solution avoids consuming resources andtime for association rules that do not interest the user. The second one is that insome cases constraint-based solutions are the only solutions proposed to process thedata with the same minimum support threshold as exhaustive algorithms. The com-binatorial explosion of frequent itemset numbers makes it impossible for exhaustivealgorithm execution. Then – since pruning do not only use the minimum supportthreshold constraint, it is possible for constraint-based algorithms to use even lowerminimum support thresholds. For instance, very specific association rules can be gen-erated by a constraint-based algorithm which would not be discovered by an exhaus-tive algorithm like Apriori because of the combinatorial explosion. The possibility ofapplying very specific rules often provides unusual and unknown knowledge for theuser, which make it very interesting (Freitas 1998 [109]).
The second solution has also his own advantages. The first advantage as we saw isthat constraint-based algorithms can not exploit optimally anti-monotonic constraintsin all situations. Sometimes, applying constraints in the post-processing stage canbe faster than generating results with a constraint-based algorithm. The secondadvantage takes its strength from the iterative and interactive nature of the datamining process itself. In the data mining process, the user can multiply successiveassociation rule extractions. Every new extraction query depends on the antecedentquery results. If an exhaustive algorithm can process all frequent itemsets in anacceptable response time than all frequent itemsets can be available for any queryrequest by the user. It can be sufficient to generate association rules – if the minimumsupport threshold is not decreased, from the frequent itemset already calculated.Consequently, if the frequent itemset generation stage is processed completely, theuser doesn’t care about the execution time, and does not change the minimum supportthreshold, this solution can promote response time (Geothales and Bussche 1999[121]).
1.5 Problematic of Association Rules and Solutions
The main disadvantage of the rule extraction process is that the volume of generatedrules often greatly exceeds the size of the underlying database. Typically only a small

1.5 Problematic of Association Rules and Solutions 33
fraction of that large volume of rules is of any interest to the user who is very oftenoverwhelmed with the massive amount of rules. Cognitive processing of thousandsof rules takes much more time then generating them even by a less efficient tool.Imielinski 1998 [152] believes that the main challenge facing association rule miningis what to do with the rules after having generated them.
Association rule generation methods have to face two types of problem:
• rule quantity: the huge number of mined association rules makes manual in-spection practically infeasible. It also increases the difficulty in interpreting theresults and obtaining relevant knowledge.
• rule quality: an equally or possibly more important issue concerns the qualityof the extracted rules. Rules such as ”age = 10 → unemployed”, while beingstatistically valid in a database are obvious since they are trivial knowledge.For instance, Major and Mangano 1995 [189] mined 529 rules from a hurricanedatabase of which only 19 were found to be actually novel, useful and relevant.
There has been various research aimed at the attenuation of both problems (rulequality and rule quantity). Proposed solutions for the rule quality problem relyon the specification of interestingness measures to represent the novelty, utility orsignificance of rules. By ordering the discovered rules according to their degree ofinterestingness, one can ensure that only good quality rules are presented first tothe analyst. For the rule quantity problem, various strategies have been proposed,among them being redundancy reduction and post-processing techniques, these beingthe two most widely used.
1.5.1 Interestingness Measures
In association rule mining the user often needs to evaluate an overwhelming numberof rules. Interestingness measures are very useful for filtering and ranking the rulespresented to the user. In the original formulation of association rule discovery prob-lem, support and confidence are two of the interestingness measures proposed.
Support is necessary because it represents the statistical significance of a pat-tern. From the marketing perspective, itemset support in a market database justifiesthe feasibility of promoting the items together. Support is also good for pruningthe search space since it possesses a nice downward closure property (anti-monotonicconstraint). Tan and Kumar 2000 [209] examined various objective interestingnessmeasures and demonstrated that support is a good measure because it represents howstatistically significant a pattern is. Support-based pruning is effective because is ananti-monotonic function, and it allows us to prune mostly uncorrelated or negativelycorrelated patterns. Beyond that, it may not serve as a reliable interestingness mea-sure. For example, rules with high support often correspond to obvious knowledgeabout the domain and consequently, may be not interesting to the analyst simply

34 Knowledge Discovery in Databases and Association Rules
because it does no reveal any surprising information. In theory, confidence measuresthe conditional probability of events associated with a particular rule. Unfortunately,confidence can be misleading in many practical situations, as shown by Brin et al.1997 [48].
Except for these two measures, many other have been proposed in the literature.Geng and Hamilton 2006 [117] have classified interestingness measures into three cat-egories : objective, subjective, and semantics-based measures.
• Objective Measures Based on Probability: objective interestingness measuresare based on probability theory, statistics, and information theory. Therefore,they have strict principles and foundations and their properties can be formallyanalysed and compared. Objective Measures take into account neither the con-text of the domain of application nor the goals and background knowledge ofthe user. They evaluate the generality and reliability of association rules. Hil-derman and Hamilton 1999 [144] surveyed 70 interestingness measures (mostlyobjective) that have been successfully employed in data mining application.
• Subjective Measures: in application where the user has background knowledge,rules ranked highly by objective measures may not be interesting. A subjec-tive interestingness measure takes into account both the data and the user’sknowledge. Such a measure is appropriate when:
– the background knowledge of users varies;
– the interests of the users varies;
– the background knowledge of users evolves.
Unlike objective measures, subjective measures may not be represented by sim-ple mathematical formulae because the user’s knowledge may be representablein various forms. Instead, they are usually incorporated into the mining pro-cess. Subjective measures can be classify in:
– Surprisingness
– Novelty
• Semantic Measures: semantic measures consider the semantics and explanationsof the association rules. Geng and Hamilton 2006 [117] consider that semanticmeasures are based on:
– Utility
– Actionability

1.5 Problematic of Association Rules and Solutions 35
Later in 2009, Blanchard et al. [30] proposed a Semantics-based classification ofobjective interestingness measures. They proposed to classify interestingness mea-sures according to the subject, the scope and the nature of the measure. This meansthat an interestingness measure is evaluated according to the notion that it measures,the elements concerned by its results, and the type of the measure: descriptive or sta-tistical.
During the data mining process, interesting measures can be used in two ways.Firstly, objective measures can be used to prune uninteresting patterns during themining process to reduce the search space. However, this may eliminate interestingrules. For instance, the support threshold can be used to filter out patterns with lowsupport during the mining process. The direct consequence is that some items arenot taken into account if they are not frequent in the database although they couldbe interesting to the user. By eliminating these items the user can waste valuableinformation. Secondly, measures can be used during post-processing to select inter-esting patterns. For instance, we can rank rules by various interestingness measuresand keep only rules with the higher ranking. The problem is that rules that havethe highest rank are not necessarily the good ones. Much research work (Ohsaki etal. 2004 [211], Tan et al. 2002 [268]) has compared the ranking of rules by humanexperts to the ranking of rules by various interestingness measures, and suggestedchoosing the measure that produces the ranking that most resembles the ranking ofexperts. This problem represents a major gap between the results of data mining andthe use of the mining results. Interestingness measures can play an important rolein the identification of novel, relevant, implicit and understandable patterns from themultitude of mined rules. They help in automating most of the post-processing workin data mining. But it should be the analyst who validates rules and designates themore interesting ones.
1.5.2 Redundancy Rule Reduction
This second section of solutions for the volume of generated rules is dedicated toredundant rule reduction techniques. Classical algorithms propose good methods forassociation rule extraction, but the number of rules is too large and too many rulesare redundant.
Redundancy reduction refers to a set of techniques aimed at pruning out items orrules which do not reveal interesting knowledge. Pruning techniques can be used todynamically reduce the dataset during processing. By discarding unnecessary items,items pruning generates dataset reduction (D) and further reduces processing time.Pruning can deal with the quantity problem, if a set of rules means the same thingor refers to the same feature of the data, then the most general rule may be preserved.
Rule covers (Toivonen et al. 1995 [275]) is a method that retains a subset of theoriginal set of rules. This subset refers to all transactions (in the database) that theoriginal rule covered. Another strategy in association rule mining was presented by

36 Knowledge Discovery in Databases and Association Rules
Zaki 2000 [305] based on the concept of closed frequent itemsets that can drasticallyreduce the generated rule set. Therefore, the set of generated frequent itemsets issmaller than the set of all frequent itemsets, especially for dense databases. Theclosed frequent itemsets are used to generate a set of rules, from which all other asso-ciation rules can be inferred. Thus, only a small set of rules can be presented to theuser. These basic rules gives a user only an overview of the domain. Although theidea was proposed by Zaki 2000 [305], it is in 2004 that Zaki 2004 [304] developed areal algorithm.
Comparable with the algorithm proposed by Zaki 2000 [305], Pasquier et al. 2005[217] introduced two condensed associations based on closed frequent itemsets to rep-resent non-redundant association rules. These two representations calledMin-maxApproximative Basis and Min-max Exact Basis describe different possibilities to ex-tract non-redundant rules using closed methods. Later, Xu and Li 2007 [298] improvedthe definitions suggested by Pasquier et al. 2005 proposing a more concise associationrule basis called Reliable exact basis.
Li 2006 [181] proposed optimal rule sets defined with respect to an interestingnessmeasure. An optimal rule does not have a more general rule with greater interesting-ness. Thus, the algorithms produced a set of rules contains all optimal rules.
A set of techniques for the reduction of redundant rules was developed and im-plemented by Ashrafi et al. 2005 [12]. The proposed techniques are based on gener-alisation/specification of antecedent/consequent of the rules and they are divided inmethods for multi-antecedent rules and multi-consequent rules.
Several researches suggested that pruning redundant rules can seriously decreasethe number of redundant rules is exponential (Zaki 2004 [304]). Redundancy reduc-tion methods may not provide an overall picture if the number of the pruned rules istoo large.
1.5.3 Interactive Rule Post-processing
Rule post-processing involves helping user to select rules which are relevant or inter-esting and, thus, reduce the cognitive load of experts. But, since it is always the userwho decides what is interesting this means that post-processing of association rulesa non trivial task (Roddick et al. 2001 [239], Freitas 1999 [107], Bayardo et al. 1999[19], Dong and Li 1998 [92], Silberschatz and Tuzhilin 1995 [247], Silberschatz andTuzhilin 1996 [249]).
Many authors have stressed that the data mining process is by nature highlyiterative and interactive and requires user involvement (Fayyad 1997 [100]). In par-ticular Brachman and al. 1996 [45] have pointed out that in order to efficiently assistthe users in their search for interesting knowledge, the data mining process shouldbe considered not from the point of view of the discovery algorithms but from that

1.5 Problematic of Association Rules and Solutions 37
of the users, as a human-centred decision support system. Thus, to find interestingrules it is more efficient to incorporate the user into the Data Mining process thanjust presenting filtering operators to help the user exploring the association rule ex-traction algorithm results. Yamamoto et al. 2009 [72] compared the performance ofthe user-driven approach I2S (Yamamoto et al. 2007 [299]) with a conventional ruleextraction approach Apriori to illustrate the possibilities of the user-driven solution.In a case study with a domain specialist, the usefulness of incorporating the analystinto the data mining process was confirmed. We believe that a closer contact withthe discovery process allows users to obtain interesting rules faster than just runningan algorithm as a black box.
The main approaches for interactive association rule post-processing can be groupedinto three classes:
1. organise an interactive exploration/extraction of association rules;
2. organise an interactive visual exploration of association rule mining results;
3. organise an interactive visual extraction of association rules.
1.5.3.1 Interactive Exploration and Extraction of Association Rules
Rule Browser
Interactive tools of the type rule browser have been developed to assist the userin interactive post-processing of association rules. Like the file browser, they are in-teractive interfaces that present information in textual form.
Sahar 1999 [242] proposed to the user to eliminate non interesting rules by re-moving not interesting items. If a user eliminates an item, all rules in the resultinglist that contain this item are removed. The effectiveness of this approach lies inits ability to quickly eliminate large families of rules that are not interesting, whilelimiting user interactions to a few, simple classification questions. In 2000, Ma et al.2000 [187] proposed a system where the user explores a summary of rules and he/shecan select interesting rules from it. More recently, a feature-rich rules browser waspresented by Fule and Roddick 2004 [115] (Figure 1.4). It allows the user to filterassociation rules by applying more or less general syntactic constraints as they mayuse a taxonomy of items. The tool also allows the user to choose what rule interest-ingness measure should be used for sorting and filtering rules. Furthermore, the usercan save the rules that he/she deems interesting during the exploration.
Some association rule browsers exploit subjective interestingness measures andthen can profit from the user knowledge. For example, Liu et al. 1999 [184] proposeda rule browser based on subjective interestingness measures. This tool exploits theuser’s knowledge of the data domain to present the rule. Firstly, the user expresses

38 Knowledge Discovery in Databases and Association Rules
Figure 1.4: The RSetNav rules browser [115]
his knowledge under the form of relations by specifying a set of patterns according tohis/her previous knowledge or intuitive feelings. Then, the tool matches and ranksthe discovered rules in different categories according to whether or not they confirmthe user’s wishes. In general, the technique ranks the discovered patterns accordingto their conformity to the user’s knowledge or their unexpectedness, or their action-ability. The assumption of this technique is that some amount of domain knowledgeand the user’s interests are implicitly embedded in his/her specified pattern. Withsuch a ranking system, the user can check the lists of rules to confirm his/her ex-pectation, or to find those patterns that are against his/her intuitions, or to discoverthose rules that are actionable. This method can be used to confirm user knowledge,to find unexpected patterns or to discover actionable rules. The main limitation ofthe rules browser is their textual representations of the rules which does not suit thestudy of large amounts of rules. These tools also have the problem of implementingonly a few interestingness measures (maximum of three).
Query Languages
The concept of Inductive Databases, was introduced by Imielinski and Mannila1996 in their founding article [151]. The main idea was to extend the database man-agement system in order to incorporate data mining methods. In other words, it isabout developing a data mining query language, an SQL generalisation that allowsdata creation and manipulation and also knowledge discovery from databases (clas-sify, clusters of association rules, etc.). For the user, he/she manipulates a databasecontaining both data and knowledge, regardless of whether the information is actuallystored in the database or dynamically generated from data.
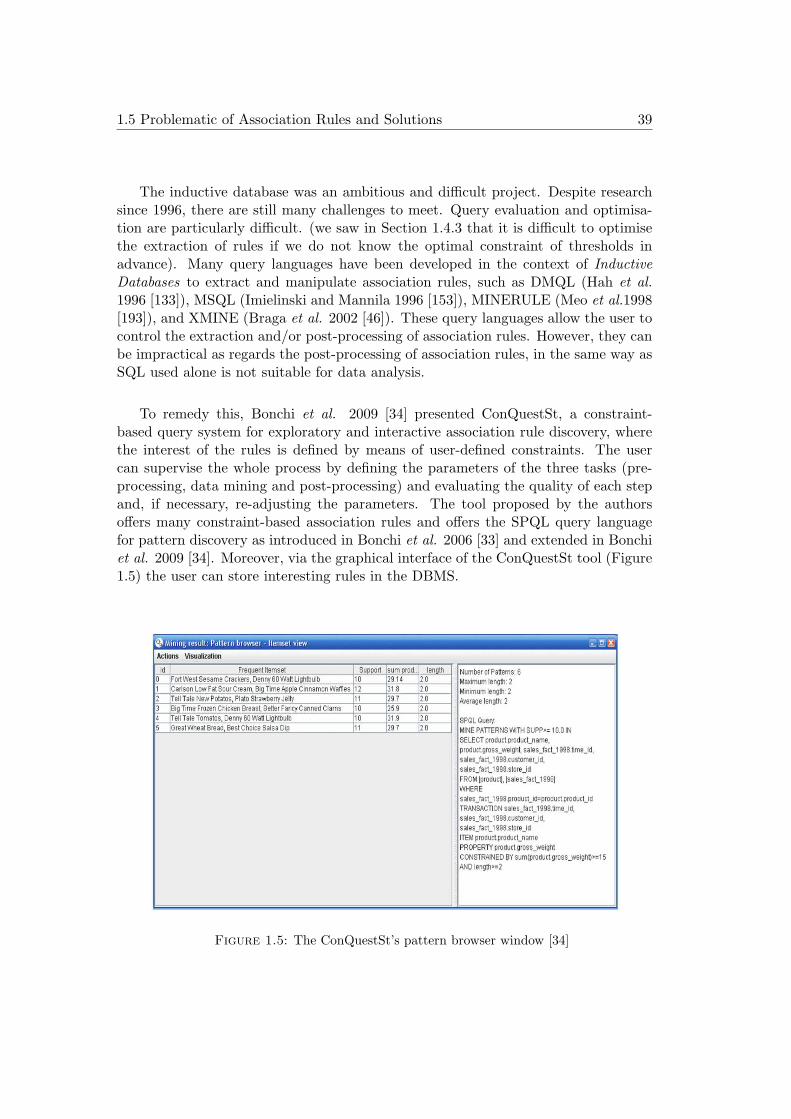
1.5 Problematic of Association Rules and Solutions 39
The inductive database was an ambitious and difficult project. Despite researchsince 1996, there are still many challenges to meet. Query evaluation and optimisa-tion are particularly difficult. (we saw in Section 1.4.3 that it is difficult to optimisethe extraction of rules if we do not know the optimal constraint of thresholds inadvance). Many query languages have been developed in the context of InductiveDatabases to extract and manipulate association rules, such as DMQL (Hah et al.1996 [133]), MSQL (Imielinski and Mannila 1996 [153]), MINERULE (Meo et al.1998[193]), and XMINE (Braga et al. 2002 [46]). These query languages allow the user tocontrol the extraction and/or post-processing of association rules. However, they canbe impractical as regards the post-processing of association rules, in the same way asSQL used alone is not suitable for data analysis.
To remedy this, Bonchi et al. 2009 [34] presented ConQuestSt, a constraint-based query system for exploratory and interactive association rule discovery, wherethe interest of the rules is defined by means of user-defined constraints. The usercan supervise the whole process by defining the parameters of the three tasks (pre-processing, data mining and post-processing) and evaluating the quality of each stepand, if necessary, re-adjusting the parameters. The tool proposed by the authorsoffers many constraint-based association rules and offers the SPQL query languagefor pattern discovery as introduced in Bonchi et al. 2006 [33] and extended in Bonchiet al. 2009 [34]. Moreover, via the graphical interface of the ConQuestSt tool (Figure1.5) the user can store interesting rules in the DBMS.
Figure 1.5: The ConQuestSt’s pattern browser window [34]
40 Knowledge Discovery in Databases and Association Rules
1.5.3.2 Interactive Visual Exploration and extraction of Association Rules
In the post-processing of association rules, it is often through rule visualisation thatpost-processing is performed. Visualisation take advantage of the intuitive appeal ofvisual representations such as graphs, colour and charts to attract the user’s atten-tion. In addition, innovative ways of depicting the results of data mining in two orthree dimensions help provide more realistic information than textual representation(for more details see Chapter 2 Section 2.4).
Visual representations of data mining results also allow easily interaction. As-sociation rule representations easily allow navigation at various levels of details byinteractively and iteratively changing the rule views. This mean that different scenar-ios can be analysed and compared. Groups of rules can be validated on the basis oftheir visual representations. This can reduce the cognitive load of the experts whendealing with many rules.
Visual representations can be used:
• in conjunction with data mining algorithms to facilitate and accelerate theknowledge analysis;
• as a method of data mining.
Visualisation of association rule mining results
Typical visual representations to display results of association rule mining aregrid-like structures and bar charts. The grid view consists of 2D matrix of cells whereeach cell represents a rule. One matrix dimension represents rule antecedent and theothers represent rule consequent. Each cell is filled with coloured bars indicating rulesupport and confidence values. However, this representation often suffers from occlu-sion. Besides, it is difficult to represent rule antecedent or consequent with more thenone item. This restriction can be overcome by extending the matrix dimensions torepresent combinations of items, but it becomes impracticable if there are too manydifferent items.
Kopanakis and Theodoulidis 2003 [171] introduced a representation using barcharts coupled with a parallel coordinate visualisation (Inselberg and Dimsdale 1990[155]) and a grid view. The bar charts (Figure 1.6(a)) map both interest measurevalues and rule contents. Each item value (discrete or continuous) from both theantecedent and the consequent is visually mapped as a bar chart. If the elementis discrete, then a value is indicated in the bar; if it is continuous, an interval isindicated instead. This approach represents only one rule at a time, and a grid ofrepresentations (Figure 1.6(b)) is used to display multiple rules. A distance measureis employed to evaluate rule similarity in order to determine their placement on thegrid. The similar rules are placed close to each other. The underlying rationale in the
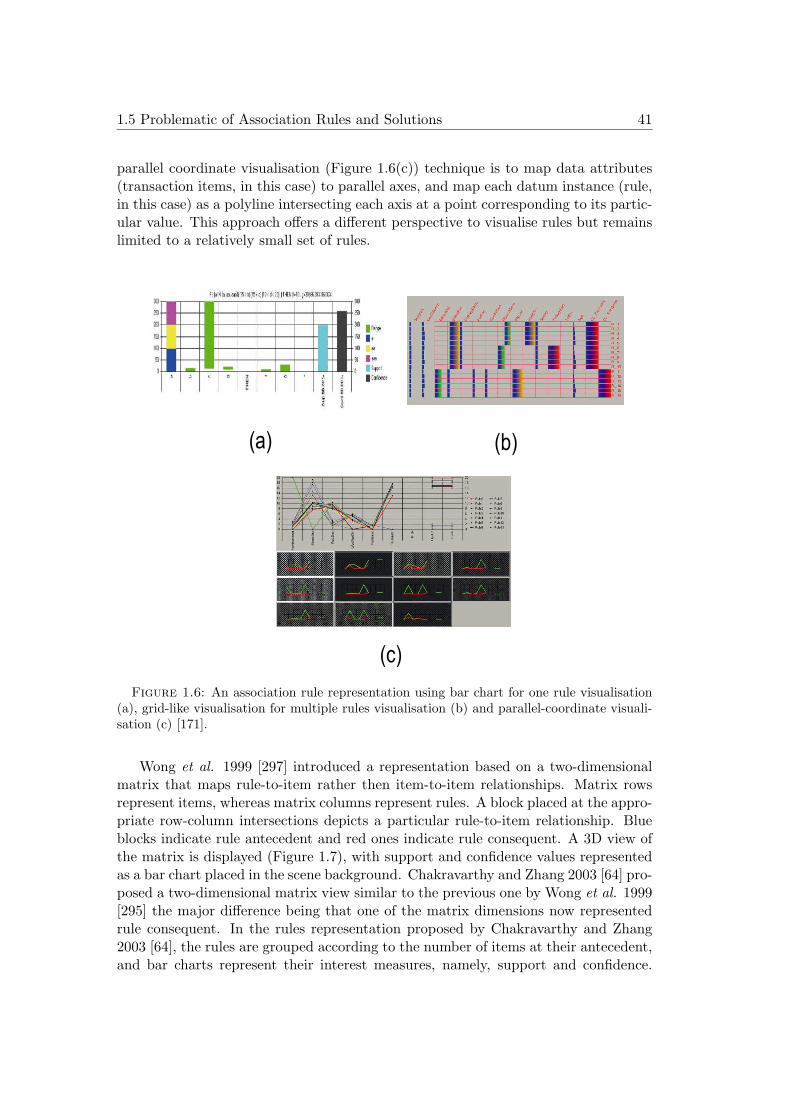
1.5 Problematic of Association Rules and Solutions 41
parallel coordinate visualisation (Figure 1.6(c)) technique is to map data attributes(transaction items, in this case) to parallel axes, and map each datum instance (rule,in this case) as a polyline intersecting each axis at a point corresponding to its partic-ular value. This approach offers a different perspective to visualise rules but remainslimited to a relatively small set of rules.
��� ���
���
Figure 1.6: An association rule representation using bar chart for one rule visualisation(a), grid-like visualisation for multiple rules visualisation (b) and parallel-coordinate visuali-sation (c) [171].
Wong et al. 1999 [297] introduced a representation based on a two-dimensionalmatrix that maps rule-to-item rather then item-to-item relationships. Matrix rowsrepresent items, whereas matrix columns represent rules. A block placed at the appro-priate row-column intersections depicts a particular rule-to-item relationship. Blueblocks indicate rule antecedent and red ones indicate rule consequent. A 3D view ofthe matrix is displayed (Figure 1.7), with support and confidence values representedas a bar chart placed in the scene background. Chakravarthy and Zhang 2003 [64] pro-posed a two-dimensional matrix view similar to the previous one by Wong et al. 1999[295] the major difference being that one of the matrix dimensions now representedrule consequent. In the rules representation proposed by Chakravarthy and Zhang2003 [64], the rules are grouped according to the number of items at their antecedent,and bar charts represent their interest measures, namely, support and confidence.

42 Knowledge Discovery in Databases and Association Rules
Each bar represents a quantity of items at the antecedent, and is sub-divided intointerest measure range value (e.g., 60-70% confidence, 80-90% confidence, etc). Thisrepresentation gives a broader view of the rules set, and the user may obtain a closerlook by clicking on a bar, which causes a two-dimensional matrix view. Couturier etal. 2007 [79] combined 2D matrix for visual representations of association rules withgraphical fisheye view. Their goal is to give users a details-on-demand view whilepreserving an overview of the overall context. One visualisation area shows rules ina 2D matrix, with antecedent and consequent mapped to each dimension and valuesfor interestingness measures (support and confidence) displayed as colours within thecorresponding cell, whose visual area is equally split among measures. The same au-thors Couturier et al. 2007 [80] proposed an approach for exploring association rulesbased on a visual representation of cluster of rules, obtained by applying the k-meansalgorithm over the rule characteristics. Each cluster is represented in a grid-cell, andcolours map interest measure values.
Figure 1.7: Visualisation of item associations [297].
Hofmann et al. 2000 [146] introduced a representation using Mosaic plots (Figure1.8). They display a contingency table to represent an association rule by mappingthe rule support and confidence as areas proportional to their values. The repre-sentation provides deeper understanding of the correlation between the antecedentand the consequent of a rule. This approach considers only one itemsets at a time,and interpreting the visualisation becomes difficult when three or more items appeareither at the antecedent or the consequent.
Unwin et al. 2001 [280] proposed the TwoKey plot a scatter plot visualisation (Fig-ure 1.9) of the corpus of association rules. The two most common interest measures,

1.5 Problematic of Association Rules and Solutions 43
Figure 1.8: Association rules representation with Mosaic Plots [146].
namely support and confidence, are mapped respectively to the X and Y dimensionof the plot. Therefore, a graphical marker representing a rule is positioned in theplot according to its support and confidence values, while the marker’s colour mapsthe number of item’s in the rule. This representation provides an overview of thewhole rule set, and users can employ filtering operators to direct rule exploration,e.g., obtaining rules related to a rule query, such as its more specific rules and moregeneral rules.
Ong et al. 2002 [148] adopted a grid-like visual representation for association ruleswith columns ranked by confidence values and rows ranked by support. The rulesare grouped in cells, according to their support and confidence, and represented assquares whose locations are determined by their support and confidence values. Fil-ters based on support, confidence or item selection assist user navigation through therule set. The authors pointed out that their method shows rules of any size and withno limitations of rules number. However, only the interest measure value is visuallyrepresented (the itemsets are not represented). The same authors proposed a tree-likeview of rules. The rules are grouped according to their antecedent and consequent.Antecedent are firstly shown as nodes, according to the number of items. Then, foreach antecedent node, a rule containing the consequent is shown as sub-nodes. TheTree view represent the main contribution of Ong et al. 2002 [148] compared to theTwoKey plot proposed by Unwin et al. 2001 [280]. A grid-like rule visualisation(Figure 1.10) has been also employed later by Techapichetvanich and Datta 2005[271], where two groups of lines represent items belonging to the antecedent and theconsequent. Each rule is visually represented as a line that connects the item lines.If an item belong to the rule, the intersection of the rule line and the item line is

44 Knowledge Discovery in Databases and Association Rules
Figure 1.9: A scatter plot of 5807 rules with TwoKey plot [280].
marked by a dot. Either the support or the confidence value is divided into intervalsand mapped to the colour of the line representing the rule.
Figure 1.10: A grid-based visualisation of association rules [271].
Yang 2003 [300] employed parallel coordinate visualisation to display associationrules (Figure 1.11). Rules are represented similarly, by two lines, one for the an-tecedent and another for the consequent. An arrow connects the lines, and colour

1.5 Problematic of Association Rules and Solutions 45
may map interestingness measure values. Support of a rule is represented by the linewidth. Confidence is represented by the colour.
Figure 1.11: A parallel coordinates visualisation of association rules [300].
In the graph-based representation of association rules by Bruzzese and Buono 2004[50] the colour of a node represents the antecedent (red) or the consequent (green) ofa rule, while edges connecting the nodes depict the association. Confidence is mappedto the edge length, with colour mapping the support, light and dark blue referring tolow and high support, respectively. A user may further explore subsets of rules us-ing a parallel-coordinate representation. Unlike the previous visualisation approach,this representation allows the visualisation of a large set of rules while displaying theitems making up the rules. Otherwise, it offers few interaction operators. Ertek andDemiriz 2006 [99] proposed to display association rules using a graph-based technique(Figure 1.12). Items and rules are mapped as nodes, and item-rule connections maptheir relations, with directed lines to indicate the direction of the implication. Rulenode colour maps the level of rule confidence. The size of the nodes (area) showthe support interestingness measure. The approach proposed by Yang 2003 [300]and Ertek and Demiriz [99] generate the results and then visualise both intermediateresult–frequent itemset–and final results–association rules. However, they do not al-low user interference during the analytical processing.
A few approaches provide visual representations of individual rules (Hofmann2000 [146], Kopanakis and Theodoulidis 2003 [171]). They used reduced screen space,which make impossible to avoid a point of saturation when multiple rules are displayedand from where no rules can be further represented on the screen. This limitationare faced by all representations based on 2D matrix and on grids. On the other hand,
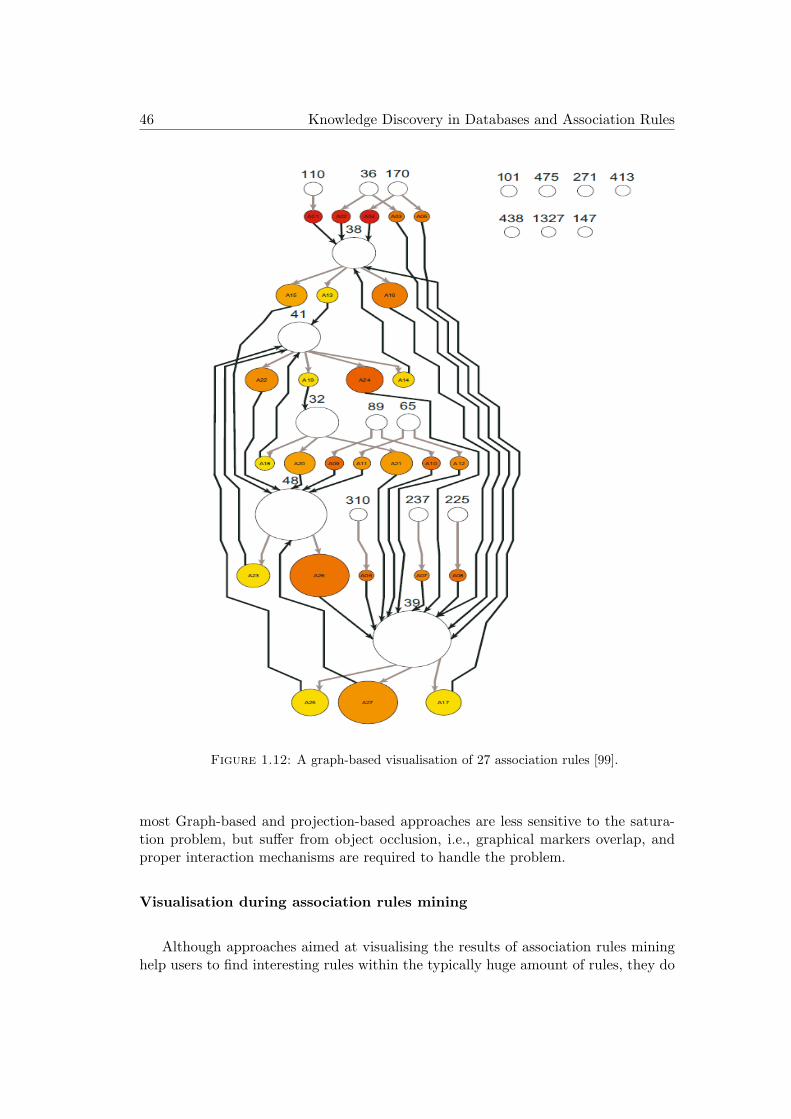
46 Knowledge Discovery in Databases and Association Rules
Figure 1.12: A graph-based visualisation of 27 association rules [99].
most Graph-based and projection-based approaches are less sensitive to the satura-tion problem, but suffer from object occlusion, i.e., graphical markers overlap, andproper interaction mechanisms are required to handle the problem.
Visualisation during association rules mining
Although approaches aimed at visualising the results of association rules mininghelp users to find interesting rules within the typically huge amount of rules, they do

1.5 Problematic of Association Rules and Solutions 47
not allow active user participation in the process, for instance by monitoring the asso-ciation rule extraction algorithm. Active participation allows users to input previousknowledge into the data mining process itself, which can be done both by drivingthe generation of frequent itemsets, and the extraction of association rules. Someapproaches that promote user introduction in the discovery process will be discussed.
The idea was first proposed by Klemettinen et al. 1994 [170] for analysis of fail-ures in telecommunication networks. By using a browser, the user tries to reachinteresting rules by revising interestingness measures thresholds and applying syntac-tic constraint (the user can choose the items that should appear or not appear in therules) to reduce the number of rules. Then, bar charts are used to map interest mea-sure values of the association rules. Bar height maps the interest measures values –support, confidence and their product (named commonness) so that high values catchthe user’s attention during rule exploration. The authors also present a graph-basedvisualisation of rules (Figure 1.13) where items are presented as nodes and associa-tions as directed arrows. Arrow thickness represents rule confidence or, alternatively,support, and colour can map additional information. Nonetheless, the graph suffersfrom a cluttering problem when displaying too many rules. A solution to avoid thisproblem is to include merging multiple nodes from a cluster into a single node, or dis-playing nodes for the antecedent and the consequent in separate regions of the screen.
Figure 1.13: Rule visualisation / rule graph ([170]).
A step in this direction was taken by Liu and Salvendy 2006 [185], who allowedthe exploration of frequent itemsets at each step of the Apriori, but the user cannotfully drive the process, for two main reasons. Firstly, rules are automatically gener-ated for all the obtained frequent itemsets and it is not possible to focus on specific

48 Knowledge Discovery in Databases and Association Rules
groups of itemsets at this moment. Secondly, the user does not have full control overalgorithm execution, since he/she cannot change the algorithm parameters during theprocess. In an interactive approach for association rule exploration, it is importantfor a user to be able to reverse the last action if he/she realises that it is not suitable.To face such a problem, it is desirable that the user have the possibility to backtrack(or forward) one step to change parameters or to restart the process with differentparameters.
Kuntz et al. 2000 [174] introduced a new approach inspired by experimental workon behaviour during a discovery stage. The basic strategy of this approach is to startfrom the frequent items, similar to the Appriori algorithm. The user may then selectitems of interest and obtain rules involving these and other items (Figure 1.14). Therule extraction is dynamic: at each step, the user can focus on a subset of potentiallyinteresting items and launch an algorithm for extracting the relevant associated rulesaccording to statistical measures. This navigation operation is called forward chain-ing, and is graphically represented by graph-based visualisation (backward chainingis also supported). Besides being user-directed this strategy avoids generating un-wanted rules. Blanchard et al. 2003 [28] proposed a user-centred rule explorationapproach, which adopts a visual metaphor of two arenas to place interesting rules.The arena holds the generalised and specialised rules separately. Each rule is repre-sented by a sphere, whose radius maps its support, and by a cone, whose base widthmaps its confidence. Additionally, the colours of the sphere and cone redundantlyrepresent a weighted average of the measures, with the position of the rule at thearena represents the implication intensity. This work was extended later (Blanchardet al. 2007 [31]) with two complementary visualisations: the first is the 3D visualinterface ( see Chapter 3) and the other is the neighbourhood relationship betweenrules, some of them from the already mentioned work by Kuntz et al. 2000 [174].Based on the neighbourhood relations, the authors proposed rules that are closer to aselected rule according to a neighbourhood relation. The available relations are: sameantecedent, forward chaining, antecedent generalisation (which is opposite to forwardchaining),same items, agreement specialisation, exception specialisation, generalisa-tion and same consequent.
Yamamoto et al. 2007 [299] proposed a System called I2E that relies on an theinteractive execution of Apriori aided by a visual representation of the space of item-sets. At each execution step the system identifies the frequent k-itemsets. Then,the users visualise and explore the proposed frequent itemsets via a graph-based vi-sualisation of the itemsets extracted in the current step(k) . The itemsets that aresimilar in content are grouped together in the graph visualisation. After generatingthe frequent itemsets, the users can drive the rule extraction by changing the min-imum support value and by filtering frequent itemsets. This approach supports auser-driven selective rule extraction that produces fewer rules, but still includes rulesrepresentative of all different groups of similar identified itemsets. After rule extrac-tion, users can explore the complete rules space via a visual interface that allowspairwise rule comparisons.
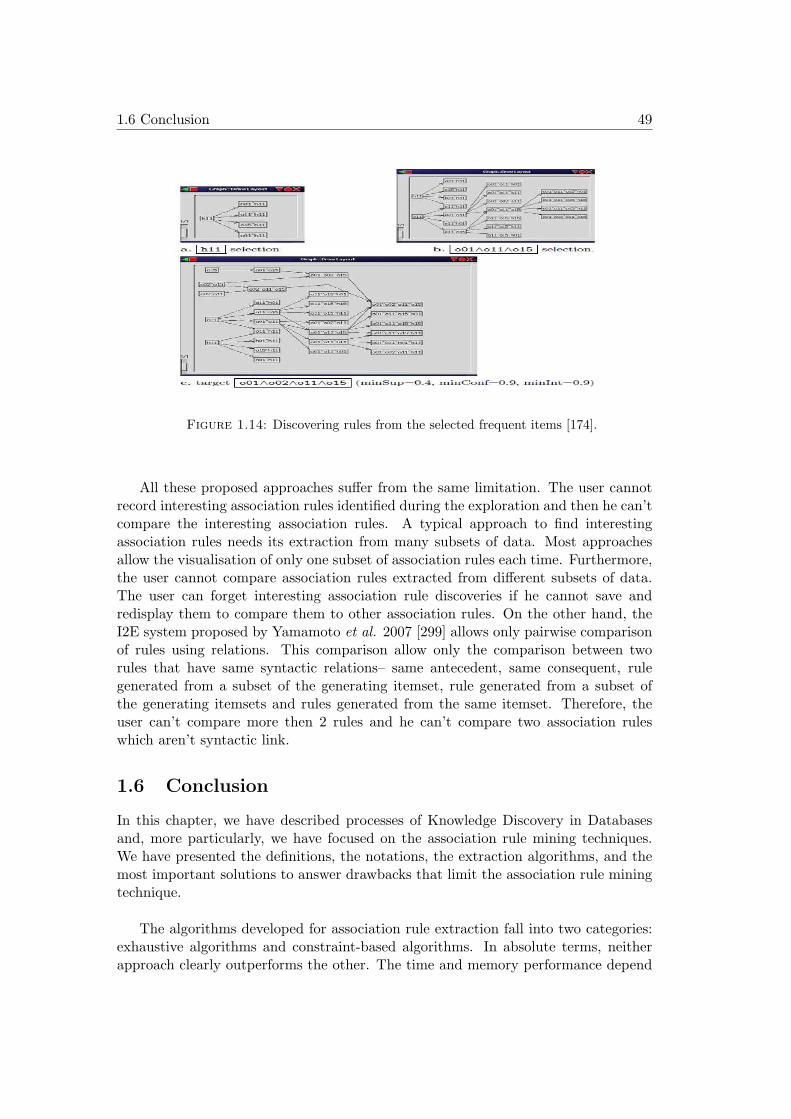
1.6 Conclusion 49
Figure 1.14: Discovering rules from the selected frequent items [174].
All these proposed approaches suffer from the same limitation. The user cannotrecord interesting association rules identified during the exploration and then he can’tcompare the interesting association rules. A typical approach to find interestingassociation rules needs its extraction from many subsets of data. Most approachesallow the visualisation of only one subset of association rules each time. Furthermore,the user cannot compare association rules extracted from different subsets of data.The user can forget interesting association rule discoveries if he cannot save andredisplay them to compare them to other association rules. On the other hand, theI2E system proposed by Yamamoto et al. 2007 [299] allows only pairwise comparisonof rules using relations. This comparison allow only the comparison between tworules that have same syntactic relations– same antecedent, same consequent, rulegenerated from a subset of the generating itemset, rule generated from a subset ofthe generating itemsets and rules generated from the same itemset. Therefore, theuser can’t compare more then 2 rules and he can’t compare two association ruleswhich aren’t syntactic link.
1.6 Conclusion
In this chapter, we have described processes of Knowledge Discovery in Databasesand, more particularly, we have focused on the association rule mining techniques.We have presented the definitions, the notations, the extraction algorithms, and themost important solutions to answer drawbacks that limit the association rule miningtechnique.
The algorithms developed for association rule extraction fall into two categories:exhaustive algorithms and constraint-based algorithms. In absolute terms, neitherapproach clearly outperforms the other. The time and memory performance depend

50 Knowledge Discovery in Databases and Association Rules
on the extraction parameters and data studied. In practice, an exhaustive algorithmcan be a suitable solution for hollow data sets or for users who can tolerate a longprocessing time but it still produces a huge number of rules. On the other hand, aconstraint-based algorithm can produce a limited number of rules but requires thatthe user use the correct values of the constraints.
Different methods have been proposed to address these two problems:
• evaluate, order and filter rules with interestingness measures other than supportconfidence;
• reduce the number of proposed rules using redundancy reduction methods;
• organise an interactive exploration (and extraction) of rules.
Nevertheless, the two first approaches have their own limits. Firstly, the interestand the utility of a rule is decided by the user whereas the interestingness measuresare generally based on database information. Redundancy reduction methods allow areduction of the number of rules from millions to thousands, but even so, a user is notable to manually exploit thousands of rules. In conclusion, the useful characteristicof patterns suggested by Fayyad et al. cannot be met in this case.
Thus, the last technique allows the introduction of the user in the data miningprocess to extract reduced sets of rules which are useful and interesting for him. Themost efficient approach for interaction exploration and extraction are based on visualinterfaces. Moreover, on the one hand, the visualisations adopted in most reviewedapproaches demand considerable screen space, which is quite limited in 2D interfaces.Given the large amount of visual objects it is impossible to show clearly all of therules simultaneously. In addition, visualisation in 2D suffers from a lack of agreeablesemantics for the position and orientation of objects when placed on a 2D grid, whichcan cause biased visual feedback.
On the other hand, a very limited number of approaches support a fully user-driven rule extraction process and no one provides the user with the possibilityof saving and comparing the discovered interesting rules. Thus, new representa-tion/interaction techniques are needed to extract reduced sets of rules which areuseful and interesting for the user.

2Virtual Reality Technology
Contents
2.1 Introduction . . . . . . . . . . . . . . . . . . . . . . . . . . . . . . . . . 512.2 Concepts and definition of VR . . . . . . . . . . . . . . . . . . . . . . 52
2.2.1 Immersion . . . . . . . . . . . . . . . . . . . . . . . . . . . . . . . . . . 542.2.2 Autonomy . . . . . . . . . . . . . . . . . . . . . . . . . . . . . . . . . . 562.2.3 Interaction . . . . . . . . . . . . . . . . . . . . . . . . . . . . . . . . . 56
2.3 Virtual Environments . . . . . . . . . . . . . . . . . . . . . . . . . . . 562.4 From 2D toward 3D and Virtual Reality . . . . . . . . . . . . . . . 57
2.4.1 2D versus 3D . . . . . . . . . . . . . . . . . . . . . . . . . . . . . . . . 572.4.2 Toward Virtual Reality . . . . . . . . . . . . . . . . . . . . . . . . . . 59
2.5 Interaction techniques and metaphors . . . . . . . . . . . . . . . . . 602.5.1 Navigation . . . . . . . . . . . . . . . . . . . . . . . . . . . . . . . . . 612.5.2 Selection and manipulation . . . . . . . . . . . . . . . . . . . . . . . . 692.5.3 System control . . . . . . . . . . . . . . . . . . . . . . . . . . . . . . . 74
2.5.3.1 2D solutions in 3D environments . . . . . . . . . . . . . . . . 742.5.3.2 3D menus . . . . . . . . . . . . . . . . . . . . . . . . . . . . . 75
2.6 Visual Display Configurations . . . . . . . . . . . . . . . . . . . . . . 772.6.1 Immersive configurations . . . . . . . . . . . . . . . . . . . . . . . . . 792.6.2 Non-Immersive Configurations . . . . . . . . . . . . . . . . . . . . . . 81
2.7 Conclusion . . . . . . . . . . . . . . . . . . . . . . . . . . . . . . . . . . 82
2.1 Introduction
As previously already stated, visualisation and interaction are an important fieldsof research in Data Mining (DM). It relies on the fact that the human mind pro-cesses visual information easily and quickly and may extract a lot of information andknowledge in this way. In this context, visualisation represents a critical step that isrequired at during the Knowledge Discovery in Databases (KDD) process (Fayyad et
51

52 Virtual Reality Technology
al. 1996 [101]).
As proposed by Fayyad et al. 1996 [281], data visualisation can be viewed as anapproach to the problem of KDD and involves two important aspects (Fayyad et al.1996 [101]): (i) helping the user in the knowledge discovery step and (ii) enablinghim/her to interact with the knowledge representation (Chernoff 1973 [68], Bertin1967 [24], Card et al.1999 [60], Becker et al. 1987 [235], Pickett and Grinstein 1988[220], Tufte 1990 [278], Cleveland 1993 [74], Keim and Kriegel 1996 [167], Wong andBergeron 1997 [296], Friendly 2001 [110], Unwin 2000 [279]). Thus, VDM requirestools and efficient visualisation and interaction techniques enabling the user(s) toperform such complex tasks.
The emergence of virtual reality (VR) has enabled significant advances in the fieldof data visualisation (large-scale, stereoscopic viewing) and user interaction (Fuchset al. 2003[112]). VR allows immersive real-time visualisation and interaction withhuge amounts of data. Therefore, VR has a great potential and can be very useful forVDM. However, current VR systems (many configurations exist), interaction tech-niques and metaphors are not well suited for the specific tasks involved or requiredby VDM and KDD.
In the first part this chapter, we define the concept of VR and Virtual Environ-ments (VEs). Then, we compare current 2D, 3D and VR techniques to now proposedin the context of data visualisation. In Section 3, we present and analyse the variousinteraction devices and interfaces widely used in current VR applications. In addition,we review existing 3D interaction techniques and metaphors and give the advantagesand drawbacks of these for DM, both in mono-user and multi-user contexts. Finally,we propose a classification for hardware configurations of visual displays enabling userimmersion in VEs.
2.2 Concepts and definition of VR
Virtual reality lies at the intersection of several disciplines such as computer graph-ics, human-computer interaction, computer vision, and robotics. It uses large-scaleadvanced visual displays, interaction devices and multimodal interaction techniquesto immerse one or more user(s) in a Virtual Environment (VE). One the advantagesof VR is that the interaction techniques are based on human natural action, percep-tion and communication abilities, allowing the user to perform complex tasks quiteintuitively (Burdea and Coiffet 1993 [54], Fuchs et al. 2003 [112])
VR is currently used in a wide variety of applications such as engineering, medicine,biology, education and training, etc. The increasingly widespread use of VR is due to(i) the rapid evolution of computers (processing and graphic capabilities), interactiondevices coming recently from the game industry such as the WiimoteTM , KinectTM ,Play Station MoveTM , and low-cost visual displays (3D televisions and projectors),

2.2 Concepts and definition of VR 53
and (ii) the increasing development of applications in different sectors (automotive,aerospace, medicine, education, defence, entertainment, etc.).
Augmented Reality (AR) refers to different techniques allowing the integrationof digital entities (objects, images, text, etc.) in the real world [196]. Milgram andKishino [197] coined the term Mixed Reality and proposed to consider it as a contin-uum which extends from the real world to fully virtual worlds (Figure 2.1).
����������AB�C�DE
����
F���������A������A��
����AB�C��E
������A��
���A���AB
���A���
F���������A
Figure 2.1: Triangle of Virtual Reality proposed by Burdea and Coiffet [54].
Burdea and Coiffet 1993 [54] introduced the 3I concept: immersion, interactionand imagination as a new approach to define and analyse VEs (Figure 2.2). In thisconcept, Imagination plays a crucial role and characterises user interpretation thatresults from a VR experience. Some authors consider VR as an extension of classicalhuman-computer interfaces. For example, Ellis 1994 [97] proposed that VR is ”anadvanced human-computer interface that simulates a realistic environment and allowsparticipants to interact with it”. Other researchers define VR as computer simulatedworlds in which the user is the main actor.In this context, it is important to understand that a user may perceive and un-
���������
��A��B�����B��CB���D
E��BF�D����B�
Figure 2.2: Triangle of Virtual Reality proposed by Burdea and Coiffet[54].
derstand a VE through various sensory channels such as vision, sound, touch, smell,etc., but also through movement, action and interaction with virtual objects or data.Tisseau 2001 [274] defines VR as a universe of models offering the mediation of senses,actions and mind.
Other definitions of VR from functional, technical, and philosophical points ofview are detailed in Fuchs etal. 2006 [113] and Fuchs etal. 2003 [112]. Fuchs etal. [112] define VR through its purpose: ”the purpose of VR is to enable a person(or more) a sensory-motor and cognitive activity in an artificial world, numerically

54 Virtual Reality Technology
created, which can be imaginary, or a symbolic simulation of certain aspects of thereal world”.
Zeltzer 1992 [307] has proposed a model for the description and classification ofVEs. The model, represented by the AIP cube, includes three components: Auton-omy, Interaction and Presence (Figure 2.3) and is based on the assumption thatevery VE has three distinct components which are:
• A set of models and processes (autonomy);
• Action on them (interaction);
• Some sensory modalities (presence).
Using this model, any VR application can be represented using three-dimensionalcoordinates (autonomy, interaction, presence), for which the axes are normalised be-tween 0 (criterion completely absent) and 1 (criterion fully present). Tisseau 2001[274] also focused on the concepts of presence and autonomy to define VR applica-tions and propose that the presence itself is supported by immersion and interaction(Figure 2.4).
Figure 2.3: The AIP cube : autonomy, interaction, presence [307].
2.2.1 Immersion
In the VR community, the term immersion is widely used and it is quite important tounderstand what it really means and what are the related aspects. The first level of

2.2 Concepts and definition of VR 55
��������
�������AB�
CD�B�BEF
�EE���AB�
�BE�D�����A�D�
�A��D��������
����A��E ��A�����AED��B�
�A��B��E��
A������A����A��AB�
�A��D�����AF
Figure 2.4: Immersion, interaction, andautonomy in VR [274].
immersion is physical or visual (Burkhardt 2003 [56], Mestre and Fuch 2006 [194]).In fact, immersion reflects the extent to which the human visual field is covered bythe displayed virtual images. The second level of immersion, generally called spatialimmersion, is related to the extent to which the user(s) can act or move in the virtualworld. These two levels of immersion are of course closely linked.
Bowman and Hodges 1999 [39] define immersion as the sensation of being presentin the VE. Thus, a user is physically ”immersed” when he/she feels that the phys-ical world that surrounds him/her has replaced the virtual world. A further levelof immersion is related to the user’s mental or psychological state. For some VRapplications such as training or simulation, this level of immersion is required.
The user’s sense of presence in a virtual world is another important aspect thatplays a crucial role in immersion. Indeed, the presence provides the user the feelingof being inside the VE. In this context, it is essential to distinguish between virtualpresence and social presence (Slater et al. 1998 [252], Slater etal. 1996 [253]). Thefirst type of presence is the feeling that we try to give to the user as he/she is a partof the virtual world (Burkhardt 2003 [56], Mestre and Fuchs 2006 [194], Stoffregenet al. 2003[265]). On the other hand, social presence characterises collaborativeVEs in which virtual humans (human avatars or embodied conversational agents) arepresent. Social presence involve mutual awareness of the participants and of theiractivities within the shared virtual world. Kadri et al. 2007 [162, 163] point out theimportance of user’s representation by avatars in the VE.

56 Virtual Reality Technology
2.2.2 Autonomy
In VR, the notion of autonomy is related to the different components of the VE.The user is one of those components and he/she is considered as the most activeentity in the virtual space. The user role in VR is not the same as in scientific orinteractive simulations (Tisseau 2001[274]). In scientific simulation, the user sets someparameters before the simulation and analyses the results afterwards. On the otherhand, in VR applications, the user is exposed to a digital environment which allowshim/her to evolve, to change the VE properties, and to interact with the differententities in real time. The user’s autonomy lies in his ability to coordinate perceptionsand actions taken during the interaction process.
2.2.3 Interaction
Since the emergence of VR, researchers have been particularly interested in interac-tion, this being is the core component of any interactive system. Broadly speaking,Interaction can be defined as a communication language between humans and com-puters. This communication language is the set of actions/reactions between humanand computer interfaces through input / output devices and interaction techniques.
3D interaction can be defined as a system that links different interaction devicesand software technology to enable real-time modification of VEs. These differentpieces of software allow the use of available materials through drivers which provideaccess to low-level devices, and high-level software applications. The different inter-action techniques are between the hardware layer (low-level) and the application layer(high-level).
2.3 Virtual Environments
The term Virtual Environment was introduced by researchers from the MassachusettsInstitute of Technology (MIT) in the early 90s as a synonym for VR (Heim 1995 [140]).A VE is generally considered as a 3D real-time interactive environment representingreal, symbolic or imaginary data, visualised using desk-top or immersive displays (Ha-chet 2003 [132]). There are different types of VE, based on the degree of immersionprovided to the user (Kalawsky 1996[164]):
• Non-Immersive Virtual Environment (NIVE)
• Semi-Immersive Virtual Environment (SIVE)
• Fully-Immersive Virtual Environment (FIVE)
Table 2.3 shows the qualitative performance of the different types of VR systemsaccording to the degree of immersion provided by the associated VE.

2.4 From 2D toward 3D and Virtual Reality 57
In VR, users need to interact with the virtual objects present within the VE usingsome interaction techniques. An interaction technique is defined as a method enablinga task in a VE to be performed (Hachet 2003 [132]). Foley et al. [103] considerinteraction technique as a way of using 3D input devices to accomplish a given task.Interaction techniques can also be defined as how the user operates a given interfaceto interact in real-time with virtual entities and control the application. In VR, thenotion of interaction paradigm or metaphor is used by some authors to define a setof rules and techniques that allow the user to perform interactive tasks within a VE.
Main features NIVE SIVE FIVE
Resolution High High low-average
Perception Low Low High
Navigation skills Low Average High
Field of view Small Average Large
Shift Low Low High-average
Sense of immersion Low High-average High-average
Table 2.1: Qualitative performance of the various VEs [164].
2.4 From 2D toward 3D and Virtual Reality
There is a controversial debate on the use of 2D versus 3D and VR for informationvisualisation. In order to justify our choice for 3D and VR, we first review the differ-ence between 3D visualisation and VR techniques:
• 3D visualisation is a representation of an object in a 3D space by showing length,width and height coordinates on a 2D surface such as a computer monitor. 3Dvisual perception is achieved using visual depth cues such as lighting, shadowsand perspective;
• VR techniques enable the user immersion in a multi-sensorial VE and use in-teraction devices and stereoscopic images to increase depth perception and therelative 3D position of objects. In addition the user is able to navigate andexplore VEs.
2.4.1 2D versus 3D
Little research has been dedicated to the comparison of 2D and 3D representations.The experiments of Spence 1990 [255] and Carswel et al. 1991 [62] show that thereis no significant difference of accuracy between 2D and 3D for the comparison of
58 Virtual Reality Technology
numerical values. In particular, Spence 1990 [255] pointed out that it is not theapparent dimensionality of visual structures that counts but rather the actual numberof parameters that show variability. Under some circumstances, information may beprocessed even faster when represented in 3D rather than in 2D. Concerning theperception of global trends in data, the experimental results of Carswel et al. 1991[62] also show an improvement when answer times using 3D but to the detriment ofaccuracy.
Finally, Tavanti and Lind 2001 [270] pointed out that realistic 3D displays couldsupport cognitive spatial abilities and memory tasks, namely remembering the placeof an object, better than with 2D.
Cockburn and McKenzie 2002 [75] presented their investigation in the domainof effectiveness of spatial memory in real-world physical models and in equivalentcomputer-based virtual systems. The different models vary the user’s freedom to usedepth and perspective in spatial arrangements of images representing web pages. Sixinterfaces were used in the evaluation of three physical interfaces and three computer-based virtual equivalents. Results show that the ability to quickly locate web pageimages deteriorated as their freedom to use the third dimension increased. The sub-jective answers also indicated that the users found the 3D interfaces more clutteredand less efficient. Spacial memory clearly provides an effective aid to informationretrieval, but the study doesn’t conclude about the role that 3D plays to increaserapidity of data retrieval in static-perspective spatial organisations. The results in-dicate that for relatively sparse information retrieval tasks (up to 99 data items), 3Dhinders retrieval.
Tory et al. 2006 [276] compared 2D, 3D, and combined 2D/3D displays for dif-ferent tasks in order to identify the tasks for which each view is best suited trough 3experiments: (i) position estimation task, (ii) orientation task, and (iii) qualitativeexploration. These experiments showed that strict 3D displays with additional cuessuch as shadows can be effective for approximate relative position estimation andorientation. However, precise orientation and positioning are difficult with a strict3D display. For each precise task, the combination of 2D/3D display was better thanstrict 2D or 3D display. Compared to strict 2D display, combination displays per-formed as well or better.
On the other hand, several problems arise, such as intensive computation, morecomplex implementations than 2D interfaces, and user adaptation and disorienta-tion. The first problem can be addressed by using powerful and specialised hardware.However, one of the main problems of 3D applications is user adaptation. In fact,most users only have experience with classical windows, icons, menu pointing devices(WIMP) and 2D-desktop metaphors. Therefore, interaction with 3D presentationsand possibly the use of special devices require considerable adaptation efforts to usethis technology. There is still no commonly-accepted standard for interaction with3D environments. Some research has shown that it takes users some time to under-stand what kind of interaction possibilities they actually have (Baumgartner et al.

2.4 From 2D toward 3D and Virtual Reality 59
2007 [17]). In particular, as a consequence of a richer set of interactions and a higherdegree of freedom, users may be disoriented.
2.4.2 Toward Virtual Reality
Research on human visual perception attests to the complexity and power of humanvisual abilities. We perceive a 3D world primarily through a combination of binocularvision and the use of motion parallax (Harris 2004 [138]). However the brain obtainsmany clues such as the depth and shape of objects from the surrounding environment(ground-plane, shadow, relative motion). Immersive environments allow to a user totake advantage of the way the brain already interprets visual information (Hubonaand Shirah 2005[149]) and provides key advantages for evaluating and analysing infor-mation, including the use of peripheral vision to provide global context, body-centricjudgements about 3D spatial relations, and enhanced 3D perception from stereo andmotion parallax (head tracking, Dam etal. 2000[86]).
Together these spatial indicators create a more natural environment and thuspromote more efficient exploration of 3D data. On a regular computer screen, thestrongest available depth cue is motion parallax. As a result, in order to understand3D data from images on a screen, users need to constantly rotate the view or rock itback and forth to perceive depth. The motion interfaces with detailed examinationor measurement of displayed data is not required in stereoscopic environments whereother depth cues are available. Furthermore, immersive environments offering headtracking in addition to stereoscopy enable motion parallax without the user havingto consciously move the 3D data: motion is simply created by moving one’s head orwalking around the data; an intuitive response that does not interfere with analyticaltasks.
To overcome limitations of interaction with 3D representations, VR interfacesand input devices have been proposed. These interfaces and devices offer simpler andmore intuitive interaction techniques (selection, manipulation, navigation, etc.), andmore compelling functionality (Shneiderman 2003[245]). Latulipe et al. 2005 [176]demonstrated that a symmetric technique for simultaneous rotation, translation andscale yields significant performance benefits over the standard single mouse in an im-age alignment task.
In VR, the user can always access external information without leaving the envi-ronment and the context of the representation. Also, the user’s immersion in the dataallows him to take advantage of stereoscopic vision that enables him to disambiguatecomplex abstract representations (Maletic et al. 2001 [190]). Ware and Franck 1996[288], compared the visualisation of 2D and 3D graphs. Their work shows a signif-icant improvement in intelligibility when using 3D. More precisely, they found thatthe ability to decide if two nodes are connected or not is improved by a factor of 1.6when adding stereo cues, by 2.2 when using motion parallax depth cues, and by afactor of 3 when using stereoscopic as well as motion parallax depth cues.
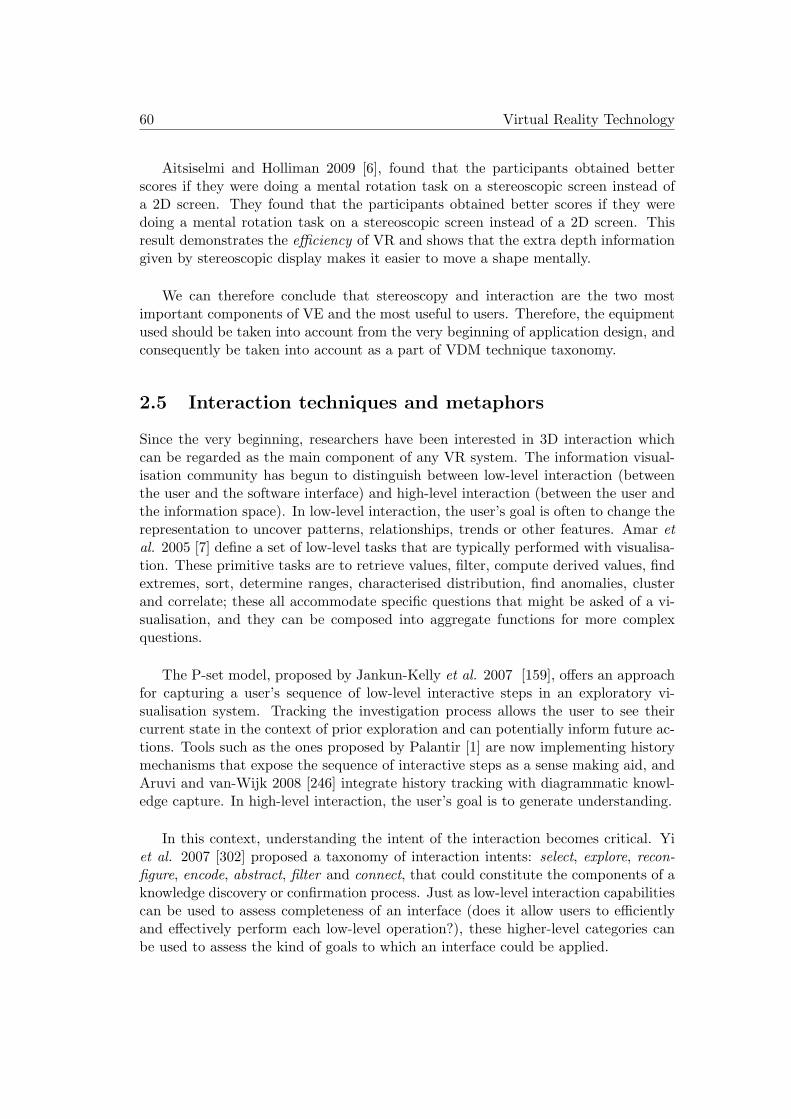
60 Virtual Reality Technology
Aitsiselmi and Holliman 2009 [6], found that the participants obtained betterscores if they were doing a mental rotation task on a stereoscopic screen instead ofa 2D screen. They found that the participants obtained better scores if they weredoing a mental rotation task on a stereoscopic screen instead of a 2D screen. Thisresult demonstrates the efficiency of VR and shows that the extra depth informationgiven by stereoscopic display makes it easier to move a shape mentally.
We can therefore conclude that stereoscopy and interaction are the two mostimportant components of VE and the most useful to users. Therefore, the equipmentused should be taken into account from the very beginning of application design, andconsequently be taken into account as a part of VDM technique taxonomy.
2.5 Interaction techniques and metaphors
Since the very beginning, researchers have been interested in 3D interaction whichcan be regarded as the main component of any VR system. The information visual-isation community has begun to distinguish between low-level interaction (betweenthe user and the software interface) and high-level interaction (between the user andthe information space). In low-level interaction, the user’s goal is often to change therepresentation to uncover patterns, relationships, trends or other features. Amar etal. 2005 [7] define a set of low-level tasks that are typically performed with visualisa-tion. These primitive tasks are to retrieve values, filter, compute derived values, findextremes, sort, determine ranges, characterised distribution, find anomalies, clusterand correlate; these all accommodate specific questions that might be asked of a vi-sualisation, and they can be composed into aggregate functions for more complexquestions.
The P-set model, proposed by Jankun-Kelly et al. 2007 [159], offers an approachfor capturing a user’s sequence of low-level interactive steps in an exploratory vi-sualisation system. Tracking the investigation process allows the user to see theircurrent state in the context of prior exploration and can potentially inform future ac-tions. Tools such as the ones proposed by Palantir [1] are now implementing historymechanisms that expose the sequence of interactive steps as a sense making aid, andAruvi and van-Wijk 2008 [246] integrate history tracking with diagrammatic knowl-edge capture. In high-level interaction, the user’s goal is to generate understanding.
In this context, understanding the intent of the interaction becomes critical. Yiet al. 2007 [302] proposed a taxonomy of interaction intents: select, explore, recon-figure, encode, abstract, filter and connect, that could constitute the components of aknowledge discovery or confirmation process. Just as low-level interaction capabilitiescan be used to assess completeness of an interface (does it allow users to efficientlyand effectively perform each low-level operation?), these higher-level categories canbe used to assess the kind of goals to which an interface could be applied.

2.5 Interaction techniques and metaphors 61
Traditional 2D user interfaces (WIMP) have well-established methods and tech-niques, such as pull-down menus, buttons, and windows. Generally, these meth-ods cannot be transferred to VR. Therefore, VE needs completely new interactionparadigms. Three-dimensional user interfaces (3DUI) are considered to be one of thealternative of current 2D interfaces (Dachselt and Hinz 2005 [84]). More than a dozenyears of research in the field of VR have produced a rich variety of applications, novelinput and output devices as well as 3D interaction techniques.
There are several classifications of 3D interaction techniques. Mine 1995 [198]proposed the first classification based on four fundamental tasks: navigation, selec-tion, manipulation, and scaling. He also defined a fifth task derived from the fourprevious tasks: virtual menu and widgets. Hand 1997 [137] introduced the modernclassification basics which were taken over by Bowman et al. 2001 [41] who classifiesthe various 3D interaction techniques according to three main tasks: navigation, se-lection and manipulation, and system control. The authors also discussed the effect ofcommon interaction devices on user interaction as well as interaction techniques forgeneric 3D tasks. Arns 2002 [11] considered that Bowman’s taxonomy is too generaland encompasses too many parts of a VR system. For that reason, she proposed aclassification for virtual locomotion (travel and way-finding) methods. This classi-fication includes information concerning visual displays, interactions devices, tasks,and the two primary elements of virtual travel: translation and rotation.
Coquillart and Grosjean 2003 [241] proposed an alternative classification of inter-action techniques. They broke down each application into basic tasks called PrimitiveVirtual Behavioural (PVB). These PVBs are the functional objectives of immersionand interaction level. These basic tasks may of course be performed by the userthrough the proposed interaction techniques. Whatever the application, the PVBcan be grouped into four categories: to observe the virtual world, to move in thevirtual world, to act on the virtual world, and to communicate with others or withthe application. Finally, Dachselt and Hinz 2005 [84] proposed a classification of 3Dwidget solutions by interaction purpose/intention of use, e.g, direct 3D object inter-action, 3D scene manipulation, exploration and visualisation.
In the following, we present an overview of the three 3D interaction tasks involvedin the Bowman’s et al. 2001 classification [41]: navigation, selection and manipula-tion, and system control. These interaction primitives have been proposed in a generalcontext of interaction with VEs and are not well suited for Visual Data Mining tasks.Thus, some specific primitives will have to be designed and integrated in interactiontechnique classification in this more complex context.
2.5.1 Navigation
As in the real world, the user needs to move in the virtual world to perform certaintasks such as exploring large 3D structures or datum sets. During navigation, theuser may need to move his/her head to observe some specific objects or to better

62 Virtual Reality Technology
perceive the 3D layout of the VE through motion parallax. Navigation is generallydefined by a set of methods used to move the virtual camera (the user’s view point)(Rheingold 1991 [233]). Some researchers (Dumas etal. 1999 [93]) defined naviga-tion as all user’s movements within the virtual space. For Bowman et al. 2004 [42],this task is the most relevant user action in large-scale 3D environments. It allowsthe user to browse, search and/or operate in virtual space. For example, Wiss andCarr 1999 [294] have performed a comparative study of three different 3D represen-tations of information: cam tree, information cube, and information landscape. Theresults indicate that one of the most influential factors was navigation. Navigationmay sometime be reduced to locomotion as the user has to propulse himself/herselfin the VE using some physical activities such a walking, bicycling, etc. (Darken etal.1998[87], Chance etal. 1998[66]).
Navigation presents challenges such as supporting spatial awareness, providingefficient and comfortable movement between distant locations so that users can focuson more important tasks. Bowman et al. 1997 [40] define two main components fornavigation: the motor component called travel, and the cognitive component calledwayfinding. Travel is the motor component of navigation and refers to physical move-ments of the user from one place to another. Wayfinding matches the cognitive com-ponent of navigation. It allows users to navigate in the environment and choose amovement path (Fuchs etal. 2003[112]). In this case, the user asks questions such as:”Where am I?”, ”Where should I go?” , ”How do i get there?”.
Several factors influence navigation techniques quality. Bowman et al. 1997 [40]define a list of quality factors which represent specific attributes of effectiveness forvirtual travel techniques.
• Travel speed: appropriate velocity;
• Accuracy: proximity to the desired target;
• Spatial Awareness: the user’s knowledge of his/her position and orientation inthe virtual environment during and after navigation;
• Ease of learning: the ability of a novice user to take ownership of the navigationtechnique;
• Ease of use: the cognitive load of the technique from the user’s point of view;
• Information gathering: the user’s ability to collect information on the environ-ment during the navigation;
• Presence: the users sense of immersion within the virtual environment.
Later, the same authors Bowman 1998 [44] proposed a taxonomy of travel tech-niques in VE. This taxonomy has 3 main components (Figure 2.5): direction/target

2.5 Interaction techniques and metaphors 63
Figure 2.5: Bowman’s taxonomy for travel techniques [44].
selection, velocity/acceleration selection and input condition.
• direction/target selection: in order to move in the VE, the user must indi-cate where he/she wants to go, or at least in what direction. In the first case,the user can simply select an exact target to move to, using a direct manipula-tion technique such as ray-casting, or an indirect technique such as selecting itin a menu. In the second case , the user may not specify an exact location, butinstead a direction of travel, by pointing with a joystick or physically rotate inthe desired direction for example;
• velocity/acceleration selection: once the user indicates where he/she isgoing, the designer should worry about how quickly the user will get there.Several techniques exist for determining the travel speed. The user can selecta discrete speed (low, medium or fast) or a continuous rang (a slider bar or a”gas pedal”). Additionally, it is important to specify how the user reaches thisspeed. A sudden transition between no motion to fast travel speed will certainlydisorient the user, so it may be beneficial to allow the user to accelerate ordecelerate in a VE;
• input conditions: several input devices can be used to ensure the user travelin a VE. The user can simply indicate the target or continuously indicate thetarget direction. The first technique may be easier for a novice user but cancause the user disorientation and does not provide as much control as the first

64 Virtual Reality Technology
option, if for example the user changes his mind about where he wants to travel.Input devices will be studied carefully later.
Other factors was studied in Bowman’s taxonomy include task characteristics,environment characteristics, user characteristics, and system characteristics.Arns and Cruz-Neira 2002 [11] think that Bowman’s taxonomy is too general, andcan include too many parts of a VR system. To remedy to this problem, they pro-posed a new classification system based on the display devices and interaction devices.
Under Bowman’s taxonomy using a wand with constant velocity or an omni-directional sliding device appear identical because the user moves at constant velocityin the direction of gaze. However, these two travel techniques lead to very differentexperiences for the user. In the same way, the choice of the display device may alsoaffect the user’s travel in a VE. The authors also define two sub-tasks that the userperforms when travelling: translation and rotation. Both of these operations can beperformed simultaneously or separately.
• Rotation: two rotation methods (Figure 2.6) are defined for the user of a VE: physical rotation and virtual rotation. Physical rotation is the rotation of theuser with respect to the world. Virtual rotation is the rotation of virtual worldwith respect to the user. Usually, when travelling in a physical world, we travelforward in the direction our body is facing. When we wish to change direction,we need to orient our body in the new direction and move in that direction.However, in the real world, we are limited since we can’t rotate around thevertical axis. In the VE, the user is still subject to the same limitation. However,he/she is able to fully rotate his/her body in the VE and rotate the VE withrespect to his/her body.
• Translation: similar to rotation, view point translation can be accomplishedusing two different methods: physical translation and virtual translation (Fig-ure 2.7). Physical translation can be simply walking to change the viewpoint.Because virtual worlds are often much more larger than the physical area inwhich the user walks (limitation due to the locomotion device), other methodsmay be employed such as a bicycle which allows the user to feel that he/sheis physically walking as he/she translates in the virtual world, while actuallyremaining stationary in the physical world. Virtual translation is similar to vir-tual rotation. In this context, a variety of devices can be used such as a joystick.
Navigation is a conceptually simple task that involves a movement of the view-point from one location to another. Additionally, viewpoint orientation also needs tobe considered. Bowman et al. 2001 [41] organises the navigation metaphors into fivecategories:

2.5 Interaction techniques and metaphors 65
��������
��A�B�C
D��E
F�����C
�B�CE�
��������B�CE
�E��������E����EB�E��
���
���
!�"�#$�������A
��%#��&A�'�(���)�"��������A�AEB����
��%#��&A�FEC�B���)�*BBECE�������AEB�����
Figure 2.6: Arns’s 2000 [11] taxonomy for rotation techniques.
• Physical movement;
• Manual viewpoint manipulation;
• Steering;
• Target-based travel;
• Route planning.
Physical movementIn most cases of 3D interaction, the concept used for the design of new interactiontechniques is inspired by human interaction with the real environment. For example,walking is the easiest and most natural way to move from one place to another ineveryday life. This way of moving is widely used in VR. Other navigation metaphorsare also inspired by such natural dynamic gestures.
For example, physical movement uses the motion of the user’s body to travelthrough the environment. Ware and Osborne [289] defined one of the first navigationmetaphors based on real walking. The user moves freely within the VE by physicallywalking on the spot. To change the walking direction, the user should turn his headin the desired orientation. Figure 2.8 shows some examples of locomotion devicessuch as treadmills, stationary bicycles, walking-pads, dance-pads, and a chair-basedinterface. Such techniques need enhanced physical exertion when navigating.

66 Virtual Reality Technology
����������
ABC��D��
E���F��
���
�������������
�����������F������ �������!D���
��������E!�D��C���"DD!�!�������!D����
#!$F�������%��$
&D��! ����%��$
'��%��$�������D!�
Figure 2.7: Arns’s 2002 [11] taxonomy of translation techniques.
(a) (b) (c)
Figure 2.8: Examples of locomotion devices : (a): a walking-pad [35], (b): a dance Pad[22], and (c): a chair-based interface[22].
Another approach based on the user physical movement principle was proposedby York et al. 2004 [303]. They proposed to calculate the travel speed based on thespeed of ascent or descent of the user knees. There is a strong dependence betweenthe travel in the virtual scene and physical movement navigation techniques. Thetechniques based on the physical movement navigation are easier to use because theuser does not provide any cognitive effort to understand this technique. Accordingto a study by Usoh et al. 1999 [282] study, the results are better when the used nav-igation metaphor is close to real walking, because presence is higher for real walkersthan virtual walkers.
Virtual movementManual viewpoint manipulation In manual viewpoint manipulation, the user’s handmotions can be used to simulate travel. Mine et al. 1997 [199] introduced a travel

2.5 Interaction techniques and metaphors 67
technique in which the direction is given by the orientation of the head. It means thatthe direction of movement follows the direction of the user’s gaze which is determinedby the movement of the head. It is a cognitively very simple technique but it hasa major drawback since it does not allow the user to visually observe the parts ofthe scene that are behind him or to the side, so he will often be forced to navigateblindly. To overcome this problem, a technique based on the user hand directionwas proposed (Robinett and Holloway 1992 [238], Bowman and Hodges 1999 [39]).This technique allows the user to move and look in different directions. The traveldirection is determined continuously by the user’s hand orientation. This techniqueis somewhat more difficult to learn for some users, but more flexible then the headtracking techniques. Mine et al. 1997 [199] proposed a technique which uses bothhands to move. Indeed, it is possible to determine both the direction and the velocityof travel. The main advantage of this technique is based on the knowledge of the posi-tion of both hands. The velocity is calculated according to the distance between bothhands: the longer the distance is, more rapid the travel is. This technique is cogni-tively difficult because the user may have difficulty to control the velocity of his travel.
The ”grabbing-the-air” technique (Butterworth et al. 1992 [57]) is another exam-ple of techniques that use the hand to specify the travel direction. The user pullshimself along as if with a virtual rope. The direction of movement may be indicatedin several ways, among them, using a joystick. In the metaphor of the flying saucerintroduced by Butterworth et al. 1992 [57], the user uses a joystick to move forwardand backward in the VE. There are 6 degrees of freedom device, 3 degrees for motionand 3 degrees for rotation. This technique is often performed using Pinch Glovesand can be used with one or both hands . Usually, when someone talks to others,it is natural to turn his body toward his interlocutor(s). Bowman et al. 2001 [36]were inspired by this real-life example to implement the technique that determinesthe travel direction with the user torso direction (Figure 2.9).
(a) (b)
Figure 2.9: Pinch Gloves [36]: (a): User wearing Pinch Gloves (b): Two-handed naviga-tion technique
Target-based travel The user specifies the destination, and the system handles the

68 Virtual Reality Technology
movement. This may take the form of teleportation, where the user jumps immedi-ately to the new location. This method has a major drawback because it confuses theuser since it gives no information on the traveled distance. To overcome this problemButterworth et al. 1992 [57] proposed to fly the user between the starting point andthe destination to avoid user disorientation. Target-based techniques are very simplefrom the user’s point of view.
The use of a map is another way to perform a movement in a virtual world pro-posed by Bowman et al. 1999 [39]. The user is represented by an icon in a 2D map(Figure 2.10). The movement of the icon by a stylus to a new location on the mapcreates the user’s travel. When the icon is pressed, the system moves slowly from theuser’s current location to the new location indicated by the icon.
Figure 2.10: Physical (left) and virtual (right) view of map navigation metaphor [39].
Stoakley et al. 1995 [264] offered the user the possibility to directly manipulatehis viewpoint. The user can move his viewpoint as he/she moves an object in the vir-tual world. This metaphor is called Worlds In Miniature (WIM). To travel, the userholds in his hand a virtual model (a miniature representation of the virtual world).The user’s movements in the virtual world following his/her avatar in the miniatureworld. Elvins et al. 1998 [98] propose to represent only a part of the virtual world inminiature allowing the user to easily find its way. This technique relies on the prin-ciple of Worldlets that are miniature representations of several parts of the virtualenvironment.
Route planning The user specifies the path that should be taken through the en-vironment, and the system handles the movement (Ahmed and Eades 2005[5]). Theuser may manipulate icons or draw a path on a map of the space or in the actualenvironment in order to plan a route. Igarashi et al. 1998 [150] proposed anothermethod that allows the user to draw the intended path directly on the scene, andthe avatar automatically moves along the path. Sternberger 2005 [263] uses a radius

2.5 Interaction techniques and metaphors 69
to draw freely a deformable virtual path to follow during navigation. The purposeof this interaction is to avoid obstacles that confront the user and that can slightlychange the direction. Once the destination is known, the user can be moved to thenew location.
Steering Continuous specification of the direction of motion. Examples of tech-niques called gaze-directed steering, where the user’s head orientation determines thedirection of travel, or pointing, where hand orientation is used are called continuoussteering; these techniques are general and efficient.
Thought wizard metaphor The user is relaxed at a fixed point in the 3D space anduses simple gestures to move the needed information around him or her.
2.5.2 Selection and manipulation
Because direct manipulation is a main interaction modality, not only in the 3D vir-tual world but also in natural real environments, the design of interaction techniquesfor object selection and manipulation has a profound impact on the entire VE userinterface quality.
select an object is a common task in everyday life. Indeed, in order to manipulatean object, the user needs to take it in his hand or designate it among other objects.The selection process in VR is often inspired by the selection in the real world. Theselection task is also called a target acquisition task (Zhai etal. 1994[308]), representsthe designation of an object or set of objects to accomplish a given goal within theVE (Bowman and Frohlich 2005[38]). But how can one tell the system that an objecthas been selected?
Selection validation is the task after the designation task. It can be indicated inseveral ways according to the selection technique used and the environment in whichthe user operates. For example, the user can press a button, use a gesture or a voicecommand, but the validation can be done automatically if the interaction systemtakes into account the users intentions.
Navigation and selection are tasks that allow humans to have the illusion of livingin a virtual world, to travel within it, and even to touch the objects belonging tothe virtual world. In most cases, the user remains a spectator which is immersed inthe VE. However, the manipulation task allows to the user to be an actor capableof changing the VE properties. It represents the active component of any interactivesystem. It can be defined as a complex process of modifying the properties of anobject or set of objects belonging to the virtual world. These properties can be forexample: position, orientation, colour, scale, and texture.
The manipulation task is related to the selection task, because the user can not

70 Virtual Reality Technology
manipulate an object without having previously selected it. Figure 2.11 present tax-onomies proposed by Bowman for selecting and manipulating virtual objects (Bow-man 1998[44]). Interaction techniques for 3D manipulation in virtual environmentsshould provide means of accomplishing at least one of the 4 basic tasks:
• Object selection;
• Object positioning;
• Object rotation;
• Object scaling.
There are two main category techniques of selection and manipulation depend-ing on the position and the distance of the user and virtual objects (Poupyrev andIchikawa 1999 [228]): Exocentric techniques and Egocentric techniques (Poupyrev etal. 1998[226]).
Exocentric techniquesIn this technique, the virtual world is controlled from outside. In this case, the useris considered as an actor who is not a part of the virtual scene, but still has the powerto act on objects in the virtual world. Stoakley et al. 1995 [264] proposed one of thefirst selection metaphors based on the principle of the exocentric interaction, calledWIM, which uses miniature representations of the virtual scene to allow the user toact indirectly on the virtual world objects. Each object in the WIM can be selectedusing the virtual hand metaphor. The user holds a model of the scene on his/her non-dominant hand and selects (and/or manipulate) objects with his/her dominant hand.The main disadvantage of using the miniaturised model of the virtual world is theselection and manipulation of small objects. Also, all objects should be representedin the WIM even where the number of objects presented is very large. Pierce et al.1999 [222] proposed the Voodoo doll technique. This technique offers the user theability to create their own miniature objects which are called Dolls. To manipulatethe objects, the user designates the object he/she wishes to handle due to the headcrusher technique (Pierce et al. 1997 [221]). Then, a miniature model of the objectand its immediate environment is created in the non-dominant hand. The dominanthand is used to move and rotate the miniature created. This technique allows themanipulation of objects of various sizes.
Egocentric techniquesIn this technique, the user proceeds directly from within the environment. The usercan use his own hand to select a virtual object. Sturman et al. 1989 [266] proposeda selection technique based on the virtual hand metaphor. In this technique, theuser touches the virtual object with his real hand to designate it, then validates theselection, either by closing his/her wrist, or by remaining in contact with the ob-ject for some time. This technique is very simple, natural and intuitive but it raises

2.5 Interaction techniques and metaphors 71
(a)
(b)
Figure 2.11: Taxonomies proposed by Bowman 1998 [44] for selection (a) and objectmanipulation (b) in VEs.
the problem of selecting distant objects. In this case, the user must move up to benext to the object in order to designate it by his hand. To overcome this problem,Poupyrev et al. 1996 [227] proposed the Go-Go technique. It is based on the sameprinciple as the previous technique, e.g. touching the virtual object to select it. Itis also based on the metaphor of the virtual hand (the hand is represented by a realhand in the VE). The virtual hand position is calculated by a non-linear function, so

72 Virtual Reality Technology
that the virtual hand goes further than the real hand after having reached a certaindistance D threshold. The user has a virtual arm longer than its real hand allowingit to reach distant objects. This technique is still limited to the selection and ma-nipulation of small objects. Frees and Kessler 2005 [106] have proposed a techniqueof selection/direct manipulation that can be used to complement manual interactiontechniques such as ray-casting to improve the accuracy of user hand movements. Infact, the rotation and translation are stabilised when the hand movements slow downbelow a certain threshold.
When the virtual objects are not readily available to the user, he/she can select itthrough a specific interaction technique. One of the first techniques designed for inter-action with virtual worlds is the ray-casting technique. This technique was introducedby Bolt 1980 [32] and enriched over the years by other researchers. The Ray-castingtechnique is based on the virtual ray metaphor. An infinite laser ray from a virtualhand crosses the entire virtual world. The first object intersected in the virtual worldis ready to be selected. Zhai et al. 1994 [308] proposed a new interaction techniquebased on the ray-casting technique. They added a 3D semi-transparent cursor atthe end of the ray. The objective of this cursor is to distinguish the virtual ray inthe scene. Later, De Amicis et al. 2001 [88] replaced the cursor by a spherical volume.
Techniques based on the virtual pointer metaphor have the advantage of beingcognitively simple and easy to use, but have a major drawback for the selection ofsmall and distant objects. Liang and Green 1994 [183] proposed to use an icon in-stead of the ray to solve this problem. In fact, if distant objects become smallerwith distance, then the selection tool must be larger to be able to easily select it.Thereafter, Forsberg et al. 1996 [104] proposed to modify the opening angle of thecone as a function of the object to be selected and its position in the virtual environ-ment. The selection cone must be wider for distant objects that for close ones. Thistechnique takes advantage of Fitts’law, which says that the selection time decreaseswith an increasing surface to be selected. During the selection process, the user mayface barriers that hide the objects he/she wants to select. To avoid this difficulty,Olwal and Feiner 2003 [212] proposed the virtual flexible pointer technique which isan extension of the virtual ray technique. This technique allows a user in a 3D envi-ronment to point more easily to fully or partially obscured objects, and to indicateobjects to other users more clearly. The flexible pointer can also reduce the need fordisambiguation and can make it possible for the user to point to more objects thanwith other presented egocentric techniques (Figure 2.12).
Other researchers prefer to remove unwanted objects that the user does not wishto select (Steed and Parker 2004[261]). To do this, the user is holding a flashlightthat illuminates some virtual objects, which are considered potentially selected. Un-wanted objects can be removed by making movement with the lamp. This selectiontechnique is effective and avoids selection errors but it has a major drawback, sincethe user changes the properties of the environment by removing undesirable objectsto select other objects.

2.5 Interaction techniques and metaphors 73
Figure 2.12: The flexible pointer selecting a partially occulted object without interferingwith the occluding object [212].
For the different manipulation techniques that we have cited, the user acts directlyon the virtual objects. There are, however, other techniques of indirect selection whichallow the user to designate distant objects. These techniques are based on the Di-rected Finger metaphor (Pierce etal. 1997[221]). This metaphor requires that theindex finger is recognisable in the virtual space using a position sensor attached tothe finger called Sticky Finger. Objects are selected using a virtual ray, leading fromthe head of the user and passes through his hand index finger. Another techniquebased on the same metaphor was proposed by Tanriverdi and Jacob 2000 [269]. Inthis technique the user indicates objects with his glance. The user’s head should berecognisable in the virtual world. This technique has a major problem because theuser can not look around himself during the selection process. Pierce et al. 1997 [221]proposed an alternative selection technique that uses the movement of a hand. Theuser uses his thumb and forefinger to grasp the target object and take it, as if theimage was perceived rather than the 3D object. Other techniques based on the sameprinciple have been proposed. Among them, the Framing Hands technique (Pierceetal. 1997[221]). Using this technique, the user positions his hands to form the twocorners of a frame in the 2D image. The user then positions this frame to surroundthe object to be selected. Another example of indirect manipulation techniques isthe technique proposed by Kitamura et al. 1999 [169] using Virtual Chopsticks. Thistechnique allows the user to capture, to move and to rotate virtual objects. For ex-ample, one of the chopsticks can serve as a rotation axis while the other indicatesthe rotation amplitude. Ware and Osborne 1990 [289] proposed the creation of newobjects with shapes similar to virtual objects, on which they perform manipulations.The user has consistent tactile feedback. Hachet 2003 [132] uses a 2 hand-held steer-ing wheel device (CAT), to manipulate objects in a scene.

74 Virtual Reality Technology
The variety of reported interaction techniques can be overwhelming for the de-veloper. However, some general principles regarding the choice of manipulation tech-niques can be stated. None of the techniques can be identified as the best. Theirperformance is task and environment dependent. Often, non-realistic techniques havebetter performance than those based on the real world (Bowman et al. 2001[41]). Theevaluation of virtual manipulation techniques helps to quantify performance and isan important research area.
2.5.3 System control
System Control is a task that can execute a command in order to change the interac-tion mode and/or the system state. System control refers to indirect manipulation;it includes all indirect manipulation techniques on the application, the environmentand/or data. Bowman et al. 2006 [37] define the System Control as the change of thestate system or the mode of interaction; it can allow adjusting scalar values too. Thistask is at a different conceptual level from the three other tasks. The user interactswith the system using services provided by the system itself.
In a 2D interface, the System Control can be summarised with a simple click onan icon or menu. It can be considered as a communication tool between a humanand the application. Well-known 2D techniques have been adapted to VE. In the 3Dinterface, the user must consider several degrees of freedom to interact with the sys-tem. Input/output devices are numerous and more elaborate than those used in 2D.Since the arrival of the first computers, graphic interfaces have evolved considerably.Currently, they are more ergonomic, more aesthetic, and easier to use. Early worksreflection on control system techniques in VR proposed to extend or adapt some 2Dwidgets to 3D. Conner et al. 1992 [78] defined a widget as ”an encapsulation of geom-etry and behaviour used to control or display information about application objects”.Then, they built a library of components such as the colour, selector, and the virtualsphere rotation widget.
2.5.3.1 2D solutions in 3D environments
The achievement of a 2D menu in 3D interfaces started with the introduction ofWIMP elements into VE such as pop-up menus and pull-down 3D virtual menus.Jacoby and Ellis 1992 [157] suggested a pop up 2D menu freely positioned and ro-tated in the virtual space. The user selects and activates the menu using the virtualpointer metaphor. This concept has been revised and improved by Jacoby et al. 1994[158] by adding transparency and haptic feedback to facilitate the menu manipula-tion. By combining 3D interaction with the software support available for a 2D userinterface tool, the user is provided with a familiar interaction concept. Other workattempted to make 2D widgets available within a 3D context, thus also incorporatingtraditional 2D menus. Early work by Feiner et al. 1993 [102] proposed a heads-upwindow system, where images of 2D windows are overlaid on the user’s view of the

2.5 Interaction techniques and metaphors 75
physical world. In Coninx et al. 1997 [77] an hybrid 2D/3D user interface is used.A pinch glove is used for simulating 2D mouse events. More recently, Andujar et al.2006 [9] suggested to extend current 3D toolkits to display menus and other widgetssuch as 2D shapes within the virtual world.
In 2D desktop environments, menus can be operated by pressing a cursor key orusing the mouse pointer. Typically in VE, the user’s finger or laser-pointer is used forselecting in combination with a button-click on a physical device for activation. Thissolution has the advantage of being familiar to users. No learning period is necessaryto teach user(s) how to use the menu.
2.5.3.2 3D menus
Different menus for system control have been proposed and evaluated:
Circular menus: are widely used in VRs. The different elements of the menuare placed on a circle. The selection is made either by motion in the direction of an el-ement from the centre, or by circle rotation in order to bring the element of interest inthe area of selection. This concept was firstly used in 2D interfaces. Kurtenbach andBuxton 1994 [175] proposed a technique that selects a menu item in a circular motionin one gesture. The user draws a line in the desired element’s direction. This con-cept was then adapted for triangular menus whose elements are distributed around acentral element. Thus manipulation is more efficient compared to the circular menusbecause the elements are equidistant from the centre. Deering 1995 [90] provided asignificant improvement to these menus, adapting them to be hierarchical and thenallowing a greater number of commands. The disadvantage of the hierarchical menuis that they occupy large a space on the screen. It completely replaces the scene dur-ing handling. Liang and Green 1994 [183] use circular menus without using hierarchy.Unlike other circular menus, the menu items are arranged in a circle around a verticalaxis. The menu is then represented as a ring with a hole in the middle. The elementin front of the user is the active element. To change the latter, the user must rotatethe ring according to a predefined axis. This technique has been adopted by Gerber2004 [119] but instead of displaying a complete circle before the user’s hand, only apart of the menu is shown. The user selects an item by turning his wrist. Wescheand Droske 2000 [290], proposed a hybrid technique that uses a circular menu andpointer technique for selection. Each element is represented by an icon. The variousicons are arranged in front of the user according to a portion of a circular arc andthe selection is done using a virtual ray. A quick menu selection was introduced withthe Spin Menu (Gerber and Bechmann 2005[118]). Items are arranged on a portionof a circle and controlled by rotating the wrist in the horizontal plane. Since 9-11items can be displayed on a ring, hierarchical spin menus are suggested with crossed,concentric, or stacked layouts.
Glove-based menus : these allow more natural selection techniques using thefingers and hands. Typically, finger pinches are used to control a menu system. The

76 Virtual Reality Technology
Tulip Menu (Bowman and Wingrave 2001[43]) is a drop-down menu based on the useof the fingers. The user’s hand is equipped with a data glove and each finger is a menuitem (Figure 2.13). The user can select a menu item by pinching the thumb to theappropriate finger. When the number of menu items is greater than four, it is possi-ble to use both hands. The little finger is reserved for a ”more options” item. Whenthe menu was originally selected the first three item would appear on the first threefingers. Pinching the thumb to the little finger caused the next three items to appearin the non-dominant hand. This technique allows an accurate and fast selection. Itis interesting because the user does not need to look at his finger to choose which oneshould be pinched. On the other hand, this technique is not suitable for a large menu.
Figure 2.13: The tulip menu proposed by Bowman and Wingrave 2001[43].
Speech recognition enhanced menus: one of the problems resulting fromthe use of data gloves is that hands can be encumbered to use other tools (Hand1997[137]). This was the motivation for the development of hands-off interactiontechniques (Jacoby etal. 1994 [158]). The menu items are selected via speech recog-nition. Other menu solutions employ speech recognition as an alternative input inaddition to graphical selection (multi-modal approach); among them the 3D Paletteby Billinghurst et al. 1997 [26].
Hand-held menus : allow menus to be controlled with only one hand, whilethe other hand is used to select items from it. Prominent examples are the interac-tion techniques developed by Mine et al. 1997 [199]. The tear-off palette containsminiature representations of available objects which can be selected and added to thevirtual world by the user. Another example for two-handed direct menu selection isthe tool and object palette which is based on tracked props (Szalavari and Gervautz1997 [267]).
Workbench menus: these are very attractive for direct manipulation (Gros-jean and Coquillart 2001 [128]). Typically, menus are used by means of a toolboxcontaining various 3D-icons. Interaction can be done with a stylus or data glove as

2.6 Visual Display Configurations 77
for example on the responsive workbench system introduced by Cutler et al. 1997[83]. The C3 (Command and Control Cube) proposed by Grosjean and Coquillart[128] uses the marking menu concept. It proposes to place the menu at the cuberather than with a list, in order to accelerate access. The menu consists of 27 boxesdivided into 3 ∗ 3 ∗ 3 boxes. The purpose of this representation is to allow the userto select a command with a maximum three gesture to reach his goal. Each of the26 boxes may contain a command, the 27th box, placed on the centre of the cube, isreserved for the special action to cancel the menu. The user’s hand is represented bya small cursor always initialised at the centre of the cube. Thus, the user simply hasto make a gesture in the direction of the desired item, then release the device buttonto perform the corresponding action. This technique gives excellent results in termsof speed selection and accuracy.
Body relative menus : these are attached to the user’s body and thus takeadvantage of proprioception during operations. The look-at-menu (Mine et al. 1997[199]) is an example. The menu can be attached to any object in the VE includingthe user. It is activated by the intersection of the user’s direction of sight with ahot point representing a menu. To choose an item the user moves his/her head tosimply look at the desired item to select it. Thus, head position is used instead ofthe traditional hand position. In 2007 Dachselt and Hbner [85] proposed a survey ofgraphical 3D menu solutions for VEs among others (e.g. augmented reality).
Figure 2.14: Immersive wall of the PREVISE platform [154].
2.6 Visual Display Configurations
Virtual Reality systems are based on different hardware configurations, mainly re-lated to visual interfaces. These configurations can be classified into two categories:

78 Virtual Reality Technology
Figure 2.15: Example of immersive dome [126].
Figure 2.16: Example of immersive rooms [166].
• Immersive configurations(used in Fully-Immersive Virtual Environment (FIVE))whose objective is to immerse the user in the VE (immersive virtual reality)through a stereoscopic display. Note that some configurations do not involvetotal recovery of the visual field of the user (wall, workbench);
• Non-immersive (used in Semi-Immersive Virtual Environment (SIVE)) con-figurations only allow the user to visualise virtual entities in a virtual world,through a display device such as a computer screen (Isdale 1993 [156]). Then,the user sees the world through a ”window” represented by the screen. Notethat this configuration does not necessarily imply the absence of Stereoscopicvisualisation (objects appear behind or before the screen plane).

2.6 Visual Display Configurations 79
Figure 2.17: Example of workbench [262].
Figure 2.18: Example of the CAVE-like system [205].
2.6.1 Immersive configurations
Immersive configurations are based on one of the following visual interfaces.
• Immersive walls: these consist of a large flat screen on which images are pro-jected. Visualisation, generally stereoscopic, is based on the use of polarisingfilters (linear or circular) and passive or active glasses for separating the imagesfor the left eye of those for the right eye. The PREVISE platform of LISA is animmersive wall (Figure 2.14) which consists of a 2 x 2.5 m visual display withpassive stereoscopic projection.
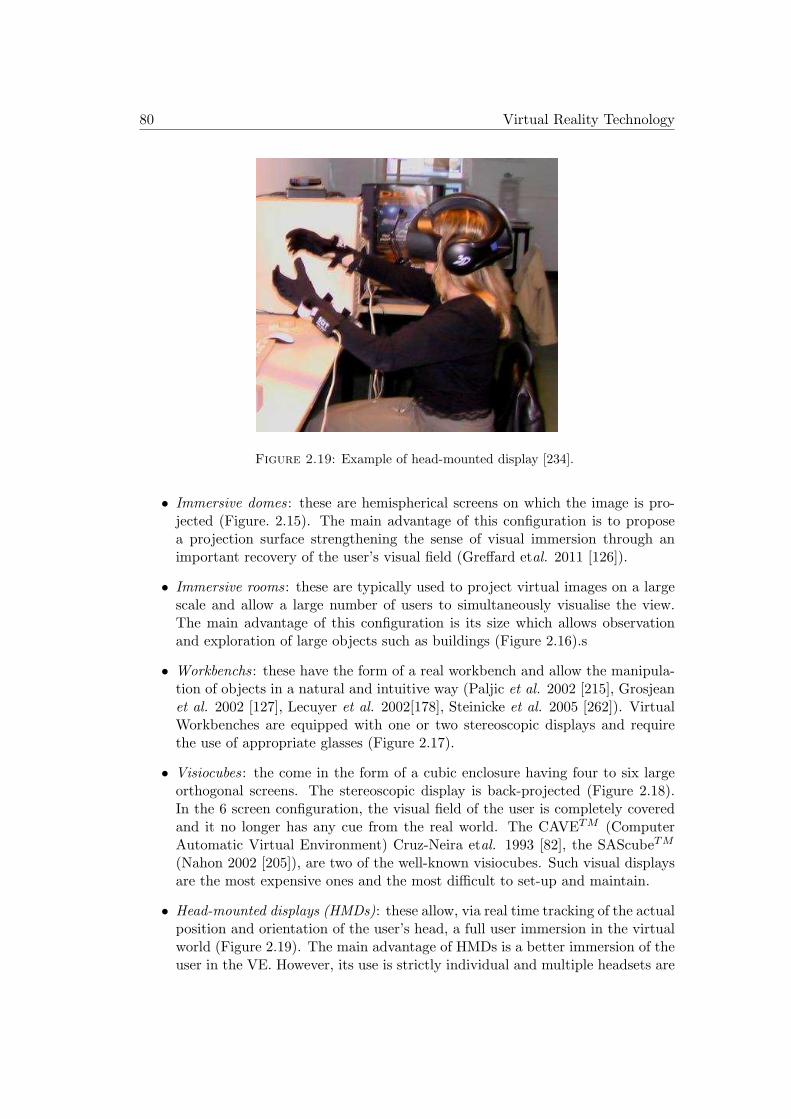
80 Virtual Reality Technology
Figure 2.19: Example of head-mounted display [234].
• Immersive domes : these are hemispherical screens on which the image is pro-jected (Figure. 2.15). The main advantage of this configuration is to proposea projection surface strengthening the sense of visual immersion through animportant recovery of the user’s visual field (Greffard etal. 2011 [126]).
• Immersive rooms: these are typically used to project virtual images on a largescale and allow a large number of users to simultaneously visualise the view.The main advantage of this configuration is its size which allows observationand exploration of large objects such as buildings (Figure 2.16).s
• Workbenchs: these have the form of a real workbench and allow the manipula-tion of objects in a natural and intuitive way (Paljic et al. 2002 [215], Grosjeanet al. 2002 [127], Lecuyer et al. 2002[178], Steinicke et al. 2005 [262]). VirtualWorkbenches are equipped with one or two stereoscopic displays and requirethe use of appropriate glasses (Figure 2.17).
• Visiocubes: the come in the form of a cubic enclosure having four to six largeorthogonal screens. The stereoscopic display is back-projected (Figure 2.18).In the 6 screen configuration, the visual field of the user is completely coveredand it no longer has any cue from the real world. The CAVETM (ComputerAutomatic Virtual Environment) Cruz-Neira etal. 1993 [82], the SAScubeTM
(Nahon 2002 [205]), are two of the well-known visiocubes. Such visual displaysare the most expensive ones and the most difficult to set-up and maintain.
• Head-mounted displays (HMDs): these allow, via real time tracking of the actualposition and orientation of the user’s head, a full user immersion in the virtualworld (Figure 2.19). The main advantage of HMDs is a better immersion of theuser in the VE. However, its use is strictly individual and multiple headsets are
2.6 Visual Display Configurations 81
required for multi-user/or collaborative applications. Another drawback is thatmost HMDs have a quite small field of view (FOV).
It is important to also note that the use of HMDs presents ergonomic problems.Thus, the user mobility is often limited, given the wires connecting the visualisationdevice to the computer. On the other hand, its considerable weight and the lowrefresh rate may create discomfort and cybersickness.
2.6.2 Non-Immersive Configurations
In non-immersive (desk-top) configurations, the virtual environment is displayed on aPC screen or more recently on a 2D/3D TV screen. The size of the screen can there-fore be quite large. These configurations are a relatively more affordable alternativethat immersive configurations.
On a conventional screen, the virtual scene is displayed with quite better char-acteristics (resolution, light, etc.) than in an immersive (projected) configuration.Currently, the market of large size, low cost flat screen displays (LCD, OLED orplasma) allows us to consider non-immersive configurations, for which the displayedimage occupies a larger portion of the user’s visual field (a recent TV screen has adiagonal size of about 2m ).
In this configuration, the VE is generally viewed through the screen in a non-colocalised configuration, i.e. with a spatial offset between the display space and theinteraction space (Figure 2.20) or in a colocalised position (Figure 2.21).
Figure 2.20: Illustration of a non-colocalised configuration [65].

82 Virtual Reality Technology
Figure 2.21: Illustration of a colocalised configuration [213].
Several configurations are available for non-immersive display systems such as :
• Screens directly connected to the computer: classic PC screens or more recently,large display (LCD or plasma);
• Laptop screens such as mobile phones screens or PDA (Personal Digital Assis-tants);
• Systems of video projection on various surfaces;
• Mixed solutions (Billinghurst et al. 2001 [27]).
The main interest of non-immersive configurations is that the display can beshared by several users (except laptop screens). In addition, systems using projec-tors or flat panel displays are independent of the user position and they are low-costcompared to HMDs. In addition, there are a variety of projection surfaces such aslarge screens or walls [232], semi-transparent mirrors (Rauterberg et al. 1997[231]),and surfaces (Piper et al. 2002[223]).
2.7 Conclusion
In this chapter, we proposed have a comparison between 2D, 3D and virtual realitytechniques, and mentioned better suitability for fully immersive environments. Re-search work on the comparison between visual representations and interaction tech-niques have been presented. Then, we have presented and analysed 2D/3D visuali-sation and virtual reality configurations. In this context, we have giving an overview

2.7 Conclusion 83
of the existing interaction techniques that can be suited for Visual Data Miming(in the next Chapter we will present an overview of interaction techniques used inVisual Data Mining). Different classifications based on fundamental tasks such asnavigation, selection and manipulation of virtual entities have also been analysed.Furthermore, we have presented a classification of visual displays, focusing on immer-sive and non-immersive ones. In the next chapter, we will propose a new classificationof Visual Data Mining (VDM) techniques based on the use of 3D and virtual realitytechniques.

84 Virtual Reality Technology

3Overview of Visual Data Mining in 3D and
Virtual Reality
Contents
3.1 Introduction . . . . . . . . . . . . . . . . . . . . . . . . . . . . . . . . . 86
3.2 Visualisation . . . . . . . . . . . . . . . . . . . . . . . . . . . . . . . . . 87
3.2.1 Why is visualisation important ? . . . . . . . . . . . . . . . . . . . . . 88
3.2.2 The Visualisation Process . . . . . . . . . . . . . . . . . . . . . . . . . 90
3.2.3 Semiology of graphics . . . . . . . . . . . . . . . . . . . . . . . . . . . 93
3.3 Visual Data Mining (VDM) . . . . . . . . . . . . . . . . . . . . . . . . 96
3.3.1 3D Visual Representation for VDM . . . . . . . . . . . . . . . . . . . . 98
3.3.1.1 Abstract visual representations . . . . . . . . . . . . . . . . . 99
3.3.1.2 Virtual worlds . . . . . . . . . . . . . . . . . . . . . . . . . . 102
3.3.2 Interaction for VDM . . . . . . . . . . . . . . . . . . . . . . . . . . . . 103
3.3.2.1 Visual exploration . . . . . . . . . . . . . . . . . . . . . . . . 104
3.3.2.2 Visual manipulation . . . . . . . . . . . . . . . . . . . . . . . 106
3.3.2.3 Human-centred approach . . . . . . . . . . . . . . . . . . . . 107
3.4 A New Classification for VDM . . . . . . . . . . . . . . . . . . . . . . 107
3.4.1 Pre-processing . . . . . . . . . . . . . . . . . . . . . . . . . . . . . . . 108
3.4.2 Post-processing . . . . . . . . . . . . . . . . . . . . . . . . . . . . . . . 111
3.4.2.1 Clustering . . . . . . . . . . . . . . . . . . . . . . . . . . . . 112
3.4.2.2 Classification . . . . . . . . . . . . . . . . . . . . . . . . . . . 113
3.4.2.3 Association rules . . . . . . . . . . . . . . . . . . . . . . . . . 114
3.4.2.4 Combination of methods . . . . . . . . . . . . . . . . . . . . 115
3.5 Conclusion . . . . . . . . . . . . . . . . . . . . . . . . . . . . . . . . . . 116
85
86 Overview of Visual Data Mining in 3D and Virtual Reality
3.1 Introduction
At the output of the Data Mining (DM) process (post-processing), the decision-makermust evaluate the results and select what he finds interesting (Figure 3.1). Exploringand analysing the vast volume of knowledge extracted by the DM algorithms can bea complicated task. However, this task can be improved considerably with visualrepresentations by taking advantage of human capabilities for perception and spatialcognition. Visual representations can allow rapid information recognition and showcomplex ideas with clarity and efficacy (Card et al.1999 [60]).
In everyday life, we interact with various information media which present us withfacts and opinions based on knowledge extracted from data. It is common to commu-nicate such facts and opinions in a virtual form, preferably interactive. For example,when watching weather forecast programmes on TV, the icons of a landscape withclouds, rain and sun, allow us to quickly build a picture about the weather forecast.
Such a picture is sufficient when we watch the weather forecast, but professionaldecision-making is a rather different situation. In professional situations, the decision-maker is overwhelmed by the DM algorithm results. Representing these results asstatic images limits the usefulness of their visualisation. This explains why thedecision-maker needs to be able to interact with the data representation in orderto find relevant knowledge. Interaction with the data representation can be exploitedin two ways (de Oliveira and Levkowitz 2003 [89]):
• interaction with the DM algorithms results in facilitating and accelerating theanalysis of studied data, the intermediate result, or produced knowledge.
• interaction with the DM algorithms.
Visual Data Mining (VDM), presented by Beilken and Spenke 1999 [23] as aninteractive visual methodology ”to help a user to get a feeling for the data, to detectinteresting knowledge, and to gain a deep visual understanding of the data set”, canfacilitate knowledge discovery in data. The advantages of VDM is that the user isdirectly involved in the DM process and does not only interact with the data repre-sentation.
In 2D space, VDM has been studied extensively and a large number of visualisa-tion techniques have been developed over the last decade to support the exploration oflarge data sets. Thus, including aesthetically appealing elements, such as 3D graphicsand animation, increases the intuitiveness and memorability of visualisation. Also, iteases the perception of the human visual system (Spence 1990 [255], Brath et al. 2005[47]). Although, there is still a debate concerning 2D vs 3D data visualisation (Shnei-derman 2003 [245]), we believe that 3D and VR techniques have a better potential toassist the decision-maker in analytical tasks, and to deeply immerse the user in thedata sets. In many cases, the user needs to explore data and/or knowledge from the

3.2 Visualisation 87
inside-out and not from the outside-in, as in 2D techniques (Nelson et al. 1999 [206]).This is only possible by using VR and Virtual Environment (VEs). VEs allow usersto navigate continuously to new positions inside the data sets, and thereby obtainmore information about the data. In KDD, VR has already been studied in differentareas such as pre-processing (Nagel et al. 2008 [203], Ogi et al. 2009 [210]), classi-fication (Einsfeld et al. 2006 [95]), and clustering (Ahmed et al. 2006 [4]). Althoughthe benefits offered by VR compared to desk-top 2D and 3D still need to be proved,more and more researchers are investigating its use with VDM (Cai et al. 2007 [59]).
In this chapter, we firstly introduce research work on information visualisationregarding visualisation tool design and specially the graphic representation. In Sec-tion 2, we provide an overview of the current state of research concerning 3D visualrepresentations. In Section 3, we present our motivation for interaction techniques inthe context of KDD. In Section 4, we propose a new classification for VDM based onboth 3D representations and interaction techniques. In addition, we survey represen-tative works on the use of 3D and VR interaction techniques in the context of KDD.Finally, we present possible directions for future research.
Figure 3.1: Illustration of the KDD process.
3.2 Visualisation
Visualisation is the display of information using graphic representations. A singlepicture can contain more information, and can be processed much more quickly thana page of words. This is because the human perceptual system can interpret im-ages faster then text analysis. Pictures can also be independent of language, wherebya graph or a map may be understood by a group of people with no common language.
It is impressive to realise the number and types of visualised data that we en-counter in our everyday activities. Some of these might include:
• train and subway maps;
• the instructions for changing a car headlight;

88 Overview of Visual Data Mining in 3D and Virtual Reality
• a graph which may indicate the increase or decrease the number of unemployedin a country.
In each case, the visualisation provides an alternative to, or a supplement for,textual information. It is clear that visualisation provides a richer description of theinformation than the word-based counterpart.
3.2.1 Why is visualisation important ?
There are many reasons to explain why visualisation is important. The most obviousreason can be that sight is one of the human key senses for information understanding.
Figure 3.2 shows a diagram of an organisation that is difficult to describe verbally.However, the image can be easily comprehensible with only a brief examination (Wardet al. 2010 [286]). For instance, it is obvious that marketing has the most consultantsand that the driver has the longest chain of command.
�������
��A�������B�� �����C�DB�� ��E�F��
�B���D��� �B���D��� �����FD��D
�B���D��������F����D�B����������FD��D
Figure 3.2: An organisation chart. A pattern requires at least one paragraph to describeit.
Example 3.2.1 In this example we highlight why visualisation is so important indecision making, and the role of human preferences and training.
Elting et al. 1999 [240] presented 34 clinicians with the preliminary resultsfrom hypothetical clinical trials of a generic conventional treatment compared with ageneric investigation treatment; both treatments treating the same condition. Fourdifferent visualisation techniques are used to represent the two treatment results. Thetwo treatments differed from one another and one of the treatments is better thanthe other. Clinicians seeing that difference should then decide to stop the trial.
Figure 3.3 shows the four presentations of the same data. In the upper left thereis a simple table; in the upper right, pie charts; in the lower left, stacked bar charts;and in the lower right, a sequence of rectangles. In all representations, both theconventional and the investigation treatments are presented. The green colour showsthat the drug induced a response and red that none occurred. The decision to stopvaried significantly, depending on the presentation of the data. Correct decisions were

3.2 Visualisation 89
82% with icon display (lower right), 68% with tables, and 56% with pie charts or bargraphs. In actual clinical practice, up to 25% of the patients treated according to thedata displayed as bar charts would have received inappropriate treatment. Clearlythe choice of visualisation impacted the decision process. Elting et al. 1999 [240]noted that most (21/34) clinicians preferred the table, and that several did not likethe icon display. This emphasises that it is not only the visualisation that is key inpresenting data well, but that user preferences are strongly involved.
Figure 3.3: Four various visual representations of a hypothetical clinical trial. [240].
The high use of the web increase the amount of recorded data. The explorationand analysis of large marketing, financial, security, medical, and biological data setsproduce results that need to be analysed. Given the increasing size of informationavailable there is a growing need for tools and techniques to help make effectiveuse of this information overload. Likewise, there is a growing need to find mecha-nisms for communicating information to people in an efficient and effective way, andto help educate them about processes and concepts that affect everyday life, fromglobal warming to economic trends. Visualisation is paramount for these new knowl-edge discovery tools. Applications often use both static and interactive visualisationwhich are much more aesthetic and understandable to the user within applications toprovide alternative views of the data and to help describe some structure, patterns,knowledge or anomaly in the data. In many domains, visualisation can be, and isbecoming, an effective tool to assist user(s) in analysis and knowledge discovery.

90 Overview of Visual Data Mining in 3D and Virtual Reality
What is the difference between scientific data visualisation and informa-tion visualisation ?
Both visualisations forms create visual representations from data that supportuser interaction with the aim of finding useful information in the data. In scientificvisualisation, visual representations are typically constructed from measured or sim-ulated data which represent objects or concepts of the physical world. Figure 3.4(a)shows an application that provides a VR interface to view the flow field around aspace shuttle. In information visualisation, graphic models present abstract conceptsand relationships that do not necessarily have a counterpart in the physical world,such as association rules (Agrawal et al. 1993 [2]), etc. For instance, Figure 3.4(b)shows a 3D tree representation to visualise data clusters.
(a) (b)
Figure 3.4: Scientific visualisation and information visualisation examples: (a): visual-ization of the flow field around a space shuttle (Laviola 2000 [177]) (b): GEOMIE (Ahmed etal. 2006 [4])information visualisation framework
3.2.2 The Visualisation Process
Visualisation is often part of a larger process, which may be exploratory data anal-ysis, knowledge discovery, or visual analysis. To design a new visualisation tool, thedesigner should first begin with the analysis of the data to display. The data can comefrom different sources and have different structures (simple or complex). Then, thedesigner should consider the type of information that should be extracted from thesedata by the viewers. Visualisation can be used for different analysis tasks such asexploration (looking for interesting knowledge) or confirmation of hypotheses (basedon prior beliefs).
To visualise data, the designer needs to define mapping from the data onto thedisplay (Figure 3.5). There are many ways to realise this mapping and visualisationprinciples can provide mechanisms to translate date into more intuitive representa-tion for users to perform their goals. This means that the data values are used to

3.2 Visualisation 91
define graphical objects, such as points, lines, and shapes, and their attributes likecolour, position, size, and orientation. Thus, for example, we could map a number toa colour of a cube or a size of line to get a different way to view the same data.
Another, component of the visualisation process is interactive control of the view-ing and mapping of variables. Whereas early visualisation was static, nowadays visu-alisation is a dynamic process. This means that the user controls all process stages,from data mapping to mapping and viewing. There is no effectiveness guarantee of agiven visualisation. Different users, with different backgrounds, perceptual abilities,and preferences, will have different opinions on each visualisation. The user’s task willalso affect the usefulness and effectiveness of the visualisation. Each visualised datumchange can have implications on the resulting visualisation. For this, it is essentialto enable users to modify and interact with the visualisation until they achieve theirgoal, such as extracting an interesting piece of knowledge or confirming or denyinghypothesis.
The visualisation process is traditionally described as a pipeline because is com-posed of a succession of stages which can be studied independently (Figure 3.5).This process starts with data to generate a visualisation. Among several visualisa-tion pipelines, we selected the one proposed by Card et al. 1999 [60] that we thinkis the easiest and simplest representation of the visualisation process. We also notedtwo important points: user interaction can take place at any stage in the pipeline(nodes and link) and visualisation systems may have multiple views at the same timeon the screen. Let us explain more precisely each transformations and stage.
• Data transformation: this is the starting stage of the visualisation process.It allows data to be transformed into something usable by the visualisationsystem. Data transformation deals with data issues such as data too largefor visualisation. Large amounts of data may require ordering, selecting orfiltering. For example, Williamson and Shneiderman 1992 [293] introducedDynamic queries which allow users to formulate queries to select the data tobe visualised by adjusting graphical widgets, such as sliders for quantitativevariables and a check box for qualitative variables. The display is updatedinstantaneously.
• Rendering Mappings: once the data are ready, they can be represented. Thisrequires data mapping into graphical objects by associating to each variablein the data to a graphic variable: shape, colour, and size, for example. Thegraphic objects can have from zero to three dimensions - that is point, line, areasand volumes. It is easy to simply develop a visualisation that conveys wronginformation. Figure 3.6 shows an improper use of bar chart. By having the barsextend over each of the y-coordinate tick marks, there is an implication thatthe y-coordinate is involved, although no such association occurs. For example,the soybeans in the 5th column, cut across several y-values (INDIA, CHINA,

92 Overview of Visual Data Mining in 3D and Virtual Reality
TURKEY) until reaching BRAZIL. A better representation is the one in Figure3.7.
• View transformation: this is the final stage of the visualisation process. Viewtransformation involves the presentation of graphical objects to the user. Thisincludes interfacing with a computer graphics Application Programmer’s Inter-face (API). The display view on the screen can be 3D or 2D. Many interactiontechniques for view transformation are available allowing the user to changethe view or the perspective onto the visual representation. The most knowninteraction techniques are:
– Viewpoint manipulation: this is carried out by translation, rotation orzooming.
– Details on demand : this consists of choosing an element in the representa-tion and bringing up additional information about it (Shneiderman 1996[244]).
– Focus/context aimed to increase detailed description of certain parts ofdata (the point of interest, focus, etc), while the rest of the data is re-duced in size, in order to provide guidance to the users. The best knownFocus/context techniques are the techniques of distortion, such as the Fisheye proposed by Furnas 1986 [116]. In the technique of bending backwards,another variant of the Focus/context technique, the overview of differentobjects is not readable, but, miniatures of objects is an index to move di-rectly to the information sought. However, there are other methods thanthe distortion of space. The viewing volume (Mroz and Hauser 2001 [201])for example, proposes varying the opacity, (colour shades) and frequencyto achieve Focus/context visualisation of 3D data.
– Brushing : this means highlighting a selected subset of the data, but it canalso be done to delete it from view, if the user wants to focus on othersubsets of data.
– Multiple views : this allows the user to have several views of the same rep-resentation on multiple windows. Interactive changes made in one visual-isation are automatically reflected in the other visualisations. Connectingmultiple visualisations through interactive linking and brushing providesmore information than considering each visualisation independently.
Some techniques combine several types of transformation. For example, the se-mantic zoom is a view transformation which changes the data shown (data trans-formation). The more users zoom, the more the level of detail increase (Hascot andBeaudoin-Lafon 2001 [139]). From the visualisation process point of view, we canformalise the differences between the post-processing of association rule methods pre-sented in Chapter 1 Section 1.5.3 as(Table 3.2.2):

3.2 Visualisation 93
Figure 3.5: The visualisation process at a high level view [60].
Figure 3.6: Poor use of a bar chart
• Association rule exploration methods (Query Languages and Rules Browser)only use data transformation;
• Visualisation of association rule mining result methods include Rendering Map-pings and View transformations but are poor in Data transformation;
• Visualisation during association rule mining methods instantiate all transfor-mations of the visualisation process.
As we will see later the post-processing of association rule methodology proposedin this thesis belongs to the 3rd category.
3.2.3 Semiology of graphics
Although many examples of different visualisation techniques have been proposed inorder to determine the most effective encoding based on the variables to represent, westill lack a comprehensive language to describe our graphical creations. Robertson etal. 1991 [237] first suggested the creation of a formal model as a foundation for each

94 Overview of Visual Data Mining in 3D and Virtual Reality
Figure 3.7: Better use of scatter plot
Methods Data transformations Rendering Mappings View transformations
Query Languages •
Rule Browser •
Visualisation ofassociation rulemining results
• •
Visualisation dur-ing associationrule mining
• • •
Table 3.1: Differences among the post-processing of association rules methods from thevisualisation process point of view.
visualisation system. Among the authors who proposed a classification of encodinggraphics, Cleveland and McGill 1984 [73] then Wilkinson 2005 [291] are the best knowconcerning static graphic (charts, scatter plots, etc.). The second flow of works comesfrom cartography, among them MacEachren 1995 [188] and more importantly Bertin1967 [24].
In 1967, Bertin published his semiology of graphics (Bertin 1967 [24]). This wasthe first rigorous attempt to describe the link between data and visual elements. Al-though Bertin 1967 [24] draws his representations on paper, its principles are still thebenchmark for today’s representations.

3.2 Visualisation 95
Bertin presents the fundamentals of information encoding via graphic represen-tations as a semiology, a science dealing with sign systems. His first key point isthe strict separation of content (the information to encode) from the container (theproperties of the graphic system).
Bertins theory states that graphical presentations use graphical marks, such aspoints, lines, and areas, to encode information via their positional and retinal prop-erties (Bertin’s graphical vocabulary is shown in Table 3.2.3).
Marks Points, lines, and area
Positional Two planar dimensions
Retinial Size, value, texture, colour, orientation, and shape
Table 3.2: Bertin’s graphical vocabulary [24].
Bertin’s system is composed of seven visual graphic variables:
• Position (two planar dimensions);
• Six retinal variables (Figure 3.8): size (height, area, or number), value (satu-ration), texture (fitness or coarseness), colour (hue), orientation (angular dis-placement), and shape.
These graphic variables are combined with visual semantics for linking data at-tributes to visual elements.
Position plays a key role in visualisation because it is the visual information per-ceptually dominant in a visual representation (Bertin 1967 [24] , Card et al. 1999 [60],Wilkinson 2005 [291]). The other graphic variables called retinal variables (Table 3.8)are identified by experimental psychology and represent graphic variations designedfor visual perception. There are called retinal variables because it is possible to per-ceive their variations without involving the muscles of the optical system unlike forthe position. The implantation of retinal variables can be punctual, linear or zonal.Krygier and Wood 2005 [173] summarised the most effective use of Bertins retinalvariables for showing qualitative or quantitative differences according to Bertin inTable 3.8.
As concerns size, this retinal variable denotes more surfaces than lengths. There-fore, graphical encoding based on surfaces are more relevant than the graphical en-coding based on length. In some cases, the surface variation is reduced to a singlelength variation (in bar charts all rectangles have a side of the same length). To esti-mate the different possibilities of graphical encoding with the seven graphic variables,Bertin identified four possible attitudes for a person facing data (Bertin 1967 [24]):

96 Overview of Visual Data Mining in 3D and Virtual Reality
Figure 3.8: The most effective use of Bertins retinal variables [173].
• Associative perception: the user seeks to combine the different modalities of adummy variable;
• Selective perception:the user seeks to distinguish the different modalities of adummy variable;
• Orderly perception: the user seeks to perceive the order of ordinal variablemodalities;
• Quantitative perception: the user seeks to perceive relationships among quanti-tative variable values.
Bertin summarises his principles of visualisation in the Table 3.2.3 which indicateswhich graphic variables are adapted to the data representation.
3.3 Visual Data Mining (VDM)
Historically, VDM has evolved from the fields of scientific visualisation and informa-tion visualisation (Section 3.2). Beilken et al. 1999 [23] presented the purpose of

3.3 Visual Data Mining (VDM) 97
Type of variable Dummy Ordinal Quantitative
Perception Associative Selective Orderly Quantitative
Position • • • •
Size • • •
Texture • •
Colour • • •
Orientation • •
Shape •
Table 3.3: Matching graphic variables and variables [24].
VDM as a way to ”help a user to get a feeling for the data, to detect interestingknowledge, and to gain a deep visual understanding of the data set”. Niggemann2001 [208] looked at VDM as a visual representation of the data close to the mentalmodel. We focus on the interactive exploration of data and knowledge that it is builton extensive visual computing (Gross 1994 [129]).
As humans understand information by forming a mental model which capturesonly the main information, in the same way, data visualisation, similar to the mentalmodel, can reveal hidden information encoded in the data. In addition to the roleof the visual data representation, Ankerst 2001 [10] explored the relation betweenvisualisation and the KDD process. He defined VDM as ”a step in the KDD processthat utilises visualisation as a communication channel between the computer and theuser to produce novel and interpreted patterns”. He also explored three different ap-proaches to VDM, two of which affect the final or intermediate visualisation results.The third approach involves the interactive manipulation of the visual representa-tion of the data rather than the results of the KDD methods. The three definitionsrecognise that VDM relies heavily on human perception capabilities and the use ofinteractivity to manipulate data representations. The three definitions also empha-sise the key importance of the following three aspects of VDM: visual representations;interaction processes; and KDD tasks.
In most of the existing KDD tools, VDM is only used during two particular stepsof the KDD process: in the first step (pre-processing) VDM can play an importantrole since analysts need tools to view and create hypotheses about complex (i.e. verylarge and / or high-dimensional) original data sets. VDM tools, with interactivedata representation and query resources, allow domain experts to quickly explorethe data set (Ferreira-de-Oliveira and Levkowitz 2003 [89]). In the last step (post-processing) VDM can be used to view and to validate the final results that are mostlymultiple and complex. Between these two steps, an automatic algorithm is used toperform the DM task. Some new methods have recently appeared which aim at

98 Overview of Visual Data Mining in 3D and Virtual Reality
involving the user more significantly in the KDD process; they use visualisation andintensive interaction, with the ultimate goal of gaining insight into the KDD problemdescribed by vast amounts of data or knowledge. In this context, VDM can turnthe information overload into an opportunity by coupling the strengths of machineswith that of humans. On the one hand, methods from KDD are the driving forceof automatic analysis, while on the other side, human capabilities to perceive, relateand make conclusions turn VDM into a very promising research field. Nowadays,fast computers and sophisticated output devices can create meaningful visualisationand allow us not only to visualise data and concepts, but also to explore and interactwith these data in real-time. Our goal is to look at VDM as an interactive processwith the visual representation of data allowing KDD tasks to be performed. Thetransformation of data/knowledge into significant visualisation is not a trivial task.Very often, there are many different ways to represent data and it is unclear whichrepresentations, perceptions and interaction techniques needs to be applied. Thisproposed classification (Section 3.4) seeks to facilitate this task according to thedata and the KDD goal to be achieved by reviewing representation and interactiontechniques used in VDM. KDD tasks have different goals and diverse tasks need to beapplied several times to achieve a desired result. Visual feedback has a role to play,since the decision-maker needs to analyse such intermediate results before making adecision.
3.3.1 3D Visual Representation for VDM
One of the problems that VDM must address is to find an effective representationof something that has no inherent form. In fact, it is crucial not only to determinewhich information to visualise but also to define an effective representation to con-vey the target information to the user. The design of a visualisation representationmust address a number of different issues: what information should be presented?How this should be done? What level of abstraction to support? etc. For exam-ple, a user tries to find out interesting relations between variables in large databases.This information may be visualised as a graph (Prykeand and Beale 2005 [230]) oras an abstract representation based on a sphere and cone (Blanchard et al. 2007 [31]).
Many representations for VDM have been proposed. For instance, some visualrepresentations are based on abstract representations, such as graphs (Ahmed et al.2006 [4]), trees (Einsfeld et al. 2007 [96], Buntain 2008 [53]), and geometrical shapes(Ogi et al. 2009 [210], Nagel et al. 2008 [203], Meiguins et al. 2006 [192]) and otherson virtual worlds objects (Baumgartner et al. 2007 [17]).
The classification proposed in this section provides some initial insight into whichtechniques are oriented to certain data types, but does not assert that one visualrepresentation is more suitable than others to explore a particular data set. Selectinga representation depends largely on the task being supported and is still a largelyintuitive process.
3.3 Visual Data Mining (VDM) 99
Many researchers have attempted to construct a taxonomy for visualisation. Chi2000 [71] used the Data State Model (Chi and Riedl 1998 [70]) to classify informationvisualisation techniques. This model is composed of 3 dimensions with categori-cal values: data stages (value, analytical abstraction, visualisation abstraction, andview), transformation operators (data transformation, visualisation transformation,and visual mapping transformation), and within stage operators (value stage, analyt-ical stage, visualisation stage, and view stage). The separation of data states, visualtransformations and operators provides flexibility in handling data/visual abstractsat different stages using operationally similar or functionally similar operators acrossdifferent applications. This model shows how data change from one stage to anotherrequiring one of the three types of data transformation operators. This state modelhelps implementers understand how to apply and implement information visualisa-tion techniques. Tory and Moller 2004[277] present a high-level taxonomy for visu-alisation which classifies visualisation algorithms rather than data. Algorithms arecategorised according to the assumption they make about the data being visualised.Their taxonomy is based on 2 dimensions: values of data (discrete or continuous) andhow much the algorithm designer chooses display attributes (specialisation, timing,colour, and transparency). Teyseyre and Campo 2009 [273] presented an overviewof 3D representations for visualising software, describing several major aspects likevisual representations, interaction issues, evaluation methods, and development tools.They also performed a survey of some representative tools to support different tasks,i.e., software maintenance and comprehension, requirements validation, etc.
Not much work has attempted comparing visual representations. Wiss and Carr1999 [294] performed a comparative study of 3 different 3D representations of infor-mation: a cam tree, an information cube, and an information landscape. In this studythe authors chose to visualise a hierarchical file system. The task used to perform thestudy is based on the seven high-level information visualisation tasks as defined laterby Shneiderman 2003 [245]: overview, zoom, filter, details-on-demand, relate, historyand extract. The authors propose 3 tasks: search, based on Shneiderman’s zoomtask, count, based on Shneiderman’s relate task, and compare, based on Shneider-man’s overview task. This study showed that the possibility to get a good local andglobal overview is the one most important factors in supporting the types of tasks.Statistical analysis of the results show that the information cube performed worst forall tasks, and the Information Landscape performed best. The results indicate thatthe most influential factor was overview.
3.3.1.1 Abstract visual representations
3D representations are still abstract and require the user to learn certain conventions,because they do not look like what they refer to or they do not have a counterpartin the real-world. There are 3 kinds of abstract representations: graphs, trees, andgeometrical shapes.

100 Overview of Visual Data Mining in 3D and Virtual Reality
GraphsA graph (Figure 3.9) is a network of nodes and arcs, where the nodes represent enti-ties and the arcs represent relationships between entities. For a review on the stateof the art in graph visualisation, see Herman et al.2000 [142] .
Originally, graph visualisation was used in 2D space to represent componentsaround simple boxes and lines. However, several authors think that larger graphstructures can be viewed in 3D (Parker et al. 1998 [216]).
A technique based on the hyper system (Hendley et al. 1999 [141]) for force-basedvisualisation can be used to create a graph representation. The visualisation consistsof nodes and links whose properties are given by the parameters of the data. Dataelements affect parameters such as node size and colour, link strength and elasticity.The dynamic graphs algorithm enables the self-organisation of nodes in the visualisa-tion area by the use of a force system in order to find a steady state, and determinethe position of the nodes. For example, Beale et al. 2007 [20] proposed a Haikusystem (Figure 3.9 (b)) which provides an abstract 3D perspective of clustering al-gorithm results based on the hyper system. One of the characteristics of this systemis that the user can choose which parameters are used to create the distance metrics(distance between two nodes), and which ones affect the other characteristics of thevisualisation (node size, link elasticity, etc.). Using the hyper system allows relatedthings (belonging to the same cluster) to be near to each other, and unrelated thingsto be far away.
Trees3D trees (Figure 3.10) is a visualisation technique based on the hierarchical organisa-tion of data. A tree can represent many entities and the relationships among them. Ingeneral, the visualisation of hierarchical information structures is an important topicin the information visualisation community (van-Ham and van-Wijk 2002 [284]). Because trees are generally easy to layout and interpret (Card et al.1999 [60]), this ap-proach finds many applications in classification visualisation (Buntain 2008 [53]). 3Dtrees were designed to display a larger number of entities than in 2D representations,in a comprehensible form (Wang et al. 2006 [285]). Various methods have been devel-oped for this purpose, among which, space-filling techniques and node-link techniques.
Space-filling techniques (Van-ham and Van-wijk 2002 [284], Wang et al. 2006[285]) based upon 2D tree-maps visualisation proposed by Johnson and Shneiderman1991 [161] have been successful for visualising trees that have attribute values at thenode level. Space-filling techniques are particularly useful when users care mostlyabout nodes and their attributes but do not need to focus on the topology of the tree,or consider that the topology of the tree is trivial (e.g 2 or 3 levels). The users ofspace-filling techniques also require training because of the unfamiliar layout (Plaisantet al. 2002 [224]).
Node-link techniques, on the other hand, have long been frowned upon in the

3.3 Visual Data Mining (VDM) 101
(a) (b)
(c)
Figure 3.9: An example of graph representations: (a) Ougi[214], (b) Association rules:Haiku [230], (c) DocuWorld [95]
information visualisation community because they typically make inefficient use ofscreen space. Even trees of a hundred nodes often need multiple screens to be com-pletely displayed, or require scrolling since only part of the tree is visible at a giventime. A well-known node-link representation in cone trees was introduced by Robert-son et al. 1991 [237] for visualising large hierarchical structures in a more intuitiveway. 3D trees may be displayed vertically (Cone Tree) or horizontally (Cam Tree).
Buntain 2008 [53] used 3D trees for ontology classification visualisation (Figure3.10 (a)). Each leaf represents a unique concept in the ontology, and the transparencyand size of each leaf is governed by the number of documents associated with the givenconcept. A molecule is constructed by clustering together spheres that share commondocuments, and surrounds the leaves with a semi transparent shell (Figure 3.10 (b)).
Geometrical shapesIn this technique, 3D objects with certain attributes are used to represent data andknowledge. The 3D scatter-plot visualisation technique (Nagel et al. 2001 [204]) isone of the most common representations based on geometric shapes (Figure 3.11).The main innovation compared to 2D visualisation techniques is the use of volume

102 Overview of Visual Data Mining in 3D and Virtual Reality
(a) (b)
Figure 3.10: An example of tree representing ontology classification : SUMO [53]
rendering which is a conventional technique used in scientific visualisation. 3D ren-dering techniques use voxels (instead of pixels in 2D) to present a certain density ofthe data. 3D scatter-plot have been adapted by Becker 1997 [21], making the opacityof each voxel a function of point density. Using scatter-plots is intuitive since eachdatum is faithfully displayed. Scatter-plots have been used successfully for detectingrelationships in two dimensions (Bukauskas and Bhlen 2001[52], Eidenberger 2004[94]). This technique hit limitations if the dataset is large, noisy, or if it containsmultiple structures. With large amounts of data, the amount of displayed objectsmakes it difficult to detect any structure at all.
3.3.1.2 Virtual worlds
Trying to find easily-understandable data representations, several researchers pro-posed the use of real-world metaphors. This technique uses elements of the real-worldto provide insights about data. For example, some of these techniques are based ona city abstraction (Figure 3.12). The virtual worlds (sometimes called cyber-spaces)for VDM are generally based either on the information galaxy (Krohn 1996 [172]) orthe information landscape metaphor (Robertson et al. 1998 [236]). The differencebetween the two metaphors is that in the information landscape, the elevation ofobjects is not used to represent information (objects are placed on a horizontal floor).The specificity of virtual worlds is that they provide the user with some real worldrepresentations.
Trying to find easily understandable representations of data, several researchersproposed using real-world metaphors. These techniques use elements of the world toprovide insight about data. For example, some of these techniques are based on acity abstraction (Figure 3.12). In Imsovision – IMmersive SOftware VISualisatION(Maletic et al. 2001 [190]), the platform size is proportional to the size of the class(i.e., number of methods and attributes). The attributes of a class are viewed asspheres and number functions viewed as columns. This type of natural representa-tion reduces the cognitive overhead of the visualisation.

3.3 Visual Data Mining (VDM) 103
(a) (b)
(c) (d)
Figure 3.11: Different 3D scatter plots representations: (a) VRMiner [14], (b) 3DVDM[203], (c) DIVE-ON [8], (d) Visualisation with augmented reality[192]
Figure 3.12: Example of virtual worlds representation: Imsovision [190].
3.3.2 Interaction for VDM
Data Mining (DM) usually deals with massive data sets and most visual techniquespropose mapping each data item into a corresponding graphical element (pixel, line,icon, etc.). The implication is that they do not scale well when handling millions of

104 Overview of Visual Data Mining in 3D and Virtual Reality
data items. This made clear the need to interact with the visual representations toreduce visual clutter and object overlap. Interaction techniques can provide the userwith mechanisms for handling complexity in large data sets.
VDM is not a completely human guided process. DM algorithms analyse a dataset searching for useful information and statistically valid patterns. The degree ofautomation of data mining process varies, but still the algorithm, not the user, whichis the one that is looking for patterns. In this context, Ferreira-de-Oliveira andLevkowitz 2003 [89] denoted that VDM should have a larger role than traditionalapplications of visualisation techniques. This creates the potential of greatly increas-ing user participation in the DM process as a whole, as well as the end user’s overallunderstanding of the process. To make it feasible will certainly require a greaterinteraction between the information visualisation and DM communities. This allowsincreasing recognition within the information visualisation that interaction and in-quiry are inextricable and that it is through the interactive manipulation of a visualinterface that knowledge is constructed, tested, refined and shared.
Interaction techniques can empower the user’s perception of information whenvisually exploring a data set (Hibbard et al. 1995 [143]). The ability to interact withvisual representations can greatly reduce the drawbacks of visualisation techniques,particularly those related to visual clutter and object overlap, providing the user withmechanisms for handling complexity in large data sets. Pikea et al. 2009 [292] ex-plored the relationship between interaction and cognition. They consider that thecentral percept of VDM is that the development of human insight is aided by inter-action with a visual interface. As VDM is concerned with the relationship betweenvisual displays and human cognition, merely developing only novel visual metaphorsis rarely sufficient to make new discoveries provide confirm or negate prior beliefs.
We can distinguish three different interaction categories: exploration, manipula-tion and human-centred approaches.
3.3.2.1 Visual exploration
Visual exploration techniques are designed to take advantage of the considerable vi-sual capabilities of human beings, especially when users try to analyse tens or evenhundreds of graphic variables in a particular investigation. Visual exploration allowsthe discovery of data trends, correlations and clusters, to take place quickly, and cansupport users in formulating hypotheses about the data. It is essential in some situa-tions to allow the user to simply look at the visual representation in a passive sense.This may mean moving around the view point in order to reveal structure in the datathat may be otherwise masked and overlooked . In this way, exploration provides themeans to view information from different perspectives to avoid occlusion and to seeobject details. It can be very useful to have the ability to move the image to resolveany perceptual ambiguities that exist in a static representation when a large amountof information is displayed at once. The absence of certain visual cues (when viewing

3.3 Visual Data Mining (VDM) 105
a static image) can mask important results (Kalawsky and Simpkin 2006 [165]).
Navigation is often the primary task in 3D worlds and refers to the activity ofmoving through the scene. The task of navigation presents challenges such as sup-porting spatial awareness and providing efficient and comfortable movement amongdistant locations. Some systems enable users to navigate without constraint throughthe information space (Nagel et al. 2008 [203], Einsfeld et al. 2006 [95], Azzag etal. 2005 [14]). Other systems restrict movement in order to reduce possible userdisorientation (Ahmed et al. 2006 [4]). As an illustration, in VRMiner (Azzag etal. 2005 [14]) a six-degree freedom sensor is fixed to the user’s hand (Figure 3.13)allowing him/her to easily define a virtual camera in 3D space. For example, whenthe user moves his hand in the direction of the object, he/she may zoom in or out.The 3DVDM system (Nagel et al. 2008 [203]) allows the user to fly around andwithin the visualised scatter-plot. The navigation is controlled by the direction of a”wanda” device tracked with 6 degrees of freedom. Dissimilarly, in GEOMI (Ahmedet al. 2006 [4]), the user can only rotate the representation along the X and Y axesbut not along the Z axis.
Figure 3.13: Illustration of a navigation technique based on the use of a data glove [17].
In visual exploration, the user can also manipulate the objects in the scene. Inorder to do this, interaction techniques provide means to select and zoom-in and zoom-out to change the scale of the representation. Beale et al. 2007 [20] demonstrated thatusing a system which supports the free exploration and manipulation of informationdelivers increased knowledge even from a well-known dataset. Many systems providea virtual hand or a virtual pointer (Einsfeld et al. 2007 [96]), a typical approach usedin VE, which is considered as being intuitive as it simulates real-world interaction (Bowman et al. 2001[41]).

106 Overview of Visual Data Mining in 3D and Virtual Reality
• Select: this technique provides users with the ability to mark interesting dataitems in order to keep track of them when too many data items are visible,or when the perspective changes. In these two cases, it is difficult for users tofollow interesting items. By making items visually distinctive, users can easilykeep track of them even in large data sets and/or with changed perspectives.
• Zoom: by zooming, users can simply change the scale of a representation sothat they can see an overview (context) of a larger data set (using zoom-out)or the detailed view (focus) of a smaller data set (using zoom-in). The essentialpurpose is to allow hidden characteristics of data to be seen. A key point hereis that the representation is not fundamentally altered during zooming. Detailssimply come into focus more clearly or disappear from view.
Visual exploration (as we can see in Section.7) can be used in the pre-processingof the KDD process to identify interesting data (Nagel et al. 2008 [203]), and in post-processing to validate DM algorithm results (Azzag et al. 2005 [14]). For example,in VRMiner(Azzag et al. 2005 [14]) and in ArVis (Blanchard et al. 2007 [31]), theuser can select an object to obtain information about it.
3.3.2.2 Visual manipulation
In KDD, the user is essentially faced with a mass of data that he/she is trying tomake sense of. He/she should look for something interesting. However, interest isan essentially human construct, a perspective of relationships among data that isinfluenced by tasks, personal preferences, and past experience. For this reason, thesearch for knowledge should not only be left to computers; the user has to guide itdepending upon what he/she is looking for, and hence which area to focus computingpower on. Manipulation techniques provide users with different perspectives of thevisualised data by changing the representation.
One of these techniques is the capability of changing the attributes presented inthe representation. For example, in the system shown by Ogi et al. 2009 [210], theuser can change the combination of presented data. Other systems have interactiontechniques that allow users to move data items more freely in order to make the ar-rangement more suitable for their particular mental model (Einsfeld et al. 2006 [95]).
Filter interaction techniques enable users to change the set of data items beingpresented on some specific conditions. In this type of interaction, the user specifiesa range or condition, so that only data meeting those criteria are presented. Dataoutside the range or not satisfying the conditions are hidden from the display or showndifferently; even so, the actual data usually remain unchanged so that whenever usersreset the criteria, the hidden or differently-illustrated data can be recovered. Theuser is not changing data perspectives, just specifying conditions within which dataare shown. ArVis (Blanchard et al. 2007 [31]), allows the user to look for a rule witha particular item in it. To do this, the user can search for it in a menu which lists allthe rule items and allows the wanted object to be shown.

3.4 A New Classification for VDM 107
3.3.2.3 Human-centred approach
In most existing KDD tools, interaction can be used in two different ways: explorationand manipulation. Some new methods have recently appeared ( Baumgartner et al.2007 [17], Poulet and Do 2008 [225]), tried to involve the user in the DM process moresignificantly and used visualisation and interaction more intensively. In this task, theuser manipulates the DM algorithm and not only the graphical representation. Theuser sends commands to the algorithm in order to manipulate the data to be extracted.We are speaking here about local knowledge discovery. This technique allows the userto focus on interesting knowledge from his/her point of view, in order to make theDM tool more generically useful to the user. It is also necessary for the user to eitherchange the view point or manipulate a given parameter of the knowledge discoveryalgorithm and observe its effect. There must therefore be some way in which theuser can indicate what it is considered interesting and what is not, and to do this theKDD tool needs to be dynamic and versatile (Ceglar et al. 2003[63]). The human-centred process should be iterative since it is repeated until the desired results areobtained. From a human interaction perspective, a human-centred approach closesthe loop between the user and the DM algorithm in a way that allows them to respondto results as they occur by interactively manipulating the input parameters (Figure3.14). With the purpose of involving more intensively the user in the KDD process,this approach has the following advantages (Poulet and Do 2008 [225]).
• the quality of the results is improved by the use of human-knowledge recognitioncapabilities;
• using domain knowledge during the whole precess (and not only in the inter-pretation of the results) allows guided searching for knowledge;
• the confidence in the results is improved as the DM process gives more compre-hensible results.
In Arvis (Blanchard et al. 2007 [31]), the user can navigate among the subsets ofrules via a menu providing neighbourhood relations. By applying a neighbourhoodrelation to a rule, the mining algorithm extracts a new subset of rules. The previoussubset is replaced by the new subset in the visualisation area.
3.4 A New Classification for VDM
In this section, we present a new classification of VDM tools based on 3 dimensions:visual representations, interaction techniques, and KDD tasks. Table 3.4 presents thedifferent modalities of each of the three dimensions. The proposed taxonomy takesinto account both visual representation and interaction techniques. In addition, manyvisualisation design taxonomies include only a small subset of techniques (e.g., loco-motion Arns 2002 [11]). Currently, visualisation tools have to provide not onlyeffective visual representations but also effective interaction metaphors to facilitateexploration and help users achieve insight. Having a good 3D representation without

108 Overview of Visual Data Mining in 3D and Virtual Reality
Figure 3.14: Illustration of the human-centred approach.
a good interaction technique does not mean having a good tool. Existing metaphorsfor visualisation and interaction can be classified under the new system, enabling de-signers to more easily compare metaphors to see exactly how they are different andsimilar to each other. This classification looks at some representative tools for doingdifferent KDD tasks, e.g., pre-processing and post-processing (classification, cluster-ing and association rules). Different tables summarise the main characteristics of thereported VDM tools with regard to visual representations and interaction techniques.Other relevant information such as interaction actions ( navigation, selection and ma-nipulation, and system control), input-output devices (CAVEs, mice, hand trackers,etc.) presentation (3D representation or VR representation) and year of creation isalso reported.
Dimension Modalities
Visual representation Graphs, 3D trees, geometrical shapes, virtual worlds
Interaction techniques Visual exploration, visual manipulation, human-centred
KDD tasks Pre-processing, classification, clustering, association rules
Table 3.4: Dimension modalities
3.4.1 Pre-processing
Pre-processing (in VDM) is the task of data visualisation before the DM algorithmis used. It is generally required as a starting point of KDD projects so that analystsmay identify interesting and previously unknown data by the interactive exploration ofgraphical representations of a data set without heavy dependence on preconceived as-sumptions and models. The basic visualisation technique used for data pre-processing

3.4 A New Classification for VDM 109
System Visual
Rep-
resen
tation
Interaction
techniques
Interaction actions Input-
Output
devices
3D/
VR
year
Navigation Selection
and
Manipu-
lation
System
control
Ogi et al.
2009[210]Geometricshape
Visualmanipulation
- - Graphicalmenu
CAVE VR 2009
3DVDM Nagel etal. 2008 [203] (Fig-ure 3.11(b))
Geometricshape
Visual explo-ration
Manualview pointmanipulation+ thoughtwizardmetaphor
- - Three-button’wand’ +CAVE
VR 2008
Nested circlesWang et al.
2006 [285]
Visual ex-plorationandvisualmanipu-lation
Tree - Objectselection+ virtualpointer
Graphicmenus
Mouse + 2Dscreen
3D 2006
Visualisationwith augmentedreality Meiguinset al. 2006 [192](Figure 3.11(d))
Geometricshape
Visualmanipulation
- Objectselection+ virtualhand
Graphicalmenus
Hand tracker VR 2006
Dive-On Am-moura et al.
2001[8] (Figure3.11(c))
Geometricshape
Visual explo-ration andmanipulation
Physicalmovement +steering +target-basedtravel
Objectselection
Graphicalmenus
Hand + headtracker +CAVE
VR 2001
Table 3.5: 3D VDM tool summary for pre-processing KDD task.
is the 3D scatter-plot method, where 3D objects with attributes are used as mark-ers. The main principle behind the design of traditional VDM techniques, such asThe Grand Tour (Asimov 1985 [13]), the parallel coordinate (Inselberg and Dimsdale1990 [155]), etc., is that they are viewed from the outside-in. In contrast to this, VRlets users explore the data from inside-out by allowing users to navigate continuouslyto new positions inside the VE in order to obtain more information about the data.Nelson et al.1999 [206] demonstrated through comparisons between 2D and VR ver-sions of the VDM tool XGobi that the VR version of XGobi performed better. Inthe system proposed by Ogi et al. 2009 [210], the user can see several data set repre-sentations integrated in the same space. The user can switch the visible condition ofeach data set. This system could be used to represent the relationships among severaldata sets in 3D space, but it does not allows the user to navigate through the dataset and interact with it. The user can only change the visual mapping of the dataset. However, the main advantage of this system is that the data can be presentedwith a high degree of accuracy using high-definition stereoscopic display that can bebeneficial especially when visualising a large amount of data. This system has beenapplied to the visualisation and analysis of earthquake data. Using the 3rd dimensionhas allowed the visualisation of both the overall distribution of the hypocentre data

110 Overview of Visual Data Mining in 3D and Virtual Reality
and the individual location on any earthquake, which is not possible with the con-ventional 2D display. The Figure 3.15 shows hypocentre data recorded over 3 years.
Figure 3.15: Visualisation of earthquakes data using a 4K stereo projection system [210].
The system allows the visualisation of several databases at the same time e.g. mapdata, terrain data, basement depth, etc and the user can switch the visible conditionof each datum in the VE. For example, the user can change the visualisation datafrom the combination of hypocentre data and basement depth data to the combina-tion of hypocentre data and terrain data. Thus, the system can show the relationshipsbetween, only, any two data sets among the others.
As a result of using VR, the 3DVDM system (Nagel et al. 2008 [203]) is capa-ble of providing real-time user response and navigation as well as showing dynamicvisualisation of large amounts of data. Nagel et al.2008 [203] demonstrated that the3DVDM visualisation system allows faster detection of non-linear relationships andsubstructures in data than traditional methods of data analysis. An alternative pro-posal is available with DIVE-ON (Data mining in an Immersed Visual EnvironmentOver a Network) system, proposed by Ammoura et al. 2001[8]. The main idea ofDIVE-ON is visualising and interacting with data from distributed data warehousesin an immersed VE. The user can interact with such sources by walking or flyingtowards them. He/she can also can pop up a menu, scroll through it and execute allenvironment, remote, and local functions. Thereby, DIVE-ON makes intelligent useof the natural human capability of interacting with spatial objects and offers consid-erable navigation possibilities e.g. walking, flying, transporting and climbing.
Inspired by Treemap Wang et al. 2006 [285] presented a novel space-filling ap-proach for tree visualisation of file systems (Figure 3.16). This system provides a

3.4 A New Classification for VDM 111
good overview for a large hierarchical data set and uses nested circles to make iteasier to see groupings and structural relationships. By clicking on an item (a circle),the user can see the associated sub-items represented by the nested circles in a newview. The system provides the user with a control panel allowing him/her to filterfiles by types; by clicking on one file type, the other files types are filtered out. Azoom-in/zoom-out function allows the user to see folder or file characteristics such asname, size, and date. A user-feedback system means that user interaction techniquesare friendly and easy to use.
Figure 3.16: Representation of a file system with 3D-nested cylinders and spheres [285].
Meiguins et al. 2006 [192] presented a tool for multidimensional VDM visuali-sation in an augmented-reality environment where the user may visualise and ma-nipulate information in real time VE without the use of devices such as a keyboardor mousse and interact simultaneously with other users in order to make a decisionrelated to the task being analysed. This tool uses a 3D scatter-plot to visualise theobjects. Each visualised object has specific characteristics of position (x, y and zaxes), colour, shape, and size that directly represent data item values. The mainadvantages of these tools is that they provide users with a dynamic menu which isdisplayed in an empty area when the user wants to execute certain actions. The toolalso allows users to perform many manipulation interaction tasks such as real-time fil-ter attributes, semantic zoom, rotation and translation of objects in the visualisationarea. A detailed comparison of these techniques is presented in Table 3.5.
3.4.2 Post-processing
Post-processing is the final step of the KDD process. Upon receiving the output ofthe DM algorithm, the decision-maker must evaluate and select the interesting partof the results.

112 Overview of Visual Data Mining in 3D and Virtual Reality
3.4.2.1 Clustering
Clustering is used for finding groups of items that are similar. Given a set of dataitems, this set can be partitioned into a set of classes, so that items with similarcharacteristics are grouped together.
The GEOMI system proposed by Ahmed et al. 2006 [4] is a visual analysis toolfor the visualisation of clustered graphs or trees. The system implements block modelmethods to associate each group of nodes to corresponding cluster. Two nodes arein the same cluster if they have the same neighbour set. This tool allows immersivenavigation in the data using 3D head gestures instead of the classical mouse input.The system only allows the user visual exploration. Users can walk into the network,move closer to nodes or clusters by simply aiming in their direction. Nodding ortilting the head rotates the entire graph along the X and Y axes respectively, whichprovides users with intuitive interaction.
The objective of @VSIOR (Baumgartner et al. 2007 [17]), which is a human-centred approach, is to create a system for interaction with document, meta-data,and semantic relations. Human capabilities in this context are spatial memory andthe fast visual processing of attributes and patterns. Artificial intelligence techniquesassist the user, e.g. in searching for documents and calculating document similar-ities. Similarly, VRMiner (Azzag et al. 2005 [14]) uses stereoscopic and intuitivenavigation; these allow the user to easily select the interesting view point. VRMinerusers have found that using this tool helps them solve 3 major problems: detectingcorrelation between data dimensions, checking the quality of discovered clusters, andpresenting the data to a panel of experts. In this context, the stereoscopic displayplays a crucial role in addition to the intuitive navigation which allows the user toeasily select the interesting view point. A detailed comparison of these techniques ispresented in Table 3.6.
System Visual
Represen
tation
Interaction
techniques
Interaction actions Input-
Output
devices
3D/
VR
year
Navigation Selection
and Manip-
ulation
System con-
trol
@VISOR Baum-gartner et al.
2007 [17] (Figure3.13)
Graph Human- cen-tred
- Object selec-tion + objectpositioning+virtual hand
Graphicalmenu +gesturalinteraction
TabletPC(2D) +Data glove +stereoscopic
VR 2007
GEOMI Ahmedet al. 2006 [4]
Graph +tree
Visual explo-ration
Steering - Gesturalinteraction
Head tracker+ stereo-scopic
VR 2006
VRMiner Azzaget al. 2005 [14](Figure 3.11(a))
Abstractgeometricalshape
Visual explo-ration
Manualview pointmanipula-tion
Object selec-tion
Gesturalinteraction
Data glove +stereoscopic
VR 2005
Table 3.6: 3D VDM tool summary for clustering KDD task

3.4 A New Classification for VDM 113
3.4.2.2 Classification
Given a set of pre-defined categorical classes, how can one determine which of theseclasses a specific data item belongs to? In SUMO (Figure 3.10), a tool for document-class visualisation is proposed (Buntain 2008 [53]). The classes and relations amongthem can be presented to the user in a graphic form to facilitate understanding of theknowledge domain. This view can then be mapped onto the document space whereshapes, sizes, and locations are governed by the sizes, overlaps, and other propertiesof the document classes. This view provides a clear picture of the relations amongthe resulting documents. Additionally, the user can manipulate the view to showonly those documents that appear in a list of a results from a query. Furthermore,if the results include details about subclasses of results and ”near miss” elements inconjunction with positive results, the user can refine the query to find more appro-priate results or widen the query to include more results if insufficient information isforthcoming. The third dimension allows the user a more expressive space, completewith navigation methods such as rotation and translation. In 3D, overlapping linesor labels can be avoided by rotating the layout to a better point of view.
DocuWorld (Einsfeld et al. 2006 [95]) is a prototype for a dynamic semantic in-formation system. This tool allows computed structures as well as documents to beorganised by users. Compared to the web Forager (Card et al. 1996[61]), a workspaceto organise documents with different degrees of interest at different distances to theuser, DocuWorld provides the user with more flexible possibilities to store documentsat locations defined by the user and visually indicates cluster-document relations (dif-ferent semantics of connecting clusters to each other). A detailed comparison of thesetechniques is presented in Table 3.7.
System Visual
Rep-
resen
tation
Interaction
techniques
Interaction actions Input-
Output
devices
3D/
VR
year
Navigation Selection
and
Manipu-
lation
System
control
SUMO Buntain2008 [53] (Figure3.10)
Tree Visual explo-ration
Manual viewpoint manip-ulation
- - 2D Mouse +2D screen
3D 2008
DocuWorld Eins-feld et al. 2006 [95](Figure 3.9(c))
Graph human- cen-tred
Thought wiz-ard metaphor
Objectselection+ objectpositioning+ virtualpointer
Gesturalinteraction+ voicecommands
Mouse +stereoscopic
VR 2006
Table 3.7: 3D VDM tool summary for classification KDD task

114 Overview of Visual Data Mining in 3D and Virtual Reality
3.4.2.3 Association rules
On account of the enormous quantities of rules that can be produced by DM al-gorithms, association rule post-processing is a difficult stage in an association rulediscovery process. In order to find relevant knowledge for decision-making, the userneeds to rummage through the rules.
Figure 3.17: ArVis : a tool for association rules visualisation [31].
ArVis proposed by Blanchard et al. 2007 [31] is a human-centred approach. Thisapproach consists of letting the user navigate freely inside the large set of rules byfocusing on successive limited subsets via a visual representation of the rules (Figure3.17). In other words, the user gradually drives a series of visual local explorationsaccording to his/her interest for the rules. This approach is original compared toother rule visualisation methods (Couturier et al. 2007[79], Ertek and Demiriz 2006[99], Zhao and Liu 2005[309]). Moreover, ARVis generates the rules dynamicallyduring exploration by the user. Thus, the user’s guidance during association rulepost-processing is also exploited during association rule mining to reduce the searchspace and avoid generating huge amounts of rules.
Gotzelmann et al. 2007 [130] proposed a VDM system to analyse error sourcesof complex technical devices. The aims of the proposed approach is to extract as-sociation rules from a set of documents that describe malfunctions and errors forcomplex technical devices, followed by a projection of the results on a corresponding3D model. Domain experts can evaluate the results gained by the DM algorithmby exploring a 3D model interactively in order to find spatial relationships betweendifferent components of the product. 3D enables the flexible spatial mapping of theresults of statistical analysis. The visualisation of statistical data on their spatialreference object by modifying visual properties to encode data (Figure 3.12 (a)) canreveal a priori unknown facts, which where hidden in the database. By interactively

3.4 A New Classification for VDM 115
exploring the 3D model, unknown sources and correlations of failures can be discov-ered that rely on the spatial configuration of several components and the shape ofcomplex geometric objects. A detailed comparison of these techniques is presentedin Table 3.8.
System Visual
Rep-
resen
tation
Interaction
techniques
Interaction actions Input-
Output
devices
3D/
VR
year
Navigation Selection
and
Manipu-
lation
System
control
ARVis Blanchardet al. 2007 [31](Figure 3.17)
Geometricshape
Human- cen-tred
Manual viewpoint manip-ulation
Objectselecting+ virtualpointer
Graphicalmenus
Mouse + 2Dscreen
3D 2007
3D spatialdata mining ondocument sets(Gotzelmann et al.
2007 [130] )
Virtualworld
Visualnavigationand visualmanipulation
- Object se-lection
Graphicalmenus
- 3D 2006
Table 3.8: 3D VDM tools: summary for association rules in KDD tasks.
3.4.2.4 Combination of methods
The Haiku tool (Figure 3.9(b)) proposes combining different DM methods: cluster-ing, classification and association rules (Beale et al. 2007 [20]). In this tool, the useof 3D graphs allows the visualisation of high-dimensional data in a comprehensibleand compact representation. The interface provides a large set of 3D manipulationfeature of the structure such as zooming in and out, moving through the representa-tion (flying), rotating, jumping to specific location, viewing data details, and definingan area of interest. The only downside is that the control is done using a mouse. Adetailed presentation is shown in Table 3.9.
System Visual
Rep-
resen
tation
Interaction
techniques
Interaction actions Input-
Output
devices
3D/
VR
year
Navigation Selection
and
Manipu-
lation
System
control
Heiku Pryke-and and Beale2005 [230] (Figure3.9(b))
Graph Human-centred
Manual viewpoint manip-ulation + tar-get based
Object se-lection
- Mouse + 2Dscreen
3D 2005
Table 3.9: 3D VDM tool : combination of methods.

116 Overview of Visual Data Mining in 3D and Virtual Reality
3.5 Conclusion
In this chapter, we have proposed a new classification of VDM tools composed of3 dimensions: visual representations, interaction techniques, and data mining tasks.We have also proposed a survey of visual representations and 3D interaction tech-niques in data mining and virtual reality. Compared to 2D representation (presentedin Chapter 1 Section 1.5.3) 3D representation allows the display of large data set butunlike 2D representation of association rules, 3D metaphors do not allow visualisationand manipulation of rule items. Therefore, the user can not directly find the rulesthat contain a given item or he/she can not require the presence of an item in theextracted rules.
Through this study, we can notice that most of the pre-processing tools use im-mersive configuration (CAVE) which is not the case of post-processing tools thatstill rely on interaction metaphors and devices developed more than a decade ago.VDM is inherently cooperative requiring many experts to coordinate their activitiesto make decisions. Thus, desktop configuration does not allows collective work likelarge-scale immersive configuration. We can also see that most tool are suitable onlyfor data/knowledge exploration and don’t offer manipulation techniques despite thefact that user participation in the process of data mining is paramount.
Now, it is questionable whether these classical interaction techniques are able tomeet the demands of the ever increasing mass of information or whether we are los-ing because we still lack the possibilities to properly interact with the databases toextract relevant knowledge. Devising intuitive visual interactive representations fordata mining and providing real time interaction and mapping techniques that arescalable to the huge size of many current databases are some of the research chal-lenges that remain to be addressed.

4Interactive Extraction and Exploration of
Association Rules
Contents
4.1 Introduction . . . . . . . . . . . . . . . . . . . . . . . . . . . . . . . . . 1184.2 Constraints of the Interactive Post-processing of Association
Rules . . . . . . . . . . . . . . . . . . . . . . . . . . . . . . . . . . . . . . 1194.2.1 Importance of the Individual Attributes of Rules . . . . . . . . . . . . 120
4.2.1.1 Attribute importance . . . . . . . . . . . . . . . . . . . . . . 1204.2.1.2 Attribute interaction . . . . . . . . . . . . . . . . . . . . . . 121
4.2.2 Hypothesis About The Cognitive Processing of Information . . . . . . 1214.3 IUCEAR: Methodology for Interactive User-Centred Exploration
of Association Rules . . . . . . . . . . . . . . . . . . . . . . . . . . . . 1234.3.1 Items Selection . . . . . . . . . . . . . . . . . . . . . . . . . . . . . . . 1244.3.2 Local mining: anticipation functions . . . . . . . . . . . . . . . . . . . 1244.3.3 Association Rule Visualisation, Validation, and Evaluation . . . . . . 1274.3.4 Browsing History . . . . . . . . . . . . . . . . . . . . . . . . . . . . . . 1274.3.5 Interactive process . . . . . . . . . . . . . . . . . . . . . . . . . . . . . 128
4.4 New Association Rules Metaphor . . . . . . . . . . . . . . . . . . . . 1284.4.0.1 Rendering Mapping of Association rule metaphor . . . . . . 1284.4.0.2 Spring-embedded like algorithm . . . . . . . . . . . . . . . . 130
4.4.1 Validation of Association rule metaphors . . . . . . . . . . . . . . . . . 1324.4.1.1 Objective . . . . . . . . . . . . . . . . . . . . . . . . . . . . . 1324.4.1.2 Task . . . . . . . . . . . . . . . . . . . . . . . . . . . . . . . . 1324.4.1.3 Protocol . . . . . . . . . . . . . . . . . . . . . . . . . . . . . 134
4.4.2 Results . . . . . . . . . . . . . . . . . . . . . . . . . . . . . . . . . . . 1354.4.2.1 Response Time . . . . . . . . . . . . . . . . . . . . . . . . . . 1354.4.2.2 Error rate . . . . . . . . . . . . . . . . . . . . . . . . . . . . . 1394.4.2.3 Subjective Aspects . . . . . . . . . . . . . . . . . . . . . . . . 140
4.4.3 Discussion . . . . . . . . . . . . . . . . . . . . . . . . . . . . . . . . . . 1414.5 Interactive Visualisation of Association Rules with
117

118 Interactive Extraction and Exploration of Association Rules
IUCEARVis . . . . . . . . . . . . . . . . . . . . . . . . . . . . . . . . 1424.5.1 Items Selection . . . . . . . . . . . . . . . . . . . . . . . . . . . . . . . 143
4.5.1.1 Data Transformations . . . . . . . . . . . . . . . . . . . . . . 1434.5.1.2 Rendering Mappings . . . . . . . . . . . . . . . . . . . . . . . 1434.5.1.3 View Transformation . . . . . . . . . . . . . . . . . . . . . . 145
4.5.2 Association Rule Exploration, Evaluation and Validation . . . . . . . 1464.5.2.1 Data Transformation . . . . . . . . . . . . . . . . . . . . . . 1464.5.2.2 Rendering Mappings . . . . . . . . . . . . . . . . . . . . . . . 1484.5.2.3 View Transformation . . . . . . . . . . . . . . . . . . . . . . 150
4.5.3 Browsing History . . . . . . . . . . . . . . . . . . . . . . . . . . . . . . 1524.5.3.1 Rendering Mappings . . . . . . . . . . . . . . . . . . . . . . . 1524.5.3.2 View Transformation . . . . . . . . . . . . . . . . . . . . . . 155
4.6 Conclusion . . . . . . . . . . . . . . . . . . . . . . . . . . . . . . . . . . 155
4.1 Introduction
To handle the large amount of rules produced by the data mining algorithms, manysolutions have been proposed in the literature, among them the post-processing ofassociation rules. This consists of a second search operation with the aim of findinginteresting association rules. Whereas the first operation (data mining) is done au-tomatically by combinatorial algorithms, the search for interesting rules is generallyleft to the user.
In 1996, Brachman et al. 1996 [45] have pointed out that in order to efficientlyassist the users in their search for interesting knowledge, the data mining processshould be considered not only from the point of view of the discovery algorithms,but also from that of the user, as a human-centred decision-support system. Forpost-processing of association rules to be effective, we need to include the user inthe KDD process and combine human flexibility, creativity and knowledge with theenormous storage capacity and the computational power of today’s computers. Thus,interactive, efficient tools have to be developed.
In most association rule post-processing approaches, it is often through visualisa-tion that rule post-processing is performed. Effective interactivity does not involveonly interaction with the graphic representation of rules but with the data miningprocess itself. However, in most approaches, interactivity is not present throughoutall the process of association rule generation. Figure 4.1 shows the different stepsof the association rule generation process. The different figures represented in thisdiagram show the moments in which experts are involved in the association rule gen-eration process. Even so, the association rule generation process must be able to relyon notions of task-oriented systems as defined in human computer interaction (Dia-per 2003 [91], Greenberg 2003 [125]). In order to find relevant knowledge in visualrepresentations, the decision-maker needs to freely rummage through large amount ofdata. It is therefore essential to integrate him/her in the data mining process throughthe use of efficient interactive techniques.

4.2 Constraints of the Interactive Post-processing of Association Rules 119
In this chapter, firstly we propose a new methodology for the interactive visualisa-tion of association rules designed for the convenience of the user faced with a large setof rules, this being based on the principle of the cognitive processing of information.Section 2 is dedicated to a our association rules metaphor based on information vi-sualisation principles for effective visual representations. In Section 3, we present theIUCEARVis functions that were used. For this, we refer to the visualisation processmodel proposed by Card et al. 1999 [60] for new visualisation tools that highlightsthree components: Data transformation, Rendering Mappings and View transforma-tion.
Figure 4.1: Expert role in the association rule generation process
4.2 Constraints of the Interactive Post-processing of As-sociation Rules
During the post-processing step, the user is faced with large set of rules. In orderto find interesting knowledge for decision making, he/she needs to (i) interpret therules in its business semantics and (ii) evaluate their quality. The decision-makingindicators are (i) the syntax of rules (the items involved in each rule) and (ii) theassociation rules interestingness measures.
In this context, the user’s task can be extremely difficult for three main reasons:
• 3D association rule representations does not allow the visualisation of the rulesyntax.
• the huge number of rules at the output of the association rules extraction algo-rithms makes their exploration a very painful task;

120 Interactive Extraction and Exploration of Association Rules
• association rule extraction is a non-supervised process. Association rules aretypically used when the user does not know what he/she is looking for. There-fore, the user can not formulate constraints that would directly isolate inter-esting rules. Usually, the user is looking for knowledge that he/she does notexpect.
4.2.1 Importance of the Individual Attributes of Rules
All techniques proposed for rule visualisation in VR (Chapter 3 Section 3.4.2.3) havebeen developed to represent an association rule as a hole without paying attention tothe relations among the attributes that make up the antecedent and the consequentand the contribution of each one to the rule. Attribute components of an associationrule and their contribution to the rule may be more informative than the rule itself(Freitas 1998 [109]). Two rules with the same value of rule interestingness measurecan have very different degrees of interestingness for the user, depending on whichattributes occur in the antecedent and in the consequent.
In the same way, the information found in form of relations between the attributes(correlation) provides the analyst with a better and clearer image than analysing arule (Imielinski 1998 [152]). Exploring an association rule attribute enables deeperinsight into the data. Analysts can be interested by these relationships, rather thana static rule. Many researchers have demonstrated that attribute interaction is a keyconcept of association rule mining (Freitas 2001 [108], Chanda et al. 2010 [67], Yaoet al. 1999 [301]).
4.2.1.1 Attribute importance
An attribute can be important for the user if regularities are observed in a smallerdataset, although being unobservable in the entire data. A rule can be considered asa disjunction of rules. The size of a disjunct (rule) is the number of items composedin the rule’s antecedent and the rule’s consequent. For example, r : (milk, bread,eggs → apples, pears) is a rule. A disjunction of a rule is r1 : (milk → apples,pears), r2 : (bread → apples, pears), r3 : (eggs → apples, pears), r4 : (apples →milk, bread, eggs), and r5 : (pears → milk, bread, eggs). At first sight, it seemsthat these small rules have no importance, since they can be considered as redundantrules. Based on this view, most extraction algorithms do not keep these rules in theresults. However, small rules have the potential to show unexpected relationships inthe data (Freitas 1998 [109]). Provost and Aronis 1996 [229] proved that small ruleswere considered interesting in their field application. Accordingly, it would beneficialthat the user see automatically these small rules.
In order to evaluate the contribution of each item to a rule, Freitas 1998 [109]proposed the Information Gain measure which can be positive or negative. The In-formation Gain measure (Freitas 1998 [109]) was proposed for rules with only one

4.2 Constraints of the Interactive Post-processing of Association Rules 121
item in the consequence. In our representation, if an item ∈ Antecedent has respec-tively a high positive (negative) Information Gain that mean that: r : (item →Consequence) is a good (bad) rule whatever the number of items in the consequent.From a rule interest perspective, a high Information Gain may point out new interest-ing implications unknown by the user. At the same time, a rule including attributeswith low or negative information gain indicate irrelevant rules. Therefore, the userdoes not waste time looking at these rules since he/she already knows that they arenot interesting.
4.2.1.2 Attribute interaction
Two attributes are correlated if they are not independent. Two attributes are inde-pendent if changing the value of one does not affect the value of the other. The liftmeasure calculates the correlation between each attribute pair from the antecedentor the consequent. The correlation between two attributes represents the amount ofinformation shared between the two attributes. The lift measure determines whethertwo attributes are correlated (lift >1) or not (lift <1) (see Chapter 1 Section 1.3.2).
The Freitas 2001 [108] study showed that the concept of attributes interactioncan be beneficial to the association rule extraction process and proposed to intro-duce attribute interaction in the design of association rule mining systems. Attributeinteraction enable the detection of surprising knowledge which can’t be discoveredby analysing the whole rule. The relationships expressed in a rule totality is quitedifferent from the relationships expressed in separate rule parts (antecedent and con-sequent).
On the other hand, to discover useful association rules, the user needs to getinsight into the data and learn about the data model by exploring attribute relations(Chanda et al. 2010 [67]). In many case (a biological or genetic context for example)antecedent items has weak associations with consequent. However, they interacttogether in a complicated way to control the consequent (Chanda et al. 2010 [67]).
4.2.2 Hypothesis About The Cognitive Processing of Information
Based on the bounded rationality assumption (Simon 1979 [251]), a decision-makingprocess can be regarded as seeking a dominant structure. More precisely, the userfaces a set of options about using rules as operators in this search for dominant struc-ture. This dominant structure is a cognitive structure in which an alternative choicecan be seen as dominant over the others (Montgomery 1983 [200]). This decisionmaking model can be used for association rule post-processing. According to Mont-gomery 1983 [200], the user isolates a limited number of potentially interesting rulesand performs comparisons among them. This is done several times during the deci-sion making process with the aim of finding rules that are more interesting then theother ones. Considerably early in a decision making process, the decision maker triesto find promising rules, which can be replaced by more interesting ones during the
122 Interactive Extraction and Exploration of Association Rules
process. These changes can take place several times during the process, particularlywhen the user has trouble to find dominant structures.
Bhandari 1994 [25] proposed a machine-assisted knowledge discovery approach.A computer program guides a decision maker to discover knowledge from data. Thisapproach was based on experimental data related to user behaviour during a deci-sion making process study. The machine-assisted knowledge discovery approach isbased on a new KDD methodology called attribute focusing. In this methodology,an automatic filter detects, using statistical measures, a small number of potentiallyinteresting items. Attribute focusing aims to point out small and thus more com-prehensible subsets of items. Later, Hahsler et al. 2007 [134] proposed a two-stepapproach called interesting itemsets (e.g., by a mixture of mining and expert knowl-edge). In the first step, the user defines a set of interesting itemsets and then, ina second step the system generates rules based only on these itemsets. The inter-est to target a small number of items in the cognitive processing of information hasalso been strongly confirmed by strategy-making work (see Barthelemy 1992 [16] formore information). In fact, because of the human’s limited cognitive capabilities, theuser can examine at a given moment of time only a small amount of information.Therefore, the decision maker should be able to save the interesting association rules,discovered from different subsets of rules, and compare them.
Today, KDD is viewed as a session-driven activity. Therefore, the mining resultsare typically displayed on the screen, viewed by the user and subsequently, completelydiscarded. Thus the typical lifetime of the discovered knowledge is the duration ofthe mining session. There is little or no support for the user to rely on the resultsof the previous mining sessions. In such a system, the discovered knowledge frompossibly many mining sessions can be stored in memory. Furthermore, one can buildupon the knowledge accumulated over time.
From these various works on the cognitive processing of information, we estab-lished five principles underlying our methodology for the post-processing of associa-tion rules.
• P1 : lets the user choose a limited number of potentially interesting items;
• P2 : provides the user with association rules that may be interesting;
• P3 : allows the user to make comparisons among association rules;
• P4 : allows the user to modify the subset of potentially interesting items at anytime during post-processing;
• P5 : allows the user to note the interesting association rules and save them withnotes.

4.3 IUCEAR: Methodology for Interactive User-Centred Exploration of AssociationRules 123
4.3 IUCEAR: Methodology for Interactive User-CentredExploration of Association Rules
We assign R, the complete set of association rules produced by an exhaustive algo-rithm for association rule extracting. R contains most of the time a large number ofassociation rules. Our methodology for association rule post-processing is designedfor the convenience of the user faced with a large size of association rule set R. Itis necessary to let the user navigate in R by exploring limited subsets of associationrules. The association rules and their interesting measures are presented in graphicform. This means that the user controls, through successive trial and error, a seriesof local visual explorations based on his/her interest in the rules (Figure 4.2).
�
��
��
��
��
����ABCD��CEF���C���D�D�C��D��DCF
Figure 4.2: Exploration of limited subsets of association rules in R
Thus, the set R is explored subset after subset. The user never faces all associ-ation rules at the same time. At each navigation step, the system proposes to theuser a set of association rules that can interested him/her. Then, the user may findan interesting association rule and decide to keep it in the memory or may take thedecision to choose the next association rules subset to visit. It is through this process,that the user subjectivity is expressed in the association rules post-processing. Fil-tering functions can be used to prune the association rule set proposed by the system.
Our methodology includes the guiding principles of the cognitive processing ofinformation presented in Section 4.2.2 as follows:
1. functions to select a subset of potentially interesting items (P1 );
2. relations to target subset of association rules and to navigate among them (P2and P4 );
3. the user views subset of rules (P3 ). The visualisation simplifies comparisonsamong pieces of information (Ceglar et al. 2003 [63]);

124 Interactive Extraction and Exploration of Association Rules
4. the user saves the association rules that seem interesting (P3 and P5 ).
The functions, relations and visualisation must take into account the two indica-tors involved in the user task: the syntax of the rules and the interestingness measuresof the values.
4.3.1 Items Selection
Item Selection is the first step of the proposed methodology. We take advantage ofthe fact that the user focuses on subsets to display only the subset being explored.Thus, the functions add to the antecedent and add to the consequent performthe data transformation from a set of items I to a rule A.
Through this step the user selects a set of interesting items (P1). The functionis defined as follows: in the whole item set I, two relations add to the antecedent
and add to the consequent associate each selected item to the antecedent or tothe consequent (Figure 4.3) of a reference rule (used to target a subset of associationrules). To add an item, the user must make two choices: which relation to apply andon which item.
�����
����������������
���������A�BC���
���������
D��A�BC���
Figure 4.3: Each relation adds a selected item to the antecedent or to the consequent.
4.3.2 Local mining: anticipation functions
Anticipation functions perform the transformation of a rule A to a set of rules S bytargeting subsets of rules. Interactive operators must be integrated into the visuali-sation process to allow the user to activate these functions.
These functions define how subsets of rules are constituted from items selected inthe previous step. As a vector of user navigation, those functions are fundamentalelements of the IUCARE methodology. The anticipation functions are defined as fol-lows: in all sets of rules R, the anticipation functions associate each rule to a limited

4.3 IUCEAR: Methodology for Interactive User-Centred Exploration of AssociationRules 125
subset of rules that could be interesting to the user (Figure 4.4).
�
�������������A�BCDE
Figure 4.4: Anticipation functions associate each association rule chosen or constructedby the user to a subset of rules.
From a rule the system proposes x rules. To navigate from one subset to an-other, the user must choose which rule to apply the anticipation functions (from theproposed x rules) otherwise he/she can always change the selected items (Figure 4.5).
������������A�BCDE
FE���
�EDE���A
���A�������A��CA���A
Figure 4.5: To navigate from one subset of rules to another, the user can choose one rulefrom the current subset of rules or change the selected items.
∀(r1,r2) ∈ R2, (r2)is − anticipation − rule − of(r1) ⇔(the system determinesthat r2 is interesting for the user based on r1). Here, the 5 anticipation functions(r2)is-anticipation-rule-of(r1):
• r2 is an anticipation rule of r1 if, and only if, r2 has a more general antecedentthan r1 – and has an item more in the antecedent.
• r2 is an anticipation rule of r1 if, and only if, r2 has a more general consequentthan r1 – and has an item more in the consequent.

126 Interactive Extraction and Exploration of Association Rules
• r2 is an anticipation rule of r1 if, and only if, r2 has an item less than r1 in theantecedent.
• r2 is an anticipation rule of r1 if, and only if, r2 has an item less than r1 in theconsequent. If there is only one item in the antecedent or in the consequent,this item will be replaced by another item from the database.
• r2 is an anticipation rule of r1 if, and only if, r2 has the same antecedent of r1and a different consequent .
• r2 is an anticipation rule of r1 if, and only if, r2 has the same consequent of r1and a different antecedent.
All functions are based on rules syntax (Figure 4.6).
����� ���A ������
������BA�CDDE� ���A
����� ���A�BA�CDDE
CDDE� ���A
���� CDDE�
Figure 4.6: Illustration of the anticipation functions.
From all the items of the database, the number of rules constructed by the antic-ipation functions can be very high. The larger the number of items in the database,the greater the number of proposed rules. But as we have already mentioned, theuser can not analyse a large number of association rules. Therefore, association ruleranking functions are used to propose only a limited number of rules to the user ata time. These functions use the rule’s interestingness measures to rank the set ofrules before issuing them. The user visualises only a small set of high-ranking rulesat a time. The originality of the IUCARE methodology in comparison with othermethods of rule exploration (presented in Section 1.5.3.2) mainly lies in the conceptof anticipation and ranking functions. The user can elaborate hypotheses during thenavigation process, unlike an association rules explorer or a query language, since theuser must lay down his hypothesis before starting the process of extracting associa-tion rules. Using a rules explorer or a query language, the extraction constraints mustbe explicitly set, whereas with the IUCARE methodology, constraints are expressedimplicitly as they are integrated into the anticipation functions. We believe that thesefunctions facilitates the user task by making constraint specification much easier andoffer knowledge based on the his/her interest because it does not require the user toknow what he/she looking for.

4.3 IUCEAR: Methodology for Interactive User-Centred Exploration of AssociationRules 127
Example 4.3.1 Consider the following scene in an association rule post-processingprocess: The user thinks that the association rule milk , bread , eggs → pearsis interesting but he/she does not know that milk , bread , appels → eggs andmilk , bread → jus are even more interesting. With the IUCARE methodology,the user has access to valuable information that he/she does not know and thatare based on his/her intentions and preferences. However, if the user uses a querylanguage to perform post-processing rules, then it will not account for the existenceof these interesting rules because he did not know beforehand. If he/she uses a rulesexplorer, then he/she must find each rule manually via the graphical interface. Ifthe user chooses Arvis (Blanchard et al. 2007 [31]) to explore association rules post-processing, he/she needs to use two different neighbourhood relationships to achievethe two rules. In the 3 cases, the user’s task can be tedious.
4.3.3 Association Rule Visualisation, Validation, and Evaluation
The IUCEAR methodology aims to help the user find interesting rules. For that, theuser should be able to evaluate and to compare the association rules proposed by theanticipation functions.
Visualisation can be very beneficial to association rule mining (Simoff et al. 2008[250]). In fact, visualisation techniques are an effective means to provide users withmeaningful visual representations instead of poorly intelligible textual lists. Visual-ising rules makes it easier to find rules that have high interestingness measures andto compare them (cognitive principle P2 ). A significant flaw in most visual repre-sentations presented in Chapter 1 Section 1.5.3 such as grid-like structures and barcharts it is that it does not highlight the rule’s interestingness measures although thisinformation is crucial to rule validation. For example, matrix visualisation, graphvisualisation, and parallel coordinate visualisation use colour to represent some rulesinterestingness measures, even though this graphic encoding for quantitative variablesis known to be bad in information visualisation. The use of colour to represent quan-titative ordinal variables is very often tolerated when it is used to represent a fewmodalities (Wilkinson 2005 [291], Spence 2001 [256]). This can especially be appliedto quantitative variables such as rule interestingness measures if we accept to discre-tise them. Strictly speaking, such a solution should be rejected because the coloursdo not induce any universal order, and their application is unique each time (Bertin1969 [24], Mulrow 2002 [202]).
4.3.4 Browsing History
Rule exploration may be facilitated by providing the user with a rule navigation card.During the association rule exploration process, the user can show his/her interest tosome association rules. These association rules are stored as a navigation map. Thisnavigation card can take the form of a graph indicating the score for each associationrule and the order of their registration (Figure 4.7). This representation would serveas historical exploration but also to give the user an overview of all the rules he/she
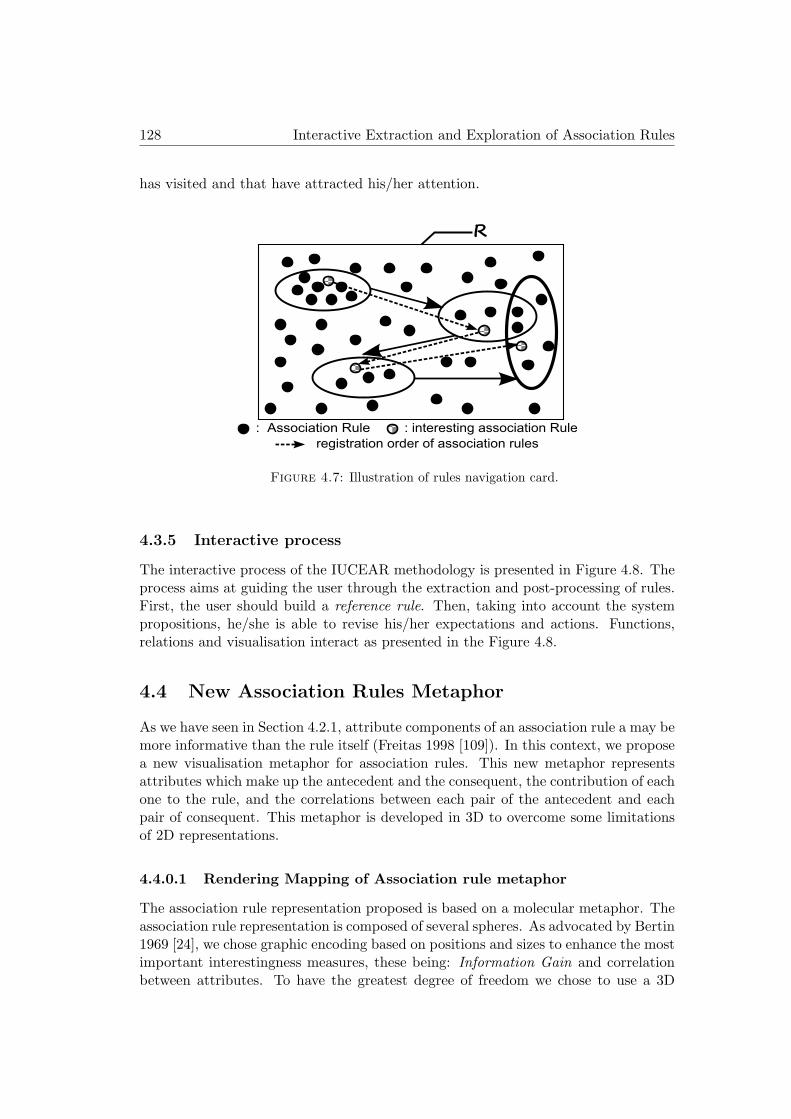
128 Interactive Extraction and Exploration of Association Rules
has visited and that have attracted his/her attention.
�
�������������A�BCDE ���AEFE��A�����������A�BCDE
FE���F���A��F�EF�������������A�FCDE�
Figure 4.7: Illustration of rules navigation card.
4.3.5 Interactive process
The interactive process of the IUCEAR methodology is presented in Figure 4.8. Theprocess aims at guiding the user through the extraction and post-processing of rules.First, the user should build a reference rule. Then, taking into account the systempropositions, he/she is able to revise his/her expectations and actions. Functions,relations and visualisation interact as presented in the Figure 4.8.
4.4 New Association Rules Metaphor
As we have seen in Section 4.2.1, attribute components of an association rule a may bemore informative than the rule itself (Freitas 1998 [109]). In this context, we proposea new visualisation metaphor for association rules. This new metaphor representsattributes which make up the antecedent and the consequent, the contribution of eachone to the rule, and the correlations between each pair of the antecedent and eachpair of consequent. This metaphor is developed in 3D to overcome some limitationsof 2D representations.
4.4.0.1 Rendering Mapping of Association rule metaphor
The association rule representation proposed is based on a molecular metaphor. Theassociation rule representation is composed of several spheres. As advocated by Bertin1969 [24], we chose graphic encoding based on positions and sizes to enhance the mostimportant interestingness measures, these being: Information Gain and correlationbetween attributes. To have the greatest degree of freedom we chose to use a 3D

4.4 New Association Rules Metaphor 129
Figure 4.8: Interactive process description for the IUCEAR methodology.
representation.
Our metaphor (Figure 4.9) shows two types of interestingness measures.
The first one matches rule attribute description which consists of categorical vari-ables from Bertin’s semiology point of view. Each attribute has an associated contin-uous variable corresponding to its information gain. The user must know if an itembelongs to the antecedent or the consequent. Therefore, we should separate the itemsof the antecedent from the items of the consequent in the representation space. Eachsphere represents an item and its size and colour represent its contribution to therule. The sphere size represents the contribution of the item and the colour shows ifthe contribution is positive (blue) or negative (grey). The chosen graphical encodinghighlights items with high, positives contribution (large blue sphere) and those withhigh, negative contributions (large grey sphere). Both sets of information are inter-esting to the user.
The lift is a positive measure used to indicate to what degree two items of theantecedent or two items of the consequence are correlated. A distance between eachtwo items of the same side (antecedent or consequence) is an effective representa-tion of this measurement. The more the items are correlated, the closer the spheres.In our representation, the antecedent and the consequence are two separate graphsin which the nodes are items. To generate item coordinates in 3D space, we use amodified version of the spring-embedded like algorithm (Hendley et al. 1999 [141]).

130 Interactive Extraction and Exploration of Association Rules
Figure 4.9: The visual association rule metaphor.
This algorithm (see Chapter 3 Section 3.3.1.1 ) enables the spheres self-organisationin the visualisation area by the use of a force system in order to determine the spherepositions. Using a force system allows correlated items to be near each other, andindependent items to be far away. The algorithm is described in the following section.An association rule representation consists of spheres and links whose properties aregiven by the rule parameters.
The second type of interestingness measure corresponds to measurements associ-ated with the rule (support, confidence, etc,.). This meta information that describesthe properties of the rules are quantitative variables according to Bertin’s semiology1969 [24]. Theoretically, it is possible to represent a large number of metrics usingvisual variables appropriate to the area of interest of each user. For example, we canrepresent the confidence or the support by a distance between the antecedent and theconsequence. The visual metaphor stresses the rules with a high level of confidenceor support (Figure 4.10). Furthermore, complementary text labels appear above eachobject to give the name of the corresponding item.
4.4.0.2 Spring-embedded like algorithm
The graph representing the antecedent items or the consequent items is projected intoa 3D space. Each graph node represents an item. Nodes are represented by spheres.The node coordinates are determined by a system of attractive forces (Table 4.4.0.2).
The nodes are all connected with edges. The edge is considered as a spring be-tween two nodes with length and elasticity attributes. The spring length represents

4.4 New Association Rules Metaphor 131
Figure 4.10: Illustration of an association rules set. The distance between the antecedentand the consequence stresses the rules with a high interestingness measure (support of confi-dence)
Input: Set of item l, Set of Edge E, Force = (x=0,y=0,z=0)
Output: Set of coordinates C
1. forall item lk ∈ l do
5. forall Edge Em ∈ E connected to lkdo
6. Force = Force + HookeAttraction(lk, Em)
7. endfor
8. Velocity = (Velocity + Force) * damping
9. C = C * Velocity
10. endfor
Table 4.1: The placement algorithm.
the correlation between the two items (1/lift). More the items are correlated, themore the edge are short and the closer the nodes. To reduce the number of con-straints, we consider only relevant links whose lift is greater than 1 (see Chapter 1Section 1.3.2 ).
The Hooke attraction (FH) describes the elasticity of the spring. It is appliedbetween each pair of nodes and tends to maintain them at the defined distance (1/lift).
Definition 4.4.1The Hook attraction FH , applied to a node of coordinates C1 linked to another
node of coordinates C2 where k is the virtual stiffness and R the length of the edge.
FH = −k(|L−R)L
|L|with L = p2 − p1

132 Interactive Extraction and Exploration of Association Rules
The system produces a physical approximation of the node movement which canbe easily interpreted by a human where the nodes are distributed in space accordingto the edge length (correlation among the items).
4.4.1 Validation of Association rule metaphors
In this section, we present the results of the evaluation of four different representationsof association rules with different interaction techniques and visualisation configura-tion. The four representations considered in this study are based on the metaphorpresented in the previous section. This experiment aims to evaluate the four differentrepresentations in different configurations. In this study, only one association ruleis visualised by users and the different association rules are only one item in theconsequent.
• Metaphor 1 (Figure 4.11(a)): the items are placed in a circle with an ascendingInformation Gain;
• Metaphor 2 (Figure 4.11(b)): the items are placed using the spring-embeddedlike algorithm;
• Metaphor 3 (Figure 4.11(c)): the items are placed in a circle in pairs with anascending Information Gain. The item with the highest Information Gain isplaced first with the most correlated item next to it. The distance between thetwo items is proportional to the lift value.
• Metaphor 4 (Figure 4.11(d)): the items are placed in a circle in pairs with anascending Information Gain without the distance between the antecedent andthe consequent.
4.4.1.1 Objective
The objective of this study is the determination of i the best metaphor to repre-sent association rules, ii the more adequate visualisation interface and iii the bestinteraction technique, to offer the best performance and most suitable tool for theuser.
4.4.1.2 Task
The task was to answer five different questions about each of the four displayed as-sociation rule representations.The five questions are:
• Question 1: What is the item of the consequent?
• Question 2: What is the most influential item of the association rule?

4.4 New Association Rules Metaphor 133
(a) (b)
(c) (d)
Figure 4.11: The 4 metaphors of association rule : (a) Metaphor 1 (b) Metaphor 2 (c)Metaphor 3 (d) Metaphor 4
• Question 3: What are the most correlated items of the association rule?
• Question 4: What are the lowest correlated items of the association rule?
• Question 5: What is the total number of antecedent items ?
The displayed association rules have four levels of complexity. Complexity isproportional to the number of items of association rules. There are four differentassociation rules extracted from the database of Polytech’Nantes student grades be-tween 2002 and 2005.
The different rules are:
• Association rule 1 (9 items): Social and Professional Issues(3rd)=B, Informationsystems(3rd)=C, Software Engineering(3rd)=B, Applied Mathematics(3rd)=B,

134 Interactive Extraction and Exploration of Association Rules
Foreign Languages(4th)=D, Applied Mathematics(4th)=B, Networking and Com-munications(4th)=B, Social and Professional Issues(4th)=A → Social and Pro-fessional Issues(5th)=B
• Association rule 2 (7 items): Software Engineering(2007)=E, Foreign Lan-guages(2007)=C, Networking and Communications(2007)=C, Information Sys-tems ID(2007)=D, Social and Professional Issues(2007)=D, Foreign Languages(2008)=B,Information Systems ID(2008)=D→Humanities and Professional Issues(2009)=C
• Association rule 3 (5 items): Foreign Languages=D, Social and Professional Is-sues=C, Application of Mathematics and Statistics to Decision-Aide=D, Knowledge-based Systems=D, Training Periods and Term Projects=C → Information Re-trieval=C
• Association rule 4 (4 items): Social and Professional Issues=C, InformationSystems=D, Systems and languages=D → Software Engineering=C
To simplify things, each item will be represented by a letter. Subjects shouldrespond to a total of 20 questions (five questions for each one of the four associationrules). Interaction with the representation is done using rotations on the 3-axis anda zoom (in/out).
4.4.1.3 Protocol
A total of 36 volunteer subjects, all right handed, participated in this study. Thesesubjects had normal or corrected vision. Two protocols were used:
• Protocol 1: 24 of the 36 subjects performed the task only once, in one of thetwo conditions C1 or C2 (12 C1 and 12 C2);
• Protocol 2: 12 of the 36 subjects performed the task twice without a rest periodbetween the two tests, in the conditions C3 and C4. 50% of the subjects beganin condition C3, then did the test in condition C4 and 50 % of the subjectsbegan in condition C4, then do the test in condition C3.
The experimental conditions are the following:
• C1: wiimoteTM and stereoscopic display;
• C2: wiimoteTM and monoscopic display;
• C3: mouse and stereoscopic display;
• C4: mouse and monoscopic display.
To get acquainted with the system, the subjects had to interact with a test asso-ciation rule in the different conditions, before starting the test. The order of displayof the different association rules was randomly selected for each subject to avoid bias

4.4 New Association Rules Metaphor 135
due to training transfer. The response time for each question was recorded. Thesubjects were equipped with stereoscopic active glasses in conditions C1 and C3 andwere placed in front of the screen at a distance of 1.5 meters (Figure 4.12). To collectsubjective data, a questionnaire was given to each subject at the end of the experi-ment.
Figure 4.12: The test conditions.
4.4.2 Results
Firstly, we examined the task completion time and the error rate. Then, we examinethe subjective aspects of performance (information collected via the questionnaire).We also reported the information collected (observation) during the experiment (dif-ficulties encountered, strategies, subjects behaviour, etc.).
4.4.2.1 Response Time
Recorded data (response time) was processed through the analysis of variance (ANOVA).
Concerning the identification of the consequent item (question 1), the resultsshown in Figure 4.13 indicate that metaphor 4 has a better response time thanmetaphor 1 and metaphor 3 (F (3, 11) = 2.94, p = 0.04). ANOVA found thatmetaphor 4 (M = 9.2s, SD = 3.1) allowed a quicker identification of the consequentthan metaphor 1 (M = 14.3 s, SD = 6.2) and metaphor 2 (M = 14.9 s; SD = 8.0).No difference was found between metaphors 3 and 4. Therefore, we can deduce thatmetaphor 4 is best since the standard deviation is smaller. This result shows that the

136 Interactive Extraction and Exploration of Association Rules
user’s performance is predictable.
For this task, monoscopic viewing is sufficient (Figure 4.14) and stereoscopicdisplay does not help the user much . The interaction mode (computer mouse orWiimoteTM ) does not have a significant effect on performance (F (3, 11) = 0.45, p >0.05) except in the case of using the WiimoteTM with monoscopic viewing. Inthis case, ANOVA revealed better results than the stereoscopic display (F (1, 22) =5.53, p = 0.02). ANOVA also revealed no difference between monoscopic and stereo-scopic viewing when using the mouse only.
Figure 4.13: Response time to question 1 for different metaphors.
Figure 4.14: Response time to question 1 for different conditions.
To determine the dominant item of the association rule (Question 2), the resultsshown in Figure 4.15, indicate that metaphor 3 (M = 16.9 s, SD = 6.3) and metaphor4 (M = 13.8s, SD = 2.8) are better compared to metaphor 2 (M = 22.7s, SD = 7.9)in terms of response time (F (3, 11) = 4, 13, p = 0.01).

4.4 New Association Rules Metaphor 137
The identification of the largest sphere does not require a specific method forviewing in the case of using the mouse (Figure 4.16) with monoscopic display (M =15.08s, SD = 6.08) and stereoscopic display (M = 15.0s, SD = 5.67). The use of theWiimoteTM (M = 21.69s, SD = 8.6) generates a response time higher than the mouse(M = 15.08s, SD = 6.08) in the case of monoscopic display (F (3.11) = 3.06, p = 0.04).To this question the mouse is better than the wiimoteTM only in the case of mono-scopic viewing. In the case of stereoscopic viewing the mode of interaction does notinfluence the response time. ANOVA found no differences between monoscopic dis-play and stereoscopic display with the mouse.
Figure 4.15: Response time to question 2 for different metaphors.
Figure 4.16: Response time to question 2 for different conditions.
The results of identification of the most correlated items (F (3, 11) = 10.78, p =0.00001) shown in Figure 4.17 indicates that metaphor 3 (M = 19.55s, SD = 4.81)and metaphor 4 (M = 15.66 s, SD = 3.94) requires a response time lower than neededby metaphor 1 (M = 31.89s, SD = 14.96) and metaphor 2 (M = 31.81s; SD = 7.04).We can also assume a slightly better performance of metaphor 4 (M = 15.66 s, SD =
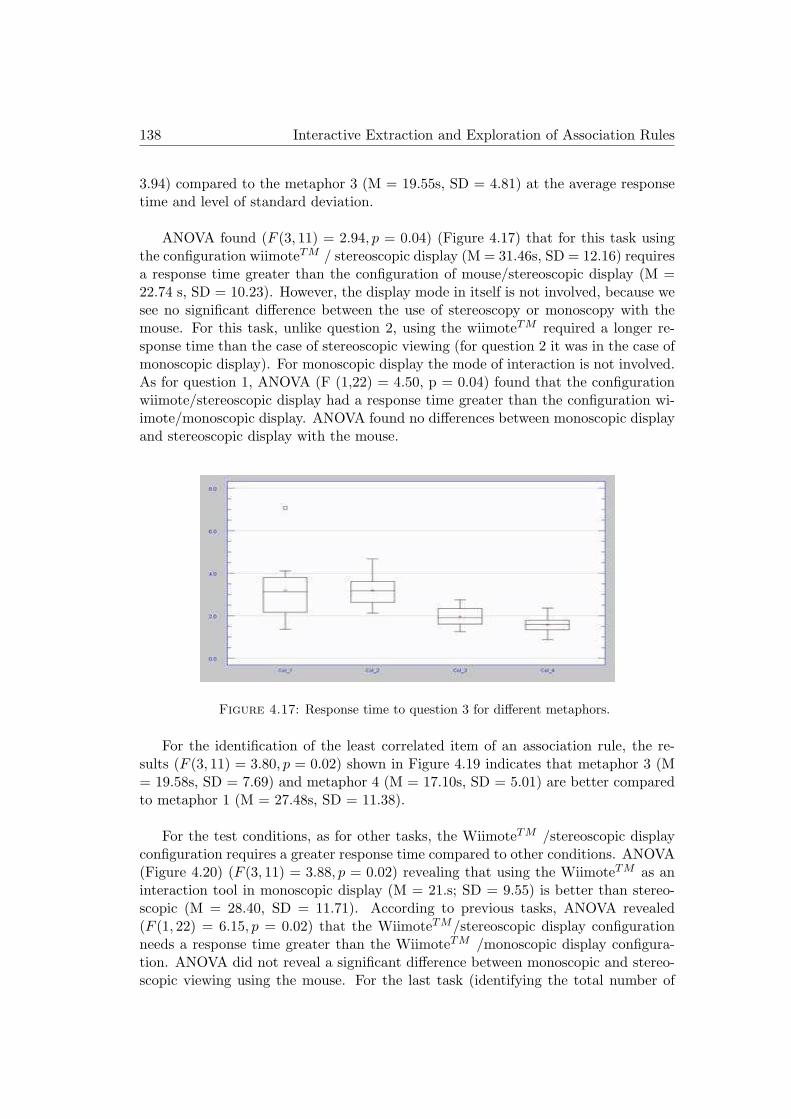
138 Interactive Extraction and Exploration of Association Rules
3.94) compared to the metaphor 3 (M = 19.55s, SD = 4.81) at the average responsetime and level of standard deviation.
ANOVA found (F (3, 11) = 2.94, p = 0.04) (Figure 4.17) that for this task usingthe configuration wiimoteTM / stereoscopic display (M = 31.46s, SD = 12.16) requiresa response time greater than the configuration of mouse/stereoscopic display (M =22.74 s, SD = 10.23). However, the display mode in itself is not involved, because wesee no significant difference between the use of stereoscopy or monoscopy with themouse. For this task, unlike question 2, using the wiimoteTM required a longer re-sponse time than the case of stereoscopic viewing (for question 2 it was in the case ofmonoscopic display). For monoscopic display the mode of interaction is not involved.As for question 1, ANOVA (F (1,22) = 4.50, p = 0.04) found that the configurationwiimote/stereoscopic display had a response time greater than the configuration wi-imote/monoscopic display. ANOVA found no differences between monoscopic displayand stereoscopic display with the mouse.
Figure 4.17: Response time to question 3 for different metaphors.
For the identification of the least correlated item of an association rule, the re-sults (F (3, 11) = 3.80, p = 0.02) shown in Figure 4.19 indicates that metaphor 3 (M= 19.58s, SD = 7.69) and metaphor 4 (M = 17.10s, SD = 5.01) are better comparedto metaphor 1 (M = 27.48s, SD = 11.38).
For the test conditions, as for other tasks, the WiimoteTM /stereoscopic displayconfiguration requires a greater response time compared to other conditions. ANOVA(Figure 4.20) (F (3, 11) = 3.88, p = 0.02) revealing that using the WiimoteTM as aninteraction tool in monoscopic display (M = 21.s; SD = 9.55) is better than stereo-scopic (M = 28.40, SD = 11.71). According to previous tasks, ANOVA revealed(F (1, 22) = 6.15, p = 0.02) that the WiimoteTM/stereoscopic display configurationneeds a response time greater than the WiimoteTM /monoscopic display configura-tion. ANOVA did not reveal a significant difference between monoscopic and stereo-scopic viewing using the mouse. For the last task (identifying the total number of

4.4 New Association Rules Metaphor 139
Figure 4.18: Response time to question 3 for different conditions.
items from the antecedent), there was no significant difference among the 4 metaphors.
Figure 4.19: Response time to question 4 for different metaphors.
4.4.2.2 Error rate
For the error rate analysis, we consolidated the 5 questions together in the same his-togram. Figure 4.21 shows that there is no differences among the metaphors. Eachmetaphor has its advantages and disadvantages. For instance, its is easier to find themost influential items (question 2) with metaphor 1 than with the other metaphorsbecause the spheres are classified in ascending order. For question 3 (the most cor-related items) it is easier the find the closest spheres with metaphors 3 and 4. Forquestion 4 (the lowest correlated item) it the information is given only by metaphor 2.
Figure 4.22 shows that the use of WiimoteTM produces a lower error rate relativeto the mouse. When using the WiimoteTM users take much more time to analyse the

140 Interactive Extraction and Exploration of Association Rules
Figure 4.20: Response time to question 4 for different conditions.
representation than with the mouse and produce better results. This shows that theWiimoteTM is more suitable in a large screen configuration. There is no differencesbetween stereoscopic and monoscopic display.
Figure 4.21: Error rates of the questions for different metaphors.
4.4.2.3 Subjective Aspects
The observation of the subjects performed during the study revealed that they have nodifficulty to interact with the different representations of association rules. However,the majority of subjects (90 %) did not use the zoom function. This means that thedistance from the display of the representation was adequate for all the metaphorsand all the subjects. We also note that 70 % of the subjects preferred to use theWiimoteTM compared to the traditional computer mouse. An adjustment periodwas necessary for the WiimoteTM which explains the response time being still highercompared using the mouse. A more detailed experience concerning the use of theWiimoteTM is necessary for more reliable conclusions to be drawn.

4.4 New Association Rules Metaphor 141
Figure 4.22: Error rates of the questions for different conditions.
4.4.3 Discussion
We have presented a series of experiments we conducted to study the relevance andthe influence of different display configurations (monoscopic and stereoscopic) andinteraction devices (mouse, wiimoteTM ) in different tasks involving knowledge extrac-tion from different representation association rule metaphors. Different experimentaltasks using several interaction configurations have been proposed and validated. Afirst experiment was conducted to choose a metaphor among the four proposed toextract information about association rules with an acceptable compromise betweenresponse time and error rate. This experiment proves that metaphor 3 and metaphor4 are the best in terms of response time. In a second step the choice of a configura-tion interaction/visualisation, the experimentation shows that there is no differencebetween the monoscopic display and stereoscopic display. In interaction, the bestresults were obtained with the mouse. The use of stereoscopy or monoscopy led tosimilar results.
The first experiment allowed us to choose a representation of association rulesbut did not conclude on the configuration interaction and visualisation to choose.The data collected through the questionnaire and observation of subjects during theexperiment showed that wiimoteTM provided a sense of freedom of movement morethan the mouse. 90 % of subjects preferred the wiimoteTM to a mouse. Some usersmentioned recurring discomfort when viewing stereoscopically. Using a desktop PCwith a monoscopic display to answer questions was annoying in the case of stereoscopicdisplay. Some subjects were forced to remove their glasses which generated a longerresponse time for stereoscopic over the monoscopic viewing.

142 Interactive Extraction and Exploration of Association Rules
4.5 Interactive Visualisation of Association Rules withIUCEARVis
The IUCEAR methodology defines some basic principles for developing a tool dedi-cated to association rule exploration. However, the methodology can be implementedin multiple ways. In particular, various possibilities have been conceivable for graphicencoding. In this section we describe the choices that were made to work out themethodology for the visualisation tool.
To implement the four parts of the IUCEAR methodology, three different inter-faces were presented to the user (Figure 4.23) for the:
• selection of interesting items;
• exploration and validation of recommended association rules;
• visualisation of the history map of the association rules selected by the user.
Figure 4.23: Illustration of IUCEARVis approach.
As we have seen in Section 4.4, the association rule metaphor was designed todisplay the items making up the rules. This metaphor is used in IUCEARVis to im-plement the IUCARE methodology. Such is the association rule metaphor, that we

4.5 Interactive Visualisation of Association Rules withIUCEARVis 143
chose an encoding approach based on positions and sizes to highlight the degree ofrules interestingness in IUCEARVis.
We pursue the visualisation process proposed by Card et al. 1999 [60] (presentedin Section 3.2.2) to describe the different visualisation interfaces.
4.5.1 Items Selection
4.5.1.1 Data Transformations
We took advantage of the fact that the user focuses on rule subsets to display onlythe subset being explored (cognitive principle (P1) of the IUCEAR methodology).
Initially, the user selects the interesting items that should be in the extractedassociation rules. Therefore, the user should build a reference rule by selecting theitems that will make up its antecedent and the items that will make up its conse-quent. Thus, the functions add to antecedent and add to consequent perform the datatransformation from a set of items I to a rule A. We call A the reference rule, becauseit is from the component items of this rule that rules will be generated.
For example, with a set of four items I = (A,B,C,D) the user can build any rulethat he considers interesting (milk → bread) ; (milk, bread → apples), ( milk, bread,apples → eggs), etc.
To start or restart a rule exploration process, the user has first to select a referencerule using the item selection interface.
Example 4.5.1 In the example shown in Figure 4.24, the user builds the referencerule (con=+, n=+, led=+ → clv=0). He/she can immediately note that this is apoor quality rule (confidence = 27%, support = 4%, and lift = 0.57).
4.5.1.2 Rendering Mappings
Multiple objects are present in this interface (Figure 4.25):
1. list of items: a pick-list contains all database items;
2. cylinders representing the frequency of items: the maximum size of a cylinder= 1. The most common item in the database will be represented by a cylinderof size 1. The cylinders may have different colours: blue, green or red. Moreprecisely, when there is more than one item in the antecedent and more thanone item in the consequent, the contribution of the item to the association rulecan be calculated if the item will be added to the antecedent or if the item willbe added to the consequent. The cylinder colour indicates if the item improvesthe quality of the rule’s interestingness. A green colour indicates that the item

144 Interactive Extraction and Exploration of Association Rules
Figure 4.24: Item Selection interface.
improves the rule quality. A blue colour indicates that the item does not changethe rule quality. A red colour indicates that the item degrades the rule quality.;
3. spheres representing the antecedent items have a fixed size. Consequently, thespheres are all identical;
4. spheres representing the consequent items are identical to the spheres repre-senting the antecedent items;
5. cylinders representing the support and confidence they are the same size. Themaximum size of the cylinder is equal to 100 % of the interestingness measure.To represent the values of the reference rule interestingness measures we chose agraphic encoding based on sizes: the size of a cylinder. The value is representedby the darker colour, and is also displayed above the cylinder. Since the lift isan unbounded measure we decided to display only the value without a graphicobject associated to it;
6. a cursor is used to select the thresholds values of interestingness measure (sup-port and confidence). The threshold values may vary between 0% and 100%.
In this interface we do not use the metaphor of representation of association rulespresented in Section 4.4. This metaphor allows the comparison of association rules,whereas in this interface only one rule is displayed: the reference rule.

4.5 Interactive Visualisation of Association Rules withIUCEARVis 145
�
�
�
�
�
�
Figure 4.25: Objects present is the item Selection interface.
4.5.1.3 View Transformation
This interface allows the user to build a reference rule and display the interestingnessmeasure related to it. Firstly, the user visualise all items (I ) present in the databasein a pick-list. The number of items displayed on the drop down is set to 28. If thereare more then 28 items in the database, the user can easily scroll down the list toshow the hidden items. In order to help the user to get an idea about the data andto choose interesting items, the item selection interface offers the possibility to mod-ify the ordering items list criteria. The item pick-list can be ordered in frequencyorder, alphabetical order, highest support, highest confidence, and highest lift (theordering by interestingness measures is possible only if at least one item occurs inthe antecedent and one item in the consequence). The user can choose to visualisethe contribution of the item to the association rule if it will be in the antecedent orif it will be in the consequence. The user can also change the support and confidenceminimum thresholds by the algorithms of rule extraction.
To navigate among the different interfaces (item selection, rule exploration, andbrowsing history) a command menu allows direct access to the desired interface. Thiscommand menu is present in the three interfaces of IUCEARVis.

146 Interactive Extraction and Exploration of Association Rules
4.5.2 Association Rule Exploration, Evaluation and Validation
After item selection, the system proposes to the user a small set of rules syntacticallyclose to the reference rule. Then, the user can visualise, evaluate and validate themthrough the association rule exploration interface. The algorithms used for associationrule generation will be presented in Section 5.2
4.5.2.1 Data Transformation
After selecting a reference rule A, the anticipation functions perform transformationof a rule A to a set of rules R by targeting subsets of rules.
Six anticipation functions are taken up in IUCEARVis. Most of them are spe-cialisation functions or generalisation functions. Specialisation and generalisation areindeed the two fundamental cognitive processes to generate new rules according toHolland et al. 1986 [147]. One of the characteristics of the anticipation functions isthe integration of the most important interestingness measures of association rules,support (supp) and confidence (conf). Each interestingness measure is associated toa minimum threshold (minsupp and minconf) set by the user to filter rules. Thesethresholds can be changed by the user at any time during navigation in R.
To define the anticipation functions, we bring thresholds together in the booleanfunction GoodQuality :
∀r ∈ R, GoodQuality(r) ⇔ (supp > minsuppandconf > minconf)
This approach is in the form of the following anticipation functions:
- The association rule of reference has only one item in the antecedent oronly one item in the consequent
• A1(x → Y ) = z → Y |z ∈ I (Y )
• A2(X → y) = X → z|z ∈ I (X)
- The association rule of reference has at least one item in antecedent andone item in the consequent
• anticipation functions of specialisation: specialisation consists of adding an itemto the rule antecedent or the rule consequent;
– A3(X → Y ) = X ∪ z → Y |z ∈ I (X ∪ Y ) ∧GoodQuality(X ∪ z → Y )

4.5 Interactive Visualisation of Association Rules withIUCEARVis 147
– A4(X → Y ) = X → Y ∪ z|z ∈ I (X ∪ Y ) ∧GoodQuality(X → Y ∪ z)
• anticipation function of generalisation: generalisation consists of simplifying therule antecedent or the rule consequent.
– A5(X → Y ) = Xz → Y |z ∈ X ∧GoodQuality(X z → Y )
– A6(X → Y ) = X → Y z|z ∈ Y ∧GoodQuality(X → Y z)
For the purpose of simplicity, upper case (X,Y ) denotes item sets and lower case(x, y, z) denotes items. We note X ∪ Y instead of X ∪ Y and X\z instead of X\z.
Example 4.5.2 Let us consider a sample of supermarket transaction data set pre-sented in Table 4.5.2 with minsupp = 20% and minconf = 80%:
Tuple Milk Bread Eggs Apples Pears
1 1 0 1 0 1
2 1 1 0 1 1
3 1 1 1 1 0
4 1 1 1 1 1
5 0 0 1 1 0
Table 4.2: A supermarket transaction data set.
Let us consider an association rule
Milk,Bread → Apples [supp = 60% and conf = 100%]
• if we used A2, two association rules can be generated (Milk, Bread → Eggs[Supp= 40% and Conf= 66%]) ; (Milk, Bread→ Pears [supp=40% and conf=66%]).All the rules have conf ≤ minconf ;
• if we used A3, two association rules can be generated (Milk , Bread, Eggs → Ap-ples [supp= 40% and conf=100%]) ; (Milk, Bread, Pears → Apples [supp=40%and conf=100%]). The two rules have supp ≥ minsupp and conf ≥ minconf ;
• if we used A4, two association rules can be generated (Milk, Bread → Apples,Eggs [supp=40% and conf=66%]) ; (Milk, Bread → Apples, Pears [supp=20%and conf=50%]). All the rules have conf ≤ minconf ;
• if we usedA5, two association rules can be generated (Milk→Apples [Supp=60%and Conf=100%]) ; (Bread →, Apples [Supp=60% and Conf=100%]). The tworules have supp ≥ minsupp and conf ≥ minconf ;

148 Interactive Extraction and Exploration of Association Rules
• A1 and A6 can’t be used because there is a single item in the antecedent.
A total of 8 association rules can be generated, but only 4 will be presented tothe user (supp ≥ minsupp and conf ≥ minconf).
• R1: Milk → Apples :Supp(R1)=60% and Conf(R1)=100% ;
• R2: Bread → Apples Supp(R2)=60% and Conf(R2)=100% ;
• R3: Milk, Bread, Eggs → Apples Supp(R3)= 40% and Conf(R3)=100% ;
• R4: Milk, Bread, Pears → Apples Supp(R4)=40% and Conf(R4)=100%.
According to the number of items present in the database, the number of generatedassociation rules can be very high. As we have already seen in Chapter 1, humancapabilities can’t deal with large volumes of information. To limit the cognitive loadof analysis, we propose a limited subset of rules at a time. Only the 10 most importantrules will be displayed. In order to select those rules, the user must choose one of theselection criteria among :
• highest support;
• highest confidence;
• highest lift;
• an aggregate measure = weightSupport * support + weighconfidence*confidence+ weightlift* lift weights values are defined by the user.
The algorithms developed for the local extraction of association rules are presentedin Section 5.2.
4.5.2.2 Rendering Mappings
Association rule exploration, evaluation and validation is the central interface ofIUCEARVis. It is through this interface that the user explores the subset of rulesgenerated by the local mining algorithms.
Based on the reference rule A, the system generates and displays a subset of rulesS = F (A) that may interest the user. The reference rule will be consistently addedto any generated subset. This allows comparisons between the reference rule andthe rules proposed by the system. For example, it is interesting to identify whichitems can be removed from the rule without degrading the rule quality. Reciprocally,comparison can be used to check if adding new items to the antecedent or to theconsequent improves the rule quality.
The association rule exploration interface presents 3 different regions: (Figure 4.26):

4.5 Interactive Visualisation of Association Rules withIUCEARVis 149
�
�
�
Figure 4.26: Interface for association rules exploration, validation, and evaluation.
1. at the upper left: the reference rule built by the user via the item selectioninterface. Displaying the rule of reference allows the user to compare the rulethat he/she built with the rules proposed by the system. The reference rule isrepresented according to our rule metaphor;
2. at the upper right: a 3D Scatter plot (see description Chapter 3 Section 3.3.1.1)in which the rules are represented . As advocated by the IUCARE methodology,we chose map encoding based on positions to highlight the rule interestingnessmeasures. In a 3D scatter plot, the position of an object might allow us toencode three rule interestingness measures, an interestingness measure on eachaxis. To facilitate the perception of depth (z axis) in the 3D space, the intensityof colour is associated with the depth axis. The closer the object is to the user,the more intense the colour. To distinguish the rule of reference, it will berepresented in green while other rules are represented in blue. The scatter plotstresses the good quality rules. More precisely, a rule placed in the top of thethree axes represents a rule whose support, confidence, and lift are high. On theother hand, a rule placed near the scatter plot origin represents a rule whosethree interestingness measures are weak;
3. at the bottom: In a visual representation, the perceptually dominant informa-tion is the spatial position. Therefore the interestingness measures which arefundamental for decision making are represented by the object position. Theuser chooses what rules interestingness measure will serve to organise the rules.Since the range of Information Gain values vary according to the displayed ruleset, IUCAREVis includes a normalisation procedure for allocating sphere sizeson larger values. This also helps to avoid low values lead to very small spheres

150 Interactive Extraction and Exploration of Association Rules
and large values lead to large spheres.
An association rule can have a score between 0 to 3 given by the user accordingto his/her interest to the rule. The colour of links in the representation metaphor isused to encode the score value as follows (Figure 4.27):
• 0: white colour;
• 1: azure colour;
• 2: medium blue colour;
• 3: dark blue colour.
(a) (b) (c) (d)
Figure 4.27: The different colours of links to encode rules score: (a): score 0 (whitecolour), (b): score 1 (azure colour), (c): score 2 (medium blue colour), (d): score 3 (dark bluecolour).
4.5.2.3 View Transformation
Research work in visual perception shows that humans have at first overall percep-tions of a scene, before paying attention to detail (Hascoet and Beaudoin-Lafon 2001[139]), this motivated the development of Focus/context approaches (see Chapter 3Section 3.2.2). This is especially well known in a formula made by Shneiderman 1996[244] widely used in information visualisation: ”overview first, zoom, and filter, thendetails on demand”. In IUCAREVis, the user must be able to pass easily from aglobal view to a detailed view by interacting with the visualisation. For that, theuser can focus on one rule among the displayed association rules set. The user selectsthe rule that he/she want to show and this rule will be displayed on the front of thescreen. The other rules remain displayed but blurred. The selected rule is displayedin red to keep the overall context (Figure 4.28). The sphere representing the same

4.5 Interactive Visualisation of Association Rules withIUCEARVis 151
rule in the 3D scatter plot is displayed in red too. This technique is called brushingand linking (see Chapter 3 Section 3.2.2). The interestingness measure values relativeto the selected rule are displayed. It is easy to locate the best rules with the scatterplot. The user can just click on the selected rule to zoom in and examine it moreclosely.
Figure 4.28: Linking and brushing: a selected rule is simultaneously highlighted in the3D scatter plot.
Several system control commands are also available to meet the different needs ofthe user in his search for interesting knowledge (Figure 4.29):
1. set a new rule as a reference rule. The user can select any rule from the dis-played set of rules and make it the new reference rule. The system automaticallytriggers the algorithms to generate a new subset of rules according to the an-ticipation functions.
2. modify the 3D scatter plot axis. To give more flexibility to the user, we givehim/her the possibility to decide which interestingness measure will be repre-sented on each axis.
3. change the displayed subset of rules. The association rules are displayed by aset of 10. The user can then display each time the previous or following subset.
4. change the rule interestingness measure used to sort the rules set. The user canmay choose between : support, confidence, lift or global measure (see section4.5);

152 Interactive Extraction and Exploration of Association Rules
�
�
�
� �
Figure 4.29: System control commands available in the rules exploration, evaluation andvalidation interface.
5. activate/deactivate filter. The user can visualise only rules that have the sameconsequent or the same antecedent as the reference rule;
6. set a rule score. During the exploration step, an interesting rule can draw theattention of the user, then, he/she can give it a score between 1 and 3 and addit to the history map of interesting rules. The cursor used to set the rule scoreis displayed at the user request (Figure 4.30).
4.5.3 Browsing History
Through the browsing history interface, the user visualises all rules which have drawnhis/her attention during the exploration and extraction process. So there is no trans-formation of data.
4.5.3.1 Rendering Mappings
Unlike the exploration interface where the number of rules is limited to 10, this inter-face must support large numbers of rules. Therefore, we have chosen a representationbased on the information landscape metaphor to place the association rule set. Specif-ically in a scale (Figure 4.31).
Since in a visual representation the perceptually dominant information is the spa-tial position, the interestingness measures which are fundamental for decision makingare represented by the association rule position in the scale. In a 3D information land-scape, the position of an object allow us to encode three interestingness measures.
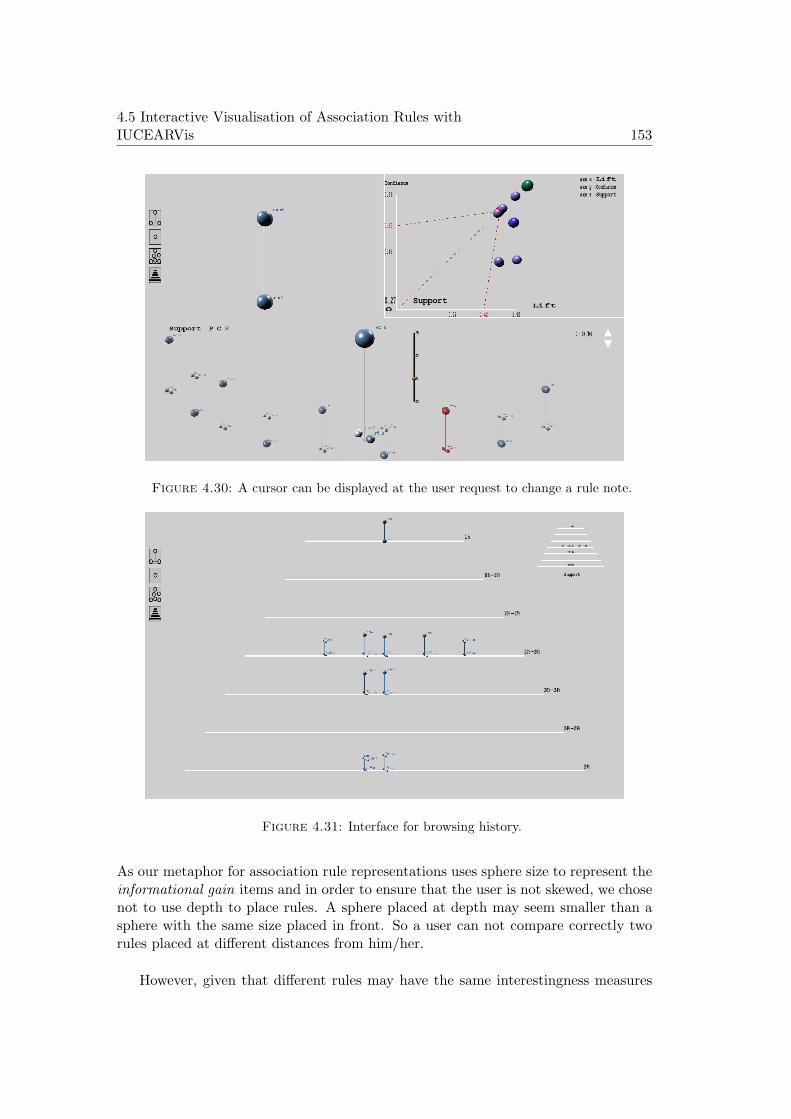
4.5 Interactive Visualisation of Association Rules withIUCEARVis 153
Figure 4.30: A cursor can be displayed at the user request to change a rule note.
Figure 4.31: Interface for browsing history.
As our metaphor for association rule representations uses sphere size to represent theinformational gain items and in order to ensure that the user is not skewed, we chosenot to use depth to place rules. A sphere placed at depth may seem smaller than asphere with the same size placed in front. So a user can not compare correctly tworules placed at different distances from him/her.
However, given that different rules may have the same interestingness measures

154 Interactive Extraction and Exploration of Association Rules
values, it is necessary to leave one dimension in order to distribute the associationrules in space and prevent them from overlapping. Only one interestingness measureis encoded by the position. In addition, the rules placement on a scale allow high-lighting the rules with good quality. More precisely, a rule positioned on the bottomstep is a rule whose interestingness measure value is greater than another placed onthe top step. A landscape miniature representation allows users to have the orderof addition of each rule to the history. Instead of each rule displayed in the scale, anumber corresponding to the order of addition of the rule is displayed in the minia-ture scale.
The scale is composed of 7 steps and on each step rules are distributed from thecentre of the step towards the outside. The size of the scale is the same regardlessthe number of displayed rules. However, interestingness measure values correspond-ing to each step vary depending on the displayed rules (Figure 4.32). Maximum andminimum interestingness measure values are calculated each time a rule is added ordeleted from the displayed rule set.
For the association rule representation we use our metaphor. The colour of linksamong the items corresponds to the note that the user has given to the rule likein the exploration interface. An Information Gain normalisation procedure is usednormalise the sphere sizes.
Figure 4.32: The rule positions on the scale are based on the interestingness measurevalues.

4.6 Conclusion 155
4.5.3.2 View Transformation
As in the rule exploration and validation interface, the user can focus on one ruleamong the displayed association rule set. The user selects the rule that he/she wantsto show and this rule will be displayed on the front of the screen. The other rulesremain displayed but blurred. The selected rule is displayed in red to keep the overallcontext. The user can select rules from the miniature scale too (brushing and linkingtechnique see Chapter 3 Section 3.2.2).
The user can modify the score of a given association rule at any time. Then thelink colour will be modified directly. The user can also delete an association rulefrom the history by giving it the score 0. It will immediately be removed from theinterface.
4.6 Conclusion
In this chapter, we have presented the IUCEAR methodology for interactive visu-alisation of association rules and IUCEARVis an implementation of the IUCEARmethodology.
IUCEAR methodology is designed for the convenience of the user faced with largesets of rules taking into account his/her capacity of information processing. We pro-pose also a new association rule metaphor allowing the visualisation of attributescomposing the association rule. Also, it shows attribute relationships and the contri-bution of each one of them.
IUCEARVis allows rule exploration and the identification of relevant knowledge.The tool is based on an intuitive VR representation that supports the extraction ofsets of rules described by several interestingness measures. This representation high-lights rules interestingness measures and facilitates the re cognition of good qualityrules. IUCEARVis proposes anticipation functions (generalisation and specialisation)to help the user find interesting rules. Many interaction operators allows users toguide navigation among rules.
As shown in Chapter 1 Section 1.5.3, 2D association rule visualisation tools arebased on items and see the rule interestingness measures as ancillary information.On the other hand, a few association rule visualisation tools (Chapter 3 Section3.4.2.3) are proposed in 3D and VR. Those tools propose: either representationsmainly based on rule interestingness measures (Blanchard et al. 2007 [31]), or arepresentation mainly based on items but without highlighting rule interestingnessmeasures (Gotzelmann et al. 2007 [130]). Other proposed methods offer very fewinteraction operators. IUCEARVis is quite different for two mains reasons becauseit proposes (i) representation based on both rule items and interestingness measures,and (ii) many interaction operators based on both rule items and interestingnessmeasures.

156 Interactive Extraction and Exploration of Association Rules
5IUCEARVis Tool Development
Contents
5.1 Introduction . . . . . . . . . . . . . . . . . . . . . . . . . . . . . . . . . 1575.2 Interactive Rule Local Mining With IUCEARVis . . . . . . . . . . . 158
5.2.1 Constraints in IUCEARVis . . . . . . . . . . . . . . . . . . . . . . . . 1595.2.2 Association Rule Extraction in IUCEARVis . . . . . . . . . . . . . . . 159
5.3 Implementation . . . . . . . . . . . . . . . . . . . . . . . . . . . . . . . . 1615.3.1 Virtual Reality Technology . . . . . . . . . . . . . . . . . . . . . . . . 1615.3.2 Tool Architecture . . . . . . . . . . . . . . . . . . . . . . . . . . . . . . 165
5.4 Interaction in IUCEARVis . . . . . . . . . . . . . . . . . . . . . . . . . 1675.4.1 Object Selection and Manipulation . . . . . . . . . . . . . . . . . . . . 1675.4.2 System Control . . . . . . . . . . . . . . . . . . . . . . . . . . . . . . . 170
5.5 Case Study . . . . . . . . . . . . . . . . . . . . . . . . . . . . . . . . . . 1725.6 Conclusion . . . . . . . . . . . . . . . . . . . . . . . . . . . . . . . . . . 178
5.1 Introduction
Merely developing a novel visual metaphor is rarely sufficient to make new discovery.In the association rule extraction process, the decision-maker is overwhelmed by theassociation rule algorithm results. Representing these results as static images limitsthe use of the visualisation. This explains why the user needs to be able to interactwith the association rules representation in order to find relevant knowledge.
Interaction also allows the user to be integrated into the association rule extrac-tion process. The user should be able to manipulate the extraction rule algorithmsand not only the graphical representations. This allows him to focus on interestingknowledge from his point of view, in order to make the association rule methods be
157
158 IUCEARVis Tool Development
more generically useful.
In this chapter we firstly present the IUCEARVis rule extraction module. Thenwe detail its implementation. Rule extraction is an interactive module that generatessets of rules and their interestingness measures at each user demand. Thus no rule isproduced in advance. This local extraction approach follows user exploration. It isconceived to overcome the limitations of exhaustive extraction with which the timetaken may be prohibitive for dense data (Chapter 1 Section 1.5). The local extractionof association rules is carried out by constraint-based algorithms, designed specificallyto extract on demand the sets of rules generated by the anticipation functions.
In this chapter, we are also interested in presenting the implementation of theIUCEARVis tool. The tool is based on virtual reality visualisation and intuitive3D interaction techniques. Firstly, we present the local association rule extractionalgorithms. Then we detail the implementation of IUCEARVis in Section 2. Section 3is devoted to interaction techniques in IUCEARVis. Finally, we present a case study.
5.2 Interactive Rule Local Mining With IUCEARVis
Many algorithms for association rule extraction exist in the literature (see Chapter1 Section 1.4). One of the most popular is the Apriori algorithm. Apriori uses anincremental approach to find all frequent item sets – that have support above the min-imum threshold. Then, it builds all rules that have confidence above the minimumthreshold. The problem with this algorithm is the large amount of generated associa-tion rules which makes their analysis almost impossible. Another approach consists ofsearching for interesting rules locally, in the neighbourhood of rules that the user al-ready knows. Instead of generating all rules by means of an exhaustive algorithm, thenew approach consists of generating locally all candidate rules (syntactically close tothe rule selected by the user), and then checking their support and confidence againstthe transaction database. This local approach follows user navigation and overcomesthe limitations of exhaustive extraction algorithms. The candidate rules are all pos-sible interesting rules. After generation, a pass over the database is performed tocompute rule interestingness measures. In order to be present in the output rulesset, rules must conform with the support and confidence thresholds specified by theuser. This association rule extraction module is interactive and generates sets of as-sociation rules on demand. Local rules extraction is carried out by a constraint-basedalgorithm, specifically designed to extract rule sets at the user’s request.
The IUCEARVis constraint-based algorithms were designed with a quite differentperspective to the constraint-based algorithms presented in Chapter 1, Section 1.4.Whereas the latter is looking to exploit constraint classes as generally as possible,the IUCEARVis algorithm uses only special constraints induced by the anticipationfunctions.

5.2 Interactive Rule Local Mining With IUCEARVis 159
5.2.1 Constraints in IUCEARVis
The constraint-based algorithms use constraints to reduce the search space. InIUCEARVis, there are two types of constraints on rules.
• syntactic constraints: what items can or must appear in the antecedent and theconsequent;
• quality constraints: that specify a minimum threshold for both rule interesting-ness measures of support and confidence.
The syntactic constraints are the most powerful constraints. They allow the searchspace to severely restricted.
5.2.2 Association Rule Extraction in IUCEARVis
The general local algorithm for association rules extraction is presented in Table 5.2.2.
This algorithm is organised into four main steps:
• STEP 1: in this step we use syntactic constraints to construct candidate as-sociation rules. This function enumerates all association rules that satisfy asyntactic constraint only from the items list without having to consult individ-uals in the database. Accordingly, this step does not require any pass over thedatabase;
• STEP 2: the purpose of this step is to calculate the rule interestingness measurevalues. First, we must calculate the cardinality of each itemset – number ofindividuals who check the itemset in the database, of the rules listed in STEP1. For the rule: (Milk, Bread → Eggs), three cardinals itemsets should becalculated, the antecedent cardinal (nmilk,bread), the consequent cardinal (neggs),and the global itemset [antecedent ∪ consequent] (nmilk,bread,eggs). The cardinalsare determined by counting the itemset occurrences in the database. This stepis the most time expensive step. Once the cardinals are determined, the ruleinterestingness measure values can be calculated. The number of transactions inthe database (n) is also necessary to calculate the rule interestingness measures;
• STEP 3: in this step the quality constraints are exploited. The rules arefiltered on the rule interestingness measures relative to the support thresholdand confidence threshold.
• STEP 4: in this step the rules are ranked according to an interestingness mea-sure specified by the user. Default configuration uses the support; otherwise,the last ranking measure chose by the user.

160 IUCEARVis Tool Development
Input: Database D
Association Rule (Reference Rule) RR
Set of candidates Items I
Thresholds (minimum Thresholds of rules interestingness measures)
minSupp and minConf
Ranking interestingness measure RM
Output: Set of couple (AR, M(AR))
when AR is an association rule and M(AR) its interestingness measures SetAR
1. SetAR = ∅
STEP 1: Construction of candidate rules with syntactic constraints
2. forall (Ik in I) do begin
3. AR = construction-rule(Ik, RR)
4. endfor
STEP 2: Calculate the association rule interestingness measure
5. forall (ARk in AR) do begin
6. M(AR) = calculate-interestingnessMeasures(ARk, D)
7. endfor
STEP 3: Eliminate the candidate rules that do not meet
the quality constraints (support threshold and confidence threshold)
8. forall (ARk in AR) do begin
9. SetAR = filters(ARk,M(AR), minSupp,minConf)
10. endfor
STEP 4: Rank the candidate rule set according to the interestingness
measure specified by the user
11. SetAR = Ranking(SetAR,RM)
12. return SetAR
Table 5.1: The local association rule extraction algorithm.
In the following, we give a more detailed description of the local algorithms. Eachalgorithm corresponds to one of the anticipation functions of the IUCEAR method-ology.
The algorithm presented in Table 5.2.2 is used to extract sets of rules defined bythe specialisation anticipation function. This algorithm is used only if there is morethan one item in the antecedent or more than one item in the consequent. Firstly,in line 2, the algorithm enumerates all candidate items Ik. Ik should not belong

5.3 Implementation 161
to the antecedent or to the consequent of the reference rule (line 3). Secondly, thealgorithm creates a new candidate rule by adding the new item to the antecedent ofthe reference rule (PRR ∪ Ik → CRR) (line 4). In lines 5, 6, and 7 the algorithmdetermines the cardinals of the itemsets needed to calculate the rule interestingnessmeasures (support, confidence, and lift). If the new rule interestingness measure val-ues are above the thresholds (line 11), the new rule can be added to the result set(line 12). The rules that do not satisfy the support and the confidence thresholds areeliminated. Thirdly, the algorithm creates a new candidate rule by adding the newitem to the consequent of the reference rule (PRR → CRR ∪ Ik ) (line 13). Thesame treatment will be repeated for this new rule (lines 14 to 18).
If there is only one item in the antecedent or one item in the consequent of thereference rule, a specific specialisation algorithm is used to generate association rules.This algorithm is presented in Table 5.3.
The algorithm presented in Table 5.4 is used to extract sets of rules defined bythe generalisation anticipation function. This step generates a very small numberof association rules. The algorithm involves two important steps. Firstly, for rulesthat the number of items in the antecedent is greater than one item, the algorithmeliminates at each iteration one item. The new candidate rule is of the form: ARi =(PRR Ik → CRR). Then the algorithm calculates this rule interestingness measureand adds it to the rule list if their interestingness measure values satisfy the thresholds.
5.3 Implementation
5.3.1 Virtual Reality Technology
In IUCEARVis, we used OpenGL to generate 3D scenes. OpenGL serves two mainpurposes: (i) it presents a single, uniform interface for different 3D accelerator hard-ware and (ii) it supports the full OpenGL feature set, using software emulation ifnecessary, for all implementations. OpenGL is evolutionary; it allows additionalfunctionality through extensions as new technology is created. Several libraries arebuilt on top of or beside OpenGL to provide features not available in OpenGL itself.Libraries such as GLU can be found with most OpenGL implementations, and otherssuch as GLUT and SDL have grown over time and provide rudimentary cross-platformwindowing and mouse functionality. OpenGL does not load directly the display. Itonly describes 3D objects, initialises OpenGL rendering which is done by the operat-ing system API or by the OpenGL Utility Toolkit, GLUT, which is a window systemindependent toolkit for writing OpenGL programs. It implements a simple window-ing application programming interface (API) for OpenGL. The comparison between2D, 3D and virtual reality approaches realised in Chapter 2, Section 2.4.2 allowingus to believe that only the stereoscopic enables fully and efficiency exploitation of 3Drepresentations.

162 IUCEARVis Tool Development
Input: Database D
Antecedent of the Reference Rule PRR
Consequence of the Reference Rule CRR
Set of candidates Items I
Minimum support Thresholds minSupp
Minimum confidence Thresholds minConf
Ranking interestingness measure RM
Output: a set of couple (AR, M(AR)) when AR is an association rule
and M(AR) its interestingness measures SetAR
1. SetAR = ∅
2. forall (Ik in I) do begin
3. if Ik /∈ PRR and Ik /∈ CRR then
STEP 1
4. ARi = PRR ∪ Ik → CRR
STEP 2
5. calculateCardinal(Ik ∪ PRR,D)
6. calculateCardinal(Ik ∪ CRR,D)
7. calculateCardinal(Ik ∪ CRR ∪ PRR,D)
8. M(ARi, support) = calculateSupport(ARi)
9. M(ARi, confidence) = calculateConfidence(ARi)
10. M(ARi, lift) = calculateLift(ARi)
STEP 3
11. if support(M(ARi)) ≥ minSupp and confidence(M(ARi)) ≥ minConf then
12. SetAR = SetAR ∪ (ARi,M(ARi))
STEP 1
13. ARi+1 = PRR → CRR ∪ Ik
STEP 2
14. M(ARi+1)(support) = calculateSupport(ARi)
15. M(ARi+1) (confidence) = calculateConfidence(ARi+1)
16. M(ARi+1)(lift) = calculateLift(ARi+1)
STEP 3
17. if support(M(ARi+1)) ≥ minSupp and confidence(M(ARi+1)) ≥ minConf then
18. SetAR = SetAR ∪ (ARi+1,M(ARi+1))
19. endfor
STEP 4
20. SetAR = Ranking(SetAR,RM)
21. return SetAR
Table 5.2: The local specialisation anticipation function algorithm.

5.3 Implementation 163
Input: Database D
Antecedent of the Reference Rule PRR
Consequence of the Reference Rule CRR
Set of candidates Items I
Minimum support Threshold minSupp
Minimum confidence Threshold minConf
Ranking interestingness measure RM
Output: a set of couple (AR, M(AR)) when AR is
an association rule and M(AR) its interestingness measures SetAR
1. SetAR = ∅
2. calculateCardinal(PRR,D)
3. calculateCardinal(CRR,D)
4. if | PRR | = 1 do begin
5. forall (Ik in I) do begin
6. if (Ik) /∈ PRR and (Ik) /∈ CRR do begin
STEP 1
7. ARi = Ik → CRR
STEP 2
8. calculateCardinal(Ik ,D)
9. M(ARi, support) = calculateSupport(ARi)
10. M(ARi, confidence) = calculateConfidence(ARi)
11. M(ARi, lift) = calculateLift(ARi)
STEP 3
12. if support(M(ARi)) ≥ minSupp and confidence(M(ARi)) ≥ minConf then
13. SetAR = SetAR ∪ (ARi,M(ARi))
14. endfor
15. if |CPR| = 1 do begin
16. forall (Ik in I) do begin
17. if (Ik) /∈ PRR and (Ik) /∈ CRR do begin
STEP 1
18. ARi = PRR → IkSTEP 2
19. calculateCardinal(Ik ,D)
20. M(ARi, support) = calculateSupport(ARi)
21. M(ARi, confidence) = calculateConfidence(ARi)
22. M(ARi, lift) = calculateLift(ARi)
STEP 3
23. if support(M(ARi)) ≥ minSupp and confidence(M(ARi)) ≥ minConf then
24. SetAR = SetAR ∪ (ARi,M(ARi))
25. endfor
STEP 4
26. SetAR = Ranking(SetAR,RM)
27. return SetAR
Table 5.3: The modified local specialisation anticipation function algorithm.
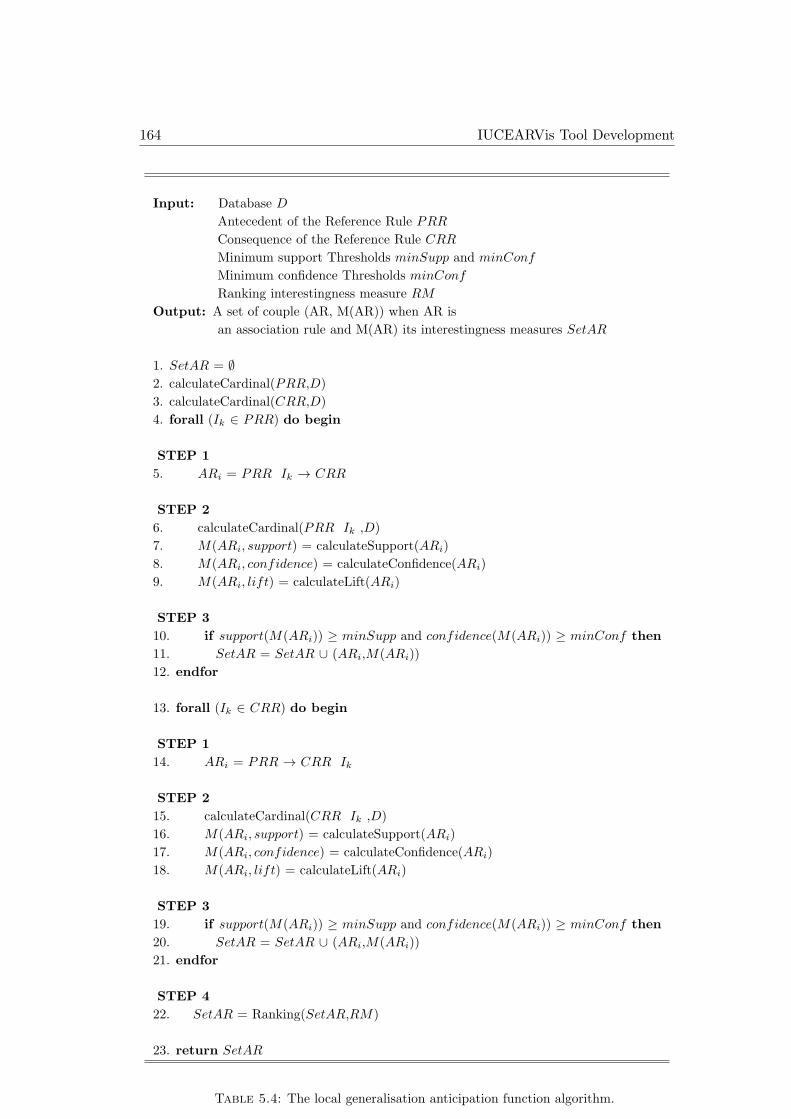
164 IUCEARVis Tool Development
Input: Database D
Antecedent of the Reference Rule PRR
Consequence of the Reference Rule CRR
Minimum support Thresholds minSupp and minConf
Minimum confidence Thresholds minConf
Ranking interestingness measure RM
Output: A set of couple (AR, M(AR)) when AR is
an association rule and M(AR) its interestingness measures SetAR
1. SetAR = ∅
2. calculateCardinal(PRR,D)
3. calculateCardinal(CRR,D)
4. forall (Ik ∈ PRR) do begin
STEP 1
5. ARi = PRR Ik → CRR
STEP 2
6. calculateCardinal(PRR Ik ,D)
7. M(ARi, support) = calculateSupport(ARi)
8. M(ARi, confidence) = calculateConfidence(ARi)
9. M(ARi, lift) = calculateLift(ARi)
STEP 3
10. if support(M(ARi)) ≥ minSupp and confidence(M(ARi)) ≥ minConf then
11. SetAR = SetAR ∪ (ARi,M(ARi))
12. endfor
13. forall (Ik ∈ CRR) do begin
STEP 1
14. ARi = PRR → CRR Ik
STEP 2
15. calculateCardinal(CRR Ik ,D)
16. M(ARi, support) = calculateSupport(ARi)
17. M(ARi, confidence) = calculateConfidence(ARi)
18. M(ARi, lift) = calculateLift(ARi)
STEP 3
19. if support(M(ARi)) ≥ minSupp and confidence(M(ARi)) ≥ minConf then
20. SetAR = SetAR ∪ (ARi,M(ARi))
21. endfor
STEP 4
22. SetAR = Ranking(SetAR,RM)
23. return SetAR
Table 5.4: The local generalisation anticipation function algorithm.

5.3 Implementation 165
5.3.2 Tool Architecture
The IUCEARVis tool proposes to implement the IUCEAR methodology introducedin Chapter 4 Section 4.3. For this purpose, we elaborated a modular and evolvingarchitecture that we designed as shown in Figure 5.1.
Figure 5.1: General architecture of the IUCEARVis tool.
The tool is organised in 3 important parts:
• the data server is the PostgreSQL management system of relational databases;
• the iterative process of local association rules generation;
• visualisation and interaction (OpenGL).
The process of local association rule generation supports rule extraction. It imple-ments a constraint-based algorithm adapted to the different functions of the module(anticipation functions, filtering functions, etc.). This module is interactive and pro-duces subsets of rules on user request. No rules are produced in advance.
Visualisation and interaction is an interactive process that generates the repre-sentation as the user navigates. Scenes generation does not require database accessand therefore is low in time consumption. Interactivity is the heart of the IUCEARmethodology. In the association rules field, it is uncommon to find interestingnessknowledge in only one search. Thus, an important contribution of our work is to pro-pose an interactive approach. The objective of the interactive process (Figure 5.2) isto help the user find interesting association rules by taking into account user actions.The interactivity also allows the user to come back to his/her actions to finally findinteresting knowledge.
Firstly, the interactivity of our approach comes from the process itself that isdesigned to leave the user the liberty to choose the best action to undertake. Then,

166 IUCEARVis Tool Development
interaction with the different items/association rules representations increases thedegree of user interactivity, giving him/her more flexibility to navigate into the rep-resentation. Several steps are suggested as follows:
Figure 5.2: Interactive process description of IUCEARVis.
1. Visualising Items : this first step consists in the development of user expecta-tions. The user choose which items can be interesting and then, should be inan interesting association rule. All the database items are available to the userby means of a pick-list.
2. Ordering Items : the ordering operators help the user to choose items. Theuse of operators increases the level of the tool interactivity. It is the user whochooses which operator he/she wants to apply.
3. Selection Items : in this step, the user chooses which items belong to the an-tecedent and which items belong to the consequent.
4. Applying anticipation functions : the second step consists of using the items se-lected by the user to propose a new association rule set which can be interestingto the user.
5. Ranking Rules: many ranking operators can be used to rank the associationrules proposed by the anticipation functions. It is the user who chooses whichoperator to be applied over the association rule set. Letting the user choosewhich operators will be applied represents an important point in user interac-tivity. Choosing the operator is choosing what association rules set is visualisedfirst.

5.4 Interaction in IUCEARVis 167
6. Filters: this phase proposes two filters to be applied over the ranked associationrules. These filters can be applied whenever the user needs them.
7. Visualising Rules : visualisation is the most important step. It is through visu-alisation that the user can see the result of his/her actions. An important setof interestingness measures can be visualised to help the user chooses which isthe most appropriate decision to take.
8. Selection: in this final step, the user chooses a new association rule amongthe visualised rules set. Then, he/she returns in step 4 in order to apply ananticipation function over the new selected association rule.
9. Validation: the user evaluates subjectively the set of rules. In this step, the usercan validate an association rule (add to history) or revise his/her information(item selection) and restart the research.
10. Visualising History : this step proposes to the user to visualise rules that he/shejudges interesting. He/she can delete the rules whenever he/she wants.
5.4 Interaction in IUCEARVis
As we have seen in Chapter 2, VR applications use interaction devices, metaphorsand sensory interfaces, to offer the user the ability to interact with virtual entities pre-sented in a virtual context. These interactions are based on usage scenarios (softwarelayer) and interfaces. They allow navigation, selection and manipulation of virtualobjects, and application control. Virtual reality techniques are relatively little used inthe field of VDM and in particular for association rules visualisation (see Chapter 3).We propose two VR interaction techniques. The first involves bimanual interaction(Figure 5.3) and the second evolves single-handed interaction. In the bimanual inter-action, the user uses his dominant hand to select objects in the scene. Both handsare used for objects manipulation (rotation) and translation of the virtual camera(zoom-in and zoom-out). The presence of the user’s hands is detected by a motioncapture system based on infrared cameras. Reflective stickers are attached to theuser’s hand.
These two techniques have been implemented at the (1/2, 1, 0) Point of theAIP cube (Chapter 2, Section 2.2): solutions (association rules) are generated semi-automatically through local association rule generating algorithms; solutions are pre-sented in a virtual context, and objects have no autonomy (they are manipulated bythe user).
5.4.1 Object Selection and Manipulation
The user uses his/her dominant hand for selection, the non-dominant hand is used toactivate selection. When the two user’s hands are detected, movement of both handscan change the virtual camera coordinates for rotation (rotate the object relative toits pivot point) and so visualise the object from different points of view. When the

168 IUCEARVis Tool Development
Figure 5.3: Bimanual interaction.
user moves his/her hands, he/she makes rotation of the virtual camera: (left andright). When the user moves away his/her hands from each other, he/she performsright rotation. Otherwise, it performs left rotation. In the second interaction tech-nique, the user operates an interaction device: WiimoteTM or a classic mouse. He/sheperforms the same tasks described previously (selection, rotation) and translation ofthe virtual camera (zoom-in and zoom-out). The only difference is that the user needto click on a button of the mousse or the WiimoteTM to select an object or to activatethe camera movement.
Figure 5.4 illustrates the different possibilities of user actions on the camera.These actions are:
• increase or decrease of the distance between the camera and the object;
• specify the angle of view of the virtual camera.
The automaton of the camera movement (Figure 5.5) is composed of the followingstates:
• R : the camera moves away from the object;
• I : the camera returns to the initial configuration;
• C : the camera approaches the object.

5.4 Interaction in IUCEARVis 169
������
������A
B��ACD���A
B�E�F�E��F�
B�E�F�ED���
�A�����
�������F���A�
������A�CC
�A�����
Figure 5.4: Illustration of the different possibilities of camera controlled movements.
State changes are triggered via button (mouse button or wiimoteTM button) andmodelled by the following logical variables:
• TR : triggering the remoteness of the camera;
• TC : triggering the approach of the camera.
Figure 5.5: Automation governing the distance camera - object.
The automation of the camera rotation (Figure 5.6) is composed of the followingstates :
• L : the camera moves in the counterclockwise direction (left);
• U : the camera moves up;

170 IUCEARVis Tool Development
• I : the camera returns to the initial configuration;
• R : the camera moves in the clockwise direction (right);
• D : the camera moves down.
The camera is always oriented towards the object. The camera movement isproportional to the offset(∆X or ∆Y) between the position of the mouse at a givenmoment t and the position of the mouse at the instant of activation of the button ofrotation in the one-hand configuration or the distance between the two user handsat a given moment t and the distance between the two user hands at the moment ofdetection of the second hand in the bimanual configuration. State changes, related tothe camera’s lateral movement, are triggered by activating the mouse (or WiimoteTM )left button and its movement or by the detection of the two user hands.
Logical variables used for modelling are:
• ML : the offset of the cursor to the left;
• MR : the offset of the cursor to the right;
• MU : the offset of the cursor to up;
• MD : the offset of the cursor to down;
• MB : activation of rotation (mousse/WiimoteTM left button or the modificationof the distance between the user’s two hands).
At the deactivation of the rotation (deactivation of the mouse/WiimoteTM leftbutton or the detection of only one user hand), the current state becomes the camera’sinitial state.
5.4.2 System Control
IUCEARVis proposes many interactive operations, such as changing a constraint,moving from one interface to an other,etc. It appears that the use of a system controlis increasingly important as the complexity of the application increases– in terms ofthe number of operations. While it is entirely possible to be satisfied with a rudimen-tary or nonexistent interface when the only possible action is to move and rotate avirtual object, it is quite different when the interaction possibilities increase. On theone hand, it is necessary to allow the user to activate them, but, in the other hand, itis also preferable that it can be done easily and efficiently. The role of system controlis to offer opportunities, but also and above is to provide efficiency and sensibility.For this purpose, we propose to represent all the controls as buttons. This solutionis intuitive and easy to use; the user just has to click on a button to activate a control.
The schema relative to the activation of different features of interaction with theextraction association rule algorithm is shown in Figure 5.7. To facilitate schemaunderstanding we have added a different interfaces with which the user interacts.The schema is composed of the following states:
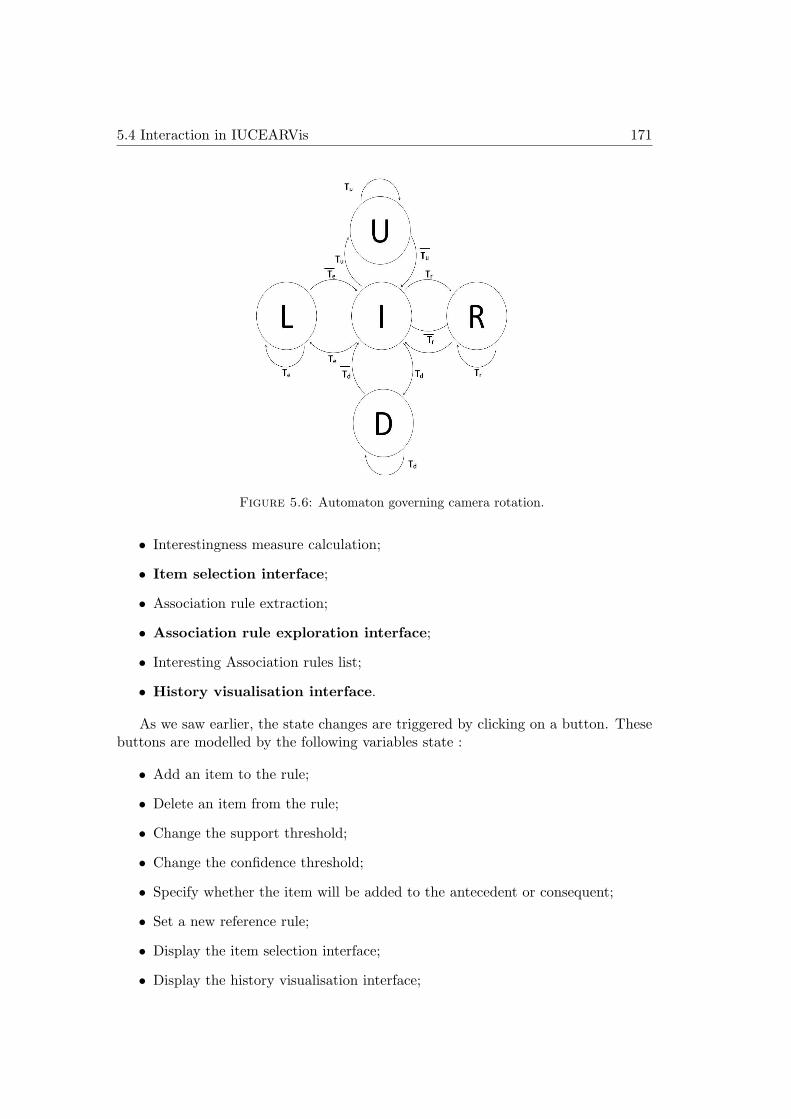
5.4 Interaction in IUCEARVis 171
Figure 5.6: Automaton governing camera rotation.
• Interestingness measure calculation;
• Item selection interface;
• Association rule extraction;
• Association rule exploration interface;
• Interesting Association rules list;
• History visualisation interface.
As we saw earlier, the state changes are triggered by clicking on a button. Thesebuttons are modelled by the following variables state :
• Add an item to the rule;
• Delete an item from the rule;
• Change the support threshold;
• Change the confidence threshold;
• Specify whether the item will be added to the antecedent or consequent;
• Set a new reference rule;
• Display the item selection interface;
• Display the history visualisation interface;

172 IUCEARVis Tool Development
• Modification the reference rule;
• Add an association rule to the history list;
• Modify the association rule exploration interface.
Figure 5.7: Illustration of the interaction possibilities with the extraction algorithms.
5.5 Case Study
This study is based on psychological profile database, provided by PerformanSe SA.This company designs software for human resource management decision supportdedicated to behavioural evaluation and motivation in the workplace. The profiledatabase contains the profiles of 4065 persons (reference population of French adults).The profiles are described by ten behavioural traits (Table 5.5). Each behaviouraltrait is encoded by a qualitative variable with three modalities coded as {+, 0, -}:strongly affirmed, moderately affirmed, and weakly affirmed.
We are interested in rigorous people. We begin by studying behavioural traitsinvolved by searching for independence (AFL = -) and strictness (CON = +). Firstly,we discovered that these criteria are not very common in the data by means of theitem selection interface (Figure 5.8). Then, we realised that it is a low quality rule
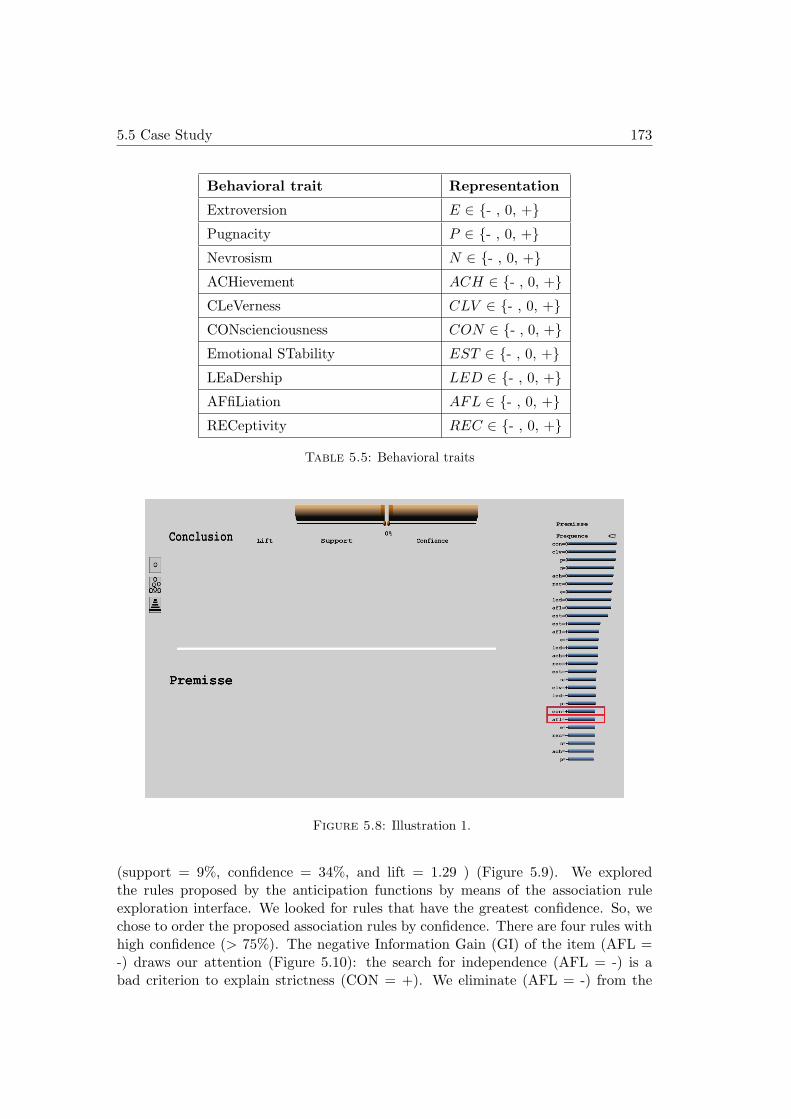
5.5 Case Study 173
Behavioral trait Representation
Extroversion E ∈ {- , 0, +}
Pugnacity P ∈ {- , 0, +}
Nevrosism N ∈ {- , 0, +}
ACHievement ACH ∈ {- , 0, +}
CLeVerness CLV ∈ {- , 0, +}
CONscienciousness CON ∈ {- , 0, +}
Emotional STability EST ∈ {- , 0, +}
LEaDership LED ∈ {- , 0, +}
AFfiLiation AFL ∈ {- , 0, +}
RECeptivity REC ∈ {- , 0, +}
Table 5.5: Behavioral traits
Figure 5.8: Illustration 1.
(support = 9%, confidence = 34%, and lift = 1.29 ) (Figure 5.9). We exploredthe rules proposed by the anticipation functions by means of the association ruleexploration interface. We looked for rules that have the greatest confidence. So, wechose to order the proposed association rules by confidence. There are four rules withhigh confidence (> 75%). The negative Information Gain (GI) of the item (AFL =-) draws our attention (Figure 5.10): the search for independence (AFL = -) is abad criterion to explain strictness (CON = +). We eliminate (AFL = -) from the

174 IUCEARVis Tool Development
Figure 5.9: Illustration 2.
Figure 5.10: Illustration 3.
reference rule and choose to add (LED = -): motivation for protection. The systemproposes 102 rules. The 10 first rules are all good rules (72% ≤confidence ≤ 95%, 2%≤support ≤ 12% and lift ≥ 2.7) (Figure 5.11).
One of the best rules is: (CLV = - , LED = - → CON = + ;confidence = 92% ,support= 12%, lift = 3.35) which means that lack of cleverness and seeking protectionare good predictors of strictness (Figure 5.12). This is quite a good rule, but we want

5.5 Case Study 175
Figure 5.11: Illustration 4.
Figure 5.12: Illustration 5.
to verify whether other characteristics could better predict strictness. To do so, weselect (CLV = - , LED = - → CON = +) as a new reference rule. The new rulesset contains 68 rules. Two rules catch our attention: (CLV = - , LED = -, E = - →CON = +; confidence = 96% , support= 10%, lift = 3.60) and ( CLV = - , LED =-, ACH = + → CON = +; confidence = 96% , support= 7%, lift = 3.61). It is theonly rules that does not contain items with negative Information Gain (Figure 5.13).

176 IUCEARVis Tool Development
Achievement and introversion are good predictors for strictness. We add these rules
Figure 5.13: Illustration 6.
to the list of interesting rules (visualised by the history interface). We select the rule(CLV = - , LED = -, E = - → CON = +) as a new reference rule to verify if othercharacteristics could predict strictness. We look for rules that maximise the threerule interestingness measures. Thus, we classify rules with the aggregate measure.The metaphor (distance between the antecedent and the consequence) allows us todistinguish the rules with good confidence (Figure 5.14). Several new items appear.They are little correlated with items (CLV = - , LED = -, E = -). These items are(ACH = + , N = +, EST = -). The items (N = +) and ( EST = -) appear alsoin the consequent of two rules that have good interestingness measures: (CLV = - ,LED = -, E = - → CON = + , EST = -) and (CLV = - , LED = -, E = -→ CON =+ , N = +). We can conclude that lack of cleverness, motivation for protection andintroversion can explain both strictness and questioning and strictness and anxiety.To verify other criteria verified by lack of cleverness, motivation for protection andintroversion (CLV = - , LED = -, E = -) we applied the filter same antecedent tothe rule (CLV = - , LED = -, E = - → CON = +). No rule has an equal or higherquality than the reference rule (Figure 5.15).
Finally, we found five interesting rules :
1. ( CLV = - , LED = -) → ( CON = + ) ( confidence = 92% , support= 12%,lift = 3.35)
2. ( CLV = - , LED = -, E = -) → ( CON = + ) ( confidence = 96% , support=10%, lift = 3.60)
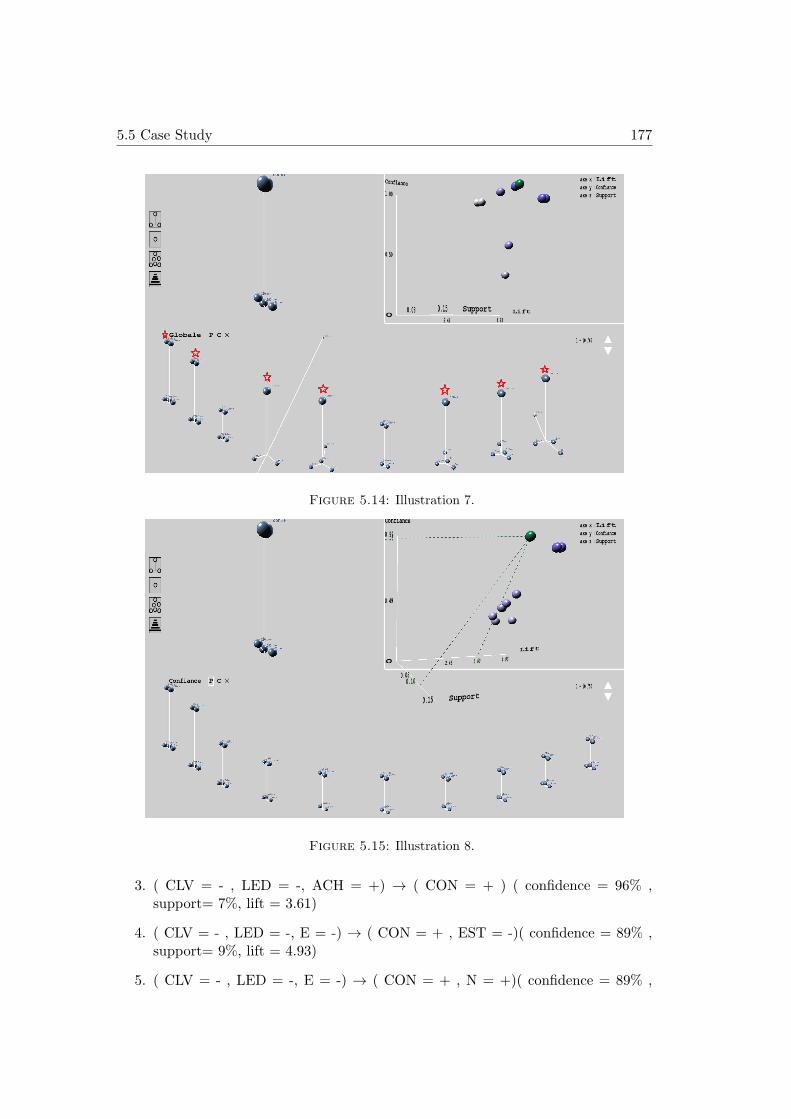
5.5 Case Study 177
Figure 5.14: Illustration 7.
Figure 5.15: Illustration 8.
3. ( CLV = - , LED = -, ACH = +) → ( CON = + ) ( confidence = 96% ,support= 7%, lift = 3.61)
4. ( CLV = - , LED = -, E = -) → ( CON = + , EST = -)( confidence = 89% ,support= 9%, lift = 4.93)
5. ( CLV = - , LED = -, E = -) → ( CON = + , N = +)( confidence = 89% ,
178 IUCEARVis Tool Development
support= 9%, lift = 4.98)
5.6 Conclusion
This Chapter was consecrated to the implementation of the IUCEARVis tool. IUCEARVisallows user (s) to interactively generate, explore, and validate the whole set of asso-ciation rules by means of an iterative process.
Firstly, we have mainly detailed the algorithms used for rule generation. Weadapted the extraction of rules to the rule post-processing interactive character ofthe IUCEAR methodology. For that purpose, we developed specific algorithms forlocal association rule extraction. These algorithms generate rules based on a referencerule constructed by the user. They exploit constraints engendered by the anticipa-tion functions and are specifically optimised for these constraints. With the syntacticconstraints, the space research is drastically reduced; the algorithms are polynomialdepending on the number of items. This local approach gives the possibility to over-come the limits of the exhaustive algorithms, for instance the Apriori algorithm,mainly the number of generating rules can be very large. In particular, even veryspecific rules can be extracted with local algorithms.
Then, we detailed how the modules which compose the tool were implemented.We discussed the choices that we made during development, in particular concerningsoftware technology.
Regarding interaction techniques, we considered two approaches for the selectionand manipulation of virtual objects. The first technique evolves bimanual interactionand the second evolves single-handed interaction. In the first technique, the presenceof the user’s hands is detected by a motion capture system based on infrared cameras.In the second one, the user operates an interaction device: WiimoteTM or a classicmouse.
Testing IUCEARVis on real data shows that the tool helps discover interestingrules of good quality, and in particular the locally dominant rules (the best rules inthe explored region).

Conclusion and Perspectives
This thesis is concerned with the merging of two active research domains: KnowledgeDiscovery in Databases (KDD), and more precisely the Association Rule Mining andVirtual Reality techniques.
Data mining algorithms generate association rules in large quantities so that theuser can not generally use them directly. To identify interesting useful knowledge, it isnecessary in the output of the data mining algorithms to carry out a post-processingof association rules, consisting of a second search operation. Although data mining isdone automatically by combinatorial algorithms, finding interesting rules is done bythe user. This is a tedious task in practice.
Contributions
The contributions of this thesis can be summarised as follows:
• we propose a new classification for VDM techniques based on both 3D repre-sentations and interaction techniques;
• we propose a new metaphor for association rule representation;
• we establish a methodology for interactive visualisation of association rules;
• we develop specific algorithms for local extraction of association rules;
• we create a tool for the interactive visualisation of association rules in virtualenvironments.
Classification for VDM techniques based on both 3D representations andinteraction techniques
We present a new classification of VDM tools based on 3 dimensions: visual rep-resentations, interaction techniques, and KDD tasks. The proposed taxonomy takesinto account both visual representation and interaction techniques in the context ofdata mining applications. Existing metaphors for visualisation and interaction can beclassified under the new system, enabling designers to more easily compare metaphorsto see exactly how they are different and similar to each other.
179

180 Conclusion and Perspectives
This classification looks at some representative tools for performing different KDDtasks, e.g., pre-processing and post-processing (classification, clustering and associa-tion rules). Different tables summarise the main characteristics of the reported VDMtools with regard to visual representations and interaction techniques. Other relevantinformation such as interaction actions (navigation, selection and manipulation, andsystem control), input-output devices (CAVEs, mice, hand trackers, etc.) presenta-tion (3D representation or VR representation) and year of creation is also reported.
New metaphor for association rule representation
We propose a new visualisation metaphor for association rules. This new metaphorrepresents attributes which make up the antecedent and the consequent, the contribu-tion of each one to the rule, and the correlations between each pair of the antecedentand each pair of the consequent.
In this context, we developed 3D visual representations to overcome some lim-itations of 2D representations. This new metaphor is based on the principles ofinformation visualisation for effective visual representation [24]. The association rulehas a molecular representation based on a Node-Link Algorithm which is used tocalculate item positions in the 3D space. A validation study was carried out for theevaluation of four different representations of association rules with different inter-action techniques and visualisation interfaces. Although this test requires deepeningfurther work, we have shown that this metaphor allows the discovery of interestingrelationships among items that are not visible with the other metaphors.
Methodology for interactive visualisation of association rules: IUCARE
We developed an interactive visualisation methodology for association rules, namedInteractive User-Centred Association Rules Exploration (IUCARE). It is designed toassist the user when facing large sets of rules taking into account his/her capacity toprocess information. This user-centred methodology can really assist the user whensearching for interesting knowledge in a rules set by combining the three main ap-proaches that are traditionally offered to facilitate the rules post-processing: rulesinterestingness measure, interactivity, and visualisation. The user selects interestingknowledge and the system proposes sets of rules based on this knowledge. Then, theuser can navigate in this rules set using interactive visualisation of rules and theirinterestingness measures. Thus, the user directs a series of local visual explorationsbased on his/her interest for the rules. The user does not deal with a large set of rules,but he/she explores it subset by subset. This approach is based on the cognitive prin-ciples of Montgomery [200]. Based on this principle, we developed the anticipationfunctions. These functions allow for the extraction of small subsets of rules basedon items selected by the user. The items selected by the user can be changed atany time during the navigation. These functions provide genuine originality to our

181
methodology. Another original facet of the IUCARE methodology, is the possibilityto note the interesting association rules and visualise them on a dedicated interface.This interface gives the user the ability to quickly find, view, and compare the rulesthat he/she considered interesting during his/her previous explorations.
Algorithms for local association rules extraction
We propose adopting the rule extraction from the interactive nature of rules post-processing. For this purpose we developed specific algorithms for local associationrules extraction. They are constraints-based algorithms that extract only the rulesets that the user wishes to view in his/her exploration. Thus, the user operates roleof a heuristically integrated within the process of association rules extraction. Theuse of powerful constraints provides the extraction of very few rules compared to theexhaustive algorithms. In addition, even the very specific rules (regarding a verysmall portion of the data) can be extracted with the local extraction algorithms.
The interactive visualisation tool IUCAREVis
We develop an interactive tool for association rules visualisation in virtual real-ity: IUCAREVis. This tool implements the three approaches described above: newmetaphor for association rule representation, IUCARE methodology, and algorithmsfor local association rules extraction. IUCAREVis is based on a virtual reality visu-alisation and intuitive interaction. This representation enhances rules interestingnessmeasures and therefore facilitates the recognition of the most suitable rules. IU-CAREVis incorporates two interaction techniques: bi-manual techniques and a one-hand interaction technique. These interactions allow the user to navigate among thesets of rules.
Perspectives
Development of constraint-based algorithms with memory
A higher performance strategy for local rules extraction can be achieved. Saving in-termediate results will avoid the generation of the same association rule several times.Extraction with memory is an intermediate solution between exhaustive extraction(full memory) and constraint-based extraction (without memory). This solution willdecrease the algorithms execution time.
IUCAREVis validation
The tool can be tested by an expert with the same or other data. This would confirm

182 Conclusion and Perspectives
our hypothesis with an expert in rule validation. It will allows us to envisage new in-teractions, anticipation functions, filters, etc, based on expert advice or by analysingthe exploration history of IUCAREVis. Then, it is possible to validate the interactionand visualisation interfaces proposed in IUCAREVis as we did for the validation ofassociation rule metaphors. An experimental protocol may consist of asking severaluser groups using different configurations of IUCAREVis (monoscopic/stereoscopicvisualisation, tracking / Wiimote interaction devices, etc) to perform the same ex-ploration tasks on the same data. This experiment can be used also to compareIUCAREVis tool to other association rules exploration tools. Such experiment wouldallow us to compare the accuracy and the speed of the user responses.
The use of ontologies
Rules exploration can be improved by incorporating the possibility of using one ormore item hierarchies. This allows the user to specialise or to generalise the rulesnot only by adding or removing items, but also by going down or up the items inthe hierarchy. This approach could be generalised by allowing the introduction ofexternal knowledge, such as ontology of the subject field, information to explain thedata, or even user annotation. Such associations between knowledge extracted fromthe data and external knowledge is ambitious, but we think it would facilitate theappropriation of knowledge by the user.
A 3D marking menu
The application control can be facilitate with the use of a 3D marking menu. Onthe one hand, the use of a menu displayed on the user request allows to free theview; all the commands will be eliminated from the displayed interface and will bedisplayed only if the user needs to use them. On the other hand, a 3D marking menucan be more ergonomic, more aesthetic, and easier to use. A marking menu can beused without a visual feedback of the graphical menu (user memorise the gesturesnecessary for the activation of a given command), than the user is able to activate acommand without taking his eyes or attention from the main task. The menu can bemanipulated by the user non-dominant hand, thus remains the dominant hand freefor the main tasks of objects selection and manipulation.
A collaborative work system
The association rules mining is preferably performed by different background ex-perts such as databases, marketing, statistics, machine learning, etc. Very few peopleare expert in all these domains. So it is not uncommon that multiple expert shouldwork together on the same mining process. To work together all the experts should

183
be present in the same location. The development of a VE for collaborative associa-tion rules mining in which each expert is represented by an avatar allows experts tocollaborate without necessarily be present in the same place. Each expert should beable to identify the other experts actions.

184 Conclusion and Perspectives

References 185
References
[1] www.palantirtech.com.
[2] Rakesh Agrawal, Tomasz Imielinski, and Arun Swami. Mining association rulesbetween sets of items in large databases. In Proceedings of the 1993 ACMSIGMOD international conference on Management of data, pages 207 – 216,1993.
[3] Rakesh Agrawal and Ramakrishnan Srikant. Fast algorithms for mining associ-ation rules. In Proceedings of the 20th International Conference on Very LargeData Bases, VLDB ’94, 1994.
[4] Adel Ahmed, Tim Dwyer, Michael Forster, Xiaoyan Fu, Joshua Ho, Seok-Hee Hong, Dirk Koschtzki, Colin Murray, Nikola S. Nikolov, RonnieTaiband Alexandre Tarassov, and Kai Xu. Geomi: Geometry for maximuminsight. Graph Drawing, 3843:468–479, 2006.
[5] Adel Ahmed and Peter Eades. Automatic camera path generation for graphnavigation in 3d. In Proceedings of the 2005 Asia-Pacific symposium on Infor-mation visualisation (APVis ’05), pages 27–32. Australian Computer Society,Inc., 2005.
[6] Y. Aitsiselmi and N. S. Holliman. Using mental rotation to evaluate the benefitsof stereoscopic displays. Stereoscopic Displays and Applications, 7237, 2009.
[7] Robert Amar, James Eagan, and John Stasko. Low-level components of analyticactivity in information visualization. In Proceedings of the Proceedings of the2005 IEEE Symposium on Information Visualization, pages 15–, Washington,DC, USA, 2005. IEEE Computer Society.
[8] Ayman Ammoura, Osmar R. Zaıane, and Yuan Ji. Immersed visual data min-ing: Walking the walk. In Proceedings of the 18th British National Conferenceon Databases (BNCOD’01), pages 202–218. Springer-Verlag, 2001.
[9] Carlos Andujar, Marta Fairen, and Ferran Argelaguet. A cost-effective approachfor developing application-control guis for virtual environments. In Proceedingsof the 3D User Interfaces, 3DUI ’06, pages 45–52, Washington, DC, USA, 2006.IEEE Computer Society.
[10] Mihael Ankerst. Visual Data Mining. PhD thesis, Institute for ComputerScience Database and Information Systems, University of Munich, 2001.
[11] Laura Lynn Arns and Carolina c. A new taxonomy for locomotion in virtualenvironments. In Proceedings second Virtual Reality International Conference,VRIC’02. Iowa State University, 2000.
[12] Mafruz Zaman Ashrafi, David Taniar, and Kate Smith. Redundant associationrules reduction techniques. Advances in Artificial Intelligence, pages 254–263,2005.

186 References
[13] Daniel Asimov. The grand tour: a tool for viewing multidimensional data.SIAM journal on scientific and statistical computing, 6(1):128–143, 1985.
[14] H. Azzag, F. Picarougne, C. Guinot, and G. Venturini. Vrminer: a tool for mul-timedia databases mining with virtual reality. In J. Darmont and O. Boussaid,editors, Processing and Managing Complex Data for Decision Support, pages318–339, 2005.
[15] B. Baesens, S. Viaene, and J. Vanthienen. Post-processing of association rules.In Workshop on Post-Processing in Machine Learning and Data Mining: In-terpretation, visualization, integration, and related topics with in Sixth ACMSIGKDD Int. Conf. on Knowledge Discovery and Data Mining, pages 20–23,2000.
[16] J.P. Barthlemy. A model of selection by aspects. Acta Psychologica, 79(1):119,1992.
[17] Sebastian Baumgartner, Achim Ebert, Matthias Deller, and Stefan Agne. 2dmeets 3d: a human-centered interface for visual data exploration. In Extendedabstracts on Human factors in computing systems, CHI ’07, pages 2273–2278.ACM, 2007.
[18] Jr. Bayardo and Roberto J. Efficiently mining long patterns from databases.ACM SIGMOD Record, 27:85–93, June 1998.
[19] Roberto J. Bayardo, Jr. and Rakesh Agrawal. Mining the most interestingrules. In Proceedings of the fifth ACM SIGKDD international conference onKnowledge discovery and data mining, KDD ’99, pages 145–154. ACM, 1999.
[20] Russell Beale. Supporting serendipity: Using ambient intelligence to augmentuser exploration for data mining and web browsing. International Journal ofHuman-Computer Studies, 65(5):421–433, 2007.
[21] B.G. Becker. Volume rendering for relational data. In Proceedings of the IEEESymposium on Information Visualization (InfoVis ’97), pages 87–91, 1997.
[22] Steffi Beckhaus, Kristopher J. Blom, and Matthias Haringer. Intuitive, hands-free travel interfaces for virtual environments. In IEEE Workshop in new di-rections in 3D user interfaces, pages 57–60, 2005.
[23] C. Beilken and M Spenke. Interactive data mining with infozoom –the medicaldata set. In Workshop Notes on Discovery Challenge, PKDD, pages 49–54,1999.
[24] Jacques Bertin. Semiology of Graphics: Diagrams, Networks, Maps. Universityof Wisconsin Press, 1967.
[25] Inderpal Bhandari. Attribute focusing: machine-assisted knowledge discov-ery applied to software production process control. Knowledge Acquisition,6(3):271294, 1994.
References 187
[26] Mark Billinghurst, Sisinio Baldis, Lydia Matheson, and Mark Philips. 3dpalette: a virtual reality content creation tool. In Proceedings of the ACMsymposium on Virtual reality software and technology, pages 155–156, 1997.
[27] Mark Billinghurst, Hirkazu Kato, and Ivan Poupyrev. The magic-book—moving seamlessly between reality and virtuality. IEEE ComputerGraphics and Applications, 21(3):6–8, May 2001.
[28] Julien Blanchard, Fabrice Guillet, and Henri Briand. Exploratory visualizationfor association rule rummaging. In Workshop on Multimedia Data Mining,MDM-03, pages 107–114, 2003.
[29] Julien Blanchard, Fabrice Guillet, and Henri Briand. Interactive visual ex-ploration of association rules with rule-focusing methodology. Knowledge andInformation Systems, 13(1):43–75, 2007.
[30] Julien Blanchard, Fabrice Guillet, and Pascale Kuntz. Post-Mining of Associa-tion Rules: Techniques for Effective Knowledge Extraction, chapter Semantics-Based Classification of Rule Interestingness Measures, pages 56–79. 2009.
[31] Julien Blanchard, Bruno Pinaud, Pascale Kuntz, and Fabrice Guillet. A 2d-3d visualization support for human-centered rule mining. In Computers &Graphics, 2007.
[32] Richard A. Bolt. Put-that-there: Voice and gesture at the graphics interface.SIGGRAPH Computer Graphics, 14:262–270, 1980.
[33] Francesco Bonchi, Fosca Giannotti, Claudio Lucchese, Salvatore Orlando, Raf-faele Perego, and Roberto Trasarti. On interactive pattern mining from rela-tional databases. In Proceedings of the 5th international conference on Knowl-edge discovery in inductive databases, KDID’06, pages 42–62. Springer-Verlag,2007.
[34] Francesco Bonchi, Fosca Giannotti, Claudio Lucchese, Salvatore Orlando, Raf-faele Perego, and Roberto Trasarti. A constraint-based querying system forexploratory pattern discovery. Information Systems, 34:3–27, March 2009.
[35] Laroussi Bouguila, Florian Evequoz, Michele Courant, and Beat Hirsbrunner.Walking-pad: a step-in-place locomotion interface for virtual environments. InProceedings of the 6th international conference on Multimodal interfaces, ICMI’04, pages 77–81, New York, NY, USA, 2004. ACM.
[36] D. A. Bowman, C. A. Wingrave, J. M. Campbell, V. Q. Ly, and C. J. Rho-ton. Novel uses of pinch gloves for virtual environment interaction techniques.Virtual Reality, 6(3):122–129, 2001.
[37] Doug A. Bowman, Jian Chen, Chadwick A. Wingrave, John Lucas, AndrewRay, Nicholas F. Polys, Qing Li, Yonca Haciahmetoglu, Ji-Sun Kim, SeonhoKim, Robert Boehringer, and Tao Ni. New directions in 3d user interfaces. TheInternational Journal of Virtual Reality, 6(2):3–14, 2006.

188 References
[38] Doug A. Bowman and Bernd Frohlich. New directions in 3d user interfaces.In Proceedings of the 2005 IEEE Conference 2005 on Virtual Reality, VR ’05,pages 312–, Washington, DC, USA, 2005. IEEE Computer Society.
[39] Doug A. Bowman and Larry F. Hodges. Formalizing the design, evaluation,and application of interaction techniques for immersive virtual environments.Journal of Visual Languages & Computing, 10(1):3753, 1999.
[40] Doug A. Bowman, David Koller, and Larry F. Hodges. Travel in immersivevirtual environments: An evaluation of viewpoint motion control techniques.In Proceedings of the Virtual Reality Annual International Symposium, pages45–52, 1997.
[41] Doug A. Bowman, Ernst Kruijff, Joseph J. LaViola, and Ivan Poupyrev. Anintroduction to 3-d user interface design. Presence: Teleoper. Virtual Environ.,10(1):96–108, 2001.
[42] Doug A. Bowman, Ernst Kruijff, Joseph J. LaViola, and Ivan Poupyrev. 3DUser Interfaces: Theory and Practice. Addison Wesley Longman PublishingCo., Inc., Redwood City, CA, USA, 2004.
[43] Doug A. Bowman and Chadwick A. Wingrave. Design and evaluation of menusystems for immersive virtual environments. In Proceedings of the Virtual Re-ality 2001 Conference, VR ’01, pages 149–, Washington, DC, USA, 2001. IEEEComputer Society.
[44] Douglas A. Bowman. Interaction Techniques For Common Tasks In Immer-sive Virtual Environments - Design, Evaluation, And Application. PhD thesis,Georgia Institute of Technology, 1998.
[45] Ronald J. Brachman and Tej Anand. Advances in knowledge discovery anddata mining. chapter The process of knowledge discovery in databases, pages37–57. American Association for Artificial Intelligence, Menlo Park, CA, USA,1996.
[46] Daniele Braga, Alessandro Campi, Mika Klemettinen, and Pier Luca Lanzi.Mining association rules from xml data. In Proceedings of the 4th Interna-tional Conference on Data Warehousing and Knowledge Discovery, DaWaK2000, pages 21–30, 2002.
[47] Richard Brath, Mike Peters, and Robin Senior. Visualization for communica-tion: The importance of aesthetic sizzle. In Proceedings of the Ninth Inter-national Conference on Information Visualisation, pages 724–729. IEEE Com-puter Society, 2005.
[48] Sergey Brin, Rajeev Motwani, and Craig Silverstein. Beyond market baskets:generalizing association rules to correlations. ACM SIGMOD Record, 26:265–276, June 1997.

References 189
[49] Sergey Brin, Rajeev Motwani, Jeffrey D. Ullman, and Shalom Tsur. Dynamicitemset counting and implication rules for market basket data. ACM SIGMODRecord, 26(2):255–264, 1997.
[50] Dario Bruzzese and Paolo Buono. Combining visual techniques for associationrules exploration. In Proceedings of the working conference on Advanced visualinterfaces, AVI ’04, pages 381–384, New York, NY, USA, 2004. ACM.
[51] Dario Bruzzese and Cristina Davino. Visual mining of association rules. InSpringer Berlin / Heidelberg, editor, Visual Data Mining: Theory, Techniquesand Tools for Visual Analytics, volume 4404, pages 103–122. S.J. Simoff et al(Eds), 2008.
[52] Linas Bukauskas and Michael Bhlen. Observer relative data extraction. In InProceedings of the International Workshop on Visual Data Mining, in conjunc-tion with ECML/PKDD2001, 2nd European Conference on Machine Learningand 5th European http://www.opensg.org/ Conference on Principles and Prac-tice of Knowledge Discovery in Data, pages 1–2, 2001.
[53] Cody Buntain. 3d ontology visualization in semantic search. In Proceedings ofthe 46th Annual Southeast Regional Conference, pages 204–208, 2008.
[54] Grigore Burdea and Philippe Coiffet. La ralit virtuelle. 1993.
[55] Doug Burdick. Mafia: A maximal frequent itemset algorithm for transactionaldatabases. In Proceedings of the 17th International Conference on Data Engi-neering, pages 443–, Washington, DC, USA, 2001. IEEE Computer Society.
[56] Jean-Marie Burkhardt. Immersion, ralisme et prsence dans la conception etl’valuation des environnements virtuels. Psychologie franaise, 48(2):35–42, 2003.
[57] Jeff Butterworth, Andrew Davidson, Stephen Hench, and Marc. T. Olano. 3dm:a three dimensional modeler using a head-mounted display. In Proceedings ofthe 1992 symposium on Interactive 3D graphics, pages 135–138, 1992.
[58] Jochen c, Ulrich Guntzer, and Gholamreza Nakhaeizadeh. Algorithms for asso-ciation rule mining: a general survey and comparison. ACM SIGKDD Explo-rations Newsletters, 2:58–64, June 2000.
[59] Yang Cai, Richard Stumpf, Timothy Wynne, Michelle Tomlinson, Daniel Sai HoChung, Xavier Boutonnier, Matthias Ihmig, Rafael Franco, and NathanielBauernfeind. Visual transformation for interactive spatiotemporal data min-ing. Knowledge and Information Systems, 13(2):119–142, 2007.
[60] Stuart K. Card, Jock D. Mackinlay, and Ben Schneiderman. Readings in in-formation visualization : using vision to think. Morgan Kaufmann publishers,1999.

190 References
[61] Stuart K. Card, George G. Robertson, and William York. The webbook and theweb forager: an information workspace for the world-wide web. In Proceedingsof the SIGCHI conference on Human factors in computing systems: commonground, CHI ’96, pages 111–ff., New York, NY, USA, 1996. ACM.
[62] C. Melody Carswell, Sylvia Frankenberger, and Donald Bernhard. Graphing indepth: Perspectives on the use of three-dimensional graphs to represent lower-dimensional data. Behaviour & Information Technology., 10(6):459–474, 1991.
[63] Aaron Ceglar, John F. Roddick, and Paul Calder. Managing data mining tech-nologies in organizations. chapter Guiding knowledge discovery through inter-active data mining, pages 45–87. IGI Publishing, Hershey, PA, USA, 2003.
[64] Sharma Chakravarthy and Hongen Zhang. Visualization of association rulesover relational dbmss. In Proceedings of the 2003 ACM symposium on Appliedcomputing, SAC ’03, pages 922–926. ACM, 2003.
[65] D. Chamaret. Plate-forme de ralit virtuelle pour ltude de laccessibilit et delextraction de lampes sur prototype virtuel automobile. PhD thesis, UniversitdAngers, 2010.
[66] Sarah S. Chance, Florence Gaunet, Andrew C. Beall, and Jack M. Loomis.Locomotion mode affects the updating of objects encountered during travel:The contribution of vestibular and proprioceptive inputs to path integration.Presence: Teleoper. Virtual Environ., 7(2):168–178, April 1998.
[67] Pritam Chanda, Jianmei Yang, Aidong Zhang, and Murali Ramanathan. Onmining statistically significant attribute association information. SIAM, pages141–152, 2010.
[68] Herman Chernoff. The use of faces to represent points in k-dimensional spacegraphically. Journal of the American Statistical Association, 68(342):361–368,1973.
[69] W. Cheung and O.R. Zaiane. Incremental mining of frequent patterns withoutcandidate generation or support constraint. In Proceedings. Seventh Interna-tional Database Engineering and Applications Symposium, pages 111–116, 2003.
[70] Ed H. Chi and John T. Riedl. An operator interaction framework for visualiza-tion systems. In Proceedings of IEEE Symposium on Information Visualization,INFOVIS ’98, pages 63–70. IEEE Computer Society, 1998.
[71] E.H. Chi. A taxonomy of visualization techniques using the data staterefer-ence model. In Proceedings of IEEE Symposium on Information Visualization,InfoVis’00, pages 69–75, 2000.
[72] Maria Cristina Ferreira de Oliveira Claudio Haruo Yamamoto andSolange Oliveira Rezende. Post-Mining of Association Rules: Techniques forEffective Knowledge Extraction, chapter Visualization to Assist the Generation

References 191
and Exploration of Association Rules, pages 224–245. Information Science Ref-erence, 2009.
[73] W S Cleveland and R McGill. Graphical perception: Theory, experimenta-tion, and application to the development of graphical methods. Journal of theAmerican Statistical Association, 79(387):531–554, 1984.
[74] William S. Cleveland. Visualizing Data. Hobart Press, 1993.
[75] Andy Cockburn and Bruce McKenzie. Evaluating the effectiveness of spatialmemory in 2d and 3d physical and virtual environments. In Proceedings of theSIGCHI conference on Human factors in computing systems, CHI ’02, pages203–210. ACM, 2002.
[76] F. Coenen, P. Leng, and S. Ahmed. Data structure for association rule mining:T-trees and p-trees. IEEE Transactions on Knowledge and Data Engineering,16(4):774–778, 2004.
[77] K. Coninx, F. Van Reeth, and E. Flerackers. A hybrid 2d / 3d user interface forimmersive object modeling. In Proceedings of the 1997 Conference on ComputerGraphics International, CGI ’97, pages 47–, Washington, DC, USA, 1997. IEEEComputer Society.
[78] Brookshire D. Conner, Scott S. Snibbe, Kenneth P. Herndon, Daniel C. Rob-bins, Robert C. Zeleznik, and Andries van Dam. Three-dimensional widgets. InProceedings of the 1992 symposium on Interactive 3D graphics, I3D ’92, pages183–188, New York, NY, USA, 1992. ACM.
[79] Olivier Couturier, Tarek Hamrouni, Sadok Ben Yahia, and Engelbert Me-phu Nguifo. A scalable association rule visualization towards displaying largeamounts of knowledge. In : Proceedings of the 11th International ConferenceInformation Visualization, pages 657–663, Washington, DC, USA, 2007. IEEEComputer Society.
[80] Olivier Couturier, Jose Rouillard, and Vincent Chevrin. An interactive ap-proach to display large sets of association rules. In Proceedings of the 2007conference on Human interface: Part I, pages 258–267, Berlin, Heidelberg,2007. Springer-Verlag.
[81] Chad Creighton and Samir Hanash. Mining gene expression databases for as-sociation rules. Bioinformatics, 19(1):79–86, 2003.
[82] Carolina Cruz-Neira, Daniel J. Sandin, and Thomas A. DeFanti. Surround-screen projection-based virtual reality: the design and implementation of thecave. In Proceedings of the 20th annual conference on Computer graphics andinteractive techniques, SIGGRAPH ’93, pages 135–142, 1993.
192 References
[83] Lawrence D. Cutler, Bernd Frohlich, and Pat Hanrahan. Two-handed directmanipulation on the responsive workbench. In Proceedings of the 1997 sympo-sium on Interactive 3D graphics, I3D ’97, pages 107–114, New York, NY, USA,1997. ACM.
[84] R. Dachselt and M. Hinz. Three-dimensional widgets revisited: towards futurestandardization. In Proceedings of IEEE VR 2005 Workshop on New Directionsin 3D User interfaces,, pages 89–92, 2005.
[85] Raimund Dachselt and Anett Hbner. Three-dimensional menus: A survey andtaxonomy. Virtual Environments, 31(1):5365, 2007.
[86] Andries van Dam, Andrew S. Forsberg, David H. Laidlaw, Joseph J. LaViola,and Rosemary M. Simpson. Immersive vr for scientific visualization: A progressreport. IEEE Computer Graphics and Applications, 20:26–52, November 2000.
[87] Rudolph P. Darken, Terry Allard, and Lisa B. Achille. Spatial orientation andwayfinding in large-scale virtual spaces: An introduction. Presence., 7(2):101–107, 1998.
[88] Raffaele de Amicis, Michele Fiorentino, and Andre Stork. Parametric interac-tion for cad application in virtual reality environment. In International Con-ference on Design Tools and Methods in Industrial Engineering, pages D3/43–D3/52, 2001.
[89] Maria Cristina Ferreira de Oliveira and Haim Levkowitz. From visual data ex-ploration to visual data mining: A survey. Visualization and Computer Graphic,vol. 9 no. 3:378–394, 2003.
[90] Michael F. Deering. Holosketch: a virtual reality sketching/animation tool.ACM Transactions on Computer-Human Interaction, 2(3):220–238, 1995.
[91] Dan Diaper. The Handbook of Task Analysis for Human-Computer Interac-tion, chapter Task Analysis for Human-Computer Interaction, pages 5– 5 – 47.Prentice Hall PTR, Upper Saddle River, NJ, USA, 2003.
[92] Guozhu Dong and Jinyan Li. Interestingness of discovered association rulesin terms of neighborhood-based unexpectedness. In Proceedings of the SecondPacific-Asia Conference on Research and Development in Knowledge Discoveryand Data Mining, PAKDD ’98, pages 72–86, London, UK, UK, 1998. Springer-Verlag.
[93] Cdric Dumas, Patricia Plnacoste, and Christophe Chaillou. Dfinition d’unmodle d’interaction pour une interface de travail tridimensionnelle partird’exprimentations. In HM’99, 1999.
[94] H. Eidenberger. Visual data mining. In J. R. Smith, T. Zhang, & S. Pan-chanathan, editor, Society of Photo-Optical Instrumentation Engineers (SPIE)Conference Series, volume 5601 of Presented at the Society of Photo-OpticalInstrumentation Engineers (SPIE) Conference, pages 121–132, October 2004.

References 193
[95] Katja Einsfeld, S. Agne, M. Deller, A. Ebert, B. Klein, and C. Reuschling.Dynamic visualization and navigation of semantic virtual environments. InProceedings of the conference on Information Visualization (IV ’06), pages 569–574. IEEE Computer Society, 2006.
[96] Katja Einsfeld, Achim Ebert, and Jurgen Wolle. Hannah: A vivid and flexible3d information visualization framework. In Proceedings of the 11th InternationalConference Information Visualization (IV ’07), pages 720–725. IEEE ComputerSociety, 2007.
[97] Stephen R. Ellis. What are virtual environments? IEEE Computer Graphicsand Applications, 14:17–22, 1994.
[98] T. Todd Elvins, David R. Nadeau, Rina Schul, and David Kirsh. Worldlets:3d thumbnails for 3d browsing. In Proceedings of the SIGCHI conference onHuman factors in computing systems, CHI ’98, pages 163–170, New York, NY,USA, 1998. ACM Press/Addison-Wesley Publishing Co.
[99] Gurdal Ertek and Ayhan Demiriz. A framework for visualizing associationmining results. In Proceedings of the 21st international conference on Computerand Information Sciences, ISCIS 2006, pages 593–602. Springer-Verlag, 2006.
[100] Usama M. Fayyad. Data mining and knowledge discovery in databases: Im-plications for scientific databases. In Proceedings of the Ninth InternationalConference on Scientific and Statistical Database Management, SSDBM ’97,pages 2–11, Washington, DC, USA, 1997. IEEE Computer Society.
[101] Usama M. Fayyad, Gregory Piatetsky-Shapiro, Padhraic Smyth, and Ra-masamy Uthurusamy. Advances in Knowledge Discovery and Data Mining.AAAI/MIT Press, 1996.
[102] Steven Feiner, Blair MacIntyre, Marcus Haupt, and Eliot Solomon. Windowson the world: 2d windows for 3d augmented reality. In Proceedings of the 6thannual ACM symposium on User interface software and technology, UIST ’93,pages 145–155, New York, NY, USA, 1993. ACM.
[103] James D. Foley, Andries van Dam, Steven K. Feiner, and John F. Hughes. Com-puter graphics : principles and practice. Addison-Wesley Longman PublishingCo., Inc., Boston, MA, USA, 1996.
[104] Andrew Forsberg, Kenneth Herndon, and Robert Zeleznik. Aperture basedselection for immersive virtual environments. In Proceedings of the 9th annualACM symposium on User interface software and technology, UIST ’96, pages95–96, New York, NY, USA, 1996. ACM.
[105] William J. Frawley, Gregory Piatetsky-Shapiro, and Christopher J. Matheus.Knowledge discovery in databases: An overview. AI Magazine, 13, n 3:57–70,1992.

194 References
[106] Scott Frees and G. Drew Kessler. Precise and rapid interaction through scaledmanipulation in immersive virtual environments. In Proceedings of the 2005IEEE Conference 2005 on Virtual Reality, VR ’05, pages 99–106, Washington,DC, USA, 2005. IEEE Computer Society.
[107] A.A. Freitas. On rule interestingness measures. Knowledge-Based Systems,12(5-6):309–315, 1999.
[108] Alex A. Freitas. Understanding the crucial role of attribute interaction in datamining. Artificial Intelligence Review, 16(3):177–199, 2001.
[109] Alex Alves Freitas. On objective measures of rule surprisingness. In Proceedingsof the Second European Symposium on Principles of Data Mining and Knowl-edge Discovery, PKDD ’98, pages 1–9, London, UK, 1998. Springer-Verlag.
[110] Michael Friendly. Visualizing Categorical Data. SAS Publishing, 1st edition,2001.
[111] Yongjian Fu and Jiawei Hah. Meta-rule-guided mining of association rules inrelational databases. In Proceedings of the 1st International Workshop on Inte-gration of Knowledge Discovery with Deductive and Object-Oriented Databases,KDOOD’95, pages 39–46, 1995.
[112] P. Fuchs, B. Arnaldi, and J. Tisseau. La ralit virtuelle et ses applications.Presses des Mines, 2003.
[113] Philippe Fuchs, Sabine Coquillart, and Jean-Marie Burkhardt. Le trait de laralit virtuelle: Interfaage, immersion et interaction en environnement virtuel.Presses des Mines, 2006.
[114] Takeshi Fukuda, Yasuhiko Morimoto, Shinichi Morishita, and TakeshiTokuyama. Data mining with optimized two-dimensional association rules.ACM Transactions on Database Systems (TODS), 26:179–213, June 2001.
[115] Peter Fule and John F. Roddick. Experiences in building a tool for navigat-ing association rule result sets. In Proceedings of the second workshop on Aus-tralasian information security, Data Mining and Web Intelligence, and SoftwareInternationalisation, volume 32, pages 103 – 108, 2004.
[116] G. W. Furnas. Generalized fisheye views. In CHI ’86: Proceedings of theSIGCHI Conference on Human Factors in Computing Systems, pages 16–23.ACM Press, 1986.
[117] Liqiang Geng and Howard J. Hamilton. Interestingness measures for data min-ing: A survey. ACM Computing Surveys (CSUR), 38, September 2006.
[118] D. Gerber and D. Bechmann. The spin menu: A menu system for virtualenvironments. In Proceedings of the 2005 IEEE Conference 2005 on VirtualReality, VR ’05, pages 271–272, Washington, DC, USA, 2005. IEEE ComputerSociety.

References 195
[119] Dominique Gerber. Interaction 3D sur le plan de travail virtuel: Application auxdformations de forme libre. PhD thesis, Universit Louis Pasteur de Strasbourg,2004.
[120] James J. Gibson. The Ecological Approach To Visual Perception. PsychologyPress, 1986.
[121] Bart Goethals and Jan Van Den Bussche. A priori versus a posteriori filteringof association rules. In ACM SIGMOD Workshop on Research Issues in DataMining and Knowledge Discovery., pages 1–6, 1999.
[122] Bart Goethals and Mohammed J. Zaki. Advances in frequent itemset miningimplementations. SIGKDD Explorations, 6(1):109–117, Jun 2003.
[123] Karam Gouda and Mohammed Javeed Zaki. Efficiently mining maximal fre-quent itemsets. In Proceedings of the 2001 IEEE International Conference onData Mining, ICDM ’01, pages 163–170, Washington, DC, USA, 2001. IEEEComputer Society.
[124] Gosta Grahne and Jianfei Zhu. Fast algorithms for frequent itemset min-ing using fp-trees. IEEE Transactions on Knowledge and Data Engineering,17(10):1347–1362, 2005.
[125] Saul Greenberg. The Handbook of Task Analysis for Human-Computer Inter-action, chapter Working Through Task-Centered System Design, pages 49–65.Prentice Hall PTR, 2003.
[126] Nicolas Greffard, Fabien Picarougne, and Pascale Kuntz. Immersive dynamicvisualization of interactions in a social network. In GfKl, pages 255–262, 2011.
[127] Jerome Grosjean, Jean-Marie Burkhardt, Sabine Coquillart, and Paul Richard.Evaluation of the command and control cube. In Proceedings of the 4th IEEE In-ternational Conference on Multimodal Interfaces, ICMI ’02, pages 473–, Wash-ington, DC, USA, 2002. IEEE Computer Society.
[128] Jrme Grosjean and Sabine Coquillart. Command & control cube : a shortcutparadigm for virtual environments. In 7th EG Workshop on Virtual Environ-ments & 5th Immersive Projection Technology Workshop, 2001.
[129] Markus Gross. Visual computing : the integration of computer graphics, visualperception and imaging. Springer-Verlag, 1994.
[130] Timo Gtzelmann, Knut Hartmann, Andreas Nrnberger, and ThomasStrothotte. 3d spatial data mining on document sets for the discovery of failurecauses in complex technical devices. In Proceedings of the I2nd Int. Conf. onComputer Graphics Theory and Applications, 2007.
[131] Fabrice Guillet and Howard J. Hamilton, editors. Quality Measures in DataMining. Springer, 2007.

196 References
[132] Martin Hachet. Interaction avec des Environnements Virtuels affiches au moyend’Interfaces de Visualisation Collective. PhD thesis, Universite de Bordeaux 1,2003.
[133] Jiawei Hah, Yongjian Fu, Wei Wang, Krzysztof Koperski, and Osmar Zaiane.Dmql: A data mining query language for relational databases. In Proceedingsof the SIGMOD Worshop on research issues on Data Mining and KnowledgeDiscovery, pages 27–33. ACM, 1996.
[134] Michael Hahsler, Christian Buchta, and Kurt Hornik. Selective association rulegeneration. Computational Statistics revue, pages 303–315, March 2007.
[135] Jiawei Han and Yongjian Fu. Discovery of multiple-level association rules fromlarge databases. In Proceedings of the 21th International Conference on VeryLarge Data Bases, VLDB ’95, pages 420–431, 1995.
[136] Jiawei Han and Jian Pei. Mining frequent patterns by pattern-growth: method-ology and implications. ACM SIGKDD Explorations Newsletter, Special issueon Scalable data mining algorithms, 2(2):14–20, 2000.
[137] Chris Hand. A survey of 3d interaction techniques. Computer Graphics Forum,16(5):269281, 1997.
[138] Julie M. Harris. Binocular vision: moving closer to reality. Philosophicaltransactions - Royal Society. Mathematical, physical and engineering sciences,362(1825):2721–2739, 2004.
[139] M. Hascot and M. Beaudoin-Lafon. Visualisation interactive dinformation. In-formation, Interaction, Intelligence, 1:1, 2001.
[140] Michele Heim. Cyberspace/cyberbodies/cyberpunk: cultures of technological em-bodiment, chapter The design of virtual reality, pages 65–78. 1995.
[141] R. J. Hendley, N. S. Drew, A. M. Wood, and R. Beale. Narcissus: visualisinginformation. In Proceedings of the IEEE Symposium on Information Visualiza-tion (INFOVIS ’95), pages 90–96. Morgan Kaufmann Publishers Inc., 1999.
[142] Ivan Herman, Ieee Computer Society, Guy Melancon, and M. Scott Marshall.Graph visualization and navigation in information visualization: A survey.IEEE Transactions on Visualization and Computer Graphics, 6:24–43, 2000.
[143] W. Hibbard, H. Levkowitz, J. Haswell, P. Rheingans, and F. Schroeder. Inter-action in perceptually-based visualization. Perceptual Issues in Visualization,IFIP Series on Computer Graphics:23–32, 1995.
[144] Robert J. Hilderman and Howard J. Hamilton. Heuristic measures of inter-estingness. In Proceedings of the Third European Conference on Principles ofData Mining and Knowledge Discovery, PKDD ’99, pages 232–241, London,UK, 1999. Springer-Verlag.

References 197
[145] Jochen Hipp and Ulrich Guntzer. Is pushing constraints deeply into the miningalgorithms really what we want?: an alternative approach for association rulemining. ACM SIGKDD Explorations Newsletter, 4:50–55, June 2002.
[146] Heike Hofmann, Arno P. J. M. Siebes, and Adalbert F. X. Wilhelm. Visualizingassociation rules with interactive mosaic plots. In Proceedings of the sixth ACMSIGKDD international conference on Knowledge discovery and data mining,pages 227–235, New York, NY, USA, 2000. ACM.
[147] John H. Holland, Keith J. Holyoak, Richard E. Nisbett, and Paul R. Tha-gard. Induction: processes of inference, learning, and discovery. MIT Press,Cambridge, MA, USA, 1986.
[148] Kian huat Ong, Kok leong Ong, Wee keong Ng, and Ee peng Lim. Crystalclear:active visualization of association rules. In International Workshop on ActiveMining, AM2002, 2002.
[149] Geoffrey S. Hubona and Gregory W. Shirah. Ambient Intelligence For ScientificDiscovery, volume 3345/2005, chapter Spatial Cues in 3D Visualization, pages104–128. Spinger, 2005.
[150] Takeo Igarashi, Rieko Kadobayashi, Kenji Mase, and Hidehiko Tanaka. Pathdrawing for 3d walkthrough. In Proceedings of the 11th annual ACM symposiumon User interface software and technology, UIST ’98, pages 173–174, New York,NY, USA, 1998. ACM.
[151] Tomasz Imielinski and Heikki Mannila. A database perspective on knowledgediscovery. Communications of the ACM, 39:58–64, November 1996.
[152] Tomasz Imielinski and Aashu Virmani. Association rules... and what’s next?– towards second generation data mining systems. Advances in Databases andInformation Systems, 1475:6, 1998.
[153] Tomasz Imielinski and Aashu Virmani. Msql: A query language for databasemining. Data Mining and Knowledge Discovery, 3:373–408, December 1999.
[154] Franois-Xavier Inglese, Philippe Lucidarme, Paul Richard, and Jean-Louis Fer-rier. Previse - a human-scale virtual environment with haptic feedback. InSecond International Conference on Informatics in Control, automation andRobotics, pages 140–145. INSTICC Press, 2005.
[155] Alfred Inselberg and Bernard Dimsdale. Parallel coordinates: a tool for vi-sualizing multi-dimensional geometry. In Proceedings of the 1st conference onVisualization, VIS ’90, pages 361–378. IEEE Computer Society Press, 1990.
[156] Jerry Isdale. What is virtual reality ? a homebrew introduction and informationresource list, 1993.
[157] Richard H. Jacoby and Stephen R. Ellis. Using virtual menus in a virtualenvironment. SPIE, 1668:39–48, 1992.
198 References
[158] Richard H. Jacoby, Mark Ferneau, and Jim Humphries. Hands-off interactionwith menus in virtual spaces. SPIE, 2177:355–371, 1994.
[159] T. J. Jankun-Kelly, Kwan-Liu Ma, and Michael Gertz. A model and frame-work for visualization exploration. IEEE Transactions on Visualization andComputer Graphics, 13:357–369, March 2007.
[160] Baptiste Jeudy and Jean-Francois Boulicaut. Optimization of association rulemining queries. Intelligent Data Analysis, 6:341–357, September 2002.
[161] Brian Johnson and Ben Shneiderman. Tree-maps: a space-filling approach tothe visualization of hierarchical information structures. In Proceedings of the2nd conference on Visualization (VIS ’91), pages 284–291. IEEE ComputerSociety Press, 1991.
[162] A. Kadri, A. Lecuyer, and J.-M. Burkhardt. The visual appearance of user’savatar can influence the manipulation of both real devices and virtual objects.In IEEE Symposium on 3D User Interfaces, 2007.
[163] A. Kadri, A. Lecuyer, J.-M. Burkhardt, and S. Richir. The influence of visualappearance of user’s avatar on the manipulation of objects in virtual environ-ments. In IEEE Symposium on 3D User Interfaces, pages 291 – 292, 2007.
[164] R S Kalawsky. Exploiting virtual reality techniques in education and training:Technological issues. AGOCGSIMA Report Series, 26(1):1356–5370, 1996.
[165] Roy Kalawsky and Graeme Simpkin. Automating the display of third per-son/stealth views of virtual environments. Presence: Teleoper. Virtual Envi-ron., 15(6):717–739, 2006.
[166] L. N. Kalisperis, G. Otto, K. Muramoto, J. S. Gundrum, R. Masters, andB Orland. An affordable immersive environment in beginning design studioeducation. In ACADIA 2002, Thresholds Between Real and Virtual: DesignResearch, Education, and Practice in the Space Between the Physical and theVirtual,, pages 49–56, 2002.
[167] D.A. Keim and H.-P.; Kriegel. Visualization techniques for mining largedatabases: a comparison. IEEE Transactions on Knowledge and Data En-gineering, 8(6):923 – 938, 1996.
[168] Daniel A. Keim. Information visualization and visual data mining. IEEE Trans-actions on Visualization and Computer Graphics, 8(1):1–8, 2002.
[169] Yoshifumi Kitamura, Tomohiko Higashi, Toshihiro Masaki, and Fumio Kishino.Virtual chopsticks: Object manipulation using multiple exact interactions. InProceedings of the IEEE Virtual Reality, VR ’99, pages 198–, Washington, DC,USA, 1999. IEEE Computer Society.
References 199
[170] Mika Klemettinen, Heikki Mannila, Pirjo Ronkainen, Hannu Toivonen, andA. Inkeri Verkamo. Finding interesting rules from large sets of discovered asso-ciation rules. In Proceedings of the third international conference on Informationand knowledge management, CIKM ’94:, pages 401–407, New York, NY, USA,1994. ACM.
[171] Ioannis Kopanakis and Babis Theodoulidis. Visual data mining modeling tech-niques for the visualization of mining outcomes. Journal of Visual Languages& Computing, 14(6):543–589, 2003.
[172] Uwe Krohn. Vineta: navigation through virtual information spaces. In Pro-ceedings of the workshop on Advanced visual interfaces(AVI ’96), pages 49–58,New York, NY, USA, 1996. ACM.
[173] John Krygier and Denis Wood. Making Maps: A Visual Guide to Map Designfor GIS. The Guilford Press, 2005.
[174] Pascale Kuntz, Fabrice Guillet, Remi Lehn, and Henri Briand. A user-drivenprocess for mining association rules. In Proceedings of the 4th European Con-ference on Principles of Data Mining and Knowledge Discovery, PKDD ’00,pages 483–489. Springer-Verlag, 2000.
[175] Gordon Kurtenbach and William Buxton. User learning and performance withmarking menus. In Proceedings of the SIGCHI conference on Human factors incomputing systems: celebrating interdependence, CHI ’94, pages 258–264, NewYork, NY, USA, 1994. ACM.
[176] Celine Latulipe, Craig S. Kaplan, and Charles L. A. Clarke. Bimanual andunimanual image alignment: an evaluation of mouse-based techniques. In Pro-ceedings of the 18th annual ACM symposium on User interface software andtechnology, UIST ’05, pages 123–131, New York, NY, USA, 2005. ACM.
[177] Joseph J. Laviola. Msvt: A multimodal scientific visualization tool. In the 3edIASTED International Conference on Computer Graphics and Imaging, pages1–17, 2000.
[178] Anatole Lecuyer, Christine Megard, Jean-Marie Burkhardt, Eads Ccr, TaegiLim, Philippe Coiffet, Ludovic Graux, and Sabine Coquillart. The effect ofhaptic, visual and auditory feedback on an insertion task on a 2-screen work-bench. In In Proceedings of the Immersive Projection Technology Symposium,2002.
[179] Adrien Marie Legendre. Nouvelles mthodes pour la dtermination des orbites descomtes. 1805.
[180] Carson Kai-Sang Leung, Laks V. S. Lakshmanan, and Raymond T. Ng. Exploit-ing succinct constraints using fp-trees. ACM SIGKDD Explorations Newsletter,4:40–49, June 2002.
200 References
[181] Jiuyong Li. On optimal rule discovery. IEEE Transactions on Knowledge andData Engineering, 18, 2006.
[182] Wenmin Li, Jiawei Han, and Jian Pei. Cmar: accurate and efficient classificationbased on multiple class-association rules. In Proceedings IEEE InternationalConference on Data Mining, pages 369– 376, 2001.
[183] Jiandong Liang and Mark Green. Jdcad: A highly interactive 3d modelingsystem. In Computer and Graphics, 18(4):499–506, 1994.
[184] Bing Liu, Wynne Hsu, Lai-Fun Mun, and Hing-Yan Lee. Finding interestingpatterns using user expectations. IEEE Transactions on Knowledge and DataEngineering, 11(6):817–832, 1999.
[185] Yan Liu and Gavriel Salvendy. Design and evaluation of visualization support tofacilitate association rules modeling. International Journal of Human-ComputerInteraction, 21(1):15–38, 2006.
[186] Jianxiong Luo and Susan M Bridges. Mining fuzzy association rules and fuzzyfrequency episodes for intrusion detection. International Journal of IntelligentSystems, 15(8):687–703, 2000.
[187] Yiming Ma, Bing Liu, and Ching Kian Wong. Web for data mining: orga-nizing and interpreting the discovered rules using the web. ACM SIGKDDExplorations Newsletter, 2:16–23, June 2000.
[188] Alan M. MacEachren. How Maps Work : Representation, Visualization, andDesign. Guilford Press, 1995.
[189] John A. Major and John J. Mangano. Selecting among rules induced froma hurricane database. Journal of Intelligent Information Systems, 4(1):39–52,1995.
[190] Jonathan I. Maletic, Andrian Marcus, Greg Dunlap, and Jason Leigh. Visu-alizing object-oriented software in virtual reality. In Proceedings of the NinthInternational Workshop on Program Comprehension, IWPC’01, pages 26–38.IEEE Computer Society, 2001.
[191] Heikki Mannila, Hannu Toivonen, and A. Inkeri Verkamo. Discovery of frequentepisodes in event sequences. Data Mining and Knowledge Discovery, 1(3):259–289, 1997.
[192] Bianchi Serique Meiguins, Ricardo Melo, Casseb do Carmo, LeonardoAlmeida, Aruanda Simoes Gonalves, Srgio Clayton V. Pinheiro, and Marcelode Brito Garcia. Multidimensional information visualization using augmentedreality. In Proceedings of ACM international conference on Virtual reality con-tinuum and its applications (VRCIA ’06), 2006.
[193] Rosa Meo, Giuseppe Psaila, and Stefano Ceri. An extension to sql for miningassociation rules. Data Mining and Knowledge Discovery, 2:195–224, June 1998.

References 201
[194] DR Mestre and P Fuchs. Trait de la Ralit Virtuelle, chapter Immersion etPrsence, pages 309–338. Ecole des Mines de Paris, 2006.
[195] Ryszard S. Michalski, Ivan Bratko, and Avan Bratko. Machine Learning andData Mining; Methods and Applications. John Wiley & Sons, Inc., 1998.
[196] P. Milgram, D. Drascic, J. J. Grodski, A. Restogi, S. Zhai, and C. Zhou. Mergingreal and virtual worlds. In IMAGINA95, pages 218–30, 1995.
[197] Paul MILGRAM and Fumio KISHINO. A taxonomy of mixed reality visualdisplays. IEICE transactions on information and systems, E77(12):1321–1329,1994.
[198] Mark R. Mine. Isaac : A virtual environment tool for the interactive construc-tion of virtual worlds. Technical report, University of North Carolina, 1995.
[199] Mark R. Mine, Frederick P. Brooks, Jr., and Carlo H. Sequin. Moving objectsin space: exploiting proprioception in virtual-environment interaction. In Pro-ceedings of the 24th annual conference on Computer graphics and interactivetechniques, SIGGRAPH ’97, pages 19–26, New York, NY, USA, 1997. ACMPress/Addison-Wesley Publishing Co.
[200] Henry Montgomery. Decision rules and the search for a dominance struc-ture: Towards a process model of decision making*. Advances in Psychology,14:343369, 1983.
[201] Lukas Mroz and Helwig Hauser. Rtvr: a flexible java library for interactivevolume rendering. In VISUALIZATION’01 : Proceedings of the Conference onVisualization, pages 279–286. IEEE Computer Society Press, 2001.
[202] Edward J. Mulrow. The visual display of quantitative information. Technomet-rics, 44(4):400, 2002.
[203] Henrik R. Nagel, Erik Granum, Søren Bovbjerg, and Michael Vittrup. Immer-sive visual data mining: The 3dvdm approach. Visual Data Mining: Theory,Techniques and Tools for Visual Analytics, pages 281–311, 2008.
[204] Henrik R Nagel, Erik Granum, and Peter Musaeus. Methods for visual miningof data in virtual reality. In Proceedings of the International Workshop onVisual Data Mining in conjunction with 2nd European Conference on MachineLearning and 5th European Conference on Principles and Practice of KnowledgeDiscovery in Databases, pages 13–27, 2001.
[205] David Nahon. Salles immersives et cubes de ralit virtuelle, une premire mondialesur pc : le sas cube. In Imagina, 2002.
[206] L. Nelson, D. Cook, and C. Cruz-Neira. Xgobi vs the c2: Results of an experi-ment comparing data visualization in a 3-d immersive virtual reality environe-ment with a 2-d workstation display. computational statistics 14, pages 39–51,1999.

202 References
[207] Raymond T. Ng, Laks V. S. Lakshmanan, Jiawei Han, and Alex Pang. Ex-ploratory mining and pruning optimizations of constrained associations rules.ACM SIGMOD Record, 27:13–24, June 1998.
[208] Oliver Niggemann. Visual Data Mining of Graph-Based Data. PhD thesis,University of Paderborn, Jun 2001.
[209] Pang ning Tan and Vipin Kumar. Interestingness measures for associationpatterns: A perspective. Technical report, Departement of Computer Scienceand engineering, University of Minnesota, 2000.
[210] Tetsuro Ogi, Yoshisuke Tateyama, and So Sato. Visual data mining in immer-sive virtual environment based on 4k stereo images. In VMR ’09: Proceedings ofthe 3rd International Conference on Virtual and Mixed Reality, pages 472–481.Springer-Verlag, 2009.
[211] Miho Ohsaki, Shinya Kitaguchi, Kazuya Okamoto, Hideto Yokoi, and TakahiraYamaguchi. Evaluation of rule interestingness measures with a clinical dataseton hepatitis. In Proceedings of the 8th European Conference on Principles andPractice of Knowledge Discovery in Databases, PKDD ’04, pages 362–373, NewYork, NY, USA, 2004. Springer-Verlag New York, Inc.
[212] A. Olwal and S Feiner. The flexible pointer: An interaction technique foraugmented and virtual reality. In Proceedings of ACM Symposium on UserInterface Software and Technology, number 81-82, 2003.
[213] M. Ortega and S. Coquillart. Prop-based haptic interaction with co-locationand immersion: an automotive application. In IEEE International Workshopon Haptic Audio Visual Environments and their Applications, 2005.
[214] K. Osawa, N. Asai, M. Suzuki, Y. Sugimoto, and F. Saito. An immersiveprogramming system: Ougi. In Proceedings of the 12th International Conferenceon Artificial Reality and Telexistence (ICAT2002), pages 36–43, 2002.
[215] Alexis Paljic, Sabine Coquillart, Jean-Marie Burkhardt, and Paul Richard. Astudy of distance of manipulation on the responsive workbench. In ImmersiveProjection Technology, IPT2002, 2002.
[216] G. Parker, G. Franck, and C. Ware. Visualization of large nested graphs in3d: Navigation and interaction. Journal of Visual Languages & Computing,9:299–317, 1998.
[217] Nicolas Pasquier, Rafik Taouil, Yves Bastide, Gerd Stumme, and Lotfi Lakhal.Generating a condensed representation for association rules. Journal of Intelli-gent Information Systems, 24(1):29–60, 2005.
[218] Jian Pei and Jiawei Han. Can we push more constraints into frequent patternmining? In Proceedings of the sixth ACM SIGKDD international conferenceon Knowledge discovery and data mining, KDD ’00, pages 350–354, New York,NY, USA, 2000. ACM.

References 203
[219] G. Piatetsky-Shapiro. Knowledge Discovery in Databases, chapter Discovery,Analysis, and Presentation of Strong Rules, page 229248. AAAI/MIT Press,1991.
[220] G.G. Pickett, R.M. Grinstein. Iconographic displays for visualizing multidi-mensional data. Proceedings of the 1988 IEEE International Conference onSystems, Man, and Cybernetics, pages 514–519, 1988.
[221] Jeffrey S. Pierce, Andrew S. Forsberg, Matthew J. Conway, Seung Hong,Robert C. Zeleznik, and Mark R. Mine. Image plane interaction techniquesin 3d immersive environments. In Proceedings of the 1997 symposium on Inter-active 3D graphics, I3D ’97, pages 39–ff., New York, NY, USA, 1997. ACM.
[222] Jeffrey S. Pierce, Brian C. Stearns, and Randy Pausch. Voodoo dolls: seamlessinteraction at multiple scales in virtual environments. In Proceedings of the 1999symposium on Interactive 3D graphics, I3D ’99, pages 141–145, New York, NY,USA, 1999. ACM.
[223] Ben Piper, Carlo Ratti, and Hiroshi Ishii. Illuminating clay: a 3-d tangibleinterface for landscape analysis. In Proceedings of the SIGCHI conference onHuman factors in computing systems: Changing our world, changing ourselves,CHI ’02, pages 355–362, New York, NY, USA, 2002. ACM.
[224] Catherine Plaisant, Jesse Grosjean, and Benjamin B. Bederson. Spacetree:Supporting exploration in large node link tree, design evolution and empiricalevaluation. In Proceedings of the IEEE Symposium on Information Visualiza-tion (InfoVis’02), pages 57–64. IEEE Computer Society, 2002.
[225] Francois Poulet and Thanh Nghi Do. Visual Data Mining, chapter InteractiveDecision Tree Construction for Interval and Taxonomical Data, pages 123–135.Springer-Verlag, 2008.
[226] I. Poupyrev, T. Ichikawa, S. Weghorst, and M. Billinghurst. Egocentric ob-ject manipulation in virtual environments: Empirical evaluation of interactiontechniques. Computer Graphics Forum, 17:4152, 1998.
[227] Ivan Poupyrev, Mark Billinghurst, Suzanne Weghorst, and Tadao Ichikawa. Thego-go interaction technique: non-linear mapping for direct manipulation in vr.In Proceedings of the 9th annual ACM symposium on User interface softwareand technology, UIST ’96, pages 79–80, New York, NY, USA, 1996. ACM.
[228] IVAN POUPYREV and TADAO Ichikawa. Manipulating objects in virtualworlds: Categorization and empirical evaluation of interaction techniques. Jour-nal of Visual Languages & Computing, 10(1):1935, 1999.
[229] Foster John Provost and John M. Aronis. Scaling up inductive learning withmassive parallelism. Machine Learning, 3(1):33–46, 1996.

204 References
[230] Andy Prykeand and Russell Beale. Interactive comprehensible data mining.Ambient Intelligence for Scientific Discovery, 3345:48–65, 2005.
[231] GWM Rauterberg, M Fjeld, Bichsel Krueger, H, U M, Leonhardt, and MarkusMeier. Build-it : a video-based interaction technique for a planning tool forconstruction and design. In Work With Display Units (WWDU),, page 175176,1997.
[232] Jun Rekimoto. Pick-and-drop: a direct manipulation technique for multiplecomputer environments. In Proceedings of the 10th annual ACM symposium onUser interface software and technology, UIST ’97, pages 31–39, New York, NY,USA, 1997. ACM.
[233] Howard Rheingold. Virtual Reality. Summit Books, 1991.
[234] Paul Richard. Analyse de linteraction homme-monde virtuel lors de tches demanipulation dobjets dformables. PhD thesis, Universit Pierre et Marie Curie(Paris 6), 1996.
[235] William S. Cleveland Richard A. Becker and Allan R. Wilks. Dynamic graphicsfor data analysis. Statistical Science, 2(4):355–383., 1987.
[236] George Robertson, Mary Czerwinski, Kevin Larson, Daniel C. Robbins, DavidThiel, and Maarten van Dantzich. Data mountain: using spatial memory fordocument management. In Proceedings of the 11th annual ACM symposium onUser interface software and technology (UIST ’98), pages 153–162, 1998.
[237] George G Robertson, Jock D Mackinlay, and Stuart K. Card. Cone trees:animated 3d visualizations of hierarchical information. In Proceedings of theSIGCHI conference on Human factors in computing systems: Reaching throughtechnology, pages 189 – 194, 1991.
[238] Warren Robinett and Richard Holloway. Implementation of flying, scaling andgrabbing in virtual worlds. In Proceedings of the 1992 symposium on Interactive3D graphics, I3D ’92, pages 189–192, New York, NY, USA, 1992. ACM.
[239] John F. Roddick and Sally Rice. What’s interesting about cricket?: on thresh-olds and anticipation in discovered rules. ACM SIGKDD Explorations Newslet-ter, 3:1–5, July 2001.
[240] ELTING L. S., MARTIN C. G., ; CANTOR S. B., and ; RUBENSTEIN E.B. nfluence of data display formats on physician investigators’ decisions tostop clinical trials : prospective trial with repeated measures. British MedicalJournal, 318(7197):1527–1531, 1999.
[241] J Grosjean S Coquillart. Interaction 3d, paradigmes et mtaphores. Trait de laralit virtuelle, 2003.
References 205
[242] Sigal Sahar. Interestingness via what is not interesting. In Proceedings of thefifth ACM SIGKDD international conference on Knowledge discovery and datamining, KDD ’99, pages 332–336, New York, NY, USA, 1999. ACM.
[243] Ashoka Savasere, Edward Omiecinski, and Shamkant B. Navathe. An efficientalgorithm for mining association rules in large databases. In Pceedings of the21th International Conference on Very Large Data Bases, pages 432–444, 1995.
[244] B. Shneiderman. The eyes have it: a task by data type taxonomy for informationvisualizations. In Proceedings of IEEE Symposium on Visual Languages, pages336– 343, 1996.
[245] Ben Shneiderman. Why not make interfaces better than 3d reality? IEEEComputer Graphics and Applications, 23(6):12–15, 2003.
[246] Yedendra Babu Shrinivasan and Jarke J. van Wijk. Supporting the analyticalreasoning process in information visualization. In Proceeding of the twenty-sixthannual SIGCHI conference on Human factors in computing systems, CHI ’08,pages 1237–1246, New York, NY, USA, 2008. ACM.
[247] Avi Silberschatz and Alexander Tuzhilin. On subjective measures of interest-ingness in knowledge discovery. In Proceedings of KDD-95, pages 275 – 281,1995.
[248] Avi Silberschatz and Alexander Tuzhilin. What makes patterns interestingin knowledge discovery systems. IEEE Transactions on Knowledge and DataEngineering, 8(6):970–974, December 1996.
[249] Avi Silberschatz and Alexander Tuzhilin. What makes patterns interestingin knowledge discovery systems. IEEE Transactions on Knowledge and DataEngineering, 8:970–974, December 1996.
[250] Simeon J. Simoff, Michael H. Bohlen, and Arturas Mazeika. Visual data min-ing. chapter Visual Data Mining: An Introduction and Overview, pages 1–12.Springer-Verlag, Berlin, Heidelberg, 2008.
[251] Herbert A. Simon. Models of thought. Yale University Press, 1979.
[252] Mel Slater, John McCarthy, and Francesco Maringelli. The influence of bodymovement on subjective presence in virtual environments. The Journal of theHuman Factors and Ergonomics Society, 40(3):469–477, 1998.
[253] Mel Slater, Martin Usoh, Steve Benford, Dave Snowdon, Chris Brown, TomRodden, Gareth Smith, and Sylvia Wilbur. Distributed extensible virtual real-ity laboratory (devrl): a project for co-operation in multi-participant environ-ments. In Proceedings of the Eurographics workshop on Virtual environmentsand scientific visualization, pages 137–148, London, UK, 1996. Springer-Verlag.

206 References
[254] P. Smyth and R. M. Goodman. An information theoretic approach to ruleinduction from databases. IEEE Transactions on Knowledge and Data Engi-neering, 4(4):301–316, 1992.
[255] Ian Spence. Visual psychophysics of simple graphical elements. Journal ofExperimental Psychology: Human Perception and Performance., 16(4):683–692,1990.
[256] R. Spence. Information Visualization. Addison-Wesley: Essex, England, 2001.
[257] Ramakrishnan Srikant and Rakesh Agrawal. Mining quantitative associationrules in large relational tables. In Proceedings of the 1996 ACM SIGMODinternational conference on Management of data, SIGMOD ’96, pages 1–12,New York, NY, USA, 1996. ACM.
[258] Ramakrishnan Srikant and Rakesh Agrawal. Mining sequential patterns: Gen-eralizations and performance improvements. Proceedings of the 5th Interna-tional Conference on Extending Database Technology: Advances in DatabaseTechnology, pages 3–17, 1996.
[259] Ramakrishnan Srikant and Rakesh Agrawal. Mining generalized associationrules. Future Generation Computer Systems, 13(2–3):161–180, 1997.
[260] Jaideep Srivastava, Robert Cooley, Mukund Deshpande, and Pang-Ning Tan.Web usage mining: discovery and applications of usage patterns from web data.ACM SIGKDD Explorations Newsletter, 1:12–23, January 2000.
[261] Anthony Steed and Chris Parker. 3d selection strategies for head tracked andnon-head tracked operation of spatially immersive displays. In 8th InternationalImmersive Projection Technology Workshop, pages 13–14, 2004.
[262] Frank Steinicke, Klaus H. Hinrichs, and Timo Ropinski. Virtual reflections andvirtual shadows in mixed reality environments. In Proceedings of the 10th Inter-national Conference on Human-Computer Interaction, INTERACT’05, pages1018–1021, Rome, 2005.
[263] L Sternberger. Deformable ray-casting interaction technique. In IEEE YoungVirtual Reality Conferences, 2005.
[264] Richard Stoakley, Matthew J. Conway, and Y Pausch. Virtual reality on a wim:interactive worlds in miniature. In Proceedings of the SIGCHI conference onHuman factors in computing systems, CHI ’95, pages 265–272, 1995.
[265] T.A. Stoffregen, B. Bardy, L.J. G. Smart, and R.J. Pagulayan. Virtual andadaptative environments: Applications, implications, and Human performanceissues, chapter On the nature and evaluation of fidelity in virtual environments,pages 111–128. Mahwah, NJ: Lawrence Erlbaum., 2003.

References 207
[266] D. J. Sturman, D. Zeltzer, and S. Pieper. Hands-on interaction with virtualenvironments. In Proceedings of the 2nd annual ACM SIGGRAPH symposiumon User interface software and technology, UIST ’89, pages 19–24, New York,NY, USA, 1989. ACM.
[267] Zsolt Szalavri and Michael Gervautz. The personal interaction panel atwo-handed interface for augmented reality. Computer Graphics Forum,16(3):C335C346, 1997.
[268] Pang-Ning Tan, Vipin Kumar, and Jaideep Srivastava. Selecting the right inter-estingness measure for association patterns. In Proceedings of the eighth ACMSIGKDD international conference on Knowledge discovery and data mining,KDD ’02, pages 32–41. ACM, 2002.
[269] Vildan Tanriverdi and Robert J. K. Jacob. Interacting with eye movementsin virtual environments. In Proceedings of the SIGCHI conference on Humanfactors in computing systems, CHI ’00, pages 265–272. ACM, 2000.
[270] Monica Tavanti and Mats Lind. 2d vs 3d, implications on spatial memory. InProceedings of the IEEE Symposium on Information Visualization 2001, INFO-VIS’01, page 139. IEEE Computer Society, 2001.
[271] Kesaraporn Techapichetvanich and Amitava Datta. Visar : A new techniquefor visualizing mined association rules. In International conference on advanceddata mining and applications, ADMA 2005. Springer-Verlag, 2005.
[272] Tudor Teusan, Gilles Nachouki, Henri Briand, and Jacques Philippe. Discov-ering association rules in large, dense databases. In Proceedings of the 4thEuropean Conference on Principles of Data Mining and Knowledge Discovery,PKDD ’00, pages 638–645. Springer-Verlag, 2000.
[273] Alfredo R. Teyseyre and Marcelo R. Campo. An overview of 3d software visual-ization. IEEE Transactions on Visualization and Computer Graphics, 15(1):87–105, 2009.
[274] Jaques Tisseau. Realite virtuelle : autonomie in virtuo. PhD thesis, Universityof Rennes1, 2001.
[275] H. Toivonen, M. Klemettinen, P. Ronkainen, K. Hatonen, and H. Mannila.Pruning and grouping of discovered association rules. Workshop on Statistics,Machine Learning, and Knowledge Discovery in Databases, pages 47–52, 1995.
[276] Melanie Tory, Arthur E. Kirkpatrick, M. Stella Atkins, and Torsten Moller.Visualization task performance with 2d, 3d, and combination displays. IEEETransactions on Visualization and Computer Graphics, 12:2–13, January 2006.
[277] Melanie Tory and Torsten Moller. Rethinking visualization: A high-level tax-onomy. In Proceedings of IEEE Symposium on Information Visualization, IN-FOVIS ’04, pages 151–158. IEEE Computer Society, 2004.

208 References
[278] Edward R. Tufte. Envisioning Information. Graphics Press, 1990.
[279] Antony Unwin. Visualisation for data mining. In International Conference onData Mining, Visualization and Statistical System, 2000.
[280] Antony Unwin, Heike Hofmann, and Klaus Bernt. The twokey plot for multipleassociation rules control. In Proceedings of the 5th European Conference onPrinciples of Data Mining and Knowledge Discovery, PKDD ’01, pages 472–483, 2001.
[281] Padhraic Smyth Usama Fayyad, Gregory Piatetsky-Shapiro. From data miningto knowledge discovery in databases. AI MAGAZINE, 17(3):37–54, 1996.
[282] Martin Usoh, Kevin Arthur, Mary C. Whitton, Rui Bastos, Anthony Steed,Mel Slater, and Frederick P. Brooks, Jr. Walking walking-in-place flying, invirtual environments. In Proceedings of the 26th annual conference on Computergraphics and interactive techniques, SIGGRAPH ’99, pages 359–364, New York,NY, USA, 1999. ACM Press/Addison-Wesley Publishing Co.
[283] J. J. Valdes. Virtual reality representation of information systems and decisionrules: An exploratory tool for understanding data and knowledge. In the 9-thInternational Conference on Rough Sets, Fuzzy Sets, Data Mining and GranularComputing, 2003.
[284] J.J. van Ham, F. van Wijk. Beamtrees: compact visualization of large hierar-chies. Proceedings of IEEE Symposium on Information Visualization (INFOVIS’02), pages 93– 100, 2002.
[285] Weixin Wang, Hui Wang, Guozhong Dai, and Hongan Wang. Visualization oflarge hierarchical data by circle packing. In Proceedings of SIGCHI conferenceon Human Factors in computing systems (CHI ’06), pages 517–520. ACM, 2006.
[286] Matthew Ward, Georges Grinstein, and Daniel Keim. Interactive Data Visual-ization: Foundations, Techniques, and Applications. A. K. Peters, Ltd., 2010.
[287] Colin Ware. Information Visualization: Perception for Design. Morgan Kauf-mann Publishers Inc., San Francisco, CA, USA, 2004.
[288] Colin Ware and Glenn Franck. Evaluating stereo and motion cues for visualizinginformation nets in three dimensions. ACM Transactions on Graphics (TOG),15(2):121–140, 1996.
[289] Colin Ware and Steven Osborne. Exploration and virtual camera control in vir-tual three dimensional environments. SIGGRAPH Computer Graphics, 24:175–183, 1990.
[290] Gerold Wesche and Marc Droske. Conceptual free-form styling on the responsiveworkbench. In Proceedings of the ACM symposium on Virtual reality softwareand technology, VRST ’00, pages 83–91, New York, NY, USA, 2000. ACM.

References 209
[291] Leland Wilkinson. The Grammar of Graphics (Statistics and Computing).Springer-Verlag, 2005.
[292] Remco Chang William A Pike, John Stasko and Theresa A O’Connell. Thescience of interaction. Information Visualization, 8:263–274, 2009.
[293] Christopher Williamson and Ben Shneiderman. The dynamic homefinder: eval-uating dynamic queries in a real-estate information exploration system. InProceedings of the 15th annual international ACM SIGIR conference on Re-search and development in information retrieval, SIGIR ’92, pages 338–346.ACM Press, 1992.
[294] U. Wiss and D.A. Carr. An empirical study of task support in 3d informationvisualizations. In IEEE International Conference on Information Visualization,pages 392 – 399, 1999.
[295] Pak Chung Wong. Visual data mining. IEEE Computer Graphics and Appli-cations, 19(5):20–21, 1999.
[296] Pak Chung Wong and R. Daniel Bergeron. 30 years of multidimensional multi-variate visualization. In Scientific Visualization, Overviews, Methodologies, andTechniques, pages 3–33, Washington, DC, USA, 1997. IEEE Computer Society.
[297] Pak ChungWong, Paul Whitney, and Jim Thomas. Visualizing association rulesfor text mining. In Proceedings of the 1999 IEEE Symposium on InformationVisualization, pages 120–123, 1999.
[298] Yue Xu and Yuefeng Li. Generating concise association rules. In Proceedingsof the sixteenth ACM conference on Conference on Information and KnowledgeManagement, pages 781–790. ACM, 2007.
[299] Claudio Haruo Yamamoto, Magaly Lika Fujimoto, and Solange OliveiraRezende. An itemset-driven cluster-oriented approach to extract compact andmeaningful sets of association rules. In Proceedings of the Sixth InternationalConference on Machine Learning and Applications, IV ’07, pages 87–92, Wash-ington, DC, USA, 2007. IEEE Computer Society.
[300] Li Yang. Visualizing frequent itemsets, association rules, and sequential pat-terns in parallel coordinates. In Proceedings of the 2003 international confer-ence on Computational science and its applications, ICCSA’03, pages 21–30.Springer-Verlag, 2003.
[301] Y. Y. Yao, S. K. Michael Wong, and Cory J. Butz. On information-theoreticmeasures of attribute importance. In Proceedings of the Third Pacific-Asia Con-ference on Methodologies for Knowledge Discovery and Data Mining, PAKDD’99, pages 133–137, London, UK, 1999. Springer-Verlag.
[302] Ji Soo Yi, Youn ah Kang, John Stasko, and Julie Jacko. Toward a deeperunderstanding of the role of interaction in information visualization. IEEE

210 References
Transactions on Visualization and Computer Graphics, 13:1224–1231, Novem-ber 2007.
[303] Yan Allison York, L. Yan, R. S. Allison, and S. K. Rushton. New simple virtualwalking method – walking on the spot. In In 8 th Annual Immersive ProjectionTechnology (IPT) Symposium Electronic Proceedings, 2004.
[304] Mohammed Zaki. Mining non-redundant association rules. Data Mining andKnowledge Discovery, 9:223–248, 2004.
[305] Mohammed J. Zaki. Generating non-redundant association rules. InternationalConference on Knowledge Discovery and Data Mining, pages 34 – 43, 2000.
[306] Mohammed J. Zaki. Spade: An efficient algorithm for mining frequent se-quences. Machine Learning, 42:31–60, January 2001.
[307] David Zeltzer. Autonomy, interaction, and presence. Presence: Teleoper. Vir-tual Environ., 1:127–132, 1992.
[308] Shumin Zhai, William Buxton, and Paul Milgram. The silk cursor: investigatingtransparency for 3d target acquisition. In Proceedings of the SIGCHI conferenceon Human factors in computing systems: celebrating interdependence, CHI ’94,pages 459–464, New York, NY, USA, 1994. ACM.
[309] Kaidi Zhao and Bing Liu. Opportunity map: A visualization framework forfast identification of actionable knowledge. In Proceedings of the 14th ACMinternational conference on Information and knowledge management, CIKM’05, pages 60–67, 2005.
[310] Qiankun Zhao and Sourav S. Bhowmick. Association rule mining: A survey.Technical report, CAIS, Nanyang Technological University, Singapore, 2003.

Thèse de Doctorat
Zohra Ben Said - GuefrechA virtual reality-based approach for interactive and visual mining of associationrules
RésuméCette thèse se situe à l’intersection de deux domaines actifs derecherche : la fouille de règles d’association et la réalité virtuelle.Les limites majeures des algorithmes d’extraction de règlesd’association sont (i) la grande quantité de règles produites et (ii)leur faible qualité. Dans la littérature, plusieurs solutions ont étéproposées pour remédier à ce problème, comme le post-traitementde règles d’association qui permet la validation des règles etl’extraction de connaissances utiles. Cependant, alors que lesrègles sont extraites automatiquement par des algorithmescombinatoires, le post-traitement de règles est effectué parl’utilisateur. La visualisation peut aider l’utilisateur à faire face à unegrande quantité de règles en les représentants sous forme visuelle.Afin de trouver les connaissances pertinentes dans lesreprésentations visuelles, l’utilisateur doit interagir avec lareprésentation de règles d’association. Par conséquent, il estessentiel de fournir à l’utilisateur des techniques d’interactionefficaces.Ce travail aborde deux problèmes essentiels : la représentation derègles d’association afin de permettre à l’utilisateur de détecter trèsrapidement les règles les plus intéressantes et l’explorationinteractive des règles. Le premier exige une métaphore intuitive dereprésentation de règles d’association. Le second nécessite unprocessus d’exploration très interactif permettant à l’utilisateur defouiller l’espace de règles en se concentrant sur les règlesintéressantes.Les principales contributions de ce travail peuvent être résuméescomme suit :– Nous proposons une nouvelle classification pour les techniques
de fouille visuelles de données, basée sur des représentationsen 3D et des techniques d’interaction. Une telle classificationaide l’utilisateur à choisir une configuration pertinente pour sonapplication.
– Nous proposons une nouvelle métaphore de visualisation pourles règles d’association qui prend en compte les attributs de larègle, la contribution de chacun d’eux et leurs corrélations.
– Nous proposons une méthodologie pour l’exploration interactivede règles d’association. Elle est conçue pour faciliter la tâche del’utilisateur face à des grands ensembles de règles en tenant encompte ses capacités cognitives. Dans cette méthodologie, desalgorithmes locaux sont utilisés pour recommander lesmeilleures règles basées sur une règle de référence proposéepar l’utilisateur. Ensuite, l’utilisateur peut à la fois dirigerl’extraction et le post-traitement des règles en utilisant desopérateurs d’interaction appropriés.
– Nous avons développé un outil qui implémente toutes lesfonctionnalités de la méthodologie. Notre outil est basé sur unaffichage intuitif dans un environnement virtuel et prend encharge plusieurs méthodes d’interaction.
AbstractThis thesis is at the intersection of two active research areas :Association Rules Mining and Virtual Reality.The main limitations of the association rule extraction algorithms are(i) the large amount of the generated rules and (ii) their low quality.Several solutions have been proposed to address this problem suchas, the post-processing of association rules that allows rulevalidation and extraction of useful knowledge. Whereas rules areautomatically extracted by combinatorial algorithms, rulepost-processing is done by the user. Visualisation can help the userfacing the large amount of rules by representing them in visual form.In order to find relevant knowledge in visual representations, theuser needs to interact with these representations. To this aim, it isessential to provide the user with efficient interaction techniques.This work addresses two main issues : an association rulerepresentation that allows the user quickly detection of the mostinteresting rules and interactive exploration of rules. The first issuerequires an intuitive representation metaphor of association rules.The second requires an interactive exploration process allowing theuser to explore the rule search space focusing on interesting rules.The main contributions of this work can be summarised as follows :– We propose a new classification for Visual Data Mining
techniques, based on both 3D representations and interactiontechniques. Such a classification helps the user choosing avisual representation and an interaction technique for his/herapplication.
– We propose a new visualisation metaphor for association rulesthat takes into account the attributes of the rule, the contributionof each one, and their correlations.
– We propose a methodology for interactive exploration ofassociation rules to facilitate the user task facing large sets ofrules taking into account his/her cognitive capabilities. In thismethodology, local algorithms are used to recommend betterrules based on a reference rule which is proposed by the user.Then, the user can both drives extraction and post-processing ofrules using appropriate interaction operators.
– We developed a tool that implements all the methodologyfunctionality. The tool is based on an intuitive display in a virtualenvironment and supports multiple interaction methods.
Mots clésRègles d’association, Réalité virtuelle, fouille visuelle de données,Visualisation, Exploration Interactive de Règles.
Key WordsAssociation Rules Mining, Virtual Reality, Visualisation, Visual DataMining, Interactive Rules Exploration.
L’UNIVERSITÉ NANTES ANGERS LE MANS
Copyright © 2022 FDOKUMEN