
Thermodynamic and hydrodynamic response of compressed air energy storage reservoirs: a review
26
Rev Chem Eng 28 (2012): 123–148 © 2012 by Walter de Gruyter • Berlin • Boston. DOI 10.1515/revce-2012-0006 Thermodynamic and hydrodynamic response of compressed air energy storage reservoirs: a review Roy Kushnir, Amos Ullmann* and Abraham Dayan School of Mechanical Engineering, Tel Aviv University, Tel Aviv 69978, Israel, e-mail: [email protected] * Corresponding author Abstract Installation of large-scale compressed air energy storage (CAES) plants requires underground reservoirs capable of storing compressed air. In general, suitable reservoirs for CAES applications are either porous rock reservoirs or cav- ern reservoirs. Depending on the reservoir type, the cyclical action of air injection and subsequent withdrawal produces temperature and pressure fluctuations within the reservoir. An accurate prediction of these fluctuations is essential for the design of the reservoir and its associated turbomachinery. Being mutually dependent, the selection of the turbomachin- ery and reservoir characteristics must be conducted simultane- ously to obtain an integrated cost-effective plant. The present review is intended to encompass the pertinent literature on the temperature and pressure variations within CAES reservoirs. The principal experimental and operational data sources are described, as well as important results of theoretical modeling efforts. Conclusions derived from those investigations and their relevance to CAES plant designs are discussed. Keywords: cavern reservoirs; compressed air energy storage (CAES); porous rock reservoirs; underground storage. 1. Introduction Electrical energy supply is an intricate task that must provide a reliable and continuous energy service to consumers. All public utilities face the problem of economically meeting that goal, subject to fluctuating power demand. Seasonal differ- ences and daily fluctuations in power consumption require a sophisticated energy resources management. Representative summer and winter daily demand curves of Israel are shown in Figure 1. The trends seen are typical to Western countries, except that in colder countries the winter demand is higher than the summer demand. Clearly, the diurnal electric power consumption undergoes significant variations. It reaches its peak during day hours and drops to its trough at nighttime. In principle, to meet power demands, a utility operates within three generation level spans, as seen in Figure 2. The base load units operate continuously throughout the year and provide 40–60% of the peak demand. The units are typically large coal or nuclear facilities that have attractive efficiencies at relatively low fuel cost. Those units, however, are expen- sive to install and generally not flexible to follow fluctuating load demand. Another 30–40% of the load, representing the broad daily peak demand, are met by intermediate generating equipment. These usually consist of old and low-efficiency fossil-fuel units, renewable energy units, hydroelectric power units (wherever available), and gas-turbine units if needed. The remaining sharp peak demand is met primarily by gas turbines and to a lesser degree by hydroelectric turbines and diesel generators. Incorporation of energy storage facilities in the electri- cal power industry can reduce both pollution and fossil fuel depletion, and yet be economical. Energy storage systems should effectively transfer excess energy of base load units during low demand periods to periods of high demand (see Figure 2). This utilization of off-peak energy reduces the use of higher heat rate petroleum peaking systems and improves the capacity factor of the efficient base load units. The result can be an overall improvement of generating economics due to fuel cost savings and lower maintenance entailed by the uniform steady-state operating mode of the base load units. Energy storage systems also provide additional flexibility owing to their rapid response time and their ability to main- tain their efficiency at partial loads. Storage of excess base load power requires economical sys- tems capable of delivering several hours of output at power levels larger than 100 MW. To date, there are only two com- mercial large-scale energy storage technologies, the pumped hydroelectric storage (PHS) and the compressed air energy storage (CAES). There are over 100 GW provided by more than 200 PHS facilities in the world, representing roughly 3% of the global generating capacity (Chen et al. 2009). However, shortage of topographically suitable sites and objections by environmentalists limit additional expansion of this technol- ogy. In contrast, there are only two CAES facilities in operation (total of 431 MW); however, owing to a broad range of reser- voir options, the CAES technology has a potential of expand- ing and becoming significant in capacity. Faced with soaring energy prices, indeed worldwide researchers and developers are reviving the CAES technology (Patel 2008). The present review addresses the CAES technology, with particular focus on the pertinent literature of expected temper- ature and pressure variations within CAES reservoirs. First, the basic concepts of CAES are described (Section 2) along with the specifications of operational CAES plants. Section 3 addresses the specific characteristics of each type of storage reservoir (i.e., porous rock reservoirs, salt caverns, and hard rock caverns). Recommendations for the operational storage temperature and pressure ranges are also discussed. Reviews Brought to you by | Tel Aviv University (Tel Aviv University) Authenticated | 172.16.1.226 Download Date | 7/11/12 6:33 PM
Transcript of Thermodynamic and hydrodynamic response of compressed air energy storage reservoirs: a review

Rev Chem Eng 28 (2012): 123–148 © 2012 by Walter de Gruyter • Berlin • Boston. DOI 10.1515/revce-2012-0006
Thermodynamic and hydrodynamic response of compressed air energy storage reservoirs: a review
Roy Kushnir, Amos Ullmann * and Abraham Dayan
School of Mechanical Engineering , Tel Aviv University, Tel Aviv 69978 , Israel , e-mail: [email protected]
* Corresponding author
Abstract
Installation of large-scale compressed air energy storage (CAES) plants requires underground reservoirs capable of storing compressed air. In general, suitable reservoirs for CAES applications are either porous rock reservoirs or cav-ern reservoirs. Depending on the reservoir type, the cyclical action of air injection and subsequent withdrawal produces temperature and pressure fl uctuations within the reservoir. An accurate prediction of these fl uctuations is essential for the design of the reservoir and its associated turbomachinery. Being mutually dependent, the selection of the turbomachin-ery and reservoir characteristics must be conducted simultane-ously to obtain an integrated cost-effective plant. The present review is intended to encompass the pertinent literature on the temperature and pressure variations within CAES reservoirs. The principal experimental and operational data sources are described, as well as important results of theoretical modeling efforts. Conclusions derived from those investigations and their relevance to CAES plant designs are discussed.
Keywords: cavern reservoirs; compressed air energy storage (CAES); porous rock reservoirs; underground storage.
1. Introduction
Electrical energy supply is an intricate task that must provide a reliable and continuous energy service to consumers. All public utilities face the problem of economically meeting that goal, subject to fl uctuating power demand. Seasonal differ-ences and daily fl uctuations in power consumption require a sophisticated energy resources management. Representative summer and winter daily demand curves of Israel are shown in Figure 1 . The trends seen are typical to Western countries, except that in colder countries the winter demand is higher than the summer demand. Clearly, the diurnal electric power consumption undergoes signifi cant variations. It reaches its peak during day hours and drops to its trough at nighttime.
In principle, to meet power demands, a utility operates within three generation level spans, as seen in Figure 2 . The base load units operate continuously throughout the year and provide 40 – 60 % of the peak demand. The units are typically
large coal or nuclear facilities that have attractive effi ciencies at relatively low fuel cost. Those units, however, are expen-sive to install and generally not fl exible to follow fl uctuating load demand. Another 30 – 40 % of the load, representing the broad daily peak demand, are met by intermediate generating equipment. These usually consist of old and low-effi ciency fossil-fuel units, renewable energy units, hydroelectric power units (wherever available), and gas-turbine units if needed. The remaining sharp peak demand is met primarily by gas turbines and to a lesser degree by hydroelectric turbines and diesel generators.
Incorporation of energy storage facilities in the electri-cal power industry can reduce both pollution and fossil fuel depletion, and yet be economical. Energy storage systems should effectively transfer excess energy of base load units during low demand periods to periods of high demand (see Figure 2). This utilization of off-peak energy reduces the use of higher heat rate petroleum peaking systems and improves the capacity factor of the effi cient base load units. The result can be an overall improvement of generating economics due to fuel cost savings and lower maintenance entailed by the uniform steady-state operating mode of the base load units. Energy storage systems also provide additional fl exibility owing to their rapid response time and their ability to main-tain their effi ciency at partial loads.
Storage of excess base load power requires economical sys-tems capable of delivering several hours of output at power levels larger than 100 MW. To date, there are only two com-mercial large-scale energy storage technologies, the pumped hydroelectric storage (PHS) and the compressed air energy storage (CAES). There are over 100 GW provided by more than 200 PHS facilities in the world, representing roughly 3 % of the global generating capacity (Chen et al. 2009 ). However, shortage of topographically suitable sites and objections by environmentalists limit additional expansion of this technol-ogy. In contrast, there are only two CAES facilities in operation (total of 431 MW); however, owing to a broad range of reser-voir options, the CAES technology has a potential of expand-ing and becoming signifi cant in capacity. Faced with soaring energy prices, indeed worldwide researchers and developers are reviving the CAES technology (Patel 2008 ).
The present review addresses the CAES technology, with particular focus on the pertinent literature of expected temper-ature and pressure variations within CAES reservoirs. First, the basic concepts of CAES are described (Section 2) along with the specifi cations of operational CAES plants. Section 3 addresses the specifi c characteristics of each type of storage reservoir (i.e., porous rock reservoirs, salt caverns, and hard rock caverns). Recommendations for the operational storage temperature and pressure ranges are also discussed. Reviews
Brought to you by | Tel Aviv University (Tel Aviv University)Authenticated | 172.16.1.226
Download Date | 7/11/12 6:33 PM

124 R. Kushnir et al.: Thermodynamic and hydrodynamic response of CAES reservoirs
are offered for two problem classes, namely compressible air fl ow within CAES porous reservoirs and the thermody-namic conditions within CAES caverns. These are presented in Sections 4 and 5, respectively. Major experimental and operational data sources are described. Likewise, important
theoretical models and their results are reviewed. Summary and conclusions are presented in Section 6.
2. Overview of CAES technology
CAES is one promising venue to supply peaking power to electric utilities. A CAES plant provides the advantage of com-pressing air during off-peak hours to a relatively inexpensive underground reservoir, at the low cost of excess base-load electrical power. Later, during peak hours, the compressed air is released, heated (fi red), and then driven to the gas turbine expansion, which in turn run the electrical power generators. Additionally, the CAES technology could also support the exploitation of renewable energy resources, such as supportive storage of wind and solar energy for peak power consumption.
2.1. Main features
The standard CAES plant design consists of a compressor train, gas turbines, a motor generator unit, and an under-ground reservoir, as shown in Figure 3 . Essentially, CAES plants operate similarly to conventional gas turbines except that the compression and expansion stages operate indepen-dently at separate times. That decoupling and the incorpo-ration of intermediate storage of the compressed air are the principal attributes of the concept. The compressed air storage is accomplished through the incorporation of an underground reservoir. The uncoupling is done by a motor generator, which has a pair of clutches that enables it to act as a motor dur-ing compression (declutching the turbines) and as a generator during power generation (declutching the compressor train). Newer design propositions consider several combinations of compressors and expansion devices with more than one shaft, as subsequently discussed.
In contrast to a pure gas turbine plant, where around 40 – 60 % of the turbine output is needed for compression, a CAES plant can generate all of the turbine output. The elec-trical output of CAES plants is therefore about two to three
Inter-cooler
Undergroundreservoir
Motor/generator
Turbines
Recuperator
Compressor train
Valve
Fuel
Stack
Ambientair
LP LPHPHP
After-cooler
HP LP
Valve
Figure 3 Schematic diagram of a standard CAES plant design.
Pow
er d
eman
d
Time of day Midday Midnight
Typical winterday
Typical summerday
Figure 1 Representative daily load demands in Israel.
Time of day Midday Midnight
Base loadsupply
Intermediateload supply
Peak loadsupply
Excess energy
Peak energy
Pow
er d
eman
d
Figure 2 Typical diurnal base, intermediate and peak loads.
Brought to you by | Tel Aviv University (Tel Aviv University)Authenticated | 172.16.1.226
Download Date | 7/11/12 6:33 PM

R. Kushnir et al.: Thermodynamic and hydrodynamic response of CAES reservoirs 125
being reduced during operation. Alternatively, the air com-pression may supply a constant mass fl ow rate, which entails an increasing outlet pressure. Pressure changes in the latter case and fl ow rate changes in the former are subject to the underground storage physical characteristics. Theoretically, the compressor can work in a third way that matches its char-acteristics, and where both outlet pressure and mass fl ow rate would vary accordingly. These different ways of operations also apply to the discharge stage. Additionally, CAES systems can be designed to operate on either a daily or a weekly cycle. In a daily cycle, the same amount of air is injected and with-drawn each day. In a weekly cycle, during the fi rst 5 days air is withdrawn and partially injected (on a daily basis) so that the required extra charging is carried out during the weekend (there is no generation during weekends).
2.3. Thermodynamic performance indices
The thermodynamic performance of CAES plants is impor-tant because it determines, among other things, the energy requirements of the system, component sizes, and ultimately the costs of the ground and underground facilities. The fol-lowing parameters characterize the performance of CAES plants.
2.3.1. Component sizing parameters The physical sizes of the turbomachinery and cavern determine, to a great extent, the costs of the ground and underground facilities. The specifi c turbine air fl ow rate (kilogram per kilowatt-hour output) reveals the expected turbomachinery size and cost. A lower specifi c turbine fl ow rate requires smaller and cheaper turbomachinery. The specifi c storage volume (cubic meters of cavern volume required per kilowatt-hour output) is a measure of the size of the storage cavern.
2.3.2. Energy requirement parameters The operation of CAES requires energy input during two parts of the cycle. Electrical energy would be consumed during compression of the air before storage, and chemical energy (fuel) would be consumed during power generation to raise the air temperature before expansion. In this context, the specifi c compressor energy requirement (kilowatt-hour input per kilogram of air compressed) is essentially the electrical energy demand for compression. The plant heat rate (British thermal unit of fuel burned per kilowatt-hour output) indicates the chemical energy demand of the generation mode.
2.3.3. Overall plant performance parameters A single parameter for the merit of a CAES plant is not simple to defi ne, as it handles energy fl ows with different values (fuel, peak, and off-peak electric energy). This situation makes it diffi cult to describe CAES performance through a single index in a way that is universally useful. The common adopted parameters for evaluating the plant performance are the energy ratio (ER) and the primary energy effi ciency ( η pe ), which are defi ned as follows:
ER = E c / E g (1)
times greater than equivalent gas turbine plants. Furthermore, the uncoupling reduces the compressors ’ air mass fl ow rate as compared with that of the turbine owing to the longer duration of the compression stage than the expansion stage. Consequently, CAES plants require smaller compressors. The decreased cost of the compressors usually offsets the extra cost of the underground reservoir development, clutches, and all other auxiliary equipments. Additionally, from an environ-mental point of view, the improved performance entails an important advantage of reducing both the power plant pollu-tion and the depletion of fossil fuel resources.
The two existing CAES facilities (discussed in Section 2.4) are based on the standard design seen in Figure 3. In new CAES projects, alternative plant design options are considered with the aim of reducing capital and operating costs, subject also of meeting existing air emission standards free of addi-tional auxiliary equipment. One such advanced CAES design with air injection (CAES-AI) is described by Nakhamkin et al. (2009) . The design is based on off-shelf equipment that includes a standard combustion turbine on a separate shaft. Another design considered for commercialization gives pref-erence to the adiabatic CAES concept. There, heat from the hot compressed air is stored in specifi cally designed ther-mal energy storage (TES) system to heat the withdrawn air, thereby removing the need of fi ring that air. To be economi-cal, the capital cost of the TES system must be lower than the fi ring fuel cost.
2.2. Operational modes
CAES plants have three different modes of operation, namely charging, storage, and discharge. In the charging mode, at off-peak load periods, the motor is driven by excess base-load power and charges the air storage reservoir. Atmospheric air is compressed and injected into an underground reservoir. The air storage pressure is determined according to the res-ervoir characteristics, the subsurface geological conditions, and economical considerations. The compression train has intercoolers to reduce the compression work, and an after-cooler to reduce the temperature of the injected air. The lat-ter is important as it reduces the storage volume requirement, minimizes the thermal stresses on the reservoir walls (in cav-ern reservoirs), and reduces the air viscosity and associated losses (in porous rock reservoirs).
Following the charging stage, the plant enters its storage mode, where only heat and mass transport within the stor-age medium take place. Later, during peak load, the discharge mode is initiated. In the standard design, the compressed air is discharged to a combustion chamber where it is fi red. From there, the hot gas expands through a gas turbine (typically in two stages) to run the generator and produce electricity. A recuperator can be added to preheat the discharged air, before the combustion chamber, using the heat of turbine exhaust gases. Subsequently, the plant gets into a second “ storage ” mode, which closes the cycle.
In principle, CAES turbomachinery can operate in sev-eral ways. The compressor train may work with a constant outlet pressure, which implies that the air mass fl ow rate is
Brought to you by | Tel Aviv University (Tel Aviv University)Authenticated | 172.16.1.226
Download Date | 7/11/12 6:33 PM
126 R. Kushnir et al.: Thermodynamic and hydrodynamic response of CAES reservoirs
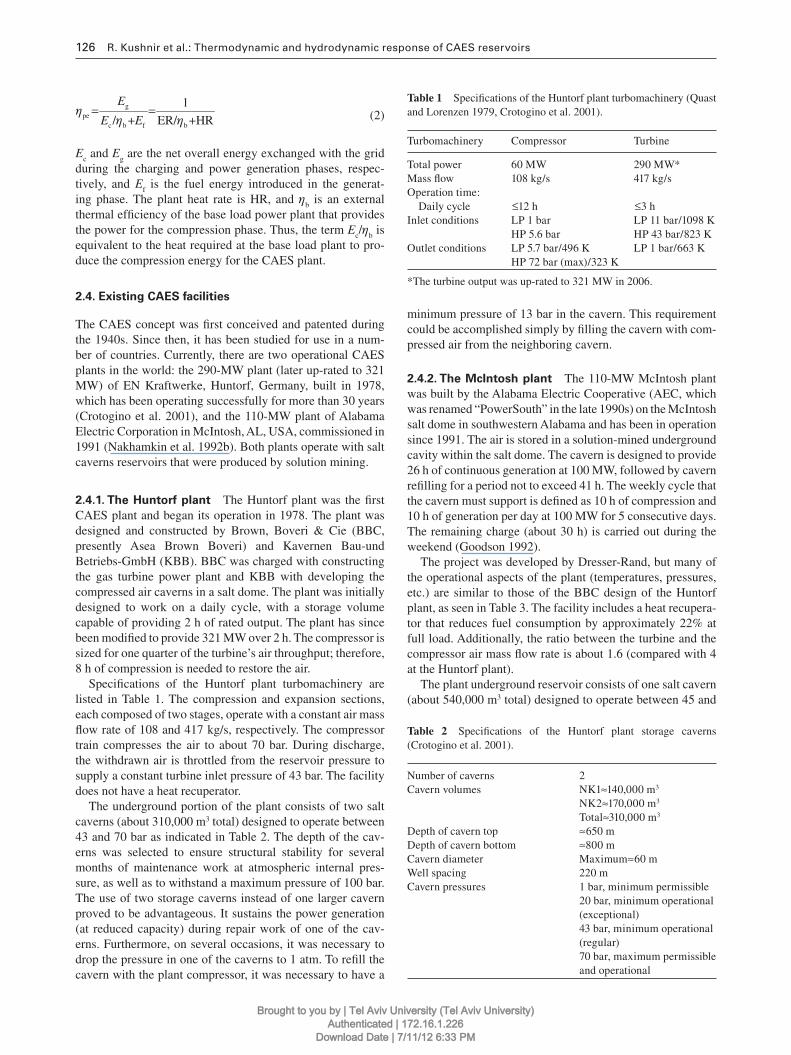
Table 1 Specifi cations of the Huntorf plant turbomachinery (Quast and Lorenzen 1979 , Crotogino et al. 2001 ).
Turbomachinery Compressor Turbine
Total power 60 MW 290 MW*Mass fl ow 108 kg/s 417 kg/sOperation time : Daily cycle
≤ 12 h
≤ 3 h
Inlet conditions LP 1 bar HP 5.6 bar
LP 11 bar/1098 K HP 43 bar/823 K
Outlet conditions LP 5.7 bar/496 K HP 72 bar (max)/323 K
LP 1 bar/663 K
*The turbine output was up-rated to 321 MW in 2006.
gpe
c b f b
1
/ + ER/ +HR
E
E Eη
η η= =
(2)
E c and E g are the net overall energy exchanged with the grid during the charging and power generation phases, respec-tively, and E f is the fuel energy introduced in the generat-ing phase. The plant heat rate is HR, and η b is an external thermal effi ciency of the base load power plant that provides the power for the compression phase. Thus, the term E c / η b is equivalent to the heat required at the base load plant to pro-duce the compression energy for the CAES plant.
2.4. Existing CAES facilities
The CAES concept was fi rst conceived and patented during the 1940s. Since then, it has been studied for use in a num-ber of countries. Currently, there are two operational CAES plants in the world: the 290-MW plant (later up-rated to 321 MW) of EN Kraftwerke, Huntorf, Germany, built in 1978, which has been operating successfully for more than 30 years (Crotogino et al. 2001 ), and the 110-MW plant of Alabama Electric Corporation in McIntosh, AL, USA, commissioned in 1991 (Nakhamkin et al. 1992b ). Both plants operate with salt caverns reservoirs that were produced by solution mining.
2.4.1. The Huntorf plant The Huntorf plant was the fi rst CAES plant and began its operation in 1978. The plant was designed and constructed by Brown, Boveri & Cie (BBC, presently Asea Brown Boveri) and Kavernen Bau-und Betriebs-GmbH (KBB). BBC was charged with constructing the gas turbine power plant and KBB with developing the compressed air caverns in a salt dome. The plant was initially designed to work on a daily cycle, with a storage volume capable of providing 2 h of rated output. The plant has since been modifi ed to provide 321 MW over 2 h. The compressor is sized for one quarter of the turbine ’ s air throughput; therefore, 8 h of compression is needed to restore the air.
Specifi cations of the Huntorf plant turbomachinery are listed in Table 1 . The compression and expansion sections, each composed of two stages, operate with a constant air mass fl ow rate of 108 and 417 kg/s, respectively. The compressor train compresses the air to about 70 bar. During discharge, the withdrawn air is throttled from the reservoir pressure to supply a constant turbine inlet pressure of 43 bar. The facility does not have a heat recuperator.
The underground portion of the plant consists of two salt caverns (about 310,000 m 3 total) designed to operate between 43 and 70 bar as indicated in Table 2 . The depth of the cav-erns was selected to ensure structural stability for several months of maintenance work at atmospheric internal pres-sure, as well as to withstand a maximum pressure of 100 bar. The use of two storage caverns instead of one larger cavern proved to be advantageous. It sustains the power generation (at reduced capacity) during repair work of one of the cav-erns. Furthermore, on several occasions, it was necessary to drop the pressure in one of the caverns to 1 atm. To refi ll the cavern with the plant compressor, it was necessary to have a
Table 2 Specifi cations of the Huntorf plant storage caverns (Crotogino et al. 2001 ).
Number of caverns 2Cavern volumes NK1 ≈ 140,000 m 3
NK2 ≈ 170,000 m 3 Total ≈ 310,000 m 3
Depth of cavern top ≈ 650 mDepth of cavern bottom ≈ 800 mCavern diameter Maximum ≈ 60 mWell spacing 220 mCavern pressures 1 bar, minimum permissible
20 bar, minimum operational (exceptional)43 bar, minimum operational (regular)70 bar, maximum permissible and operational
minimum pressure of 13 bar in the cavern. This requirement could be accomplished simply by fi lling the cavern with com-pressed air from the neighboring cavern.
2.4.2. The McIntosh plant The 110-MW McIntosh plant was built by the Alabama Electric Cooperative (AEC, which was renamed “ PowerSouth ” in the late 1990s) on the McIntosh salt dome in southwestern Alabama and has been in operation since 1991. The air is stored in a solution-mined underground cavity within the salt dome. The cavern is designed to provide 26 h of continuous generation at 100 MW, followed by cavern refi lling for a period not to exceed 41 h. The weekly cycle that the cavern must support is defi ned as 10 h of compression and 10 h of generation per day at 100 MW for 5 consecutive days. The remaining charge (about 30 h) is carried out during the weekend (Goodson 1992 ).
The project was developed by Dresser-Rand, but many of the operational aspects of the plant (temperatures, pressures, etc.) are similar to those of the BBC design of the Huntorf plant, as seen in Table 3 . The facility includes a heat recupera-tor that reduces fuel consumption by approximately 22 % at full load. Additionally, the ratio between the turbine and the compressor air mass fl ow rate is about 1.6 (compared with 4 at the Huntorf plant).
The plant underground reservoir consists of one salt cavern (about 540,000 m 3 total) designed to operate between 45 and
Brought to you by | Tel Aviv University (Tel Aviv University)Authenticated | 172.16.1.226
Download Date | 7/11/12 6:33 PM

R. Kushnir et al.: Thermodynamic and hydrodynamic response of CAES reservoirs 127
Table 3 Specifi cations of the McIntosh plant turbomachinery (Goodson 1992 , Holden et al. 2000 ).
Turbomachinery Compressor Turbine
Total power 50 MW 110 MWMass fl ow 90.7 kg/s 143 kg/sOperation time: Guarantee 41 h 26 h (at 100 MW) Weekly cycle 10 h (for 5 weeknights) 10 h (for 5 weekdays)
30 h (during weekend)Inlet conditions LP 1 bar LP 15 bar/1144 K
IP 4 bar/305 K HP 43 bar/811 KHP 24 bar/305 K
Outlet conditions LP 4 bar/453 K LP 1.04 bar/642 KIP 24 bar/413 KHP 74 bar (max)/322 K(after-cooler)
Table 4 Specifi cations of the McIntosh plant storage cavern (Nakhamkin et al. 1992a ,b).
Number of caverns 1Cavern volume ≈ 540,000 m 3 Depth of cavern top ≈ 460 mDepth of cavern bottom ≈ 760 mCavern diameter Top ≈ 60 m
Center ≈ 55 mBottom ≈ 28 m
Cavern pressures 45 bar minimum operational74 bar maximum operational
74 bar as indicated in Table 4 . The cavern has a shape of a tall slender cup with a height of approximately 300 m, and a diameter varying from 60 m near the cavern top, to 55 m at the center, and 28 m near the bottom. The top of the storage cavity is approximately 460 m below the surface.
2.4.3. Other facilities The Huntorf and McIntosh plants are the only commercial CAES plants currently in operation. Since the commissioning of these plants, CAES developments have ceased for a while. Since a decade ago, new CAES facilities were planned and are currently under development. The work on a 2700-MW plant (9 × 300 MW) project was initiated in 2001 at Norton, OH. The plan is to convert an idle limestone mine to an air storage reservoir. The project was initially approved by the Ohio Public Siting Board in 2001, but the construction was delayed for many years. In November 2009, FirstEnergy, a leading electric utility based in Akron, OH, obtained the development rights and plan on erecting the project.
Recently, prompted by the staggering growth of wind-powered capacity, the CAES technology is being considered to manage wind energy (Succar and Williams 2008 ). For that, the Iowa Association of Municipal Utilities began develop-ing an aquifer CAES facility in Dallas Center, IA, to directly support a wind farm. The Iowa Stored Energy Park (ISEP) a 270-MW CAES plant, as formally announced in December 2006, was expected to be operational in 2015. Unfortunately,
the project was terminated after 8 years of development owing to a site geological limitation discovery. Lessons learned in the development process are provided in the report of Schulte et al. (2012) . This was the fi rst project that intended to link a CAES facility directly to a wind energy source, and the fi rst to choose a porous rock for storage.
The electric power research institute (EPRI) is support-ing two new CAES projects for possible construction. One is a NYSEG (New York State Electric & Gas Corporation) 150 – 200-MW plant to be connected to an existing salt cav-ern for storage; the other is a PG&E (Pacifi c Gas & Electric) 300 – 400-MW plant with an underground air storage based on a depleted gas fi eld. Both projects are in their preliminary design, costing, and economic benefi ts examination. Project updates are periodically described in the EPRI CAES dem-onstration newsletters (my.epri.com). Separately, an adia-batic CAES project, called ADELE, is under development by RWE Power (Germany ’ s largest power producer) and indus-trial partners (Bieber et al. 2011 ). The preferred site for the plant is Stassfurt, located in a region marked for wind energy exploitation.
Besides the commercial facilities, there are also experimen-tal CAES facilities. A 20-MW CAES test facility was built in a fractured-rocks aquifer at Sesta, Italy (Dinelli et al. 1988 ). The facility operated for several years, but a geologic event disturbed the site and led to facility closure (Knoke 2002 ). In addition, Japan has a 2-MW pilot plant at Kami-sunagawa that comprises a hard-rock tunnel 6 m in diameter and 57 m in length (Ishihata 1997 ).
2.5. On the pressure and temperature within CAES
reservoirs
In spite the promising potential of the CAES technology, a limited number are in operation or planned to be constructed. This can be attributed to the diffi culty in locating proper and inexpensive geological formations. Additionally, all other common problems of gas turbines installation apply also to CAES plants (such as closeness to transmission lines and fuel supplies, and environmental concerns, like visual impact and noise). However, even if such a formation is located, incorpo-rating it as an underground reservoir may raise uncertainties regarding the air pressure and temperature variations within the reservoir, which is indispensable information for the design of CAES plants.
The design of CAES plants is based on predictions of the reservoir air pressure and temperature fl uctuations for two reasons. First, it determines the needed storage volume (in cavern reservoirs) or number of wells (in porous rock res-ervoirs), and also assures that the reservoir will operate within safe pressure and temperature limits. Second, it is a necessary information for the selection of the turbomachin-ery equipment. The compression equipment is one that must meet the maximal storage pressure, which occurs at the end of the charging stage. On the other hand, the reservoir pres-sure and temperature during discharge determine the turbine inlet pressure and the required fuel consumption. In prin-ciple, the economics of CAES plants highly depend on the
Brought to you by | Tel Aviv University (Tel Aviv University)Authenticated | 172.16.1.226
Download Date | 7/11/12 6:33 PM

128 R. Kushnir et al.: Thermodynamic and hydrodynamic response of CAES reservoirs
integration of the aboveground and underground reservoir specifi cations.
3. Classifi cation of CAES underground reservoirs
The siting of a CAES plant must be in the neighborhood of an economical underground reservoir capable of storing com-pressed air with negligible losses. Underground reservoirs that are suitable for CAES applications may be classifi ed into two general types: porous rock reservoirs and cavern reser-voirs. The latter consist of caverns in salt domes or beds and in low-permeability hard rocks. Each of those storage reser-voirs has its own specifi c characteristics.
3.1. Porous rock reservoirs
Porous rock formations such as aquifers or depleted gas reser-voirs are suitable storage media for CAES. Successful use of such formations as CAES reservoirs generally requires exis-tence of an impermeable overlaying dome-like cap rock, to inhibit upward and lateral escape of the compressed air, as seen in Figure 4 . In some cases, geologic faults could pro-duce vertical shifts of one or more sides of the formation and thereby provide lateral seal or seals. The bottom of the porous reservoir may be sealed by the presence of water (aquifers), or alternatively by impermeable rock (dry gas reservoirs).
The size of the reservoir, its porosity, and its permeability must be large enough to admit air at a required rate and com-pressor delivery pressure. Also, it must permit the recovery of the air at the required rate and turbine inlet pressure. All those requirements must be met with a reasonable number of wells. The wells and surface connection equipment are the most expensive part of the storage facility. Porous rock reservoirs have the potential of being the inexpensive choice for CAES applications, but nonetheless depend on the characteristics of the storage stratum (e.g., thinner, less-permeable structures will require more wells and therefore a higher development cost). In general, a porosity and permeability greater than
0.1 and 300 mD, respectively, are recommended (Allen et al. 1983 ).
3.1.1. Aquifers Aquifers are naturally occurring water-bearing porous media of permeable rock, sand, or gravel. Utilization of an aquifer for CAES requires a detailed geologic site characterization to ascertain whether it is actually suitable for CAES development. High-resolution seismic surveys can help defi ne the shape of a geologic structure, the thickness of a zone of interest, and the presence of viable cap rock. Following successful site characterization, the reservoir could be developed over the course of weeks or months. A continuous air injection through wells gradually displaces water, fi lls the void space, and forms a large air bubble, as seen in Figure 4. From this point on, the reservoir can begin its storage operations, namely cyclical air injection and withdrawal.
The air pressure in the reservoir, at static conditions, is equal to the local water pressure. The cyclical air injection and withdrawal produce pressure fl uctuations in the stored air. In general, these fl uctuations are determined by the res-ervoir characteristics, the number and size of the wells, and the operating conditions (fl ow rates, charging time, etc.). The recommended mean storage pressure is between 20 and 80 bar (Allen et al. 1983 ). Also, in aquifer reservoirs, suffi cient distance between the bottom of the wells and the air-water interface should be maintained (partially penetrating wells) to prevent undesired water suction during the discharge phase. It turns out that water suction is a factor that could severely limit the discharge air fl ow rate (see Section 4.4.2).
3.1.2. Depleted gas reservoirs Another possibility for air storage in porous formations is the use of depleted natural gas reservoirs. These reservoirs are formations that have already been evacuated from their recoverable gas. They constitute underground formations that are geologically capable of holding high-pressure gas. Incorporation of such CAES reservoirs facilitates the reservoir evaluation process as compared with aquifer evaluations, as historical records are usually available. Historical data provide valuable
Caprock
Injection-withdrawalwells
Water
Compressed air
Surface
Porous and permeable layer
Confinedaquifer
Sufficient depth to allowrequired pressure
Spillpoint
Figure 4 Schematic of an aquifer reservoir.
Brought to you by | Tel Aviv University (Tel Aviv University)Authenticated | 172.16.1.226
Download Date | 7/11/12 6:33 PM
R. Kushnir et al.: Thermodynamic and hydrodynamic response of CAES reservoirs 129
information such as fi eld size and depth, discovery pressure, and porous rock properties.
Depleted gas reservoirs could be dry and with an imperme-able basement rock, or could be sealed by water from below. Referring to the latter, following its content evacuation, the reservoir may be completely fi lled with water, except for a small gas cap. Hence, development and operation of such res-ervoirs is not different from aquifer reservoirs, but with an advantage stemming from the knowledge of its geologic char-acteristics. In dry reservoirs, at depletion, small amounts of unrecoverable gas may be left over. Therefore, the initial air withdrawals could be one of fl ammable mixture. To prevent damage of the surface facilities by such mixtures, any remain-ing gas should be removed or displaced away from the active air bubble volume. This can be achieved through established techniques that are practiced in various forms by the natural gas and petroleum industries (ANR Storage Company 1990 ). The advantage of dry reservoirs is that the wells can fully penetrate the air zone. In addition, operation can take place at any desired pressure that does not exceed the reservoir thresh-old pressure.
3.2. Cavern reservoirs
Cavern reservoirs offer several advantages over to porous rock reservoirs. An important one is that cavern storage is geologically feasible in many areas where porous media storage is not. An additional advantage is that there is no inherent limitation on deliverability fl ow rates, as opposed to porous media storage where injection and withdrawal rates are limited by the permeability of the reservoir and air-water interface stability. Furthermore, cavern reservoirs could be located at almost any desired depth below surface and are therefore less restrictive in terms of operational pressure and pressure fl uctuation limits. Suitable host lith-ologies for CAES caverns include salt domes or beds and low-permeability hard rocks.
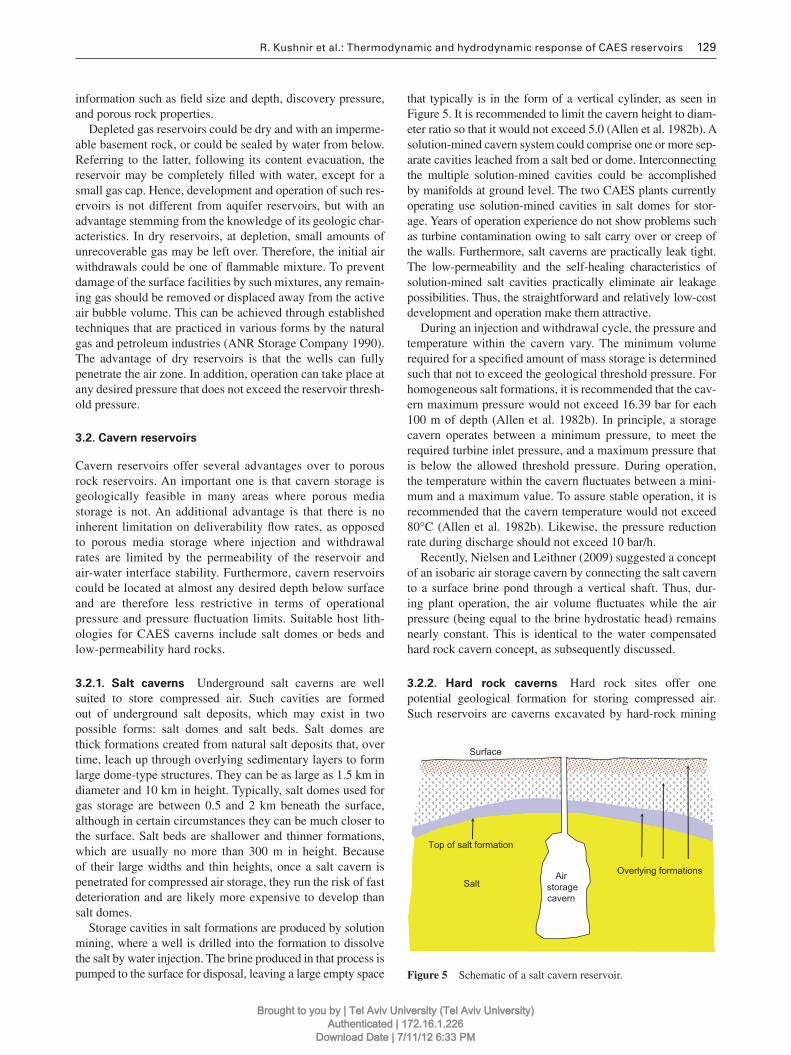
3.2.1. Salt caverns Underground salt caverns are well suited to store compressed air. Such cavities are formed out of underground salt deposits, which may exist in two possible forms: salt domes and salt beds. Salt domes are thick formations created from natural salt deposits that, over time, leach up through overlying sedimentary layers to form large dome-type structures. They can be as large as 1.5 km in diameter and 10 km in height. Typically, salt domes used for gas storage are between 0.5 and 2 km beneath the surface, although in certain circumstances they can be much closer to the surface. Salt beds are shallower and thinner formations, which are usually no more than 300 m in height. Because of their large widths and thin heights, once a salt cavern is penetrated for compressed air storage, they run the risk of fast deterioration and are likely more expensive to develop than salt domes.
Storage cavities in salt formations are produced by solution mining, where a well is drilled into the formation to dissolve the salt by water injection. The brine produced in that process is pumped to the surface for disposal, leaving a large empty space
Overlying formations Salt
Top of salt formation
Air storagecavern
Surface
Figure 5 Schematic of a salt cavern reservoir.
that typically is in the form of a vertical cylinder, as seen in Figure 5 . It is recommended to limit the cavern height to diam-eter ratio so that it would not exceed 5.0 (Allen et al. 1982b ). A solution-mined cavern system could comprise one or more sep-arate cavities leached from a salt bed or dome. Interconnecting the multiple solution-mined cavities could be accomplished by manifolds at ground level. The two CAES plants currently operating use solution-mined cavities in salt domes for stor-age. Years of operation experience do not show problems such as turbine contamination owing to salt carry over or creep of the walls. Furthermore, salt caverns are practically leak tight. The low-permeability and the self-healing characteristics of solution-mined salt cavities practically eliminate air leakage possibilities. Thus, the straightforward and relatively low-cost development and operation make them attractive.
During an injection and withdrawal cycle, the pressure and temperature within the cavern vary. The minimum volume required for a specifi ed amount of mass storage is determined such that not to exceed the geological threshold pressure. For homogeneous salt formations, it is recommended that the cav-ern maximum pressure would not exceed 16.39 bar for each 100 m of depth (Allen et al. 1982b ). In principle, a storage cavern operates between a minimum pressure, to meet the required turbine inlet pressure, and a maximum pressure that is below the allowed threshold pressure. During operation, the temperature within the cavern fl uctuates between a mini-mum and a maximum value. To assure stable operation, it is recommended that the cavern temperature would not exceed 80 ° C (Allen et al. 1982b ). Likewise, the pressure reduction rate during discharge should not exceed 10 bar/h.
Recently, Nielsen and Leithner (2009) suggested a concept of an isobaric air storage cavern by connecting the salt cavern to a surface brine pond through a vertical shaft. Thus, dur-ing plant operation, the air volume fl uctuates while the air pressure (being equal to the brine hydrostatic head) remains nearly constant. This is identical to the water compensated hard rock cavern concept, as subsequently discussed.
3.2.2. Hard rock caverns Hard rock sites offer one potential geological formation for storing compressed air. Such reservoirs are caverns excavated by hard-rock mining
Brought to you by | Tel Aviv University (Tel Aviv University)Authenticated | 172.16.1.226
Download Date | 7/11/12 6:33 PM
130 R. Kushnir et al.: Thermodynamic and hydrodynamic response of CAES reservoirs
techniques (i.e., tunnel boring machine, drilling, and blasting). Mined caverns could be located at almost any desired depth below surface and can include one or more separate cavities. Such caverns are typically horizontal and can have various cross sections (circular, ovoid, mushroom, arched roof, etc.). Generally, the quality of the rock improves with depth; however, any selected site would have to be studied carefully.
Several rock formations are potentially suitable for under-ground compressed air storage, in particular the sedimentary carbonate rocks limestones and dolomites, the igneous plu-tonic rocks granites and gabbros, and the metamorphic rocks quartzite and massive gneiss (Allen et al. 1982a ). In general, candidate rock types must have high structural strength, ade-quate volume, and low permeability. One major concern with rock storage caverns relates to leakage of the air. It is neces-sary to select a rock formation of suffi ciently low permeabil-ity that does not have an air leakage level that hurts the plant economics. An acceptable air loss may be limited to 4 % of the stored mass per day (Giramonti et al. 1978 ). In this respect, hard rock caverns for gas storage are classifi ed as lined and unlined caverns. The existence of a suffi ciently high ground-water pressure around an unlined cavern prevents gas leakage (Aberg 1977 ). This can be achieved by locating the caverns at a suffi cient depth or by installing a water curtain. In lined caverns, gas leakage is prevented by wall liners.
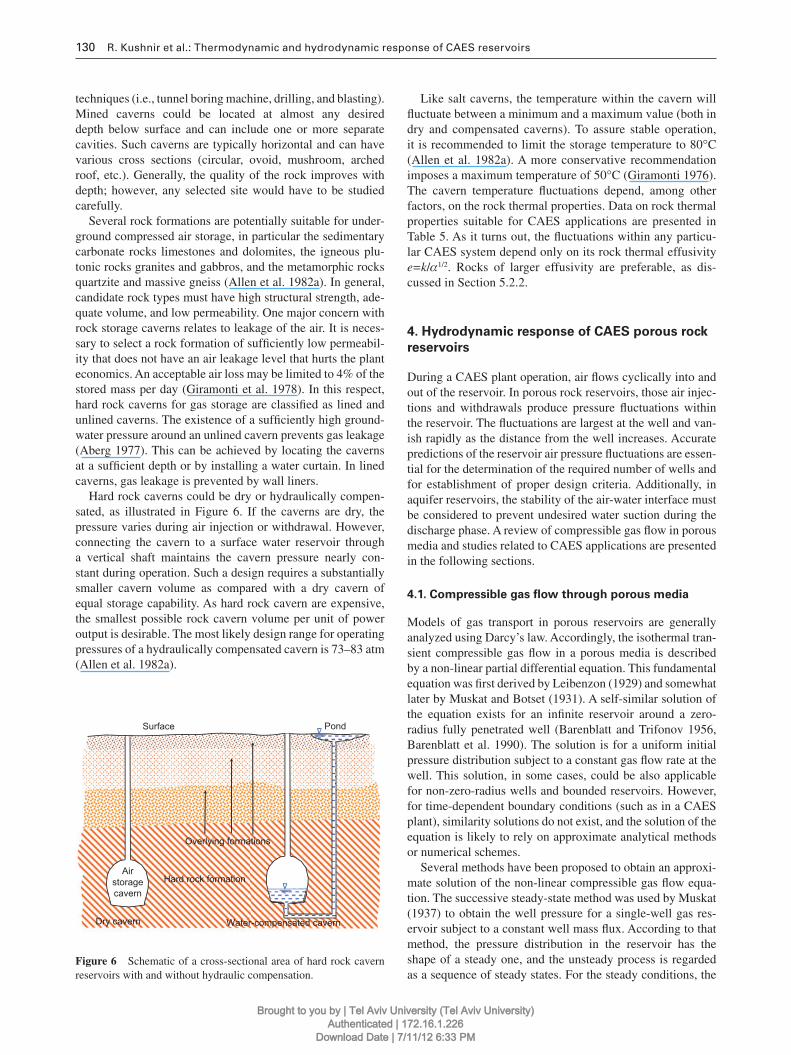
Hard rock caverns could be dry or hydraulically compen-sated, as illustrated in Figure 6 . If the caverns are dry, the pressure varies during air injection or withdrawal. However, connecting the cavern to a surface water reservoir through a vertical shaft maintains the cavern pressure nearly con-stant during operation. Such a design requires a substantially smaller cavern volume as compared with a dry cavern of equal storage capability. As hard rock cavern are expensive, the smallest possible rock cavern volume per unit of power output is desirable. The most likely design range for operating pressures of a hydraulically compensated cavern is 73 – 83 atm (Allen et al. 1982a ).
Overlying formations
Hard rock formation
Surface
Dry cavern
Pond
Water-compensated cavern
Airstoragecavern
Figure 6 Schematic of a cross-sectional area of hard rock cavern reservoirs with and without hydraulic compensation.
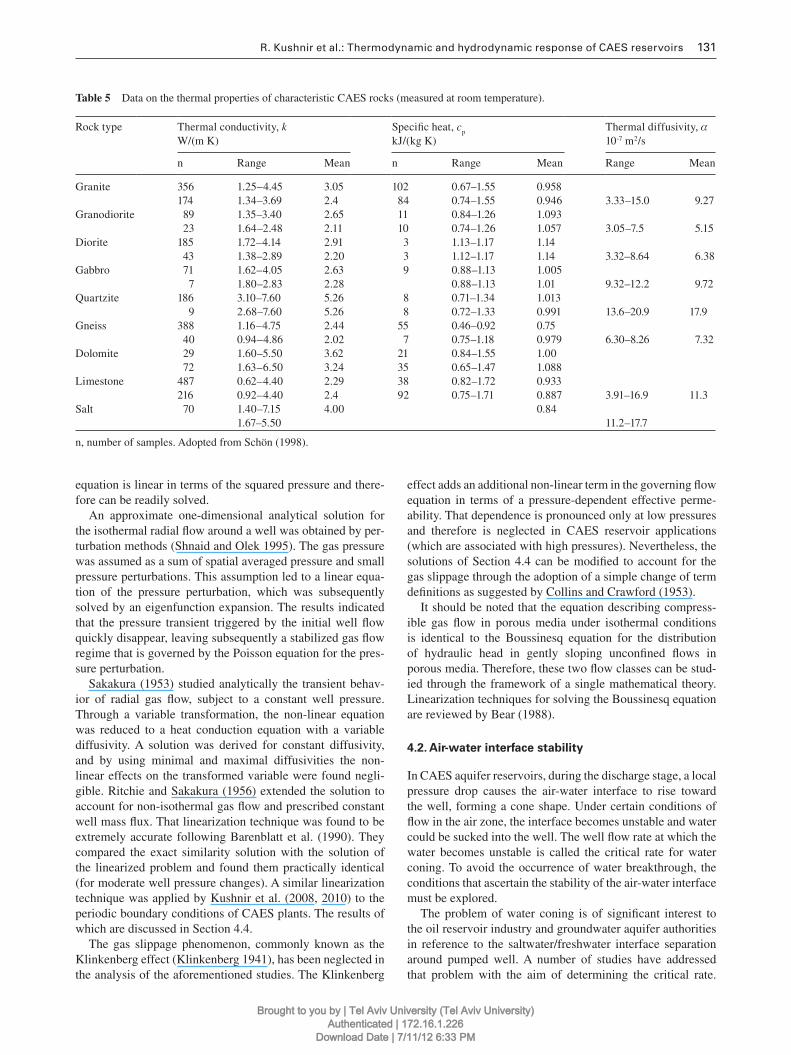
Like salt caverns, the temperature within the cavern will fl uctuate between a minimum and a maximum value (both in dry and compensated caverns). To assure stable operation, it is recommended to limit the storage temperature to 80 ° C (Allen et al. 1982a ). A more conservative recommendation imposes a maximum temperature of 50 ° C (Giramonti 1976 ). The cavern temperature fl uctuations depend, among other factors, on the rock thermal properties. Data on rock thermal properties suitable for CAES applications are presented in Table 5 . As it turns out, the fl uctuations within any particu-lar CAES system depend only on its rock thermal effusivity e = k / α 1/2 . Rocks of larger effusivity are preferable, as dis-cussed in Section 5.2.2.
4. Hydrodynamic response of CAES porous rock
reservoirs
During a CAES plant operation, air fl ows cyclically into and out of the reservoir. In porous rock reservoirs, those air injec-tions and withdrawals produce pressure fl uctuations within the reservoir. The fl uctuations are largest at the well and van-ish rapidly as the distance from the well increases. Accurate predictions of the reservoir air pressure fl uctuations are essen-tial for the determination of the required number of wells and for establishment of proper design criteria. Additionally, in aquifer reservoirs, the stability of the air-water interface must be considered to prevent undesired water suction during the discharge phase. A review of compressible gas fl ow in porous media and studies related to CAES applications are presented in the following sections.
4.1. Compressible gas fl ow through porous media
Models of gas transport in porous reservoirs are generally analyzed using Darcy ’ s law. Accordingly, the isothermal tran-sient compressible gas fl ow in a porous media is described by a non-linear partial differential equation. This fundamental equation was fi rst derived by Leibenzon (1929) and somewhat later by Muskat and Botset (1931) . A self-similar solution of the equation exists for an infi nite reservoir around a zero-radius fully penetrated well (Barenblatt and Trifonov 1956 , Barenblatt et al. 1990 ). The solution is for a uniform initial pressure distribution subject to a constant gas fl ow rate at the well. This solution, in some cases, could be also applicable for non-zero-radius wells and bounded reservoirs. However, for time-dependent boundary conditions (such as in a CAES plant), similarity solutions do not exist, and the solution of the equation is likely to rely on approximate analytical methods or numerical schemes.
Several methods have been proposed to obtain an approxi-mate solution of the non-linear compressible gas fl ow equa-tion. The successive steady-state method was used by Muskat (1937) to obtain the well pressure for a single-well gas res-ervoir subject to a constant well mass fl ux. According to that method, the pressure distribution in the reservoir has the shape of a steady one, and the unsteady process is regarded as a sequence of steady states. For the steady conditions, the
Brought to you by | Tel Aviv University (Tel Aviv University)Authenticated | 172.16.1.226
Download Date | 7/11/12 6:33 PM
R. Kushnir et al.: Thermodynamic and hydrodynamic response of CAES reservoirs 131
equation is linear in terms of the squared pressure and there-fore can be readily solved.
An approximate one-dimensional analytical solution for the isothermal radial fl ow around a well was obtained by per-turbation methods (Shnaid and Olek 1995 ). The gas pressure was assumed as a sum of spatial averaged pressure and small pressure perturbations. This assumption led to a linear equa-tion of the pressure perturbation, which was subsequently solved by an eigenfunction expansion. The results indicated that the pressure transient triggered by the initial well fl ow quickly disappear, leaving subsequently a stabilized gas fl ow regime that is governed by the Poisson equation for the pres-sure perturbation.
Sakakura (1953) studied analytically the transient behav-ior of radial gas fl ow, subject to a constant well pressure. Through a variable transformation, the non-linear equation was reduced to a heat conduction equation with a variable diffusivity. A solution was derived for constant diffusivity, and by using minimal and maximal diffusivities the non-linear effects on the transformed variable were found negli-gible. Ritchie and Sakakura (1956) extended the solution to account for non-isothermal gas fl ow and prescribed constant well mass fl ux. That linearization technique was found to be extremely accurate following Barenblatt et al. (1990) . They compared the exact similarity solution with the solution of the linearized problem and found them practically identical (for moderate well pressure changes). A similar linearization technique was applied by Kushnir et al. (2008 , 2010) to the periodic boundary conditions of CAES plants. The results of which are discussed in Section 4.4.
The gas slippage phenomenon, commonly known as the Klinkenberg effect (Klinkenberg 1941 ), has been neglected in the analysis of the aforementioned studies. The Klinkenberg
effect adds an additional non-linear term in the governing fl ow equation in terms of a pressure-dependent effective perme-ability. That dependence is pronounced only at low pressures and therefore is neglected in CAES reservoir applications (which are associated with high pressures). Nevertheless, the solutions of Section 4.4 can be modifi ed to account for the gas slippage through the adoption of a simple change of term defi nitions as suggested by Collins and Crawford (1953) .
It should be noted that the equation describing compress-ible gas fl ow in porous media under isothermal conditions is identical to the Boussinesq equation for the distribution of hydraulic head in gently sloping unconfi ned fl ows in porous media. Therefore, these two fl ow classes can be stud-ied through the framework of a single mathematical theory. Linearization techniques for solving the Boussinesq equation are reviewed by Bear (1988) .
4.2. Air-water interface stability
In CAES aquifer reservoirs, during the discharge stage, a local pressure drop causes the air-water interface to rise toward the well, forming a cone shape. Under certain conditions of fl ow in the air zone, the interface becomes unstable and water could be sucked into the well. The well fl ow rate at which the water becomes unstable is called the critical rate for water coning. To avoid the occurrence of water breakthrough, the conditions that ascertain the stability of the air-water interface must be explored.
The problem of water coning is of signifi cant interest to the oil reservoir industry and groundwater aquifer authorities in reference to the saltwater/freshwater interface separation around pumped well. A number of studies have addressed that problem with the aim of determining the critical rate.
Table 5 Data on the thermal properties of characteristic CAES rocks (measured at room temperature).
Rock type Thermal conductivity, k W/(m K)
Specifi c heat, c p kJ/(kg K)
Thermal diffusivity, α 10 -7 m 2 /s
n Range Mean n Range Mean Range Mean
Granite 356 1.25 – 4.45 3.05 102 0.67 – 1.55 0.958174 1.34 – 3.69 2.4 84 0.74 – 1.55 0.946 3.33 – 15.0 9.27
Granodiorite 89 1.35 – 3.40 2.65 11 0.84 – 1.26 1.093 23 1.64 – 2.48 2.11 10 0.74 – 1.26 1.057 3.05 – 7.5 5.15
Diorite 185 1.72 – 4.14 2.91 3 1.13 – 1.17 1.14 43 1.38 – 2.89 2.20 3 1.12 – 1.17 1.14 3.32 – 8.64 6.38
Gabbro 71 1.62 – 4.05 2.63 9 0.88 – 1.13 1.005 7 1.80 – 2.83 2.28 0.88 – 1.13 1.01 9.32 – 12.2 9.72
Quartzite 186 3.10 – 7.60 5.26 8 0.71 – 1.34 1.013 9 2.68 – 7.60 5.26 8 0.72 – 1.33 0.991 13.6 – 20.9 17.9
Gneiss 388 1.16 – 4.75 2.44 55 0.46 – 0.92 0.75 40 0.94 – 4.86 2.02 7 0.75 – 1.18 0.979 6.30 – 8.26 7.32
Dolomite 29 1.60 – 5.50 3.62 21 0.84 – 1.55 1.00 72 1.63 – 6.50 3.24 35 0.65 – 1.47 1.088
Limestone 487 0.62 – 4.40 2.29 38 0.82 – 1.72 0.933216 0.92 – 4.40 2.4 92 0.75 – 1.71 0.887 3.91 – 16.9 11.3
Salt 70 1.40 – 7.15 4.00 0.841.67 – 5.50 11.2 – 17.7
n, number of samples. Adopted from Sch ö n (1998) .
Brought to you by | Tel Aviv University (Tel Aviv University)Authenticated | 172.16.1.226
Download Date | 7/11/12 6:33 PM
132 R. Kushnir et al.: Thermodynamic and hydrodynamic response of CAES reservoirs
The pioneering work was conducted by Muskat and Wyckoff (1935) who coined the term “ water coning. ” They indicated the existence of a critical cone height and a corresponding critical fl ow rate. Beyond that height, the interface becomes unstable and water would fl ow into the well. They presented an approximate solution for the critical rate in oil wells by assuming that the heavier fl uid (water) is stationary and acts like an impervious boundary. They also assumed that the shape of the interface does not appreciably affect the oil potential distribution.
Wheatley (1985) was the fi rst to take into account the cone shape by requiring that the cone surface is in effect a stream-line. He postulated a potential function containing a linear combination of line and point sources with three adjustable parameters. By properly adjusting the parameters, Wheatley was able to satisfy closely all the boundary conditions. Included in his paper is a procedure for computing the criti-cal oil production rate. Later, Hoyland et al. (1989) presented a numerical model that also addresses the interface shape. Their results for the critical fl ow rate agree with Wheatley ’ s solution, while Muskat and Wyckoff ’ s approximation entails somewhat higher critical fl ow rates.
Muskat (1937) discussed the problem of water coning in gas reservoirs and noted that water coning will be harder to form in gas wells than in oil wells. This is due to the nature of the pressure distribution in gas reservoir (compared with oil reservoirs), and due to a larger density difference (water/gas compared with water/oil). He therefore argued that water coning will impose fewer diffi culties in wells producing from gas zones than in wells producing oil. Nevertheless, CAES reservoirs involve much larger fl ow rates than gas or oil res-ervoirs and water coning could impose signifi cant limitations on the discharge fl ow rates.
4.3. Field test data
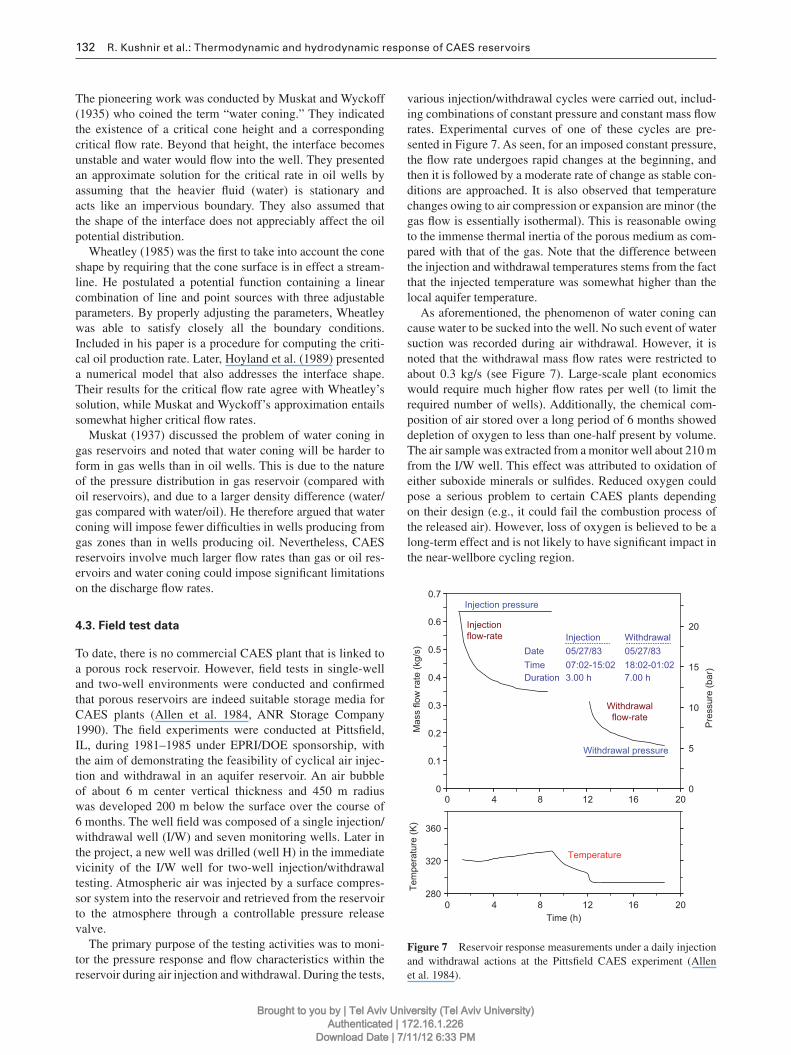
To date, there is no commercial CAES plant that is linked to a porous rock reservoir. However, fi eld tests in single-well and two-well environments were conducted and confi rmed that porous reservoirs are indeed suitable storage media for CAES plants (Allen et al. 1984 , ANR Storage Company 1990). The fi eld experiments were conducted at Pittsfi eld, IL, during 1981 – 1985 under EPRI/DOE sponsorship, with the aim of demonstrating the feasibility of cyclical air injec-tion and withdrawal in an aquifer reservoir. An air bubble of about 6 m center vertical thickness and 450 m radius was developed 200 m below the surface over the course of 6 months. The well fi eld was composed of a single injection/withdrawal well (I/W) and seven monitoring wells. Later in the project, a new well was drilled (well H) in the immediate vicinity of the I/W well for two-well injection/withdrawal testing. Atmospheric air was injected by a surface compres-sor system into the reservoir and retrieved from the reservoir to the atmosphere through a controllable pressure release valve.
The primary purpose of the testing activities was to moni-tor the pressure response and fl ow characteristics within the reservoir during air injection and withdrawal. During the tests,
2800 4 8 12 16 20
0 4 8 12 16 20
320
360
Time (h)
Tem
pera
ture
(K)
Temperature
0
0.1
0.2
0.3
0.4
0.5
0.6
0.7
Mas
s flo
w ra
te (k
g/s)
0
5
10
15
20
Pre
ssur
e (b
ar)
Withdrawal InjectionDateTimeDuration
05/27/8307:02-15:023.00 h
05/27/8318:02-01:027.00 h
Injection pressure
Withdrawal pressure
Injectionflow-rate
Withdrawalflow-rate
Figure 7 Reservoir response measurements under a daily injection and withdrawal actions at the Pittsfi eld CAES experiment (Allen et al. 1984 ).
various injection/withdrawal cycles were carried out, includ-ing combinations of constant pressure and constant mass fl ow rates. Experimental curves of one of these cycles are pre-sented in Figure 7 . As seen, for an imposed constant pressure, the fl ow rate undergoes rapid changes at the beginning, and then it is followed by a moderate rate of change as stable con-ditions are approached. It is also observed that temperature changes owing to air compression or expansion are minor (the gas fl ow is essentially isothermal). This is reasonable owing to the immense thermal inertia of the porous medium as com-pared with that of the gas. Note that the difference between the injection and withdrawal temperatures stems from the fact that the injected temperature was somewhat higher than the local aquifer temperature.
As aforementioned, the phenomenon of water coning can cause water to be sucked into the well. No such event of water suction was recorded during air withdrawal. However, it is noted that the withdrawal mass fl ow rates were restricted to about 0.3 kg/s (see Figure 7). Large-scale plant economics would require much higher fl ow rates per well (to limit the required number of wells). Additionally, the chemical com-position of air stored over a long period of 6 months showed depletion of oxygen to less than one-half present by volume. The air sample was extracted from a monitor well about 210 m from the I/W well. This effect was attributed to oxidation of either suboxide minerals or sulfi des. Reduced oxygen could pose a serious problem to certain CAES plants depending on their design (e.g., it could fail the combustion process of the released air). However, loss of oxygen is believed to be a long-term effect and is not likely to have signifi cant impact in the near-wellbore cycling region.
Brought to you by | Tel Aviv University (Tel Aviv University)Authenticated | 172.16.1.226
Download Date | 7/11/12 6:33 PM

R. Kushnir et al.: Thermodynamic and hydrodynamic response of CAES reservoirs 133
As seen in Figure 7, after several hours of air withdrawal, the fl ow rate approaches steady conditions. To examine the applicability of formulae developed for the natural gas indus-try to CAES studies, calculated steady-state fl ow rates were compared with measured data as seen in Figure 8 (ANR Storage Company 1990). The calculations were based on the deliverability equation for steady-state laminar radial fl ow of gases (Katz et al. 1959 )
( )( )
-6 2 2r e w
e w
0.703 10 -
ln
k H p pm
ZT r rμ
×=�
(3)
where m is the fl ow rate in million standard cubic feet per day (MMSCFD, at standard conditions of 60 ° F and 14.7 psi), p w and p e are the well bottom hole and reservoir edge pressures in psi, k r the permeability in millidarcies, H the gas layer height in feet, T the reservoir temperature in degrees Rankine, μ the gas viscosity at p e and T in centipoises, Z the gas compress-ibility factor at p e and T , and r e and r w are the reservoir exte-rior and well radii in feet. As seen in the fi gure, the actual well deliverability exceeded prediction by approximately 20 % .
4.4. Theoretical studies
The studies of CAES in porous rock reservoirs consist of air fl ow in dry porous rock reservoirs and in aquifers. In dry res-ervoirs, the wells are allowed to fully penetrate the air layer. For a single well, a one-dimensional radial fl ow model can be considered. In CAES aquifer reservoirs, partially penetrat-ing wells are used to prevent undesired water suction. The air fl ow near the well is therefore two-dimensional and axis-symmetrical. Moreover, instead of a fi xed impervious bottom boundary such as in dry reservoirs, a fl uctuating air-water interface must be addressed. In general, CAES models are based on the assumption that the reservoir can adequately be represented as a homogeneous (but not necessarily isotro-pic) porous space with both constant effective porosity and
10.01 0.1 1 10
10
100
1000
Air flow (MMSCFD)
(pe2 -p
w2 )/1
03 (psi
2 )
Calculation (Eq. 3)Measurement
Figure 8 I/W well deliverability performance: comparison between calculations and measurements (ANR Storage Company 1990).
permeability. Additionally, as revealed by the Pittsfi eld test results, the fl ow within the anisotropic reservoir porous space can be considered as isothermal if the injected air is cooled, approximately to the reservoir temperature.
Consider a partially penetrating well located in an aquifer reservoir as shown in Figure 9 . Initially, the porous rock res-ervoir contains a stationary air layer of height H and pressure P 0 , bounded by a water aquifer below and an impervious cap rock above. For a single-phase air fl ow with a sharp air-water interface, the continuity, Darcy, and generalized gas state equations lead to the following non-linear partial differential equation for the air pressure
2 2 2 2 2r z
2 2
1
2 2
p k p p k p
t f r r r f zμ μ
⎛ ⎞∂ ∂ ∂ ∂= + +⎜ ⎟∂ ∂ ∂ ∂⎝ ⎠
(4)
where μ is the air viscosity, f is the porosity, and k r and k z denote the medium permeability in the radial (horizontal) and vertical directions, respectively. To calculate the air pres-sure varying distribution within the reservoir, Eq. (4) is to be solved subject to the appropriate boundary conditions.
4.4.1. Horizontal fl ow in dry porous reservoirs In dry reservoirs, the air is bounded below by impermeable rocks and the well can fully penetrate the air zone. The air fl ow is therefore only horizontal. A numerical study on the behavior and suitability of an aquifer-based CAES was conducted by Ayers (1982) . The study referred to storage in aquifer reservoirs. However, the assumption of a fi xed air-water interface and the incorporation of fully penetrating wells essentially limit the study to dry porous reservoirs rather than aquifers. Two models of isothermal air fl ow have been developed by Ayers. The fi rst is a one-dimensional radial fl ow around a single well and the second is a two-dimensional horizontal fl ow around a multiple-well system. The solutions for the air pressure distribution around the well were obtained by a numerical integration of the governing differential equation. The models were used to design a well-fi eld system for a 1000-MW 10-h CAES plant, for several potential sites.
H
h
rw
r
z
Undisturbed interface
Compressed air
Discharge stageinterface
Charging stageinterface Water aquifer
η (r,t)
Figure 9 Schematic of a partially penetrating well in a CAES aquifer reservoir.
Brought to you by | Tel Aviv University (Tel Aviv University)Authenticated | 172.16.1.226
Download Date | 7/11/12 6:33 PM

134 R. Kushnir et al.: Thermodynamic and hydrodynamic response of CAES reservoirs
Kushnir et al. (2008) studied the pressure fl uctuations around a well of a CAES plant. An approximate analytical solution of Eq. (4) was derived for one-dimensional radial fl ow and typi-cal operating conditions; namely, two periods of constant well mass fl ow rate for the charging and discharging phases, and no fl ow in between. Additionally, the reservoir radius was assumed to be larger than the pressure fl uctuation penetration radius. Eq. (4) and the boundary conditions were simplifi ed through the introduction of a modifi ed pressure Φ , according to
2 2
0 0p P P= + Φ (5)
It turns out that for typical operating conditions and reser-voir characteristics, the non-linearity effects of the modifi ed pressure are negligible. Thus, the modifi ed pressure can be obtained from the solution of a linearized differential equa-tion. In particular, the following expressions for the modifi ed pressure at the well, were obtained
* * * * ** *s r 1 2
1* * * *c 3
2 4 (1 - ) (1 - )ln ln , 0
( ) (1 - )
t t t tt t
m C t t t
τ Γ + Γ += + < ≤
Γ Γ +�CDΦ
(6a)
* * * * ** * *s 1 21 2* * * *
c 3
2 ( - ) (1 - )ln ln ,
( ) (1 - )
t t t tt t t
m t t t
Φ Γ Γ += + < ≤
Γ Γ +�CD
(6b)
* * ** ** * *s r 312 3* * * *
c 2
2 4 (1 - )( - )ln - ln ,
( ) ( - )
t tt tt t t
m t C t t
Φ τ Γ +Γ= < ≤
Γ ΓCD
�
(6c)
* * * * ** *s 1 23* * * *
c 3
2 ( - ) ( - )ln ln , 1
( ) ( - )
t t t tt t
m t t t
Φ Γ Γ= + < ≤
Γ ΓCD
�
(6d)
where Γ is the Gamma function, C = e γ with γ being the Euler ’ s constant ( C = 1.781072 … ), and
* * *ss
0 w p
p r 0 p r * cr c2 2 2
w w r 0
, ,
R ,
r tr t
P r t
t k P t m Z Tm
r f r Hk P
ΦΦ
α μτ
μ π
≡ ≡ ≡
≡ ≡ ≡�
�
(7)
The subscript “ s ” in Φ indicates steady periodic solution. t 1 , t 2 - t 1 , and t 3 - t 2 are the compression, storage, and power generation duration times, respectively. t p is the cycle time period and r w the well radius. m c is the compressor mass fl ow rate and CD represents the discharging to charging mass fl ow ratio (equal also to the charging to discharging time ratio). Representative ranges of reservoir characteristic, operating conditions, and their corresponding dimensionless param-eters are listed in Table 6 . As seen in the table, both mc
* and τ r (which represent all the physical properties) have a wide range of applicable values. The remaining dimensionless parameters (the time intervals) are determined so as to meet the local power demand and production capacity.
Calculated reservoir pressures for a cycle period at dif-ferent radii are illustrated in Figure 10 A. As seen, the well
Table 6 Representative ranges of reservoir characteristics, operating conditions, and their corresponding dimensionless parameters for dry CAES reservoirs.
Variable Defi nitions Minimum value
Maximum value
Units
f Porosity 0.05 0.35 – k r Horizontal
permeability100 5000 mD
H Air layer height 5 25 m r w Well radius 0.05 0.6 m P 0 Initial air pressure 20 70 barm c Compressor fl ow rate 1 50 kg/s T Air temperature 290 400 K μ Air viscosity 1.8 × 10 -5 2.4 × 10 -5 Pa s t p Cycle time period 24 24 h Z Compressibility factor 0.99 1.01 – α r Pneumatic diffusivity,
k r P 0 /( μ f )0.02 40 m 2 /s
τ r t p α r / r w 2 5 × 10 3 1 × 10 9 m c
* m c μ ZR T/( π Hk r P 0 2 ) 8 × 10 -5 20
t 1 * t 1 / t p 6/24 12/24
t 2 * - t 1
* ( t 2 - t 1 )/ t p 2/24 8/24 t 3
* - t 2 * ( t 3 - t 2 )/ t p 2/24 10/24
pressure undergoes rapid changes at the beginning of each time interval (owing to the fl ow variations). Following those sharp responses, the pressure rate of change moderates as it approaches stable conditions. The curves reveal a diminution in amplitude and a progressive phase lag (although small) as r * increases. The pressure dependence on r * , at the end of each time interval, is seen in Figure 10B. Due to a small phase lag, the curves for t * = t 1
* and t * = t 3 * approximately rep-
resent the pressure envelop, which expectedly decreases as r * increases. It is clearly observed that the penetration of a well pressure fl uctuation into the reservoir does not exceed a certain distance; beyond that distance, the pressure oscil-lations are negligible. The penetration radius was found to be approximately equal to ( α r t p )
1/2 , where α r = k r P 0 /( f μ ) is the pneumatic diffusivity.
The dimensionless parameter mc* was found to be the most
infl uential on the well pressure oscillations. This can also be observed from inspection of Eqs. (6a)–(6d) where the modi-fi ed pressure is directly proportional to mc
*, while other param-eters appear only as logarithmical arguments. Therefore, designs of CAES in dry reservoirs must give preference to the smallest practical mc
* (e.g., larger H , k r , and P 0 , or smaller T and mc) in order to reduce pressure fl uctuations. In this context, it should be noted that only mc and P 0 can be con-sidered as design variables. In dry reservoirs, the designer must use the reservoirs as found, each having for instance its own unique height, discovery temperature, and permeability. Evidently, these reservoir parameters can markedly infl uence the range of air pressure variations, and should be considered when comparing candidate reservoir sites.
Given a porous reservoir, then by using several wells it is possible to reduce mc
* with its associated pressure fl uctuations. A decrease in pressure fl uctuations reduces the compressor cost and work and enlarges the turbine output. However, more
Brought to you by | Tel Aviv University (Tel Aviv University)Authenticated | 172.16.1.226
Download Date | 7/11/12 6:33 PM

R. Kushnir et al.: Thermodynamic and hydrodynamic response of CAES reservoirs 135
0.68
0.76
0.84
0.92
1.0
1.08
1.16
log(r*)
1
t3*
t2*
t3*t2
*
t*=t1*
0.680 0.2 0.4 0.6 0 0.5 1.51.0 2.0 3.02.50.8 1.0
0.76
0.84
0.92
1.0
1.08
1.16
t*
p s p s
Discharging
r*=1
22.25
256.35
951.65Charging Storage
Storage
t1*
A B
* *
Figure 10 Steady periodic dimensionless pressure oscillations for τ r = 5 × 10 5 , mc* = 0.05, t 1
* = 7/24, t 2 * = 14/24, and t 3
* = 18/24: (A) versus dimen-sionless time at different dimensionless radii; (B) versus dimensionless radius at different dimensionless times (Kushnir et al. 2008 ).
wells results in higher development cost. Therefore, the pre-ferred number of wells should be determined not only from technological considerations, but should also involve eco-nomic aspects. In addition, it is also possible to reduce mc
* by enlarging the initial air pressure P 0 . In dry porous reservoirs, the pressure P 0 can be different from the reservoir discovery pressure. Again, this has economic implications as the plant cost and power output depends on P 0 .
As aforementioned, all three – the charging time, the power generation time, and the resulting storage time – depend on the local power demand and production capacity. Realistic bounds for these time intervals are shown in Table 6. Evidently, for a given mass of stored air (i.e., mc
* t 1 * = const),
larger charging time spans, or power generation time spans, produce smaller pressure fl uctuations. It is therefore preferred to expand the compression and power generation time spans as much as possible to mitigate the pressure fl uctuations and associated losses.
4.4.2. Two-dimensional fl ow in aquifers In general, the radial fl ow solution is applicable to studies of dry reservoirs, in which the well can fully penetrate the air zone. In non-dry aquifer reservoirs, partially penetrating wells are used to prevent undesired water suction during the discharge phase. Consequently, the air fl ow near the well is two-dimensional and axis-symmetrical. Furthermore, instead of a fi xed impervious bottom boundary condition, a fl uctuating air-water interface must be addressed. As aforementioned, under certain conditions of fl ow in the air zone, the interface becomes unstable and water could be sucked into the well. Accordingly, it is necessary to avoid the condition of interface instability.
The air injection and withdrawal induces a two-phase (air-water) fl ow process. Numerical solutions of the two-phase fl ow equations for a partially penetrating single-well sub-ject to a weekly cycle were presented by Wiles and McCann (1981) . The work made part of an extensive CAES research effort conducted at the Pacifi c Northwest Laboratory, USA
(e.g., Smith et al. 1979 , Wiles 1979 ). The reservoir pressure fl uctuations were found to be highly sensitive to the well screen length. Also, it was shown that for certain operating conditions and reservoir characteristics, water can enter the well. Meiri and Karadi (1982) developed a numerical model for similar conditions (two-phase, two-dimensional, single-well) but subject to a daily cycle. They examined reservoir permeability effects and found that the air-water displacement is strongly infl uenced by it. The breadth of the transition zone (the zone where both air and water are present in the void space at various degrees of saturation) narrows with increas-ing permeability.
If the transition zone is considerably narrower than the air fl ow domain, it is justifi ed to assume that a sharp air-water interface would be representative, where a single-phase air fl ow exists in the upper domain. On the basis of that assump-tion, Braester and Bear (1984) developed a two-dimensional numerical model for a partially penetrating single-well sub-ject to a daily periodic cycling of constant air fl ow rates dur-ing compression and power generation. The model accounts for variations of the air-water interface location. The solution was obtained by the Galerkin fi nite-element method. In the range of the parameters studied, the air-water interface fl uc-tuations were found to be small. Calculations indicated that the well pressure fl uctuations were pronounced in cases of short well penetrations ( < 20 % of the gas layer height).
A theoretical investigation of the fl ow within CAES aqui-fer reservoirs, based on the assumption of a sharp air-water interface existence, was conducted by Kushnir et al. (2010) . Eq. (4) was solved subject to a daily cycling of constant mass fl ow rates during the charging and discharging phases. The modifi ed pressure of Eq. (5) was used to linearize the govern-ing equation. Additionally, the reservoir radius was assumed to be larger than the pressure fl uctuation penetration radius. As a fi rst approximation, the infl uence of the interface shape on the pressure distribution within the air zone was neglected. Consequently, the expressions for the maximum and minimum reservoir modifi ed pressures occurring on the well boundaries
Brought to you by | Tel Aviv University (Tel Aviv University)Authenticated | 172.16.1.226
Download Date | 7/11/12 6:33 PM

136 R. Kushnir et al.: Thermodynamic and hydrodynamic response of CAES reservoirs
ř
z*
0.00417
·
0.0030.0015
mc*
Criticalinterface
Wellh*=0.5
g*=0.035
τz=200
t1*=7/24
t2*=14/24
t3*=18/24
0.2
0.4
0.6
0.8
0
15 3 1 1 3 5
Figure 11 Calculated cross-sectional shapes of the air-water interface at the end of power generation stage for different m c
* ’ s.
at the ends of the compression and power generation stages are, respectively
( )
( )
* * *smax 1 2* * * *c 1 1 3
2 *2 * 2 *w
*2 *2 * 2 *w
2 (1 - )ln ln
4 ( ) (1 - )
- 21
ln
- 2
z t t
m C t t t
r h h h
hr h h h
τΦ
ˇ
ˇ
Γ += +Γ Γ +
⎛ ⎞⎛ ⎞+ + Γ⎜ ⎟⎜ ⎟⎝ ⎠⎜ ⎟+
⎜ ⎟⎛ ⎞+ Γ⎜ ⎟⎜ ⎟⎝ ⎠⎝ ⎠
CD&
(8a)
( )
( )
* * *smin 3 1* * * *c 3 3 2
2 *2 * 2 *w
*2 *2 * 2 *w
2 ( - )ln ln
( ) 4 ( - )
- 2
- ln
- 2
zt t
m t C t t
r h h h
hr h h h
τ
ˇ
ˇ
Γ= -Γ Γ
⎛ ⎞⎛ ⎞+ + Γ⎜ ⎟⎜ ⎟⎝ ⎠⎜ ⎟
⎜ ⎟⎛ ⎞+ Γ⎜ ⎟⎜ ⎟⎝ ⎠⎝ ⎠
&C D
CD
Φ
(8b)
where
rw
p z 0 p z*wzz 2 2
r
, , t k P trk h
hk H H H f H
ατ
μ≡ = ≡ ≡
(9)
where h is the well screen length (penetration length, see Figure 9), and the remaining dimensionless groups are defi ned in Eq. (7). It turns out that the range of pressure oscillations Δ p s
* = p s * max -
p s * min is highly dependent on h * . Clearly, to mitigate pressure
fl uctuations and associated losses, the well screen length must be extended as much as possible. On the other hand, larger penetrations run the risk of undesired water suction.
To investigate the risk of water suction in CAES reservoirs, the critical fl ow rate and interface height were determined in accordance with the concepts of Muskat and Wyckoff (1935) . Thus, the critical mass fl ow rate and interface rise are defi ned by two conditions stating that both the pressure and the verti-cal pressure gradient on each side of the interface are iden-tical. Accordingly, the equations determining the critical conditions are
z * = η *, (1 + Φ *) 1/2 = 1- g *(1- z *) (10)
( )( )
** * * * *
*, 2 1- 1-z g g z
z
Φη
∂= =∂
(11)
where
* * * w
0
= , = , gHz
z gH H P
ρηη =
(12)
where η denotes the interface location (see Figure 9) and ρ w is the water density. The left-hand side of Eq. (10) repre-sents the air pressure at the interface, and the right-hand side stands for the water pressure at the interface under hydrostatic conditions.
From the pressure distribution solution, the shape of the interface during discharge can be determined from Eq. (10). Calculated cross-sectional shapes of the air-water interface at the end of the power generation stage are illustrated in Figure
11 , for various values of m c* . Although, due to the nature of the
calculation, these curves are not fully accurate, they do have the general shape of expected streamline near an interface. In fact, they closely resemble the curves obtained experimentally by Farmen et al. (1999) . In the latter, the interface evolved from a fl at shape and rose to a bell-shaped curve, and then to a cusp-like form, a moment before breakthrough. It is also seen from the fi gure that unstable interface conditions are reached when the water surface is still at a distance from the well.
The highest interface rise occurs right beneath the well, approximately at the end of the withdrawal stage. Based on the pressure distribution solution, the modifi ed pressure beneath the well at that time is
* * *s 3 1
* * * *c 3 3 2
* * * *2
* * * * *2
2 ( - )ln - ln
( ) 4 ( - )
- ( - )sin
2 2- ln
( )sin
2 2
zt t
m t C t t
z h z h
h z h z h
τΦ
π
π
Γ=Γ Γ
⎛ ⎞ ⎛ ⎞Γ ⎜ ⎟ ⎜ ⎟⎝ ⎠ ⎝ ⎠
⎛ ⎞ ⎛ ⎞+ +Γ ⎜ ⎟ ⎜ ⎟⎝ ⎠ ⎝ ⎠
�CD
CD
(13)
When this expression is substituted in Eqs. (10) and (11), the critical mass fl ow rate and interface rise can be calculated. Results of such calculations are seen in Figure 12 , showing the critical dimensionless mass fl ow rate dependence on the relative well penetration for various values of g * . The pre-dicted trends agree with the results of previous investigations of steady oil wells ’ critical conditions (e.g., Wheatley 1985 , Hoyland et al. 1989 ). Evidently, critical fl ow rates are smaller for deeper well penetrations, with a markedly higher sensitiv-ity at deep penetrations. As it turns out, the critical fl ow rate strongly depends on the gas layer height, where a mild exten-sion of H entails a signifi cant increase of m c
cr . Representative ranges of the studied reservoir characteristics, operating con-ditions, and their corresponding dimensionless parameters for aquifer reservoirs are provided in Table 7 . Within the ranges
Brought to you by | Tel Aviv University (Tel Aviv University)Authenticated | 172.16.1.226
Download Date | 7/11/12 6:33 PM

R. Kushnir et al.: Thermodynamic and hydrodynamic response of CAES reservoirs 137
h*
0.02
0.050.1
10-4
0 0.2 0.4 0.6 0.8 1.0
10-3
10-2
10-1
m* c c
r
g* τz=100
t1*=7/24
t2*=14/24
t3*=18/24
·
Figure 12 Critical dimensionless fl ow rates versus relative well penetrations at different g * ’ s (Kushnir et al. 2010).
Table 7 Representative ranges of reservoir characteristics, operating conditions, and their corresponding dimensionless parameters for aquifer reservoirs (the remaining variables are listed in Table 6).
Variable Defi nitions Minimum value
Maximum value
Units
k z Vertical permeability 100 5000 mD ρ w Water density 930 1000 kg/m 3 α z Pneumatic diffusivity,
k z P 0 /( μ f )0.02 40 m 2 /s
τ z t p α z / H 2 3 1.3 × 10 5 r w ( k z / k r )
1/2 r w / H 3 × 10 -4 0.12m c
* m c* μ ZR T /( π Hk r P 0
2 ) 8 × 10 -5 20 g * ρ w gH / P 0 7 × 10 -3 0.12
listed in Tables 6 and 7, H and k r are the principal param-eters that affect the critical fl ow rate and should preferably be as large as possible. Additionally, prolongation of the power generation duration can signifi cantly increase the critical fl ow rate and therefore the well storage capacity.
Generally, the variables that can mitigate the pressure fl uc-tuations also stabilize the interface. The well screen length is excluded from such variables where larger well penetrations reduce both the pressure fl uctuations and the critical fl ow rate. A decrease in pressure oscillations is desirable because it reduces the compression work and enlarges the turbine out-put. However, lower critical fl ow rates would require drilling more wells. To elucidate these opposing effects, the critical fl ow rate and the corresponding pressure oscillations (calcu-lated at m c
* cr ) are plotted in Figure 13 . As seen, at small pen-etration, the pressure fl uctuation changes steeply, while the critical fl ow rate is only slightly affected. At high penetra-tion, the critical fl ow rate changes steeply, while the pressure fl uctuation is practically negligible. Obviously, the choice of the preferred screen length must be based on economics and should preferably be between 0.25 and 0.75 of the air layer height.
It is warranted to extend the discussion and address quan-titatively real critical fl ow rates. In this respect, the operating conditions of the Huntorf plant (Tables 1 and 2) were used to estimate how many wells are required to have a similar performance with an aquifer reservoir. For typical reservoir characteristics, at least 46 wells are needed for a 25 m air layer height (compressor fl ow rate 108 kg/s and critical fl ow rate 2.34 kg/s). Accordingly, for H = 15 m 149 wells, and for H = 5 m 1722 wells are needed. The calculation demonstrates that water coning could impose severe limitations, especially for large-scale plants. Consequently, CAES designs should be based on the smallest practical m c
* , for the reductions of the number of wells and pressure fl uctuations (i.e., enlarging the air layer height as much as possible). Note that as opposed to dry reservoirs, in aquifer reservoirs the air layer height is a design variable, while P 0 is purely imposed by the constant local hydrostatic head.
As seen in the aforementioned example, the storage of energy for urban commercial plants may require numer-ous wells. The subject of multiple overlapping well fi elds was not addressed in CAES studies except for the work of Ayers (1982) . However, it is worth noting that the linearized modifi ed pressure representation allows the extension of the single-well solution to solutions of multiple well fi elds by superposition. The modifi ed pressure at any point can be sim-ply calculated through the summation of each well contribu-tion. For that case, the compressor fl ow rate must feed all the wells. The fl ow rate distributions among the wells must be determined fi rst so as to satisfy a condition of equal pressure in all the wells (assuming negligible transmission losses).
5. Thermodynamic response of CAES cavern
reservoirs
The underground caverns of CAES plants are exposed to cyclical air injections and withdrawals. As a result, the cavern
h*
0
0.2
0.4
0.6
0.8
p s m
ax-p
s min
řw=0.015
Critical flowrate
Range of pressurefluctuations at criticalconditions
10-4
0 0.2 0.4 0.6 0.8 1.0
10-3
10-2
10-1
m* c c
r·
τz=100
t1*=7/24
t2*=14/24
t3*=18/24g*=0.05
**
Figure 13 Effects of the well penetration on the critical dimen-sionless fl ow rate and the corresponding range of pressure variations (Kushnir et al. 2010 ).
Brought to you by | Tel Aviv University (Tel Aviv University)Authenticated | 172.16.1.226
Download Date | 7/11/12 6:33 PM

138 R. Kushnir et al.: Thermodynamic and hydrodynamic response of CAES reservoirs
air temperature and pressure fl uctuate between maxima and minima values (occurring at the ends of the charge and dis-charge stages, respectively). As aforementioned, accurate predictions of the reservoir air pressure and temperature fl uc-tuations are required to determine the storage volume, and to assure that the reservoir will operate within safe pressure and temperature limits. The pressure reduction rate and the cavern wall temperature gradient are also factors that must be consid-ered and kept below their allowable values. Additionally, the withdrawal of air through the recuperator at undesirable low temperature may cause condensation of acidic material (in the turbine exhaust gases stream) on the recuperator walls, with consequent corrosion. To avoid that problem, it is important to maintain an adequate cavern minimum temperature. In addi-tion to the operational data of the existing CAES facilities, several theoretical studies on the response of underground caverns to CAES charge/discharge cycles have been carried out and are subsequently discussed.
5.1. Operational data
The two operational CAES plants provide valuable data on the temperature and pressure variations of their caverns, dur-ing injection and withdrawal actions. In the trial runs of the Huntorf plant, extensive measurements of temperature and pressure were carried out. Results of such daily measure-ments of the temperature and pressure in the cavern and at the wellhead, as presented by Quast and Crotogino (1979) , are seen in Figure 14 . During the diurnal cycle, the cavern was charged and discharged several times a day. The most impor-tant measurement fi nding implies that temperature variations during injection and withdrawal were much smaller than those predicted in the design phase. In fact, the temperature fl uctuations are substantially smaller than those calculated by adiabatic cavern assumption. Thus, heat transfer at the cavern walls plays an important role in reducing the cavern tempera-ture and pressure changes. Consequently, the Huntorf plant storage capacity is larger than anticipated.
As seen in Figure 14, the pressure differences between the cavern and the wellhead are almost identical throughout the cycle (and are close in value to the hydrostatic pressure differences). Thus, friction losses along the tubing are essen-tially much smaller than the hydrostatic pressure differences. Additionally, it is seen that during withdrawal, the air well-head temperature is smaller than the cavern temperature. According to Quast and Crotogino (1979) , the data analysis indicates that the fl ow along the tubing is practically adiabatic and the temperature difference can be attributed to adiabatic expansion. Likewise, during injection, the air temperature increases along the tubing in accordance to adiabatic com-pression. Note that, during injections, the wellhead measure-ments refl ect the after-cooler conditions and therefore the wellhead temperature is nearly constant.
Performance test results from the McIntosh plant are pro-vided by Nakhamkin et al. (1993) . The temperatures and pres-sures measured at the wellhead during the tests are shown in Figure 15 . To verify the net energy storage available, a com-plete cavern discharge test was preformed. During the test, the
20
30
40
50
Time (h)
Tem
pera
ture
(°C
)
-200
-100
0
100
Mas
s flo
w ra
te (k
g/s)
WellheadCavern
40
50
60
Time (h)
Pre
ssur
e (b
ar)
-2000 4 8 12 16 20 24
0 4 8 12 16 20 24
-100
0
100
Mas
s flo
w ra
te (k
g/s)
WellheadCavern
Figure 14 Measurements of pressure, temperature, and port fl ow rate of cavern NK1 during a daily trial run (Quast and Crotogino 1979 ).
plant delivered a power of 100 MW for 27 h and 46 min until it reached the minimum design cavern pressure (exceeded the guaranteed 26 h). After approximately 3 h, the cavern was recharged for 40 h and 50 min (to restore the air consumed during the total discharge test). This was accomplished with-out exceeding both the cavern maximum pressure and the guaranteed compression energy consumption. Again, it fol-lows that the temperature transient assumptions of the design phase were conservative and the actual temperatures changes during injection and withdrawal are smaller than predicted.
5.2. Theoretical studies
Consider an underground storage cavern of constant volume V , located at a certain depth below the surface, which is ini-tially fi lled with compressed air at a pressure P 0 and tempera-ture T 0 (equaling surrounding rock temperature). The cavern is either vertical (salt cavern) or horizontal (hard rock cav-ern), as illustrated in Figure 16 . During a CAES plant opera-tion, air fl ows cyclically into and out of the cavern. Most of the CAES studies considered the condition of uniform tem-perature, density, and pressure throughout the storage space.
Brought to you by | Tel Aviv University (Tel Aviv University)Authenticated | 172.16.1.226
Download Date | 7/11/12 6:33 PM

R. Kushnir et al.: Thermodynamic and hydrodynamic response of CAES reservoirs 139
40
60
80
100
0 10 20 30 40 50 60 70 80
Time (h)
Pre
ssur
e (b
ar)
260
280
300
320
Tem
pera
ture
(K)
Test for time and energyconsumed to recharge thecavern
Total energystorage test
Wellheadtemperature
Wellheadpressure
Figure 15 Wellhead pressure and temperature variations during performance tests at the McIntosh plant (Nakhamkin et al. 1993 ). Consult Table 3 for injection and withdrawal fl ow rates.
Compressedair
Compressedair
Rockformation
Rockformation
T, p T, p
mi · mi
·me· me
·
Figure 16 Schematic of horizontal and vertical underground air storage caverns in rock formation.
This is a reasonable assumption owing to both the air circu-lation and the slow rates of temperature variations. Hence, upon defi ning the cavern port and walls as the boundaries of a control volume, and applying the mass and energy conserva-tion equations subject to the generalized gas state equation, one obtains
i e l
d( )- ( )- ( )
dV m t m t m t
t
ρ= � � �
(14)
( )
v i i
e l
d( ) - R -
d
- ( ) ( ) R -
T
T
T uV c m t h h Z T
t
um t m t Z T Q
ρ ρρ
ρρ
⎛ ⎞⎛ ⎞∂= +⎜ ⎟⎜ ⎟∂⎝ ⎠⎝ ⎠
⎛ ⎞⎛ ⎞∂+ +⎜ ⎟⎜ ⎟∂⎝ ⎠⎝ ⎠
�
�� �
(15)
p = Z ρ R T (16)
u and h are the specifi c internal energy and enthalpy, and c v and Z are the constant volume-specifi c heat and compressibil-ity factor of the air. Q stands for the heat transfer rate across the cavern walls. The subscript “ i ” denotes the inlet air condi-tions and the subscript “ e ” designates the outlet air conditions at the cavern port. The subscript “ l ” stands for the air leak-age across the cavern walls. The kinetic and potential energy changes are insignifi cant even in tall caverns (Kushnir et al. 2012a ), and therefore are ignored.
Although a considerable amount of studies exist on CAES, only few address in depth the temperature and pressure char-acteristics of CAES caverns. The studies can be divided into two groups, those that account for the air heat transfer to the cavern walls and those that adopt the adiabatic walls assump-tion. Given the air thermodynamic properties, for adiabatic and impermeable cavern walls ( Q = 0, m l = 0), the cavern air temperature and pressure fl uctuations can be derived from
Eqs. (14) – (16). For non-adiabatic conditions or permeable cavern walls, predictions of temperature and pressure fl uctua-tions require additional specifi c laws for the heat transfer and air leakage terms.
5.2.1. Adiabatic caverns Although heat transfer through the cavern walls may have an infl uencing role, the study of adiabatic reservoirs has merit for several reasons. First, it provides a reference solution, which is a limiting case for conditions of negligible heat transfer through the cavern walls. Second, it offers clear analytical solutions that shed light on the thermodynamic behavior of the air during cycle phases of compression and discharge. Furthermore, it provides a tool to examine and choose the most suitable thermodynamic state equation of air that yields a simple, yet representative, model.
In this context, the temperature changes in cavern reservoirs were treated by Osterle (1991) , who performed a thermody-namic analysis of a simple CAES plant, based on the fi rst and second laws. The air was considered to be an ideal gas and the cavern to be adiabatic. A solution for the air temperature was developed for the cavern pressurization, from a minimum to a maximum pressure, and back to the minimum. The injected air was assumed to be cooled to the cavern initial temperature. It is shown that following a series of charge/discharge cycles, the reservoir maximum and minimum temperatures approach asymptotic limits (i.e., steady periodic conditions).
Skorek and Banasiak (2006) performed thermodynamic analyses of CAES systems, which included cavern tempera-ture and pressure calculations for a steady charge/discharge cycle at two different minimum cavern pressures (i.e., 1.6 and 6.0 MPa). They incorporated the assumptions of semi-ideal gases and adiabatic cavern walls. Their results of the semi-ideal gas model fall well within the range of the ideal gas and the real gas model predictions (see Figure 17 ), as subse-quently discussed. It should be noted that both Osterle (1991) and Skorek and Banasiak (2006) focused their analyses on the
Brought to you by | Tel Aviv University (Tel Aviv University)Authenticated | 172.16.1.226
Download Date | 7/11/12 6:33 PM
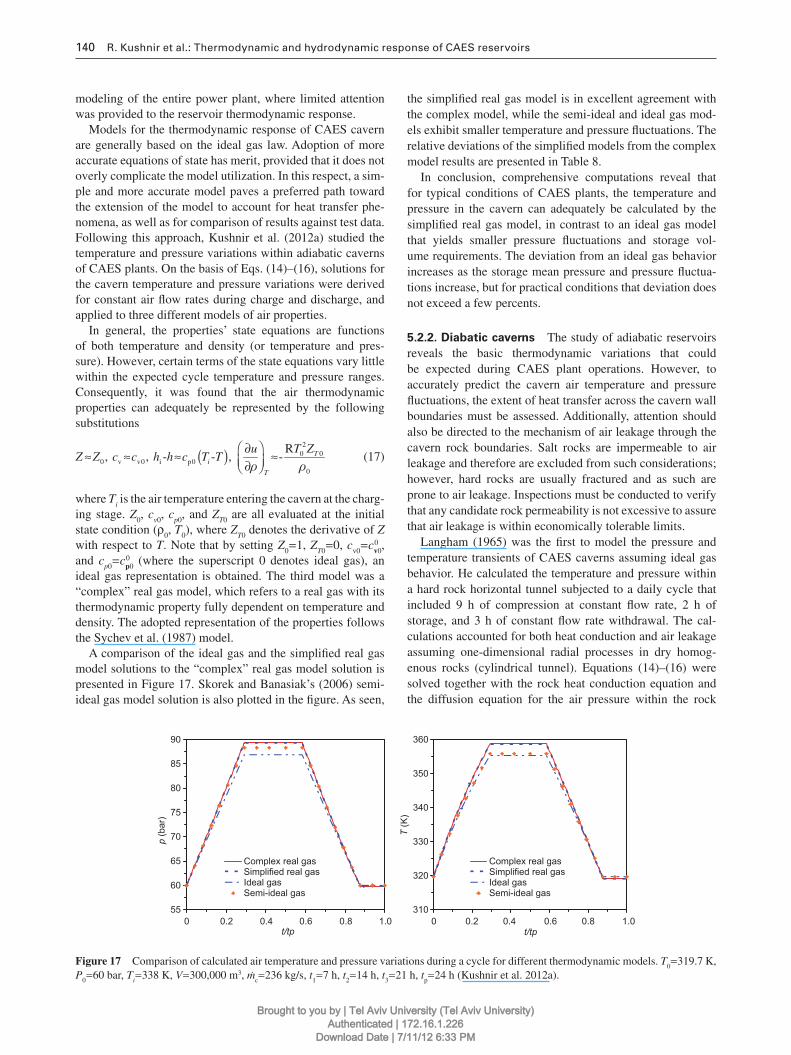
140 R. Kushnir et al.: Thermodynamic and hydrodynamic response of CAES reservoirs
modeling of the entire power plant, where limited attention was provided to the reservoir thermodynamic response.
Models for the thermodynamic response of CAES cavern are generally based on the ideal gas law. Adoption of more accurate equations of state has merit, provided that it does not overly complicate the model utilization. In this respect, a sim-ple and more accurate model paves a preferred path toward the extension of the model to account for heat transfer phe-nomena, as well as for comparison of results against test data. Following this approach, Kushnir et al. (2012a) studied the temperature and pressure variations within adiabatic caverns of CAES plants. On the basis of Eqs. (14) – (16), solutions for the cavern temperature and pressure variations were derived for constant air fl ow rates during charge and discharge, and applied to three different models of air properties.
In general, the properties ’ state equations are functions of both temperature and density (or temperature and pres-sure). However, certain terms of the state equations vary little within the expected cycle temperature and pressure ranges. Consequently, it was found that the air thermodynamic properties can adequately be represented by the following substitutions
( )
20 0
0 v v0 i p00
R, , - - , - T
i
T
T ZuZ Z c c h h c T T
ρ ρ
⎛ ⎞∂≈ ≈ ≈ ≈⎜ ⎟∂⎝ ⎠ (17)
where T i is the air temperature entering the cavern at the charg-ing stage. Z 0 , c v 0 , c p 0 , and Z T 0 are all evaluated at the initial state condition ( ρ 0 , T 0 ), where Z T 0 denotes the derivative of Z with respect to T . Note that by setting Z 0 = 1, Z T 0 = 0, c v0 = c0
v0, and c p 0 = c0
p0 (where the superscript 0 denotes ideal gas), an ideal gas representation is obtained. The third model was a “ complex ” real gas model, which refers to a real gas with its thermodynamic property fully dependent on temperature and density. The adopted representation of the properties follows the Sychev et al. (1987) model.
A comparison of the ideal gas and the simplifi ed real gas model solutions to the “ complex ” real gas model solution is presented in Figure 17. Skorek and Banasiak ’ s (2006) semi-ideal gas model solution is also plotted in the fi gure. As seen,
310
320
330
340
350
360
t/tp
T (K
)
Complex real gasSimplified real gasIdeal gasSemi-ideal gas
550 0.2 0.4 0.6 0.8 1.0
60
65
70
75
80
85
90
t/tp0 0.2 0.4 0.6 0.8 1.0
p (b
ar)
Complex real gasSimplified real gasIdeal gasSemi-ideal gas
Figure 17 Comparison of calculated air temperature and pressure variations during a cycle for different thermodynamic models. T 0 = 319.7 K, P 0 = 60 bar, T i = 338 K, V = 300,000 m 3 , m c = 236 kg/s, t 1 = 7 h, t 2 = 14 h, t 3 = 21 h, t p = 24 h (Kushnir et al. 2012a).
the simplifi ed real gas model is in excellent agreement with the complex model, while the semi-ideal and ideal gas mod-els exhibit smaller temperature and pressure fl uctuations. The relative deviations of the simplifi ed models from the complex model results are presented in Table 8 .
In conclusion, comprehensive computations reveal that for typical conditions of CAES plants, the temperature and pressure in the cavern can adequately be calculated by the simplifi ed real gas model, in contrast to an ideal gas model that yields smaller pressure fl uctuations and storage vol-ume requirements. The deviation from an ideal gas behavior increases as the storage mean pressure and pressure fl uctua-tions increase, but for practical conditions that deviation does not exceed a few percents.
5.2.2. Diabatic caverns The study of adiabatic reservoirs reveals the basic thermodynamic variations that could be expected during CAES plant operations. However, to accurately predict the cavern air temperature and pressure fl uctuations, the extent of heat transfer across the cavern wall boundaries must be assessed. Additionally, attention should also be directed to the mechanism of air leakage through the cavern rock boundaries. Salt rocks are impermeable to air leakage and therefore are excluded from such considerations; however, hard rocks are usually fractured and as such are prone to air leakage. Inspections must be conducted to verify that any candidate rock permeability is not excessive to assure that air leakage is within economically tolerable limits.
Langham (1965) was the fi rst to model the pressure and temperature transients of CAES caverns assuming ideal gas behavior. He calculated the temperature and pressure within a hard rock horizontal tunnel subjected to a daily cycle that included 9 h of compression at constant fl ow rate, 2 h of storage, and 3 h of constant fl ow rate withdrawal. The cal-culations accounted for both heat conduction and air leakage assuming one-dimensional radial processes in dry homog-enous rocks (cylindrical tunnel). Equations (14) – (16) were solved together with the rock heat conduction equation and the diffusion equation for the air pressure within the rock
Brought to you by | Tel Aviv University (Tel Aviv University)Authenticated | 172.16.1.226
Download Date | 7/11/12 6:33 PM

R. Kushnir et al.: Thermodynamic and hydrodynamic response of CAES reservoirs 141
Table 8 Relative deviations of the predicted temperatures and pressures from the complex real gas model predictions (in % ) for the conditions of Figure 17 (Kushnir et al. 2012a ).
Model T s,max T s,max - T s,min p s,max p s,max - p s,min
Ideal gas 0.94 8.66 2.75 8.38Semi-ideal gas 0.79 7.16 1.12 3.41Simplifi ed real gas 0.016 0.146 0.018 0.055
porous space. The heat transfer rate across the cavern walls was expressed as
( )c c w -RQ h A T T=� (18)
where h c is the heat transfer coeffi cient, A c the tunnel surface area, and T R w is the tunnel wall temperature. The heat transfer coeffi cient between the air and the tunnel walls was approxi-mated by
Nu = B ( Gr ) 1/3 (19)
where Nu and Gr are the Nusselt and Grashof numbers, and B is a constant coeffi cient. The calculations show that the rock thermal properties infl uence the tunnel temperature fl uc-tuations and thereby the required storage volume for a given size of generating station. Additionally, the air leakage rate was found to be highly dependent on the rock permeability. Likewise, the tunnel radius has a marked effect on the tunnel air temperature and air leakage rate. It should be noted that the air leakage process would preferably drive the air toward the nearby ground surface (in a three dimensional manner) rather than to extremely distant rock locations. Thus, a one-dimensional radial air fl ow is an approximate representation.
Vosburgh and Kosky (1977) calculated the temperature and pressure variations in a single salt cavern for a weekly CAES cycle. The work was part of a conceptual design of an 800-MW CAES plant. Their model is based on the mass and energy conservation [Eqs. (14) and (15) excluding leakage], where the air was considered to be ideal gas. The heat trans-fer calculations were based on one-dimensional radial heat conduction within the salt and modeled by fi nite difference methods, subject to a constant heat convection coeffi cient at the cavern walls (of 10 W/m 2 Κ ). The calculations cover a period of 10 weekly cycles. It is shown that the wall heat transfer reduces the cycle pressure swings as compared with adiabatic conditions. Additionally, in each cycle, the process drives a net amount of energy into the surrounding salt by conduction.
The cavern temperature and pressure fl uctuations were obviously modeled by the constructors of the two exist-ing CAES plants. Their publications, however, contain only results related to the specifi c operation of the Huntorf and McIntosh plants, and do not provide mathematical formula-tions. Essentially, the models are based on mass and energy conservation and account for heat transfer through the cavern walls but lack any details on the thermodynamic assumptions upon which the models were developed. In this context, the KBB model of the Huntorf plant is briefl y discussed by Quast
and Crotogino (1979) . The cavern temperature measure-ments taken at the plant trial run were used to calibrate the model. The ESPC model of the McIntosh plant is discussed by Nakhamkin et al. (1989) . The paper includes calculation of the cavern pressure and temperature based on the AEC CAES plant design conditions (41 h of compression, 2 h of storage, followed by 26 h of generation). The results showed that the temperature increase is approximately 30 ° F. They argued that the plant heat rate and energy ratio are only mildly affected by the temperature transients; however, the cavern volume must be 15 % larger than that of an assumed isothermal cavern. The salt temperature was also calculated, and revealed that the heat penetration extends only about 1.5 m into the salt. In a following paper (Nakhamkin et al. 1990 ), the authors ran transient analyses for a weekly cycle of the AEC CAES plant, for 2 weeks of operation. They concluded that cavern air tem-perature transients must be considered to properly size the storage caverns capacity, subject to the allowable operating range of pressures.
Yoshida et al. (1998) modeled the fl ow within the horizon-tal cavern of the Kami-sunagawa pilot plant in Japan (under planning at the time). They did not assume a uniformity of air temperature like previous investigations. Instead, they applied a two-dimensional ( r , θ ) turbulent model (low Reynolds num-ber k - ε ) and solved the fl ow coupled with the heat conduction in the surrounding rock. The calculations were performed for the expected plant operation, comprising 10 h of compres-sion, 3.5 h of storage, 4 h of generation, and a pressure swing between 40 and 80 atm. It was shown that the temperature difference between the air and the cavern wall is small. Additionally, the heat transfer coeffi cient was calculated and found to be approximately 90 W/m 2 K, and maintained almost a constant value for the entire operation duration.
Raju and Khaitan (2012) modeled the temperature and pres-sure variations within CAES caverns. Their model is based on Eqs. (14) – (16) where air leakage was excluded. Furthermore, the air was considered to be an ideal gas. The heat transfer rate across the cavern walls was expressed by Eq. (18); however, the cavern wall temperature ( T R w ) was assumed to be con-stant throughout the cycle. They argued that the constant heat transfer coeffi cient assumption is inadequate owing to forced convection effects during cavern charge and discharge cycles. The heat transfer coeffi cient was approximated according to the expression
0.8c ceff i e( )- ( )
h Ah a b m t m t
V≡ = + � �
(20)
where h eff is an effective heat transfer coeffi cient. The fi rst and the second terms on the right-hand side of Eq. (20) represent the natural and forced convection contributions, respectively. The unknown coeffi cients a and b (assumed as constants) were determined by calibrating the model with the calcula-tion results of the Huntorf caverns ’ pressure and temperature variations, specifi cally during the caverns ’ discharge to the minimum permissible pressure of 20 bar (Crotogino et al. 2001 , also appear in Quast and Crotogino 1979 ). The deter-mined values were a = 0.2356 and b = 0.0149. However, as h eff
Brought to you by | Tel Aviv University (Tel Aviv University)Authenticated | 172.16.1.226
Download Date | 7/11/12 6:33 PM

142 R. Kushnir et al.: Thermodynamic and hydrodynamic response of CAES reservoirs
depends on the cavern surface area, it is applicable only to the Huntorf plant. Moreover, a constant wall temperature assump-tion pertains to the limiting case of perfectly conducting rock. In reality, the rocks are far from being a perfect conductor. To accurately predict the heat transfer rates, the cavern conserva-tion equations should be solved simultaneously with the rock heat conduction equation.
The temperature and pressure variations within CAES cav-erns were also modeled by Kushnir et al. (2012b) , based on Eqs. (14) – (18), and for conditions of constant air mass fl ow rates during both charge and discharge stages. Air leakage was excluded from the model, and for any given operating condi-tion and cavern geometry a constant value was assigned to the heat transfer coeffi cient. First, the limiting cases of adia-batic and perfectly conducting rocks were studied. Analytical solutions were obtained for the temperature and pressure vari-ations from which the required cavern volume could be cal-culated. In particular, when the air was considered as an ideal gas, simple volume expressions were developed for adiabatic and isothermal caverns
c 1adiabatic
max min
R
-im t T
Vp p
γ=�
(21)
1 0isothermal
max min
R
-cm t T
Vp p
=�
(22)
where m c and t 1 are the compression fl ow rate and duration time, respectively, and γ is the specifi c heat ratio. The interre-lationship of the storage pressure ratio to the required storage volume, as expressed by Eqs. (21) and (22), is demonstrated in Figure 18 . It is seen from the fi gure that the optimal pres-sure ratio should preferably lie between 1.2 and 1.8. At pres-sure ratios < 1.2, a slight increase of the pressure ratio entails small increases of both the required compression work and compressor cost but substantially decreases the storage vol-ume and its cost. On the other hand, at pressure ratios > 1.8,
20
30
40
50
0 4 8 12 16 20 24
0 4 8 12 16 20 24Time (h)
Tem
pera
ture
(°C
)
-200
-100
0
100
Mas
s flo
w ra
te (k
g/s)
Numerical modelMeasured data
40
50
60
Time (h)
Pre
ssur
e (b
ar)
-200
-100
0
100
Mas
s flo
w ra
te (k
g/s)
Numerical modelMeasured data
Figure 19 Pressure, temperature, and port fl ow rate of cavern NK1 versus time: comparison between measured data (Quast and Crotogino 1979 ) and numerical results (Kushnir et al. 2012b ).
01 1.2 1.4 1.6 1.8 2.0 2.2
2
4
6
.
8
10
pmax/pmin
Vp m
in/(m
ct 1γR
T i)
-1pmaxpmin
1Adiabatic cavern
-1 pmax pmin
1Isothermal cavern
( )γ
Optimal pressure ratiorange
TiT0
γ=1.4Ti /T0=1.05
Figure 18 The dimensionless storage volume dependence on the storage pressure ratio under ideal gas behavior (Kushnir et al. 2012b ).
a decrease of the ratio does not greatly affect the storage vol-ume, but reduces the required compression work and com-pressor cost. Consequently, the selection of the exact storage pressure ratio and its corresponding storage volume should be based on both design considerations and economical criteria.
Additionally, a numerical model that accounts for heat conduction assuming one-dimensional radial processes was developed. Figure 19 presents a comparison between calcu-lated air temperatures and pressures to the measured data of the Huntorf plant (Quast and Crotogino 1979 ). As observed, calculated temperatures and pressures are in good agreement with the measured fi eld data. Yet, the span of the measured temperature variations during charge and discharge are some-what smaller than the calculated one, which implies that the heat fl ow between the air and the surrounding rocks is larger than the model prediction. It should be noted that similar results were obtained from the comparison of the KBB and ESPC models to the same measured data (Nakhamkin et al. 1990 ). The discrepancy is likely to emanate from the uncer-tainty in the value of both the cavity surface area and the heat transfer coeffi cient. Naturally, solution-mining techniques are known to produce wavy cavern walls. The surface bulges act like fi ns and thereby enhance the wall heat transfer rates. This effect could be accounted for by an enlargement of the
Brought to you by | Tel Aviv University (Tel Aviv University)Authenticated | 172.16.1.226
Download Date | 7/11/12 6:33 PM

R. Kushnir et al.: Thermodynamic and hydrodynamic response of CAES reservoirs 143
cavity surface area as compared with that of a smooth cylin-drical cavern. Furthermore, the action of air injection and withdrawal on non-smooth walls could produce, to a certain extent, a turbulent forced convection and thereby entail larger heat transfer coeffi cients than those of natural convection.
Sensitivity analyses were conducted with the numerical model and approximate analytical solutions to identify the dominant parameters that affect the storage temperature and pressure fl uctuations, and thereby the required storage vol-ume. The main dimensionless parameters of the heat equation and Eqs. (14) and (15) are
R pc 1 c c c Wr r 2
0 v0 c W R
, , , =tm t h A h R
m q Fo BiV c m R k
α
ρ= = =�
� (23)
where k R and α R are the rock thermal diffusivity and thermal conductivity, and R w the cavern radius. m r is the ratio of the injected to initial air mass in the cavern, and the heat trans-fer effects are expressed by the dimensionless groups q r , Fo , and Bi . The latter two have the form of the Fourier and Biot numbers but not their usual defi nition, as their characteristic length is the cavern radius (instead of the temperature pen-etration depth into the surrounding rocks). The heat transfer at the cavern walls was found to highly affect the air tem-perature and pressure variations as compared with adiabatic conditions. In principle, heat transfer to the rocks during com-pression damps the temperature increase, while heat transfer from the rocks during discharge inhibits the extent of tem-perature decrease.
Representative ranges of the cavern characteristics, operat-ing conditions, and their corresponding dimensionless para-meters are presented in Table 9 . Within the ranges described
in Table 9, the cycle average air temperature is larger than the undisturbed rock temperature, T 0 . Therefore, two processes of heat fl ow are detected, one governed by temperature fl uctua-tions of short penetration distance ( ≈ α R t p ) and the other refl ect-ing the continuous heat fl ow caused by the higher average air temperature versus that of the distant rock temperature. Notice that, in theory, the latter process if modeled as a one-dimen-sional radial heat fl ow would continuously increase distant rock temperatures. However, in reality, the heat conduction process would gradually drive that heat toward the surface (in a three-dimensional manner) rather than to extremely dis-tant rock locations. As it turns out, the temperature penetra-tion depth is still relatively small when the air temperature approaches periodic steady conditions, which justifi es the one-dimensional model applicability. Additionally, it was found that in each cycle, a certain amount of heat is lost by conduction to the surrounding rocks. However, if the injected air temperature is close in value to the rock temperature, only a few percent of the injected energy is lost to the rocks in each cycle.
Analyses also indicated that at relatively short tempera-ture penetration depths, the cavern air and wall temperatures depend only on Bi * = Bi × Fo 1/2 (instead of both Fo and Bi )
c R p c p*
R R
=h t h t
Bik e
α=
(24)
Basically, Bi * represents a thermal resistance ratio (rocks conduction versus air cavern convection). As seen, the rock property that rules this type of heat transfer problem is the thermal effusivity, e = ( k ρ c p )
1/2 = k / α 1/2 . The required stor-age volume dependence on the rock effusivity can be seen
Table 9 Representative ranges of cavern characteristics, operating conditions, and their corresponding dimensionless parameters.
Variable Defi nitions Minimum value
Maximum value
Units Comment
T 0 Local rock temperature 20 60 ° C Allen et al. (1982a) P 0 First fi ll cavern pressure 20 70 bar According to the desired turbine inlet pressure m c Flow rate through the compressor 50 150 kg/s R w Cavern radius 5 30 m A c Cavern surface area 5 × 10 3 10 5 m 2 h c Heat transfer coeffi cient 10 150 W/(m 2 K) k R Rock thermal conductivity 1 7 W/(m K) See Table 5 α R Rock thermal diffusivity 0.3 × 10 -6 3 × 10 -6 m 2 /s See Table 5 e R Rock thermal effusivity, k R / α R 1/2 550 13,000 W s 1/2 /(m 2 K) p min Minimum cavern operational pressure 20 70 bar According to the desired turbine inlet pressure p max /p min Operational cavern pressure ratio 1.2 1.8 – Subject to geological constraints and economics T i / T 0 Relative injected air temperature 1 1.2 – Subject to geological constraints and economics m r m c t 1 /( ρ 0 V ) 0.1 0.55 – Based on Figure 18 q r h c A c /( m c c v0 ) 1 150 – Fo α R t p / R w 2 3 × 10 -5 0.01 – Bi h c R w / k R 10 4500 – Bi * h c t p
1/2 /e R 0.2 80 – t 1 * t 1 / t p 6/24 12/24 – Compression
t 2 * - t 1
* ( t 2 - t 1 )/ t p 2/24 8/24 – Storage t 3
* - t 2 * ( t 3 - t 2 )/ t p 2/24 10/24 – Power generation
Brought to you by | Tel Aviv University (Tel Aviv University)Authenticated | 172.16.1.226
Download Date | 7/11/12 6:33 PM

144 R. Kushnir et al.: Thermodynamic and hydrodynamic response of CAES reservoirs
from the infl uence of Bi * numbers on the storage volume, as depicted in Figure 20 . It is observed that a larger e R (smaller Bi * ’ s) reduces the required storage volume for any given max-imum and minimum storage pressure (or reduces the storage maximum pressure for any given storage volume and mini-mum pressure). A diminution of the storage volume is par-ticularly important to hard rock caverns, which are relatively expensive to excavate. Thus, preference must be given to sites of largest rock thermal effusivity.
As expected, smaller injected air temperatures reduce the required storage volume, but require higher cooling costs. The injected air temperature also provides a method of con-trolling the cycle maximum and minimum temperatures as lower injected temperatures entail lower average cavern tem-peratures. Additionally, it was found that similar to porous reservoirs, for a given amount of injected air ( m c t 1 = const), it is advantageous to expand the duration of compression and power generation periods as much as feasible.
Recently, Kim et al. (2012) studied the temperature and pressure variations within lined rock caverns of CAES plants; in particular, the concept of using concrete lined caverns at a relatively shallow depth for cost savings. A two-dimensional numerical model was developed for an underground cavern of circular cross section. The model was based on the simula-tor TOUGH-FLAC (Rutqvist et al. 2002 ), which links two established codes; namely, TOUGH2 for multiphase fl ow and heat transfer, and FLAC 3D for geomechanical analyses. The cavern air volume was represented as a circular shell that extends from a radius of 2 m to the cavern wall radius of 2.5 m (divided by grid elements around its periphery). That vol-ume was considered as a medium of high porosity (1.0), high permeability, and mechanical softness. The volume of each element was subsequently increased by a factor of 2.78 to account for the entire cavern volume.
A parametric study was conducted to identify the key parameters affecting the performance of the lined CAES reservoir. The analysis showed that the principal property
11.2
.
1.4 1.6 1.8
2
3
4
5
pmax/pmin
Vp m
in/m
ct 1γR
T i)
Bi* →∞ (adiabatic)
Bi*=30
Bi*=6
Bi*=2
Bi* →0(perfect conduction)
Figure 20 The dimensionless storage volume dependence on the storage pressure ratio for different values of Bi * and q r = 30, T
i / T 0 = 1.05, γ = 1.4, t 1
* = 8/24, t 2 * = 14/24, t 3
* = 18/24, T 0 = 310 K, P 0 = 45 bar (Kushnir et al. 2012b ).
responsible for long-term air tightness is the permeability, both of the concrete lining and the surrounding rock. The analysis indicated that a concrete lining with permeability < 1 × 10 -18 m 2 and thickness of 0.5 m would have an acceptable air leakage rate of < 1 % , for an operational pressure range in between 5 and 8 MPa at an underground depth of 100 m. It was also found that the capillary retention properties and initial gas saturation of the lining could be a very signifi cant parameter, and air leakage could be effectively prevented if the air-entry pressure of the concrete lining was higher than the operation air pressure and the lining was kept at high moisture content. Additionally, calculations showed that in the tight lining case, energy losses are primarily due to conduction, through which in each cycle few percents of the injected energy are lost to the rocks. These losses can be reduced by lowering the injected air temperature.
The approach of Kim et al. (2012) was to explicitly model the cavern interior as a single peripheral row of grid ele-ments of highly porous, permeable, and mechanically soft material. The ability of this approach to adequately predict the convective heat exchange rates between the air and the cavern wall remained to be confi rmed through comparison against test data. For instance, a successful reproduction of the Huntorf measured data (Figure 14) would support that approach.
6. Summary and conclusions
This review provides an overview of the CAES technology, including its underground reservoirs. It addresses the temper-ature and pressure response of CAES underground reservoirs to charge/discharge cycles. The latest theoretical studies, main experimental investigations, and operational data are described. The review covers both porous rock reservoirs and cavern reservoirs.
6.1. Porous rock reservoirs
To date, there is no commercial CAES plant that is linked to a porous rock reservoir. The following conclusions were drawn based on experimental and theoretical studies:
The Pittsfi eld aquifer CAES experiment confi rmed the fea-sibility of CAES in porous rock reservoirs. The experiment also demonstrated that temperature changes owing to air compression or expansion are minor (the gas fl ow is essen-tially isothermal).
The fi eld tests revealed that after several months of air stor-age, a considerable oxygen depletion took place. However, such vitiation was observed only after long-term storage with no air cycling, which in real terms is of no concern to CAES plants, where the air is frequently changed.
The distance from the well, which characterizes the pres-sure fl uctuation penetration radius, is closely equal to ( α r t p )
1/2 with α r being the radial pneumatic diffusivity.
CAES plant designs must give preference to the smallest prac-tical m c
* = m c μ ZR T /( π Hk r P 0 2 ) (e.g., larger H or k r ) for the reduc-
tion of both the number of wells and the pressure fl uctuations.
Brought to you by | Tel Aviv University (Tel Aviv University)Authenticated | 172.16.1.226
Download Date | 7/11/12 6:33 PM
R. Kushnir et al.: Thermodynamic and hydrodynamic response of CAES reservoirs 145
It is desirable to expand the compression and power genera-tion duration periods, as much as feasible (for a given amount of injected air, m c t 1 = const). Prolongation of the power genera-tion duration period, in particular, can signifi cantly increase the well storage capacity.
Water coning could impose severe limitations on the dis-charge fl ow rates, such that large-scale energy storage could be uneconomical. A signifi cant diminishment of that limita-tion can be achieved by enlargement of the air layer height (during the initial reservoir preparation).
The choice of the well screen length in aquifer reservoirs must be based on economics (accounting for the plant energy capacity and the number of required wells), and should pref-erably be in between 0.25 and 0.75 of the air layer height.
6.2. Cavern reservoirs
Currently, there are two operational CAES plants in the world. Both are using underground salt cavern reservoirs. The plants provide valuable data on the cavern temperature and pressure variations. The following conclusions were drawn from mea-sured data and theoretical investigations:
The pressure difference between the cavern and the well-head are close in value to the corresponding hydrostatic pressure difference. The temperature differences (cavern to wellhead) during injection and withdrawal can be estimated by adiabatic compression/expansion formulae.
The air thermodynamic properties can be adequately repre-sented by a simplifi ed real gas model, in contrast to ideal gas models that yield somewhat smaller temperature and pressure fl uctuations. The deviation from ideal gas behavior increases at higher cavern pressures, but for practical conditions that deviation does not exceed few percents.
Two processes of heat fl ow within the rocks are distin-guished, one governed by temperature fl uctuations of short penetration distance and the other refl ecting the continuous heat fl ow caused by the higher average cavern air temperature versus that of the distant rock temperature. It turns out that the cavern air temperature is near steady conditions when the temperature penetration depth is relatively small and there-fore can be calculated by a one-dimensional model.
Heat transfer phenomena are characterized by two dimensionless parameters q r = h c A c /( m c c v0 ) and Bi * = h c t p
1/2 / e R . Operational data and theoretical studies revealed that, for practical conditions, the heat transfer at the cavern walls sub-stantially decrease the air temperature and pressure variations as compared with those of adiabatic conditions.
For realistic operating conditions and reservoir characteris-tics, in each cycle, few percents of the injected energy are lost by conduction to the rocks. These losses can be diminished by reducing the injected air temperature.
The principal thermal property that governs the heat trans-fer processes is the rock effusivity, e R = ( ρ R c pR k R ) 1/2 . To reduce the required storage volume, preference must be given to rock types that have the largest thermal effusivity.
The injected air temperature substantially affects the stor-age average temperature and provides a method of control-ling the cycle maximum and minimum temperatures. Smaller
injected air temperatures also reduce the required storage vol-ume, but require higher cooling costs.
Similarly to porous reservoirs, for a given amount of injected air ( m c t 1 = const), it is advantageous to expand the duration of compression and power generation periods as much as feasible.
The optimal storage pressure ratio should preferably lie between 1.2 and 1.8, and its selection should be based on both design considerations and economical criteria.
The principal parameters that assure acceptable air leak-age rate in hard rock cavern are the rock and lining (in lined caverns) permeabilities. In particular, for an operating pres-sure range of 5 – 8 MPa at an underground depth of 100 m, a concrete lining with permeability < 1 × 10 -18 m 2 and thickness of 0.5 m would result in a leakage rate of < 1 % .
6.3. Topics for further research
A number of research topics that deserve to be explored are identifi ed. As mentioned, the studies of porous rock reser-voirs refer to the pressure distribution around a single well of a CAES plant. However, the storage of energy for urban com-mercial plants will require numerous wells. Therefore, there is a need to extend the current knowledge and conduct an inves-tigation of the response of multiple wells to charge/discharge cycles. In particular, to examine the possible well-overlapping effects such as their infl uence on pressure fl uctuations and air-water interface instabilities. Such an investigation will pave a path toward a cost-effective plant design with respect to the optimal number of wells and locations.
Additionally, the current models for porous rock reser-voirs are based on the assumptions that the surrounding rocks can adequately be represented as homogeneous. Those models reveal the basic hydrodynamic response that could be expected during CAES plant operations, even for more complicated formations such as fractured rocks. However, to accurately predict the pressure fl uctuations in such forma-tions, a more complex approach involving advanced numeri-cal calculations must be incorporated.
In the study of underground caverns, the mechanism of air leakage through the rock porous space should be explored more accurately. A comprehensive parametric study deserves to be conducted to identify the effect of the operating conditions and reservoir characteristic on the air leakage rate (e.g., storage pressure, cavern shape and depth, rock permeability and porosity). Attention should also be directed toward the study of the air leakage infl uence on the plant performance. Additionally, the thermodynamic char-acteristics of water-compensated caverns of CAES plants are yet to be studied.
The theoretical studies indicate that the optimal well screen length in aquifer reservoirs should be in between 0.25 and 0.75 of the air layer height. Likewise, they indicate that the optimal pressure ratio in cavern reservoirs should preferably be in between 1.2 and 1.8. The exact optimal values should be determined through studies that integrate the air storage system and its minimum/maximum pressures with the speci-fi cations of the turbomachinery.
Brought to you by | Tel Aviv University (Tel Aviv University)Authenticated | 172.16.1.226
Download Date | 7/11/12 6:33 PM
146 R. Kushnir et al.: Thermodynamic and hydrodynamic response of CAES reservoirs
Nomenclature
A c cavern wall surface area Bi Biot number based on cavern radius, h c R w / k R Bi * Biot number based on penetration depth, h c t p
1/2 / e R c v constant-volume specifi c heat c p constant-pressure specifi c heat C constant, C = e γ = 1.781072 … CD charging/discharging time ratio e thermal effusivity E c compression energy E f fuel energy E g generator energy ER energy ratio, E c / E g f porosity Fo Fourier number, α R t p / R w 2 g gravitational acceleration g * dimensionless hydrostatic pressure, ρ w gH / P 0 Gr Grashof number, g β ( T R w - T )(2 R w ) 3 / ν 2 h well screen length (porous reservoirs, Section 4) h specifi c enthalpy (cavern reservoirs, Section 5) h * dimensionless well screen length, h / H h c heat transfer coeffi cient h eff effective heat transfer coeffi cient, h c A c / V H air layer height in porous reservoirs HR plant heat rate k permeability (porous reservoirs, Section 4) k thermal conductivity (cavern reservoirs, Section 5) m air mass fl ow rate m c
* dimensionless air mass fl ow rate, m c μ ZR T /( π Hk r P 0
2 ) m r injected to initial cavern air mass ratio, mc t 1 /( ρ 0 V ) Nu Nusselt number, h c (2 R w )/ k p pressure p w well bottom hole pressure p e reservoir edge pressure P 0 initial air pressure in the reservoir p * dimensionless pressure, p / P 0 q r dimensionless heat transfer parameter, h c A c /( m c c v0 ) Q heat transfer rate across the cavern walls r radial coordinate r* dimensionless radial coordinate, r/rw
r e reservoir exterior radius r w well radius r w dimensionless well radius, k z
1/2 r w /( k r 1/2 H )
R specifi c air constant R w radius of the cavern t time t p cycle time period t 1 compression duration time t 2 - t 1 storage duration time t 3 - t 2 power generation duration time t * dimensionless time, t / t p T temperature T 0 initial air temperature in the cavern T i injected air temperature at the cavern port T * dimensionless temperature, T / T 0 u specifi c internal energy
V cavern volume z vertical coordinate z * dimensionless vertical coordinate, z / H Z air compressibility factor Z T derivative of Z with respect to T
Greek symbols α pneumatic diffusivity (porous reservoirs, Section 4),
kP 0 /( f μ ) α thermal diffusivity (cavern reservoirs, Section 5) β volumetric thermal expansion coeffi cient γ specifi c heat ratio at initial state, c p 0 / c v 0 η interface location (in aquifer reservoirs) η * dimensionless interface location, η / H η b base load plant effi ciency η pe primary energy effi ciency μ air viscosity ν air kinematic viscosity ρ air density ρ w water density ρ 0 initial air density in the cavern τ r dimensionless cycle time period in dry porous reser-
voirs, t p α r / r w 2 τ z dimensionless cycle time period in aquifer reser-
voirs, t p α z / H 2 Φ modifi ed pressure, defi ned in Eq. (5) Φ * dimensionless modifi ed pressure, Φ / P 0
Subscripts 0 initial state c compressor cr critical e exit i inlet l leakage r radial R rock R w cavern walls s steady periodic cycle z vertical
Superscript
0 ideal gas
References
Aberg B. Prevention of gas leakage from unlined reservoirs in rock. Proc. Int. Symp. on Storage in Excavated Rock Caverns, Stockholm, Sweden, 1977; pp. 399 – 413.
Allen RD, Doherty TJ, Fossum AF. Geotechnical issues and guide-lines for storage of compressed air in excavated hard rock cav-erns. Technical Report PNL-4180, Pacifi c Northwest Laboratory, 1982a.
Allen RD, Doherty TJ, Thoms RL. Geotechnical issues and guide-lines for storage of compressed air in solution-mined salt cavi-ties. Technical Report PNL-4242, Pacifi c Northwest Laboratory, 1982b.
Brought to you by | Tel Aviv University (Tel Aviv University)Authenticated | 172.16.1.226
Download Date | 7/11/12 6:33 PM

R. Kushnir et al.: Thermodynamic and hydrodynamic response of CAES reservoirs 147
Allen RD, Doherty TJ, Erikson RL, Wiles LE. Factors affecting stor-age of compressed air in porous rock reservoirs. Technical Report PNL-4707, Pacifi c Northwest Laboratory, 1983.
Allen RD, Doherty TJ, Schainker RB, Istvan JA, Pereira JC. Preliminary results from the Pittsfi eld aquifer fi eld test applica-ble to commercialization of CAES technology. Intersoc Energy Convers Eng Conf 1984; 1081 – 1090.
ANR Storage Company. Compressed-air energy storage: Pittsfi eld aquifer fi eld test; Test data: engineering analysis and evaluation, EPRI Report GS-6688, 1990.
Ayers DL. Compressed air energy storage preliminary design and site development program in an aquifer, Vol. 8: aquifer fl ow code simulation, EPRI Report Em-2351, 1982.
Barenblatt GI, Trifonov NP. On some axisymmetrical problems of transient liquid and gas fl ow in porous medium (in Russian). Izv AN SSSR OTN 1956; 1: 59 – 70.
Barenblatt GI, Entov V, Ryzhik V. Theory of fl uid fl ow through natu-ral rocks. Dordrecht, The Netherlands: Kluwer Academic, 1990: 154 – 163.
Bear J. Dynamics of fl uids in porous media, 2nd ed., New York: Dover Publications, 1988: 408 – 435.
Bieber M, Marquardt R, Moser P. Storage technologies compensat-ing for fl uctuating power generation. VGB PowerTech 2011; 91: 59 – 63.
Braester C, Bear J. Some hydrodynamics aspects of compressed-air energy storage in aquifers. J Hydrol 1984; 73: 201 – 225.
Chen H, Cong TN, Yang W, Tan C, Li Y, Ding Y. Progress in electri-cal energy storage system: a critical review. Prog Nat Sci 2009; 19: 291 – 312.
Collins RE, Crawford PB. Calculations of unsteady-state gas fl ow through porous media, corrected for Klinkenberg effects. Trans AIME 1953; 198: 339 – 340.
Crotogino F, Mohmeyer KU, Scharf R. Huntorf CAES: more than 20 years of successful operation. Solution Mining Research Institute, Spring Meeting, Orlando, FL, USA, 2001.
Dinelli G, Lozza G, Macchi E. A feasibility study of CAES plants for peak load generation. In: Yogi Goswami D, editor. Proceedings of the 23rd Intersociety Energy Conversion Engineering Conference, IECEC. New York, NY: The American Society of Mechanical Engineers, ASME, 1988: 417 – 424.
Farmen JE, Wagner G, Oxaal U, Meakin P, Feder J, Jossang T. Dynamics of water coning. Phys Rev E 1999; 60: 4244 – 4251.
Giramonti AJ. Preliminary feasibility evaluation of compressed air storage power systems. United Technologies Research Center Report R76-952161-5, 1976.
Giramonti AJ, Lessard RD, Blecher WA, Smith EB. Conceptual design of compressed air energy storage electric power systems. Appl Energy 1978; 4: 231 – 249.
Goodson JO. History of fi rst U.S. compressed air energy storage (CAES) plant (110-MW-26h), Vol. 1: early CAES development, EPRI Report TR-101751, 1992.
Holden P, Moen D, DeCorso M, Howard J. Alabama electric coop-erative compressed air energy storage (CAES) plant improve-ments. ASME paper 2000-GT-0595, 2000.
Hoyland LA, Papatzacos P, Skjaeveland SM. Critical rate for water coning: correlation and analytical solution. SPE Reservoir Eng 1989; 4: 495 – 502.
Ishihata T. Underground compressed air storage facility for CAES-G/T power plant utilizing an airtight lining. ISRM News J 1997; 5: 17 – 21.
Katz DL, Cornell D, Vary JA, Kobayashi R, Poettmann FH, Elenbaas JR, Weinaug CF. Handbook of natural gas engineering. New York: McGraw-Hill, 1959.
Kim HM, Rutqvist J, Ryu DW, Choi BH, Sunwoo C, Song WK. Exploring the concept of compressed air energy storage (CAES) in lined rock caverns at shallow depth: a modeling study of air tightness and energy balance. Appl Energy 2012; 92: 653 – 667.
Klinkenberg LJ. The permeability of porous media to liquids and gases. API Drilling Prod Pract 1941: 200 – 213.
Knoke S. Compressed air energy storage (CAES) chapter. In: Eckroad S, editor. Handbook of energy storage for transmission or dis-tribution applications. Palo Alto, CA: Electric Power Research Institute (EPRI), 2002.
Kushnir R, Ullmann A, Dayan A. Steady periodic gas fl ow around a well of a CAES plant. Transp Porous Media 2008; 73: 1 – 20.
Kushnir R, Ullmann A, Dayan A. Compressed air fl ow within aqui-fer reservoirs of CAES plants. Transp Porous Media 2010; 81: 219 – 240.
Kushnir R, Ullmann A, Dayan A. Thermodynamic models for the temperature and pressure variations within adiabatic caverns of compressed air energy storage plants. ASME J Energy Res Technol 2012a; 134: Article no. 021901.
Kushnir R, Dayan A, Ullmann A. Temperature and pressure variations within compressed air energy storage caverns. Int J Heat Mass Transfer 2012b, in press. DOI:10.1016/j.ijheatmasstransfer.2012.05.055.
Langham EJ. The underground storage of compressed air for gas turbines: a dynamic study on an analogue computer. Comput J 1965; 8: 216 – 224.
Leibenzon LS. Gas movement in a porous medium (in Russian). Neft Slants Khoz 1929; 10: 497 – 519.
Meiri D, Karadi GM. Simulation of air storage aquifer by fi nite element model. Int J Numer Anal Meth Geomech 1982; 6: 339 – 351.
Muskat M. The fl ow of homogeneous fl uid through porous media, 1st ed., New York: McGraw-Hill, 1937.
Muskat M, Botset HG. Flow of gas through porous materials. Physics 1931; 1: 27 – 47.
Muskat M, Wyckoff RD. An approximate theory of water coning in oil production. Trans AIME 1935; 114: 144 – 163.
Nakhamkin M, Swensen E, Schainker RB, Mehta B. CAES plant per-formance and economics as a function of underground salt dome storage transient processes. ASME paper 89-GT-143, 1989.
Nakhamkin M, Swensen E, Mehta B. Analysis of temperature tran-sients of underground air storage in a salt dome during CAES plant operation. Solution Mining Research Institute, Fall Meeting, Paris, 1990.
Nakhamkin M, Andersson L, Swensen E, Howard J, Meyer R, Schainker R, Pollak R, Mehta B. AEC 110 MW CAES plant: status of project. J Eng Gas Turb Power 1992a; 114: 695 – 700.
Nakhamkin M, Andersson L, Turpin D, Howard J, Meyer R, Schainker R, Pollak R, Mehta B. First U.S CAES plant initial startup and operation. In: Proceedings of the 54th American Power Conference, Vol. 54. Chicago, IL: Illinois Institute of Technology, 1992b: 154 – 161.
Nakhamkin M, Andersson L, Schainker R, Howard J, Meyer R. 110 MW-26 Hr CAES performance test results and initial reliability indices. In: Proceedings of the 55th American Power Conference, Vol. 55. Chicago, IL: Illinois Institute of Technology, 1993: 1016 – 1021.
Nakhamkin M, Chiruvolu M, Patel M, Byrd S, Schainker R, Marean J. Second generation of CAES technology – performance, opera-tions, economics, renewable load management, green energy. POWER-GEN international. Las Vegas, NV: Las Vegas Convention Center, December 8 – 10, 2009.
Nielsen L, Leithner R. Dynamic simulation of an innovative com-pressed air energy storage plant – detailed modelling of the Storage Cavern. WSEAS Trans Power Syst 2009; 4: 253 – 263.
Brought to you by | Tel Aviv University (Tel Aviv University)Authenticated | 172.16.1.226
Download Date | 7/11/12 6:33 PM

148 R. Kushnir et al.: Thermodynamic and hydrodynamic response of CAES reservoirs
Osterle JF. The thermodynamics of compressed air exergy storage. J Energy Res Technol 1991; 113: 7 – 11.
Patel S. The return of compressed air energy storage. Power 2008; 152: 10.
Quast P, Crotogino F. Initial experience with the compressed-air energy storage (CAES) project of Nordwestdeutsche Kraftwerke AG (NWK) at Huntorf/West Germany. Erdoel Erdgas Z 1979; 95: 310 – 314.
Quast P, Lorenzen H. The Huntorf 290-MW CAES power plant – design, construction and commissioning of underground facili-ties. Erdoel Erdgas Z 1979; 95: 90 – 95.
Raju M, Khaitan SK. Modeling and simulation of compressed air storage in caverns: a case study of the Huntorf plant. Appl Energy 2012; 89: 474 – 481.
Ritchie RH, Sakakura AY. Asymptotic expansions of solutions of the heat conduction equation in internally bounded cylindrical geometry. J Appl Phys 1956; 27: 1453 – 1459.
Rutqvist J, Wu YS, Tsang CF, Bodvarsson G. A modeling approach for analysis of coupled multiphase fl uid fl ow, heat transfer, and deformation in fractured porous rock. Int J Rock Mech Min Sci 2002; 39: 429 – 442.
Sakakura AY. A note on the transient gas fl ow problem. U.S. Geological Survey Report TEI-329, 1953.
Sch ö n JH. Physical properties of rocks: fundamentals and principles of petrophysics, 2nd ed., Oxford: Pergamon, 1998: 333 – 348.
Schulte RH, Critelli N, Holst Kent, Huff G. Lessons from Iowa: development of a 270 megawatt compressed air energy stor-age project in midwest independent system operator, a study for the DOE Energy Storage Systems Program. Technical Report, Sandia National Laboratories, 2012; doi: 10.2172/1035330.
Shnaid I, Olek S. Pressure perturbations method for analysis of tran-sient compressible gas fl ow around wells in porous media. Int J Heat Mass Transfer 1995; 38: 2697 – 2700.
Skorek J, Banasiak K. Thermodynamic analysis of the compressed-air energy storage systems operation. Inz Chem Proces 2006; 27: 187 – 200.
Smith GC, Wiles LE, Loscutoff WV. Numerical analysis of tem-perature and fl ow effects in a dry, one-dimensional aquifer used for compressed air energy storage. Technical Report PNL-2546, Pacifi c Northwest Laboratory, 1979.
Succar S, Williams RH. Compressed air energy storage: theory, resources, and applications for wind power. Technical Report, Princeton University, 2008.
Sychev VV, Vasserman AA, Kozlov AD, Spiridonov GA, Tsymarny VA. Thermodynamic properties of air. Washington, DC: Hemisphere, 1987.
Vosburgh KG, Kosky PG. Heat transfer effects in compressed air energy storage. Presented at the Winter Annual Meet of ASME, Heat Transfer in Energy Conservation 1977: 83 – 90.
Wheatley MJ. An approximate theory of oil/water coning. Paper SPE 14210, SPE 60th Annual Technical Conference and Exhibition, Las Vegas, NV, 1985.
Wiles LE. Numerical analysis of temperature and fl ow effects in a dry, two-dimensional, porous media reservoir used for com-pressed air energy storage. Technical Report PNL-3047, Pacifi c Northwest Laboratory, 1979.
Wiles LE, McCann RA. Water coning in porous media reservoirs for compressed air energy storage. Technical Report PNL-3470, Pacifi c Northwest Laboratory, 1981.
Yoshida H, Tada S, Oishi Y, Hatoya T, Echigo R, Hang CY. Thermo-fl uid behavior in the cavern for the compressed air energy stor-age gas turbine system. Heat transfer 1998, Proceedings of 11th IHTC, 1998; 6: 523 – 528.
Received April 17, 2012; accepted May 7, 2012
Roy Kushnir received his PhD degree from Tel Aviv Univer-sity, Israel in 2011. Currently, he is a researcher at the School of Mechanical Engineering at Tel Aviv University. His main research activities are in the areas of energy storage and nat-ural convection cooling.
Amos Ullmann received his PhD degree from the City Uni-versity of New York, USA in 1992. Currently, he is an asso-ciate professor at the School of Mechanical Engineering at Tel Aviv University, Israel and he serves as the head of the Environmental Engineering Program.
He is a co-author of more than 70 publications in the fi elds of multiphase fl ow and transport phenomena, separation processes, particles fl ow and emission and micro-pumps.
Abraham Dayan is an asso-ciate professor at the School of Mechanical Engineer-ing at Tel Aviv University, Israel. He received his PhD in 1974 from the University of California, Berkeley. His principal research activities are in the fi elds of heat trans-fer, thermodynamics, bioen-gineering, nuclear safety,
energy generation and energy storage.
Brought to you by | Tel Aviv University (Tel Aviv University)Authenticated | 172.16.1.226
Download Date | 7/11/12 6:33 PM