Containerized Compressed Natural Gas Shipping - CORE
108
Containerized Compressed Natural Gas Shipping by Georgios V. Skarvelis Bachelor of Engineering in Naval Architecture, Newcastle University, 2008 Master of Science in Marine Engineering, Newcastle University, 2009 Submitted to the Department of Mechanical Engineering in Partial Fulfillment of the Requirements for the Degree of Master of Science in Mechanical Engineering at the Massachusetts Institute of Technology June 2013 ARCHIVES MA SSACHUSETTS INSTITUTE OF TECHNOLOGY U 235J20- © 2013 Massachusetts Institute of Technology. All rights reserved. Signature of Author: Department of Mechanical Engineering May 22, 2013 Certified by: Accepted by: Paul D. Sclavounos Professor of Mechanical Engineering and Naval Architecture Thesis Supervisor David E. Hardt Professor of Mechanical Engineering Chairman, Department Committee on Graduate Students
-
Upload
khangminh22 -
Category
Documents
-
view
3 -
download
0
Transcript of Containerized Compressed Natural Gas Shipping - CORE

Containerized Compressed Natural Gas Shipping
by
Georgios V. Skarvelis
Bachelor of Engineering in Naval Architecture, Newcastle University, 2008Master of Science in Marine Engineering, Newcastle University, 2009
Submitted to theDepartment of Mechanical Engineering
in Partial Fulfillment of the Requirements for the Degree of
Master of Science in Mechanical Engineering
at the
Massachusetts Institute of Technology
June 2013
ARCHIVESMA SSACHUSETTS INSTITUTE
OF TECHNOLOGY
U 235J20-
© 2013 Massachusetts Institute of Technology. All rights reserved.
Signature of Author:Department of Mechanical Engineering
May 22, 2013
Certified by:
Accepted by:
Paul D. SclavounosProfessor of Mechanical Engineering and Naval Architecture
Thesis Supervisor
David E. HardtProfessor of Mechanical Engineering
Chairman, Department Committee on Graduate Students

Containerized Compressed Natural Gas Shipping
by
Georgios V. Skarvelis
Submitted to the Department of Mechanical Engineeringon May 22, 2013 in Partial Fulfillment of the
Requirements for the Degree of
Master of Science in Mechanical Engineering
ABSTRACT
In the last decades, the demand for energy is increasing. It is necessary to develop new
ways to distribute the energy using economically feasible solutions. In this project an
Ultra Large Container Ship is used that can carry more than 12,000 TEUs. Inside each
TEU, four cylinders are installed that can store compressed natural gas at 250 bar. Two
types of cylinders are tested: cylinders made of steel and cylinders made of carbon
fiber. Carbon fiber cylinders were chosen because they are lighter. In addition, two
types of compressors are used: centrifugal and reciprocating compressors. Centrifugal
compressors are used to increase the initial pressure from 10 bar to 50 bar.
Reciprocating compressors are used to increase the pressure from 50 bar to 250 bar. A
model is developed using thermodynamics and MATLAB, in order to determine the
total power required for a compressor to fill the entire vessel in one or more days.
Furthermore, by using valuation metrics, a model is created to find the value of the
project and to generate sensitivity analyses. It is concluded that leasing the ships is
more profitable than buying them.
Thesis Supervisor: Paul D. SclavounosTitle: Professor of Mechanical Engineering and Naval Architecture
2

Dedication
This thesis is dedicated to my parents, Vasilis and Maria,whose support, guidance and constant love have
sustained me throughout my life and have provided methe opportunity to pursue my dreams.
3

Acknowledgements
First of all, I would like to thank my supervisor Professor Paul Sclavounos, for his
inspiring and encouraging way to guide me to a deeper understanding of knowledge
work, his very useful comments and notes during the entire work with this final year
project, and above all for his time.
Secondly, I take this opportunity to also thank, in no particular order, Sungho Lee,
Andreas Nanopoulos, Carlos Casanovas and Godine Chan of the Laboratory for Ship and
Platform Flows (LSPF) as well as Dr. John Coustas and Mr. Iraklis Prokopakis of DANAOS
Corporation for their help in compiling this thesis. In addition, I would like to thank all
the professors and students at MIT.
At last, to my parents, thanks for supporting me with your love and understanding.
Georgios V. Skarvelis, June 2013
4
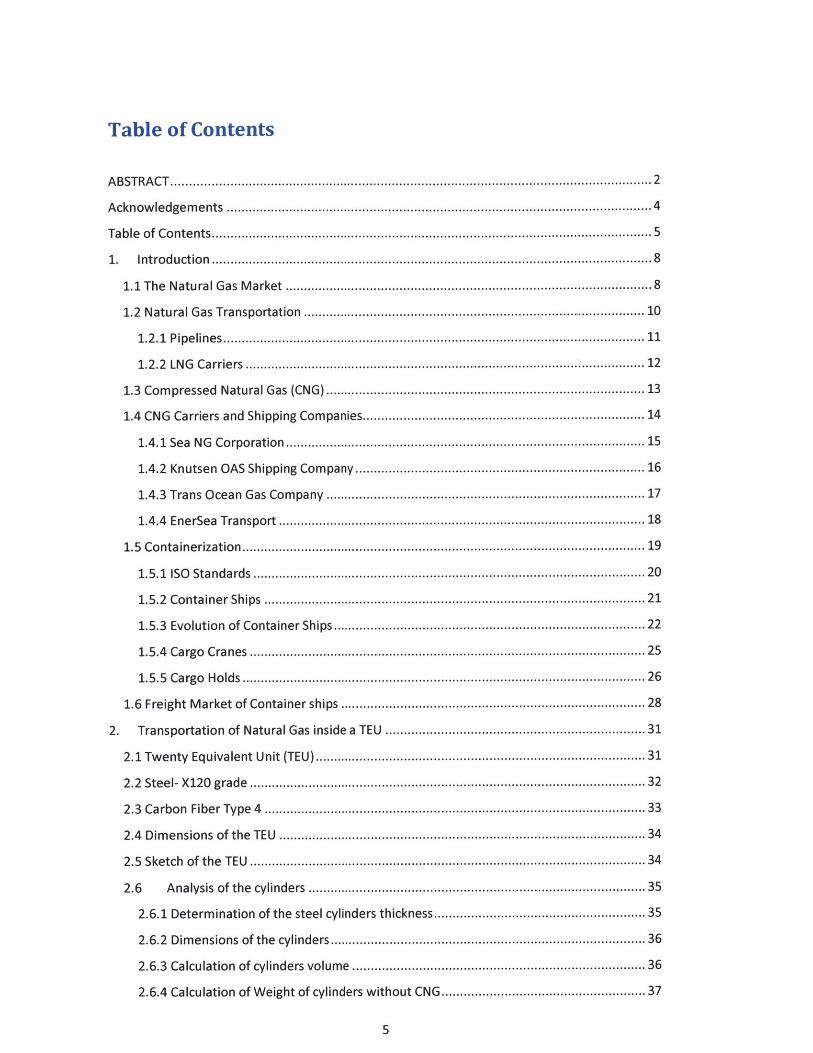
Table of Contents
ABSTRACT..................................................................................................................................2
Acknow ledgem ents ................................................................................................................... 4
Table of Contents.......................................................................................................................5
1. Introduction.......................................................................................................................8
1.1 The Natural Gas M arket .............................................................................................. 8
1.2 Natural Gas Transportation ....................................................................................... 10
1.2.1 Pipelines.................................................................................................................. 11
1.2.2 LNG Carriers ....................................................................................................... 12
1.3 Com pressed Natural Gas (CNG)................................................................................... 13
1.4 CNG Carriers and Shipping Com panies........................................................................ 14
1.4.1 Sea NG Corporation .............................................................................................. 15
1.4.2 Knutsen OAS Shipping Com pany .......................................................................... 16
1.4.3 Trans Ocean Gas Com pany ................................................................................... 17
1.4.4 EnerSea Transport .............................................................................................. 18
1.5 Containerization............................................................................................................. 19
1.5.1 ISO Standards ..................................................................................................... 20
1.5.2 Container Ships .................................................................................................. 21
1.5.3 Evolution of Container Ships ................................................................................. 22
1.5.4 Cargo Cranes ........................................................................................................... 25
1.5.5 Cargo Holds ............................................................................................................. 26
1.6 Freight M arket of Container ships .............................................................................. 28
2. Transportation of Natural Gas inside a TEU ................................................................... 31
2.1 Twenty Equivalent Unit (TEU)..................................................................................... 31
2.2 Steel- X120 grade ........................................................................................................... 32
2.3 Carbon Fiber Type 4 ................................................................................................... 33
2.4 Dim ensions of the TEU ................................................................................................ 34
2.5 Sketch of the TEU ........................................................................................................... 34
2.6 Analysis of the cylinders ....................................................................................... 35
2.6.1 Determ ination of the steel cylinders thickness...................................................... 35
2.6.2 Dim ensions of the cylinders................................................................................. 36
2.6.3 Calculation of cylinders volume ............................................................................ 36
2.6.4 Calculation of W eight of cylinders without CNG.................................................... 37
5

2.6.5 Determination of the Compressed Natural Gas inside the four cylinders...............37
2.6.6 Total W eight of a TEU ......................................................................................... 37
2.6.7 Determ ination of the Carbon Fiber (Type 4) cylinders weight ............................... 38
2.7 Strength Analysis of the TEU........................................................................................ 39
2.7.1 Tensile Stresses .................................................................................................. 41
2.7.2 Beam Analysis ..................................................................................................... 41
2.7.3 Shear Force and Bending M oment Diagram s ....................................................... 42
2.7.4 Com pression Stresses on the beam ..................................................................... 43
2.7.5 M axim um Bending stress..................................................................................... 43
2.7.6 Critical Buckling Point .......................................................................................... 43
3. Com pressors .................................................................................................................... 44
3.1 Reci procating Com pressors ....................................................................................... 44
3.2 Centrifugal Com pressors ............................................................................................ 45
3.3 Axial Com pressors..................................................................................................... 46
3.4 Rotary Com pressors ................................................................................................... 46
3.5 First Law of Thermodynam ics ......................................................................................... 47
3.6 Ideal Gas Laws................................................................................................................ 48
3.7 Perfect Gas Form ula ................................................................................................... 49
3.8 Com pressibility...............................................................................................................50
3.9 Theoretical Com pression cycles................................................................................... 51
3.10 Heat transfer ................................................................................................................ 52
3.11 Heat m ode ....................................................................................................................... 52
3.12 Heat Capacity ............................................................................................................... 53
3.13 W ork Done Calculation for the whole Process .......................................................... 54
3.14 Calculation of the above constants ............................................................................ 59
3.14.1 Calculation of Z factor........................................................................................ 59
3.14.2 Calculation of the Surface Area of the cylinders ................................................. 61
3.14.3 Specific Heat Capacities and Gas Constant of M ethane ...................................... 62
3.14.4 M ass flow rate ................................................................................................... 63
3.15 Calculation of W ork done using M atlab ..................................................................... 64
3.15.1 Case 1: Load a TEU in one day ............................................................................ 64
3.15.2 Case 2: Load a TEU in two days ......................................................................... 67
3.15.3 Case 3: Load a TEU in three days........................................................................ 70
3.16 Graphs of the above results..................................................................................... 73
6

4. Econom ic Valuation .................................................................................................... 75
4.1 Ultra large Container Ship (U LCS) .............................................................................. 75
4.1.1 Ultra Large Containership Details.......................................................................... 76
4.1.2 Num ber of CNG TEUs loaded in the ULCS............................................................. 76
4.1.3 Voyages and Fleet of the Shipping Com pany........................................................ 76
4.2 Capital Costs for the Shipping Company ..................................................................... 77
4.2.1 Annual Costs............................................................................................................ 77
4.2.2 Fuel Costs ................................................................................................................ 78
4.2.3 Electricity Costs .................................................................................................. 84
4.2.4 Port Charges ............................................................................................................ 84
4.2.5 The deploym ent of containers ............................................................................ 84
4.2.6 Extra Costs............................................................................................................... 85
4.2.7 Crew Costs and Adm inistrative Expenses ............................................................ 85
4.3 Operating Incom e of the fleet ..................................................................................... 86
4.4 Unleveraged Internal Rate of Return ......................................................................... 87
4.5 Return on Invested Capital (ROIC) .............................................................................. 87
4.6 Return on Equity (ROE).............................................................................................. 88
4.7 W ACC (W eighted Average Cost of Capital)................................................................. 89
4.8 Value/Capital for the shipping com pany ..................................................................... 91
4.9 Sensitivity Analysis for buying the ships ..................................................................... 93
4.10 Econom ic Evaluation for leasing the vessels .............................................................. 93
4.10.1 Sensitivity Analysis for leasing the ships............................................................. 94
4.11 Com parison of the above two options ..................................................................... 94
5. Com parison of LNG Carriers and ULCS carrying CNG containers ................................... 96
5.1 Energy savings................................................................................................................ 96
5.2 Comparison of the revenue of LNG ship and the ULCS of this project ......................... 98
5.3 Sum m ary of advantages .............................................................................................. 98
6. Conclusions ...................................................................................................................... 99
7. Appendices .................................................................................................................... 100
Appendix A - Torsion of our Cylinders................................................................................. 100
Appendix B - Buckling......................................................................................................... 104
8. References.....................................................................................................................106
7

1. Introduction
1.1 The Natural Gas Market
Natural gas will play an important role worldwide for the next several decades. Natural
gas accounts for 14% of the total world energy supply. That share is expected to rise
especially in North America and Europe.
Natural gas is a gaseous-phase fossil fuel and is lighter than air. It is used for residential
purposes such as space heating, water heating and cooking. In the last decade, gas is
also used to generate electricity. It is cleaner than conventional fossil fuels such as coal
(solid substance) and oil (liquid substance). Gas is also more efficient and has lower
levels of dangerous byproducts that are released into the atmosphere (Wang and
Economides 2009).
There are many large deposits of natural gas around the world. Gas consumption is
rapidly increasing, and the International Energy Agency (IEA) states that the global gas
demand will rise by more than 50% between 2013 and 2035. According to IEA, gas will
make to 32% of the global energy supply.
Recoverable naturat-gas reserves2011 trn cubic metres
0 10 20 30 40 50 60 70 80 90 100 110 120 130 140 150
Figure 1: Recoverable natural-gas reserves
8
I
Russia
United States
China
Iran
Saudi Arabia
Australia
Gatar
Argentina
Mexico
Canada
Venezuela
Indonesia
Norway
Nigeria
AlgeriaSource: 1EA
ConventionalTightShale
1 Coal-bed methane

One drawback to natural gas is the difficulty in transporting it. Because of increased
demand, there has been a substantial development in natural gas exploration and
transportation
On the global natural gas market, USA and Russia account around 40% of the natural
gas supply as can be seen from the graph below.
The World Top 10 (2011)
rN .4-
Ii EuM (U
00A-A
c:r:
Figure 2: Top 10 Producers of Natural Gas
The following graph clearly shows that North America and Europe are the leading
regions in natural gas consumption.
World dry natural gas consumption by region, 1980-2010trillion cubic feet Europe ounner Sovie t
North America 21 Uno29
Ie,,13
Central & SouthAmerica
5 Oceania
trillion cubicleet30
2010 --15 _
50 11980 1986 1990 1996 2000 2006 2010
- North AmericaFormer Soviet Union
-Europe-- Asia
Middle EastCentral & South America
-Africa-Oceania
Figure 3: Natural Gas Consumption by region
9
Share of W0,10 latal

Over the last years, Asia had a high growth rate in gas consumption and is approaching
the level of Europe and North America. This growth is shown in Figure 3. This is due to
the shutdown of Nuclear reactors in Japan after the Fukosima accident and the
increased Chinese demand for the Russian natural gas.
1.2 Natural Gas Transportation
Due to rising environmental concerns and low price, natural gas is a front-runner in
energy preference by customers worldwide. Hence, the transportation of it over long
distances is a major issue for the majority of governments and the energy sector.
Two well established modes of transportation are used to carry natural gas over long
distances from the sources to the consumers: pipelines and liquefied natural gas (LNG)
ships. According to BP statistical review of World Energy, pipelines account for 70% of
the transported gas and LNGs for the remaining 30%. Many countries construct LNG
terminals for re-gasification in order to be able to get this fossil fuel directly from the
LNG ships. Some LNG ships have already installed small re-gasification stations on
them, in order to be able to transport greater gas volume from the port. These stations
make LNG ships more competitive against the pipelines. The following figure clearly
depicts LNG ships domination in the sea transport market of natural gas (Wang and
Economides 2009).
usCanada
a Mexico0 S & Cent. America* Eutope & EurasiaU Mddle East
Afric+ Pipeline gas
0 Asa Pacific - LNG
Figure 4: Use of LNG carriers and Pipelines around the world
10

1.2.1 Pipelines
Pipelines are less expensive than the LNG vessels. Underwater pipelines are also an
option, but are very expensive. Pipelines are the common and efficient ways to
transport natural gas on land. Of course, pipelines have political, technical and
economical obstacles. High capital investment is needed for large-diameter pipelines
and significant proven reserves for the next years. Larger pipelines mean that more
compressor stations are necessary for the operation of the pipelines. Compressor
stations require fuel and specialized workers to run. It is estimated that a pipeline costs
around $1 billion to $1.5 billion per 1000 km. Pipeline transportation is less complex
than the LNG process. In the last decade, the development of the underwater pipelines
and offshore pipeline technology make pipelines a viable way of transportation.
Pipeline usage reduces the unit costs of gas transportation thus making it more
competitive to LNG vessels usage (Wagner and Wagensveld 2002).
Figure 5: Alaskan Pipeline
11

1.2.2 LNG Carriers
LNG ships are very expensive. They cost around $200 million to build and their
maximum capacity is 160,000 cubic meters.
Figure 6: Liquefied Natural Gas Carrier
The obvious benefit of LNG carriers is the relatively easy access to distant markets.
Generally, beyond 3,000 kilometers is too great and expensive of a distance for
pipelines to cover (Wand and Economides 2009). The environmental concerns for oil
transportation pipelines have frequently been more widely debated than for liquefied
natural gas pipeline transportation. Pipeline projects such as the Baku-Tblisi Ceyhan,
Chad-Cameroon, Camisea and the Yadana have become important landmarks for
ecological activism. On the other hand, if the pipeline infrastructure can be moved
underground then the environmental impacts can be reduced.
The advantage of LNG ships over pipelines and other modes of transportation for
natural gas is clearly depicted by the following figure.
12

Efficient Options for Monetizing Natural Gas16--
14
12
10
8
6
4
2
070 5,000
Figure 7: Options to transport Natural Gas according to the distance to consuming
market
1.3 Compressed Natural Gas (CNG)
CNG is a natural gas compressed at pressures of 100 to 250 bar in order to reduce its
volume. Ships, trucks and barges can transport it. It has been used to fuel buses, cars
and other vehicles around the world. There are several maritime companies that use
CNG vessels to transport compressed natural gas throughout the seas. These ships can
be called "floating pipelines" (Wang and Economides 2009).
The first ship was constructed in the 1960's for the transportation of CNG. The name of
the ship was Columbia Gas' SIGALPHA. This ship was capable of carrying compressed
natural gas. Of course, this ship was uneconomical due to the low selling price of
natural gas. This high transportation cost and low gas prices meant low returns for the
investors (Wang and Economides 2009).
13
S
I It
1,000 2,000 3,000 4,000Distance to consuming market (km)

Today LNG ships are the leaders in sea transportation of natural gas because they can
carry larger quantities for a considerable distance. Thus they can pick up and transport
natural gas from any port.
Proved / stranded gas (102m3)
Capacity (million m3 )
Reach (km)
Upstream infra costs
Downstream infra costs
Number potential export sites
Global gas commodity market?
Energy balance delivered gas
Public acceptance
161
100 - 250
6000 - 12,000
very large
very large
low
no
very strong
low
127
1,4 - 22
200 - 5,500
low
low
large
yes
stronger
unknown
Table 1: Advantages of LNG Carriers over CNG Carriers
1.4 CNG Carriers and Shipping Companies
CNG carriers' technology is very simple. At an ambient temperature, natural gas is
compressed to higher pressures (100-250 bar). A common CNG ship has a containment
system of cylindrical, vertical or horizontal pipes to store the compressed natural gas.
The pipes are made of steel in order to sustain the high temperature of natural gas
intake.
In the last decade, many investors and shipping companies have shown interest in CNG
projects. Some of the most famous shipping companies that own CNG carriers are:
SeaNG Corporation, Knutsen OAS Shipping Company, Trans Ocean Gas Company and
Enersea Transport LLC.
14

Figure 8: SeaNG Corporation's carrier
1.4.1 Sea NG Corporation
Sea NG Corporation is based in Canada. It has a model that stores compressed natural
gas in coils of pipe wound into cylindrical containers called coselles. Coselles have a
diameter of 17 meters and 4 meters in height. Every coselle weighs around 600 tons
and has a capacity of 3 million MMscf of compressed natural gas. They can be stacked
in the holds and on the deck. This type of CNG vessel combines safe and efficient
loading and unloading facilities with the gas compressed at an onshore terminal.
American Bureau of Shipping was the first classification society, which approved the
first CNG carrier of Sea NG Corporation. Cost savings are achieved because these types
of ships use their own natural gas, as a fuel thus the ship owner does not need to
purchase heavy fuel oil, which is expensive.
15

1.4.2 Knutsen OAS Shipping Company
Knutsen OAS is a Norwegian maritime company, which developed a pressurized natural
gas system. This system consists of pipes enclosed in cylindrical containers. Det Norske
Veritas the Norwegian classification society approved this vessel. In this model, the
natural gas is stored on-board at 250 bar at ambient temperature in vertical cylinders.
The capacity of these ships varies from 2 million cubic meters to 30 million cubic
meters. Their advantage is that they use natural gas as fuel so they have low cost. Their
disadvantage is that the unloading of natural gas could be far away from shore and this
increases the delivery cost.
The technology behind the Knutsen's ship is simple. It is a combination of a crude oil
tanker and a container vessel. The ship's pressurized natural gas system is based on
pipeline construction principles.
I
Figure 9: PNG Carrier of Knutsen OAS
16
4L
Abo.

1.4.3 Trans Ocean Gas Company
Trans Ocean Gas Company is based in Canada and uses fiber reinforced plastic pressure
vessels to transport compressed natural gas at high pressures.
Fiber pressure vessels are considered safe and trustworthy and have various
applications in different industries such as aerospace, offshore shipping and public
transportation. Using fiber pressure vessels eliminates all the disadvantages of using
conventional steel pressure vessels.
The Trans Ocean Gas CNG containment system is easier to install because it is
developed in cassettes. The cassette system carries fiber pressure bottles vertically and
manifolds are connected on the top and bottom of each cassette. In order to reduce
their instability from vibrations and hydrodynamic movements, the cassette frames are
made of steel. In addition, manifolds and pipes are manufactured by duplex stainless
steel in order to be corrosion resistant (Trans Ocean Gas. July, 2010).
Figure 10: Trans Ocean Gas CNG Carrier
17

1.4.4 EnerSea Transport
EnerSea Transport is a US maritime company and has developed a cargo containment
system known as 'VOTRANS' (Volume Optimized Transport Storage).This system
includes compressed natural gas bottles made from large-diameter steel pipe sections.
Optimizing pressure and temperature and using this containment method can achieve
improved storage efficiencies of more than 60%.
Reducing the vessel's weight reduces wall thickness due to the operating pressure of
120 bar and in that way the volume of natural gas is increased.
The vessel's draft was designed to guarantee that the ship could be constructed and the
cargo containment system could be fitted in dry dock. In addition, the vessel can be dry
docked in many ports worldwide for servicing and maintenance.
Figure 11: EnerSea Transport CNG Carrier
18

1.5 Containerization
Containerization is the technique of transporting cargo by placing it in large containers.
It is an essential cargo-moving method established in the last century. Sealed boxes
were used until the 1960s. Afterwards, containerization became a vital factor in
maritime industry. Ships were constructed for carrying containers. These types of ships
are fast and large and can hold boxes inside the bulkheads and above deck. Containers
can be easily loaded and unloaded with less lost time in ports. Their speed makes them
able to make more voyages compare to traditional cargo vessels. Of course, port
infrastructure plays a key role for the fast handling of the boxes. The container can be
transported by a ship, truck and rail. The container, developed after the Second World
War, resulted in a rapid increase of international trade and reduced transport expenses
(Stopford 2009).
Containerization caused a revolution in the global logistics system and shipping
industry. Its introduction did not have an easy passage and it took about ten years
before ships used it widely. One important issue was the high cost of infrastructure in
ports and railroad stations for the handling of the containers. Moreover, trade unions
were worried about the massive loss of jobs of port employees.
Figure 12: Container Terminal
19
In 2010 approximately 90% of non-bulk cargo worldwide was moved by container ships.
Today, several container ships can carry over 14,000 TEU. One example of a modern
container ship with a length of 396 meters is the Emma Maersk. Container ships can be
limited in size only by the depth. Enhanced cargo safety is also a significant advantage
of containerization. It is very difficult for someone to steal the shipment because the
doors of the containers are sealed. In addition, a number of containers are fitted with
electronic monitoring devices and can be remotely monitored for changes in air
pressure, which happens when the doors are opened. Containers have developed into
widely accepted technique to move vehicles overseas .By using TEU or FEU containers
for simple international transportation; container ships have decreased shipping
expense and shipping time.
1.5.1 ISO Standards
There are five common standard container lengths worldwide: 20-ft, 40-ft, 45-ft, 48-ft,
and 53-ft. The United States uses standard containers of 48-ft and 53-ft for domestic
purposes. Cargo capacity of container ships is expressed in twenty-foot equivalent
units or forty-foot equivalent units (FEU).
The maximum gross mass for a loaded TEU container is 24 tons, and for a FEU is
30 tons. The maximum payload mass is reduced to approximately 22 tons for TEU and
27 tons for FEU due to truss weight.
Figure 13: TEU Container
20

1.5.2 Container Ships
Container ships are merchant vessels that carry their load in standard intermodal
containers. They carry the majority of sea-going non-bulk cargo.
Container ship capacity is measured in twenty-foot equivalent units.
These ships remove their hatches and hold more than the traditional merchant vessels.
The hull of a container ship is divided into cells by vertical guide rails. These cells are
designed to store cargo in standard dimensions of a TEU or FEU. Containers are usually
made of steel to be able to hold up to 24 tons.
Recent container ships can carry up to 16,000 twenty-foot equivalent units.
Figure 14: Marco Polo Container Ship (16,000 TEU)
Today's largest container ships have a length of 400 meters. The hull is comparable to
bulk carriers and is built around a strong keel. The holds are topped by hatch covers, on
which more boxes can be loaded. A lot of container ships have their own cargo cranes,
and safety systems for securing the stability of boxes during the voyages.
21

Figure 15: General Arrangement of a Container Ship
In 2010, container ships made up 14% of the world's fleet in terms of deadweight
tonnage. The container ship deadweight tonnage is around 170 million. The average
age of container ships worldwide is 11 years, making them the youngest merchant type
of vessel.
The top 20 liner companies controlled 65% of the world's container capacity, with 2,700
ships and German ship owners dominate the liner shipping trade.
1.5.3 Evolution of Container Ships
Since the mid 1950s, the size of the container ships has been increasing by different
periods. Each period represents a different generation. There are five generations:
1) First generation
The first generation of container ships consisted of small bulk vessels with speeds of 18
knots that could carry up to 1,000 TEUs. Due to the lack of infrastructure in port
terminals, these vessels had cranes onboard. Once the container began to be adopted,
the construction of the first fully cellular container ships started. All containerships are
composed of cells. Cellular containership also offered the benefit of loading the cargo
below the deck as well as on the deck. Many ports started to use specialized cranes for
22

loading and unloading boxes. In addition, the fully cellular vessels were much faster
with speeds of more than 20 knots.
2) Second Generation - Panamax
In the 1980's larger containerships were constructed to meet the economies of scale.
More boxes means less cost per TEU. The main purpose of naval architects and ship
owners is to build ships that can pass the Panama Canal (32 meters beam limitation)
and this was achieved in 1985 with containerships of about 4,000 TEUs.
1) Third Generation - Post Panamax
The target was to overcome the beam restriction of Panama Canal and to construct
bigger ships by increasing the length and keep the beam constant. In 1996, the first
Post Panamax ship was constructed with a capacity of 6,500 TEUs. Ship size increased
with a capacity of 8,000 TEUs due to the rapid growth of international trade. Post
Panamax Containerships require deep-water ports with excellent handling systems.
2) Fourth Generation - New Panamax
These are ships designed to be able to pass Panama Canal after its expansion in 2014.
They have the ability to carry around 12,500 TEUs. These vessels can service the USA
either from Asia and Europe.
3) Fifth Generation - Post New Panamax
In 2006, Maersk shipping company introduced the containership Emma Maersk having
capacity of 11,000 to 15,000 TEUs. These ships cannot pass the Panama Canal even
after its 2014 expansion but can load up to 18,000 TEUs. In addition, shipyards are
trying to design container ships of 30,000 TEUs. These ships will be very useful for the
transportation of large commodities between Europe and Asia.
23

Containership speeds range from 20 to 25 knots. Due to high-energy consumption, many
shipping companies are using slow-steaming method (up to 21 knots) to reduce their fuel costs.
As a result, the design of fast containerships will not continue for the next few years.
S- Io am-D6[aWWEauVinese (ON-) voobogaBA
A 500 - g. T.m Mx'= a 4Ay CaL/ar (879-i)flxU
1,900 -2500 TEU
faisn ME98-) _____________e 3000-3,400 TEDl
Panamax Max (/985-)3400 - 4,500 TEl
4,0-5,000DOTEUPost Panamax (/988-)
Post Paamx Phus (20/0-)6,000 - 8,000 1ai
ALrw PaanWX (214-)12,500 a -
B caumkws -~cantakm h~b am dark
5
4gnas h bdow dmk
:1I.
A
B
C
pat har Pwaaw e f(g-) U7x5M5.5 :22--8 (aii am)15,000 TEU
Tk 00 M?-)18000 Ta
Figure 16: Evolution of Container Ships
In order to reduce the operating cost per TEU, economies of scale play an essential role
in containerships sizes. The major issues for the construction of larger ships are, the
lack of large low speed diesel engines, the size limitations of sea passages such as Suez
Canal and Singapore Strait and the lack of sufficient ports organized to handle large
container ships.
Of course, the low draft of large container ships gives substantial room for ships
growth. Hence, a 20,000 TEUs ship can be constructed by increasing its length and its
beam.
24
1.5.4 Cargo Cranes
There are two types of container ships: geared container ships that have cargo crane
on-board and gearless container ships that do not have cranes. The majority of the
container ships are ungeared. Geared ships account for only 8% of the container ship
capacity and are vessels of 1,500-2,500 TEUs.
Geared container ships are flexible and can load and unload TEUs in every port, but
they have a number of disadvantages such as:
e Higher new building cost
e More maintenance and fuel costs
* Suitable only for less-developed ports
e Some of the cranes are slower than the ports cranes
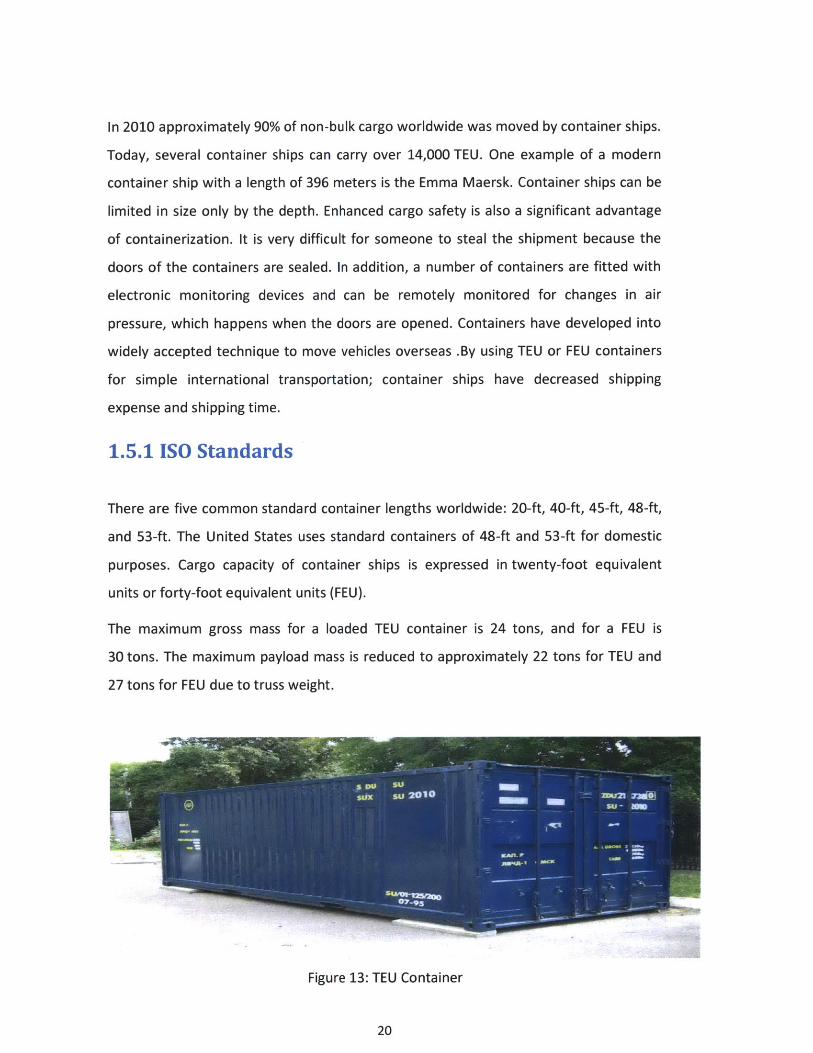
The development of port cranes has been a key to the success of
containerization. Today, some ports can load or unload around 700 TEUs per hour.
Singapore's port is the world's busiest harbor with 26 million of TEUs annually and the
total estimated container traffic is around 465 million TEUs.
Figure 17: Port Crane
25

1.5.5 Cargo Holds
Cargo holds for modern container ships are mainly constructed to increase the speed of
loading and unloading the cargo, and to hold containers stable while at sea. The hatch
openings are vital for the operation of the vessel through its entire life. They are
enclosed by a steel arrangement which is the hatch coaming. Hatch covers are on the
top of hatch coamings and are metal plates that can be moved hydraulically or lifted by
cranes (Stopford 2009).
Vertical arrangements made by metal or cell guides, are installed in each cargo hold.
They keep the containers in well-organized rows and give extra protection against
movement during sea turbulence. The main difference between the structure of
container ships and other merchant vessels such as oil tankers and bulk carriers is that
container ships have cell guides.
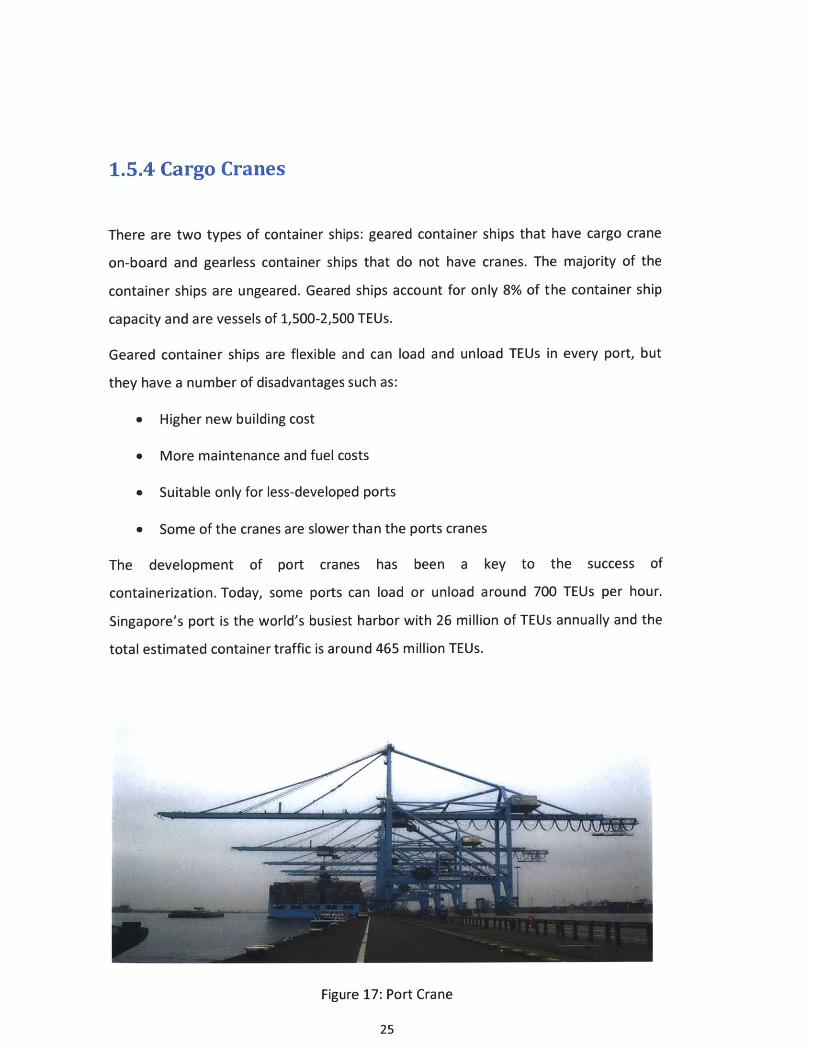
A method of three dimensions is used in the loading and unloading process to explain
the location of a container aboard the ship.
The first coordinate is the row, which starts in the front of the container ship.
The second coordinate is a tier. The first tier is at the bottom of the cargo holds and it
increases across the height of the cargo hold.
The third coordinate is the slot. Slots on the starboard side are given odd numbers and
those on the port side are given even numbers. The slots at the centerline are given low
numbers, and the numbers increase for slots near the end of the edges of breadth.
26
SAY 09%2 10 08 0s 04 02 03 03 os 07 0s It
I I I I I I I I soBe84
82to10
04
02
12 0 410 02 Of 03 015 07 86 It
SAYI1 (10) row
- so
06
Figure 18: The three dimensions of the cargo hold
3
I- 4
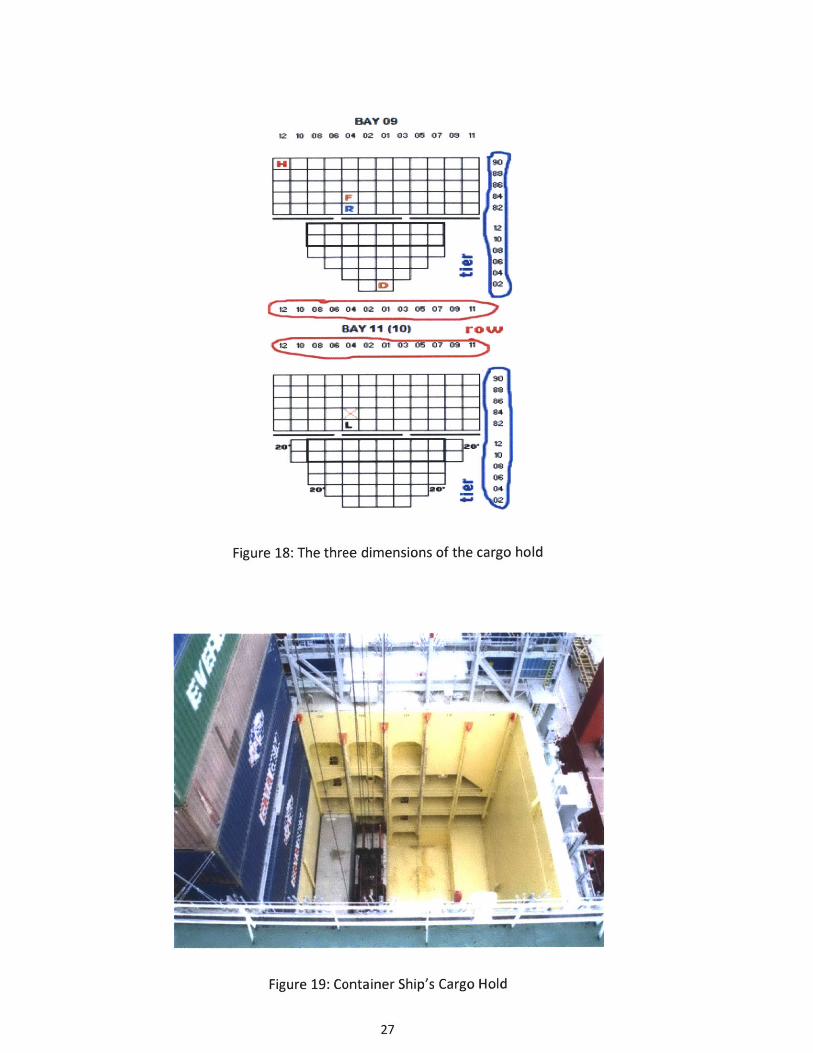
Figure 19: Container Ship's Cargo Hold
27

1.6 Freight Market of Container ships
The act of hiring a ship to carry commodities is called chartering.
In the freight market, the following types of freights and contracts apply:
e Voyage Charter
In this case, the ship owner agrees to transport a given quantity of a commodity with a
predefined vessel from a given port, A, to a given port, B, within a stated time period.
The price is defined as $/tonne of commodity. The freight weight depends upon the
quantity of the cargo loaded in the ship, except when the vessel is fixed on dead weight
charter (Alizadeh and Nomikos 2009).
The ship owner pays every operational expense related to the vessel (fuel, crew, port
charges, etc) with the only exception, probably, being the loading and unloading
expenses.
The voyage charter may be:
1. Direct: this is performed within a few weeks after signing the contract, while
the respective freight is called spot rate.
2. Forward charter: this is performed in the future, e.g. within two months after
signing the contract.
3. Consecutive: this refers to a number of similar, repetitive vessels.
0 Time Charter
In this case, the vessel and the crew are leased for a specific time period. The ship
owner provides the crew, the maintenance and guarantees that the vessel meets
various performance criteria (speed, consumption, etc). In this case, the rate is
determined differently, in $/day or DWT/month.
In addition, the charterer pays separately the following: Fuel, port expenses, loading
and unloading expenses. During the specified charter period, the charterers may use
28

the vessel at their discretion; they may even sub-charter it. A time charter fixture report
will detail the name of the vessel, its description, its delivery date, the rate of hire and
the name of charterer.
There are three charters categories:
1. Direct
2. Forward charter
3. Bareboat charter: the charterer, apart from the fuel, port expenses, loading
and unloading expenses, also provides the crew. In addition, a ship owner
buys a vessel and does not wish to manage it but hands it over the charterer
for a specific period, usually 10-20 years. The owner cannot be active in the
operation of the ship and he acts as an investor.
The time charter market is less transparent for calculating the general market on a
particular route. It is a very suitable measurement for charterers, ship owners and
bankers because they are able to consider the ship's income and compare it to the
breakeven cost (Alizadeh and Nomikos 2009).
" Contract of affreightment
* A Contract of affreightment is similar to a repetitive chartering contract but the
name of the vessel is not defined in it. The ship owner is allowed to use any
vessel, at his discretion, in order to comply with his contractual obligations. He
can even use a vessel that is not under his control when signing the contract
(e.g. he may fulfill his obligations by participating in the time charter as a buyer).
Companies, which are using contract of affreightment, illustrate their industry
as "industrial shipping" because their objective is to provide a service. Most of
these shipping companies that are using this type of chartering, own bulk
carriers that transport iron and coal and the major consumers are the steel mills
of Europe and Far East.
29

The ship owner covers every operating expense of the vessel. The freight is calculated
in a fixed price $/tonne of the commodity. One problem of this contract is that the
volume and time schedule of the cargo is not usually known in advance.
The container shipping prices are divided into two categories: the first is the price to
time-charter one TEU on a container ship, and the other is the freight rate which is the
daily cost to distribute one TEU. The liner maritime companies use the Hamburg Index
and Shanghai's Containerized Freight Index to determine the charter prices of
containers. These indexes show the average daily cost of a TEU for a weight of 14 tons.
In addition, UNCTAD keeps a record of container freight rates expressed as the price for
a charterer to move one TEU along a given route. There are three main routes for liner
sector: Europe-Asia, USA-Europe and USA-Asia. In recent years the freight rate of USA-
Asia route is higher than the other routes due to the high demand of Chinese products
in USA.
Containerized Freight Indices, 20103,000 1,500
1,,300
2,600
1,400 1200
1 27200 1100
2 2000100
E .0 900
1,.600 800W I
Vro 700
1,200 600
1.000 Soo
1 4 7 10 13 16 19 22 25 28 31 34 37 40 43 46 49
Weec no.
-Shanghai - Europe (USD/TEU) = Shanghai - US west coast (USD/FEU)
mChina Containerized Preight Index (RH axis)
Source: Shanghai Shipping Exchange
Figure 20: Shanghai's Containerized Freight Indices
30

2.Transportation of Natural Gas inside a TEU
2.1 Twenty Equivalent Unit (TEU)
The twenty-foot equivalent unit is the most common unit of cargo capacity regularly
used to illustrate the deadweight of container ships. It is a standard-sized metal box
which has the ability to be transported easily by sea (ships) and land (trucks and trains).
The height of TEU ranges from 1.30 meters to 2.90 meters. The most common height is
2.59 meters.
The maximum gross weight for a TEU container is 24tons. Subtracting the empty
container weight, the maximum load a TEU can carry is reduced to 21.8 tons.
8ft
Figure 21: Dimensions of a TEU Container
Inside a TEU, four cylinders can be installed to carry compressed natural gas. In this
project, two materials are examined for the manufacture of the cylinders. The materials
are Steel (X120 steel grade) and composites (Carbon Fiber Type 4).
31

2.2 Steel- X120 grade
The first Compressed Natural Gas (CNG) project, using steel pressure vessels mounted
on the deck of a ship, was conducted off the coast of New Jersey in 1966. It was
concluded that it was not feasible because the weight of steel pressure vessels
required, would be too heavy for the host ship to carry. Thus, CNG development
stagnated for thirty years.
Since then, the demand of Natural gas has been increasing rapidly. Pipeline Companies
try to reduce the gas transportation costs. These expenses can be reduced by high
strength operating pressure and thin wall pipes. Conventional steel lacks strength. The
technological advancement of plate manufacturing helps these companies to exploit
the high strength of steel. Over the last decades, engineers increased transportation
efficiency by increasing the diameter of pipelines. Today, the highest pipeline uses X100
grade. In 1993 ExxonMobil accelerated the improvement of X120 pipeline technology
(Valsgard, Lotsber, Sigurdsson and Mork 2010).
150 -
100
Stmegth
50
0
x5e
1950
X120 e X120
X60 X..
1960 1970 1980 2000 2020Yecar of Comlercial Readiness
Figure 22: The rapid improvement of X120
32
b.
-
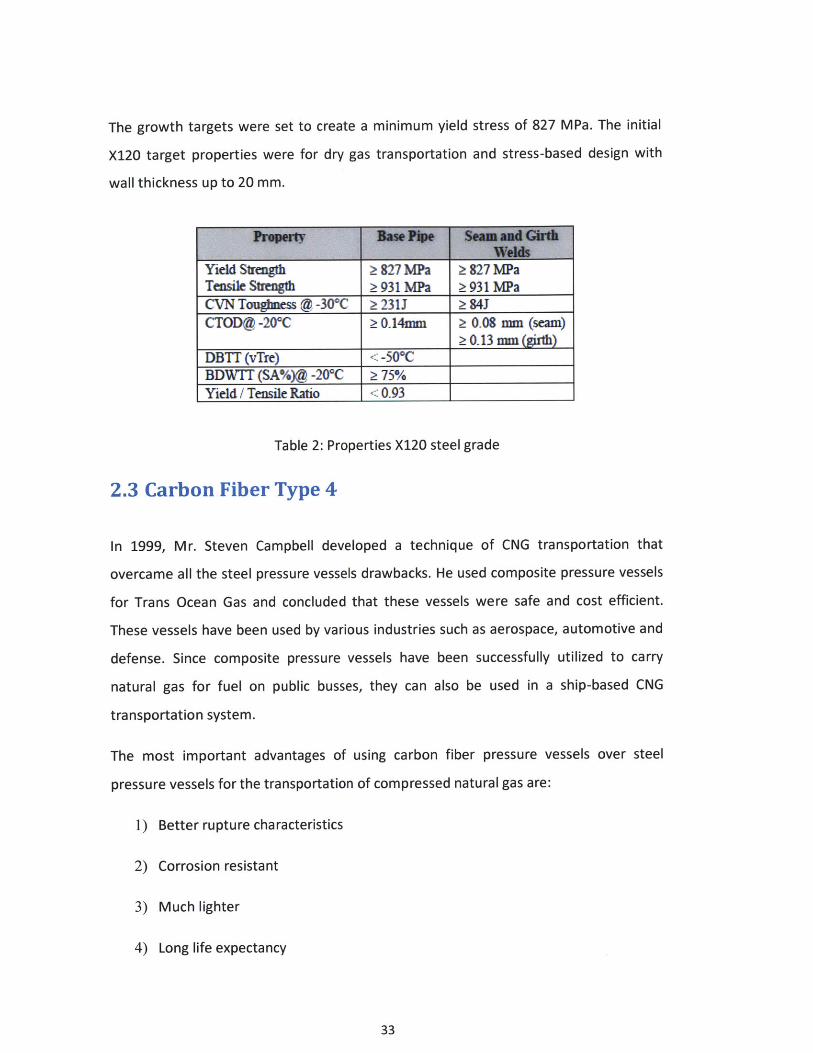
The growth targets were set to create a minimum yield stress of 827 MPa. The initial
X120 target properties were for dry gas transportation and stress-based design with
wall thickness up to 20 mm.
Yield StrengthTensile Strength
8 927 MPa>931 MPa
827 MPa931 MPa
CVN Toughness @-30*C 2231J 84JCTOD@ -20*C > 014mm 0.08 mm (seam)
20.13 mm(girth)DBTT (vTre) <-50*CBDWTIT (SA%)@ -200C 75%Yield / Tensile Ratio <0.93
Table 2: Properties X120 steel grade
2.3 Carbon Fiber Type 4
In 1999, Mr. Steven Campbell developed a technique of CNG transportation that
overcame all the steel pressure vessels drawbacks. He used composite pressure vessels
for Trans Ocean Gas and concluded that these vessels were safe and cost efficient.
These vessels have been used by various industries such as aerospace, automotive and
defense. Since composite pressure vessels have been successfully utilized to carry
natural gas for fuel on public busses, they can also be used in a ship-based CNG
transportation system.
The most important advantages of using carbon fiber pressure vessels over steel
pressure vessels for the transportation of compressed natural gas are:
1) Better rupture characteristics
2) Corrosion resistant
3) Much lighter
4) Long life expectancy
33

f"a Resin Price-
50
CNG Tank, 190 lit.
100 160 200 250Vessel Weight (kg)
Figure 23: Comparison of the weight and cost of each material
2.4 Dimensions of the TEU
TELJ____ ____
Length 6,1 meters
Width 2,44 metersHeight 2,59 meters
Volume 39 cubic meters
Weight 2,2 tons
2.5 Sketch of the TEU
Side View Plan View
2.59 m
6.1 m 2.44 m
34
(0M0
0
100%
90%
80%
70%
60%
50%
40%
30%
20%
Low iiinMce XStrand* (Type 4)----- l
0
2.6 Analysis of the cylinders
2.6.1 Determination of the steel cylinders thickness
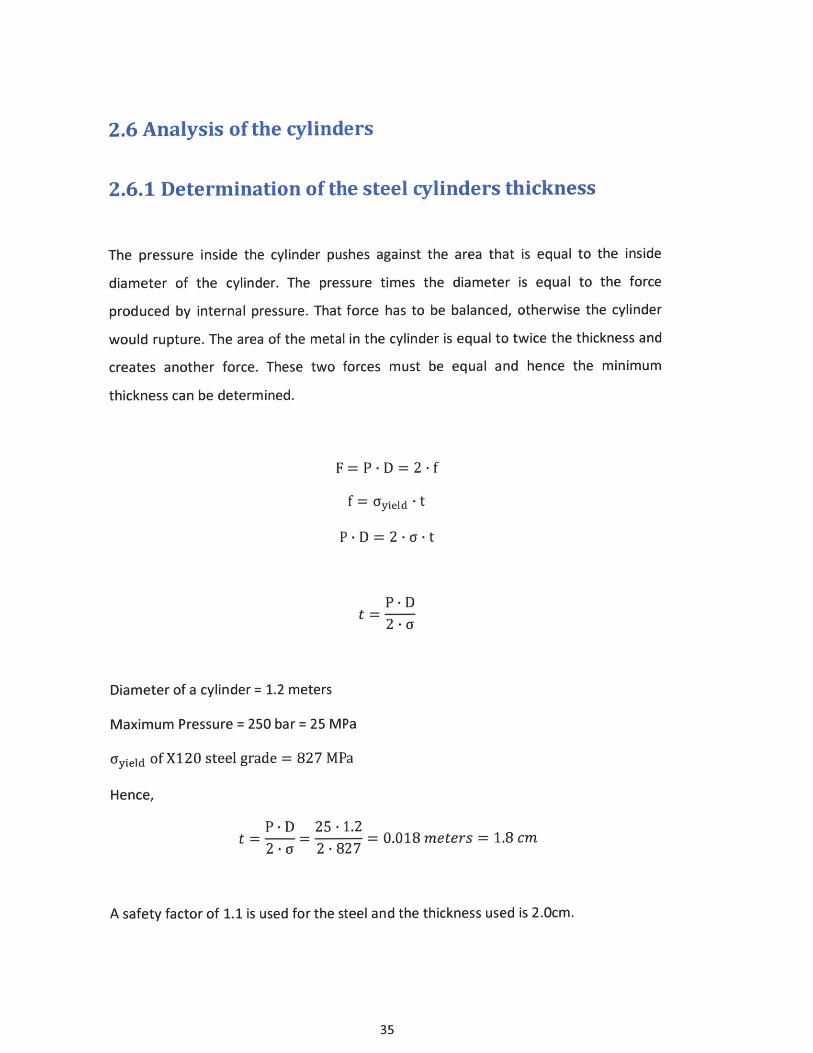
The pressure inside the cylinder pushes against the area that is equal to the inside
diameter of the cylinder. The pressure times the diameter is equal to the force
produced by internal pressure. That force has to be balanced, otherwise the cylinder
would rupture. The area of the metal in the cylinder is equal to twice the thickness and
creates another force. These two forces must be equal and hence the minimum
thickness can be determined.
F= P-D= 2-f
f = Uyield t
P-D=2-a-t
t=2 -ay
Diameter of a cylinder = 1.2 meters
Maximum Pressure = 250 bar = 25 MPa
Gyield of X120 steel grade = 827 MPa
Hence,
P -D 25-1.2t = - = 2 2= 0.018 meters =1.8 cm
2 - ca 2-827
A safety factor of 1.1 is used for the steel and the thickness used is 2.0cm.
35

2.6.2 Dimensions of the cylinders
Pressure inside the cylinders 250 barCylinder's length 6 meters
Material X120 Steel gradeThickness 0,020 meters
Diameter of the Cylinder 1,2 metersDiameter of the Inner Cylinder 1,16 meters
Yield Strength of steel 827 MPa
2.6.3 Calculation of cylinders volume
Cylindrical SectionLength 4,8 meters
Outside Height 1,2 metersInside Height 1,16 meters
Inner Volume 5,1 cubic metersTotal Volume 5,4 cubic meters
Volume of Cylindrical Section 0,4 cubic meters
Semicircular Sections 2Outer Radius 0,6 metersInner Radius 0,58 meters
Inner Volume 2,11 cubic metersTotal Volume 2,26 cubic meters
Volume of Semicircular Sections 0,15 cubic meters
Total Volume of Steel 0,50 cubic meters
]
36
L

2.6.4 Calculation of Weight of cylinders without CNG
Density of steel 7850 kg/cubic meters
Weight of Steel in one cylinder 3946 kg 4 tons
Weight of 4 cylinders in an TEU 15,8 tons
2.6.5 Determination of the Compressed Natural Gas inside
the four cylinders
Density of Natural Gas 0,7 kg/cubic meters
Total Volume of Inner Cylinders inFEU 7,18 cubic meters
Weight of Natural Gas (4 Cylinders) 5029 kg 5,0 tons
2.6.6 Total Weight of a TEU
Weight of the TEU+Cylinders+NG 23 tons
As it is mentioned in a previous section of this thesis, the maximum weight of a TEU 24
tons. Hence, using steel cylinders is reliable and valid for this project.
37

2.6.7 Determination of the Carbon Fiber (Type 4)
cylinders weight
According to the following figure and the composite cylinders company the ratio of the
CNG/Total weight is 57.7% or a ratio of 0.577. The weight of the compressed natural
gas is 5 tons this gives a weight for the composite container of 3.66 tons. This lowers
the weight of the TEU by 4.32 tons which is 34%.
Type 1 Type 2 Type 3 Type 4
93% 4% <2% <2%
Metal Metal Liner reinforced Metal Liner reinforced Resin impregnatedwith resin Impregnated with resin Impregnated continuous filament
continuous filament continuous filament with a non-metallic liner(hoop Wrap) (fully Wrap)
CrMo steel CrMo steel with Glass Aluminium with HP HDPE liner with CarbonFiber Glass &lor Carbon
$3 to $5 $5 to $7 $9 to $14 $11 to $18
0.91.3 0.-1.0 OA-0. 0.3-CA
sou"
Figure 24: Weight and cost of each material
Therefore, the total weight of a TEU by using composites cylinder us 11.7 tons.
Weight of the NG 5 tons
CNG/Total Weight 0,577
Weight of the composites cylinders 3,67 tons
Weight of NG 5 tons
Weight of frame + TEU 3 tons
Weight of a loaded TEU 11,7 tons
38

2.7 Strength Analysis of the TEU
1.2 meters
1.2 meters
Figure 25: Free Body Diagram of the cylinder
Mass of Natural gas inside the cylinder = 1250 kg
Mass of cylinder's steel = 3950 kg
Total mass = 5200 kg
Weight = 5200 * 9.81 = 51012 N
Weight at each edge is = 51012/2 = 25506 N
6 = 450
s 12 1cO - 1
,EF = 0
F3x - F1, = 0
F3 - cosO = F1 - cosO
F3 = F1
39

Weight = F2 + F1, + F3 ,
25506 = F2 + F1 -sin& + F3 - sinO
25506 = F2 + F1 - sin45" + F3 - sin450
25506 = F2 + F1 + F3 -
Al1 = Al2 cos6 = Al3
Euler'sformula states: Al =
F1 4 -_1 F2 *- 12A-E - AEcos6
F1 1 = F2 - 12 - COS9
F -cos= F2 -12 -cos6
F1 = F2 - cos 2 6 = F3
F lA E
F1 = F 2 - -V( 2
*-* F1 = F2 - 0-5 = F3
Hence,
25506 = F2 + F1 -2
40

25506 = F2 + F2 - O.5 - + (F 2 - 0.5 *1-)
F2 = 14941 N
F1 = F3 = 7492N
2.7.1 Tensile Stresses11 = 13 = 0.84 meters
12 = 0.6 meters
Thickness = 0.03 meters
-1 = 3 F - 7492 = 297302 N/r 2A 0.84* 0.03
F2 14941NU2 6 - 0 3 = 830111 N/2A 0.6-0.03= 8311
2.7.2 Beam Analysis
85 N/cm
6 meters
Total Weight of a cylinder = 51012 N
Length of the beam = 6 meters
Hence, 8500 N/m = 85 N/cm
41

EF = 0
EF = 0< Ra + Rb = 85 -600 = 51000 N
Hence, Ra = Rb = 25500 N
EM = 0
x=0 M=0
x=3 M = (25500 - 300) -(85 - 3) = 3825000 N - cm
x=6 M=0
2.7.3 Shear Force and Bending Moment Diagrams
25500 N
3I m
25500 N
Bending Moment Diagram:
3im
+1 3825000 N - cm I
Cross-Section:
42
120 cm

A36 steel is going to be used.
Force = 51012 N
Length = 600 cm
Young Modulus of A36 steel = 29000000 psi = 19994796 N/cm2
F -1 51012 -600 10 4 cmAl-AE~ 19994796-600-3
2.7.4 Compression Stresses on the beamF 51012
a=F 50 = 28.34 N/cm2
A 600-3
A36 steel in plates, bars, and shapes with a thickness of less than 8 inches have
minimum yield strength of 36,000 psi.
36000 psi = 24821 N/cm 2
2.7.5 Maximum Bending stressthickness -width 2 3 - 1202
Wx = Moment of Resistance = 6- 6 = 7200 cm 3
6 6
M 3825000- -- 82 0 -= 531.25 N/cm2
W 7200
Allowable bending stress for A36 steel: 22000 psi = 15168 N/cm 2
Callowable > Ubending moment
Hence, it is accepted.
2.7.6 Critical Buckling PointIn our case, Euler's formula for critical buckling point cannot be applied.
Safety factor of A36 steel = 1.67
Fcritical = safety factor - Force
Fcritical = 1.67 -51012 = 85190 N
Of course we can reduce the thickness of the cross-section in order the total weight of
the FEU to be decreased
43

3. Compressors
A gas compressor is a mechanical device that increases the pressure of a gas by
reducing its volume.
Types of Compressors:
The most important types of gas compressors are presented on the following figure
(Bloch 2006):
L i Screw c lr~qid Ring] Scroll
Figure 26: Compressors Types
3.1 Reciprocating Compressors
Reciprocating compressors make use of pistons driven by a crankshaft. Their
characteristics are:
e They are stationary or portable
e They are single or multi-staged
" Internal combustion engines or electric motors drive them
44

They are used by many industries such as automotive, oil and gas industries. Their
benefit is the potential to reach discharge pressures up to 200 MPa and for that reason
they are the most efficient type of compressors. On the other hand, their big size and
high capital cost are their main disadvantages (Bloch 2006).
P1
Figure 27: Reciprocating Compressor
3.2 Centrifugal Compressors
Centrifugal compressors make use of an impeller to force the gas to the rim of the
impeller, increasing the velocity of the gas. A diffuser section is used in order to convert
the kinetic energy to pressure energy. These compressors are mainly used in the oil
industry and in natural gas processing plants. They are single and multi-staged
compressors. They can reach pressures up to 70 MPa (Bloch 2006).
Figure 28: Centrifugal Compressor
45

3.3 Axial Compressors
Axial-flow compressors are dynamic rotating compressors that use arrays of fan-
like airfoils to compress the gas. They are perfect for high flow rates of gases. They are
multi-staged compressors (more than 5 stages). One important advantage of axial
compressors is their high efficiency which reaches 90% at design conditions. Of course,
for that reason they are expensive and need careful maintenance. Natural gas pumping
stations use these types of compressors (Bloch 2006).
oVAIN SHAF NDFIIVI= FROM TURBINE
Figure 29: Axial Compressor
3.4 Rotary Compressors
Rotary
screws
screw compressors use two meshed, rotating, positive-displacement helical
to force the gas into a smaller space (Bloch 2006). Their features are:
Continuous operation
e Stationary or portable
* They produce a power up to 900 kW
e Their discharge pressure can be up to 8 MPa
46

Figure 30: Rotary Compressor
3.5 First Law of Thermodynamics
The first law of thermodynamics states that energy cannot be created or destroyed
during a process, although it may change from one form of energy to another in a
closed system (Borgnakke and Sonntag 2009).
AE = Q -W
The change in internal energy of a system is equal to the heat added to the system
minus the work done by the system.
The first law of thermodynamics can be expressed from the conservation of energy for
an open system.
Q + (e + pU) initial * hinitial = (e + PU)final ' rfinal + W
e is the energy, u is the specific volume and p is the pressure.
For constant flow of mass: 7 initial = rnfinal = ?n
Hence, the above equation can be written as:
O + (e + pU) initial - 7 = (e + PU)final - r + 1
47
Oil injected into the Compressed gassystem seals,lubricates andrgove heat hat Two-stage irrtake gas filter Oil separator
the compression. elemert.Compressor
Micro oil filter Cool oilretumn Belt
Gas- OilSeparator
Compresd '- OiyoutletOil cooler Hot separated oil gas
to oil cooler Motordrive
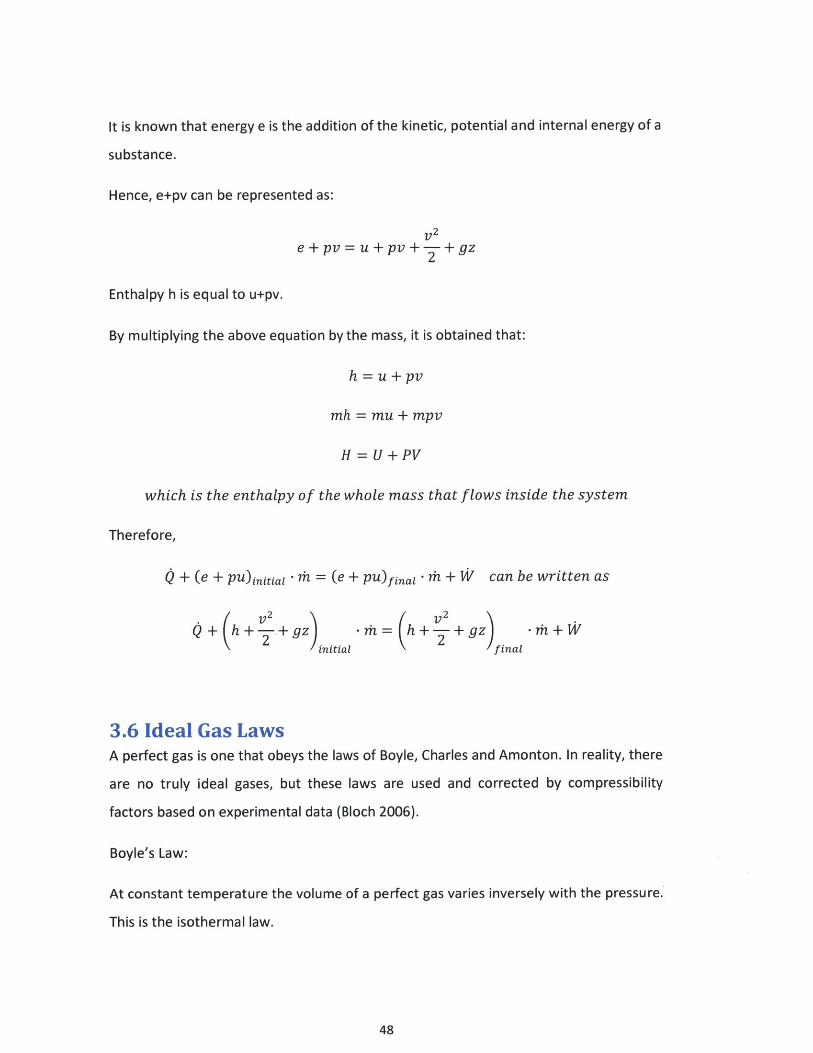
It is known that energy e is the addition of the kinetic, potential and internal energy of a
substance.
Hence, e+pv can be represented as:
v 2e + pv = u + pv +- + gz
Enthalpy h is equal to u+pv.
By multiplying the above equation by the mass, it is obtained that:
h = u + pv
mh = mu + mpv
H = U + PV
which is the enthalpy of the whole mass that flows inside the system
Therefore,
Q + (e + PU)initial -7h = (e + pu)final -?m + W can be written as
+ ( 2
(h + ,+ gzinitial
S ( 2
T h = ( h -T g z f in a l
3.6 Ideal Gas LawsA perfect gas is one that obeys the laws of Boyle, Charles and Amonton. In reality, there
are no truly ideal gases, but these laws are used and corrected by compressibility
factors based on experimental data (Bloch 2006).
Boyle's Law:
At constant temperature the volume of a perfect gas varies inversely with the pressure.
This is the isothermal law.
48

V2 P1
V1 P2
P2 - V2 = P1 -V1 = constant
Charles' Law:
The volume of a perfect gas at constant pressure varies as the absolute temperature:
V2 T2
V1 T1
V2 _V 1 _- - - - constantT2 T1
Amontons' Law:
At constant volume the pressure of a perfect gas will vary with the absolute
temperature.
P2 T 2
P1 T,
P2 _p 1-- =- constantT 2 T1
3.7 Perfect Gas FormulaUsing Charles' and Boyles' laws, the following formula is developed which is the perfect
gas equation:
P - V = n-- R - T
Where P is pressure in Pascal, V is the gas volume in m 3 , n is the number of moles of
the gas, T is the absolute temperature in Kelvin and R is the universal gas constant and
equals to 8.31 mo.mol-K
49

3.8 CompressibilityAll the gases deviate from the above ideal gas laws. It is essential that these deviations
be considered in many compressor calculations in order for the results to be reliable.
Compressibility is taken into account from the records on the real performance of a
particular gas under pressure-volume-temperature changes. Hence, Z factor becomes a
multiplier in the perfect gas equation (Cravalho, Smith, Brisson and McKinley 2005).
The ideal gas formula can be written as:
P-V =Z-n-R-T
Or
P -VZ =RT
Compressibility factor Z is defined as the ration of the actual volume (at a given
pressure and temperature) to the ideal volume of a perfect gas. In addition, it
determines how real gas diverges from actuality.
Z factor can be calculated by PVT laboratories and from published charts such as the
one shown in the following figure.
PEUDO gVCEvD PMESURC
Figure 31: Diagram of Compressibility Factor
50

3.9 Theoretical Compression cyclesThere are two types of compression cycles that are valid to compressors.
Isothermal Compression is when the temperature is kept constant as the pressure
increases. Of course, this is an ideal compression cycle and cannot be implemented
easily on a compressor. This needs constant removal of the heat of compression.
Isothermal compression obeys the following equation:
P1 -V1 = P2 - V2 = constant
Adiabatic compression is obtained when there is no heat added or removed from the
gas during compression. It obeys the following formula
P1 - 1 = P2 V 2
where k is the ratio of the specific heats.
1E D CSB
AB - ADIABATICAC - POLYTROPICAD - ISOTHERMAL
THEORETICALNO CLEARANCE
F A
VOLUME-0
FIGURE 1.7 A p-V diagram illustrating theoretical compression cycles. (Dresser-Rand Company,
Painted Post, N. Y)
Figure 32: Pressure-Volume Diagram
The above figure shows the theoretical isothermal and adiabatic cycles on a pressure-
volume diagram. The area represents the work required from a compressor. It is
observed that the work required for the isothermal process is less than the work
required for the adiabatic process.
51
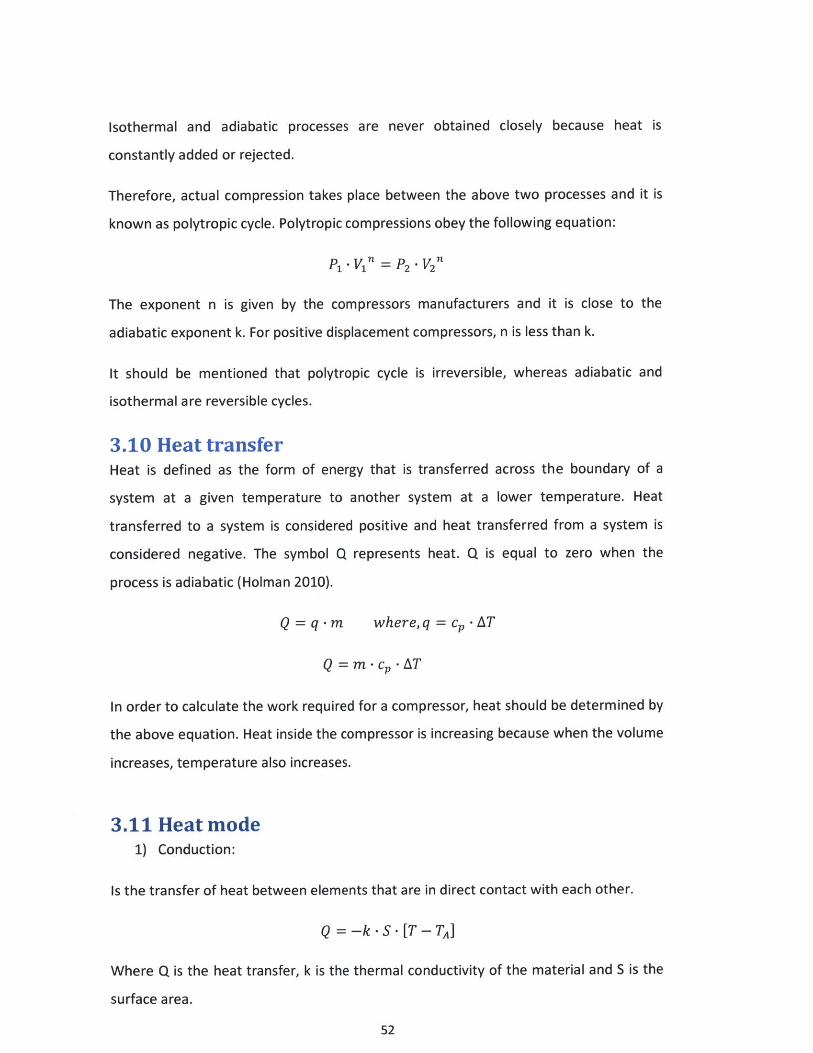
Isothermal and adiabatic processes are never obtained closely because heat is
constantly added or rejected.
Therefore, actual compression takes place between the above two processes and it is
known as polytropic cycle. Polytropic compressions obey the following equation:
P1 - = P2 . V2n
The exponent n is given by the compressors manufacturers and it is close to the
adiabatic exponent k. For positive displacement compressors, n is less than k.
It should be mentioned that polytropic cycle is irreversible, whereas adiabatic and
isothermal are reversible cycles.
3.10 Heat transferHeat is defined as the form of energy that is transferred across the boundary of a
system at a given temperature to another system at a lower temperature. Heat
transferred to a system is considered positive and heat transferred from a system is
considered negative. The symbol Q represents heat. Q is equal to zero when the
process is adiabatic (Holman 2010).
Q=q-m where,q=c, -AT
Q=m-c, *AT
In order to calculate the work required for a compressor, heat should be determined by
the above equation. Heat inside the compressor is increasing because when the volume
increases, temperature also increases.
3.11 Heat mode1) Conduction:
Is the transfer of heat between elements that are in direct contact with each other.
Q = -k - S - [T - TA]
Where Q is the heat transfer, k is the thermal conductivity of the material and S is the
surface area.
52

The conduction process can be seen in the following sketch:
Figure 33: Conduction Process
Energy conducted in the left side + Heat created within the element = Change in
internal energy + Energy conducted out right side
3.12 Heat CapacityHeat Capacity is a feature of a matter, the amount of heat required to change its
temperature by one degree. For gases, there are two heat capacities (at constant
pressure and at constant volume) (Holman 2010)..
The heat capacity for constant pressure Cp is the change of specific enthalpy of a gas
when the pressure is constant and temperature varies.
Cp can be obtained by:
CP-h2 - hi
St2 - t1
The heat capacity at constant volume Cv is the change of specific internal energy of a
gas when the volume is constant and temperature varies.
V U2 - Ui
t 2 - tl
The relationship between Cp and Cv can be represented by the following equation:
R = Cp - C,
53

Hence, the difference between the two specific heat capacities is equal to the universal
gas constant R.
In addition, many times in thermodynamics the ratio of Cp and Cv can be written as:
Y = CPC3
3.13 Work Done Calculation for the whole Process
The purpose of our compressors is to increase the volume from 10 bar to 250 bar. This
can be achieved by using centrifugal compressors to increase the pressure from 10 bar
to 50 bar and then using reciprocating compressors to increase the pressure from 50
bar to 250 bar. In addition, an inter-cooler is used to reduce the temperature in order
any melting issue to be avoided. Our process is divided into three stages and all the
above thermodynamics equations were used for the determination of the total work
done by the compressors and the inter-cooler.
P1(t), T1(T)
v
P2(t),T2(t)=Ta P3(t),T3(t)
Figure 34: Two-stage process to reach 250 bar inside the cylinders of the TEU
54
Pin=10 barTo=Ta
wi

First Law around Stage 1 (10-50 bar):
W = * - cp - (T1 - TA)
First Law around Stage 2 (50-250 bar):
W = 7h - c, (T3 - T2 )
First Law around Inter-Cooler:
QIc = ? - Cp - (T1 - T2)
First Law around FEU container:
dE
dtQc + m - hIN ~
1) Qc = -k - S - [T(t) - TA]
2)
3)
hIN = Cy T3(t)E(t) = m(t) - cv -T (t)
Substitution:
-k -S- [T(t) -TA] +h-c- d[m(t) - cv - T(t)]Ts~t)= dt
-k -S - [T(t) - Tai + r - cp -T(t) = r - c, -T(t) + m(t) -c, - !'t)
First Law around FEU container:
QIc = m - c, - (T 1 - T2 )
rh - c, - (T1 - T2 ) = (k -S)1 c - (T1 - TA)
Qic = (k - S)1 c - (T1 - TA)
or
Qic =(k -S)jc(T1 + T2
- 1 2- TA) = h -c,. (T 1 -T 2 )
Hence,
WTotal = W1 + W2 = h- Cp (T1 - TA + T3 - T 2 )
55
c + - hIN =
dE

(p (a(p a
- T = -a T2
Let's substitute on the following equation:
(k S)1 c -(T1 +T2(kS)c 2
TA) = rh- c '-(T 1 - T 2 )
(k. . (T1 + T2
(k-)1c 2TA) = m-c- T1- m-c-T2
(k-S)Ic-T-+(k-S)c -2 (k-S)1c-TA=m-cP- T1 - ' T2
(k -S) 1c -T1 + (k -S)c-T 2 - 2 -(k-S)c- TA = 2 Cp T - 2 -- c -T2
(k -S)c-T 2 + 2 -- cp -T 2 = 2 -c - T1 - (k -S)c-T 1 + 2 -(k -S)c-T
T2[(k -S) 1 c + 2 -i- cp] = 2 -cp T1 - (k -S)c-T 1 +2 -(k -S) 1 c TA
T2 -f- cp -T1 - (k -S) 1 c -[T 1 - 2 TA]
[(k -S) 1 c + 2 -m- c]
By knowing the following equation:
T3 = (Pa T
j
One other principle equation is:
Tp- TA
TA
(PA) a
- -c[-T1-(k -S)1c -
[(k -S)1c + 2 - -rh
2 -fi -cp -T,1[(k -S)1 c + 2 -7h c]]
(P a
\P/)
T,) . (p)' a(pl agpa
[T1 - 2 -TA]
-c] j
(k -S)1c - [T1 - 2 - TA ]
[(k -S)Ic + 2 - Th -cy]]
56
Calculation of T2:
T3 (P3) a T2 ~ TA
TA
(P1 a
~PA)PA) TA
pa(PA)a()
P a
- rh - cp - T1 - (k -S)1c - [T1 - 2 - TA ][(k -S)1c + 2 -7h -cp]
= p a. 2
P 1 /
T3p a.2
\/ )

2* m* 1h-c-T[(k-S)1 c +2 -h-c]]
P (pa (k - S)1c
\P/ [(k -S)1c +
-L(p a (k -S)c -T 1\ } [(k -S)1c + 2 - l- cP]TA |
2 -m -ca]]
P a 2 - * - (k -S) 1c
T1 -[(k s)1c+2 - - cP]]+ (P)a (k -]S)c -2 -T
P, [(k -S)1c +2 -T - cP]]
3 (Pa (p)a.2 - C - c-(k -S) 1c
(P)aP1
(k -S)Ic -2 -TA
[(k -S)1c +2 - t -c ]
Ti3 = (p3 a
Ti2 'P 2)
- p)a(p ()a
2 -rh-c -(k -S)1c TI -( p ) a -
+ - -. 3[(k -S)1c+2 -ih -c] LT2
(k -S)Ic -2 -TA[(k -S) 1 c + 2 -m -c]]
Assume that T2=Ta or that the inter-cooler brings the exit temperature down to
atmospheric.
(pa 2 -rh - cp - (k -S)1c +(P)a . 2*t[(k -S) 1c + 2 - h - c]J +
(p)a 2 - m - cp - (k -S)1c(k -S) 1c + 2 - h -c]] +
[T3
TA3
T3 -
(k -S)1c - 2 -TA
[(k -S)1c + 2 - I - cp]
(k -S)lc -2
[(k - S) 1c + 2 - i - cP]J
T3 - [T3
T3 - 1 - [(k
(k -S)1 c - 2
-S)1c + 2 -?h -_I] TA
c ]] (p )a
TP a (p)a2 -m - cp - (k -S)1c
[(k -S)1 c + 2 -i] -c]
a2 - - cp - (k -S)IC(pa.[(k -S)Ic + 2 - - c]
T3 -
ITA pt) 2 -rh - cp - (k -S)jc(PA)a (P(t))a.[(k -S)c + 2 - - c
[1
Perfect Gas Law:
P(t) -V = m(t) - R -T(t)
Hence,
57
T3 (P)a\
T3 =
From,
T3 =
T3 =
T3 =
(kS- S)1c-2J[(k -S)1e + 2 - ?h - cP]
(k -S)1 c -2[(k -S);c + 2 - r -cp]
I

T3 =[ TA(PA)a
(m(t)- R -T(t)\a 2.-.c,-(kS)IC 1V[(k -S)1c+2 -T - c]]
Substitution:
dEQc+m-hJNyj
-k -S -[T(t) -TA] + ' T3 (t) = d[m(t) -c-T(t)]dt
-k -S -[T(t) - TA] + - c- T3(t) = -c -T(t) + m(t) -c-'t(t)
TA
-k -S- [T(t) - TA]+ -c p
-k-S- [T(t) -TA]+ m- cp.
m(t)- R -T(t) a 2-h-cp-(k-S) 1 c
a 1y [(k S) c 2 S)c + 2 - -c] = -c -T(t)+ m(t) -c -
1-[ k -S)c2- -c
TA (m(t)-R .T(t)a 2 - y -cp-(k -S)Ic]P - S)ilc + 2 - c - cy ]]
A i (mt (k)1c-2- c, -T(t)
1- [(k -S)Ic + 2 -6 - cp]
m(t) - c,
Total Work done
tf
WTotal = J (W1 + W2)dt = Jt .[m-c,-(T -TA+T -T2)]dt0
58
-T(t)
S _ (k - S)1c -2 |[(k - S)1c + 2- - ]
3.14 Calculation of the above constants
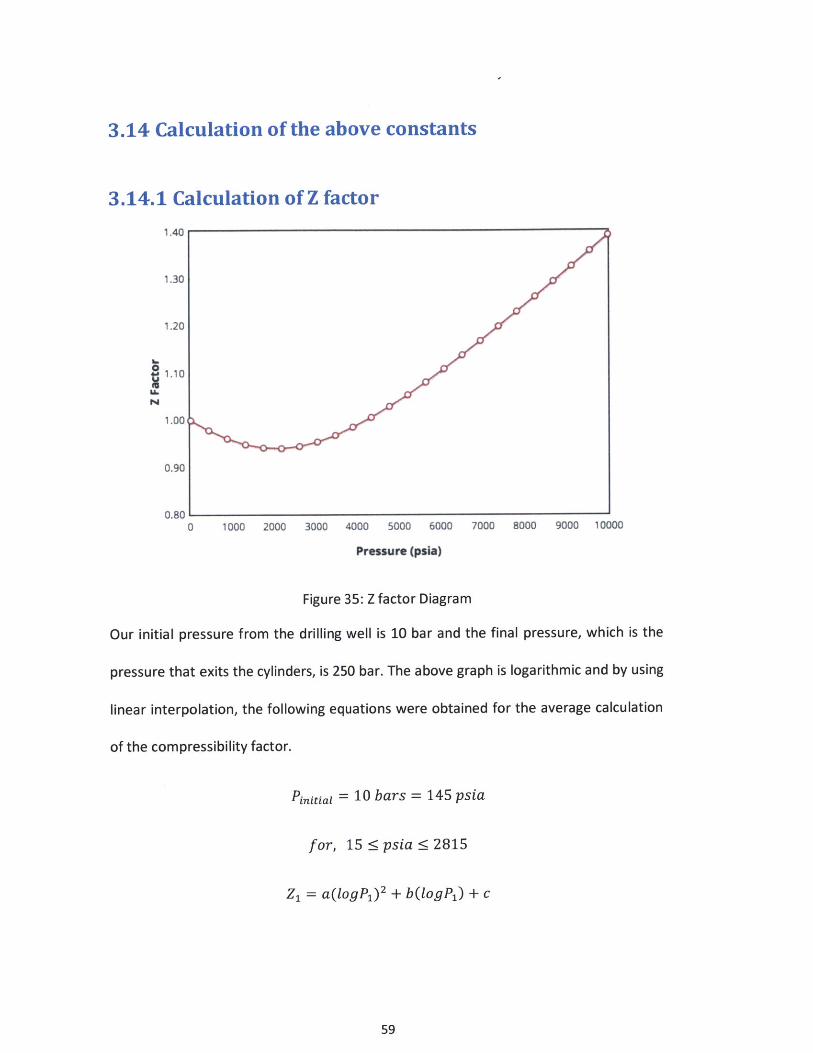
3.14.1 Calculation of Z factor
1.40
1.30
1.20
1.10
1.001
0.90
0.800 1000 2000 3000 4000 5000 6000 7000 8000 9000 10000
Pressure (psia)
Figure 35: Z factor Diagram
Our initial pressure from the drilling well is 10 bar and the final pressure, which is the
pressure that exits the cylinders, is 250 bar. The above graph is logarithmic and by using
linear interpolation, the following equations were obtained for the average calculation
of the compressibility factor.
Pinitia1 = 10 bars = 145 psia
for, 15 s psia 5 2815
Z1 = a(logP1 ) 2 + b(logP1 ) + c
59

a= -0.0322
b= 0.0833
c= 0.9468
Z, = 0.9764
Pfinai = 250 bars = 3625 psia
for, 2815 psia 4015
Z2 = a(logP2) 2 + b(logP2) + c
a= 0.9214
b= -6.6837
c= 12.9418
Z2= 0.8254
Hence, the average of Z1 and Z2 is taken
Zi + Z2 0.9764 + 0.8254Z = 2 2
60
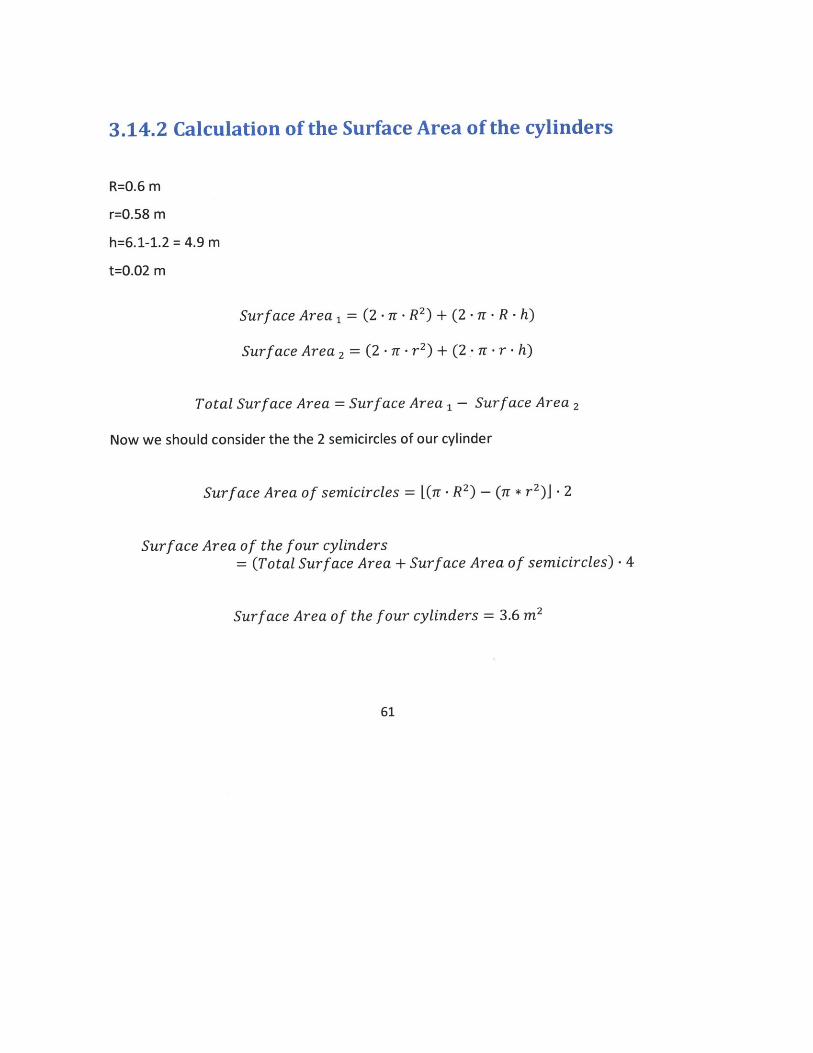
3.14.2 Calculation of the Surface Area of the cylinders
R=0.6 m
r=0.58 m
h=6.1-1.2 = 4.9 m
t=0.02 m
Surface Area 1 = (2 -7 - R2)+ (2 .n - R - h)
Surface Area 2 = (2 -7r - r 2 ) + (2,- n -r - h)
Total Surface Area = Surface Area 1 - Surface Area 2
Now we should consider the the 2 semicircles of our cylinder
Surface Area of semicircles = [(7 -R 2 ) - (n * r 2 )J 2
Surface Area of the four cylinders= (Total Surface Area + Surface Area of semicircles) -4
Surface Area of the four cylinders = 3.6 m 2
61

3.14.3 Specific Heat Capacities and Gas Constant of
Methane
AppendixI 1 911
Ideal-gas specific heats of various common gases
(a) At 300 K
Gas constant, R c cGas Formula kJ/kg - K kJkg - K kJ/kg - K k
Air - 0.2870 1.005 0.718 1.400Argon Ar 0.2081 0.5203 0.3122 1.667Butane C4H10 0.1433 1.7164 1.5734 1.091Carbon dioxide CO2 0.1889 0.846 0.657 1.289Carbon monoxide CO 0.2968 1.040 0.744 1.400Ethane C2H6 0.2765 1.7662 1.4897 1.186Ethylene C2H4 0.2964 1.5482 1.2518 1.237Helium He 2.0769 5.1926 3.1156 1.667Hydrogen H2 4.1240 14.307 10.183 1.405Methane CH4 0.5182 2.2537 1.7354 1.299Neon Ne 0.4119 1.0299 0.6179 1.667Nitrogen N2 0.2968 1.039 0.743 1.400Octane CaHis 0.0729 1.7113 1.6385 1.044Oxygen 02 0.2598 0.918 0.658 1.395Propane C3Hs 0.1885 1.6794 1.4909 1.126Steam H20 0.4615 1.8723 1.4108 1.327
Note: The unit krg - K is equivalent to kJAg - C.Some Chemicaf and Process Thertnodynamics 31E by Kyle, B. G. 0 2000. Adapted by permission of Pearson Education, Inc.. Upper Saddle River, NJ.
Table 3: Ideal-gas specific heats of various gases
c = 2253.7 kKP kg-Kc, = 1735.4 1
kg-KR = 518.2 '
kg.K
c~ 2253.7y = - = 22 = 1.299
c, 1735.4
62

3.14.4 Mass flow rate
One TEU can carry 5 tons (5,000 kg) of compressed natural gas.
Hence,
The mass flow rate depends on time (hours needed to load the whole vessel).
To load one TEU in one day,
5000M 86400= 0.056 kg/sec
86400
To load one TEU in two days,
5000
m = 172800= 0.029 kg/sec
To load one TEU in three days,
5000m = 259200
= 0.019 kg/sec
63

3.15 Calculation of Work done using Matlab
3.15.1 Case 1: Load a TEU in one dayStage 1: To increase the pressure from 10 bar to 50 bar
x 10 Pressure exits Compressor 1 VS Time
4.5
4
3.5
3 r
2.5
2-
1.5
0 1 2 3 4 5 6 7 8time (seconds)
Figure 36: Pressure (10 bar-50 bar) over Time graph
Temperature exits Compressor I VS Time
420
400
380
360
340
320
300
280 r0 1 2 3 4 5
time (seconds)6 7 8 9
x 10
Figure 37: Temperature over Time graph
64
9
x 10
EF-
440

Stage 2: To increase the pressure from 50 bar to 250 bar
x 107 Pressure exits Compressor 2 VS Time
2
0na-
1.5 K
1 1
0.5 -0 1 2 3 4 5 6 7 8
time (seconds)
Figure 38: Pressure (50 bar-250 bar) over Time graph
Temperature exits Compressor 2 VS Time
-- -- --------- -.. 1 - -7- --2 3 4 5 6 7
time (seconds)
Figure 39: Temperature over Time graph
65
9
x 10 4
EFT
440.
420 -
400
380 -
360-
340-
320
300-
2800 1
2
K
8 9
X 104

Work done VS Time
0.5-
0
0 1 2 3 4 5time (seconds)
6 7 8
x 104
Figure 40: Work done to reach 250 bar in one day
Total Work required = 1.8039 - 10 9Joules
Hence, a 20.8 kW rated compressor is needed to load one TEU in one day.
66
104x
3.51-
3
2.5 -
7!, 2-
00 1.5-

3.15.2 Case 2: Load a TEU in two daysStage 1: To increase the pressure from 10 bar to 50 bar
X 106 Pressure exits Compressor 1 VS Time
4.5
4
3
2.5
2
1.5
10
CL
E
440
420
400 -
380 -
360-
340 -
320
300
2800
2 4 6 8 10 12 14 1time (seconds)
Figure 41: Pressure (10 bar-50 bar) over Time graph
Temperature exits Compressor 1 VS Time
2 4 6 8 10time (seconds)
12
6 18
x 10
14 16 18
x 104
Figure 42: Temperature over Time graph
67

Stage 2: To increase the pressure from 50 bar to 250 bar
x 107 Pressure exits Compressor 2 VS Time2.5
2
a-= 1.5UO
0.5-0
440 -
420
400
380-
360
340
320
300
280-0
2 4 6 8 10 12 14time (seconds)
Figure 43: Pressure (50 bar-250 bar) over Time graph
Temperature exits Compressor 2 VS Time
2 4 6 8 10 12 14time (seconds)
Figure 44: Temperature over Time graph
68
16 18
x 104
16 18
x 10
-7
CL
E

Work done VS Time
0
0 2 4 6 8 10time (seconds)
12
Figure 45: Work done to reach 250 bar in two days
Total Work required = 1.7814 - 10'Joules
Hence, a 10.31 kW rated compressor is needed to load one TEU in two days.
69
-0
45
9
18000
16000-
14000
12000
10000 -
8000-
6000-
4000-
2000 -
14 16
x 10
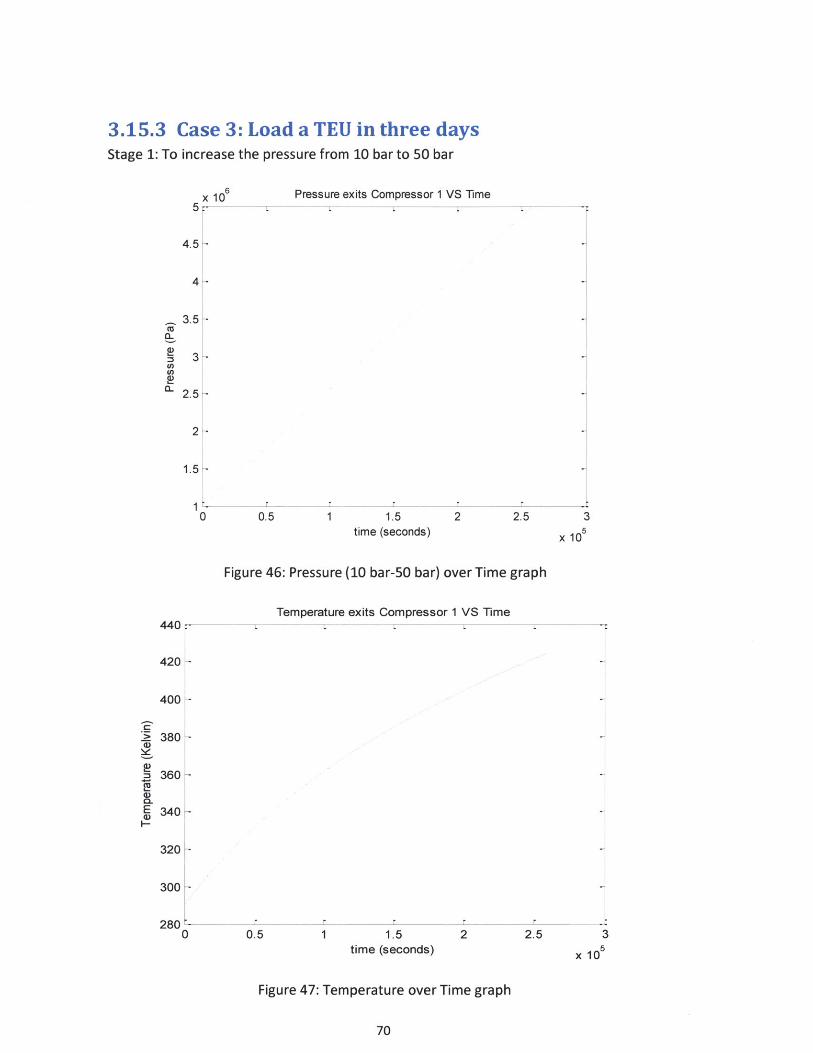
3.15.3 Case 3: Load a TEU in three daysStage 1: To increase the pressure from 10 bar to 50 bar
X 106 Pressure exits Compressor 1 VS Time
4.51
4
3.51-
3
2.5-
2-
1.5
0
440 P-
420-
400
380 -
360
340
320 -
300-
2800
-7
_ r0.5 1 1.5 2 2.5
time (seconds)
Figure 46: Pressure (10 bar-50 bar) over Time graph
Temperature exits Compressor 1 VS Time
10.5 1.5
time (seconds)2
3
x 10
2.5 3
x 10
Figure 47: Temperature over Time graph
70
.IDa-
CL
E
_,r_

Stage 2: To increase the pressure from 50 bar to 250 bar
X 107 Pressure exits Compressor 2 VS Time2.5
2
1a5
1-
0.5 1 1.5 2 2.5time (seconds)
Figure 48: Pressure (50 bar-250 bar) over Time graph
Temperature exits Compressor 2 VS TimeL
I -
0.5 1 1.5 2time (seconds)
Figure 49: Temperature over Time graph
71
2.5
-7
0.50 3
x 10
CL
(D
440
420
400
380-
360 -
340
320
300
2800
~1
3
x 10

Work done VS Time
1 1.5time (seconds)
Figure 50: Work done to reach 250 bar in three days
Total Work required = 1.7857. 10Joules
Hence, a 6.9 kW rated compressor is needed to load one TEU in two days.
72
12000
10000k-
8000
6000-
4000-
2000 -
-j
0 0.5 2 2.5
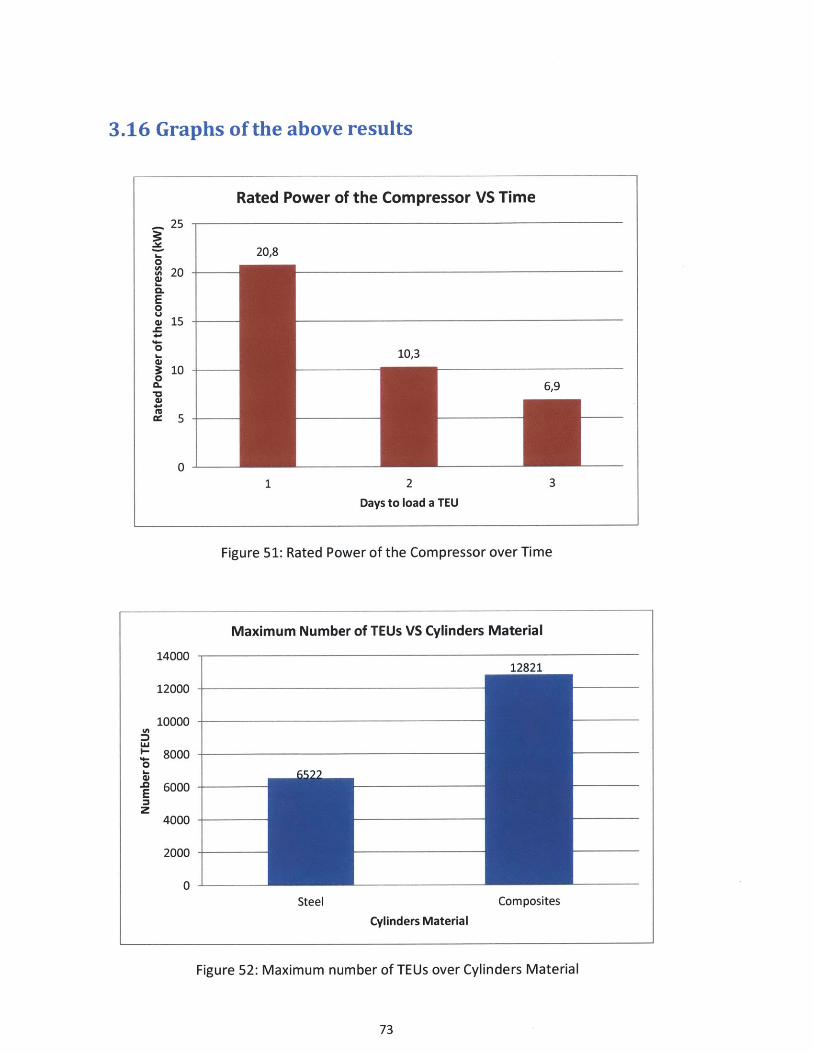
3.16 Graphs of the above results
Rated Power of the Compressor VS Time
20,8
10,3
6,9
2
Days to load a TEU
Figure 51: Rated Power of the Compressor over Time
Figure 52: Maximum number of TEUs over Cylinders Material
73
20
15
10
0IA
0.
E0
0
0CL
0cc
5-
0-1 3
Maximum Number of TEUs VS Cylinders Material
1400012821
12000 -
10000 -
8000 -0
6000 -
z4000 -
2000 -
0Steel Composites
Cylinders Material
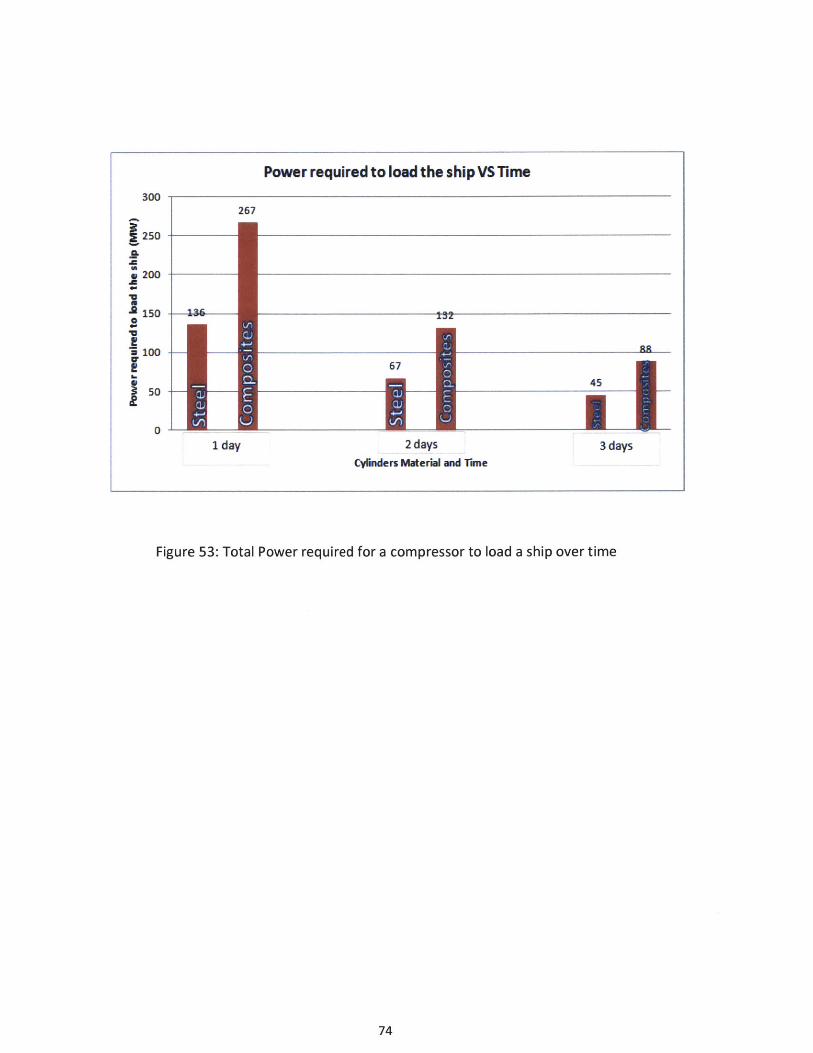
Figure 53: Total Power required for a compressor to load a ship over time
74
Power required to load the ship VS Time
300267
250
3200
- 1500
z 100E 67
4550
0
1day 2 days 3 daysCylinders Material and ime

4. Economic Valuation
4.1 Ultra large Container Ship (ULCS)The dimensions of containership have a propensity to be large as world trade increases
and cargo movements and demand raise. The expansion of containership size started
after 1990. In the last decade, containerships of more than 12,000 TEU operate into
Asia-Europe and Asia-USA. DNV says that a construction of a 22,000 TEU containership
will be held in the forthcoming years.
Ultra Large Containerships have the benefit of economies of scale where operating
expenses decreases as vessel's size increases. It is proven that bigger vessels capital
cost is 20% less and fuel expense 40% less. Of course, frequency of voyages and cargo
demand play an important role for a profitable large ship. In addition, these types of
ocean carrier are dependent on ports infrastructure.
Moreover,
lower.
700
600
ULCS are green ships by the idea that fuel consumption per TEU carried is
-*-Europe - Far East (11,500 miles)
-w-Trans Paif (8 000 mibs)
-*-Trans Atlanbc (4.000 miles)
500
400
300
200
1000 1000 2000 3000 4000 5000 6000
Capacity in TEU
7000 8000
Figure 54: Cost per TEU over Capacity in TEU
75
(*2

4.1.1 Ultra Large Containership Details
Deadweight 150,936 tons
Length 368 meters
Beam 51 meters
Depth 30 meters
Newbuilding Price $ 130.000.000
Cargo Overview 13,900
4.1.2 Number of CNG TEUs loaded in the ULCS
150,000Number of TEUs = = 12,821 TEUs
11.7
4.1.3 Voyages and Fleet of the Shipping Company
A distance of 5000 nautical miles is taken which is the distance between USA (West
Coast) to Japan. It is known that containerships have the ability to run up to 25 knots.
Hence,
5000_Days to go from USA to Japan = 25 24= 8 days
The ship stays around 3 days at each port for loading and unloading of compressed
natural gas.
Therefore, the whole trip takes around 22 days for the ship.
365Annual Voyages per vessel = = 17 voyages
22
Furthermore, a fleet of seven Ultra Large Containerships is required, in order for the
shipping company to have continuous operation.
76
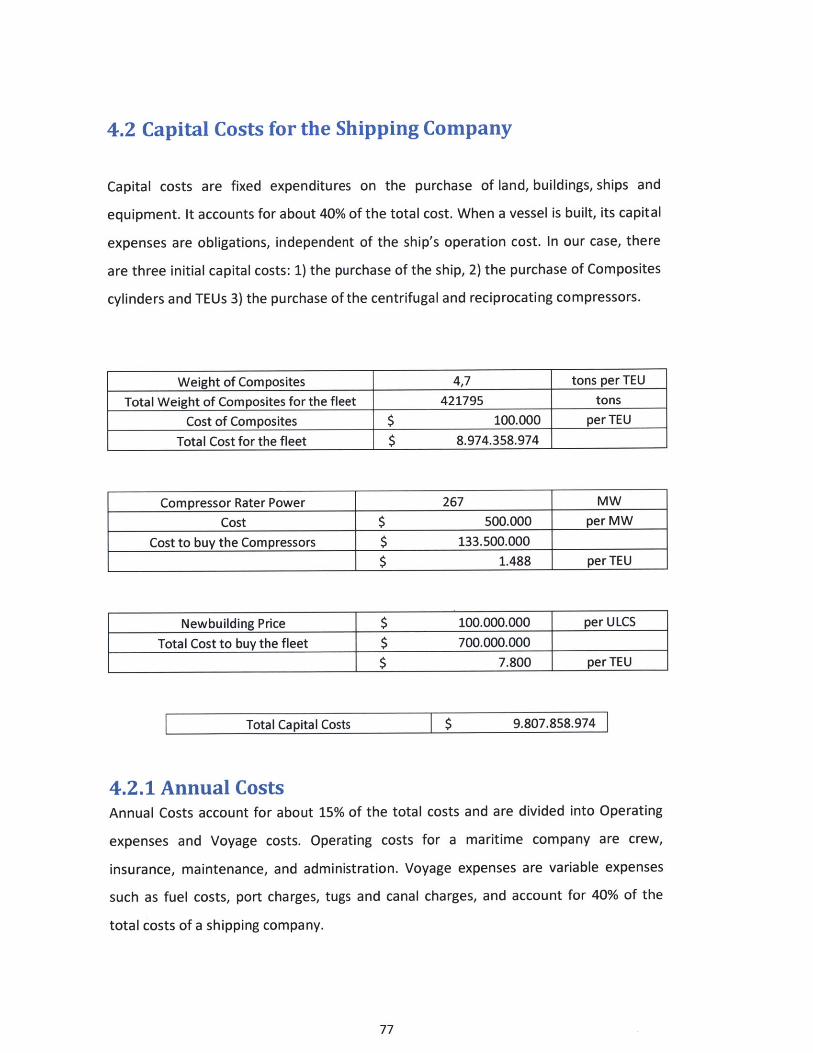
4.2 Capital Costs for the Shipping Company
Capital costs are fixed expenditures on the purchase of land, buildings, ships and
equipment. It accounts for about 40% of the total cost. When a vessel is built, its capital
expenses are obligations, independent of the ship's operation cost. In our case, there
are three initial capital costs: 1) the purchase of the ship, 2) the purchase of Composites
cylinders and TEUs 3) the purchase of the centrifugal and reciprocating compressors.
Weight of Composites 4,7 tons per TEU
Total Weight of Composites for the fleet 421795 tons
Cost of Composites $ 100.000 per TEU
Total Cost for the fleet $ 8.974.358.974
Compressor Rater Power 267 MW
Cost $ 500.000 per MW
Cost to buy the Compressors $ 133.500.000
$ 1.488 per TEU
Newbuilding Price $ 100.000.000 per ULCS
Total Cost to buy the fleet $ 700.000.000
$ 7.800 per TEU
Total Capital Costs $ 9.807.858.974
4.2.1 Annual CostsAnnual Costs account for about 15% of the total costs and are divided into Operating
expenses and Voyage costs. Operating costs for a maritime company are crew,
insurance, maintenance, and administration. Voyage expenses are variable expenses
such as fuel costs, port charges, tugs and canal charges, and account for 40% of the
total costs of a shipping company.
77

4.2.2 Fuel CostsAccording to shipyard's data, an Ultra Large Containership needs a low speed diesel
engine of 68,000 kW in order to reach a speed of 25 knots.
It is known that the brake power is proportional to the speed to the power of three.
Power = Resistance -Speed = C -Speed3
Where, C is a constant.
By using the above formula, useful charts and an average specific fuel consumption of
170 g/kWh are used to estimate the fuel costs for different speeds and the amount of
emissions generated.
400 -
0% 25% 50%Power in % MCR
- Simple Cycle Gas Turbine:constant speed
-X- Simple Cycle Gas Turbine:propeller law
--- High speed Diesel Engine:constant speed
- High speed Diesel Engine:propeller law
-*- 1000 rpm Diesel Engine:constant speed
- 1000 rpm Diesel Engine:propeller law
-0- Medium speed Diesel Engine:constant speed
- Medium speed Diesel Engine:propeller law
- Low speed Diesel Engine:propeller law
100% ISO conditions:LHV = 42700 kJ/kg
75%
Figure 55: Specific fuel consumption over Power
78
CU-C,,
350
300-
250-
200-
150

-*- Slow speed Diesel Engine
--- Medium speed Diesel Engine
-4--1000 rpm Diesel Engine
-a- High speed Diesel Engine
-X- Simple Cycle Gas Turbine
U 'Y0%
Figure 12.9
x-X-X-X-X---X---x--X---X-X
25% 50%
Power in % MCR75% 100%
NOx emission rato for prime movers.
Figure 56: NOx emission ratio for prime movers
Speed (knots) MCR SFC (/kWh)
25 100% 171
24 96% 171
23 92% 170
22 88% 170
21 84% 17020 80% 170
19 76% 170
18 72% 170
17 68% 170,
16 64% 170
15 60% 170
14 56% 170
13 52% 170
12 48% 170
11 44% 170
10 40% 170
79
140-
120-
100-
80 4-
C
x0z
60-
404
204

Brake Powerrate massofu mass rate (tonnes da
68640 11737 282
60728 10385 249
53449 9086 218,
46776 7952 191
40683 6916 166
35144 5974 143
30131 5122 123
25620 4355 105
21583 3669 88
17994 3059 73
14826 2520 60
12054 2049 49
9651 1641 39
7591 1290 31
5847 994 24
4393 747 18
Noxer (g/kmfuel) kiz of Nox per dav
100 281,70102 249,23
103 218,07
105 190,85
107 165,99
110 143,39
112 122,94
115 104,53
117 88,06
120 73,41
122604
125 49,18
127 5938
130 30,97
132 20,6135 17,92
80

Route Long Beach to Tokyo Speed (knots)
Disanc (nutial miles) 00224
2
22
21
20
18
16
514
1312
1 010
Days to go to Tokyo Fuel Consumption (tonnes) Price of HFO 380cSt
8 2347 7109 2163 710
9 1807 710
10 1494 710
12 1210 710
13 956 710
15 732 710
17 538 710
194 714A
21 373 710
81

Cost of Fuel per dayCost of Fuel ($)
1666716 200006
1536046 176952
1402459 154831
1283157 1355011169158 117851
1060461 101804
957066 .87284
858973 74215
766183 62521
678695 52124596509 42949
519626 34919
448045 27958
381766 21990320789 16938265115 12726
Figure 57: Power over Speed of the Ultra Large Containership
82
Power VS Speed of the ULCS80000
70000
60000
50000
40000 -
30000 0
20000
10000
010 11 12 13 14 15 16 17 18 19 20 21 22 23 24 25
Speed (knots)

Figure 58: Cost of Heavy Fuel Oil per day over Speed of the ULCS
NOx generated VS Speed300,00 J-8t;-7-
250,00 249,23-~ ' 2
200,00C-
,a
z 150,0000
t0;S10000
x0z 50,00
0,00
18,07
0190,85
165,91-79-- I-"143,39
22,94104,53
73,4160,4499 18
S23,8617,923% 1 2 61
25 24 23 22 21 20 19 18 17 16 15 14 13 12 11 10
Speed (knots)
Figure 59: NOx generated over speed of The ULCS
The ULCS carries 12,821 TEUs of compressed natural gas.
281.70NOx = 1 = 0.022 kg of NOx per TEU
12,821
83
Cost of Fuel per day VS Speed250000
000006200000 1795
154831V 150000 -0. CL 117851
Z 101804U. 100000 - 7421
-W6252210 $9
U 50000 - 294
1 1 -1994693.27260
25 24 23 22 21 20 19 18 17 16 15 14 13 12 11 10
Speed (knots)
P

4.2.3 Electricity Costs
In the previous chapter, it is calculated that a 267 MW rated compressor is need to fill
the entire speed in one day. The cost of electricity in USA is $0.10 cents per kWh.
Hence,
Electricity Costs = 267 - 1000 - 0.10 -24 = $640,800 per voyage
4.2.4 Port ChargesPort charges correspond to a major part in voyage expenses for the use of facilities and
services provided by the port. The actual port charges depend on the pricing policy of
the port's administration, the ship's size, the time spent in port and the type of cargo
loaded or unloaded. Of course, the shipping company has less control over these
charges, since they vary from port to port.
4.2.5 The deployment of containers
Figure 60: The deployment of the containers
84
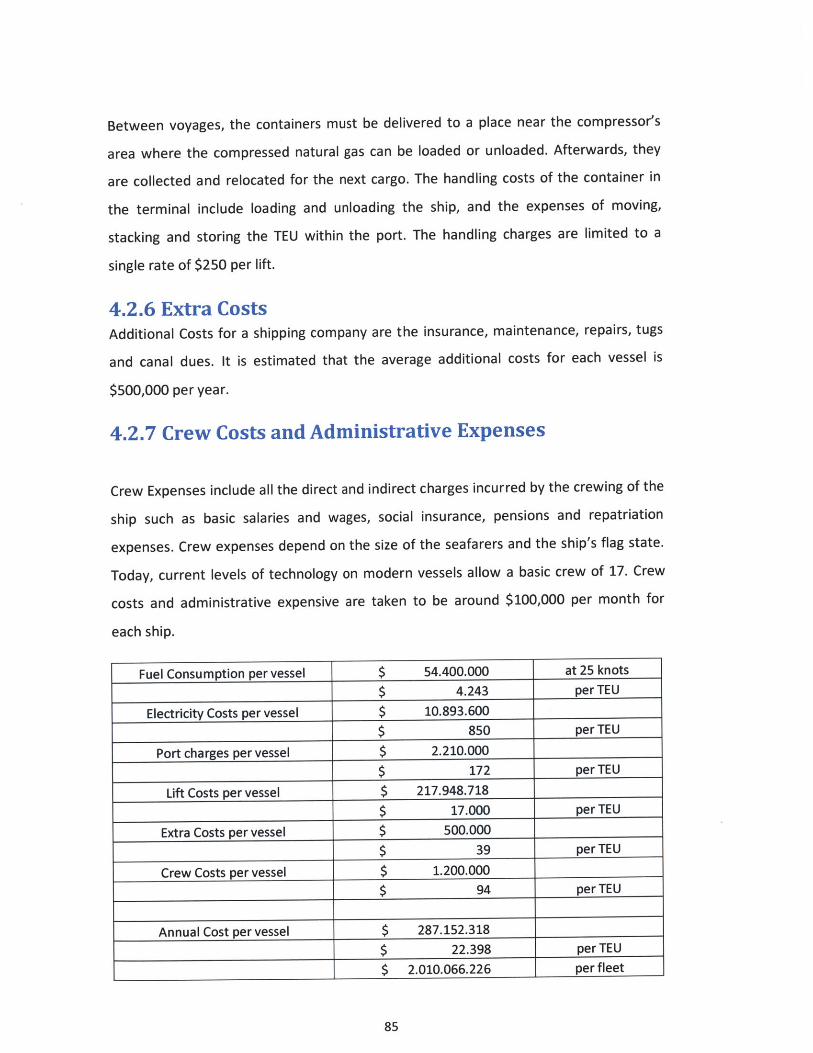
Between voyages, the containers must be delivered to a place near the compressor's
area where the compressed natural gas can be loaded or unloaded. Afterwards, they
are collected and relocated for the next cargo. The handling costs of the container in
the terminal include loading and unloading the ship, and the expenses of moving,
stacking and storing the TEU within the port. The handling charges are limited to a
single rate of $250 per lift.
4.2.6 Extra CostsAdditional Costs for a shipping company are the insurance, maintenance, repairs, tugs
and canal dues. It is estimated that the average additional costs for each vessel is
$500,000 per year.
4.2.7 Crew Costs and Administrative Expenses
Crew Expenses include all the direct and indirect charges incurred by the crewing of the
ship such as basic salaries and wages, social insurance, pensions and repatriation
expenses. Crew expenses depend on the size of the seafarers and the ship's flag state.
Today, current levels of technology on modern vessels allow a basic crew of 17. Crew
costs and administrative expensive are taken to be around $100,000 per month for
each ship.
Fuel Consumption per vessel $ 54.400.000 at 25 knots
$ 4.243 per TEU
Electricity Costs per vessel $ 10.893.600
$ 850 perTEU
Port charges per vessel $ 2.210.000
$ 172 perTEU
Lift Costs per vessel $ 217.948.718
$ 17.000 per TEU
Extra Costs per vessel $ 500.000
$ 39 perTEU
Crew Costs per vessel $ 1.200.000
$ 94 perTEU
Annual Cost per vessel $ 287.152.318
$ 22.398 per TEU
$ 2.010.066.226 per fleet
85

Figure 61: Annual Costs per vessel
4.3 Operating Income of the fleet
Operating income is the total pre-tax profit a shipping company generates from its
operations. The operating profit of this particular shipping company depends on the
arbitrage of the different prices of natural gas around the world.
$2.69
OF&*. $bi
Figure 62: Natural gas prices around the world
86
Annual Costs
* Fuel Consumption pervessel
* Electricity Costs pervessel
* Port charges per vessel1%
* Lift Costs per vessel
* Extra Costs per vessel
* Crew Costs per vessel

Natural Gas carried 5000 kg per TEUEnergy 55 MJ/kg
Total Energy 275000 MJ275 GJ
Cost to buy NG $ 4 per GJ
$ 1.100 perTEU
Selling Price $ 18 per GJ
$ 4.950 perTEU
per voyageTotal profit $ 3.850 per TEU
annual profit$ 65.450 perTEU
Total Annual Profit of the Fleet $ 5.873.717.949
4.4 Unleveraged Internal Rate of ReturnIRR can be used to measure the profitability of a project. A project with high IRR can be
considered profitable and attractive to potential investors.
IRR =Annual Operating Profit - Annual Costs - Depreciation
Capital Costs
IRR = 34.4% for this project
4.5 Return on Invested Capital (ROIC)Return on Invested Capital (ROIC) is used to observe how well companies generate
earnings from capital invested in their business. It is essentially the return a company
earns on each dollar it invests in a business. ROIC is defined as Net Operating Profits
Less Adjusted Taxes (NOPLAT) divided by the Invested Capital.
When a company's return on invested capital is greater than its' capital cost, then it
creates value by investing in its projects, otherwise it destroys value.
87

ROIC =Net Operating Profits Less Adjusted Taxes
Invested Capital
ROIC = 24.1% for this project
Tax rate is taken to be 30%.
4.6 Return on Equity (ROE)ROE is the amount of net income returned as a percentage of equity. Return on equity
determines a company's profitability by depicting how much profit a company creates
with the money investors have invested.
The levered cost of equity ROE is given by the formula:
ROE = ROIC + ([ROIC - (1 - t) - kd] -)
where:
kd = Cost of debt
D = Market value of debt
E = Market value of equity
C =D+E = 100%
t = tax rate
It is assumed that kd is 5% and the tax rate is equal to 30%. Concerning D/E, this ratio
is 1 when D = E for a leverage of 50% and it is 4 when D=4E for a leverage of 80%.
Cost of debt 5%
Market value of debt 60%Market value of equity 40%
C 100%
ROE 54,94%
88

4.7 WACC (Weighted Average Cost of Capital)WACC is an estimation of a company's cost of capital in which each category of capital
is proportionately weighted. WACC increases as the beta and rate of return on equity
rises. An increase in WACC shows a reduction in valuation and a higher risk.
Therefore, a shipping company's assets such as ships are financed by either debt or
equity. WACC is the average of the costs of these assets of financing, each of which is
weighted by its individual use. By calculating the WACC, it can be observed how much
interest the maritime company has to pay for every dollar it invests.
It is assumed that the cost of equity is 20% and a growth rate of 5%.
A Company's value is equal to the addition of the market value of debt and the market
value of equity.
V=D+E
By multiplying it with a complex fraction of 1,
CF - (1 - t) + CF
(CFcr (1- t) + CFe
CFd = Cash flow to debt holders
CF, = Cash flow to equity holders
The cash flow to debt holders is stable; the perpetuity formula is used to measure the
debt:
D CFdC dDkg
kd = cost of debt
CFd = D -kd
The same is for
89
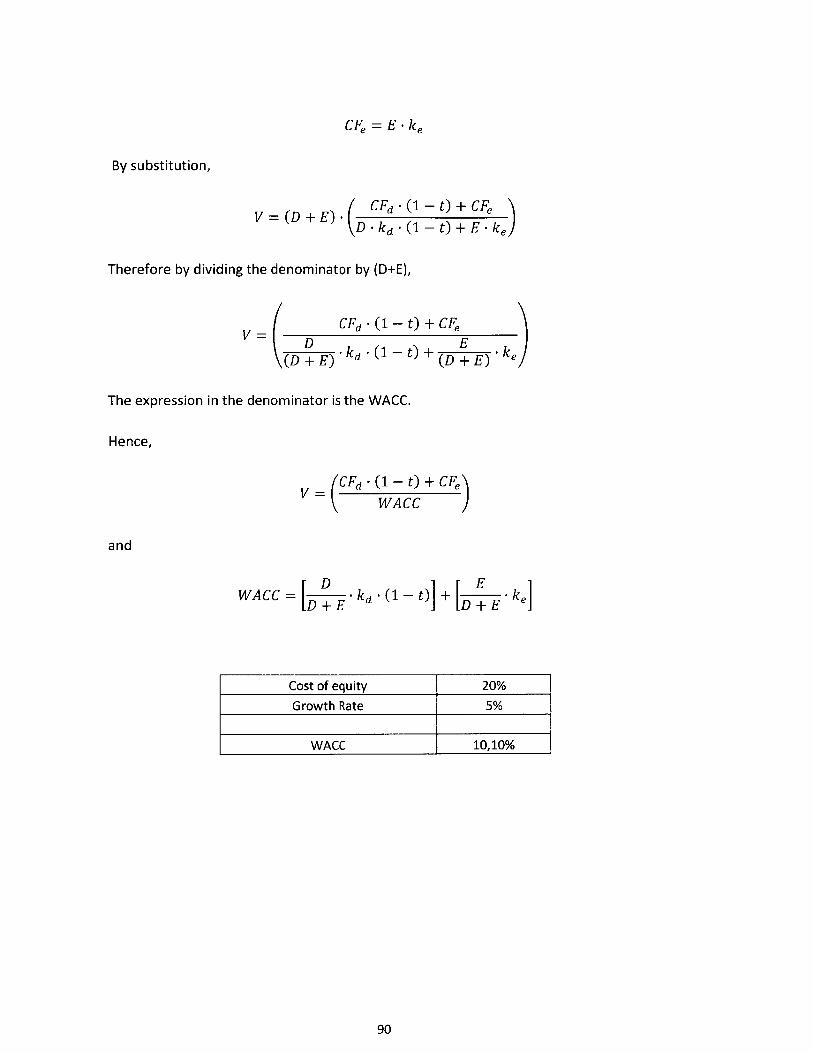
CF = E - ke
By substitution,
V (D + E) CFd (1 -
V ) D - kd (1 -
Therefore by dividing the denominator by (D+E),
CFdV (D\(D + E) -kd
E(1 - t) + (D + E)
-ke)
The expression in the denominator is the WACC.
Hence,
(CFd -(1 - t) +CFV WACC
and
D EWACC = D + kd (1 - t) + [D + E ke
Cost of equity 20%
Growth Rate 5%
WACC 10, 10%
90
t) + CFet) + E - ke
- (1 - t) + CFe
4.8 Value/Capital for the shipping companySince the shipping company increases its cash flows at a constant rate, the famous
perpetuity formula can be used to value the firm.
Free Cash FlowValue =
WACC-g
Where, g is the growth rate.
Free Cash Flow = Net Operating Profit - Taxes - Capital Invested
Net Operating Profit - Adjusted Taxes = NOPLAT
But,
Capital InvestedInvestement Rate = NOPLAT
Hence,
Free Cash Flow = NOPLAT - (NOPLAT - IR)
Free Cash Flow = NOPLAT - (1 - IR)
growth rate = ROIC - IR
JR = ROIC
Now build this into the free cash flow equation:
Free Cash Flow = NOPLAT - (1 - IR)
Free Cash Flow = NOPLAT - (1- ROIC
Substituting,
Free Cash FlowValue = WACC - g
91

Value =NOPLAT -(1 - ROIC)
WACC - g
It is known that:
NOPLATROIC =
Capital Invested
NOPLAT = ROIC - Capital Invested
Hence,
Value =
Value =
NOPLAT - (1 - ROIC)
WACC - g
ROIC -Capital Invested - (1 -ROIC
WACC -g
ValueCapital Invested
ROIC - (1 - ROIC
WACC - g
v/c 3,74
92
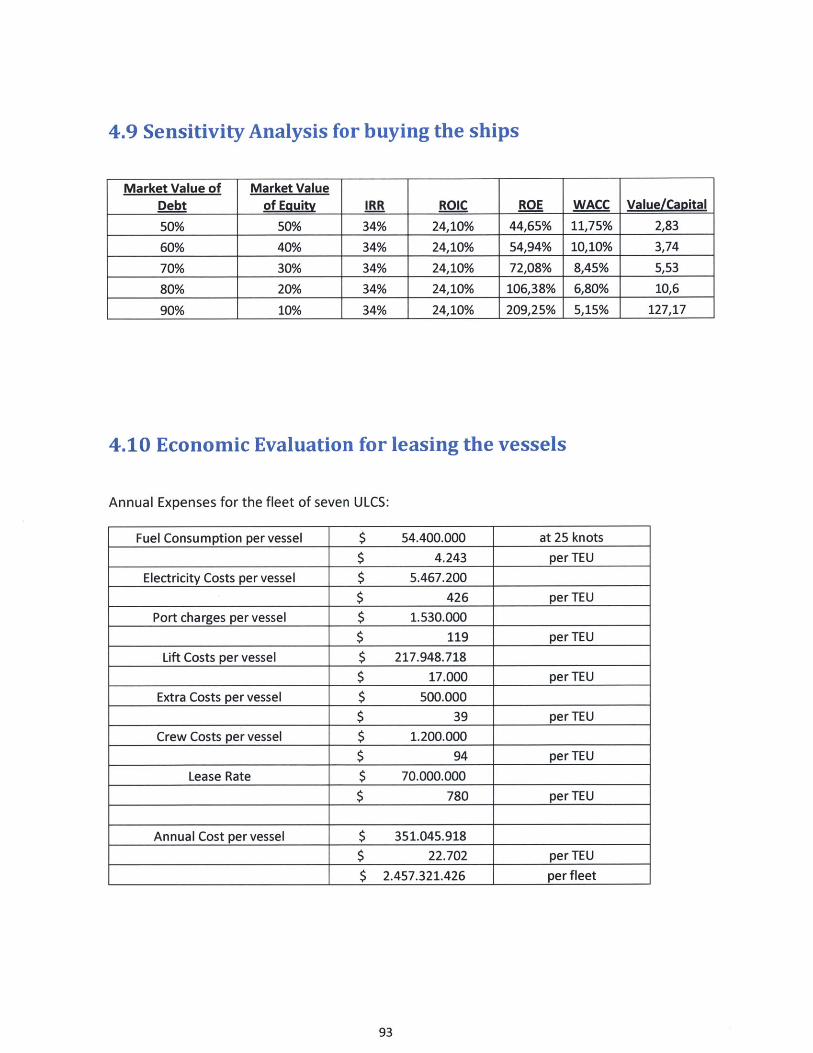
4.9 Sensitivity Analysis for buying the ships
Market Value of Market ValueDe&bt of Euity IRR ROIC ROE WACC Value/Capital
50% 50% 34% 24,10% 44,65% 11,75% 2,83
60% 40% 34% 24,10% 54,94% 10,10% 3,74
70% 30% 34% 24,10% 72,08% 8,45% 5,53
80% 20% 34% 24,10% 106,38% 6,80% 10,6
90% 10% 34% 24,10% 209,25% 5,15% 127,17
4.10 Economic Evaluation for leasing the vessels
Annual Expenses for the fleet of seven ULCS:
Fuel Consumption per vessel $ 54.400.000 at 25 knots
$ 4.243 perTEU
Electricity Costs per vessel $ 5.467.200
$ 426 perTEU
Port charges per vessel $ 1.530.000
$ 119 perTEU
Lift Costs per vessel $ 217.948.718
$ 17.000 perTEU
Extra Costs per vessel $ 500.000
$ 39 perTEU
Crew Costs per vessel $ 1.200.000
$ 94 perTEU
Lease Rate $ 70.000.000
$ 780 perTEU
Annual Cost per vessel $ 351.045.918
$ 22.702 per TEU
$ 2.457.321.426 per fleet
93

4.10.1 Sensitivity Analysis for leasing the ships
Market Value of Market ValueDebt of EQuity IRR ROIC ROE WACC Value/Capital
50% 50% 41% 28,90% 54,36% 11,75% 3,55
60% 40% 41% 28,90% 67,08% 10,10% 4,69
70% 30% 41% 28,90% 88,27% 8,45% 6,94
80% 20% 41% 28,90% 130,65% 6,80% 13,29
90% 10% 41% 28,90% 257,81% 5,15% 158,54
4.11 Comparison of the above two options
Value/Capital Ratio VS Leverage Ratio180
160
140
120
100
80
60
40
20
0
158,54
127,17
* Buying the Ships
* Leasing the Ships
3,55 4.69 6,94 13,292,83 3,74 5,53 1
50%
50%
40% 30% 20%
60% 70% 80%
Leverage Ratio: Debt/Equity
10%
90%
Figure 63: Value/Capital Ratio over Leverage ratio
94
0
1P
Eu
CLMu'p
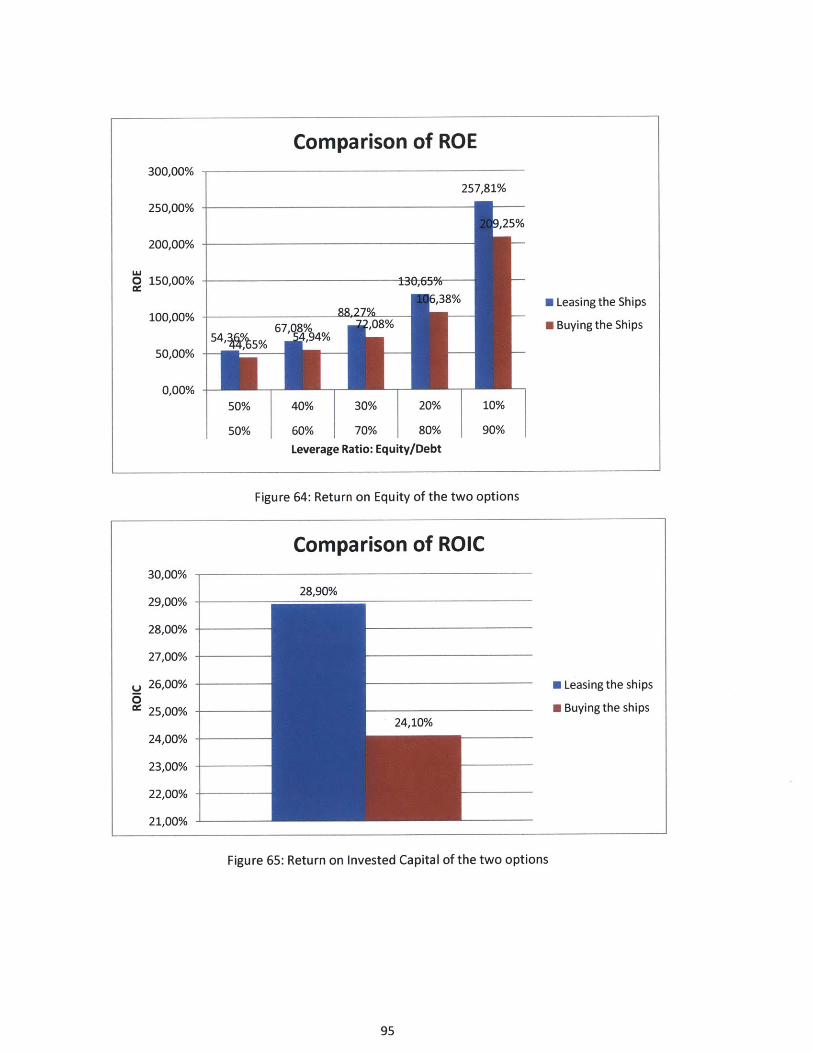
Comparison of ROE300,00% 1
250,00% -
200,00%
LU
o 150,00% -
100,00% -
50,00% -
0,00% -
257,81%
±3~jV,U.J 0
8R.27%* Leasing the Ships
" Buying the Ships
,i8%i
50% 40% 30% 20%
50% 60% 70% 80%
Leverage Ratio: Equity/Debt
10%
90%
Figure 64: Return on Equity of the two options
Comparison of ROIC30,00%
29,00% -8,90%
28,00%
27,00% -
U 26,00% -- Leasing the ships
c 25,00% - - Buying the ships24,10%
24,00% -
23,00% -
22,00%
21,00%
Figure 65: Return on Invested Capital of the two options
95
67, 854, 5% ' ,4%

5. Comparison of LNG Carriers and ULCScarrying CNG containers
5.1 Energy savings
In order to calculate the energy savings of our project it is assumed that our cylinders
are filled by liquefied natural gas.
Volume of TEU = 29 cubic meters
Density of LNG = 450 kg/cubic meters
Mass inside cylinders = 13050 kg = 13 tons
Energy Carried by the TEU = 13050 * 55.6 = 725,580 MJ
The liquefaction of natural gas can be achieved by three stages:
351C -> -401 C
350 1
300
250
200
150 -
100 -
2 -90 -88 -8650 I
-91
- 400C -> -851C
-84 -82
Enthalpy,
-851C -> -1601C
-80 -78 -76 -74 -72h (kJ/mol)
Work done = mass -Ah
96
E<D
I I I I I I I
Tb
I II I I I I I I
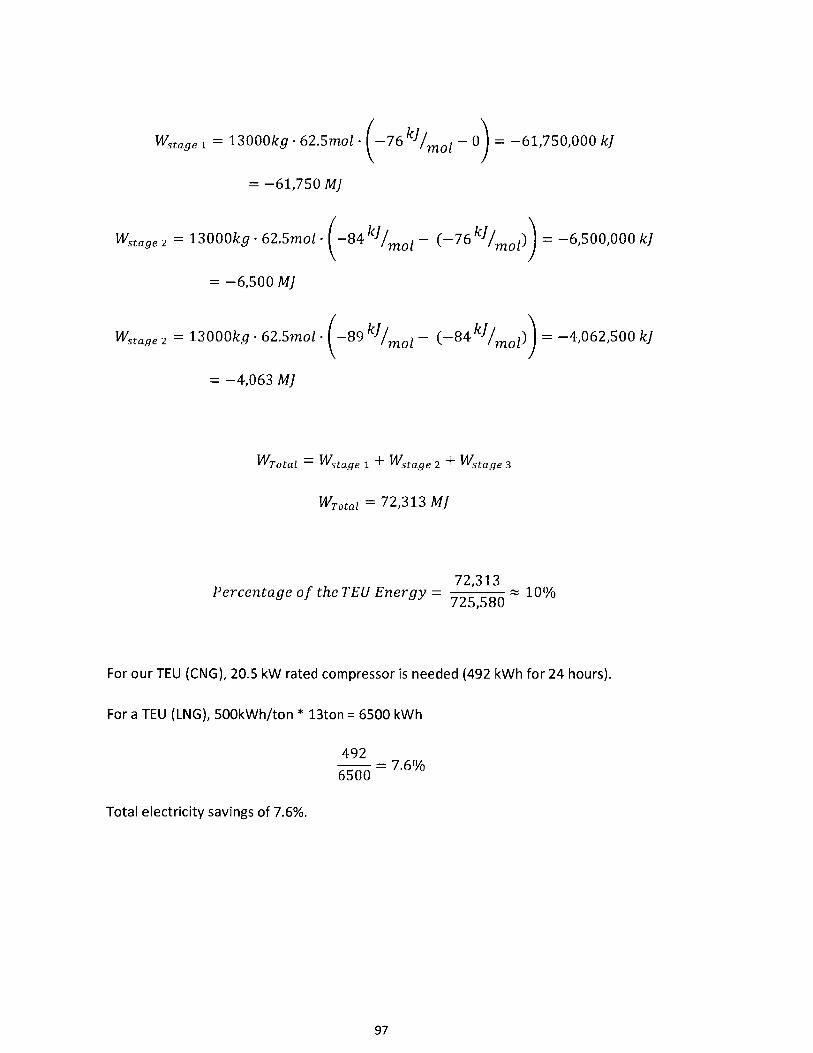
Wstage 1 = 13000kg - 62.5mol - (-76 k]/moi
= -61,750 MJ
Wstage 2 = 13000kg - 62.5mol - (-84 kI/mol - (- 7 6 kJ/ mol) ) -6,500,000 k]
= -6,500 MJ
Wstage 2 = 13000kg - 62.5mol - (-89 kJmol - (-84 k] mol1)) = -4,062,500 k]
= -4,063 MJ
WTotal = Wstage 1 + Wstage 2 + Wstage 3
WTotai = 72,313 MJ
72,313Percentage of the TEU Energy = 72,580 ~ 10%
725,580
For our TEU (CNG), 20.5 kW rated compressor is needed (492 kWh for 24 hours).
For a TEU (LNG), 500kWh/ton * 13ton = 6500 kWh
492= 7.6%
6500
Total electricity savings of 7.6%.
97
-0) = -61,750,000 k]

5.2 Comparison of the revenue of LNG ship and the ULCS of
this project
ULCS Vessel(12821 TEUs of
LNG Vessel CNG)
Density (kg/mA3) 450 0,7
Volume (mA3) 140000 192000
Deadweight (tonnes) 63000 64105
kilograms 63000000 64105000
Specific Energy (MJ/kg) 53,6 53,6
Energy of the cargo (MJ) 3376800000 3525775000
Energy of the cargo (GJ) 3376800 3525775
Energy of the cargo (MMbtu) 3201206 3342434,7
Number of Voyages (yearly) 10 17
Total Revenue from Japan $441.766.483 $784.135.181
5.3 Summary of advantages
Hence, the advantages of using the ULCS carrying CNG containers are:
" Simple design of cylinders and pressure management
e Mature technology
e Less energy consumption
e Gas/vapor instead of cryogenic
e Lower maintenance expenses
" Higher revenue due to the high speed of containerships
e Higher deadweight
" The life cycle fuel cost is lower
" No need of re-gasification and liquefaction
98
6. Conclusions
The purpose of the current thesis was to study the viability and feasibility
of installing four carbon fiber cylinders inside a TEU container. It can be
seen that the results are reliable and an Ultra Large Container Ship can
carry these specially constructed containers.
In addition, thermodynamic analysis was used to determinate the total
power required for a compressor to fill 12,821 TEUs, in one day. It is
concluded that a 267 MW compressor is needed for this purpose. MATLAB
was used to calculate the total work done and three parameters (Pressure,
Temperature and Word done) were tested over a period of time.
Moreover, it is observed that financial parameters such as Return on
Invested Capital and Return on Equity are very attractive for a potential
investor. The conclusion is that leasing the ships, is a more profitable
option than buying the vessels.
Finally, it was shown that this project is more profitable than conventional
CNG projects and LNG Ships. The Ultra Large Container Ship can carry more
natural gas than the LNG ship can. The Container ship is more profitable to
use due to its high speed.
By the dramatic expansion of container ships, it can be seen that natural
gas will probably be transported by containers for the next several
decades.
99
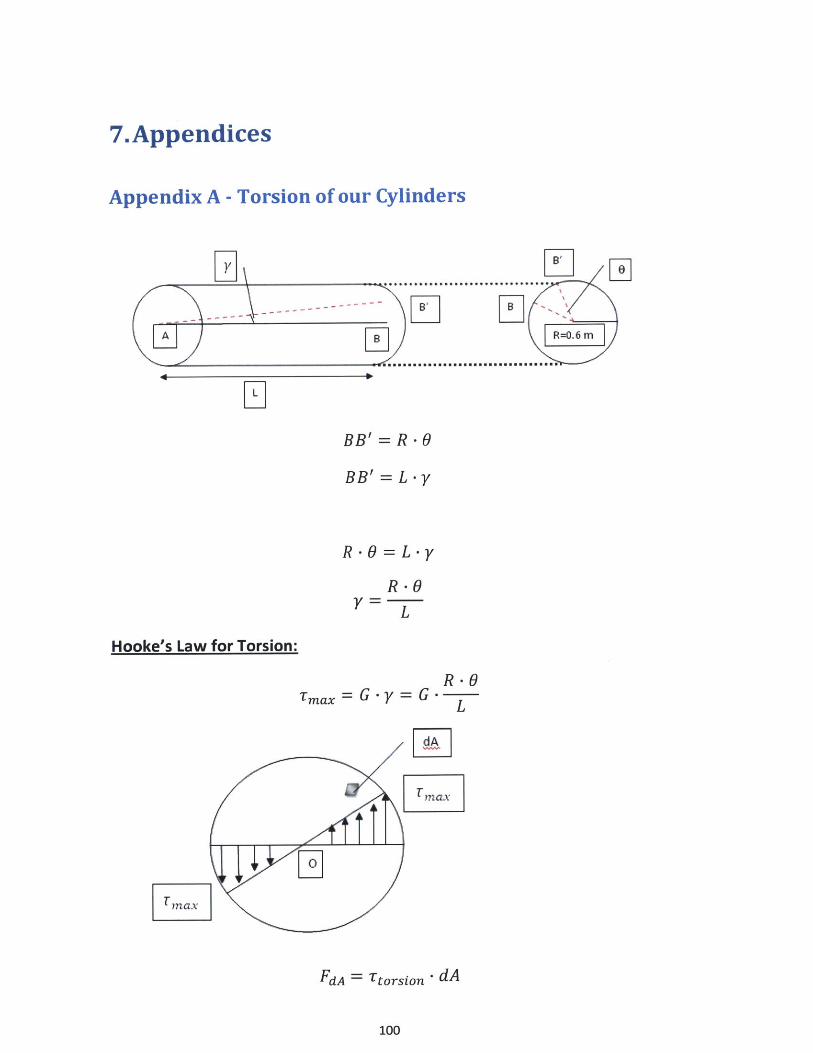
7.Appendices
Appendix A - Torsion of our Cylinders
--- ------A I 6m
BB' =R-0
BR' = L -y
R-O=L-yR - 0
Y = L
Hooke's Law for Torsion:
R -T max = G - y = G -
L
TLmax
FdA = T torsion * dA
100
44 b

This force creates an internal Moment MdA in the dA section of a distance r from the
center of the beam.
MdA = FdA - r
MdA = Ttorsion - r - dA
Since the cross-sectional area is in equilibrium, the sum of the moments MdA of all
small sections of our area is equal to torsional moment.
M = 'A Ttorsion - r - dA
Ttorsionis not stable and is proportional to the distance from the origin of the cross-
sectional area. Ttorsionis decreasing as it reaches the center of the section.
FR
-1 ax
tan = TmaxR
And
tanG = Ttorsion
r
Hence,
Tmax _ Ttorsion
R r
Tmax
Therefore, the above formula of the sum of moments can be written as:
M = fA Ttorsion - r dA = fATmax 2 - dA = Tmax - r 2 - dA
R I dA R J A
101
.... I ....................... ..................................

It is observed that:
fAr -dA = Polar Moment of Inertia = 10
Moreover,
RTmax = - M
10
In addition, the above formula can be expressed as:
1 I0Tmax = - - M because W = -
WO R
Wo is the polar moment of resistance.
For a cylinder the polar moment of resistance and the polar moment of inertia cab becalculated by the following equations:
I~ = -- D44 32
W = - -D3
16
Hence,
R 32 -RTmax =--M = D4 M
I0 7r -D4
In order our truss to remain stable in case of a torsional moment, the tensile breakingstrength of the material that will be used for the elements should be given in order tocalculate the allowable torsional stress.
Tallowable = 0.8 breaking strength
Calculation of the Maximum Torsional moment of the cylinders:
Tallowable > Tmax
32 - RTallowable ! _ - .e M
T- D4
Tallowable - i - D4 > M32 -R
Tallowable ' 0.34 M
Angular deformation:
102

Tmax = G -y
Tmax
The allowable angular deformation is:
TallowableYallowable G
Hence,
Yallowable > Y
RYallowable > -G M
-10 *G
3 2 RYallowable 7 - D4 - G M-G
The rotation of the beam can be calculated by:
YOx - - L
R
Therefore,
Ox,allowable >M
GI . -L
Ox,allowable >32- M
T -D4 - G- L
103

Appendix B - BucklingSlenderness of a beam:
la = a - length
a is a coefficient
Radius of Gyration =
I=Moment of inertia
A =laRadius of Gyration
AA= a-l-I
Euler's Formula for Buckling:
r 2 E IFcr= 2
72 E2Ia2 .*1
Critical buckling stress:
Fe, r2 -E - Iacr = A= A - 2a
Radius of Gyration =I I
<-+ R=2
i 2 - E -*
U'cr la a2
A= la
Radius of Gyration
77 2 -E0cr 2
104
T i

Limit Slenderness:
Ucr : alimit
R 2 -E/2 a limit
7T2 - E A
alimit
J2 - E
:5mi Alimit
The limit slenderness for steel has a range of 88-100.
In addition,
safety factor =7c07allowable for buckling
The safety factor for steel is around 5.
105

8. References
Alizadeh, A., Nomikos, N. (2009) Shipping Derivatives and Risk Management, Palgrave
Macmillan, London, United Kingdom
Bloch, H. (2006) A Practical Guide to Compressor Technology, Second Edition, John
Wiley & Sons, New Jersey, United States of America
Borgnakke, C., Sonntag, R. (2009) Fundamentals of Engineering Thermodynamics,
Seventh Edition, John Wiley & Sons, United States of America
Carlton, L. (2007) Marine Propellers and Propulsion, Second Edition, Elsevier, Oxford,
United Kingdom
Coperland, T., Koller, T., Murrin, J. (2000) Valuation: Measuring and Managing the
Value of Companies, Third Edition, McKinsey & Company, John Wiley & Sons, United
States of America
Cravalho, E., Smith, J., Brisson, J., McKinley, G. (2005) Thermal-Fluids Engineering-An
Integrated Approach to Thermodynamics, Fluid Mechanics and Heat Transfer,
Department of Mechanical Engineering, Massachusetts Institute of Technology, United
States of America
Deshpande, A., Economides, M. http://www.docstoc.com/docs/19961870/CNG-An-
Alternative-Tra nsport-for-Natura I-Gas-Instead-of (accessed January 27, 2013)
Dunlop, J. (2003) CNG Transport Technology is Delivering on Promises, EnerSea
Transport LLC, United States of America
ExxonMobil. August 2011. http://www.ogi.com/articles/2011/08/exxonmobil-grants-
pipeline-welding-license.html (accessed February 17, 2013)
106

Gambone, L. October 27, 2005.
http://www.cleanvehicle.org/technology/CNGCylinderDesignandSafety.pdf (accessed
December 6, 2011)
Hanssen K.F. (2005) CNG by Ship: Technology status and challenges, DNV Managing
Risk, OG21/Demo 2000 Workshop, Offshore Gas Solution, Norway
Holman, J.P. (2010) Heat Transfer, Tenth Edition, McGraw-Hill Companies, New York,
United States of America
Koller, T., Goedhart, M., Wessels, D. (2005) Valuation: Measuring and Managing the
Value of Companies, Fourth Edition, McKinsey & Company, John Wiley & Sons, United
States of America
Lamb, T., Ramoo, R., Parthasarathy, M. (2011) A New Concept for CNG Carriers and
Floating CNG/Oil Processing and Storage Offshore Platforms, Altair ProductDesign,
United States of America
Lothe, P., Stroem N.K. (2005) Pressurized Natural Gas-Next Generation Marine Gas
Transport Solution, Knutsen OAS Shipping, Offshore Technology Conference, Houston,
Texas, United States of America
Muckle, W. (1967) Strength of Ship's Structures, Edward Arnold, Newcastle Upon Tyne
University, United Kingdom
Ruppin, U., Noetzold, N., Pentschew, P., Kaeding, P. (2011) CNG-Technologies: A
Comparison Study, Rostock, Germany
Rynn, P., Patel, H. (2005) ABS Development of a Guide for Compressed Natural Gas
Carriers, American Bureau of Shipping, Houston, Texas, United States of America
107

Stopford, M. (2009) Maritime Economics, Third Edition, Routledge, Taylor and Francis
Group, London and New York
Trans Ocean Gas. July, 2010. http://www.transoceangas.cOm/Development Plan.htm
(accessed November 10, 2011).
Ueno, K., Hunter, K. May 12, 2003. http://www.vairex.com/resources/Efficiency-0514-
2.pdf (accessed May 15, 2012)
Valsgard, S., Lotsber, I., Sigurdsson, G., Mork, K. (2010) Fatigue design of steel
containment cylinders for CNG ship application, Det Norske Veritas, Norway
Wagner, J., Wagensveld, S. (2002) Marine Transportation of Compressed Natural Gas:
A Viable Alternative to Pipeline or LNG, Melbourne, Australia
Wang, X., Economides, M. (2009) Advanced Natural Gas Engineering, Gulf Publishing
Company, Houston, Texas, United States of America
Wood, H., Stapersma, D. (2008) Design of Propulsion and Electric Power Generation
Systems, The Institute of Marine Engineering, Science and Technology, London, United
Kingdom
108