
OPTIMAL FLEET COMPOSITION FOR MARINE TRANSPORT OF COMPRESSED NATURAL GAS FROM STRANDED FIELDS
14
OPTIMAL FLEET COMPOSITION FOR MARINE TRANSPORT OF COMPRESSED NATURAL GAS FROM STRANDED FIELDS Giorgio Trincas * * University of Trieste, Trieste, Italy, [email protected] Abstract In this paper, a decision-based scheme is developed to improve the competitiveness and efficiency of compressed natural gas (CNG) shipping. A database of CNG ships of different size and speed is built off-line at conceptual design level, which provides technical and economic information sufficient to optimize the fleet composition. This goal is reached by generating a number of feasible fleets from the logistics viewpoint and ranking them by giving priority to CNG shipping tariff. To this end, a built-in code is implemented which integrates the logistics strategy with the menu of CNG ships to solve the decision-making model. A case study shows that usage of the proposed scheme facilitates correct decisions aimed at reducing the overall capital investment and improves the reliability and economic efficiency of the CNG shipping system. Keywords: Compressed Natural Gas, Shipping Logistics, Conceptual Ship Design, Fleet Composition 1. Introduction Natural gas has become a more and more important resource of energy since it has low environmental impact. Currently, 70 percent of gas is transported to market by pipeline and 30 percent as liquefied natural gas (LNG). Pipelines are attractive even offshore, but require huge upfront investments. LNG onshore facilities are expensive to build and the dual production process (liquefaction and regasification) is costly and energy wasteful. Marine transport of compressed natural gas (CNG) can be a successful alternative for short and medium distances (in the range of 2,000 nm) also allowing upstream oil & gas companies to monetize gas reserves that otherwise would remain stranded. The rationale of CNG option in prospective regions like the Mediterranean, Black Sea, South Eastern Asia, Caribbean, Caspian, South America, and South Africa is that the offtake and delivery of small-to-medium sized stranded markets are less competitive for LNG or subsea pipeline transport modes. Unfortunately, so far inability to develop an affordable CNG solution has hindered take-off of CNG marine transport. The reason for this unpleasant situation is twofold: the pressure vessels designed and sometimes certified for marine transport are inadequate, since they are too heavy and/or have a too small diameter; the result is that the proposed CNG ships are too large and expensive, and with low cargo density in holds, making the CNG marine transport still non-competitive with pipelines; lack of concurrent engineering between logistics knowledge and ship design has not permitted yet to tailor and optimize a CNG fleet for a specific market identification; many studies are available in the literature
Transcript of OPTIMAL FLEET COMPOSITION FOR MARINE TRANSPORT OF COMPRESSED NATURAL GAS FROM STRANDED FIELDS
OPTIMAL FLEET COMPOSITION FOR MARINE TRANSPORT
OF COMPRESSED NATURAL GAS FROM STRANDED FIELDS
Giorgio Trincas*
*University of Trieste, Trieste, Italy, [email protected]
Abstract
In this paper, a decision-based scheme is developed to improve the competitiveness and efficiency of
compressed natural gas (CNG) shipping. A database of CNG ships of different size and speed is built off-line
at conceptual design level, which provides technical and economic information sufficient to optimize the fleet
composition. This goal is reached by generating a number of feasible fleets from the logistics viewpoint and
ranking them by giving priority to CNG shipping tariff. To this end, a built-in code is implemented which
integrates the logistics strategy with the menu of CNG ships to solve the decision-making model. A case study
shows that usage of the proposed scheme facilitates correct decisions aimed at reducing the overall capital
investment and improves the reliability and economic efficiency of the CNG shipping system.
Keywords: Compressed Natural Gas, Shipping Logistics, Conceptual Ship Design, Fleet Composition
1. Introduction
Natural gas has become a more and more important resource of energy since it has low environmental impact.
Currently, 70 percent of gas is transported to market by pipeline and 30 percent as liquefied natural gas (LNG).
Pipelines are attractive even offshore, but require huge upfront investments. LNG onshore facilities are
expensive to build and the dual production process (liquefaction and regasification) is costly and energy
wasteful. Marine transport of compressed natural gas (CNG) can be a successful alternative for short and
medium distances (in the range of 2,000 nm) also allowing upstream oil & gas companies to monetize gas
reserves that otherwise would remain stranded. The rationale of CNG option in prospective regions like the
Mediterranean, Black Sea, South Eastern Asia, Caribbean, Caspian, South America, and South Africa is that
the offtake and delivery of small-to-medium sized stranded markets are less competitive for LNG or subsea
pipeline transport modes.
Unfortunately, so far inability to develop an affordable CNG solution has hindered take-off of CNG marine
transport. The reason for this unpleasant situation is twofold:
the pressure vessels designed and sometimes certified for marine transport are inadequate, since they are
too heavy and/or have a too small diameter; the result is that the proposed CNG ships are too large and
expensive, and with low cargo density in holds, making the CNG marine transport still non-competitive
with pipelines;
lack of concurrent engineering between logistics knowledge and ship design has not permitted yet to tailor
and optimize a CNG fleet for a specific market identification; many studies are available in the literature

(Economides and Mokhatab, 2007; Santi, 2007, Nikolaou et al., 2009), mainly devoted to clever
modelling of the logistics for optimal routing and distribution schedules of CNG ships, but without due
identification of the best CNG ships’ size and technical characteristics leading to actual optimal fleets.
As to the first unsolved problem, in Italy it is under development a new technology for CNG marine transport,
which is based on Type III pressure vessels (PVs with steel liners wrapped with hybrid composite of glass and
carbon). In these PVs the gas may be compressed to 300 bar at standard temperature and atmosphere and up
to 330 bar with mild refrigeration. The internal diameter ranges from 2.0 to 3.0 meters. The lower weight of
these pressure vessels with respect to other CNG technologies and the convenient unit cost per volume of gas
transported allow to design CNG ships with a deadweight to displacement ratio almost doubled if compared
to designs developed worldwide so far.
However, the needed integration between logistics and rational ship design has been the main driver to this
paper. Hence, the main goal is selection of the optimal fleet configuration for shipping the compressed natural
gas on a specific sea route with a given export rate for a number of gas production years. To this end, a rational
scheme has been implemented which integrates a menu of CNG prototype ships into a logistics framework.
The latter selects the number of ships entering in the fleet together with their size and economically optimal
service speed, given a number of relevant parameters such as loading and offloading rates per day, distance to
the market, connecting and disconnecting time on terminals, stand-by time, availability of storage at both origin
and destination locations. Final selection of the optimal fleet composition is performed on the basis of
minimum shipping tariff.
The optimal fleet composition has to guarantee a continuous delivery to the destination terminal, being flaring
not allowed and re-injection not considered in the present study. The best fleet composition shall be selected
by ranking for the minimum tariff required by the shipping company on an annual basis to transport and deliver
a volume unit of compressed natural gas
Sixteen CNG ships of different capacity ranging from 50 to 900 million of standard cubic feet (mmscf) have
been developed at conceptual level to transport gas to different markets at various average supply rates per
day. They install Type-III pressure vessels of 2.5-m internal diameter at 300-bar pressure.
The final result of this paper is a self-standing feasibility study for the marine transport of CNG, complete of
cost evaluation, at an accuracy level sufficient to make decision on possible implementation of the business in
whichever area where stranded gas can be monetized. Application to a case study is illustrated.
2. Marine CNG Distribution Schemes
Of course, there can be many ways to organize a CNG marine transport. The main distinction regards the kind
of path more suitable, which mainly depends on consumption rate at each receiving site and on relative
geographical location of them. The preferred schemes are the so-called hub-and-spoke and milk-run. The
former is preferred for destinations with sufficient consumption rates and can be better serviced by medium-
sized ships preferably with storage facility on both hub and receiving points. On the contrary, the milk-and-
run pattern is compelled when receiving sites have low consumption rates. They will be served by smaller
ships in a cyclical path. In this case, a storage plant at each destination point is mandatory in order to supply
gas in adequate quantity for consumption until another CNG ship will visit that receiving site.

The overall capacity of a CNG fleet, Gf , substantially has to satisfy shipping of the natural gas available at the
origin. At destination site the gas can be delivered by a different number of sister ships sailing at optimal speed
with adequate deadweight, e.g.
�� = � ⋅ � ⋅ ��(1)
where
�� = capacity of a ship (mmscf);
� = number of ships in each fleet;
� = number of terminals at delivery site, necessitated when the utilization rate per day, ��, at the
receiving point is higher than the maximum daily offloading rate that is technically feasible; this
number (trains of ships) has to satisfy the inequality� ≥ ��� ����⁄ � , where � is the smallest
integer larger than�� ����⁄ .
The primary criterion to apply in selecting the best fleet composition shall be minimization of the tariff to
transport unit of gas volume (USD/mscf] or unit of gas energy [USD/mBtu] per nautical mile.
In this paper, analysis and application will be restrained to the hub-and-spoke distribution pattern, that is, a
single destination only, � = 1 (�� ≤ ����), will be addressed.
3. Hub-and-Spoke Distribution Pattern
As it has been demonstrated (Nikolaou, 2010), the minimum capacity required to a CNG ship to transport
natural compressed gas for given maximum loading and offloading rates is determined as
�� =4�� +
2��
�� − 1����
−1
����=
���
�� − 1����
−1
����(2)
where
�� = connecting/disconnecting time (h)
� = distance from source to receiving site (nm)
� = ship service speed (kn)
���� = maximum offloading rate (mmscf/h)
��� = maximum loading rate (mmscf/h)
and where ��� = 4�� + �/� denotes the total round-trip time from delivery site to the source and back after
gas loading plus the total time for connecting/disconnecting the ship to/from the buoys.
Inserting equation (2) into equation (1) yields the formula (3) for assessing the minimum capacity of a fleet
organized in � trains each of � ships
�� = � ⋅ � ⋅���
�� − 1����
−1
����(3)
It can be demonstrated that the fleet capacity is bounded by a lower and an upper limit, respectively, depending
on the gas consumption rate, ��, which can be actually absorbed by destination terminals
�
� − 1�4�� +
2�
�� ⋅ �� ≤ �� ≤
�
� − 2�4�� +
2�
�� ⋅ ��(4)

assuming that the offloading rate equals the daily absorption at gas by each terminal, e.g. �� .= ����.
Figure 1 provides the required fleet capacity and its lower and upper bounds, ��and��, respectively, with
parameters �� = 1.5 h, � = 900 nm, � = 18 kn, and ���� = ���, while considering one, two and three trains
of ships, e.g. � = 1, 2, 3.
Fig. 1. �� and its bounds in terms of number of ships and trains
It can be easily seen that increasing number of ships causes that the limit lines bounding �� approach each
other until they coincide as a large number of smaller ships are employed at a capacity value given as
lim�→�
�� = lim�→�
�� ��� +2�
��(5)
Some preliminary conclusions may be drawn from parametric analysis of the above formulae which serve an
order-of-magnitude assessment of minimum fleet capacity. The necessitated CNG fleet capacity substantially
depends on the distance to ship speed ratio (� /�) and consumption rate ��/����.
At a first glance, it would appear that many small ships ought to be preferred since the required fleet capacity
is reduced accordingly. Ideally, the best would be building an infinite number of CNG ships leading to a kind
of pipeline, such as a boat bridge in Rome Empire time. But the problem is more complex as soon as the
operating expenses of so many ships through the business lifetime would be considered. As it is well known,
for the same total deadweight a fleet with large ships require higher initial investment for building but much
lower operating costs with respect to a fleet with a larger number of smaller ships. Separate consideration of
logistics and shipping leads to wrong conclusions. It can be anticipated that combining requirements from both
sectors will help decision-makers to identify the best fleet composition. It will result that a small number of
medium-sized ships is always the optimal solution.
3.1. Bounding Ship Capacity in Fleet Composition
Capacity of CNG ships as well as their loading/offloading rates stay within certain limits because of technical
and economic reasons. It is difficult to deem that ships with capacity over 50 mmscf and below 900 mmscf are
feasible. On the lower side, even with very low consumption rate and storage facility the tariff would not be
competitive with subsea pipelines. On the upper side, the initial investment would be too high; moreover, to
avoid too long loading/offloading times would require very large, heavy and expensive compressors on board.
When the CNG marine transport adopts the hub-and-spoke model, the first activity is to select the ship capacity
as a function of consumption rate, ��. Initially, consider a fleet of two ships. When the minimum capacity
value ��overtakes the upper bound (see Figure 1) that a CNG ship may reach in a single distribution train due
to technical limits and economic inconvenience, it would be necessary to assess ��, then eventually ��, and so
forth, until ship size will be within technical and building standards. On the contrary, would �� be lower than
minimal feasible capacity (see Figure 1 once more), it shall be advisable to plan the fleet following the milk-
run model.
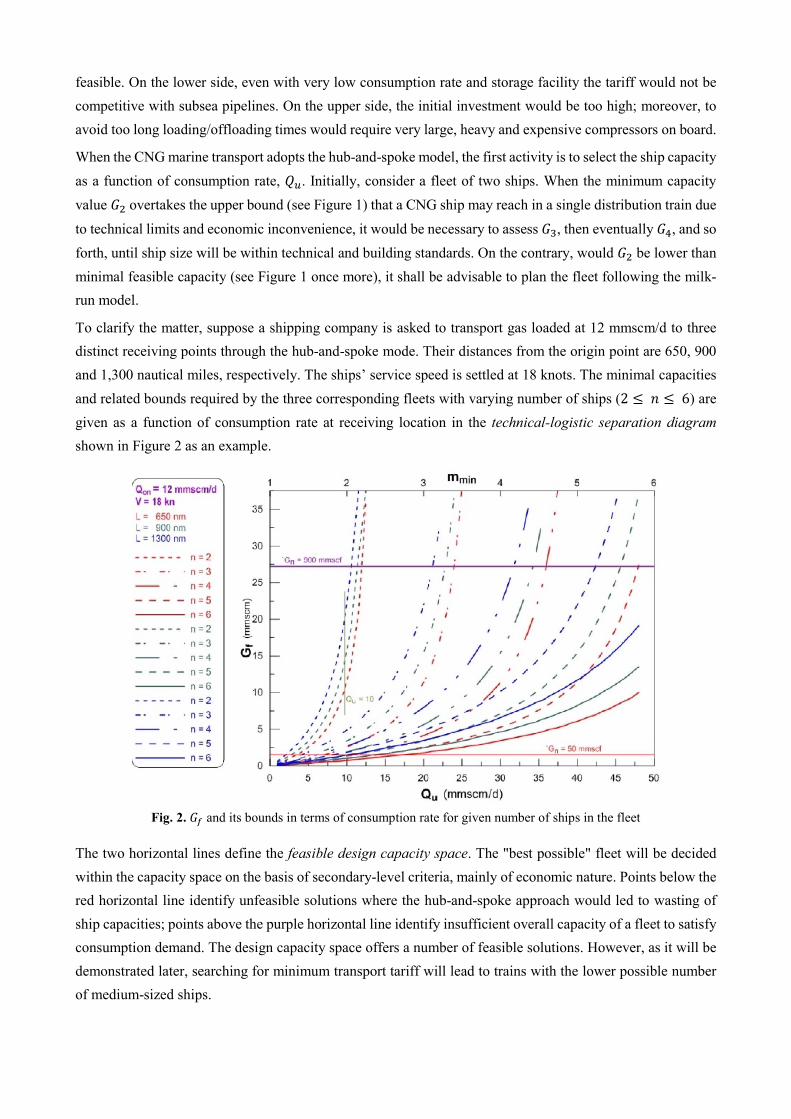
To clarify the matter, suppose a shipping company is asked to transport gas loaded at 12 mmscm/d to three
distinct receiving points through the hub-and-spoke mode. Their distances from the origin point are 650, 900
and 1,300 nautical miles, respectively. The ships’ service speed is settled at 18 knots. The minimal capacities
and related bounds required by the three corresponding fleets with varying number of ships (2 ≤ � ≤ 6) are
given as a function of consumption rate at receiving location in the technical-logistic separation diagram
shown in Figure 2 as an example.
Fig. 2. �� and its bounds in terms of consumption rate for given number of ships in the fleet
The two horizontal lines define the feasible design capacity space. The "best possible" fleet will be decided
within the capacity space on the basis of secondary-level criteria, mainly of economic nature. Points below the
red horizontal line identify unfeasible solutions where the hub-and-spoke approach would led to wasting of
ship capacities; points above the purple horizontal line identify insufficient overall capacity of a fleet to satisfy
consumption demand. The design capacity space offers a number of feasible solutions. However, as it will be
demonstrated later, searching for minimum transport tariff will lead to trains with the lower possible number
of medium-sized ships.
For instance, suppose that a CNG marine transport is planned to deliver gas to the aforementioned receiving
locations from a rich stranded field where gas may be loaded from four wellheads at loading rate ��� = 12
mmscm/d. If the utilization rate is lower (say, 10 mmscm/d), it is evident from Figure 2 that the only feasible
solution is with a train of two ships only. On the contrary, if the consumption rate overtakes 12 mmscm/d
(��/����� > 1), one train is no more sufficient. Two trains with three smaller ships (� = 3) will be the best
solution even though many other fleets with higher number of smaller and smaller ships are theoretically
feasible. And so forth; when consumption rate reaches 35 mmscm/d, trains with four ships at least are
necessitated.
3.2. Hub-and-Spoke Modelling
In the hub-and-spoke distribution pattern, continuous supply and delivery of gas imply overlap of ships. On
the contrary, intermittent supply and/or delivery results in less ships composing the fleet, or at least in a fleet
with the same number of ships but of reduced size (lower Capex and Opex) and lower tariff.
When a storage plant is introduced, the hub-and-spoke model will be denoted as hybrid. So, altogether four
types can be distinguished for the hub-and-spoke scheme:
Continuous-Continuous (CC): no storage facility is available.
Continuous-Interrupted (CI): storage facility at receiving point to accelerate the offloading phase.
Interrupted-Continuous (IC): storage facility at the origin point to speed up the loading phase.
Interrupted-Interrupted (II): storage facilities at both source and destination points.
3.2.1. Continuous-continuous service
If the logistics of the CNG transport mode does not require any storage facility, one can speak of hub-and-
spoke pattern with continuous service (CC); in this case
� =��
����
To avoid whichever outage or temporal overlapping during the operating cycle (e.g., a round-trip from the
delivery site to the source for reloading and return to resume delivery), there has to be continuous gas supply
(ship after ship) at the delivery site to cover consumption demand during the time other CNG ships are on a
round-trip while simultaneously ensuring that the gas source can supply the required natural gas.
This reasoning leads to the general equilibrium equation between the time taken by a CNG ship in the fleet to
complete a gas distribution cycle and the time spent by the other ships to offload the gas to utilization
���� = (� − 1)���� ⟹ ��� +
����
���= (� − 1)
����
����(6)
being
���� = ������ = ��� + ���� + ��� =
����
���+
����
����+ ���
Hence, the minimum capacity required to any sister ship composing the fleet can be derived from equation (6)
as
���� = ��� �
��� ⋅ ����
(� − 1)��� − �����(7)
3.2.2. Continuous-interrupted service
The main benefit expected by installation of a storage facility at destination site is reduction of time spent by
a CNG ship to stay connected to the delivery terminal, thus not depending directly upon the immediate
consumption rate. The ship(s) will get free from the client's utilization rate and the gas will always be unloaded
at maximum offloading rate. This model is mandatory when only one ship per train is available, say, especially
in a transitional period until a fleet is fully operated. In this case, the equilibrium equation to balance the
amount of gas supplied to consumption from storage facility during the round-trip of � CNG ships and the
accumulation of gas into the storage plant provided by the fleet reads
���� ⋅ �� = � ⋅ ��������� − ���(8)
where ���� is the cycle time of � ships if there is a gas storage facility at the destination site.
Then, the minimum ship capacity may be derived from equation (8) as
���� =
�� ⋅ ���
� −�����
−������
(9)
subject to the constraint � > (��/��� − ��/����), while the minimum storage capacity at spoke is
���= ��
�� �1 −��
�����(10)
It is evident that if �� > ����more than one train is to be introduced.
3.2.3. Interrupted-continuous service
In addition, there may be situations where the reservoir can guarantee only small gas quantities continuously,
which would force the CNG ships to waste time because of lengthy loading operations. A gas storage plant at
hub (for example, an FPSO especially when the natural gas is a sub-product of oil production) may speed up
the loading schedule since the natural gas will be accumulated there before another ship arrives.
If �� denotes the daily supply rate of gas at hub, solving for the balance equation between the accumulation
of gas at hub during the round-trip of � CNG ships and the amount of gas loaded effectively
���� ⋅ �� = � ⋅ �������
�� − ���(11)
allows evaluation of the unknown loading rate capable to synchronize the transport process as
����� =
���� ⋅ ���
����� − ��
�� �����
− ������
(12)
where the minimum ship capacity has the value assessed when no storage facility does exist (CC case).
The actual cycle time is then calculated as
���� =
����
�����
+��
��
����+ ���(13)
Since the quantity of natural gas delivered by � ships during the overall operating cycle is equal to
� ⋅ ���� = ��
�� ⋅ ��

it is straightforward to determine the capacity of each sister ship in the fleet as
���� =
���� ⋅ ��
�(14)
while the minimum storage capacity at hub is
���= ��
�� �1 −��
����(15)
subject to the constraint for the number of ships in the fleet similar to the one of the CI service.
3.2.4. Interrupted-interrupted service
In the most general case when storage facilities are envisaged at both the origin and receiving sites,
determination of the minimum ship capacity in a fleet follows the same path illustrated for the interrupted-
continuous service, where the only difference is that the initial ship capacity is assessed from the continuous-
interrupted service. From the balance equation
���� ⋅ �� = �������
�� − ���(16)
the actual loading rate is assessed as
����� =
���� ⋅ ��
����� − ��
�� ������
− �����
(17)
which allows to calculate the new cycle time ����. Now, iterating between the new ��
��, ����� and ��
��, the final
minimum capacity for each ship of the fleet is determined as
���� =
���� ⋅ ��
�(18)
Then, the storage capacities at source and destination site are calculated respectively as
���= ��
�� �1 −��
����(19)
���= ��
�� �1 −��
�����(20)
4. Building the Database of CNG Ships
The design of competitive CNG ships presents a number of formidable challenges, which include safe loading
and unloading gas system, as well as the tight integration of gas containment system, structure and propulsion.
These difficulties are compounded by lack of existing baseline ships, historical databases, and compressed gas
experience within the design community. Consequently, designers must rely on physics-based analysis
methods that facilitate rational decisions and compromises. Therefore, what is needed is a means of distilling
the essence of complex analysis tools into a form that can quickly and easily provide all required information.
To this end, a mathematical design model was developed and inserted into a multicriterial decision-making
support system (Trincas, 2002) in order to reduce inaccuracy and imprecision in assessing relevant ship properties.
Since CNG ship concepts are prototypes, inadequate information about configuration and size of feasible designs is
overcome by generating efficient (Pareto) solutions where the preferred designs are selected with fuzzy ELÈCTRE
method (Sevkli, 2009).

4.1. The Family of CNG Ships
The following are the main topics included in the mathematical model to generate the concept designs:
identification of main dimensions and geometrical coefficients of twin-skeg hull form, viable to install
the pressure vessels adequate to transport required volume of CNG;
selection of pressure vessels’ length subject to the following crisp constraints: compliance with intact and
damage stability rules, and avoidance of coupling between ship motions (heave, roll and pitch) as well as
of resonance between roll and wave periods (roll period greater than 14 seconds);
assessment of midship section structure and lightship weight breakdown;
power prediction in calm water and waves & wind;
electric power balance;
seakeeping assessment for motions and accelerations;
one-dimensional vibration calculations to avoid solutions where risk does exist of resonance between
main modes of hull vibration and propellers’ speed;
round-trip modelling;
horsepower for compression onboard to unload gas and simultaneous stand-by (dynamic positioning).
Table 1. Main characteristics of CNG ships in the family
CNG Capacity (mmscf)
50 100 150 200 250 300 350 400 450
No. PVs (D = 2.5 m) 92 140 174 210 217 248 272 306 342
PV length (m) 10.20 13.20 15.80 17.30 20.80 21.80 23.20 23.50 23.70
Length overall (m) 138.58 164.20 168.66 173.00 172.40 178.60 192.90 193.90 212.18
Beam (m) 22.66 24.52 26.48 27.70 30.10 31.48 32.90 34.00 35.00
Draft (m) 4.58 5.16 5.68 6.10 6.38 6.80 7.08 7.42 7.55
Depth at side (m) 14.00 14.30 14.70 15.00 15.30 16.30 17.70 18.00 18.20
Displacement (t) 9,008 13,060 16,011 18,887 22,229 25,226 29,567 32,188 37,120
Roll period (s) 14.20 14.10 14.00 14.70 14.40 15.40 16.30 15.60 14.30
Total power (kW) 7,736 9,852 9,852 10,800 12,552 13,152 14,400 16,152 18,852
Deadweight (t) 1,100 2,042 2,978 3,919 4,856 5,787 6,742 7,657 8,615
Ship cost (USD⋅106) 130.20 143.40 155,30 168,00 183.60 197.90 215.60 230.30 249.70
CNG Capacity
(mmscf) 500 550 600 650 700 750 800 850 900
No. PVs (D = 2.5 m) 369 387 430 440 484 495 506 517 528
PV length (m) 24.40 25.50 25.10 26.50 26.00 27.20 28.30 29.40 30.50
Length overall (m) 230.00 237.80 238.00 242.36 242.61 246.92 252.00 256.05 263.70
Beam (m) 34.86 36.18 37.20 37.82 38.84 38.88 40.90 41.82 42.64
Draft (m) 7.68 7.88 8.02 8.24 8.35 8.50 8.56 8.56 8.66
Depth at side (m) 18.90 20.00 19.60 21.00 20.50 21.70 22.80 23.90 25.00
Displacement (t) 40,136 44,139 46,963 50,692 53,297 56,694 61,248 63,255 67,920
Roll period (s) 16.500 16.50 14.60 16.70 14.70 17.20 15.80 16.30 16.80
Total power (kW) 18,852 19,436 22,800 24,552 25,136 25,136 25,428 30,400 32,152
Deadweight (t) 9,554 10,465 11,428 12,349 13,320 14,253 15,160 16,102 17,062
Ship cost (USD⋅106) 263.90 280.05 297.90 315.80 329.50 344.50 360.90 378.50 397.00
Main characteristics of the “best possible” CNG ships with gas capacity ranging from 50 up to 900 mmscf, are
summarized in Table1.
4.2. Shipping Tariff Estimation
For the time being, only shipping tariff is estimated. Absolute values of tariffs should be read cautiously, since
building cost of each ship is evaluated according to average hourly cost and productivity of Italian shipyards,
whilst daily operating costs are derived from average data for LNG ships, gas costs are set from present market
information.
Basically, a discounted cash flow model under assumed financial scenario is used to solve for tariff. It involves
identification of key elements which determine the investment’s outcomes, such as ship’s acquisition,
operating costs, tax and interest rates, leverage scheme, economic life, salvage value, etc. Discounted cash
flows are calculated on an after tax basis.
The following are key considerations in tariff estimations:
Terms of Project: 10, 15, 20, 25, 30 years
Capex (capital expenses for ship building):
- ship capital expenses are spread over three years prior to first gas delivery
- shipyard overheads assumed as 30% of overall labor costs
- expected net profit for shipyard assumed at 6.5% after taxes
- included are costs for design, survey, insurance, administration, etc.
Opex (operating expenses over ship lifetime):
- ship operating expenses are escalated at 2% per annum starting from first gas delivery
- MDO cost estimated at USD 865/mt in Rotterdam Port averaged on August 2014
- natural gas cost estimated at wellhead price USD 2.65/mscf, averaged on 2012 data
- linear depreciation assumed; scrap value varies from 25 percent of ship acquisition cost after 10 years
of ship lifetime down to 10 percent after 30 years
- 5-year dry-docking and annual maintenance and repair costs are included in annual operating
expenditures
Tax Rate: Net Present Values assessed with Corporate tax rate of 30%
Internal Rate of Return for the ship owner: IRR assumed 12% as reasonable project return
5. Case Study
Application of the implemented model is limited here to analysis of the viability of the marine CNG transport
from an offshore loading terminal to an offshore unloading terminal (hub-and-spoke distribution pattern) with
a source-destination distance of 900 nm where the maximum production rate is 7 mmscm/d. A single
distribution train of ships is considered only since the daily demand of natural gas is lower than 12 mmscm/d
(refer to Figure 2).
The loading point is identified offshore near, say, an FPSO which may be deemed as the cargo storage facility
when the loading rate onboard the CNG ship is higher than the daily gas supply from the wells. During loading
operation the CNG ship is connected to an STL buoy which receives the gas compressed at 270 bar from the
FPSO via a short subsea pipeline. The offloading point with or without a storage plant receives gas from a
buoy which connects a SALS system installed on board with an onshore treatment plant.
In determining fleet composition and ship size the following parameters are set:
ship service speed: range from 15 to 20 knots, with sea margin as 21% to allow for added resistance
in wind and waves;
connect/disconnect time: 1.5 hours for each operation
stand by-time: what is needed to round up each one-way voyage to the nearest whole day;
350 operating days per year.
To evaluate influence of different gas volumes loaded at the hub and potential advantages of cargo storage at
receiving terminal the cases summarized in Table 2 are investigated.
Table 2. Hub-and-spoke cases
Service Hub Spoke
continuous-
continuous
Loading at 5 mmscm/d Offloading at 5 mmscm/d
Loading at 7 mmscm/d Offloading at 7 mmscm/d
continuous- interrupted
Loading at 3 mmscm/d Offloading at 7 mmscm/d
Loading at 5 mmscm/d Offloading at 7 mmscm/d
interrupted - interrupted
Loading at 3 mmscm/d Offloading at 7 mmscm/d
Loading at 5 mmscm/d Offloading at 7 mmscm/d
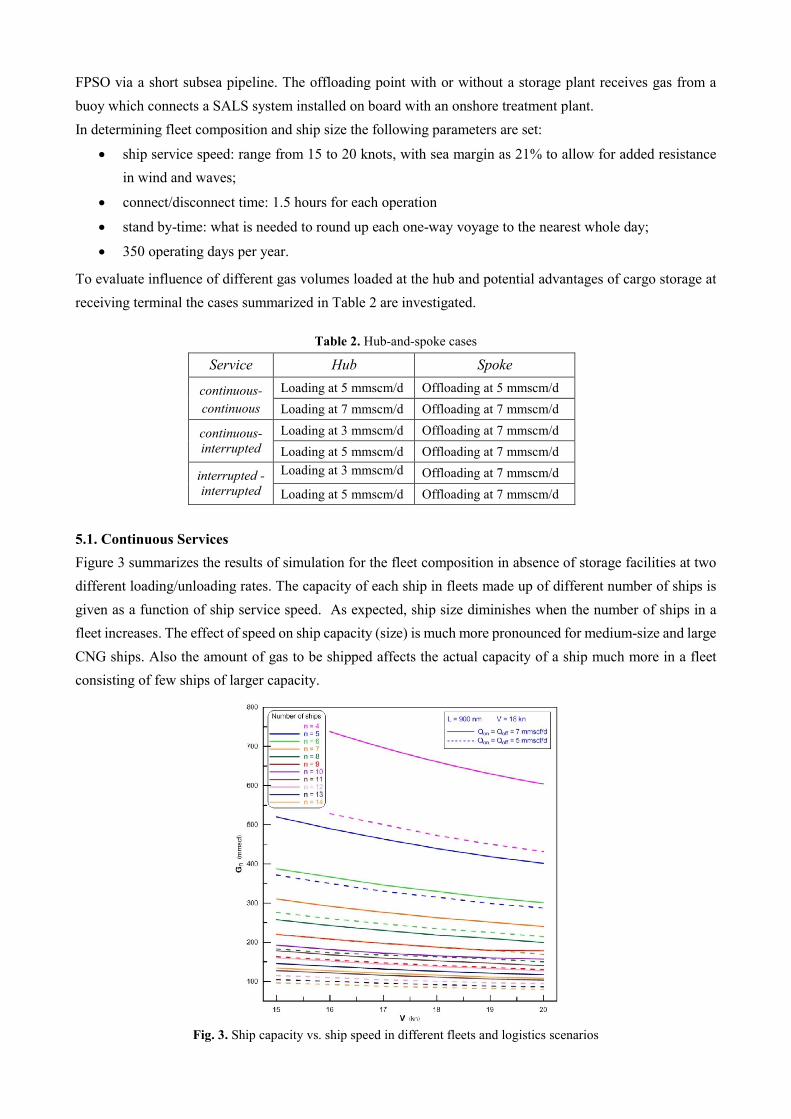
5.1. Continuous Services
Figure 3 summarizes the results of simulation for the fleet composition in absence of storage facilities at two
different loading/unloading rates. The capacity of each ship in fleets made up of different number of ships is
given as a function of ship service speed. As expected, ship size diminishes when the number of ships in a
fleet increases. The effect of speed on ship capacity (size) is much more pronounced for medium-size and large
CNG ships. Also the amount of gas to be shipped affects the actual capacity of a ship much more in a fleet
consisting of few ships of larger capacity.
Fig. 3. Ship capacity vs. ship speed in different fleets and logistics scenarios

The lines depicted in Figure 4 show that for the continuous- service the shipping tariff increases dramatically
when the number of ships increases with corresponding decrease of ship size. Each point in a group (fleet)
denotes a ship with a specific service speed (V = 15, 16, 17, 18, 19, 20 kn). For the considered logistics
parameters, the best fleet is composed by five ships when 7 mmscf per day are shipped, whilst the best fleet is
composed by four larger ships with higher tariff when both loading and offloading rates are 5 mmscm/d.
100 200 300 400 500 600
Capacity (mmscf)
2,20
2,40
2,60
2,80
3,00
3,20
3,40
3,60
3,80
4,00
4,20
4,40
4,60
4,80
5,00T
ari
ff
(US
D/m
msc
f)
Number of ships
n = 4n = 5
n = 6n = 7
n = 8
n = 9n = 10
n = 11
Fig. 4. Shipping tariff vs. ship capacity in different fleets and logistics scenarios
Figure 5 shows the optimal service speed for the best fleets which is singled out by the lower shipping tariff.
These speeds are about 18 and 19 knots for the fleets of four and five ships, respectively. It is worth noticing
that the optimal speed generally diminishes when a fleet consists of more and more ships.
Fig. 5. Shipping tariff vs. ship speed in different fleets and logistics scenarios
These results confirm the preliminary comments on results depicted in Figure 1. Even in the simplest hub-and-
spoke distribution pattern, e.g. continuous-continuous service, no concurrent consideration of logistics and
conceptual designing of ships with simultaneous merging of technical and economic properties can lead to
wrong decision making.

5.2. Effects of Storage Plants
An analysis was carried out to quantify the effects on ship size and capacity yielded by potential storage plants
available at spoke (CI) and hub and spoke (II) with respect to the CC service as a function of utilization rate.
Fig. 6. Ship capacity vs. utilization rate with and without storage plant
The graphs depicted in Figure 6 clearly show that the positive reduction of ship capacity (��) becomes less
and less significant as soon as a fleet consists of a higher number of ships. It is also evident that the maximum
advantage is gained when the utilization rate is about half the assumed gas supply at hub. The vertical axis on
the right side shows the storage capacity at the receiving point as a function of the utilization rate required by
each single ship belonging to a specific fleet. In first approximation the storage capacity at hub was assumed
to be of about the same size as at hub.
5.3. Synthesis
Finally, synthesis of technical-economic evaluations for different transport scenarios is offered in Table 3. It
is clear that larger availability of stranded gas reduces initial investment and tariff (compare CC7 with CC5
and CC3). It is also straightforward to evaluate the advantages induced on these economic parameters by
installation of storage plants especially on the capital expenses in building ships.
Table 3. Main data for the best fleets in different scenarios
Service Case
Load Rate (mmscm/d)
Unload Rate (mmscm/d)
No. of ships
Capacity (mmscf)
V (kn)
Build Cost (USD⋅106)
Cycles
per year
Tariff (USD/mBtu)
CC 3.0 3.0 3 568.9 18 277.7 33 2.726
CI3 3.0 7.0 3 359.4 18 221.9 47 2.441
II3 3.0 7.0 2 296.6 17 197.0 48 2.547
CC5 5.0 5.0 4 450.2 19 245.6 38 2.685
CI5 5.0 7.0 4 411.5 18 235.4 45 2.370
II5 5.0 7.0 3 387.7 18 229.0 46 2.395
CC7 7.0 7.0 5 418.6 19 241.3 46 2.360

If service cases are grouped according to loading rates (3.0 and 5.0 mmscm/d) some tendency is clear:
usage of storage plant at receiving site (CI) reduces dramatically the ship capacity and therefore the
building with respect to the continuous service; also shipping tariff is reduced mainly because of relevant
increase in annual round-trips;
the main effect of installing a storage facility also at the source site (II) is to reduce the number of ship in
the fleet; the service speed diminishes too; on the contrary, the shipping tariff increases with respect to
both CI service cases because less gas is delivered to the client.
6. Conclusions
In this paper, a simulation model is presented based on full integration of logistics with ship concept design
through a multicriterial decision-making approach in order to select the optimal fleet composition for marine
transport of compressed natural gas. This transport mode of natural gas will be a successful alternative to LNG
and pipelines for short and medium distances also permitting to monetize stranded gas on condition that:
a new generation of Type III pressure vessels is ready to be installed on CNG ships, so allowing design
of lighter and cheaper ships in terms of Capex and Opex;
interdependency between logistics and tailored ship design is fully taken into account as proposed in this
paper.
Some important conclusions may be drawn:
medium-sized ships (around 400 mmscf) are economically the most efficient in the range of 1,000 nm;
small capacity ships could be feasible only for very short distances and small gas volumes;
whichever effort in optimal selection of a fleet has to ensure continuous gas supply at the delivery location
and adequate gas supply at the source site;
the best solution is to organize fleets with multiple CNG vessels and storage facilities;
while storage facility definitively appears convenient at the receiving site, its usage at the source point is
questionable; only evaluation of storage facilities’ cost and consideration of the total tariff may clarify
which might be the best planning of the whole transport system.
References
Economides, M.J., Mokhatab, S.: Compressed Natural Gas: Monetizing Stranded Gas, 2007
Nikolaou, M.: Optimizing the Logistics of Compressed Natural Gas Transportation by Marine Vessels, Journal of Natural
Gas and Engineering, Vol. 2, 2010, pp. 1-20.
Nikolaou, M., Economides, M.J., Wang, X., Marongiu-Porcu, M.: Distributed Compressed Gas Sea Transport,
Proceedings of the 2009 Offshore Technology Conference, Houston, OTC 19738, 2009, pp. 1-14.
Santi, F.: Nimby-Proof Marine Transport of Gas (in Italian), in Nuova Energia, no. 4, 2007.
Sevkli, M.: An Application of the Fuzzy Electre Method for Supplier Selection, International Journal of Production
Research, 2009, Vol. 48, no. 12, pp. 3393-3405
Trincas, G.: Survey of Design Methods and Illustration of Multiattribute Decision Making System for Concept Ship Design (Plenary Paper), Proceedings of the Third International Conference on Marine Industry, MARIND’2001, Varna, 2001, Vol. III, pp. 21-50.