Computational Analysis of Compressed Stiffened Composite ...
11
aerospace Article Computational Analysis of Compressed Stiffened Composite Panels with Impact Damage Alexander A. Ryabov 1 , Evgeny E. Maslov 1 , Dmitry Y. Strelets 2, * and Vladimir G. Slobodchikov 3 1 Sarov Engineering Center, Nizhny Novgorod Region, Techno-Park «Sarov» 607328, Russia; [email protected] (A.A.R.); [email protected] (E.E.M.) 2 Moscow Aviation Institute, National Research University, Moscow 125993, Russia 3 Joint-Stock Company, Aero Composite, Moscow 125284, Russia; [email protected] * Correspondence: [email protected] Received: 15 November 2018; Accepted: 15 February 2019; Published: 27 February 2019 Abstract: A complex modeling technique is presented in this paper for a numerical analysis of compressed stiffened composite panels with impact damage. The numerical technique is based on the LS-Dyna code application, which simulates both the dynamic deformation of the panel subjected to a local impact and the quasi-static uniform compression of the panel within the local damage zone. The technique has been validated by both impact and compression experimental tests of the stiffened composite panel. The obtained numerical results show that impact damage to the composite panel can reduce the carrying capacity in more than 50% of damaged panels compared to undamaged panels. Keywords: composite stiffened panels; stresses; strains; kinetic energy; carrying capacity; dynamic loading; impact damage; static compression; finite element method; explicit scheme 1. Introduction Fiber reinforced polymer (FRP), which has high strength characteristics, is widely used in aerospace, shipbuilding, and other industries. Scientific investigations of composite structures have been carried out over several decades [1–12]. General aspects of the numerical modeling of deformations and failure of aircraft structures, made of composite materials are presented in [12]. This paper points out that the increased use of FRP presents new difficulties for stress analysis due to the complicated structure and highly complex failure modes of composite materials. When solving problems with composite materials it is necessary to take into account physical nonlinearity, large displacements, and contact interactions of layers and fibers of FRP laminates. It is important for correct predictions of reciprocal action of the possible buckling and instability of loading process and damage growth, reducing residual strength of composite structure. It is well known that composite plates and shells are very sensitive to local dynamic loads, such as the hail, and the impact of small stones from the runway. It is noted in [11] that, with relatively low levels of kinetic energy, impact damage appears inside composite materials and can be invisible on the external surface of the structure. The experimental results show that the damage occurs within a conical contact zone with the apex at the point of impact [13]. A real damage zone also includes broken fibers, matrix cracks, and delamination of plies. In the compression of thin panels, this local damaged zone with delamination allows the fibers to buckle at much lower strains than in an undamaged region. Therefore, predicting delamination growth due to buckling is very important. Some results of numerical simulations of the post-buckling delamination growth in compressed composite plates and shells are presented in [14–17]. A finite-element nonlinear analysis of the post-buckling behavior of a compressed rectangular plate with circular delamination was conducted Aerospace 2019, 6, 25; doi:10.3390/aerospace6030025 www.mdpi.com/journal/aerospace
-
Upload
khangminh22 -
Category
Documents
-
view
0 -
download
0
Transcript of Computational Analysis of Compressed Stiffened Composite ...

aerospace
Article
Computational Analysis of Compressed StiffenedComposite Panels with Impact Damage
Alexander A. Ryabov 1, Evgeny E. Maslov 1, Dmitry Y. Strelets 2,* andVladimir G. Slobodchikov 3
1 Sarov Engineering Center, Nizhny Novgorod Region, Techno-Park «Sarov» 607328, Russia;[email protected] (A.A.R.); [email protected] (E.E.M.)
2 Moscow Aviation Institute, National Research University, Moscow 125993, Russia3 Joint-Stock Company, Aero Composite, Moscow 125284, Russia; [email protected]* Correspondence: [email protected]
Received: 15 November 2018; Accepted: 15 February 2019; Published: 27 February 2019
Abstract: A complex modeling technique is presented in this paper for a numerical analysis ofcompressed stiffened composite panels with impact damage. The numerical technique is based onthe LS-Dyna code application, which simulates both the dynamic deformation of the panel subjectedto a local impact and the quasi-static uniform compression of the panel within the local damage zone.The technique has been validated by both impact and compression experimental tests of the stiffenedcomposite panel. The obtained numerical results show that impact damage to the composite panel canreduce the carrying capacity in more than 50% of damaged panels compared to undamaged panels.
Keywords: composite stiffened panels; stresses; strains; kinetic energy; carrying capacity;dynamic loading; impact damage; static compression; finite element method; explicit scheme
1. Introduction
Fiber reinforced polymer (FRP), which has high strength characteristics, is widely used inaerospace, shipbuilding, and other industries. Scientific investigations of composite structureshave been carried out over several decades [1–12]. General aspects of the numerical modelingof deformations and failure of aircraft structures, made of composite materials are presentedin [12]. This paper points out that the increased use of FRP presents new difficulties for stressanalysis due to the complicated structure and highly complex failure modes of composite materials.When solving problems with composite materials it is necessary to take into account physicalnonlinearity, large displacements, and contact interactions of layers and fibers of FRP laminates.It is important for correct predictions of reciprocal action of the possible buckling and instability ofloading process and damage growth, reducing residual strength of composite structure. It is wellknown that composite plates and shells are very sensitive to local dynamic loads, such as the hail,and the impact of small stones from the runway. It is noted in [11] that, with relatively low levelsof kinetic energy, impact damage appears inside composite materials and can be invisible on theexternal surface of the structure. The experimental results show that the damage occurs within aconical contact zone with the apex at the point of impact [13]. A real damage zone also includes brokenfibers, matrix cracks, and delamination of plies. In the compression of thin panels, this local damagedzone with delamination allows the fibers to buckle at much lower strains than in an undamaged region.Therefore, predicting delamination growth due to buckling is very important.
Some results of numerical simulations of the post-buckling delamination growth in compressedcomposite plates and shells are presented in [14–17]. A finite-element nonlinear analysis of thepost-buckling behavior of a compressed rectangular plate with circular delamination was conducted
Aerospace 2019, 6, 25; doi:10.3390/aerospace6030025 www.mdpi.com/journal/aerospace

Aerospace 2019, 6, 25 2 of 11
in [15] with the ABAQUS code and validated by experimental data. There was a discrepancy within10% between the predicted load for delamination growth and the values measured from the tests.In general, the “compression after impact” problem remains for composite materials, limiting allowablecompressive strains, often as low as ε = 0.3%.
Different approaches for numerical simulations of impulse dynamic loading, predicting impactdamage of composite structures and analysis of experimental data, are described in [18–26]. Most ofthe numerical test results presented in these papers have been obtained on coupons with an impactvelocity of less than 5 m/s and a mass of less than 5 kg. The tests [18,19] show that the damage causedby the low-velocity impact with kinetic energy of Ek ~60 J can reduce the compressive propertiesof coupons by up to 50% and reduce the compressive properties of stringer stiffened panels by asmuch as 20% [21]. A series of carbon composite thin plates were tested in the range of impactenergy Ek = 0.60–9.34 J in [20] and compared with numerical results obtained with finite-elementimpact code FE77 with explicit solver and the LS-Dyna code. The developed modeling technique hasworked well for carbon composites and allowed the predication of the force history and the onset ofdelamination. Additionally, different composite plates and stiffened panels subjected to impacts withan energy of Ek = 13–25 J were studied in [22]. It is noted in this paper that the debilitating effects oncompression strength limit the permissible design strain levels to 0.3–0.4%. A modeling techniquebased on the LS-Dyna code was developed in [23] using single-layer shell elements to predict both thein-plane damage and delamination. This technique was applied to a stiffened composite plate loadedwith Ek ~ 15 J and validated by comparing the numerical and test results of [21], with differences of16% for force–time response and 20% for damage area being obtained. Delamination threshold loadassessment was studied in [24] for 100 × 100 mm square samples of glass–carbon–epoxy composite.It was experimentally found that there was a threshold impact energy of Ek = 1.5 J independent of theglass fiber stacking sequence. Moreover, 150 × 100 mm rectangular plates of carbon fiber–epoxy weretested in [26] with low-velocity impacts in the range of Ek = 15–35 J. It is pointed out in this paper thatdelamination area and its shape depend on the stacking sequence.
A brief literature survey shows that all observed publications can be divided into two separategroups: the first one includes investigations of damage in composite structures subjected to localdynamic loading, and the second one presents an analysis of the post-buckling behavior of the initiallydamaged structures to predict load for delamination growth. In the present paper, an attempt hasbeen made to develop a modeling tool and conduct complex analysis simulating both stages on thebase of one platform using the LS-Dyna code: dynamic loading by impactor and static compression ofstiffened panel with impact damage obtained in the first stage.
All new aircrafts have to meet very stringent requirements of national and international aviationrules. A designer must demonstrate the static strength and carrying capacity of the units madeof composite materials, preliminarily subjected to local dynamic loading with kinetic energy ofEk = 135 J [11]. This impulse is transmitted by an impactor with a spherical end. Such loadingconditions are investigated here.
2. Statement of Work and Governing Equations
Deformations of a thin-walled stiffened panel are described according to the Lagrangeapproach [27]. There are two coordinate systems: the first one is a fixed rectangular Cartesiancoordinate system, X = [X1X2X3], and the second one is a local coordinate system, x = [x1x2x3],with directional cosines nij:
xi = nijXj, i, j = 1, 3. (1)
The origin of the local coordinates is located at a midsurface of the panel, axis x3 is a normal to themidsurface, and x1, x2 are orthogonal to x3. We assume that transverse shear deformations are small,which allows us to suppose that the local basis is orthogonal during all the process of deformation.
Aerospace 2019, 6, 25 3 of 11
The velocity–strain components in the local basis.εij are defined by velocity–strain components in the
general basis.eij:
.εij = nimnjk
.emk, (2)
Velocity–strain components.eij are defined in a current state metrics:
.eij = (
.Ui,j +
.U j,i)/2, (i, j = 1, 3)
Xi = Xi| t=0 +t∫
0
.Uidt
(3)
where displacements Ui are defined in Cartesian coordinate system X, comma means a space derivative,and a superposed dot denotes a time derivative.
The equation of motion is written in the form of the variation principle of balance of virtualpowers of work [28,29]:∫
Ω
σijδ.εijdV +
∫Ω
ρ..Uiδ
.UidV =
∫Γp
Piδ.
Uidγ +∫Γq
Pqi δ
.Uidγ, (i, j = 1, 3) (4)
where: σij—components of stress tensor, ρ—density, Pqi —contact pressure, Pi—distributed load,
Ω—volume of structure, Γq—contact surface, Γp—surface of external pressure is applied, δ.εij,
δ.
Ui—variations of.εij, and
.Ui at the surface with given boundary conditions δ
.Ui = 0.
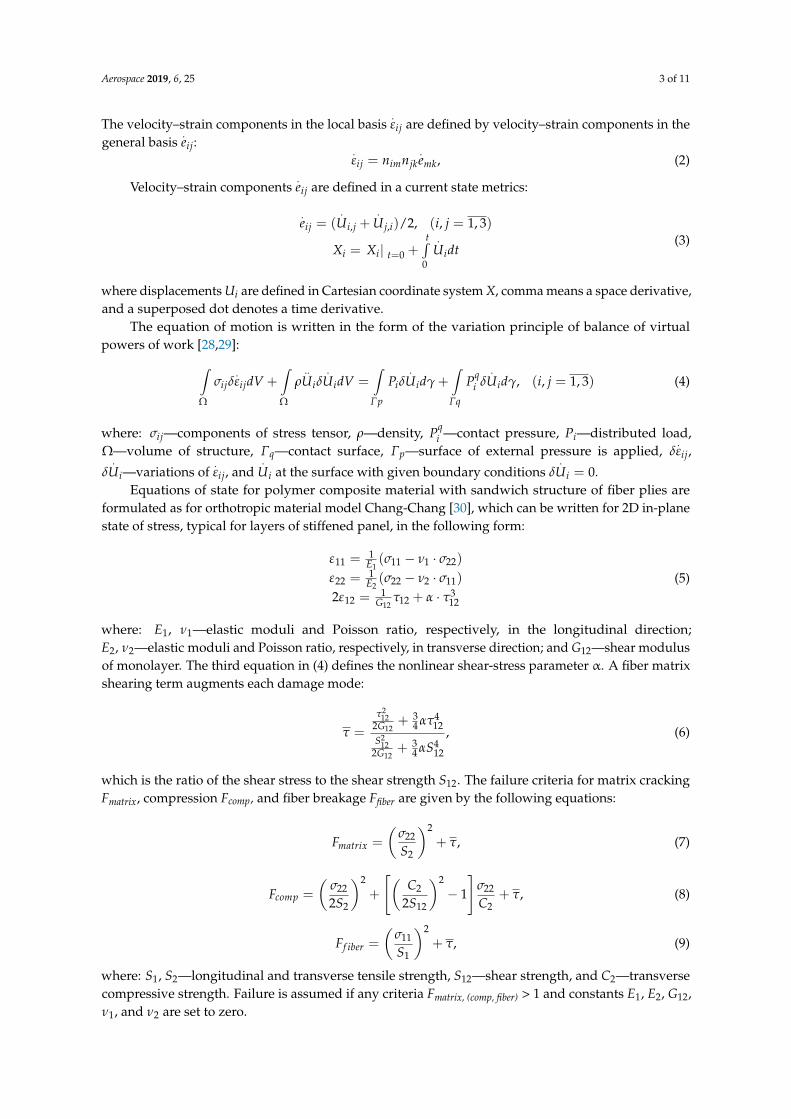
Equations of state for polymer composite material with sandwich structure of fiber plies areformulated as for orthotropic material model Chang-Chang [30], which can be written for 2D in-planestate of stress, typical for layers of stiffened panel, in the following form:
ε11 = 1E1(σ11 − ν1 · σ22)
ε22 = 1E2(σ22 − ν2 · σ11)
2ε12 = 1G12
τ12 + α · τ312
(5)
where: E1, ν1—elastic moduli and Poisson ratio, respectively, in the longitudinal direction;E2, ν2—elastic moduli and Poisson ratio, respectively, in transverse direction; and G12—shear modulusof monolayer. The third equation in (4) defines the nonlinear shear-stress parameter α. A fiber matrixshearing term augments each damage mode:
τ =
τ212
2G12+ 3
4 ατ412
S212
2G12+ 3
4 αS412
, (6)
which is the ratio of the shear stress to the shear strength S12. The failure criteria for matrix crackingFmatrix, compression Fcomp, and fiber breakage Ffiber are given by the following equations:
Fmatrix =
(σ22
S2
)2+ τ, (7)
Fcomp =
(σ22
2S2
)2+
[(C2
2S12
)2− 1
]σ22
C2+ τ, (8)
Ff iber =
(σ11
S1
)2+ τ, (9)
where: S1, S2—longitudinal and transverse tensile strength, S12—shear strength, and C2—transversecompressive strength. Failure is assumed if any criteria Fmatrix, (comp, fiber) > 1 and constants E1, E2, G12,ν1, and ν2 are set to zero.

Aerospace 2019, 6, 25 4 of 11
Modeling of delaminations: In the suggested approach, every composite layer is simulatedas a separate domain. For every pair of adjacent domains, the specific contact algorithm,CONTACT...TIEBREAK [31], is applied. Delamination between domains appears if:( σn
NFLS
)2+( σS
SFLS
)2≥ 1 (10)
where: σn, σs—normal and shear stresses in the connection, respectively NFLS, SFLS—ultimate normaland shear stresses, respectively. If delamination appears between domains, usual contact interaction isapplied for further simulation.
An explicit scheme for time discretization and the finite element method [28] are used tonumerically solve Equations (1)–(10).
The problem of local dynamic loading and consequent uniform static compression of the stiffenedcomposite rectangular flat panel of constant thickness h1 with sizes of a × 2b is considered in thispaper (see Figure 1). At the first stage, the panel is locally impacted by dynamic force P caused bysteel impactor. Then, at the second stage, the panel is statically loaded by longitudinal compressionapplied as uniform displacements at the free edge of the panel. The opposite edge of the panel isrigidly restrained, and symmetrical boundary conditions are applied at the side edges of the panel.
Aerospace 2018, 5, x FOR PEER REVIEW 4 of 12
which is the ratio of the shear stress to the shear strength S12. The failure criteria for matrix cracking Fmatrix, compression Fcomp, and fiber breakage Ffiber are given by the following equations:
,2
2
22 τσ+
=
SFmatrix
(7)
,122 2
222
12
22
2
22 τσσ+
−
+
=
CSC
SFcomp
(8)
,2
1
11 τσ+
=
SFfiber
(9)
where: S1, S2—longitudinal and transverse tensile strength, S12—shear strength, and C2—transverse compressive strength. Failure is assumed if any criteria Fmatrix, (comp, fiber) > 1 and constants E1, E2, G12, ν1, and ν2 are set to zero.
Modeling of delaminations: In the suggested approach, every composite layer is simulated as a separate domain. For every pair of adjacent domains, the specific contact algorithm, CONTACT...TIEBREAK [31], is applied. Delamination between domains appears if:
122
≥
+
SFLSNFLSSn σσ
(10)
where: σn, σs—normal and shear stresses in the connection, respectively NFLS, SFLS—ultimate normal and shear stresses, respectively. If delamination appears between domains, usual contact interaction is applied for further simulation.
An explicit scheme for time discretization and the finite element method [28] are used to numerically solve Equations (1)–(10).
The problem of local dynamic loading and consequent uniform static compression of the stiffened composite rectangular flat panel of constant thickness h1 with sizes of a × 2b is considered in this paper (see Figure 1). At the first stage, the panel is locally impacted by dynamic force P caused by steel impactor. Then, at the second stage, the panel is statically loaded by longitudinal compression applied as uniform displacements at the free edge of the panel. The opposite edge of the panel is rigidly restrained, and symmetrical boundary conditions are applied at the side edges of the panel.
The panel is made of carbon/epoxy FRP with laminate stacking sequence (+45°, 0°, −45°, 0°, 90°, 0°, −45°, 0°, and +45°)3s. The normalized dimensions of the panel are presented in Table 1.
Table 1. Main normalized dimensions of the carbon/epoxy fiber reinforced polymer pane 1.
h h2 h3 a b b1 b2 7.5 2.0 2.0 66 23.3 17.0 11.4 1 Dimensions are normalized by h1 value.
Figure 1. Stiffened panel with impact damage. a—panel length; b—half panel width or thedistance between the stringers; h1—the composite plating thickness; b1, b2, h2—the stringer geometricparameters; h3—the sum of the stringer shelf thickness and the composite plating thickness; h—thesum of stringer height and the composite plating thickness; P—force caused by impactor.
The panel is made of carbon/epoxy FRP with laminate stacking sequence (+45, 0, −45, 0, 90,0, −45, 0, and +45)3s. The normalized dimensions of the panel are presented in Table 1.
Table 1. Main normalized dimensions of the carbon/epoxy fiber reinforced polymer pane 1.
h h2 h3 a b b1 b2
7.5 2.0 2.0 66 23.3 17.0 11.41 Dimensions are normalized by h1 value.
3. Local Dynamic Deformation of the Panel
The finite-element model based on 8-node brick elements SOLID_ORTHO [31] was developedto simulate dynamic deformation of the panel subjected to local impact. In this computing model,every fiber layer is simulated by a separate layer of solid finite elements (Figure 2). The number offinite elements in this model is about 1.25 million.

Aerospace 2019, 6, 25 5 of 11
Aerospace 2018, 5, x FOR PEER REVIEW 5 of 12
Figure 1. Stiffened panel with impact damage. a—panel length; b—half panel width or the distance between the stringers; h1—the composite plating thickness; b1, b2, h2—the stringer geometric parameters; h3—the sum of the stringer shelf thickness and the composite plating thickness; h—the sum of stringer height and the composite plating thickness; P—force caused by impactor.
3. Local Dynamic Deformation of the Panel
The finite-element model based on 8-node brick elements SOLID_ORTHO [31] was developed to simulate dynamic deformation of the panel subjected to local impact. In this computing model, every fiber layer is simulated by a separate layer of solid finite elements (Figure 2). The number of finite elements in this model is about 1.25 million.
Figure 2. Fragment of the panel finite-element model. V—the impactor initial velocity, M—the impactor weight.
The weight M and initial velocity V of the dropping pin impacting the panel between stringers with kinetic energy Ek = 140 J are presented in Figure 2. Some results of numerical simulations obtained with LS-Dyna code are shown in Figures 3 and 4. A comparison of contact interaction force P between rod and panel via time obtained in experiment (curve 1) and in simulation (curve 2) is shown in Figure 3. A Dynatup INSTRON 9250 HV (Instron, High Wycombe, UK) pile driver with vertical dropping pin, having a spherical end with a diameter of 25.4 mm, was used to inflict impact damage. It can be seen that there is a small reduction of the contact force at Рexp ~ 6.5 kN and t1 ~ 0.6 ms in the experiment, perhaps due to partial failure of fibers and matrix. The numerical curve also demonstrates some reduction of the contact force at Рnum ~ 12.3 kN at t2 ~ 1.2 ms. In general, numerical and experimental force time histories are close to each other when they grow. At the same time, the maximal level of the numerical force, Рnum max ~ 19.3 kN, exceeds the experimental level, Рexp max ~ 16.1 kN, by ~ 20%. The numerical duration of the impulse also exceeds the experimental one. There is one more curve 3 in Figure 3, obtained for the same level of kinetic energy, Ek = 140 J, and impactor weight of M = 1.7 kg. It can be seen from Figure 3 that the same level of kinetic energy provides a different impulse of the contact force.
Figure 2. Fragment of the panel finite-element model. V—the impactor initial velocity, M—theimpactor weight.
The weight M and initial velocity V of the dropping pin impacting the panel between stringerswith kinetic energy Ek = 140 J are presented in Figure 2. Some results of numerical simulations obtainedwith LS-Dyna code are shown in Figures 3 and 4. A comparison of contact interaction force P betweenrod and panel via time obtained in experiment (curve 1) and in simulation (curve 2) is shown in Figure 3.A Dynatup INSTRON 9250 HV (Instron, High Wycombe, UK) pile driver with vertical dropping pin,having a spherical end with a diameter of 25.4 mm, was used to inflict impact damage. It can be seenthat there is a small reduction of the contact force at Pexp ~ 6.5 kN and t1 ~ 0.6 ms in the experiment,perhaps due to partial failure of fibers and matrix. The numerical curve also demonstrates somereduction of the contact force at Pnum ~ 12.3 kN at t2 ~ 1.2 ms. In general, numerical and experimentalforce time histories are close to each other when they grow. At the same time, the maximal level ofthe numerical force, Pnum max ~ 19.3 kN, exceeds the experimental level, Pexp max ~ 16.1 kN, by ~ 20%.The numerical duration of the impulse also exceeds the experimental one. There is one more curve 3 inFigure 3, obtained for the same level of kinetic energy, Ek = 140 J, and impactor weight of M = 1.7 kg.It can be seen from Figure 3 that the same level of kinetic energy provides a different impulse of thecontact force.Aerospace 2018, 5, x FOR PEER REVIEW 6 of 12
Figure 3. Contact force between impactor and panel. P—force caused by impactor; t—time; Ek—kinetic energy.
Figure 4. Experimental and numerical damage zones.
Figure 4 shows delamination zones defined with acoustic ultrasonic control in four tests (curves 1) and corresponding numerical damage zones obtained for an impactor of M = 15.8 kg (curve 2) and for an impactor of M = 1.7 kg (curve 3).The quantity b is the distance between stringers. A comparison of the test sizes and numerical dimensions of the damage zones are presented in Table 2.
Figure 3. Contact force between impactor and panel. P—force caused by impactor; t—time;Ek—kinetic energy.

Aerospace 2019, 6, 25 6 of 11
Aerospace 2018, 5, x FOR PEER REVIEW 6 of 12
Figure 3. Contact force between impactor and panel. P—force caused by impactor; t—time; Ek—kinetic energy.
Figure 4. Experimental and numerical damage zones.
Figure 4 shows delamination zones defined with acoustic ultrasonic control in four tests (curves 1) and corresponding numerical damage zones obtained for an impactor of M = 15.8 kg (curve 2) and for an impactor of M = 1.7 kg (curve 3).The quantity b is the distance between stringers. A comparison of the test sizes and numerical dimensions of the damage zones are presented in Table 2.
Figure 4. Experimental and numerical damage zones.
Figure 4 shows delamination zones defined with acoustic ultrasonic control in four tests (curve 1)and corresponding numerical damage zones obtained for an impactor of M = 15.8 kg (curve 2) and foran impactor of M = 1.7 kg (curve 3). The quantity b is the distance between stringers. A comparison ofthe test sizes and numerical dimensions of the damage zones are presented in Table 2.
Table 2. The sizes of the damage zone.
Results Experiment Simulation *
Size in X direction 0.64–0.75b 0.65bSize in Y direction 0.63–0.70b 0.88b
* Simulations with M = 15.8 kg.
Curves of dimensionless stresses in the longitudinal direction alone fibers (σ1) and in thetransversal direction (σ2) in the top monolayer (dotted line) and bottom monolayer (solid line) areshown in Figure 5 for two impacts with the same kinetic energy, Ek = 136 J, for two impactors havingmasses of M1 = 1 kg (curve 1) and M2 = 10 kg (curve 2). Top and bottom points in which stresses havecollected are located on the axis of impact. Dimensionless stresses are normalized with correspondingultimate stresses of tension (+) and compression (−) of fibers and matrix. Numerical results show thatbottom fibers maintain strength and top fibers do not for both impactor masses. Failure of the topcompressed fibers for both masses begins at approximately t ~ 0.4–0.5ms. Stress σ2 in the matrix of thetop monolayer does not reach limit stress of compression, however in the bottom monolayer it exceedsthis limit slightly only for mass M2 = 10 kg.
Due to impact loading damage appears in the layers of fibers and between layers. Any fibers canbe ruptured due to tension or destroyed by bending and compression in the layers, and the matrix alsocan be damaged. Modeling technique allows the prediction of sizes of damage zones for both matrixfailure and delamination of layers.

Aerospace 2019, 6, 25 7 of 11
Aerospace 2018, 5, x FOR PEER REVIEW 7 of 12
Table 2. The sizes of the damage zone.
Results Experiment Simulation *) Size in X direction 0.64–0.75b 0.65b Size in Y direction 0.63–0.70b 0.88b
*) Simulations with M = 15.8 kg.
Curves of dimensionless stresses in the longitudinal direction alone fibers ( 1σ ) and in the
transversal direction ( 2σ ) in the top monolayer (dotted line) and bottom monolayer (solid line) are shown in Figure 5 for two impacts with the same kinetic energy, Ek = 136 J, for two impactors having masses of M1 = 1 kg (curves 1) and M2 = 10 kg (curves 2). Top and bottom points in which stresses have collected are located on the axis of impact. Dimensionless stresses are normalized with corresponding ultimate stresses of tension (+) and compression (−) of fibers and matrix. Numerical results show that bottom fibers maintain strength and top fibers do not for both impactor masses. Failure of the top compressed fibers for both masses begins at approximately t ~ 0.4–0.5ms. Stress
2σ in the matrix of the top monolayer does not reach limit stress of compression, however in the bottom monolayer it exceeds this limit slightly only for mass M2 = 10 kg.
Due to impact loading damage appears in the layers of fibers and between layers. Any fibers can be ruptured due to tension or destroyed by bending and compression in the layers, and the matrix also can be damaged. Modeling technique allows the prediction of sizes of damage zones for both matrix failure and delamination of layers.
Figure 5. Stresses in fibers ( 1σ ) and matrix ( 2σ ).
Cross-sections of calculated impact damage zones in the longitudinal direction are presented in Figure 6. The dimensionless sizes of the damage zones are normalized by the distance between stringers—b. It can be seen that loading with the same kinetic energy, Ek = 136 J = const., in two loading cases with rod masses M1 = 1 kg and M2 = 10 kg provides different sizes of damage zones, with the impact of the heavy rod causing an increase of damage areas of 15–20%.
Figure 5. Stresses in fibers (σ1) and matrix (σ2).
Cross-sections of calculated impact damage zones in the longitudinal direction are presentedin Figure 6. The dimensionless sizes of the damage zones are normalized by the distance betweenstringers—b. It can be seen that loading with the same kinetic energy, Ek = 136 J = const., in two loadingcases with rod masses M1 = 1 kg and M2 = 10 kg provides different sizes of damage zones, with theimpact of the heavy rod causing an increase of damage areas of 15–20%.Aerospace 2018, 5, x FOR PEER REVIEW 8 of 12
Figure 6. Impact damage zones in the longitudinal direction. M1, M2—the weights of different impactors; L1—the size of matrix damage area; L2—the size of delamination area.
4. Quasi-Static Compression of the Panel
The impact damage zone is specified as a delaminated area with contact interaction between composite layers with overall sizes preliminarily defined by numerical simulations and ultrasonic control of the panel. The broken fibers and matrix cracks in layers are not included in the computing model. Solving of the problem is carried out with explicit method [27] by slow growing of the edge uniform displacements to exclude dynamic effects. Some numerical results are presented in Figures 7–9.
Dimensionless load–displacement curves are shown in Figure 7 for undamaged panel (curve 1) and for the panel with impact damage (curve 2). The dimensionless load q is normalized with a critical level of compressive load and dimensionless displacement is normalized with the thickness of the plate. The maximal displacement of the undamaged panel grows monotonically. In the panel with local impact damage, displacement demonstrates complicated behavior, caused by the local buckling in the damage zone. As can be seen from Figures 7 and 8, weak bending of the layers with small hardening occurs in the damage area at a load of about 4.0=q . General delamination of
the layers and separation of the stringers begin at a load of 0.1=q , and it follows to the
formation of general transversal buckling folding and defines a carrying capacity of the damaged panel.
The level of the load at which the ultimate compression stress of the fibers is reached in the undamaged panel, 𝑞 = 2.2, is marked by a small cross on curve 1. It can be concluded that the local impact damage zone reduces the carrying capacity of composite panel by more than 50%.
Figure 6. Impact damage zones in the longitudinal direction. M1, M2—the weights of differentimpactors; L1—the size of matrix damage area; L2—the size of delamination area.
4. Quasi-Static Compression of the Panel
The impact damage zone is specified as a delaminated area with contact interaction betweencomposite layers with overall sizes preliminarily defined by numerical simulations and ultrasoniccontrol of the panel. The broken fibers and matrix cracks in layers are not included in the computingmodel. Solving of the problem is carried out with explicit method [27] by slow growing of the edgeuniform displacements to exclude dynamic effects. Some numerical results are presented in Figures 7–9.
Dimensionless load–displacement curves are shown in Figure 7 for undamaged panel (curve 1)and for the panel with impact damage (curve 2). The dimensionless load q is normalized with a criticallevel of compressive load and dimensionless displacement is normalized with the thickness of theplate. The maximal displacement of the undamaged panel grows monotonically. In the panel withlocal impact damage, displacement demonstrates complicated behavior, caused by the local bucklingin the damage zone. As can be seen from Figures 7 and 8, weak bending of the layers with small

Aerospace 2019, 6, 25 8 of 11
hardening occurs in the damage area at a load of about q = 0.4. General delamination of the layersand separation of the stringers begin at a load of q = 1.0, and it follows to the formation of generaltransversal buckling folding and defines a carrying capacity of the damaged panel.Aerospace 2018, 5, x FOR PEER REVIEW 9 of 12
Figure 7. Displacements of undamaged and damaged panels. 𝑞 − dimensionless load; 𝑈 —dimensional displacement; σf—actual compression stress in the fibers, [σc]—ultimate compression stress of the fibers.
Figure 8. Post-buckling deformations of the panel in the transversal and longitudinal directions near the damage area.
The curves of longitudinal strains specific points on the external surface of the panel near the impact damage zone are shown in Figure 9. The numbers of the curves corresponding to the point numbers are presented in Figure 9. The panel is compressed along the line crossing gauges located at points 4–7. Numerical results show that deformations at all points grow nearly linearly to a level of ε ~ 0.26–0.27%, up to a load of 𝑞 = 0.4 − 0.45 . Then, the deformations are changed significantly
with load growing up to the level of 0.1=q . Gauge 2 is located just on the top of the buckling fold crossing the panel in the transverse direction (see Figure 7). That is why, due to extensive
Figure 7. Displacements of undamaged and damaged panels. q—dimensionless load; U—dimensionaldisplacement; σf—actual compression stress in the fibers, [σc]—ultimate compression stress of the fibers.
Aerospace 2018, 5, x FOR PEER REVIEW 9 of 12
Figure 7. Displacements of undamaged and damaged panels. 𝑞 − dimensionless load; 𝑈 —dimensional displacement; σf—actual compression stress in the fibers, [σc]—ultimate compression stress of the fibers.
Figure 8. Post-buckling deformations of the panel in the transversal and longitudinal directions near the damage area.
The curves of longitudinal strains specific points on the external surface of the panel near the impact damage zone are shown in Figure 9. The numbers of the curves corresponding to the point numbers are presented in Figure 9. The panel is compressed along the line crossing gauges located at points 4–7. Numerical results show that deformations at all points grow nearly linearly to a level of ε ~ 0.26–0.27%, up to a load of 𝑞 = 0.4 − 0.45 . Then, the deformations are changed significantly
with load growing up to the level of 0.1=q . Gauge 2 is located just on the top of the buckling fold crossing the panel in the transverse direction (see Figure 7). That is why, due to extensive
Figure 8. Post-buckling deformations of the panel in the transversal and longitudinal directions nearthe damage area.

Aerospace 2019, 6, 25 9 of 11
Aerospace 2018, 5, x FOR PEER REVIEW 10 of 12
bending compression, strain at point 2 is reduced rapidly, passing into tension deformation. A small reduction of compression strains takes place at points 5 and 6 closing to the damage delaminated zone. In the adjacent points 4 and 7 located at the same axis, compression
deformations remain close to the constant level by the load of 0.1=q . Compression strains at points 1 and 3 continue to grow due to additional bending during the formation of the buckle fold.
Figure 9. Strains in tested points near impact damage zone.
A comparison of the obtained numerical results and experimental data is presented in Table 3. Compression tests of the panels were implemented with MTS500 automatic hydraulic test bench (PCE Group CO KG, Meschede, Germany) with a maximal load of 5000 kN and measuring accuracy of 1%. Strain measurement was conducted with CTMM strain gage equipment.
One can see that the calculated strains agree with measured ultimate deformations corresponding to the carrying capacity level of the damaged panel.
Table 3. Longitudinal strains ε near damage zone (𝑞 − dimensionless load).
Load q Points Experimental ε,% Numerical ε, %
1.0
1 −0.45 −0.44 3 −0.48 −0.45 4 −0.26 −0.25 7 −0.30 −0.27
5. Conclusions
1. A complex modeling technique has been developed on the basis of the LS-Dyna code for the prediction of local impact damage and its influence on the carrying capacity of a compressed flat stiffened composite panel. The numerical analysis shows that local buckling of delaminated fibers in impact damage zone is one of the main reasons for a significant reduction of the carrying capacity of the compressed FRP stiffened panel.
2. The validity of the modeling technique was confirmed by the agreement between the numerical and experimental results. The maximal dynamic force and impulse duration in the simulation of local impact exceed experimental data by no more than ~20%. The numerical and experimental sizes of the impact damage zone are ~0.7b and close to each other. These predictions could be quite acceptable for preliminary engineering analysis.
Figure 9. Strains in tested points near impact damage zone.
The level of the load at which the ultimate compression stress of the fibers is reached in theundamaged panel, q = 2.2, is marked by a small cross on curve 1. It can be concluded that the localimpact damage zone reduces the carrying capacity of composite panel by more than 50%.
The curves of longitudinal strains specific points on the external surface of the panel near theimpact damage zone are shown in Figure 9. The numbers of the curves corresponding to the pointnumbers are presented in Figure 9. The panel is compressed along the line crossing gauges locatedat points 4–7. Numerical results show that deformations at all points grow nearly linearly to a levelof ε ~ 0.26–0.27%, up to a load of q = 0.4–0.45. Then, the deformations are changed significantlywith load growing up to the level of q = 1.0. Gauge 2 is located just on the top of the buckling foldcrossing the panel in the transverse direction (see Figure 7). That is why, due to extensive bendingcompression, strain at point 2 is reduced rapidly, passing into tension deformation. A small reductionof compression strains takes place at points 5 and 6 closing to the damage delaminated zone. In theadjacent points 4 and 7 located at the same axis, compression deformations remain close to the constantlevel by the load of q = 1.0. Compression strains at points 1 and 3 continue to grow due to additionalbending during the formation of the buckle fold.
A comparison of the obtained numerical results and experimental data is presented in Table 3.Compression tests of the panels were implemented with MTS500 automatic hydraulic test bench (PCEGroup CO KG, Meschede, Germany) with a maximal load of 5000 kN and measuring accuracy of 1%.Strain measurement was conducted with CTMM strain gage equipment.
Table 3. Longitudinal strains ε near damage zone (q—dimensionless load).
Load q Points Experimental ε, % Numerical ε, %
1.0
1 −0.45 −0.443 −0.48 −0.454 −0.26 −0.257 −0.30 −0.27
One can see that the calculated strains agree with measured ultimate deformations correspondingto the carrying capacity level of the damaged panel.

Aerospace 2019, 6, 25 10 of 11
5. Conclusions
1. A complex modeling technique has been developed on the basis of the LS-Dyna code for theprediction of local impact damage and its influence on the carrying capacity of a compressedflat stiffened composite panel. The numerical analysis shows that local buckling of delaminatedfibers in impact damage zone is one of the main reasons for a significant reduction of the carryingcapacity of the compressed FRP stiffened panel.
2. The validity of the modeling technique was confirmed by the agreement between the numericaland experimental results. The maximal dynamic force and impulse duration in the simulation oflocal impact exceed experimental data by no more than ~20%. The numerical and experimentalsizes of the impact damage zone are ~0.7b and close to each other. These predictions could bequite acceptable for preliminary engineering analysis.
3. The fixed level of the kinetic energy of Ek = const. is not a fully correct measure of local damagefor FRP stiffened panel, since the decrease of the impactor weight and keeping Ek = const. causedecreasing sizes of damage zone.
4. Quasi-static simulation of the damaged panel at the stage of longitudinal compressionallows the prediction of the ultimate longitudinal strains near the impact damage zone:εnum = −0.25 to −0.48%, which are close to the experimental levels: εexp = −0.27% to −0.45%,corresponding to the carrying load of the FRP panel.
5. The obtained numerical results show that the local impact damage zone can reduce the carryingcapacity of the compressed composite panel by more than 50% compared to the undamagedcomposite panel.
Author Contributions: Conceptualization, A.A.R., D.Y.S. and V.G.S.; Methodology, A.A.R.; Validation, E.E.M.;Formal Analysis, D.Y.S. and V.G.S.; Investigation, A.A.R. and E.E.M.; Writing-Original Draft Preparation A.A.R.;Writing-Review & Editing, A.A.R.
Funding: This research received no external funding.
Acknowledgments: The authors thank for experimental results kindly provided by Russian Federal CentralAero-Hydrodynamic Institute.
Conflicts of Interest: The authors declare no conflict of interest.
References
1. Bolotin, B.V.; Novichkov, Y.N. Mechanics of Multilayers Structures; Mashinostroenie: Moscow, Russia, 1980.(In Russian)
2. Vasiliev, V.V.; Morozov, E.V. Mechanics and Analysis of Composite Materials; Elsevier Science Ltd.: Amsterdam,The Netherlands, 2001.
3. Abrosimov, N.A.; Bazhenov, V.G. Nonlinear Problems of Dynamics of the Composite Structures; NNSU:Nizhny Novgorod, Russia, 2002; 400p. (In Russian)
4. Ladeveze, P.; Le Dantec, E. Damage modeling of the elementary ply for laminated composites.Compos. Sci. Technol. 1992, 43, 257–267. [CrossRef]
5. Kenane, M.; Benzeggagh, M.L. Mixed-mode delamination fracture toughness of unidirectional glass/epoxycomposites under fatigue loading. Compos. Sci. Technol. 1997, 57, 597–605. [CrossRef]
6. Zinoviev, P.A.; Grigoriev, S.V.; Lebedeva, O.V.; Tairova, L.P. The strength of multilayered composites under aplane-stress state. Compos. Sci. Technol. 1998, 57, 1209–1223. [CrossRef]
7. Camanho, P.P.; Da’vila, C.G.; Pinho, S.T.; Iannucci, L.; Robinson, P. Prediction of in situ strengths and matrixcracking in composites under transverse tension and in-plane shear. Compos. Part A Appl. Sci. Manuf. 2006,37, 165–176. [CrossRef]
8. Da´vila, C.; Camanho, P.P.; Turon, A. Effective simulation of delamination in aeronautical structures usingshells and cohesive elements. J. Aircr. 2008, 45, 663–672. [CrossRef]
9. Krueger, R.; Ratcliffe, J.G.; Minguet, P.J. Panel stiffener debonding analysis using a shell/3D modelingtechnique. Compos. Sci. Technol. 2009, 69, 2352–2362. [CrossRef]

Aerospace 2019, 6, 25 11 of 11
10. Gutkin, R.; Pinho, S.T.; Robinson, P.; Curtis, P.T. On the transition from shear-driven fiber compressive failureto fiber kinking in notched CFRP laminates under longitudinal compression. Compos. Sci. Technol. 2010, 70,1223–1231. [CrossRef]
11. Backer, A.; Dutton, S.; Kelly, D. Composite Materials for Aircraft Structures, 2nd ed.; American Institute ofAeronautic and Astronautic, Inc.: Reston, VA, USA, 2004.
12. Ostergaard, M.G.; Ibbotson, A.R.; Le Roux, O.; Prior, A.M. Virtual Testing of Aircraft Structures.CEAS Aeronaut. J. 2011, 1, 83–103. [CrossRef]
13. Clark, G.; Saunders, D.S. Morphology of Impact Damage Growth by Fatigue in Carbon Fiber CompositeLaminates. Mater. Forum 1991, 15, 333–342.
14. Naganarayana, B.P.; Atluri, S.N. Computational Model for Analysis Interactive Buckling and DelaminationGrowth in Composite Structures. Sadhana Acad. Proc. Eng. Sci. 1996, 21, 547–575.
15. Reeder, J.R.; Kyongchan, S.; Chunchu, P.B.; Ambur, D.R. Postbuckling and Growth of Delaminationsin Composite Plates Subjected to Axial Compression. In Proceedings of the AIAA 2002-1746,43rd AIAA/ASME/ASCE/AHS/ASC Structures, Structural Dynamics, and Material Co-LocatedConferences, Denver, CO, USA, 22–25 April 2002.
16. Patel, B.P.; Gupta, A.K. An investigation on nonlocal continuum damage models for composite laminatedpanels. Compos. B Eng. 2014, 60, 485–494. [CrossRef]
17. Wan, Y.; Sun, B.; Gu, B. Multi-scale structure modeling of damage behaviors of 3D orthogonal wovencomposite materials subject to quasi-static and high strain rate compression. Mech. Mater. 2016, 94, 1–25.[CrossRef]
18. Cantwell, W.; Morton, J. An assessment of residual strength of an impact damaged carbon-fiber reinforcedepoxy. Compos. Struct. 1990, 14, 303–317. [CrossRef]
19. Hull, D.; Shi, B.Y. Damage mechanism characterization in composite damage tolerance investigations.Compos. Struct. 1993, 23, 99–120. [CrossRef]
20. Davies, G.A.; Zhang, X. Impact Damage Predictions in Carbon Composite Structures. J. Impact Eng. 1995, 16,149–170. [CrossRef]
21. Greenhalgh, E.; Bishop, S.M.; Braz, D.; Hughes, D.; Lahiff, S.; Millson, B. Characterization of impact damagein skin-stringer composite structures. Compos. Struct. 1996, 36, 187–207. [CrossRef]
22. Zhang, X. Impact Damage in Composite Aircraft Structures—Experimental Testing and NumericalSimulation. J. Aerosp. Eng. 1998, 212, 245–259. [CrossRef]
23. Rajbhandari, S.P.; Scott, M.L.; Thomson, R.S. An Approach to Modelling and predicting Impact Damage inComposite Structures. In Proceedings of the ICAS 2002 Congress, Toronto, ON, Canada, 8–13 September 2002.
24. Imielinska, K.; Wojtyra, R.; Kozlowski, M. On Delamination Threshold Loads in Low Velocity Impact onGlass-Carbon/Epoxy Composites. Kompozyty (Compos.) 2005, 5, 69–74.
25. Olsson, R. Modelling of impact damage zone in composite laminates for strength after impact. Aeronaut. J.2012, 116, 1349–1365. [CrossRef]
26. Al-Hadrayi Ziadoon, M.R.; Zhou, C. Effect the Stacking Sequences of Composite Laminates under LowVelocity Impact on Failure Modes by Using Carbon Fiber Reinforced Polymer. Int. J. Eng. Sci. (IJES) 2016,5, 53–62.
27. Bazhenov, V.G.; Demareva, A.V.; Zhestkov, M.N.; Kibets, A.I. Special features of numerical simulation forelastic-plastic buckling of hemispherical shells under loading with the rigid indenter. PNRPU Mech. Bull.2016, 2, 22–33. [CrossRef]
28. Belytschko, T.; Liu, W.K.; Moran, B. Nonlinear Finite Elements for Continua and Structures; John Wiley & Sons:New York, NY, USA, 2000; 600p.
29. Washizu, K. Variational Methods in Elasticity and Plasticity; Pergamon Press: Oxford, UK, 1982.30. Chang, F.K.; Chang, K.Y. A progressive damage model for laminated composites containing stress
concentrations. J. Compos. Mater. 1987, 21, 834–855. [CrossRef]31. Hallquist John, O. LS-DYNA Theory Manual LSTC; Livermore Software Technology Corporation: Livermore,
CA, USA, 2017.
© 2019 by the authors. Licensee MDPI, Basel, Switzerland. This article is an open accessarticle distributed under the terms and conditions of the Creative Commons Attribution(CC BY) license (http://creativecommons.org/licenses/by/4.0/).