
Thermal Design of Humidification Dehumidification Systems ...
286
Thermal Design of Humidification Dehumidification Systems for Affordable and Small-scale Desalination by Prakash Narayan Govindan B.E. Mechanical Engineering Sri Venkateswara College of Engineering, Anna University (2005) and MA M.Tech. Mechanical Engineering Indian Institute of Technology - Madras (2007) L Submitted to the Department of Mechanical Engineering SACHUSFTTS INSTrTE OF TECi M'L3Y OCT 2 2 2012 LIBRARIES in partial fulfillment of the requirements for the degree of Doctor of Philosophy in Mechanical Engineering at the MASSACHUSETTS INSTITUTE OF TECHNOLOGY September 2012 @ Massachusetts Institute of Technology 2012. All rights reserved. A uthor .................................... ......................... me1 ,nt o echanica n ng ,J-u4 712 Certified by S........ Collins.. .. Samuel C. Collins rfeor John H. Lienhard V of Mechanical Engineering So es.pervisor Accepted by ............. . David E. Hardt Chairman of Graduate Studies Department of Mechanical Engineering
-
Upload
khangminh22 -
Category
Documents
-
view
1 -
download
0
Transcript of Thermal Design of Humidification Dehumidification Systems ...
Thermal Design of Humidification
Dehumidification Systems for Affordable and
Small-scale Desalinationby
Prakash Narayan Govindan
B.E. Mechanical EngineeringSri Venkateswara College of Engineering, Anna University (2005)
and MA
M.Tech. Mechanical EngineeringIndian Institute of Technology - Madras (2007) L
Submitted to the Department of Mechanical Engineering
SACHUSFTTS INSTrTEOF TECi M'L3Y
OCT 2 2 2012
LIBRARIES
in partial fulfillment of the requirements for the degree of
Doctor of Philosophy in Mechanical Engineering
at the
MASSACHUSETTS INSTITUTE OF TECHNOLOGY
September 2012
@ Massachusetts Institute of Technology 2012. All rights reserved.
A uthor .................................... .........................me1 ,nt o echanica n ng
,J-u4 712
Certified by S.... .... Collins.. ..
Samuel C. Collins rfeor
John H. Lienhard Vof Mechanical Engineering
So es.pervisorAccepted by ............. .
David E. HardtChairman of Graduate Studies
Department of Mechanical Engineering

2
Thermal Design of Humidification Dehumidification Systems
for Affordable and Small-scale Desalination
by
Prakash Narayan Govindan
Submitted to the Department of Mechanical Engineeringon July 26, 2012, in partial fulfillment of the
requirements for the degree ofDoctor of Philosophy in Mechanical Engineering
Abstract
The humidification dehumidification (HDH) technology is a carrier-gas-based thermaldesalination technique ideal for application in a small-scale system but, currently, hasa high cost of water production (about 30 $/m 3 of pure water produced). The presentthesis describes fundamental contributions to the thermal design of HDH systemsthat have made them affordable (< 5 $/m 3). These contributions include: (1) thedevelopment of thermal design algorithms for thermodynamic balancing via massextractions and injections; (2) design of a bubble column dehumidifier for high heatand mass transfer rates even in the presence of a large percentage of non-condensablegas; and (3) optimization of system design with pressure as a parameter.
Definition of a novel non-dimensional parameter known as the 'modified heatcapacity rate ratio' (HCR) has enabled designs that minimize the imbalance in localdriving temperature and concentration differences. The design algorithm has beenvalidated by experimental data from a pilot-scale HDH unit constructed as part of thethesis work. The energy consumption of HDH was reduced by 55% by this technique.
Bubble column (BC) heat exchangers can have high heat and mass transfer ratesby condensing the vapor-gas mixture in a column of liquid rather than on a coldsurface. New physical understanding of heat transfer in BCs has led to low pressuredrop designs (< 1 kPa) and the concept of multistaging the uniform temperature col-umn in several temperature steps has led to high effectiveness designs (about 90%).A prototype with an order of magnitude higher heat rate compared to existing de-humidifiers operating in the film condensation regime was developed to validate thephysical models.
Overall cost of water production in HDH can be further reduced by treatingpressure as a variable parameter. Systems operating under varied pressure consumehalf the energy as existing HDH systems.
Thesis Supervisor: John H. Lienhard VTitle: Samuel C. Collins Professor of Mechanical Engineering
3

I would like to dedicate this doctoral dissertation to my mother and
father - Malathy and Govindan. There is no doubt in my mind that
without their continued support I could not have gotten this far.
4
Acknowledgments
It has been a terrific four years at MIT for me and I have several people to thank
for that. There could not have been a better thesis supervisor for me than Professor
John Lienhard. I dedicate all accolades I received during my PhD work to him1 . I
also thank him for providing me with a transformative amount of self-confidence.
Professor Syed Zubair has been a great pillar of support and strength. I could not
have asked for a better mentor to collaborate with. I would like to thank Professor
Bora Mikic for giving me advise throughout my PhD. I especially thank him for
teaching 2.55 in the unique and awesome way he does and separately, for incepting
the idea of direct contact condensation in me. I am indebted to Mr. Leon Awerbuch
for being a great advisor for me. I consider myself lucky for having the foremost
expert on desalination as a mentor. I am grateful to Professor Alexander Mitsos for
giving me advise whenever I needed it. I also thank him for being my co-author in
the optimization paper presented at IIT Madras.
Professor Sarit Das, my Master's thesis advisor and mentor, visited MIT in 2011
(when my research was going through a bit of a slump) and he energized me. I owe
him a great deal for all that he is done for me during that period and beyond. I am
thankful to Professor Peter Griffith for spending time with me from time-to-time and
sharing with me the decades of wisdom he has on design of thermal systems.
Dr. Mostafa was the post-doc in the group when I first joined MIT and was
extremely supportive and taught me several things. I owe him my gratitude. I am
especially thankful for the help he later provided in design of the bubble column
experiment.
I have had the oppurtunity to work with some terrific MIT undergrads including
Yoshio Perez, Steven Lam, Maximuss St. John, Victor Nevarez and Jeff Huang. I
appreciate their efforts and hard work for the project and thank them for working
with me. I m sure they will go on to become very successful in their careers. I am
'Including the best paper award at the IDA world water congress 2011, MIT Legatum Fellowship
for Development and Entrepreneurship, the deFlorez prize for graduate design 2012, all the papers
and patent disclosures
5

excited by the oppurtunity to further work with Steven and Max during the coming
year. Many thanks to Karim Chehayeb for working with me over the last year from
AUB and at MIT as an exchange student on the balancing project. I wish him all
the best with his graduate studies at MIT!
I would like to express my whole hearted thanks to all co-authors in all of my
papers including Ronan McGovern, Karan Mistry, Greg Thiel, Jacob Miller, Fahad
Al-Sulaiman and Ed Summers. Thanks for working with me and greatly contributing
to the project! My thanks to Professor Antar for being a great collaborator and
co-author. I would like to thank Professor Amro Al Qutub for reviving the idea of
varied pressure HDH systems. I am indebted to Shanon Liburd, Anand Palapally,
Leo Banchik, Moe Mirhi, Martin Sievers, Jacob Miller, Anurag Bajpayee and all
previously mentioned members of the Lienhard group for being so patient with me
and for being such a fun group.
Thanks to my friends at MIT - Jongho, Chintoo, Sourabh, Amith, Sam Davis,
Meggy, Gaurav - for keeping me sane for four years. Special thanks to Sourabh for
helping me with the title for the thesis and to Meggy for proof reading my thesis for
language errors. Many thanks to the awesome adminstrative staff at MIT - Leslie,
Una, Joan, Angela Mickunas, Kate, Laura, Meghan Moore, Christine Gervais and
Christine Smaldone.
I would like to thank the wonderful couple at Yoga 24x7 - Aravind and Krishna
Priya - for being my spiritual mentors.
I would like to thank my brother - Prasad - for always being there for me! I would
like to thank my soon-to-be-wife, Aishwarya for being the best partner anybody can
ever have. Thank you all!
Last but not least, I would like to thank the King Fahd University of Petroleum
and Minerals for funding the research reported in this thesis through the Center for
Clean Water and Clean Energy at MIT and KFUPM (project # R4-CW-08).
6
Contents
1 Introduction
Global water problem. . . . . . . . . . . . . . . . . . . . . . . . . .
1.1 Conventional desalination technologies . . . . . . . . . . . . .
1.2 Humidification Dehumidification (HDH) . . . . . . . . . . . .
1.3 Organization of the thesis . . . . . . . . . . . . . . . . . . . .
2 Technology review
2.1 Review of systems in literature . . . . . . . . . . . . . . . . .
2.1.1 Closed-air open-water (CAOW) water heated systems
2.1.2 Closed-water open-air (CWOA) water heated systems
2.1.3 Closed-air open-water (CAOW) air heated systems
2.1.4 HDH systems with mass extractions and injections
2.2 Alternate cycles resembling the HDH process . . . . . . .
2.2.1 Dew-vaporation technique . . . . . . . . . . . . .
2.2.2 Diffusion-driven desalination technique . . . . . .
2.2.3 Atmospheric water vapor processers . . . . . . . .
2.3 Review of components in the HDH system . . . . . . . .
2.3.1 Humidifiers . . . . . . . . . . . . . . . . . . . . .
2.3.2 Dehumidifiers . . . . . . . . . . . . . . . . . . . .
2.4 Performance benchmarking of HDH systems . . . . . . .
2.5 Unanswered questions . . . . . . . . . . . . . . . . . . .
7
31
31
33
36
38
41
42
43
47
. . . . . . 50
. . . . . . 54
. . . . . . 57
. . . . . . 57
. . . . . . 58
. . . . . . 59
. . . . . . 60
. . . . . . 60
. . . . . . 62
. . . . . . 64
. . . . . . 65
3 Thermal design of simultaneous heat and mass exchange (HME)
devices
3.1 Control volume models ...... ..........................
3.1.1 New heat and mass exchanger (HME) terminology ......
3.1.2 Equations and modeling details .................
3.1.3 Solution technique . . . . . . . . . . . . . . . . . . . . . . . .
3.2 Control volume based second law based design of HME devices . . .
3.2.1 Expressions for entropy generation . . . . .
3.2.2 Condition for minimum entropy generation
3.2.3 Section summary . . . . . . . . . . . . . . .
3.3 Applicability of energy effectiveness . . . . . . . .
3.3.1 Heat exchangers . . . . . . . . . . . . . . . .
3.3.2 Direct contact heat and mass exchangers . .
3.3.3 Indirect contact heat and mass exchangers .
3.4 Chapter conclusions . . . . . . . . . . . . . . . . . .
. . . . . . . . 82
. . . . . . . . 87
. . . . . . . . 92
. . . . . . . . 93
. . . . . . . . 93
. . . . . . . . 94
. . . . . . . . 99
. . . . . . . . 100
4 Theoretical control-volume based analysis of existing embodiments
of the HDH system
4.1 Water heated HDH cycle . . . . . . . . . . . . . . . .
4.1.1 Effect of relative humidity of the air entering
humidfier (4a,1, #a,2). .... ................
4.1.2 Effect of component effectiveness (Eh, ed). . . .
4.1.3 Effect of top temperature (Tw, 2) . . . . . . . .
4.1.4 Effect of bottom temperature (TW,o). . . . . .
4.2 Single and multi-stage air heated cycle . . . . . . . .
4.3 Chapter conclusions . . . . . . . . . . . . . . . . . . .
and exiting the
5 Thermodynamic balancing of HME devices and the HDH system
mass extraction and injection
5.1 Thermal balancing in simultaneous heat and mass transfer devices
5.1.1 'Control volume' balancing . . . . . . . . . . . . . . . . . .
103
105
105
108
108
111
113
114
by
117
118
118
8
67
67
70
76
80
81

5.1.2 Enthalpy pinch: novel parameter to define performance of HME
device . . . . . . . . . . . . . . . . . . . . . . . . . . . . . . .
5.1.3 Mass extractions or injections based balancing . . . . . . . . .
5.1.4 Functional form for continuous thermodynamic balancing . .
5.2 Modeling of HDH systems . . . . . . . . . . . . . . . . . . . . . . . .
5.2.1 System without extractions . . . . . . . . . . . . . . . . . . .
5.2.2 System with infinite extractions and injections . . . . . . . . .
5.2.3 System with a single extraction and injection . . . . . . . . .
5.2.4 Property packages . . . . . . . . . . . . . . . . . . . . . . . .
5.3 Results and discussion . . . . . . . . . . . . . . . . . . . . . . . . . .
5.3.1 Continuous extractions with "infinitely large" HME devices:
the upper limit on HDH performance . . . . . . . . . . . . . .
5.3.2 Effect of finite system size . . . . . . . . . . . . . . . . . . . .
5.3.3 Uncertainty associated with 'saturated air' approximation . .
5.3.4 Comparison of dehumidifier balanced and humidifier balanced
systems . . . . . . . . . . . . . . . . . . . . . . 139
5.3.5 Effect of number of extractions . . . . . . . . . .
5.4 Chapter conclusions . . . . . . . . . . . . . . . . . . . . .
6 Experimental investigation of thermal design of HME
HDH systems
6.1 Control volume balancing of HME devices . . . . . . . .
6.1.1 Experimental details . . . . . . . . . . . . . . . .
6.1.2 Results . . . . . . . . . . . . . . . . . . . . . . . .
6.1.3 Section conclusions . . . . . . . . . . . . . . . . .
6.2 HDH system experiments . . . . . . . . . . . . . . . . . .
6.2.1 Effect of mass flow rate ratio . . . . . . . . . . . .
6.2.2 Effect of top brine temperature . . . . . . . . . .
6.2.3 Effect of feed water temperature . . . . . . . . . .
6.2.4 Effect of mass extraction and injection . . . . . .
141
144
devices and
149
. . . . . . . 152
. . . . . . . 152
. . . . . . . 154
. . . . . . . 156
. . . . . . . 157
. . . . . . . 160
. . . . . . . 160
. . . . . . . 162
. . . . . . . 162
9
120
124
127
129
129
131
131
133
133
135
137
137

6.2.5 Peak Performance of the pilot HDH system . .
6.3 Chapter conclusions . . . . . . . . . . . . . . . . . . . .
167
167
7 Mechanical compression driven varied pressure HDH system 169
7.1 Variable pressure HDH cycle . . . . . . . . . . . . . . . . . . . . . . . 170
7.2 Terminology used . . . . . . . . . . . . . . . . . . . . . . . . . . . . . 172
7.2.1 Isentropic efficiency . . . . . . . . . . . . . . . . . . . . . . . . 172
7.2.2 System and performance parameters . . . . . . . . . . . . . . 173
7.3 Equations and modeling details . . . . . . . . . . . . . . . . . . . . . 174
7.3.1 Compressor . . . . . . . . . . . . . . . . . . . . . . . . . . . . 174
7.3.2 Expander . . . . . . . . . . . . . . . . . . . . . . . . . . . . . 175
7.4 Results and discussions . . . . . . . . . . . . . . . . . . . . . . . . . . 175
7.4.1 Parametric study . . . . . . . . . . . . . . . . . . . . . . . . . 175
7.4.2 Selection of expansion device. . . . . . . . . . . . . . . . . . . 181
7.5 Comparison with other HDH cycles . . . . . . . . . . . . . . . . . . . 183
7.6 Chapter conclusions . . . . . . . . . . . . . . . . . . . . . . . . . . . . 184
8 Thermal compression driven hybrid HDH-RO system 187
8.1 Reversible entrainment efficiency of the TVC . . . . . . . . . . . . . . 193
8.1.1 System and performance parameters . . . . . . . . . . . . . . 193
8.2 Equations and modeling details . . . . . . . . . . . . . . . . . . . . . 195
8.3 A typical embodiment of the novel cycle . . . . . . . . . . . . . . . . 197
8.4 Results and discussions . . . . . . . . . . . . . . . . . . . . . . . . . . 198
8.4.1 Effect of using an expander and a RO unit for additional water
production . . . . . . . . . . . . . . . . . . . . . . . . . . . . .
8.4.2 Effect of heating steam conditions . . . . . . . . . . . . . . .
8.4.3 Effect of pressure ratio . . . . . . . . . . . . . . . . . . . . . .
8.4.4 Effect of operating pressures . . . . . . . . . . . . . . . . . . .
8.4.5 Effect of air side pressure drop in heat and mass exchangers .
8.5 Comparison with existing desalination techniques. . . . . . . . . . . .
8.6 Chapter conclusions . . . . . . . . . . . . . . . . . . . . . . . . . . . .
198
199
204
204
207
209
211
10

9 Multi-stage bubble columns for high heat rate dehumidification
9.1 Predictive model for combined heat and mass transfer ........
9.1.1 Thermal resistance between the liquid in the column and the
coil surface . . . . . . . . . . . . . . . . . . . . . . . . . . . .
9.1.2 Thermal resistance between the liquid in the column and the
bubbles . . . . . . . . . . . . . . . . . . . . . . . . . . . . . .
9.1.3 Evaluation of total heat flux from the resistance model . . . .
9.2 Experimental details . . . . . . . . . . . . . .
9.3 Results and discussion . . . . . . . . . . . . .
9.3.1 Effect of superficial velocity . . . . . .
9.3.2 Effect of bubble diameter . . . . . . . .
9.3.3 Effect of inlet mole fraction . . . . . .
9.3.4 Effect of liquid column height . . . . .
9.3.5 Comparison of model and experiments
9.3.6 Effect of bubble-on-coil impact . . . .
9.4 Effect of multi-staging . . . . . . . . . . . . .
9.4.1 Prototype . . . . . . . . . . . . . . . .
9.4.2 Comparison with existing devices . . .
. . . . . . . . . . 226
. . . . . . . . . . 228
. . . . . . . . . . 230
. . . . . . . . . . 232
. . . . . . . . . . 232
. . . . . . . . . . 234
. . . . . . . . . . 234
. . . . . . . . . . 236
. . . . . . . . . . 236
. . . . . . . . . . 239
. . . . . . . . . . 243
9.5 Chapter conclusions . . . . . . . . . . . . . . . . . . . . . . . . . . . . 243
10 Conclusions 245
10.1 Component design . . . . . . . . . . . . . . . . . . . . . . . . . . . . 245
10.2 HDH system design . . . . . . . . . . . . . . . . . . . . . . . . . . . . 246
A Calculation of reversible GOR for HDH 263
B Entropy generation in a counterflow cooling tower 265
C Algorithms for modeling HDH systems with and without thermo-
dynamic balancing 269
D Cost of water production in HDH system proposed in this thesis 273
11
213
214
216
221
223

E Helium as carrier gas in HDH systems 277
E.1 Rationale for selecting helium ...... ...................... 277
E.1.1 Thermophysical properties ..... .................... 278
E.1.2 Psychrometric properties ..................... 278
E.1.3 Estimate of gas side heat transfer coefficient in the dehumidifier 280
E.1.4 Gas side pressure drop in the dehumidifier . . . . . . . . . . . 282
E.2 Thermodynamic cycle for HDH desalination . . . . . . . . . . . . . . 282
E.3 Relative thermodynamic performance of helium based cycles . . . . . 283
E.4 Chapter conclusions . . . . . . . . . . . . . . . . . . . . . . . . . . . . 285
12

List of Figures
1-1 World map showing areas of physcial and economic water scarcity [1]. 32
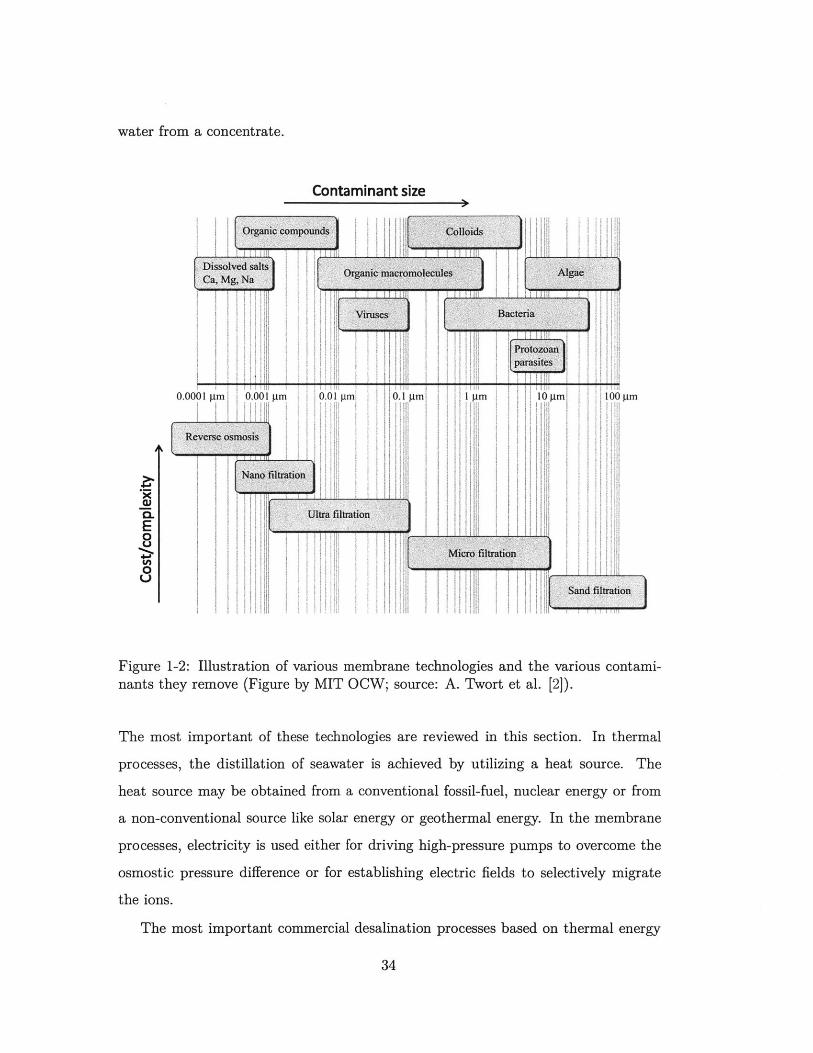
1-2 Illustration of various membrane technologies and the various contam-
inants they remove (Figure by MIT OCW; source: A. Twort et al.
[2]). . . . . . . . . . . . . . . . . . . . . . . . . . . . . . . . . . . . . 34
1-3 Simplest embodiment of HDH process. . . . . . . . . . . . . . . . . . 37
2-1 Classification of HDH systems based on cycle configurations. . . . . . 42
2-2 Water heated CAOW HDH process on psychometric chart. . . . . . . 44
2-3 Water heated CWOA HDH process on psychometric chart. . . . . . . 48
2-4 Single stage air heated CAOW HDH process on psychometric chart. . 51
2-5 Three stage air heated CAOW HDH process on psychometric chart. . 52
2-6 Schematic diagram of a water-heated, closed-air, open-water humidification-
dehumidification desalination system with mass extraction and injec-
tion of the moist air stream. . . . . . . . . . . . . . . . . . . . . . . . 55
2-7 Dew-vaporation process. . . . . . . . . . . . . . . . . . . . . . . . . . 58
2-8 Performance of HDH systems in literature. . . . . . . . . . . . . . . . 65
3-1 Psychometric chart illustrating an example of the Second Law limits
on a counterflow cooling tower operation. . . . . . . . . . . . . . . . . 71
3-2 Maximum value of effectiveness versus exit relative humidity for a cool-
ing tower: T,, = 55'C; Ta,i = 34*C; 4; = 100; p = 100 kPa. . . . . . 75
3-3 Control volume for counterflow cooling tower. . . . . . . . . . . . . . 77
3-4 Control volume for counterflow dehumidifier. . . . . . . . . . . . . . . 79
3-5 Control volume for a heat exchanger. . . . . . . . . . . . . . . . . . . 82
13
3-6 Non-dimensional entropy generation versus heat capacity rate ratio for
counterflow heat exchangers; 'h= 0.5 . . . . . . . . . . . . . . . . . 84
3-7 Mass flowrate ratio versus non-dimensional entropy generation; T,i =
34*C; e = 0.8; #0, = 0.9; #i = 0.6; P = 100 kPa. . . . . . . . . . . . . 88
3-8 Effect of water inlet temperature on entropy generation; T,i = 340C;
e = 0.8; #,, = 0.9; #i = 0.6; Th,in/ahda = 1.2 - 29; P = 100 kPa. . . . 90
3-9 Effect of air inlet temperature on entropy generationr; T,, = 55*C;
e = 0.8; 0 =0.6; 0.8; 0 i 20,i/; = 1.2 - 29; P = 100 kPa. . . . 90
3-10 Effect of outlet air relative humidity on entropy generation in a cooling
tower; T.,i = 50*C; T,i = 34*C; e = 0.7; #i = 0.5; ,i2 /rhda =
1.2 - 29; P = 100 kPa. . . . . . . . . . . . . . . . . . . . . . . . . . . 91
3-11 Effect of inlet air relative humidity on entropy generation in a cooling
tower; T.,i = 50*C; Ta,i = 34*C; e = 0.7; #0, = 0.9; fie,in/hda =
1.2 - 29; P = 100 kPa. . . . . . . . . . . . . . . . . . . . . . . . . . . 91
3-12 Effect of air side pressure drop on entropy generation in a cooling tower;
Tm,i = 50*C; Ta,i = 34*C; e = 0.7; , = 0.9; #i = 0.6; Tfw,in/ada =
1.2 - 29; P = 100 kPa. . . . . . . . . . . . . . . . . . . . . . . . . . . 92
3-13 Comparison of different effectiveness definitions in a counterflow hu-
midifier with saturated air at the inlet and when moist air is the min-
imum heat capacity stream (HCR < 1). . . . . . . . . . . . . . . . . . 95
3-14 Comparison of different effectiveness definitions in a counterflow hu-
midifier when water is the minimum heat capacity stream (HCR > 1). 96
3-15 Comparison of different effectiveness definitions in a counterflow hu-
midifier at thermally balanced condition (HCR = 1). . . . . . . . . . 97
3-16 Comparison of different effectiveness definitions at thermally balanced
condition (HCR = 1) for counterflow humidifier with air entering hot-
ter than water. . . . . . . . . . . . . . . . . . . . . . . . . . . . . . . 98
3-17 Comparison of different effectiveness definitions at thermally balanced
condition (HCR = 1) for counterflow dehumidifier. . . . . . . . . . . . 99
14

4-1 Schematic diagram of water heated closed air open water HDH cycle. 106
4-2 Effect of relative humidity on performance of the WH-CAOW HDH
cycle. . . . . . . . . . . . . . . . . . . . . . . . . . . . . . . .. . . . 107
4-3 Effect of component effectiveness of humidifier on performance of the
WH-CAOW HDH cycle. . . . . . . . . . . . . . . . . . . . . . . . . . 107
4-4 Effect of component effectiveness of dehumidifier on performance of
the WH-CAOW HDH cycle. . . . . . . . . . . . . . . . . . . . . . . . 109
4-5 Effect of top brine temperature on performance of the WH-CAOW
HDH cycle. . . . . . . . . . . . . . . . . . . . . . . . . . . . . . . . . 110
4-6 HCR of dehumidifer versus GOR at various top brine temperatures. 110
4-7 HCR of humidifier versus GOR at various top brine temperatures. . 111
4-8 Effect of feedwater temperature on performance of the WH-CAOW
HDH cycle. . . . . . . . . . . . . . . . . . . . . . . . . . . . . . . . . 112
4-9 HCR of dehumidifer versus GOR at various feedwater temperatures. . 112
4-10 HCR of humidifier versus GOR at various feedwater temperatures. . . 113
4-11 Effect of number of stages on performance of air heated CAOW HDH
system . . . . . . . . . . . . . . . . . . . . . . . . . . . . . . . . . . . 115
5-1 Temperature versus enthalpy diagram representing the dehumidifica-
tion process highlighting the maximum change in enthalpy rates (per
kg of dry air) that can be achieved by each of the fluid streams (Ahmax,c
and Ahmax,h) and the terminal enthalpy pinches (We and W1 h). .. .. 120
5-2 Temperature versus enthalpy diagram for the dehumidification process
highlighting 'loss in ideal enthalpy' or enthalpy pinch at any given
location ('rocal) as a measure of local effectiveness in HME devices. . 123
5-3 Temperature versus enthalpy diagram representing the humidification
process highligting the 'pinch point' occuring at an intermediate loca-
tion rather than at a terminal one. . . . . . . . . . . . . . . . . . . . 124
15

5-4 A plot of local enthalpy pinch values ('I'car) relative to the overall en-
thalpy pinch (T) to illustrate the effect of extractions in a dehumidifier
with the control volume balanced case. . . . . . . . . . . . . . . . . . 126
5-5 Effect of extraction on the irreversiblity in the dehumidifier evaluated
at T. = 20*C; T = 70*C; 'Ideh = 20 kJ/kg dry air; HCR =1. . . . . . 126
5-6 An illustration of (a) temperature and (b) humidity ratio profiles in an
dehumidifier with complete thermodynamic balancing by continuous
injection. . . . . . . . . . . . . . . . . . . . . . . . . . . . . . . . . . . 128
5-7 Temperature profile representing the HDH system without extractions
or injections. Boundary conditions: Ta = 20*C; Te = 80*C; Waeh =
Thum = 20 kJ/kg dry air . . . . . . . . . . . . . . . . . . . . . . . . . 130
5-8 Temperature profiles representing the HDH system with continuous
extractions to completely balance (a) dehumidifier and (b) humidifier.
Boundary conditions: T = 20*C; Tc = 80*C; 'Ideh = Thum = 20 kJ/kg
dry air . . . . . . . . . . . . . . . . . . . . . . . . . . . . . . . . . . . 132
5-9 Temperature profile representing the HDH system with a single extrac-
tion. Boundary conditions: Ta = 20*C; Tc = 80*C; Wdeh = Thum = 20
kJ/kg dry air. . . . . . . . . . . . . . . . . . . . . . . . . . . . . . . . 134
5-10 Mass flow rate ratio and HCR profile for complete thermodynamic
balancing in a HDH system with 100% effective humidifier and dehu-
midifier. Boundary conditions: T = 20'C; S = 35 g/kg; Tc = 80'C;
Wdeh = Thum = 0 kJ/kg dry air; N = oo; System performance: GOR
= 109.7; RR=7.6%. . . . . . . . . . . . . . . . . . . . . . . . . . . . . 136
5-11 Effect of having finite-size HME devices on the performance of the HDH
system with infinite extractions highlighting the maximum possible
uncertainity associated with using the saturation line as the air process
path. Boundary conditions: Ta = 20*C; S = 35 g/kg; T = 80*C;
N = oo; HCRdeh=1. . . . . . . . . . . . . . . . . . . . . . . . . . . . 138
16
5-12 Comparison of performance of the HDH system with infinite extrac-
tions for complete thermodynamic balancing of humidifier with that
for complete thermodynamic balancing of the dehumidifier. Boundary
conditions: Ta = 20'C; S = 35 g/kg; Tc = 80*C; N = oo; HCRdeh=1. 140
5-13 Reduction in total system irreverisibility with complete thermody-
namic balancing of either the humidifier or the dehumidifier in HDH.
Boundary conditions: Ta = 20*C; S = 35 g/kg; T = 80*C; Xaeh =
Thum = 20 kJ/kg dry air; HCR&h=1 or ; HCRhum=1. . . . . . . . . 142
5-14 Effect of number of extractions (for thermodynamic balancing) on the
performance of the HDH system with finite and infinite size HME
devices. Boundary conditions: T, = 20'C; S = 35 g/kg; Te = 80*C;
HCR eh=1. . . . . . . . . . . . . . . . . . . . . . . . . . . . . . . . . 143
5-15 Effect of extraction on total system irreversiblities. Boundary condi-
tions: Ta = 20'C; S = 35 g/kg; Tc = 80*C; Wdeh = Thum = 20 kJ/kg
dry air; HCRahe=1. . . . . . . . . . . . . . . . . . . . . . . . . . . . . 145
6-1 Schematic diagram of a water-heated, closed-air, open-water humidification-
dehumidification desalination system with mass extraction and injec-
tion of the moist air stream. . . . . . . . . . . . . . . . . . . . . . . . 150
6-2 Three dimensional rendering of the experimental humidifier unit. . . . 153
6-3 Effectiveness and heat capacity rate ratio versus water inlet temper-
ature in the humidifier. Boundary conditions: T = 32'C; m,=2.85;
Twb,e = 20*C; P = 101.3 kPa; V = 0.27 m3 . . . . . . . . . . . . . . . 155
6-4 Effect of mass flow rate ratio on non-dimensional entropy generation
in the humidifier. Boundary conditions: Te = 32*C; Tc=60'C; Twb,e =
20*C; P = 101.3 kPa; Vh = 0.27 m3 . . . . . . . . . . . . . . . . . . . 155
6-5 Effect of packing volume on the performance of the humidification
device. Boundary conditions: T = 32*C; T=60*C; Tb,e = 20*C;
P = 101.3 kPa; Vuock = 0.07 m3 ; m,=2.8 . . . . . . . . . . . . . . . . 156
17

6-6 Photograph of the 700 liter/day water-heated, closed-air, open-water
humidification-dehumidification desalination system with mass extrac-
tion and injection of the moist air stream described in this chapter. 158
6-7 A state-of-the-art dehumidifier procured from George Fischer LLC 159
6-8 Effect of mass flow rate ratio on the performance of the HDH system
without mass extractions. Boundary conditions: T = 20*C; Tc =
80'C; N = 0; Vh = 0.27 m3 ; Ad = 8 m2 . . . . . . . . . . . . . . . . . . 161
6-9 Effect of top brine temperature on the performance of the HDH system
without mass extractions. Boundary conditions: Ta = 25*C; HCRd =
1; N = 0; V = 0.27 m3 ; Ad = 8 m 2 . . . . . . . . . . . . . . . . . . . . 161
6-10 Effect of feed water temperature on the performance of the HDH sys-
tem without mass extractions. Boundary conditions: Tc = 90*C;
mr= 2.4; N =0; Vh =0.27 m 3; Ad =8 m 2 . . . . . . . . . . . . . . . 163
6-11 Effect of mass flow rate of air extracted on the performance of the
HDH system. Boundary conditions: Ta = 25*C; Tc = 90*C; N = 1;
Vh = 0.27 m3 ; Ad = 8 m 2 . . . . . . . . . . . . . . . . . . . . . . . . . 165
6-12 Effect of top brine temperature on the performance of the HDH system
with a single air extraction from the humidifier to the dehumidifier.
Boundary conditions: Ta = 25*C; HCR= 1; N = 1; V = 0.27 m3
A d = 8 m2 . . . . . . . . . . . . . . . . . . . . . . . . . . . . . . . . . 166
7-1 Effect of pressure on humidity ratio of saturated moist air. . . . . . . 170
7-2 Schematic diagram of mechanical compression driven HDH system . . 171
7-3 Mechanical compression driven HDH cycle represented in psychromet-
ric coordinates. . . . . . . . . . . . . . . . . . . . . . . . . . . . . . . 172
7-4 Effect of modified heat capacity ratio of humidifier on specific work and
specific entropy generation. Tam,in = 30*C; EH = ED = 80%; 7lcom =
7e = 100%; PH = 40 kPa; PD = 48kPa. . . . . . . . . . . . . . . . . . 177
7-5 Effect of component effciency or effectiveness on cycle performance for
Tw,in = 30*C; PH = 33.33 kPa; PD =40 kPa . . . . . . . . . . . . . . . 177
18
7-6 Effect of pressure ratio and dehumidifier pressure on cycle performance
for T = 30*C; 6H = ED = 80%; qcom = ,e = 100% . . . . . . . . . . 179
7-7 The effect of pressure ratio on specific net work and vapor productivity
ratio to explain the trend in Fig. 7-6. . . . . . . . . . . . . . . . . . . 179
7-8 The effect of dehumidifier pressure on specific net work and vapor
productivity ratio to explain the trend in Fig. 7-6. . . . . . . . . . . . 180
7-9 Effect of air-side pressure drop in the humidifier on cycle performance
for T,,in = 30*C; EH = ED = 80%; r/cm = ,e = 100%; PD =40 kPa. . 180
7-10 Effect of air-side pressure drop in dehumidifier on cycle performance
for T.,,in = 30*C; EH = ED = 80%; l7com = qe = 100%; PD,i = 40kPa. . 181
7-11 Effect of using a throttle versus using an air expander in the two pres-
sure cycle for T = 30*C; 6H = = 80%; 7com = 100%; qe =
Oor100%; PD = 40kPa. . . . . . . . . . . . . . . . . . . . . . . . . . 182
7-12 Entropy generation in the throttle and the air expander cycles for
T,,, = 30*C; EH = ED = qcom = 9e = 90%; PH = 40kPa; PD = 50 kPa. 182
7-13 Thermal energy driven varied pressure HDH system . . . . . . . . . . 184
8-1 Black box model for steam driven thermal desalination system. . . . . 188
8-2 Effect of the heating steam temperature (and correspondingly the total
entropy rate of steam) entering a thermal desalination system (shown
in Fig. 8-1) on the least thermal energy required to drive the system.
To = 30*C; zi,io = 1; T,..t = 30'C; rh = 1kg/s; Si = 35, 000 ppm; RR =
50% . . . . . . . . . . . . . . . . . . . . . . . . . . . . . . . . . . . . 190
8-3 Schematic diagram of thermal vapor compression driven HDH-RO sys-
tem . . . . . . . . . . . . . . . . . . . . . . . . . . . . . . . . . . . . . 192
8-4 Psychrometeric representation of thermal vapor compression driven
HDH system . . . . . . . . . . . . . . . . . . . . . . . . . . . . . . . . 192
8-5 A typical embodiment of the TVC driven HDH-RO cycle. . . . . . . . 197
19

8-6 The effect of expander efficiency on performance of thermal vapor com-
pression driven HDH-RO system and the specific entropy generated in
the expander. T = 30*C; eH = 60%; eD = 70%; qtyc = 30%; Pt =
5 MPa; PH = 86.96 kPa; PD = 100 kPa; xz,,,n= 1; HCRH 1 . . . . . . 200
8-7 The effect of expander efficiency on relative importance of the HDH
process to the thermal vapor compression driven HDH-RO system.
T,,,in = 30'C; eH = 60%; £D = 70%; i7tv = 30%; Pt = 5 MPa; PH =
86.96 kPa; PD = 100 kPa; x,,in = 1; HCRH = 1 . . . . . . . . . . . . . 200
8-8 The effect of steam pressure on performance of thermal vapor com-
pression driven HDH-RO system. T,,, = 30*C; EH = 60%; ED =
70%; 7tyc = 30%; 77e = 50%; PH = 86.96kPa; PD = 1OOkPa; xzf,,, =
1; HCRH 1 . . . . . . . . . . . . . - - - - - - - - - - - ' - - - -. 201
8-9 The effect of steam pressure on total entropy rate of steam entering
and leaving the system, to explain the trends in Fig. 8-8. . . . . . . . 202
8-10 The effect of steam pressure on vapor entrainment ratio and vapor
productivity ratio, to explain the trends in Fig. 8-8. . . . . . . . . . . 203
8-11 Effect of pressure ratio on performance of thermal vapor compression
driven HDH-RO system. T..,in = 30*C; eH = 60%; ED = 70%; tc =
30%; g7e = 50%; PD = 100 kPa; Pt = 5 MPa; xst,in = 1; HCRH = -.- 205
8-12 The effect of pressure ratio on vapor entrainment ratio and vapor pro-
ductivity ratio, to explain the trends in Fig. 8-11. . . . . . . . . . . . 205
8-13 Effect of humidifier pressure on performance of thermal vapor com-
pression driven HDH-RO system. T,,,in = 30*C; EH = 60%; ED =
70%; tvc = 30%; 7e = 50%; PD/PH = 1.15; Pat = 5 MPa; z,,,in =
1; HCRH = . . . . . . . . . . . . . . . . . . . . . . . . . . . . . . . . 206
8-14 The effect of humidifier pressure on vapor entrainment ratio and vapor
productivity ratio, to explain the trends in Fig. 8-13. . . . . . . . . . 207
20

8-15 Effect of air-side pressure drop in dehumidifier on performance of ther-
mal vapor compression driven HDH-RO system. T = 30*C; EH =
60%; ED = 70%; 77t, = 30%; D7e = 50%; PD = 100 kPa; P,,t = 5 MPa; xst,in =
1; HCRH = - -- ---- ----................................ 208
8-16 Effect of air-side pressure drop in humidifier on performance of ther-
mal vapor compression driven HDH-RO system. T,,,i, = 30*C; EH
60%; ED = 70%; t = 30%; e = 50%; PD = 100 kPa; Pt = 5 MPa; x,,, -
1; HCRH = - - - - - - -- - --................................ 208
8-17 Benchmarking of new HDH techniques against existing desalination
system s. . . . . . . . . . . . . . . . . . . . . . . . . . . . . . . . . . . 210
9-1 Schematic diagram of the bubble column dehumidifier. . . . . . . . . 215
9-2 A thermal resistance model for the bubble column dehumidifier. . . . 215
9-3 A mass transfer resistance model between the liquid in the column and
the bubbles . . . . . . . . . . . . . . . . . . . . . . . . . . . . . . . . 222
9-4 Schematic diagram of test apparatus; (1, 11, 12) valves, (2, 6, 13)
rotameter, (3, 8) sparger, (4) humidifier column, (5) submerged electric
heater, (7) pressure gauge, (9) dehumidifier column, (10) water coil,
(14) inline water heater, (15) cooling water tank, (16) chilled water
coil, (TI - T8) thermocouples . . . . . . . . . . . . . . . . . . . . . . 227
9-5 Photographs showing design of sparger and coil for (a) non-impact and
(b) im pact cases . . . . . . . . . . . . . . . . . . . . . . . . . . . . . . 229
9-6 Effect of superficial velocity on the total heat flux in the bubble column
measured and evaluated at Db = 4 mm; xi, = 21%; H = 254 mm. . . . 231
9-7 Effect of bubble diameter on the total heat flux in the bubble column
measured and evaluated at V = 3.8 cm/s; Xin = 21%; H = 254 mm. . 233
9-8 Effect of inlet mole fraction of the vapor on the total heat flux in
the bubble column measured and evaluated at V = 3.8 cm/s; Db =
4 mm; H = 254 mm . . . . . . . . . . . . . . . . . . . . . . . . . . . . 233
21
9-9 Effect of liquid height on the total heat flux in the bubble column
measured and evaluated at Vg = 6.52 cm/s; Db = 4 mm; Xi, = 21%. . 235
9-10 Parity plot of heat flux values evaluated by the model and that mea-
sured by experiments for various boundary conditions. . . . . . . . . 235
9-11 Bubble rise path in circular (left) and serpentine (right) coils. . . . . 237
9-12 Effect of bubble-on-coil impact. . . . . . . . . . . . . . . . . . . . . . 237
9-13 Schematic diagram of multi-stage bubble column dehumidifier. . . . . 238
9-14 An illustration of the temperature profile in the bubble columns for (a)
single stage and (b) multi-stage . . . . . . . . . . . . . . . . . . . . . 239
9-15 Prototype of multi-stage bubble column. . . . . . . . . . . . . . . . . 240
9-16 Effect of multistaging the bubble column on energy effectiveness of the
device. . . . . . . . . . . . . . . . . . . . . . . . . . . . . . . . . . . . 242
A-1 Schematic diagram for calculating Carnot GOR of HDH . . . . . . . 263
C-i Flowchart of the overall HDH system design for the no extractions case.270
C-2 Flowchart of the overall system design for the continuous air extrac-
tions case . . . . . . . . . ... . . . . . . . . . . . . . . . . . . . . . . . 271
C-3 Flowchart of the overall system design for the single air extraction case. 272
D-i Three-dimensional model of a trailer-mounted, sub-atmospheric-pressure,
natural-gas-fired, single air extraction HDH system with a 12 foot tall
packed bed humidifier and a four-stage bubble column dehumidifier. . 274
E-1 Psychrometeric chart for helium water vapor mixture and moist air. . 279
E-2 Relative performance of water heated HDH cycle with helium or air
as carrier gas. T = 30*C; Tcg,H,out = 90 0C; EH = 60%; ED =
90%; P = IOOkPa. . . . . . . . . . . . . . . . . . . . . . . . . . . . . 284
22

List of Tables
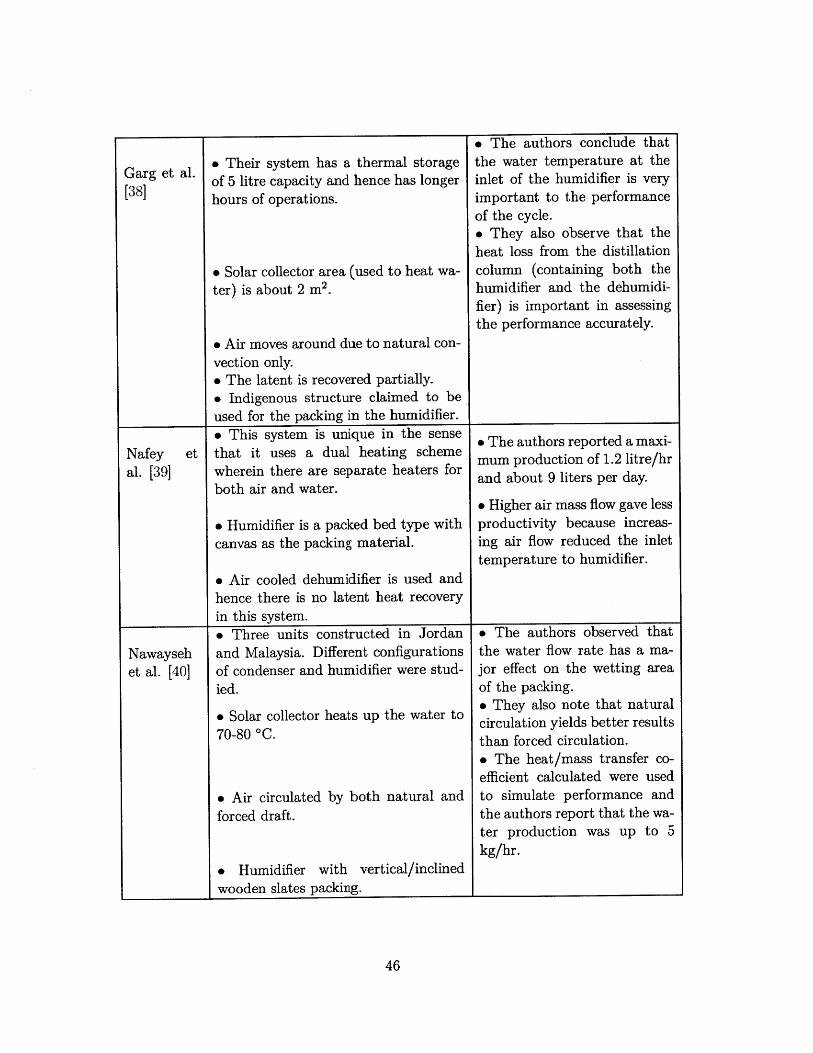
2.1 Features and summary of results from various previous works on water
heated CAOW HDH cycle. .............................. 45
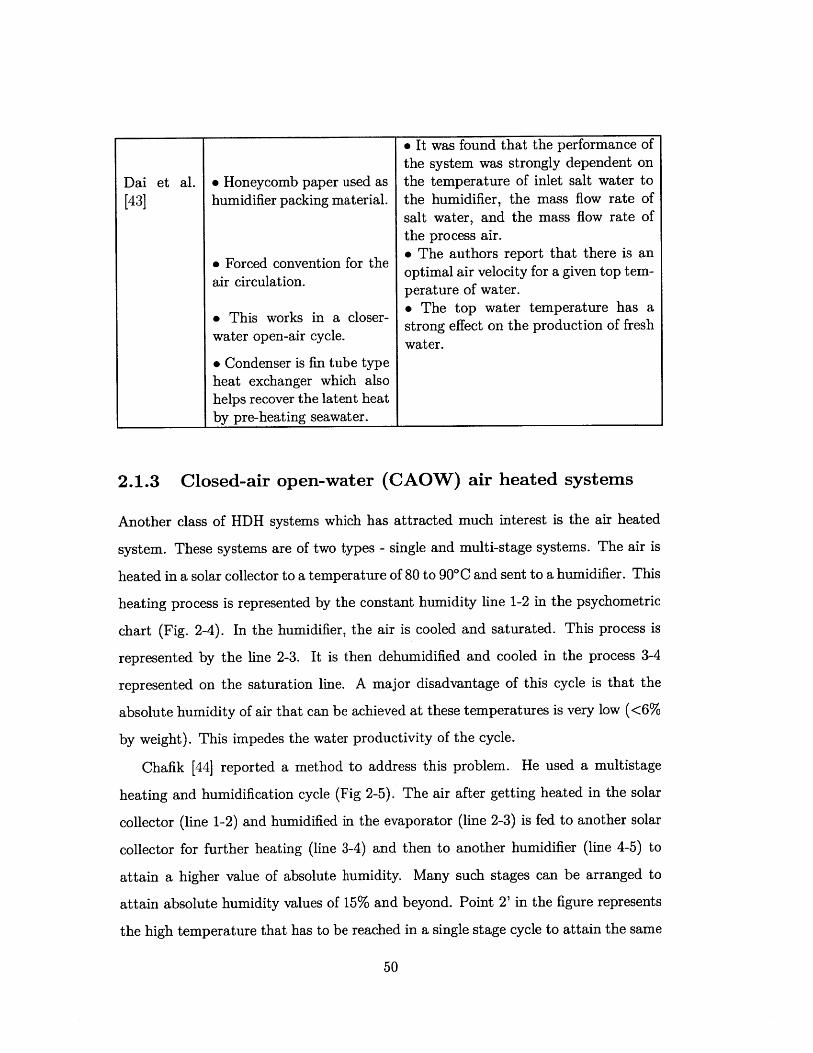
2.2 Features and summary of results from various previous works on water
heated CWOA HDH cycle. .............................. 49
2.3 Features and summary of results from various previous works on air
heated CAOW HDH cycle. .............................. 52
3.1 Various definitions of effectiveness for simultaneous heat and mass ex-
change components . . . . . . . . . . . . . . . . . . . . . . . . . . . . 68
3.2 Examples of maximum effectiveness for a counterflow cooling tower
with following boundary condition: T,, = 70 *C; p,, = 1 atm, T,i =
30*C; pa,i = 1 atm, #i = 1.0. . . . . . . . . . . . . . . . . . . . . . . . 97
3.3 Examples of maximum effectiveness for a counterflow cooling tower
with following boundary condition: T, = 70 *C; pw,i = 1 atm, Ta,i =
30 C; pa,i = 1 atm, #; = 0.5. . . . . . . . . . . . . . . . . . . . . . . . 98
3.4 Examples of maximum effectiveness for a counterflow air dehumidifier
with following boundary condition: T,; = 30 C; pw,i = l atm, T,i =
70 *C; pa,i = 1 atm, #3 = 1.0. . . . . . . . . . . . . . . . . . . . . . . . 100
3.5 Applicable range of various definitions of effectiveness of simultaneous
heat and mass exchange devices. . . . . . . . . . . . . . . . . . . . . . 102
4.1 Comparison of GOR of HDH cycles under representative boundary
conditions . . . . . . . . . . . . . . . . . . . . . . . . . . . . . . . . . 116
23

6.1 Peak Performance of the pilot HDH system . . . . . . . . . . . . . . .1
7.1 Comparison of mechanical compression HDH with other HDH desali-
nation technologies . . . . . . . . . . . . . . . . . . . . . . . . . . . . 183
9.1 Sparger design . . . . . . . . . . . . . . . . . . . . . . . . . . . . . . . 228
9.2 Coil design for multi-stage prototype . . . . . . . . . . . . . . . . . . 241
D.1 Various components of capital expenditure (CAPEX) for a 10 m3 per
day HDH system. . . . . . . . . . . . . . . . . . . . . . . . . . . . . . 275
E. 1 Thermophysical properties of different carrier gases at STP and of dry
saturated steam at atmospheric pressure . . . . . . . . . . . . . . . . 278
E.2 Estimated improvement in gas side dehumidification heat transfer co-
efficients when helium is used as the carrier gas. . . . . . . . . . . . . 282
E.3 Various system parameters and temperatures for cases shown in Fig. E-2284
24
167

Nomenclature
Acronyms
ED Electrodialysis
GOR Gained Output Ratio
HDH Humidification Dehumidification
HME Heat and Mass Exchanger
MSF Multi-stage Flash
MED Multi-effect Distillation
MVC Mechanical Vapor Compression Distillation
RO Reverse Osmosis
TBT Top Brine Temperature
TTD Terminal Temperature Difference
TVC Thermal Vapor Compressor
RR Recovery Ratio
Symbols
a. specific interfacial area of the bubble column (m 2/m 3 )
c total molar concentration (mol/m 3 )
C heat capacity rate (W/K)
c, specific heat capacity at constant pressure (J/kg.K)
c,,9 average specific heat capacity at constant pressure of the vapor-air mixture
(J/kg.K)
Db bubble diameter (m)
do sparger hole diameter (m)
25
D' thermal diffusion coefficient (m2/s-K)
DAB diffusion coefficient (m2/s)
ERvap vapor entrainment ratio (-)
Ec equivalent electricity consumption (kWh/m 3)
g specific Gibbs energy (J/kg) or gravitational accelaration (m/s 2)
H liquid height in the column (m)
H total enthalpy rate (W)
h specific enthalpy (J/kg)
h* Water and moist air enthalpy rate normalized by mass flow rate of dry air
(J/kg dry air)
ha specific enthalpy of moist air (J/kg of dry air)
hfg enthalpy of evaporation (J/kg)
HCR heat capacity rate ratio (-)
ht heat transfer coefficient for the sensible heat exchanged between bubble
and liquid column (W/m 2-K)
I specific entropy generation in the expander (J/kg.K)
j mass flux (kg/m 2 .s)
k thermal conductivity (W/m-K)
k, mass transfer coefficient for the latent heat exchanged between bubble and
liquid column (m/s)
1 characteristic length (m)
lit integral length for turbulence (m)
di mass flow rate (kg/s)
mr water-to-air mass flow rate ratio (-)
n exponent (-)
N number of extractions (-)
P absolute pressure (N/m 2)
Q heat rate (W)
R gas constant (J/kg.K)
R universal gas constant (J/mol-K)
26

q heat flux (W/m 2)
q~t heat flux due to condensation of vapor from the bubble in the liquid column
(W/m 2)
qit,imc heat flux die to direct condensation of vapor from the bubble on the coil
surface (W/m 2 )
q~e8 mii heat flux due to the sensible heat exchange between bubble and liquid
column (W/m 2 )
R thermal resistance (K.m 2 /W)
Rbc thermal resistance between the liquid column and the coil surface (K-m 2 /W)
Rcoi thermal resistance due to coolant flow inside the coil (K-m 2/W)
Rbc thermal resistance between the liquid column and the coil surface (K-m 2 /W)
Rcoi, thermal resistance due to coolant flow inside the coil (K-m 2/W)
Rsensible thermal resistance for the sensible heat exchange between bubble and liquid
column (K-m2 /W)
s specific entropy (J/kg-K)
S salinity or total dissolved solids (ppm)
$ total entropy rate of steam (W/K)
Sfg specific entropy change of evaporation (J/kg.K)
$gen entropy generation rate (W/K)
$1, entropy generation rate per unit volume (W/m 3 K)
t surface renewal time (s)
tf average residence time of the bubble in the liquid (s)
T temperature (*C)
Tair local energy-averaged temperature of the air-vapor bubble (*C)
Teit local temperature of the coil surface (*C)
TcaOumn local energy-averaged temperature of the liquid in the column (*C)
Tcoo ant local energy-averaged temperature of the coolant in the coil (*C)
U velocity in the x direction (m/s)
V velocity (m/s)
Vb bubble velocity (m/s)
27
Vc circulation velocity (m/s)
V superficial velocity (m/s)
V,. radial velocity in the liquid column (m/s)
vol volume of the bubble column (m 3 )
VPR vapor productivity ratio (-)
X quality of steam (-) or mass concentration (kg/kg)
Greek
a thermal diffusivity (m 2/s)
A Difference or change
C volumetric gas holdup (-)
e component effectiveness (-)
7ltvc reversible entrainment efficiency for a TVC (-)
77e isentropic efficiency for an expander (-)
0 log mean temperature difference (*C)
v kinematic viscosity (m2/s)
p Density (kg/m 3 )
0- surface tension (N/m)
# Relative humidity (-)
T enthalpy pinch (J/kg dry air)
TTD terminal enthalpy pinch (J/kg dry air)
Tiole local average enthalpy pinch (J/kg dry air)
w absolute humidity (kg/kg of dry air)
Subscripts
a humid air
c cold stream
D dehumidifier
da dry air
e expander
g gas
28

h hot stream
H humidifier
i inlet
in entering
max maximum
least least
1 liquid
o outlet
out leaving
pw product water
rev reversible
RO reverse osmosis
s isentropic
sat saturated
st steam
tur steam turbine
tvc thermal vapor compressor
W water
Superscripts
ideal ideal condition
mod modified
rev reversible
Non-dimensional Numbers
Fr Froude Number, V/(g Db)
Le Lewis Number, a/DAB
Lef Lewis Factor, ht/(pcp,gki)
Pr Prandtl Number, v/a
Re Reynolds Number, (V -Db)/V
St Stanton Number, h/(pcV)
29

Thermodynamic states
a Seawater entering the dehumidifier
b Preheated seawater leaving the dehumidifier
c Seawater entering the humidifier from the brine heater
d Brine reject leaving the humidifier
e Moist air entering the dehumidifier
ex Moist air state at which mass extraction and injection is carried out in
single extraction cases
f Relatively dry air entering the humidifier
g Air at an arbitary intermediate location in the dehumidifier
i Seawater at an arbitrary intermediate location in the dehumidifier
30
Chapter 1
Introduction
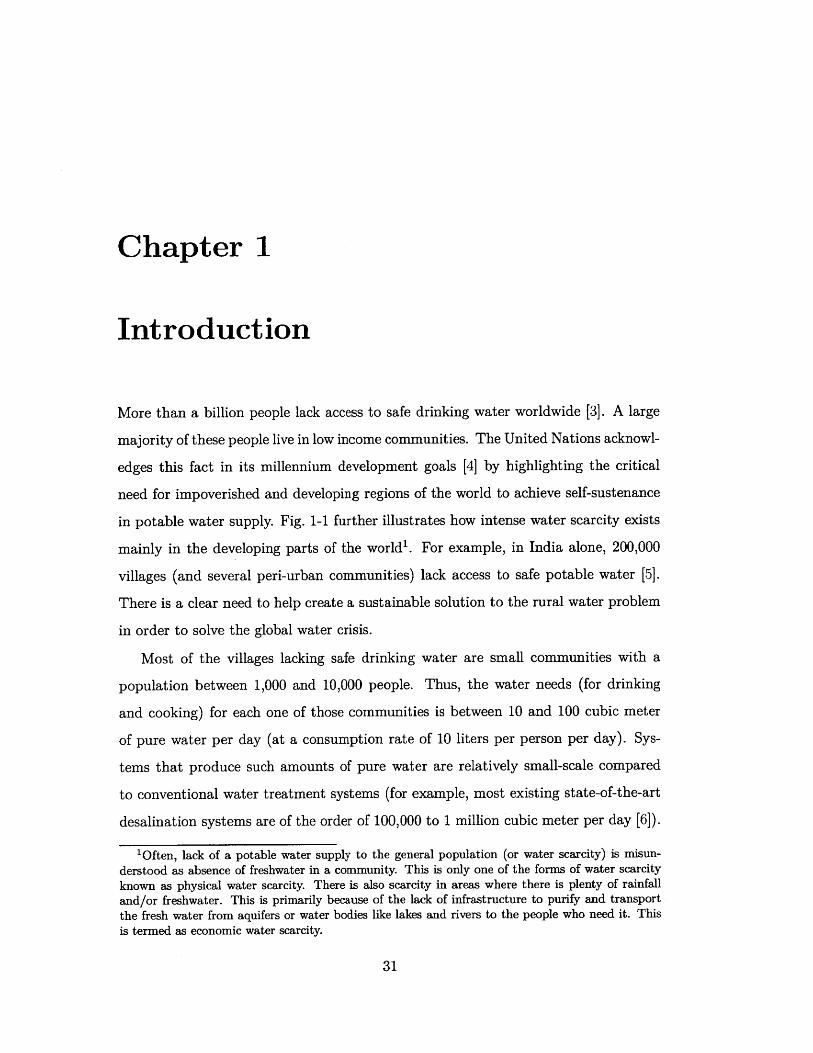
More than a billion people lack access to safe drinking water worldwide [3]. A large
majority of these people live in low income communities. The United Nations acknowl-
edges this fact in its millennium development goals [4] by highlighting the critical
need for impoverished and developing regions of the world to achieve self-sustenance
in potable water supply. Fig. 1-1 further illustrates how intense water scarcity exists
mainly in the developing parts of the world'. For example, in India alone, 200,000
villages (and several peri-urban communities) lack access to safe potable water [5].
There is a clear need to help create a sustainable solution to the rural water problem
in order to solve the global water crisis.
Most of the villages lacking safe drinking water are small communities with a
population between 1,000 and 10,000 people. Thus, the water needs (for drinking
and cooking) for each one of those communities is between 10 and 100 cubic meter
of pure water per day (at a consumption rate of 10 liters per person per day). Sys-
tems that produce such amounts of pure water are relatively small-scale compared
to conventional water treatment systems (for example, most existing state-of-the-art
desalination systems are of the order of 100,000 to 1 million cubic meter per day [6]).
'Often, lack of a potable water supply to the general population (or water scarcity) is misun-
derstood as absence of freshwater in a community. This is only one of the forms of water scarcity
known as physical water scarcity. There is also scarcity in areas where there is plenty of rainfall
and/or freshwater. This is primarily because of the lack of infrastructure to purify and transport
the fresh water from aquifers or water bodies like lakes and rivers to the people who need it. This
is termed as economic water scarcity.
31

ULittle or no water scarcity
Physical water scarcity
Approaching physical water scarcity
Economic water scarcity
Figure 1-1: World map showing areas of physcial and economic water scarcity [1].
Any potential small-scale solution to the problem needs to be both implementable
and scalable. For the solution to be implementable, it has to be cost effective and
resource-frugal. Currently, the price of safe drinking water (in the rare case it is
available) in these low income communities is very high relative to the cost of tapped
municipal drinking water in nearby "developed" regions (for example, in some parts
of rural India the cost of water is up to 10 $/m 3 which is roughly 40 times the
cost of municipal drinking water available a few miles away in a nearby city [7]).
Furthermore, in many villages, resources including skilled labor, a continuous energy
supply, and raw materials are not readily available. The solution should, hence, be
implementable within these constraints too.
An implementable solution is truly worthwhile only if it is scalable and can reach
a large number of people (say, a million or more). For such scalability, the solution
should be able to handle an array of contaminants in the water to be treated. In India
alone, the contaminants range from high fluoride content to bacterial contamination
to water being very brackish. Sixty six million people have been reported to be
32
ENot estimated

consuming water with elevated levels of fluoride in India [8]. Most of these people
live in the states of Rajasthan and Gujarat where fluoride contents reach up to 11
mg/L. Some districts in Assam, Orissa have very high iron content in water (1 to 10
mg/L - red water) and some in Rajasthan, Uttar Pradesh and Bihar have yellow water
(>1 mg/L of iron) [9]. Certain places in Haryana, Gujarat, and Andhra Pradesh were
also found to have dangerously high levels of mercury. The problems associated with
high levels of Arsenic in ground water (in West Bengal) are well documented [10]. At
least 300,000 people are affected by drinking water with arsenic above the permissible
limit of 0.05 mg/L in this region. In parts of coastal Tamil Nadu, because of seawater
intrusion, there is the problem of high salinity in drinking water (as high as 10,000
ppm in some cases) [11]. These problems are almost exclusively limited to rural and
peri-urban communities. In all, almost one in three of the 600,000 Indian villages face
problems of brackish or contaminated water and scarcity of fresh water. The India
example is typical in that most developing and under-developed nations face similar
water problems.
Desalination technologies are known to remove all contaminants including diss-
solved ions, micro organisms and so on. For example, as illustrated in Fig. 1-2,
reverse osmosis removes even the smallest contaminants (albeit at a higher cost and
complexity compared to other water treatment techniques). Furthermore, all ther-
mal desalination technologies (MSF, MED, HDH and so on) are commonly known
to remove all contaminants (producing what is in principle de-ionized water). The
challenges in implementing these technologies are, however, to make them low cost
(< 5 $/m 3 ) at a community-scale (10-100 m 3/day) and relatively maintenance-free
(or maintained by non-technical laborers). The goal of the present thesis work is to
develop a small-scale desalination technology which can meet these challenges.
1.1 Conventional desalination technologies
Desalination is generally performed by either of two main processes: by evaporation
of water vapor or by use of a semi-permeable, non-porous membrane to separate fresh
33
water from a concentrate.
Contaminant size
Z4
E0U
0
Figure 1-2: Illustration ofnants they remove (Figure
various membrane technologies and the various contami-by MIT OCW; source: A. Twort et al. [2]).
The most important of these technologies are reviewed in this section. In thermal
processes, the distillation of seawater is achieved by utilizing a heat source. The
heat source may be obtained from a conventional fossil-fuel, nuclear energy or from
a non-conventional source like solar energy or geothermal energy. In the membrane
processes, electricity is used either for driving high-pressure pumps to overcome the
osmostic pressure difference or for establishing electric fields to selectively migrate
the ions.
The most important commercial desalination processes based on thermal energy
34
are multi-stage flash (MSF) distillation, multiple effect distillation (MED) and me-
chanical vapor compression (MVC). The MSF and MED processes consist of many
serial stages at successively decreasing temperature and pressure. The MSF process
is based on the generation of vapor from seawater or brine due to a sudden pressure
reduction (flashing) and subsequent condensation of the vapor to produce pure wa-
ter. The process is repeated stage-by-stage at successively decreasing pressures. This
process requires an external steam supply as energy input, normally at a temperature
of around 110'C. The maximum operating temperature is limited by scale formation,
and thus the thermodynamic performance of the process is also limited. For the MED
system, water vapor is generated by heating the seawater at a given pressure in each
of a series of cascading chambers. Condensation of steam generated in one stage (or
"effect") is used to heat the brine in the next stage, which is at a lower pressure. The
thermal performance of these systems is proportional to the number of stages, with
capital cost and practical considerations like leakage and carbon-dioxide outgassing
limiting the number of stages to be used.
In MVC systems, the energy for desalination is provided as a work transfer in a
steam compressor as a work transfer which maintains the condensation at a higher
pressure than the evaporation. The condensation of pure vapor provides the heat of
evaporation in a single heat exchange where there is phase change in either stream
exchanging energy. When an external source of steam is available, the compression
process might be powered by it in a thermal vapor compressor (or TVC which is a
steam-to-steam ejector) instead of providing a work transfer in a mechanical com-
pressor.
The second important class of desalination processes, reverse osmosis (RO) and
electrodialysis (ED), use a membrane to desalinate water. RO requires power to
drive a pump that increases the pressure of the feed water to a desired value. The
required pressure depends on the salt concentration of the feed water and the associ-
ated osmotic pressure. The ED process uses an electric potential to produce selective
migration of ions through suitable ion-exchange membranes [12]. Both RO and ED
are widely used for brackish water desalination; however, RO is also competitive with
35
MSF distillation processes for seawater desalination.
MSF plants typically have capacities ranging from 100,000 to almost 1,000,000
m 3 /day [13]. MED plants tend to be of a similar size and MVC plants are typically
small-scale (about 1,000 m 3 per day). The largest operational RO plant currently is
the Ashkelon plant, at 330,000 m 3 /day [6]. RO is also applicable on a smaller scale
at around 1,000 m 3 /day [14]. ED plants are of the order of 1,000 to 10,000 m 3 /day.
Other approaches to desalination include processes like the ion-exchange process,
liquid-liquid extraction, and the gas hydrate process. Most of these approaches are
not generally used unless when there is a requirement to produce high purity (total
dissolved solids < 10 ppm) water for specialized applications.
The MSF process represents more than 90% of the thermal desalination processes
installed worldwide, while the RO process represents more than 80% of membrane
processes for water production. Together MSF and RO currently account for around
70 to 80% of the total installed desalination capacity in the world. Most of this
capacity is in large scale plants in the economically developed regions of the world
(including the Middle East, Australia and USA).
1.2 Humidification Dehumidification (HDH)
Nature uses air as a carrier gas to desalinate seawater by means of the rain cycle. In
the rain cycle, seawater gets heated (by solar irradiation) and evaporates into the air
above to humidify it. Then the humidified air rises and forms clouds. Eventually, the
clouds 'dehumidify' as rain over land and can be collected for human consumption.
The man-made version of this cycle is called the humidification-dehumidification de-
salination (HDH) cycle. The simplest form of the HDH cycle is illustrated in Figure
1-3. The cycle constitutes of three subsystems: (a) the air and/or the brine heater
(only a brine heater is shown in the figure), which can use various sources of heat
like solar, thermal, geothermal or combinations of these; (b) the humidifier or the
evaporator; and (c) the dehumidifier or the condenser.
The HDH cycle has received some attention in recent years and many researchers
36

Packed bedVVVVVVV Water Heater
Humidifier A A- Dehumidifier
SCarrier gas
Pure water, rhP Sea water in,Brine, rhb
Figure 1-3: Simplest embodiment of HDH process.
have investigated the intricacies of this technology (see Chapter 2). It should be noted
here that the predecessor of the HDH cycle is the simple solar still. Several researchers
[15-17] have reviewed the numerous works on the solar still. It is important to
understand the demerits of the solar still concept.
The most prohibitive drawback of a solar still is its low efficiency (Gained-output-
ratio, or GOR 2 , less than 0.5) which is primarily the result of the immediate loss
of the latent heat of condensation through the glass cover of the still. Some designs
recover and reuse the heat of condensation, increasing the efficiency of the still. These
designs (called multi-effect stills) achieve some increase in the efficiency of the still
but the overall performance is still relatively low. The main drawback of the solar
still is that the various functional processes (solar absorption, evaporation, conden-
sation, and heat recovery) all occur within a single component. By separating these
37
2see Sec. 2.1 for definition of GOR

functions into distinct components, thermal inefficiencies may be reduced and overall
performance improved. This separation of functions is the essential characteristic of
the HDH system. For example, the recovery of the latent heat of condensation, in
the HDH process, is affected in a separate heat exchanger (the dehumidifier) wherein
the seawater, for example, can be preheated. The module for heat input (like a solar
collector) can be optimized almost independently of the humidification or dehumidi-
fication component. The HDH process, thus, promises higher productivity due to the
separation of the basic processes.
HDH systems are ideal for application in small-scale systems. They have no parts
which require extensive maintenance like membranes or high temperature steam lines.
There is also no bottle-neck in applying HDH for varied and tough feedwater qualities.
The present thesis describes fundamental contributions to thermal design of HDH
systems which make it affordable for application in small-scale desalination.
1.3 Organization of the thesis
Chapter 2 details a literature review of the HDH technology providing the specific
objectives and scope of the present thesis works.
Chapter 3 describes methodology to model simultaneous heat and mass exchange
devices (HME) including the humidifier and the dehumidifier and a new second law
design algorithm for the same.
Chapter 4 uses the theory developed for HME devices in Chapter 3 and extends it
to on-design modeling of existing HDH cycles. Chapters 5 to 8 describe novel system
designs for HDH. These include HDH systems with mass extraction and injection
(Chapter 5) and HDH systems powered by a mechanical compressor (Chapter 7) and
a thermal vapor compressor (Chapter 8). Chapter 6 details experimental work on a
pilot scale HDH unit.
3All of the work reported in the present document has been written as 8 international journal
papers (5 of them already published [18-22] and 3 of them are under review [23-25]), 3 conference
papers [26-28] and 5 patent disclosures [29-33] (2 of them issued and 3 pending). All of these
documents I am the first author or the lead inventor.
38

Chapter 9 describes the invention of a novel dehumidifier to reduce capital cost.
39

THIS PAGE INTENTIONALLY LEFT BLANK
40
Chapter 2
Technology review
HDH systems are classified under three broad categories. One is based on the form of
energy used such as solar, thermal, geothermal, or hybrid systems. This classification
brings out a promising merit of the HDH concept: the promise of water production
by use of low grade energy, especially from sources of industrial waste heat or from
renewable resources like solar energy.
The second classification of HDH processes is based on the cycle configuration
(Figure 2-1). As the name suggests, a closed-water open-air (CWOA) cycle is one in
which ambient air is taken into the humidifier where it is heated and humidified and
sent to the dehumidifier where it is partially dehumidified and let out in an open cycle
as opposed to a closed air cycle wherein the air is circulated in a closed loop between
the humidifier and the dehumidifier. In this cycle, the brine is recirculated until a
desirable recovery is attained. The air in these systems can be circulated by either
natural convection or mechanical blowers and feedwater is typically circulated by a
pump. It is of pivotal importance to understand the relative technical advantages of
each of these cycles and choose the one that is best in terms of efficiency and cost of
water production.
The third classification of the HDH systems is based on the type of heating used
- water or air heating systems. The performance of the system depends greatly on
which fluid is heated.
41

Figure 2-1: Classification of HDH systems based on cycle configurations.
2.1 Review of systems in literature
As a first step for understanding different works in literature the following perfor-
mance parameters are defined.
1. Gained-Output-Ratio (GOR): is the ratio of the latent heat of evaporation of
the water produced to the net heat input to the cycle.
GOR = rhW - hfg (2.1)QIn
This parameter is, essentially, the effectiveness of water production, which is
an index of the amount of the heat recovery affected in the system. This is the
primary performance parameter of interest in HDH (and in thermal desalina-
tion, in general) and is very similar to the performance ratio (PR) defined for
MED and MSF systems. For steam driven desalination systems (like in most
state-of-the-art MSF and MED systems), PR is approximately equal to GOR.
42

GOR = W *" hjg (2.2)ms -Ah,
(2.3)
PR
It is worthwhile to note that GOR is also defined as the ratio of the latent
heat (hfg) to the specific thermal energy consumption. The latent heat in the
equations above is calculated at the average partial pressure of water vapor (in
the moist air mixture) in the dehumidifier.
2. Recovery ratio (RR): is the ratio of the amount of water produced per kg of feed.
This parameter is also called the extraction efficiency [34]. This is, generally,
found to be around 10% for the HDH system in single pass and can be increased
to higher values (up to 90%) by brine recirculation.
RR = "" (2.4)
2.1.1 Closed-air open-water (CAOW) water heated systems
A typical CAOW system is shown in Fig. 1-3. The humidifier is irrigated with hot
water and the air stream is heated and humidified using the energy from the hot water
stream. This process on the psychometric chart is represented by the line 1-2 (Fig. 2-
2). The humidified air is then fed to the dehumidifier and is cooled in a compact
heat exchanger using seawater as the coolant. The seawater gets preheated in the
process and is further heated in a solar collector before it irrigates the humidifier.
The dehumidified air stream from the dehumidifier is then circulated back to the
humidifier. This process on the psychometric chart is represented by the line 2-1
(Fig. 2-2).
There are several works in literature on this type of cycle. The important features
of the system studied and the main observations from these studies are tabulated in
43

01
E
Dry bulb Temperature, *C
Figure 2-2: Water heated CAOW HDH process on psychometric chart.
Table 2.1.
Some common conclusions can be drawn from this table. Almost all the inves-
tigators have observed that the performance is maximized at a particular value of
the water flow rate. There also is an almost unanimous consensus that natural cir-
culation of air yields better efficiency than forced circulation of air for the closed air
water heated cycle. However, it is not possible to ascertain the exact advantage in
performance (for natural circulation) from the data available in literature.
44
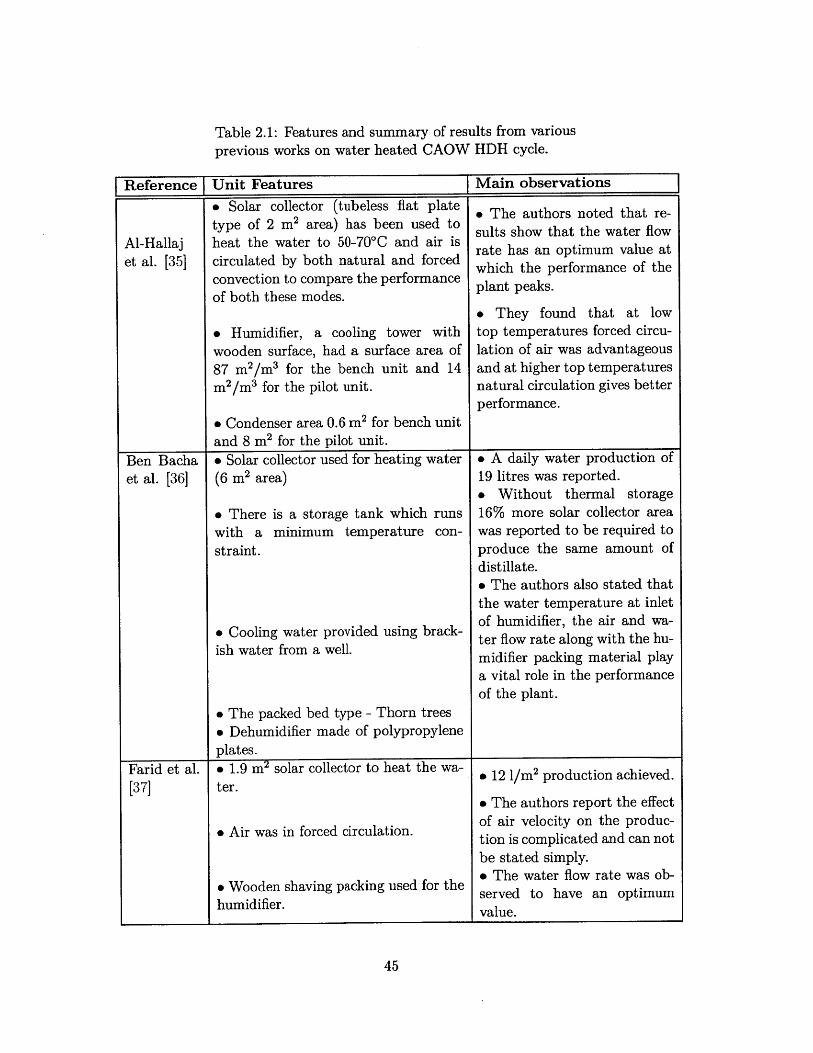
Table 2.1: Features and summary of results from various
previous works on water heated CAOW HDH cycle.
Reference Unit Features Main observations
* Solar collector (tubeless flat plate * The authors noted that re-type of 2 m2 area) has been used to sults show that the water flow
Al-Hallaj heat the water to 50-70*C and air is rate has an optimum value atet al. [35] circulated by both natural and forced which the performance of the
convection to compare the performance plant peaks.of both these modes.
* They found that at low
* Humidifier, a cooling tower with top temperatures forced circu-
wooden surface, had a surface area of lation of air was advantageous
87 m 2/m 3 for the bench unit and 14 and at higher top temperatures
m2/m 3 for the pilot unit. natural circulation gives betterperformance.
* Condenser area 0.6 m2 for bench unitand 8 m2 for the pilot unit.
Ben Bacha & Solar collector used for heating water * A daily water production of
et al. [36] (6 m2 area) 19 litres was reported.* Without thermal storage
* There is a storage tank which runs 16% more solar collector area
with a minimum temperature con- was reported to be required to
straint. produce the same amount ofdistillate.* The authors also stated thatthe water temperature at inletof humidifier, the air and wa-
i Cooling water provided using brack- ter flow rate along with the hu-ish water from a well. midifier packing material play
a vital role in the performanceof the plant.
" The packed bed type - Thorn trees" Dehumidifier made of polypropyleneplates.
Farid et al. * 1.9 m2 solar collector to heat the wa- * 12 1/m2 production achieved.[37] ter.
a The authors report the effectof air velocity on the produc-
* Air was in forced circulation. tion is complicated and can notbe stated simply.e* The water flow rate was ob-
h Wooden shaving packing used for the served to have an optimumhumidifier. value.
45
r.
* Their system has a thermal storage
of 5 litre capacity and hence has longer
hours of operations.
* Solar collector areater) is about 2 M2 .
(used to heat wa-
e Air moves around due to natural con-vection only." The latent is recovered partially." Indigenous structure claimed to beused for the packing in the humidifier.* This system is unique in the sense
that it uses a dual heating scheme
wherein there are separate heaters for
both air and water.
* Humidifier is a packed bed type with
canvas as the packing material.
* Air cooled dehumidifier is used and
hence there is no latent heat recovery
in this system.
* Three units constructed in Jordanand Malaysia. Different configurationsof condenser and humidifier were stud-ied.
* Solar collector heats70-80 0C.
* Air circulated by b(forced draft.
* Humidifier withwooden slates packing.
up the water to
oth natural and
vertical/inclined
e The authors conclude thatthe water temperature at theinlet of the humidifier is veryimportant to the performanceof the cycle.& They also observe that theheat loss from the distillationcolumn (containing both thehumidifier and the dehumidi-fier) is important in assessingthe performance accurately.
* The authors reported a maxi-mum production of 1.2 litre/hrand about 9 liters per day.
* Higher air mass flow gave lessproductivity because increas-ing air flow reduced the inlettemperature to humidifier.
* The authors observed thatthe water flow rate has a ma-jor effect on the wetting areaof the packing.a They also note that naturalcirculation yields better resultsthan forced circulation.9 The heat/mass transfer co-efficient calculated were usedto simulate performance andthe authors report that the wa-ter production was up to 5kg/hr.
46
Garg et al.[38]
Nafeyal. [39]
et
Nawaysehet al. [40]
______________________ J.
I

1*
* A unique HDH cycle with a directcontact packed bed dehumidifier wasused in this study.
* The system uses waste heat to heatwater to 60*C
* It uses a part of the water producedin the dehumidifier as coolant and re-covers the heat from this coolant in aseparate heat exchanger.
* The authors demonstratedthat this process can yielda fresh water production effi-ciency of 8% with an energyconsumption of 0.05 kWh perkilogram of fresh water pro-duction based on a feed watertemperature of only 60*C* It should be noted that theefficiency is the same as therecovery ratio defined in thepresent thesis.
* Also the energy consumptiondoes not include the solar en-ergy consumed.
2.1.2 Closed-water open-air (CWOA) water heated systems
In a typical CWOA system the air is heated and humidified in the humidifier using
the hot water from the solar collector and then is dehumidified using outlet water
from the humidifier. The water, after being pre-heated in the dehumidifier, enters
the solar collector, thus working in a. closed loop. The dehumidified air is released to
ambient.
The humidification process is shown in the psychometric chart (Fig. 2-3) by line
1-3-2. Air entering at ambient conditions is saturated to a point 2 and then the
saturated air follows the line 2-3. The dehumidification process is shown by line 3-4.
The air is dehumidified along the saturation line. A relatively small number of works
in literature consider this type of cycle. The important features of the system studied
and main observations from these studies are shown in Table 2.2.
One disadvantage of the CWOA is that when the humidification process does
not cool the water sufficiently the coolant water temperature to the inlet of the
dehumidifier goes up. This limits the dehumidification of the humid air resulting in a
reduced water production compared to the open water cycle. However, when efficient
humidifiers at optimal operating conditions are used, the water may be potentially
47
Klausnerandcoworkers
[34]

E
3
Dry bulb temperature, *C
Figure 2-3: Water heated CWOA HDH process on psychometric chart.
cooled to temperatures below the ambient temperature (up to the limit of the ambient
wet-bulb temperature). Under those conditions, the closed water system is more
productive than the open water system. Closed water (brine recirculation) is also
desired in all HDH systems which aim for higher recovery ratios.
48
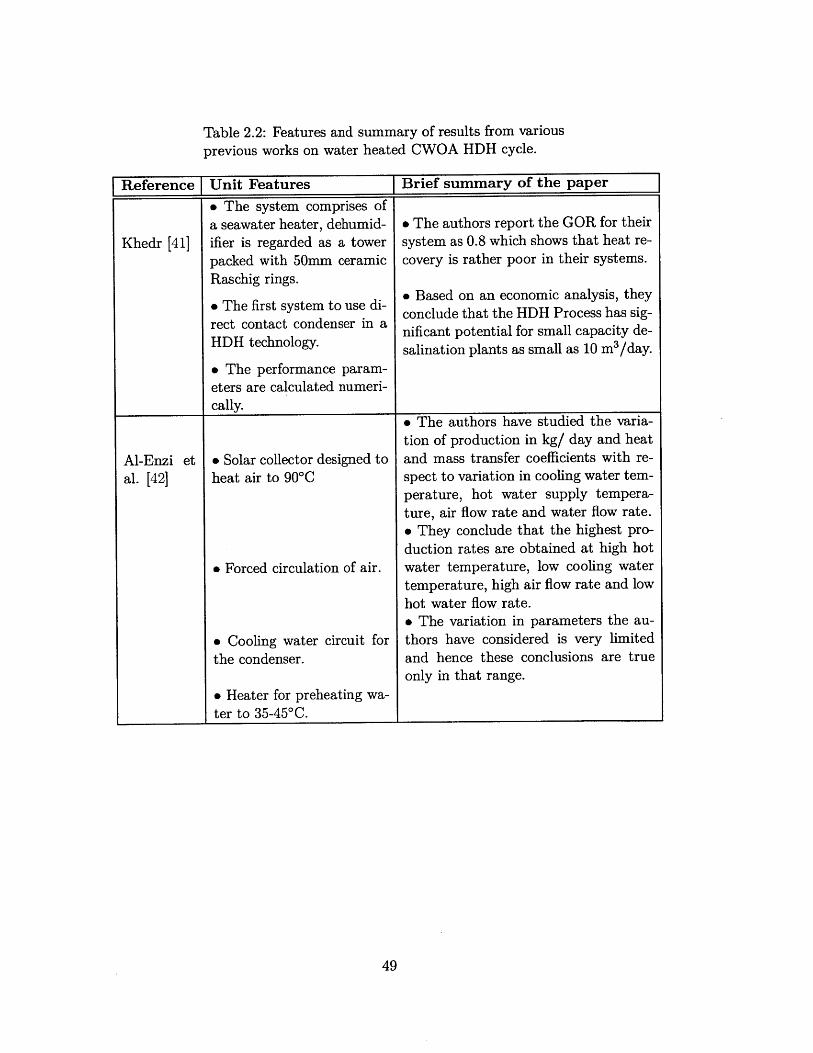
Table 2.2: Features and summary of results from various
previous works on water heated CWOA HDH cycle.
49
Reference ' Unit Features Brief summary of the paper
* The system comprises of
a seawater heater, dehumid- * The authors report the GOR for their
Khedr [41] ifier is regarded as a tower system as 0.8 which shows that heat re-
packed with 50mm ceramic covery is rather poor in their systems.
Raschig rings..use di- Based on an economic analysis, they
rThe first system tose i conclude that the HDH Process has sig-rect contact condenser in a nificant potential for small capacity de-HDH technology. salination plants as small as 10 m 3 /day.
* The performance param-
eters are calculated numeri-cally.
* The authors have studied the varia-
tion of production in kg/ day and heat
Al-Enzi et * Solar collector designed to and mass transfer coefficients with re-
al. [42] heat air to 90'C spect to variation in cooling water tem-
perature, hot water supply tempera-
ture, air flow rate and water flow rate.
* They conclude that the highest pro-
duction rates are obtained at high hot
" Forced circulation of air. water temperature, low cooling water
temperature, high air flow rate and low
hot water flow rate.a The variation in parameters the au-
" Cooling water circuit for thors have considered is very limited
the condenser. and hence these conclusions are true
only in that range.
a Heater for preheating wa-
ter to 35-45'C.
* Honeycomb paper used ashumidifier packing material.
* Forced convention for the
air circulation.
* This works in a closer-
water open-air cycle.
* Condenser is fin tube type
heat exchanger which alsohelps recover the latent heat
by pre-heating seawater.
e It was found that the performance of
the system was strongly dependent on
the temperature of inlet salt water to
the humidifier, the mass flow rate of
salt water, and the mass flow rate of
the process air.a The authors report that there is an
optimal air velocity for a given top tem-
perature of water.* The top water temperature has a
strong effect on the production of fresh
water.
2.1.3 Closed-air open-water (CAOW) air heated systems
Another class of HDH systems which has attracted much interest is the air heated
system. These systems are of two types - single and multi-stage systems. The air is
heated in a solar collector to a temperature of 80 to 90'C and sent to a humidifier. This
heating process is represented by the constant humidity line 1-2 in the psychometric
chart (Fig. 2-4). In the humidifier, the air is cooled and saturated. This process is
represented by the line 2-3. It is then dehumidified and cooled in the process 3-4
represented on the saturation line. A major disadvantage of this cycle is that the
absolute humidity of air that can be achieved at these temperatures is very low (<6%
by weight). This impedes the water productivity of the cycle.
Chafik [44] reported a method to address this problem. He used a multistage
heating and humidification cycle (Fig 2-5). The air after getting heated in the solar
collector (line 1-2) and humidified in the evaporator (line 2-3) is fed to another solar
collector for further heating (line 3-4) and then to another humidifier (line 4-5) to
attain a higher value of absolute humidity. Many such stages can be arranged to
attain absolute humidity values of 15% and beyond. Point 2' in the figure represents
the high temperature that has to be reached in a single stage cycle to attain the same
50
Dai et al.
[43]

-o
E
Dry bulb temperature, oC
Figure 2-4: Single stage air heated CAOW HDH process on psychometric chart.
humidity as a 3 stage cycle. This higher temperature has substantial disadvantages
for the solar collectors. However, from an energy efficiency point of view, there is not
much of an advantage to multi-staging, as the higher water production comes with a
higher energy input as compared to single stage systems.
Also, from the various studies in literature, we observe that the air-heated systems
have higher energy consumption than water heated systems. This is because air heats
up the water in the humidifier and this energy is not subsequently recovered from the
water, unlike in the water-heated cycle in which the water stream is cooled in the
humidifier.
51

-~~ 56
.. .............i-----....----
Dry bulb temperature,*OC
Figure 2-5: Three stage air heated CAOW HDH process on psychometric chart.
Table 2.3: Features and summary of results from various
previous works on air heated CAOW HDH cycle.
Reference Unit Features Brief summary of the pa-
l I per
* Solar collectors (four-fold-web-plate .h uhrrpotdta hE. Chafik built system is too costly and
[44] art508'.the solar air heaters constitute
40% of the total cost.
* Also he observed that the
eMulti-stage system that breaks up the system can be further im-
humidification and heating in multiple proved by minimizing the pres-
stages. sure drop through the evapora-tor and the dehumidifiers.
Pad humidifier with corrugated cellu-
lose material.t 3 separate heat recovery stages.
Forced circulation of air.
52
At atmospheric pressure I.
4=O.1At atmoispheric pressure
7
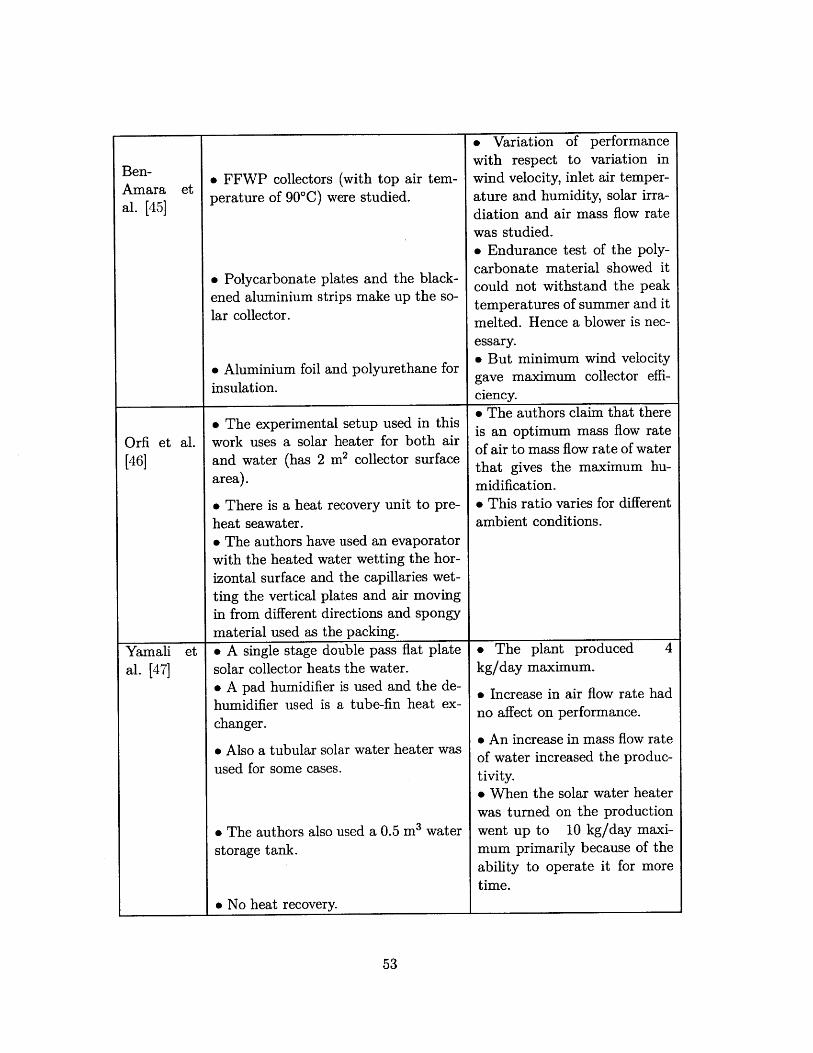
* FFWP collectors (with top air tem-
perature of 90*C) were studied.
* Polycarbonate plates andened aluminium strips make
lar collector.
the black-up the so-
I Aluminium foil and polyurethane for
insulation.
* The experimental setup used in this
work uses a solar heater for both air
and water (has 2 m 2 collector surface
area).
a There is a heat recovery unit to pre-
heat seawater.* The authors have used an evaporator
with the heated water wetting the hor-
izontal surface and the capillaries wet-
ting the vertical plates and air moving
in from different directions and spongy
material used as the packing.
* A single stage double pass flat plate
solar collector heats the water.
* A pad humidifier is used and the de-
humidifier used is a tube-fin heat ex-
changer.
* Also a tubular solar water heater was
used for some cases.
* The authorsstorage tank.
also used a 0.5 m3 water
* The authors claim that thereis an optimum mass flow rateof air to mass flow rate of waterthat gives the maximum hu-midification.* This ratio varies for differentambient conditions.
4* The plant producedkg/day maximum.
* Increase in air flow rate hadno affect on performance.
* An increase in mass flow rateof water increased the produc-tivity.* When the solar water heaterwas turned on the productionwent up to 10 kg/day maxi-mum primarily because of theability to operate it for moretime.
* No heat recovery. I
53
Ben-Amaraal. [45]
et
Orfi et al.[46]
Yamalial. [47]
et
* Variation of performance
with respect to variation in
wind velocity, inlet air temper-
ature and humidity, solar irra-
diation and air mass flow rate
was studied.* Endurance test of the poly-
carbonate material showed it
could not withstand the peak
temperatures of summer and it
melted. Hence a blower is nec-
essary.e But minimum wind velocity
gave maximum collector effi-
ciency.
I

Houcine etal. [48]
* 5 heating and humidification stages.
* First two stages are made of 9 FFWPtype collector of each 4.98 m2 Area.The other collectors are all classicalcommercial ones with a 45 m 2 area forthe third and fourth stage and 27 m2
area for the final stage. Air tempera-ture reaches a maximum of 90*C.
" Air is forced-circulated.
" All other equipment are same as usedby Chafik [26]
2.1.4 HDH systems with mass extractions and injections
A schematic diagram of an embodiment of the HDH system with mass extractions and
injections is shown in Fig. 2-6. The system shown here is a water-heated, closed-air,
open-water system with three air extractions from the dehumidifier into the humid-
ifier. States a to d are used to represent various states of the seawater stream and
states e and f represent that of moist air before and after dehumidification.
Even though there has been no clear conceptual understanding of how the thermal
design of HDH systems with mass extraction/injection should be carried out, a small
number of studies in literature discuss limited performance characteristics of these
systems. Miller-Holst pioneered the thermal balancing of HDH systems by propos-
ing to balance the stream-to-stream temperature difference in the HME devices by
'continuous' variation of the water-to-air mass flow rate ratio [49, 50]. The moist
54
~
_________________________________________________ I
* Maximum production of wa-
ter was 516 L/day.
a Plant tested for a period of 6months.
* Major dilation is reportedto have been formed on thepolycarbonate solar collectorplates.* Due to hardness of the sea-water, there were corrosion is-sues.* The water production costfor this system is (for a 450-500litre/day production capacity)28.65 Euro/m 3 which is high.* 37% of the cost is that of thesolar collector field.
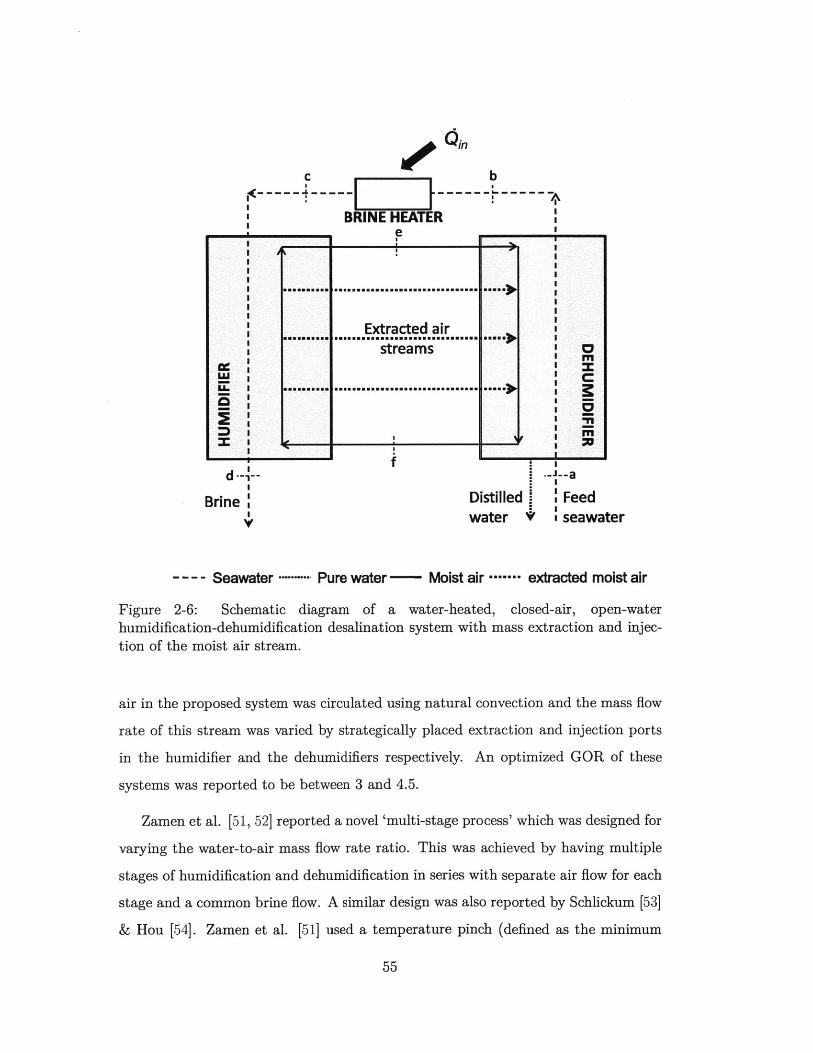
in
c bABRINE HEATER
d ---
Brine
e
Extracted airstreams
f
Distilled Feedwater seawater
- - - - Seawater Pure water - Moist air . extracted moist air
Figure 2-6: Schematic diagram of a water-heated, closed-air, open-waterhumidification-dehumidification desalination system with mass extraction and injec-tion of the moist air stream.
air in the proposed system was circulated using natural convection and the mass flow
rate of this stream was varied by strategically placed extraction and injection ports
in the humidifier and the dehumidifiers respectively. An optimized GOR of these
systems was reported to be between 3 and 4.5.
Zamen et al. [51, 52] reported a novel 'multi-stage process' which was designed for
varying the water-to-air mass flow rate ratio. This was achieved by having multiple
stages of humidification and dehumidification in series with separate air flow for each
stage and a common brine flow. A similar design was also reported by Schlickum [53]
& Hou [54]. Zamen et al. [51] used a temperature pinch (defined as the minimum
55
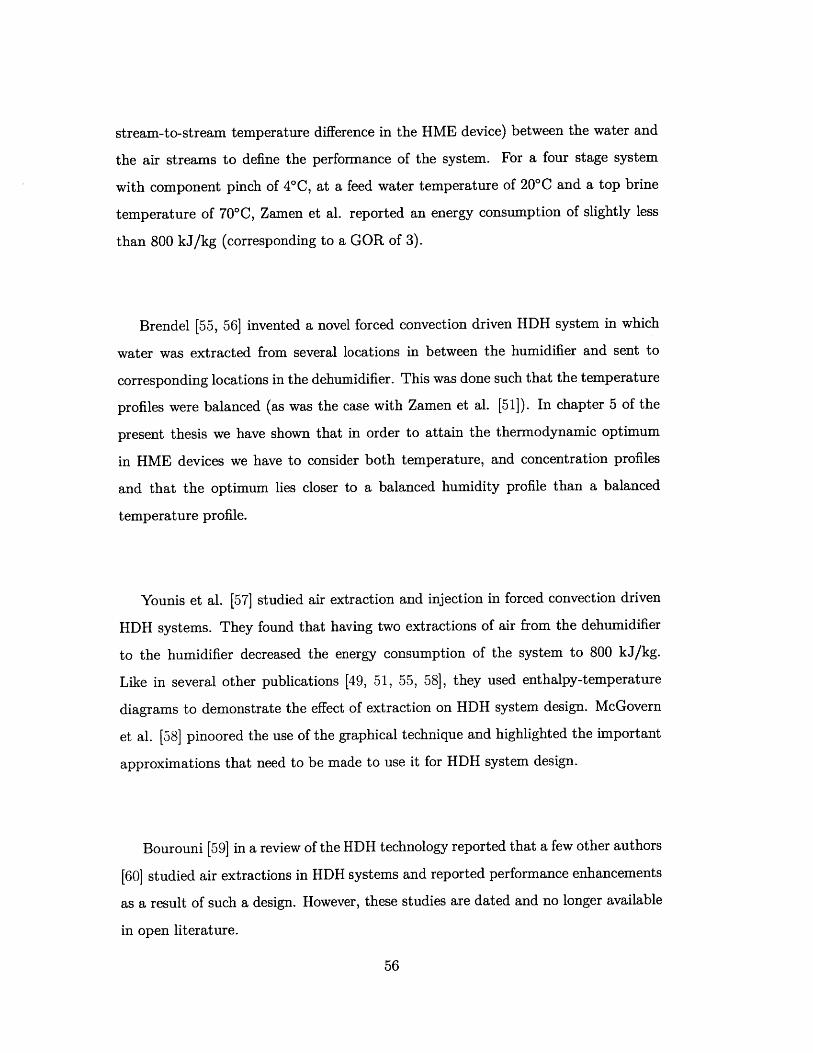
stream-to-stream temperature difference in the HME device) between the water and
the air streams to define the performance of the system. For a four stage system
with component pinch of 4*C, at a feed water temperature of 20*C and a top brine
temperature of 70*C, Zamen et al. reported an energy consumption of slightly less
than 800 kJ/kg (corresponding to a GOR of 3).
Brendel [55, 56] invented a novel forced convection driven HDH system in which
water was extracted from several locations in between the humidifier and sent to
corresponding locations in the dehumidifier. This was done such that the temperature
profiles were balanced (as was the case with Zamen et al. [51]). In chapter 5 of the
present thesis we have shown that in order to attain the thermodynamic optimum
in HME devices we have to consider both temperature, and concentration profiles
and that the optimum lies closer to a balanced humidity profile than a balanced
temperature profile.
Younis et al. [57] studied air extraction and injection in forced convection driven
HDH systems. They found that having two extractions of air from the dehumidifier
to the humidifier decreased the energy consumption of the system to 800 kJ/kg.
Like in several other publications [49, 51, 55, 58], they used enthalpy-temperature
diagrams to demonstrate the effect of extraction on HDH system design. McGovern
et al. [58] pinoored the use of the graphical technique and highlighted the important
approximations that need to be made to use it for HDH system design.
Bourouni [59] in a review of the HDH technology reported that a few other authors
[60] studied air extractions in HDH systems and reported performance enhancements
as a result of such a design. However, these studies are dated and no longer available
in open literature.
56

2.2 Alternate cycles resembling the HDH process
2.2.1 Dew-vaporation technique
Beckmann and coworkers have invented [61] and investigated [62, 63] a desalination
technology that works on the humidification dehumidification principle. They call
it the 'Dew-vaporation' technique (figure 2-7). Unlike the HDH process, it uses a
common heat transfer wall between the humidifier (which they call the evaporation
chamber) and the dehumidifier (which they call the dew formation chamber). The
latent heat of condensation is directly recovered through this wall for the humidifica-
tion process. It is reported that the use of this common heat transfer wall makes the
process energy efficient.
In this process the saline water, after being preheated using the exit distillate
water stream, wets the heat transfer wall and is heated by means of the latent heat
of condensation from the dew-formation chamber. It then evaporates into the air
stream, humidifying it. The humidified air stream is then heated using an external
source and is fed to the dehumidifier at a temperature higher than the temperature of
air leaving the humidifier. While, heat is directly recovered from the dew-formation
tower, it should be noted that the condensation process itself is relatively ineffec-
tive. The dehumidified air exits the tower at a high temperature of around 50*C
(compared to 30-35*C in a HDH cycle). Also, the coupling of the humidification and
dehumidification processes sacrifices the modularity of the HDH system and the re-
lated opportunities to optimize subsystem design and performance separately. Since
a single wall is used for both dehumidification and humidification there is hardly any
optimization possible to the heat exchange surfaces which can improve the transfer
rates (for example, the 'equivalent' heat transfer coefficient in the dehumidification
process was in some cases is as low as 1 W/m 2 -K). However, Hamieh et al. [62] has
reported that the energy efficiency of this system is higher than regular HDH systems
(a GOR of about 5).
57
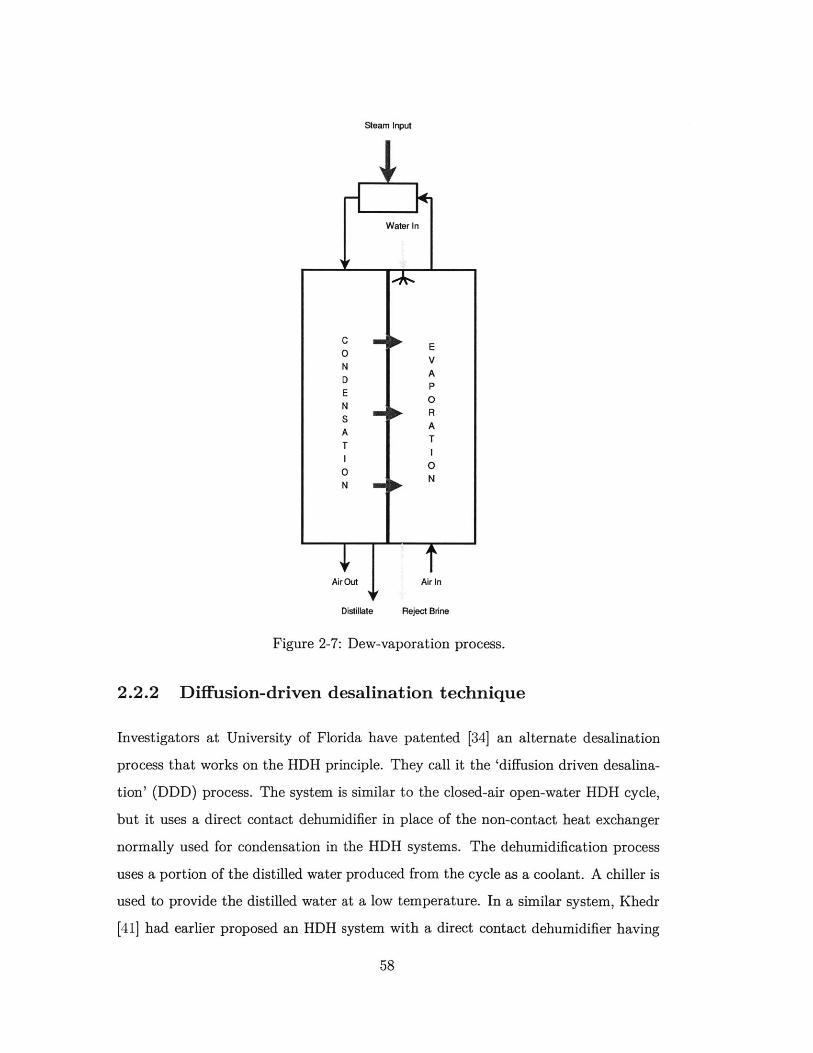
Steam Input
Distillate Reject Brine
Figure 2-7: Dew-vaporation process.
2.2.2 Diffusion-driven desalination technique
Investigators at University of Florida have patented [34] an alternate desalination
process that works on the HDH principle. They call it the 'diffusion driven desalina-
tion' (DDD) process. The system is similar to the closed-air open-water HDH cycle,
but it uses a direct contact dehumidifier in place of the non-contact heat exchanger
normally used for condensation in the HDH systems. The dehumidification process
uses a portion of the distilled water produced from the cycle as a coolant. A chiller is
used to provide the distilled water at a low temperature. In a similar system, Khedr
[41] had earlier proposed an HDH system with a direct contact dehumidifier having
58

ceramic Raschig rings as the packing material. The specific energy demand of the
DDD process (GOR is about 1.2) is higher for this cycle than for a normal HDH
cycle. This is because the latent heat of condensation is captured in two steps (from
the moist air stream to the pure water stream in the direct contact device and then
from the pure water stream to the brine in a liquid-to-liquid heat exchanger).
2.2.3 Atmospheric water vapor processers
Wahlgren [641 reviewed various processes that extract the humidity from ambient
air. These processes are called dew collection processes and the system is sometimes
called an atmospheric vapor processer. Three different methods have been applied in
these systems: (1) surface cooling using heat pumps or radiative cooling devices; (2)
using of solid/liquid desiccants to concentrate the moisture in atmospheric air before
condensing it out; and (3) convection-induced dehumidification in a tower structure.
While it may seem promising to take advantage of air that is already humidified
and a cycle which consists of only dehumidification (which is by itself exothermic),
some major drawbacks accompany this concept of water extraction. The absolute
humidity in ambient air found in most places around the world is low, and hence to
produce a reasonable amount of water a large amount of air needs to circulate through
the process equipment. Also, even though the dehumidification process is exothermic
the possibility of extracting any thermodynamic advantage from it exists only when
a lower temperature sink is available. On the contrary, the energy consumption of
these devices has been reported to be much higher than HDH systems. The theoritical
minimum energy consumption for these systems is 681 kWh/m 3 . The actual energy
consumption is bound to be much higher than the limit. Even this reversible limit is
higher than the energy consumption of existing HDH systems.
59

2.3 Review of components in the HDH system
2.3.1 Humidifiers
Many devices are used for air humidification including spray towers, wetted-wall tow-
ers and packed bed towers [651. The principle of operation for all of these devices is
the same. When water is brought into contact with air that is not saturated with
water vapor, water evaporates into air and raises the humidity of the air. The driving
forces for this humidification process are the concentration and temperature differ-
ences between the water-air interface and the water vapor in air. The concentration
difference depends on the vapor pressure at the gas-liquid interface and the partial
pressure of water vapor in the air.
Any of the above mentioned devices can be used as a humidifier in the HDH
system. A spray tower for instance consists essentially of a cylindrical vessel in which
water is sprayed at the top of the vessel and moves downward by gravity dispersed
in droplets within a continuous air stream flowing upward. These towers are simple
in design and have minimal pressure drop on the gas side. It is generally known that
this device has high capacity but low efficiency. The low efficiency is as a result of
the low water holdup due to the loose packing flow [661. The diameter-to-length ratio
is a very important parameter in spray tower design. For a large ratio air will be
thoroughly mixed with the spray. Small diameter-to-length ratio will let the spray
quickly reach the tower walls, forming a film becoming ineffective as a spray. Design
of spray towers requires knowledge of heat and mass transfer coefficients as well as the
contact surface area of the water droplets. Many empirical correlations and design
procedures are given in Kreith and Boehm [661.
Younis et al. [57] and Ben-Amara et al. [45] used a spray tower as the humidifier
in their HDH systems. Ben-Amara et. al tested the spray tower humidifier by varying
the ratio of water-to-dry air mass flow rate and keeping the inlet water temperature
and absolute humidity constant. The inlet air temperature (80'C) was higher than
the water spray temperature (60*C). They found that increasing the amount of water
sprayed increased the absolute outlet humidity. However, further increase in the water
60

quantity resulted in air cooling and this condensed some of the water vapor content
in the air. This means a decrease in the absolute humidity, although the outlet air
is always saturated. Therefore, for air heated HDH cycles there is an optimum value
of the mass flow ratio which gives maximum air humidity. This fact promotes the
use of multi-stage air heater and humidifier combinations to increase the fresh water
production.
Wetted-wall towers have been used as humidifier in HDH systems by Miller-H6lst
[49] and Orfi et al. [46]. In a wetted-wall tower, a thin film of water is formed run-
ning downward inside a vertical pipe, with air flowing either co-currently or counter-
currently. Water is loaded into the top of the tower and a weir distributes the flow of
water around the inner perimeter of the tube that wets the inner surface of the tube
down its length. Such devices have been used for theoretical studies of mass trans-
fer, since the contact area can be calculated, accurately. In Miller-H16st's system,
heated water was distributed onto vertically hanging fleeces made of polypropylene
and trickled downward. The air move in countercurrent flow to the brine through
the humidifier and becomes saturated at the outlet. On the other hand, Orfi et al.
[46] used a different design for their wetted-wall humidifier. To improve the heat and
mass exchange process, they covered the wooden vertical wetted-walls with a cotton
wick to reduce the water flowing velocity and use the capillary effect to keep the
vertical walls always wetted. Their design shows higher performance with about 100
% humidification efficiency.
To increase the humidification efficiency, packing is typically used. This helps
by increasing the dispersion of water droplets, the contact area and contact time.
Devices that contain packing material are known as packed bed towers and special
types that are used to cool water are called cooling towers. These are vertical columns
filled with packing materials with water sprayed at the top and air flows in counter
or cross flow arrangement. Packed bed towers have been used by many researchers as
a humidifier device in HDH desalination systems because of the higher effectiveness.
Different packing materials have been used as well. The factors influencing the choice
of a packing are its heat and mass transfer performance, the quality of water, pressure
61
drop, cost and durability.
In general, all of these humidification devices are relatively low cost at reasonable
performance unlike the dehumidifiers which are known to have low heat and mass
transfer rates due to the presence of large concentrations of non-condensable gas
(equivalent heat transfer coefficients as low as 1 W/m 2 -K) in what is typically a film
condensation process. These dehumidifiers are reviewed in the following paragraphs.
2.3.2 Dehumidifiers
The types of heat exchangers used as dehumidifiers for HDH applications vary. For
example, flat-plate heat exchangers were used by Mfiller-H61st et al. [49]. Others
used finned tube heat exchangers [44, 46]. A long tube with longitudinal fins was
used in one study [37], while a stack of plates with copper tubes mounted on them in
another study [40]. Bourouni et al. [67] used a horizontal falling film-type condenser.
A flat plate heat exchanger made of double webbed slabs of propylene was used by
Miller-H61st [49] in his HDH system. The distillate runs down the plates trickling into
the collecting basin. Heat recovery is achieved by transferring heat to the cold seawa-
ter flowing inside the flat plate heat exchanger. The temperature of seawater in the
condenser increases from 40*C to 75C. In a similar study, Chafik [44] used seawater
as a coolant wherein the water is heated by the humid air before it is pumped to the
humidifiers. Three heat exchangers were used in three different condensation stages.
An additional heat exchanger is added at the intake of seawater (low temperature
level) for further dehumidification of air. The heat exchangers (or dehumidifiers) are
finned tube type air coolers. It is important to note that to withstand the corrosive
nature of seawater; stainless steel is used for frames, collecting plates, while the fins
are made of aluminum. In addition, special attention was exercised to avoid leakage
of distillate water.
Different designs of condensers in a HDH cycle were used by Farid et al. [37]. In a
pilot plant built in Malaysia, the dehumidifier was made of a long copper-galvanized
steel tube (3 m length, 170 mm diameter) with 10 longitudinal fins of 50 mm height
on the outer tube surface and 9 fins on the inner side. In another location, they used
62

a simplified stack of flat condenser made of 2 x 1 m 2 galvanized steel plates with
long copper tubes mounted on each side of the plate to provide a large surface area.
The condenser size was made large, particularly to overcome the small heat transfer
coefficients both on the air- and water-sides due to relatively low air velocity, as well
as low water flow rates.
In another design, the dehumidifier was made of 27 m long copper pipe having
a 10 mm OD, mechanically bent to form a 4 m long helical coil fixed in the PVC
pipe. The preheated feed water was further heated in a flat plate collector. The hot
water leaving the collector was uniformly distributed over a wooden shaving packing
in a 2 m long humidifier. It is important to note that the condenser or dehumidifier
was made of hard PVC pipes connected to form a loop with the blower fixed at the
bottom. The condenser was made of a copper pipe mechanically bent to form a helical
coil fixed in the PVC pipe.
Bourouni et al. [67] used a condenser made of polypropylene which was designed
to work at low temperatures (70-90*C) for a HDH system. It is similar to a horizontal
falling film-type condenser. At the top of the dehumidifier, the hot humid air is forced
down where the distilled water is recovered. It is important to note that heat recovery
in an HDH system requires a larger heat transfer area for improving the overall system
performance. For this reason, 2000 m of tubes are used in the evaporator, while 3000
m of tubes in the condenser.
The system Orfi et al. [46] used had two solar heaters, one for heating water and
the other for heating air. The condenser, that uses seawater for cooling, consists of a
chamber with a rectangular cross section. It contains two rows of long cylinders made
of copper in which the feed water flows. Longitudinal fins were soldered to the outer
surface of the cylinders. The condenser is characterized by heat-transfer surface area
of 1.5 m2 having 28 m as a total length of the coil.
63
2.4 Performance benchmarking of HDH systems
A detailed literature review has been conducted in this chapter. Based on this review,
we try to benchmark the key performance metrics of existing HDH systems: (1) the
cost of water production; (2) the heat and mass transfer rates in the dehumidifier;
and (3) the system energy efficiency (GOR).
The total cost of water production in HDH systems is mostly a sum of the energy
cost (captured by the GOR of the system) and the capital cost'. A large fraction
of the capital investment in typical HDH systems is the dehumidifier cost. This is
driven by the low heat and mass transfer rates in the device. It has been reported
that the 'equivalent' heat transfer coefficient in the dehumidifier is between 1 and
100 W/m 2-K [42, 62]. This is two orders of magnitude lower than for pure vapor
condensers.
Using the data given in various papers, GOR for the reported systems was cal-
culated. It was found that the maximum GOR among existing HDH systems was
about 3. Figure 2-8 illustrates the GOR of a few of the studies. The GOR varied
between 1.2 to 3. These values of GOR translate into energy consumption rates from
215 kWhth/m 3 to 550 kWhth/m 3. The low value of GOR achieved by Ben Bacha et
al. [36] was because they did not recover the latent heat of condensation. Instead,
they used separate cooling water from a well to dehumidify the air. Lack of a system-
atic understanding of the thermal design of HDH systems which can help optimize
performance is the reason behind such inefficient designs. The higher value of GOR
achieved by Miiller-H5lst et al. [49] was because of high heat recovery (using the con-
cept of thermodynamic balancing explained in Chapter 5). These results tell us the
importance of maximizing heat recovery in minimizing the energy consumption and
the operating and capital cost of HDH systems. It is also to be noted that the GOR
varied from 3 to 4.5 in Miller-Hl61st's system because of the inability of that system
to independently control the air flow by natural convection. It is, hence, desirable to
develop forced convection based systems which have a sustainable peak performance.
64
'The system is almost maintenance-free.

Based on a simple thermodynamic calculation, the GOR of a thermodynamically
reversible HDH system can be evaluated to be 122.5 for typical boundary conditions
(see Appendix A). When compared to a GOR of 3 for existing systems, the reversible
GOR of 122.5 shows that there is significant potential for improvement to existing
HDH systems in terms of reducing thermodynamic losses, and this gives ample mo-
tivation to study the thermal design of these systems in detail.
5
O 4 ~ -to 4.5
3-CL
0
C
0 JAl-Hallaj et Ben Bacha et Farid et al., Nawayseh et Muller-Hoist Klausner &
al. 1998. al., 2003. 1998 Ed., 1999 et al., 2007 Mel., 2005
Figure 2-8: Performance of HDH systems in literature.
A few studies in literature actually report the overall cost of water production in
a HDH system [44, 48, 49]. This cost is found to be about $30 per cubic meter of
water produced which is very high. The central goal of the science developed in this
thesis is to reduce this cost to affordable levels (<$5 per cubic meter).
2.5 Unanswered questions
Based on the literature review presented in the current chapter, it is clear that to
reduce the overall cost of water production to affordable levels in HDH systems,
several unanswered issues need to be addressed. These include:
1. Development of systematic methodologies for modeling the humidifier and the
dehumidifier in the context of the overall HDH system design and analysis;
65

2. Development of thermal design algorithms to minimize thermodynamic losses
in the humidifier and the dehumidifier;
3. Understanding the thermodynamic relationships that govern the efficiency of
various embodiments of HDH;
4. Applying the aforementioned understanding to developing energy efficient ver-
sions of the HDH cycle;
5. Developing detailed methodology for design of forced convection based HDH
systems with mass extractions and injections; and
6. Developing methods to increase the heat and mass transfer rates in the dehu-
midifier.
In the following chapters, all of these issues are addressed.
66

Chapter 3
Thermal design of simultaneous
heat and mass exchange (HME)
devices
A simultaneous heat and mass exchanger (HME) is a device that is used to transfer
heat and mass between two fluid streams at different temperatures and concentrations.
Thermal contact between the fluid streams will occur through direct contact of the
streams if mass is transferred between them or through indirect contact via a heat
transfer surface if the mass transfer is associated with phase change in just one stream
with no mass tranfer between the two streams. Accordingly, they are classified as
direct contact devices (e.g., packed bed humidifiers and cooling towers) and indirect
contact devices (e.g., shell-and-tube dehumidifiers and cooling coils). Understanding
the thermodynamics of these devices is crucial to optimizing the thermal performance
of HDH systems. This also has application in other fields of thermal design (such as
cooling towers for thermal power plants and cooling coils in air conditioning systems).
3.1 Control volume models
As mentioned above, HME devices are widely used in power generation, desalination,
air conditioning, and refrigeration systems, and their performance is vital to the
67

Table 3.1: Various definitions ofchange components.
effectiveness for simultaneous heat and mass ex-
overall system performance. For example, the thermal performance of cooling towers
is critical to the overall performance of steam or combined cycle power plants in
which they are used [68, 691. For analysis and optimization of cycles containing
these components, defining an effectiveness to characterize their performance has
considerable advantages [18, 19, 70]. It is, therefore, important to critically examine
various definitions of effectiveness that are used in the literature.
In HME literature, several definitions for effectiveness are in use, but they are
specific to certain configurations and boundary conditions. The effectiveness defini-
tions that are used for cooling towers, humidifiers, and cooling coils are summarized
in Table 3.1.
In cooling tower literature [68, 71], an effectiveness is commonly defined based on
the temperature change of one of either the air or the water streams, typically, the
change in water temperature. This definition can also be written using terminology
68
Reference fed de- Defined forfined
Mandi et al. [68]; ATCheremisinoff and eT = Tidal Cooling towersCheremisinoff [71]
Nellis and Klien [72] O DehumidifierA hideal
Nellis and Klien[72] h = Ah DehumidifierJhelal
Jaber and Webb [731 Fj = Qact Cooling towersrhmod z

commonly used in cooling towers: (a) Range, the change in water temperature be-
tween the inlet and the outlet; and (b) Approach, the difference between the water
exit temperature and the inlet air wet-bulb temperature:
RangeEr = Rne(3.1)
Range + Approach
Nellis and Klien [72] present a modified definition of effectiveness for a cooling coil
(dehumidifier) based on humidity ratio and specific enthalpy of the moist air stream,
and, they provide several examples of the use of these effectivenesses for cooling coil
design in their textbook.
Jaber and Webb [73] proposed a modified definition of effectiveness based on an
analogy between counterflow heat exchangers and counterflow cooling towers. They
defined the maximum possible heat transfer rate as the product of the minimum mod-
ified mass flow rate (ra) and the maximum air side enthalpy potential difference:
-mod = rncA" (3.2)
where
f dha'at (3.3)dTw
S *md = min(Thmod, ,a) (3.4)
where f' is the average slope of the saturated moist air enthalpy with water tem-
perature. It should be noted that they neglect the effect of evaporation on rh, and
assume that the saturation enthalpy curve for moist air is linear with temperature.
This definition is examined in more detail in a succeeding section (Sec. 3.1.1).
The above literature review suggests a need to critically examine the existing
effectiveness definitions and to identify one which is robustly applicable to a large
class of HME devices. Thus, this paper seeks to answer the following questions: Can
a single definition of effectiveness be given which will apply to all types of HME
devices? For what situations can one apply the existing definitions of effectiveness?
What is the significance of the heat capacity rate ratio to HME devices and how
69
can it be defined without any approximations about fluid properties? What is the
analogy of a balanced heat exchanger in the case of a heat and mass exchanger? How
does thermal balancing affect the effectiveness definitions? Which is the 'balanced'
thermodynamic state in a HME devices?
3.1.1 New heat and mass exchanger (HME) terminology
In this section, new terminology for HME devices is defined. This includes an energy-
based effectiveness and a modified heat capacity rate ratio.
Energy effectiveness
An energy based effectiveness, analogous to the effectiveness defined for heat exchang-
ers, is given in Eq. (3.5):
e = .(3.5)AlHmax
This definition is based on the maximum change in total enthalpy rate that can
be achieved in an adiabatic heat and mass exchanger. It is defined as the ratio of
change in total enthalpy rate to maximum possible change in total enthalpy rate. The
maximum possible change in total enthalpy rate can be of either the cold or the hot
stream, depending on the heat capacity rate of the two streams. The stream with
the minimum heat capacity rate dictates the thermodynamic maximum that can be
attained. To elucidate this concept, consider the example of a counterflow cooling
tower.
Figure 3-1 illustrates the Second Law limitations imposed on such a device. Here,
'wb,1' is the wet-bulb point of the air at the inlet to the humidifier and 'a,2' is the
exit air state. The air is assumed to be saturated at the inlet and hence, Twb,1 = Ta,1.
The saturation line connecting the point 'wb,1' to 'a,2' represents one possible process
path for the humidification process.
The maximum dry bulb temperature that can be achieved by the saturated air
at the exit of the humidifier is the water inlet temperature (indicated by point 'a,3').
From Fig. 3-1, it is seen that the maximum enthalpy change possible (/Xtmax) for
70
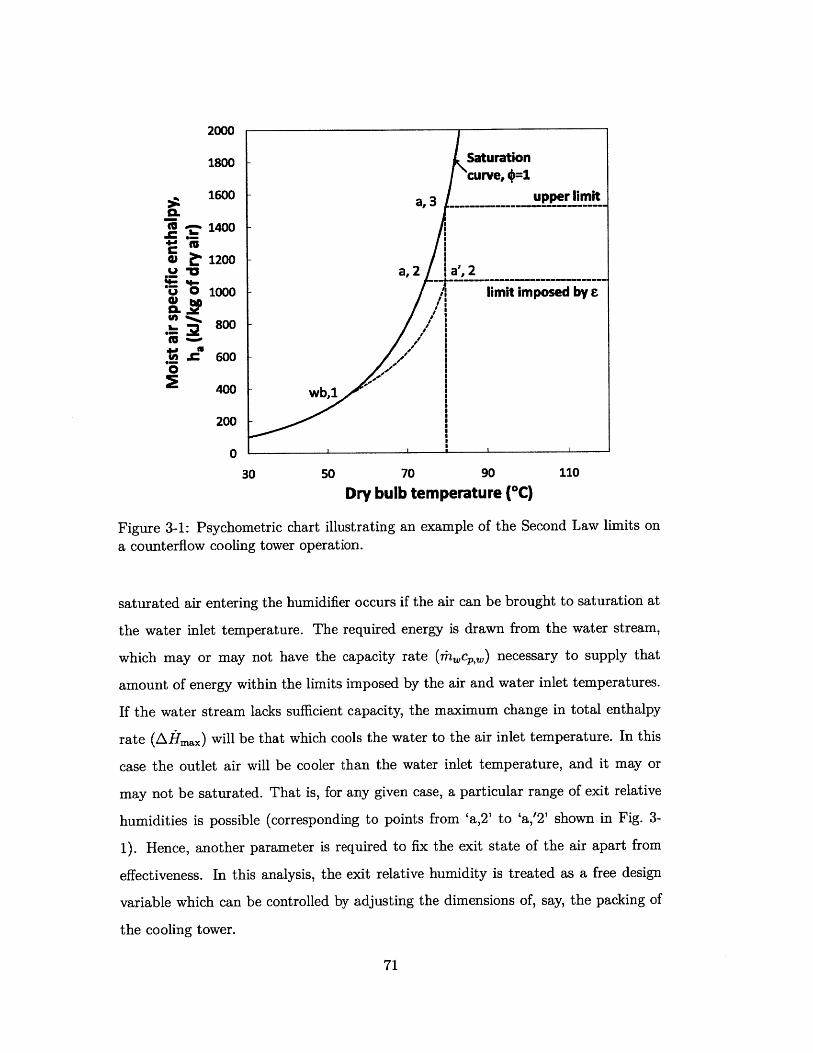
2000
1800 - aurauuncurve,*=1
:A 1600 a, 3 upper li
CL"M - 1400-
0 t' 1200.- 0 a, 2 la',2
OU 0 1000 limit imposed by eCLin, _ 00 /19% 2 /f
S600
400 wb,1
200
0
30 50 70 90 110
Dry bulb temperature (*C)
Figure 3-1: Psychometric chart illustrating an example of the Second Law limits ona counterflow cooling tower operation.
saturated air entering the humidifier occurs if the air can be brought to saturation at
the water inlet temperature. The required energy is drawn from the water stream,
which may or may not have the capacity rate (ilc,,,) necessary to supply that
amount of energy within the limits imposed by the air and water inlet temperatures.
If the water stream lacks sufficient capacity, the maximum change in total enthalpy
rate (AHma,) will be that which cools the water to the air inlet temperature. In this
case the outlet air will be cooler than the water inlet temperature, and it may or
may not be saturated. That is, for any given case, a particular range of exit relative
humidities is possible (corresponding to points from 'a,2' to 'a,'2' shown in Fig. 3-
1). Hence, another parameter is required to fix the exit state of the air apart from
effectiveness. In this analysis, the exit relative humidity is treated as a free design
variable which can be controlled by adjusting the dimensions of, say, the packing of
the cooling tower.
71

It is important to note that the energy effectiveness concept applies to all types of
HME devices, not simply counterflow cooling towers. This includes humidifiers and
dehumidifier used in HDH systems.
Heat capacity rate ratio
In the limit of infinite heat transfer area for a pure heat exchanger, the entropy
generation rate in the exchanger is entirely due to what is known as thermal imbalance
or remanent irreversibility. This thermal imbalance is associated with conditions at
which the heat capacity rate ratio is not equal to unity [74]. In other words, a
heat exchanger is said to be thermally 'balanced' at a heat capacity rate ratio of
one. This concept of thermodynamic balancing, even though very well known for
heat exchangers, was only recently extended to HME devices (and is reported in the
Sec. 3.2 of this chapter). It is important to establish a reliable definition for the heat
capacity rate ratio for an HME in order to understand its influence on selecting the
appropriate definition of effectiveness.
In some cases, the heat capacity rate of one of the streams of a simultaneous heat
and mass exchangers cannot be defined readily. For example, in a counterflow cooling
tower (where hot water is losing heat and mass to humid air), it is not possible to
define the change in enthalpy of the moist air stream as the product of specific heat
capacity at constant pressure and change in temperature because the humidity ratio
also affects moist air enthalpy, ha:
ha = f T,p, w (3.6)
If the effect of pressure variation on enthalpy is neglected,
dha =c', - dT + -dw (3.7)O p,T
where
C'A = T (3.8)
72

Hence, the heat capacity rate ratio cannot be calculated as it is for heat exchangers.
Braun et al. [75] found a way around this problem by defining an effective heat ca-
pacity of the moist air stream as slope of the saturated specific enthalpy line evaluated
at water temperatures:
CpA = dha, sat (3.9)dTw
which is identical to the enthalpy correction factor f', Eq. (3.3), defined by Jaber and
Webb [73]. This approximation has reasonable accuracy (under certain operating
conditions) for cooling tower cases. However, in certain cases were the humidity
levels are relatively high (e.g., in a direct contact counterflow air humidifier or an
indirect contact dehumidifier), a sizable error is induced.
Therefore, we introduce a modified heat capacity ratio based on the total enthalpy
rate change which is accurate in all ranges of humidity and temperature levels. This
is defined using an analogy to heat exchangers. For heat exchangers,
HCRHE ccp, (310)Mhcp,h
This can be rewritten as(AHmxc'
HCRHE max,c (311)AHmax,h
since the maximum temperature difference in Afmax,c and Afmax,h is the same (i.e.,
Afmax,k = rhkCp,k - (Th,; - T,;), where k = c or h). Similarly, for an HME device, we
define
HCR = (A. max,c (3.12)AHmax,h(3
The validity of this definition is proven using several examples in Sec. 3.2.
Non-dimensional entropy generation
For heat exchangers, it is shown in Sec. 3.2.1 that a non-dimensional entropy gener-
ation term appears in the derivation. Similarly, we define a non-dimensional
term for heat and mass exchangers.
73
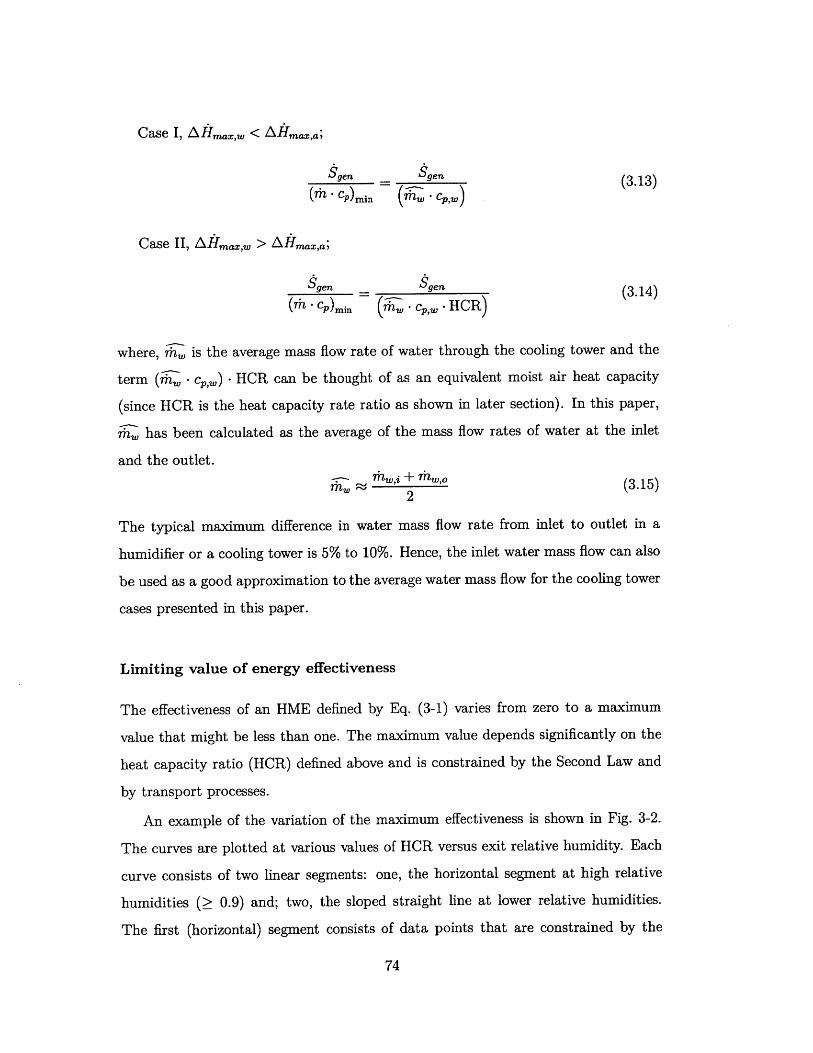
Case I, Afmaxw < Afmax,a;
gen _ Sen (3.13)(mh -CO)M (m l -c,,,)
Case II, Afmax,w > Af5m2,a;
Sgen Sge (3.14)(rh - c,)mi (mW, -c,,. - H CR)
where, mhw is the average mass flow rate of water through the cooling tower and the
term (mW - cp,,) - HCR can be thought of as an equivalent moist air heat capacity
(since HCR is the heat capacity rate ratio as shown in later section). In this paper,
mhw has been calculated as the average of the mass flow rates of water at the inlet
and the outlet.
m 1 " 2 (3.15)U?2
The typical maximum difference in water mass flow rate from inlet to outlet in a
humidifier or a cooling tower is 5% to 10%. Hence, the inlet water mass flow can also
be used as a good approximation to the average water mass flow for the cooling tower
cases presented in this paper.
Limiting value of energy effectiveness
The effectiveness of an HME defined by Eq. (3-1) varies from zero to a maximum
value that might be less than one. The maximum value depends significantly on the
heat capacity ratio (HCR) defined above and is constrained by the Second Law and
by transport processes.
An example of the variation of the maximum effectiveness is shown in Fig. 3-2.
The curves are plotted at various values of HCR versus exit relative humidity. Each
curve consists of two linear segments: one, the horizontal segment at high relative
humidities (> 0.9) and; two, the sloped straight line at lower relative humidities.
The first (horizontal) segment consists of data points that are constrained by the
74
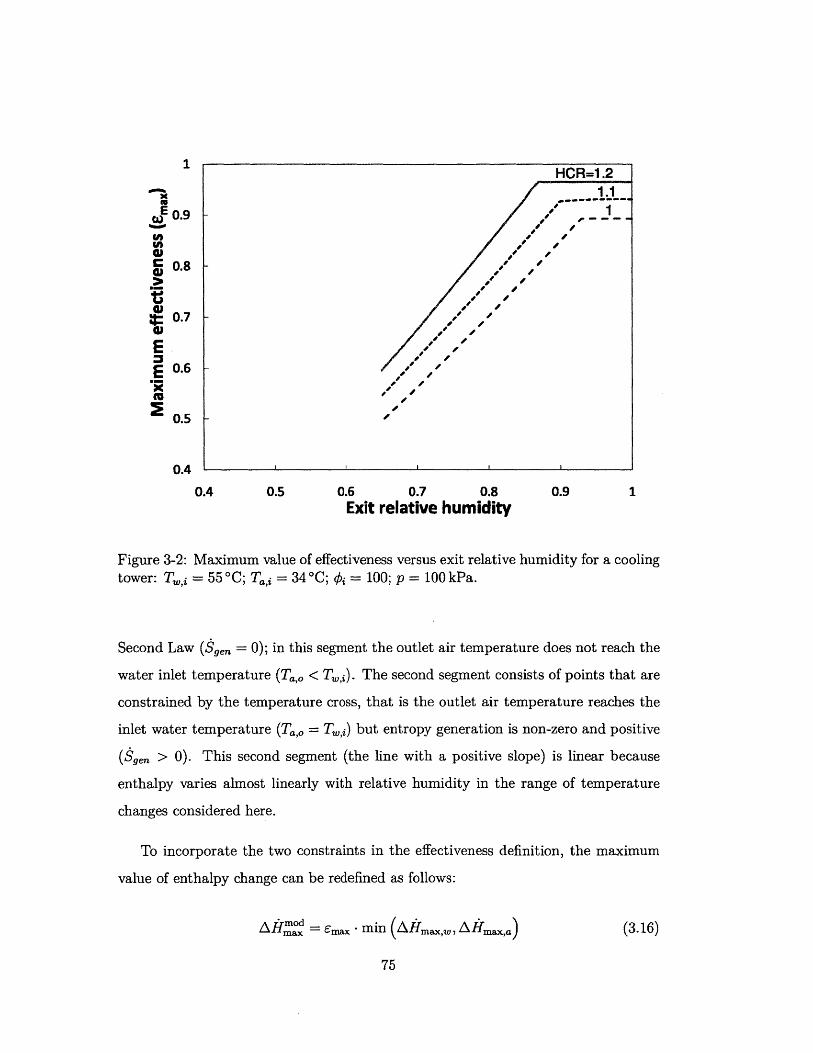
1
M . -1 - -- - -
E0.4 *J
If
C 0.8 ,
0.7 .08
0 .4 0.5 0./. . .
Exit relative humidity
Figure 3-2: Maximum value of effectiveness versus exit relative humidity for a coolingtower: T,i = 55*C; T,, = 34*C; #i = 100; p = 100 kPa.
Second Law ($.=0); in this segment the outlet air temperature does not reach the
water inlet temperature (T,,, < T,;,). The second segment consists of points that are
constrained by the temperature cross, that is the outlet air temperature reaches the
inlet water temperature (Ta,O = T,1,) but entropy generation is non-zero and positive
($g,, > 0). This second segment (the line with a positive slope) is linear because
enthalpy varies almost linearly with relative humidity in the range of temperature
changes considered here.
To incorporate the two constraints in the effectiveness definition, the maximum
value of enthalpy change can be redefined as follows:
HEmma =max - min (Anmax,w, Amax,a) (3.16)
75

and Eq. (3.5) would be modified to:
emod = .d (3.17)
Equation (3.17) ensures that the effectiveness varies from 0 to 1 (as for heat
exchangers). However, this modification to the definition of effectiveness will make
it very cumbersome to evaluate effectiveness a priori. Hence, the definition given in
Eq. (3.5) is recommended and will be used in this thesis.
3.1.2 Equations and modeling details
This section discusses the conservation equations for indirect and direct contact HME
devices. The following reasonable approximations are made in the conservation equa-
tions.
" The processes involved operate at steady-state conditions.
" There is no heat loss from the components to the surroundings.
" Kinetic and potential energy terms are neglected in the energy balance.
Direct contact heat and mass exchangers
Consider a counterflow cooling tower (Fig. 3-3) in which one fluid stream is pure
water and the other stream is a mixture of air and water vapor. Since the dry air
that enters the device in the humid air stream all leaves in the humid air stream, the
mass flow rate of dry air is constant:
da = mda,i = raa,o (3.18)
A mass balance on the water in the cooling tower gives the mass flow rate of the
water leaving the humidifier in the water stream:
m.,O = mhi - rnda (Wa,o - WO) (3.19)
76

Water stream
Twji; Ta,o; coo ; 40
w,i rda
/ CV
Coolingtower
Tw,o ; Ta,i ; i ; #iMWo rhda
Humid air stream
Figure 3-3: Control volume for counterflow cooling tower.
Based on Eq. (3.5), the energy effectiveness, e, may be written in terms of mass
flow rates, temperatures, and humidity ratios. However, in order to determine the
maximum possible change in enthalpy rate, it must be known whether the air stream
or the water stream is the hot stream.
When the water enters hotter than the air, the ideal condition that the water
stream can attain is that the temperature at the exit equals the inlet air wet-bulb
temperature. This corresponds to the enthalpy driving force (which is nothing but
the enthalpy potential difference between the two streams driving the heat and mass
transfer) becoming zero at the water exit [761. The ideal condition that the moist air
stream can reach is saturation at the inlet water temperature. As explained earlier this
is a limit imposed by the rate processes (T, < Te,). When the air enters hotter than
the water stream, the ideal conditions that can be attained by the air and the water
is different to the case with hot water entering the HME. These again correspond to
the driving enthalpy difference becoming zero for the respective streams.
Based on the above discussion, the effectiveness definition of a counterflow direct
contact HME device with hot water entering is written as follows:
77
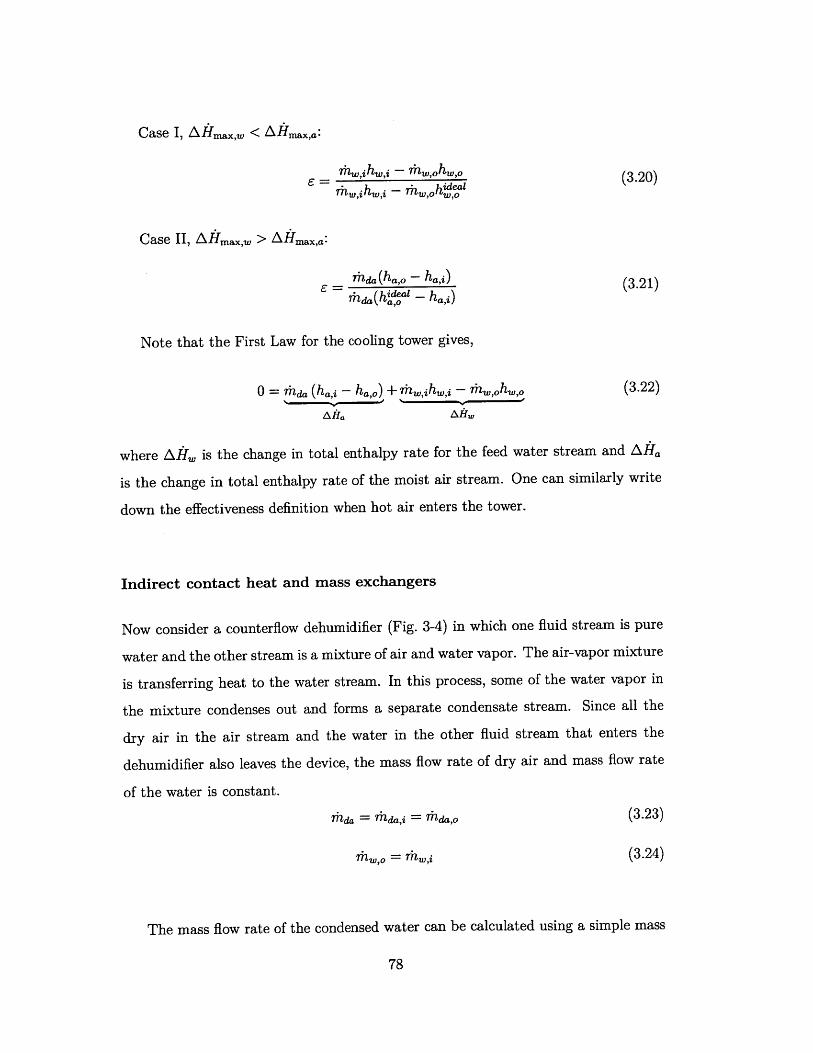
Case I, Afm,w < A max,a:
,h - W', h"' (3.20)rhw,ihm,i - Aw,ohidea"l
Case II, AL\max,w > Afnmax,a:
6 ilda (ha,o - ha,i) (3.21)Maa(hidea? - ha,i)
Note that the First Law for the cooling tower gives,
0 = rda (ha,i - ha,o) + ,ihw,i - ih, 0 hW, 0 (3.22)
where AntH is the change in total enthalpy rate for the feed water stream and AHa
is the change in total enthalpy rate of the moist air stream. One can similarly write
down the effectiveness definition when hot air enters the tower.
Indirect contact heat and mass exchangers
Now consider a counterflow dehumidifier (Fig. 3-4) in which one fluid stream is pure
water and the other stream is a mixture of air and water vapor. The air-vapor mixture
is transferring heat to the water stream. In this process, some of the water vapor in
the mixture condenses out and forms a separate condensate stream. Since all the
dry air in the air stream and the water in the other fluid stream that enters the
dehumidifier also leaves the device, the mass flow rate of dry air and mass flow rate
of the water is constant.
mada = rfda,i = Tda,o (3.23)
TmWo = N., (3.24)
The mass flow rate of the condensed water can be calculated using a simple mass
78

Humid air stream
T W'OTa, mi ,G # irhW mda
lcv
w~i : Ta,o ;Cme ; #rnw r1da
Coolingwater stream i Tpw; rhpw
Condensate
Figure 3-4: Control volume for counterflow dehumidifier.
balance:
r,2 = mla (Wa,o - WO) (3.25)
To calculate the maximum total enthalpy rate change possible, the inlet temper-
atures and mass flow rates must be known. As explained before, the ideal condition
corresponds to the enthalpy driving force becoming zero at the water exit or the air
exit. The ideal condition that the air can reach at the exit is saturation at the inlet
temperature of water. The water can at best reach the dry bulb temperature of the
air at inlet. Again, this corresponds to the enthalpy driving force reaching zero at
the air inlet end.
Based on the above discussion, the effectiveness definition of a counterflow indirect
contact HME device is as follows:
Case I,Aftmax,w < Aftmaxa:
eh w, ha (3.26)hw,i - hiwl
79

Case II, AHmax,w > AHmax,:
Thda(ha,o - ha,i) + Tfpwhpw (3.27)7haia(ha,o - h*) + riphpw
Note that the First Law for the dehumidifier can be expressed as,
0 = rhda (ha,i - ha,o) - Thpw hpwu + rhw (hw,i - ho (3.28).
Afta 1 11w
where A5. is the change in total enthalpy rate for the feed water stream and Ana
is the change in total enthalpy rate of the moist air stream.
3.1.3 Solution technique
The solution of the governing equations was carried out using Engineering Equa-
tion Solver (EES) [77] which uses accurate equations of state to model the prop-
erties of moist air and water. EES evaluates water properties using the IAPWS
(International Association for Properties of Water and Steam) 1995 Formulation [78].
Dry air properties are evaluated using the ideal gas formulations presented by Lem-
mon et al. [79]. Moist air properties are evaluated assuming an ideal mixture of
air and steam using the formulations presented by Hyland and Wexler [801. Moist
air properties from EES are in close agreement with the data presented in ASHRAE
Fundamentals [81] and pure water properties are equivalent to those found in NIST's
property package, REFPROP [82].
EES is a numerical solver, and it uses an iterative procedure to solve the equations.
The convergence of the numerical solution is checked by using the following two
variables: (1) 'Relative equation residual' - the difference between left-hand and
right-hand sides of an equation divided by the magnitude of the left-hand side of the
equation; and (2) 'Change in variables' - the change in the value of the variables
within an iteration. The calculations converge if the relative equation residuals is
lesser than 10-6 or if change in variables is less than 10-. These are standard
values used to check convergence in EES. There are several publications which have
80

previously used them for thermodynamic analysis [83, 84].
3.2 Control volume based second law based design
of HME devices
Before we study the applicability of the energy effectiveness definition (section 3.3),
it is important to understand the concept of entropy generation and thermodynamic
balancing of HME devices'.
A few researchers [85-87] have previously attempted to optimize the second law
design of heat and mass exchange devices by studying the sources of irreversibilities
at the local level. Carrington and Sun [861 presented the following expression for the
volumetric entropy generation rate as a sum of the three components that arise in
combined heat and mass transfer processes. These include a mass transfer compo-
nent, a heat transfer component and a coupled heat and mass transfer component,
neglecting the irreversibilities due to fluid flow.
- ( k 2 2p 2RD' p_2_ DAB 2S'" = - - (VT) + (T) - (VXA) + (VX2 (3.29)
T2 MAMBc MAMBXAXBC
The first term on the right hand side of Eqn. 3.29 is the heat transfer compo-
nent of the total irreversibility. In heat exchangers (without phase change or mass
transfer, for example) this is the only term that causes the irreversibilities, other
than the fluid flow irreversibilities. Hence, by balancing the stream-to-stream tem-
perature difference in the heat exchangers we can minimize entropy production for a
fixed effectiveness. In the following section it is shown how the temperature balance
minimizes entropy production in a heat exchanger. However, the same is not true
for a combined heat and mass exchange device, since in some situations the second
and third term (related to mass diffusion irreversibilities) in Eqn. 3.29 can play a
'Because the energy effectiveness definition is to be tested at various degrees of thermodynami-cally balancing of HME devices.
81
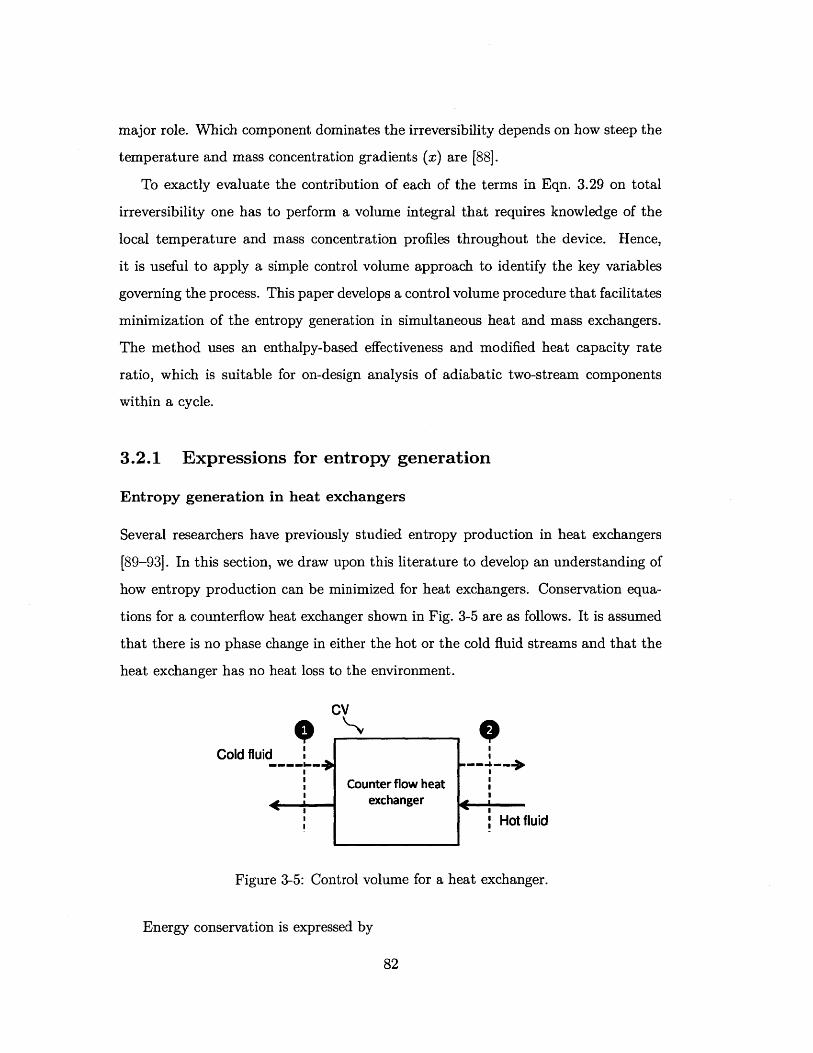
major role. Which component dominates the irreversibility depends on how steep the
temperature and mass concentration gradients (x) are [88].
To exactly evaluate the contribution of each of the terms in Eqn. 3.29 on total
irreversibility one has to perform a volume integral that requires knowledge of the
local temperature and mass concentration profiles throughout the device. Hence,
it is useful to apply a simple control volume approach to identify the key variables
governing the process. This paper develops a control volume procedure that facilitates
minimization of the entropy generation in simultaneous heat and mass exchangers.
The method uses an enthalpy-based effectiveness and modified heat capacity rate
ratio, which is suitable for on-design analysis of adiabatic two-stream components
within a cycle.
3.2.1 Expressions for entropy generation
Entropy generation in heat exchangers
Several researchers have previously studied entropy production in heat exchangers
[89-93]. In this section, we draw upon this literature to develop an understanding of
how entropy production can be minimized for heat exchangers. Conservation equa-
tions for a counterflow heat exchanger shown in Fig. 3-5 are as follows. It is assumed
that there is no phase change in either the hot or the cold fluid streams and that the
heat exchanger has no heat loss to the environment.
CV
Cold fluid
Counter flow heatexchanger
Hot fluid
Figure 3-5: Control volume for a heat exchanger.
Energy conservation is expressed by
82

Te.- (h2,c- hi,c)= nTh (h2,h - hl,h) (3.30)
and if the specific heat capacities are constant
Thcc,c - (T2,c -T1,c) = rhhc,,h - (T2, - T1,h) (3.31)
Here, we have assumed that both the streams are incompressible and that the
pressure change is negligible between the inlet and outlet.
The Second Law gives,
5gen = hc - (s 2,c - si,c) + hh - (si,h - s2,h) (3.32)
= racc,,c - In + Tac, - In > 0 (3.33)T1,c T2,h
The heat exchanger effectiveness is defined in the usual fashion as actual to max-
imum heat transfer:
(3.34)
Qmax = (rh - c,)min - (T2,h - T1,c) (3.35)
We define the heat capacity rate ratio (HCR) as
HCR = - c (3.36)rnh * cp,h Ch
Using these equations we can write the entropy generation in two possible ways,
Case I, Oc < Oh:
= 1 In 1 - E -HCR 1 - T1,c +I I (3.37)Cc HCR nlI T 2,h]J T1,c
Case II, Oh < ce:
Sgen =HCR-In 1+ 1 E T2,± 1 + In 1 - 1 - T1c (3.38)Ch HCR T1,c )T2,
83

Hence, it can be seen that entropy production depends on these parameters:
Sgen T2,h 1 ,HCR, E (3.39)Cmin I f Ti,C )I
In Fig. 3-6, we have shown that for various values of effectiveness and a fixed
temperature ratio, the non-dimensional entropy generation is minimized at HCR=1.
A simple calculation shows that this is true for all values of temperature ratio and
effectiveness. At this condition, the heat exchanger is said to be 'balanced'. It is
important to understand that the stream-to-stream temperature difference is constant
throughout the length of the heat exchanger in this condition (see Eqn. 3.31 and 3.36).
In other words, the driving force (temperature difference) is balanced. The driving
force for energy transfer in a combined heat and mass exchanger is a combination
of both the temperature difference and the concentration difference. In the following
sections, we try to understand how to balance these driving forces for HME devices.
0.2
0.18 -
0.16 -
0.14
0.12
-
0.1E.
0.08 %w%
%E--0.8
0.04 - -.. =.7
0.02 - E=0.6
0
0 0.5 1 1.5 2HCR
Figure 3-6: Non-dimensional entropy generation versus heat capacity rate ratio forcounterflow heat exchangers; 'h= 0.5.
84

Entropy generation in heat and mass exchangers
Here we develop an expression for entropy generation in a heat and mass exchanger to
identify the variables that affect 5,e, in these devices. The example of a counterflow
cooling tower (Fig. 3-3) is taken. An energy balance gives
rhmi - hw,i - rhWO, - hw,0 = rhda - (ha,o - ha,i) (3.40)
The enthalpy of moist air (air-water vapor mixture), can be alternatively defined as,
ha - hrej = cp,3 - (T - Trej) + w - [cp,v - (T - Tref) + hfg] (3.41)
In the above equation, it is assumed for purposes of discussion that the water vapor
and dry air are ideal gases and also that their specific heat capacities are constant
(in the calculations of Section 3.2.2, exact properties are used). Taking these ideas
into consideration, we define the component effectiveness carefully before we look at
examples of balancing the heat and mass exchanger. Using Eqns. 3.41, we write the
following expression for Tw,0 :
{T iw,i * Cpw
rhwi - c,, - rhd. - (wo - WO * -c.,, T)'i
rhda. (Cp,da + Cp,v Wi). )m{,i -c,, - Tda- ( wi)- c } TaW o
r ha - (c ,a + c , - O wo)Orh{,i - c, - rh.- - i) - c }
(rhaa ' hf g,o Wraw,i -c,,m - rha - (WO -Wi) -P' c
( ra - hfgi (3.42)m rh,i -c,, - rha - (wo -wi ) -~ c
where, hfg,o and hyg,i are evaluated at the inlet and outlet air temperatures. From
the definition of effectiveness, we have two cases. Case I, A.maxw < Am,t2,a:
TWO= {' w). T } . (1 - e) + e -Ta, (3.43)rhw.i - (Wo - WO) - ma
85

Case II, AHmax,w > AHmax,a:
(cp,(a + c1 Ta,o = 'i (1Icp,da + Cp'o ' wo- e) Ta,i + e -Tw,i
-(1 - e) -{ (- hfg,o - Wi - hfg,j) (3.44)Cp,da + Cp,v ' Wo )
Applying the Second Law to the control volume, we can derive the following expression
for entropy production in a cooling tower (see Appendix B):
Tn " +da - cp,an awo
TWi ) wi -cpi T, )+Ma -cP'' In (T'" maa -
w,i CP' pW Ta, i MT ,i'
+a . -(wO - wi) - Sfg,omW'i -CpAW
mda R, P.,at,u,,o wo*-+ -d R In -W
ThW'i 'W pwtotal
+da - R in 1 + 1.608 - wo+l I i
c'' -In Tw,0cp' (Ta,o
flldaR-w
rl,i CpAw
+ ThaRrhw,i - cpW
± 1
1.608 -w
-,-In 1+ 11.608 - wi
(3.45)
where P,at is the saturation vapor pressure of water. Using Eqns. (3.42 - 3.44) we can
see that entropy has the following functional form;
S gen 7 1~ Tda$ei Tf' w, 4 , 4 , e, R 1 , R 2 , R 3 , R 4, T" ,wi'cp,w Ta,i Ow~
P* (3.46)
where: R 1 = rhda'pda R 2 = 1d*"" R ;d R 3 = nd" RU - R4 = Mdac,v . - to_ l
c e,icp, mericpn 2he,ic,, f w,ic P.fa,o
Also, we can see that the parameters in Egn. 25 have the following functional form:
R1, R2,R3, R4 = f2 . ,cp,da Rda Rw
, , ,cp,2j cp,w) cp,w
cp'v
cp,wJ(3.47)
86
Sgen
W'i - cp,W
_
-WO.- In 1I

and
P= f3 Potr 7 , 7Ta,, Tw,i, , #, # (3.48)
Therefore, we can write Eqn. (25) as,
$ e " = f4 T w ,i, T ,i , #' , k 4 , e, "Th d , ' c" , , , P tota } (3 .4 9 )
In Section 3.3, we show how the non-dimensional entropy production can be mini-
mized using this understanding.
3.2.2 Condition for minimum entropy generation
Effect of mass flow rate ratio
In previous section, we showed that the non-dimensional entropy generation of a
cooling tower is a function of the inlet temperatures, the component effectiveness,
the exit and inlet relative humidities, the ratio of certain specific heat capacities
(Cd d-a a - , the absolute pressure and the mass flow rate ratio. Figure 3-7SCp'W Cp'W 7 Cp'W 7 Cp'W)
illustrates the importance of this understanding.
The mass flow rate ratio is plotted against the non-dimensional entropy generation
term " for various values of inlet water temperature (Tw,j) of 55*C to 70*C,
an inlet air temperature (Ta,i) of 34 0C, an exit relative humidity (#,) of 70%, an inlet
relative humidity (#j) of 90% and an effectiveness (edt) of 80%. It can be observed
that the non-dimensional entropy generation is minimized at a particular value of
mass flow rate ratio. This is found to be true for all values of input variables (inlet
temperatures, inlet and exit reltive humidities and component effectiveness). Hence,
we can conclude that at fixed inlet conditions the optimum point for non-dimensional
entropy generation is dependent only on the mass flow rate ratio.
In certain cases (e.g, in Fig. 3-7 for T,, = 70*C) the minimum entropy generation
point cannot be attained within the constraints (Sgen > 0; Twi T.,o). Also, there
are points of zero entropy generation at effectiveness less than 1. These correspond
to points of maximum effectiveness.
87
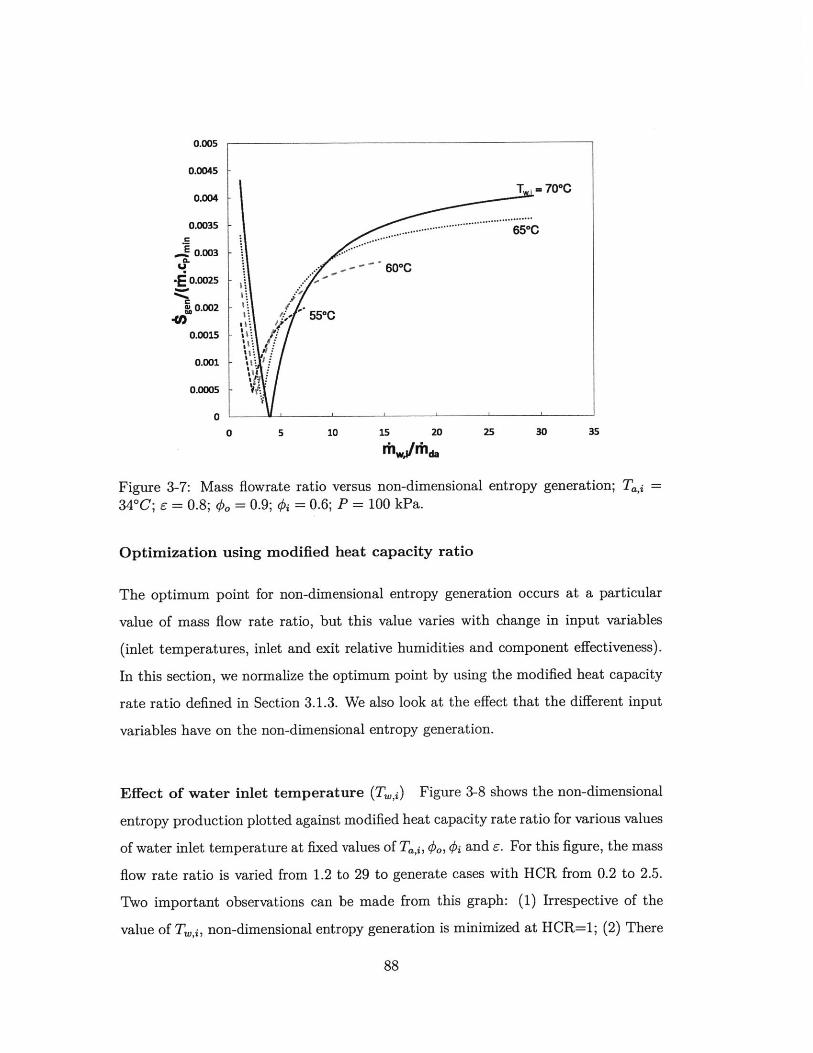
0.005
0.0045T .-. 70*C
0.0035 .............----------~~-~~.....
E 000.003-60*C
-E 0.0025
e 0.002-.00 55*C
0.0015 It
0.001 -
0.0005 - :
0
0 5 10 15 20 25 30 35
rhwrhd
Figure 3-7: Mass flowrate ratio versus non-dimensional entropy generation; T.,i =
34*C; e = 0.8; 4, = 0.9; 4 = 0.6; P = 100 kPa.
Optimization using modified heat capacity ratio
The optimum point for non-dimensional entropy generation occurs at a particular
value of mass flow rate ratio, but this value varies with change in input variables
(inlet temperatures, inlet and exit relative humidities and component effectiveness).
In this section, we normalize the optimum point by using the modified heat capacity
rate ratio defined in Section 3.1.3. We also look at the effect that the different input
variables have on the non-dimensional entropy generation.
Effect of water inlet temperature (T.,,) Figure 3-8 shows the non-dimensional
entropy production plotted against modified heat capacity rate ratio for various values
of water inlet temperature at fixed values of Ta,i, 0 , 4j and e. For this figure, the mass
flow rate ratio is varied from 1.2 to 29 to generate cases with HCR from 0.2 to 2.5.
Two important observations can be made from this graph: (1) Irrespective of the
value of T.,i, non-dimensional entropy generation is minimized at HCR=1; (2) There
88
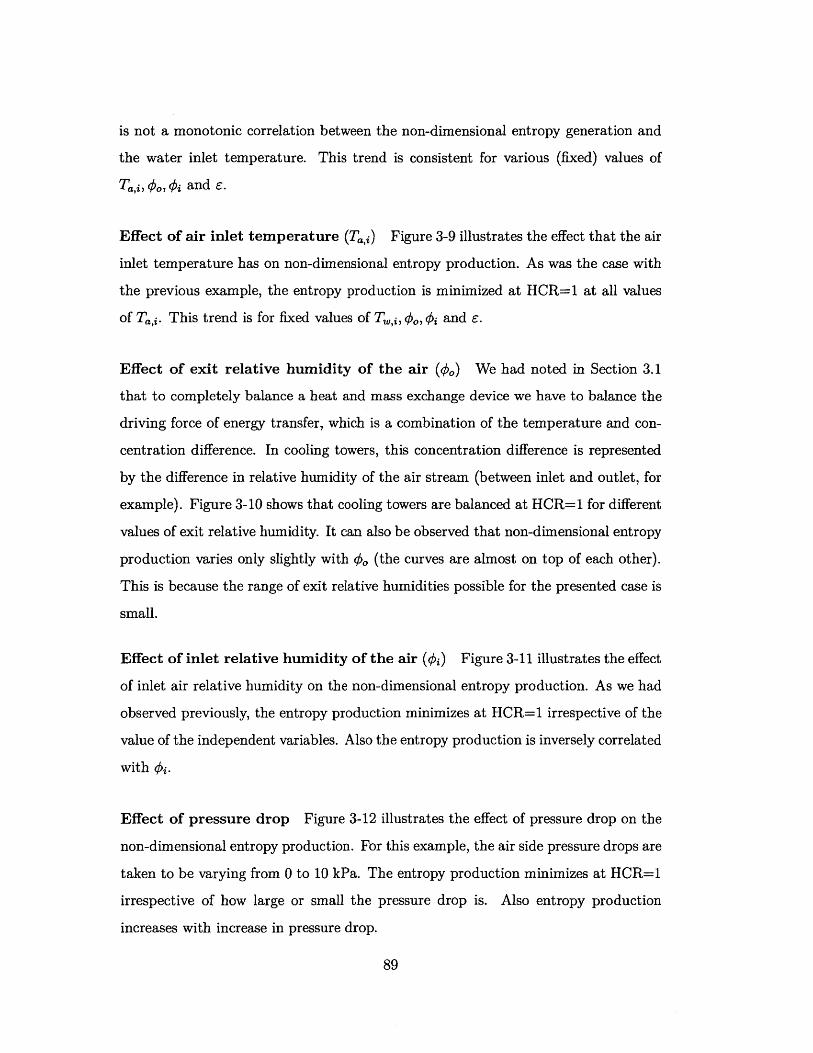
is not a monotonic correlation between the non-dimensional entropy generation and
the water inlet temperature. This trend is consistent for various (fixed) values of
T.,j, #.,#Oj and e.
Effect of air inlet temperature (Ta,i) Figure 3-9 illustrates the effect that the air
inlet temperature has on non-dimensional entropy production. As was the case with
the previous example, the entropy production is minimized at HCR=1 at all values
of Ta,i. This trend is for fixed values of T 5,i,0, #i and e.
Effect of exit relative humidity of the air (#,,) We had noted in Section 3.1
that to completely balance a heat and mass exchange device we have to balance the
driving force of energy transfer, which is a combination of the temperature and con-
centration difference. In cooling towers, this concentration difference is represented
by the difference in relative humidity of the air stream (between inlet and outlet, for
example). Figure 3-10 shows that cooling towers are balanced at HCR=1 for different
values of exit relative humidity. It can also be observed that non-dimensional entropy
production varies only slightly with #0, (the curves are almost on top of each other).
This is because the range of exit relative humidities possible for the presented case is
small.
Effect of inlet relative humidity of the air (#j) Figure 3-11 illustrates the effect
of inlet air relative humidity on the non-dimensional entropy production. As we had
observed previously, the entropy production minimizes at HCR=1 irrespective of the
value of the independent variables. Also the entropy production is inversely correlated
with # .
Effect of pressure drop Figure 3-12 illustrates the effect of pressure drop on the
non-dimensional entropy production. For this example, the air side pressure drops are
taken to be varying from 0 to 10 kPa. The entropy production minimizes at HCR=1
irrespective of how large or small the pressure drop is. Also entropy production
increases with increase in pressure drop.
89

0.005
0.0045 -
o.oo4 -
0.0035 - '-.
.s'-. Te =0*
0.003
E 0.0025 -..--- '65*C
%0.002 -' 0C
0.0015 -- . -
0.001
0.0005 -~ ,
0
0 0.5 1 1.5 2 2.5HCR
Figure 3-8: Effect of water inlet temperature on entropy generation; T,i = 34*C;E = 0.8; 4,, = 0.9; #i = 0.6; m.,in/rh& = 1.2 - 29; P = 100 kPa.
0.003
0.0025
.5 0.002E
0.0015
0.001
0.0005
0
0 0.5 1 HCR 1.5 2 2.5
Figure 3-9: Effect of air inlet temperature on entropy generationr; T,, = 55*C;e = 0.8; #4, = 0.6; #i = 0.8; de,in/Tda = 1.2 - 29; P = 100 kPa.
90
Tai = 30*C
..-34*C
-- 420Cs

0.0017
0.0015 -
0.0013 -
0.0011
0.0009
0.0007 -
0.0005
0.4 0.6 0.8 1 1.2 1.4 1.6HCR
Figure 3-10: Effect of outlet air relative humidity on entropy generation in a coolingtower; T,, = 50*C; Ta,i = 34*C; e = 0.7; di = 0.5; d ii/&a = 1.2 - 29; P = 100kPa.
0.0016
0.0014
0.0012
0.001
-E 0.0008
0.0006
0.0004
0.0002
0
0 0.5 1HCR
1.5 2
Figure 3-11: Effect of inlet air relative humidity on entropy generation in a cooling
tower; T, = 50*C; T,i = 34*C; e = 0.7; #o = 0.9; rhw,in/rda = 1.2 - 29; P = 100kPa.
91

0.008
0.007 AP=10 kPa
0.006
E 0.005 - --'+-...--- , AP=5 kPa
o.oo4. -
C
90.003 -- '-'
0.002 -AP=O kPa
0.001 -
0
0 0.5 1 1.5 2 2.5
HCR
Figure 3-12: Effect of air side pressure drop on entropy generation in a cooling tower;
T.,i = 50*C; Ta,i = 34*C; e = 0.7; #, = 0.9; 4k = 0.6; Tw,in/Taa = 1.2 - 29; P = 100kPa.
From the various examples in this section, it is clear that a combined heat and mass
exchanger is 'balanced' and the entropy production is minimum when the modified
heat capacity rate ratio is 1. Also, the functional dependence of the non-dimensional
entropy production is
.T5f m =Cf) T,j, T',, ,EHCR, c,,da R , , Ptota (3.50)(mh - c,) m.CAW c, c, c,,,
where
HCR = (Allmaxc) (3.51)
3.2.3 Section summary
In this section, the following significant conclusions are arrived at from this study:
1. The entropy production can be usefully non-dimensionalized by dividing it by
the heat capacity rate of the minimum heat capacity stream in the heat and
92

mass exchanger QQ"g .
2. A modified heat capacity rate ratio (HCR) for simultaneous heat and mass
exchangers was defined as the ratio of the maximum possible change in to-
tal enthalpy rate of the cold stream to the maximum possible change in total
enthalpy rate of the hot stream HCR =
3. The non-dimensional entropy production for a cooling tower is dependent on
the following variables:
en f T,i, To, #, #i, E, HCR, Cpda , ,' cP,- Potail(2'h*Cp)Min PI P,w - CP, - CP, W I
It is noted that this includes performance parameters (e, #0), inlet variables
(TWi, Ta,i, ), pressure (Ptotea) and fluid properties (c,,a, c,,, c,,, Ra, Rw).
Operationally, HCR can be varied by only changing the mass flow rate ratio
(-"id) The component effectiveness contains the effects of the exchanger di-
mensions and material properties and is varied in an on-design sense.
4. The non-dimensional entropy production is minimized and the heat and mass
exchanger is 'balanced' at HCR=1. The experimental proof of the same is
decribed in Chapter 6.
3.3 Applicability of energy effectiveness
In this section, the differences and similarities between the various definitions of ef-
fectiveness and their relationship to the energy effectiveness are examined. How the
heat capacity rate ratio affects the aforementioned relationships is also discussed. All
graphs in this section plot the various effectivenesses versus the energy based effec-
tiveness. Additionally, the non-dimensional entropy generation rate is also plotted
versus the energy based effectiveness.
3.3.1 Heat exchangers
In this section, it is shown that the energy effectiveness of an HME in the limiting case
of no mass transfer in a counterflow humidifier is equivalent to that of a counterflow
93

heat exchanger. When mass is not transferred, the humidity ratio of the moist air
stream remains unchanged from inlet to outlet. Therefore,
Wi = WO (3.52)
Since the humidity ratio of the air stream remains constant, the effectivenesses
reduce to the following Case I, water is the minimum heat capacity stream (HCR > 1)
hw,i -hm'O
_ c T O - T , - T,) (3.53)
c,, (T,-Ta) ~ c,, (Tp,i - Ta,i)
Case II, moist air is the minimum heat capacity stream (HCR < 1)
ha,i - ha,o _ c, (Ta,i - Ta,o) (3.54)ha,i - hi? Cp,a (Ta,i - T(,3)
Finally, the maximum value of the above two equations gives the energy effective-
ness expression
rYcp,,i, (TW, - TWO)
Crnn (Tw, - Ta,i)
rhdaCp,a (Ta,i - Ta,o) (3.55)Crnin (Ta,i -T.,i)
which is the usual definition for the effectiveness of a two stream heat exchanger [94}.
3.3.2 Direct contact heat and mass exchangers
Counterflow humidifiers with saturated air at the inlet
The comparison of various definition of effectiveness for a counterflow humidifier is
shown in Fig. 3-13. In this example, the device operates at atmospheric pressure with
the inlet water temperature at 70*C, and the moist air entering saturated at 30*C
and exiting saturated. In this case, the device is operating at a heat capacity rate
94
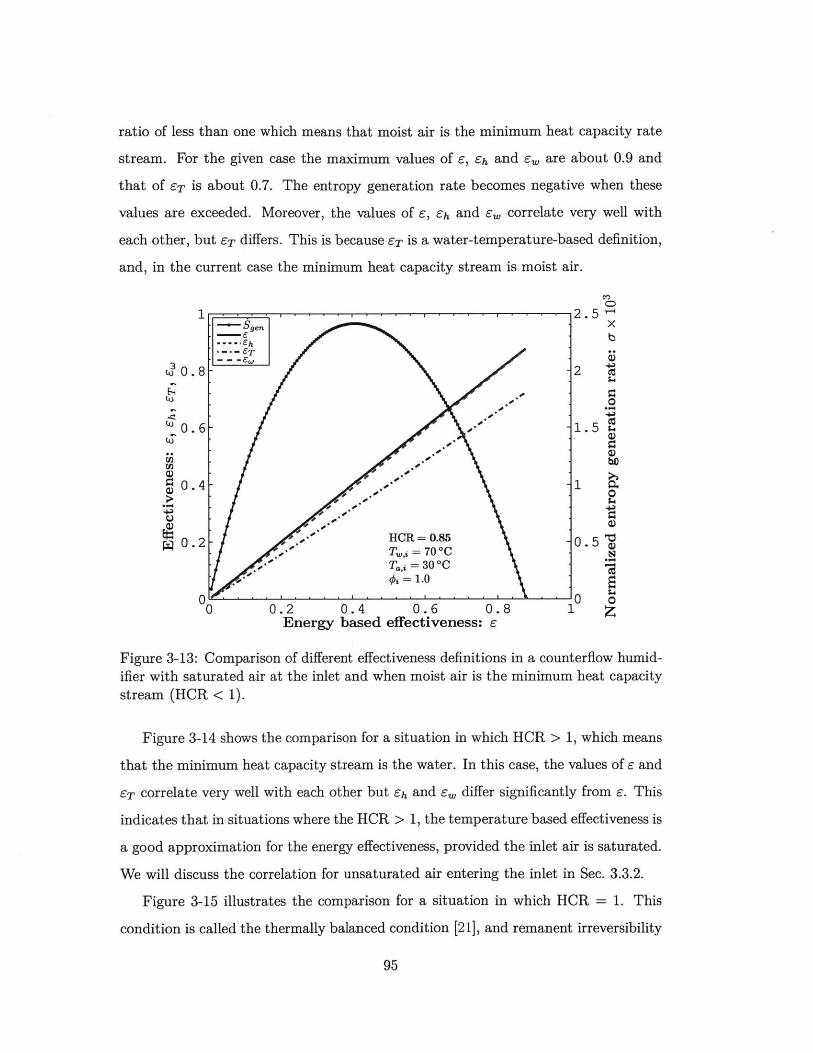
ratio of less than one which means that moist air is the minimum heat capacity rate
stream. For the given case the maximum values of e, ch and e, are about 0.9 and
that of eT is about 0.7. The entropy generation rate becomes negative when these
values are exceeded. Moreover, the values of e, £h and e, correlate very well with
each other, but er differs. This is because er is a water-temperature-based definition,
and, in the current case the minimum heat capacity stream is moist air.
"o1 . . . 2.5 -1
0.8- -2
.6- 0 -1.5:3O
0.4- 0)0
0.2 HCR 0.85 0.5p"T.,, = 70 *CT, 1 = 30*C
= 1.0
0 ' ' ' '. 0 o0 0.2 0.4 0.6 0.8 1 Z
Energy based effectiveness: e
Figure 3-13: Comparison of different effectiveness definitions in a counterflow humid-ifier with saturated air at the inlet and when moist air is the minimum heat capacitystream (HCR < 1).
Figure 3-14 shows the comparison for a situation in which HCR > 1, which means
that the minimum heat capacity stream is the water. In this case, the values of e and
ET correlate very well with each other but Eh and e, differ significantly from e. This
indicates that in situations where the HCR > 1, the temperature based effectiveness is
a good approximation for the energy effectiveness, provided the inlet air is saturated.
We will discuss the correlation for unsaturated air entering the inlet in Sec. 3.3.2.
Figure 3-15 illustrates the comparison for a situation in which HCR = 1. This
condition is called the thermally balanced condition [21], and remanent irreversibility
95

1 54Sgen HCR =3.75 X
- 6 Tw,=70*C b--- eT T,i=30*C
(u 0.8- =
u 0.6- 3
UU
0.4 -2
0.2.
0 ' ' ' ' ' 0o0 0.2 0.4 0.6 0.8 1 Z
Energy based effectiveness: e
Figure 3-14: Comparison of different effectiveness definitions in a counterflow humid-ifier when water is the minimum heat capacity stream (HCR > 1).
is a minimum in this condition. Since the temperature profiles and the humidity levels
are balanced, all the various definitions of effectiveness are very similar in this case.
This further demonstrates the concept of thermal balancing. In heat exchangers, this
concept is well known and corresponds to the balancing of the temperature profiles
[21, 74].
Another interesting observation that can be made from the figures in this section
is that the maximum value of effectiveness is lower at the balanced condition and
increases as HCR moves further away from a balanced condition (see Table 3.2).
This is because irreversibility is lower at HCR = 1 compared to unland the entropy
production becomes negative (See Figs. 3-13, 3-14 and 3-15) at a lower value of
effectiveness. Hence, a lower value of maximum effectiveness exists for the balanced
condition. At values of HCR sufficiently away from one (like the case were HCR =
3.75 in the table) the energy effectiveness has a maximum value of one.
96
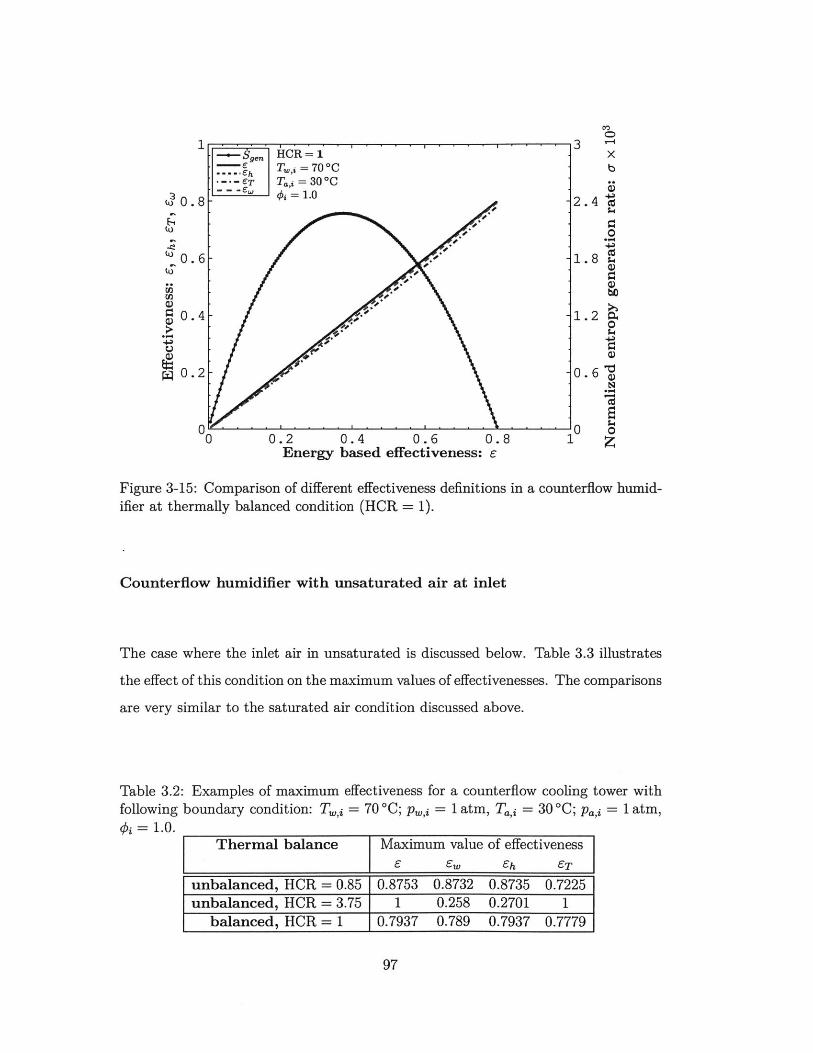
C)
1 I3 '-4
--- 3,n HCR=1TI,i=70*C b
- - T.,i=30C --
0.8 -2.4
0.6- 1.8
S0.4- 1.20
a)*
0.2- 0.6
0 0 ' ' ' ' ' ' ' ' ' ' ' ' ' . ' ' ' 0 00 0.2 0.4 0.6 0.8 1 ;
Energy based effectiveness: e
Figure 3-15: Comparison of different effectiveness definitions in a counterflow humid-ifier at thermally balanced condition (HCR = 1).
Counterflow humidifier with unsaturated air at inlet
The case where the inlet air in unsaturated is discussed below. Table 3.3 illustrates
the effect of this condition on the maximum values of effectivenesses. The comparisons
are very similar to the saturated air condition discussed above.
Table 3.2: Examples of maximum effectiveness for a counterflow cooling tower withfollowing boundary condition: T,, = 70 *C; p., 1 = 1 atm, Tai = 30 *C; pa,i = 1 atm,
= 1.0.Thermal balance Maximum value of effectiveness
E Ew Eh ET
unbalanced, HCR = 0.85 0.8753 0.8732 0.8735 0.7225unbalanced, HCR = 3.75 1 0.258 0.2701 1
balanced, HCR = 1 0.7937 0.789 0.7937 0.7779
97

Table 3.3: Examples of maximum effectiveness for a counterflow cooling tower withfollowing boundary condition: T 0,i = 70 "C; pw,i = 1 atm, Ta,i = 30 *C; Pa,i = 1 atm,
= 0.5.Thermal balance Maximum value of effectiveness
E E. Eh ET
unbalanced, HCR = 0.85 0.7803 0.7765 0.7803 0.7608unbalanced, HCR = 4 1 0.242 0.25 1
balanced, HCR = 1 0.776 0.772 0.776 0.756
Counterflow humidifier with air entering hotter than water
The implications of having hotter air entering a direct contact HME on the ideal
conditions that be achieved by the fluid streams were discussed in the previous sec-
tion. Figure 3-16 illustrates the comparison of the effectivenesses for this boundary
condition in a thermally balanced situation. It is observed that the values of e, Eh
and er correlate reasonably well with each other but ew differs. This is because e,
is a humidity-based definition and the humidity change alone does not capture the
change in total energy very well in hot air cases.
1
0.8
0.6
0 0.4
r 0.2
3.6xb
3.57
0
3.54
bC
3.510
3.48 "
0 ' ' ''' ' ' ' ' ' ' '' '' 3 .45 o0 0.2 0.4 0.6 0.8 1 z
Energy based effectiveness: e
Figure 3-16: Comparison of different effectiveness definitions at thermally balancedcondition (HCR = 1) for counterflow humidifier with air entering hotter than water.
98

3.3.3 Indirect contact heat and mass exchangers
Indirect contact or surface type HME are different from direct contact type HME
in that the fluid streams are not mixed. Hence, it is important to investigate the
comparison between the different effectiveness definitions. Also, it is interesting to
investigate the influence of thermal balancing in these devices.
Figure 3-17 illustrates that at the thermally balanced condition, the dehumidifier
can be defined by any of the four values of effectivenesses (which is similar to the
direct contact counterpart). Also, when HCR < 1 and HCR > 1, all trends are
similar to the direct contact type.
11
:3(i. 0.
(U)
~0.(U
0.
r0.
0 0.2 0.4 0.6 0.8Energy based effectiveness: e
O,0,
S10 '-
xb
06
-40
-2
- 0
Figure 3-17: Comparison of different effectiveness definitions atcondition (HCR = 1) for counterflow dehumidifier.
thermally balanced
It was previously observed that for the direct contact HME the maximum value of
effectiveness is lower at the balanced condition and increases as HCR moves further
away from a balanced condition (Table 3.2). Table 3.4 shows that for counterflow
indirect contact HME the maximum value of effectiveness is close to one for cases
when HCR = 1 and HCR > 1. This is a significant observation and shows that the
99
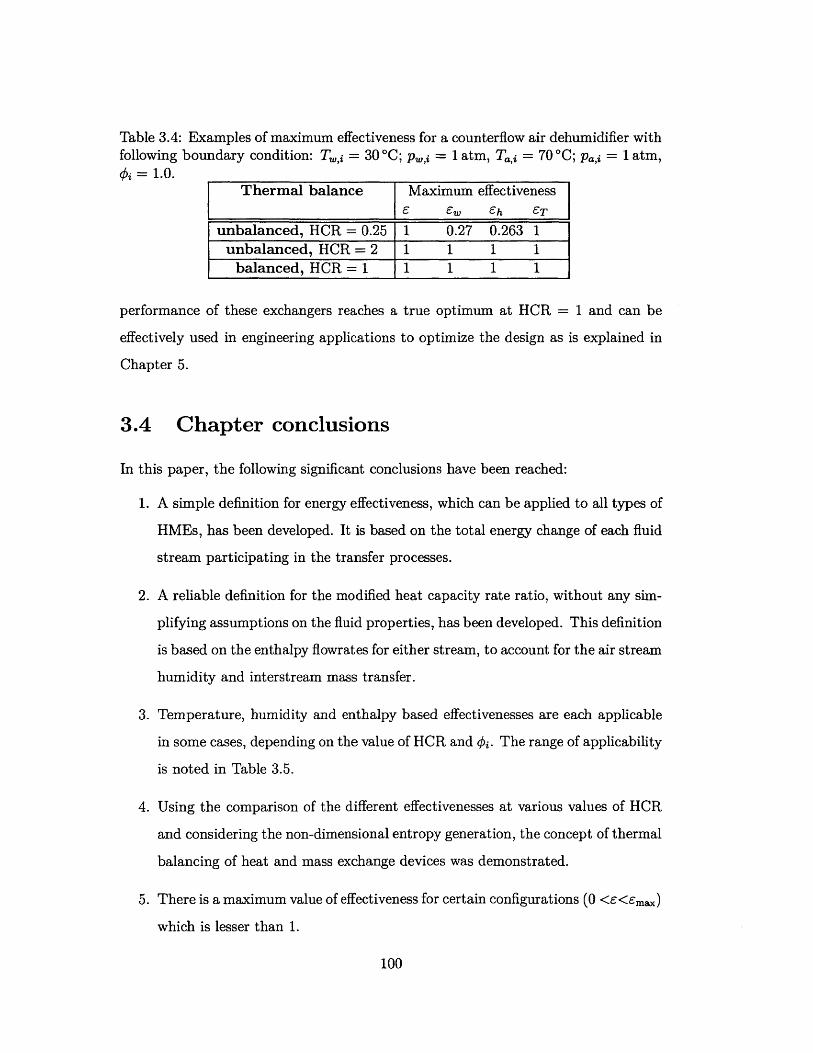
Table 3.4: Examples of maximum effectiveness for a counterflow air dehumidifier withfollowing boundary condition: Tm,i = 30 *C; p,,,i = 1 atm, Ta,i = 70 *C; pa,i = 1 atm,
= 1.0.Thermal balance Maximum effectiveness
6 6w Eh 6 T
unbalanced, HCR = 0.25 1 0.27 0.263 1unbalanced, HCR = 2 1 1 1 1
balanced, HCR = 1 1 1 1 1
performance of these exchangers reaches a true optimum at HCR = 1 and can be
effectively used in engineering applications to optimize the design as is explained in
Chapter 5.
3.4 Chapter conclusions
In this paper, the following significant conclusions have been reached:
1. A simple definition for energy effectiveness, which can be applied to all types of
HMEs, has been developed. It is based on the total energy change of each fluid
stream participating in the transfer processes.
2. A reliable definition for the modified heat capacity rate ratio, without any sim-
plifying assumptions on the fluid properties, has been developed. This definition
is based on the enthalpy flowrates for either stream, to account for the air stream
humidity and interstream mass transfer.
3. Temperature, humidity and enthalpy based effectivenesses are each applicable
in some cases, depending on the value of HCR and 44. The range of applicability
is noted in Table 3.5.
4. Using the comparison of the different effectivenesses at various values of HCR
and considering the non-dimensional entropy generation, the concept of thermal
balancing of heat and mass exchange devices was demonstrated.
5. There is a maximum value of effectiveness for certain configurations (0 <E<Ema,)
which is lesser than 1.
100
6. The entropy production can be usefully non-dimensionalized by dividing it by
the heat capacity rate of the minimum heat capacity stream in the heat and
mass exchanger " ).
7. A modified heat capacity rate ratio (HCR) for simultaneous heat and mass
exchangers was defined as the ratio of the maximum possible change in to-
tal enthalpy rate of the cold stream to the maximum possible change in total
enthalpy rate of the hot stream HCR = Ak..r )
8. The non-dimensional entropy production for a cooling tower (or humidifier) is
dependent on the following variables:
(1i2p f (Tri, Tof{, #,, #jki, ,HCR, Cpda , Ptoterp(rh'CP~minCp,w 7 Cp,W' 7 P Cp,W
It is noted that this includes performance parameters (e, #), inlet variables
(Tw,i, T,, j), pressure (Ptotai) and fluid properties (c,a, c,, , cp,, Ra, R).
Operationally, HCR can be varied by only changing the mass flow rate ratio
("'.d) The component effectiveness contains the effects of the exchanger di-
mensions and material properties and is varied in an on-design sense.
9. The non-dimensional entropy production is minimized and a control volume of
the heat and mass exchanger is 'balanced' at HCR=1.
101

Table 3.5: Applicable range of various definitions of effectiveness of simultaneous heatand mass exchange devices.
Reference Effectiveness Range of applicabilityIdefined
Mandi et al. [68]; AT Cooling towers and humidifiers whenCheremisinoff and 11 = ATideal HCR > 1Cheremisinoff [71]
AW Humidifier, dehumidifiers and coolingNellis and Klien [72] E = coils when HCR < 1; but not applica-
ble for parallel flow when 4i < 1
Aha Humidifier, dehumidifiers and coolingNellis and Klien [72] =Ahidal coils when HCR < 1
All heat and mass exchangers (butJaber and Webb [73] F, = acd needs evaluation of slope of moist air
ra - Ahjela enthalpy line)
Oact All heat and mass exchangers; all situ-Present work ations
102

Chapter 4
Theoretical control-volume based
analysis of existing embodiments of
the HDH system
From the literature review in Chapter 2, it has been found that no study has carried
out a detailed thermodynamic analysis in order to optimize the system performance
of existing HDH cycles for either the water and air heated designs. In this chapter, the
thermodynamic performance of these HDH cycles is analyzed by way of a theoretical
cycle analysis. The control-volume based models for the humidifier and the dehumid-
ifier, proposed in the previous chapter, are used to perform this analysis. The concept
of minimum entropy generation in these basic HDH systems is developed using a new
non-dimensional parameter defined in the previous chapter, HCR. The experimental
validation of the theoretical results developed herein is given in Chapter 6.
In performing the analysis described in this chapter, the following reasonable
approximations have been made:
" The processesed operate at steady-state conditions.
" There is no heat loss from the humidifier, the dehumidifier, or the heater to the
ambient.
" Pumping and blower power is negligible compared to the energy input in the
103
heater.
" Kinetic and potential energy terms are neglected in the energy balance.
" The water condensed in the dehumidifier is assumed to leave at a temperature
which is the average of the humid air temperatures at inlet and outlet of the
dehumidifier.
" It was previously shown that the use of pure water properties instead of seawater
properties does not significantly affect the performance of the HDH cycle at
optimized mass flow rate ratios [701. Hence, only pure water properties are
used in this chapter.
Engineering Equation Solver [77] was used to perform the analysis. The fluid
property packages and the solution technique used were already described in Sec-
tion 3.1.3. The governing equations and equations for the energy effectivenes of the
humidifier and the dehumidifier are the same as those described in Section 3.1.2. The
energy input in the heater is given by the change in enthalpy rate of the fluid being
heated.
Terminology used
1. Top temperature: In HDH systems, either water or air is heated (for example,
in a solar collector). The top temperature of the cycle is the temperature of the
fluid being heated at the exit of the heater.
2. Bottom temperature: The feedwater to the dehumidifier enters the cycle at the
bottom temperature of the cycle.
3. Terminal temperature difference (TTD): is the stream-to-stream temperature
difference at either end of the heat and mass exchanger (humidifier or dehumid-
ifier) [95].
4. Pinch point temperature difference: is the minimum local stream-to-stream tem-
perature difference at any point within the heat and mass exchanger and may
104

be lower than both the terminal temperature differences [95] in the humidifier
and the dehumidifier depending on the inlet conditions being considered. In
some cases, however, the pinch may be equal to one of the terminal tempera-
ture differences. In most HDH systems, the pinch point is equal to TTD in the
dehumidifier and is lower than TTD in the humidifier.
4.1 Water heated HDH cycle
One of the most commonly studied HDH cycles is the closed-air open-water water-
heated (CAOW) cycle (see Figure 4-1). A comprehensive study of parameters which
affect the performance of this cycle has not been reported in literature. Such a study
will help to understand the ways by which the performance of this basic cycle can
be improved and hence, is reported below. The parameters studied include top and
bottom temperatures of the cycle, mass flow rate of the air and water streams, the
humidifier and dehumidifier effectivenesses and the operating pressure. The perfor-
mance of the cycles depend on the mass flow rate ratio (ratio of mass flow rate of
seawater at the inlet of the humidifier to the mass flow rate of dry air through the
humidifier), rather than on individual mass flow rates. Hence, in this and all the
preceeding sections the mass flow rate ratio is treated as a variable. This variation
with mass flow rate ratio was also noted by other investigators [35, 37, 96].
4.1.1 Effect of relative humidity of the air entering and ex-
iting the humidfier (#0,1, #a,2).
The humidifier and dehumidifier can readily be designed such that the relative humid-
ity of air at their exit is one. Hence, in this paper the exit air from these components
is considered to be saturated. However, the exit relative humidity is indicative of the
performance of the humidifier and the dehumidifier; and hence, understanding how
the variation of these parameters changes the performance of the system is important.
Figure 4-2 illustrates the effect that relative humidity of air at the humidifier inlet
105

4n
, w,2 OnTVV'
Mw BRINE HEATER rm|
- -da -- - wI
Ta,2' (Ja,2
Twpw
----Seawater -------.. Pure water - Moist air ------- extracted moist air
Figure 4-1: Schematic diagram of water heated closed air open water HDH cycle.
and exit can has on the performance of the cycle (GOR). For this particular case, the
top (T,,,2) and bottom temperatures (T,,o) were fixed at 80*C and 35*C respectively.
Humidifier and dehumidifier effectivenesses (Eh, Ed) were fixed at 90%. Mass flow rate
ratio was fixed at 5. It can be observed that for a variation Of 4.,2 from 100 to 70%
the performance of the system (GOR) decreases by roughly 3%, and for the same
change in 0a,2 the effect is roughly 34%.
This difference suggests that the relative humidity of the air at the inlet of the
humidifier has a much larger effect on performance. These trends were found to
be consistent for all values of mass flow rate ratios, temperatures and component
effectivenesses. This, in turn, suggests that the dehumidifier performance will have
a larger impact on the cycle performance. This issue is further investigated in the
following paragraphs.
106

2.4 - - a,2
P 2.2 -
K 1.8CL
1.6 -0
c 1.4 -
1.2 -
10.6 0.7 0.8 0.9 1 1.1
Relative humidity, 4 [-]
Figure 4-2: Effect of relative humidity on performance of the WH-CAOW HDH cycle.
0
CL
W
C
1.8
1.6
1.4
1.2
1
0.8
0.6
0.4
0.2
00 1 2 3 4 5 6
Mass flow ratio (rhfinhd)
Figure 4-3: Effect of component effectiveness of humidifier on performance of theWH-CAOW HDH cycle.
107
0.5
I

4.1.2 Effect of component effectiveness (Ch, Ed).
Figure 4-3 and 4-4 illustrate the variation of performance of the cycle at various
values of component effectivenesses. In Fig. 4-3, the top temperature is fixed at
80*C, the bottom temperature is fixed at 30'C and the dehumidifier effectiveness is
fixed at 80%. The mass flow rate ratio was varied from 1 to 6. It is important to
observe that there exists an optimal value of mass flow rate ratio at which the GOR
peaks. It can also be observed that the increase in performance is fairly linear with
increasing humidifier effectiveness, Ch. In Fig. 4-4, the top temperature is fixed at
80 0 C, the bottom temperature is fixed at 30*C and the humidifier effectiveness is
fixed at 80%. The cycle performance changes more dramatically for higher values of
dehumidifier effectiveness. These trends are consistent for various values of top and
bottom temperatures. Hence, a higher dehumidifier effectiveness is more valuable
than a higher humidifier effectiveness for the performance (GOR) of the cycle.
In the previous discussion, we have observed that the dehumidifier exit air rela-
tive humidity (4k,1) is more important than the humidifier exit air relative humidity
(#a,2). Hence, based on these results, we can say that for a water heated cycle the
performance of the dehumidifier is more important than the performance of the hu-
midifier.
4.1.3 Effect of top temperature (TW, 2 )
Figure 4-5 illustrates the effect of the top temperature on the cycle performance
(GOR). For this particular case, the bottom temperature (T.,o) was fixed at 35*C and
humidifier and dehumidifier effectivenesses were fixed at 92%. Top temperature (TW, 2 )
was varied from 50 0 C to 90 0 C. The optimal value of mass flow rate ratio increases
with an increase in top temperature. Depending on the humidifier and dehumidifier
effectiveness itself this trend changes. At lower component effectivenesses, the top
temperature has no or little effect on the cycle performance. This result is counter-
intuitive. However, it can be explained using the modified heat capacity rate ratio.
The modified heat capacity rate ratio (HCR), was defined in Section 3.2, as the
108

3.5
3 - 1
c 2.50
2
0. 0.91.5
0.8
0.70.60.5
0.5
0
0 1 2 3 4 5 6
Mass flow ratio (rh*fha)
Figure 4-4: Effect of component effectiveness of dehumidifier on performance of theWH-CAOW HDH cycle.
ratio of maximum possible enthalpy change in the cold stream to the maximum pos-
sible enthalpy change in the hot stream. It was found that the entropy generation in
a heat and mass exchange device is minimized (for a given effectiveness and inlet con-
ditions) when HCR=1 ('balanced' condition). We are going to use this understanding
here to explain the trends obtained at various top temperatures.
Figure 4-6 shows the variation of GOR with the heat capacity rate ratio of the
dehumidifier (HCRd). It can be seen that GOR maximizes at HCRd = 1. The
maximum occurs at a balanced condition for the dehumidifier which, as we have shown
in the preceeding paragraphs is the more important component. Further, it can be
noticed from Fig. 4-7 that the degree of balancing of the humidifier at the optimum
GOR condition reduces (HCRh moves farther away from 1) as the top temperature
increases. Hence, the irreversibility of the humidifier (and the total irreversibility of
the system) increases with increase in top temperature. A system with higher total
irreversibility has a lower GOR [70]. This explains the decrease in GOR with the
increase in top temperature.
109

4
3.5
3
2.5
2
1.5
1
0.5
n0 1 2 3 4 5
Mass flow ratio (rh.frhd)
4-5: Effect of top brine temperature on performance of
4
3.5
p~3
02.5
2n.
*1.5VC
to 1
0.5
0
Figure 4-6:
6 7
the WH-CAOW HDH
0 0.25 0.5 0.75 1 1.25 1.5
Heat capacity rate ratio of dehumidifier, HCRd
HCR of dehumidifer versus GOR at various top brine temperatures.
110
TW2=600C
700 C
800 C
900C0w
'a
S0
'USCUw
Figurecycle.
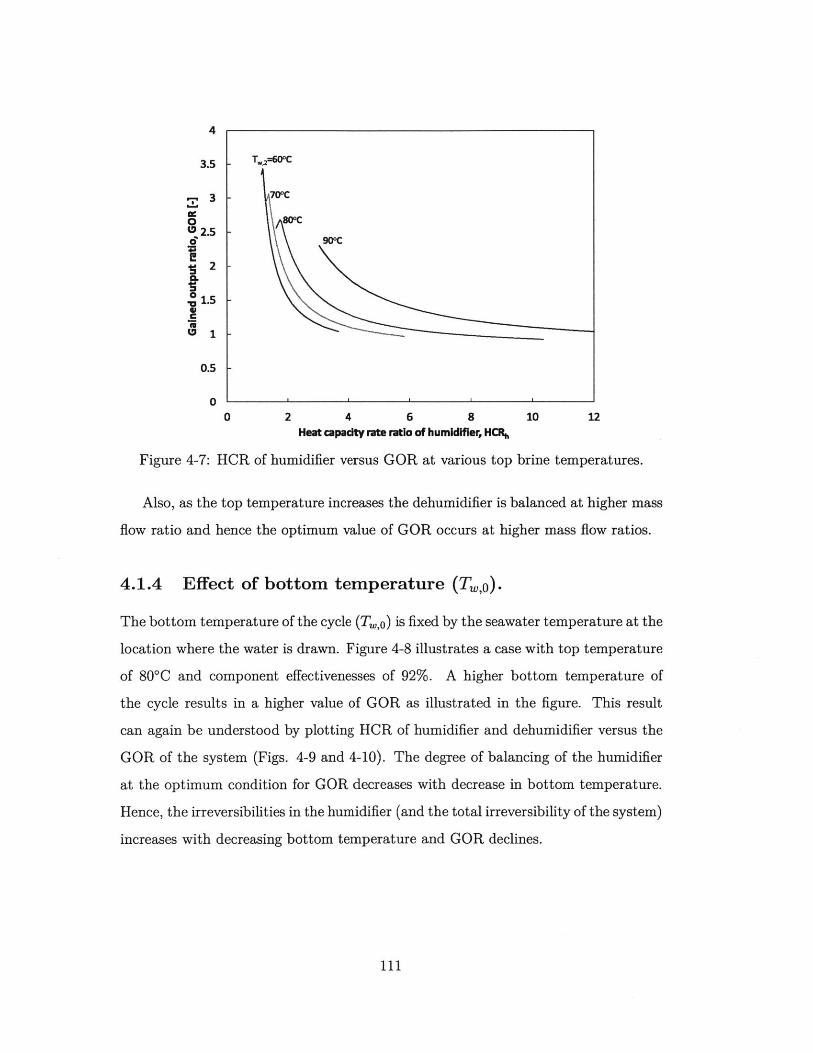
4
3.5 -,' " -
3-U,3 700C
o 800C02.56r 900C
2
1.5
0.5
0 2 4 6 8 10 12Heat capacty rate ratio of humidifier, HCR
Figure 4-7: HCR of humidifier versus GOR at various top brine temperatures.
Also, as the top temperature increases the dehumidifier is balanced at higher mass
flow ratio and hence the optimum value of GOR occurs at higher mass flow ratios.
4.1.4 Effect of bottom temperature (TW,o).
The bottom temperature of the cycle (Tw,o) is fixed by the seawater temperature at the
location where the water is drawn. Figure 4-8 illustrates a case with top temperature
of 80 0C and component effectivenesses of 92%. A higher bottom temperature of
the cycle results in a higher value of GOR as illustrated in the figure. This result
can again be understood by plotting HCR of humidifier and dehumidifier versus the
GOR of the system (Figs. 4-9 and 4-10). The degree of balancing of the humidifier
at the optimum condition for GOR decreases with decrease in bottom temperature.
Hence, the irreversibilities in the humidifier (and the total irreversibility of the system)
increases with decreasing bottom temperature and GOR declines.
111

3.5
3
0
n.0CL
'UIi
2.5
2
1.5
1
0.5
00 1 2 3 4 5 6
Mass flow ratio (rdrhd,)
Figure 4-8: Effect of feedwater temperature on performance of the WH-CAOW HDHcycle.
3
2.5
020
1.5
1
0.5
00 0.2 0.4 0.6 0.8 1 1.2 1.4 1.6
Heat capacity rate ratio of dehumidifier, HCRd
Figure 4-9: HCR of dehumidifer versus GOR at various feedwater temperatures.
112
\ 35C
300C250C
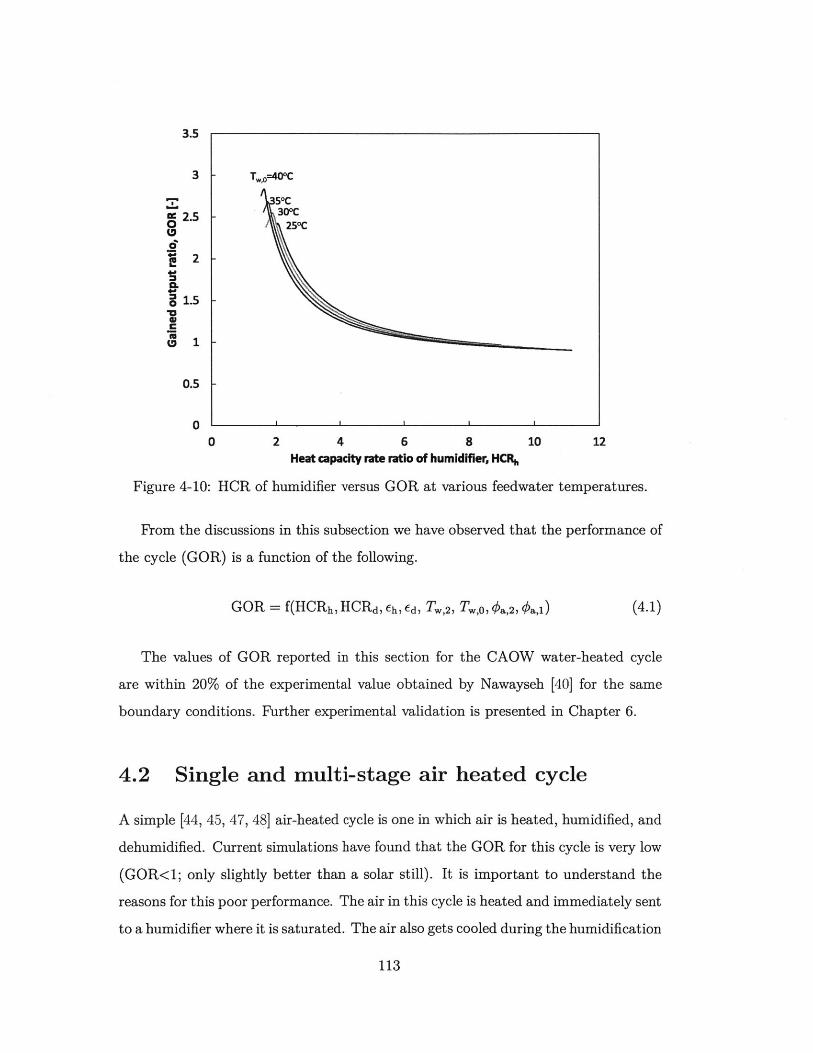
3.5
3 - T. 0=400C
5"C
2.5 -30 0C250C
.2
*04.
o 15C
0.5
00 2 4 6 8 10 12
Heat capacity rate ratio of humidifier, HCRh
Figure 4-10: HCR of humidifier versus GOR at various feedwater temperatures.
From the discussions in this subsection we have observed that the performance of
the cycle (GOR) is a function of the following.
GOR = f(HCRh, HCRd, eh, ed, Tw, 2, T., 0, #a,2, Oa,j) (4.1)
The values of GOR reported in this section for the CAOW water-heated cycle
are within 20% of the experimental value obtained by Nawayseh [40] for the same
boundary conditions. Further experimental validation is presented in Chapter 6.
4.2 Single and multi-stage air heated cycle
A simple [44, 45, 47, 48] air-heated cycle is one in which air is heated, humidified, and
dehumidified. Current simulations have found that the GOR for this cycle is very low
(GOR<1; only slightly better than a solar still). It is important to understand the
reasons for this poor performance. The air in this cycle is heated and immediately sent
to a humidifier where it is saturated. The air also gets cooled during the humidification
113

process since it is at a higher temperature than the water stream. Thus, heat is lost
to the water stream in the humidifier. In the water-heated cycle, the air stream is
heated in the humidifier. This further facilitates heat recovery in the dehumidifier,
which is absent in an air heated system. Hence, the performance is much lower in an
air-heated system.
To improve the performance of air-heated systems, Chafik [44, 971 proposed a
multi-stage cycle. A three stage cycle was illustrated using a psychrometric chart in
Chapter 2 (Fig. 2-5). The air in this cycle is heated and sent to a humidifier where
it is saturated. It is then further heated and humidified again. The idea behind this
scheme was to increase the exit humidity of the air so that water production can be
increased. Chafik was able to increase the exit humidity from 4.5% (by weight) for
a single stage system to 9.3% for a 4 stage system. We reproduce this result for the
same cycle under similar operating conditions. However, we also observed that the
GOR of the cycle rises by only 9% (Fig. 4-11). This is because the increased water
production comes at the cost of increased energy input. This, in turn, is because
the multi-staging does not improve the heat recovery in the humidification process.
Chafik reported very high cost of water production of 28.65 Euro/m 3 due in part to
low energy efficiency of the system.
4.3 Chapter conclusions
A comprehensive study to understand and optimize the performance of previously
stufies HDH cycle conigurations has been carried out. The following significant con-
clusions are reached:
1. The performance of a basic water-heated cycle depends on: (a) the water-to-air
mass flow rate ratio; (b) the humidifier and dehumidifier effectivenesses; (c) top
and bottom temperatures; and (d) relative humidity of air at the exit of the
humidifier and the dehumidifier.
2. There is a specific value of the water-to-air mass flow rate ratio at which the
114

10 1.2
----Exit humidity (%)
no 8 -GOR 1-1
O
4 -- 0.9 0E
0
2 -.
0 0.7
0 1 2 3 4 5
Number of stages
Figure 4-11: Effect of number of stages on performance of air heated CAOW HDH
system.
performance of the system is optimal. This optimal point is characterized by a
thermodynamically balanced condition in the dehumidifier. The balanced con-
dition as explained in the previous chapter is given by a modified heat capacity
rate ratio of 1. This finding is important, as it is fundamental to design algo-
rithms for HDH systems with mass extraction and injections that are developed
in Chapter. 5.
3. As shown in the table below, previously studied multi-stage and single-stage air
heated cycles have low energy efficiency compared to the water heated HDH
cycle.
4. The performance of existing HDH systems is only 1 / 6 0 th of the reversible GOR.
This shows the extent of the thermodynamic losses (irreversiblity) in these sys-
tems. Much of the remainder of this thesis (Chapters. 5, 7, and 8) is dedicated
to improving the thermal design of the HDH cycle so as to reduce the thermo-
dynamic losses.
115
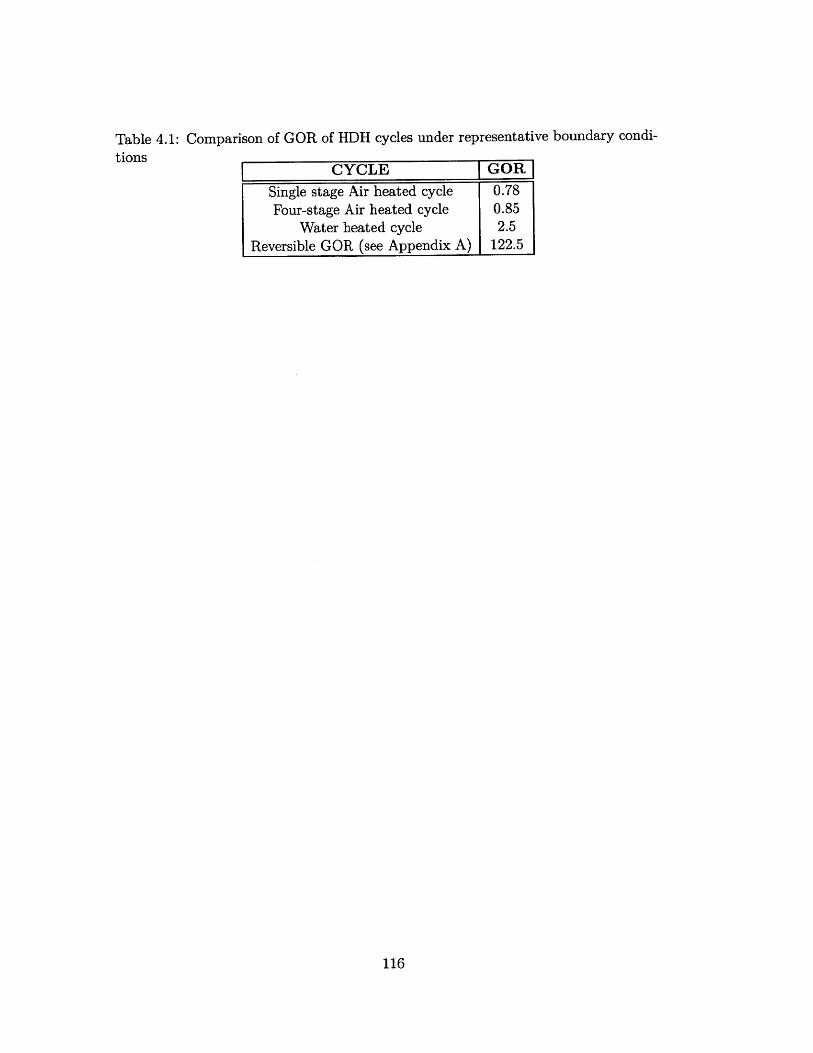
Table 4.1: Comparison of GOR of HDH cycles under representative boundary condi-
tionsCYCLE GOR
Single stage Air heated cycle 0.78
Four-stage Air heated cycle 0.85
Water heated cycle 2.5
Reversible GOR (see Appendix A) 122.5
116
Chapter 5
Thermodynamic balancing of HME
devices and the HDH system by
mass extraction and injection
When finite time thermodynamics is used to optimize the energy efficiency of thermal
systems, the optimal design is one which produces the minimum entropy within the
constraints of the problem (such as fixed size or cost). In this chapter, this well-
established principle is applied to the thermal design of combined heat and mass
exchange devices (dehumidifiers, and humidifiers) for improving the energy efficiency
of HDH systems.
Mass extractions and injections which vary the water-to-air mass flow rate ratio
along the fluid flow path in the humidifier and the dehumidifier is known to improve
the energy efficiency of HDH systems. In the present chapter, we report a compre-
hensive thermodynamic analysis to understand how to design for the aforementioned
mass extractions and injections in the HDH system (Fig. 2-6). This design (discussed
in the succeeding sections) draws upon the fundamental observation that there is a
single value of water-to-air mass flow rate ratio (for any given boundary conditions
and component effectivenesses) at which the system performs optimally (see Chap-
ter 4).
Despite all of the publications on the subject (see Chapter 2.1.4), several questions
117
remain unanswered. These include: (1) evaluating the upper limit on performance of
a HDH system with mass extractions and injections; (2) developing design algorithms
to completely balance HME devices and HDH systems; (3) understanding the effect of
balancing the humidifier as opposed to balancing the dehumidifier on the performance
of the HDH system; and (4) examining the effect of number of extractions on the HDH
system.
5.1 Thermal balancing in simultaneous heat and
mass transfer devices
A major portion of the entropy produced in the HDH system is due to the heat and
mass transfer mechanisms occuring in the humidifier and the dehumidifier. Mistry
et al. [98] demonstrated that at an optimal water-to-air mass flow rate ratio, 70% or
more of all the entropy produced in the water-heated HDH system was produced in
the humidifier and the dehumidifier. In order to reduce the entropy production of the
system we have to address the entropy produced in the humidifier and dehumidifier.
In this section, we revisit the algorithm (previously developed Chapter 3) for control
volume balancing of HME devices and extend it to continuous and discrete balancing
of these devices using mass extractions and injections. We also propose an appropriate
alternative to the 'component effectiveness' (Chapter 3) and the 'temperature pinch'
[51, 52, 54, 58] techniques of modeling HME devices.
5.1.1 'Control volume' balancing
To understand thermodynamic balancing in HME devices let us consider the simpler
case of a heat exchanger first. In the limit of infinite heat transfer area, the entropy
generation rate in this device will be entirely due to what is known as thermal imbal-
ance or remanent irreversibility. This is associated with conditions at which the heat
capacity rate of the streams exchanging heat are not equal [74]. In other words, a heat
exchanger (with constant heat capacity for the fluid streams) is said to be thermally
118

'balanced' (with zero remanent irreversibility) at a heat capacity rate ratio of one.
This concept of thermodynamic balancing, very well known for heat exchangers, was
extended to HME devices in Chapter 3.
In order to define a thermally 'balanced' state in HME devices, a modified heat
capacity rate ratio for combined heat and mass exchange was defined by analogy to
heat exchangers as the ratio of the maximum change in total enthalpy rate of the cold
stream to that of the hot stream. The maximum changes are defined by defining the
ideal states that either stream can reach at the outlet of the device. For example, the
ideal state that a cold stream can reach at the outlet will be at the inlet temperature
of the hot stream and that a hot stream can reach at the outlet will be at the inlet
temperature of the cold stream. The physics behind this definition are explained in
chapter 3.
HCR = A max,c (5.1)k AHmax,h(
It was shown previously that at fixed inlet conditions and effectiveness, the entropy
generation of a combined heat and mass exchange device is minimized when the
modified heat capacity rate ratio (HCR) is equal to unity (Chapter 3.2). Further, a
recent study [88] has shown that for a fixed heat transfer rate, condensation rate, and
HME size, the entropy generation in a dehumidifier approaches a minimum when HCR
approaches unity. Thus, we could say that HCR being unity defines the balanced state
for HME devices irrespective of whether it is a fixed effectiveness or a fixed hardware
condition. However, this is a 'control volume' balanced state wherein the design does
not include mass extractions and injections. We will now try to extend the control
volume concept to that of complete thermodynamic balancing in HME devices by
variation of water-to-air mass flow rate ratio along the process path.
119

5.1.2 Enthalpy pinch: novel parameter to define performance
of HME device
To clearly visualize the simultaneous heat and mass transfer process, we consider the
example of a dehumidifier and plot a temperature versus enthalpy diagram (Fig. 5-1).
In section 4 of a recent publication [58], we explained in detail the various approxi-
mations involved in such graphical representations. The approximations involved in
Fig. 5-1 are also summarized in appendix A of the present paper.
so h WC
70 - b'-- --- ----
0 -
CL waterE
20 - f -- ----
10 -.
0-200 -100 0 100 200 300 400 500 600 700 800
Specific enthalpy (kJ/kg dry air)
Figure 5-1: Temperature versus enthalpy diagram representing the dehumidification
process highlighting the maximum change in enthalpy rates (per kg of dry air) thatcan be achieved by each of the fluid streams (Ahmax,c and Ahmax,h) and the terminal
enthalpy pinches (IFe and Wh).
In Fig. 5-1, e to f represents the process path for dehumidification of the moist air
and a to b represents the process path for energy capture by the seawater stream. f'
and b' represent the hypothetical ideal states the moist air and water stream would
have, respectively, reached if the dehumidifier had been of infinite size. Hence, h*|If -
h*|If (represented as Wh) and h*ly, - h* Ib (represented as Ic,) is the loss in enthalpy
120
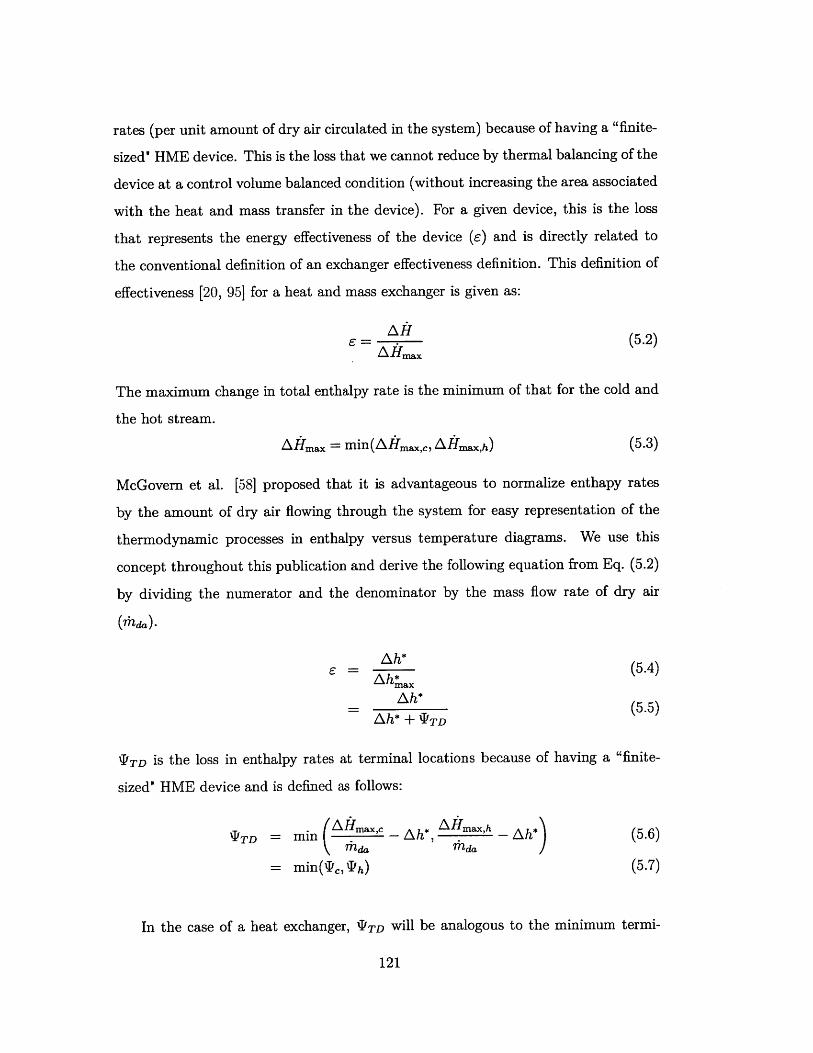
rates (per unit amount of dry air circulated in the system) because of having a "finite-
sized' HME device. This is the loss that we cannot reduce by thermal balancing of the
device at a control volume balanced condition (without increasing the area associated
with the heat and mass transfer in the device). For a given device, this is the loss
that represents the energy effectiveness of the device (e) and is directly related to
the conventional definition of an exchanger effectiveness definition. This definition of
effectiveness [20, 951 for a heat and mass exchanger is given as:
AfH (5.2)AfHmax
The maximum change in total enthalpy rate is the minimum of that for the cold and
the hot stream.
Afmax = min(Atmax,c, Afrmax,h) (5.3)
McGovern et al. [58] proposed that it is advantageous to normalize enthapy rates
by the amount of dry air flowing through the system for easy representation of the
thermodynamic processes in enthalpy versus temperature diagrams. We use this
concept throughout this publication and derive the following equation from Eq. (5.2)
by dividing the numerator and the denominator by the mass flow rate of dry air
(rhda).
Ah*e = a(5.4)
Ah* axAh* Ah* (5.5)
Ah* + 'JTD
'ITD is the loss in enthalpy rates at terminal locations because of having a "finite-
sized' HME device and is defined as follows:
T TD = min maxc AH max,h - Ah* (5.6)Mda rndaJ
= min(IC, h) (5.7)
In the case of a heat exchanger, "'TD will be analogous to the minimum termi-
121

nal stream-to-stream temperature difference (TTD). Assuming the hot stream is the
minimum heat capacity stream, we may derive the equations for the effectiveness of
a heat exchanger as given below (Eqs. 5.8 & 5.9).
EHE = )(Thp~ - (5.8)(mhc,) h(Th,in - Tc,in)
A~h ±(5.9)ATh + (Th,out - Tc,in)
TTDh
The extention to the case where the cold stream is the minimum heat capacity stream
is similar. By comparing Eqs. 5.5 & 5.9, the analogy is clear.
TTD is seldom used to define performance of a heat exchanger in thermodynamic
analyses; the temperature pinch is the commonly used parameter. The difference is
that the pinch is the minimum stream-to-stream temperature difference at any point
in the heat exchanger and not just at the terminal locations. Like temperature pinch,
I can be defined as the minimum loss in enthalpy rate due to a finite device size at any
point in the exchanger and not just at the terminal locations. This is accomplished,
as shown in Fig. 5-2, by considering infinitely small control volumes represented by
just two states (g for air and i for water). We can define the ideal states for each
of these real states as g' and i'. The local I at this location can be defined as the
minimum of hIjg - hji (represented as XI'2) and hjg - hIy (represented as X1). Thus,
the general definition of 'I will be as follows:
T = min(Ah* - Ah*) (5.10)local ma
Hence, based on the arguments presented in this section, we can say that XF for
a HME device is analogous to temperature pinch for an HE, and it can be called
the 'enthalpy pinch'. We recommend that, because of the presence of the concentra-
tion difference as the driving force for mass transfer in HME devices, a temperature
pinch or a terminal temperature difference should not be used when defining the
performance of the device.
122

80
70 b------
60 -------------------------------
50 ter
E
20 - f-----------
10 -
0-200 -100 0 100 200 300 400 500 600 700 800
Specific enthalpy (kJ/kg dry air)
Figure 5-2: Temperature versus enthalpy diagram for the dehumidification process
highlighting 'loss in ideal enthalpy' or enthalpy pinch at any given location (Trocal)as a measure of local effectiveness in HME devices.
The energy effectiveness is another commonly used performance metric for HEs
[95] and HMEs [20]. But, this is a control volume parameter and accounts for only
terminal differences. In order to design for balancing, we need to consider local
differences. Consider the temperature profile of a humidification process as shown in
Fig. 5-3: the 'pinch' point does not occur at the terminal locations but rather at an
intermediate point. This behaviour is not captured if we define the performance of
the device by an energy effectiveness. In the extreme case, as demonstrated in Fig.
22 of Miller et al. [99], high values of effectiveness for the humidifier could lead to an
internal temperature and concentration cross. IF does not have this problem since it
is a local parameter and is, hence, used to define the performance of HME devices
(humidifiers and dehumidifiers) in this study.
123

110
100 -
C
80 -
s70-
60 - a0
60 -A
8.
30
20
10
0-200 -100 0 100 200 300 400 500 600 700 800
Specific enthalpy (ki/kg dry air)
Figure 5-3: Temperature versus enthalpy diagram representing the humidification
process highligting the 'pinch point' occuring at an intermediate location rather than
at a terminal one.
5.1.3 Mass extractions or injections based balancing
As described in Sec. 5.1.1, a value of unity for the modified heat capacity rate ratio
defines a thermally balanced state for a control volume without extractions. For such
a case HCR is not equal to unity at all locations in the device. With mass extractions
or injections we can vary the slope of the water line such that HCR is one throughout
the device. This is the operating condition at which the HME device is completely
balanced. We rewrite the expression for HCR in terms of Te and 'Ph to understand
this concept.
HCR = .-max,c (5.11)AHmax,h
Ah* + Tc(5.12)
Ah* + 'P
124

when HCR=1 for the CV, "TD,c = FTD,h (5.13)
when HCR=1 at all locations, T = constant (5.14)
To vary the water-to-air mass flow rate ratio such that HCR=1 at every location
in the device (or conversely T = constant at every point) we need extractions or
injections at every point (the number of extractions of injections are infinitely many).
We call this "continuous thermodynamic balancing". Even though this has theoretical
significance in understanding systems with mass extraction and injection, in practice
it will be difficult to achieve. Hence, we also evaluate balancing a HME device with
a finite number of injections. In the cases reported in this paper, we investigate a
single extraction or injection alone.
As can be understood by looking at Figs. 5-1 and 5-2, in a 'control volume'
balanced dehumidifier without extractions or injections, the local T is minimum at
the two terminal locations (also see Eq. 5.13), and at all intermediate points it is
higher. This results from the nature of the temperature-enthalpy diagram as discussed
in more detail in Sec. 5.2. The local variation of T in the control volume balanced
case is illustrated in Fig. 5-41. As may be observed from the figure, a single injection
brings T to a minimum value at one intermediate location (or conversely brings
HCR = 1 at that location and the two terminal ones). In the case of the number
of injections approaching infinity, local value of '1 can be minimum and constant
throughout the length of the device (Eq. 5.14). The direction of the injection of air is
to the dehumidifier. Since, we need to vary the water-to-air mass rate ratio to balance
the device (and not individual mass flow rates) we can equivalently inject water into
the (counterflow) dehumidifier.
Figure 5-5 illustrates the effect of continuous and single injections on the total
irreversiblity in the dehumidifier. The entropy produced per unit amount of water
condensed is reduced to a quarter with continuous injection and to 3/ 5th with a single
injection. This is representative of an optimal case. Such a large reduction demon-
strates the importance of thermodynamic balancing for heat and mass exchangers.
'For the x-axis in Fig. 5-4, the specific enthapy per kg of dry air (used to describe the control
volume location in Figs.(5-1-5-2)) is normalised by the total heat duty (Ah*). This convention is
used in the rest of the thesis.
125

240
190
140
90
0
0 0.1 0.2 03 0.4 0.5 06 0.7 OA 03 1
Non-dimensional (enthalpy) location along the fluid flow path H
Figure 5-4: A plot of local enthalpy pinch values ('Iocar) relative to the overall en-
thalpy pinch (T) to illustrate the effect of extractions in a dehumidifier with the
control volume balanced case.
V
.C0V
C
C
C
)S-
0.35
0.3
0.25
0.2
0.15
0.1
0.05
0=0 N=1
Number of extractions In the dehumidifier, N [
Figure 5-5: Effect of extraction on the irreversiblity in the dehumidifier evaluated at
T = 20*C; Te = 70'C; adeh = 20 kJ/kg dry air; HCR =1.
126
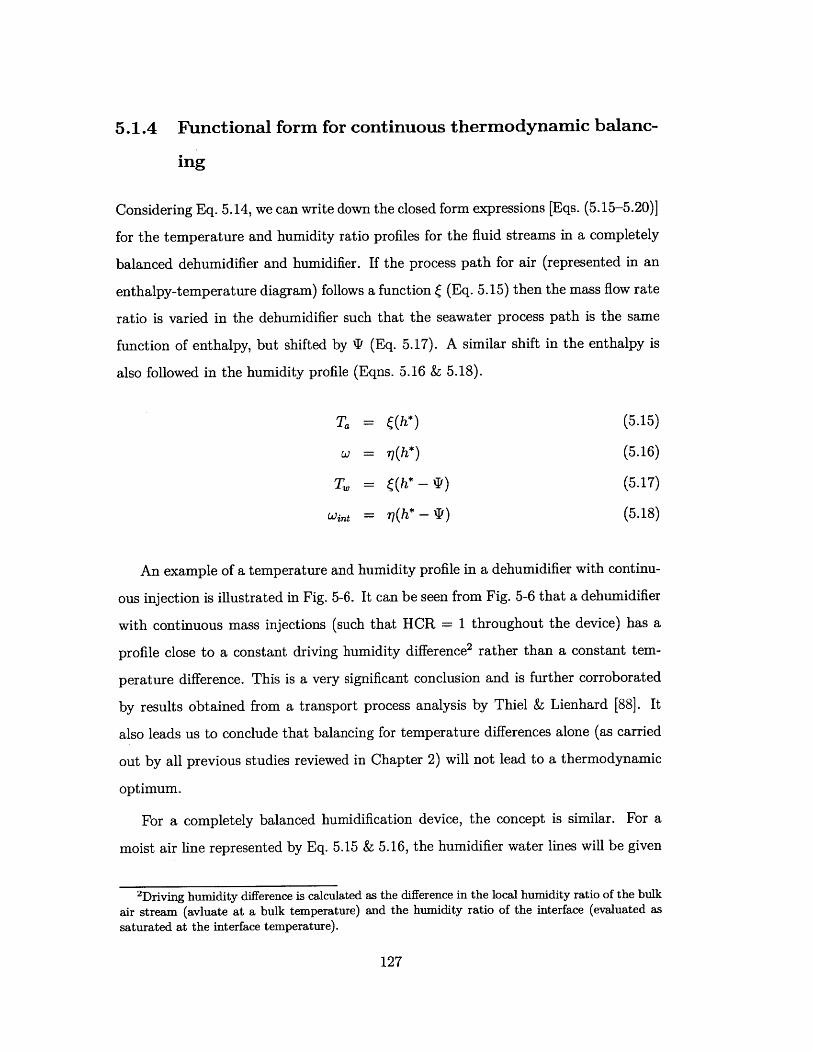
5.1.4 Functional form for continuous thermodynamic balanc-
ing
Considering Eq. 5.14, we can write down the closed form expressions [Eqs. (5.15-5.20)]
for the temperature and humidity ratio profiles for the fluid streams in a completely
balanced dehumidifier and humidifier. If the process path for air (represented in an
enthalpy-temperature diagram) follows a function ( (Eq. 5.15) then the mass flow rate
ratio is varied in the dehumidifier such that the seawater process path is the same
function of enthalpy, but shifted by IQ (Eq. 5.17). A similar shift in the enthalpy is
also followed in the humidity profile (Eqns. 5.16 & 5.18).
Ta = ((h*) (5.15)
W = r,(h*) (5.16)
Tw = ((h* - P) (5.17)
Wi = 77(h* - q1) (5.18)
An example of a temperature and humidity profile in a dehumidifier with continu-
ous injection is illustrated in Fig. 5-6. It can be seen from Fig. 5-6 that a dehumidifier
with continuous mass injections (such that HCR = 1 throughout the device) has a
profile close to a constant driving humidity difference2 rather than a constant tem-
perature difference. This is a very significant conclusion and is further corroborated
by results obtained from a transport process analysis by Thiel & Lienhard [88]. It
also leads us to conclude that balancing for temperature differences alone (as carried
out by all previous studies reviewed in Chapter 2) will not lead to a thermodynamic
optimum.
For a completely balanced humidification device, the concept is similar. For a
moist air line represented by Eq. 5.15 & 5.16, the humidifier water lines will be given
2Driving humidity difference is calculated as the difference in the local humidity ratio of the bulk
air stream (avluate at a bulk temperature) and the humidity ratio of the interface (evaluated as
saturated at the interface temperature).
127
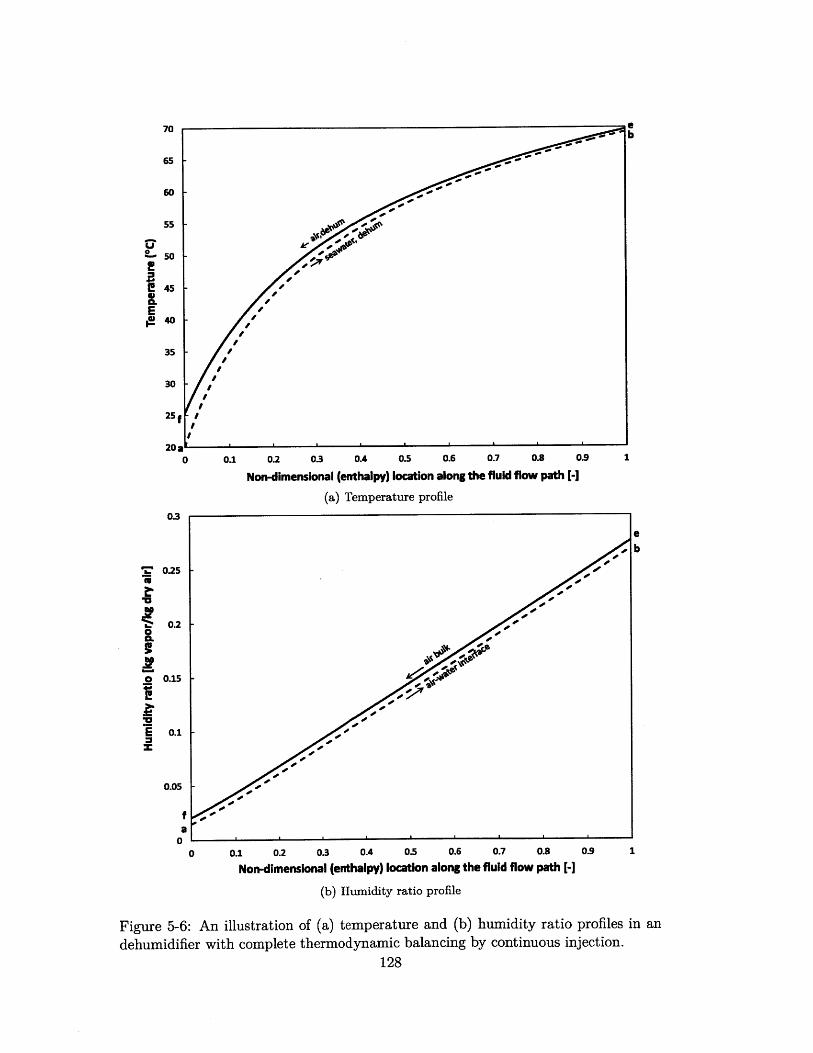
70
65
0 v~s50
E40
35i!40 /
0 0.1 0.2 0.3 3A 0.5 0.6 0.7 0.8 0. 1
Non-dimensional (enrthalpy) location along the fluid flow path[-
(a) Temperature profile
03
Ie
b
0 2 5 -
0.2 -
0.1
E 0 002 . , .4 05 0. . 0 .
0.05
f ,O'
0 ' '
0 0.1 0.2 03 OA 0.5 0.6 07 0.8 0.9 1
Non-dimensional (enthalpy) location along the fluid flow path[-
(b) Humidity ratio profile
Figure 5-6: An illustration of (a) temperature and (b) humidity ratio profiles in an
dehumidifier with complete thermodynamic balancing by continuous injection.
128

by:
Tw = {{h* +IF) (5.19)
Wint = r(h* + T) (5.20)
The complete injection profiles can be obtained by only varying the water-to-air
mass flow rate ratio. This can be done by continuous extraction or injection of either
the air or the water (or both) from or into the HME device.
5.2 Modeling of HDH systems
In the current section, we use the concepts of thermodynamic balancing developed
for HME devices and apply them to the HDH system design. An embodiment of the
system under study is illustrated in Fig. 2-6.
5.2.1 System without extractions
A temperature-enthalpy diagram for the HDH system without extractions (illustrated
earlier in Fig. 2-6) is shown in Fig. 5-7. The process line for the air is represented
by the saturation line 'ef' in the humidifier and the dehumidifier. The uncertainity
in the calculated performance of the HDH system as a result of the approximation
that air is saturated all along its process path is small and is discussed in detail in
Sec. 5.3.3. The seawater process line is represented by 'ab' in the humidifier, by 'bc'
in the heater and by 'cd' in the dehumidifier.
A detailed algorithm to design this system using the top brine temperature, the
feed water temperature and the component enthalpy pinches as input variables is elu-
cidated in Fig. C-1 of Appendix C. The design of the HDH system using temperature-
enthalpy diagrams was also previously discussed by other researchers [49, 51, 55, 58].
A temperature pinch was used in that study instead of an enthalpy pinch used in
the current publication. As illustrated in Fig. C-1, the solution is iterative and the
thermophysical properties are evaluated as described in Sec. E.1.
129

U
0
o op
o . 0. 0 O.4 d.i. p 07 08 .
I-0
E
40 op
d go
30
20a0 0.1 0.2 0.3 0.4 0S 0.6 0.7 0.8 0.9 1
Non-dimensional (enthalpy) location along the fluid flow path [-
Figure 5-7: Temperature profile representing the HDH system without extractions or
injections. Boundary conditions: T = 20*C; Tc = 80*C; "aeh = Thum = 20 kJ/kg
dry air.
Other than the energy and mass conservation equations described in Chapter 3.1.2,
the understanding that the slope of the water line in the temperature versus enthalpy
diagram can be used to evaluate the mass flow rate ratio at any given point in the
HME devices is important to the analysis:
slope = - 1 (5.21)dh* m,c,,
Further, the entropy of the various states evaluated using the temperature-enthalpy
diagram may be used to evaluate the mass flow rate in the humidification and the
dehumidification devices.
130

5.2.2 System with infinite extractions and injections
Equations (5.15-5.20) are fundamental to designing systems with infinite extraction
such that the remanent irreversibility in one of the humidifier or the dehumidifier is
zero. Fig. 5-8 illustrates the application of the aforementioned equations in system
design via temperature versus location diagrams. From a pinch point perspective, the
temperature pinch in the humidifier and the dehumidifier are at different terminal ends
in the 'dehumidifier balanced' and 'humidifier balanced cases'. The enthalpy pinch,
however, is minimum and constant at all points in the dehumidifier and humidifier in
the two respective cases.
The detailed procedure to model the system with infinite extractions illustrated
in Fig. C-2 of Appendix C. In developing this procedure we have put in a place a
constraint that the state (temperature and humidity) of the injected stream is the
same as the stream it is injected into. This is done to avoid generating entropy due
to mixing streams which are at dissimilar states. Further, it is important to note
that air in the dehumidifier has the same inlet and outlet temperature and humidity
unlike water which has a different streamwise temperature in the humidifier and the
dehumidifier (due to the presence of the heater). Thus for the HDH system under
study in this chapter, it is not possible to perform water extractions and injections
without either generating entropy due to mixing or without limiting the number of
extractions. Hence, air extraction is studied in this publication.
5.2.3 System with a single extraction and injection
It is, perhaps, more practical to apply a finite number of extractions and injections
in the HDH system. Hence, we study the effect of a single extraction in this publica-
tion along with that of infinite extractions. Fig. 5-9 illustrates a temperature profile
of a system with a single extraction and injection. In the illustrated case, the air
was extracted from the dehumidifier at the state 'ex' and injected in a corresponding
location in the humidifier with the same state 'ex' to avoid generating entropy dur-
ing the process of injection. This criteria for extraction is applied for all the cases
131

80
70
60 ---U -0
20
0 0.1 0.2 0.3 0.4 0.5 0.6 0.7 0.8 0.9 1
Non-dimensional (enthalpy) location along the fluid flow path [-(a) Dehumidifier balanced
80
C
70 -- a b
40 . ! ,'
S I
30. -
f
20'
0 0.1 0.2 0.3 0.4 0.5 0.6 0.7 0.8 0.9 1
Non-dimensional (enthalpy) location along the fluid flow path
() DHumnidifier balanced
so C
60d
20 a #
Figure 5-8: Temperature profiles representing the HDH system with continuous ex-
tractions to completely balance (a) dehumidifier and (b) humidifier. Boundary con-
ditions: Ta = 20*C; Te = 80*C; Waeh = Washm = 20 kJ/kg dry air.132
reported in this paper since it helps us study the effect of thermodynamic balancing,
independently, by separating out the effects of a temperature and/or a concentration
mismatch between the injected stream and the fluid stream passing through the HME
device (which when present can make it hard to quantify the reduction in entropy
generated due to balancing alone).
The detailed procedure to model the system with a single air extraction and
injection is illustrated in Fig. C-3 of Appendix C.
5.2.4 Property packages
" The thermophysical properties of seawater were evaluated using the correlations
presented by Sharqawy et al. [100].
" Thermophysical properties of pure water are evaluated using the IAPWS (Inter-
national Association for Properties of Water and Steam) 1995 Formulation [78].
" Moist air properties are evaluated assuming an ideal mixture of air and steam
using the formulations presented by Hyland and Wexler [80].
" Moist air properties thus calculated are in close agreement with the data pre-
sented in ASHRAE Fundamentals [81] and pure water properties are equivalent
to those found in NIST's property package, REFPROP [82].
5.3 Results and discussion
In this section, we investigate the effect thermodynamic balancing can have on the
energy performance of the HDH system. First, we attempt to design a completely
reversible HDH system. Then, we use this as a basis to investigate the effect of having
finite-sized systems, of balancing the humidifier versus the dehumidifier, and of the
number of extractions.
133
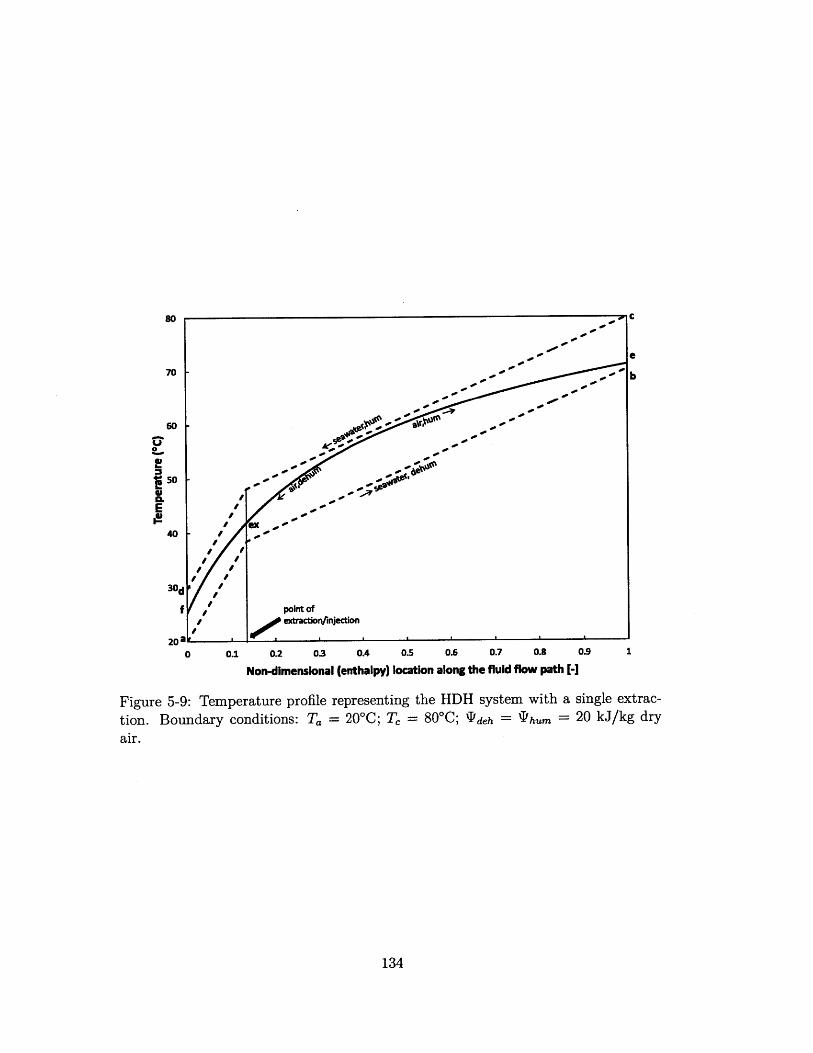
400
go ar
61-.'- -
sod 1 O
40a
30d ,
exctractiofifjectiof
2 0 a6
0 0.1 0.2 0.3 0.4 0.5 0.6 0.7 0.8
Non-dimensional (enthalpy) location along the fluid flow path
Figure 5-9: Temperature profile representing the HDH system with a
tion. Boundary conditions: Ta = 20'C; Tc = 80*C; 1deh = Ta'hum
air.
0.9 1
1
single extrac-
20 kJ/kg dry
134
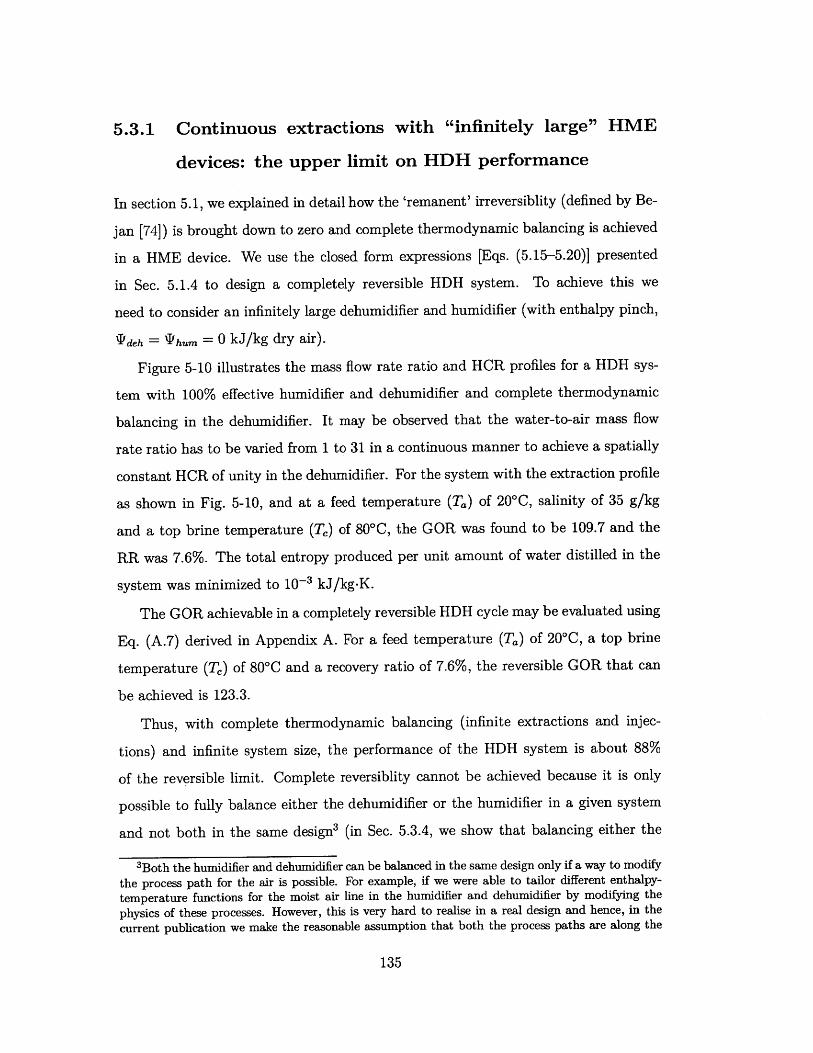
5.3.1 Continuous extractions with "infinitely large" HME
devices: the upper limit on HDH performance
In section 5.1, we explained in detail how the 'remanent' irreversiblity (defined by Be-
jan [74]) is brought down to zero and complete thermodynamic balancing is achieved
in a HME device. We use the closed form expressions [Eqs. (5.15-5.20)] presented
in Sec. 5.1.4 to design a completely reversible HDH system. To achieve this we
need to consider an infinitely large dehumidifier and humidifier (with enthalpy pinch,
"Qdeh = T'hum = 0 kJ/kg dry air).
Figure 5-10 illustrates the mass flow rate ratio and HCR profiles for a HDH sys-
tem with 100% effective humidifier and dehumidifier and complete thermodynamic
balancing in the dehumidifier. It may be observed that the water-to-air mass flow
rate ratio has to be varied from 1 to 31 in a continuous manner to achieve a spatially
constant HCR of unity in the dehumidifier. For the system with the extraction profile
as shown in Fig. 5-10, and at a feed temperature (Ta) of 20*C, salinity of 35 g/kg
and a top brine temperature (Tc) of 800C, the GOR was found to be 109.7 and the
RR was 7.6%. The total entropy produced per unit amount of water distilled in the
system was minimized to 10-3 kJ/kg-K.
The GOR achievable in a completely reversible HDH cycle may be evaluated using
Eq. (A.7) derived in Appendix A. For a feed temperature (Ta) of 20'C, a top brine
temperature (T) of 800C and a recovery ratio of 7.6%, the reversible GOR that can
be achieved is 123.3.
Thus, with complete thermodynamic balancing (infinite extractions and injec-
tions) and infinite system size, the performance of the HDH system is about 88%
of the reversible limit. Complete reversiblity cannot be achieved because it is only
possible to fully balance either the dehumidifier or the humidifier in a given system
and not both in the same design3 (in Sec. 5.3.4, we show that balancing either the
3Both the humidifier and dehumidifier can be balanced in the same design only if a way to modify
the process path for the air is possible. For example, if we were able to tailor different enthalpy-
temperature functions for the moist air line in the humidifier and dehumidifier by modifying the
physics of these processes. However, this is very hard to realise in a real design and hence, in the
current publication we make the reasonable assumption that both the process paths are along the
135

U30 - - - - - - - - - - - - - - HcR- - - - -
. 250.8 .=
E -5
0.6o
15
"'t - 0.4 E8
10
0.25
0 ''''00 0.2 0.4 0.6 0.8 1
Non-dimensional (enthalpy) location along the dehumidifier [
Figure 5-10: Mass flow rate ratio and HCR profile for complete thermodynamic bal-
ancing in a HDH system with 100% effective humidifier and dehumidifier. Boundary
conditions: Ta = 20*C; S = 35 g/kg; Tc = 80'C; Jdeh = Thum = 0 kJ/kg dry air;
N = oo; System performance: GOR = 109.7; RR=7.6%.
136
1.235
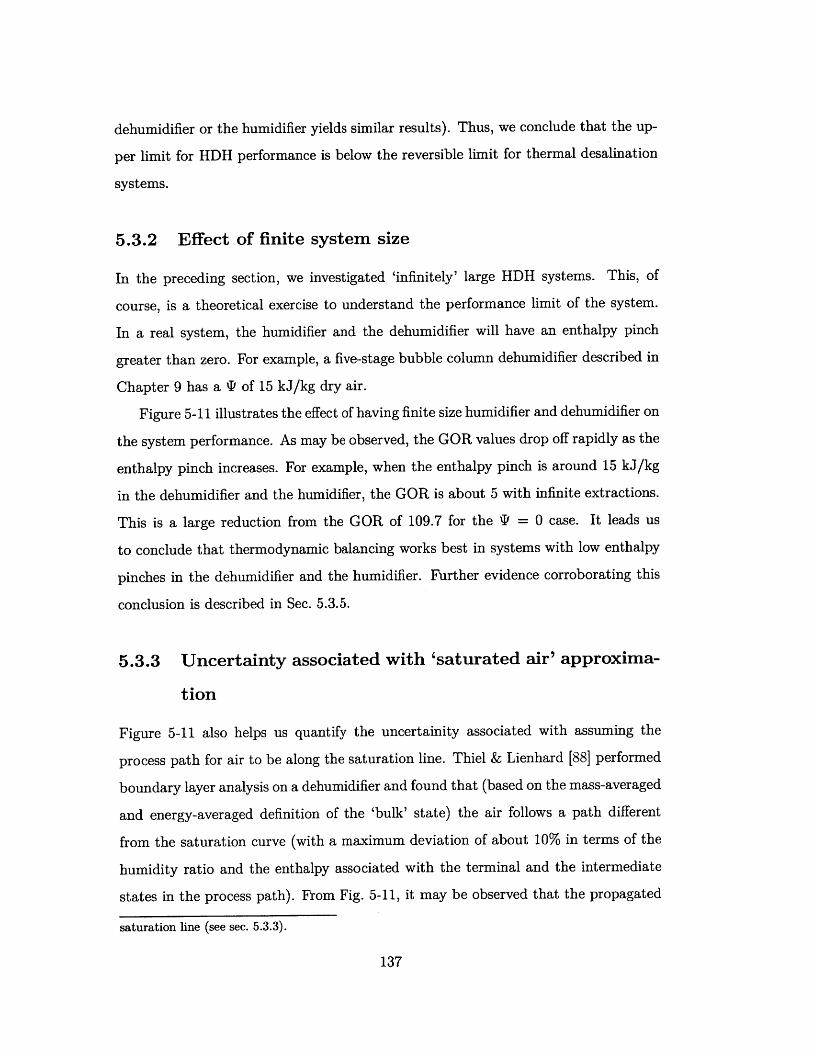
dehumidifier or the humidifier yields similar results). Thus, we conclude that the up-
per limit for HDH performance is below the reversible limit for thermal desalination
systems.
5.3.2 Effect of finite system size
In the preceding section, we investigated 'infinitely' large HDH systems. This, of
course, is a theoretical exercise to understand the performance limit of the system.
In a real system, the humidifier and the dehumidifier will have an enthalpy pinch
greater than zero. For example, a five-stage bubble column dehumidifier described in
Chapter 9 has a T of 15 kJ/kg dry air.
Figure 5-11 illustrates the effect of having finite size humidifier and dehumidifier on
the system performance. As may be observed, the GOR values drop off rapidly as the
enthalpy pinch increases. For example, when the enthalpy pinch is around 15 kJ/kg
in the dehumidifier and the humidifier, the GOR is about 5 with infinite extractions.
This is a large reduction from the GOR of 109.7 for the IF = 0 case. It leads us
to conclude that thermodynamic balancing works best in systems with low enthalpy
pinches in the dehumidifier and the humidifier. Further evidence corroborating this
conclusion is described in Sec. 5.3.5.
5.3.3 Uncertainty associated with 'saturated air' approxima-
tion
Figure 5-11 also helps us quantify the uncertainity associated with assuming the
process path for air to be along the saturation line. Thiel & Lienhard [88] performed
boundary layer analysis on a dehumidifier and found that (based on the mass-averaged
and energy-averaged definition of the 'bulk' state) the air follows a path different
from the saturation curve (with a maximum deviation of about 10% in terms of the
humidity ratio and the enthalpy associated with the terminal and the intermediate
states in the process path). From Fig. 5-11, it may be observed that the propagated
saturation line (see sec. 5.3.3).
137
1000
* calculated using saturated airapproximation
100 x calculated using mass averagedboundary layer data [15]
0
10 -
1
0 5 10 15 20 25 30
Enthalpy pinch In humidifier and dehumidifier, y [kI/kg da]
Figure 5-11: Effect of having finite-size HME devices on the performance of the
HDH system with infinite extractions highlighting the maximum possible uncertainity
associated with using the saturation line as the air process path. Boundary conditions:
Ta = 20*C; S = 35 g/kg; Tc = 80*C; N = oo; HCRdeh=l.
138

uncertainty in the GOR value due to the aforementioned deviation from the saturation
line approximation is small. The uncertainty is less than 1% at IQ values close to zero
and reaches a maximum uncertainty of 11% at a T of 27 kJ/kg of dry air (IF values
greater than 27 kJ/kg are not of interest in this publication because of reasons stated
later in this section). It is important to note that at T = 27 kJ/kg of dry air, a 11%
variation corresponds to an uncertainty of only 0.3 in terms of the GOR value.
5.3.4 Comparison of dehumidifier balanced and humidifier
balanced systems
In Fig. 5-8, we illustrated the temperature profiles for two HDH systems: one with a
balanced dehumidifier and the other with a balanced humidifier. In this section, we
compare the performance of these two systems at various values of enthalpy pinch. As
may be observed from Fig. 5-12, the performance is fairly similar. At lower values of
enthalpy pinch (IF < 7 kJ/kg dry air) the dehumidifier balanced system has a slightly
higher performance and at higher values of enthalpy pinch the humidifier balanced
system is marginally better.
To understand the similar GOR values for the two systems studied in this section,
let us consider Fig. 5-13. The entropy generated in the humidifier and the dehumidifier
per kilogram of water desalinated in the system is illustrated for a fixed top brine
temperature, feed water temperature and enthalpy pinches in the humidifier and the
dehumidifier. When we completely balance the dehumidifier for this system, we reduce
the entropy generated in the dehumidifier to a quarter of that in a system without
mass extractions and injections. However, the entropy generated in the humidifier
is increased by 65%. While we are balancing the dehumidifier, the humidifier is
moving away from the balanced state. In the system with a completely balanced
humidifier, the entropy generation in the humidifier is reduced to less than a third
of that in a system without mass extractions or injections. The entropy generated
in the dehumidifier changes little. The total entropy generated in the system per kg
of water desalinated is about the same for both the system discussed here and hence
139
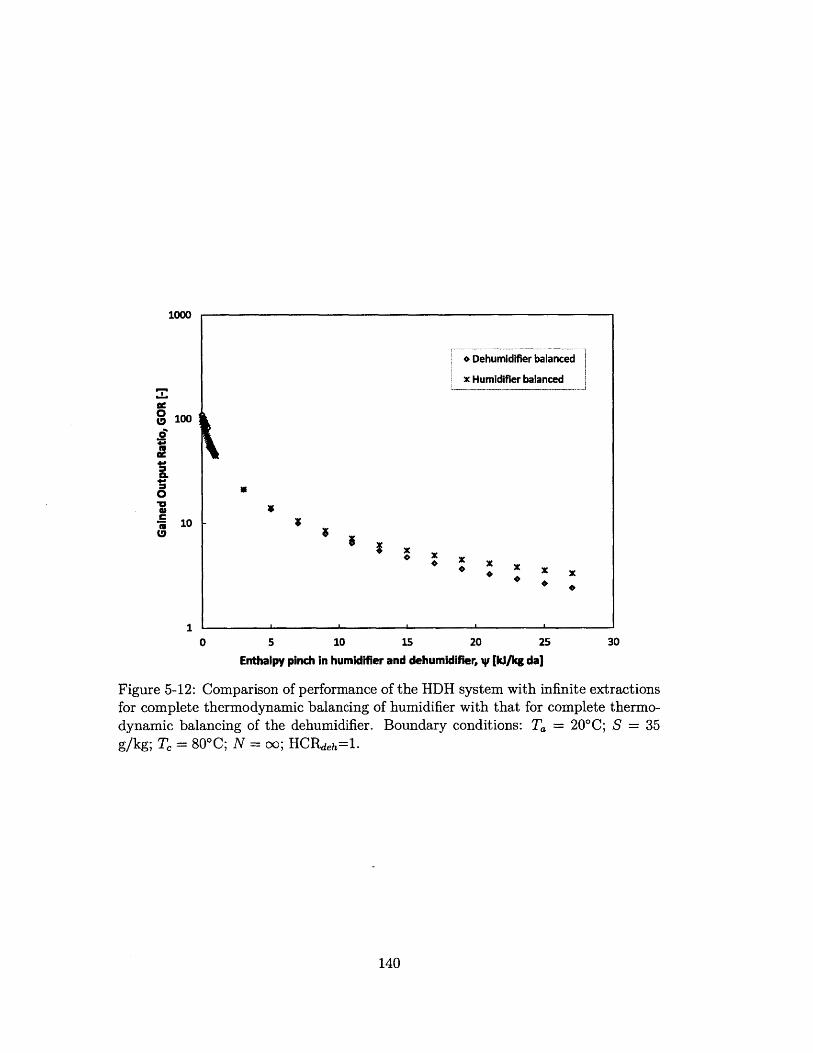
1000
o Dehumidifier balanced
x Humidifier balanced
S100
.'16
C.
0
C S10
0 X 0 X0 X X X
0 5 10 15 20 25 30
Enthalpy pinch in humidifier and dehumidifier, V [Ik/kg da]
Figure 5-12: Comparison of performance of the HDH system with infinite extractionsfor complete thermodynamic balancing of humidifier with that for complete thermo-
dynamic balancing of the dehumidifier. Boundary conditions: Ta = 20*C; S = 35g/kg; Te = 80*C; N = oo; HC~jeh=l.
140
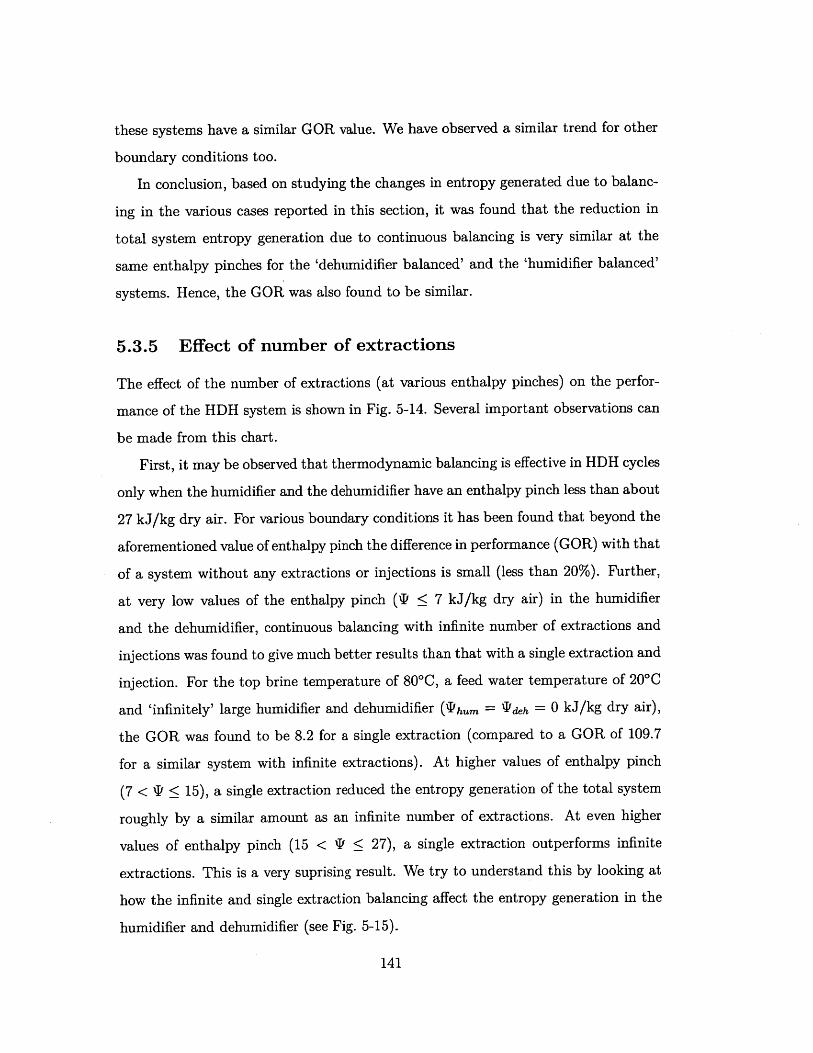
these systems have a similar GOR value. We have observed a similar trend for other
boundary conditions too.
In conclusion, based on studying the changes in entropy generated due to balanc-
ing in the various cases reported in this section, it was found that the reduction in
total system entropy generation due to continuous balancing is very similar at the
same enthalpy pinches for the 'dehumidifier balanced' and the 'humidifier balanced'
systems. Hence, the GOR was also found to be similar.
5.3.5 Effect of number of extractions
The effect of the number of extractions (at various enthalpy pinches) on the perfor-
mance of the HDH system is shown in Fig. 5-14. Several important observations can
be made from this chart.
First, it may be observed that thermodynamic balancing is effective in HDH cycles
only when the humidifier and the dehumidifier have an enthalpy pinch less than about
27 kJ/kg dry air. For various boundary conditions it has been found that beyond the
aforementioned value of enthalpy pinch the difference in performance (GOR) with that
of a system without any extractions or injections is small (less than 20%). Further,
at very low values of the enthalpy pinch (T < 7 kJ/kg dry air) in the humidifier
and the dehumidifier, continuous balancing with infinite number of extractions and
injections was found to give much better results than that with a single extraction and
injection. For the top brine temperature of 80'C, a feed water temperature of 20*C
and 'infinitely' large humidifier and dehumidifier (Thum = Tdeh = 0 kJ/kg dry air),
the GOR was found to be 8.2 for a single extraction (compared to a GOR of 109.7
for a similar system with infinite extractions). At higher values of enthalpy pinch
(7 < IF < 15), a single extraction reduced the entropy generation of the total system
roughly by a similar amount as an infinite number of extractions. At even higher
values of enthalpy pinch (15 < IQ < 27), a single extraction outperforms infinite
extractions. This is a very suprising result. We try to understand this by looking at
how the infinite and single extraction balancing affect the entropy generation in the
humidifier and dehumidifier (see Fig. 5-15).
141
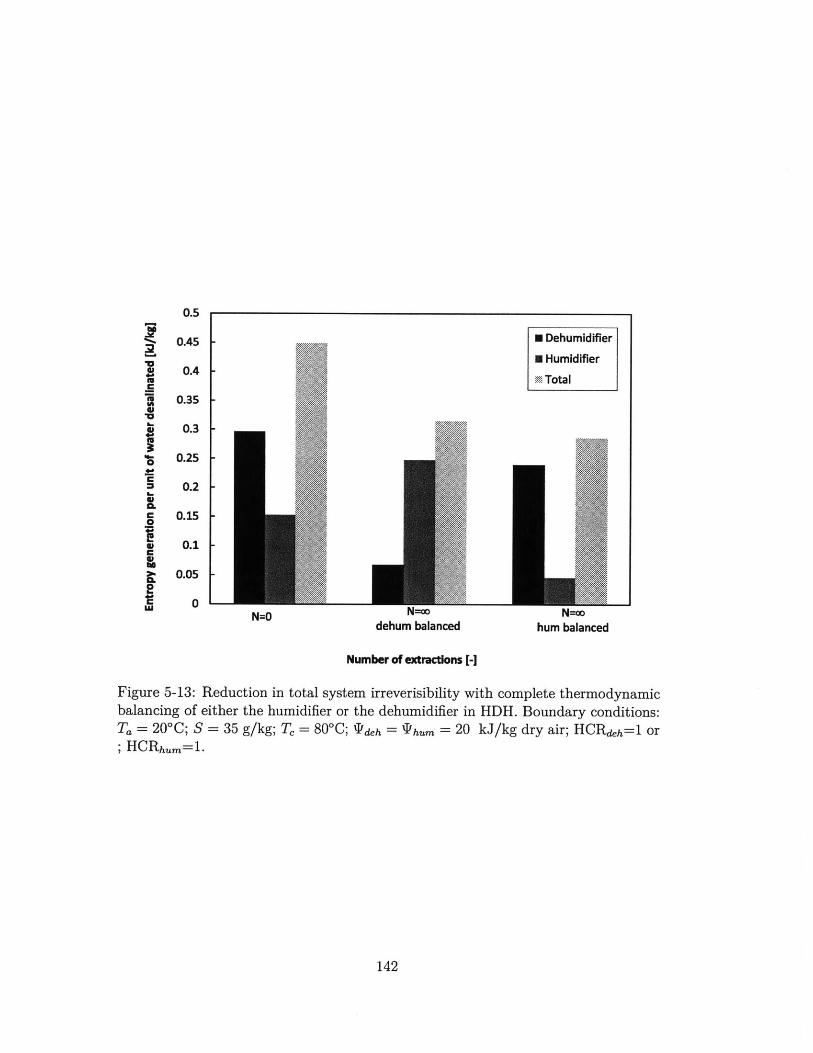
0.5
0.45
0.4
0.35
0.3
0.25
0.2
0.15
0.1
0.05
0
M Dehumidifier
0 Humidifier
- TotaI
N=d l=aedehumn balanced hum balanced
Number of extractions [-]
Figure 5-13: Reduction in total system irreverisibility with complete thermodynamicbalancing of either the humidifier or the dehumidifier in HDH. Boundary conditions:Ta = 20*C; S = 35 g/kg; Tc = 80*C; Xydeh = T hum = 20 kJ/kg dry air; HCRdh=1 or; HCRhum=1.
142
'U
1000
0
0
C
100i
10
*N-+infinity
x N=1
o N=0
*
-
£X 6 X X X
XXOxixt"I1
10
UA 0 0
5
0 * * * 0
10 15
0
20 25
Enthalpy pinch in humidifier and dehumidifier, y [kJ/kg da]
Figure 5-14: Effect of number of extractions (for thermodynamic balancing) on the
performance of the HDH system with finite and infinite size HME devices. Boundaryconditions: Ta = 20*C; S = 35 g/kg; Tc = 80'C; HCRdeh=.
143
X X X X X X X X X

Figure 5-15 illustrates the entropy generated in the humidifier and the dehumidifier
in systems with zero, one and infinite extractions/injections at component enthalpy
pinches of 20 kJ/kg dry air. It may be observed that when continuous extractions
are applied, the entropy generated in the balanced component (the dehumidifier) is
reduced but the entropy generated in the humidifier is increased. In other words, the
humidifier is 'de-balanced' as the dehumidifier is balanced. For the single extractions
case, even though the entropy generated in dehumidifier is reduced by a smaller
amount than that in the infinite extractions case, the humidifier is not de-balanced.
Thus, the total entropy generated is lower in the single extraction case and the GOR
is higher.
5.4 Chapter conclusions
In the first half of this chapter, a detailed study of thermodynamic balancing in HME
devices is carried out. The following is a summary of the main conclusions of that
study.
1. A novel "enthalpy pinch" has been defined for combined heat and mass exchange
devices. This definition is analogous to the temperature pinch traditionally de-
fined for heat exchangers. The enthalpy pinch (IF) combines stream-to-stream
temperature and humidity ratio differences, and is directly related to the effec-
tiveness of the device. We recommend it for use in thermodynamic analysis of
systems containing HME devices.
2. Closed form equations for the temperature and humidity ratio profiles of a
completely and continuously balanced HME device with zero 'remanent' irre-
versiblity is presented in this paper for the first time in literature.
3. It is observed that this state of complete thermodynamic balancing (in humid-
ifiers and dehumidifiers) is closer to a state of constant local humidity ratio
difference than to that of a constant stream-to-stream temperature difference.
144

0.5
0.45
0.4
0.35
S0.3
20.25
0.2
0.15
0.1
0.05
0
- Dehumidifier
" Humidifier
STotaI
N=U N=1
Number of extractions [-]
N=co
Figure 5-15: Effect of extraction on total system irreversiblities. Boundary conditions:T = 20*C; S = 35 g/kg; T = 80*C; Wdeh = W'hum = 20 kJ/kg dry air; HCRdeh=1.
145
*0
'U
.2
4. By continuous injection of mass in a dehumidifier, the entropy generation in the
device can be brought down to .1th of that in a device without injections. By4
a single extraction it can be brought down to Ith. Either water or air may be5.
injected from the dehumidifier in these cases.
Further, these observations were used in the second part of the chapter for the de-
sign of thermodynamically balanced HDH systems, and the following are the salient
features of that part of the study.
1. Detailed algorithms for design of HDH systems with mass extractions and in-
jections using the temperature versus enthalpy diagram have been developed in
this chapter. These were developed for both continuous and discrete extractions
and injections.
2. An almost completely reversible HDH system was designed using an "infinitely
large" humidifier and dehumidifier with continuous mass extraction and injec-
tion. A theoretical gained-output-ratio of 109.7 approaching the reversible limit
of 123.3 was evaluated for this ideal system with the total entropy generation
(Seapproaching zero (e- ~ 10- kJ/K- kg water produced).
3. The uncertainty of the final results reported in the paper associated with the
approximation of the air being saturated at all points in the humidification and
dehumidification processes was evaluated to be reasonably small based on the
boundary layer data from Thiel and Lienhard [88].
4. It is found that the performance of an HDH system with a completely balanced
humidifier and that with a completely balanced dehumidifier are similar. This is
explained by examining the entropy generated in each component in the system
in each case.
5. It is found that thermodynamic balancing is effective in HDH only when the
HME devices have an appropriately low enthalpy pinch (IF < 27 kJ/kg dry air).
146

6. At very low values of the enthalpy pinch (T < 7 kJ/kg dry air) in the humidifier
and the dehumidifier, continuous balancing with an infinite number of extrac-
tions and injections was found to give much better results than that with a single
extraction and injection. At higher values of enthalpy pinch (7 < XI < 15), a
single extraction reduced the entropy generation of the total system by a sim-
ilar amount as infinite extractions. At even higher values of enthalpy pinch
(15 < T < 27), single extraction outperformed infinite extractions and at
T > 27, thermodynamic balancing has no significant effect on the performance
of the HDH system.
These results are experimentally validated in a pilot scale HDH unit. The details
of the same are described in the following chapter.
147

THIS PAGE INTENTIONALLY LEFT BLANK
148

Chapter 6
Experimental investigation of
thermal design of HME devices
and HDH systems
Maximization of energy efficiency of a thermal system is at its essence the minimiza-
tion of the total entropy generation in the system (and in the environment) within
the constraint of a fixed system size or cost. In this study, we perform such an
optimization for simultaneous heat and mass exchange devices with a fixed size con-
straint, specifically for the thermal design of humidification dehumidification (HDH)
desalination systems.
A pilot scale experimental unit that incorporates the thermodynamic cycle shown
in Fig. 6-1 (with a daily water production of 700 liters) has been constructed and
instrumented, detailed experiments conducted on the system are reported in this
publication. This unit also facilitates detailed experimentation on the humidification
device and the water heated CAOW HDH system without mass extraction. These
measurements substantiate the previously developed theory for such extractions (see
Chapter 5), and they also provide significant new insights.
149

C
BRINE HEATE
WI
Brine
e
Extracted aistream
f
Oin
b
r
M
-- --
Distilled Feedwater * seawater
- - - - Seawater .--------- Pure water - Moist air .------ extracted moist air
Figure 6-1: Schematic diagram of a water-heated, closed-air, open-waterhumidification-dehumidification desalination system with mass extraction and injec-tion of the moist air stream.
Summary of design theory
The theoretical framework for design of HME devices for implementation in the HDH
system has been developed over a few preceeding chapters of the current thesis. The
linchpin in this theoretical work is the definition of a novel parameter known as the
'modified heat capacity rate ratio' (HCR). A brief summary of the definition of this
parameter and its significance to thermal design of HME devices and the HDH system
is given below.
It was shown previously that at fixed inlet conditions and effectiveness, the en-
tropy generation of a combined heat and mass exchange device is minimized when
150
the modified heat capacity rate ratio (HCR) is equal to unity [21]. Figure 3-9 il-
lustrated an example of this result for a humidifier. This figure elucidated that the
non-dimensional entropy production (as defined in chapter 3) plotted against modi-
fied heat capacity rate ratio for various values of air inlet temperature at fixed values
of energy effectiveness and inlet conditions of air and water streams. Irrespective of
the value of air inlet temperature, non-dimensional entropy generation is minimized
at HCR=1. It was also found that this result is true irrespective of the values of the
other fixed conditions.
Further, a recent study [88] has shown that for a fixed heat transfer rate, con-
densation rate, and HME size, the entropy generation in a dehumidifier approaches
a minimum when HCR approaches unity. Miller [101] developed numerical models
to simulate heat and mass transfer in a fixed area HME device (humidifier and de-
humidifier) and reported that at HCR=1 the non-dimensional entropy generation is
minimized for these devices. Thus, we could say that HCR being unity defines the
balanced state for HME devices regardless of whether it is a fixed effectiveness or a
fixed hardware condition.
Past work also showed the importance of HCR to the performance of the water
heated HDH system shown in Fig. 6-1 without mass extractions or injections [19].
Figure 4-6 shows the variation of performance of the system (gained output ratio or
GOR) with the heat capacity ratio of the dehumidifier (HCRd). It can be seen that
GOR is maximized at HCRd = 1. The maximum occurs at a balanced condition for
the dehumidifier, which is the more irreversible component in this particular cycle.
Thus, we had theoretically shown that HCR=1 is the balanced state for HME
devices and is the criteria for optimal performance of HDH systems. This chapter
experimentally validates those conclusions. Moreover, the fixed hardware analysis
of the HDH system and the importance of HCR to that analysis is reported in this
chapter.
151
6.1 Control volume balancing of HME devices
As described in Sec. 6, theoretical considerations show that a modified heat capacity
rate ratio (HCR) of 1 will lead to minimum entropy generation in a fixed effectiveness
or fixed hardware device and that the condition should be established to optimize the
thermal performance of the HDH cycle [19]. In this section, this important conclusion
is investigated experimentally.
6.1.1 Experimental details
A 3 meter tall packed bed humidifier with a 0.278 m2 cross section packed with heat
transfer fills was built to transfer heat and mass simultaneously between an air stream
and a heated water stream (a 3D rendering of the unit is shown in Fig. 6-2). The
column was built out of transparent acrylic and was split into three sections: (1) the
air chamber or the bottom section - where the air enters the system and the liquid is
discharged from the system; (2) the middle section with the fill material in it where
direct contact heat and mass exchange between the water droplets and the air stream
is affected; and (3) the top section where the hot water from a heater is sprayed on
the packing. The three sections were held together by flanges and were made easy to
disassemble. The air is circulated via forced draft using an air blower and the water
is circulated via a pump. The flow rate of the water is adjusted by an inline valve
attached to the pump. Inside the humidifier are blocks of corrugated plastic sheets. In
the current setup, polypropylene packing material from Brentwood Industries (model
number: CF1200 MA) with a specific area of 226 m2/m 3 was used. Further details
about construction of the humidifier is explained by Maximus St. John [102].
The flow rate of water is measured by a rotameter and the inlet temperature of
the water can be adjusted by the inline electric water heater. The flowrate of air is
measured via a separate rotameter. The inlet and outlet water and air temperatures
are measured by standard K-type thermocouples. The thermocouples and the data
logging system have an uncertainty of ± 0.1*C. The rotameters used for air flow
measurements have a range of 5 -50 ft3/min (2360 - 23600 cm 3/s) with a least count
152

Figure 6-2: Three dimensional rendering of the experimental humidifier unit.
153
of i 0.2 ft 3 /min (i 94.4 cm 3 /s). The rotameter used for water flow measurement has
a range of 0.4 - 2 US gallon/min (25.2 - 126.2 cm 3 /s) with a least count of 0.02 gpm
(1.26 cm 3 /s). Visual observation showed the appearance of supersaturation of air
with water vapor at the exit. This is also a commonly known fact among researchers
in the field. Exit humidity measurements were, hence, not required for these sets of
experiments.
6.1.2 Results
Minimum effectiveness at the balanced condition Figure 6-3 illustrates the
energy effectiveness and the heat capacity rate ratio of the humidifier at various hot
water inlet temperatures to the device. This was measured at a fixed value of air inlet
dry and wet bulb temperatures, a fixed value of water-to-air mass flow rate ratio and
at atmospheric pressure. The maximum uncertainty on the calculated effectiveness
value is i1% and that on the heat capacity rate ratio is ±1.5%.
It may be immediately observed that there exists a water inlet temperature at
which the energy effectiveness is minimum. This corresponds to the case closest to
a HCR of 1. This result is consistent with that demonstrated theoretically [101]. It
is also consistent with the well-established theory for heat exchangers which have a
minimum value of effectiveness at the 'balanced' state.
Condition for minimum entropy generation Figure 6-4 illustrates that there
exists a particular mass flow rate at which non-dimensional entropy generated in
the device is minimized. This is at fixed inlet air condition and fixed inlet water
temperature. At different values of these boundary conditions, the same result was
found to be true. The minimum that is observed also corresponds to the case closest
to an HCR of 1. This is consistent with the theoretical observation that irreversiblity
is minimized at HCR of unity [21, 88, 101].
Effect of HME size We have previously observed that thermodynamic balancing
is most effective when the size of the HME device is large and the driving forces are
154
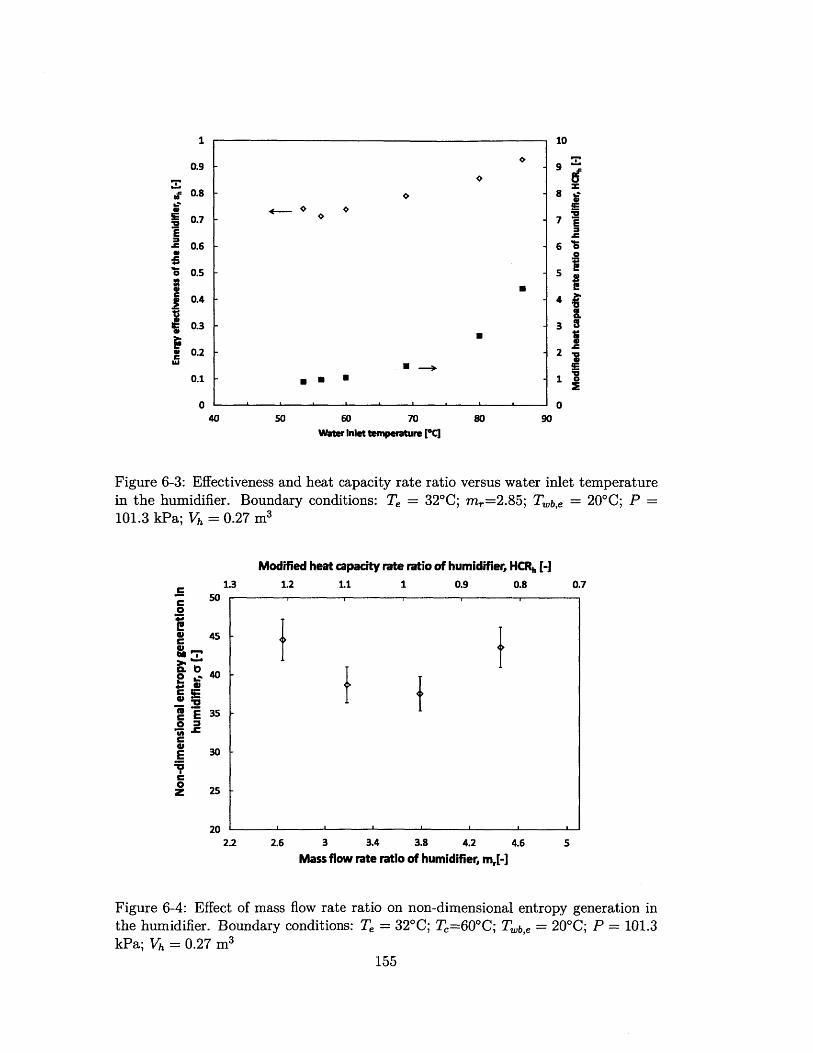
1
0.9
0
2
EE-E
4..
0.8
0.7
0.6
0.5
0.4
0.3
0.2
0.1
040 50 60 70
Water inlet tenpeature [*CJ
80
10
9
8
V
7
60
4
3
2 7
090
Figure 6-3: Effectiveness and heat capacity rate ratio versus water inlet temperaturein the humidifier. Boundary conditions: T = 32*C; m,=2.85; Tb,e = 20*C; P =101.3 kPa; Vh = 0.27 m3
C
C
11C
C0
0.0
C0C
Modified heat capacity rate ratio of humidifier, HCRh [-]1.3 1.2 1.1 1 0.9 0.8
50
01 4
E 35
30
25
20
0.7
2.2 2.6 3 3.4 3.8 4.2 4.6 5
Mass flow rate ratio of humidifier, m[-]
Figure 6-4: Effect of mass flow rate ratio on non-dimensional entropy generation inthe humidifier. Boundary conditions: Te = 32*C; T=60 *C; Tb,e = 20*C; P = 101.3kPa; Vh = 0.27 m 3
155
Q
U
U
U -p.U
I ++

100 0.9
90 - 0.8
80 - U
70 . E7 0.6
60 -0.5
.=50
0.4mL C
40 . -
0.0
0 m0.3
Civl 20 [t 0o2
10 0.1
10 0 L
0 1 2 3 4 5 6
Number of packing blocks[-
Figure 6-5: Effect of packing volume on the performance of the humidification device.Boundary conditions: Te = 32'C; T,=60'C; Twb,e = 20'C; P = 101.3 kPa; Vk =
0.07 in3 ; r,=2.8
relatively small [23]. Here, we investigate the effect of HME size on the effectiveness
and enthalpy pinch of the device. To calculate the enthalpy pinch, a temperature
enthalpy diagram was simulated using the measured exit states of air and water. The
air was approximated to follow the saturated air process path. This approximation
was found to be reasonable in Chapter 5. Figure 6-5 illustrates that as we increase
the packing volume (each block of packing adds 0.07 m 3 of volume), the effectiveness
increases rapidly till it flattens out at 80% and the enthalpy pinch drops rapidly from
80 to 14.8 kJ/kg of dry air.
6.1.3 Section conclusions
From the data presented in this section, we can draw the following important conclu-
sions about performance of HME devices:
156

1. A modified heat capacity rate ratio of 1, under the fixed hardware condition
and at fixed inlet states for the two streams exchanging heat and mass, sets
the optimum mass flow rate ratio at which the entropy generation in the device
is minimized. This is consistent with the on-design (fixed effectiveness) theory
developed earlier.
2. As is well-established in regular heat exchanger theory, for an HME device as
well the energy effectiveness is minimized at a HCR of 1.
3. A small enthalpy pinch of 14.8 kJ/kg dry air is obtained in the pilot scale
humidification device built. This corresponds to a temperature pinch of 2.8*C.
6.2 HDH system experiments
Figure 6-6 is a photograph of the pilot scale CAOW water heated HDH unit built.
The humidifier used in the unit was already described in detail in Sec. 6.1.1. Hooked
up to the humidifier were four polypropylene plate-and-tube dehumidifiers (setup in
series) procured from George Fischer LLC. A photograph of the same is shown in
Fig. 6-7.
In this dehumidification device, air flows through the center and exchanges energy
with a water stream flowing through a series of plates in plane with the cross section.
The air stream is dehumidified in the process producing a condensate stream and the
water stream is preheated before it is sent to the electric heater where the energy is
input for the desalination process. The plates each consist of 35 parallel 0.189" (0.48
cm) ID tubes fed and drained by two section headers. Barriers at opposite ends of
the headers divide it such that water can only flow from one side of the header to the
other via the parallel tubes connecting them. As shown in Figure 6-7, water enters
the header through an inlet in one corner and flows through the parallel tubes to the
opposite header section where it drains into the header below it. Since the headers
separate the hot air flow from the external environment, heat loss in these devices is
reduced. Each of these dehumidifiers had a heat transfer area of 2 m 2 (for a total of 8
157

Figure 6-6: Photograph of the 700 liter/day water-heated, closed-air, open-waterhumidification-dehumidification desalination system with mass extraction and injec-tion of the moist air stream described in this chapter.
158
t
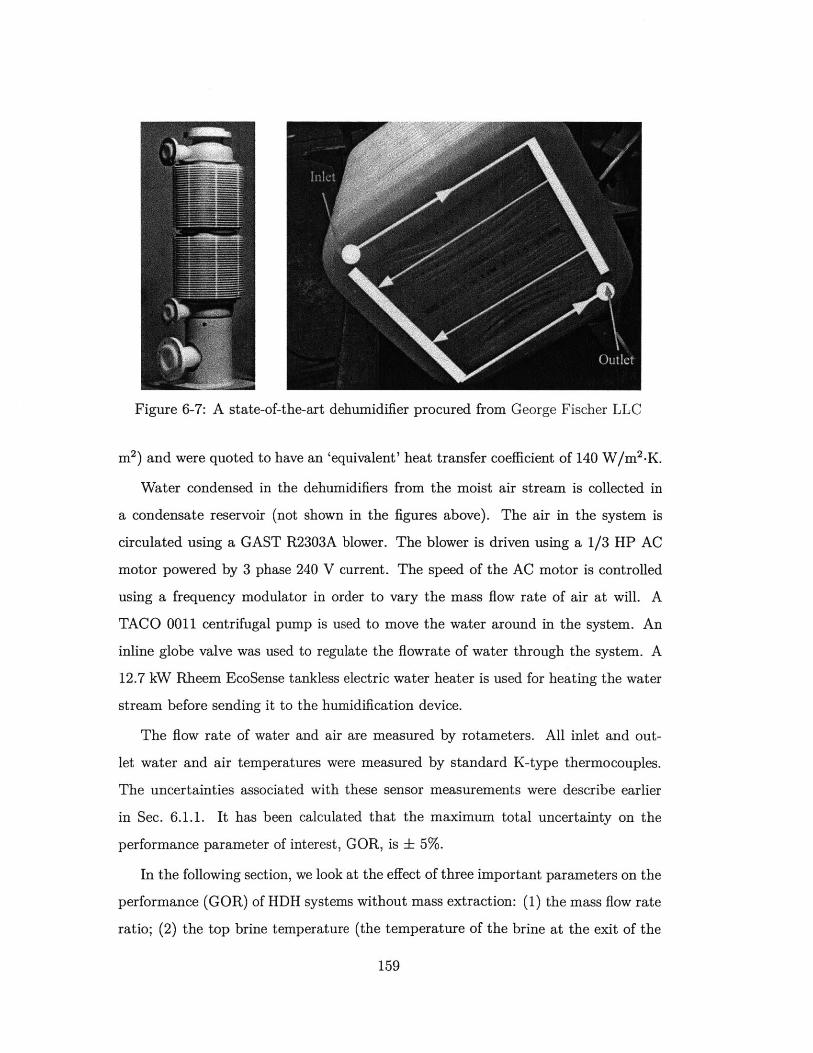
Figure 6-7: A state-of-the-art dehumidifier procured from George Fischer LLC
In2 ) and were quoted to have an 'equivalent' heat transfer coefficient of 140 W/m 2-K.
Water condensed in the dehumidifiers from the moist air stream is collected in
a condensate reservoir (not shown in the figures above). The air in the system is
circulated using a GAST R2303A blower. The blower is driven using a 1/3 HP AC
motor powered by 3 phase 240 V current. The speed of the AC motor is controlled
using a frequency modulator in order to vary the mass flow rate of air at will. A
TACO 0011 centrifugal pump is used to move the water around in the system. An
inline globe valve was used to regulate the flowrate of water through the system. A
12.7 kW Rheem EcoSense tankless electric water heater is used for heating the water
stream before sending it to the humidification device.
The flow rate of water and air are measured by rotameters. All inlet and out-
let water and air temperatures were measured by standard K-type thermocouples.
The uncertainties associated with these sensor measurements were describe earlier
in Sec. 6.1.1. It has been calculated that the maximum total uncertainty on the
performance parameter of interest, GOR, is ± 5%.
In the following section, we look at the effect of three important parameters on the
performance (GOR) of HDH systems without mass extraction: (1) the mass flow rate
ratio; (2) the top brine temperature (the temperature of the brine at the exit of the
159

heater); and (3) the feed water temperature. Further, the effect of mass extractions
and injections is investigated.
6.2.1 Effect of mass flow rate ratio
Figure 6-9 illustrates the effect of the water-to-air mass flow rate ratio on the per-
formance of the water heated CAOW HDH system (illustrated in Fig. 6-1) without
mass extraction or injection. In this plot, GOR is normalized by the optimal GOR
in all of the cases considered in the figure. This normalization is performed for all
the data in the chapter. Absolute values of GOR are tabulated in Sec. 6.2.5. As was
observed by several other researchers [35, 37, 461 and in our previous HDH modeling
efforts [19, 22, 26], there is a particular value of mass flow rate ratio at which the
HDH system performance is optimal.
The optimum mass flow rate ratio corresponds to a modified heat capacity ratio
of unity for the dehumidifier (HCRd=1). This again is consistent with on-design
(fixed component effectiveness) data formerly presented by us [19]. The maximum
GOR thus occurs at a balanced condition for the dehumidifier which is the more
irreversible component in the system for the given feed water temperature, top brine
temperature, and cycle configuration.
6.2.2 Effect of top brine temperature
The top brine temperature (TBT) is an important parameter in the design of thermal
desalination systems. One would expect that for a fixed size of the humidifier and
the dehumidifier, a higher TBT will lead to a higher system efficiency. Figure 6-9
illustrates the same for HDH systems. This figure is plotted at a feed temperature of
25*C and at HCRd = 1.
It may be observed that the performance at a TBT of 60*C is only 55% of that
at a TBT of 90*C. This is an important conclusion which can be only obtained from
fixed hardware (off-design) data. When the components in HDH are modelled as fixed
effectiveness (on-design), the size of the components increase/decrease with change in
160

0 1 2 3 4 5 6Water-to-air mass flow rate ratio [-]
Figure 6-8: Effect of masswithout mass extractions.Vh= 0.27 m 3; Ad=8m 2 .
flow rate ratio on theBoundary conditions:
performance ofTa = 20*C; Tc
the HDH system= 80*C; N = 0;
1.2
1 -
0.8
0.6
0
0.4
0.2
040 50 60 70 80 90 100
Top Brine Temperature [*C]
Figure 6-9: Effect of top brine temperature on the performance of the HDH systemwithout mass extractions. Boundary conditions: T = 25*C; HCRd = 1; N = 0;Vh=0.27m 3;Ad=8m2
161
1.2
* 0.8
0
! 0.60
0.4
0.2
0
II
ii
+
HCR 4=1
7 8

boundary conditions. For example, at a lower TBT a component effectiveness of 80%
will need a much larger component than at a higher TBT. For this reason, on-design
data at certain boundary conditions would suggest that at a lower TBT, we obtain a
higher GOR [19].
In commercial systems, the TBT is limited depending on the constituents of the
water being treated. The formation of hard scales on heat transfer equipment because
of precipitation of scaling components limits the TBT in seawater systems to between
65-900 C.
6.2.3 Effect of feed water temperature
Figure 6-10 further illustrates the usefulness of the HCR concept. Here, we plot the
GOR versus feed water temperature at fixed TBT and water-to-air mass flow rate
ratio.
It may be observed that there is an optimum value for feed water temperature at
which the performance is maximized. This corresponds to a heat capacity rate ratio
of unity in the dehumidifier (HCRd=1). This further reinforces the idea that HCR=1
is the balanced condition for HME devices.
6.2.4 Effect of mass extraction and injection
The enthalpy pinch model for analysis of HME devices in HDH system was dis-
cussed in Chapter 5.1.2. In that work, algorithms for continuous and discreet extrac-
tions/injections in the HDH system with finite and infinite HME size were formulated.
Several important conclusions based on that on-design study were made. It was found
that a single mass extraction and injection of moist air was as efficient or better than
infinite extractions above component enthalpy pinches of 7 kJ/kg&. In Sec. 6.1.2, we
showed that the enthalpy pinch in our pilot unit is greater than the aforementioned
value. Hence, a single extraction of air was made in the current pilot unit from the
humidifier at a height in the humidifier which split the packing volume into 20%
after extraction and 80% before extraction (the extraction was made closer to the
162

1.1
1.0
0
0to
0.9
0.8 -
0.7 -
0.615 20 25 30 35 40
Feed water temperature [*C]
Figure 6-10: Effect of feed water temperature on the performance ofwithout mass extractions. Boundary conditions: T = 90*C; m,Vh = 0.27 m3 ; Ad = 8 m 2.
45
the HDH system= 2.4; N = 0;
163
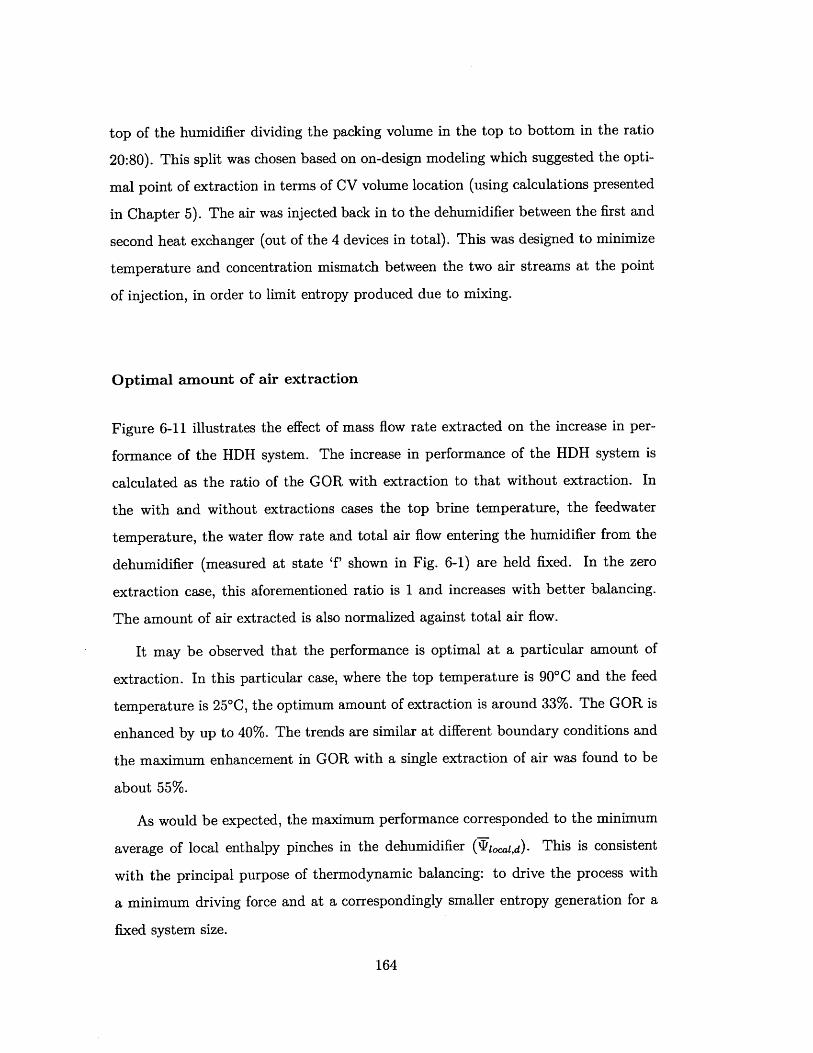
top of the humidifier dividing the packing volume in the top to bottom in the ratio
20:80). This split was chosen based on on-design modeling which suggested the opti-
mal point of extraction in terms of CV volume location (using calculations presented
in Chapter 5). The air was injected back in to the dehumidifier between the first and
second heat exchanger (out of the 4 devices in total). This was designed to minimize
temperature and concentration mismatch between the two air streams at the point
of injection, in order to limit entropy produced due to mixing.
Optimal amount of air extraction
Figure 6-11 illustrates the effect of mass flow rate extracted on the increase in per-
formance of the HDH system. The increase in performance of the HDH system is
calculated as the ratio of the GOR with extraction to that without extraction. In
the with and without extractions cases the top brine temperature, the feedwater
temperature, the water flow rate and total air flow entering the humidifier from the
dehumidifier (measured at state 'f' shown in Fig. 6-1) are held fixed. In the zero
extraction case, this aforementioned ratio is 1 and increases with better balancing.
The amount of air extracted is also normalized against total air flow.
It may be observed that the performance is optimal at a particular amount of
extraction. In this particular case, where the top temperature is 90*C and the feed
temperature is 25*C, the optimum amount of extraction is around 33%. The GOR is
enhanced by up to 40%. The trends are similar at different boundary conditions and
the maximum enhancement in GOR with a single extraction of air was found to be
about 55%.
As would be expected, the maximum performance corresponded to the minimum
average of local enthalpy pinches in the dehumidifier (PlI,d). This is consistent
with the principal purpose of thermodynamic balancing: to drive the process with
a minimum driving force and at a correspondingly smaller entropy generation for a
fixed system size.
164

1.6
Minimum ii
1.5
1.4 -
0 1.3-
0S1.2- ,
1.1 -
1.00.00 0.10 0.20 0.30 0.40 0.50
Amount air extraction per unit air flow [-]
Figure 6-11: Effect of mass flow rate of air extracted on the performance of the
HDH system. Boundary conditions: Ta = 25*C; T = 90'C; N = 1; Vh = 0.27 m3
Ad = 8 m 2 .
165
17
1.6 -
Z 1.5 -0
V 1.4 -TBT=90*C
0 1.3 -~
1.2 . TBT=80*CI
1.1
1.0 I '
0.00 0.05 0.10 0.15 0.20 0.25 0.30 0.35 0.40 0.45 0.50
Amount air extraction per unit air flow [-]
Figure 6-12: Effect of top brine temperature on the performance of the HDH sys-
tem with a single air extraction from the humidifier to the dehumidifier. Boundary
conditions: Ta = 25*C; HCR= 1; N = 1; Vh = 0.27 m3 ; Ad = 8 m2 .
Effect of top brine temperature
Figure 6-12 illustrates the effect of TBT on the enhancement of GOR due to a single
extraction and injection in the HDH system.
It may be immediately observed that there exists an optimum mass of extraction
in each case (corresponding to the case in which the average local enthalpy pinch is
minimum). It may also be observed that the effect of the extraction is larger at a
higher TBT. This was found to be consistently true at other values of feed temperature
and packing volume. The results also make thermodynamic sense because at higher
TBT the reversible efficiency of the cycle is higher. One would expect that the effect
of balancing, which is to bring the system closer to reversibility, is higher when a
higher reversible GOR is possible. This is an important design conclusion which
means that it is desirable to design the extractions with the maximum TBT that is
possible.
166
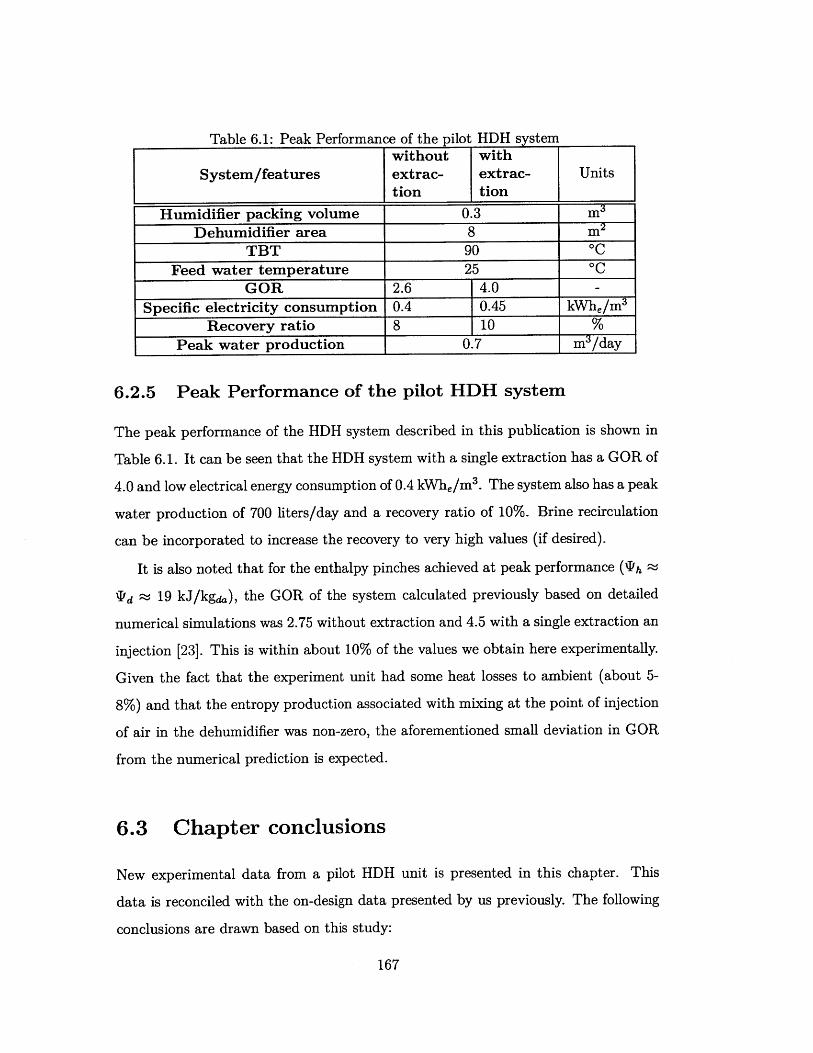
Table 6.1: Peak Performance of the pilot HDH systemwithout with
System/features extrac- extrac- Unitstion tion
Humidifier packing volume 0.3 ma
Dehumidifier area 8 mn_2
TBT 90 *C
Feed water temperature 25 *C
GOR 2.6 4.0-
Specific electricity consumption 0.4 0.45 kWhe/m 3
Recovery ratio 8 10 %
Peak water production 0.7 mn/day
6.2.5 Peak Performance of the pilot HDH system
The peak performance of the HDH system described in this publication is shown in
Table 6.1. It can be seen that the HDH system with a single extraction has a GOR of
4.0 and low electrical energy consumption of 0.4 kWhe/m 3 . The system also has a peak
water production of 700 liters/day and a recovery ratio of 10%. Brine recirculation
can be incorporated to increase the recovery to very high values (if desired).
It is also noted that for the enthalpy pinches achieved at peak performance ('h a
Td ~ 19 kJ/kga), the GOR of the system calculated previously based on detailed
numerical simulations was 2.75 without extraction and 4.5 with a single extraction an
injection [23]. This is within about 10% of the values we obtain here experimentally.
Given the fact that the experiment unit had some heat losses to ambient (about 5-
8%) and that the entropy production associated with mixing at the point of injection
of air in the dehumidifier was non-zero, the aforementioned small deviation in GOR
from the numerical prediction is expected.
6.3 Chapter conclusions
New experimental data from a pilot HDH unit is presented in this chapter. This
data is reconciled with the on-design data presented by us previously. The following
conclusions are drawn based on this study:
167

1. HCR=1 (i.e. the point at when the maximum change in enthalpy rates of either
stream exchanging energy is equal) represents a thermally balanced state for a
simultaneous heat and mass exchange device.
2. For a water heated CAOW HDH system without mass extractions, the HCRd=1
represents the state at which the GOR is maximized.
3. HDH systems without mass extractions need to be operated at as high a top
brine temperature as is possible in order to ensure a high GOR.
4. Mass extractions from the humidifier to the dehumidifier increase the GOR of
the water heated CAOW HDH system by up to 55%.
5. The optimum extraction mass flow rate corresponds to the case in which a
minimum average local enthalpy pinch is achieved in the device.
6. At a higher top brine temperature, the enhancement in GOR due to mass
extractions is higher.
Finally, the pilot system built had a maximum GOR of 4.0+0.2 and is currently
the state of the art in HDH systems in terms of energy efficiency when compared to
systems reported in literature (see Chapter. 2).
168
Chapter 7
Mechanical compression driven
varied pressure HDH system
All existing HDH systems operate at a single pressure (normally at atmospheric pres-
sure) and consist of three subsystems: (a) an air and/or water heater; (b) a humidifier
or an evaporator; and (c) a dehumidifier or a condenser. These are simple systems
and are relatively easy to design and fabricate. However, the thermal performance
of these single pressure systems is very limited (a maximum Gained Output Ratio or
GOR of about 4). This is because the single pressure HDH system has three intrinsic
disadvantages from a thermal performance perspective: (1) low water vapor content
in air (low humidity ratio) at atmospheric pressure; (2) extra thermal resistance to
heat transfer because of the presence of the carrier gas (air) in the condenser; and
(3) lower energy recovery compared to MSF and MED systems. The third point is
especially important because, unlike MSF and MED systems, multi-staging the HDH
system does not yield any increase in performance (Chapter 4). In this chapter, sim-
ple means to address the aforementioned demerits of the HDH system using the tools
of classical thermodynamics are described.
Effect of operating pressure on the humidity ratio of moist air
All previous HDH systems in literature have been designed to operate at atmospheric
pressure. However, to increase the vapor content of moist air the systems need to
169

be operated at sub-atmospheric pressures. Figure 7-1 illustrates this concept in a
psychrometric chart. For example, at a dry bulb temperature of 65 *C the humidity
ratio of moist air is increased two fold when the operating pressure is reduced from
100 kPa to 50 kPa.
-o
1
006cc
:0
E
2
1.8
1.6
1.4
1.2
1
0.8
0.6
0.4
0.2
0
45 55 65 75
Dry Bulb Temperature (*C)
85 95
Figure 7-1: Effect of pressure on humidity ratio of saturated moist air.
However, if the entire HDH system is operated under this reduced pressure, the
increase in thermal performance is relatively low. This is because: (1) the energy
recovery is limited (for the same reasons as for the atmospheric pressure systems);
and (2) the humidity ratio at the dehumidifier exit is also increased, limiting the
water productivity [19].
7.1 Variable pressure HDH cycle
In this chapter, a new HDH cycle to improve the energy efficiency of HDH is described.
The proposed cycle operates the humidifier and dehumidifier at different pressures.
170
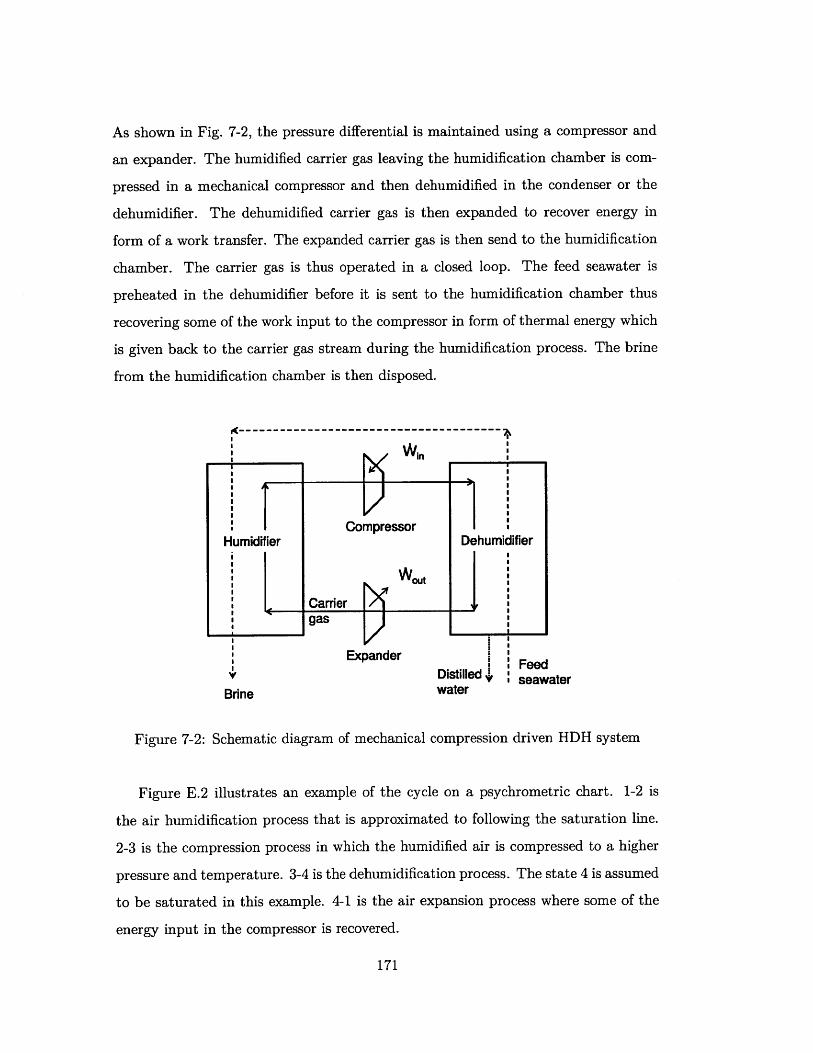
As shown in Fig. 7-2, the pressure differential is maintained using a compressor and
an expander. The humidified carrier gas leaving the humidification chamber is com-
pressed in a mechanical compressor and then dehumidified in the condenser or the
dehumidifier. The dehumidified carrier gas is then expanded to recover energy in
form of a work transfer. The expanded carrier gas is then send to the humidification
chamber. The carrier gas is thus operated in a closed loop. The feed seawater is
preheated in the dehumidifier before it is sent to the humidification chamber thus
recovering some of the work input to the compressor in form of thermal energy which
is given back to the carrier gas stream during the humidification process. The brine
from the humidification chamber is then disposed.
Win
CompressorHumidifier Dehumidifier
wout
Carrier
Expander FeedDistilled 4 seawater
Brine water
Figure 7-2: Schematic diagram of mechanical compression driven HDH system
Figure E.2 illustrates an example of the cycle on a psychrometric chart. 1-2 is
the air humidification process that is approximated to following the saturation line.
2-3 is the compression process in which the humidified air is compressed to a higher
pressure and temperature. 3-4 is the dehumidification process. The state 4 is assumed
to be saturated in this example. 4-1 is the air expansion process where some of the
energy input in the compressor is recovered.
171

3000
:- 2500 -'ii Process 1-2: Humidification
Process 2-3: CompressionProcess 3-4: Dehumidification2 Process 4-1: Expansion
:-
1500
E., 3I-02 1000
00.-i
41
C
0
0 20 40 60 80 100 120 140
Dry bulb temperature("C)
Figure 7-3: Mechanical compression driven HDH cycle represented in psychrometric
coordinates.
7.2 Terminology used
In this section, the terminology used in the analysis is defined. This includes an
energy-based effectiveness, an isentropic efficiency for the compressor and expander,
a modified heat capacity rate ratio for the heat and mass exchange devices, and the
system performance parameters. Energy-effectiveness and HCR have been defined
before in Chapter 3.
7.2.1 Isentropic efficiency
The performance of the compressor and expander are defined by an isentropic effi-
ciency. For a mechanical compressor, the isentropic efficiency is defined as the ratio
of the reversible to actual work input.
ryrM - v (7.1)7cm w
172

For an expander, the isentropic efficiency is defined as the ratio of the actual to
reversible work output.
r (7.2)e Wrei,
7.2.2 System and performance parameters
As a first step for understanding the improved performance of the new HDH cycles
the following system and performance parameters are defined.
1. Specific work consumption (SW): is the amount of electrical energy (in kJe)
consumed to produce one kg of fresh water. This parameter is used commonly
for defining the performance of work driven desalination systems.
SW = 'n- * (7.3)
The specific work consumption can be rewritten as follows
SW wout
i "da WH 0= {vv oZ:t }{(7.4)
mha -WH,o j mPW
SNW 1/VPR
Thus, SW is a function of two new system parameters - vapor productivity ratio
(VPR) and specific net work (SNW).
2. Vapour productivity ratio (VPR): is defined as the ratio of the rate at which
water is produced by the system to the rate at which water vapor is compressed
in the system.
VPR =- P" (7.5)Thda ' WH,o
VPR is a measure of how effective the humidifier and dehumidifier are at pro-
ducing water given a fixed compression ratio, and expander and compressor
173
efficiency. The value of VPR will always be less than 1, as water cannot be
produced at a rate greater than that at which it flows into the dehumidifier.
For example if the vapor productivity ratio is 0.25, this means for every four
units of vapor that are compressed in the system, only one unit of water is pro-
duced. Evidently, VPR should be maximised to avoid water vapor from being
needlessly compressed.
3. Specific net work (SNW) : is the net work input to the system per unit amount
of vapor compressed.
SNW = - wout (7.6)7 2 da 'WNH,o
In the mechanical compression driven HDH system, compression of the carrier
gas is an energetic loss which is only partially recovered as work in the expander
and as heat in the dehumidifer. SNW is indicative of the work imparted to the
useful component of the fluid mixture circulating in the system.
7.3 Equations and modeling details
This section discusses the conservation equations for the expander and compressor
are provided below.
7.3.1 Compressor
Consider a mechanical compressor which provides the driving pressure difference to
the moist air stream by means of a work transfer (Win). The First Law for the
compressor can be expressed as
Win = mada (ha,o - ha,i) (7.7)
174

The isentropic efficiency for the compressor can be defined as:
hev - ha,i7 cm=ha,0 ha,i (7.8)
where the exit state from the compressor (which is at the dehumidifier inlet pressure)
is calculated using the Second Law for the reversible case.
srevSa,o -Sa,i
7.3.2 Expander
(7.9)
The First Law for the expander can be expressed as
W/st = rhda (ha,i - ha,o) - (rw - hw)condensate (7.10)
The isentropic efficiency for the expander can be defined as:
Thda (ha,i - ha,O) - (lTh - hw)condensedle= a . rev )re
moa (ha,i - hae ) - (rhw - hw o) enat(7.11)
where the exit state from the expander (which is at the humidifier inlet pressure) in
the reversible case is calculated using the Second Law.
ada (sa, - se) - (rhw . Sw)r *e 0 (7.12)
Solution technique is same as that presented in Chapter 3.1.3
7.4 Results and discussions
7.4.1 Parametric study
This section investigates the importance of various parameters on the overall per-
formance of the variable pressure cycle driven by a mechanical compressor. Under-
175
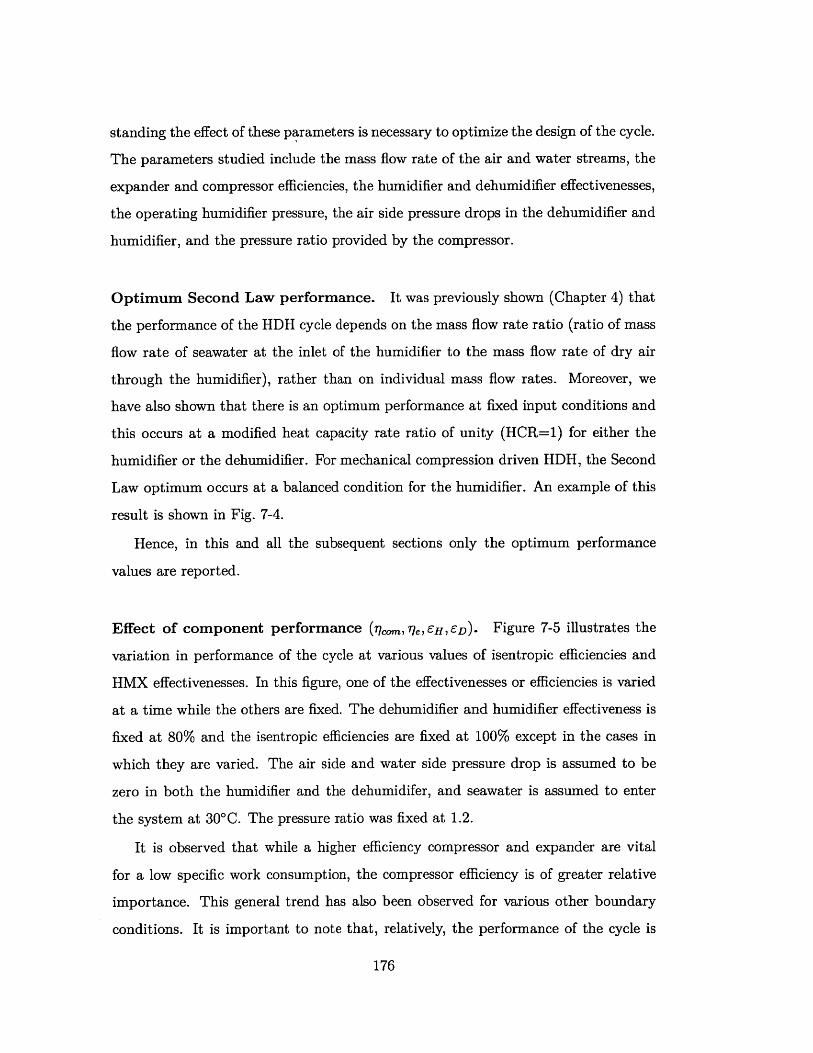
standing the effect of these parameters is necessary to optimize the design of the cycle.
The parameters studied include the mass flow rate of the air and water streams, the
expander and compressor efficiencies, the humidifier and dehumidifier effectivenesses,
the operating humidifier pressure, the air side pressure drops in the dehumidifier and
humidifier, and the pressure ratio provided by the compressor.
Optimum Second Law performance. It was previously shown (Chapter 4) that
the performance of the HDH cycle depends on the mass flow rate ratio (ratio of mass
flow rate of seawater at the inlet of the humidifier to the mass flow rate of dry air
through the humidifier), rather than on individual mass flow rates. Moreover, we
have also shown that there is an optimum performance at fixed input conditions and
this occurs at a modified heat capacity rate ratio of unity (HCR=1) for either the
humidifier or the dehumidifier. For mechanical compression driven HDH, the Second
Law optimum occurs at a balanced condition for the humidifier. An example of this
result is shown in Fig. 7-4.
Hence, in this and all the subsequent sections only the optimum performance
values are reported.
Effect of component performance (r/com, 77e, EH, ED). Figure 7-5 illustrates the
variation in performance of the cycle at various values of isentropic efficiencies and
HMX effectivenesses. In this figure, one of the effectivenesses or efficiencies is varied
at a time while the others are fixed. The dehumidifier and humidifier effectiveness is
fixed at 80% and the isentropic efficiencies are fixed at 100% except in the cases in
which they are varied. The air side and water side pressure drop is assumed to be
zero in both the humidifier and the dehumidifer, and seawater is assumed to enter
the system at 30*C. The pressure ratio was fixed at 1.2.
It is observed that while a higher efficiency compressor and expander are vital
for a low specific work consumption, the compressor efficiency is of greater relative
importance. This general trend has also been observed for various other boundary
conditions. It is important to note that, relatively, the performance of the cycle is
176

55
50
0
U
U'a.U,
45
40
35
30
OA 0.6 0.8 1 1.2
0.2
- 0.19
1.-E
- 0.18
.2- 0.17
100I-
- 0.16
0 .1
0.14
14
HCRH
Figure 7-4: Effect of modified heat capacity ratio of humidifier on
specific entropy generation. T = 30*C; EH = eD = 80%; 7/cor -
40 kPa; PD = 48 kPa.
600
400
3400
L
200
100
0
0 0.2 0.4 0.6 0.8 1
Component efficiency or effectiveness, q or E [-]
Figure 7-5: Effect of component effciency or effectiveness on cycle
T,,, = 30*C; PH = 33.33 kPa; PD = 40 kPa.
specific work and
7 = 100%; PH =
1.2
performance for
177
<--.
ri..m
rie
E-DEH

less sensitive to the humidifier and dehumidifier performance.
Effect of pressure ratio (PD/PH) and dehumidifier pressure (Pd). Figure 7-6
illustrates the effect of pressure ratio and humidifier pressure on cycle performance.
Firstly, at a lower pressure ratio, the specific work is lower (indicating a higher system
performance). The lower limit on pressure ratio required in the compressor is imposed
by the dehumidifier minimum terminal temperature difference. For the present sim-
ulations the pressure ratio was varied from 1.2 to 2.4.
The reason for lower SW at lower pressure ratios can be explained using Fig. 7-7.
At lower design pressure ratios, the vapor productivity ratio is lower. As already
explained in. Section 8.1.1, this is an expected trend. SNW increases with increasing
pressure ratio and the slope with which the SNW increases is much greater than that
for the increase in VPR. Specific work is the ratio of SNW to VPR (See Eqn. 7.4); and
hence, at lower pressure ratios, we get a higher performance. In Fig. 7-6 it can also
be observed that a lower dehumidifier pressure gives a lower specific work. This is
explained using the variation of SNW and VPR with dehumidifier pressure as shown in
Fig. 7-8. Both SNW and VPR increase with increase in design dehumidifier pressure.
VPR increases slowly compared to SNW and hence the specific work consumption
decreases with lower dehumidifier pressures.
Effect of air side pressure drop (APH, APD). The air side pressure drop can be
substantial in heat and mass exchange (HME) devices if the design is not performed
to optimize it. Figures 7-9 and 7-10 illustrate the effect of pressure drop of the air
stream through the HME devices on the overall performance of the system. As the
pressure drop increases, the specific work consumption increases rather drastically.
Hence, it is vital to design the HME devices such that the pressure drop is minimal.
At higher values of pressure drop there is an optimum pressure ratio at which
the specific work is minimum. The pressure drop in the dehumidifier and humidifier
increase the specific work by a similar amount.
178
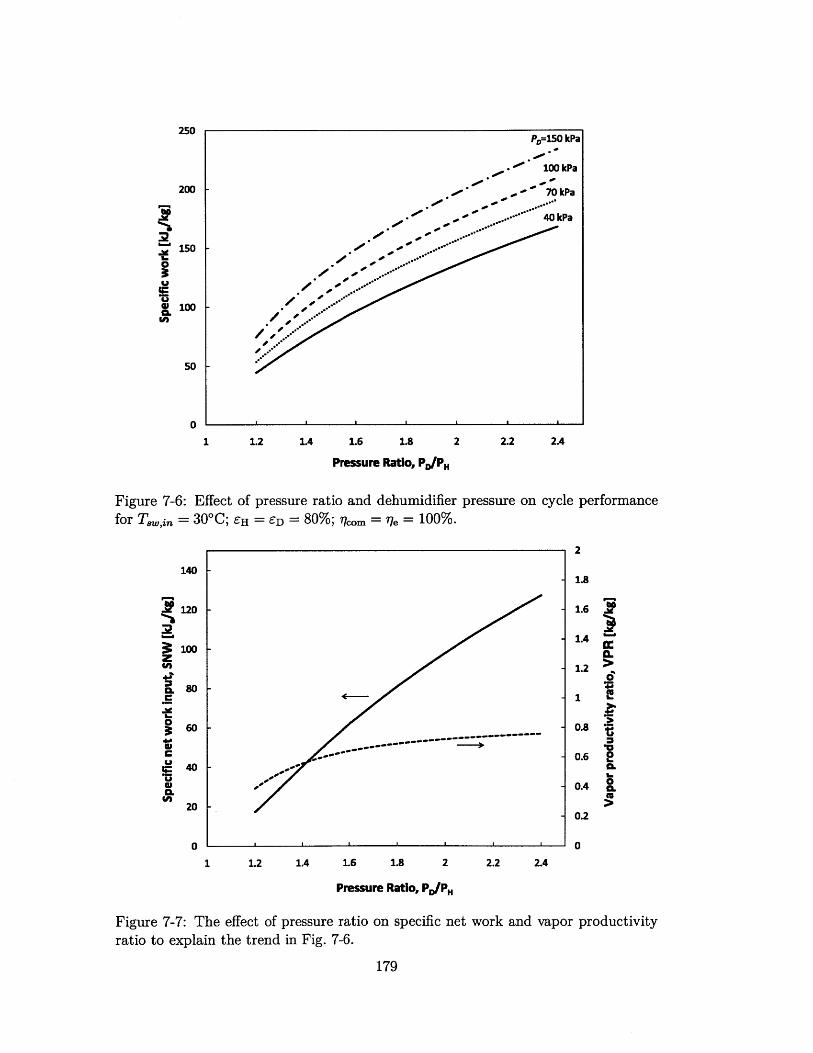
PD=150 kPa
-~ 100 kPa
-. 70 kPa
- ---- 40kPa
-oo0,
le *
0
.- 4p
50
0
Figure 7-6: Efor =3
140
120
S100z4A
C.B
- 60
20CL
20
n
1 1.2 1.4 1.6 1.8 2 2.2
Pressure Ratio, PD/ H
ffect of pressure ratio and dehumidifier pressure0 C; EH = ED = 80%; i = r/= 100%.
2.4
on cycle performance
2
1.8
1.6
1.4
1.2
1
0.8
0.6
0.4
0.2
0
*.
0a-1.0C.
1 1.2 1.4 1.6 1.8 2
Pressure Ratio, PD/ H
Figure 7-7: The effect of pressure ratio on specific net
ratio to explain the trend in Fig. 7-6.
179
2.2 2.4
work and vapor productivity
250
200
0
C.W)
150
100
' ' ' - -
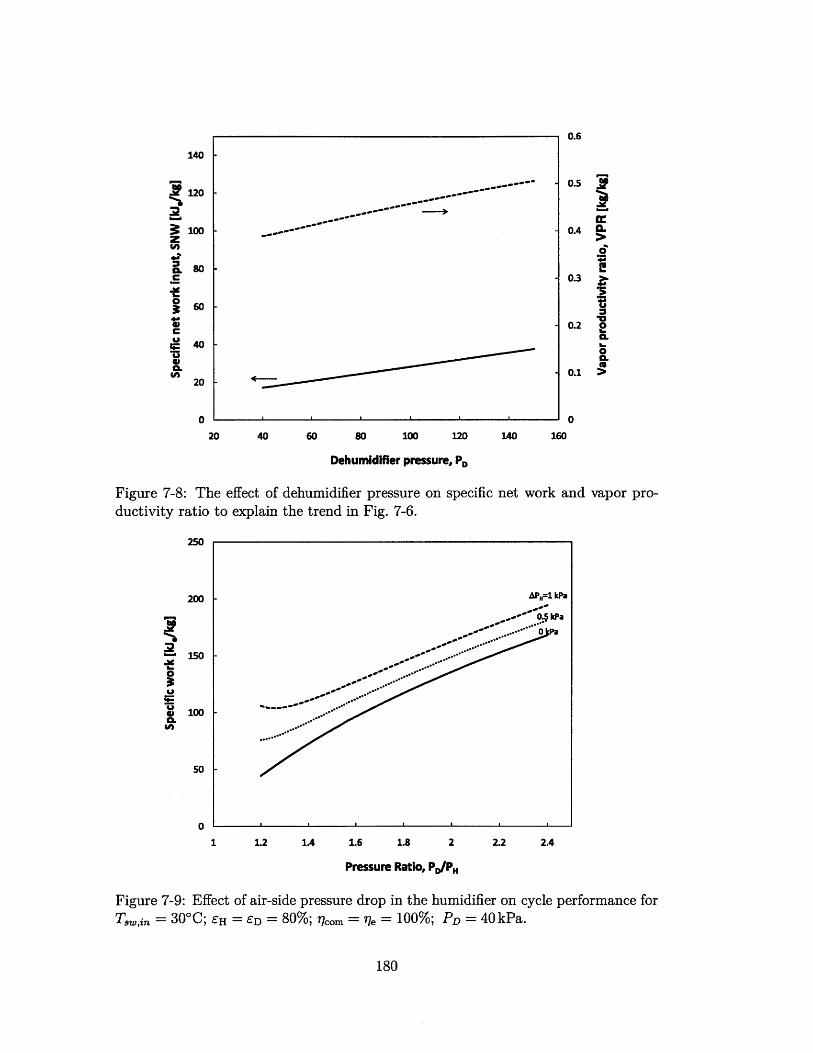
140
120
30.100zine
a. 8 0
C
00
460
CL
20
0
20 40 60 80 100 120 140
Dehumidifier pressure, PD
Figure 7-8: The effect ofductivity ratio to explain
2s0
200 -
OP":2
CLin
1s0
100
s0
0
dehumidifier pressure on specificthe trend in Fig. 7-6.
net work and vapor pro-
1 1.2 1.4 1.6 1.8 2.2 2.4
Pressure Ratio, PdPH
Figure 7-9: Effect of air-side pressure drop in the humidifier on cycle performance for
T,,in = 30*C; EH = CD = 80%; ?7com = ?le = 100%; PD = 40kPa.
180
0.6
0.4 I-
0.2
CL1.
0.1-0. 0
0
160
..-----
.51 kPa
0.5 kPa

200 ~D2 kPa
APD2k~1801
kPa
160 -...-- -- 0 kPa160
~140 -*
120 -
20 -
~80C.4A
60
40
20
1 1.2 1.4 1.6 1.8 2 2.2 2.4
Pressure Ratio, PD/ H
Figure 7-10: Effect of air-side pressure drop in dehumidifier on cycle performance for
T,,in = 30*C; EH = ED = 80%; om = = 100%; PD,i = 40 kPa.
7.4.2 Selection of expansion device.
This section investigates the use of a throttle in place of a mechanical expansion
device in the variable pressure system, downstream of the dehumidifier. Here, the
throttle is modeled as an isenthalpic device. Figure 7-11 illustrates the performance
loss because of using a throttle. It is clearly observed that, when using a throttle, the
cycle has very high specific work consumption.
The reason for the low performance is shown in Fig. 7-12. This figure illustrates
the entropy generation in each of the devices for certain boundary conditions. It can
be immediately observed that for the cycle with the throttle, the entropy generation is
very high because the process in the throttle is highly irreversible. We have previously
proved [70] that the performance is inversely proportional to total entropy generated
in the system. Hence, the irreversiblity in the throttling process causes the system
performance to drop significantly.
181
200

1600
1400
1200
1000
800
n. U600
' 400
200
0
1 1.2 1A 1.6 1.8
Pressure Ratio, PD/PH
2 2.2 2.4
Figure 7-11: Effect of using a throttle versus using an air expander in the two pressurecycle for T,,,in = 30*C; EH = ED = 80%; r/om = 100%; 7e = 0 or 100%; PD = 40 kPa.
0.014
0.012
0.01
C0
0.008
0to 0.006
*0.004C
0.002
0
Cycle with throttle
* Cycle with expander
Dehumidifier
Thrmtde
Humidifier
Compressor
Figure 7-12: Entropy generation in the throttle and the air expander cycles forT,,, = 30*C; EH = E= com e = 90%; PH = 40kPa; PD = 50 kPa.
182
with throttle
with expander
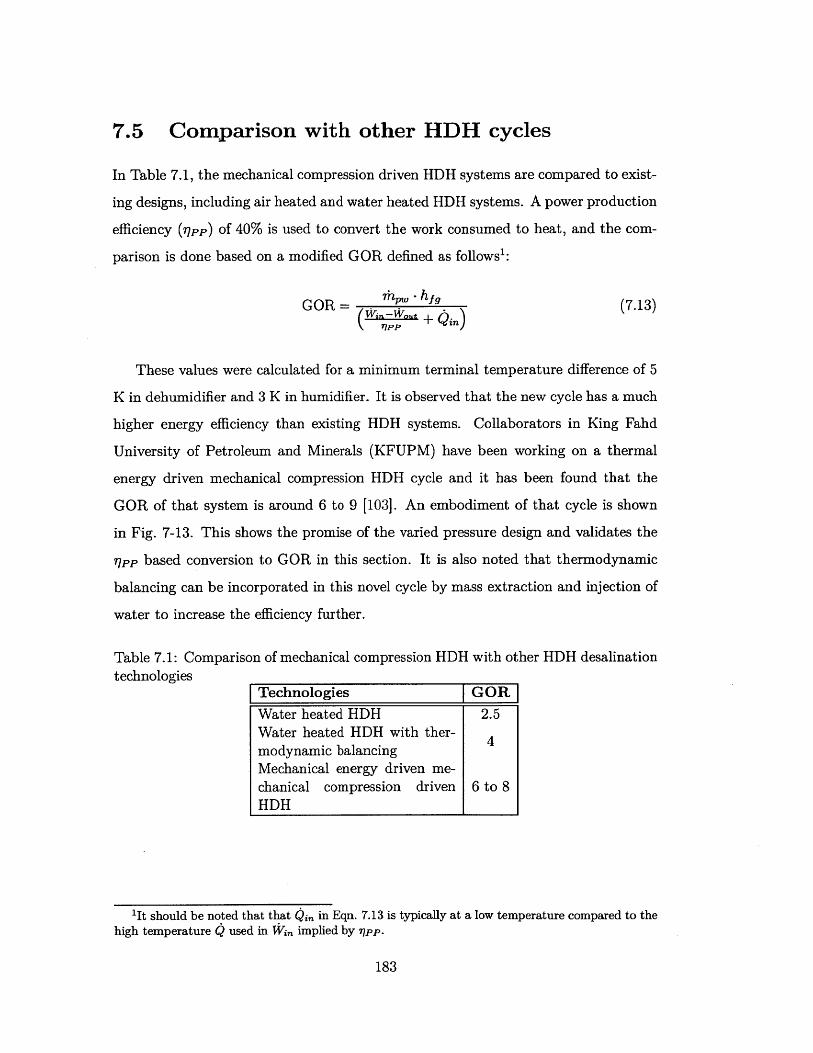
7.5 Comparison with other HDH cycles
In Table 7.1, the mechanical compression driven HDH systems are compared to exist-
ing designs, including air heated and water heated HDH systems. A power production
efficiency (iqpp) of 40% is used to convert the work consumed to heat, and the com-
parison is done based on a modified GOR defined as follows':
GOR = .p, - hyg (7.13)
nlPP/
These values were calculated for a minimum terminal temperature difference of 5
K in dehumidifier and 3 K in humidifier. It is observed that the new cycle has a much
higher energy efficiency than existing HDH systems. Collaborators in King Fahd
University of Petroleum and Minerals (KFUPM) have been working on a thermal
energy driven mechanical compression HDH cycle and it has been found that the
GOR of that system is around 6 to 9 [103]. An embodiment of that cycle is shown
in Fig. 7-13. This shows the promise of the varied pressure design and validates the
Tpp based conversion to GOR in this section. It is also noted that thermodynamic
balancing can be incorporated in this novel cycle by mass extraction and injection of
water to increase the efficiency further.
Table 7.1: Comparison of mechanical compression HDH with other HDH desalinationtechnologies
Technologies GOR
Water heated HDH 2.5Water heated HDH with ther-modynamic balancingMechanical energy driven me-chanical compression driven 6 to 8HDH I
1It should be noted that that QiL in Eqn. 7.13 is typically at a low temperature compared to thehigh temperature Q used in Win implied by ijpp.
183
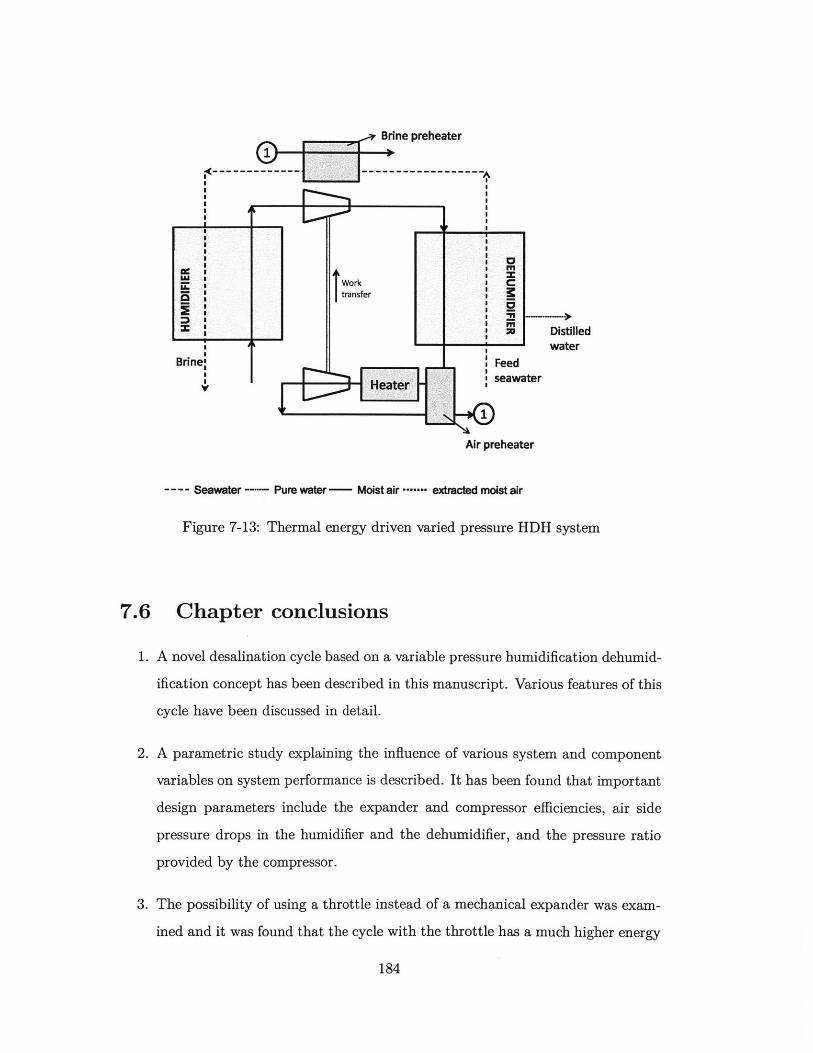
Biepreheater
O-U
Brine:
Worktransfer
Heater
Mu
Feedseawater
Air preheater
Distilledwater
-- Seawater -- Pure water - Moist air .----- extracted moist air
Figure 7-13: Thermal energy driven varied pressure HDH system
7.6 Chapter conclusions
1. A novel desalination cycle based on a variable pressure humidification dehumid-
ification concept has been described in this manuscript. Various features of this
cycle have been discussed in detail.
2. A parametric study explaining the influence of various system and component
variables on system performance is described. It has been found that important
design parameters include the expander and compressor efficiencies, air side
pressure drops in the humidifier and the dehumidifier, and the pressure ratio
provided by the compressor.
3. The possibility of using a throttle instead of a mechanical expander was exam-
ined and it was found that the cycle with the throttle has a much higher energy
184
6

requirement because of high irreversiblity in the throttling process.
4. The thermal energy driven mechanical compression HDH cycle has much higher
performance than existing HDH cycles.
Based on the details provided in this chapter, pilot scale experimental units are
under construction at KFUPM in Saudi Arabia.
185

THIS PAGE INTENTIONALLY LEFT BLANK
186

Chapter 8
Thermal compression driven
hybrid HDH-RO system
Increasing the top brine temperature (and correspondingly the temperature of the
steam used as heat source) in a thermal desalination system can decrease the amount
of heat required to drive the process. In existing thermal desalination systems like
MSF and MED, a practical limit on the top brine temperature is associated with the
formation of calcium sulphate (hard) scales. For typical seawater concentrations and
recovery ratios when brine temperatures exceed 90-110*C (the corresponding steam
temperature being 100-120*C), the solubility of calcium is such that it precipitates as
calcium sulphate. This forms hard scales on heat exchanger surfaces impeding heat
transfer. Hence, in MED and MSF the temperature of the heating steam is limited
to 100 0 C to 120 0 C. Carrier gas based thermal desalination systems can potentially
operate well above this limit. This paper describes the features of such a novel system.
The conceptual details of this system are discussed later in this section. MED-TVC
also operates with higher temperature steam but for operational considerations (to
reduce the specific volume of the steam drawn from the Rankine cycle) rather than
to reduce specific energy consumption. The details of the effect of increasing the
heating steam temperature on the energy consumption of MED-TVC systems have
been documented by Kamali et al. [104].
First, let us quantify the effect of increasing the heating steam temperature by
187

considering a simple black box model (shown in Fig. 8-1) of a thermal desalination
system. This system is steam driven (like MSF and MED). The brine and pure water
are assumed for simplicity to leave the system at the same temperature as the inlet
feed seawater. Heat is lost from the system at this same temperature. Also, the steam
enters in a fully dry condition (x = 1) and leaves as a liquid at the inlet feed seawater
temperature. The expression for the thermal energy required to run the black box
system is derived below using the First and Second Law of Thermodynamics.
Feed waterentering thesystem atT0, Po
Steam entering Condensed steamthe system at leaving the system
Tt,in -x=1, Ps at To, PO
- - ~~~~ >
FxOut
Figure 8-1: Black box model for steam driven thermal
Brine leavingthe system atTo, PO
Pure waterleaving thesystem at To, PO
desalination system.
First Law on the black box gives
(hh)st,in + mihi = (rnh)t,ot + rh2 h2 + T 3h 3 + QO,
Second Law on the black box gives
(hs)t,in + rh1s1 + gen = (rnstut + T 2 s 2 + ass +
Further we combine Eqs. 8.1 and 8.2 to give
(rhh),t,in - (rhh)st,O = (is),t,in -To - (rhs),t,,t - TO + T292 + 7h393
-7higi + Sgen -'TO (8.3)
188
(8.1)
(8.2)

Here, 9 (= h - Ts) is the specific gibbs energy. Now we can write the change
in total enthalpy rate of the steam, which is the thermal energy consumed by the
system, as follows
A kin = (rh)t,in - (Thh),t,&Ut
= (5n - Sout,t -TO + rn29 2 + m39 3 - Tn1g1
+$Sen -To (8.4)Akin in,st ~ otst T I - RR
To0+ + 2+g - R1M3 ±3 RR RR
+ "S" - TO (8.5)mh3
RR = is the recovery ratio of the system.
From Eq. 8.5, it can be seen that the specific thermal energy required to drive a
steam driven desalination system is directly proportional to the total entropy rate of
steam used per unit amount of water distilled in the system. Increasing the steam
temperature to the system reduces the aforementioned entropy rate. This is because
of the fact that increasing the steam temperature reduces the specific entropy and
increases the specific enthalpy. The increase in specific enthalpy, in turn, reduces the
mass flow rate of steam required. Hence, by increasing the temperature both the mass
flow rate of steam required and the specific entropy are reduced, reducing the total
entropy rate of steam entering the system. This is expected to reduce the thermal
energy consumed by the system. Let us quantify this effect by evaluating the least
amount of thermal energy required, which is calculated assuming there is no entropy
generation in the system.
Ainieast 'in,st - $4t,, ± 1 - RR 12+93- -- gi (8.6)m3 m I RR RR
Fig. 8-2 shows the effect of increasing the heating steam temperature (and cor-
respondingly reducing the total entropy rate of the steam entering the system) on
the least thermal energy required to produce 1 kg/s of water in the system. It is
189

noted here that for the following calculation second and the third term in the right
hand side of Eq. 8.6 is constant. For this illustration, seawater feed is at a salinity
of 35,000 ppm and temperature of 30 0C. Seawater properties are evaluated using the
correlations presented by Sharqawy et al. [100]. The curves are plotted at a recovery
ratio (RR) of 50%. It is observed that by increasing the steam temperature from 90*C
to 120*C (and correspondingly reducing 5j;, by 31.6%) the least thermal energy re-
quired is reduced by 27%. If the steam temperature can be further increased to 2000C
(correspondingly reducing 5i,, by 59%) the least thermal energy required is reduced
by 50%. These trends are similar to those presented for steam driven MED-TVC
systems by several researchers including Kamali et al. [104].
Total specific entropy rate of heating steam entering the system,
$ hi [k/kg.K]
0 10 20 30 40 50 60 70
0
E
-EE -i; ,
300
250
200
150
100
50
0
0 50 100 150 200 250 300 350
Heating steam temperature, Ts [*C]
80
400
Figure 8-2: Effect of the heating steam temperature (and correspondingly the total
entropy rate of steam) entering a thermal desalination system (shown in Fig. 8-1) on
the least thermal energy required to drive the system. To = 30'C; xt,,, = 1; T,,,, =
30*C; rits = 1kg/s; Si = 35, 000 ppm; RR = 50%.
190
9.p/hpw
.
Hence, we conclude that fundamental to decreasing the specific energy consump-
tion of a steam driven desalination system is to increase the temperature of heating
steam and to reduce the total entropy rate of steam used per unit water produced in
the system. The focus of this manuscript is a new desalination system which can run
using steam at a high temperature without the problems of scale formation.
In this proposed system we operate the humidifier and dehumidifier at different
pressures. As shown in Fig. 8-3, the pressure differential is maintained using a ther-
mal vapor compressor (TVC) and an expander. Conceptually, this is similar to the
variable pressure HDH system using a mechanical compressor that we described in
the previous chapter except for the use of a TVC instead of a mechanical compres-
sor. The humidified carrier gas leaving the humidification chamber is compressed in
a TVC using a steam supply and then dehumidified in the condenser (or the dehu-
midifier). The dehumidified carrier gas is then expanded to recover energy in form of
a work. The recovered work is used in a reverse osmosis unit to desalinate the brine
from the humidifier. The expanded carrier gas is send to the humidification chamber.
The carrier gas is thus operated in a closed loop. The feed seawater is preheated in
the dehumidifier before it is sent to the humidification chamber thus recovering some
of the energy input to the compressor in form of thermal energy which is given back
to the carrier gas stream during the humidification process. As shown in Fig. 8-3,
both the thermo-compression and the expansion process can lead to condensation of
a small amount of water out of the carrier gas.
Figure 8-4 illustrates an example of the new desalination cycle on a psychrometric
chart. Path 1-2 is the air humidification process that is approximated to follow the
saturation line. Path 2-3 is the thermo-compression process in which the humidified
air is compressed to a higher pressure and temperature. Path 3-4 is the dehumidi-
fication process which is also approximated to follow the saturation line at a higher
pressure, PD. Path 4-1 is the air expansion process where some of the energy input
in the compressor is recovered.
In this system, we can use higher pressure and temperature steam (Tat > 1200C)
without attaining a high top brine temperature. This is possible because the heating
191

W.ut | Feed
out seawaterDistilled
water
---------------- ROwith energyrecovery
Brine
- - -- Seawater -- Pure water- Carrier gas - - Steam
Figure 8-3: Schematic diagram of thermal vapor compression driven HDH-RO system.
sco0
PH, -
4000
P Process 1-2: HumidificationProcess 2-3: Thermo-compresslonProcess 3-4: DehumidificationProcess 4-1: Expansion
003 252
1000
0 10 20 30 40 so 60 70 a0 90
Dry bulb temperature T [*C]
Figure 8-4: Psychrometeric representation of thermal vapor compression driven HDH
system.19
2192
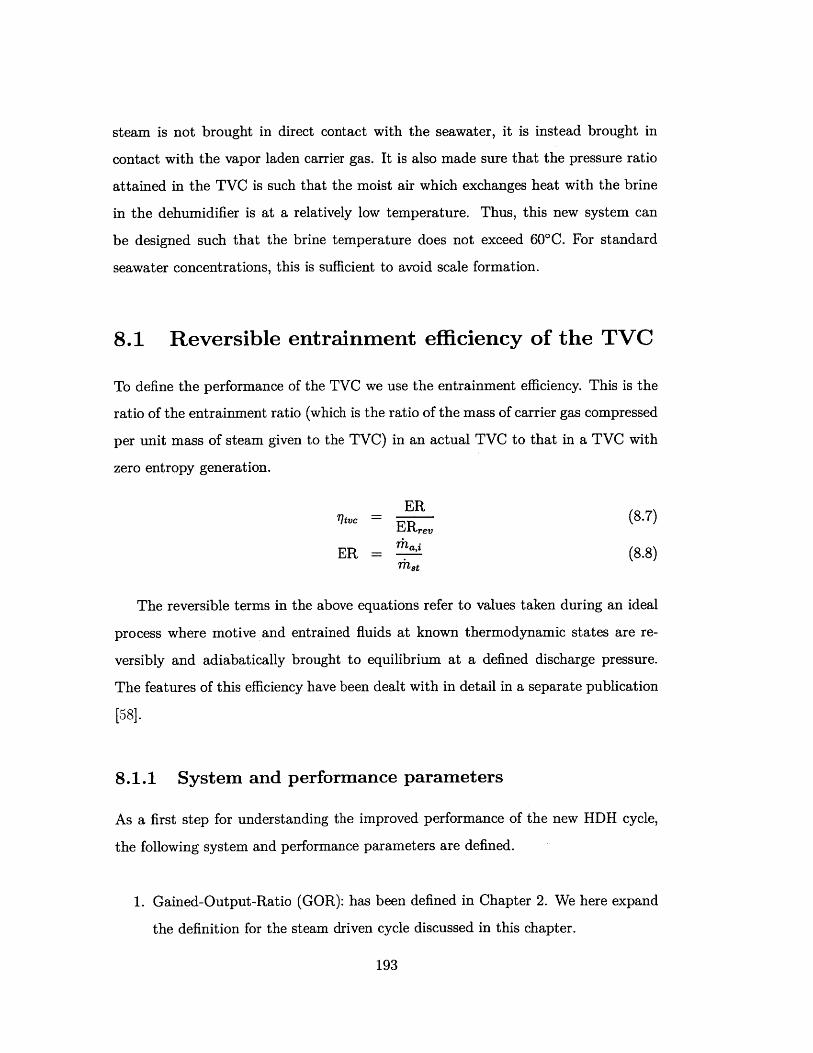
steam is not brought in direct contact with the seawater, it is instead brought in
contact with the vapor laden carrier gas. It is also made sure that the pressure ratio
attained in the TVC is such that the moist air which exchanges heat with the brine
in the dehumidifier is at a relatively low temperature. Thus, this new system can
be designed such that the brine temperature does not exceed 600C. For standard
seawater concentrations, this is sufficient to avoid scale formation.
8.1 Reversible entrainment efficiency of the TVC
To define the performance of the TVC we use the entrainment efficiency. This is the
ratio of the entrainment ratio (which is the ratio of the mass of carrier gas compressed
per unit mass of steam given to the TVC) in an actual TVC to that in a TVC with
zero entropy generation.
Rc = (8.7)ER,.
ER = mai (8.8)
The reversible terms in the above equations refer to values taken during an ideal
process where motive and entrained fluids at known thermodynamic states are re-
versibly and adiabatically brought to equilibrium at a defined discharge pressure.
The features of this efficiency have been dealt with in detail in a separate publication
[581.
8.1.1 System and performance parameters
As a first step for understanding the improved performance of the new HDH cycle,
the following system and performance parameters are defined.
1. Gained-Output-Ratio (GOR): has been defined in Chapter 2. We here expand
the definition for the steam driven cycle discussed in this chapter.
193

The net heat rate input to the TVC driven HDH system is given as
Qin= riht * (hst,in - hsot) (8.9)
For the HDH system, h,,,ut is a fully liquid state evaluated at the exit of the
dehumidifier. Hence, Eq. 2.2 can be rewritten as follows
GOR - n, - hfg- ft hst,in - h mt,out )
?" .Ma -0 ~oh5 (8.10)Mda ' Ho , tin -h.,t
VPR ERva,
VPR -ERap (8.11)
Thus, GOR is approximately equal to the product of two new system parameters
- vapor productivity ratio (VPR), and vapor entrainment ratio (ERap). It is
noted that the ratio of the latent heat of vaporization to the difference in specific
enthalpy of steam between the inlet and exit of the system varies between 0.92
to 0.98 for the conditions considered in this paper. Hence, approximating this
term as 1 for the sake of explaining some of the trends in the paper is reasonable.
It should be note that this approximation is not used to calculate GOR in this
paper.
2. Equivalent electricity consumption (Ec): is defined in terms of the amount
of electricity that could have been produced using the thermal energy which
was given to a desalination system. The electrical work is calculated assuming
that the steam used in the desalination plant was instead expanded in a steam
turbine.
Wat = st - (hst,tur,in - hst,tur,out) - Tgen [kW] (8.12)
Where ?lgen is efficiency of the electrical generator and is assumed to be 95%.
In order to calculate hst,tur,ot, the outlet steam temperature is taken to be the
steam turbine exit temperature which is commonly employed in Rankine cycle
194

power plants (35*C). Also, an isentropic efficiency of 85% is assumed for the
steam turbine.
c [kWeh/m 3] (8.13)mp - 3.6
The equivalent electricity consumption parameter facilitates comparison be-
tween thermal desalination systems and work driven desalination systems. For
the latter, the actual work input is used in Eq. 8.13 instead of WTk.
3. Vapor productivity ratio (VPR): is defined as the ratio of the rate at which water
is produced by the system to the rate at which water vapor is compressed in
the system. This parameter is indicative of the efficiency of all the components
in the system excluding the TVC. For the HDH-TVC-RO system, the value of
this parameter will be greater than 1. A VPR of 12 means that for every kg of
water vapor compressed in the TVC, 12 kg of water is produced.
VPR = r",o + rnpw,RO (8.14)r 7da *WH,o
4. Vapor Entrainment Ratio (ERap): is the amount of water vapor entrained by
the TVC per unit amount of motive steam supplied.
ERvap = . (8.15)mst
The energy input in compressing vapor in the carrier gas mixture is the useful
part of the total energy input to the compressor. We are interested in the
quantity of vapor entrained per unit steam supplied rather than the quantity
of mixture entrained per unit steam supplied.
8.2 Equations and modeling details
This section discusses the conservation equations for the TVC and the RO unit. The
conservation equations for the other devices in the system and the fluid property
195

packages and models used to solve the defined equations are already dealt with in
earlier chapters.
Consider a TVC in which a mixture of air and water vapor is compressed from
a low pressure PH to a higher pressure PD, using a steam supply. Since all the
dry air entering the TVC also leaves the device, the mass flow rate of dry air is
constant. During the compression process, some of the water vapor in the mixture
might condense out. The mass flow rate of the condensed water may be calculated
by using a mass balance:
rh'toc= i&1 (Weve,i - Wtvc,O) + fnst (8.16)
The efficiency of the TVC defined in Eq. 8.7 may be written as
rltvc - * (8.17)inst
Here rhr, is calculated from the following conservation equations for the reversible
case:
""- hst,t=c,in = da (h*t"c,o - ha,tvc,i) ± tc - (8.18)
rhrev~ rev -.
St" - sSt,tac,in = ha (s",c,o - Sa,tvc,i) + r-pw,tvc - sPWtvc (8.19)
For the reversible case, the discharged (dehumidifier inlet) pressure (PD) is the
same as the real case. The First and Second Law for the TVC can be expressed as
rehs-t,tc,in = rhda (ha,tvc,o - ha,tvc,i) + rapw,tvc - h ,tvc (8.20)
Sgen,tvc = mda (Sa,tvc,o - Sa,tvc,i) - rt - Sst,tvc,in + ?Pw,tvc - Spw,tvC (8.21)
The work recovered in the expander W,, produces further fresh water from the
brine exiting the humidifier by operating a reverse osmosis (RO) unit for desalination
of the brine. RO is taken to have an energy consumption of 3.5 kWh/m 3 at a recov-
ery of 50%. These performance value are representative of RO systems desalinating
196

seawater from a medium to large scale [105].
rnpw,RO = .Ec,RO -3.6
(8.22)
8.3 A typical embodiment of the novel cycle
Figure 8-5 shows a typical embodiment of the TVC driven HDH-RO cycle. The
component performances are selected such that they are easily available off-the-shelf.
An RO system performance of 3.5 kWh/m 3 was used for the simulation. A feed
seawater temperature of 30*C and a pressure ratio of 1.15 were used. Saturated
steam at 50 bar was used for compressing moist air in the TVC.
Humidifier design
HCRfl=1PH=PD/ 1.15
Brine to RO T=420C'ih.=36.55 kg/s
di,=21.63 kg/s
Preheated brineT=47*C
9air=0.76 kg/s, Pg=5 MPa
Dehumidffer desigI ED=7O%
PD=0.1 MPa
FeedT=30*C
i.=36.80 kg/s
System Performance: GOR = 9.46; &= 22 kWh/
---- Seawater --- Pure water - Carrier gas - - Steam
Figure 8-5: A typical embodiment of the TVC driven HDH-RO cycle.
The HDH section of the system has been designed for a 1 kg/s water production.
197

The air and water mass flow rates were calculated for a modified heat capacity rate
ratio (HCR) of 1 for the humidifier (details about the relevance of HCR of heat and
mass exchangers to the performance of HDH cycles are described in previous chapters
(Chapter 7 and 3). An overall system GOR of 9.46 and equivalent total electricity
consumption of 22 kWh/m 3 (from Eq. 8.12 & 8.13) are achieved in this embodiment.
8.4 Results and discussions
The various features of the novel TVC driven HDH cycle with RO are discussed in
this section. The importance of various parameters on the overall performance of
the cycle is investigated. Understanding the effect of these parameters is necessary
to optimize the design of the cycle. The parameters studied include the motive
steam pressure, the pressure ratio provided by the TVC, the expander efficiency, the
operating humidifier pressure, and the air side pressure drops in the dehumidifier and
humidifier. All calculations presented in this section are performed for a modified
heat capacity ratio for the humidifier of unity. The typical embodiment of the cycle
described in the previous section was used as a base case from which parameters were
varied.
8.4.1 Effect of using an expander and a RO unit for addi-
tional water production
In a separate publication [106], we described the characteristics of an HDH system
run using a TVC and a separate throttle valve (instead of an expander, as described
in this paper). It had been found that the entropy generated in the throttle valve
negates the advantage of using higher pressure steam. In other words, the S" *TMPu
term in Eq. 8.5 is so high that the reduction in i does not reduce specific energy
consumption. Here, we improve on that cycle by replacing the isenthapic throttling
process by an expansion process which is close to an isentropic process. We use
the work recovered by the expansion process in a reverse osmosis unit to produce
198

additional pure water from the brine exiting the humidifier. To quantify the effect
of this change let us define a specific entropy generation in the expander (I), which
characterises the specific irreversibility in the expansion process, as the ratio of the
entropy generated in the expander to the total water produced in the system.
I = ""'gene (8.23)hpw,D + Thpw,RO + t0
Figure 8-6 illustrates the effect of having a less irreversible expansion process on
the GOR of the thermal vapor compression driven system. It can be seen that as
we go to an expansion process that is closer to being isentropic, the relative amount
of irreversibility in the expansion process is greatly reduced and GOR is increased.
As we increase the expander efficiency, we are producing more work for the RO unit.
Hence, we expect that at high expander efficiencies the majority of the water will be
produced in the RO section of the system.
Figure 8-7 represents the variation in the amount of water produced in the dehu-
midifier relative to the total water produced in the system with changes in expander
efficiency. It can be seen that at lower expander efficiencies most of the water is
produced in the dehumidifier and at higher expander efficiencies most of the water
is produced in the RO unit. The high performance realizations of the system corre-
sponds to the later case. This leads us to conclude that because of the irreversibilities
in the overall system, for attaining high performance, it is better to recover energy
as a work transfer in the expander rather than as a heat transfer in the dehumidifier.
This translates into operating the HDH system as a combined desalination and power
production system with the RO driven by the power produced in the expander.
8.4.2 Effect of heating steam conditions
Earlier in this chapter, we had shown that in order to reduce the heat required to
run a thermal desalination system the total entropy flow entering the system needs
to be reduced. In other words, the heating steam used needs to be at a lower entropy
state or of a lower mass flow rate (higher enthalpy state). We will first investigate the
199

20
18
16
14
12
8. 100
8
6
4
2
0
3
2.5 1CL
2
0.5
0A
0
0.0 0.2 0.4 0.6 0.8 1.0
Expander effidency, , [-]
Figure 8-6: The effect of expander efficiency on performance of thermal vapor
compression driven HDH-RO system and the specific entropy generated in the ex-
pander. T,,,in = 30*C; EH = 60%; ED = 70%; 7t = 30%; Pt = 5 MPa; PH =
86.96kPa; PD = 100kPa; xt,j,, = 1; HCRH = 1.
100 -
90
80
-COO 60
U -E.C + 50.
4 a
-E 30
20
10
0 -0.0 0.2 0.4 0.6 0.8 1.0
Expander effidency, n. [-]
Figure 8-7: The effect of expander efficiency on relative importance of the HDH pro-
cess to the thermal vapor compression driven HDH-RO system. T,,,, = 30*C; EH60%; ED = 70%; 7tyc = 30%; Pt = 5MPa; PH = 86-96 kPa; PD = 100 kPa; t,in
1; HCRH =1. 200

effect of using higher pressure (saturated) steam. Figure 8-8 illustrates the increase
in GOR and the decrease in equivalent electricity consumption when higher pressure
steam is used. For this example, the component effectivenesses and efficiencies are
fixed along with the operating pressures and feed seawater conditions. The air and
water side pressure drops are assumed to be zero.
5
00 1000 2000 3000 4
Steam pressure, P, [kPa]
000
Figure 8-8: The effect of steam pressure on performance of thermal vapor compression
driven HDH-RO system. T = 300C; EH = 60%; ED = 70%; qtyc = 30%; ,e50%; PH = 86.96kPa; PD = 100 kPa; xst,in = 1; HCRH = 1-
We can clearly observe the strong impact that an increase in steam pressure can
have on the performance of the HDH-TVC system. In this example, when the steam
pressure is increased from 250 kPa to 1000 kPa (i.e. from a saturated steam tem-
perature of 127.40 C to 179.90 C) the GOR is increased by 55%. It is also important
to note that even though we use a higher pressure steam, the equivalent electricity
consumption is still reduced by 14% for the aforementioned increase in steam pres-
sure. This is because the mass flow rate of high pressure steam extracted from the
(fictious) steam turbine is small and the corresponding work lost in the steam turbine
201
30
25
0.
0.0
CL
MU
20 1
15
10
'----
- -
30
25E
20
0
.E
15 0W
1
10
5 Cr'U
1 0005000 6(
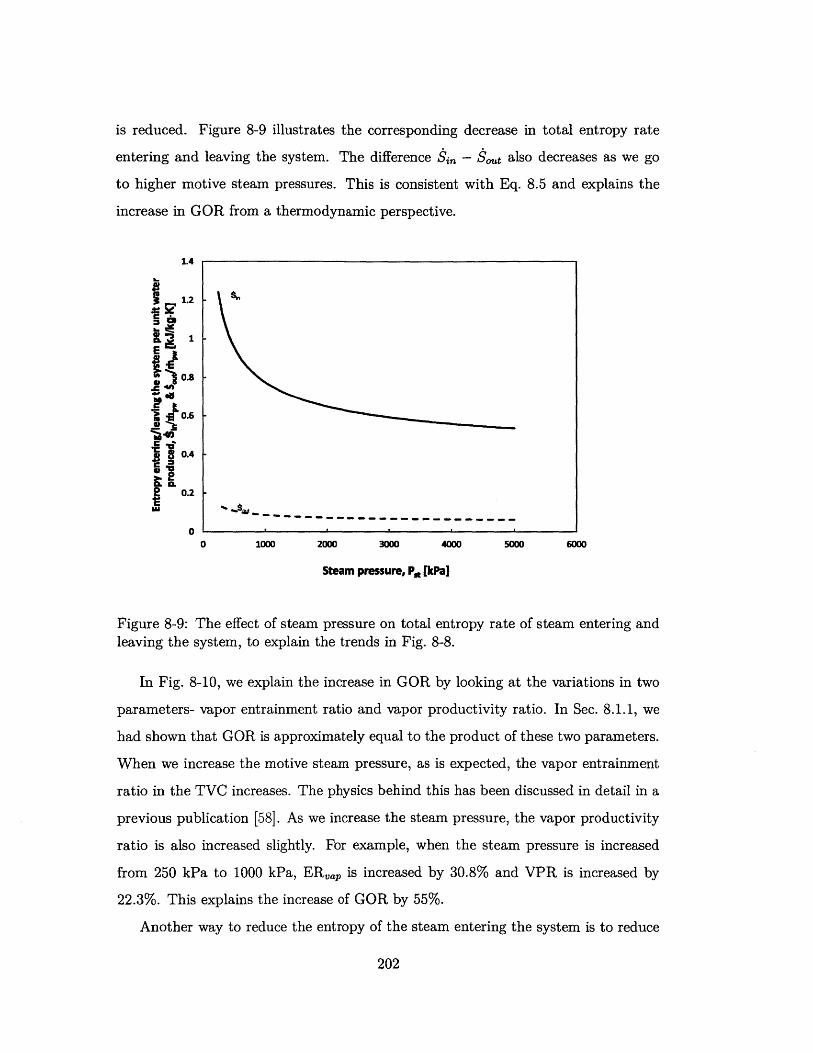
is reduced. Figure 8-9 illustrates the corresponding decrease in total entropy rate
entering and leaving the system. The difference $j, - $.t also decreases as we go
to higher motive steam pressures. This is consistent with Eq. 8.5 and explains the
increase in GOR from a thermodynamic perspective.
1.4
1.2
&~1E
1,1 0.s.1 4ft
0.6
0.4
2 0.2
00 1000 2000 3000 4000 5000
Steam pressure, P [kPa]
Figure 8-9: The effect of steam pressure on total entropy rate of steam entering andleaving the system, to explain the trends in Fig. 8-8.
In Fig. 8-10, we explain the increase in GOR by looking at the variations in two
parameters- vapor entrainment ratio and vapor productivity ratio. In Sec. 8.1.1, we
had shown that GOR is approximately equal to the product of these two parameters.
When we increase the motive steam pressure, as is expected, the vapor entrainment
ratio in the TVC increases. The physics behind this has been discussed in detail in a
previous publication [58]. As we increase the steam pressure, the vapor productivity
ratio is also increased slightly. For example, when the steam pressure is increased
from 250 kPa to 1000 kPa, ERap is increased by 30.8% and VPR is increased by
22.3%. This explains the increase of GOR by 55%.
Another way to reduce the entropy of the steam entering the system is to reduce
202
6000
- - - - - - - - - - - - - - - - - - - - - - - - -
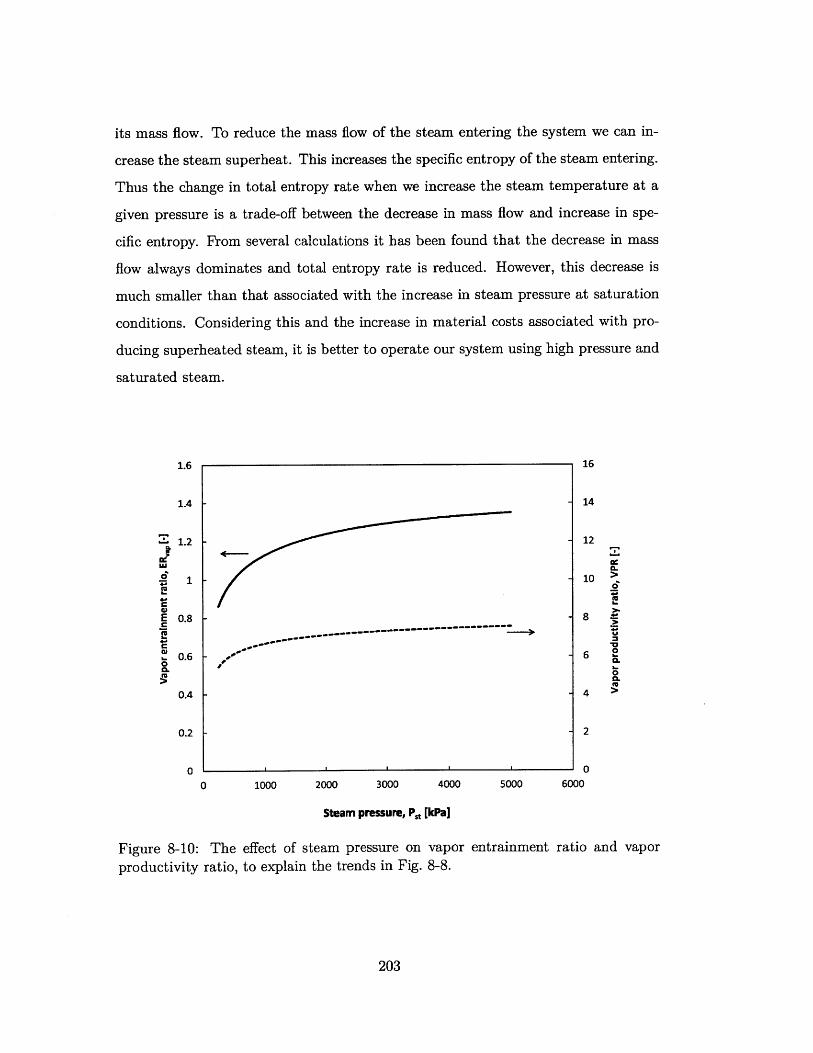
its mass flow. To reduce the mass flow of the steam entering the system we can in-
crease the steam superheat. This increases the specific entropy of the steam entering.
Thus the change in total entropy rate when we increase the steam temperature at a
given pressure is a trade-off between the decrease in mass flow and increase in spe-
cific entropy. From several calculations it has been found that the decrease in mass
flow always dominates and total entropy rate is reduced. However, this decrease is
much smaller than that associated with the increase in steam pressure at saturation
conditions. Considering this and the increase in material costs associated with pro-
ducing superheated steam, it is better to operate our system using high pressure and
saturated steam.
0 1000 2000 3000 4000 5000
Steam pressure, Pt [kPaJ
Figure 8-10: The effect of steam pressure on vapor entrainment
productivity ratio, to explain the trends in Fig. 8-8.ratio and vapor
203
1.6
1.4
1.2
1
0.8
0.6
0.4
0.2
0
(U
E
16
14
12
10
8
26 2
0.
0.CL
4 >
2
-1 0
6000

8.4.3 Effect of pressure ratio
Pressure ratio is defined as the pressure of moist air leaving the humidifier to the
pressure of moist air entering the dehumidifier. It is essentially the pressure ratio
across the TVC created by the steam supply. As we had already seen in the previous
chapter, this can be the most important design parameter for varied pressure HDH
systems. Figure 8-11 illustrates the change in GOR and equivalent electricity con-
sumption when the pressure ratio is varied in an on-design sense. For this example,
the component effectivenesses and efficiencies are fixed along with the dehumidifier
and the heating steam pressures, and the feed seawater conditions. The air and water
side pressure drops are assumed to be zero. For the present calculations the pressure
ratio was varied from 1.2 to 1.8. The lower limit on pressure ratio is imposed by
the dehumidifier minimum terminal temperature difference. It is observed that as
we go to a smaller pressure ratio the GOR increases and the equivalent electricity
consumption decreases. For example, GOR is 13.6% higher and Ec is 19.2% lower
when the system is designed at a pressure ratio of 1.2 instead of 1.8.
This variation in the performance can be explained using Fig. 8-12. From this
figure, it is observed that as we increase the pressure ratio, the vapor entrainment
ratio is decreased. This is only to be expected since a larger pressure rise in the TVC
will require a larger motive steam flow. Also, as we increase the pressure ratio the
VPR is increased. This is because the dehumidification and humidification is carried
out more effectively to produce water at larger pressure ratios. The increase in VPR
is less than the decrease in vapor entrainment ratio. VPR is 43% higher and ER, is
41% lower when the system is designed at a pressure ratio of 1.8 instead of 1.2. This
explains the lower GOR at higher pressure ratios.
8.4.4 Effect of operating pressures
All previous HDH systems in literature have been designed to operate at atmospheric
pressure. However, to increase the vapor content of moist air, the system needs to be
operated at sub-atmospheric pressures. For example, at a dry bulb temperature of 65
204

1.4 1.6
Pressure Ratio, P./PH
Figure 8-11: Effect of pressure ratio on performance
driven HDH-RO system. T,,,in = 30*C; 6H = 60%;50%; PD = 100 kPa; P,, = 5 MPa; xt,f,, = 1; HCRH =
1.2 1.4 1.6 1.8
of thermal vapor compression
ED 70%; 77t, 30%; 77e -
1.
16
14
12
10
8
06
-L400.
4 >
2
02
Pressure Ratio, PD/PH
Figure 8-12: The effect of pressure ratio on vapor
ductivity ratio, to explain the trends in Fig. 8-11.entrainment ratio and vapor pro-
205
30
25
20
15
10
0r0
0L
0-0Eu
,.-----
30
25 -E
20.
E
15 5
10
2
5
01 1.2 1.8
1.6
1.4
1.2
0 1
r=0.8
0.6
1CL
0.4
0.2 I-
01

*C the humidity ratio of moist air is increased two-fold when the operating pressure
is reduced from 100 kPa to 50 kPa. We now investigate the effect that this change in
pressure can have on the system performance. Figure 8-13 illustrates the change in
GOR and equivalent electricity consumption when the humidifier pressure is varied at
a fixed pressure ratio. For this example, the component effectivenesses and efficiencies
are fixed along with the heating steam pressure, and the feed seawater conditions.
The air and water side pressure drops are assumed to be zero. It is observed that as
we change the humidifier pressure there is very little change in GOR and Ec.
30 30
25 25E
----- --------------- --------- p
0W 20 20 C
15 15210
10 -10
CUi
5 .5- 5 a
0 0
20 30 40 50 60 70 80 90 100
Humidifier pressure, P, [kPa]
Figure 8-13: Effect of humidifier pressure on performance of thermal vapor compres-
sion driven HDH-RO system. T = 30*C; EH = 60%; ED = 70%; tc = 30%; e =
50%; PD/PH = 1.15; Pst = 5 MPa; z,,,i, = 1; HCRH = 1-
VPR increases and ERvap decreases with decrease in humidifier pressure. The
increase in VPR is almost at the same rate as the decrease in ERap,. Hence, GOR is
almost constant with variation in humidifier pressure. As we had already explained,
when the humidifier operating pressure is reduced the amount of vapor content in the
air-vapor mixture will increase greatly. Hence, as we go to a lower PH the amount of
vapor leaving the humidifier (rhaa -wH,o) will increase. We recall that this term is the
206
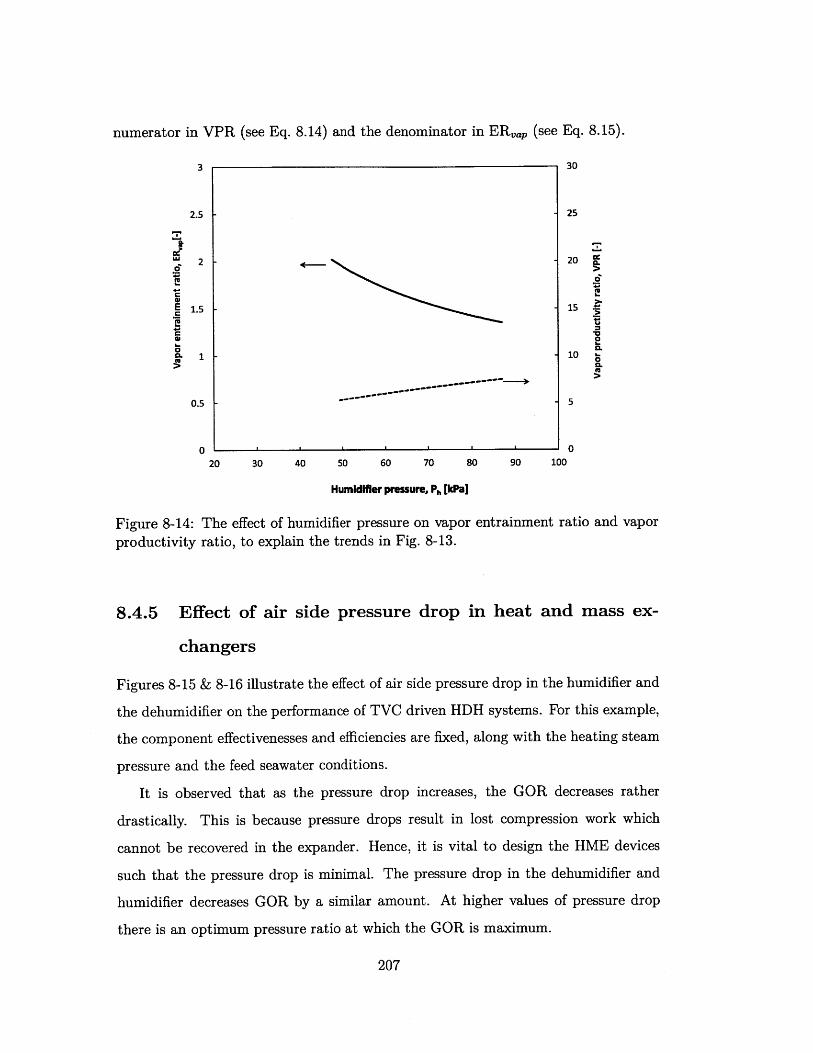
numerator in VPR (see Eq. 8.14) and the denominator in ERap (see Eq. 8.15).
3 30
2.5 25
2 ---. 20
E 1.5 15
0.5 - 5
0 ' '
20 30 40 50 60 70 80 90 100
Humidifier pressure, Ph []Pa]
Figure 8-14: The effect of humidifier pressure on vapor entrainment ratio and vapor
productivity ratio, to explain the trends in Fig. 8-13.
8.4.5 Effect of air side pressure drop in heat and mass ex-
changers
Figures 8-15 & 8-16 illustrate the effect of air side pressure drop in the humidifier and
the dehumidifier on the performance of TVC driven HDH systems. For this example,
the component effectivenesses and efficiencies are fixed, along with the heating steam
pressure and the feed seawater conditions.
It is observed that as the pressure drop increases, the GOR decreases rather
drastically. This is because pressure drops result in lost compression work which
cannot be recovered in the expander. Hence, it is vital to design the HME devices
such that the pressure drop is minimal. The pressure drop in the dehumidifier and
humidifier decreases GOR by a similar amount. At higher values of pressure drop
there is an optimum pressure ratio at which the GOR is maximum.
207

0C
.2
S0.*
10
9.5
9
8.5
8
7.5
7
6.5
61 1.2 1.4 1.6 1.8 2
Pressure Ratio, PD/PH
Figure 8-15: Effect of air-side pressure drop in dehumidifier on performance of ther-
mal vapor compression driven HDH-RO system. T,,,, = 30*C; EH = 60%; ED
70%; qtVc = 30%; qe = 50%; PD = 100 kPa; P,8 = 5 MPa; xt,i,, = 1; HCRH = 1-
0C,
0
10
9.5
9
8.5
8
7.5
7
6.5
61 1.2 1.4 1.6 1.8 2
Pressure Ratio, PD/ H
Figure 8-16: Effect of air-side pressure drop in humidifier on performance of ther-
mal vapor compression driven HDH-RO system. T,, = 30*C; CH = 60%; ED
70%; qtVc = 30%; 7e = 50%; PD = 100 kPa; Pst = 5 MPa; xt,i,, = 1; HCRH = 1.
208
0 kPa
- OkPa
0.5 kPa
A&P,=1kPa_

8.5 Comparison with existing desalination tech-
niques.
In this section, a niche is identified for the new technology proposed in this paper. In
the absence of reliable cost data, we will do this by considering the scale of application
(in m3 of water produced per day), the energy performance of various desalination
systems and the quality of the energy source used. To evaluate and compare the per-
formance of various thermal and electricity driven desalination technologies with that
of the new system - gained output ratio (GOR) and equivalent electricity consumption
Ec are used. GOR is a thermal energy based performance parameter (see Eq. 2.2).
In order to calculate it for electricity driven systems, we use a power production
efficiency (qpp = 40%) to convert electricity consumed to thermal energy.
Hence, for electrical energy driven systems,
GOR = h- (8.24)Ec 3.6
Figure 8-17 plots both the equivalent electrical energy consumption and the GOR
against the size of the system in m 3 /day. Performance of the various desalination
processes is obtained from the widely cited review paper by Miller [107].
The performance values shown for the HDH-TVC-RO system is in two bands.
The lower band of performance values correspond to the system with off-the-shelf
components (77tvc = 30%, n7e = 50%, EH = 60% and ED = 70%) and the higher
one corresponds to the system with custom built (and more efficient components)
(7tc = 40% to 50%, ,e = 80%, EH = 70% and ED = 70%). Both bands of performance
values are for systems using steam at 10 to 50 bar.
The application of this system is likely to be limited to a medium or large scale
because medium pressure steam at 10-50 bar is expected to be uneconomical to pro-
duce on a small scale. In the medium to large scale market, the competing steam
driven desalination technologies are MED, MSF and Rankine cycle driven RO. From
Fig. 8-17 it is observed that HDH-TVC-RO system can potentially outperform MSF
209
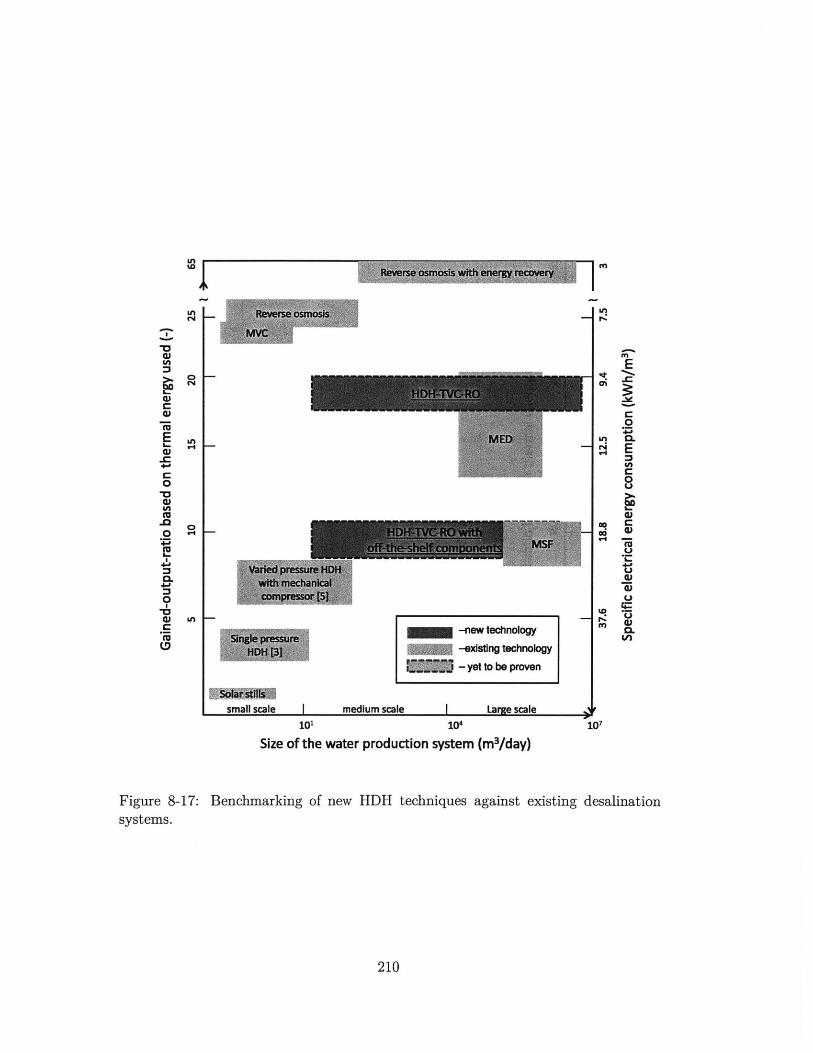
Ln
0C..'
U''-I
0
-new technology
-existing technology
- yet to be proven
small scale I101
medium scale Large scale104
E
.1 e
~-
0
Sn 0.
0
(U
W
U
0.
Size of the water production system (m3/day)
Figure 8-17: Benchmarking of new HDH techniques against existing desalinationsystems.
210
CL
CU
C

and perform as well as MED in terms of GOR and equivalent electricity consumption.
This performance is at a higher heating steam pressure (and temperature) than MSF
and MED. MSF and MED can run using 80-120*C saturated steam. Also, it is com-
mon knowledge that Rankine cycle power plants require anywhere between 400-600*C
steam temperature to run economically and efficiently. Such a steam source cannot
be produced economically when RO is a stand alone desalination unit, it needs to be
in a co-production environment coupled to a large scale Rankine cycle power plant
for such a energy source to be available.
Hence, the niche for the HDH-TVC-RO technology is medium scale, stand alone,
decentralized seawater desalination using medium pressure steam. It would be desir-
able to produce the steam using solar energy. Coastal communities which have high
solar insolation, high water scarcity and inavailability of fossil fuels are a target for
this technology. This is unlike other HDH technology described in this thesis which
are applicable for small-scale, community-level water treatment.
8.6 Chapter conclusions
1. A novel carrier gas based thermal desalination system run using a thermal vapor
compressor is described in this Chapter. This system can use steam at a higher
temperature (and lower total entropy rate) than existing thermal desalination
systems.
2. This system has been analyzed in detail in an on-design sense by assigning
an energy effectiveness for the humidifier and dehumidifier, and an isentropic
efficiency for the expander and a reversible entrainment efficiency for the TVC.
3. It has been found that recovering energy given by steam in the TVC as work in
an expansion process leads to a more efficient system than using a isenthalpic
throttling process. However, the use of an efficient expander leads to the major-
ity of the water being produced in the RO unit coupled to it. In these scenarios,
the HDH system itself operates as a power and water coproduction unit where
211
all of the power produced is used for further desalination in a RO unit.
4. For minimum specific energy consumption of the HDH-TVC-RO system, use
of an efficient TVC and high pressure (Pt = 10 to 30 bar) steam are most
important.
5. It is also crucial to design the system for as low a pressure ratio as is possible.
The air side pressure drops in the HME devices also play a significant role.
6. The absolute value of pressure in the humidifier and the dehumidifier have been
found to have little effect on the system performance.
7. The HDH-TVC-RO system is appropriate for medium scale, stand alone, decen-
tralized seawater desalination using medium pressure steam. In these situations
a GOR of 20 and an equivalent electricity consumption of 9.5 kWh/m 3 can be
attained using components with high efficiencies.
212

Chapter 9
Multi-stage bubble columns for
high heat rate dehumidification
When a non-condensable gas is present, the thermal resistance to condensation of
vapor on a cold surface is much higher than in a pure vapor environment. This is,
primarily, because of the diffusion resistance to transport of vapor through the mixture
of non-condensable gas and vapor. Several researchers have previously studied and
reported this effect [108-116]. There is a general consensus that, when even a few mole
percent of non-condensable gas is present in the condensing fluid, the deterioration
in the heat transfer rates could be up to an order of magnitude [117-122]. From
experimental reports in literature it can be observed that the amount of deterioration
in heat transfer is a very strong (almost quadratic) function of the mole fraction of
non-condensable gas present in the condensing vapor. For this reason, a deaerator is
usually used in power plants to prevent the accumulation of non-condensable gas in
the steam condenser.
In HDH systems, a large percentage of air (60-90% by mass) is present by default in
the condensing stream. As a consequence it has been found that, in these systems, the
heat exchanger used for condensation of water out of an air-vapor mixture (otherwise
known as dehumidifier) has very low heat and mass transfer rates (an 'equivalent'
heat transfer coefficients as low as 1 W/m 2-K in some cases [62, 63]). In this chapter,
we propose to improve the heat transfer rate by condensing the vapor-gas mixture in
213

a column of cold liquid rather than on a cold surface by using a bubble column heat
(and mass) exchanger.
Bubble columns are extensively used as multiphase reactors in process, biochem-
ical and metallurgical applications [123]. They are used especially in chemical pro-
cesses involving reactions which have a very high heat release rate associated with
them (such as the Fischer-Tropsch process used in the manufacture of synthetic fuels)
[124, 125]. We propose to apply this device for condensation of the air-vapor mixture
with a large percentage of air present in it. Figure 9-1 illustrates the proposed device
schematically. In this device, moist air is sparged through a porous plate (or any
other type of sparger [126]) to form bubbles in a pool of cold liquid. The upward
motion of the air bubbles causes a wake to be formed underneath the bubble which
entrains liquid from the pool, setting up a strong circulation current in the liquid
pool [127]. Heat and mass are transferred from the air bubble to the liquid in the
pool in a direct contact transport process. At steady state, the liquid, in turn, losses
the energy it has gained to the coolant circulating through a coil placed in the pool
for the purpose of holding the liquid pool at a steady temperature.
9.1 Predictive model for combined heat and mass
transfer
In this section, we develop a thermal resistance model for the condensation of water
from an air-vapor mixture in a bubble column heat exchanger. Figure 9-2 illustrates
a local thermal resistance network describing the heat and mass transfer processes in
the bubble column condenser. To draw this network, we define local energy-averaged
'bulk' temperatures for the condensing mixture, the liquid in the pool, and the coolant
and also approximate the heat transfer to be locally one-dimensional.
The four temperature nodes in the network are: (1) the average local temperature
of the air-vapor mixture in the bubbles (T,.i), (2) the average temperature of the
liquid in the pool (TCOIn), (3) the local temperature of the coil surface (Tcou), and
214

Coolant Coolant inout
I I Vapor/gas mixture out
Condensate out
Cooling coils
Liquid in column
BubblesSpargerAir distribution chamber
Vapor/gas mixture in
Figure 9-1: Schematic diagram of the bubble column dehumidifier.
It,impact
it
Rim act
T TeilR coolunt
air RsensibleRbc Reoi
Figure 9-2: A thermal resistance model for the bubble column dehumidifier.
215
(4) the average local temperature of the coolant inside the coil (Tcooat). Between
Tajr and Tco.m. there is direct contact heat and mass transfer. The heat transfer is
via a thermal resistance represented by Rens,,je and the mass transfer is represented
as a (latent) heat source (qt = j - hyg). The thermal resistance due to the coil wall
itself will be very small and has been neglected. This is especially true in the cases
considered in this thesis since copper tubing is used. In cases where stainless steel or
a lower thermal conductivity metal is used, this resistance might not be negligible.
Between the coil surface and the bubble there could be direct contact heat exchange
and associated condensation of vapor on the coil surface. The heat transfer is via
a heat transfer resistance Rimepat and the mass transfer are represented by the heat
source qt,impet. Several researchers [124, 125, 128-130] have previously studied the
thermal resistance between the pool of liquid and the immersed surface in a bubble
column reactor. In the current chapter, this resistance is represented as Rbc between
Tconj and Tcomma. Finally, there is a convective resistance inside the coil for the coolant
flow represented by Rcou.
In order to simplify the circuit, the direct impact of the bubble on the coil surface
is approximated to have negligible effect on the heat and mass transfer (i.e. Rimpaet
and qat,impact are neglected). The experiments were designed and carried out such that
this approximation was satisfied (see section 9.2) and the effect of direct impact was
dealt with in a separate set of experiments (see section 9.3.6). Each of the remaining
resistances depicted above will be modeled using reasonable simplifying assumptions
in the following paragraphs.
9.1.1 Thermal resistance between the liquid in the column
and the coil surface
In bubble column reactors used in the chemical industry, proper design of the heat
transfer surfaces is vital to maintain catalytic activity, reaction integrity and product
quality since the reactions typically involve very high heat release rates because of
their highly exothermic or endothermic nature. In these scenarios, the temperature
216
of the liquid in the column is of utmost importance. Hence, several studies have been
conducted over the last five decades on modeling and measuring the heat transfer
coefficients between the liquid and the heat transfer surface.
In a pioneering effort, Konsetov [129] proposed a semi-analytical model based on
the assumption that heat rates are determined by isotropic turbulent fluctuations in
the liquid. He approximated the characteristic dimension for heat transfer from the
liquid to the coil to be the coil diameter and used the Kutateladze model [131] for
determining the gas holdup. Konsetov used a flexible constant to fit the data from
the model to experimental data in literature. This correlation, however, has not been
widely used for bubble column reactor design.
Kast [130] developed a model by considering that a fluid element in front of
the rising bubble receives radial momentum and moves toward the wall. This was
postulated to break up the boundary layer at the wall. The author proposed that
below the bubble, liquid is sucked in at a radial velocity V, and that this results in a
capacitive heat transport given by V,- p-cp. He further observed that Vr is propotional
to the superficial gas velocity V and defined Stanton number as St= . . Based
on intuitive reasoning Kast proposed the following correlation.
St = f (ReFrPr)" (9.1)
Deckwer [128] used the Kolmogorov theory of isotropic turbulence [132] and Hig-
bie's theory of surface renewal [133] to explain the form of the equation (Eq. 9.1)
proposed by Kast. By observing that there is no experimental evidence of a physi-
cal length scale for the heat transfer, Deckwer postulated that the micro eddy scale
of energy dissipation (see Eq. 9.2) proposed by Kolmogrov is an ideal characteristic
length scale for the problem at hand. The author also proposed use of the Kolmogorov
velocity (see Eq. 9.3) as the characteristic velocity.
S= (-)1(9.2)
V = (Ve) 14 (9.3)
217
The heat transfer correlation (Eq. 9.4) thus derived by Deckwer had the same
form as Kast's model and used a flexible constant.
St = c(ReFrPr)~ 2 6 (9.4)
In this section, the present authors have described an improved model for predict-
ing the heat transfer rate between the liquid in the column and the coil surface. In
this model we (like Deckwer [128]) used Higbie's theory of surface renewal however,
with a different length scale. In fluid elements adjacent to the surface, unsteady heat
diffusion takes place and is described by the following equation:
Sa2(9.5)
The appropriate boundary conditions to describe this problem are ones that de-
scribe the temperature T as the wall temperature Tca1 at x = 0 and all times, the
bubble temperature as the initial temperature at all x, and T as the bubble temper-
ature at x = oo at all times. The final boundary condition is possible only when
we approximate the fluid element to have infinite depth and the contact times to be
short.
T = Tcoil X = 0 t ;> 0 (9.6)
T = Tbbue x > 0 t = 0 (9.7)
T = T&ie x = 00 t > 0 (9.8)
Solving the above equations, we can obtain the following expression for the heat
flux and the thermal resistance.
q =2 k pc- (Tuwe - Teai (9.9)
I = 2 Fpcp(9.10)Rc /fV t
218

From Eq. (9.10), it is clear that the resistance can be modeled by modeling the
surface renewal time (t). For modeling t, we need to model the characteristic length
scale and velocity scale accurately. As stated earlier, Deckwer modeled the length
and velocity using the Kolmogrov theory (Eqs. 9.2 & 9.3). These scales are indica-
tive of the smallest eddies present in the flow and are the scales at which energy is
dissipated. These are the scales that form the viscous sub-layer and are very small
physically. Hence, this scale is unlikely to regulate the surface renewal mechanism
and the physical mixing. We propose to use a more intuitive length scale which is
the integral scale of turbulence.
The integral scale is the representative size of the largest energy bearing eddy. In
some cases this scale can be defined by the physical constraints of the flow domain.
For example, in pipe flow the diameter of the pipe is of the order of the largest eddies
in the flow, and the ratio of the pipe diameter to mean velocity along the pipe is
a good estimate of the time period required to describe the flow. In other cases
where the integral scale is not obvious from the flow geometry, it can be defined using
the autocorrelation of the velocity (i.e., the correlation of a velocity component with
itself) as follows:
lit = u(x2t) .u(x+r, t) dr (9.11)0 U2
where u is the root-mean-square velocity in the x-direction and r is the distance be-
tween two points in the flow. The determination of the integral scale using Eq. (9.11)
is not straight-forward [134-136. Direct numerical simulations or large scale visual-
ization experiments using particle image velocimetery or other such techniques are
normally used to obtain the autocorrelation of velocity in a 3D flow like in bubble
columns [137]. Instead of going into these elaborate techniques, we propose to approx-
imate the integral scale by the bubble diameter. Magaud et al. [138] have presented
experimented data that supports this approximation. Similar results concluding that
the integral length is of the order of the bubble diameter have been reported by other
authors as well [139, 140].
219
There exist various expressions to calculate the bubble diameter (depending on
flow regime) and most of them are empirical or semi-empirical. We use the following
expression for the cases involved in this thesis [141]. This equation can also be derived
from a simple force balance (with the gravitational force equaling the surface tension).
Db = 6-d" (9.12)Ip - Pg I
We also propose to use the liquid circulation velocity as the characteristic veloc-
ity. This is logical because the liquid that 'renews' the boundary layer formed on
the heat transfer surface is at this velocity and when we aim to calculate the time
between two 'renewals' we need to take this into account. Field and Rahimi [142]
have proposed that the following expression, which is commonly used in literature
[125], is appropriate to calculate liquid circulation velocity in bubble columns.
V = 1.36 {gH(V - C -b)} 1 (9.13)
According to this expression, the circulation velocity is a function of the bubble
velocity and several researchers have previously presented various expressions for
calculating the same. An appropriate correlation from the wide selection needs to be
picked based on the conditions in the bubble column. For the cases reported in this
chapter we find it appropriate to use the following equation for evaluating bubble
velocity developed based on Mendelson's wave equation [143]. Our own experimental
observations showed that this correlation works well for the cases reported in this
thesis.
2 + (9.14)p1Db 2
To calculate circulation velocity based on Eq. (9.13) we also need to evaluate the vol-
umetric gas holdup (E), for which we propose to use the following expression provided
by Joshi and Sharma [127]. Several other correlations which have been reported by
various researchers, but for the conditions under which we conducted the experiments
in (described in Sec. 9.2) we find the following correlation to be the most appropriate.
220

Also, we find that this correlation (Eq. 9.15) is the most widely used by researchers
in the field. Our own experimental observations showed that this correlation works
well for the cases reported in this chapter.
eV= (9.15)0.3 + 2.- V
Based on these expressions, we can evaluate the time between two 'renewals'
as t =24. By applying this contact time to Eq. (9.10), we evaluate the thermal
resistance between the liquid in the column and the coil surface. This resistance is,
however, a minor one in the network and the prediction of the same has little effect
on the overall result for the cases reported in this thesis.
9.1.2 Thermal resistance between the liquid in the column
and the bubbles
The high resistance to diffusion of vapor through a vapor-gas mixture is the reason
that regular dehumidifiers have low heat transfer coefficients. In this section, we model
the equivalent of the aforementioned diffusion resistance for the case of bubble column
dehumidifiers. In Fig. 9-2, the total heat flux between the bubbles and the liquid was
modeled as the sum of the heat flux due to condensation (qat) and the heat flux due to
heat transfer through the resistance Rsesisre. We will evaluate the latent heat using
a mass transfer resistance model and the sensible heat using a heat and mass transfer
analogy. The mass transfer resistances associated with condensation are shown in Fig.
9-3. In drawing these resistances it is approximated that the condensation occurs at
an interface just outside the bubble surface and mass averaged 'bulk' humidity ratios
are defined for the vapor-gas mixture inside the bubble and at the bubble interior
surface.
The mass transfer resistances depicted in Fig. 9-3 are: (1) the resistance to
diffusion of vapor through the vapor-gas mixture in the bulk (Wfdk) to the bubble
surface (w&o,,ie) and (2) the mass transfer resistance caused by bubble motion through
the liquid. The first resistance is not easy to model without knowing the mechanism of
221

RnlI2 (bubble RrriNi
Figure 9-3: A mass transfer resistance model between the liquid in the column and
the bubbles
convective transport inside the bubble which could be augmented by a fluid circulation
caused by rapid and asymmetric vertical motion of the bubble in the liquid pool.
Since there are several complexities involved in evaluating the mechanism of transport
inside the bubble, we assume a boundary layer is formed for diffusive transport and
approximate the thickness of the boundary layer by the radius of the bubble itself.
This is an upper limit for the size of the boundary layer and the associated thermal
resistance and hence, in the succeeding sections (Sec. 9.3.5) it is shown that the heat
transfer and condensation rates predicted by the model consistently underestimates
those measured experimentally. The model equation is:
k,1 - DAb (9.16)
We model the resistance outside the bubble surface using surface renewal mecha-
nism (similar to that presented in Eqs. (9.5-9.10)):
-2 D AB 17k2 = - (9.17)
The surface renewal time (t) in this case is modeled as the ratio of the bubble diameter
and the bubble slip velocity. The bubble slip velocity is the relative velocity of the
bubble with respect to the circulating liquid. The liquid circulation velocity and the
bubble velocity are calculated using the expression presented in Eq. (9.13) & (9.14)
respectively. The model equation is:
Dbt = b-V (9.18)
222
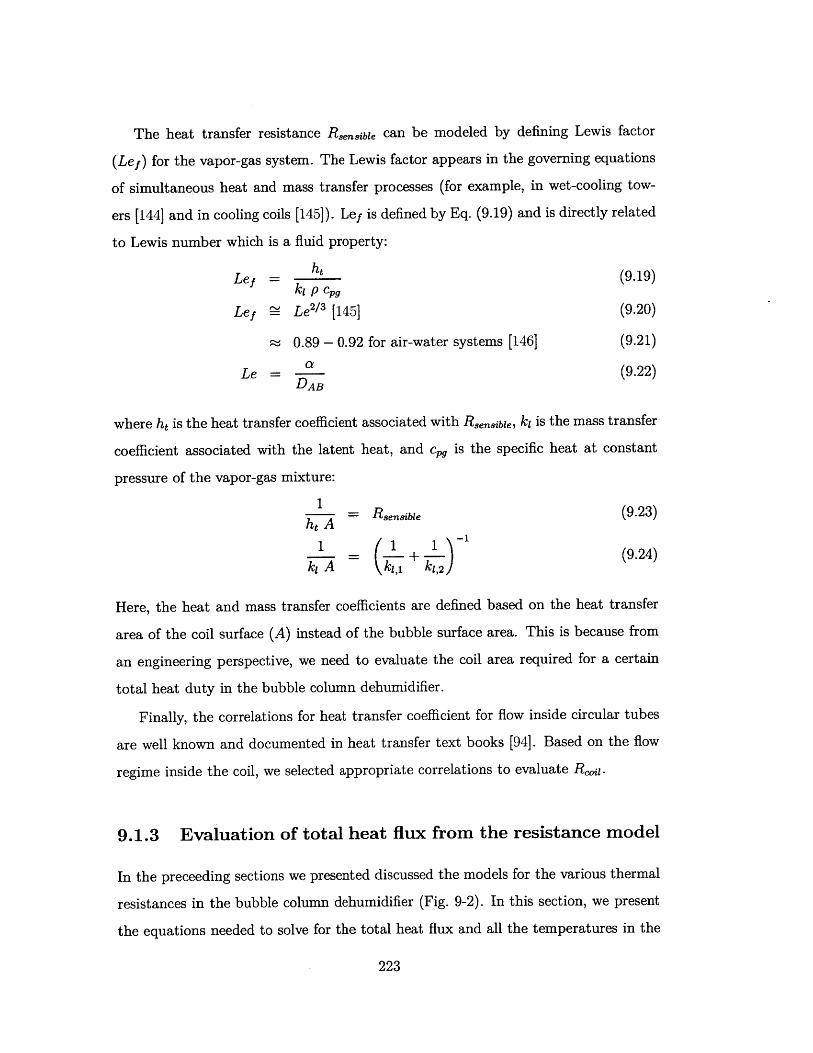
The heat transfer resistance Rsensible can be modeled by defining Lewis factor
(Lef) for the vapor-gas system. The Lewis factor appears in the governing equations
of simultaneous heat and mass transfer processes (for example, in wet-cooling tow-
ers [144] and in cooling coils [145]). Lef is defined by Eq. (9.19) and is directly related
to Lewis number which is a fluid property:
Ley = h(919)ki p cpg
Lej f Le2/ 3 [145] (9.20)
0.89 - 0.92 for air-water systems [146] (9.21)
Le = a (9.22)DAB
where ht is the heat transfer coefficient associated with Rsensible, ki is the mass transfer
coefficient associated with the latent heat, and cp is the specific heat at constant
pressure of the vapor-gas mixture:
= Rsensible (9.23)he A
1 1 1 (9.24)- 7 + - (.4k, A kI',1 kj,2
Here, the heat and mass transfer coefficients are defined based on the heat transfer
area of the coil surface (A) instead of the bubble surface area. This is because from
an engineering perspective, we need to evaluate the coil area required for a certain
total heat duty in the bubble column dehumidifier.
Finally, the correlations for heat transfer coefficient for flow inside circular tubes
are well known and documented in heat transfer text books [94]. Based on the flow
regime inside the coil, we selected appropriate correlations to evaluate Rcois.
9.1.3 Evaluation of total heat flux from the resistance model
In the preceeding sections we presented discussed the models for the various thermal
resistances in the bubble column dehumidifier (Fig. 9-2). In this section, we present
the equations needed to solve for the total heat flux and all the temperatures in the
223
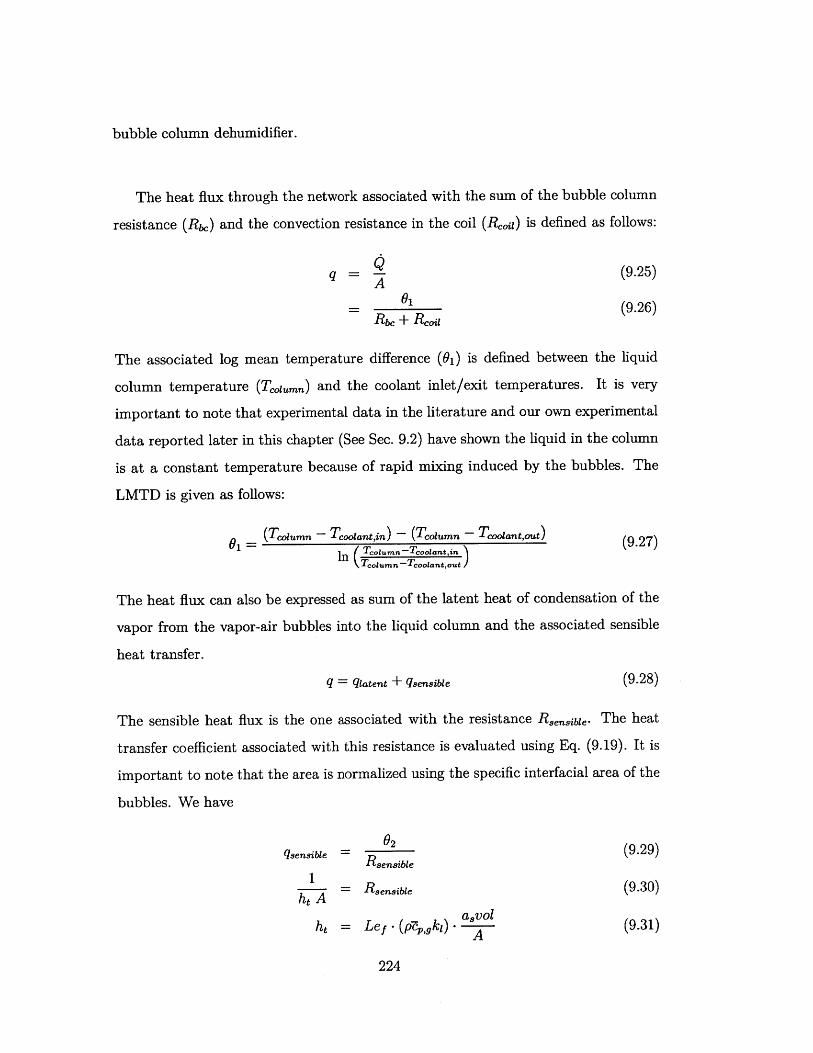
bubble column dehumidifier.
The heat flux through the network associated with the sum of the bubble column
resistance (Rbc) and the convection resistance in the coil (Reou) is defined as follows:
q - (9.25)A
= b61 (9.26)Rbc + Reoi
The associated log mean temperature difference (01) is defined between the liquid
column temperature (Tco.umn) and the coolant inlet/exit temperatures. It is very
important to note that experimental data in the literature and our own experimental
data reported later in this chapter (See Sec. 9.2) have shown the liquid in the column
is at a constant temperature because of rapid mixing induced by the bubbles. The
LMTD is given as follows:
(Tcojsmn - Tcooant,in) - (Tclumn - Tcooant,out) (9.27)h (Tcolumn-coolant,in
\Tcolumn~Tcoolant,out/
The heat flux can also be expressed as sum of the latent heat of condensation of the
vapor from the vapor-air bubbles into the liquid column and the associated sensible
heat transfer.
q = qiatent + qsensise (9.28)
The sensible heat flux is the one associated with the resistance Rsensible. The heat
transfer coefficient associated with this resistance is evaluated using Eq. (9.19). It is
important to note that the area is normalized using the specific interfacial area of the
bubbles. We have
qsensibe = R 2 (9.29)Rsensible
= kR)enavle (9.30)
ht =Lef ' (P ,,,kj) - -qVl(9.31)
224

The specific interfacial area is evaluated using the following widely used expression
[141].
a. = GE (9.32)Db
The associated log mean temperature difference is defined between the column tem-
perature and the air inlet/exit temperature:
- (Tajr,in - Tcolumn) - (Tair,,ot - Tcoiumn) (9.33)- In ir'''"-Teo"u" n
Tair,out ~*Tcol umn/
The latent heat transfer rate is calculated using the following expression based on
mass flux:
qlatent = jh (9.34)
The mass flux is evaluated by using the mass conversation equation across the bubble
column condenser:mhda
j = (win - W.t) (9.35)
The energy balance between the coolant and the air is written as follows
7hcoolantep,coolant
q A (Tcooiant,out - Toiant,in) (9.36)
rha(hai,.,in - hai,ut) (9.37)A
By applying a mass balance on the vapor over a incremental time dt and integrating
the same over a the residence time for the bubble in the liquid tf we obtain the
following expression.
k -a, = 1In Wsat (9.38)f Wout ~~ Wat
Where the bubble residence time t1 is evaluated as the ratio of the liquid height and
the bubble velocity:H
ty = - (9.39)Vb
By solving Eqs. (9.25-9.39) we can obtain the heat flux and the associated tempera-
tures from the estimated thermal resistance [Eqs. (9.5-9.24)].
225

Solution technique
The equations presented in this section are solved simultaneously using Engineering
Equation Solver (EES) [77]. The various fluid property packages used in EES have
been previously been explained in Chapter 3.1.3.
9.2 Experimental details
A laboratory scale test rig was designed and built to study the condensation process
from a vapor-air mixture in a bubble column condenser. Figure 9-4 shows a schematic
diagram of the test apparatus used in the study. The apparatus consists of two bubble
columns (4) and (9) with dimensions of 12" (304.8 mm) width x 12" (304.8 mm)
length x 18" (457.2 mm) height made from transparent PVC sheets of 3/8" (9.52
mm) thickness. The first column (4) is used to produce moist air for the experiment
by passing air through a sparger (3) into hot water. The water in this column is heated
by a 1.5 kW submerged electric heater (5). The air is supplied from a compressor
and the flow rate is controlled by valve (1) and measured by rotameter (2). The
humidified air from the first bubble column flows to the test column (9) where the
dehumidification measurements are carried out. Before entering the second column,
the flow rate is measured by a rotameter (6), the pressure is measured by a pressure
gauge (7), and the dry and wet bulb temperatures are measured with thermocouples
T1 and T2 respectively. Air flows into the sparger of the test column (8) where it is
cooled and dehumidified using the cold copper coil (10). The copper coil has a pipe
diameter of 1/4" (6.35 mm), a coil height of 6" (152.4 mm) and a turn diameter of
9" (228.6 mm). Cold water acting as the coolant flows inside the coil and is pumped
from the cooling tank (15) where chilled water coil (16) keeps the temperature inside
this tank almost constant. The dry bulb temperature and wet bulb temperature of
the outlet air from the second column are measured by thermocouples T3 and T4
respectively. The two columns are provided with a charging and empting valve at
the back side (not shown in figure). Cold water from the cooling water tank (15)
is pumped into the copper coil (10). The flow rate of the water is adjusted by the
226

Figure 9-4: Schematic diagram of test apparatus; (1, 11, 12) valves, (2, 6, 13) rotame-
ter, (3, 8) sparger, (4) humidifier column, (5) submerged electric heater, (7) pressure
gauge, (9) dehumidifier column, (10) water coil, (14) inline water heater, (15) cooling
water tank, (16) chilled water coil, (T1 - T8) thermocouples
inline valve (11) and the bypass valve (12). The flow rate of water is measured by
rotameter (13) and the fine temperature of the water can be adjusted by the inline
electric water heater (14). The inlet and outlet water temperature from the copper
coil are measured by thermocouples T5 and T6 respectively. The water temperature
in the condenser bubble column is measured at two levels using thermocouples T7
and T8.
The sparger (3) of the humidifier bubble column (4) is a cartridge type sparger
of 10" (254 mm) length. The sparger is from Mott corporation made of stainless
steel (316LSS) porous pipe of 2" (50.8 mm) outside diameter and 1/16" (1.59 mm)
thickness. This sparger generates uniform and fine bubble sizes and has a pressure
drop less than 13.7 kPa (2 psi). The sparger (8) in the dehumidifier column is made
of aluminium box 10" (254 mm) x 10" (254 mm) x 1" (25.4 mm). The top cover of
this box is made of an acrylic sheet with a number of holes drilled in it to generate
the air bubbles. There are 5 acrylic sheets; each one has different number of holes,
hole diameter, and hole pitch as shown in Table 9.1. The thermocouples used in the
apparatus are of K-type are connected to a data logger and a PC. The thermocouples
and the data logging system have an uncertainty of t 0.1*C. The rotameters used
for air flow measurements have a range of 0.8 - 8.2 ft 3 /min (378 - 3870 m 3/s) with
a least count of i 0.2 ft3 /min (i 94.4 m 3/s). The rotameter used for water flow
227

measurement has a range of 0.01 - 0.85 L/min with a least count of 0.01 L/min.
Table 9.1: Sparger design
Design No. Hole size (mm) Pitch (mm) Number of holes
1 1.59 16 121
2 2.38 23 643 3.18 26 364 3.96 32 255 4.76 40 16
In order to study the impact of bubble-on-coil, we designed a set of circular coils
to avoid impact and a set of serpentine coils which will facilitate impact. The pho-
tographs of the two set of coils are shown in Fig. 9-5. It may be observed that the
circular coil has a turn diameter of 9" (228.6 mm) and the sparger face area is 8"
(203.2 mm) x 8" (203.2 mm) which brings the point of inception of the bubble to be
vertically away from the coil. This helps minimize impact. In the serpentine coil,
each pass of the coil is deliberately made to cross over the sparger holes maximizing
impact. The results are markedly different for the two coils and are reported later on
in this chapter (see Sec 9.3.6).
9.3 Results and discussion
In this section, we explain the importance of parameters such as superficial velocity,
inlet mole fraction of vapor, bubble diameter, liquid height and effect of bubble-on-
coil impact on the performance of a bubble column dehumidifier by varying these
parameters independently.
The performance parameter of interest is the total heat flux exchanged between
the coolant and the air-vapor mixture. Other alternative performance parameters,
such as an 'equivalent' heat transfer coefficient, are not strictly correct, in contrast
to the situation for a heat exchanger. This is because defining a global value for
heat transfer coefficient will involve defining a log mean temperature difference (or
another such global parameters for the device in its entirety) between the air and water
228
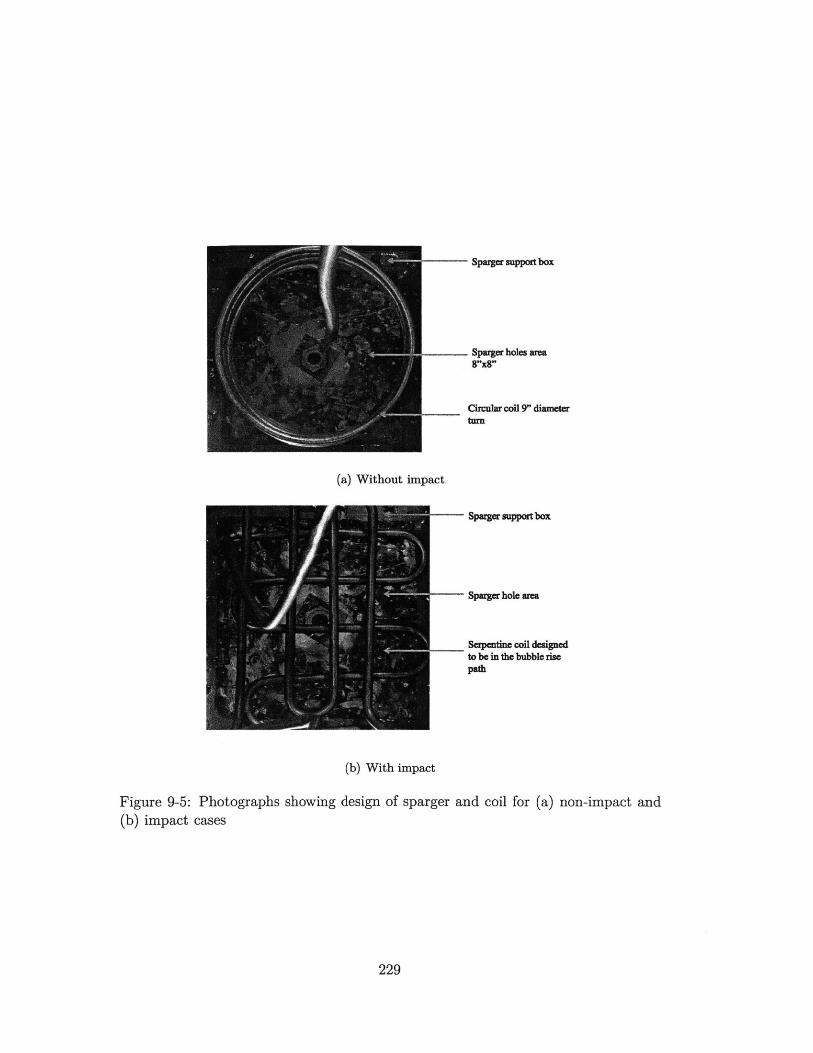
Sparger support box
Sparger holes area8"x8"
Circular coil 9" diameterturn
(a) Without impact
Sparger support box
Sparger hole area
Serpatine coil designedto be in the bubble risepath
(b) With impact
Figure 9-5: Photographs showing design of sparger and coil for (a) non-impact and(b) impact cases
229

temperatures at the inlet and outlets. This would amount to associating the mass
transfer (and the associated latent heat release, which is the major portion of the total
heat exchanged between the fluid streams) with a temperature difference: and this is
ofcourse inappropriate because the mass transfer is associated with a concentration
difference and not a temperature difference [20, 21, 88]. It is, hence, logical to use heat
flux as the performance parameter since it captures all the important characteristics
of the bubble column dehumidifier (including the condensation rate) but does not
involve all of the aforementioned issues.
9.3.1 Effect of superficial velocity
Several researchers have studied the effect of superficial velocity on mass transfer in
bubble columns [124, 147-150]. These studies, however, did not involve condensation
from the bubble into the liquid column. A typical example of the mass transfer studies
in literature would be absorption of isobutylene in aqueous solutions of H2 SO 4 [151,
152]. Researchers have also separately studied the effect of superficial velocity on heat
transfer to immersed surfaces in bubble column reactors [128-130, 153-158]. However,
we should note that the effect of superficial velocity on simultaenous heat and mass
exchange with condensation has not been studied before (to the best knowledge of
the authors), and it will be the focus of this section.
The general consensus in literature is that the heat and mass transfer coefficients
are higher at higher superficial velocity [159]. Studies have also shown that the rate
of increase of heat transfer coefficients with gas velocity is more pronounced at lower
gas velocity, and more gradual at higher gas velocities. This is because of the change
in flow regime from homogenous bubbly flow to the churn-turbulent regime. The
effect of increase in superficial velocity is reported to be lower in the churn-turbulent
regime.
A flow regime map reported by Shah et al. [124] predicts that the transition veloc-
ity for the experimental bubble column reported in the current chapter lies somewhere
between 4.5 and 7 cm/s (based on an effective column diameter of 30.5 cm). During
experimentation it was observed that between superficial velocities of 3 to 8 cm/s the
230
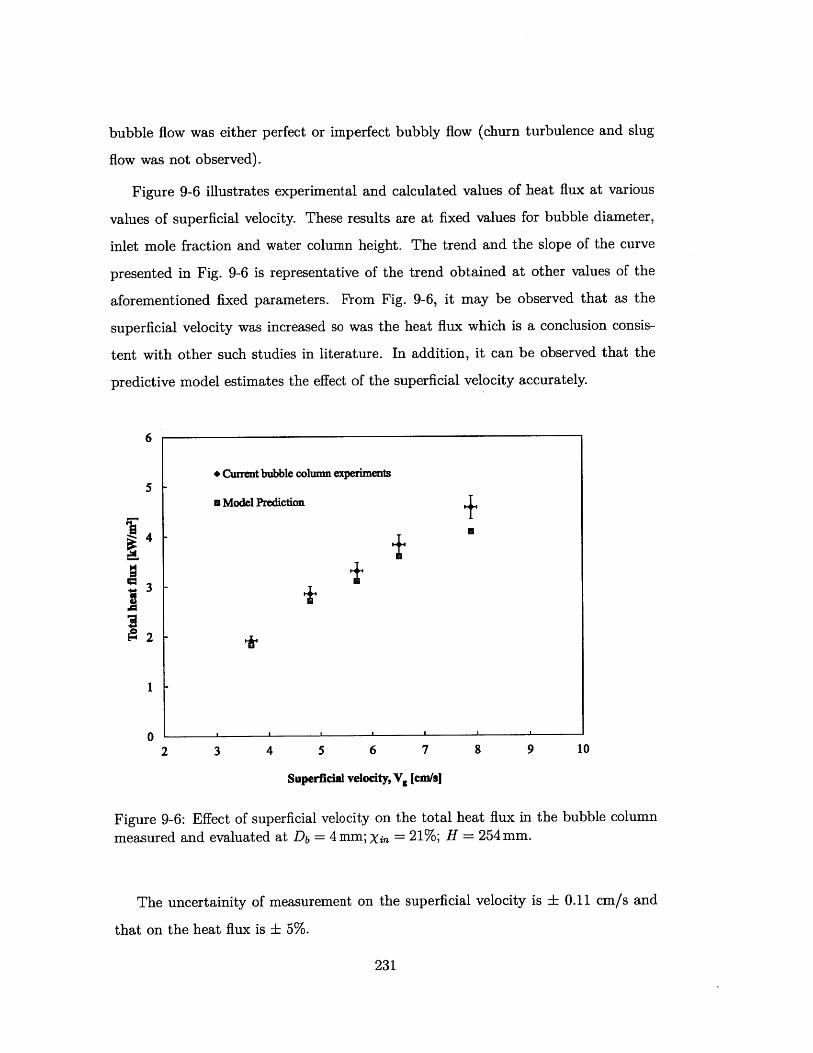
bubble flow was either perfect or imperfect bubbly flow (churn turbulence and slug
flow was not observed).
Figure 9-6 illustrates experimental and calculated values of heat flux at various
values of superficial velocity. These results are at fixed values for bubble diameter,
inlet mole fraction and water column height. The trend and the slope of the curve
presented in Fig. 9-6 is representative of the trend obtained at other values of the
aforementioned fixed parameters. From Fig. 9-6, it may be observed that as the
superficial velocity was increased so was the heat flux which is a conclusion consis-
tent with other such studies in literature. In addition, it can be observed that the
predictive model estimates the effect of the superficial velocity accurately.
6
* Current bubble column experiments5
n Model Prediction
4
3
-2
1-
0 ' '
2 3 4 5 6 7 8 9 10
Superficial velocity, Vg [cm/s]
Figure 9-6: Effect of superficial velocity on the total heat flux in the
measured and evaluated at Db = 4 mm; Xin = 21%; H = 254 mm.
bubble column
The uncertainity of measurement on the superficial velocity is ± 0.11 cm/s and
that on the heat flux is t 5%.
231

9.3.2 Effect of bubble diameter
In the literature, no consensus is evident on the effect of bubble diameter on transport
coefficients in bubble columns. While on the one hand some researchers have reported
that bubble properties (including bubble diameter) affect the mass transfer coefficient
greatly [160-1621, on the other hand Deckwer [128] has suggested that there is no
evidence of the effect of bubble diameter on heat transfer to immersed surfaces. Also,
the effect of bubble diameter on simulatenous heat and mass transfer has not been
investigated yet.
Our experiments and modeling show (see Fig. 9-7) that there is a relatively minor
but discernible effect of bubble diameter on the total heat flux exchanged in a bubble
column dehumidifier. The heat flux is found to decrease with an increase in bubble
diameter. This result is found to be consistent at other values of the fixed parameters
(superficial velocity, inlet mole fraction and liquid height) as well. It is to be noted
that the predictive model proposed in Sec. 9.1 predicts the trend in Fig. 9-7 to a good
degree of accuracy.
9.3.3 Effect of inlet mole fraction
In steam condensers with a small amount of non-condensable gas present (< 10%
by mole) the inlet mole fraction of vapor has been reported to have a very sharp
effect on the heat transfer coefficient [117, 121]. As mentioned earlier in this chapter,
experimental data in the literature suggests that the effect is almost quadratic in
nature. In this section, we investigate the effect of the same parameter in a bubble
column dehumidifier.
The inlet mole fraction of vapor is varied from 10% to 25% (3.6 to 9 times lower
than regular condensers) at fixed values of superficial velocity, bubble diameter and
liquid height. Fig. 9-8 illustrates the experimental and modeling results for the same.
A strong effect of the mole fraction is seen, as is also the case in steam condensers.
From our experiments, we observe that the effect is more linear than quadratic (in
the studied range). Hence, the presence of non-condensable gas is affecting the heat
232
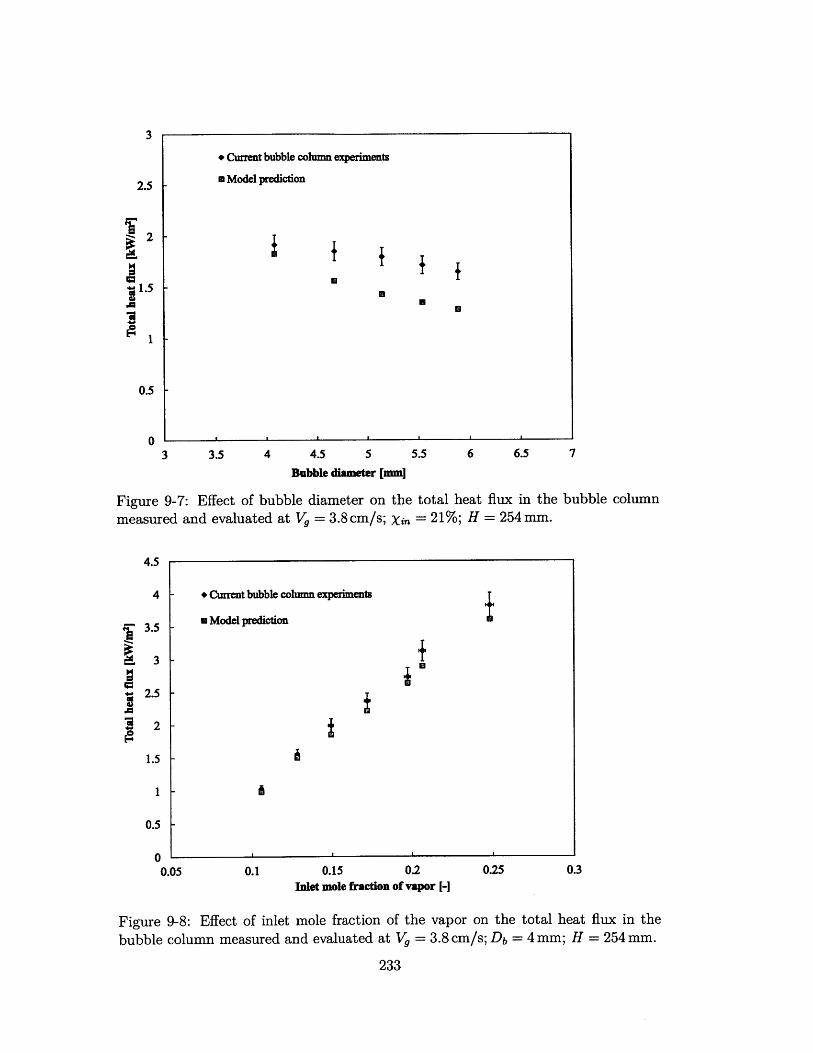
3 3.5 4 4.5 5
Bubble diameter [mm]
55 6 6.5 7
Figure 9-7: Effect of bubble diameter on the total heat flux in themeasured and evaluated at Vg = 3.8 cm/s; Xin = 21%; H = 254 mm.
4.5
4 - * Current bubble column experiments
3.5 - m Model prediction
3
2.5
S 2-
1.5
1 -
0.5-
0 L0.05 0.1 0.15 0.2 0.25
Inlet mole fraction of vapor H
Figure 9-8: Effect of inlet mole fraction of the vapor on the total heat flux in the
bubble column measured and evaluated at V = 3.8 cm/s; Db = 4 mm; H = 254 mm.
233
* Current bubble column experiments
* Model prediction
3
2.5
2
1.5
PC
1
0.5
0
bubble column
0.3

transfer to a much lesser degree than in the film condensation situations of a standard
dehumidifier. This demonstrates the superiority of the bubble column dehumidifier
[32]. This observation is further discussed in Sec. 9.4.2. Figure 9-8 also illustrates
that the predictive model predicts the effect of inlet mole fraction very accurately.
The uncertainity of measurement on the mole fraction is ± 1%.
9.3.4 Effect of liquid column height
Regular dehumidifiers and steam condensers can be designed to have minimal pressure
drop (as low as a few hundred Pa). In bubble columns, a large percentage of the
pressure drop that occurs on the vapor side is due to the hydrostatic head of the
liquid in the column that the air-vapor mixture has to overcome. Thus, it is desirable
to keep the liquid height to a minimum value. The cooling coils must remain fully
immersed in the liquid pool, and hence, the minimum liquid height should be that
which just immerses the coils.
Figure 9-9 illustrates that there is no effect of reducing the liquid height from 10"
(254 mm) to 6" (152.4 mm - the minimum height at which the coil was fully immersed).
This can be understood by considering the length scale of the liquid circulation, which
we have postulated as the intergral length of turbulence. As explained earlier in
Sec. 9.1.1, the integral length is very close to the bubble diameter. Hence, the scale
at which the circulation happens in the liquid is of the order of a millimeter which
is two orders of magnitude lower than the liquid height. Therefore, unless the liquid
height is reduced to a few millimeters, it will not have an effect on the bubble column
performance. This is a very significant consideration when designing bubble column
dehumidifiers for systems which cannot take large gas side pressure drops, such as
the humidification dehumidification desalination (HDH) system [18, 19].
9.3.5 Comparison of model and experiments
We have seen that the predictive model estimates the effect of bubble diameter,
superficial velocity and inlet mole fraction of vapor on heat flux exchanged in a
234
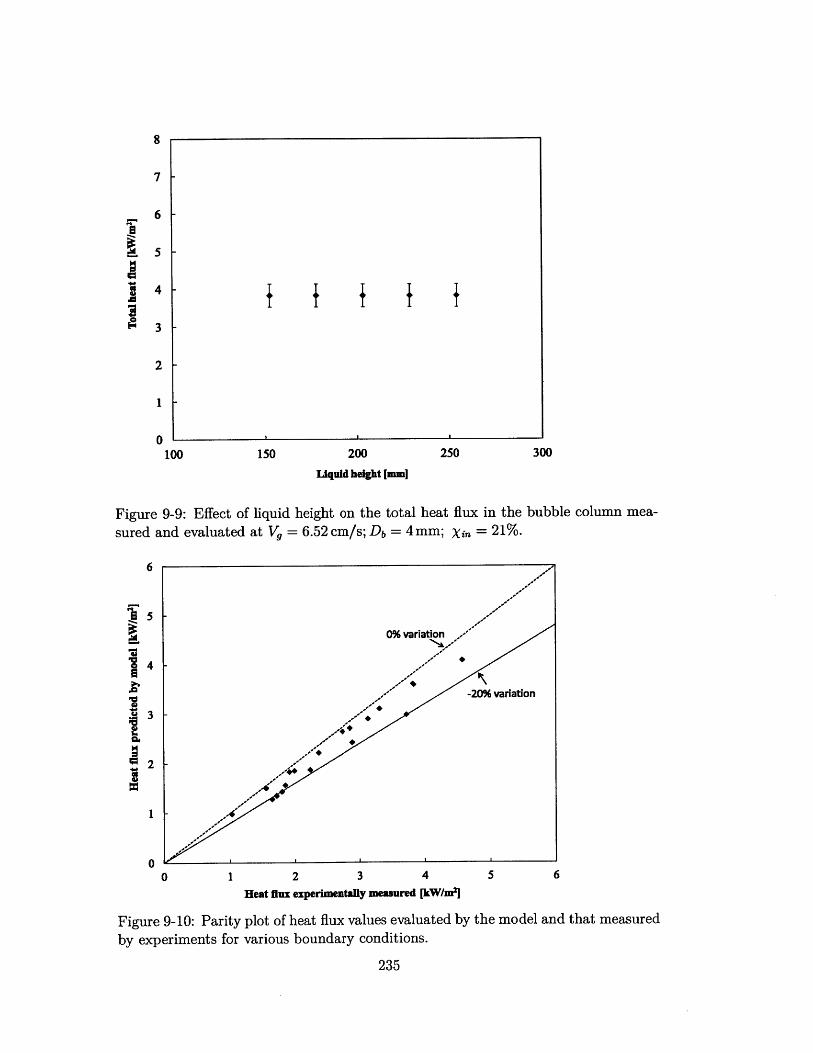
200
Uquid height [mnI
Figure 9-9: Effect of liquid height on the total heat flux in the
sured and evaluated at V = 6.52 cm/s; Db = 4 mm; Xin = 21%.
6
5
4
3
2
1
00 1 2 3 4 5
Heat flux experimentally measured [kW/mi]
Figure 9-10: Parity plot of heat flux values evaluated by the modelby experiments for various boundary conditions.
235
bubble column mea-
6
and that measured
8
7
6
5
4
3
U0
'U I f f
21-
0-100 150 250 300

bubble column dehumidifier accurately. In Fig. 9-10 we present a comparison of
the experimental data and the model for various boundary conditions in a parity
plot. There is excellent agreement (within -20%), and as per our expectation, the
model consistently underpredicts the heat flux. This is because we approximated
the boundary layer inside the bubble to be of the order of the bubble radius itself
(Sec. 9.1.2), which is clearly an overestimation of the associated thermal resistance.
9.3.6 Effect of bubble-on-coil impact
In consideration of the effect of all of the different parameters (described in the
previous paragraphs), bubble-on-coil impact was avoided during experimentation (see
Sec. 9.2) and neglected in the predictive model. In this section, we study the effect of
impact. Figure 9-11 clearly shows the difference in bubble rise path in cases without
and with bubble-coil impact. Predictably, this has a large effect on the heat rate in
the device.
Figure 9-12 illustrates this effect. It may be observed that impact raises the heat
transfer rates to significantly higher values. Thus, in case of the serpentine coils, a
major portion of the heat communicated between the air-vapor bubbles and the coils
is through direct impact between the two. Hence, to obtain higher heat transfer rates
it is desirable to design coils to have maximum impact.
9.4 Effect of multi-staging
In a HDH system, the isothermal nature of the column liquid in the bubble column
dehumidifier reduces the temperature to which seawater can be preheated to (in the
coils). This limits the energy effectiveness of the device (for definition of energy
effectiveness, see Chapter 3). A low effectiveness in the dehumidifier, reduces the
HDH system performance significantly (see Chapter 4). In this section, we detail an
innovation which increases the energy effectiveness of these devices.
A schematic diagram of a multi-stage bubble column is shown in Fig. 9-13. In
this device, the moist air is sparged successively from the bottom-most (first) stage
236

Figure 9-11: Bubble rise path in circular (left) and serpentine (right) coils.
9
8 - without iTpctowith impact +
7
6- +5+
3 -
2 -
1-
02 3 4 5 6 7 8
Superficial velocity, V, [cmls]
Figure 9-12: Effect of bubble-on-coil impact.
237
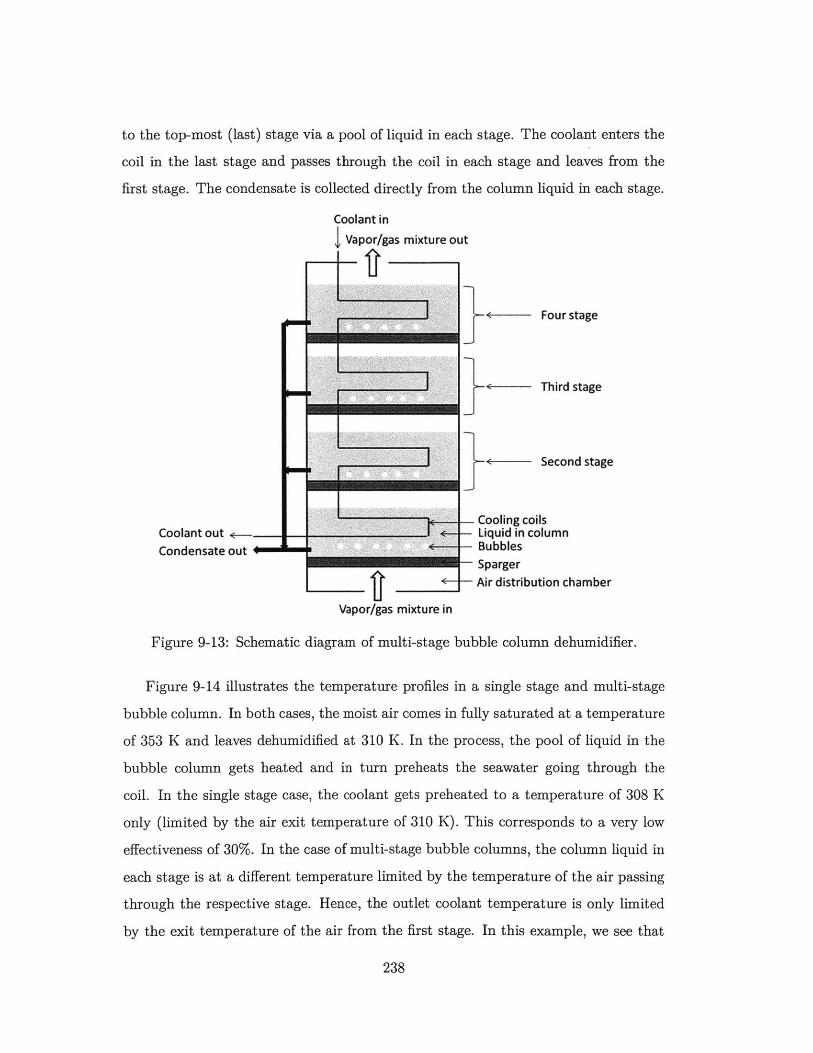
to the top-most (last) stage via a pool of liquid in each stage. The coolant enters the
coil in the last stage and passes through the coil in each stage and leaves from the
first stage. The condensate is collected directly from the column liquid in each stage.
Coolant in
Vapor/gas mixture out
Four stage
Third stage
1 - Second stage
Cooling coilsCoolant out . + -Liquid in columnCondensate out Bubbles
- SpargerAir distribution chamber
Vapor/gas mixture in
Figure 9-13: Schematic diagram of multi-stage bubble column dehumidifier.
Figure 9-14 illustrates the temperature profiles in a single stage and multi-stage
bubble column. In both cases, the moist air comes in fully saturated at a temperature
of 353 K and leaves dehumidified at 310 K. In the process, the pool of liquid in the
bubble column gets heated and in turn preheats the seawater going through the
coil. In the single stage case, the coolant gets preheated to a temperature of 308 K
only (limited by the air exit temperature of 310 K). This corresponds to a very low
effectiveness of 30%. In the case of multi-stage bubble columns, the column liquid in
each stage is at a different temperature limited by the temperature of the air passing
through the respective stage. Hence, the outlet coolant temperature is only limited
by the exit temperature of the air from the first stage. In this example, we see that
238
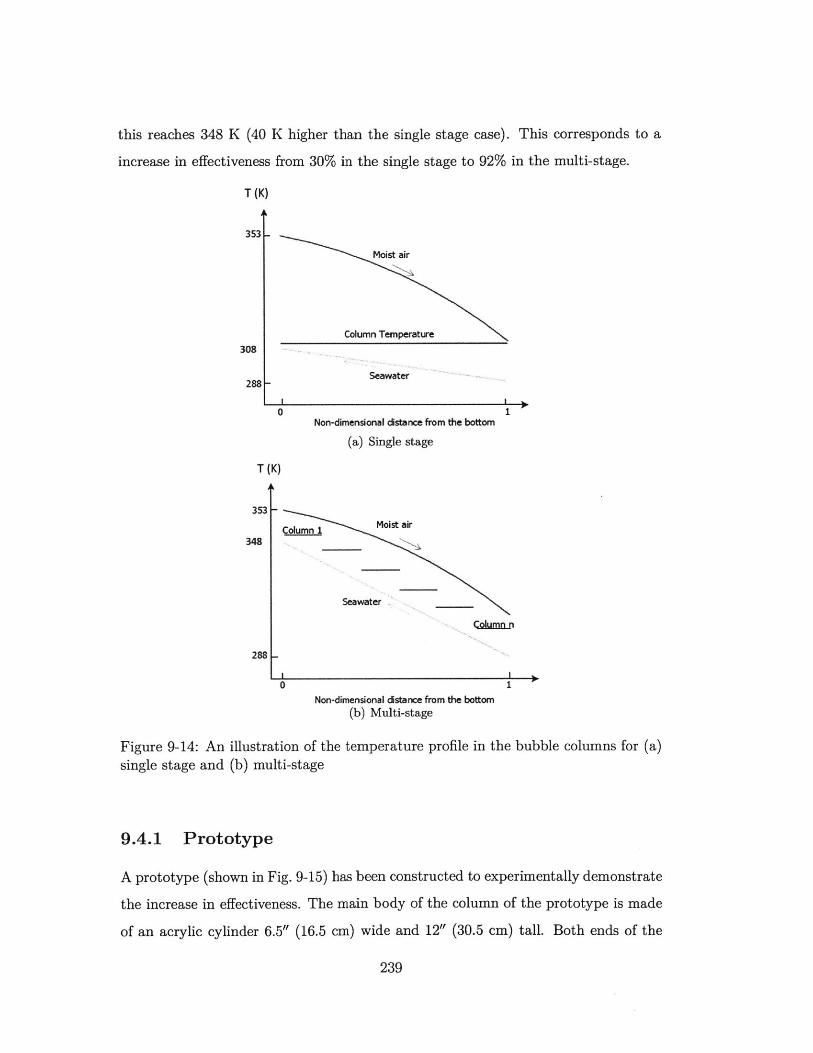
this reaches 348 K (40 K higher than the single stage case). This corresponds to a
increase in effectiveness from 30% in the single stage to 92% in the multi-stage.
T (K)
353
308
288
Moist air
Seawater
0Non-dimensional cistance from the bottom
(a) Single stage
1'
T (K)
Column 1 Moist air
Seawater .
Coumnin
10Non-dimensional distance from the bottom
(b) Multi-stage
Figure 9-14: An illustration of the temperature profile in the
single stage and (b) multi-stage
bubble columns for (a)
9.4.1 Prototype
A prototype (shown in Fig. 9-15) has been constructed to experimentally demonstrate
the increase in effectiveness. The main body of the column of the prototype is made
of an acrylic cylinder 6.5" (16.5 cm) wide and 12" (30.5 cm) tall. Both ends of the
239
353
348
288
I~ I
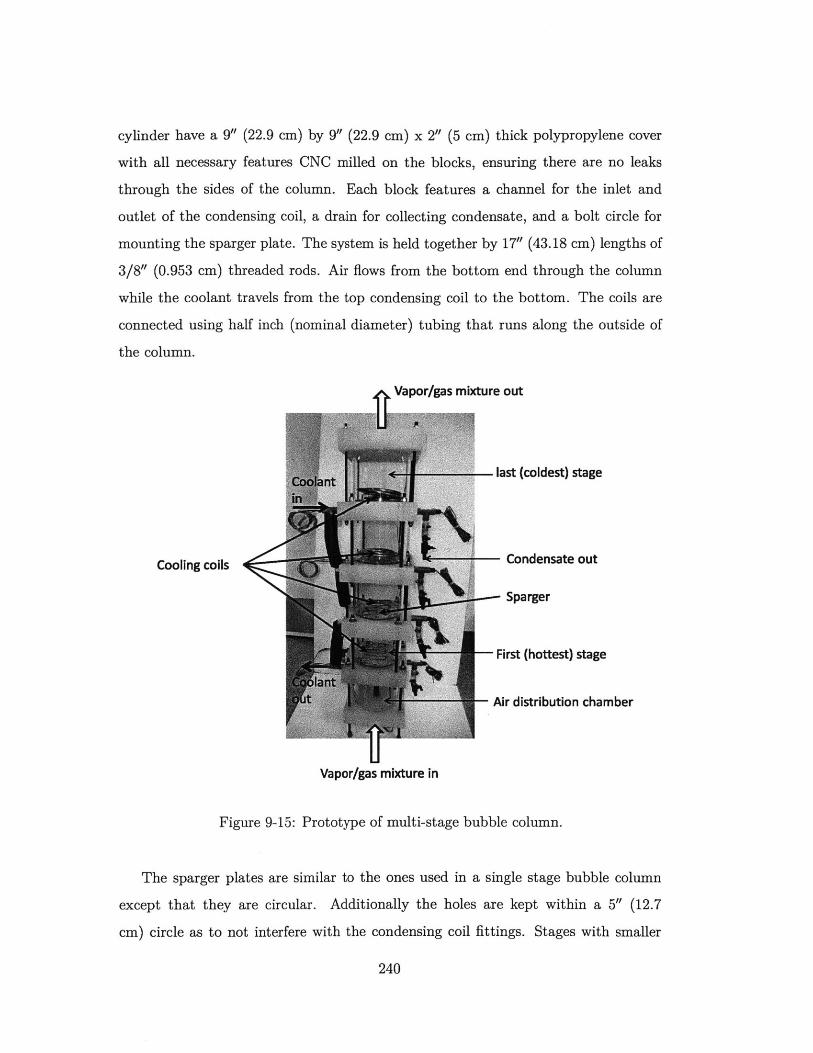
cylinder have a 9" (22.9 cm) by 9" (22.9 cm) x 2" (5 cm) thick polypropylene cover
with all necessary features CNC milled on the blocks, ensuring there are no leaks
through the sides of the column. Each block features a channel for the inlet and
outlet of the condensing coil, a drain for collecting condensate, and a bolt circle for
mounting the sparger plate. The system is held together by 17" (43.18 cm) lengths of
3/8" (0.953 cm) threaded rods. Air flows from the bottom end through the column
while the coolant travels from the top condensing coil to the bottom. The coils are
connected using half inch (nominal diameter) tubing that runs along the outside of
the column.
Vapor/gas mixture out
last (coldest) stage
Cooling coils Condensate out
Sparger
First (hottest) stage
Air distribution chamber
Vapor/gas mixture in
Figure 9-15: Prototype of multi-stage bubble column.
The sparger plates are similar to the ones used in a single stage bubble column
except that they are circular. Additionally the holes are kept within a 5" (12.7
cm) circle as to not interfere with the condensing coil fittings. Stages with smaller
240

condensing coils use sparger plates with greater number of holes because their column
supports a lower liquid pool height. Copper coils were used to pass the coolant
through. Table 9.2 shows the dimensions of coils. Setup A is a single stage, B is two
stage, and C is three stage. In setup B and C, the first stage has the smallest coil
because otherwise all heat transfer will occur in the first stage and make the device
inefficient. Also, note that stage 2 and stage 3 coils use a spiral design (as seen in
Fig. 9-15). Further details of the prototype construction is given by Lam [163]. The
setup was instrumented using the same sensors used for the single stage experiments.
The total uncertainty on the effectiveness of the device is small (< 1 %).
Table 9.2: Coil design for multi-stage prototypeSetup Stage O.D. [inch] L [inch] Type
A 1 1/4 50 Serpentine
B 1 1/4 28 SerpentineB 2 3/8 60 CircularC 1 1/4 16 SerpentineC 2 1/4 32 CircularC 3 3/8 40 Circular
Figure 9-16 illustrates the increase in effectiveness of the device with multistaging.
The data presented here is for an air inlet temperature of 65*C, inlet relative humidity
of 100%, a water inlet temperature of 25*C and a water-to-air mass flow rate ratio
of 2.45. It can be seen that the energy effectiveness of the device is increased from
around 54% at single stage to about 90% for the three stage device. This can be
further increased with a fourth stage. Work is progress in this regard. Further,
owing to the higher superficial velocity (because of smaller column diameter) than in
the single stage experiment reported in previous sections, the heat fluxes were much
higher (up to 25 kW/m 2). Also, the total gas side pressure drop of this device was
800 Pa.
241

+ Prototype
SOA dehumidifier
I - II
1 2 3
Number of stages, N [-]
Figure 9-16: Effect of multistaging the bubble column on energy effectiveness of the
device.
242
1
0.9
0.8
0.7
0.6
0.5
PO
PC
IPC
0
U
0.4
0.3
0.2
0.1
00

9.4.2 Comparison with existing devices
A state-of-the-art dehumidifier (which operates in the film condensation regime) pro-
cured from George Fischer LLC was found to yield a maximum heat flux of 1.8 kW/m 2
(as per the design specification) compared to a maximum of 25 kW/m 2 obtained in
the bubble column dehumidifier, demonstrating the superior performance of the novel
device. This comparison was carried out at the same inlet conditions for the vapor-air
mixture and the coolant streams. Also, the streamwise temperature differences were
similar in both the cases. Further, the energy effectiveness of a three-stage bubble col-
umn dehumidifier was found to be similar to the conventional dehumidifier mentioned
here.
9.5 Chapter conclusions
This chapter has proposed a novel bubble column dehumidifier for high rates in con-
densation of moist air mixtures with up to 90% non-condensables in them. The main
conclusions are as follows.
1. Bubble column dehumidifiers have an order of magnitude better performance
than existing state-of-the-art dehumidifiers operating in the film condensation
regime.
2. The bubble column should be designed for high superficial velocity, low bubble
diameter, and maximum bubble-on-coil impact. In order to minimize pressure
drop, the liquid height can be kept to a minimum such that the coil is entirely
submerged in the liquid. This is possible because the height has no effect on
the performance of the device if it is greater than the bubble diameter (~4-6
mm).
3. The inlet mole fraction of the vapor is found to have a weaker effect on the
performance of the device than in a regular dehumidifier (in which the perfor-
mance deteriorates quadratically with the vapor mole fraction at low values of
mole fraction).
243

4. A physics-based predictive heat transfer model based on a thermal resistance
circuit to estimate heat flux and temperature profiles in the bubble column
condenser has been developed. The experimental data is underpredicted by
a maximum of 20%. The model accurately predicts the effects of the various
parameters on heat flux without incorporating any adjustable parameters.
5. A three-stage bubble column with a manageable air side pressure drop of < 1
kPa, an high effectiveness of 92% and a very high heat rate of 25 kW/m 2 was
constructed at a fraction of the cost of a regular dehumidifier operating in the
film condensation regime.
Implementation of the novel dehumidifier described in this chapter for application in
HDH systems will reduce the capital cost of the system leading to a reduced cost of
water production. The volume is reduced to 1/ 18th of the regular dehumidifier.
244

Chapter 10
Conclusions
Small-scale desalination systems can contribute to solution of the global water scarcity
problem by facilitating community-level, easily-scalable water supply. The humidifi-
cation dehumidification (HDH) technology is a carrier-gas-based thermal desalination
technique ideal as a small-scale system. However, existing state-of-the-art HDH sys-
tems have a high cost of water production (about 30 $/m 3 of pure water produced).
This thesis has made fundamental contributions to the thermal design of simultane-
ous heat and mass exchange (HME) devices and the HDH systems which can lead
to afforable HDH systems. These contributions are summarized into two classes: (1)
component design; and (2) system design.
10.1 Component design
1. A new definition for energy effectiveness, which can be applied to all types
of HMEs, has been developed. It is based on the total enthalpy change of
each fluid stream participating in the transfer processes. This parameter has
enabled control volume based modeling of the humidifier and the dehumidifier
of the HDH system.
2. Further, a novel "enthalpy pinch" has been defined for combined heat and mass
exchange devices, analogous to the temperature pinch traditionally defined for
245
heat exchangers. Enthalpy pinch (T) combines stream-to-stream temperature
and humidity ratio differences, and it is directly related to the effectiveness of
the device. This parameter has enabled thermal designs of HME devices and
HDH systems with continuous or discrete extractions and injections.
3. A new non-dimensional parameter called the 'modified heat capacity rate ratio'
(HCR) has been shown to be the linchpin in thermal design of HME devices
(including the humidifier and the dehumidifier). The thermally balanced state
for HME devices (with minimum entropy generation) has been found to be
at a HCR of unity for both on-design (fixed-hardware) and off-design (fixed-
performance) conditions. The closed form equations for zero 'remanent' irre-
versibility designs with continuous mass extraction or injection in HME devices
have been reported in this thesis.
4. A pilot scale packed-bed humidifier unit with an enthalpy pinch of 14.8 kJ/kg
dry air and a temperature pinch of 2.8*C has been built, and used to experi-
mentally validate the aforementioned theory for HME devices.
5. Existing dehumidifiers which operate in the film condensation regime are found
to have extremely low heat and mass transfer rates. A novel multi-stage bubble
column dehumidifier with a heat rate of 25 kW/m 2 (an order of magnitude
higher than regular dehumidifiers), an effectiveness of 92% at a pressure drop
of less of < 1 kPa has been built at MIT. These devices can be constructed at
a fraction of the cost of existing dehumidifiers.
10.2 HDH system design
1. Various HDH systems were analyzed in detail, and it was found that the op-
timum energy performance (GOR) of these systems occurs at a modified heat
capacity rate ratio of unity for either the humidifier or the dehumidifier de-
pending on the mode of energy input. In water heated systems, the optimum
occured at HCR=1 for the dehumidifier. This was shown both experimentally
246

and using on-design simulations. Further, on-design models showed that for
mechanical compression driven, varied pressure systems the optimum occurs at
a HCR =1 for the humidifier.
2. The aforementioned understanding was applied to develop thermal design al-
gorithms for thermodynamic balancing in HDH systems with mass extractions
and injections. For an HDH system with 'infinitely' sized ideal components
(zero enthalpy pinch) and continuous mass extraction and injection, the GOR
was found to be about 89% of the reversible limit. This is the upper limit of
the HDH system performance. Also, it is found that thermodynamic balanc-
ing is effective in HDH only when the HME devices have an appropriately low
enthalpy pinch (T < 27 kJ/kg dry air).
3. A pilot-scale HDH system producing a maximum of 700 liters of water a day
was constructed and used to validate the aforementioned algorithms. It was
found that this system had a peak GOR of 4 with a single air extraction and
injection from the humidifier to the dehumidifier.
4. Energy consumption in HDH systems can be further reduced by treating pres-
sure as a variable parameter. The concept of mechanical compression driven,
sub-atmospheric pressure HDH systems (with the humidifier at a lower pres-
sure than the dehumidifier) which follow a reverse-Brayton-like desalination
cycle was developed. This system has been theoretically demonstrated using ef-
fectiveness based on-design models to operate at a thermal energy consumption
of less than 100 kWh per cubic meter (GOR = 6). Pilot scale experiments are
being designed for construction in Saudi Arabia based on the aforementioned
findings.
5. Further, designs of thermal compression driven HDH systems hybridized with
RO were developed. It was found that these systems have a high GOR of up
to 20. More research needs to be done to investigate the applicability of these
steam driven units to community level water treatment.
247

All the science developed in this thesis can make HDH systems afforable' for
application in small scale drinking water systems in the developing world.
'The water cost was estimated at < 5 $/m3. See Appendix D.
248

References
[1] "Water for food, water for life: A comprehensive assessment of water manage-ment," International Water Management Institute, 2007.
[2] A. Twort, D. Rathnayaka, and M. Brandt, Water Supply. IWA Publishing,2000.
[3] "Water for people, water for life, executive summary," tech. rep., The United
Nations World Water Development Report, 2003.
[4] "The millennium development goals report," tech. rep., United Nations, New
York, 2008.
[5] A. Hammond, "The next 4 billion: Market size and business strategy at the
base of the pyramid," tech. rep., Published by World Resource Institute, 2007.
[6] B. Sauvet-Goichon, "Ashkelon desalination plant - a successful challenge," De-
salination, vol. 203, pp. 75-81, 2007.
[7] C. K. Prahalad and A. Hammond, "Serving the world's poor profitably," Har-
vard Business Review, pp. 4-11, 2002.
[8] J. Fawell, K. Bailey, J. Chilton, E. Dahi, L. Fewtrell, and Y. Magara, "Fluoridein drinking-water," in WHO Drinking-water Quality Series, IWA Publishing,
London, 2006.
[9] B. Bhuyan, "A study on arsenic and iron contamination of groundwater in three
development blocks of lakhimpur district, assam, india," Report and Opinion,vol. 2 (6), pp. 82-87, 2010.
[10] T. Appello, "Arsenic in ground water a global problem," in Proceedings of Sem-
inar Utrecht, Netherlands National Committee of IAH, J. P. Heedreik, 2006.
[11] A. Annapoorania, A. Murugesan, Ramu, and N. G. Renganathan, "Ground-water quality assessment in coastal regions of chennai city, tamil nadu, india
U case study," in Proceedings of India Water Week 2012 - Water, Energy and
Food Security, 10-14 April 2012, New Delhi.
[12] H. Strathmann, Ion-Exchange Membrane Separation Processes. Elsevier, NewYork, 2004.
249

[13] F. F. Alshareff, "Investment opportunities in the desalination sector of the king-
dom of saudi arabia resulting from privatization and restructuring," in Proceed-
ings of Saudi Water and Power Forum, Jeddah, 2008.
[14] A. M. Bilton, L. C. Kelley, and S. Dubowsky, "Photovoltaic reverse osmosis -feasibility and a pathway to develop technology." In press.
[15] G. N. Tiwari, H. N. Singh, and R. Tripathi, "Present status of solar distillation,"
Solar Energy, vol. 75(5), pp. 367-73, 2003.
[16] H. E. S. Fath, "Solar distillation: a promising alternative for water provision
with free energy, simple technology and a clean environment," Desalination,vol. 116, pp. 45-56, 1998.
[17] T. A. Lawand, "Systems for solar distillation," tech. rep., Brace Research In-
stitute., Report No. R 115, Sep. 1975.
[18] G. P. Narayan, M. H. Sharqawy, E. K. Summers, J. H. Lienhard V, S. M. Zubair,and M. A. Antar, "The potential of solar-driven humidification-dehumidificationdesalination for small-scale decentralized water production," Renewable and
Sustainable Energy Reviews, vol. 14, pp. 1187-1201, 2010.
[19] G. P. Narayan, M. H. Sharqawy, J. H. Lienhard V, and S. M. Zubair, "Thermo-
dynamic analysis of humidification dehumidification desalination cycles," De-
salination and Water Treatment, vol. 16, pp. 339-353, 2010.
[20] G. P. Narayan, K. H. Mistry, M. H. Sharqawy, S. M. Zubair, and J. H. Lien-
hard V, "Energy effectiveness of simultaneous heat and mass exchange devices,"
Frontiers in Heat and Mass Transfer, vol. 1, pp. 1-13, 2010.
[21] G. P. Narayan, J. H. Lienhard V, and S. M. Zubair, "Entropy generation min-
imization of combined heat and mass transfer devices," International Journal
of Thermal Sciences, vol. 49, pp. 2057-66, 2010.
[22] G. P. Narayan, R. K. McGovern, S. M. Zubair, and J. H. Lienhard V, "High-
temperature steam-driven varied-pressure humidification-dehumidification sys-
tem coupled with reverse osmosis for energy-efficient seawater desalination,"
Energy, vol. 37(1), pp. 482-93, 2012.
[23] G. P. Narayan, K. M. Chehayeb, R. K. McGovern, G. P. Thiel, J. H. Lien-
hard V, and S. M. Zubair, "Thermodynamic balancing of the humidification
dehumidification desalination system by mass extraction and injection." Under
review in International Journal of Heat and Mass Transfer.
[24] G. P. Narayan, M. G. S. John, J. H. Lienhard V, and S. M. Zubair, "Thermal
design of the humidification dehumidification desalination system: an experi-
mental investigation." Under review in International Journal of Heat and Mass
Transfer.
250

[25] G. P. Narayan, M. H. Sharqawy, S. Lam, and J. H. Lienhard V, "Bubble columns
for condensation at high concentrations of non-condensable gas: heat transfer
model and experiments." Submitted for review, 2012.
[26] G. P. Narayan, R. K. McGovern, S. M. Zubair, and J. H. Lienhard V, "Vari-
able pressure humidification dehumidification desalination," in Proceedings of
ASME/JSME 8th Thermal Engineering Joint conference, Hawaii, March 13-17
2011.
[27] G. P. Narayan, R. K. McGovern, S. M. Zubair, and J. H. Lienhard V, "Helium
as carrier gas in humidification dehumidification desalination," in Proceedings of
ASME International Mechanical Engineering Congress & Exposition, Denver,USA., November 11-17, 2011.
[28] G. Narayan, R. McGovern, G. Thiel, 3. Miller, M. Sharqawy, S. Zubair, M. An-
tar, and 3. L. V, "Status of humidification dehumidification desalination tech-
nology," in Proceedings of World Water Congress, International Desalination
Association, Perth, Australia, 2011. Received Best Paper in Thermal De-
salination.
[29] M. H. Sharqawy, G. P. Narayan, 3. H. Lienhard V, and S. M. Zubair, "Wa-
ter separation under reduced pressure," 2012. US Patent filing no. USSN12/554,726.
[30] G. P. Narayan, M. H. Sharqawy, J. H. Lienhard V, and S. M. Zubair, "Water
separation under varied pressure," 2012. US Patent filing no. USSN 12/573,221.
[31] G. P. Narayan, K. H. Mistry, 3. H. Lienhard V, and S. M. Zubair, "High-
efficiency thermal-energy-driven water purification system." Filed in Feb 2011.
US Patent filing no. USSN 13/028,170.
[32] G. P. Narayan, G. P. Thiel, R. K. McGovern, M. H. Sharaqawy, and 3. H.
Lienhard V, "Vapor-mixture condenser." US Patent filing no. USSN 13/241,907.
[33] G. P. Narayan, K. M. Chehayeb, G. P. Thiel, R. K. McGovern, S. M. Zubair,and J. H. Lienhard V, "Thermodynamic balancing of combined heat and mass
exchange devices." US Patent filing no. 13/550,094.
[34] Y. Li, J. F. Klausner, and R. Mei, "Performance characteristics of the diffusion
driven desalination process," Desalination, vol. 196, pp. 188-96, 2006.
[35] S. Al-Hallaj, M. M. Farid, and A. R. Tamimi, "Solar desalination with
humidification-dehumidification cycle: performance of the unit," Desalination,vol. 120, pp. 273-280, 1998.
[36] H. B. Bacha, T. Damak, and M. Bouzguenda, "Experimental validation of
the distillation module of a desalination station using the smcec principle,"
Renewable Energy, vol. 28, pp. 2335-54, 2003.
251

[37] M. M. Farid and A. W. Al-Hajaj, "Solar desalination with humidification-dehumidification cycle," Desalination, vol. 106, pp. 427-429, 1996.
[38] H. Garg, R. Adhikari, and R. Kumar, "Experimental design and computer simu-lation of multi-effect humidification (meh) - dehumidification solar distillation,"
Desalination,, vol. 153, pp. 81-86, 2002.
[39] A. Nafey, H. Fath, S. El-Helaby, and A. Soliman, "Solar desalination usinghumidificationUdehumidification processes. part ii. an experimental investiga-tion," Energy Conversion and Management, vol. 45(7-8), pp. 1263-77, 2004.
[40] N. K. Nawayseh, M. M. Farid, S. Al-Hajaj, and A. R.Tamimi, "Solar desali-nation based on humidification process-i evaluating the heat and mass transfercoefficients," Energy Conversion and Management, vol. 40, pp. 1423-49, 1999.
[41] M. Khedr, "Techno-economic investigation of an air humidification-dehumidification desalination process," Chemical Engineering Technology,vol. 16, pp. 270-4, 1993.
[42] G. Al-Enezi, H. Ettouney, and N. Fawzi, "Low temperature humidificationdehumidification desalination process," Energy Conversion and Management,vol. 47, pp. 470-84, 2006.
[43] Y. J. Dai and H. Zhang, "Experimental investigation of a solar desalination unit
with humidification and dehumidification," Desalination, vol. 130, pp. 169-75,2000.
[44] E. Chafik, "A new type of seawater desalination plants using solar energy,"
Desalination, vol. 156, pp. 333-348, 2003.
[45] M. Ben Amara, I. Houcine, A. Guizani, and M. Maalej, "Experimental studyof a multiple-effect humidification solar desalination technique," Desalination,vol. 170, pp. 209-21, 2004.
[46] J. Orfi, M. Laplante, H. Marmouch, N. Galanis, B. Benhamou, S. B. Nasral-
lah, and C. Nguyen, "Experimental and theoretical study of a humidification
dehumidification water desalination system using solar energy," Desalination,vol. 168, p. 151, 2004.
[47] C. Yamali and I. Solmus, "A solar desalination system using humidificationUde-humidification process: experimental study and comparison with the theoretical
results," Desalination, vol. 220, pp. 538-51, 2008.
[48] I. Houcine, M. B. Amara, A. Guizani, and M. Maalej, "Pilot plant testing ofa new solar desalination process by a multiple-effect-humidification technique,"Desalination, vol. 196, pp. 105-124, 2006.
252

[49] H. Mller-Holst, Solar thermal desalination using the Multiple Effect Humid-
ification (MEH) method in Solar Desalination for the 21st Century, ch. 15,pp. 215-25. NATO Security through Science Series, Springer, Dordrecht, 2007.
[50] H. Muller-Holst, Mehrfacheffekt-Feuchtluftdestillation bei Umgebungsdruck -Verfahrensoptimierung und Anwendungen. PhD thesis, Technische UniversitstBerlin, 2002.
[51] M. Zamen, S. M. Soufari, and M. Amidpour, "Improvement of solar
humdification-dehumidification desalination using multi-stage process," in Pro-
ceedings of 14th International Conference on Process Integration, Modelling and
Optimisation for Energy Saving and Pollution Reduction, 2011.
[52] M. Zamen, S. M. Soufari, and M. Amidpour, "Improvement of solar
humdification-dehumidification desalination using multi-stage process," Chem-ical Engineering Transactions, vol. 25, pp. 1091-1096, 2011.
[53] T. Schlickum, "Vorrichtung zum trennen einer flissigkeit von den in ihr gel6stenfremdstoffe," 2007.
[54] S. Hou, "Two-stage solar multi-effect humidification dehumidification desali-nation process plotted from pinch analysis," Desalination, vol. 222, p. 572U8,2008.
[551 T. Brendel, Solare Meewasserental sungsanlagen mit mehrstufiger verdungtung.
PhD thesis, Ruhr University Bochum, 2003.
[561 T. Brendel, "Process to distil and desalinate water in contra-flow evaporationhumidifier unit with progressive removal of evaporated fluid," 2003. German
Patent #DE10215079 (Al).
[57] M. A. Younis, M. A. Darwish, and F. Juwayhel, "Experimental and theoreti-cal study of a humidification-dehumidification desalting system," Desalination,vol. 94, pp. 11-24, 1993.
[58] R. K. McGovern, G. P. Thiel, G. P. Narayan, S. M. Zubair, and J. H. Lienhard
V, "Evaluation of the performance limits of humidification dehumidification
desalination systems via a saturation curve analysis," Applied Energy, July 2012.
In press.
[59] K. Bourouni, M. Chaibi, and L. Tadrist, "Water desalination by humidificationand dehumidification of air: state of the art," Desalination, vol. 137, p. 167U176,2001.
[60] W. Grune, T. Thompson, and R. Collins, "New applications of thermodynamicprinciples to solar distillation," in Meeting of the American Society of Mechan-
ical Engineers, no. Paper 61-5A-45, New York, 1961.
253

[611 J. R. Beckmann, "Method and apparatus for simultaneous heat and mass trans-
fer utilizing a carrier gas," 2005.
[621 B. M. Hamieh, J. R. Beckman, and M. D. Ybarra, "Brackish and seawater
desalination using a 20 sq. ft. dewvaporation tower," Desalination, vol. 140,pp. 217-226, 2001.
[63] B. M. Hamieh and J. R. Beckman, "Seawater desalination using dewvapora-tion technique: experimental and enhancement work with economic analysis,"
Desalination, vol. 195, pp. 14-25, 2006.
[64] R. Wahlgren, "Atmospheric water vapor processor designs for potable waterproduction: a review," Water Research, vol. 35, pp. 1-22, 2001.
[65] R. E. Treybal, Mass Transfer Operations. McGraw-Hill, NY, 1980.
[66] F. Kreith and R. F. Bohem, Direct-contact heat transfer. Hemisphere Pub.
Corp., Washington, 1988.
[67] K. Bourouni, R. Martin, and L. Tadrist, "Experimental investigation of
evaporation performances of a desalination prototype using the aero-evapo-condensation process," Desalination, vol. 114, pp. 111-28, 1997.
[68] R. P. Mandi, R. K. Hegde, and S. N. Sinha, "Performance enhancement ofcooling towers in thermal power plants through energy conservation," in Power
Tech IEEE Explorer, (Russia), 2005.
[69] R. Tawney, Z. Khan, and J. Zachary, "Economic and performance evaluation of
heat sink options in combined cycle applications," Journal of Engineering for
Gas Turbines and Power, vol. 127, no. 2, pp. 397-403, 2005.
[70] K. H. Mistry, "Second law analysis and optimization of humidification-dehumidification desalination cycles," Master's thesis, Massachusetts Instituteof Technology, 2010.
[71] N. P. Cheremisinoff and P. N. Cheremisinoff, Cooling towers: selection, design,and practice. Ann Arbor Science Publishers, Ann Arbor, MI, 1981.
[72] G. Nellis and S. Klein, Heat Transfer. Cambridge University Press, 2008.
[73] H. Jaber and R. L. Webb, "Design of Cooling Towers by the Effectiveness-NTUMethod," ASME Journal of Heat Transfer, vol. 111, pp. 837-843, 1989.
[74] A. Bejan, Entropy generation minimization: the method of thermodynamic op-
timization of finite size systems and finite time processes. Boca Raton, FL:
CRC Press, 1996.
[75] J. E. Braun, S. A. Klein, and J. W. Mitchell, "Effectiveness models for cooling
towers and cooling coils," ASHRAE Transactions, vol. 95, pp. 164-174, 1989.
254
[76] J. C. Kloppers and D. G. Kr6ger, "Cooling tower performance evaluvation:
Merkel, poppe and e-ntu method of analysis," ASME Journal of Engineering
for Gas Turbines and Power, vol. 127, pp. 1-6, 2005.
[77] S. A. Klein, "Engineering Equation Solver, Academic Professional, Version 8,"
08 2009.
[78] S. Pruss and W. Wagner, "The iapws formulation 1995 for the thermodynamic
properties of ordinary water substance for general and scientific use," Journal
of Physical and Chemical Reference Data, vol. 31, pp. 387-535, 2002.
[79] E. W. Lemmon, R. T. Jacobsen, S. G. Penoncello, and D. G. Friend, "Thermo-
dynamic Properties of Air and Mixtures of Nitrogen, Argon, and Oxygen From
60 to 2000 K at Pressures to 2000 MPa," Journal of Physical and Chemical
Reference Data, vol. 29, no. 3, pp. 331-385, 2000.
[80] R. W. Hyland and A. Wexler, "Formulations for the Thermodynamic Properties
of Dry Air from 173.15 K to 473.15 K, and of Saturated Moist Air From 173.15
K to 372.15 K, at Pressures to 5 MPa," ASHRAE Transactions, vol. Part 2A
(RP-216), no. 2794, pp. 520-535, 1983b.
[81] D. J. Wessel, ASHRAE Fundamentals Handbook 2001 (SI Edition). American
Society of Heating, Refrigerating, and Air-Conditioning Engineers, 2001.
[82] E. W. Lemmon, M. L. Huber, and M. 0. McLinden, "Nist standard reference
database 23: Reference fluid thermodynamic and transport properties," tech.
rep., REFPROP, Version 8.0 (2007).
[83] R. Zmeureanu and X. Y. Wu, "Energy and exergy performance of residential
heating systems with separate mechanical ventilation," Energy, vol. 32, pp. 187-
195., 2007.
[84] B. A. Qureshi and S. M. Zubair, "A complete model of wet cooling towers with
fouling in fills," Applied Thermal Engineering, vol. 26, pp. 1982-1989, 2006.
[85] Y. J. San, W. M. Worek, and Z. Lavan, "Entropy generation in combined heat
and mass transfer," International Journal of Heat and Mass Transfer, vol. 30,pp. 1359-68, 1987.
[86] C. G. Carrington and Z. F. Sun, "Second law analysis of combined heat and
mass transfer phenomena," International Journal of Heat and Mass Transfer,
vol. 34(11), pp. 2767-73, 1991.
[87] A. Bejan, "The thermodynamic design of heat and mass transfer processes and
devices," International Journal of Heat and Fluid Flow, vol. 8(4), pp. 258-76,1987.
255

[88] G. P. Thiel and J. H. Lienhard V, "Entropy generation in condensation in the
presence of high concentrations of noncondensable gases," International Journal
of Heat and Mass Transfer, vol. 55, pp. 5133-5147, May 2012.
[89] J. E. Hesselgreaves, "Rationalisation of second law analysis of heat exchangers,"International Journal of Heat and Mass Transfer, vol. 43, pp. 4189-204, 2000.
[90] L. C. Witte and N. Shamsundar, "A thermodynamic efficiency concept for heatexchange devices," Journal of Engineering for Power, vol. 105, pp. 199-203,1983.
[91] A. L. London and R. K. Shah, "Costs of irreversibilities in heat exchanger
design," Heat Transfer Engineering, vol. 4, pp. 59-73, 1983.
[92] S. Sarangi and K. Choowdhury, "On the generation of entropy in a counterflowheat exchanger," Cryogenics, vol. 22, pp. 63-5, 1982.
[93] E. Sciubba, "A minimum entropy generation procedure for the discerte pseudo-optimization of finned-tube heat exchangers," Revue Gdnirale de Thermique,vol. 35, pp. 517-525, 1996.
[94] J. H. Lienhard V and J. H. Lienhard IV, A Heat Transfer Textbook. 4th ed.,Dover Publication, Minoela NY, 2011.
[95] R. K. Shah and D. P. Sekulin, Fundamentals of heat exchanger design. John
Wiley and Sons, 2003.
[96] S. Soufari, M. Zamen, and M. Amidpour, "Performance optimization of the
humidification-dehumidification desalination process using mathematical pro-
gramming," Desalination, vol. 237, pp. 305-317, 2009.
[97] E. Chafik, "Design of plants for solar desalination using the multi-stage heat-
ing/humidifying technique," Desalination, vol. 168, pp. 55-71, 2004.
[98] K. H. Mistry, A. Mitsos, and J. H. Lienhard V, "Optimal operating conditions
and configurations for humidification-dehumidification desalination cycles," In-
ternational Journal of Thermal Sciences, vol. 50, pp. 779-789, 2011.
[99] J. A. Miller and J. H. Lienhard V, "Impact of extraction on a humidification-dehumidification desalination system." Submitted for review, 2012.
[100] M. H. Sharqawy, J. H. L. V, and S. M. Zubair, "Thermophysical properties of
seawater: A review of existing correlations and data," Desalination and Water
Treatment, vol. 16, pp. 354-80, 2010.
[101] J. A. Miller, "Numerical balancing in a humdification dehumidification desali-
nation system," Master's thesis, Massachusetts Institute of Technology, 2011.
[102] M. G. St. John, "Design and optimization of a humidifier for an hdh system."
SB Thesis. Massachusetts Institute of Technology, June 2012.
256
[103] G. P. Narayan, A. Al Qutub, and J. H. Lienhard V, "System, method andappartus for thermal energy driven mechanical compression humidification de-humidification desalination." To be filed in July 2012.
[104] R. K. Kamali, A. Abbassi, S. A. S. Vanini, and M. S. Avval, "Thermodynamicdesign and parametric study of med-tvc," Desalination, vol. 222, pp. 596-204,2007.
[105] G. J. Crisp, "Actual energy consumption and water cost for the swro systemsat perth australia and gold coast - case history," in Proceedings of IDA energy
conference: Huntington beach, USA., 2011.
[106] K. H. Mistry, G. P. Narayan, A. Mitsos, and J. H. Lienhard V, "Optimizationof multi-pressure humidification dehumidification desalination using thermalvapor compression and energy recovery," in Proceedings of 10th ISHMT-ASMEHeat and Mass Transfer Conference, IIT Madras, December 27-30, 2011.
[107] J. E. Miller, "Review of water resources and desalination technologies," tech.rep., Sandia National lab, 2003. Report: SAND 2003-0800.
[108] A. P. Colburn and 0. A. Hougen, "Design of cooler condensers for mixturesof vapors with noncondensing gases," Industrial and Engineering Chemistry,vol. 26, pp. 1178-1182, 1934.
[109] W. Nusselt, "Die oberflachenkondensation des wasserdampfes," Zeitschrift desVereinsDeutscherIngenieure, vol. 60, pp. 541-6, 1916.
[110] E. M. Sparrow and E. R. G. Eckert, "Effects of superheated vapor and noncon-densable gases on laminar film condensation," AIChE Journal, vol. 7, pp. 473-7,1961.
[111] E. M. Sparrow, W. J. Minkowycz, and M. Saddy, "Forced convection condensa-tion in the presence of noncondensables and interfacial resistance," InternationalJournal of Heat and Mass Transfer, vol. 10, pp. 1829-45, 1967.
[112] W. J. Minkowycz and E. M. Sparrow, "Condensation heat transfer in the pres-ence of noncondensables: interfacial resistance, superheating, variable proper-ties, and diffusion," International Journal of Heat and Mass Transfer, vol. 9,pp. 1125-44, 1966.
[113] V. E. Denny, A. F. Mills, and V. J. Jusionis, "Laminar film condensation froma steam-air mixture undergoing forced flow down a vertical surface," Journalof Heat Transfer, vol. 93, pp. 297-304, 1971.
[114] V. E. Denny and V. J. Jusionis, "Effects of noncondensable gas and forcedflow on laminar film condensation," International Journal of Heat and MassTransfer, vol. 15, pp. 315-326, 1972.
257

[115] C. Y. Wang and C. J. Tu, "Effects of non-condensable gas on laminar film con-densation in a vertical tube," International Journal of Heat and Mass Transfer,vol. 31, pp. 2339-45, 1988.
[116] T. Kageyama, P. F. Peterson, and V. E. Schrock, "Diffusion layer modeling forcondensation in vertical tubes with noncondensable gases," Nuclear Engineeringand Design, vol. 141, pp. 289-302, 1993.
[117] H. A. Hasanein, Steam condensation in the presence of noncondensable gases
under forced convection conditions. PhD thesis, Massachusetts Institute of Tech-nology, 1994.
[118] S. Z. Kuhn, Investigation of heat transfer from condensing steam-gas mixtureand turbulent films flowing downward inside a vertical tubes. PhD thesis, Uni-versity of California at Berkeley, 1995.
[119] N. K. Maheshwari, P. K. Vijayan, and D. Saha, "Effects of non-condensablegases on condensation heat transfer," in Proceedings of 4th RCM on the IAEACRP on Natural Circulation Phenomena, 2007.
[120] H. A. Hasanein, M. S. Kazimi, and M. W. Golay, "Forced convection in-tubesteam condensation in the presence of noncondensable gases," InternationalJournal of Heat and Mass Transfer, vol. 39, pp. 2625-2639, 1996.
[121] M. Siddique, M. W. Golay, and M. S. Kazimi, "Local heat transfer coefficientsfor forced convection condensation of steam in a vertical tube in the presence ofair," Two-Phase Flow and Heat Transfer (3,d ed.), vol. 197, pp. 386-402, 1992.ASME, New York.
[122] V. D. Rao, V. M. Krishna, K. V. Sharma, and P. M. Rao, "Convective conden-sation of vapor in the presence of a non-condensable gas of high concentrationin laminar flow in a vertical pipe," International Journal of Heat and MassTransfer, vol. 51, pp. 6090 - 6101, 2008.
[123] S. Degaleesan, M. Dudukovic, and Y. Pan, "Experimental study of gas-inducedliquid-flow structures in bubble columns," AIChE Journal, vol. 47, pp. 1913-31,2001.
[124] Y. T. Shah, S. P. Godbole, and W. D. Deckwer, "Design parameters estimationsfor bubble column reactors," AIChE Journal, vol. 28, pp. 353-79., 1982.
[125] C. Hulet, P. Clement, P. Tochon, D. Schweich, N. Dromard, and J. Anfray,"Heat transfer in two- and three-phase bubble columns," International Journalof Chemical Reactor Engineering, vol. 7, pp. 1-93, 2009.
[126] A. V. Kulkarni and J. B. Joshi, "Design and selection of sparger for bubblecolumn reactor. part i: Performance of different spargers," Chemical engineeringresearch and design, vol. 89, pp. 1972-85, 2011.
258

[127] J. B. Joshi and M. M. Sharma, "A circulation cell model for bubble columns,"
Chemical Engineering Research and Design, vol. 57a, pp. 244-251, 1979.
[128] W. D. Deckwer, "On mechanism of heat transfer in bubble column reactors,"
Chemical Engineering Science, vol. 35, pp. 1341-1346, 1980.
[129] V. V. Konsetov, "Heat transfer during bubbling of gas through liquid," Inter-
national Journal of Heat and Mass Transfer, vol. 9, pp. 1103-8, 1966.
[130] W. Kast, "Analyse des wrmeibergangs in blasensiulen," International Journal
of Heat and Mass Transfer, vol. 5, p. 389, 1962.
[131] S. S. Kutateladze and M. A. Styrikovich, Hydraulics of gas-liquid systems.
Wright-Patterson Air Force Base, 1960.
[132] A. Kolmogorov, "On degeneration of isotropic turbulence in an incompressible
viscous liquid," Doklady Akademiia Nauk SSSR, vol. 31, pp. 538-540, 1941.
[133] R. Higbie, "The rate of absorption of a pure gas into a still liquid during a short
time of exposure," Transactions of American Institute of Chemical Engineers,vol. 35, pp. 365-89, 1935.
[134] N. L. Dias, M. Chamecki, A. Kan, and C. M. P. Okawa, "Study of spectra,structure and correlation functions and their implications for the stationarity
of surface-layer turbulence," Boundary Layer Meteorology, vol. 110, pp. 165-
189, 2004.
[135] D. J. Tritton, Physical Fluid Dynamics. Oxford University Press, 1988.
[136] A. M. I'Aglom, Correlation theory of stationary and related random functions,Vol 1: Basic Results. Springer Verlag, 1987.
[137] P. L. O'Neill, D. Nicolaides, D. Honnery, and J. Soria., "Autocorrelation func-
tions and the determination of integral length with reference to experimental
and numerical data," Proceedings of 15th Australasian Fluid Mechanics Con-
ference, vol. Paper # AFMC00064, pp. 1-3, 2004.
[138] F. Magaud, M. Souhar, G. Wild, and N. Boisson, "Experimental study of bub-
ble column hydrodynamics," Chemical Engineering Science, vol. 56, pp. 4597-
4607., 2001.
[139] M. Souhar, "Some turbulence quantities and energy spectrain the wall region
in bubble flows," Physics of Fluids A, vol. 1, pp. 1558-65, 1989.
[140] M. Lance and J. Bataille, "Turbulence in the liquid phase of a uniform bubbly
air-water flow," Journal of Fluid Mechanics, vol. 222, pp. 95-118, 1991.
[141] D. N. Miller, "Scale-up of agitated vessels gas-liquid mass transfer," AIChE
Journal, vol. 20, pp. 445-53, May 1974.
259

[142] R. W. Field and R. Rahimi, "Hold-up heat transfer in bubble columns," inFluid Mixing III, pp. 257 - 270, European Federation of Chemical Engineering,Amarousion-Pefki, Greece, 1988.
[143] H. D. Mendelson, "The prediction of bubble terminal velocities from wave the-ory," AIChE Journal, vol. 13, p. 250, 1967.
[144] F. Merkel, "Verdunstungskidhlung," VDI-Zeitchrift, vol. 70, pp. 123-8, 1925.
[145] J. L. Threlkeld, Thermal environmental engineering. Prentice-Hall Inc, 1970.
[146] F. Bosnjakovic, Technische Thermodinamik. Theodor Steinkopf, Dresden, 1965.
[147] A. Schumpe and G. Grund, "The gas disengagement technique for studying gasholdup structure in bubble columns," Candian Journal of Chemical Engineer-ing, vol. 64, pp. 891-6, 1986.
[148] S. S. Ozturk, A. Schumpe, and W. D. Deckwer, "Organic liquids in a bub-ble column: holdups and mass transfer coefficients," AIChE Journal, vol. 33,pp. 1473-80, 1987.
[149] K. Akita and F. Yoshida, "Gas hold-up and volumetric mass transfer coefficientsin bubble columns," Industrial and Engineering Chemistry Process Design andDevelopment, vol. 12, pp. 76-80, 1973.
[150] Y. Kang, Y. J. Cho, K. J. Woo, and S. D. Kim, "Diagnosis of bubble distributionand mass transfer in pressurized bubble columns with viscous liquid medium,"Chemical Engineering Science, vol. 54, p. 4887, 1999.
[151] J. K. Gehlawat and M. M. Sharma, "Absorption of isobutylene in aqueoussolutions of sulfuric acid," Chemical engineering science, vol. 23, p. 1173, 1968.
[152] H. Kroper, K. Schlomer, and H. M. Weitz, "How basf extracts isolentylene,"Hydrocarbon Process, vol. 195, p. 1, 1969.
[153] H. Hikita, S. Asal, H. Kikukawa, T. Zalke, and M. Ohue, "Heat transfer coeffi-cients in bubble column," Industrial and Engineering Chemistry Process Designand Development, vol. 20, pp. 540-5, 1981.
[154] Y. Kawase and M. Moo-Young, "Heat transfer in bubble column reactors withnewtonian and non-newtonian fluids," Chemical Engineering Research and De-sign, vol. 65, pp. 121-6, 1987.
[155] Y. Kato, K. Uchida, T. Kago, and S. Morooka, "Liquid holdup and heat transfercoeffcient between bed and wall in liquid-solid and gas-liquid-solid fluidizedbeds," Powder Technology, vol. 28, pp. 173-9, 1981.
[156] Y. J. Cho, K. J. Woo, Y. Kang, and S. D. Kim, "Dynamic characteristics ofheat transfer coeffcient in pressurized bubble columns with viscous medium,"Chemical Engineering and Processing, vol. 41, pp. 699-706, 2002.
260
[157] S. C. Saxena, N. S. Rao, and A. C. Saxena, "Heat-transfer and gas-holdupstudies in a bubble column: air-water-glass bead system," Chemical EngineeringCommunications, vol. 96, pp. 31-55, 1990.
[158] H. Li and A. Prakash, "Heat transfer and hydrodynamics in a three-phaseslurry bubble column," Industrial and Engineering Chemistry research, vol. 36,pp. 4688-94, 1997.
[159] N. Kantarci, F. Borak, and K. 0. Ulgen, "Bubble column reactors," ProcessBiochemistry, vol. 40, p. 2263U83, 2005.
[160] M. Fukuma, K. Muroyama, and S. Morooka, "Properties of bubble swarm ina slurry bubble column," Journal of Chemical Engineering of Japan, vol. 20,pp. 28-33, 1987.
[161] R. Krishna and J. M. V. Baten, "Mass transfer in bubble columns," CatalysisToday, vol. 79-80, pp. 67-75, 2003.
[162] A. Behkish, Z. Men, R. J. Inga, and B. I. Morsi, "Mass transfer characteristicsin a large-scale slurry bubble column reactor with organic liquid mixtures,"Chemical Engineering Science, vol. 57, pp. 3307-24, 2002.
[163] S. Lam, "Development of a multi-stage bubble column dehumidifier for appli-cation in a humidification dehumidification desalination system." SB Thesis,Massachusetts Institute of Technology, June 2012.
[164] C. Sommariva, Economics and Financing. Balaban Desalination Publications,2010.
[165] A. K. Plappally and J. H. Lienhard V, "Cost of water supply, treatment, end-use, and reclamation," in Proceedings of European Desalination Society Con-ference, Barcelona, April 22-26, 2012.
[166] J. H. Huang, "Design of a mobile community level water treatment system basedon humidification dehumidification desalination." SB Thesis, Massachusetts In-stitute of Technology, June 2012.
[167] US Energy Information Administration. URL:http://www.eia.gov/countries/cab.cfm?fips=IN. 2012.
[168] R. B. Saffarini, E. K. Summers, H. A. Arafat, and J. H. Lienhard V, "Eco-nomic evaluation of stand-alone solar powered membrane distillation systems,"Desalination, vol. 299, pp. 55-62, 2012.
[169] M. Sievers, "Design and optimization of a dehumidifier in a humidification-dehumidification (hdh) desalination system," Master's thesis, Technische Uni-verstat Hamburg-Harburg, 2010.
261

[170] H. A. Hasanein, Steam condensation in the presence of noncondensable gasesunder forced convection conditions. PhD thesis, Massachusetts Institute of Tech-nology, 1994.
[171] S. Z. Kuhn, Investigation of heat transfer from condensing steam-gas mixtureand turbulent films flowing downward inside a vertical tubes. PhD thesis, Uni-versity of California at Berkeley, 1995.
[172] N. . K. Maheshwari, P. K. Vijayan, and D. Saha, "Effects of non-condensablegases on condensation heat transfer," in Proceedings of 4th RCM on the IAEACRP on Natural Circulation Phenomena, Vienna, Austria., 2007.
[173] R. H. Perry and C. H. Chilton, Chemical engineers'handbook. McGraw-Hill,1973.
[174] M. K. Abuarabi and K. V. Reddy, "Performance evaluation of desalination pro-cesses based on the humidification/dehumidification cycle with different carriergases," Desalination, vol. 156, pp. 281-93, 2003.
262
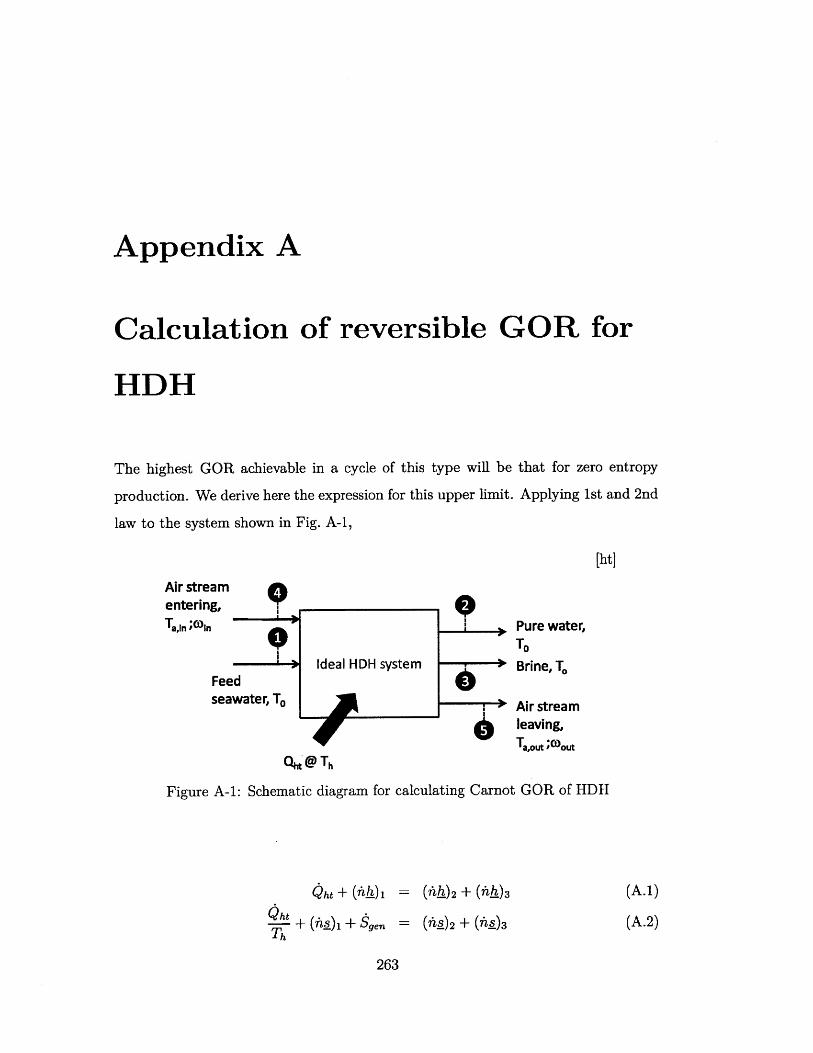
Appendix A
Calculation of reversible GOR for
HDH
The highest GOR achievable in a cycle of this type will be that for zero entropy
production. We derive here the expression for this upper limit. Applying 1st and 2nd
law to the system shown in Fig. A-1,
[ht]
Air streamentering,
Ta,in min
Feedseawater, To
Ideal HDH system
Q@ Th
Figure A-1: Schematic diagram for calculating Carnot GOR of HDH
Qht + ( 1A) i
Th + (4) 1 + $genTh
= (A-)2 + (Ah)3
= (-s_)2 + (nlA)3
263
3
6 3
Pure water,TOBrine, To
Air streamleaving,
a,out Wout
(A.1)
(A.2)
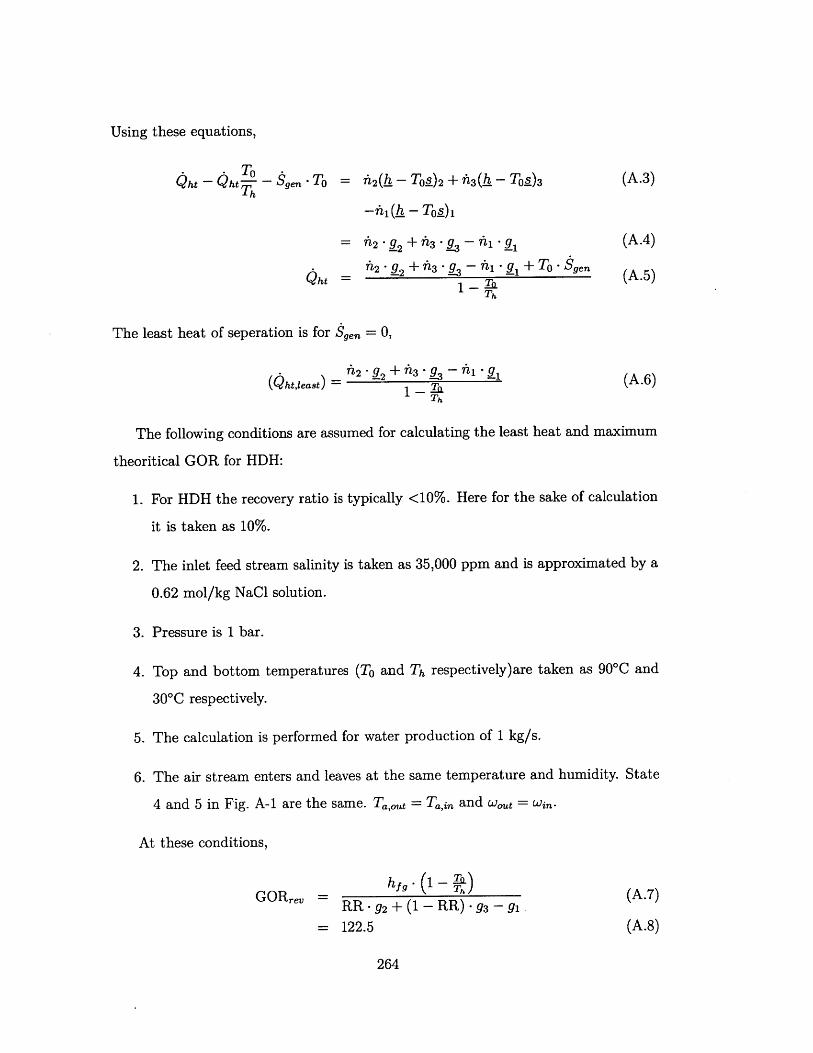
Using these equations,
ht - Qht# - Sgen - = A2(h - TO!) 2 + h3( -T0)3 (A.3)
-il(h - TO1) 1
= A2 - 2 +n -3 - i - 1 (A.4)
Qht = 722+na - -ni - 1 +TO-$gen (A.5)Ta
The least heat of seperation is for Sgen = 0,
n2 - 2 2 +h3 - 93 - i- 1 (A.6)(Qht,least) To (A16)
The following conditions are assumed for calculating the least heat and maximum
theoritical GOR for HDH:
1. For HDH the recovery ratio is typically <10%. Here for the sake of calculation
it is taken as 10%.
2. The inlet feed stream salinity is taken as 35,000 ppm and is approximated by a
0.62 mol/kg NaCl solution.
3. Pressure is 1 bar.
4. Top and bottom temperatures (To and Th respectively)are taken as 90 0 C and
30*C respectively.
5. The calculation is performed for water production of 1 kg/s.
6. The air stream enters and leaves at the same temperature and humidity. State
4 and 5 in Fig. A-i are the same. T,ot = Ta,in and wat = wi&.
At these conditions,
GORr = hj -(A.7)
RR-g 2 +(1-RR)-g-gi
= 122.5 (A.8)
264

Appendix B
Entropy generation in a
counterflow cooling tower
Using the control volume in Fig. 3-3,
$4 = nhW2 sWO + 74a,o - Sa,o
Si = nei -si + rna,i - Sa,i
Applying the Second Law to the same isolated control volume,
$gen = $o - si
= neWi - (sW'O -sWi) - (ThWi - 7ewo) - se'O
+na,o -Sa,o - ma,i -So > 0
Moist air entropy can be written as:
mha,- Sa,o = ?Ida Sda,o + fida Wo -Sv,o
mha,i Sa,i = Sda - saa,i + rnda Wi * Sv,i
265
(B.1)
(B.2)
(B.3)
(B.4)
(B.5)
(B.6)

Now Eqn. B.4 can be written as:
$,gen = rhw,i - (swO - se,i) - (Thw'i - Thw,O) - sW'O
+a - (saa,o - Sda,i) + mda - Wo - (sv,o - S,)
+ da- (Wo - W) - sv,o + Amix,out - Almix,in (B.7)
where Amix is the entropy of mixing of dry air and water vapor mixture. It should
also be noted that entropy of individual components (saa,o, saa,i, sv,o, and sv,) are all
evaluated at the respective moist air temperature and total pressure. A mass balance
gives
rw,i - mh,o = Tda - (WO - wi)
This further reduces Eqn. B.7 to give
Sgen = rh,i . (s,O - smi) - rhda - (Wo - Wo) - (sw,o - Sv,.)
+Taa - (saa,o - saa,i) + rha - W - (svo - si)
+A~mix,aut - AAmix,in
(B.8)
(B.9)
Water is assumed as an incompressible fluid, and the total pressure of the system
is taken to be uniform. Assuming that dry air and water vapor exhibit ideal gas
behavior, we have:
Sgen = CP1 - In
TaIn '
+ia -(O - wi) [Rw In (satWo) + sfg,o(TaTT+Thd. Wo - i) 1R In (Ptotal)+ f'
+da -cp,da - In Ta'i
+da Wi -c,, - In
+A mixout - AAmix,in
266
(B.10)

where, Psatw,o is the saturation pressure of water at T,, and sfg,o is the enthalpy
change of vaporization at T.,,. The entropy of mixing for an ideal mixture can be
written as:
A'mix,out - A~mix,in = -Rda ln()x&,,)
-R-,,- ln(x,,o)
+Rda - Aa ln(xdai)
+Rw - nv,i - ln(x,,,i)
Here the mole fraction of dry air and water vapor can be expressed in terms of
humidity ratio, w, as:
- Xda
Xda
Mda
MV
= 1.608 -1
(B.12)
(B.13)
(B.14)
1 + 1.608 -w1.608 -WX1 =
*1+1.608-w
Using these expressions for mole fraction in Eqn. B.10 we get the following.
AAmix,out - AAmix,in = daIa Rda - In( + 1.608 - w,1 + 1.608 - wi
-Rw - w, - I n 1 + )1.608 -w
Using Eqns. B.10 and B.15, we obtain Eqn. 3.45.
267
(B.11)
+ 11.608 - wi } (B.15)+R, - wi - In 1I

THIS PAGE INTENTIONALLY LEFT BLANK
268

Appendix
Algorithms for modeling
systems
HDH
thermodynamic balancing
269
C
with and without
Figure C-1: Flowchart of the overall HDH system design for the no extractions case.
270

N->inf
Yes
Estimate the total heat duty Ah byassuming parallel temperature profiles
for dehumidifier and humidifier
I,Plot saturated air temperature profile T=f(h*)
-4----Plot dehumidifiertemperature
profile T=(h'W)
Divide total enthalpy rangeinto small equal intervals
Calculate AS (per kg of water)
*
Calculate slope of humidifiertemperature profile
Calculate lower temperature of waterstream in humidifier in the interval
Repeat process for all intervals and generatethe humidifier temperature profile
ICalculate As (per kg of dry air)
Calculate mass flow rate ratiofor humidifier stream
Calculate Aw
Calculate mass flow rate of waterproduced in interva
Calculate mass flow rate ofwater stream in humidifier in
following interval
Calculate salinity of waterstream in humidifier
Calculate specific heat ofwater stream in humidifier
Define state A withhA=h(TW)+W and TA=Tt(hA)
I4-Define state B for water stream in humidifier
with hB=h.(T) and TB determined fromhumidifier temperature profile at heI
Shift entire humidifier temperature profileupwards by AT=T-TB
Calculate total entropy generation
Calculate heat input
Calculate gained output ratio
Figure C-2: Flowchart of the overall system design for the continuous air extractions
case.
271
I
I I
I
I

Figure C-3: Flowchart of the overall system design for the single air extraction case.
272

Appendix D
Cost of water production in HDH
system proposed in this thesis
The cost of water production is calculated by a standard method used in the desali-
nation industry [164, 165].
Figure D-1 illustrates a three-dimensional model of a trailer-mounted, single air
extraction HDH system operating under sub atmospheric pressure with a 12 foot
(3.6 m) tall packed bed humidifier and a four-stage bubble column dehumidifier. All
the details of the layout design was performed by Jeffery Huang [166]. This unit is
designed to produce 10 m3 per day. We calculate the cost of this unit as cost of the
state-of-the-art HDH system.
The total thermal energy consumed by this system is 156 kWhth per cubic meter
of water produced and the electrical energy consumption is 1.2 kWh per cubic meter
of water produced (see Chapters. 5 and 6). The thermal energy is provided from
compressed natural gas tanks on the trailer at an assumed cost of $4 per 1000 cubic
feet (this is the average price in India [167]). The electrical energy is provided using
an diesel generator at the rate of $0.20 per kWh. The total energy cost per m3 of
water produced is $2.17.
The capital cost is the sum of the various costs listed in Table D. 1. These costs are
obtained from different manufacturers. The parts for the humidifier and dehumidifier
are to be obtained from these manufacturers and the assembly and fabrication is to
273

Air circulation Natural gas firedblower heater
Water pumps
Figure D-1: Three-dimensional model of a trailer-mounted, sub-atmospheric-pressure,natural-gas-fired, single air extraction HDH system with a 12 foot tall packed bedhumidifier and a four-stage bubble column dehumidifier.
be done by sub-contractors.
The total capital cost is amortized over a life of 20 years. The amortization factor
(CAF) is calculated as follows.
CAF= (D.1)1 - (1 + I)-20
where, I is the interest rate (taken to 6% in this calculation). Annual amortization
is the product of CAF and CAPEX. This comes to $ 4,266.38. It is widely accepted
in desalination industry that fixed 0 & M is a maximum of 5% of the CAPEX. The
total annual levelized cost is the sum of the annual amortization and annual fixed cost
divided by the total amount of water produced in a year. This comes to 2.30 $ per
cubic meter of water produced. Further, we also assume that the plant is available
for 90% of the time only, which is reasonable for thermal desalination systems [164].
274

Hence the total cost of water is $4.91 per cubic meter of water produced1 . This
is much lower than the $15 to $60 per m3 that has been reported for Membrane
Distillation Technology (which is the other promising small-scale thermal desalination
system) [168]. It is also much lower than the costs reported for other HDH system
(see Sec. 2.4).
Table D.1: Various components of capital expenditure (CAPEX) for a 10 m 3 per dayHDH system.
Component Cost [$]Vacuum pumps 1,250.00
Column containers 2,500.00Pumps 1,600.00Blowers 2,000.00
Dehumidifier 8,000.00Humidifier 8,000.00
NG combustor 1,500.00Generator 1,000.00
Sub contractor costs 15,000.00Assembly 2,585.00Controls 5,500.00
Total 48,935.00
'This is based on conservative upper limit estimates for CAPEX and is bound to be lower as theadvantages of economies of scale are realised.
275

THIS PAGE INTENTIONALLY LEFT BLANK
276

Appendix E
Helium as carrier gas in HDH
systems
In this appendix, we propose to solve the problems of low heat and mass transfer
rates in the dehumidifier by changing the carrier gas from air to helium. The energy
performance of HDH systems using helium relative to air is analysed in detail using
novel on-design models for the components described in Chapter 3.
E.1 Rationale for selecting helium
In HDH systems, the properties of the carrier gas affect the overall cost of water
production. While the psychrometeric properties affect the thermodynamics and
the energy consumption of the system, the thermophysical properties, like thermal
conductivity, affect the heat transfer area required in the heat and mass exchange
devices. In this section, we consider these properties for various gases which could
possibly be used in HDH systems and outline the rationale for using helium in HDH
systems.
277

Table E.1: Thermophysical properties of different carrier gases at STP and of drysaturated steam at atmospheric pressure
I M [g/mol] I k [W/m.K] Jc, [J/kg.K] I p [kg/m 3 ]Air 28.97 0.02551 1.005 1.169He 4.003 0.1502 5.193 0.1615N2 28.01 0.02568 1.038 1.13Ar 39.95 0.01796 0.5203 1.611
CO 2 44.01 0.01657 0.8415 1.775Steam 18.02 0.02503 2.043 0.5897
E.1.1 Thermophysical properties
Table E.1 shows all the important thermophysical properties for air, helium, nitrogen,
argon and carbon dioxide at T=25*C and P=1 atm. Since these gases are to be used
as a mixture with steam in the HDH systems, the properties of dry saturated steam
at P=1 atm are also shown.
It is observed that helium has a much higher thermal conductivity than the other
gases in consideration, about six times that of air. The thermal conductivity is
especially important because a higher value will help reduce the gas side thermal
resistance in the dehumidifiers.
The specific heat capacity is also much higher for helium than for the other gases.
Specific heat affects the ratio of mass flow rate of seawater entering the system to
that of the carrier gas circulated in the system. The performance of a HDH system
is optimal when operated at a particular ratio of mass flow rates (Chapter 4). Hence,
it is important to identify this ratio for each of the carrier gases at a given operating
condition; this is done as part of the thermodynamic study later in the paper.
As can be seen from density of the gases, helium is by far the lightest gas and this
may cause some operational difficulties. Dynamic viscosity (not shown) is about the
same for the gases under consideration.
E.1.2 Psychrometric properties
Using Dalton's law and approximating the carrier gas and water vapor mixture as an
ideal mixture we can write down the humidity ratio of the carrier gas as a function
278

4.5P=100 kPa, *=1
4 -Helium
3.5
2.5
.c 2
o 1.5.0
0.5 Air
0 - - II
0 10 20 30 40 50 60 70 80 90
Temperature(*C)
Figure E-1: Psychrometeric chart for helium water vapor mixture and moist air.
of the mixture temperature (T), pressure (P), relative humidity (#) and molar mass
(M) of the carrier gas.
W(T, P,) = psat (T) (E.1)Me:g P - 4 -psat (T )
From this equation, it may be seen that the humidity ratio is higher for low molar
mass gases. We know that helium has low molar mass compared to air (see Tab. E.1).
Hence, the humidity ratio for helium is much higher than that for air (Fig. E-1). At
any given temperature, total pressure, and relative humidity, the humidity ratio for
helium is 7.23 times that of air. As we would expect based on Eq. E.1, this ratio is
same as the ratio of the molar mass of helium to air.
The higher humidity ratio leads to a lower total mass flow of carrier gas per unit of
water produced. This leads to a lower gas side pressure drop and a smaller auxiliary
power consumption as explained in Sec. E.1.4.
279

E.1.3 Estimate of gas side heat transfer coefficient in the
dehumidifier
In the dehumidifier of a HDH system the thermal resistance to heat transfer associated
with the presence of non-condensables (air) is much higher than thermal resistance
of the liquid film formed as a result of the condensation of steam from the moist air
mixture [169]. In this section, an estimate of this thermal resistance using wealth
of experimental data in literature is made [170, 171]. In particular, researchers from
BARC (Bhabha Atmoic Research Center) in India [172] reviewed various experimental
correlations that give the condensation heat transfer performance of steam in the
presence of non-condensables (including air and helium) for simple geometries (e.g.,
a vertical tube). The correlations are generally of the form
Nuc=zi - Re" - xe' - Jac (E.2)
The Nusselt number is given as a function of the Reynolds number of the mixture,
the bulk mole fraction of the carrier gas in the mixture and the Jakob number of the
mixture.
Nucm = - (E.3)kcgm
Recgm = Pcgm* Vmi - Dh (E.4)
Ja9 Cp,cgm - (Tb dk - Twaal) (E.5)hfg
The coefficients zi to z4 will depend on the boundary conditions and the carrier
gas. It is also common to normalize the Nusselt number for steam condensation in
the presence of saturated helium by that in the presence of saturated air at a given
temperature and absolute pressure (as shown in Eq. E.6).
280
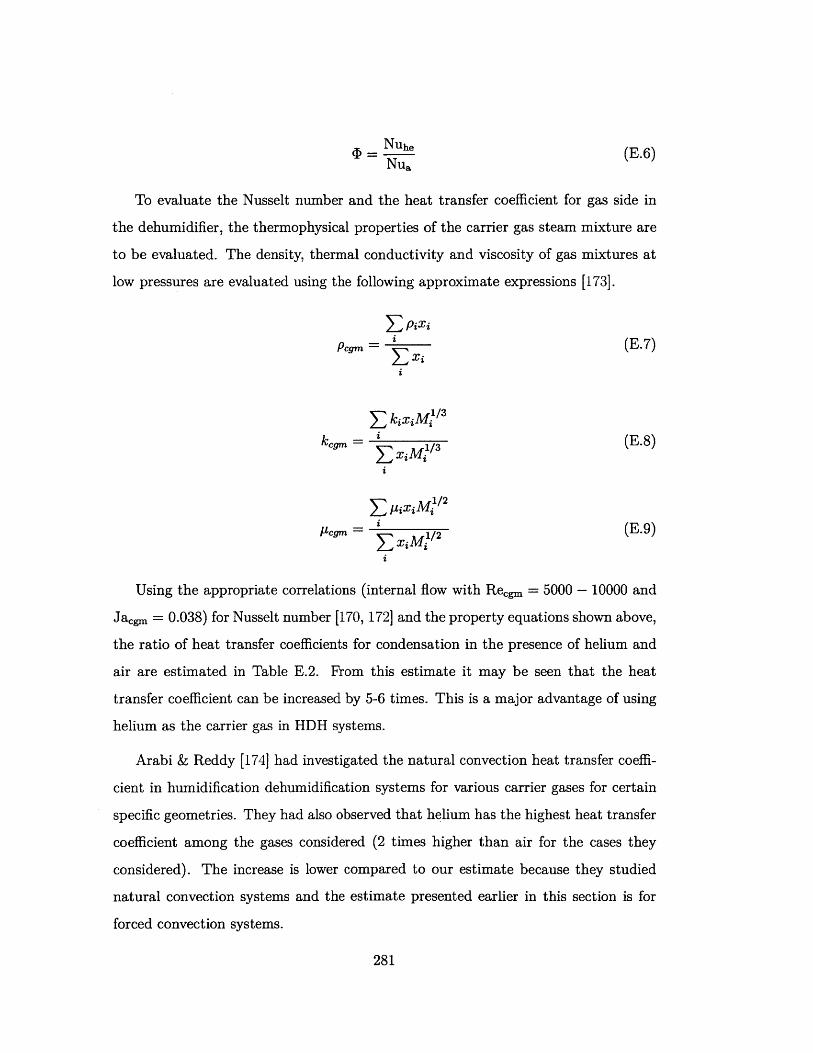
Nuhe (E.6)
Nua
To evaluate the Nusselt number and the heat transfer coefficient for gas side in
the dehumidifier, the thermophysical properties of the carrier gas steam mixture are
to be evaluated. The density, thermal conductivity and viscosity of gas mixtures at
low pressures are evaluated using the following approximate expressions [173].
E PiXiPcegm = (E.7)
kxi
k = (E.8)im
p 1i~/2
pc=n = (E.9)
Using the appropriate correlations (internal flow with Recgm = 5000 - 10000 and
Jacgm = 0.038) for Nusselt number [170, 172] and the property equations shown above,
the ratio of heat transfer coefficients for condensation in the presence of helium and
air are estimated in Table E.2. From this estimate it may be seen that the heat
transfer coefficient can be increased by 5-6 times. This is a major advantage of using
helium as the carrier gas in HDH systems.
Arabi & Reddy [174] had investigated the natural convection heat transfer coeffi-
cient in humidification dehumidification systems for various carrier gases for certain
specific geometries. They had also observed that helium has the highest heat transfer
coefficient among the gases considered (2 times higher than air for the cases they
considered). The increase is lower compared to our estimate because they studied
natural convection systems and the estimate presented earlier in this section is for
forced convection systems.
281
Table E.2: Estimated improvement in gas side dehumidification heat transfer coeffi-cients when helium is used as the carrier gas.
T xcg khe/ka (D Uhe/Ua
40 0.93 5.5 1.1 6.150 0.88 5.2 1.15 5.960 0.8 4.7 1.25 5.870 0.69 4.0 1.35 5.4
E.1.4 Gas side pressure drop in the dehumidifier
In this section, we estimate the gas side pressure drop for helium and air. The estimate
is for a fixed flow geometry with a fixed hydraulic diameter and flow area. For these
constraints, Shah [95] provides the following relationship of pressure drop on fluid
properties and mass flow rate under turbulent flow conditions.
A0.2 - 1h.8
APcgm,D O Cgm cgm (E.10)Pegm
The mass flow rate of carrier gas to be used in these equations is for the case
to produce a fixed amount of water in the HDH systems. This is explained in the
following sections. Using the mixture property equations (Eqs. E.7-E.9), the gas
side pressure drop in the dehumidifier when using helium is found to be 1/5 to 1/8
times that when using air as a carrier gas. Along with the increase in heat transfer
coefficient, the reduction in pressure drop clearly shows the potential of using helium
as carrier gas. In Sec. E.3, we analyse the effect of reduction in pressure drop on the
energy efficiency of the HDH systems.
E.2 Thermodynamic cycle for HDH desalination
The simplest HDH cycle is the water-heated, closed-air, open-water cycle. This cycle
is described in great detail ealier in this thesis (see Chapters 2, 4 and 6). The analysis
in this chapter is carried out for the same.
282
E.3 Relative thermodynamic performance of he-
lium based cycles
The effect of changing the carrier gas from air to helium on the system performance
is investigated in this section. HDH cycles are traditionally heat driven cycles run
by using low grade energy to heat the seawater. The efficiency of the cycle itself is
measured by the gained output ratio (GOR) defined in Eq. 2.2. The GOR for the
water heated HDH cycle may be rewritten as follows
GOR = rn,. - hg (E.11)'rhwcy,. (Tw,ht,out - Tw,(t,E)
From Chapters 3, 4, 5, and 7, we know that the modified heat capacity rate
ratio (HCR) is the most important thermodynamic parameter for heat driven HDH
cycles. Figure E-2 illustrates the GOR of cycles using air and helium as the carrier
gas against the modified heat capacity ratio of the dehumidifier. For this example,
the component effectivenesses are fixed along with the operating pressures and feed
seawater conditions. The seawater temperature at the exit of the heater is fixed at
90 0C.
It is observed that the change in carrier gas has very little impact on the perfor-
mance of the system. To explain this trend let us rewrite Eq. E.11 as follows
GOR = -" (E.12)rnrc,,ATht
m,"Ax -hfg= M" (E.13)
TrCpATht
where the mass flow rate ratio mr = hrhd.
So, the ratio of GOR for system with helium and air can be written as follows:
GORhe Ma AXD,he mr,he ATht,he (GORa Mhe AXD,a mr,a ATht,a
283

1
0.95
0.9
- 0.850
0.8
0.75
0a 0.7
ID0.65
0.6
0.55
0.5
0 0.2 0.4 0.6 0.8 1 1.2 1.4 1.6
Heat Capacity Rate Ratio In the Dehumidifier, HCRD1.8 2
Figure E-2: Relative performance of water heated HDH cycle with helium or air ascarrier gas. T,,in = 30*C; Tcg,H,out = 90 0C; EH = 60%; ED = 90%; P = 100 kPa.
Table E.3: Various system parameters and temperatures for cases shown in Fig. E-2HCRD ATht,he ATht,a M ATD,he ATD,a
[-] [0C] [0C] [-] [*C] [*C]0.8889 31.73 31.81 7.041 20.3 20.49
1 29.56 29.65 7.049 26.59 26.81.333 31.87 31.97 7.074 30.66 30.941.667 34.26 34.35 7.084 32.67 32.98
2 36.55 36.63 7.087 33.23 33.52
284
A s Air
Sa Helium
eA
S
-4
e
-S
From Tab.E.3, it can be seen that
ATht,he (E.15)
A Tht,a
ATD,he (E.16)
ATD,a
AXD,he (E.17)AXD,a
mrhe Ma (E.18)mr,a Me
Hence,GORhe (E.19)GORa
Thus the GOR is approximately the same for helium and air systems.
It was found from experiments described in Chapter 6 that specific work consump-
tion was around 0.4 kWh/m 3 . For the same boundary conditions at a total pressure
drop would be 1/5 to 1/8 of that of the experiment (see section E.1.4), a system with
helium as the carrier gas will have an electricity consumption of < 0.1 kWh/m 3 .
EA Chapter conclusions
1. Large pressure drops and low heat transfer coefficients in the gas side of the
dehumidifier are significant problems for HDH systems. A possible solution to
these problems is to use helium as the carrier gas instead of air. Owing to its
superior thermophysical and psychrometric properties, helium as a carrier gas
is estimated to significantly improve the heat transfer coefficient and lower the
pressure drop compared to systems using air as a carrier gas.
2. The thermodynamic performance (GOR) of the water heated HDH system is
not affected by changing the carrier gas.
3. However, the reduction of pressure drop will reduce the auxiliary electricity con-
sumption by 5 to 8 times and increase in dehumidifier heat transfer coefficient
will reduce dehumidifier size greatly.
285

4. Hence, given the advantages of lower heat exchanger size requirement and lower
electricity consumption, it is concluded that using helium as the carrier gas has
promise for HDH desalination systems. The current crisis of lack of availability
of helium, however, poses a challenge to the commercial realization of such a
system.
286