THERMAL EFFECTS IN CONCRETE BRIDGE ...
108
276 V/ NATIONAL COOPERATIVE HIGHWAY RESEARCH PROGRAM REPORT 276 THERMAL EFFECTS IN CONCRETE BRIDGE SUPERSTRUCTURES HEY LciJ f\P 2 193E MAT. LAB. TRANSPORTATION RESEARCH BOARD NATIONAL RESEARCH COUNCIL
-
Upload
khangminh22 -
Category
Documents
-
view
2 -
download
0
Transcript of THERMAL EFFECTS IN CONCRETE BRIDGE ...

276
V/ NATIONAL COOPERATIVE
HIGHWAY RESEARCH PROGRAM REPORT 276 THERMAL EFFECTS IN CONCRETE
BRIDGE SUPERSTRUCTURES
HEY LciJ f\P 2 193E
MAT. LAB.
TRANSPORTATION RESEARCH BOARD
NATIONAL RESEARCH COUNCIL

TRANSPORTATION RESEARCH BOARD EXECUTIVE COMMIflEE 1985
Officers
Chairman
JOHN A. CLEMENTS, President, Highway Users Federation for Safety and Mobility
Vice Chairman
LESTER A. HOEL, Hamilton Professor and Chairman, Department of Civil Engineering, University of Virginia
Secreta,y
THOMAS B. DEEN, Executive Director, Transportation Research Board
Members
RAY A. BARNHART, Federal Highway Administrator, U.S. Department of Transportation (ex officio) JOSEPH M. CLAPP, Vice Chairman-Corporate Services, Roadway Services, Inc. (ex officio, Past Chairman, 1984) LAWRENCE D. DAHMS, Executive Director, Metropolitan Transportation Commission, Berkeley, California (ex officio, Past Chairman, 1983) DONALD D. ENGEN, Federal Aviation Administrator, U.S. Department of Transportation (ex officio) FRANCIS B. FRANCOIS, Executive Director, American Association of State Highway and Transportation Officials (ex officio) WILLIAM J. HARRIS, JR., Vice President for Research and Test Department, Association of American Railroads (ex officio) RALPH STANLEY, Urban Mass Transportation Administrator, U.S. Department of Transportation (ex officio) DIANE STEED, National Highway Traffic Safety Administrator, U.S. Department of Transportation (ex officio) ALAN A. ALTSHULER, Dean, Graduate School of Public Administration, New York University DUANE BERENTSON, Secretary, Washington State Department of Transportation JOHN R. BORCHERT, Regents Professor, Department of Geography, University of Minnesota ROBERT D. BUGHER, Executive Director, American Public Works Association ERNEST E. DEAN, Executive Director, Dallas/Fort Worth Airport MORTIMER L. DOWNEY, Deputy Executive Director for Capital Programs, New York Metropolitan Transportation Authority JACK R. GILSTRAP, Executive Vice President, American Public Transit Association MARK G. GOODE, Engineer-Director, Texas State Department of Highways and Public Transportation WILLIAM K. HELLMAN, Secretary, Maryland Department of Transportation LOWELL B. JACKSON, Secretary, Wisconsin Department of Transportation JOHN B. KEMP, Secretary, Kansas Department of Transportation ALAN F. KIEPPER, General Manager, Metropolitan Transit Authority, Houston HAROLD C. KING, Commissioner, Virginia Department of Highways and Transportation DARRELL V MANNING, Adjutant General, Idaho National Guard, Boise JAMES E. MARTIN, President and Chief Operating Officer, Illinois Central Gulf Railroad FUJIO MATSUDA, Executive Director, Research Corporation of the University of Hawaii JAMES K. MITCHELL, Professor, Department of Civil Engineering, University of California H. CARL MUNSON, JR., Vice President for Strategic Planning, The Boeing Commercial Airplane Company MILTON PIKARSKY, Distinguished Professor of Civil Engineering, City College of New York WALTER W. SIMPSON, Vice President-Engineering, Norfolk Southern Corporation LEO J. TROMBATORE, Director, California Department of Transportation
NATIONAL COOPERATIVE HIGHWAY RESEARCH PROGRAM
Transportation Research Board Executive Committee Subcommittee for NCHRP JOHN A. CLEMENTS, Highway Users Federation for Safety and Mobility (Chairman) FRANCIS B. FRANCOIS, Amer. Assn. of State Hwy. & Transp. Officials LESTER A. HOEL, University of Virginia RAY A. BARNHART, U.S. Dept. of Transp. JOSEPH M. CLAPP, Roadway Services, Inc. THOMAS B. DEEN, Transportation Research Board
Field of Design Area of Bridges
Project Panel, C12-22 DAVID B. HEAL, New York State Dept. of Transportation (Chairman) JOSEPH H. MOORE, Virginia Polytechnic Institute & State Univ. DAVID W. GOODPASTURE, The University of Tennessee WALTER PODOLNY, JR., Federal Highway Administration JAMES K. IVERSON, The Consulting Engineers Group, Inc. CARL E. THUNMAN, JR., Consultant GUY D. MANCARTI, California Dept. of Transportation STANLEY W. WOODS, Wisconsin Dept. of Transportation GEORGE T. MARKICH, Washington State Dept. of Transportation CRAIG A. BALLINGER, FHWA Liaison Representative
GEORGE W. RING, Ill, TRB Liaison Representative
Program Staff
ROBERT J. REILLY, Director, Cooperative Research Programs CRAWFORD F. JENCKS, Projects Engineer ROBERT E. SPICHER, Deputy Director R. IAN KINGHAM, Projects Engineer LOUIS M. MACGREGOR, Administrative Engineer HARRY A. SMITH, Projects Engineer IAN M. FRIEDLAND, Projects Engineer HELEN MACK, Editor
NATIONAL COOPERATIVE HIGHWAY RESEARCH PROGRAM 276 REPORT
THERMAL EFFECTS IN CONCRETE BRIDGE SUPERSTRUCTURES
A. A. IMBSEN, D. E. VANDERSHAF, R. A. SCHAMBER, and A. V. NUTT Engineering Computer Corporation
Sacramento, California
RESEARCH SPONSORED BY THE MERICA1 ASSOCIATION OF STATE HIGHWAY AND TRANSPORTATION OFFICIALS IN COOPERATION WITH THE FEDERAL HIGHWAY ADMINISTRATION
AREAS OF INTEREST:
STRUCTURES DESIGN AND PERFORMANCE
CEMENT AND CONCRETE (HIGHWAY TRANSPORTATION) (PUBLIC TRANSIT)
(RAIL TRANSPORTATION)
TRANSPORTATION RESEARCH BOARD NATIONAL RESEARCH COUNCIL
WASHINGTON, D.C. SEPTEMBER 1985

NATIONAL COOPERATIVE HIGHWAY RESEARCH PROGRAM
Systematic, well-designed research provides the most effective approach to the solution of many problems facing highway administrators and engineers. Often, highway problems are of local interest and can best be studied by highway departments individually or in cooperation with their state universities and others. However, the accelerating growth of highway transpor-tation develops increasingly complex problems of wide interest to highway authorities. These problems are best studied through a coordinated program of cooperative research.
In recognition of these needs, the highway administrators of the American Association of State Highway and Transportation Officials initiated in 1962 an objective national highway research program employing modern scientific techniques. This program is supported on a continuing basis by funds from participating member states of the Association and it receives the full co-operation and support of the Federal Highway Administration, United States Department of Transportation.
The Transportation Research Board of the National Research Council was requested by the Association to administer the research program because of the Board's recognized objectivity and understanding of modern research practices. The Board is uniquely suited for this purpose as: it maintains an extensive committee structure from which authorities on any highway transportation subject may be drawn; it possesses avenues of communications and cooperation with federal, state, and local governmental agencies, universities, and industry; its relation-ship to the National Research Council is an insurance of ob-jectivity; it maintains a full-time research correlation staff of specialists in highway transportation matters to bring the find-ings of research directly to those who are in a position to use them.
The program is developed on the basis of research needs iden-tified by chief administrators of the highway and transportation departments and by committees of AASHTO. Each year, spe-cific areas of research needs to be included in the program are proposed to the National Research Council and the Board by the American Association of State Highway and Transportation Officials. Research projects to fulfill these needs are defined by the Board, and qualified research agencies are selected from those that have submitted proposals. Administration and sur-veillance of research contracts are the responsibilities of the National Research Council and the Transportation Research Board.
The needs for highway research are many, and the National Cooperative Highway Research Program can make significant contributions to the solution of highway transportation problems of mutual concern to many responsible groups. The program, however, is intended to complement rather than to substitute for or duplicate other highway research programs.
NCHRP REPORT 276
Project 12-22 FY'81
ISSN 0077-5614
ISBN 0-309-03860-X
L. C. Catalog Card No. 85-52305
Price $9.60
NOTICE
The project that is the subject of this report was a part of the National Cooperative
Highway Research Program conducted by the Transportation Research Board
with the approval of the Governing Board of the National Research Council. Such
approval reflects the Governing Board's judgment that the program concemed is
of national importance and appropriate with respect to both the purposes and
resources of the National Research Council.
The members of the technical committee selected to monitor this project and to
review this report were chosen for recognized scholarly competence and with due consideration for the balance of disciplines appropriate to the project. The opinions and conclusions expressed or implied are those of the research agency that per-
formed the research, and, while they have been accepted as appropriate by the technical committee, they are not necessarily those of the Transportation Research
Board, the National Research Council, the American Association of State Highway
and Transportation officials, or the Federal Highway Administration, U.S. De-
partment of Transportation. -
Each report is reviewed and accepted for publication by the technical committee according to procedures established and monitored by the Transportation Research
Board Executive Committee and the Governing Board of the National Research
Council.
The National Research Council was established by the National Academy of
Sciences in 1916 to associate the broad community of science and technology with the Academy's purposes of furthering knowledge and of advising the Federal
Government. The Council has become the principal operating agency of both the
National Academy of Sciences and the National Academy of Engineering in the conduct of their services to the government, the public, and the scientific and
engineering communities. It is administered jointly by both Academies and the
Institute of Medicine. The National Academy of Engineering and the Institute of Medicine were established in 1964 and 1970, respectively, under the charter of
the National Academy of Sciences.
The Transportation Research Board evolved in 1974 from the Highway Research Board which was established in 1920. The TRB incorporates all former HRB
activities and also performs additional functions under a broader scope involving
all modes of transportation and the interactions of transportation with society.
Special Notice
The Transportation Research Board, the National Research Council. the Federal Highway Administration. the American Association of State Highway and Trans-
portation Officials, and the individual states participating in the National Coop-erative Highway Research Program do not endorse products or manufacturers.
Tradeor manufacturers' names appear herein solely because they are considered
essential to the object of this report.
Published reports of the
NATIONAL COOPERATIVE HIGHWAY RESEARCH PROGRAM
are available from:
Transportation Research Board National Research Council 2101 Constitution Avenue, N.W. Washington, D.C. 20418
Prinied in ih, t.nhied Slates of Amer—

FOREWO RD This report contains the findings of a comprehensive study of thermally induced stresses in reinforced and prestressed concrete bridge superstructures. Design guide-
By Staff lines for thermal effects in concrete bridge superstructures, accompanied by a corn-Transportation mentary, are included in the report and are of immediate importance, applicability,
Research Board and interest to bridge engineers, construction engineers, researchers, specification writing bodies, and others concerned with thermal effects in concrete structures.
Bridge design requires consideration of the effects produced by temperature ranges and thermal gradients in the structure. These effects are particularly significant in large concrete bridges but are covered only to a limited extent in the current AASHTO Standard SpecWcations for Highway Bridges. Modern methods of concrete bridge construction require more accurate information for design purposes.
An increasing number of long span, concrete box girder bridges are being con-structed in the United States. In large sections, commonly used for segmental or other modern concrete bridge superstructures, the effects of temperature gradients, either across the section or through the thickness of its elements, are important and should be considered in the design. In some cases, stresses caused by temperature gradients may exceed those calculated for design live loads. Some design codes used in other countries provide guidance on these effects, but they are not adequately addressed in the current AASHTO Specifications.
This report contains the findings of NCHRP Project 12-22, "Thermal Effects in Concrete Bridge Superstructures." The objectives of this study were to develop rec-ommended specifications and design procedures for consideration of thermally induced stresses and movements in concrete bridge superstructures.
The first part of the report provides a review and evaluation of existing domestic and foreign codes of practice, research findings, and performance data. On the basis of this information, key parameters for the development and refinement of design procedures for thermal effects are identified. Case studies were performed to investigate the effects produced by thermal gradients on typical bridge configurations. Based on an assessment of the results of these case studies, design guidelines and a corresponding commentary have been developed and are presented along with representative example problems. The guidelines and commentary will be considered for adoption by the AASHTO Subcommittee on Bridges and Structures.
The report also provides a comprehensive bibliography containing detailed ref-erence categories that would be of use to both designers and researchers.

CONTENTS
SUMMARY.............................................................................1 PART I
CHAPTER ONE Introduction and Research Approach .................................2
CHAPTER 'rwo Findings—Current Research and Performance Data...................2
CHAPTER THREE Findings—Heat Exchange and Thermal Effects .....................6 Heat Energy Exchange on Concrete Bridge Superstructures........................6 Thermal Effects on Bridge Superstructures........................................8
CHAPTER FOUR Findings—Bridge Design Codes and Alternative Approaches .........18 UnitedStates ....................................................................20 NewZealand ....................................................................22 England.........................................................................22 Germany........................................................................23 Canada...... ... ........................ ... ................ ..... .................23 Australia........................................................................23 Japan...........................................................................24 Swedan.......................................................................... 24 Denmark........................................................................24 Italy............................................................................24 France..........................................................................24
CHAPTER FIVE Interpretation and Application—Case Studies.........................25 Longitudinal Temperature Effects ................................................25 Transverse Temperature Effects ..................................................53
CHAPTER SIX Conclusions and Recommendations ....................................62 Conclusions .....................................................................62 Recommended Design Approach for Thermal Effects..............................62 Need for Future Research........................................................62
REFERENCES AND BIBLIOGRAPHY .....................................................63 Design Codes and Practices ......................................................63 Proposed Design Code and Practices .............................................63 In-Situ Thermal Measurements...................................................63 In-Situ Thermal Gradients .......................................................64 Transverse Temperature Effects ..................................................65 Analytical Techniques............................................................65 Materials........................................................................66 Meteorological...................................................................66 Other Related Categories.........................................................66 Bridge Plans and Other Revelant Information.....................................67
PART II
APPENDIX A Design Guidelines for Thermal Effects in Concrete Bridge Superstructures ........................................................68
APPENDIX B Commentary on Design Guidelines for Thermal Effects in Concrete Bridge Superstructures..........................................................73
APPENDIX C Worked Example Problems .............................................81
APPENDIX D Summary of Bridge Design Codes of Different Countries ................99
APPENDIX E Alternative Analysis Procedures for Calculating Thermally Induced Lon-gitudinal Stresses.......................................................99

ACKNOWLEDGMENTS
The research reported herein was performed under NCHRP Project 12-22 by Engineering Computer Corporation (ECC) of Sacramento, California. Roy A. Imbsen, President of ECC, served as principal in-vestigator. He was assisted by David E. Vandershaf, Structural Engineer, and Robert A. Schamber, Research Engineer. Carl Stewart was a con-sultant to ECC on this project. Richard V. Nutt, Project Manager for ECC, reviewed the work and assisted in preparing the report.

THERMAL EFFECTS IN CONCRETE BRIDGE SUPERSTRUCTURES
SUMMARY This is a report on a comprehensive study of thermally induced stresses in reinforced and prestressed concrete bridge superstructures. The study includes stresses resulting from variations in average bridge temperature and variations in temperature due to temperature gradients within the superstructure. The former types of stresses have an important effect on the performance of most concrete bridge superstructures, while the latter types of stresses have had an adverse effect on bridge performance in only a few cases—primarily long-span prestressed box girders with design optimized cross sections.
The average bridge temperature varies seasonally and/or diurnally primarily be-cause of fluctuations in ambient temperatures. The resultant expansion and contraction of the bridge superstructure can result in internal stresses if the structure is restrained. Radiational heat gain or loss can result in a nonuniform distribution of temperature through the depth or the width of a superstructure. This temperature variation is not linear and can induce stresses in two ways. First, the variations in the thermal distortions of the concrete will induce deformations perpendicular to the longitudinal axis of the superstructure which, when restrained, will result in internal bending moments. Secondly, the nonlinear variation in temperature will be restrained from inducing nonlinear distortions of the superstructure section because of the tendency for plane sections to remain plane. This will also result in thermally induced stress.
The current AASHTO design specifications contain provisions for the variation in average bridge temperature, but do not provide any guidance for considering the variation in the temperature between different elements of the superstructure. The Post Tensioning Institute (PTI) and the design specifications from several foreign countries provide methods for considering this phenomenon. Most states that consider this temperature variation during design use the methods proposed by PTI.
The methods used by PTI and several foreign countries vary considerably. One of the primary differences in these methods is the assumed variation in temperature through the depth of the superstructure. Case studies performed as part of NCHRP Project 12-22 demonstrated that temperature variations can result in significant ther-mally induced stress and that the assumed variation in temperature has a large influence on these stresses.
Based on the results of these case studies and the fact that temperature variations in superstructures were verified by field measurement, the temperature gradient shape recently proposed by the University of Illinois is recommended for design purposes in the United States. This temperature gradient shape consists of a multilinear tem-perature variation for both the loading cases of radiational heating and radiational cooling. A proposed revision to the AASHTO specifications which includes this method of considering temperature variation was drafted as part of this study.

CHAPTER ONE
INTRODUCTION AND RESEARCH APPROACH
Temperature effects on bridges can be classified into effects resulting from the seasonal and/or diurnal variation in the mean bridge temperatures and effects resulting from the variation in temperature between different elements of the bridge at any point in time. Variations in the mean bridge temperature will result in the expansion or contraction of an unrestrained bridge superstructure. If the superstructure is fully or partially re-strained by its supporting columns, piers, or abutments, iher-mally induced stresses will result. The variation in temperature between different elements of the bridge will result in rotational as well as translational distortions of the superstructure.
Rotational distortions caused by a variation in temperature through the depth of the superstructure will result in bending moments in a structure which is continuous over one or more supports. When the temperature variation with depth is non-linear, stresses will also be induced because of the tendency for plane sections to remain plane.
Traditionally, most bridges have been designed to accom-modate only the overall longitudinal movement arising from temperature strain. However, with the recent changes in bridges types, it has become apparent that temperature differentials also exist in bridge superstructures. These temperature differentials cause stresses that should be included in the design procedures. Although the current AASHTO specifications include probable temperature ranges of mean temperature conditions that affect expansion and contraction of concrete bridge superstructures, there is no recommendation for temperature differentials that may occur in superstructure sections.
Several bridge design specifications and guidelines recognize the existence of temperature gradients throughout the depth of a bridge superstructure and recommend that vertical tempera-ture gradients be considered in the design procedure. In addition, some guidelines have also recommended that temperature gra-dients be used in the transverse direction to reflect the temper-ature changes that occur between the external and internal surfaces of box girder bridges. To date various approaches have emerged, most of them requiring different shaped temperature gradients and intensities to be used in the gradient. The thermal response of a bridge involves a combination of the shade tem-perature, the intensity of solar radiation, the absorptivity of the
superstructure materials, and the depth of the superstructure. Although many researchers and code writers recognize these factors and have proposed various design specifications that include these thermal effects, they often disagree about the im-portance and refinement that should be included in the design procedure. In addition, code writers are influenced by local meteorology and construction practices. The objective of NCHRP Project 12-22 is to develop comprehensive specifica-tions and design procedures for consideration of thermally in-duced stresses and movements in concrete bridge superstructures, and to recommend those procedures that might be the most appropriate for inclusion in the AASHTO Speci-fications.
To meet this objective, the basic approach taken in this project was to review and evaluate existing domestic and foreign codes of practice, research findings, and performance data; and, on the basis of the information generated, to establish rationales for alternative approaches to the development of guidelines for consideration of thermal effects in the design of major concrete bridge structures. The salient aspects of the research are covered in the succeeding chapters and appendixes of this report. Current research results and performance data are briefly discussed in Chapter Two. Chapter Three gives a comprehensive discussion of the key parameters in the development and refinement of the design procedures for thermal effects. Bridge design codes of different countries and alternative approaches to account for thermal effects are detailed in Chapter Four. Chapter Five de-scribes several case studies that were conducted to investigate the effects produced by thermal gradients on the longitudinal and transverse fiber stresses induced in a selected group of U.S. bridges. The conclusions and recommendations summarized in Chapter Six are based on an assessment of the results of these case studies. Design guidelines and commentary are provided in Appendixes A and B, respectively. Two worked example problems are given in Appendix C. More detailed background information with respect to bridge design codes of the different countries and alternative analysis procedures for calculating thermally induced longitudinal stresses are provided in Appen-dixes D and E respectively.
CHAPTER TWO
FINDINGS-CURRENT RESEARCH AND PERFORMANCE DATA
There are only a few published accounts of concrete bridges Bridge in Germany. This two-span continuous box girder bridge
damaged by differential temperature effects. In 1965, Leonhardt is shown in Figure 1. Five years after completion of the bridge,
et al. (105) described the damage in the girders of the Jagst cracks were discovered along one of the webs, as shown in the

CROSS SECTION
E LE VAT ION
Figure 1. The Jagst Bridge in Germany (105).
figure. Crack widths of 0.2 in. (5 mm) were measured, with lateral displacements of 0.1 in. (2 mm). Initially, the damage was attributed to the effects of nonlinear temperature gradients, but subsequent more detailed investigation revealed that other contributing factors included large, concentrated prestress forces and small amounts of reinforcement to control cracking. Large ducts located in each web produced large concentrated forces which, in turn, induced high, localized tensile stresses. It is possible that a more uniform arrangement of prestressing ten-dons would have prevented the cracking. The stirrups that were provided in the webs failed to prevent the cracking. In a sub-sequent publication, Leonhardt and Lippoth (117) made rec-ommendations intended to prevent such uncontrolled cracking. They suggested that thick-walled box sections should, if possible, be avoided and that enough secondary reinforcement should be provided to control any cracks that might occur.
In 1981, Zichner (90) described the fundamentals for deter-mining temperature effects in concrete bridges and indicated
that cracks such as those shown in Figure 2 were observed in the course of thorough inspections of several bridges. The cracks located in the bottom slabs and girder stems of box girder bridges can be attributed to, among other causes, temperature differ-ences that existed within the bridge superstructure.
More recently the State of Colorado experienced cracking in the webs and bottom deck soffits of four cast-in-place, segmental, prestressed bridges. Two of the bridges are approximately 747 ft long, the third about 516 ft long, and the fourth about 449 ft long. The three longer bridges have four spans, while the shorter one has three. The three-span bridge, shown schemat-ically in Figure 3, exhibited the greatest amount of cracking. The crack patterns on the single-cell bottom deck soffit and webs are also shown in Figure 3. The largest crack width re-ported is approximately 0.13 in. (3 mm). In a report, Ellsworth and Wooley (130) state:
The temperature . . . was measured at 5:00 p.m., August 11, 1982, by the use of a wahi digital heat spy, model DHS-40X.

©
4
'CO2
!
02 —02 —02 02 —02 02 -02 — 02 '02
(')f 111 'L. .fl11IJI .III1 : 21uhhh1 I jtil1 I
top 1 2 3 I 4 S 6
Figure 2. Cracks in a multispan box girder bridge (90).
I 07
VA
This device detects infrared radiation and displays a correspond- The following morning at 8 am, the procedure was repeated.
ing temperature. Recordings were taken on the riding surface, The temperature was recorded as follows: riding surface: 50 the barrier wall and the bottom exterior slab. Temperatures were degrees F, exterior bottom slab: 47 degrees F. found to be 82, 72, and 60 degrees, respectively. At this time The joint opening at segment 203 and 204 was recorded at the opening of the joint between segments 203 and 204 was 1/8". This demonstrated that the temperature gradient was no-
measured at 3/8". ticeably affecting the structure.

455'- 3"
42-0"
I'-
5/8'l 20-0" _4.. 9'-3/8"
TYPICAL SECTION
. BRIDGE
301 302 303 304 305 306 206 205 204 203 202 201
NORTH ELEVATION
91 ::t-::;7
BOTTOM VIEW
I~Q\ SOUTH ELEVATION
195.61'
5
i. PIER 3
Figure 3. Miller Creek Bridge in Colorado.
The other three structures were reported to ". . . show the same cracking pattern . . . but to a lesser degree."
During an 8-year period, California (34) investigated 64 con-crete box girder structures that were over 350 ft long and had
. PIER 2
no expansion joints, i.e., the deck was continuous between the back walls of the abutments (the abutment backwalls were mon-olithic with the girders).
Twenty of these structures were over 400 ft long with three

extending over 500 ft. The objective of the investigation was to determine if shrinkage, elastic and plastic prestress deformation, and temperature effects adversely affected the serviceability of the structures. The investigators relied on unusual cracking as the primary manifestation of adverse effects.
Unusual cracking was found in only 20 bents, and that only at the top of one or more columns. These cracks were horizon-tally oriented and in the area that is in tension when the structure shortens. There were also horizontal cracks near the top of 12 abutment walls. None of the cracks measured more than 0.01-in. in width. None of the decks, exterior webs, or soffits showed any signs of unusual cracking.
Temperature probably helped develop these cracks in the columns, but so did shrinkage and prestress deformation. It was not possible to determine how much each of these factors con-tributed to the unusual cracking.
Other reported cases of thermal-caused stress in structures are included in a report by Lanigan (109) on construction joints
opening in webs of a box girder bridge and in a report by Huizing et al. (110) on the falsework collapse of a continuous box girder bridge.
White (20) of Great Britain concluded that the British design practice prior, to 1979, which made no specific provisions for temperature differentials, in general resulted in adequate ac-commodation of temperature effects. While surveying reported problem of temperature differentials in highway structures, he found that there were no recorded cases of temperature-caused distress in his country. He concluded: "It appears that the lack of information in the British Isles is either because any cases of temperature damage which have occurred have not been pub-lished or because temperature damage has not occurred, the latter implying that the effects of nonlinear differential temper-ature distributions have been unintentionally allowed for in the design process (i.e. the other design loadings are too severe and/ or the design criteria too conservative)."
CHAPTER THREE
FINDINGS-HEAT EXCHANGE AND THERMAL EFFECTS
HEAT ENERGY EXCHANGE ON CONCRETE BRIDGE SUPERSTRUCTURES
Any structure exposed to the atmosphere is subjected to an exchange of heat energy between the surface of the structure and its surrounding environment. A bridge is continually gaining or losing heat which produces both seasonal and diurnal vari-ations. The amount of heat energy exchanged is dependent on many factors. There are three principal mechanisms of heat transfer: (1) radiation from the sun and reradiation between the surrounding environment and the structure itself, (2) convection of heat between the surface of the structure and its surrounding environment, and (3) conduction of heat between the surface of the structure and its surrounding environment
Heat Transfer by Radiation
Heat transfer by radiation is generally considered to be the most important of the three mechanisms. During the daylight hours when the structure is exposed to the sun, especially during the warm summer months, a net gain of heat energy occurs through the depth of structure, primarily as a result of the solar radiation impinging on the surfaces of the structures. Con-versely, primarily as a result of reradiation to the surrounding environment of the heat energy stored in the structure, a net loss of heat energy occurs during the night. During the summer, the temperature in the top surface of the bridge deck is warmer than the soffit, which results in a positive gradient. Negative
gradient develops on typical winter nights when the top surface is cooler than the soffit. The intensity of the solar radiation reaching the surface of the earth is dependent on the angle at which the radiation passes through the atmosphere and the length of daylight time. This intensity is dependent on latitude and has an annual variation, as shown in Figure 4. In addition,
25000 - I 200001
ii
24-
; •5000
••1 0 X 1000
4 A S 0 NO 4 F U A U 4
Month
Figure 4. Variation in solar radiation for various latitudes. (Source: Ref. 98)

7
the intensity of the solar radiation reaching the surface of a bridge is dependent on several other factors, each pertaining to the condition of the earth's atmosphere. These factors are shown diagrammatically in Figure 5. The intensity of solar radiation varies daily, as shown in Figure 6. Moreover, because of the poor thermal conductivity of concrete, these diurnal variations result in temperature gradients within bridge superstructures.
As shown in Figure 5, the radiation which penetrates the atmosphere and reaches the surface of a bridge deck has two primary effects. It may be reflected or it may penetrate the surface, be absorbed and converted to heat. The amount of absorbed radiation in a bridge structure is dependent on the type of surfacing. Various media absorb different quantities of radiation. Colored bodies are distinguished by their selective
SURF
SOLAR RADIATION
Jr Jr
CONVECTIVE HEAT GAINED I FROM ATMOSPHERE 'R REFLECTED INCIDENTAL SOLAR
I III NET HEAT GIVEN OFF BY I SOLAR RADIATION
OUTSIDE SURFACE BY I
CONVECTION AND RADIATION
RADIATIOION/
II liii
BRIDGE DECK
, WINTER SUMMER
-- ABSORBED SOLAR
- -- RADIATION
HEAT FLOW INTO DECK FROM OUTSIDE SURFACE
REFLECTED
RADIATION
Iw o LL.II
C.) ZID o
51(0 cDW
Q:II-
-J oz (00
uja REFLECTED
/ RADIATION
/ GL
HEAT STORED IN
EARTH
EARTH'S SURFACE ABSORBED
RADIATION
Figure 5. Solar radiation reaching the surface of a bridge.
I - Soler Ti.,.. -
Figure 6 Variation in solar radiation for a clear day. (Source: Ref. 98)

absorption of different wavelengths of light. A body which ab-sorbs all wavelengths is defined as a "blackbody." Concrete structures function as "gray bodies" because they absorb only a certain amount of wavelength and reflect the remainder. Emer-son (21) has investigated the amount of radiation absorbed on bridges having various amounts of surfacing. Emerson con-cluded that the influence of the depth of deck surfacing should also include the shape of the cross section. Priestley (16) in-vestigated the effects of white surfacing, black surfacing, and no surfacing on a one-quarter scale model of a box girder bridge. The maximum surface temperatures of the concrete were found when the deck was unsurfaced. The white surfacing was found to yield the lowest temperatures. The temperatures yielded by the black surfacing were about 10 percent lower than those occurring in the unsurfaced concrete. This difference was due to the insulating effect of the top, black layer, even though it had a greater absorptivity of radiation than the base concrete surface.
Heat Transfer by Conduction and Convection
In addition to the heat transfer by radiation heat transfer by conduction and convection also takes place at the structure surface. However, because the heat transfer by conduction alone is small, it is difficult to assess. Therefore, it is normal to allow for heat transfer by conduction and convection by assuming a single, combined coefficient sensitive to wind velocity, ambient air temperature, and surface temperature.
Overall Heat Energy Exchange
Once the variables governing the heat exchange have been defined and quantified and the expressions governing the surface boundary conditions have been developed, the temperature dis-tribution throughout the structure may be calculated. To help the bridge designer establish these boundary conditions, re-searchers have developed various expressions for the heat-energy exchange at the surface of a structure.
THERMAL EFFECTS ON BRIDGE SUPERSTRUCTURES
Having established the parameters governing the heat ex-change at the boundaries of a bridge, the temperatures within the structure may be determined. A bridge superstructure is continually gaining and losing heat which produces both sea-sonal and diurnal variations in the bridge, variations that are of concern to the bridge designer. Provisions for seasonal var-iations are included in the design of bearings, hinge seats, and substructure components that are connected to the superstruc-ture. The mean temperature of the superstructure is used in this case.
Thermal Properties of Concrete
The thermal coefficient of expansion for concrete is greatly dependent on its aggregate type and mix proportions (76, 96, 97). The cement paste of normal concrete usually has a higher thermal coefficient of expansion than the aggregate in the mix,
but because the aggregate occupies about 75 percent of the volume, it is the aggregate's thermal exansion characteristics that dictate the volumetric change during a temperature change. It is believed that a concrete's thermal coefficient of expansion is about equal to the weighted average of the thermal coefficient of its ingredients. Variations in coefficients for a particular mix are caused by the original water/cement ratio, method of curing and moisture content, and age at the time of interest.
Most codes specify an average thermal coefficient of 0.000011 to 0.0000121°C (about 0.0000061°F) for reinforced concrete. Actual coefficients from laboratory tests on concrete samples, given in Table 1, vary as much as 22 percent above and 64 percent below the higher value, depending on the aggregate type.
Aggregates are often complex in terms of mineral content, while the minerals vary widely in thermal characteristics (96). For examples of the mineral variations, siliceous minerals such as quartz have a coefficient of approximately 12 microstrain/ °C, whereas calcite, which is present in many limestones, has a coefficient from 1 to 5 microstrain/°C. Thus, the thermal ex-pansion coefficient of rocks having a high percentage of siliceous minerals is higher than those having a high percentage of calcite.
Rocks are usually grouped according to their primary mineral. The secondary mineral can vary both in type and amount; hence, rock groups from different sources (parts of the country, or on a more broader base the world) can have different thermal coefficients. Accordingly, rock groups are sometimes listed with a range of thermal coefficients, as given in Table 2.
Table 1. Thermal coefficients of concrete (.0000011°C).
AGGREGATE REPORTER
TYPE PCAa EMERSON' BROWNC ONTARIO
Quartzite 12.7 11.7-14.6 12.8 Quartz 11.9 9.0-13.2 Sandstone 11.7 11.7 9.2-13.3 11.7 Gravel 10.8 13.2 9.0-13.7 13.1 Granite 9.5 9.6 8.1-10.3 9.5 Dolerite 9.6 9.5 Basalt 8.6 7.9-10.4 Marble 4.4- 7.4 Limestone 6.8 7.3 4.3-10.3 7.4
° Building Movements and Joints, 1st Ed., Portland Cement Association, Skokie, Illinois, 1982.
M. Emerson, "Bridge Temperatures for Setting Bearings and Expansion Joints, TRRL Supplementary Report 479, Berkshire, England, ISSN 0305-1315, 1979.
R. D. Brown, "Properties of Concrete in Reactor Vessels," Conference on Prestressed Pressure Vessels, F1'oc., Institute of Civil Engineers, London, 1968.
Ontario Highway Bridge Design Code and Commentary, Ontario Ministry of Transportation and Communications, Ontario, Canada, 1979.
Table 2. Thermal coefficients of aggregates (.000001/°C).
AGGREGATE DEPT. OF _________ REPORTER TYPE INTERIORa BROWNb PCAc FHWAd
Quartzite 3.4 7.0-13.2 13.1 6-7 Sandstone 3.1 4.3-12.1 11.9 6-8 Gravel 10,6-12.8 4.5-7 Granite 2.4 1.8-11.9 1.8-11.9 4-5.5 Basalt 1.7 4.0-9.7 8.1 4-5 Marble 2.2 2.2-16.0 1.1-16.0 Limestone 2.4 1.8-11.7 3.4-11.5 2.5-4
° Concrete Manual, 7th Ed., U.S. Department of the Interior, Bureau of Reclamation. D. Brown, "Properties of Concrete in Reactor Vessels," Conference on Prestressed
Pressure Vessels, Ft'oc., Institnte of Civil Engineers, London, 1968. o Building Movements and Jointx 1st Ed., Portland Cement Association, Skokie, Illinois,
1982. G. Fattal, T. A. Reinhold, and B. Ellingwood, "Analysis of Thermal Stresses in Internally
Sealed Concrete Bridge Decks," Report No. FHWA/RD-80/085, Center for Building Tech' nology, National Burean of Standards, April 1981.

Another reason for some of the reported differences by dif-ferent testers within an aggregate group could be due to the method of testing (96). The curing method used on the test sample, the moisture content of the sample at the time of testing, its size, and the rate in which the temperature is changed all influence to some degree the resulting thermal coefficient of expansion. Variability in these factors among the various tests would, in itself, cause some variability in the results.
The presence of reinforcing steel in most in-service concrete because of a possible difference in their thermal coefficients probably causes a composite coefficient of the mass that is unlike either the steel's or the concrete's. It is thought that the max-imum effect on the concrete's thermal coefficient by the presence of steel reinforcement is no more than 10 percent (96).
Because of the wide range of aggregate's thermal character-istics and the various factors that influence the thermal coef-ficient of concrete, it is difficult to predict with a high degree of accuracy the actual thermal coefficient of expansion for a concrete without extensive material testing. Even with testing of the materials to be used, it should be recognized that there will likely be a difference between the test and actual field results.
Temperature Range
Mean or effective bridge temperatures are associated with the long-term (seasonal) movements of a bridge. These movements may require the use of expansion joints, but the current trend is to eliminate joints where possible and allow structural ele-ments, such as column and abutments, to absorb temperature-induced movement. The AASHTO Design Specifications pro-vide values for a rise and fall in average bridge temperature as a function of superstructure material and the surrounding type of terrain. Other bridge codes also provide guidelines for cal-culation of overall longitudinal movements by specifying a range of temperatures that depends on the geographical location and form of construction. The specified range of effective temper-ature represents the average range to be considered in design. Unusual conditions, such as frost pockets and sheltered, low-lying areas, may require that there be some adjustments to a given range of effective temperatures.
Emerson (81) defines the effective temperature of a bridge as that temperature which governs the longitudinal movement of the bridge deck. The effective temperature may be derived by performing a calculation which includes both the product of the areas between isotherms and their mean temperatures di-vided by the total area of cross section of the deck. Emerson (43) and Black (27) have correlated the extreme values of the effective bridge temperature with shade temperatures. Emerson correlated the shade temperature with the temperatures obtained from structures instrumented with thermocouples, and Black correlates shade temperature with bridge movements to obtain the extreme values of effective bridge temperatures.
Temperature Differentials and a Review of Analytical Studies to Determine Temperature Distribution
Because of the poor thermal conductivity of concrete, diurnal temperature effects produce temperature gradients in a concrete bridge superstructure. As mentioned earlier and explained in greater detail under "Response Analysis," these gradients will
result in rotational distortions that will produce stresses in the superstructures. Large, positive temperature gradients occur during days with high solar radiation, clear skies, a large range of ambient temperatures, and a light wind. Negative temperature gradients develop during periods associated with evening con-ditions. The temperature gradients that form are governed by heat flow through the body and are a function of the density, specific heat, and thermal conductivity of the concrete.
The general heat flow equation which governs the transient heat flow within the boundaries of the bridge superstructure is expressed as:
&T k [82 T 82T 82T1 (1)
where T = temperature of the mass; t = time;
x,y,z = direction in the Cartesian coordinates; k = thermal conductivity; p = density; and c = specific heat.
Various researchers have reduced Eq. 1 from the general three-dimensional heat-flow equation to both two-dimensional and one-dimensional heat-flow equations. A two-dimensional heat-flow analysis includes both the vertical and transverse heat flows in the given bridge superstructure. However, one-dimensional heat flow in the vertical direction is generally considered to be sufficiently accurate to conduct most bridge superstructure anal-yses. Since the 1965 report by Leonhardt, Kolbe, and Peter (105), in which they describe the distress apparently caused by nonlinear temperature distribution in the Jagst bridge (see Fig. 1), there have been many research studies on the thermal re-sponse of bridges subjected to diurnal temperature variation caused by solar radiation.
Tests conducted in Japan by Narouka, Hirai, and Yamaguti (62) in 1955 on a composite steel bridge verified that there were nonlinear temperature gradients through the depth of the con-crete deck. The maximum measured temperature gradient was about 16°F.
In 1957, Barber (63) presented a formula to estimate the maximum pavement surface temperature. The formulation in-cluded the relationships between pavement temperature, air tem-perature, wind speed, intensity of solar radiation, and the thermal properties of the pavement materials. In 1961, Zuk (64) developed a rigorous method for computing thermal stresses and deflections in statically determinate composite steel bridges. This method made it possible to estimate the stresses and strains resulting from linear temperature gradients over the bridge cross section. Liu and Zuk (65) extended this work in 1963 to include the temperature effects in simply supported, prestressed concrete bridges. This model included the change in prestressing force caused by the change in temperature of the tendon. Tempera-tures of the tendon were assumed to experience the same tem-perature as the surrounding concrete. Results of the study indicated that the change in the prestressing force varied from —3 to 5 percent of the initial prestress. Temperature-induced stresses were computed to be approximately 200 psi in compres-sion and 100 psi in tension.
In 1965, Zuk (67) attempted to predict the maximum bridge

10
surface temperature for the Virginia area by using a modification of the equation originally presented by Barber (63). He also presented an equation for determining the maximum tempera-ture differential between the top and bottom of a composite steel bridge. Good correlation was reported between the mea-sured and computed values. Field tests further confirmed the accuracy of Zuk's equation in determining the nonlinear tem-perature distribution through the concrete deck. Temperature distribution in the steel beams was either uniform or varied. The computed maximum temperature differential was 24°F, compared to the measured temperature differential of 23°F. In addition, good correlation was obtained between the calculated maximum deck temperature of 102°F and the measured value of 98°F.
In 1969, Wah and Kirksey (66) reported the results for a study that included the theoretical development experimental model and field tests for a simply supported, reinforced concrete bridge. Equations were developed to predict the thermal stresses and deflections in a beam-slab bridge. Field tests were performed on two summer days and one winter night. A significant dis-crepancy was found between the measured and the theoretical deflections, which was attributed both to the inability of the theoretical analysis to accurately include the actual temperature distribution and to the deviation of the actual bridge from the model of the bridge. Wah and Kirksey reported that tensile stresses as high as 1,500 psi were computed from measured strains.
Priestley (57, 58) analyzed the effects of several assumed thermal gradients and compared the results with measured data available at the time. One of the assumed thermal gradients consisted of a linear temperature distribution through the top deck slab, as proposed by Maher (56) and as supported by measured temperatures from three bridges located in the British Isles (59, 60, 61). Other assumed thermal gradients included the temperature distribution proposed by the Ministry of Works of New Zealand and distributions in which temperatures vary with depth as second-, fourth-, and sixth-degree parabolas. The sixth-degree parabola was found to be in good agreement with measured data, and its use was recommended for superstructure depths between 3.94 and 4.92 ft (1,200 and 1,500 mm).
In 1973, Emerson (21, 83) described a method to calculate the one-dimensional heat flow within a concrete-slab bridge by using an iterative, finite-difference solution scheme. The method related the bridge temperature to solar radiation, ambient air temperature, and wind speed. The model of the structure in this case is composed of several layers, and a starting time is assumed, at which point the equations governing the boundary conditions are applied. The assumption of boundary conditions requires an estimatjon of the times at which the nonlinear differential dis-tribution is at a minimum. It is further assumed that the tem-perature throughout the structure is a constant at this time. Emerson (83) estimated that for concrete bridges the beginning time was 0800 hours for the heating phase and 1600 hours for the cooling phase. By using these input parameters, a nonlinear differential temperature distribution was computed at 15-mm intervals until a maximum gradient was reached at approxi-mately 1500 hours. Temperatures predicted by the model cor-related well with measured prototype summer and winter temperature distributions.
In 1973, Lanigan (109) developed a two-dimensional, heat-flow, finite element program and found good agreement between
theoretical temperature distribution, measurements on labora-tory models, and prototype structures. In this case, heat flow along the longitudinal axis of the bridge was ignored.
In 1974, Berwanger (74) modified the method presented by Zuk (64) in 1961 for the composite girder bridge. The modi-fication was made to account for symmetrically and unsym-metrically reinforced concrete slabs subjected to linear and nonlinear temperature gradients. The investigation included both simple and continuous, composite girder steel bridges. Temperature-induced stresses, resulting from an assumed tem-perature differential of 45°F, was found to be significant enough to warrant additional studies. In this case, a linear temperature gradient was assumed in the concrete slab and a constant tem-perature in the steel girder.
In 1976, Priestley (60, 61) proposed a revised temperature distribution consisting of three individual parts. In the first part, temperatures were assumed to decrease nonlinearly from a max-imum of the top surface of the deck slab to a minimum at a depth of 1,200 mm. The nonlinear variation was represented by a fifth-degree parabola. The second part of the revised distri-bution applies only to a deck slab over an enclosed cell of a box girder in which case temperatures were assumed to decrease linearly. The third and final part of the revised distribution assumes a linear variation of temperatures over the bottom 200 mm of the cross section. A diagram of this variation in tem-perature is shown in Appendix D.
Priestley observed that in bridges with bituminous overlaps, the maximum temperature at the top of the concrete deck slab would decrease linearly with the thickness of the overlay because of the insulating properties of this material. Radolli and Green (55) and Zuk (67) observed that the darker bituminous surface provided greater solar absorptivity. They found that an overlay thickness of 1.6 to 2.0 in. (40 to 50 mm) would be required before the insulating properties of the overlay would offset the effect of the increased solar absorption on the temperature of the underlying concrete. Data obtained by Emerson (21), which varifies this phenomenon, are the basis for the provisions of the British Code of Practice, BS 5400.
In 1977, Will et al. (88) developed a finite-element program for predicting bridge response under temperature changes. Two programs were developed, one for the transient heat-conduction analysis, and the other for the static thermal stress analysis of bridge-type structures. The transient heat conduction program employed two-dimensional finite elements to predict the internal temperature distribution in the bridge cross section. The tem-perature distribution obtained from the heat conduction analysis was subsequently used as input into the static analysis to obtain the thennally induced movements and stresses • in the bridge. The static analysis program uses two-dimensional finite elements in a three-dimensional, global assemblage with six degrees-of-freedom at each nodal point. This program can handle skew supported bridge structures. The developed analytical proce-dures were correlated satisfactorily with measured field move-ments on two bridges. Included in the study were a three-span, continuous, post-tensioned bridge which was skewed at the sup-ports, and a two-span, pedestrian overcrossing with pretensioned beams made continuous for live loads. The measured field move-ments were slope changes measured with a mechanical incli-nometer developed by Matlock et al. (118) to measure slope changes on bridges tested for live load effects. Instead of the solar radiation, wind speed, and air temperature used by Emer-

11
son (43) surface temperatures were measured at selected time intervals and input into the transient heat-conduction analysis as boundary conditions.
Thepchatri, Johnson, and Matlock (87) conducted analytical studies by using the computer program developed by Will, John-son, and Matlock (88) and assumed diurnal variations in solar radiation, air temperature, and wind speed to predict the tran-sient temperature distribution in three types of bridge cross sections: (1) a post-tensioned concrete slab bridge, (2) a com-posite, precast, post-tensioned bridge, and (3) a composite steel girder bridge. The environmental conditions, believed to be equal to the extreme summer and winter climatic conditions of Austin, Texas, were used for boundary conditions in the two-dimen-sional finite element, heat-flow analysis. In addition, the devel-oped mathematical models were verified by conducting correlation studies on a three-span concrete slab bridge and a simply supported, girder-type reinforced concrete bridge. Field measurements of surface temperatures were correlated with the predicted temperature variations by using measured solar ra-diation, air temperature, and wind velocity in the case of the slab bridge. Extensive field test data throughout the cross-section depth were available for the girder-type bridge (87). In this case, extremely good correlation was obtained throughout the structure depth by using the two-dimensional heat-transfer model. Having verified the analytical procedures, the researchers proceeded to determine the temperature distributions on the three selected cross sections by using the extreme summer and winter climatic conditions from Austin, Texas. A maximum temperature differential of 35°F through the depth of the cross section of the 17-in, slab bridge was obtained for an extreme summer condition during the month of August. Extreme winter conditions, on the other hand, produced a reversed gradient of 9°F. Analyses conducted on a three-span, continuous concrete slab bridge indicate that during the extreme summer condition, a compression stress of 1,000 psi would occur on the top surface, whereas during the extreme winter condition, a top tensile stress of 400 psi would occur. The maximum predicted gradient for the 40-in.-deep composite concrete bridge composed of a precast, pretensioned concrete beam and reinforced concrete slab was 27°F for the summer condition. This gradient produced a max-imum compressive stress of 477 psi at the deck surface and a maximum tensile stress of approximately 400 psi in the bottom fiber of the pretensioned girder for a two-span continuous bridge. A maximum reversed gradient of 7°F was predicted for the winter condition. This gradient produced a tensile force of ap-proximately 140 psi at the bottom fiber of a simply supported span.
In 1975, Radolli and Green (55) developed a one-dimensional heat-flow analysis similar to that used by Emerson (83). Al-though acknowledging that the assumption of one-dimensional heat flow was not strictly correct, they cited comparisons in-dicating good correlations between observed and predicted tem-perature gradients obtained from a one-dimensional heat-flow analysis. They were able to use this approach to develop sim-plified formulas for use in design. Comparisons between the British Standards (12), Maher (56), the New Zealand Ministry of Works (16), and Priestley's sixth-degree parabola to an "I" girder indicate that the resulting stresses are strongly dependeht on the temperature difference and temperature gradient. Corn parisons between the gradients proposed by Leonhardt, Priest-ley, Maher and the one-dimensional heat flow were presented
for varying superstructure depths. The results were decomposed into continuity and self-equilibrating stresses. Radolli and Green proposed the use of simple design formulas for design that do not require an understanding of the temperature gradient. This is basically the approach used in the Ontario code.
Response Analysis
Having selected a given temperature gradient or loading, the bridge designer is next faced with performing the response anal-ysis. The most significant aspect of ambient thermal response of bridges is the consideration of temperature-induced strains. As with other induced deformations, such as creep and shrink-age, a temperature-induced strain does not induce stress in a member unless the free thermal expansion is restrained in some manner, as would be the case for any statically indeterminate structure. Thermal strain can occur without thermal stress; and thermal stress, without thermal strain. Because neither free movement nor complete restraint conditions exist in bridge structures, a combination of both thermal stress and thermal strain generally prevails. In particular, longitudinal tension stresses induced at the soffit of continuous bridges can be isolated as the single-most troublesome effect, though transverse thermal stresses also need to be considered, especially for box girder bridges.
Assumptions
The following assumptions are made in the development of thermal stress analyses using the one-dimensional beam theory.
The material is homogeneous and exhibits isotropic be-havior.
Material properties are independent of temperature. The material has linear stress-strain and temperature-strain
relations. Thus, thermal stresses can be considered indepen-dently of stresses or strains imposed by other loading conditions, and the principle of superposition holds.
The Navier-Bernoulli hypothesis that initially plane sec-tions remain plane after bending is valid.
The temperature varies only with depth, but is constant at all points of equal depth.
& Longitudinal and transverse thermal responses of the bridge superstructure can be considered independently and the results superimposed; i.e., the longitudinal and transverse ther-mal stress fields are assumed to be uncoupled.
This final assumption simplifies the analysis, particularly for such complex section geometries as box girders. Because of this assumed uncoupling of the response, the theory and analysis techniques for longitudinal and transverse thermal stresses are treated separately in the following sections.
Longitudinal Response Analysis
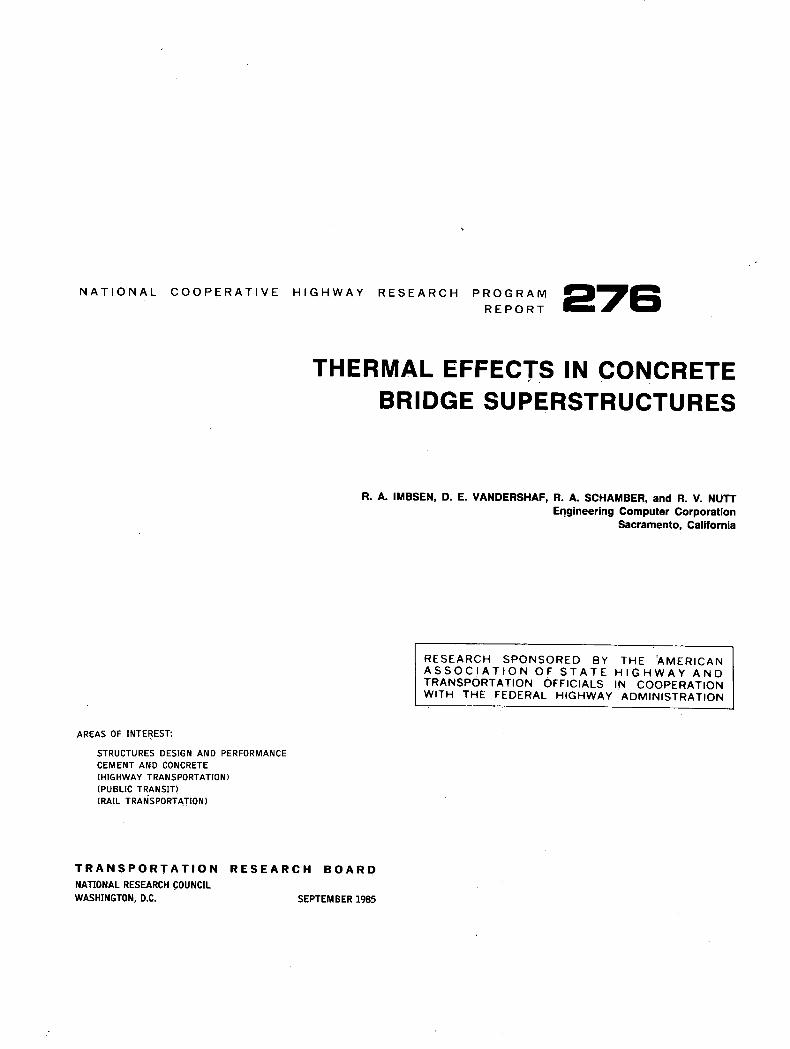
It is advantageous to separate the longitudinal thermal re-sponses into two components and superimpose the results. The bridge structure to be analyzed is first made statically deter-
12
Figure Z Arbitrary cross section subjected to a nonlinear tem-perature gradient.
Figure & Temperature-in-duced strain distribution as-suming that the section fibers do not influence one another.
(linear) strain distribution
Figure 9. Temperature-induced strain distribution.
minate by removal of sufficient internal redundancies. The stresses due to the nonlinearity of the temperature profile are also calculated. These stresses are generally called the "self-equilibrating stresses." The compatibility of the structure is then reestablished by applying the appropriate forces and moments to remove the inadmissible deformations introduced at the lo-cations of released redundancy. The stresses resulting from this action are termed "continuity stresses." Each longitudinal stress component is discussed in greater detail in the following sections.
Self-Equilibrating Stresses— Theory. Consider an arbitrary cross section subjected to a temperature field which is not plane (see Fig. 7). If such conditions exist within an unrestrained section, each of the section's fibers will tend to deform in such a way that the section will not remain plane (see Fig. 8). This deformation, however, violates the Navier-Bernoulli hypothesis stated earlier. Because of this, only a portion of the temperature field is responsible for the section's deformation, and the final strain profile must be linear as shown in Figure 9.
The differences between the thermal strains which would result from a free expansion of the section fibers and the strains in the resultant plane section give rise to what are termed self-equilibrating stresses (see Fig. 10). By definition, the sum total of these stresses across a section and the bending moments resulting from these stresses is zero. The procedure for deriving expressions for the self-equilibrating stresses, based on the as-sumptions discussed under "Assumptions," consists of the stresses in an artificially restrained structure, plus stresses re-sulting from axial loads and bending moments that would be required to remove the artificial restrains. (Note that in the sequel, compressive stresses are taken as positive.)
Figure 11 shows an arbitrary cross section and vertical tem-perature distribution of a typical member. As noted under the heading, "Assumptions," it is assumed that the temperature varies only in the vertical direction. Full restraint is provided at the ends of the member by the bending moment M and the axial force P.
1 _
TM
Free thermally - Strain Final (linear) induced strain Difference strain distribution
Figure 10. Strain difference that results in the self-equilibrating stresses.
FM P
Figure 11. Typical member with an arbitrary cross section and vertical temperature distribution.
ly
Neutral - -. axes
LbY

13
For a fully restrained member subjected to a nonlinear tem-perature-induced strain, the longitudinal stresses are given by
o,(Y) = EaT(Y) (2)
where a-,(Y) = longitudinal stress at a fiber located a distance Y
from the center of gravity of the cross section; E = elastic modulus; a = coefficient of thermal expansion; and
T( F) = temperature at a depth Y.
Since the self-equilibrating stresses act only on an unrestrained (statically determinate) structure, the conditions of longitudinal and flexural restraint shown in Figure 11 must be removed. The restraining axial force P. based on the stress distribution given by Eq. 2, is determined from
P = fy
Ea T(Y) b(Y)dY = I
o-,(Y) b(Y)dY (3)
and the stress associated with this axial force acting on the cross-sectional area A is given by
P o(Y) (4)
where b( Y) = net section width at height Y. The restraining end moment M can be evaluated from
M = I
Ea T( Y) b ( Y) YdY = I
o-,(Y)b(Y)YdY (5)
and the longitudinal stress associated with this moment is given by
MY (6)
For a long, thin member without end restraints, the longitudinal self-equilibrating stress is obtained by applying the negative of both the restraining axial force and the restraining end moment to the stress distribution given by Eq. 2. Thus using Eqs. 2, 4, and 6 yields
o(Y) = o-(Y) - o(Y) - cr,,,(Y)
or
cr(Y) = EaT(Y) - P - - MY
(7) A I
This summation of stresses is shown graphically in Figure 12. Notice that if the temperature variation is linear, no self-equil-ibrating stresses will exist.
Continuity Stresses. To calculate the continuity stresses, a sufficient number of internal redundancies are first removed for the purpose of making the structure statically determinate. The inadmissible deformations induced at the locations of removed
T r + +
Figure 12. Distribution of self-equilibrating stresses.
redundancies are then eliminated by the application of appro-priate forces and moments. The stresses induced by this rees-tablishment of compatibility are known as continuity stresses.
The magnitude and distribution of the continuity stresses are, of course, dependent on the particular bridge structure and support conditions being analyzed. Nonetheless, the total state of stresses, which is obtained by the principle of superposition, is the sum total of the self-equilibrating and continuity stress sets.
Transverse Response Analysis
Although transverse thermally induced stresses may be cal-culated as part of the total solution, for more complex sections it is convenient to "decouple" the transverse and longitudinal stresses, and analyze them separately. Such an approach is con-sistant with the assumptions made under "Assumptions."
Box girder bridges are the most common types requiring a transverse analysis, and are discussed in the following para-graphs.
In a box girder section, under a vertical temperature gradient, the deck slab will be subjected to greater temperature variation than the soffit. For fairly slender deck slabs (less than about 10 in. in thickness), it is reasonable to assume a linear temperature gradient through the thickness (16).
One approach (16) to analyzing the transverse response con-sists of removing the constraints imposed on the deck slab and allowing it to deform freely. As shown in Figure 13, the un-restrained thermal deformation of the heated deck slab may be thought of as consisting of two components: (1) an average transverse increase in length of AL = [La ( T 1 + T2)] 1(2); and (2) a (hogging) curvature of iji = [a(T 1 - T2)]/(h), in which T ] and T2 are the temperature increases of the top and bottom surfaces of the deck slab relative to the soffit slab; L is the distance between web centerlines; and h is the deck slab thickness.
In this unrestrained state, no primary thermal stresses are induced because the temperature gradient is linear, and the fi-nal strain profile is identical to the unrestrained thermal strain profile.
Secondary thermal stresses will, however, be induced by re-straint of the deck slab elongation and curvature. The elongation can be treated as an initial lack-of-fit problem, in which the section is in equilibrium with the initial free elongation of the

14
ii
AL L 14Lt To __
1' TZ
- - - - - - - - - - — -7- -
Figure 13. Top figure shows thermally induced deck slab elongation; bottom figure, thermally induced deck slab curvature.

15
deck slab. Stresses induced by restraint of the curvature are analyzed by calculating the moments required to fully restrain the rotation, then releasing the deck-slab/web joints and per-forming a moment distribution around the section. Total trans-verse stresses are the sum of those resulting from restraint of the elongation and the curvature. The relative magnitude of the two effects depends largely on the relative stiffness of the webs and deck slab (16), and it must be noted that the section has tacitly been assumed to be uncracked.
A second approach to analyzing the transverse response con-sists of both hand calculations and computer analyses. The following steps are involved in the procedure.
On the basis of the configuration of the bridge cross section, an equivalent mathematical model is developed (using beam elements) for subsequent static plane frame analysis.
All degrees of freedom are constrained by imposing arti-ficial restraints at all the nodal points.
The thermal gradient is applied to the restrained structure and thermally induced stresses are computed across the member cross section. These calculations are performed by hand.
On the basis of the applied thermal gradient, fixed-end forces and fixed-end moments are computed.
The negative of the fixed-end forces and that of the mo-ments are applied as concentrated nodal forces and couples. This removes the artificial constraints imposed in step 2.
Stresses are obtained from a computer analysis using the applied loadings determined in step 5.
The stresses determined in steps 2 and 6 are now summed together.
Interaction Between Longitudinal and Transverse Thermal Stresses
In the foregoing discussion the longitudinal and transverse stresses have been treated separately. The assumed uncoupling is, however, an approximation and the actual thermally induced stresses will be somewhat higher than those computed.
As presented by Priestley and Buckle (16), an approximate allowance for the interaction resulting from Poisson's ratio, v, effects can be obtained by adding v times the bending component of the longitudinal stress to the transverse stresses, and vice versa. It was further pointed out that these revised longitudinal stresses will have little influence on the curvature, provided the neutral axis of the cross section is a reasonable distance below the deck slab, since the net longitudinal compression in the deck slab remains unaltered.
The interaction of stresses discussed above assumes isotropic material behavior; thus, if the deck slab is conventionally rein-forced in the transverse direction, and therefore subject to crack-ing, the concept of Poisson's ratio no longer has meaning. In such a case it is more reasonable to ignore the interaction be-tween longitudinal and transverse stresses.
Available Meteorological Data
Climate is a measure of the typical atmospheric conditions at a specific location and is determined from meteorological
data collected over a period of years. Particular aspects of cli-mate may be quantified in terms of statistical information about temperature, precipitation, wind, solar radiation, or other mea-surable atmospheric phenomena. This type of information is important for many planning, engineering, and scheduling pur-poses. Within the United States this information is collected and analyzed by the Environmental Science Services Admin-istration (ESSA). This agency publishes a useful summary of climatic information (98). Figures 14 and 15, which are ex-amples of the types of information available, indicate the dis-tribution of normal daily average temperature and normal daily range of temperature, respectively, for the month of January.
Detailed climatic information is important when designing for potential thermal effects on bridges in a country with the climatic diversity of the United States. A similar condition exists in several other countries. Code writers in at least two of these countries have recognized the need to incorporate detailed cli-matic information in their thermal design procedures. The Brit-ish Design Standard provides isothermal maps of maximum and minimum shade air temperature, while the Ontario Bridge Code uses isothermal maps of maximum and minimum daily mean temperatures. The climatic information from each of these codes varies; however, methods have been developed in each case for using the climatic data to determine fluctuations in bridge tem-perature. Although the bridge design specifications of the Amer-ican Association of State Highway and Transportation Officials do not currently use detailed climatic data, it is desirable to develop bridge design procedures similar to England and On-tario that will use the data compiled by ESSA.
There are many factors that must be considered when con-verting raw climatic data to thermal loadings for designing bridges. Besides considering factors such as the type of con-struction and local site conditions, a design code must consider the probability of extreme loading conditions. Because it is gen-erally assumed that new bridges in the United States have a useful life of approximately 50 years, it is reasonable to design bridges for thermal loads that are likely to occur within this time period. Although it may not be possible to obtain climatic data based on a 50-year return period, it is possible to adjust available climatic data to approximate data for a 50-year return period. This should be the approach used in using ESSA data for bridge design.

81 * NORMAL DAILY AVERAGE TEMPERATURE (°F), JANUA1Y
\ A
.\ 2 L Z :1 )
J
5 \ I 40
LSK
/
I
-' \ -45-r __ -16 - -
INSUFFIC' DATA •. 45\\ -, i FOR ISOLINES - -
-19 , \ I ', — H.
- '
, '' • , -. - —' - ---
(
5 -
' _—
NOTE CAUTION SHOULD BE USED IN INTERPOLATING ON
' THESE GENERALIZED RAPS. SlURP CHANGES IN SHORT DISTANCES, PAR-TICULARLY IN MOUNTAINOUS AREAS,DIJE TO DIFFERENCES IN ALTITUDE, SLOPE OF
SOIL .0" LAND, TYPE OF YBOETATIVE COVER, BODIES
"0 -- -" - - \,I -- — — 65.
AIR DRAINAGE, OF WATER, FS URBAN HEAT EFFTS. 10
LctLF
PATIERN TOO COMPLEX IN
OF - '•
ME-1 I (
HAWAII TO INDICATE ON
10'
SMALL SCALE MAPS.
25 .'- - 20 Y \__-- O, -o-'o,73
CHARTS
--.'•,,:_
- - ---- I ___ -•
-------------- ---- L- J - ' "' '"" 'ç
_______ W.
Figure 14. Normal daily temperature, January.

NORMAL DAILY RANGE OF TEMPERATURE (F), AUARY -
( F-H
21
— 2 h —1) D2
20
0 —c - -- — — PC
30
0
\\
11 0 J I - bM - - - M.2i -r( Ph, I / I TLaI.R./
,.._\ •1 2 503'". / 0
NO CAUTION SHOD 81 . . 2 THZSE GENERALIZED MAPS. - I
SHARP CHANGES MAY OCCUR I.. YINSUFFICIENT DATA iC20
IN SHORT DISTANCES, PAR- _FOR ISOLINES - - - TICULARLY IN MOUNTAINOUI
\ /"\D,IR'H, \ AREAS,DUZ TO DIFFERENCEI -- - \ IN ALTITUDE, SLOPE OF
30 •
ND TYPE OF SOIL, — I VEGETATIVE COR, BODIEI
— -------- \
OF WATER, AIR DRAINAGE, flto/I /''2O i
5 URBAN HEAT EFFECTS, ETC
/ - .,------ ' PATTERN TOO COMPLEX IN 0. N ... - F M E X I\C — rHAWAII TO INDICATE ON
'7 \SMALL SCALE MAPS.
1931-60. --
I - --l- - -
Figure 15. Normal daily range of temperature, January. .

18
CHAPTER FOUR
FINDINGS-BRIDGE DESIGN CODES AND ALTERNATIVE APPROACHES
Table 3. Summary of international design provisions for thermal effects in concrete bridges.
EFFECTIVE MEAN STRUCTURE TEMPERATURE DIFFERENTIAL TEMPERATURE—VERTICAL GRADIENT
VARIABLES
AFFECTING GRADIENT USED
TEMPERATURE TEMPERATURE CLIMATIC FOR DECK
RANGE RANGE INFORMATION NOTES METHOD USED WARMING
Based on locality Climate Moderate and In general use: Temp. lag in cold climates
USA Rise Fall massive members are mentioned-No None None (AASHTO) Mod. 30°17 40°F Structure type definitions given.
Cold 35°F 45F
USA Suggests no Assumed difference ç-T • ST
(PTI) improvements to in the temp.
of deck slab AASHTO
A specified Nonlinear temp. i— 1
New temperature van- gradient. Consider
Zealand ation is given: None None longitudinal and
120
i Rise Fall transverse effects 20°C 20°C
n Vaes Climate Isothermal maps Temp. change based Nonlinear temp. hj4_.__— T
Extremes are: Structure type adjusted for: on temp. at time of gradient h4}l T
England - 14 C & 37°C Deck surfacing retum period construction elevation local divergence T5
Minimum: - 30°C Structure type Different temp. Linear temp. A temp. differential of Maximum: 20°C Element thick- range used for gradient 5°C is assumed
Germany or 15°C if element ness None calculation of thickness > 70 cm movement. Neutral: 10°C
5C below mm. Type of super- Isothermal maps A construction Unrestrained Nondimensional curvature daily mean temp. structure of max. and mm. temp. of 15°C is superstructure based on superstructure
Canada (Ontario)
10°C above max. Depth of super- mean daily temp. usually used, curvatures depth daily mean temp. structure
Climate
Based on local Type of super- National Building Temp. rise and No specific method temp. record structure Code of Canada fall based on the is mentioned.
Canada Mm. range of Temp. lag for used as a guide temp. when con- Not specified (CSA) 40°C specified. massive members structed.
Climate
Vanies-3 ranges Climate 3 climatic regions Mean temp. based Nonlinear temp. 17 4°C used: Superstructure defined based on on climatic region. gradient. Both longi-
T 00
6 0 C Australia 0 to 50°C type latitude and eleva- tudinal & transverse -.Equal
—5 to 50°C tion stresses considered. Equal
—10 to 40°C
Based on site. In Climate Different temp. Gradient not general ± 15°C Thickness of range used for cal- required for
Japan except ± 10°C for cross-section None culation of move- concrete bridges None structures with elements ment. thick members
Formuli based on Climate Formula based on A temp. of 10°C A linear temp. A temp. differential of 10°C superstructure Thickness of latitude derived is assumed at the gradient is assumed is assumed
Sweden thickness and superstructure from temperature time of construction latitude records.
Average structure Type of structure Assumed temp. A linesre temp. A temp. differential of 15°C
Denmark temperatures vary range based on gradient is assumed is assumed from - 15 to 25°C records of past
115 yrs.
Based on ambient Climate data Usually ignored. temp.: Exposure Linear gradient
Italy Exposed: ± 15°C None used if measur- Not specified Nonexposed: able differential ± 10°C exists.
Minimum: - 40°C Design stresses Linear thermal Temp. differential of 10°C Maximum: 30°C based on long- gradient
France None Specified None term elastic modulus to consider creep.

19
Bridge design codes of different countries provide many dif-ferent approaches to help the designer account for thermal ef-fects. These are summarized in Table 3. While each approach is discussed in detail in this chapter, copies of these codes or
pertinent correspondence from the countries surveyed are in-cluded in Appendix D. The codes basically differ in the refine-ment used in determining the meteorological conditions at proposed bridge sites, the types of thermal loadings considered,
DIFFERENTIAL TEMPERATURE—VERTICAL GRADIENT OTHER DIFFERENTIAL TEMPERATURES OTHER
TEMPERATURE MATERIAL At
GRADIENT USED HORIZONTAL GRADIENT IN STRUCTURE OTHER
FOR DECK VARIABLES TEMPERATURE CROSS-SECTION PROPERTIES FOR DESIGN
COOLING CONSIDERED GRADIENT ELEMENTS THERMAL ANALYSIS REQUIREMENTS
CT: Normal concrete Minimum shrinkage and .000006 per °F. Light- temperature reinforce-
None Not applicable None None weight depends on type ment. of aggregate.
Considered for trans- 10°C difference assumed Cooling of exposed sur-
verse stresses when for worked example None faces is considered.
thick bottom slab exists
Depth of member Temp. variation ap- Crack transformed
None Thickness of black- None plies to deck slabs moment of inertia
top surface used
Deck surfacing Temp. gradients apply CT: Normal concrete
thickness to deck slabs 12 x l0°rC
T XT.
Superstructure None Limestone Agg.
thickness 7 x lO °PC
1' . Structure type
A temp. differential None None None Not specified
of 5 C 15 assumed
Nondimensional Superstructure A positive linear CT assumed to
curvature based on thickness None differential of 15°C vary with aggregate
superstructure depth in the deck slab, type and curing method.
Not specified Not specified Not specified Not specified CT: Normal density Mm. shrinkage and concrete 11 x 10-6rC temp. reinforcement
Superstructure depth Requires consideration, Temp. gradient applies CT: Normal weight
None but gives no further to deck slabs also, concrete 11 x 10-6rC guidance
CT: Reinforced None None None None concrete - .000010tC
A temp. differential Type of structure None None of —5 C is assumed
A temp. differential Type of structure Temp. differential of
of - 10°C is assumed N None 5°C assumed between inside & outside of a box girder.
Not Specified Only if measurable Only if measurable CT: .000011°C differential exists differential exists
CT: .00001/°C Long-term elastic mod-
None None None ulus used for part of temp. load

20
and/or in the methods used to accommodate these thermal 3. Cooling of exposed surfaces in relation to the interior of loadings. A discussion of the design criteria from each country thick concrete members, which can result in tensile stresses on surveyed follows, the concrete surface.
UNITED STATES
The minimum requirements for the design of bridges in the United States is governed by the design specifications of the American Association of State Highway and Transportation Officials (AASHTO). In certain cases, additional, more detailed design criteria may be used. With respect to temperature, the design recommendations of the Post Tensioning Institute (PTI) are often used in the design of prestressed concrete bridges. Many individual states have also developed their own design procedures for considering thermal effects. A survey of states performed as part of this study has made it possible to sum-marize these practices under "State Practices."
The American Association of State Highway and Transportation Officials
The AASHTO design specifications for bridges provide for a rise and fall in effective mean temperature in concrete structures. The specified normal temperature range varies, based on the type of climate. The specifications require that reduced tem-perature fluctuations be considered within massive concrete members and/or structures, but no specific guidance is given as to when and how this is to be done. Variations in the mean temperature are used to calculate stresses and movements re-sulting from the thermal expansion or contraction of the su-perstructure. A thermal coefficient of expansion for normal-weight concrete is specified. The specifications do not provide for direct consideration of temperature differentials within the superstructure. Minimum reinforcement of all exposed surfaces is required to control cracking due to shrinkage and thermal stresses.
Post Tensioning Institute
The Post Tensioning Institute recommends that temperature differentials be considered in calculating longitudinal and trans-verse stresses in bridge superstructures. In a worked example presented in their design manual, they assume a 10°C (18°F) temperature difference between the top slab and the remainder of the cross section. This will result in a loading effect, equivalent to that of an applied axial load and longitudinal moment, that will produce longitudinal fiber stresses in both simple and con-tinuous spans. This nonlinear temperature gradient produces self-equilibrating stresses in a bridge superstructure.
The Post Tensioning Institute also recommends that the fol-lowing temperature phenomena be considered in calculating transverse stress:
Rapid cooling of the top slab in relation to the thick bottom slab near the interior supports.
Higher temperatures within the interior bays of box girders due to cooling of the exposed surfaces of the cross section. An example of a difference in temperature of 15°C (27°F) is used to illustrate the transverse stresses that will result.
The temperatures used in the illustrative examples of the PTI manual are not necessarily appropriate for all bridge structures. Very little guidance is given for selecting proper temperature differentials.
State Practices
Questionnaires were sent to each of the states to obtain in-formation on their experiences and practices related to the tem-perature effect on highway structures and the remedial actions taken to accommodate these effects. A summary of the questions and responses is presented in the following paragraphs and in Table 4.
Question 1: Has your State performed any type of research or studies on temperature effects. . . ? Research reports were provided by the States of California, Illinois, Indiana, Iowa, Kansas, Missouri, New York, Oklahoma, Oregon, Pennsylvania, Tennessee, Texas, Virginia, and Wisconsin. These reports are included under the "References and Bibliography." Question 2: Have you observed any manifestation of tem-
perature-related distress in bridges? The following states commented as shown:
Colorado: Major problems have been where multispan bridges up to 400 ft have been constructed without joints. Cracking has developed in the asphalt pavement, in the joint between approach slab and abutment, or cracking of the abutment wall diaphragm due to temperature move-ments. We have built this type of concrete structure up to 400 ft without joints. The most severe problem has occurred on post-tensioned CIP concrete structure due to shortening added to temperature effects.
Kansas: Some reinforced concrete rigid frame deck girder bridges (2 girders) have shown serious cracking. Some of this might be due to temperature-related stresses. Cracking between precast segments at epoxy joints appears partially related to thermal stresses.
South Carolina: Diagonal cracks in RC Tee Beams at bearing areas; spalled narrow bent caps; cracked build-ups.
Wisconsin: Excessive cracking of concrete decks on long-span steel girders; floorbeam connection failures due to possible moments about y-y axis of floorbeams from dif-ferential thermal movements between the tie girder of long-span steel tied arches and the floor system consisting of a reinforced concrete deck on steel stringers.
Question 3: Do you apply thermal axial and/or nonlinear gradient effects when designing concrete bridge superstruc-tures? The following states commented as shown:
Alaska: So far, only on major structures, where the value of the structure justifies the cost of analysis, and the analysis techniques provide for inclusion of temperature effects. Generally, assumed temperature differentials are input into computer analyses.

Table 4. Summary of state responses to questionnaire.
STATE QUESTION
1 QUESTION
2 QUESTION
3 QUESTION
4
YES NO YES NO YES NO YES NO
Alabama X X X X
Alaska X X X X
Arizona
Arkansas X X X X
California X X X X
Colorado X X X X
Connecticut X X X X
Delaware
Dist. of Columbia X X X X
Florida
Georgia
Hawaii X X X X
Idaho X X X
Illinois X X X X
Indiana X X X X
Iowa x x X X
Kansas X X X X
Kentucky
Louisiana X X X X
Maine
Maryland X X X X
Massachusetts
Michigan - X X X X
Minnesota
Mississippi X X X X
STATE QUESTION
1 QUESTION
2 QUESTION
3 QUESTION
4
YES NO YES NO YES NO YES NO
Missouri X X X X
Montana x X X - X
Nebraska XX X X
Nevada - X X X X
New Hampshire - X X x
New Jersey X X - X X
New Mexico X X X X
New York X - - X X X
North Carolina X X X X
North Dakota X X X X
Ohio X X X X
Oklahoma X X X X
Oregon x X X X
Pennsylvania X - X X X
Rhode Island X X X X
South Carolina X X X X
South Dakota
Tennessee X X - X X
Texas X X X X
Utah
Vermont - X X X X
Virginia x X X X
Washington X x X X
Washington DC
West Virginia
Wisconsin X - X X X
Wyoming X X X X
* Montana's general comment "5ince we do not have any long span concrete structures as described in the second paragraph of your letter, Montana can not provide any useful information to the research project."
Arkansas: Thermal effects determine expansion joint sizes and bearing device type.
Colorado: Current designs for segmental concrete bridges being done by Figg & Muller include provisions for a tem-perature gradient between top and bottom of segment.
Indiana: Only in long-span concrete box girder proce-dures (40).
Kansas: Monolithic steel beam at abutments—reinforced to handle moment as well as temperature differential.
Louisiana: Thermal effects are considered in the design of beam bearing pads for expansion ends and pile stresses and girder connections for fixed end continuous girder spans. Joint design is also affected.
Maryland: Most structures are for short span. Axial forces taken into account in continuous span structures
when determining if bearing at pier should be fixed or expansion. Compare the required force to overcome friction at expansion bearing with force required to move pier col-umn some iL for given temperature change.
Missouri: On reinforced concrete box girder bridges with integral columns we include moments from thermal forces in design. No consideration of these forces is made in pre-stressed I-girder and Double Tee superstructures.
New Hampshire: We will investigate the thermal and/ or nonlinear gradient effects in our current long-span con-crete bridge design.
New York: On large box superstructures (other than AASHTO boxes) we have applied a linear temperature gradient from top of box to bottom + 1 8*F (10°C) and - 9°F
(5°C). These types of structures are very rare so it would
22
not be correct to say this is policy—just what we have used on two projects.
Ohio.' We would expect deep concrete bridges designed for us by consulting firms to be so designed.
Oregon: Slab differential used for stress analysis of trans-verse frame for box girders.
Pennsylvania: Mostly apply to the expansion and con-traction of the bridge superstructures due to temperature change.
South Carolina.' Usually only so far as determining ex-pansion joint size. Thermal expansion force taken into ac-count when single span bridges fixed at both ends to vertical abutments are necessary (rare case).
Tennessee: Our policy regarding thermal expansion and contraction is set out in Structures Memorandum 045. A copy is enclosed (see Appendix D).
Texas: We have considered thermal gradients in a brief analysis of a continuous post-tensioned segmented railroad bridge of trough shape.
D. Question 4: Other than the nominal light reinforcement placed near the surface in bridge superstructures to minimize shrinkage or thermally caused concrete cracking, does your State s design codes address thermal stresses? The following states commented as shown:
Illinois: Specifies conditions at expansion joints which may require additional reinforcement in the abutment back wall or piers.
Pennsylvania: Specifies that "Provisions shall be made for stresses and movements resulting in variations in tem-perature." A range of temperatures is given for steel and concrete structures. They also specify "Maximum Allow-able Stresses at Joints in Tensile Zone" of precast and cast-in-place segmental bridge systems for different AASHTO loading groups.
It is clear from the responses that the effects of axial length changes at expansion joints is considered to be the most serious problem by the majority of those states "concerned" with tem-perature problems. No state includes the temperature gradient effect in its normal design codes. Ten States—Alaska, Colorado, Indiana, New Hampshire, New York, Ohio, Oregon, Pennsyl-vania, Texas, and Washington—do, however, consider temper-ature gradient effects for special conditions. Only three of these states furnished the range of temperature gradients used for special conditions. New York used a top to bottom of box gradient of + 18°F (10°C) to —9°F (5°C) during stress analysis on two large box superstructures. Pennsylvania, in its 5th draft of "Segmental Bridge Interim Design Specifications," includes a temperature gradient of 40°F (22.2°C). The State of Washing-ton has followed the design recommendations of the Post Ten-sioning Institute for several major bridge structures. A summary of the design criteria followed is included in Appendix D.
NEW ZEALAND
The New Zealand bridge design criteria consider loading due to variations in the mean temperature of the structure and due to temperature differentials caused by deck heating. The design
guidelines require that the cracked, transformed section be used in all calculations involving temperature loadings.
Stresses and movements resulting from variations in the mean temperature of the structure are calculated, based on a tem-perature variation of ± 20°C (36°F) for concrete structures. The effect of bearing restraint at the superstructure-substructure interface is to be considered in calculating both stresses and movements.
The effect of temperature differentials within the superstruc-ture cross section on both the longitudinal and transverse stresses generated in the structure are also calculated. Temper-atures in the cross section are assumed to vary nonlinearly and are considered to be independent of structure type and material. The assumed maximum temperature difference and its variation due to depth depend on the thickness of the blacktop (asphalt) deck surfacing, the total depth of the cross section, and whether the structural element is exposed to the air or only one side (e.g., a box-girder deck) or a solid section exposed to the air on both sides. For webs and decks not above an enclosed cell, the temperature will vary from maximum to minimum as a fifth degree parabola over a depth of 1,200 mm (47.2 in.), measured from the deck surface. It is assumed the soffit temperature is 1.5°C (2.7°F) above minimum at the surface and that it will decrease linearly to a minimum at 200 mm (7.8 in.) into the cross section. For structural cross sections less than 1,400 mm (1,200 mm + 200 mm) (55.1 in.), the effect of deck and soffit temperatures is added. For box girder decks, a linear decrease in temperature at increased depths into the cross section is assumed. The rate of temperature decrease will depend on the thickness of the blacktop surface. These temperature differen-tials are illustrated in the design specifications included in Ap-pendix D. Deck cooling due to reradiation is not considered.
ENGLAND
The English bridge design specifications consider changes in the average temperature of the bridge as well as differences between the temperatures at various depths within the super-structure cross section. Detailed isothermal maps of maximum and minimum shade air temperatures are used as the basis for calculating temperature loadings. Shade-air temperatures from the maps are adjusted to account for variations in design return period, height above sea level, and local divergence.
Minimum and maximum effective bridge temperatures are calculated from the shade-air temperatures at the bridge site. These vary for the four different types of superstructures defined in the specifications. Effective bridge temperatures are also ad-justed to account for the type and amount of deck surfacing. The effective bridge temperature variation is used to determine the forces produced in restraining elements.
Temperatures through the depth of the cross section are as-sumed to vary nonlinearly. The variation occurs linearly between specified depths. These depths and the amount of temperature variation will depend on the total depth of the section, the type of construction, and the type and amount of deck surfacing. Two conditions are considered. The first condition is unequal temperatures that result from deck heating due to solar radia-tion. The second condition is unequal temperatures that result from deck cooling due to reradiation.
The English code also specifies the coefficient of thermal ex-

23
pansion that is to be used for normal concrete. However, a dif-ferent value is specified for concrete with limestone aggregates.
The English bridge design code uses a limit-states approach, and load factors are specified for temperature loadings in the design of specific elements for the ultimate and serviceability limit states.
GERMANY
The German bridge design code (DIN 1072) provides for variations in the mean temperature of solid concrete bridges as well as for temperature differentials within the cross section.
Variations of +20°C (36°F) and —30°C (54°F) are used to calculate stresses due to thermal expansion and contraction of a bridge superstructure with an assumed construction temper-ature of 10°C (18°F). The maximum effective mean temperature may be reduced by 5°C (9°F) in structures with elements 70 cm (27.6 in.) or greater in thickness or in structures otherwise protected from rapid temperature fluctuation. Larger temper-ature variations are considered when calculating potential move-ment at the bearings.
Temperature variations of ± 5°C (9°F) in a cross section due to unequal heating (or cooling) are also considered in the design of concrete bridges. The temperatures at a cross section are assumed to vary linearly through the depth of the superstructure.
CANADA
In the past, all bridge design in Canada was governed by the AASHTO bridge design specifications, and in many provinces this is still the case. However, two separate efforts to revise bridge design criteria have recently been completed. The prov-ince of Ontario has developed a comprehensive bridge design specification based on the limit-states approach. The criteria for determining thermal effects in this code vary considerably from AASHTO's. Another bridge design standard, produced by the Canadian Standards Association (CSA), an independent code-writing body, is not as comprehensive as the Ontario Bridge Code, but it does vary slightly from the AASHTO design spec-ifications. Each of these two design codes is discussed in the following sections.
Ontario
The recently developed Ontario Bridge Code requires bridges to be designed to resist the effects of variations in the average bridge temperature and from deformations caused by temper-ature differentials within the superstructure. The code also pro-vides requirements to counter the effect of shrinkage and creep which can produce stresses and deformations similar to those caused by temperature effects. Detailed provisions for calculat-ing variations in average bridge temperature are given. Maxi-mum and minimum effective temperatures are assumed to be a specified number of degrees above or below the maximum and minimum daily mean temperatures, respectively. The number of degrees difference depends on the type of superstructure and is adjusted according to the superstructure depth. The variations given in the coefficient of linear thermal expansion are based
on the type of aggregate and the method of curing used to produce the concrete.
In noncomposite superstructure types, the effect of a thermal gradient is accounted for by specifying an unrestrained super-structure curvature. Because both radiational heating and cool-ing of the bridge deck are considered, curvature may occur in either direction. This curvature, which varies according to su-perstructure depth, is intended to account for only the effects of linear vertical temperature gradients. The curvatures resulting from the thermal gradient effects will produce forces and mo-ments in the restraining elements of continuous bridges.
Canadian Standards Association
The National Standard of Canada, produced by the Canadian Standards Association (CSA), varies from the AASHTO bridge design specifications in that it specifically states that "variation of temperature within a structure" shall be considered when determining stresses or movements caused by thermal effects. However, the document does not give any specific guidance on how this is to be accomplished.
The temperature range to be used in calculating the effective mean temperature within a structure is to be based on weather records from the locality where the bridge is to be constructed. It is recommended that bridge designers make this determination by following the guidelines of the National Building Code of Canada. The CSA standards also mention consideration of mem-ber size and thickness in determining temperature fluctuations, but no guidance is offered in this area.
AUSTRALIA
The Australian bridge design code requires that the effect of variation in both mean temperature and temperature differen-tials within the structure be considered during design. Coeffi-cients of thermal expansion for normal-weight concrete are specified. Placement of bearings and expansion joints will de-pend on both the assumed mean temperature for design and the temperature at the time of construction.
Average temperature variations are specified in the Australian code. Specific variations depend on the superstructure type and the geographic region. Because concrete superstructures are slower to respond to ambient temperature variations than other superstructure types, the specified average temperature variation for concrete superstructures is less than for other superstructure types.
The code also specifies a bilinear, vertical temperature gra-dient that provides for a temperature differential of 24°C (43°F) between the top deck surface and the bottom of the superstruc-ture cross section. Because the effect of nonstructural surfacing on this gradient is assumed to be insignificant, it is not consid-ered. The specified temperature gradient is shown in the copy of the code included in 'Appendix D.
The Australian code also mentions the potential effects of a horizontal temperature gradient through the superstructure cross section, from one side to the other. However, no specific guidance is offered as to when or how this effect should be considered.

24
JAPAN
The Japanese bridge design specifications consider only the variation in average bridge temperature for the design of con-crete bridges, although a temperature gradient from sunny to shady portions of the cross section is required for certain types of steel bridges. The variation in the average bridge temperature to be used in calculating member forces in concrete bridges is dependent on both the bridge site and the type of bridge. A distinction is made between bridges with typical structural ele-ments and those with structural elements over 70 cm (27.6 in.) thick. Only the typical rise and fall in bridge temperatures are specified for these concrete bridge types. The code contains no specific guidance for concrete bridges on how to adjust these typical values to account for bridge site variation, although such guidance is given for steel bridges.
The code specifies the coefficient of thermal expansion to be used, and also specifies a different rise and fall of average bridge temperatures to be used when designing to account for move-ment at the expansion bearings. This temperature range depends on the type of construction and whether the bridge is located in a region of typical temperature variation or in a cold climate region.
SWEDEN
The Swedish bridge design specifications provide formulas for calculating the maximum and minimum average temperatures in concrete structures. The maximum average temperature is determined from average superstructure thickness only, while the minimum average temperature depends on latitude as well as superstructure thickness. The formulas used to determine these temperatures are based on 80th percentile maximum and minimum temperature measurements. The formulas apply to bridges between 0.1 and 2.0 in (0.33 and 6.6 ft) in thickness. An average superstructure temperature at the time of construc-tion is also specified by the code. The variation between the maximum and minimum average temperatures is used along with the specified temperatures at the time of construction to calculate the stresses and movements caused from longitudinal expansion and contraction of the bridge superstructure.
Temperature distribution in a bridge is assumed to vary lin-early through the thickness of the cross section. Both deck heating and deck cooling are considered.
DENMARK
The bridge design procedures used in Denmark take into consideration the effect of the variation in the average temper-ature of the bridge and the linear variation in temperature through the depth of the cross section. Because Denmark is a small country and the climatic variation within the country is slight, no distinction for bridge location is made. In addition to the variation in temperature through the depth of the super-
structure, the code also gives specifications for a temperature variation of 5°C (9°F) through concrete structural members, such as the side wall of a box girder.
The specified variation in the average bridge temperature through the cross section, which also depends on the type of bridge, was basically selected according to the maximum tem-perature values that were exceeded in 20 percent of the years and the minimum temperature values that were below the min-imum annual temperature value for 80 percent of the years. Based on temperature information covering a 115-year period, the average temperature of concrete superstructures is assumed to vary from 25°C (77°F) to —15°C (+5°F).
The bridge designer is to consider both increases and decreases of the outside temperature through the depth of the superstruc-ture when designing a bridge. Similarly, the variation in tem-perature through any concrete structural member is assumed to increase or decrease from the outside to the inside of the member.
ITALY
The Italian bridge design code provides for temperature var-iations based on the ambient temperature. A mean effective temperature variation of ± 15°C (27°F) for exposed structures and ± 10°C (18°F) for nonexposed structures is generally used unless more precise data are available. Usually, unless there is a measurable difference in temperature between various com-ponents, the temperature differential within the superstructure is ignored. When a difference in component temperature does exist, a linear variation is assumed.
FRANCE
The French bridge design procedures for thermal effects in-clude consideration of both the effective mean temperature in the superstructure and thermal gradients resulting from deck heating due to solar radiation.
The effective mean temperature in the superstructure is as-sumed to vary from 30°C (86°F) to —40°C (-40°F). A con-struction temperature of between 8°C and 14°C (14 and 25°F) is assumed. This will result in thermal strains in the superstruc-ture of 0.0003 for expansion and - 0.0004 for contraction. Part of the strain (due to temperature variations of ± 10°C) in con-crete structures is assumed to occur rapidly. However, because the remainder of the strain is assumed to occur over a period of time, the long-term elastic modulus should be used to deter-mine the resultant stresses. Thermal loadings are multiplied by load factors of 1.0 or 0.6, depending on whether they act in conjunction with permanent or nonpermanent loadings.
The temperature within the cross section of the superstructure is assumed to vary linearly with the highest temperature at the deck surface and the lowest temperature at the bottom of the cross section. The temperature difference is assumed to be 10°C (18°F) if it is superimposed with dead load alone and 6°C (10.8°F) when it is superimposed with other loadings.

CHAPTER FIVE
INTERPRETATION AND APPLICATION-CASE STUDIES
25
Longitudinal and transverse temperature effects were applied to a selected group of U.S. bridges in this chapter. Four thermal gradients were used for the longitudinal study, and two thermal gradients were used for the transverse study. Comparisons were made between the applied gradients and the analytical results.
LONGITUDINAL TEMPERATURE EFFECTS
Four thermal gradients, shown in Figure 16, were selected for the case studies. These gradients were selected because they are representative of those presented in Chapter Four. They include those specified in the New Zealand, Britrish, and Ontario codes. In addition, the gradient presented in the Precast Seg-mental Box Girder Bridge Manual (15) was included because it is somewhat representative of those currently being used in the United States. A summary of the bridges included in these case studies is given in Table 5. The applicable portions of the codes are those pertaining to the positive gradients that occur during the day when there is high solar radiation. For the purpose of clarity, those portions of the codes that applied to the negative gradients were omitted from these case studies.
Plots of top and bottom fiber stress versus the distance lon-gitudinally along the bridge are presented in this section for each of the case studies. In addition, section stresses are included at selected points along the bridge to show the stress variations at different depths.
The plots show that maximum fiber stresses usually occur at the pier or column supports adjacent to the abutments. Changes in superstructure cross sections due to flares in the bottom slab and girder stems and/or haunched superstructures cause sig-nificant changes in fiber stresses.
There is little correlation between the magnitudes of the stresses produced by the four thermal loadings evaluated. The temperature gradient assumed by the New Zealand code usually produced the highest stresses for both top and bottom fibers, while the temperature gradient specified in the British code usually produced the lowest bottom-fiber stresses.
In some cases, the presence of columns monolithically con-nected to the superstructure had a significant effect on the stress pattern. In addition, the characteristic shape of the stress pattern was affected by the presence of internal expansion joint hinges.
Stresses shown at simple supports and at hinges (points of zero moment) are caused by the self-equilibrating stresses that result from nonlinear temperature gradients. These stresses, which do not exist at the member ends, are generally assumed to occur at some distance from the member ends, usually at a distance assumed to be equal to the depth of the member.
The analyses were conducted for bridges assumed to have a coefficient of thermal expansion of 0.000006rF, uncracked sec-tion properties, and no reductions in thermal gradients for sur-facing, elevation, etc.
Case 1 L—Colorado River Bridge
Selection
This precast, I-girder bridge differs from box girder bridges in that there is no enclosing bottom slab on the T-shaped section. Thus the heat-flow characteristics are different from those of box girders. Also, the cross-sectional properties of this super-structure differ from those of the box girder in that the neutral axis is closer to the slab. Many bridges similar to this type are located throughout the United States. The Colorado River Bridge was selected for study because it is representative of this type of bridge.
Description
This 560-ft-long structure, shown schematically in Figure 17, contains five equal spans. The superstructure is composed of a continuous 7X-in.-thick, cast-in-place concrete deck and 7 pre-cast, pretensioned, prestressed concrete I-girders with a depth-to-span ratio of 0.056. Diaphragms are cast around the ends of
57.6°F _-27.7° F 8.1°F
fl 3.60 F BRITISH
rrj 9
7 pI8O F
USA- P11 NEW ZEALAND ONTARIO
Figure 16 Thermal gradients used for case studies.

Table 5. Summary of bridges included in case studies for longitudinal temperature effects.
LONGITUDINAL DIRECTION
CASE DEPTH/SPAN NO. NO. NO.
NO. NAME/LOCATION SUPERSTRUCTURE SUBSTRUCTURE LENGTH DEPTH RATIO SPANS HINGES FRAMES COMMENT
1L Colorado River Bridge Precast, prestressed Pier Wall 565 ft-6 in. 6 ft-3 in. 0.056 5 0 1 Representative
California/Arizona I-girder I-girder
2L West Silver Eagle Rd. Cast-in-place Double 750 ft-0 in. 5 ft-0 in. 0.037 6 0 1 Representative
Overhead, California prestressed box Column box girder
girder
3L Turkey Run Creek Br. Precast, prestressed Single 317 ft-0 in. 9 ft-0 in. 0.057 2 0 1 Segmental
Indiana segmental box Column cantilever
girder
4L Kishwaukee River Br. Precast, prestressed Single 1,096 ft-0 in. 11 ft-8 in. 0.047 5 0 1 Segmental
Illinois segmental box Column cantilever
girder
5L Columbia River Br. Cast-in-place Single 1,870 ft-0 in. 9 ft-0 in. mm. 0.053 5 0 1 Segmental &
Washington prestressed seg- Column 24 ft-0 in. max. haunched
mental box girder cantilever
6L W. Silver Eagle Rd. Cast-in-place Double 750 ft-0 in. 5 ft-0 in. 0.037 6 1 2 Falsework
OH (Falsework) prestressed box Column loading
California girder
7L East Connector Cast-in-place Single 1,104 ft-0 in. 6 ft-0 in. 0.055 11 2 3 Multiframe
California reinforced Column box girder
8L Miller Creek F1l-AK Precast, prestressed Single 445 ft-3 in. 8 ft-0 in. 0.041 3 0 1 Case history
Colorado segments/box girder Column

27
112- 0" ±
112-0 112-0' 112-0" 112-0" -
ROLLER ,.. PIN
FIXJ
1]40.5' J42.O J435
6
H 3 4 5
SUPERSTRUCTURE f'c" 5000 psi 2
SUBSTRUCTURE f'c"3250 psi
ELEVATION TYPICAL SECTION: Yb" 4.27 ft A 61.74 ft2
276.57 ft 4
PIER: 1 58.92 ft 4
1'- 3"
PIER WALL
SUPERSTRUCTURE a PIER SECTION
Figure 17. Case iL—Colorado River Bridge superstructure and substructure details used for analysis.
the precast girders and monolithic with the deck to form a continuous superstructure from abutment to abutment. The sub-structure is composed of four pier walls, each measuring over 40 ft high and 2.5 ft thick. The piers, which are fixed at the bottom and pinned at the top, are relatively flexible in the longitudinal direction. The seat-type abutments have expansion bearings that allow longitudinal movement. The structure is founded on driven steel piles.
Results
Figures 18 and 19 are plots of top and bottom fiber stresses, respectively, along a typical girder centerline. Because there are no flares in this superstructure, the stress results can be plotted simply by computing the stresses at the supports and then con-necting the plotted points with straight lines. The high-tension stresses occurring in the bottom fiber at piers 2 and 5, shown in Figure 19, are caused by the T-shaped superstructure. The Ontario code specifically calls attention to the occurrence of higher bottom fibers in T-beams because of the higher location of the neutral axis.
It is interesting to note that the stresses caused by the axial forces in the superstructure that result from the pier-wall shear restraint are less than 10 psi. Therefore, these axial force stresses are negligible. A structural model allowing freedom of longi-tudinal movement at the supports in lieu of the pinned pier would have yielded essentially the same results. Shown in Figure 20 are plots of the variation in cross-section stresses with the depth for each of the four gradients considered.
Case 2L—West Silver Eagle Road Bridge and Overhead
Selection
The West Silver Eagle Road Bridge and Overhead was in-cluded in the case studies because it is representative of the current trend of bridge designers to eliminate intermediate ex-pansion joint hinges.
Description
This structure, shown schematically in Figure 21, is a six-span, 745-ft-long bridge. The superstructure is a cast-in-place, post-tensioned, prestressed concrete box girder that has a depth-to-span ratio of 0.037. The superstructure has no intermediate expansion joint hinges and is cast monolithic with the columns to form a continuous frame from abutment to abutment. The substructure is composed of five 2-column bents ranging from 25 to 35 ft in height. The columns are pinned at the bottom and fixed at the top. The seat-type abutments have expansion bearings to allow longitudinal movement. The structure is sup-ported on cast-in drilled-hole concrete piles.
Results
Figures 22 and 23 are plots of top and bottom fiber stresses, respectively, along a typical girder centerline. In Figure 23, the

28
CASE 1L - COLORADO RIVER BRIDGE TOP FIBER STRESS
O 0 U.S.A. + NEW ZEALAND
o LI)
)< C. BRITAIN ' ONTARIO
o 0
-- (J).
/ -4------_• - - / /
(I) / ci) LLJ
/ 0- /
i-
U) --- --------------------------
0 70 140 210 280 30 420 490 560 DISTANCE ALONG BRIDGE CENTERLINE (FT)
Figure 18. Case IL - longitudinal variation in top fiber stresses along a typical girder centerline due to positive temperature gradients.
maximum tension and compression stresses are somewhat less than those found at corresponding locations for the T-shaped girder considered in Case 1L. The reason for this difference appears to be due to the additional resistance provided by the bottom slab.
The effect of the monolithic columns is readily apparent at piers 2, 5, and 6. For example, at pier 2 with the New Zealand load, Figure 23 shows that the bottom fiber stresses changed significantly from —446 psi to —326 psi. This is a result of the monolithic connection between the superstructure and the col-umn. The top fiber stresses, shown in Figure 22, are similarly changed. Piers 3 and 4 are not significantly affected because of their close proximity to the superstructure's point of zero movement.
Also evident in the bottom fiber stress shown in Figure 23 is the influence of the relatively modest bottom slab flare. For example, at the right side of span 2 with the New Zealand gradient, the bottom fiber stress changes significantly from —373 psi at the beginning of the flare to —253 psi at the end of the flare. In contrast to the bottom fiber stresses, the top fiber stresses are only slightly influenced by the presence of a bottom slab flare.
Shown in Figure 24 are plots of the variation in cross-section stresses with the depth for each of the four gradients considered.
Case 3L—Turkey Run Creek Bridge
Selection
This bridge was included in the case studies because experi-mental measurements on the thermal gradients and thermal strains were available (40). In addition, the Turkey Run Bridge was among the first of its type in the United States to be constructed by the cantilever method. Because a number of epoxied joints between the precast segments lack mild reinforce-ment, many engineers have expressed a concern about thermal stresses that could cause serviceability problems at this interface. Realizing these problems, bridge designers are currently eval-uating a variety of thermal gradient loads with which to test bridges of this type. The temperature gradients, in turn, result in additional amounts of prestressing steel.

29
CASE 1L - COLORADO RIVER BRIDGE BOTTOM FIBER STRESS
u.c.. + NEW ZEALAND
o 0 -
X C. BRITAIN ONTARO
U,
t
\ / O o \
/x
C\I
LLj
LY
70 70 140 210 280 30 40 490 560
DISTANCE ALONG BRIDGE CENTERLINE (FT)
Figure 19. Case iL—longitudinal variation in bottom fiber stresses along a typical girder centerline due to positive temperature gradients.
11T1 -400 0 +400
USA
[II -400 0 +400
England
y
-400 0 +400 Ontario
-800 -400 0 +400 +800 New Zealand
Figure 20. Case iL—variation in girder cross-section stress with depth due to positive temperature gradients (the - symbol indicates tension and the + symbol indicates compression).

R 01
117-6" 35-0' 135-0" 35-0" 120-0" 02'- 6"
2 3 4 5 6 SUPERSTRUCTURE fc 3500 psi
ELEVATION SUBSTRUCTURE fc = 3250 psi
TYPICAL SECTION: Yb = 2.85 ft A= 79.39 ft 2
289.81 ft 4
FLARED SECTION: Yb = 2.62 ft A = 88.77 ft2 I= 331.79 ft 4
BENT: 1= 25.13 ft 4
52-0
5'O" r
4L6 FLARE FLARE
' _
3-0' Lir'- ___ ¶57/8" 19' FLARE
O EIII:1:,1-4 4) COLUMN
FLARE BENTS 2-6
SUPERSTRUCTURE & COLUMN SECTION
Figure 21. Case 2L— West Silver Eagle Bridge and overhead superstructure and substructure details used for analysis.

31
0
CASE 2L - W. SILVER EAGLE RD BR TOP FIBER STRESS
o o + NEW ZEALAND
o X C. BRITAIN ONTARO
o 0.
(n
_J\
UJ0 / cio
I)
/ /
----. ---------.. -- - - - - - - - -- - - - - - - - - - - - / --
-
0 - - COX
0 100 200 300 400 500 600 700 800
DISTANCE ALONG BRIDGE CENTERLINE (FT)
Figure 22. Case 2L—longitudinal variation in top fiber stresses along a typical girder centerline due to positive temperature gradients.

t /)(
I
\\ /
K " fl-
W
a
0
CASE 2L - W. SILVER EAGLE RD0 BOTTOM FIBER STRESS
o u.S.A + NEW ZEALAND
0 X C. BRITAIN 0
Z' ONTARO
32
0 0 0
0 100 200 300 400 500 600 700 800
DISTANCE ALONC BRIDCE CENTERLINE (Fl)
Figure 23. Case 2L—longitudinal variation in bottom fiber stresses along a typical girder centerline due to positive temperature gradients.
11' ' I I r i i ii -400 0 -400 -800 -400 0 -.400 -800 -400 0 -.400 —4(JU U+IJU
USA New Zealand England Ontario
Figure 24. Case 2L - variation in girder cross-section stress with depth due to positive temperature gradients.

33
Description
This structure, shown schematically in Figure 25, is a two-span, 317-ft-long bridge. The superstructure is a precast, post-tensioned, prestressed concrete segmental box girder constructed by the cantilever method. The superstructure, which is contin-uous from abutment to abutment, has a depth-to-span ratio of 0.057. The interior support consists of a single column con-structed to be fixed against rotation at the bottom and pinned at the top. This column is supported by a spread footing on bedrock. The seat-type abutments, which have expansion bear-ings to allow for longitudinal movement, are founded on driven steel piles.
Results
Because this structure is symmetrical and contains only two spans, the column will not be affected by axial shortening of the superstructure. Thus, for the purposes of analysis, this col-umn support can be treated as a roller.
Shown in Figure 26 is a comparison of the maximum mea-sured temperature differential with the temperature differentials used for the test cases.
Figures 27 and 28 are plots of top and bottom fiber stresses, respectively, along a typical girder centerline. The fiber stress plots in this case are similar to those for the end spans in Case 2L.
The influence of the bottom slab flare is readily apparent from Figure 28. As with Case 2L, which also had a flared bottom slab, the bottom fiber stresses in this case are significantly changed, while the top fiber stresses remain basically unchanged.
The top slab thickness of this single cell box section also varies transversely, making the computations to approximate the temperature gradient somewhat more tedious and lengthy than for a cross section with a constant slab thickness.
Case 4L—Kishwaukee River Bridge
Selection
The Kishwaukee River Bridge was included in the case studies because temperature data are being recorded as part of a field investigation to determine the time-dependent behavior of seg-mental, post-tensioned, cantilever concrete bridges. Although the iemperature data are not yet available, Shiu, Danile, and Russél (46) cOnfirmed that nonlinear temperature gradients similar to those proposed by Emerson (83) and Priestley were observed in thi structure.
This bridge was one of the first of its type to be constructed in the United States. As with Case 3L, because a number of epoxied joints between the precast segments lack mild reinforce-ment, many engineers have expressed concern ábut the pos-sibility of thermal stresses causing serviceability problems at this interface.
Description
This structure, shown schematically in Figure 29, is a five-span, 1,096-ft4ong bridge. The superstructure is a precast, post-tensioned, prestressed concret&segmental box girder constructed
by the cantilever method. The superstructure, which is contin-uous from abutment to abutment, has a depth-to-span ratio of 0.047. The interior supports consist of four single-column bents constructed to be fixed against rotation at the bottom. The top of the columns are constructed either to be pinned at the su-perstructure or to allow for freedom of relative transverse move-ment. The seat-type abutments have expansion bearings to allow relative longitudinal movement.
Results
Figures 30 and 31 are plots of top and bottom fiber stresses, respectively, along a girder centerline. The fiber stress plots are similar to those of Case 2L, except that the expansion bearings at the tops of the columns eliminate any effect that would occur due to connectivity.
The bottom slab flare, which is longer and thicker than the bottom slab flare in Case 2L, has a significant effect on the bottom fiber stresses.
The British-designed thermal gradient produced bottom-fiber tension stresses that were significantly low, as shown in Figure 31. The reason is that the relatively small bottom portion of that gradient results in a larger effect on the bottom fiber stress.
Case 5L—Columbla River Bridge
Selection
This bridge was included in the case studies because it differs from the precast, cantilever segmental bridges considered in Cases 3L and 4L in that the segments are cast-in-place. In this case, the segments can be easily spliced across the joints with mild, longitudinal reinforcement, thus elminating the epoxy joints between the superstructure segments. Another reason for selecting this bridge is the variation in structure depth caused by the haunches at the interior supports. This bridge was de-signed according to the Washington State Criteria (see Appendix D) on thermal effects. For longitudinal thermal effects of box girders the criteria specify a temperature increase of 20°F in the top slab. The stresses caused by this increase in temperature are combined with dead load for a service loading. In addition, another service load condition resulting from one-half the tem-perature gradient (i.e., 10°F) is combined with the dead load and full live load.
Description
This structure, shown schematically in Figure 32, is a five-span, 1,870-ft-long bridge. The superstructure is a cast-in-place, post-tensIoned, prestressed concrete segmental box girder con-structed by the cantilever method. The superstructure, which is continuous from abutment to abutment, has a depth-to-span ratio of 0.053. The 450-ft main spans are haunched at the sup-ports. The interior supports consist of single columns con-structed to be fixed against rotation at the bottom and either fixed against rotation or free to translate with respect to the superstructure at the top. The columns are supported on deep spread footings. The seat-type abutments have expansion bear-ings to allow longitudinal movement and are founded on driven steel piles.

FLARE BENT 2
317-0'
ROLLER
2
Fl FVTION
SUPERSTRUCTURE
TYPICAL SECTION:
f'c 5000 psi
Yb 5.65 ft A= 45.42 ft 2 I = 478.13 ft 4
33-0'
FLARED SECTION 5.08 ft A= 51.89 ft 2 I = 595.80 ft 4
SUPERSTRUCTURE SECTION
Figure 25. Case 3L— Turkey Run Creek Bridge superstructure and substructure details used for analysis.

U) 0
U) U) LU
I-. U)
35
I8.0F 27F 76F
ASUREMENTS ~GREAT BRITAIN
Figure 26. Case 3L—comparison of maximum measured tem- perature gradient with those used for case studies. 27 F
I I
0 40 80 120I
160 200 240 280 320 DISTANCE ALONG BRIDGE CENTERLINE (FT)
Figure 27 Case 3L_—longitudinal variation in top fiber stresses along a girder centerline due to positive temperature gradients.

36
co CASE 3L - TURKEY RUN CREEK BRIDGE BOTTOM FIBER STRESS
u.s.A. + NEW ZEALAND X C. BRITAIN
0 ONTARIO
,A•
cr
N /
N /
-
0 40 80 120 160 200 240 280 320
DISTANCE ALONG BRIDGE CENTERLINE (FT)
Figure 28. Case 3L—longitudinal variation of bottom fiber stresses along a girder centerline due to positive temperature gradients.

IO9O 0
F
I700"
T
250-0 250-0
ROLLERk I 2 3 4
EL E VAT ION
250-0 170- 0
SUPERSTRUCTURE fc = 5500 psi
- TYPICAL SECTION: Yb = 7.37 f A 79.57ff 2 I 1533.60 ft 4
FLARED SECTION: Yb= 6.40 ft A= 94.12 f t 2 I = 2018.90 ft 4
4I-0"
I0" 91.1 I- 6"
2-I" BE NT [3--~63'-1016 5'- e75/6'
1I-6 39'-0FLARE
T
:; 1 18" 1 1-6 FLARE
SUPERSTRUCTURE SECTION FLARE BENTS 2-5
Figure 29. Case 4L—Kishwaukee River Bridge superstructure and substructure details used for analysis.

38
0
co] CASE 4L - KISHWAUKEE RIVER BRIDGE TOP FIBER STRESS
0 + NEIJ ZEALAND 0 X C. BRITAIN
ONTARIO
0 0 N
- 0
/ /
(I) / U) Li
---------- I-- U) - - -
o
0 150 300 400 600 750 900 1050 1I200
DISTANCE ALONG BRIDGE CENTERLINE (FT) Figure 30. Case 4L—longitudinal variation in top fiber stresses along a girder centerline due to positive temperature gradients.

U) U) 0 u_i 0
U)
0 0
0
39
0 0-
CASE 4L - KISHWAUKEE RIVER BRIDGE BOTTOM FIBER STRESS
(D U.S.A. + NEW ZEALAND
0
X C. BRITAIN 0
G ONTARIO U,
0 150 300 450 660 750 900 1050, 1200
DISTANCE ALONG BRIDGE CENTERLINE (FT)
Figure 31. Case 4L—longitudinal variation in bottom fiber stresses along a girder centerline due to positive temperature gradients.

870-0
450-0 450-0 450- 0
R0LLER,4 FIX FIX ROLLER
1IT 2 F I X'[T FIX , 11 ELEVATION
I 63-3
I I I l- 1-81 .0 L_ 3 (Th 16.5= 214.5
I I I I4'6 1 6 77112"~~ 9'-0 ~El~' ~-O~
260-0"
0LLER
6
- 35 FROM ABUT, SPANS I & 5 SPANS 2-4
- I-lAUNCH
SECTION L..P. Yb (tt) 4A (tt 2 ) I (ft 4 ) SUPERSTRUCTURE fc 5000 psi
I 9.00 600 2! SUBSTRUCTURE fc 4000 psi 2 9.19 6.13 121.90 375.68 3 9.60 6.41 123.23 1 1524.75 4 10.18 6.79 125.11 1751.09 5 10.90 7.18 129.14 2132.84 6 11.77 7.50 136.75 2775.83 7 12.76 7.85 45.68 3619.63 8 13.87 8.22 55.75 4706.64 9 15.10 8.65 166.35 6060.87 JO 6.44 9.13 77.24 7720.86 II 7.89 9.69 87.65 9705.54 12 19.44 10.29 1 198.45 12109.05 3 21.10 10.95 209.06 i 14971.47
14 22.85 11.66 219.50 18331.48 5 24.00 11.70 223.10 18540.00
Figure 32. Case 5L-Columbia River Bridge superstructure and substructure details used for analysis.
9-0 MIN
-8" 24-0 MAX
7" MIN 3-6" MAX
4
1/
L240" MIN
/2MAX
24-0
0 -0" FILLET-,
12 0
SUPERSTRUCTURE & COLUMN SECTION

41
Results
Figures 33 and 34 are plots of top and bottom fiber stresses, respectively, along a girder centerline. The Ontario code was not considered in this case because it was not apparent how this code should be applied to nonprismatic sections. The shape of the fiber stress plots varies significantly from the cases previously considered. It is evident that the effect of the haunch is to magnify the stresses at the midpoint of the span, where the span is least thick. The effect of the haunch on fiber stresses is similar to that of a very long, thick bottom slab flare.
Instead of occurring at the supports, as in Cases 1 L through 4L, the maximum stresses for this case occur at midspan. The tensile stresses in the bottom fibers are about twice the mag-nitude of the previous four cases, as shown in Figure 34.
Because of the magnitude of the tensile stresses in the bottom slab and their location coincident with maximum dead load and live load tensile stresses, it is evident that the design of a bridge of this type should provide for thermal gradient loadings.
Shown in Figures 35 and 36 are plots of the variation in stresses with section depth for the three gradients considered for 9-ft and 24-ft deep sections respectively.
0
co CASE 5L - COLUMBIA RIVER BRIDGE
TOP FIBER STRESS 0 U.S.A.
0 + NEW ZEALAND X C. SRITAIN
U)
o 0
/ \ A
U14e
0 / Ae
" ': .
(fl U) . LL 0
x X
-_* x x
I I I I I 0 250 500 750 1000 1250 1500 1750 2000
DISTANCE ALONG BRIDGE CENTERLINE (Fl)
Figure 33. Case 5L—longitudinal variation in top fiber stresses along a girder centerline due to positive temperaiure gradients.

42
CP CASE 5L - COLUMBIA RIVER BRIDGE BOTTOM FIBER STRESS
o U-c-11 + NEW ZEALAND
0 0-.
X C BRITAiN
L()
Cl 1-
'X x > X x
0 250 500 750 1000 1250 1500 1750 2000
DISTANCE ALONG BRIDGE CENTERLINE (FT)
Figure 34. Case 5L—longitudinal variation in bottom fiber stresses along a girder centerline due to positive temperature gradients.
I- li II fill f liii 11111 —400 0 +400 —800 —400 0 +400 +800 —400 0 +400
USA New Zealand England
Figure 35. Case 5L —9-ft deep cross section - variation in girder cross-section stresses with depth due to positive temperature gradients
(the - symbol indicates tension and the + symbol indicates compression).

43
-400 0 +400 -800 -400 0 +400 +800 -400 0 +400 USA New Zealand
England
Figure 36. Case 5L —24-ft deep cross section - variation in girder cross-section stresses with depth due to positive temperature gradients (the - symbol indicates tension and the + symbol indicates compression).
Case 6L—West Silver Eagle Road Bridge and Overhead (Falsework)
Selection
The falsework failure that occurred in New Zealand prompted the inclusion of this case study. Huizing, Blakely, and Ramsay (110) established that the thermal loading was a probable factor contributing to the falsework failure that occurred on a section of the Karangahape Ramp A Bridge in Auckland, New Zealand. It was concluded that the tendency for longitudinal thermal hogging resulted in the redistribution of loads in the falsework bents, critically increasing the reactions at the extreme sup-porting bents. The coupling of this thermal effect with similar load redistributions resulting from the stage-prestressing process led to the eventual collapse of the falsework.
Except for an added hinge in span 3, this bridge is identical to Case 2L. The effects of thermal gradient loads were analyzed during an assumed intermediate stage of construction, i.e., shortly after casting the concrete, while one of the frames is still being supported on falsework.
This hypothetical example was selected to evaluate the re-distribution of falsework loads caused by thermal gradient strains during construction and to determine if this redistribu-tion might have a significant effect on falsework design. The effect of thermal gradients is similar to the effect of prestressing operations in that they result in a redistribution of falsework support reactions.
Description
This structure, shown schematically in Figure 37, is a six-span, 745-ft long bridge. The superstructure, which has one intermediate expansion joint hinge, is a cast-in-place, post-ten-
sioned, prestressed concrete box girder with a depth-to-span ratio of 0.037. The intermediate supports consist of five 2-col-umn bents ranging in height from 25 to 35 ft. The columns are constructed to be pinned at the bottom and monolithic with the superstructure at the top. The seat-type abutments have expan-sion bearings to allow longitudinal movement. The bridge is founded on cast-in drilled-hole concrete piles.
Results
The concrete bridge frame, which is assumed to be cured and supported on falsework, was analyzed to determine how it would be affected by the USA design temperature gradient. The false-work reactions, particularly under the expansion joint hinge, were evaluated for overload.
The analysis indicated that the only falsework posts signifi-cantly affected by the thermal loads were those at the expansion joint hinge. Depending on the stiffness and redundancy of the remainder of the falsework, the reaction at these posts due to the assumed thermal gradient alone could exceed the reaction at these posts due to dead and live loads. Therefore, if not designed for thermal effects, the posts could be subjected to compression loads in excess of twice their safe capacity. A larger thermal load, such as the thermal gradient used in the New Zealand code, would produce a correspondingly greater over-load.
This hypothetical situation seldom occurs in actual bridge construction practice. Nevertheless, falsework failures are a ma-jor problem, and it may be appropriate to incorporate provisions for thermal gradient loads into falsework design procedures.
117-6 I350"
ROLLER 1jjjjfl 25.0
2
12 iJ15"I05' 4 9 ( 15 135
745 -0"
35- 0 135-0 20-0 102-6 -
90-01,
ii 5t
7( IS'" 105 FALSEWORK SPRINGS SUPERSTRUCTURE f'c = 3500 psi
SUBSTRUCTURE f'c = 3250 psi
ELEVATION FALSEWORK SPRING = 25,000 k/ft
TYPICAL SECTION: Yb 2.85 ft A 79.39 ft2 I = 289.81 f t 4
52- 0
7 7/9 =
3-I0 =-T - FALSEWORK
QSPRING
D— 4 COLUMN
SUPERSTRUCTURE 8 COLUMN SECTION
Figure 3 Z Case 6L—falsework— West Silver Eagle Raod Bridge and overhead superstructure and substructure details used for analysis.

45
Case 7L—East Connector Overcrossing
Selection
The East Connector Overcrossing was selected to evaluate the presence of internal expansion joint hinges which will sig-nificantly change the thermal stresses in adjacent members.
Description
This bridge differs from the other cases studied because it contains two intermediate expansion joint hinges and because it is the only reinforced concrete bridge studied. Also, the abut-ments can be assumed to be pinned instead of fixed at the base of the diaphragm.
This structure, shown schematically in Figure 38, is an eleven-span, 1,104-ft-long bridge. The superstructure, which has two intermediate expansion joint hinges, is a cast-in-place, reinforced concrete box girder with a depth-to-span ratio of 0.055. The intermediate supports consist of ten single-column bents that are constructed to be monolithic with the superstructure and fixed against relative rotation at the footing. The diaphragm-type abutments are assumed to prevent longitudinal movement. The structure is founded on cast-in drilled-hole concrete piles.
Figures 39 and 40 are plots of top and bottom fiber stresses, respectively, along a typical girder centerline. The shape of the fiber stress plots is greatly influenced by the presence of internal expansion joint hinges for a distance of about one span length on either side of the hinge. This is similar to the behavior observed at the abutments in the previous cases.
This structure is somewhat different in that the abutments, rather than being on rollers, are designed to be pinned. This appears to have affected the fiber stresses less than expected. The main reason for this difference is the reversal in the direction of concentrated column moment at the bents adjacent to the abutments.
The normal flexural cracking that can be expected to develop in a reinforced concrete structure such as this will decrease the effective moment of inertia of the superstructure and relieve the fiber stresses shown.
Case 8L—MilIer Creek Bridge
Selection
This bridge is similar to Turkey Run Creek (Case 3L). It and several other bridges in the area developed severe cracking prob-lems shortly after completion of construction. Thermal gradient effects are suspected as being one of the causes of this distress.
Description
This structure, shown schematically in Figure 41, is a three-span 455-ft-long bridge. The superstructure is a cast-in-place, post-tensioned, prestressed concrete segmental box girder con-structed by the cantilever method. The superstructure, which is continuous from abutment to abutment, has a depth-to-span ratio of 0.041. The interior supports consist of single-column bents on spread footings. The bottoms of the columns are fixed
and the tops are pinned. The seat-type abutments have expansion bearings to allow relative longitudinal movement.
Results
The shape and magnitude of the fiber stress plots, shown in Figures 42 and 43, are similar to those of comparable structures previously analyzed, such as Turkey Run Creek and Kishwau-kee River. However, the magnitude of the stress results produced by the New Zealand thermal loading was much less than the other structures because of the insulating effect of the relatively thick (2%-in.) asphalt overlay.
This bridge is of special interest because the structure devel-oped relatively severe cracking in the bottom flange and girder stems at approximately the /4 and % points of span 2, as shown in Figure 3, a short time after completion of construction. Ther-mal gradient effects are thought to have been a significant con-tributing factor to this distress. The crack widths, in fact, were observed to be opening and closing on a daily basis, generally correlating reasonably well with daily temperature fluctuations.
This structure was constructed by the cast-in-place segmental balanced cantilever method. Prestress tendons are typically placed in the bottom slab within the center portion of the span to resist positive bending moments that can result because of creep after the cantilevered portions of the superstructure are tied together. In this bridge, these tendons terminated in the vicinity of the cracking. Several other similar bridges constructed nearby at about the same time have developed similar cracking patterns.
A plot showing dead, prestress, and USA thermal load stresses, as calculated by Figg and Muller Engineers, Inc., of Tallahassee, Florida (131), is shown in Figure 44. This plot shows that tensile stresses occur in the bottom fiber at the same location where the cracks developed.
Based on the details of construction and the characteristics of the observed cracking, the reasons for the cracking appear to be some combination of the following:
Inelastic redistribution of stress (i.e., increase of positive moment due to creep) was greater than anticipated.
Stress concentrations in the prestress anchorage zone. Thermal gradient stresses.
Although the primary cause of the distress cannot be precisely determined, it appears that the inelastic redistribution of stress resulting in an increase of positive moment (reason 1 above) is probably the most important single factor. Local tension stresses caused by prestress anchorages and thermal gradient stresses, although significant, are probably of secondary importance.
The cracking probably could have been avoided by extending the bottom slab prestress tendons, thus anchoring them much closer to bent 2 and bent 3, in zones of high bottom fiber compression.
In summary, it appears that the thermal gradient stresses are not the basic cause of this cracking problem, but are, however, contributing to it.

IILJtJ
60 0 96 2 97 10 10 0 110 0 110 0 110 0
T 110 0 o 110 0 80 0
PIN,FIXI! I FIX'4
2 4 5 6 7
ELEVATION
P P -II- 0- 0 1 8-0
I FLARE L FLARE
FLARE BENTS 2-4, 6-8 8 10-Il
PP P P P 12
10 II
fc = 3250 psi
SECTION (13: Yb = 3.56 ft A = 56.91 ft 2 1 = 297.22 ft4
SECTION ®: b 3.04 ft A = 69.73 ft2 I = 381.42 ft 4
SECTION Yb = 3.05 ft A = 73.54 ft 2 I = 387.53 ft 4
BENT I = 35.40ff 4
38-0
7/8
~-~j JL---~ EJ
6-0
22-0 ..
1 - 151/2 2 FLARE J
80
4- FLARE BENTS 5 8 9
I- 2L 0
SUPERSTRUCTURE 8 COLUMN SECTION
Figure 38. Case 7L—East Connector Overcrossing superstructure and substructure details used for analysis.

47
0
CASE 7L - EAST CONNECTOR TOP FIBER STRESS
0 0 U,
o : 0 ' . cj
(i o
CIO
LLJ
o 0 ' .
Z Z Z!Z' -' Z'
! Li Li' Li' — Li' rn a:
Li! rn:
Z z Z!Z' LU Li' LU—.' rn; a aL1
Z Li Li rn rn
0 150 300 450 600 750 900 1050 1200 DISTANCE ALONG BRIDGE CENTERLINE (FT)
Figure 39. Case 7L—longitudinal variation in top fiber stresses along a typical girder centerline due to positive temperature gradients.

48
01 , co CASE 7L - EAST CONNECTOR
BOTTOM FIBER STRESS
0 0 to
A rb
Cf : .
0 . I
. .
.
:1
7. 7. 7.' 27.'
2'
70
to: rat' a: at at: atr: : at:
0 0 -
' I I I
150 300 450 600 750 900 1050 1200 DISTNCE ALONG BRIDGE CENTERLINE (FT)
Figure 40. Case 7L—longitudinal variation in bottom fiber stresses along a typical girder centerline due to positive temperature gradients.

49
4551 311
42'- 0"
0 OD
I'- 8 /8'1 1 1 1 I'- 8/8"
9'- 3 5/84 20-0" 91- 3 /8"
TYPICAL SECTION
Figure 41. Miller Creek Bridge superstructure and substructure details used for analysis.

0 C'J
MILLER CREEK BRIDGE TOP FIBER STRESS
O JS (RADFNT 1EI ZEAA4D rRAFNT
+ BRi IS9 rRADiFNT
-- -4- - -- -i- -4-- -
.-#- fr— -'- - - -- -k- - -
•
/
/ : \
0'- i -- I--
0 60 120 180 240 300 360 420
DISTANCE ALONG BRIDGE CENTERLINE (FT)
Figure 42. Case 8L—longitudinal variation in top fiber stresses along a girder centerline due to positive temperature gradients.
0 c'J N-
0 Co
480

- - -
0 00
0 0
51
MILLER CREEK BRIDGE BOTTOM FIBER STRESS
O USA CRAiFNT NEJZFALA!4D AENT
-4- SRIfrI CRAD,FNT
0 60 120 180 240 300 360 420 480
DISTANCE ALONC BRIOCE CENTERLINE (Fl)
Figure 43. Case 8L—longitudinal variation in bottom fiber stresses along a girder centerline due to positive temperature gradients.
0I 0 c'J

0 0
0
52
DISTANCE ALONC BR1DCE CENTERLINE (FT) Figure 44. Case 8L—longitudinal variation in bottom fiber stresses along a girder centerline due to combined dead load, positive temperature gradient, and prestressing.
576' F
2 7' F
+ I 3.5' F
Figure 45. Thermal gradients used in the case studies for transverse temperature effects: (a) from the New Zealand Code, and (b) from Ref 15. 13.5' F

TRANSVERSE TEMPERATURE EFFECTS
53
Two thermal gradient loads, shown in Figure 45, were applied to the case studies presented in this section (see Table 6). One load is based on the provisions of the New Zealand code and the other on a 27°F linear temperature gradient imposed around the boundaries of the transverse section, as used in the illustra-tion presented in the Precast Segmental Box Girder Bridge Man-ual (15). The temperature gradient used in the New Zealand code is determined only on the basis of top slab heating due to solar radiation. The 27°F linear gradient, which assumes the exterior fibers warmer than the interior fibers, is determined on the basis of either the effect of direct solar radiation heat gain or a rapid increase in ambient temperature. The reverse case, which is based on the interior fibers being 27°F warmer than the exterior fibers, was not considered.
Plots of fiber stresses at the interior and exterior transverse surfaces of both the slab and girder stem elements along the boundary of the transverse section are included in the case studies presented in this section. The plots show the influences of variations in slab and girder thickness on these fiber stresses. Because the two applied loads are based on temperature gra-dients that are fairly diverse, there is little comparison between the resultant fiber stresses.
The analysis assumes linearly elastic material and uncracked section properties.
Case iT—Columbia River Bridge (9 Ft Depth)
Selection
This structure was included in the case studies because of the varying cross-sectional dimensions of the superstructure. The 9-ft deep section at midspan that is considered in this case has slab and girder dimensions that are representative of most box girders being constructed. A temperature gradient of ± 15°F (8.3°C) was used for the design of this bridge (see Appendix D).
Description
This structure, which is the same structure studied in Case 7L, was investigated for transverse temperature effects at the midspan cross section. This cross section, shown in Figure 46, has a transversely prestressed concrete deck slab with a depth-to-span ratio of 0.056. The slab varies in thickness, as is typical for a single-cell box girder section of this type. The slab on this 63-ft 3-in, wide superstructure spans nearly 30 ft between girders and cantilevers over 16 ft at the overhangs. The sloping girder stems are prestressed vertically and the variable thickness bot-tom slab is conventionally reinforced.
Designers frequently consider some type of thermal gradient load when designing an optimized cross section such as this.
Results
Figures 47 and 48 are plots of exterior and interior fiber stresses, respectively, in the slab and girder stem elements lo-cated along the boundary of the transverse section. The shapes
0 o -
0 F- -
-0 0,
— —
z 'C 01
Q Q '0
a 0 a
C C C
I—
x
z 00
F- C-) '0 '0
a a
a a r' oa a 00 00 _13
a - F-
a . a
( v_ cc .- .-..
a < 0) a-o ---
0) o -g-i
C) C)
a JD
E
-
L)o L)o
z I) 00 C) 00 C) 00
C-) - 2o a
a2 a2 C)00
2 to --
Z --
Q Q
a 00

54
"t r
L 90
I 71 1-6"
Ll48h/4 fc = 5000 psi
Figure 46. Case 1 T— Columbia River Bridge (9 ft depth) superstructure cross-section details used for analysis.
416_438 438 438__._..416 1342--360 360-- -----
257.- - 257 2I0-. 175 158 I58_-_ l75
1 I42 I28 128 - - 42 210
59 7Q59 70
I I' 53 69 6953
I I' BRIDGE
\lI
I
39-
II 'I
II I I
78 50 56 78 II 1
'I I I I,
I I 'I
26 67 67 264 I , I 'I II' 55ll ________ 79
- .1155 9=1 6779
15I 92--- —102— - - -- - --
151 _— 67
446 446 397--446 397
LEGEND
(D 27°F GRADIENT
® NEW ZEALAND
Figure 47. Case IT—Columbia River Bridge exterior fiber stresses (PSI) at the 9-ft depth section.

Q BRIDGE
55
-58-70
-52-69 -....-355___ 374 _ -----
49 -78 Ii II
-254-67 1-6
+7
39 22I.- I75_1-l58
- --257 II 374 -------_ 374 __..-355__ -69 -52
-438 -438 _-416
-78 -49 -446 -446.
V -151 I -151 -67 -25
--7 --------
LEGEND
(13 27° F GRADIENT
NEW ZEALAND
Figure 48. Case 1 T— Columbia River Bridge interior fiber stresses (PSI) at the 9-ft depth section.
of the fiber stress plots are similar for both load cases. The maximum stresses occur at the thinnest sections of the top and bottom slabs (midspan), while the minimum stresses occur in the girder stems. The largest difference in the magnitude of stresses resulting from these two loadings occurs in the bottom slab.
The cracking that will probably occur in the reinforced con-crete bottom slab will substantially reduce the thermal stresses at this location. Smaller stress reductions due to this cracking will also result in the prestressed webs and top slab.
Case 2T—Columbia River Bridge (24 Ft Depth)
Selection
This cross section of the Columbia River Bridge was also considered because of the rather massive slab and girder sections. Particular attention was given to the design of these sections because of the higher thermal stresses caused by the stiffer massive sections connected rigidly to the piers.
Description
This structure, which was investigated in Case IT for trans-verse temperature effects at midspan, is investigated here for similar effects at the ends of the span. A cross section from one of the identical ends of the span, shown in Figure 49, has a transversely prestressed concrete deck slab identical in design to the slab at midspan. The sloping webs, which are 24 ft deep at the ends of the span, are prestressed in the direction of the slope. The bottom slab, which is 3 ft 6 in. deep to accommodate compressive stress, is conventionally reinforced.
Results
The effects of the two temperature gradients on the defor-mations of this cross section are shown in Figures 50 and 51. Figure 50 shows the cross-section deformations caused by the temperature gradient used by New Zealand. The deformation caused by the 27°F linear temperature differential between ex-terior and interior fibers is shown in Figure 51. In both cases the top slab deflects downward contrary to what would be expected from a positive temperature gradient. This phenome-non can be explained by the overwhelming influence of the relatively stiff bottom slab. When curvatures are induced in the bottom slab due to temperature gradients, the top slab will deflect downward. Even though the positive temperature dif-ferentials in the deck slab will tend to cause upward deflection, it is not sufficient to overcome the downward deflection induced by bottom slab curvatures. Therefore, there will be a net down-ward deflection in the deck slab.
Figures 52 and 53 are plots of exterior and interior fiber stresses, respectively, in the slab and girder stem elements lo-cated along the boundary of the transverse section. The shapes of the fiber stress plots for the two load cases are different. The difference occurs mainly in the webs. The change in the web thickness near the top slab appears to have had a significant effect on the stresses produced by the 27°F temperature gradient.
The top-slab stresses are similar in shape and magnitude to those found in Case IT, indicating that the top slab stresses are not greatly affected by the webs and bottom slab.
The high web stresses resulting from the 27°F temperature gradient appear to be caused by the massive bottom slab. Any flexural cracking in the reinforced concrete bottom slab would greatly relieve these web stresses.

63-3
24- 0
Figure 49. Case 2T— Columbia River Bridge (24-ft depth) superstructure cross-section details used for analysis.

57
Figure 50. Case 2T— Columbia River Bridge deformations at the 24-ft deep cross section due to the New Zealand temperature gradient.
II I I.
\•
/1
)
/ Figure 51. Case 2T—Columbia River Bridge deformations at the 24-ft deep cross section due to a 27°F linear temperature gradient (PTI/PCI) in the members.

87
77
/ 530
698
/ 866 205 205 205
__- 507 507 507__.480
362 381 --------38l-_362
292 - l95224 224 195
58
LEGEND
o 27° F GRADIENT
® NEW ZEALAND
Figure 52. Case 2T—Colurnbia River Bridge exterior fiber stresses (PSI) at the 24-ft depth section.
866

59
-61 -87, 1 -87 -61 I II
-3 155- -139 -175 fI95_ - 227 227 .. l95 -175
-64 -77 -292 292 -77-64 'I - 366--_-386 ---------386- -- -- - -386-- --366_-
/ 1
-480--__ -507 507___480 /
157 -95 -95 57
244 -108 -108 244 \ I
BRIDGE / / -100 -100
142 142
1/
\I
-47
I - 530 -530
11 698 -698
;•33
1205 666
-205 -866
-205
LEGEND
() 27°F GRADIENT
@3 NEW ZEALAND
Figure 53. Case 2T— Columbia River Bridge interior fiber stresses (PSI) at the 24-ft depth section.
Case 3T—Hamilton Street Bridge
Selection
This structure was selected because it has a somewhat unusual cross section in that the girders are widely spaced. This super-structure was designed for a transverse gradient of ± 15F (8.3°C) between the inside and outside surfaces of the box sec-tion. Frequently designers do consider a thermal gradient load of some type when designing an optimized cross section such as this.
Description
This structure, shown schematically in Figure 54, is a ten-span, 1,467-ft-long bridge. The cross section has a transversely prestressed concrete deck slab with a depth-to-span ratio of 0.069. The slab varies in thickness over the girder webs and has
spans measuring approximately 19 ft between girders. Both the vertical girder stems and the variable-thickness bottom slab are constructed of conventionally reinforced concrete.
Results
Figures 55 and 56 are plots of exterior and interior fiber stresses, respectively, in the slab and girder stem elements along the boundary of the transverse section. The shapes of the fiber stress plots for the two load cases are different, except for the top and bottom slabs at the interior cell. Although the fiber stress plots are linear at the constant-thickness webs, they show that the increase in the thickness of the slabs at the girders causes the stresses in the slabs to be moderately magnified. Any flexural cracking in the reinforced concrete webs and bottom slab would greatly relieve the fiber stresses shown. However, that cracking would probably not significantly affect the stresses in the prestressed top slab.

78-O/4 11
ofl
¶9" f'c 4000 psi
0-0" 9' 41/4" 19'-41/4"
Figure 54. Case 3 T—Ham i/ton Street Bridge superstructure cross-section details used for analysis.

- - 544__ - -
3I5 448 — - 388 370 348 - -
306 ___- 360 3O7 -
- — 333 - - 302-208 256.381-
233 188-175 2065-_...151 12$ 13I 84 -157
S p. • -252 16 • • -- • —375
56- - I20-- _.I43..I50
BRIDGE -i GIRDER
.17593_226 I4I
20I8 15182 - - 1_I
—332 332289L 273
173 170-154
298.
________________
348__<2782 EGEN D 329-345 369 385— 361
27°F GRADIENT
(j NEW ZEALAND
Figure 55. Case 3 T—Ham i/ton Street Bridge exterior fiber stresses (PSI). -
239 • -175 I 169 - - -
153 - -- 172-177
-1231 .---
-13 / ' _A -
I --
I I
;190 /
-306 _____
-264 255 188 -175
II
415__ _4I2 360 388 -370 /
GIRDER
—(:f -369 -385:7~394
I
27 __-329 -- -213 - -
34829Q2 -241
-2!v1
-210 -!'- -154
-16
___--92. I _ -148
-241 ---------241- 215 ---- -208___-
-213 -348 _348_313
BRIDGE /
-332— -332.--. I I -289 -
--- 1
-139 ---------_I39_ I2O 69.5I33...
.1 7O--56 -174 -15 -- -
59' - - - - 171--181-- - - 192
Figure 56 Case 3T—Hamilton Street Bridge interior fiber stresses (PSI).
-217 -137

CHAPTER SIX
CONCLUSIONS AND RECOMMENDATIONS
CONCLUSIONS
Chapter Five described several case studies that were con-ducted to investigate the effect of various assumed thermal gra-dients on the longitudinal and transverse fiber stresses induced in various types of concrete bridge superstructures. Several con-clusions concerning the nature of thermal effects on concrete bridges can be drawn from an assessment of the results of these case studies.
These conclusions are as follows:
Although fiber stresses induced in different bridges by any single thermal gradient may vary in magnitude, the stress pat-terns are generally similar.
Changes in cross section have a significant effect on the fiber stresses induced by thermal gradients. In the longitudinal direction, cross-section changes usually consist of haunched gir-ders or flares in the bottom slab. Large variation in girder depth can increase fiber stresses significantly. In the transverse direc-tion, large differences in the transverse stiffness of the cross-section elements will also have a large effect.
The calculated fiber stresses were very sensitive to the type of temperature gradient assumed. While some gradients pro-duced similar extreme stresses, the differences in fiber stresses between the extreme fibers were significant. In most cases, this difference was sufficient to affect the requirements for longi-tudinal reinforcement. This was the case even in the bridges with shorter span lengths. This could be a contributing factor in some cases where concrete cracking has been observed.
In the transverse direction a temperature difference can result in transverse stresses significantly different from when such a temperature difference is ignored. These stresses can be realistically predicted by assuming a mean effective temperature in the top deck slab that is greater than the mean temperatures in the remainder of the cross section.
Temperature gradients can have a significant effect on the redistribution of falsework loads. Falsework designers should be aware of this fact, especially in light of the falsework failure in New Zealand that is attributed to temperature effects.
RECOMMENDED DESIGN APPROACH FOR THERMAL EFFECTS
Based on the results from the case studies and a review of the design approaches used in other countries, it is apparent that U.S. bridge design requirements should be expanded to include the effects of a thermal gradient. Use of the current
AASHTO procedures for considering longitudinal movement, although not based on precise temperature data, has resulted in very few temperature-related problems in concrete bridges even though thermal gradients are often ignored. This may be the case because the current AASHTO criteria for axial temperature effects are too conservative. Therefore, it would also be desirable to include a more accurate method for determlnlng seasonal variations in temperature and the effect of aggregate type and curing methods. The proposed design guidelines, included in Appendix A, were written in light of these observations.
NEED FOR FUTURE RESEARCH
Although research to date has determined the magnitude of temperature differentials in bridge superstructures, the effect of these differentials has not been clearly established. The stresses that would be theoretically developed in a bridge by the observed temperature gradients are inconsistent with the observed per-formance of these bridges in many cases. There are only a few instances of distress caused by a thermal gradient in bridge superstructures. When distress does exist, it is often in con-junction with other contributing factors, and therefore the rel-ative importance of the thermal effect is not always clear. This fact has led to considerable skepticism among bridge engineers as to the accuracy of, and need for, elaborate thermal design procedures. This is a primary reason why a guide specification is recommended rather than a modification of the AASHTO design specifications.
Field measurements of differential temperatures and thermal stresses through the sections of prestressed concrete box girder bridges clearly indicate significant differences that should be recognized and possibly addressed by the designers of such structures. Heretofore these effects have usually not been con-sidered. The lack of problems is not necessarily indicative of adequate design procedures.
It is possible that bridge structures may have some inherent strength not currently recognized or temperature-induced stresses may not be as high as theoretically predicted. Because most temperature effects result in serviceability problems that do not affect the structural strength of the bridge, more infor-mation on the effect of thermal gradients is needed before de-signers will be totally convinced of the need for elaborate design procedures. Even though very little temperature distress has been observed due to a temperature gradient, the increased use of optimum cross sections in long superstructures makes it im-perative to develop accurate methods for considering temper-ature differentials in the superstructure. Future research should be directed toward this goal.

REFERENCES AND BIBLIOGRAPHY
63
DESIGN CODES AND PRACTICES
Standard Spec(flcations for Highway Bridges. 12th ed., American Association of State Highway and Transpor-tation Officials, Washington, D.C. (1977) 496 pp. Ontario Highway Bridge Design Code and Commentary. Ontario Ministry of Transportation and Communications, Ontario, Canada (1979). ACI Committee 349. "Reinforced Concrete Design for Thermal Effects on Nuclear Power Plant Structures." ACI
J., No. 6, Proc. V. 77 (Nov.-Dec. 1980) pp. 399-428. "Thermal Expansion and Contraction." Tennessee Struc-tures Memorandum-045, SM045-01/07, Bureau of High-ways, Tennessee Dept. of Transportation (Feb. 1982) 5
pp. Proposal for Design and Load Regulations for Highway Bridges. Danish Ministry of Transport (Oct. 1977) 20 pp. NAASRA Bridge Design Specification. 5th ed., National Association of Australian State Road Authorities (1976)
26 pp. Specifications for Highway Bridges., Japan Road Associ- ation Tokyo, Japan (1976) pp. 1-18. State of Washington, Department of Transportation, "Thermal Effects of Design Criteria for the Yakima River Bridges and the Hamilton Street Bridges." NCHRP Proj-ect 12-22, FY '81 (Revised Feb. 22, 1982). MENTES, G. A., BRAT, P. D., RANNI, A. I., PAJUHESH, J., and COMMITTEE. "Reinforced Concrete Design for Thermal Effects on Nuclear Power Plant Structures-Discussion." ACI J. (Sept.-Oct. 1981) pp. 406-407. "Italian Bridge Design Regulations for Concrete Bridges." Rome, Italy (1980). "Actions Uniforme de Ia Temparature: Gradient Ther-mique." (Summary of rules for temperature actions in a bridge) Bagneux, France (1982). BRITISH STANDARDS INSTITUTION, "Steel, Concrete and Composite Bridges, Part I, General Statement." British
Standard BS 5400 Crowthorne, Berkshire, England (1978)
43 pp. DIN 1072 (German Bridge Design Code). (Nov. 1967). SMITH, A. W., "The Newmarket Viaduct-Part 2: Design Investigations and Specification." New Zealand Engineer-ing (Dec. 1965) pp. 498-503. Precast Segmental Box Girder Bridge Manual. Post Ten-sioning Institute and Prestressed Concrete Institute (1978)
116 pp.
PROPOSED DESIGN CODE AND PRACTICES
PRIESTLEY, M. J. N., and BUCKLE, I. G., "Ambient Ther-mal Response of Concrete Bridges." Road Research Unit Bulletin 42, Bridge Seminar, 1978, Vol. 2, Road Research Unit, National Roads Board, Wellington, New Zealand, ISSN 0549-0030 (1979) 83 pp. Committee on Loads and Forces on Bridges of the Com-mittee on Bridges, Structural Divsion, "Recommended De-
sign Loads for Bridges." J. Structural Division, No. ST7 (July 1981) pp. 1161-1212. CHURCHWARD, A. J., and SOKEL, Y. J., Thermal Re-sponses in Concrete Bridges, Brisbane." ARRB Proc., Vol. 10, Part 3 (1980) pp. 87-93. BRIDGE CONSTRUCTION DIvIsIoN, Structures Depart-ment of TRLL, "Bridge Temperatures." TRLL Supple-mentary Report 442, Proceedings of Symposium held at Transport and Road Research Laboratory, Department of the Environment, Department of Transport, Crowthorne, Berkshire, England, ISSN 0305-1315 (Oct. 5, 1977) 5 pp. WHITE, I. G., "Non-Linear Differential Temperature Dis-tributions in Concrete Bridge Structures: A Review of the Current Literature." Technical Report 525, Cement and Concrete Association (May 1979) 23 pp. EMERSON, M., "Temperature differences in Bridges: Basis of Design Requirements." TRRL Laboratory Report 765, Department of the Environment, Department of Trans-port, Crowthorne, Berkshire, England, ISSN 0305-1293 (1977) 39 pp. PAJUHESH, J., "Design of Concrete Structures for Thermal Effects." ACI J. (Mar.-Apr. 1980) pp. 74-77. RADOLLI, M., and GREEN, R., "Thermal Stress Analysis of Concrete Bridge Superstructures." Transportation Re-search Record 607, Transportation Research Board (1976) pp. 7-13. SINDEL, J. A., "A Design Procedure for Post-Tensioned Concrete Pavements." Concrete International (Feb. 1983) pp. 51-57.
IN-SITU THERMAL MEASUREMENTS (AXIAL EFFECTS, RESEARCH FINDINGS, PROPOSED RESEARCH)
BURDETTE, E. G., and GOODPASTURE, D. W., "Thermal Movements of Continuous Concrete and Steel Structures." Research Project No. 77-27-2, Research Proposal to Ten-nessee Department of Transportation, Department of Civil Engineering, University of Tennessee (Feb. 1978) 17 pp. MORTLOCK, J. D., "The Instrumentation of Bridges for the Measurement of Temperature and Movement." TRRL Laboratory Report 641, Department of the Environment, Crowthorne, Berkshire, England (1974) 53 pp. BLACK, W., MoSs, D. S., and EMERSON, M., "Bridge Temperatures Derived from Measurements of Movement." TRRL Laboratory Report 748, Department of the Envi-ronment, Crowthorne, Bershire, England, ISSN 0305-1293 (1976) 35 pp. ABDUL-AHAD, R. B., "Effects of Restrained Thermal Movement in a Continuous, Prestressed Concrete Bridge Without Interior Expansion Joints." Ph.D. Dissertation, University of Tennessee (June 1981) 147 pp. "Thermal Movements of Continuous Concrete and Steel Structures." Research Project No. 77-27-2, Final Report, Tennessee Department of Transportation (Jan. 1982) 114
pp.

64
30. HOUDESHELL, D. M., ANDERSON, T. C., and GAMBLE, W. L., "Field Investigation of a Prestressed Concrete High-way Bridge Located in Douglas County, Illinois." Project IHR-93, Documentation Report to State of Illinois Divi-sion of Highways, The Structural Research Laboratory, Dept. of Civil Engineering, University of Illinois (Feb. 1972) 64 pp.
gin EMANUEL, J. H., and WIscH, J., "Thermal Stresses Induced in a Composite Model Bridge Structure." Study 75-2, Missouri Cooperative Highway Research Program, Final Report to Missouri State Highway Department, Civil Engineering Department, Univeisity of Missouri-Rolla (Aug. 1977) 141 pp.
32 WILLEMS, N., "Experimental Strain Analysis of Contin-uous Skew Slab Bridge Decks." Report No. HPR-SCH 71-3-F, Draft Final Report to State Highway Commission of Kansas, University. of Kansas, Center for Research, Inc. (Aug. 1973) 19 pp. WHITE, I. G., and BELCHER, R. D., "Tests to Determine the Magnitude of Temperature Induced Moments in Con-crete Structures." Design Research Department, Cement and Concrete Association (Nov. 1980) 16 pp. STEWART, C. F., "Long Structures Without Expansion Joints." Interim Report, California Department of Trans-portation (June 1967) 10 pp. STEWART, C. F., "Annual Movement Study of Bridge Deck Expansion Joints." Final Report, Bridge Depart-ment, Division of Highways, State of California (June 1969) 52 pp. DILLON, E. W., and KISSANE, R. J., "Annual End Move-ments of Prestressed Concrete Bridges." Research Report 66, Final Report, Engineering Research and Development Bureau, New York State Department of Transportation (Oct. 1978) 22 pp.
37 SHIU, K. N., and RUSSELL, H. G., "Instrumentation of Linn Cove Viaduct." FHWA Contract No. DTFH61-80-C-00112, Interim Report to Teng and Associates, Con-struction Technology Laboratories, Portland Cement As-sociation, Skokie, Illinois (Aug. 1981) 30 pp.
IN-SITU THERMAL GRADIENTS (RESEARCH FINDINGS, PROPOSED RESEARCH)
38 SHIU, K. N., and RUSSELL, J. G., "Instrumentation of Linn Cove Viaduct," FHWA Contract No. DTFH61-80-C-001 12, Interim Report to Teng and Associates, Con-struction Technology Laboratories, Portland Cement As-sociation, Skokie, Illinois (Aug. 1981) 30 pp.
39 TFIURSTON, S. J., and POTTER, S. M., Measurements of Thermal Crack Widths in a Continuous Prestressed Con-crete Bridge." Central Laboratories Report No. 5-79/10, Ministry of Works and Development, Gracefield, Lower Hutt, New Zealand (Nov. 1979) 30 pp.
40. WANDERS, S. P., WINSLOW, D. A., and SUTTON, C. D., "Study of the Segmental Box Girder Bridge at Turkey Run: Construction, Instrumentation and Data Col-lection." Project No. C-36-56T, Interium Report to In-diana State Highway Commission and FHWA, Purdue University (Dec. 17, 1979) 175 pp.
41 CLARK, J. H., and HAWKINS, N. M., "Thermal, Live Load, Creep and Shrinkage Deformations and Stresses in the Denny Creek Bridge." Proposal to the Washington
State Department of Transportation (Sept. 1980) 17 pp. EMERSON, M., "Steel Box Bridge Temperatures in Aus-tralia and the United Kingdom." TRRL Supplementary Report 611, Department of the Environment, Department of Transport, Crowthorne, Berkshire, England, ISSN 0305-1315 (1980) 26 pp. EMERSON, M., "Bridge Temperatures Estimated from the Shade Temperature." TRRL Laboratory Report 696, De-partment of the Environment, Crowthorne, Berkshire, England, ISSN 0305-1293 (1976) 50 pp. EMERSON, M., "Temperatures in Bridges During the Hot Summer of 1976." TRRL Laboratory Report 783, De-partment of the Environment, Department of Transport, Crowthorne, Berkshire, England, ISSN 0305-1293 (1977) 31 pp. EMERSON, M., "Temperatures in Bridges During the Cold Winter of 1978/1979." TRRL Laboratory Report 926, De-partment of the Environment, Department of Transport, Crowthorne, Berkshire, England, ISSN 0305-1293 (1980) 31 pp. SHIu, K. N., DANIEL, J. I., and RUSSEL, H. G., "Time-Dependent Behavior of Segmental Cantilever Concrete Bridges: Progress Report 1978-80 (Kishwaukee River Bridge)." Construction Technology Laboratories, Portland Cement Association, Skokie, Illinois (Dec. 1980) 18 pp. HOFFMAN, P. C., MCCLURE, R. M., and WEST, H. H., "Temperature Studies for an Experimental Segmental Bridge." Report PTI 8010, Interim Report to Pennsylvania Department of Transportation, Pennsylvania Transpor-tation Institute, Pennsylvania State University (June 1980)
112 pp. HIRST, M. J. S., "Solar Heating of Bridges." Australian Road Research, Vol. 11, No. 2 (June 1981) pp. 28-36. RUSSELL, H. G., "What We Have Learned from Box-Girder Bridges." Paper given at Segmental Concrete Bridge Conference, Kansas City, Construction Technology Laboratories, Portland Cement Association, Skokie, Illi-nois (1982) 20 pp. THURSTON, S. J., PRIESTLEY, M. J. N., and COOKE, N., "Influence of Cracking on Thermal Response of Rein-forced Concrete Bridges." Submitted to ACI for Publi-cation (Nov. 1982) 24 pp. HIRST, M. J. S., "Thermal Loading of Concrete Bridges." International Conference on Short and Medium Span Bridges, Toronto, Canada, Canadian Society for Civil En-gineering, Proc., Vol. 1 (Aug. 1982) pp. 115-124. ABDUL-AFIAD, R. B., "Effects of Restrained Thermal Movement in a Continuous, Prestressed Concrete Bridge Without Interior Expansion Joints." Ph.D. Dissertation, University of Tennessee (June 1981) 147 pp. "Thermal Movements of Continuous Concrete and Steel Structures." Research Project No. 77-27-2, Final Report, Tennessee Department of Transportation (Jan. 1982) 114 pp. BURDETTE, E. G., and GOODPASTURE, D. W., "Thermal Movements of Continuous Concrete and Steel Structures." Research Project No. 77-27-2, Final Report, Tennessee Department of Transportation (Jan. 1982) 118 pp. RADOLLI, M., and GREEN, R., "Thermal Stresses in Con-crete Bridge Superstructures Under Summer Conditions." Transportation Research Record 547, Transportation Re-search Board (1975) pp. 23-36.

65
MAHER, D. R. H., "The Effects of Differential Temper-ature on Continuous Prestressed Concrete Bridges." Civil Engineering Transaction, Institute of Engineers of Aus-tralia, Vol. CE12, Part 1, Paper 1795 (April 1970) pp. 29-32. PRIESTLEY, M. J. N., "Effects of Transverse Temperature Gradients on Bridges." Report No. 394, Ministry of Works, New Zealand (Sept. 1972). PRIESTLEY, M. J. N., "Temperature Gradients in Bridges-Some Design Consideration." New Zealand En-gineering, Vol. 27, Part 7 (July 1972) pp. 228-233. PRICE, W. I. J., "Discussion on Paper Entitled Medway Bridge Design by 0. A. Kerensky and G. Little and Med-way Bridge Construction by M. F. Hansen and J. A. Dunster." Institution of Civil Engineers, Proc., Vol. 31 (June 1965) pp. 162-166. PRIESTLEY, M. J. N., "Linear Heat-Flow and Thermal Stress Analysis of Concrete Bridge Decks." Research Re-port No. 76/3, University of Canterbury, Department of Engineering, Christchurch, New Zealand (Feb. 1976). PRIESTLEY, M. J. N., "Design Thermal Gradients for Con-crete Bridges." New Zealand Engineering, Vol. 31, Part 9 (Sept. 1976) pp. 213-219. NAROUKA, M., HIRAI, I., and YAMAGUTI, T., "Measure-ment of the Temperature of the Interior of the Reinforced Concrete Slab of the Shigita Bridge and Presumption of Thermal Stress." Symposium of the Stress Measurements for Bridge and Structures, Japanese Society for the Pro-motion of Science, Proc., Tokyo, Japan (1957) pp. 106-115. BARBER, E. S., "Calculation of Maximum Pavement Tem-peratures from Weather Reports." Highway Research Board Bulletin 168 (1957) pp. 1-8. Zuk, W., "Thermal and Shrinkage Stresses in Composite Beams." ACIJ., Vol. 58, No. 3 (Sept. 1961) pp. 327-340. Lw, Y. N., and ZUK, W., "Thermoelastic Effects in Pre-stressed Flexural Members." PCI J., Vol. 8, No. 3 (June 1963) pp. 64-85. WAH, T., and KIRKSEY, R. E., "Thermal Characteristics of Highway Bridges." Report HR 12-4, Final Report, Southwest Research Institute (July 1969). ZUK, W., "Thermal Behavior of Composite Bridges-In-sulated and Uninsulated." Highway Research Record 76 (1965) pp. 231-253. BUCKLE, I. G., "Seasonal Variations in the Thermal Re-sponse of a Concrete Box Girder Bridge." Report No. 286, Report to the National Roads Board, Department of Civil Engineering, University of Auckland, New Zealand (June 1982) 32 pp. HOFFMAN, P. C., MCCLURE, R. M., and WEST, H. H., "Temperature Study of an Experimental Segmental Con-crete Bridge." PCI J., Vol. 26, No. 2 (Mar.-Apr. 1983) pp. 78-97. ELBADRY, M. M., and GHALI, A., "Nonlinear Temper-ature Distribution and its Effects on Bridges." IABSE Proc. P-66/83, ISSN 0377-7278 (Aug. 1983) pp. 169-191. SHIu, K. N., "Seasonal and Diurnal Behavior of Concrete Box-Girder Bridges." Construction Technology Labora-tories, Portland Cement Association, Skokie, Illinois, 29
pp. WROTH, C. P., "The Hammersmith Flyover-Site Mea-surements of Prestressing Losses and Temperature Move-
ments." Institute of Civil Engineers, Proc., Vol. 23 (Dec. 1962) pp. 601-624. POTGIETER, I., and GAMBLE, W. L., "Response of High-way Bridges to Nonlinear Temperature Distributions." Re-port No. FHWA/IL/UI-201, Final Report, University of Illinois (April 1983) pp. 291. BERWANGER, C., "Thermal Stresses in Composite." J. Institute of Structural Engineers (Apr. 1974).
TRANSVERSE TEMPERATURE EFFECTS
EMANUEL, J. H., and FILLA, M. J., "Transverse Thermal Response of a Composite Bridge." Report, University of Missouri-Rolla, 36 pp.
ANALYTICAL TECHNIQUES
FATTAL. S. G., REINHOLD, T. A., and ELLINGWOOD, B., "Analysis of Thermal Stresses in Internally Sealed Con-crete Bridge Decks." Report No. FHWA/RD-80/085, Cen-ter for Building Technology, National Bureau of Standards (Apr. 1981) 116 pp. RAHMAN, F., and GEORGE, K. P., "Thermal Stress Anal-ysis of Continuous Skew Bridges." J. Structural Division, ASCE, Vol. 105, No. ST7 (July 1979) pp. 1525-1541. THURSTON, S. J., PRIESTLEY, M. J. N., and COOKE, N., "Thermal Analysis of Thick Concrete Sections." ACI J., No. 5, Proc. V 77 (Sept.-Oct. 1980) pp. 347-357. THURSTON, S. J., "Thermal Stresses in Concrete Struc-tures." Ph.D. Dissertation, No. 78, 78-21, Department of Civil Engineering, University of Canterbury, Christchurch, New Zealand. LEONHARDT, F., "Crack Control in Concrete Structures." IABSE Surveys, S-4/77, University of Stuttgart, Germany,
26 pp. EMERSON, M., "Bridge Temperatures for Setting Bearings and Expansion Joints." TRRL Supplementary Report 479, Department of the Environment, Department of Trans-port, Crowthorne, Berkshire, England, ISSN 0305-1315 (1979) 18 pp. EMERSON, M., "Bridge Temperatures in the Arabian Gulf: Theoretical Predictions." TRRL Supplementary Report 495, Department of the Environment, Department of Transport, Crowthorne, Berkshire, England, ISSN 0305-1315 (1979) 25 pp. EMERSON, M., "The Calculation of the Distribution of Temperature in Bridges." TRRL Laboratory Report 561, Department of the Environment, Crowthorne, Berkshire, England (1973). JONES, M. R., "Bridge Temperatures Calculated by a Com-puter Program." TRRL Laboratory Report 702, Depart-ment of the Environment, Crowthorne, Berkshire, England, ISSN 0305-1293 (1976) 42 pp. EMERSON, M., "Extreme Values of Bridge Temperatures for Design Purposes." TRRL Laboratory Report 744, De-partment of the Environment, Crowthorne, Berkshire, England, ISSN 0305-1293 (1976) 50 pp. JONES, M. R., "Calculated Deck Plate Temperatures for a Steel Box Bridge." TRRL Laboratory Report 760, De-partment of the Environment, Department of Transport,

66
Crowthorne, Berkshire, England, ISSN 0305-1293 (1977) 24 pp.
87 THEPCHATRI, T., JOHNSON, C. P., and MATLOCK, H., "Prediction of Temperature and Stresses in Highway Bridges by a Numerical Procedure Using Daily Weather Reports." Research Report 23-1, Interim Report to Texas State Department of Highways and Public Transportation, Center for Highway Research, University of Texas at Aus-tin (Feb. 1977) 165 pp.
88 WILL, K. M., JOHNSON, C. P., and MATLOCK, H., "An-alytical and Experimental Investigation of the Thermal Response of Highway Bridges." Research Report 23-2, In-terim Report to Texas State Department of Highways and Public Transportation, Center for Highway Research, Uni-versity of Texas at Austin (Feb. 1977) 148 pp. YARGICOGLU, A., and JOHNSON, C. P., "Temperature Induced Stresses in Highway Bridges by Finite Element Analysis and Field Tests." Research Report 23-3F, Final Report to Texas State Department of Highways and Public Transportation, Center for Highway Research, University of Texas at Austin (July 1978) 196 pp. ZICHNER, T., "Thermal Effects on Concrete Bridges." C. E. B. Enlarged Meeting—Commission 2—Pavia (Oct. 1981) pp. 292-313. Emanuel, J. H., and HULSEY, J. L., "Thermal Stresses and Deformations in Nonprismatic Indeterminate Com-posite Bridges (Abridgement)." Transportation Research Record 607 (1976) pp. 4-6. DILGER, W. H., and GHALI, A., "Temperature Induced Stresses in Composite Box Girder Bridges." Final Report to The Department of Supplies and Services in Ottawa, Civil Engineering Consultants, Calgary, Alberta (Oct. 1980) 179 pp. chief Designing Engineer (Civil), "Differential Tempera-ture Analysis." CDP 806/A, New Zealand Ministry of Works and Development, Wellington, New Zealand (Feb. 1974) 20 pp. HAMBLY, E. C., "Temperature and Prestress Loading." Chap. 11 in Bridge Deck Behavior, John Wiley & Sons, Inc., New York (1976) pp. 187-194.
95 HOFFMAN, P. C., MCCLURE, R. M., and WEST, H. H., "Temperature Study of an Experimental Segmental Con-crete Bridge." PCI J., Vol. 26, No. 2 (Mar.—Apr. 1983) pp. 78-97.
MATERIALS
Building Movements and Joints. 1st ed. Portland Cement Association, Skokie, Illinois (1982) 64 pp. Concrete Manual. 7th ed., U.S. Department of the Interior, Bureau of Reclamation.
METEOROLOGICAL
States." SERI/SP-642-1037, Superintendent of Docu- ments, U.S. Government Printing Office, Washington, D. C. (Oct. 1981) 167 pp. DEPARTMENT OF WATER RESOURCES, "California Sun-shine-Solar Radiation Data." Bulletin 187, Sacramento, California (Aug. 1978) 110 pp. "Daily Normals of Temperature and Heating and Cooling Degree Day 1941-1970." Climatography of the United States No. 84, National Climatic Center, Ashville, N.C.
OTHER RELATED CATEGORIES
MOULTON, L. K., GANGARAO, H. V. S., and HALVORSEN, G. T., "Tolerable Bridge Movements." Paper Presented at the Sixth N. W. Bridge Engineers' Seminar, Boise, Idaho (Oct. 7, 1981) 55 pp. ZUK, W., "Jointless Bridges." FHWA/VA-81-23, Interim Report to Virginia Department of Highways and Trans-portation, Virginia Highways and Transportation Re-search Council, University of Virginia (Nov. 1980) 15 pp.. MARSH, J. G., "ARRB Creep and Shrinkage Research; What Has Been Achieved and Where Do We Go from Here?" ARRB Proc., Vol. 10, Part 3 (1980) pp. 267-273. LEONHARDT, F., KOLBE, G., and PETER, J., "Tempera-turunterschiede gefahrden Spannbetonbrucke." Beton-und Stahlbetonbau, Vol. 60, No. 7, Berlin (July 1965) pp. 157-163. MARSHALL, V., and GAMBLE, W. L., "Time-Dependent Deformations in Segmental Prestressed Concrete Bridges." Report UILU-ENG-81-2014 SRS-495, Interim Report to Illinois Department of Transportation, Illinois Cooperative Highway and Transportation Research Program, Phase 3, University of Illinois (Oct. 1981) 251 pp. STRATFON, F. W., ALEXANDER, R. and NOLTING, W., "Cracked Structural Concrete Repair Through Epoxy In-jection and Rebar Insertion." Report FHWA-KS-RD-76-2, Interim Report, Planning and Development De-partment, Kansas Department of Transportation (May 1977) 42 pp. STRATFON, F. W., ALEXANDER, R., and NOLTING, W., "Cracked Structural Concrete Repair Through Epoxy In-jection and Rebar Insertion." Report FHWA-KS-RD-78-3, Final Report, Planning and Development Depart-ment, Kansas Department of Transportation (Nov. 1978) 56 pp. LANIGAN, A. G., "The Temperature Response of Concrete Box Girder Bridges." PhD, Dissertation, University of Auckland, New Zealand (1973). HUIzING, J. B. S., BLAKELEY, R. W. G. and RAMSAY, G., "Falsework." New Zealand Engineering, Vol. 32, No. 1 (Jan. 15, 1977) pp. 2-9. BROWN, G. M., "Thermal Stresses Study of the State of the Art." Transportation Research Record 607, Transpor-tation Research Board (1976). SINDEL, J. A., "A Design Procedure for Post-Tensioned Concrete Pavements." Concrete International, Design and Construction, Vol. 5, No. 2 (Feb. 1983) pp. 51-57. "Tolerable Movement of Bridge Foundations, Sand Drains, K-Test, Slopes, and Culverts." Transportation Re-
Climatic Atlas of the United States. U.S. Department of Commerce, Ashville, North Carolina (June 1968). 113. "Solar Radiation Energy Resource Atlas of the United

67
search Record 678, Transportation Research Board, 21 pp. MEJ DARPAS, G., "Recent Evolution of the Design of the
Bridges Built in France by the Cantilever Method." Elev-enth Congress of the International Association for Bridge and Structural Engineering, Vienne, France (Sept. 1980) pp. 101-105. BRANSON, D. E., and TR0sT, H., "Unified Procedures for Predicting the Deflection and Centroidal Axis Location of Partially Cracked Nonprestressed and Prestressed Con-crete Members." ACI J. (Mar.—Apr. 1982) pp. 119-130. REYNOLDS, J. C., and EMANUEL, J. H., "Thermal Stresses and Movements in Bridges." J. Structural Division, ASCE (Jan. 1974). LEONHARDT, F., and LIPPOTH, W., "Folgerungen aus Schaden an Spannetonbrucken" (Conclusions from dam-age to prestressed concrete bridges). Beton-und Stahlbe-tonbau, Vol. 65, No. 10, Berlin (Oct. 1970) pp. 23 1-344. MATLOCK, H., PANAK, J. J., VORA, M. R., and CHAN,
J. H. C., "Field Investigation of a Skewed, Post-Stressed Continuous Slab Structure." Research Project 3-5-63-56, Interim Study Report, Center for Highway Research, Uni-versity of Texas, Austin (May 1970). KOOB, M. J., BOGGS, D. W., and HANSEN, J. M., "Field Testing of the Fremont Bridge." Report No. 78646, Wiss, Janney, Elstner & Associates, Inc., Northbrook, Illinois (Mar. 1980) 100 pp. KAMADOLI, K. A., "Thermal Stresses in Fremont Bridge Superstructure." Northwest Bridge Engineers' Seminar, Olympia, Washington (Oct. 1983) 27 pp. SCHRECK, P., "The Great Blunder." Lecture 62 at the Annual Committee Meeting, Transportation Research Board, Washington, D.C. (Jan. 1983) 11 pp. LEONHARDT, F., "RiBschaden an Betonbrucken-Ur-sachen und Abhilfe." Beton-und Stahlbetonbau, Vol. 74, No. 2 (Feb. 1979) pp. 36-44.
BRIDGE PLANS AND OTHER RELEVANT INFORMATION
California Department of Transportation, "Colorado River Bridge—Contract Plans." San Bernardino County, District 8, Route W614, Bridge No. 54C-349, Sacramento, California (Dec. 1976). California Department of Transportation, "Land Park Un-derpass - Contract Plans." Sacramento County, District 3, Route 1-5, Bridge No. 24-226, Sacramento, California (May 1972). Illinois Department of Transportation, "Kishwaukee Bridge—Contract Plans." Winnebego County, Route 412 (Jan. 1977). Indiana State Highway Commission, "Turkey Run Creek Bridge—Contract Plans." Parke County, State Route 47, Bridge File No. 47-61-6570 (1974). Washington State Department of Transportation, "Ham-ilton Street Bridge—Contract Plans." City of Spokane, State Route 290, Olympia, Washington (Jan. 1982). Washington State Department of Transportation, "Yak-ima River Bridges and Approaches—Contract Plans." Benton County, State Route 182. MP 2.94 to MP 3.82, Olympia, Washington (May 1980). FIGG AND MULLER ENGINEERS, INC., "Site Inspection of Miller Creek and Black Gore Bridges." (Aug. 11-12, 1982). State of Colorado, Department of Highways, "Memoran-dum—In-depth Inspection of the Creeks and Spalls De-veloping in the Walls and Bottom Slabs of the F-i 1-AK, F-1 1-AL Structures over Miller Creek on 170." (July 29, 1982). FIGG AND MULLER ENGINEERS, INC., "Computer Out-put-Vail Pass, Bridge AK, Miller Creek." (Sept. 29, 1982) pp. 799-807.

68
APPENDIX A
DESIGN GUIDELINES FOR THERMAL EFFECTS IN CONCRETE BRIDGE SUPERSTRUCTURES
PURPOSE OF THE GUIDELINES
These design guidelines include provisions for considering the effects of temperature on reinforced and prestressed concrete bridge superstructures. Temperature effects result from time-dependent fluctuations in the effective bridge temperature or from temperature differentials within the bridge superstructure. All concrete bridges should be designed for temperature effects resulting from time-dependent fluctuations in the effective bridge temperature. Prestressed concrete bridges within a range of span lengths, and with cross sections for which a long-established history of satisfactory performance does not exist, should also be designed for the effects of temperature differentials within the bridge superstructure.
EFFECTIVE BRIDGE TEMPERATURES
All concrete bridges shall be designed to accommodate the stresses and movements resulting from a fluctuation in the ef-fective bridge temperature. The values for the anticipated min-imum and maximum effective bridge temperatures are dependent on the type of construction and on the minimum and maximum normal air temperatures at the bridge site. The min-imum effective bridge temperature shall be obtained from Table A-i, while the maximum effective bridge temperature shall be obtained from Table A-2. Although this report is concerned with concrete bridges, results for effective bridge temperatures in composite and steel structures will be included. Unless more precise local meteorological data are available, the minimum normal air temperature shall be obtained from the map of iso-therms included in Figure A- 1, and the maximum normal air temperature shall be obtained from the map of isotherms in-cluded in Figure A-2.
DIFFERENTIAL TEMPERATURES
Provisions shall be made for stresses and movements resulting from differential temperatures within prestressed concrete bridge superstructures when a long-established history of sat-isfactory performance for similar bridge superstructure does not exist. Both longitudinal and transverse stresses and movements resulting from the positive and negative vertical temperature gradients, described below, shall be considered.
3.1 Positive Temperature Gradients
Vertical temperature differentials within concrete superstruc-tures that result from the solar heating of the deck surface shall be assumed to vary at different depths of concrete, as shown in
Table A-I. Correlation between normal daily minimum temperature and minimum effective bridge temperature.
Normal Daily Minimum
Temperature
Minimum Effective Bridge Temperature I Type of Superstructure
Concrete Composite Steel Only
-30 -3 -12 -43 -25 ' 0 -9 -36 -20 3 -7 -30 -15 5 -4 -24 -10 8 -1 -17 -5 11 2 -10 0 13 4 -5 5 15 9 0 10 19 14 5 15 22 17 11 20 25 22 16 25 29 26 22 30 32 31 27 35 35 36 33 40 38 40 311
Table A-2. Correlation between normal daily maximum temperature and maximum effective bridge temperature.
Normal Daily Maximum
Temperature
Maximum Effective Bridge Temperature Type of Superstructure
Concrete Composite Steel Only
55 66 70 91 60 69 74 94 65 73 7•9 97 70 77 83 101 75 80 88 104 80 84 93 107 85 88 96 110 90 92 99 112 95 95 102 115 100 98 104 116 105 101 105 118 110 105 107 120
Figure A-3. This gradient is only applicable to superstructures with a depth greater than 2 ft. Actual temperatures shall be assumed to vary in accordance with the values specified in Table A-3 for the various solar radiation zones and thicknesses of black top surfacing on the bridge deck.
When determining the temperature variations within box gir-der bridges the values T2 and T3 shall be increased by 5°F. Maximum solar radiation zones are shown in Figure A-4.

30 25 1-i 20 ' j______••_;\-,_.
January - 5
-20
25
EE
40 30 "\ N 30
45 .-.-'..
T 64 65 29 -63
Figure A-I. Normal daily minimum temperature (°F) for January.

75
80 90
95
July 80
80
1
C
t ..
80
95-'
80 75 90
I
.
90
105
75 8090 90
90 95
44 90
6 68 9
95 95••.. 90
..-...
Figure A-2. Normal daily maximum temperature ('F) for July.

71
0.33ff
CD 0.66ff
I-
0 /11<
D3 CD
d c'J rn
0.66ff 5°F
NOT TO SCALE
(Note: For Superstructure depths greater than 2 feet)
Figure A-3. Positive vertical temperature gradient within super-structure concrete.
Table A-3. Temperature differentials within a concrete superstructure for a positive temperature gradient (see Fig. A-4 for zone map).
Plain Concrete Surface
Zone T1 (°F) T2 ( CF) T3 ( CF)
1 54 14 5
2 46 12 4
3 41 11 4
4 38 9 3
2 in. Blacktop
Zone T1 ( CF) T2 ( CF) T3 ( CF)
1 43 14 4
2 36 12 4
3 33 11 3
4 29 9 2
4 in. Blacktop
Zone T1 ( CF) T2 (°F) T3 (CF)
1 31 9 3
2 25 10 3
3 23 11 2
4 22 11 2
3.2 Negative Temperature Gradients
Temperature differentials within concrete superstructures that result from a rapid cooling of exposed concrete surfaces shall be assumed to vary at different depths, as shown in Figure A-5. This gradient is only applicable to superstructures with a depth greater than 2 ft. Temperatures shall be assumed to vary with the maximum solar radiation zone and the thickness of black top surfacing on the bridge deck, as specified in Table A-4.
4. COEFFICIENT OF THERMAL EXPANSION
The coefficient of thermal expansion used to determine tem-perature effects shall be based on the type of aggregate to be used, as specified in Table A-S.

72
wi.. / 1 • /
/ Lf 1
—•'Tc
.. k
Figure A-4. Maximum solar radiation zones for the United States.
T1
NOT TO SCALE
0.33 ft
066ff D If)
I I ci
D3
I
3
1- If)
¶ 0.66ff 0
0.33ff
Note: For Superstructure depths greater than 2 feet
Figure A -5. Negative temperature gradient within superstructure concrete.
-T

73
Table A-4. Temperature differentials within a concrete superstructure for a negative temperature gradient (see Fig. A-4 for zone map).
Plain Concrete Surface
Zone T1 ( 5F) T2 (eF) T3 ('F) T4 (F)
1 27 7 2 14
2 23 6 2 10
3 21 6 2 8
4 19 5 2 6
2 in. Blacktop
Zone T1 (CF) T2 ('F) T3 ( °F) T4 (F)
1 22 7 2 15
2 18 6 2 11
3 17 6 2 10
4 15 5 1 8
4 in. Blacktop
Zone T1 ("F) T2 ("F) T3 ("F) T4 (F)
1 16 5 1 12
2 13 5 1 9
3 12 6 1 8
4 11 6 1 8
Table A-5. Coefficient of thermal expansion based on aggregate type (thermal coefficient of concrete based on fine and coarse aggregates).
AGGRFGATN TYPE ThERMALCOEFFICIENT
OF CONCRETEC (0.000001 pet F)
Quartz its
Quartz
7.1
6.4
Sandstone 6.5
Gravel 6.9
Granite 5.3
Dolerite 5.3
Basalt 5.0
Marble 2.4-4.1
Limestone 4.0
*Based on fine and coarse aggregates
5. ANALYSIS PROCEDURES
An analysis of temperature effects shall be performed to de-termine the stresses and movements expected to result from temperature-induced strains within specified elements of the bridge superstructure. The effects of structure continuity shall be included when analyzing both the effects of fluctuations in the effective bridge temperature and the effects of temperature differentials in the superstructure. Note, however, that for stan-dard prestress concrete cross sections within a range of span lengths having a long-established history of satisfactory per-formance, the designer has the option of waiving the detailed analysis of temperature differential effects.
APPENDIX B
COMMENTARY ON DESIGN GUIDELINES FOR THERMAL EFFECTS IN CONCRETE BRIDGE SUPERSTRUCTURES
1. APPLICABILITY OF THE GUIDELINES
All bridges are subjected to stresses and/or movements re-sulting from temperature variation. Although time-dependent variations in the effective bridge temperature have caused prob-
lems in both reinforced and prestressed concrete bridges, det-rimental effects caused by temperature differentials within the superstructure have occurred, thus far, only in prestressed bridges.
Except in extreme cases, concrete bridges will not suffer a sudden loss of strength as a result of temperature changes. The

74
primary detrimental effect from temperature variation is the formation of unacceptable cracks in the concrete that reduce the serviceability of the bridge. Strength loss may eventually result if these cracks contribute to accelerated deterioration. Safety could be affected if the deterioration were to escape detection, as might be the case if prestress strands concealed from inspection were to corrode. Because the total elimination of cracks in concrete bridges is not possible, these guidelines are designed to limit temperature-induced cracking to acceptable levels.
Although these guidelines do not specifically address false-work loads and temperature differentials resulting from the heat of hydration in thick members, they will be useful in determining those effects. Heat of hydration cooling can be an important cause of cracking, such as in the case of curing and/or cooling of the top deck slab which is cast on top of the previously constructed bottom slab and/or stems which provide restraint against movement.
2. EFFECTIVE BRIDGE TEMPERATURES
Fluctuations in effective bridge temperatures result in expan-sion and contraction of the superstructure. These movements, in turn, induce stresses in supporting elements such as columns or piers, and result in horizontal movement of the expansion joints. The magnitude of these stresses and movements on a given bridge depends on the range of temperature variation and the temperature of the bridge at the time of construction. These guidelines establish the criteria for determining the minimum and maximum bridge temperatures that can reasonably be ex-pected. For bridge designers to determine the amount of ex-pansion and contraction that can be expected to occur on a given bridge to be built in a given location, they will need to assume an effective temperature at the time of construction.
2.1 Bridge Temperature Response
Emerson established a method for estimating minimum and maximum effective bridge temperatures based on the geograph-ical distribution of minimum and maximum shade temperatures throughout the United Kingdom (19). The procedures estab-lished by Emerson were subsequently incorporated into British Standard BS 5400. Because the range of minimum and maxi-mum temperatures for the United States is larger than that reported for the United Kingdom, it was necessary to extrapolate some of the curves relating effective bridge temperatures to minimum and maximum shade temperatures. Minimum tem-peratures for the United States range from - 30°F to 40°F, as compared to a minimum temperature range of - 11°F (- 24°C) to 23°F (- 5°C) for the United Kingdom. The extrapolated portions of the minimum temperature range presented by Emer-son are shown in Figure B-i. Maximum temperatures for the United States range from approximately 55°F to 110°F, as com-pared to a maximum temperature range of 75°F (24°C) to 100°F (3 8°C) for the United Kingdom. The extrapolated portions of the maximum temperature range are also shown in Figure B-1. The values given in Tables B-1 and B-2 are based on these curves. Note that adjustments in the effective bridge temperature are not required for bridge surfacing.
2.2 Minimum and Maximum Air Temperatures
The isotherms used for the minimum and maximum air tem-perature are taken from charts published in the "Climatic Atlas of the United States" (98). The minimum air temperatures were obtained from the normal daily minimum temperatures for the month of January, while the maximum air temperatures were obtained from the normal daily maximum temperatures for the month of July. These isotherms are based on average daily records for the 30-year period from 1931 through 1960. Al-though data are available that list the extreme daily minimum and maxitnuin temperatures in the United States for a given period of time, there is no readily available published infor-mation that lists the duration in days that these extreme tem-peratures have occurred. Since bridges require 2 to 3 days to respond to a given minimum or maximum temperature, addi-tional data on the actual duration are required. In the "Cli-matography of the United States No. 84," minimum and maximum extremes for each day are averaged for the years 1941 through 1970 (101). Maximum extreme temperatures occurring at 20 randomly selected stations were compared with the iso-
Table B.1. Correlation between normal daily minimum temperature and minimum effective bridge temperature.
Normal Daily Minimum
Temperature
Minimum Effective Bridge Temperature Type of Superstructure
Concrete Composite Steel Only °F "F "F
-30 -3 -12 -43 -25 0 -9 -36 -20 3 -7 -30 -15 5 -4 -24 -10 8 -1 -17 -5 11 2 -10
0 13 4 -5 5 16 9 0
10 19 14 5 15 22 17 11 20 25 22 16 25 29 26 22 30 32 31 27 35 35 36 33 40 38 40 38
Table B-2. Correlation between normal daily maximum temperature and maximum effective bridge temperature.
Normal Daily Maximum
Temperature
Maximum Effective Bridge Temperature Type of Superstructure
Concrete Composite Steel Only "F 'F "F
55 66 70 91 60 69 74 94 65 73 79 97 70 77 83 101 75 80 88 104 80 84 93 107 85 88 96 110 90 92 99 112 95 95 102 115
100 98 104 116 105 101 105 118 110 105 107 120

40 0 I- 00 30
20
4- 0 0 1.-
ho E
0
-JO
-20 E
-5° -40 -30 -20 -10 0 JO 20 30 40 50 60 70 80 90 100 110 120
Normal Daily Minimum or Maximum Temperature (°F)
Figure B-i. Correlation between minimum or maximum temperature and minimum or maximum effective bridge temperature.
-40
-30
8C
I Maximu -I-----
i __
/
-1----
United Kingdom
Minimum N
I
~nited States
—Unite I States
-----
Ne
A United Kingdom
F/
75
therms for the normal daily maximums and found to agree within 6°F. Minimum extreme temperatures were also compared with the isotherms for the normal daily minimums and found to agree within 6°F. Initially, it was thought that the extremes on a day-to-day basis (averaged over the 30-year period from 1941 through 1970) would be substantially different from those obtained from the isotherms. On the basis of this comparison, it may be concluded that the isotherms selected will yield fairly
accurate approximations of the minimum and maximum ex-tremes for the United States. Local meteorological data may be more applicable in mountainous areas, coastal areas, urban areas, and sheltered, low-lying areas where frost pockets may develop. It is recommended that local meteorological data rather than isotherms be used for unusually large or complex bridges located in regions where extreme temperature conditions are known to occur.

76
3. DIFFERENTIAL TEMPERATURES
Variations in temperature at different depths of the super-structure caused by solar radiation effects may result in signif-icant temperature-induced fiber stresses. These stresses are induced in two ways. The first way occurs when bending mo-ments are generated in continuous spans as a result of the differences between the deformations in the top and bottom fibers. These deformations will cause a deflection in the super-structure; stresses result when this deflection is restrained by structure continuity. The second way in which stresses are in-duced is when nonlinear temperature variations through the depths of the section cause initially plane sections of the su-perstructure to become distorted. Because shallow superstruc-tures have not been adversely affected in the past by temperature differentials, design thermal gradients were developed for su-perstructures with depths greater than 2 ft.
Most typical structures have not experienced difficulties be-cause of temperature differentials. Recently, however, concrete bridge designs have become more sophisticated. As a result, span lengths have increased and designers have kept superstruc- ture weights at a minimum. This has resulted in a reduction of reserve strength for temperature-induced stresses, a reduction which has caused unacceptable cracking in some bridge super-structures. Much of this unacceptable cracking could have been avoided had the designer accurately considered the effects of differential temperatures:
Bridges can be protected from excessive temperature-induced stresses in several ways. One method is to resist the tensile force produced by the tensile stresses by providing a sufficient quantity of mild reinforcement in the zone of tension. Stresses in rein-forcement should be limited to 0.6 f, for crack control. Extra prestressing steel may also be used. However, it is recommended that the designer not rely on the tensile strength of concrete.
3.1 Positive Temperature Gradients
Positive temperature gradients occur when solar radiation, large diurnal temperature variations, and/or low wind speed conditions produce a higher temperature in the bridge deck. Each of these individual weather conditions varies throughout the United States, and they can combine to produce extreme positive temperature distributions in concrete bridge superstruc-tures in some locations. Experimental data from 26 SOLMET stations in the United States were used to compute the maximum temperature differences of a 2-m (6.56-ft) deep concrete bridge structure (73). In order to obtain solar radiation zones in the United States these temperature differences were superimposed on solar radiation contours for the month of July (99). The maximum solar radiation zones for an unsurfaced deck, a 50-mm (2-in.) blacktop deck, and a 100-mm (4-in.) blacktop deck are shown in Figures B-2, B-3, and B-4, respectively. The United States has been divided into four climatic zones (see Fig. B-5), each reflecting the maximum expected positive temperature gra-dients expected for its geographical area. The temperature var-iations in these four categories, as shown, shall be assumed to occur throughout the deck and girder members. The positive temperature gradient was based on studies done in Illinois (73). A simplification of the New Zealand fifth order temperature distribution was shown to be a good approximation by using straight-line segments from lower bound and upper bound tem-
perature differences at the SOLMET stations in Brownsville, Texas, and Phoenix, Arizona, respectively. Basically the gra-dient was composed of three linear curves at the top portion of the deck. In order to obtain temperature differences in the United States average maximum temperature differences were computed over each solar radiation zone to obtain T1 . Tem-perature differences for Zone 4 were obtained by extrapolation.
Because of the effect of the enclosed air cavity in concrete box girder bridges, the temperature in the deck above the cavity will be slightly different than in an exposed deck. Measurements made by researchers at the University of Illinois have shown that box girder deck temperatures above the girder stems do not vary significantly from those in the deck above the cell (73). Modifications to the design temperature gradients for box gir-ders are required to account for this phenomenon. Although the temperatures in the cantilevered deck overhang and the center of the girder stems are not likely to be significantly altered by the presence of the enclosed air cavity, a uniform temperature gradient may be applied to the entire cross section of a box girder bridge for the sake of simplicity. This practice will lead to thermal stress distributions very similar to those obtained if unadjusted thermal gradients were used in the overhangs and the webs.
3.2 Negative Temperature Gradients
Negative temperature gradients may occur when a bridge superstructure that had obtained a high temperature during the day experiences a reduction in temperature caused by a cool night. For convenience, the design negative temperature gradient in these recommendations is related to the temperatures and distances used for the design positive gradient. The shape of the negative gradient is based on the negative gradient proposed in British Standard BS 5400.
COEFFICIENT OF THERMAL EXPANSION
Several researchers have investigated the effect of aggregate type on the coefficient of thermal expansion for concrete. The values given in Table B-3 are averages of values reported in the literature.
ANALYSIS PROCEDURES
Several techniques exist for determining the effects of tem-perature-induced strains on a bridge structure. The following assumptions are made when performing thermal stress analyses using the one-dimensional beam theory.
The material is homogeneous and exhibits isotropic be-havior.
Material properties are independent of temperature. The material has linear stress-strain and temperature-strain
relations. Thus, thermal stresses can be considered indepen-dently of stresses or strains imposed by other loading conditions, and the principle of superposition holds.
The Navier-Bernoulli hypothesis that initially plane sec-tions remain plane after bending is valid.
The temperature varies only with depth, but is constant
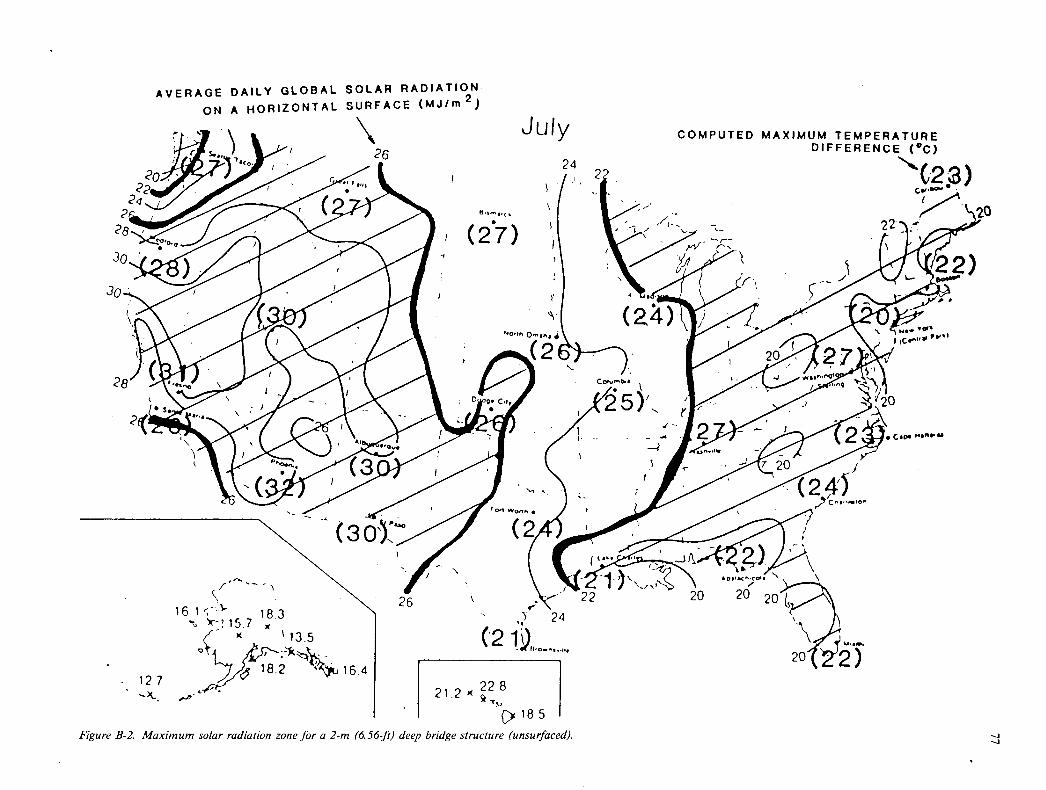
GLOBAL SOLAR RADIATION AVERAGE DAILY IZONTAL SURFACE (MJIm )
July COMPUTED MAXIMUM TEMPERATURE
\ 26
DIFFERENCE (9C)
120
24
228
20
Jo
°iJ1J: () / I '
c.
20 (//k
7 20
X(3 10)"-/ (2
22
15.7
çX '13.5 ('2 1
12 16.4
7
228 .. ' 21.2*
18,5
Figure B-2. Maximum solar radiation zone for a 2-rn (6.56-fl) deep bridge structure (unsurfaced).
, 20 20 20't7\
20425

AVERAGE DAILY GLOBAL SOLAR RADIATION 2 COMPUTED MAXIMUM TEMPERATURE
N A HORIZONTAL SURFACE (MJ/m ) July DIFFERENCE (°C)
S.
\
\_ " ' 26 24 (18) 20
22
(2228
3o7 I
( ,
<2 20
2\I (
\f ) rv i 4 1 L p
26 7'
) 1 (j 1
19)
2 ) 26 /'
:157 183 2(\
15t.
20
16.4
r
212 x
185 Figure B-3. Maximum solar radiation zone for a 2-m (6.56-fl) deep bridge structure with a 50-mm (2-in.) blacktop.
00

AVERAGE DAILY GLOBAL SOLAR RADIATION
ON A HORIZONTAL SURFACE (MJ/m2) Jul COMPUTED MAXIMUM TEMPERATURE
y DIFFERENCE (°C)
26 (24
-24 26
28 <)
30
\ ç
30
( 1
2
28
1
ooc?
- i 6). ) Es
: / K'
26 / 22 20 20 20
y18.5 Figure B-4. Maximum solar radiation zone for a 2-rn (6.56-fl) deep bridge structure with a 100-mm (4-in.) blacktop.

2
7 ( L• -. I I I (2
( .
/ 1 i 2 i
I \
113
Figure B-5. Zones of maximum solar radiation for the United States.

at all points of equal depth (except those points over an enclosed cell).
6. Longitudinal and transverse thermal responses of the bridge superstructure can be considered independently and the results superimposed; i.e., the longitudinal and transverse ther-mal stress fields are assumed to be uncoupled.
This final assumption simplifies the analysis, particularly for such complex section geometries as box girders. Because of this assumed uncoupling of the responses, the theory and analysis techniques for longitudinal and transverse thermal stresses are generally treated separately.
Perhaps the most troublesome analysis most designers are likely to encounter is the analysis of the effects of temperature differentials on the longitudinal fiber stresses induced in pre-stressed bridge superstructures. This analysis is typically ac-complished by first assuming that the free ends of the bridge superstructure are restrained from both translation and rotation. Thermal stresses will be induced throughout the depth of the cross section according to the following equation:
o- (Y) = EcT(Y)
where o- (Y) = longitudinal stress at a fiber located a distance Y from the center of gravity of the cross section; E = elastic modulus; c = coefficient of thermal expansion; and T( Y) = temperature at a depth Y
These stresses will result in axial forces and bending moments at the restrained ends of the superstructure. The response of an unrestrained bridge structure to a given temperature gradient may be obtained by superimposing on the stresses and defor-mations in the restrained bridge the stresses and deformations
81
resulting from equal and opposite axial forces and bending mo-ments applied at the free ends of the bridge. In some computer programs, this can be done by applying equivalent prestress forces to simulate the stresses induced at the restrained end of the bridge.
Table B-3. Coefficients of thermal expansion based on aggregate base (thermal coefficient of concrete based on fine and coarse aggregates).
AGGREGATE TYPE THERMAL COEFFICIENT
OF CONCRETE* (0.000001 per F)
Quartzite 7.1
Quartz 6.4
Sandstone 6.5
Gravel 6.9
Granite 5.3
Dolerite 5.3
Basalt 5.0
Marble 2.4-4.1
Limestone 4.0
*Based on fine and coarse aggregates
APPENDIX C
WORKED EXAMPLE PROBLEMS
EXAMPLE 1
Problem
A three-span pedestrian overcrossing, which is shown in Fig-ure C-1, has been built in Albuquerque, New Mexico. The effective bridge temperature at which the bridge was restrained was approximated at 57F. The deck surface is plain. Determine the expansion up to the maximum effective bridge temperature, the contraction down to the minimum effective bridge temper-ature, and the longitudinal stress distribution through the su-perstructure due to the temperature gradients.
Solution
Determine the expansion up to the maximum effective bridge temperature.
Step 1: Determine the normal daily maximum temperature at the given location from Figure C-2.
Maximum Temperature = 90°F
Step 2: Determine the maximum effective bridge temper-ature from Table C- 1.

250
75, 100, 75
ELEVATION
Y 8°
N. A. - .54
246
4L0 ° 25.1 ft 2
0 1° 55.1 ft4
E = 0.7.06 ksf
I2'L - I00" I2" a = 6.0.10-6 ft/ft/°F
20-0
Table C-i. Correlation between normal daily maximum temperature and maximum effective bridge temperature.
Normal Daily Maximum
Temperature
Maximum Effective Bridge Temperature Type of Superstructure
Concrete Composite Steel Only at.
55 66 70 91 60 69 74 94 65 73 79 97 70 77 83 101 75 80 88 104 80 84 93 107 85 88 96 110 0 92 99 117 95 95 102 115 100 98 104 116 105 101 105 118 110 105 107 120
82
SUPERSTRUCTURE AND COLUMN CROSS SECTION
Figure C-i. Elevation and superstructure cross section of Ex-ample 1.
Maximum Effective Bridge Temperature = 91.8°F
(c) Step 3: Calculate the expansion up to the maximum effec- tive bridge temperature.
Expansion = Lai T = (250 ft)(6.0 x 10_6 ft/ft/°F)(92°F - 57.0°F) = 0.0525 ft = 0.0630 in.
2. Determine the contraction down to the minimum effective bridge temperature.-
(a)
emperature:
(a) Step 1: Determine the normal daily minimum temperature at the given location from Figure C-3.
Minimum Temperature = 25°F
Step 2: Determine the minimum effective bridge tempera- ture from Table C-2.
Minimum Effective Bridge Temperature = 29°F
Step 3: Calculate the contraction down to the minimum effective bridge temperature.
Contraction = La4 T = (250 ft)(6.0 x 10 6 ft/ft/°F)(29°F - 57.0°F) = —0.0420 ft = —0.504 in.
3. Determine the longitudinal stress distribution through the su-perstructure due to the temperature gradients:
(a) Positive Gradient Stress Distribution Step 1: Determine the maximum solar radiation zone at the bridge site from Figure C-4.
Albuquerque, NM: Zone 1 (Plain concrete)
Step 2: Determine the temperature gradient from Figure C-S. The temperature distribution is shown in Figure C-6. Note that 5°F has been added to T2 and T3 for the box girder section. Step 3: Determine the thermally induced stresses assum-ing a totally restrained structure. In general, the ther-mally induced stresses are computed using Eq. 2 in Chapter Three:
cr1 (Y) = EaT(Y)
= (0.7 x 10⁶ ksf)(6.0 X 10_6 ft/ft/°F) T (Y)
= 4.20 T(Y)
The thermally induced stress distribution is shown in Figure C-7. Step 4: Determine the restraining axial stress. Using Eq. 3 in Chapter Three gives:

0 iuIy dr 80
75 . )
8 \ /
L
t.- .9O -__.. \? v"- i vV 80 95
95
i ( ? I-" ----
90 . ___ L.. .• 80
\\( 90
105
90
8090 j 90
95 (
9090
95
0 64 84 87
- .-
Figure C-2. Normal daily maximum temperature (°F) for July.

30 25 Li 20 January
- 5 5
10
5
00
-20
p.
25
30
3 01X"'~
\17 45 ,-...:
,-..-. .--...
29 64 x 65
CK
Figure C-3. Normal daily minimum temperature (°F) for January.
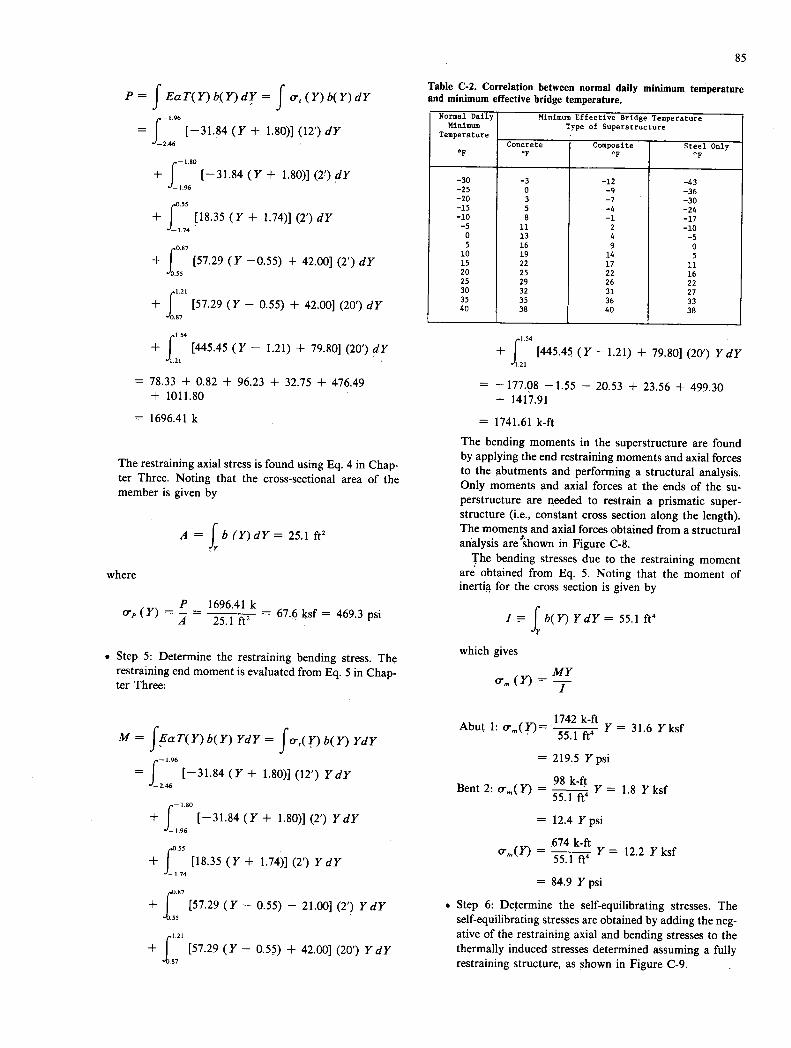
85
P=JEaT(Y)b(Y)dY=Jcr1(Y)b(Y)dY
=
f-46
1,96
[-31.84 (Y + 1.80)] (12') dY 2.
1.80 + [-31.84(Y+ 1.80)] (2') dY f 1.96
r
55 +
[18.35 (Y + 1.74)] (2') dY -1.74
J[+
f087
+ [57.29 (Y -0.55) + 42.00] (2') dY 55
57.29 (Y - 0.55) + 42.00] (20') dY 0.87
+ f 1,14
[445.45 (Y - 1.21) + 79.80] (20') dY 2!
= 78.33 + 0.82 + 96.23 + 32.75 + 476.49 + 1011.80
= 1696.41 k
The restraining axial stress is found using Eq. 4 in Chap-ter Three. Noting that the cross-sectional area of the member is given by
4 = f b (Y)dY= 25.1 ft2
where
P 1696.41 k o (Y)
25.1 ft2 67.6 ksf = 469,3 psi
Step 5: Determine the restraining bending stress. The restraining end moment is evaluated from Eq. 5 in Chap-ter Three:
M = f~E, T(Y) b(Y) YdY = f o-,Q') b(Y) YdY 1.96 f
[-31.84 (Y + 1.80)] (12') YdY 2.46
+ J
[-31.84 (Y + 1.80)] (2') YdY -1.96
p.055
± J
[18.35 (Y + 1.74)] (2') YdY -1.74
+ .1
[57.29 (Y - 0.55) + 21.00] (2') YdY .55
121
+ [57.29 (Y - 0.55) + 42.00] (20') YdY f.87
Table C-2. Correlation between normal daily minimum temperature and minimum effective bridge temperature.
Normal Daily Minimum
Temperature
Minimum Effective Bridge Temperature Type of Superatructure
Concrete Compoalte Steel Only "F
-30 -3 -12 -43 -25 0 -9 -36 -20 3 -7 -30 -15 5 -4 -24 -10 8 -1 -17 -5 11 2 -10 0 13 4 -5 5 16 9 0 10 19 14 5 15 22 17 11 20 25 22 16 25 29 26 22 30 32 31 27 35 35 36 33 40 38 40 38
+ f l.54
[445.45 (Y -1.21) + 79.80] (20') YdY 21
= - 177.08 -1.55 - 20.53 + 23.56 + 499.30 + 1417.91
= 1741.61 k-ft
The bending moments in the superstructure are found by applying the end restraining moments and axial forces to the abutments and performing a structural analysis. Only moments and axial forces at the ends of the su-perstructure are needed to restrain a prismatic super-structure (i.e., constant cross section along the length). The moments and axial forces obtained from a structural analysis are hown in Figure C-8.
The bending stresses due to the restraining moment are obtained from Eq. 5. Noting that the moment of inertia for the cross section is given by
I f b(Y) YdY = 55.1 ft4
which gives
(Y) MY
1742 k-ft r Abut 1: ,(fl"= Y = 31.6 Yksf 55.1 ft4
= 219.5 Ypsi
Bent 2: cr,(Y) = 98 k-ft Y = 1.8 Yksf
55.1 ft4
= 12.4 Ypsi
.674 k-ft = 55.1 ft4
Y = 12.2 Yksf
84.9 Ypsi
Step 6: Determine the self-equilibrating stresses. The self-equilibrating stresses are obtained by adding the neg-ative of the restraining axial and bending stresses to the thermally induced stresses determined assuming a fully restraining structure, as shown in Figure C-9.

1 •-• Y .iz•.. ( I
.1
b• I ./••
I (t I-.. -•• .
138DGE SITE 1-..
IN I
\..\J
00
Figure C-4. Maximum solar radiation zones for the United States.

(b) Negative Gradient Stress Distribution Step 1: Determine the solar radiation zone at the bridge 0.33 ft site from Figure C-4. 2
O.66ft / Albuquerque, NM: Zone 1 (Plain concrete) d ___ / fT3
Step 2: Determine the temperature gradient from Figure C-iO. The temperature distribution is shown in Figure D3
C-li. d cJ Step 3: Determine the thermally induced stresses assum- ing a totally restrained structure. The thermally induced stresses are computed identically to those of the positive gradient:
o,(Y) = 4.20 T(Y) 0.66 ft
This stress distribution is shown in Figure C-12. 5°F
Steps 4 through 6 are identical to those presented in the NOT TO SCALE
positive gradient section. (Note: For Superstructure depths greater than 2 feet)
87
Tj
Figures C-13 and C-14 show the top fiber stress and bottom fiber stress along the superstructure. These results are compared to another method which applied fictitious prestress forces to simulate the stresses induced at the restrained end of the bridge. The two methods give close comparison. This method of ap-plying fictitious prestress forces will be presented in Example 2.
Plain Concrete Surface
T1 (CF) T2 (c.F) T3 (<r)
54 14 5 46 12 4 41 11 4 38 9 3
2 in. Blacktop
EXAMPLE 2
Problem
The West Silver Eagle Bridge, which was analyzed in Chapter Five, will be used for this example, This structure, shown in Figure C-15, is a six-span 745-ft long bridge. The bridge is located in Zone 1 and assumed to have a plain concrete surface. Young's modulus is 3,350 ksi and the coefficient of thermal expansion is 6.0 >< 10_6 in./in./°F. Determine the amount of reinforcement needed to resist the thermal stresses. The method used to calculate the self-equilibrating stresses was the equivalent prestress method.
Solution
1. Positive Gradient Stress Distribution Step 1: Determine the temperature gradient from Chapter Three. The temperature distribution is shown in Figure C- 16. Step 2: Determine the thermally induced stresses assuming a totally restrained structure. The thermally induced stresses are computed using Eq. 2.
T1 (°F) T2 (°F) T3 (CF)
43 14 4 36 12 4 33 11 3 29 9 2
4 in. Blacktop
T1 (°F) T2 ('F) T3 (F)
31 9 3 25 10 3 23 11 2 22 11 2
Figure C-S. Positive temperature gradient for a concrete bridge superstructure.

77y) "°&.O(.o(yi.2/) t.'
7,). -
45Sy~
.-541°ç
7(y) 3(y4/) /.?'/
88
° '°
Figure C-6. Temperature distribution for a ppsitive temperature gradient.
y (f,) f
20' I ' tsf
2'
-,.O -I
b()r - #(y)z _3,•49 (y4/.S2)
/2' 2 L\ •"i
Figure C- 7. Thermally induced stress distribution.

89
N
MOM
IMS
Figure C-8. Moment and axial force diagram due to end restraining forces.

90
Sen+ 2 LI
+
w;U(.2i 2
C.
Figure C-9. Self-equilibrating stresses.
2
~
oU
1576 4
—4-

91
T1 Plain Concrete Surface
0.33ft I I
0.66ff T3
I
03
/03 7 T3 / /
066ff 0 T2/
/ 0.33ft T4
I / _____
NOT TO SCALE
Note: For Superstructure depths greoter than 2 feet
T1 (°F) T2 ('F) T3 ('F) T4 ("F)
27 7 2 14 23 6 2 10 21 6 2 8 19 5 2 6
2 in. Blacktop
T1 ("F) T2 (rF) T3 (cF) T4 (r.F)
22 7 2 15 18 6 2 11 17 6 2 10 15 5 1 8
4 in. Blacktop
T1 ("F) T2 (F) T3 (F) T4 ('F)
16 5 1 12 13 5 1 9 12 6 1 8 11 6 1 8
Figure C-lU. Negative temperature gradient for a concrete bridge superstructure.
27
7Ty)= I.2I, y./54'
20 t O5
o.2)
-F
T(y) 2° I
- o
y
Figure C-li. Temperature distribution for a negative temperature gradient.

92
f/3• 4' /f
;y)= - i.2i). 2.c'o 2n1.4s
t'5f
05 y /.V
O(y) /0.3 (y 4424) —O,2 y 15 0.667
-o.2.
t (y)=/4(yt (..) .:5 —4(
(y)=3I.' (yf4&
(y) y k5 f
J Figure C-12. Thermally induced stress distribution.
POSITIVE TEMPERATURE GRADIENT
METHOD I (Relaxation)
METHOD 2 (Equivalent Prestressing)
NEGATIVE TEMPERATURE GRADIENT
METHOD I ( Relaxation)
METHOD 2 (Equivalent Prestressing) -----
400
1200
a. 000
800 U,
600
400
200
0' Abut I Bent 2 Bent 3 Abut 4
-200 a-
-400 z 2 ••-..-.-..--..-.-.-'--- cj -600 z w
TOP FIBER STRESS
Figure C-13. Top fiber stress.

93
POSITIVE TEMPERATURE GRADIENT
METHOD I (Relaxation) -
METHOD 2 (Equivalent Prestressing)
CL NEGATIVE TEMPERATURE GRADIENT
METHOD I (Relaxation)
2 600 METHOD 2 (Equivalent Prestressing) -----
Ui 400 Cr
2OO\
Abut I Bent 2 Bent 3
EErST/ BOTTOM FIBER STRESS
Figure C-14. Bottom fiber stress.
Abut 4
ojY) = EaT(Y)
= (3350 ksi) (6.0 x 10_6 in. / in. /°F) T(Y)
= 0.02010 T(Y)
Table C-3 gives the thermally induced stresses for the rel-evant temperatures shown in Figure C-16. Step 3: Determine the equivalent prestress forces. The equivalent prestress forces, Pf, are shown schematically in Figure C-17 and the P-jack forces, P. which were used in a plane frame prestress program, are given in Table C-4. Step 4: Apply the equivalent prestress forces to the super-structure and calculate the self-equilibrating stresses by add-ing the negative of the results from the equivalent prestress method to the thermally induced stresses assuming a fully restrained structure. Table C-S gives the self-equilibrating stresses at selected points along the superstructure. For il-lustrative purposes a selected self-equilibrating stress dis-tribution at 0.9 point of span 1 is shown in Figure C-18.
2. Negative Gradient Stress Distribution Step 1: Determine the temperature gradient from Chapter Three. The temperature distribution is shown in Figure C-19. Step 2: Determine the thermally induced stresses assuming a totally restrained surface. The thermally induced stresses are computed using Eq. 2:
o,(Y) = EaT(Y)
= (3350 ksi) (6.0 x 10⁻⁶ in./in./°F) T(Y)
= 0.02010 T(Y)
Table C-6 gives the thermally induced stresses for the rel-evant temperatures shown in Figure C-19. Step 3: Determine the equivalent prestress forces. The equivalent prestress forces, F, are shown schematically in Figure C-20 and the P-jack forces, which were used in a plane frame prestress program, are given in Table C-7. Step 4: Apply the equivalent prestress forces to the super-structure and calculate the self-equilibrating stresses by add-ing the negative of the results from the equivalent prestress method to the thermally induced stresses assuming a fully restrained structure. Table C-8 gives the self-equilibrating stresses at selected points along the superstructure. Step 5: Evaluate the amount of reinforcement required.
Top Fiber Stresses The top fiber stresses along the superstructure are shown in Figure C-21. The point of control, which is found by inspection, is at 0.0 point of span 4. The final stress distribution at this location (shown in Figure C-22) is determined by adding the temperature effects to the dead, prestress, and live load effects. The amount of reinforce-ment is calculated as follows:
+ 0.190' /0.190 + 0.043)1 ksi T=( °719
2 )+(
2
X 0.33' X 52' x 144 in.2 /ft 2
= 1.411 kips
1411k A= =39.2in.2 /
36 ksi
Existing Reinforcement (for M) = 0.00 in. Existing Long. Reinforcement = # 5 (total 39) + #4
(total 63) = 24.7 in 2.
Need 14.5 in.2 more reinforcement.

ROL
117'-6" 135'-0 135-0 135-0 120'-0 102-6
2 3 4 b
SUPERSTRUCTURE fc • 3500 psi ELEVATION SUBSTRUCTURE f'c • 3250 psi
TYPICAL SECTION: Yb • 2.85 ft A • 79.39 ft 2 I • 289.81 f1 4
FLARED SECTION b • 2.62 ft A • 88.77 ft 2 1 331.79 ft 4
BENT: I • 25.13 ft 4
52-0"
I" r . ]7 7/8
12 5.0 4'-6 O"
L 157/6 1 FLARE
3-10 COLUMN
O FLARE BENTS 2-6
SUPERSTRUCTURE a COLUMN SECTION
Figure C-15. Case 2L— West Silver Eagle Bridge and overhead superstructure and substructure details used for analysis.

95
Bottom Fiber Stresses The bottom fiber stresses along the superstructure are shown in Figure C-23. The point of control is from the positive gradient curve at 0.5 point of span 4. The final stress distribution at this location (shown in Figure C-24) is determined by adding the temperature effects to the dead, prestress, and live load effects. The amount of reinforcement is calculated as follows:
T = [
0.267 + 022
2 ksi X 0.49' x 41.8'
X 144 in.2 /ft 2
= 718 kips
718 k = 19.9 in.' A,
36 k/in.2
Existing Reinforcement = # 5 (total 28) = 8.7 in .2
Need 11.2 in.' more reinforcement.
2.30'
Figure C-16. Temperature distribution for a positive temperature gradient.
5 0.33
I 0,33
0.33
2.30
Table C-3. Thermally induced stresses for the positive gradient.
T(F) CY t(psi)
54 1085 19 382 10 201
5 101
Table C-4. P-Jack used in the prestress program.
Average Stress Area Pf Pj
Path (psi) (in2 ) (k) (I)
1 352 2,471 870 879 2 382 2,471 944 954 3 45 2,471 111 112 4 292 2,471 722 729 5 45 285 13 14 6 201 285' 57 58 7 100 1,987 199 201 8 13 147 2 2 9 26 2,936 76 77
10 38 2,936 112 113
1085 psi
ioi Psi
Figure C-i Z Equivalent prestress forces.

-31
Figure C-18. Self-equilibrating stresses at 0. 9. point of span 1.
890 ___________
96
Table C-5. Self-equilibrating stresses.
WP FIBER __________ __________ BarI*1 FIBER
I I I Self- I I I Self-
I Fully I Negative I Axial I Equil. I Fully I Negative I Axial Equil.
I Restrained I Prestress Correction I Stresses I Restrained I Prestress I Correction Stresses
InI Point I (psi) I (psi) (psi) I (psi) I (psi) I (psi) I (psi) (psi) 0.0 1 1085 -487 0 598 1 101 1 54 1 0 I 155
I 1 1 0.9 1 1085 -195 0 890 1 101 1 -336 1 0 -235 1.0 1 1085 -172 - 1 0 1 913 1 101 1 -290 1 0 1 -189 - 0.0 1085 I -232 4 857 1 101 -224 4 -119
2 0.1 1085 I -227 4 862 I 101 -293 4 -188 0.9 1085 -254 4 I 835 I 101 -258 4 -153 1.0 1085 1 -265 1 4 1 824 1 101 1 -189 .1 4 I. - 84 0.0 1085 -272 1 4 I 817 I 101 -181 I 4 1 - 76
3 0.1 1085 -263 1 4 1 826 1 101 -246 4 I -141 0.9 1085 -249 1 4 1 840 1 101 -266 4 I -161
- 1.0 1 1085 1 -254 14 1 - 835 1 101 -201 1 4 - 96 0.0 I 1085 1 -250 1 4 1 839 1 101 -206 1 4 -101
4 0.1 1 1085 -245 1 4 844 1 101 -270 4 -165 0.9 1 1085 -269 1 4 820 1 101 -238 4 -133
1&J 1085 1 -279_ 1 4 1 810 1 101 1 -173 1 4 -68 0.0 I 1085 1 -258 3 1 830 101 -196 3 - 92
5 1 0.1 1 1085 1 -248 3 1 840 101 -266 3 -162 0.9 I 1085 1 -225 3 1 863 101 -295 3 -191 1.0 1 1085 1 -231 3 1 857 1 101 1 -225 1 3 1 -121
0.0 1 1085 -178 1 0 1 907 101 -284 I 0 1 -183 I 6 1 0.1 1 1085 -200 1 0 1 885 101 -330 I 0 1 -229 I_ 1 10 1 1085 1 -487 1 0 1 598 1 101 1 54 0 1 155
Figure C-19. Temperature distribution for a negative tempera-ture gradient.
Table C-6. Thermally induced stresses for the positive gradient.
T(cF) Y(psi)
27 —543 7 —141 2 —40
14 —289

Table C-7. P-Jack forces used in the prestress program.
7O Average
) L ox Path
Stress (psi)
Area (in2)
Pf (k)
P ()
1 201 2,471 497 502 2 141 2,471 348 352 3 25 2,471 62 63
10 4 91 2,471 225 227 5 25 285 7 7 6 40 285 11 11 7 20 1.089 22 22
- 8 20 1,089 22 22 O 9 40 432 17 17
10 38 432 16 16 11 115 963 111 112 12 13 963 13 13 13 141 1,986 280 283 14 74 1,986 147 148
5 3. Pc l
a
97
63
-Jsfl __J4 8flOn)
P~ P P, 2S
Figure C-20. Equivalent prestress forces.
Table C-8. Self-equilibrating stresses.
TOP FIBLII BOTTO/ FIDER
Sell - Sel'- Fully Pegative Axial Equll. FulLy Negative Axial Equil.
Restrained (psi)
Prestress (psi)
Correction (psi)
Stresses (psi)
Restrained (nss)
PrestresS (nsi)
Correction (psi)
Si-esse (ps:) Spitnt Point
1 0.0 -543 190 0 -353 -239 111 0 -178 1 0.9 -543 137 0 -406 -289 192 0 -137 1 1.0 -543 137 0 -406 -289 144 . 0 -145 2 0.0 -5.3 166 -2 -379 -289 112 . -2 -170 2 0.1 -543 160 -2 -385 -289 152 -2 -133 2 0.9 -543 151 -2 -304 -280 164 -2 -127 2 1,0 -543 155 -2 -390 -290 1 24 -2 -167
0.0 -543 161 -2 -384 -289 - 17 -2 774 3 I 0.1 -543 156 -2 -380 -289 157 -2 -134 3 0.9 -543 154 -2 -391 -289 169 -2 -131 3 1.0 -543 159 -2 -386 -289 I 120 -2 -171 4 0.0 -543 157 -2 -358 -280 - 22 -2 -159 4 0.1 -543 153 -2 -392 -289 162 -2 -129 4 0.9 -543 160 -2 -385 -289 153 -2 -138 4 1.0 -543 165 -2 -380 -289 113 -2 -173
0.0 -543 152 -1 -302 -289 128 -1
-162 5 0.1 -543 148 -1 -306 -299 168 -1 -122 5 0.9 -543 159 -1 -385 -289 153 -1 -137 5 1.0 -543 165 -1 -370 -289 113 -1 -177
0.0 -543 130 0 -404 -289 141 0 -118 6 0.1 -543 149 0 -403 -289 . 179 0 -110 6 1 1.0 -543 190 0 -353 -289 111 0 -17S

POSITIVE TEMPERATURE GRADIENT -
NEGATIVE TEMPERATURE GRADIENT - --
too
Abut I Bent 2 Bent 3 Bent 4 Bent 5 Bent 6 Abut 7
-100 (I) 0 -200
-300
-400 C—
-500
TOP FIBER STRESS
Figure C-21. Top fiber stresses for Example 2.
-3 P51
-_.... - iI ps
= /5/
i/B/ 94ce D3*r16u*n rcmpera-tvre OL ' Added DL 11 P5 + (L#z)/l
Figure C-22. Final stress distribution.
(I)
300 POSITIVE TEMPERATURE GRADIENT
z 0
200 NEGATIVE TEMPERATURE GRADIENT - - — (I) uJ
100 0
AbFtI Bent 2 Bent 3 _
-IOO
-2OO
-300f I.-
BOTTOM FIBER STRESS
Figure C-23. Bottom fiber stresses for Example 2.
Bent 6 / Abut 7
ITA' /
98
000
900
800
2 700 a-
600
500
40C
300

99
O7'
Fina l Sh-e.s D's*. Thrnp e re. tL 4- OLPS+(L4.I)H Figure C-24. Final stress distribution.
APPENDIX D AND APPENDIX E
Appendix D, "Summary of Bridge Design Codes of Different Countries," and Appendix E, "Alternative Analysis Procedures for Calculating Thermally Induced Longitudinal Stresses," are not published herewith but are contained in the agency final report as submitted to the sponsors, and are available on a loan basis on request to the Director, Cooperative Research Pro-grams.

THE TRANSPORTATION RESEARCH BOARD is a unit of the National Research Council, which serves the National Academy of Sciences and the National Academy of En-gineering. The Board's purpose is to stimulate research concerning the nature and performance of transportation systems, to disseminate information that the research produces, and to en-courage the application of appropriate research findings. The Board's program is carried out by more than 270 committees, task forces, and panels composed of more than 3,300 admin-istrators, engineers, social scientists, attorneys, educators, and others concerned with tanspor-tation; they serve without compensation. The program is supported by state transportation and highway departments, the modal administrations of the U.S. Department of Transportation, the Association of American Railroads, the National Highway Traffic Safety Administration, and other organizations and individuals interested in the development of transportation.
The National Research Council was established by the National Academy of Sciences in 1916 to associate the broad community of science and technology with the Academy's purposes of furthering knowledge and of advising the Federal Government. The Research Council has become the principal operating agency of both the National Academy of Sciences and the National Academy of Engineering in the conduct of their services to the government, the public, and the scientific and engineering communities. It is administered jointly by both Academies and the Institute of Medicine.
The National Academy of Sciences was established in 1863 by Act of Congress as a private, nonprofit, self-governing membership corporation for the furtherance of science and technology, required to advise the Federal Government upon request within its fields of competence. Under its corporate charter the Academy established the National Research Council in 1916, the National Academy of Engineering in 1964, and the Institute of Medicine in 1970.

TRANSPORTATION RESEARCH BOARD National Research Council
2101 ConstItution Avenue, N.W.
Washington, D.C. 20418
ADDRESS CORRECTION REQUESTED
NON-PROFIT ORG. I U.S. POSTAGE
PAID WASHINGTON, D.C.
PERMIT NO. 8970
oc0O15MD0l JAMES w HILL
ERV I SOR RES EARCH IDAHO TRANS DEPT DIV OF HWY
P 0 BOX 7129 3311 t&83