Acetylcholine release from proteoliposomes equipped with synaptosomal membrane constituents
Upload
independentCategory
view
0download
0
ACPD10, 4225–4269, 2010
Humidificationfactors of fresh
smoke particles frombiomass burning
J. L. Hand et al.
Title Page
Abstract Introduction
Conclusions References
Tables Figures
J I
J I
Back Close
Full Screen / Esc
Printer-friendly Version
Interactive Discussion
Atmos. Chem. Phys. Discuss., 10, 4225–4269, 2010www.atmos-chem-phys-discuss.net/10/4225/2010/© Author(s) 2010. This work is distributed underthe Creative Commons Attribution 3.0 License.
AtmosphericChemistry
and PhysicsDiscussions
This discussion paper is/has been under review for the journal Atmospheric Chemistryand Physics (ACP). Please refer to the corresponding final paper in ACP if available.
Measured and modeled humidificationfactors of fresh smoke particles frombiomass burning: role of inorganicconstituentsJ. L. Hand1, D. E. Day1, G. M. McMeeking2,*, E. J. T. Levin2, C. M. Carrico2,S. M. Kreidenweis2, W. C. Malm3, A. Laskin4, and Y. Desyaterik4,2
1Cooperative Institute for Research in the Atmosphere, Colorado State University, Fort Collins,CO, USA2Department of Atmospheric Science, Colorado State University, Fort Collins, CO, USA
4225

ACPD10, 4225–4269, 2010
Humidificationfactors of fresh
smoke particles frombiomass burning
J. L. Hand et al.
Title Page
Abstract Introduction
Conclusions References
Tables Figures
J I
J I
Back Close
Full Screen / Esc
Printer-friendly Version
Interactive Discussion
3National Park Service, Cooperative Institute for Research in the Atmosphere, Colorado StateUniversity, Fort Collins, CO, USA4William R. Wiley Environmental Molecular Sciences Laboratory, Pacific Northwest NationalLaboratory, Richland, WA, USA*now at: Center for Atmospheric Science, University of Manchester, Manchester, UK
Received: 27 January 2010 – Accepted: 5 February 2010 – Published: 12 February 2010
Correspondence to: J. L. Hand ([email protected])
Published by Copernicus Publications on behalf of the European Geosciences Union.
4226

ACPD10, 4225–4269, 2010
Humidificationfactors of fresh
smoke particles frombiomass burning
J. L. Hand et al.
Title Page
Abstract Introduction
Conclusions References
Tables Figures
J I
J I
Back Close
Full Screen / Esc
Printer-friendly Version
Interactive Discussion
Abstract
During the 2006 FLAME study (Fire Laboratory at Missoula Experiment), laboratoryburns of biomass fuels were performed to investigate the physico-chemical, optical,and hygroscopic properties of fresh biomass smoke. As part of the experiment,two nephelometers simultaneously measured dry and humidified light scattering co-5
efficients (bsp(dry) and bsp(RH), respectively) in order to explore the role of relativehumidity (RH) on the optical properties of biomass smoke aerosols. Results fromburns of several biomass fuels showed large variability in the humidification factor(f (RH)=bsp(RH)/bsp(dry)). Values of f (RH) at RH=85–90% ranged from 1.02 to 2.15depending on fuel type. We incorporated measured chemical composition and size10
distribution data to model the smoke hygroscopic growth to investigate the role of inor-ganic and organic compounds on water uptake for these aerosols. By assuming onlyinorganic constituents were hygroscopic, we were able to model the water uptake withinexperimental uncertainty, suggesting that inorganic species were responsible for mostof the hygroscopic growth. In addition, humidification factors at 85–90% RH increased15
for smoke with increasing inorganic salt to carbon ratios. Particle morphology as ob-served from scanning electron microscopy revealed that samples of hygroscopic parti-cles contained soot chains either internally or externally mixed with inorganic potassiumsalts, while samples of weak to non-hygroscopic particles were dominated by soot andorganic constituents. This study provides further understanding of the compounds re-20
sponsible for water uptake by young biomass smoke, and is important for accuratelyassessing the role of smoke in climate change studies and visibility regulatory efforts.
1 Introduction
The significant contribution of biomass burning emissions to the global and regionalaerosol burden has been documented by several studies (e.g. Park et al., 2003, 2007;25
Spracklen et al., 2007). Quantifying the role of biomass burning aerosols in climate
4227
ACPD10, 4225–4269, 2010
Humidificationfactors of fresh
smoke particles frombiomass burning
J. L. Hand et al.
Title Page
Abstract Introduction
Conclusions References
Tables Figures
J I
J I
Back Close
Full Screen / Esc
Printer-friendly Version
Interactive Discussion
forcing and visibility degradation requires characterizing their optical, physical, chem-ical and hygroscopic properties. Many studies have been performed in the ambientatmosphere to measure radiative properties of smoke particles from wild fire and pre-scribed burning (see the review by Reid et al., 2005a, b). However, interpreting theseresults is complicated due to the variety of conditions under which the smoke was5
generated in the ambient atmosphere. Typically, ambient smoke is generated by acombination of biomass fuels of varying moisture, under a variety of flame conditionsand is also affected by atmospheric aging. Previous studies have provided a wealth ofdata for ambient biomass smoke properties and are necessary to understand smokebehavior in the atmosphere. However, measurements performed in combustion facili-10
ties also provide opportunities to further investigate specific biomass smoke propertiesunder known conditions, such as for a given fuel type and flame condition.
The Fire Laboratory at Missoula Experiment (FLAME) was designed to investigatemany important questions regarding smoke properties from biomass burning. Theseexperiments were conducted at the US Forest Service’s Fire Science Laboratory in15
Missoula MT in 2006 and 2007. Results from several subsets of these experimentsinclude particle and gas emissions (McMeeking et al., 2009; Chakrabarty et al., 2006;Chen et al., 2006, 2007; Engling et al, 2006; Smith et al., 2009; Laskin et al., 2009),smoke marker properties (Sullivan et al., 2008), particle physical and optical properties(Hopkins et al., 2007; Lewis et al., 2009; Levin et al., 2010), aerosol hygroscopicity,20
cloud condensation and ice nucleation ability (Day et al., 2006; Carrico et al., 2008,2010; Petters et al., 2009; Demott et al., 2009). Burns were performed on fuels thatrepresented biomass found in locations often involved in wild and prescribed fires, suchas in the western and southeastern United States (McMeeking et al., 2009).
The focus of this paper is the hygroscopic properties of biomass smoke measured25
during FLAME 2006. Quantifying the behavior of aerosols with respect to changing rel-ative humidity (RH) is necessary for accurately estimating their role in climate forcing(Hansen et al, 2005) visibility degradation (Malm et al., 2005), cloud nucleating abil-ity (Vestin et al., 2007; Petters et al., 2009), and health effects (Naeher et al., 2007).
4228
ACPD10, 4225–4269, 2010
Humidificationfactors of fresh
smoke particles frombiomass burning
J. L. Hand et al.
Title Page
Abstract Introduction
Conclusions References
Tables Figures
J I
J I
Back Close
Full Screen / Esc
Printer-friendly Version
Interactive Discussion
One description of the hygroscopic response of a particle is the diameter growth fac-tor, GF, defined as the ratio of particle diameter at a specific relative humidity to thedry particle diameter (GF=Dp(RH)/Dp(dry)). However, estimating the effects of RH onaerosol radiative properties requires additional information, such as changes in par-ticle mass, composition, size, shape and morphology as a function of RH, as these5
properties also affect the amount of light scattered by a particle. The humidificationfactor, f (RH), describes changes in particle light scattering as a function of RH and isdefined as the ratio of light scattering coefficients (bsp) of humidified to dry aerosols(f (RH)=bsp(RH)/bsp(dry)). A computed f (RH) value for a pure, spherical inorganic saltparticle composed of ammonium sulfate with a mass mean diameter of 0.4 µm and ge-10
ometric standard deviation of 1.9 is 3.7 at 85–90% RH, implying that these humidifiedparticles scatter almost four times as much light as compared to dry conditions. Anexperimental humidification factor is typically determined by parallel measurements oflight scattering coefficients under dry and humidified conditions (e.g. Day et al., 2000;Malm et al., 2003).15
Previous results of f (RH) for biomass smoke particles demonstrate a wide range ofestimates. Comparisons of f (RH) from various studies is complicated by the fact thatthe definitions of “dry” and “humidified” vary per study. Typically, humidified RH valuesrange from 80–90%, and although dry RH often range between 10–30%, particles maystill absorb or retain water at RH values considered “dry”. Day et al. (2006) summarized20
f (RH) values for a variety of locations and platforms, including aircraft, ground-basedand laboratory studies. Observations of f (RH) ranged from 1.01 to 2.1 (RH=80–90%)for ambient smoke; the same range of f (RH) was observed for measurements in com-bustion facilities (Day et al., 2006; Lewis et al., 2009). The range of results undoubtedlywas due to the range of RH values, the variety of fuel types and conditions, chemical25
composition of the smoke and the degree of aging and processing in the atmosphere.For example, smoke sampled in association with regional haze could be significantlymixed with inorganic species in the atmosphere that could alter hygroscopic propertiesof the particles (Li et al., 2003; Posfai et al., 2003; Semeniuk et al., 2007; Zhang et al.,
4229
ACPD10, 4225–4269, 2010
Humidificationfactors of fresh
smoke particles frombiomass burning
J. L. Hand et al.
Title Page
Abstract Introduction
Conclusions References
Tables Figures
J I
J I
Back Close
Full Screen / Esc
Printer-friendly Version
Interactive Discussion
2008; Khalizov et al., 2009). In fact, Malm et al. (2005) found that f (RH) for days-oldsmoke in Yosemite National Park CA increased from 1.2 to ∼2.0 as the ratio of or-ganic carbon mass to ammonium sulfate mass decreased. Laboratory measurementsof f (RH) for young (minutes- to hours-old) smoke reported by Day et al. (2006) were1.01–1.76 (RH=80–90%), demonstrating a significant range in the hygroscopic prop-5
erties of unprocessed young smoke. Comprehensive measurements performed duringFLAME 2006 study allowed us to investigate the range of f (RH) for young biomasssmoke in the laboratory, as well as model f (RH) as a function of RH.
Modeling of aerosol humidification factors requires predicting changes in aerosolphysical and optical properties as a function of RH and aerosol water content. Ther-10
modynamic equilibrium models such as the Extended Aerosol Inorganic Model (E-AIM)(Clegg et al., 1998) allow for the prediction of aerosol water content as a function of RH.Aerosol water content for an aerosol mixture can be computed using the Zdanovskii-Stokes-Robinson (ZSR) approach (Stokes and Robinson, 1966) wherein the amount ofwater associated with a mixture of compounds is the sum of the water content from the15
individual species. Computing changes in aerosol size (GF), physical and optical prop-erties as a function of RH is straightforward once the aerosol water content is known.Mie theory is used to compute changes in light scattering coefficients for spherical par-ticles as a function of changing particle size and optical properties. We modeled f (RH)by applying thermodynamic models and Mie theory to aerosol chemical composition20
and size distributions measured during the FLAME 2006 study.This manuscript presents measured and modeled f (RH) estimates for young
biomass smoke generated in a controlled laboratory burns of different biomass fuels.These results are noteworthy because f (RH) was measured in conjunction with particlesize, bulk PM2.5 composition and morphology measurements. Combining all of these25
data sets in a modeling framework provided for the interpretation of aerosol hygroscop-icity for very young, unprocessed (by the atmosphere) smoke. The manuscript is orga-nized in the following way. Following the introduction, Sect. 2 describes the experimentsconducted during FLAME 2006, including light scattering coefficient measurements
4230
ACPD10, 4225–4269, 2010
Humidificationfactors of fresh
smoke particles frombiomass burning
J. L. Hand et al.
Title Page
Abstract Introduction
Conclusions References
Tables Figures
J I
J I
Back Close
Full Screen / Esc
Printer-friendly Version
Interactive Discussion
(Sect. 2.1), chemical composition (Sect. 2.2), size distributions (Sect. 2.3), scanningelectron microscopy (Sect. 2.4) and particle diameter growth factors (Sect. 2.5). Sec-tion 3 provides a description of the modeling technique for computing f (RH). Resultsare discussed in Sect. 4 and include reports of uncertainties and sensitivity studies. Asummary is provided in Sect. 5.5
2 Experimental methods
Controlled burns and measurements were conducted at the United States Forest Ser-vice Rocky Mountain Research Station Fire Sciences Laboratory in Missoula MT from21 May to 9 June 2006. Details describing the facility and experimental protocols havebeen reported elsewhere (e.g. Day et al., 2006; Chen et al., 2006; Chakrabarty et10
al., 2006; McMeeking et al., 2009; Petters et al., 2009; Lewis et al., 2009; Carrico etal., 2010; Levin et al., 2010). Aerosol and gas-phase measurements were performedafter the chamber was filled with smoke and instruments sampled smoke directly. Ameasured quantity of biomass (approximately 200 g) was burned on a continuouslyweighed platform in the middle of the chamber. Fuels were ignited with a propane15
torch at the edge of the fuel, resulting in a flame front propagating through the fuel andboth flaming and smoldering conditions occurring simultaneously. The fire was allowedto extinguish naturally and the measurements continued for approximately two hours.Typically three to four burns were performed a day. In this manuscript, we presentresults from thirteen burns.20
A thorough discussion of fuel types and their origin is provided by McMeeking etal. (2009). We grouped the fuels into four main categories. The first category, “For-est/Pine”, included ponderosa pine, lodgepole pine and southern pine. The second cat-egory, “Brush”, included southern California chamise, southern California manzanita,Utah juniper, Utah sage and rabbitbrush, and southern California ceanothus. “South-25
eastern/Tropical”, the third category, included Puerto Rico fern and southeastern waxmyrtle. A final category of “Duff” included ponderosa pine duff and Alaskan duff. A
4231

ACPD10, 4225–4269, 2010
Humidificationfactors of fresh
smoke particles frombiomass burning
J. L. Hand et al.
Title Page
Abstract Introduction
Conclusions References
Tables Figures
J I
J I
Back Close
Full Screen / Esc
Printer-friendly Version
Interactive Discussion
combination of woody material, needles and leaves were burned for each type, exceptDuff which included the decayed biomass on the forest floor as well as the top layerof the soil. The fuel was dried before burning if it did not dry out sufficiently duringshipping; fuel moisture contents were reported by McMeeking et al. (2009).
2.1 Light scattering coefficients5
Two nephelometers (model M903, wavelength of 530 nm, Radiance Research Inc,Seattle, Washington) measured light scattering coefficients. The experimental designwas similar to that used in a previous FLAME experiment (Day et al., 2006) and de-scribed in detail by Day et al. (2000). Both nephelometers sampled through identicalplumbing that was connected to a PM2.5 cyclone (URG, Chapel Hill, North Carolina)10
and a sampling inlet that allowed for the control of relative humidity. RH and temper-ature were monitored at the entrance and exit of the nephelometers using hygroclipsensors (Rotronic Instruments (UK) LTD, West Sussex, UK) with a reported accuracyof ±1.5% RH at 23 ◦C. The RH sensors were calibrated against a dew point hygrometerplus RTD dry bulb temperature sensor (General Eastern Optica, Williston, Vermont) in-15
terfaced to a humidity generator (Model 2000, Kaymont, Huntington Station, New York)with reference probes calibrated using standard salt solutions. An error of ±3% isestimated to reflect uncertainty in RH inside the nephelometer due to temperature fluc-tuations. Also, RH at the inlet and outlet of the nephelometer can vary due to heatingin the nephelometer chamber. A small change in temperature (∼1 ◦) can result in a20
significant change in RH at high RH (∼5% at 95% RH) (Day et al., 2000). Although thetemperature and RH were monitored at the inlet and outlet of the nephelometer, theexact RH and temperature inside the instrument may be slightly different. Thereforewe used the average RH of the inlet and outlet sensor to represent conditions in thenephelometer chamber. The sample RH was controlled using diffusion tubes (Perma25
Pure LLC, Toms River, New Jersey).Calibrations of the nephelometers with dry, filtered air and SUVA (HFC 134a) span
gas were performed daily. The filtered air was used as a zero-point calibration and4232

ACPD10, 4225–4269, 2010
Humidificationfactors of fresh
smoke particles frombiomass burning
J. L. Hand et al.
Title Page
Abstract Introduction
Conclusions References
Tables Figures
J I
J I
Back Close
Full Screen / Esc
Printer-friendly Version
Interactive Discussion
SUVA was used as a high calibration point. During periods of low RH (<25%) discrep-ancies in bsp values of 2–5% between the two nephelometers were observed (humid-ified nephelometer was biased high) but were within expected uncertainties (Ander-son et al., 1996). Data from the humidified nephelometer were normalized to the drynephelometer data using linear regression equations derived from the comparisons of5
data during dry conditions. For burns with no data corresponding to RH<25% for bothinstruments, corrections from an experiment earlier or later in the same day were ap-plied. The sample RH of the dry nephelometer measurement was maintained between20–25%. After the biomass was ignited, the RH corresponding the humidified neph-elometer was increased from 20–25% to over 80% over a period of one to two hours10
and the light scattering coefficients were measured as the aerosols were humidified.Values of bsp, RH and temperature were logged on a 5-s time interval.
Uncertainties in bsp and f (RH) were computed by propagating errors derived fromcalibration data following the procedure detailed in Day et al. (2006). Uncertainties inbsp derived from calibration data (one standard deviation) were typically 5–8%. Com-15
parisons of the normalized data from ten burns from both nephelometers during peri-ods corresponding to low RH (<25%) are shown in Fig. 1. Error bars reflect that themeasurement uncertainty accounted for differences between the two instruments andno additional biases in the data were observed. The uncertainty in f (RH) was com-puted by propagating the calibration and normalization uncertainties in bsp and was20
approximately ±0.08 or less for all burns. We estimated that background aerosols maybe contributing at most 0.03 to measured f (RH) by assuming all of the bsp measuredduring the chamber vents was due to ammonium sulfate. This contribution is likely anoverestimate and well within our experimental uncertainty.
2.2 Chemical composition25
The IMPROVE (Interagency Monitoring of Protected Visual Environments) networksampler (Malm et al., 2004) was used to collect smoke particulate matter for PM2.5chemical speciation and gravimetric mass analysis. The IMPROVE sampler consists
4233
ACPD10, 4225–4269, 2010
Humidificationfactors of fresh
smoke particles frombiomass burning
J. L. Hand et al.
Title Page
Abstract Introduction
Conclusions References
Tables Figures
J I
J I
Back Close
Full Screen / Esc
Printer-friendly Version
Interactive Discussion
of four independent modules; the three used during FLAME were equipped with a2.5 µm cyclone. Module A consisted of a Teflon filter that was analyzed for gravimetricfine (PM2.5) mass and elements with atomic number ≥11 (Na) and ≤82 (Pb) by XRF (X-ray florescence). Ion concentrations were determined using ion chromatography fromsamples obtained from a nylon filter in module B. Module C utilized quartz fiber filters5
for sample collection from which carbon was analyzed using thermal optical reflectance(TOR) techniques to separate organic carbon (OC) from light-absorbing carbon (LAC)(Chow et al., 2007). We assumed that the aerosols were internally mixed and com-posed of inorganic salt species (KCl, K2SO4, KNO3, (NH4)2SO4, NH4Cl and NaCl),carbon (POM, particulate organic matter, and LAC) and soil (Al2O3 and CaO) following10
Levin et al. (2010). Potassium salts are commonly observed in biomass smoke emis-sions (e.g. Posfai et al., 2003; Freney et al., 2009; Semeniuk et al., 2007; Lewis et al.,2009) and in fact potassium and chloride were the most abundant ions from the emis-sions from most of these burns. Organic carbon was converted to POM by multiplyingOC by a molecular carbon to organic carbon multiplier.15
The molecular carbon to organic carbon multiplier is necessary to account for otherelements associated with the organic carbon composition (Turpin and Lim, 2001). Val-ues can range from 1 to greater than 2 depending on sources and atmospheric pro-cessing. (Turpin and Lim, 2001; Russell, 2003; El-Zanan et al., 2005; Malm and Hand,2007). We derived estimates of the multiplier using a mass balance approach by forcing20
closure between measured PM2.5 gravimetric and reconstructed mass within 5 µg m−3
(typically <3% of mass). The values obtained ranged from 1.5 to 2.5, with an averageand one standard deviation of 1.6±0.3, depending on the burn. While we recognizethese values are subject to uncertainties inherent in the mass balance approach (e.g.El-Zanan et al., 2005; Malm and Hand, 2007), the derived estimates are consistent25
with previous literature for biomass burning samples (Reid et al., 2005a; Malm et al.,2005; Turpin and Lim, 2001). Further discussion of the multiplier and the sensitivity off (RH) will be presented in Sect. 4.
4234
ACPD10, 4225–4269, 2010
Humidificationfactors of fresh
smoke particles frombiomass burning
J. L. Hand et al.
Title Page
Abstract Introduction
Conclusions References
Tables Figures
J I
J I
Back Close
Full Screen / Esc
Printer-friendly Version
Interactive Discussion
2.3 Particle size distributions
Particle number concentrations as a function of size were measured using a differentialmobility particle sizer (DMPS, TSI, Minneapolis, Minnesota) that included a differentialmobility analyzer (TSI 3081) and associated condensation particle counter (TSI 3785).A total of 24 bins were used with a diameter range of 0.04<Dp <0.65 µm. The sample5
was not dried because the RH of the burn chamber was typically lower than 20%.More details regarding the size distribution measurements are provided by Levin etal. (2010). From the 10 min dry aerosol number distributions we computed an averagesize distribution over the entire (∼2 h) burn. In some cases the size distributions evolvedover the burn duration, in other cases it remained fairly stable (see Levin et al., 2010).10
Results from both McMeeking et al. (2009) and Levin et al. (2010) indicate that thesize distributions were dominated by accumulation mode particles. Sensitivity to thevariability of the size distribution to f (RH) will be discussed in Sect. 4.
Mass concentrations were derived by integrating the volume size distributions mea-sured by the DMPS and multiplying by a mixture density derived from the chemical15
composition data for each burn (see Sect. 3). Comparisons between DMPS recon-structed mass and gravimetric fine mass from the IMPROVE samplers showed anoverestimation of the DMPS mass by a factor of six in some cases. Recall that the IM-PROVE sampler is a PM2.5 sampler while the DMPS samples particles up to ∼0.65 µmin diameter, so it was expected that the DMPS would actually underestimate particu-20
late mass given the differences in the upper size limits. Previous studies have shownthat when using the DMPS to sample non-spherical particles sizing discrepancies canoccur (e.g. Kramer et al., 2000; Schneider et al., 2006; Khalizov et al., 2009). Aswe will show in Sect. 4, many of the burns yielded fractal particles containing long-chains of soot as observed in scanning electron microscope (SEM) images. In fact,25
the largest discrepancies in mass corresponded to samples dominated by aggregatedsoot chains. To account for the effects of non-sphericity on size distributions, we usedthe dynamic shape factor, χ , defined as the ratio of the actual resistance force of a
4235

ACPD10, 4225–4269, 2010
Humidificationfactors of fresh
smoke particles frombiomass burning
J. L. Hand et al.
Title Page
Abstract Introduction
Conclusions References
Tables Figures
J I
J I
Back Close
Full Screen / Esc
Printer-friendly Version
Interactive Discussion
non-spherical particle to the resistance force of a sphere having the same velocity andvolume (Hinds, 1999). For our application, χ relates the equivalent diameter (Dp) tothe mobility diameter (Dm) by Eq. (1):
χ =Dm
Dp(1)
A shape factor of χ=1 corresponds to a sphere and for irregularly shaped particles or5
agglomerates it can be as high as 2 or more (Baron and Willeke, 1993). Shape factorswere derived by dividing the DMPS-derived mass by the IMPROVE gravimetric finemass and taking the cubed root. The values ranged from 0.8 to 1.8 with an averageand one standard deviation of 1.3±0.3. These shape factors are in the range reportedby Kramer et al. (2000) for sodium chloride crystals, and for biomass smoke (Schnei-10
der et al., 2006; Gwaze et al., 2006). The highest values corresponded to the burnswith agglomerates of soot chains viewed by SEM images, consistent with observationmade earlier of the comparisons with the largest discrepancies in mass. There werethree cases when χ < 1 (ponderosa pine duff, Alaska duff and ceanothus); values lessthan one are physically unrealistic and reflect the uncertainties in the estimates. For15
example, values of χ obviously were sensitive to the derived densities used to computemass, as well as any discrepancies in the volume or mass concentrations. We adjustedthe size distributions by dividing bin diameters by the shape factors derived for eachburn. Sensitivity of f (RH) to the application of the shape factor will be discussed inSect. 4.20
2.4 Scanning electron microscopy analysis
Particles were collected onto transmission electron microscope filmed grid substrates(Carbon type B on Cu 400 mesh grids, Ted Pella Inc. Redding, California) for scanningelectron microscopy analysis using a rotating cascade impactor (MOUDI, model 110,MSP, Inc.). Scanning electron microscopy imaging of collected samples and X-ray25
microanalysis of particles were performed at the Environmental Molecular Sciences4236
ACPD10, 4225–4269, 2010
Humidificationfactors of fresh
smoke particles frombiomass burning
J. L. Hand et al.
Title Page
Abstract Introduction
Conclusions References
Tables Figures
J I
J I
Back Close
Full Screen / Esc
Printer-friendly Version
Interactive Discussion
Laboratory (Richland, WA), using a FEG XL30 digital scanning electron microscope(FEI, Inc) equipped with an energy dispersed X-ray (EDX) spectrometer (EDAX, Inc).Specific details of the SEM/EDX analysis of particles deposited onto filmed grid sub-strates are described elsewhere (Laskin et al., 2006, and references therein).
2.5 Growth factors (GF)5
Particle diameter growth factors (GF) were measured using a hygroscopic tandemdifferential mobility analyzer (HTDMA). The HTDMA includes a DMA that selects anearly-monodisperse aerosol sample (in this case, particles of 100 nm mobility diam-eter), followed by a conditioning system that subjects the particles to controlled watersub-saturated environment (Rader and McMurry, 1986). A second DMA classifier mea-10
sures the size distributions of humidified particles. Measurements were made at eightRH values ranging from 40% to 95%. A detailed description of the experimental pro-tocol is reported by Carrico et al. (2008, 2010). All experiments were conducted suchthat particles were initially dry (RH<15%) and then exposed to a preset higher RH be-fore being measured by the second DMA. Growth factors are defined as the ratio of15
the humidified diameter to the dry diameter. The estimated uncertainty in GF is 0.02for spherical particles, combined with an estimated uncertainty in RH of 2% (Carrico etal., 2010).
3 Modeled humidification factors (f(RH))
Modeling of humidification factors (f (RH)) as a function of RH requires knowledge of20
the changes in particle composition, size and optical properties due to changes inaerosol water content. Thermodynamic equilibrium models require aerosol chemicalcomposition data and provide aerosol water content as a function of RH. Aerosol watercontent is then used to calculate changes in particle size (GF), mass and composition.Particle light scattering coefficients are computed by applying Mie theory to measured25
4237
ACPD10, 4225–4269, 2010
Humidificationfactors of fresh
smoke particles frombiomass burning
J. L. Hand et al.
Title Page
Abstract Introduction
Conclusions References
Tables Figures
J I
J I
Back Close
Full Screen / Esc
Printer-friendly Version
Interactive Discussion
size distributions while incorporating variations in particle size and refractive index asa function of RH.
We used the E-AIM inorganic thermodynamic equilibrium model III (ExtendedAerosol Inorganic Model, Clegg et al., 1998, http://www.aim.env.uea.ac.uk/aim/aim.php) to calculate aerosol water content for inorganic aerosols by incorporating mea-5
sured mass concentrations of solid phase species. E-AIM models the system of ionsincluding hydrogen, ammonium, sodium, sulfate, nitrate and chloride as well as water.It can be run in several configurations. Species can be partitioned into solid, liquid orgaseous phases. Because E-AIM does not include potassium salts, we assumed all ofthe potassium was sodium and adjusted these concentrations to achieve a charge bal-10
ance (S. L. Clegg, personal communication, 2009). We modeled both deliquescenceand metastable equilibrium. The model was run in parametric mode that allowed forthe varying of RH from 10–99% at a temperature of 298.15 K only. While E-AIM pro-vides an option for hygroscopic growth from organic species, we did not apply it in thisapplication.15
The diameter growth factor, GF, for the inorganic aerosol mixture was computedusing Eq. (2).
GF=[(
MRH/ρRH
)/(Mdry
/ρdry
)]1/3 (2)
The dry mass and density are Mdry and ρdry, respectively. The humidified mass (MRH)is the sum of the dry mass and the derived aerosol water content as a function of RH20
from E-AIM. The humidified density (ρRH) was computed using volume-mixing rules(Hasan and Dzubay, 1983; Ouimette and Flagan, 1982) shown in Eq. (3).
ρ−1 =∑i
Xi
ρi(3)
The mass fraction for a given species (i ) is Xi and the density is ρi . The values ofρi for each species are listed in Table 1. The POM concentrations used in this cal-25
culation corresponded to the values derived from mass closure. In the case of dry4238

ACPD10, 4225–4269, 2010
Humidificationfactors of fresh
smoke particles frombiomass burning
J. L. Hand et al.
Title Page
Abstract Introduction
Conclusions References
Tables Figures
J I
J I
Back Close
Full Screen / Esc
Printer-friendly Version
Interactive Discussion
mixture density, the mass fractions and densities were summed over each individualdry species. In the case of the humidified density, the dry mixture density and waterdensity were summed. Dry mixture densities (inorganic salts+ carbon+ soil) rangedfrom 1.42–1.95 g cm−3 for all of the burns with an average and one standard deviationof 1.6±0.2 g cm−3. The dry densities for each burn are listed in Table 2. These values5
are somewhat higher than the prior estimates of biomass burning aerosol densities of1.2–1.4 g cm−3 (Reid et al., 2005a) but are consistent with Levin et al. (2010).
The mixture GF was computed using Eq. (4) following Malm and Kreidenweis (1997)who invoked the Zdanovskii-Stokes-Robinson (ZSR) assumption (Stokes and Robin-son, 1966).10
GF3 =ρdry
ρRH(∑i
XiρRH,i
ρdry,i(GFi )
3) (4)
The growth factor for species i at a given RH is GFi . The mixture dry density is ρdryand the humidified mixture density is ρRH. The species included were inorganic salts,carbon (POM+LAC) and soil. The GF values for POM, LAC and soil were set equalto one and held constant with RH, and their densities were fixed at the values listed15
in Table 1. GF curves were computed for both deliquescence and metastable equilib-rium. Both curves were normalized to one (GF=1) at the RH corresponding to the dryHTDMA measurements. This normalization resulted in suppression of the metastablecurve below the deliquescence curves at high RH. This suppression was most pro-nounced for cases when metastable equilibrium predicted considerable water at low20
RH conditions. In the absence of the normalization the two curves agreed above thedeliquescence RH.
Comparisons of modeled and measured GF are shown for weak to non-hygroscopicsmoke (ponderosa pine) and for a more hygroscopic smoke (sage/rabbit brush) inFigs. 2 and 3, respectively. The measured GF values corresponded to 100 nm di-25
ameter particles only, while the modeled GF were derived from IMPROVE PM2.5 bulkmass concentrations. Dry RH for the measured and modeled GF was the same. The
4239
ACPD10, 4225–4269, 2010
Humidificationfactors of fresh
smoke particles frombiomass burning
J. L. Hand et al.
Title Page
Abstract Introduction
Conclusions References
Tables Figures
J I
J I
Back Close
Full Screen / Esc
Printer-friendly Version
Interactive Discussion
modeled GF for smoke particles from burns of ponderosa pine (Fig. 2) were flat as afunction of RH and showed no significant difference between both methods (labeled“metastable” and “deliquescence”). The measured GF fell slightly above these curves(outside of experimental uncertainty, 0.02) but did not demonstrate any measureablegrowth with increased RH. In contrast, the modeled GF curves for sage/rabbit brush in-5
creased continuously with RH for the metastable curve while the deliquescence curveshowed additional water uptake around 70% RH. The differences between the mod-eled curves at high RH reflect the normalization discussed earlier. The measured GFvalues fell between these two curves for RH>85%, suggesting the modeled curveswere representing the hygroscopic properties of particles during this burn. We present10
these comparisons to demonstrate the typical agreement observed between measuredand modeled GF for each burn; more details regarding measured GF can be found inCarrico et al. (2010).
The GF curves were applied to the measured size distributions to compute aerosollight scattering coefficients as a function of RH. Refractive indices (n=
⇀m−ki ) were15
calculated using volume-weighted mixing rules shown in Eq. (5) (Ouimette and Flagan,1982; Hasan and Dzubay, 1983).
n= ρ∑j
Xjmj
ρj− ρ
∑j
Xjkjρj
i (5)
Real (mj ) and imaginary (kj ) parts of the refractive indices for individual species arelisted in Table 1. Here we sum over species j to avoid confusion with the imaginary20
part of the refractive index. The mixture density was computed using Eq. (3). Thereal part of the dry refractive indices ranged from 1.56 to 1.79 with an average andone standard deviation of 1.63±0.07. The imaginary part ranged from 0.012–0.39with an average and one standard deviation of 0.13±0.12. LAC was the only speciesassumed to absorb light. Some organic aerosol species may also absorb light (e.g.,25
Kirchstetter et al., 2004; Hand et al., 2005; Hoffer et al., 2006) but the effect wasnot included here. Values corresponding to each fuel are listed in Table 2. These
4240

ACPD10, 4225–4269, 2010
Humidificationfactors of fresh
smoke particles frombiomass burning
J. L. Hand et al.
Title Page
Abstract Introduction
Conclusions References
Tables Figures
J I
J I
Back Close
Full Screen / Esc
Printer-friendly Version
Interactive Discussion
values are consistent with previous reported estimates of biomass burning refractiveindices (Reid et al., 2005b, McMeeking et al., 2005; Hungershoefer et al., 2008) andare consistent with values reported by Levin et al. (2010) for FLAME 2006 and 2007studies. More discussion of these values can be found in Sect. 4.
Equation (6) was used to compute light scattering coefficients for dry or humidified5
particles (Hand et al., 2004).
bsp =∫
32
Qsp
Dpm(dry)GF2
dVdry
d logDpd logDp (6)
For bsp(dry), the Mie scattering efficiency (Qsp) is computed for diameters and complexrefractive indices of dry particles. For bsp(RH),Qsp is computed using diameters andcomplex refractive indices adjusted for water content. The dry volume size distribu-10
tion is given by dVdry/d logDp. Calculations were performed at a wavelength of 530 nm.GF is the growth factor derived with the thermodynamic models described above andDpm(dry) corresponds to the dry midpoint diameter of a size distribution bin. The hu-midification factor f (RH) was computed by dividing bsp(RH) by bsp(dry) where bsp(dry)corresponds to the RH of nephelometer measurements at 20–25% RH. The modeled15
f (RH) curves were normalized to one at the dry nephelometer RH, similar to the GFcase.
4 Results and discussion
4.1 Humidification factors (f(RH))
The extent of agreement between measured and modeled f (RH) values is limited by20
the number of simplifying assumptions required to perform the calculations. Character-izing heterogeneous, non-spherical, chemically complex particles as homogeneous in-ternally mixed spheres of known composition, size, and water content obviously could
4241

ACPD10, 4225–4269, 2010
Humidificationfactors of fresh
smoke particles frombiomass burning
J. L. Hand et al.
Title Page
Abstract Introduction
Conclusions References
Tables Figures
J I
J I
Back Close
Full Screen / Esc
Printer-friendly Version
Interactive Discussion
affect how well the calculated and measured values of f (RH) agree. The assump-tions and limitations are important to keep in mind when evaluating the comparisonsbetween modeled and measured values of f (RH), and sensitivity to some of theseassumptions will be discussed in the next section.
We present comparisons of f (RH) values for smoke particles generated from burn-5
ing of four fuel types (Forest/Pine, Brush, southeast US/Tropical and Duff) and theirrelation to other measured smoke properties such as composition and microstructure.Comparisons of measured to modeled f (RH) are difficult to quantify over the entire RHrange, therefore we compared f (RH) over RH=85–90% to avoid deliquescence RH val-ues, and we separated the comparisons between the two model estimates (metastable10
and deliquescence). The average modeled f (RH) was computed for the same RH val-ues over which the measurements were performed. Measured and modeled results forall of the fuels are reported in Table 2.
The f (RH) curve corresponding to particles generated from burns of ponderosa pineis presented in Fig. 4. Ponderosa pine is representative of the other fuels in the For-15
est/Pine fuel category, all of which produced either weak or non-hygroscopic parti-cles, with minimal growth observed above 85% (see Table 2). Values of f (RH) forsmoke from this fuel type did not exceed 1.1±0.08 for RH=85–90%. The modeledf (RH) values agreed within experimental uncertainty for fuels of this type, with modelresults ranging between 1.03 and 1.05 for both deliquescence and metastable equilib-20
rium. The modeled curves were flat over most of the RH range and started to increasearound 95%. No deliquescence behavior was observed in either measured or modeledresults. Smoke particles generated from the burning of these fuels were dominated bycarbon, with combined POM and LAC mass fractions of 83% or more. Inorganic salt tocarbon (POM+LAC) ratios were small, typically less than 0.02. Figure 5 shows an SEM25
image of particles generated in burns of ponderosa pine. Morphology of these parti-cles was very typical for those generated in burns of the Forest/Pine type of fuels. Theoily organic content of particles was largely electron-transparent and was seen in theimages as dark areas that commonly contain soot inclusions, which are seen as bright
4242

ACPD10, 4225–4269, 2010
Humidificationfactors of fresh
smoke particles frombiomass burning
J. L. Hand et al.
Title Page
Abstract Introduction
Conclusions References
Tables Figures
J I
J I
Back Close
Full Screen / Esc
Printer-friendly Version
Interactive Discussion
fragments. X-ray microanalysis of both dark areas and bright inclusions showed almostno elements other than carbon and oxygen, which was consistent with the bulk analy-sis data. Additionally, DMPS-derived shape factors for these particles were fairly small(1.0–1.2), suggesting that airborne particles were nearly spherical (Table 2), which isalso consistent with substantial coating of particles with oily organic material. Finally,5
densities ranged from 1.45–1.47 g cm−3, consistent with the dominance of POM andits density (1.4 g cm−3) that was assumed in the calculation. Refractive indices alsoreflected the dominance of POM with real values around 1.6 and imaginary parts lessthan 0.07. The organic carbon multipliers were fairly low (1.5–1.6) for these young par-ticles, as opposed to estimates reported by Malm et al. (2005) for ambient aged smoke10
(∼1.8).Smoke particles generated in the burns of Brush fuels were significantly hygroscopic,
with f (RH) values ranging from 1.18 (juniper) to 2.15 (sage/rabbit brush). The f (RH)curves shown in Fig. 6 for sage/rabbit brush fuel demonstrated flat growth (f (RH)=1)until around 55% RH after which the f (RH) smoothly increased. The measurements15
suggest deliquescence around 75% RH while the modeled deliquescence was shiftedlower by about 5% (70%). Both model approaches overestimated the data until ∼75%RH when the data fell between the deliquescence and metastable curves. Above∼85% the measurements were in closer agreement with the deliquescence curve. Themodeled f (RH=85–90%) was 2.16 and 1.87 for the deliquescence and metastable20
estimates, respectively. The continuous growth observed for smoke particles fromsage/rabbit brush burns was typical for fuels of this type (Lewis et al., 2009). Inor-ganic constituents contributed substantially to the mass of particles, with carbon massfraction ranging from 22–80% and inorganic salt to carbon ratios from 0.12–0.55 (Ta-ble 2). Smoke from these fuels had large shape factors, with the largest (χ=1.8) corre-25
sponding to particles from juniper burns. The large shape factors were consistent withobservations from the SEM images that revealed the presence of highly fractal sootparticles in the samples. The top two panels of Fig. 7 show two images of particlesin the same field of view obtained using secondary electron (SE) and backscattered
4243

ACPD10, 4225–4269, 2010
Humidificationfactors of fresh
smoke particles frombiomass burning
J. L. Hand et al.
Title Page
Abstract Introduction
Conclusions References
Tables Figures
J I
J I
Back Close
Full Screen / Esc
Printer-friendly Version
Interactive Discussion
electron (BSE) imaging modes, respectively. Soot and organic particles are clearlyseen and labeled in the SE image. Carbonaceous materials have very low backscat-tering efficiency. Therefore, both fractal soot and organic particle are nearly invisible inthe BSE image. In contrast, higher atomic number inorganic particles and inclusionsare visible in the BSE image. The bottom panel of Fig. 7 shows characteristic X-ray5
spectrum of these inorganic particles indicating their mixed KCl/K2SO4 composition.Similar observations were reported for particles sampled from chamise burns (Lewiset al., 2009) and sagebrush (Chakrabarty et al., 2006). Similarly, internally mixed sootand organic particles with inorganic species have been observed previously for am-bient biomass smoke samples (e.g. Li et al., 2003; Posfai et al., 2003; Hand et al.,10
2005; Semeniuk et al., 2007). OC multipliers tended to be higher for smoke particlesfrom burns of these fuels, as did refractive indices (real and imaginary) and densities,reflecting the higher inorganic and LAC content of these fuels (see Table 2). With theexception of ceanothus, all of the fuels of this type had LAC mass fractions of ∼30% orgreater, consistent with the dominance of soot in the SEM images.15
Smoke particles from the southeastern US/Tropical fuels tended to be less hygro-scopic than those from the Brush type, with the values of f (RH) at 85–90% RH of1.11 and 1.39 for smoke from Puerto Rico fern and wax myrtle fuels, respectively. Thedata did not show any visible deliquescence and indicated continuous growth at higherRH. For both fuels, measured f (RH) values were lower than the model estimates at20
RH=85–90%. In the case of Puerto Rico fern, the model estimates were 1.41 and 1.31for the deliquescence and metastable cases, respectively. The models significantlyoverestimated f (RH) for particles from wax myrtle burns, with f (RH)=2.03 and 1.71for the deliquescence and metastable estimates, respectively. The carbon content forparticles from fuels of this type ranged from 58% (wax myrtle) to 82% (Puerto Rico25
fern). Inorganic salt to carbon ratios were <0.3, ranging from 0.10 to 0.26 (Puerto Ricofern and wax myrtle, respectively). The shape factors, organic multipliers, densitiesand refractive indices for particles from Puerto Rico fern burns were similar to particlesfrom burns of the Forest/Pine fuels (see Table 2), but these properties were somewhat
4244
ACPD10, 4225–4269, 2010
Humidificationfactors of fresh
smoke particles frombiomass burning
J. L. Hand et al.
Title Page
Abstract Introduction
Conclusions References
Tables Figures
J I
J I
Back Close
Full Screen / Esc
Printer-friendly Version
Interactive Discussion
higher for wax myrtle. SEM images showed heterogeneity in particle microstructurefor these fuels. Round particles rich in carbon and oxygen and having inorganic inclu-sions dominated the Puerto Rico fern sample. In comparison, the wax myrtle sampleis abundant with NaCl and KCl particles internally and externally mixed with carbon butwithout the oily/liquid particles seen in the ponderosa pine sample.5
The final fuel type, Duff, included ponderosa pine duff and Alaskan duff. Smokeparticles from these burns were weak to non-hygroscopic with f (RH) values of 1.05 and1.09, respectively. The weak hygroscopic behavior observed for these particles wassimilar to those from the first fuel type and was indicated by very flat, smooth curves thatexhibit little to no growth at high RH. Within experimental uncertainty, model estimates10
(both deliquescence and metastable) agreed well, with values of f (RH) ranging from1.03–1.05. Smoke particles from both of these fuels had high carbon mass fractions(>90%) and inorganic salt to carbon ratios of 0.02. The SEM images and EDX analysisof particles from burns of ponderosa pine duff showed round and irregular particlesdominated by carbon and oxygen. Some particles appeared to have been flattened15
upon impaction onto the sample substrate; however, they do not contain oily organicconstituents characteristic of particles from the Forest/Pine fuels. Particles sampledfrom Alaskan duff burns showed fractal soot particles both internally and externallymixed with round and irregular shaped particles dominated by carbon and oxygen. Theinternally mixed particles may have been a result of coagulation. Only trace amounts of20
inorganic species were measured by X-ray microanalysis of particles from both fuels.Particle densities and refractive indices were similar to those of the Forest/Pine type,consistent with their high POM content.
The comparisons of the average f (RH) values at 85–90% RH for smoke from allburns are shown as scatter plots in Fig. 8a, b for the deliquescence and metastable25
curves, respectively. The symbols for the average f (RH) values for smoke sampled fora specific burn is denoted by a number (see Table 2) and a color (fuel type). The ex-perimental uncertainties (±0.08) are shown as dotted lines parallel to the solid perfectagreement line. The f (RH) values for smoke particles with weak hygroscopic growth
4245
ACPD10, 4225–4269, 2010
Humidificationfactors of fresh
smoke particles frombiomass burning
J. L. Hand et al.
Title Page
Abstract Introduction
Conclusions References
Tables Figures
J I
J I
Back Close
Full Screen / Esc
Printer-friendly Version
Interactive Discussion
(Forest/Pine and Duff fuel types) agreed within experimental uncertainty for the twomodel estimates. Greater disparity was observed for more hygroscopic particles de-pending on the model approach. Overall better agreement was accomplished whenusing the deliquescence curves, at least over the RH range considered here. Theexception was for smoke particles from ceanothus (#9) which agreed well with the5
metastable curve. Humidification factors for particles generated in burns of two south-eastern US/Tropical fuels were overestimated by the models.
Particles with high carbon mass fractions corresponded to low f (RH) values. Fig-ure 9 presents a summary of measured f (RH) values for RH=85–90% as a function ofinorganic salt to carbon ratios. The lowest f (RH) values (typically less than 1.1) corre-10
sponded to the lowest inorganic salt to carbon ratios (<0.05) observed for particles fromburns of Forest/Pine and Duff fuels. The most hygroscopic smoke particles from theBrush fuel type had the highest inorganic salt to carbon ratios. Smoke from the south-east US/Tropical type fell within this group as well. From Fig. 9 it is clear that as thecarbon content of particles increased relative to the inorganic content, their hygroscop-15
icity decreased. Orthogonal distance regression was applied to the data assuming un-certainties in the inorganic/carbon ratio of ±0.02 based on measurement uncertaintiesin mass concentrations. The regression resulted in a slope of 1.97±0.15, an interceptof 0.97±0.03, and a correlation coefficient of r=0.97 (significant at 99% confidencelevel). The intercept suggests an f (RH) value near one for carbon particles containing20
no inorganic constituents. Previous results reported for other measurements of hygro-scopicity during FLAME 2006 and 2007 (Carrico et al., 2010) as well measurements ofambient aged smoke particles measured in Yosemite National Park (Malm et al., 2005;Carrico et al., 2005) suggested similar behavior. Semeniuk et al. (2007) reported onthe enhancement of hygroscopicity of carbonaceous biomass burning particles mixed25
internally and externally with inorganic species during the SAFARI-2000 study in south-ern Africa. Carbonaceous particles (soot and organic particles) processed with sulfatespecies have also been shown to undergo enhancements in particle hygroscopicity(e.g. Baynard et al., 2006; Garland et al., 2007; Zhang et al., 2008; Khalizov et al.,
4246
ACPD10, 4225–4269, 2010
Humidificationfactors of fresh
smoke particles frombiomass burning
J. L. Hand et al.
Title Page
Abstract Introduction
Conclusions References
Tables Figures
J I
J I
Back Close
Full Screen / Esc
Printer-friendly Version
Interactive Discussion
2009). Our results suggest that, for some fuel types, inorganic species formed throughthe combustion of plant matter were present at the time of emission to produce signif-icantly hygroscopic particles without the influence of atmospheric processing. Similarresults were reported by Carrico et al. (2010) and Petters et al. (2009) using differentmeasurements of hygroscopicity during FLAME 2006 and 2007.5
4.2 Sensitivity of modeled f(RH)
As mentioned in the previous section, there were several assumptions and uncertain-ties associated with the data and models used to predict f (RH) values. Two of themajor assumptions included the value of the molecular weight per carbon weight mul-tiplier used to calculate POM, and the shape factor applied to the DMPS size distribu-10
tions. These assumptions were important because chemical composition influencedthe predicted aerosol water content, and the size distributions affected the derivedoptical properties. To test the impact on f (RH) values from these assumptions, weperformed sensitivity analyses to explore the role of uncertainties in size distributionsand chemical composition.15
The major source of discrepancy associated with the particle size distributions wasthe difference in integrated mass from the DMPS and IMPROVE gravimetric fine massmeasurements because of the non-sphericity of the aerosols (see Sect. 2.3). Thederived shape factors forced the agreement between mass concentrations but alsosignificantly shifted the size distributions, in most cases to smaller size. We computed20
f (RH) with and without the shape factors applied to the size distributions. The differ-ences in f (RH) were less than ±0.02 (at RH=85–90%) for all fuels and the two modelapproaches, and were not systematically biased either high or low, suggesting f (RH)was fairly insensitive to change in size distributions. The estimates were well withinthe ±0.08 experimental uncertainty. Averaging size distributions over an entire burn25
may also have contributed some uncertainty, but changes in particle size distributionsduring the sampling period were much smaller than any observed from applying shapefactors (up to 80% shift in diameter, see Table 2). The effects from variables that affect
4247

ACPD10, 4225–4269, 2010
Humidificationfactors of fresh
smoke particles frombiomass burning
J. L. Hand et al.
Title Page
Abstract Introduction
Conclusions References
Tables Figures
J I
J I
Back Close
Full Screen / Esc
Printer-friendly Version
Interactive Discussion
light scattering coefficients, such as shifting the size distribution or different optical andphysical properties for individual species, canceled when taking the ratio of bsp in thecalculation of f (RH).
Assumptions made in computing aerosol composition could also lead to uncertain-ties in modeled f (RH). The OC multiplier used to calculate POM was derived by a5
mass balance approach, forcing mass closure between reconstructed and gravimet-ric fine mass. Sensitivity to the choice of the multiplier was investigated by assumingtwo extreme values (1.2 and 2.5) that for most burns resulted in poor comparisonsbetween gravimetric and reconstructed mass. Using these two multipliers, the modelf (RH) was recalculated and compared to the f (RH) computed with the POM derived10
from mass closure. Changes in f (RH) at RH=85–90% depended on the direction ofchange in POM concentration. A decrease in POM concentration resulted in higherf (RH) values due to the increase in inorganic mass fractions, and vice versa. Forboth the deliquescence and metastable equilibrium cases, the effect of the multiplierwas within experimental uncertainty (±0.08) at 85–90% RH for most fuels. The fuels15
with the largest sensitivity (>±0.08) corresponded to those with high inorganic con-tent. Particles from burns of sage/rabbit brush, Puerto Rico fern, and ceanothus werethe most sensitive to the multiplier, especially for the case when the multiplier was 2.5.This sensitivity study suggested that for particles with high inorganic mass fractions,the f (RH) values can be sensitive to the magnitude of the POM mass fraction because20
of its role in depressing the hygroscopic growth at high RH, specifically because POMwas considered non-hygroscopic.
The sensitivity to the assumed speciation of inorganic mass was tested by calcu-lating the dry aerosol physical and optical properties such as refractive index, densityand shape factor by assuming a different mixture of inorganic salts (KCl, NaCl, am-25
moniated sulfate by degree of acidity and NH4NO3). Differences in the dry aerosolproperties were negligible. Testing the sensitivity of derived aerosol water content tothe presence of potassium salts was more difficult. As mentioned previously, the E-AIMmodel does not consider potassium salts in its formulation; therefore we assumed all of
4248
ACPD10, 4225–4269, 2010
Humidificationfactors of fresh
smoke particles frombiomass burning
J. L. Hand et al.
Title Page
Abstract Introduction
Conclusions References
Tables Figures
J I
J I
Back Close
Full Screen / Esc
Printer-friendly Version
Interactive Discussion
the potassium was sodium to derive aerosol water content. This assumption probablydid not have a significant effect on results because the deliquescence RH of most ofthe potassium salts are higher than the upper limit of the RH scans performed duringthe measurements and so may not have had a measureable impact (KCl: 84%; K2SO4:97%; KNO3: 92.3%, Freney et al., 2009, and references therein). However, it is possi-5
ble that the modeled f (RH) values were slightly higher than they would be if potassiumsalts were used to derive water contents. To illustrate, hygroscopic parameters (κ) forpotassium and sodium salts (Carrico et al., 2010, and references therein) were con-verted to GF (at RH=90%) and suggested that NaCl is only slightly more hygroscopicat 90% RH (GF=2.23) than KCl (GF=2.15), KNO3 (GF=2.11) or K2SO4 (GF=1.78).10
Although the magnitude of f (RH) may not be significantly different at high RH whenassuming sodium instead of potassium salts to derive water content, the features inthe f (RH) curves might be. Specifically, the deliquescence point for measured andmodeled f (RH) values could occur at different RH values, as suggested by the f (RH)curves presented in Fig. 6.15
The normalization of the modeled f (RH) curves also contributed some uncertainty.The modeled curves were adjusted so that f (RH) equaled one at the same dry RHvalue as the measurements, essentially accounting for any water that might have beenassociated with the measured particles at low RH. The consequences of this adjust-ment were noticeable at high RH in the suppression of the metastable equilibrium curve20
compared to the deliquescence curve, especially for the cases with significant hygro-scopic growth. The suppression of the metastable equilibrium f (RH) curve implied thatthe particles were dry at low (20–25%) RH and were humidified on the deliquescencecurve rather than existing in metastable equilibrium.
Other assumptions in modeled f (RH) include simplified treatment for calculating25
aerosol water content. We made simple assumptions regarding the average aerosolcomposition over a burn period when in reality the composition of the particles wasmost likely complex and evolving over the burn duration. We simplified the hygro-scopic growth by assuming only inorganic salts take up water and POM was completely
4249

ACPD10, 4225–4269, 2010
Humidificationfactors of fresh
smoke particles frombiomass burning
J. L. Hand et al.
Title Page
Abstract Introduction
Conclusions References
Tables Figures
J I
J I
Back Close
Full Screen / Esc
Printer-friendly Version
Interactive Discussion
non-hygroscopic. The models assumed homogeneous, internally-mixed particlesacross the accumulation mode size range, when in fact SEM images suggested het-erogeneous particles that may be internally or externally mixed. Others also haveobserved this heterogeneity in ambient smoke particles (Li et al., 2003; Posfai et al.,2003; Hand et al., 2005; Semeniuk et al., 2007). Additionally, GF data suggested there5
may be considerable heterogeneity in the particle response to water uptake, both for agiven size and across the range of accumulation mode sizes (Petters et al., 2009; Car-rico et al., 2010). Particle heterogeneity could lead to differences in hygroscopic growthacross the accumulation mode size range, resulting in particle populations growing intooptically efficient sizes at varying RHs and possibly contributing to the smoothed, con-10
tinuous growth observed in the measurements. Given all of these simple assumptionswe found acceptable agreement (within experimental uncertainty) between the mod-eled and measured f (RH) at high RH for smoke from most of the fuels examined here.
5 Summary
Measured humidification factors (f (RH)) from nephelometry demonstrated a range in15
hygroscopicity for young smoke particles from thirteen biomass fuels burned in com-bustion facility experiments. Estimates ranged from 1.02±0.08 to 2.15±0.08 at 85–90% RH depending on fuel type. Forest/Pine fuels produced particles with the leasthygroscopic properties and Brush fuels produced smoke with the most hygroscopicproperties. These ranges in hygroscopicity with fuel type are comparable to the rank-20
ings reported by Petters et al. (2009) for similar fuels. Chemical and physical char-acteristics of smoke particles were computed for each fuel from concurrent chemicalcomposition measurements. The average dry refractive index (n=m−ki , 1.63±0.07–0.13±0.12i ), densities (1.6±0.2 g cm−3), molecular carbon to organic carbon multiplier(1.6±0.3) and dynamic shape factors (1.3±0.4) were found in good agreement with25
previous estimates for biomass smoke.
4250

ACPD10, 4225–4269, 2010
Humidificationfactors of fresh
smoke particles frombiomass burning
J. L. Hand et al.
Title Page
Abstract Introduction
Conclusions References
Tables Figures
J I
J I
Back Close
Full Screen / Esc
Printer-friendly Version
Interactive Discussion
Using measured size distributions and chemical composition we modeled f (RH) val-ues as a function of RH using a thermodynamic equilibrium model and the ZSR as-sumption to estimate the mixed aerosol water content; Mie theory was used to computeaerosol optical properties assuming internally mixed spherical particles. Agreementbetween measured and modeled f (RH) values were within experimental uncertainties5
for particles from most of the fuels, suggesting that the simple assumptions applied inthe model were adequate to account for measured water uptake. Specifically, carbon,the dominant fine mass species for smoke emitted from most fuels, was treated asnon-hygroscopic.
Values of f (RH) at RH=85–90% ranged from 1.02 to 2.15 and were linearly corre-10
lated with inorganic salt to carbon ratios. These results confirmed previous findingsof hygroscopic growth of young biomass smoke (e.g. Day et al., 2006; Petters et al.,2009; Carrico et al., 2010). The smoke characteristics presented here demonstratedthat fuels with higher inorganic mass fractions and soot internally and externally mixedwith inorganic species resulted in higher f (RH) values, in some cases nearing the hy-15
groscopic properties of pure inorganic salts. In contrast, the predominantly carbonparticles resulted in only minimal growth at high RH (85–90%). Although these parti-cles did not grow significantly at high RH, their interaction with water in the atmosphereis not ruled out, as Petters et al. (2009) observed cloud nucleating ability from smokeparticles from several similar fuels. The agreement between measured and modeled20
f (RH) values provided evidence of hygroscopic young smoke most likely due to inor-ganic species burned in the plant material, as carbonaceous species were assumednon-hygroscopic in the model. These results are important for understanding the rangeof f (RH) values reported for ambient smoke and for improving our ability to parameter-ize the behavior of biomass smoke aerosols in climate studies and visibility regulatory25
efforts.
Acknowledgements. We gratefully acknowledge the USFS Fire Science Laboratory staff fortheir valuable support and assistance during the study, including Cyle Wold and Wei Min Hao.We also thank those who collected and provided fuels for the study. Funding was provided by
4251
ACPD10, 4225–4269, 2010
Humidificationfactors of fresh
smoke particles frombiomass burning
J. L. Hand et al.
Title Page
Abstract Introduction
Conclusions References
Tables Figures
J I
J I
Back Close
Full Screen / Esc
Printer-friendly Version
Interactive Discussion
the Joint Fire Science Program and the US National Park Service.
The PNNL research group acknowledges support provided from the Atmospheric Science Pro-gram of the Office of Biological and Environmental Research (OBER), US Department of En-ergy. Electron microscopy analyses were performed in the Environmental Molecular SciencesLaboratory (EMSL), a national scientific user facility sponsored by the Department of Energy’s5
Office of Biological and Environmental Research at Pacific Northwest National Laboratory(PNNL). PNNL is operated by the US Department of Energy by Battelle Memorial Instituteunder contract DE-AC06-76RL0 1830.
Disclaimer: The assumptions, findings, conclusions, judgments and views presented hereinare those of the authors and should not be interpreted as necessarily representing the National10
Park Service policies.
References
Anderson, T. L., Covert, D. S., Marshall, S. F., Laucks, M. L., Charlson, R. J., Waggoner, A. P.,Ogren, J. A., Caldow, R., Holm, R. L., Quant, F. R., Sem, G. J., Wiedensohler, A., Ahlquist,N. A., and Bates, T. S.: Performance characteristics of a high-sensitivity, three-wavelength,15
total scatter/backscatter nephelometer, J. Atmos. Oceanic Technol., 13, 967–986, 1996.Baron, P. A. and Willeke, K.: Gas and Particle Motion, in: Aerosol Measurement Principles,
Techniques and Applications, edited by: Willeke, K. and Baron, P., Van Nostrand Reinhold,New York, pp. 23–40, 1993.
Baynard, T., Garland, R. M., Ravishankara, A. R., Tolbert, M. A., and Lovejoy, E. R.: Key20
factors influencing the relative humidity dependance of aerosol light scattering, Geophys.Res. Letts., 33, L06813, doi:10.1029/2005JL024898, 2006.
Carrico, C. M., Kreidenweis, S. M., Malm, W. C., Day, D. E., Lee, T., Carrillo, J., McMeeking,G. R., and Collett Jr., J. L.: Hygroscopic growth behavior of a carbon-dominated aerosol inYosemite National Park, Atmos. Environ., 39, 1393–1404, 2005.25
Carrico, C. M., Petters, M. D., Kreidenweis, S. M., Collett Jr., J. L., Engling, G., and Malm,W. C.: Aerosol hygroscopicity and cloud droplet activation of extracts of filters from biomassburning experiments, J. Geophys. Res., 113, D08206, doi:10.1029/2007JD009274, 2008.
Carrico, C. M., Petters, M. D., Kreidenweis, S. M., Sullivan, A. P., McMeeking, G. R., Levin, E.J. T., Malm, W. C., and Collett Jr., J. L.: Water uptake and chemical composition of fresh30
4252

ACPD10, 4225–4269, 2010
Humidificationfactors of fresh
smoke particles frombiomass burning
J. L. Hand et al.
Title Page
Abstract Introduction
Conclusions References
Tables Figures
J I
J I
Back Close
Full Screen / Esc
Printer-friendly Version
Interactive Discussion
aerosols generated in open burning of biomass, Atmos. Chem. Phys. Discuss., 10, 3627–3658, 2010,http://www.atmos-chem-phys-discuss.net/10/3627/2010/.
Chakrabarty, R. K., Moosmuller, H., Garro, M. A., Arnott, W. P., Walker, J., Susott, R. A.,Babbitt, R. E., Wold, C. E., Lincoln, E. N., and Hao, W. M.: Emissions from the laboratory5
combustion of wildland fuels: Particle morphology and size, J. Geophys. Res., 111, D07204,doi:10.1029/2005JD006659, 2006.
Chen, L.-W. A., Moosmuller, H., Arnott, W. P., Chow, J. C., Watson, J. G., Susott, R. A., Babbitt,R. E., Wold, C. E., Lincoln, E. N., and Hao, W. M.: Particles emissions from laboratorycombustion of wildland fuels: In-situ optical and mass measurements, Geophys. Res. Lett.,10
33, L04803, doi:10.1029/2005GL024838, 2006.Chen, L.-W. A., Moosmuller, H., Arnott, W. P., Chow, J. C., and Watson, J. G.: Emissions from
laboratory combustion of wildland fuels: Emission factors and source profiles, Environ. Sci.Technol., 41(12), 4317–4325, 2007.
Chow, J. C., Watson, J. G., Chen, L.-W. A., Chang, M. C. O., Robinson, N. F., Trimble, D.,15
and Kohl, S.: The IMPROVE A temperature protocol for thermal/optical carbon analysis:Maintaining consistency with a long-term database, J. Air Waste Manage. Assoc. 57, 1014–1023, 2007.
Clegg, S. L., Brimblecombe, P., and Wexler, A. S.: A thermodynamic model of the system H+
- NH4+ - Na+ - SO42− - NO3− - Cl− - H2O at 298.15 K, J. Phys. Chem. A, 102, 2155–2171,20
1998.Day, D. E., Malm, W. C., and Kreidenweis, S. M.: Aerosol light scattering measurements as a
function of relative humidity, J. Air Waste Manage. Assoc., 50, 710–716, 2000.Day, D. E., Hand, J. L., Carrico, C. M., Engling, G., and Malm, W. C.: Humidification factors
from laboratory studies of fresh smoke from biomass fuels, J. Geophys. Res., 111, D22202,25
doi:10.1029/2006JD007221, 2006.DeMott, P. J., Petters, M. D., Prenni, A. J., Carrico, C. M., Kreidenweis, S. M., Collett Jr., J.
L., and Moosmuller, H.: Ice nucleation behavior of biomass combustion particles at cirrustemperatures, J. Geophys. Res., 114, D16205, doi:10.1029/2009JD012036, 2009.
Dick, W. D., Saxena, P., and McMurry, P. H.: Estimation of water uptake by organic compounds30
in submicron aerosols measured during the Southeastern Aerosol and Visibility Study, J.Geophys. Res., 105, 1471–1479, 2000.
El-Zanan, H. S., Lowenthal, D. H., Zielinska, B., Chow, J. C., and Kumar, N.: Determination of
4253
ACPD10, 4225–4269, 2010
Humidificationfactors of fresh
smoke particles frombiomass burning
J. L. Hand et al.
Title Page
Abstract Introduction
Conclusions References
Tables Figures
J I
J I
Back Close
Full Screen / Esc
Printer-friendly Version
Interactive Discussion
the organic aerosol mass to organic carbon ratio in IMPROVE samples, Chemosphere, 60,485–496, 2005.
Engling, G., Carrico, C. M., Kreidenweis, S. M., Collett Jr., J. L., Day, D. E., Malm, W. C., Hao,W. M., Lincoln, E., Iinuma, Y., and Herrmann, H.: Determination of levoglucosan in biomasscombustion aerosol by high performance anion exchange chromatography with pulsed am-5
perometric detection, Atmos. Environ., 40, S299–S311, 2006.Freney, E. J., Martin, S. T., and Buseck, P. R.: Deliquescence and efflorescence of potassium
salts relevant to biomass-burning aerosol particles, Aerosol Sci. Technol., 43(8), 799–807,2009.
Garland, R. M., Ravishankara, A. R., Lovejoy, E. R., Tolbert, M. A., and Baynard, T.: Parame-10
terization for the relative humidity dependence of light extinction: Organic-ammonium sulfateaerosol, J. Geophys. Res., 112, D19303, doi:10.1029/2006JD008179, 2007.
Gwaze, P., Schmid, O., Annegarn, H. J., Andreae, M. O., Huth, J., and Helas, G.: Comparisonof three methods of fractal analysis applied to soot aggregates from wood combustion, J.Aerosol Sci., 37, 820–838, 2006.15
Hand, J. L., Kreidenweis, S. M., Slusser, J., and Scott, G.: Comparisons of aerosol opticalproperties derived from Sun photometry to estimates inferred from surface measurements inBig Bend National Park, Texas, Atmos. Environ., 38, 6813–6821, 2004.
Hand, J. L., Malm, W. C., Laskin, A., Day, D., Lee, T., Wang, C., Carrico, C., Carrillo, J., Cowin,J. P., Collett Jr., J., and Iedema, M. J.: Optical, physical, and chemical properties of tar20
balls observed during the Yosemite Aerosol Characterization Study, J. Geophys. Res., 110,D21210, doi:10.1029/2004JD005728, 2005.
Hansen, J., Sato, M., Ruedy, R., Nazarenko, L., Lacis, A., Schmidt, G. A., Russell, G., Aleinov,I., Bauer, M., Bauer, S., Bell, N., Cairns, B., Canuto, V., Chandler, M., Cheng, Y., Del Genio,A., Faluvegi, G., Fleming, E., Friend, A., Hall, T., Jackman, C., Kelley, M., Kiang, N., Koch,25
D., Lean, J., Lerner, J., Lo, K., Menon, S., Miller, R., Minnis, P., Novakov, T., Oinas, V.,Perlwitz, Ja., Perlwitz, Ju., Rind, D., Romanou, A., Shindell, D., Stone, P., Sun, S., Tausnev,N., Thresher, D., Wielicki, B., Wong, T., Yao, M., and Zhang, S.: Efficacy of climate forcings,J. Geophys. Res., 110, D18104, doi:10.1029/2005JD005776, 2005.
Hasan, H. and Dzubay, T. G.: Apportioning light extinction coefficients to chemical species in30
atmospheric aerosol, Atmos. Environ., 17(8), 1573–1581, 1983.Hinds, W. C.: Aerosol Technology: Properties, Behavior and Measurement of Airborne Parti-
cles, 2nd ed., John Wiley & Sons, New York, pp. 42–73, 1999.
4254

ACPD10, 4225–4269, 2010
Humidificationfactors of fresh
smoke particles frombiomass burning
J. L. Hand et al.
Title Page
Abstract Introduction
Conclusions References
Tables Figures
J I
J I
Back Close
Full Screen / Esc
Printer-friendly Version
Interactive Discussion
Hoffer, A., Gelencser, A., Guyon, P., Kiss, G., Schmid, O., Frank, G. P., Artaxo, P., and Andreae,M. O.: Optical properties of humic-like substances (HULIS) in biomass-burning aerosols,Atmos. Chem. Phys., 6, 3563–3570, 2006,http://www.atmos-chem-phys.net/6/3563/2006/.
Hopkins, R. J., Lewis, K., Desyaterik, Y., Wang, Z., Tivanski, A. V., Arnott, W. P., Laskin, A.,5
and Gilles, M. K.: Correlations among Optical, Chemical and Physical Properties of BiomassBurn Aerosols, Geophys. Res. Lett., 34, L18806, doi:10.1029/2007GL0305022007, 2007.
Hungershoefer, K., Zeromskiene, K., Iinuma, Y., Helas, G., Trentmann, J., Trautmann, T., Par-mar, R. S., Wiedensohler, A., Andreae, M. O., and Schmid, O.: Modelling the optical proper-ties of fresh biomass burning aerosol produced in a smoke chamber: results from the EFEU10
campaign, Atmos. Chem. Phys., 8, 3427–3439, 2008,http://www.atmos-chem-phys.net/8/3427/2008/.
Khalizov, A. F., Zhang, R., Zhang, D., Xue, H., Pagels, J., and McMurry, P. H.: Formation ofhighly hygroscopic soot aerosols upon internal mixing with sulfuric acid vapor, J. Geophys.Res., 114, D05208, doi:10.1029/2008JD010595, 2009.15
Kirchstetter, T. W., Novakov, T., and Hobbs, P. V.: Evidence that the spectral dependence oflight absorption by aerosols is affected by organic carbon, J. Geophys. Res., 109, D21208,doi:10.1029/2004JD004999, 2004.
Kramer, L., Poschl, U., and Niessner, R., Microstructural rearrangement of sodium chloridecondensation aerosol particles on interaction with water vapor, J. Aerosol Sci., 31(6), 673–20
685, 2000.Laskin, A., Cowin, J. P., and Iedema, M. J.: Analysis of individual environmental particles
using modern methods of electron microscopy and X-ray microanalysis, Journal of ElectronSpectroscopy and Related Phenomena, 150, 260–274, doi:10.1016/j.elspec.2005.06.008,2006.25
Laskin, A., Smith, J. S., and Laskin, J.: Molecular Characterization of Nitrogen Containing Or-ganic Compounds in Biomass Burning Aerosols Using High Resolution Mass Spectrometry,Environ. Sci. Technol., 43, 3764–3771, doi:10.1021/es803456n, 2009.
Levin, E. J. T., McMeeking, G. R., Carrico, C., Mack, L., Kreidenweis, S. M., Wold, C. E.,Moosmuller, H., Arnott, W. P., Hao, W. M., Collett Jr., J. L., and Malm, W. C.: Biomass30
burning smoke aerosol properties measured during FLAME 2, J. Geophys. Res., in review,2010.
Lewis, K. A., Arnott, W. P., Moosmller, H., Chakrabarty, R. K., Carrico, C. M., Kreidenweis, S.
4255

ACPD10, 4225–4269, 2010
Humidificationfactors of fresh
smoke particles frombiomass burning
J. L. Hand et al.
Title Page
Abstract Introduction
Conclusions References
Tables Figures
J I
J I
Back Close
Full Screen / Esc
Printer-friendly Version
Interactive Discussion
M., Day, D. E., Malm, W. C., Laskin, A., Jimenez, J. L., Ulbrich, I. M., Huffman, J. A., Onasch,T. B., Trimborn, A., Liu, L., and Mishchenko, M. I.: Reduction in biomass burning aerosollight absorption upon humidification: roles of inorganically-induced hygroscopicity, particlecollapse, and photoacoustic heat and mass transfer, Atmos. Chem. Phys., 9, 8949–8966,2009,5
http://www.atmos-chem-phys.net/9/8949/2009/.Li, J., Posfai, M., Hobbs, P. V., and Buseck, P. R.: Individual aerosol particles from biomass
burning in southern Africa: 2. Compositions and aging of inorganic particles, J. Geophys.Res., 108(D13), 8484, doi:10.1029/2002JD002310, 2003.
Lide, D. R.: CRC Handbook of chemistry and physics, CRC Taylor and Francis, 2008.10
Malm, W. C. and Kreidenweis, S. M.: The effects of models of aerosol hygroscopicity on theapportionment of extinction, Atmos. Environ., 31(13), 1965–1976, 1997.
Malm, W. C., Day, D. E., Kreidenweis, S. M., Collett, J. L., and Lee, T.: Humidity-dependentoptical properties of fine particles during the Big Bend Regional Aerosol and Visibility Obser-vational Study, J. Geophys. Res., 108(D9), 4279, doi:10.1029/2002JD002998, 2003.15
Malm, W. C., Schichtel, B. A., Pitchford, M. L., Ashbaugh, L. L., and Eldred, R. E.: Spatialand monthly trends in speciated fine particle concentration in the United States, J. Geophys.Res., 109, D03306, doi:10.1029/2003JD003739, 2004.
Malm, W. C., Day, D. E., Kreidenweis, S. M., Collett Jr., J. L., Carrico, C., McMeeking, G., andLee, T.: Hygroscopic properties of an organic-laden aerosol, Atmos. Environ., 39, 4969–20
4982, 2005.Malm, W. C. and Hand, J. L.: An examination of the physical and optical properties of aerosols
collected in the IM PROVE program, Atmos. Environ., 41, 3407–3427, 2007.McMeeking, G. R., Kreidenweis, S. M., Carrico, C. M., Lee, T., and Collett Jr., J. L.:
Observations of smoke-influenced aerosol during the Yosemite Aerosol Characterization25
Study: Size distributions and chemical composition, J. Geophys. Res., 110, D09206,doi:10.1029/2004JD005389, 2005.
McMeeking, G. R., Kreidenweis, S. M., Baker, S., Carrico, C. M., Chow, J. C., Collett, Jr., J.L., Hao, W. M., Holden, A. S., Kirchstetter, T. W., Malm, W. C., Moosmuller, H., Sullivan,A. P., and Wold, C. E.: Emissions of trace gases and aerosols during the open combustion30
of biomass in the laboratory, J. Geophys. Res., 114, D19210, doi:10.1029/2009JD011836,2009.
Naeher, L. P., Brauer, M., Lipsett, M., Zelikoff, J. T., Simpson, C. D., Koenig, J. Q., and Smith,
4256

ACPD10, 4225–4269, 2010
Humidificationfactors of fresh
smoke particles frombiomass burning
J. L. Hand et al.
Title Page
Abstract Introduction
Conclusions References
Tables Figures
J I
J I
Back Close
Full Screen / Esc
Printer-friendly Version
Interactive Discussion
K. R.: Woodsmoke health effects: A review, Inhalation Toxic., 19, 67–106, 2007.Ouimette, J. R. and Flagan, R. C.: The extinction coefficient of multi-component aerosols.,
Atmos. Environ., 16(10), 2405–2419, 1982.Park, R. J., Jacob, D. J., Chin, M., and Martin, R. V.: Sources of carbonaceous aerosols over
the United States and implications for natural visibility, J. Geophys. Res., 108(D12), 4355,5
doi:10.1029/2002JD003190, 2003.Park, R. J., Jacob, D. J., and Logan, J. A.: Fire and biofuel contributions to annual mean aerosol
mass concentrations in the United States, Atmos. Environ., 41, 7389–7400, 2007.Petters, M. D., Carrico, C. M., Kreidenweis, S. M., Prenni, A. J., DeMott, P. J., Collett Jr., J. L.,
and Moosmuller, H.: Cloud condensation nucleation activity of biomass burning aerosol, J.10
Geophys. Res., 114, D22205, doi:10.1029/2009JD012353, 2009.Posfai, M., Simonics, R., Li, J., Hobbs, P. V., and Buseck, P. R.: Individual aerosol particles from
biomass burning in southern Africa: 1. Compositions and size distributions of carbonaceousparticles, J. Geophys. Res., 108(D13), 8483, doi:10.1029/2002JD002291, 2003.
Rader, D. J. and McMurry, P. H.: Application of the tandem differential mobility analyzer to15
studies of droplet growth or evaporation, J. Aerosol Sci., 17, 771–787, 1986.Reid, J. S., Koppmann, R., Eck, T. F., and Eleuterio, D. P.: A review of biomass burning emis-
sions part II: intensive physical properties of biomass burning particles, Atmos. Chem. Phys.,5, 799–825, 2005a,http://www.atmos-chem-phys.net/5/799/2005/.20
Reid, J. S., Eck, T. F., Christopher, S. A., Koppmann, R., Dubovik, O., Eleuterio, D. P., Holben,B. N., Reid, E. A., and Zhang, J.: A review of biomass burning emissions part III: intensiveoptical properties of biomass burning particles, Atmos. Chem. Phys., 5, 827–849, 2005b,http://www.atmos-chem-phys.net/5/827/2005/.
Russell, L. M.: Aerosol organic-mass-to-organic carbon ratio measurements, Environ. Sci.25
Technol., 37, 2982–2987, 2003.Schneider, J., Weimer, S., Drewnick, F., Borrmann, S., Helas, G., Gwaze, P., Schmid, O.,
Andreae, M. O., and Kirchner, U.: Mass spectrometric analysis and aerodynamic propertiesof various type of combustion-related aerosol particles, Internat. J. Mass. Spect., 258, 37–49,doi:10.1016/j.ijms.2006.07.008, 2006.30
Semeniuk, T. A., Wise, M. E., Martin, S. T., Russell, L. M., and Buseck, P. R.: Hygroscopicbehavior of aerosol particles from biomass fires using environmental transmission electronmicroscopy, J. Atmos. Chem., 56, 259–273, 2007.
4257

ACPD10, 4225–4269, 2010
Humidificationfactors of fresh
smoke particles frombiomass burning
J. L. Hand et al.
Title Page
Abstract Introduction
Conclusions References
Tables Figures
J I
J I
Back Close
Full Screen / Esc
Printer-friendly Version
Interactive Discussion
Smith, J., Laskin, A., and Laskin, J.: Molecular Characterization of Biomass Burn-ing Aerosols Using High Resolution Mass Spectrometry, Anal. Chem., 81, 1512–1521,doi:10.1021/ac8020664, 2009.
Spracklen, D. V., Logan, J. A., Mickley, L. J., Park, R. J., Yevich, R., Westerling, A. L., and Jaffe,D. A.: Wildfires drive interannual variability of organic carbon in the western U.S. in summer,5
Geophys. Res. Lett., 34, L16816, doi:10.1029/2007GL030037, 2007.Stelson, A. W.: Urban aerosol refractive index prediction by partial molar refraction approach,
Environ. Sci. Technol., 24, 1676–1679, 1990.Stokes, R. H. and Robinson, R. A.: Interactions in aqueous nonelectrolyte solutions, I, Solute-
solvent equilibria, J. Phys. Chem., 70, 2126–2131, 1966.10
Sullivan, A. P., Holden, A. S., Patterson, L. A., McMeeking, G. R., Kreidenweis, S. M., Malm, W.C., Hao, W. M., Wold, C. E., and Collett Jr., J. L.: A method for smoke marker measurementsand its potential application for determining the contribution of biomass burning from wildfiresand prescribed fires to ambient PM2.5 organic carbon, J. Geophys. Res., 113, D22303,doi:10.1029/2008JD010216, 2008.15
Turpin, B. J. and Lim, H.-J.: Species contributions to PM2.5 mass concentrations: Revisitingcommon assumptions for estimating organic mass, Aerosol. Sci. Technol., 35, 602–610,2001.
Vestin, A., Rissler, J., Swietlicki, E., Frank, G. P., and Andreae, M. O.: Cloud-nucleating proper-ties of the Amazonian biomass burning aerosol: Cloud condensation nuclei measurements20
and modeling, J. Geophys. Res., 112, D14201, doi:10.1029/2006JD008104, 2007.Zhang, R., Khalizov, A. F., Pagels, J., Zhang, D., Xue, H., and McMurry, P. H.: Variability
in morphology, hygroscopicity, and optical properties of soot aerosols during atmosphericprocessing, Proceed. Nat. Acad. Sci., 105(30), 10291–10296, 2008.
4258

ACPD10, 4225–4269, 2010
Humidificationfactors of fresh
smoke particles frombiomass burning
J. L. Hand et al.
Title Page
Abstract Introduction
Conclusions References
Tables Figures
J I
J I
Back Close
Full Screen / Esc
Printer-friendly Version
Interactive Discussion
Table 1. Density and refractive index for the species used to model aerosol optical and physicalproperties. OC and LAC correspond to organic carbon and light absorbing carbon, respectively.
Species Density (g cm−3) Refractive index
KCl 1.76 1.53a
K2SO4 1.83 1.51a
KNO3 1.78 1.47a
NH4Cl 1.8 1.41a
(NH4)2SO4 1.725 1.55b
Al2O3 2.165 1.54a
CaO 1.984 1.49a
OC 1.4 1.55b,c
LAC 2 1.96–0.66ib
a Lide et al. ; b Stelson (1990); c Dick et al. (2000)
4259
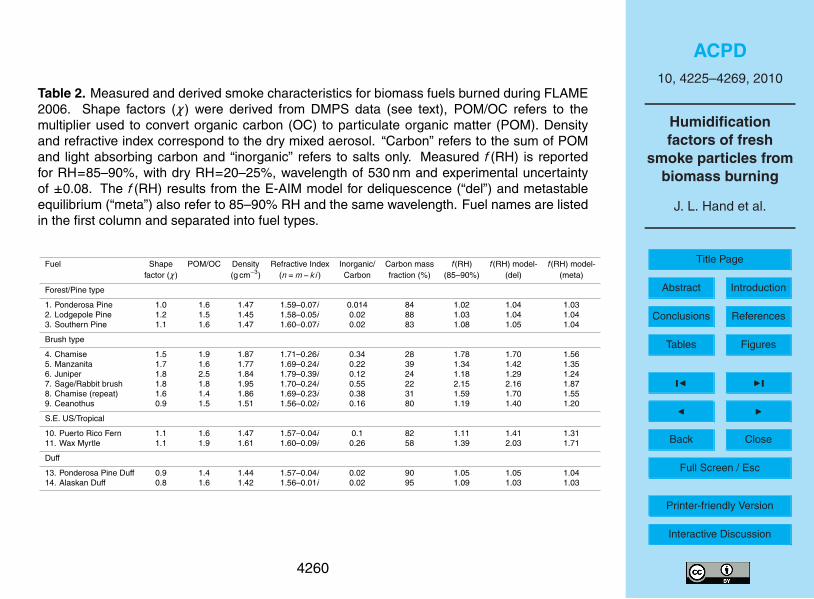
ACPD10, 4225–4269, 2010
Humidificationfactors of fresh
smoke particles frombiomass burning
J. L. Hand et al.
Title Page
Abstract Introduction
Conclusions References
Tables Figures
J I
J I
Back Close
Full Screen / Esc
Printer-friendly Version
Interactive Discussion
Table 2. Measured and derived smoke characteristics for biomass fuels burned during FLAME2006. Shape factors (χ ) were derived from DMPS data (see text), POM/OC refers to themultiplier used to convert organic carbon (OC) to particulate organic matter (POM). Densityand refractive index correspond to the dry mixed aerosol. “Carbon” refers to the sum of POMand light absorbing carbon and “inorganic” refers to salts only. Measured f (RH) is reportedfor RH=85–90%, with dry RH=20–25%, wavelength of 530 nm and experimental uncertaintyof ±0.08. The f (RH) results from the E-AIM model for deliquescence (“del”) and metastableequilibrium (“meta”) also refer to 85–90% RH and the same wavelength. Fuel names are listedin the first column and separated into fuel types.
Fuel Shape POM/OC Density Refractive Index Inorganic/ Carbon mass f (RH) f (RH) model- f (RH) model-factor (χ ) (g cm−3) (n=m−ki ) Carbon fraction (%) (85–90%) (del) (meta)
Forest/Pine type
1. Ponderosa Pine 1.0 1.6 1.47 1.59–0.07i 0.014 84 1.02 1.04 1.032. Lodgepole Pine 1.2 1.5 1.45 1.58–0.05i 0.02 88 1.03 1.04 1.043. Southern Pine 1.1 1.6 1.47 1.60–0.07i 0.02 83 1.08 1.05 1.04
Brush type
4. Chamise 1.5 1.9 1.87 1.71–0.26i 0.34 28 1.78 1.70 1.565. Manzanita 1.7 1.6 1.77 1.69–0.24i 0.22 39 1.34 1.42 1.356. Juniper 1.8 2.5 1.84 1.79–0.39i 0.12 24 1.18 1.29 1.247. Sage/Rabbit brush 1.8 1.8 1.95 1.70–0.24i 0.55 22 2.15 2.16 1.878. Chamise (repeat) 1.6 1.4 1.86 1.69–0.23i 0.38 31 1.59 1.70 1.559. Ceanothus 0.9 1.5 1.51 1.56–0.02i 0.16 80 1.19 1.40 1.20
S.E. US/Tropical
10. Puerto Rico Fern 1.1 1.6 1.47 1.57–0.04i 0.1 82 1.11 1.41 1.3111. Wax Myrtle 1.1 1.9 1.61 1.60–0.09i 0.26 58 1.39 2.03 1.71
Duff
13. Ponderosa Pine Duff 0.9 1.4 1.44 1.57–0.04i 0.02 90 1.05 1.05 1.0414. Alaskan Duff 0.8 1.6 1.42 1.56–0.01i 0.02 95 1.09 1.03 1.03
4260
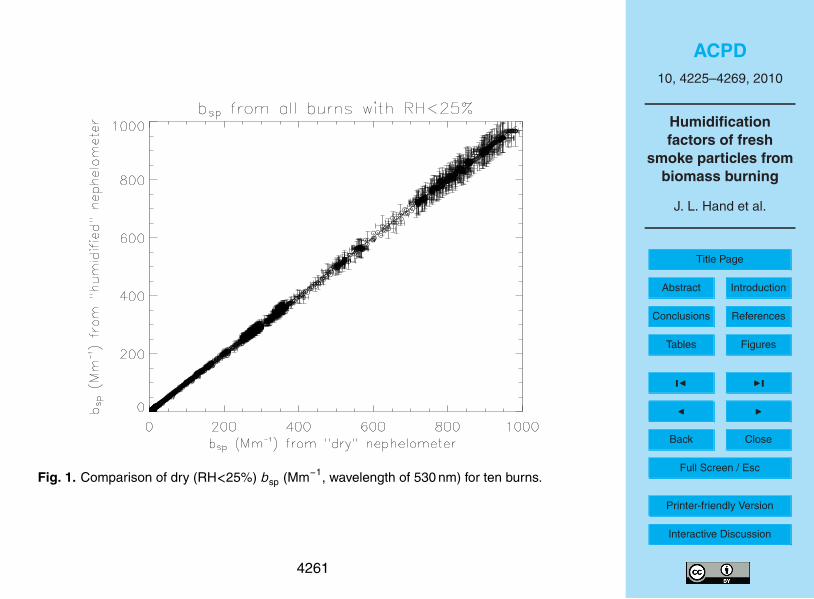
ACPD10, 4225–4269, 2010
Humidificationfactors of fresh
smoke particles frombiomass burning
J. L. Hand et al.
Title Page
Abstract Introduction
Conclusions References
Tables Figures
J I
J I
Back Close
Full Screen / Esc
Printer-friendly Version
Interactive Discussion
Figures 23
24
25
26
27
Figure 1. Comparison of dry (RH<25%) bsp (Mm-1, 530 nm) for ten burns.
34
Fig. 1. Comparison of dry (RH<25%) bsp (Mm−1, wavelength of 530 nm) for ten burns.
4261
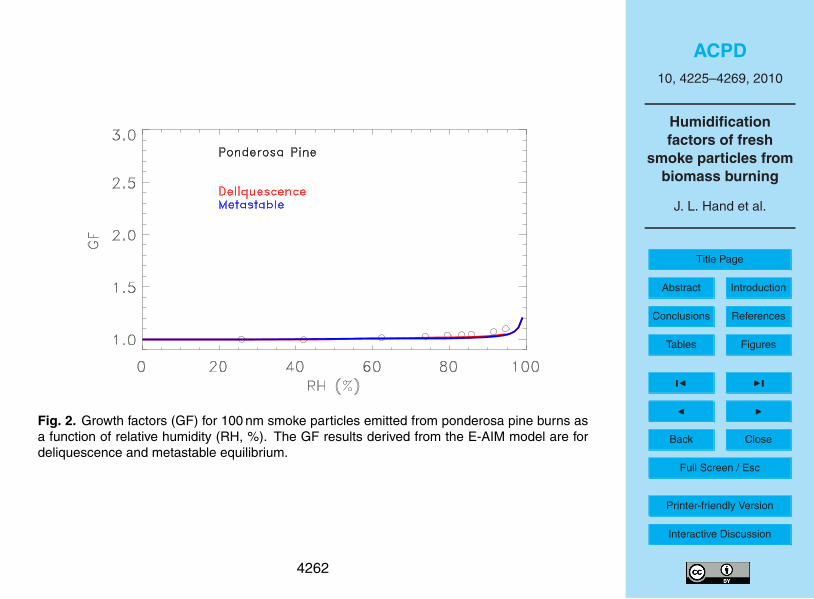
ACPD10, 4225–4269, 2010
Humidificationfactors of fresh
smoke particles frombiomass burning
J. L. Hand et al.
Title Page
Abstract Introduction
Conclusions References
Tables Figures
J I
J I
Back Close
Full Screen / Esc
Printer-friendly Version
Interactive Discussion
28
29
30
31
32
33
34
Figure 2. Growth factors (GF) for 100 nm smoke particles emitted from ponderosa pine
burns as a function of relative humidity (RH, %). The GF results derived from the E-AIM
model are for deliquescence and metastable equilibrium.
35
Fig. 2. Growth factors (GF) for 100 nm smoke particles emitted from ponderosa pine burns asa function of relative humidity (RH, %). The GF results derived from the E-AIM model are fordeliquescence and metastable equilibrium.
4262
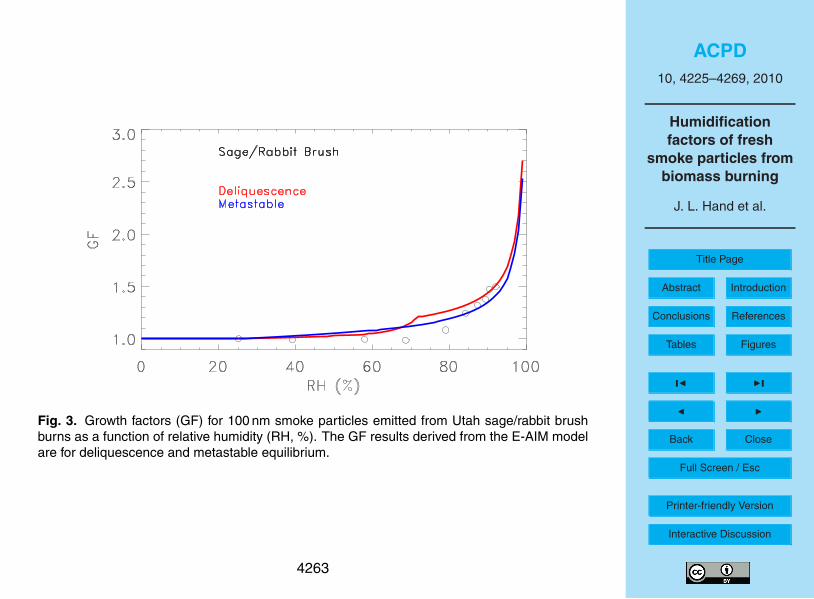
ACPD10, 4225–4269, 2010
Humidificationfactors of fresh
smoke particles frombiomass burning
J. L. Hand et al.
Title Page
Abstract Introduction
Conclusions References
Tables Figures
J I
J I
Back Close
Full Screen / Esc
Printer-friendly Version
Interactive Discussion
35
36
37
38
39
40
41
Figure 3. Growth factors (GF) for 100 nm smoke particles emitted from Utah sage/rabbit
brush burns as a function of relative humidity (RH, %). The GF results derived from the
E-AIM model are for deliquescence and metastable equilibrium.
36
Fig. 3. Growth factors (GF) for 100 nm smoke particles emitted from Utah sage/rabbit brushburns as a function of relative humidity (RH, %). The GF results derived from the E-AIM modelare for deliquescence and metastable equilibrium.
4263

ACPD10, 4225–4269, 2010
Humidificationfactors of fresh
smoke particles frombiomass burning
J. L. Hand et al.
Title Page
Abstract Introduction
Conclusions References
Tables Figures
J I
J I
Back Close
Full Screen / Esc
Printer-friendly Version
Interactive Discussion
42
43
44
45
46
47
48
49
Figure 4. Measured and modeled humidification factors (f(RH)) as a function of relative
humidity (RH, %) for particles emitted from ponderosa pine burns. The f(RH) results
derived from the E-AIM model are for deliquescence and metastable equilibrium.
Measurements and model calculations performed at a wavelength of 530 nm.
37
Fig. 4. Measured and modeled humidification factors (f (RH)) as a function of relative humidity(RH, %) for particles emitted from ponderosa pine burns. The f (RH) results derived from theE-AIM model are for deliquescence and metastable equilibrium. Measurements and modelcalculations performed at a wavelength of 530 nm.
4264
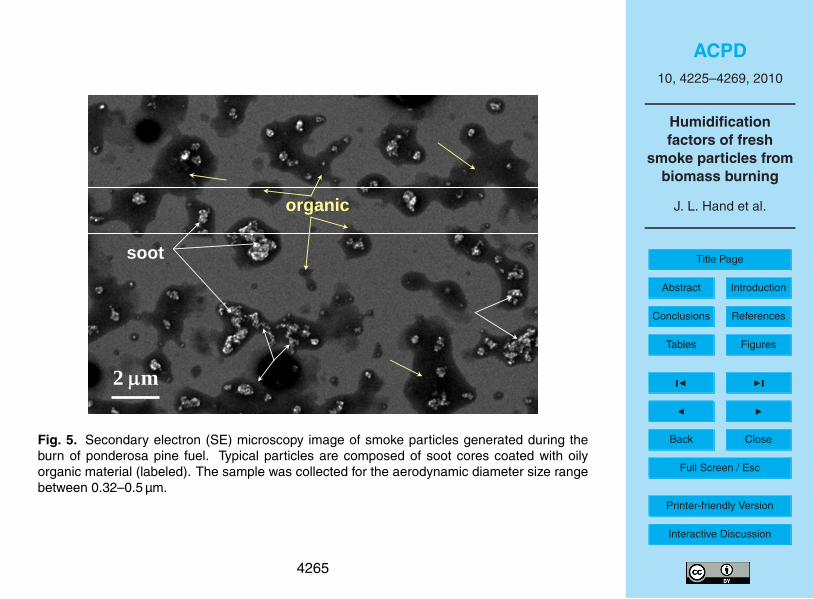
ACPD10, 4225–4269, 2010
Humidificationfactors of fresh
smoke particles frombiomass burning
J. L. Hand et al.
Title Page
Abstract Introduction
Conclusions References
Tables Figures
J I
J I
Back Close
Full Screen / Esc
Printer-friendly Version
Interactive Discussion
2 μm
soot
organic
50
51
52
53
54
55
56
Figure 5. Secondary electron (SE) microscopy image of smoke particles generated during
the burn of ponderosa pine fuel. Typical particles are composed of soot cores coated with
oily organic material (labeled). The sample was collected for the aerodynamic diameter
size range between 0.32-0.5μm
38
Fig. 5. Secondary electron (SE) microscopy image of smoke particles generated during theburn of ponderosa pine fuel. Typical particles are composed of soot cores coated with oilyorganic material (labeled). The sample was collected for the aerodynamic diameter size rangebetween 0.32–0.5 µm.
4265
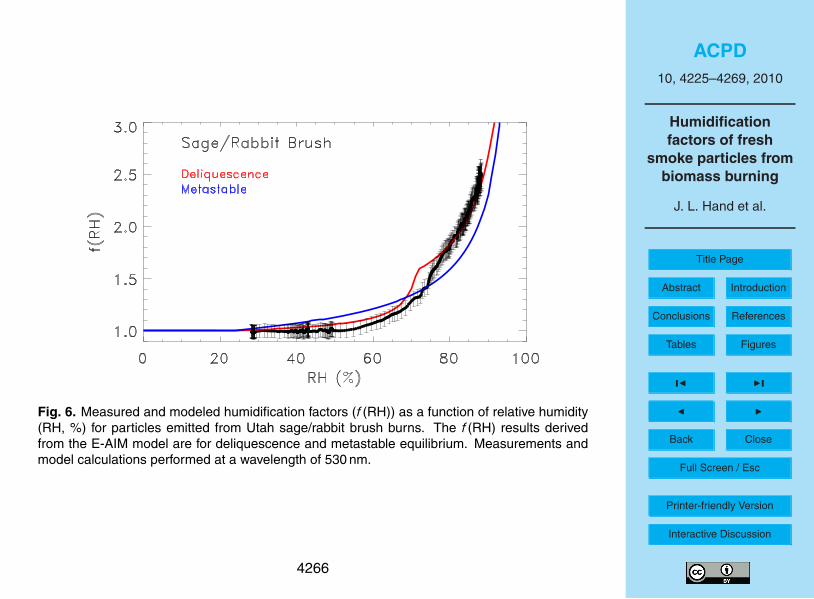
ACPD10, 4225–4269, 2010
Humidificationfactors of fresh
smoke particles frombiomass burning
J. L. Hand et al.
Title Page
Abstract Introduction
Conclusions References
Tables Figures
J I
J I
Back Close
Full Screen / Esc
Printer-friendly Version
Interactive Discussion
57
58
59
60
61
62
Figure 6. Measured and modeled humidification factors (f(RH)) as a function of relative
humidity (RH, %) for particles emitted from Utah sage/rabbit brush burns. The f(RH)
results derived from the E-AIM model are for deliquescence and metastable equilibrium.
Measurements and model calculations performed at a wavelength of 530 nm.
39
Fig. 6. Measured and modeled humidification factors (f (RH)) as a function of relative humidity(RH, %) for particles emitted from Utah sage/rabbit brush burns. The f (RH) results derivedfrom the E-AIM model are for deliquescence and metastable equilibrium. Measurements andmodel calculations performed at a wavelength of 530 nm.
4266

ACPD10, 4225–4269, 2010
Humidificationfactors of fresh
smoke particles frombiomass burning
J. L. Hand et al.
Title Page
Abstract Introduction
Conclusions References
Tables Figures
J I
J I
Back Close
Full Screen / Esc
Printer-friendly Version
Interactive Discussion
2 μm
2 μm
SE
BSE
KCl/K2SO4
soot
organic
EDX spectrum of KCl/K2SO4 particle
0.0
0.2
0.4
0.6
0.8
1.0
1.2
0 1 2 3energy, keV
inte
nsity
, a.u
4
.
K
K
ClS
CO Cu
63
64
65
66
67
68
Figure 7. Secondary electron (SE) image (top panel) and back scattered electron (BSE)
microscope image (middle panel) of smoke particles generated from burns of Utah
sage/rabbit brush fuel. Typical fractal soot, organic and inorganic particles are seen
internally and externally mixed. Carbonaceous soot and organic constituents are invisible
in the BSE image, while inorganic constituents are seen as bright spots in the BSE image.
40
Fig. 7. Secondary electron (SE) image (top panel) and back scattered electron (BSE) mi-croscope image (middle panel) of smoke particles generated from burns of Utah sage/rabbitbrush fuel. Typical fractal soot, organic and inorganic particles are seen internally and ex-ternally mixed. Carbonaceous soot and organic constituents are invisible in the BSE image,while inorganic constituents are seen as bright spots in the BSE image. Bottom panel: Char-acteristic energy dispersed X-ray (EDX) spectrum of inorganic inclusions indicates their mixedKCl/K2SO4 composition. (Cu peak results from a substrate background, C and O peaks aremixed background and sample signals). Samples were collected in the 0.18–0.32 µm aerody-namic diameter size range.
4267
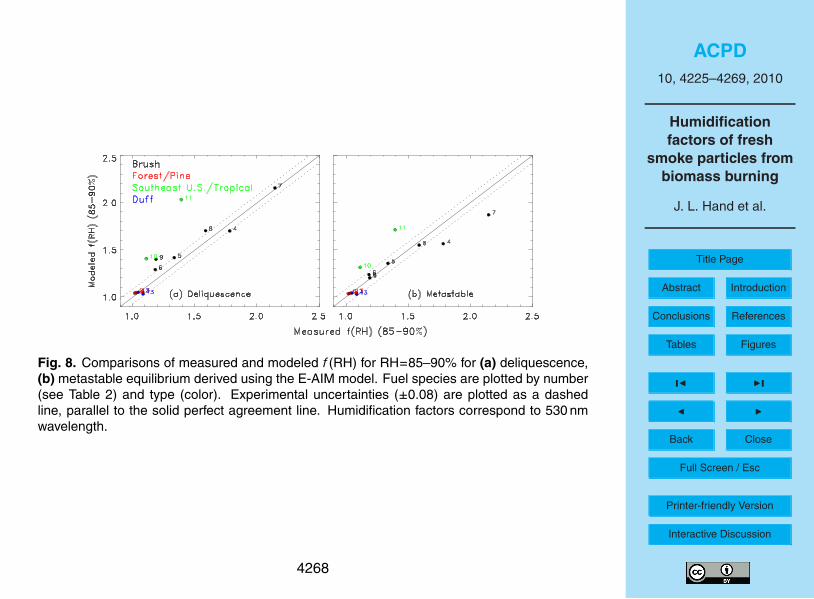
ACPD10, 4225–4269, 2010
Humidificationfactors of fresh
smoke particles frombiomass burning
J. L. Hand et al.
Title Page
Abstract Introduction
Conclusions References
Tables Figures
J I
J I
Back Close
Full Screen / Esc
Printer-friendly Version
Interactive Discussion
69
70
71
72
73
74
75
Bottom panel: Characteristic energy dispersed X-ray (EDX) spectrum of inorganic
inclusions indicates their mixed KCl/K2SO4 composition. (Cu peak results from a
substrate background, C and O peaks are mixed background and sample signals).
Samples were collected in the 0.18-0.32 μm aerodynamic diameter size range.
76
77
78
79
80
81
Figure 8. Comparisons of measured and modeled f(RH) for RH = 85-90% for (a)
deliquescence, (b) metastable equilibrium derived using the E-AIM model. Fuel species
are plotted by number (see Table 2) and type (color). Experimental uncertainties (±0.08)
are plotted as a dashed line, parallel to the solid perfect agreement line. Humidification
factors correspond to 530 nm wavelength.
41
Fig. 8. Comparisons of measured and modeled f (RH) for RH=85–90% for (a) deliquescence,(b) metastable equilibrium derived using the E-AIM model. Fuel species are plotted by number(see Table 2) and type (color). Experimental uncertainties (±0.08) are plotted as a dashedline, parallel to the solid perfect agreement line. Humidification factors correspond to 530 nmwavelength.
4268
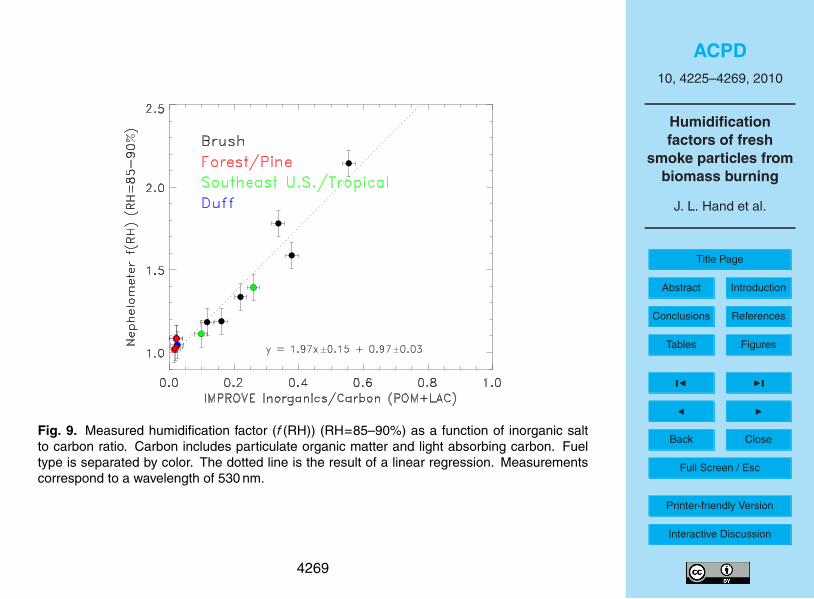
ACPD10, 4225–4269, 2010
Humidificationfactors of fresh
smoke particles frombiomass burning
J. L. Hand et al.
Title Page
Abstract Introduction
Conclusions References
Tables Figures
J I
J I
Back Close
Full Screen / Esc
Printer-friendly Version
Interactive Discussion
82
83
84
85
86
87
Figure 9. Measured humidification factor (f(RH)) (RH=85-90%) as a function of
inorganic salt to carbon ratio. Carbon includes particulate organic matter and light
absorbing carbon. Fuel type is separated by color. The dotted line is the result of a linear
regression.
42
Fig. 9. Measured humidification factor (f (RH)) (RH=85–90%) as a function of inorganic saltto carbon ratio. Carbon includes particulate organic matter and light absorbing carbon. Fueltype is separated by color. The dotted line is the result of a linear regression. Measurementscorrespond to a wavelength of 530 nm.
4269
Copyright © 2022 FDOKUMEN