Two constituents of the initiation complex of the mannan-binding lectin activation …
Upload
khangminh22Category
view
0download
0
Alkaloidal constituents of Crinum variabile
and Crinum paludosum, two southern
African Amaryllidaceae species
Kim Henry Steyn
Supervisor: Prof. Willem A.L. van Otterlo; Co-supervisor: Prof. André J. de Villiers
With special mention of the contributions of Prof. Ivan R. Green
Thesis presented in partial fulfilment of the requirements for the degree of Master of Science in the
Faculty of Science at Stellenbosch University.
The financial assistance of the National Research Foundation (NRF) towards this research is hereby acknowledged. Opinions expressed
and conclusions arrived at, are those of the author and are not necessarily to be attributed to the NRF.

i
By submitting this thesis electronically, I declare that the entirety of the work contained therein is my
own, original work, that I am the sole author thereof (save to the extent explicitly otherwise stated),
that reproduction and publication thereof by Stellenbosch University will not infringe any third party
rights and that I have not previously in its entirety or in part submitted it for obtaining any
qualification.
Copyright © 2020 Stellenbosch UniversityAll rights reserved
Stellenbosch University https://scholar.sun.ac.za
ii
1 Abstract
The extraction of dried bulbs of Crinum variabile and subsequent targeted fractionation led to the
isolation of lycorine, 1,2-O,O-diacetyllycorine, 2-O-acetyllycorine, 1-O-acetyllycorine, a
diastereomeric mixture of haemanthidine and 6-epihaemanthidine, bulbispermine and criwelline.
HPLC-MS/MS analysis of the extract was carried out, providing information regarding other
alkaloidal constituents of C. variabile. The isolation of lycorine, as well as a brief HPLC-MS/MS
dereplication study was carried out on an extract of Crinum paludosum, allowing for the tentative
identification of ten alkaloidal constituents therein, with five alkaloids remaining unidentified. A brief
synthetic study was carried out on higginsianins A and B, resulting in the generation of some
analogues thereof. These included acetylated analogues of both, as well as bromination products of
higginsianin A, and reductive hydrogenation and epoxidation products of higginsianin B.
Stellenbosch University https://scholar.sun.ac.za

iii
2 Opsomming
Ekstraksie van gedroogde Crinum variabile blombolle en die daaropvolgende fraksionering het
likorien, 1,2-di-O-asetiellikorien, 2-O-asetiellikorien, 1-O-asetiellikorien, ‘n mengsel van
haemantidien en 6-epi-haemantidien, bulbespermien en kriwelien opgelewer. HPLC-MS/MS analise
van die C. var. ekstrak het adisionele informasie van ander alkaloïde tot gevolge gehad. Isolasie van
likorien asook ‘n kort HPLC-MS/MS analise van ‘n ekstrak van Crinum paludosum het tot gevolg
gehad dat tien alkaloïde tentatief geidentifiseer kon word met nog vyf wat nie geidentifiseer kon word
nie.
‘n Kort sintetise studie op higginsiansins A en B was uitgevoer en het gelei tot die isolasie van die
geasetileerde higgginsiansins A en B, die gebromeerde analoog van higginsiansin A, die
hidrogeneerde higginsiansin B en die epoksineringsproduk van higginsiansin B.
Stellenbosch University https://scholar.sun.ac.za

1
3 Table of contents
1 Abstract ........................................................................................................................................ ii
2 Opsomming ................................................................................................................................. iii
3 Table of contents .......................................................................................................................... 1
4 List of figures ............................................................................................................................... 1
5 List of tables ................................................................................................................................. 1
6 Introduction .................................................................................................................................. 1
6.1 Background on plant-based medicines .................................................................................. 1
6.1.1 Empirical use of plant-based treatments ........................................................................ 1
6.1.2 A brief history of natural products chemistry ................................................................ 3
6.1.3 What plants offer medicinal chemistry .......................................................................... 9
6.2 The Amaryllidaceae alkaloids ............................................................................................. 11
6.2.1 An introduction to the Amaryllidaceae ........................................................................ 11
6.2.2 Classification of Amaryllidaceae alkaloids.................................................................. 13
6.2.3 Some Crinum alkaloids and their applications ............................................................ 15
6.3 A brief overview of some methods of natural product analysis .......................................... 17
7 Aims and objectives ................................................................................................................... 21
8 Crinum variabile ........................................................................................................................ 22
8.1 Introduction ......................................................................................................................... 22
8.2 Processing, results and discussion ....................................................................................... 23
8.2.1 Preparation and extraction ........................................................................................... 23
8.2.2 Processing and isolations ............................................................................................. 23
8.2.3 HPLC-ESI-MS/MS analysis of CVAlk.EXT .............................................................. 49
8.3 General comments pertaining to the above processes ......................................................... 54
8.4 Conclusions and future work ............................................................................................... 55
9 Crinum paludosum ..................................................................................................................... 57
9.1 Introduction ......................................................................................................................... 57
9.2 Processing, results and discussion ....................................................................................... 58
Stellenbosch University https://scholar.sun.ac.za

2
9.2.1 Preparation and extraction ........................................................................................... 58
9.2.2 A brief LC-ESI-MS/MS dereplication study ............................................................... 59
9.3 Conclusions and future work ............................................................................................... 66
10 A Brief synthetic study on higginsianins A and B ..................................................................... 68
10.1 Introduction ...................................................................................................................... 68
10.2 Reactions .......................................................................................................................... 69
10.2.1 Higginsianin A 39 ........................................................................................................ 69
10.2.2 Higginsianin B 40 ........................................................................................................ 72
10.3 Conclusions and future work ........................................................................................... 75
11 Methods and materials ............................................................................................................... 77
11.1 Crinum variabile .............................................................................................................. 77
11.1.1 Separation experiments ................................................................................................ 77
11.1.2 HPLC-MS/MS of CVAlk.EXT ................................................................................... 81
11.2 Crinum paludosum........................................................................................................... 81
11.2.1 HPLC-MS/MS of CPAlk.EXT ................................................................................... 81
11.3 Higginsianins A and B ..................................................................................................... 82
11.3.1 Higginsianin A 39 ........................................................................................................ 82
11.3.2 Higginsianin B 40 ........................................................................................................ 83
12 Acknowledgements .................................................................................................................... 85
13 References .................................................................................................................................. 86
A Appendix – Crinum variabile ..................................................................................................... 94
A.1 Tree Diagram – Crinum variabile ....................................................................................... 94
A.2 Lycorine 19.......................................................................................................................... 96
A.3 1,2-O,O-diacetyllycorine 21 ................................................................................................ 99
A.4 2-O-acetyllycorine 22 ........................................................................................................ 102
A.5 1-O-acetyllycorine 23 ........................................................................................................ 106
A.6 Haemanthidine and 6-epihaemanthidine 24, 25 ................................................................ 110
A.7 Bulbispermine 26 .............................................................................................................. 113
Stellenbosch University https://scholar.sun.ac.za

3
A.8 Criwelline 27 ..................................................................................................................... 117
A.9 Continuous liquid/liquid extraction apparatus .................................................................. 121
B Appendix – Higginsianins A and B ......................................................................................... 122
B.1 Higginsianin A 39 ............................................................................................................. 122
B.1.1 22-O-acetylhigginsianin A 39a .................................................................................. 123
B.1.2 NBS bromination of 39 .............................................................................................. 124
B.2 Higginsianin B 40 .............................................................................................................. 126
B.2.1 Acetylation of 40 ........................................................................................................ 127
B.2.2 Reductive hydrogenation of 40 to 40c/40d. ............................................................... 131
B.2.3 Epoxidation of 40 to 40e ............................................................................................ 132
Stellenbosch University https://scholar.sun.ac.za

1
4 List of figures
Figure 4.1.1 - The chemical structure of morphine 1. .......................................................................... 3
Figure 4.1.2 - The chemical structure of narcotine 2. .......................................................................... 4
Figure 4.1.3 - The chemical structures of thebaine 3, codeine 4 and papaverine 5. ............................ 4
Figure 4.1.4 – The chemical structures of nicotine 6, emetine 7 and colchicine 8. ............................. 5
Figure 4.1.5 – The chemical structures of strychnine 9, brucine 10 and delphinine 11. ..................... 5
Figure 4.1.6 - The chemical structure of quinine 12. ........................................................................... 6
Figure 4.1.7 – The chemical structures of caffeine 13, theobromine 14, and theophylline 15. ........... 6
Figure 4.1.8 - Chemical structures of atropine 16 and hyoscyamine 17. ............................................. 7
Figure 4.1.9 - The chemical structure of cocaine 18. ........................................................................... 7
Figure 4.2.1 - The chemical structure of lycorine 19. ........................................................................ 16
Figure 4.2.2 - The chemical structure of galanthamine 20. ............................................................... 17
Figure 6.1.1 – A botanical illustration of Crinum variabile, drawn by Barbara Jeppe, taken from “The
Amaryllidaceae of Southern Africa” by Graham Duncan, Barbara Jeppe, and Leigh Voigt ............ 22
Figure 6.2.1 – The numbered chemical structure of lycorine 19. ...................................................... 25
Figure 6.2.2 - TLC plate representing the separation acquired from P1. .......................................... 28
Figure 6.2.3 – The numbered chemical structure of 1,2-O,O-diacetyllycorine 21. ........................... 29
Figure 6.2.4 - The numbered chemical structure of 2-O-acetyllycorine 22. ...................................... 31
Figure 6.2.5 - The numbered chemical structure of 1-O-acetyllycorine 23. ...................................... 33
Figure 6.2.6 - The chemical structures of haemanthidine 24 and 6-epihaemanthidine 25 ................ 38
Figure 6.2.7 – MS/MS spectrum of CV3, showing fragmentation information. ............................... 41
Figure 6.2.8 - Numbered chemical structure of bulbispermine 26. ................................................... 44
Figure 6.2.9 - The numbered chemical structure of criwelline 27. .................................................... 47
Figure 6.2.10 - TIC of HPLC-ESI-HRMS analysis of CVAlk.EXT. ............................................... 50
Figure 7.1.1 – A botanical illustration of Crinum paludosum, drawn by Barbara Jeppe, taken from
“The Amaryllidaceae of Southern Africa” by Graham Duncan, Barbara Jeppe, and Leigh Voigt ... 57
Figure 7.2.1 – Base peak ion (BPI) TIC of HPLC-ESI-HRMS analysis of CPAlk.EXT. ................. 59
Figure 7.2.2 - The chemical structure of lycoramine-N-oxide 28. .................................................... 61
Figure 7.2.3 - Chemical structure of 11-hydroxyvittatine-N-oxide 29. ............................................. 61
Figure 7.2.4 - The chemical structures of 2-epipancrassidine 30a and pancrassidine 30b. ............... 62
Figure 7.2.5 - The chemical structures of 11-hydroxyvittatine 31a, hamayne 31b and bulbispermine
26. ....................................................................................................................................................... 62
Figure 7.2.6 - The chemical structure of vittatine 32. ........................................................................ 62
Stellenbosch University https://scholar.sun.ac.za

2
Figure 7.2.7 - The chemical structure of crinamidine 33. .................................................................. 63
Figure 7.2.8 - The chemical structures of isotazettinol 34a and tazettinol 34b. ................................ 63
Figure 7.2.9 - The chemical structure of ungeremine 35. .................................................................. 64
Figure 7.2.10 - The chemical structure of tazettine 36. ..................................................................... 64
Figure 7.2.11 - 3,4-anhydropowelline 37. .......................................................................................... 65
Figure 7.2.12 - The chemical structures of (+)-3α-hydroxy-6β-acetylbulbispermine 38a and the
theoretical 6β-acetoxy-11-hydroxyvittatine 38b. ............................................................................... 65
Figure 8.1.1 - The chemical structures of higginsianin A 39 and higginsianin B 40. The atom numbers
for higginsianin B reflect those of higginsiainin A. ........................................................................... 68
Figure 8.2.1 - The reaction scheme of Higginsianin A 39 acetylation. Pyridine was used as a solvent,
and acetic anhydride was added in excess. ........................................................................................ 69
Figure 8.2.2 - Reaction scheme of NBS bromination of higginsianin A 39. ..................................... 71
Figure 8.2.3 - Reaction scheme of the acetylation of Higginsianin B 40. ......................................... 72
Figure 8.2.4 – Comparison of 1H proton spectra for 40, 40a, and 40b. ............................................. 73
Figure 8.2.5 - TLC profile of reaction with 40 and Pd/C at 72 hours. ............................................... 74
Figure 8.2.6 - Reaction of higginsianin B 40 with Pd/C. ................................................................... 75
Figure 8.2.7 - Reaction of higginsianin B 40 with m-CPBA. ............................................................ 75
Stellenbosch University https://scholar.sun.ac.za

1
5 List of tables
Table 4.1 – Examples of skeletal structures for each Amaryllidaceae alkaloid type. ........................ 14
Table 6.1 – 1H NMR spectroscopy chemical shifts for lycorine 19.. ................................................ 25
Table 6.2 - 13C NMR spectroscopy chemical shifts of lycorine 19. .................................................. 25
Table 6.3 - Proton chemical shifts of 1,2-O,O-diacetyllycorine 21. .................................................. 29
Table 6.4 - Carbon chemical shifts of 1,2-O,O-diacetyllycorine 21. ................................................. 29
Table 6.5 - Proton shifts of 2-O-acetyllycorine 22. ........................................................................... 31
Table 6.6 - Carbon shifts of 2-O-acetyllycorine 22 ........................................................................... 32
Table 6.7 - Proton shifts of 1-O-acetyllycorine 23. ........................................................................... 34
Table 6.8 - Carbon shifts of 1-O-acetyllycorine 23 ........................................................................... 34
Table 6.9 - The 1H NMR spectroscopic peaks of CV3 and those reported for haemanthidine (24) and
6-epihaemainthidine (25).. ................................................................................................................. 39
Table 6.10 - 13C shifts acquired for both epimers of haemanthidine (24 and 25), reported with the
shifts acquired for CV3. ..................................................................................................................... 40
Table 6.11 - Tentative explanations for some observed fragment ions in the MS/MS spectrum of CV3.
............................................................................................................................................................ 42
Table 6.12 - The proton chemical shifts for bulbispermine 26. ......................................................... 44
Table 6.13 - The carbon chemical shifts for bulbispermine 26. ........................................................ 45
Table 6.14 - The proton chemical shifts for criwelline 27 ................................................................. 48
Table 6.15 - The carbon chemical shifts for criwelline 27. ............................................................... 48
Table 6.16 - Table showing the HRMS and fragmentation (MS/MS) data for the peaks in the TIC of
CVAlk.EXT. ..................................................................................................................................... 50
Table 6.17 - The HRMS data for all isolated compounds from C. variabile. .................................... 54
Table 7.1 - Peak data for TIC of CPAlk.EXT. ................................................................................... 60
Stellenbosch University https://scholar.sun.ac.za
1
6 Introduction
6.1 Background on plant-based medicines
6.1.1 Empirical use of plant-based treatments
Since before our collective recollection, human societies have been in close contact with their
environments, and have utilized the inherent value present in the natural resources therein. A practice
that has been indispensable in this regard is the use of living organisms, particularly plants, for the
treatment of diseases, injuries and ailments.1
Determining the length of time for which humans have used plants as medicines is difficult, given
that such practices predate written or illustrative records.2 In fact, it seems that the use of plants for
health benefits is not limited to humans, but has been seen in other animal species, including monkeys
and apes. Furthermore, it has been shown that humans and chimpanzees choose some of the same
plant species to use as combatants against similar symptoms.3,4 This could suggest that such practices
have evolutionary roots, and hints at a long history of close and intertwined interactions between our
species and medicinally beneficial plants. Some archaeological evidence points towards the
possibility that plants were cultivated for medicinal purposes over 60 000 years ago, as indicated by
some discoveries in a Neanderthal burial site.5 This evidence is based on the presence of pollen in a
Neanderthal grave, from 28 species of flowers. Seven of these species were known to possess
medicinal qualities at the time of this discovery (1975), leading to the postulation that they were
possibly used as such.5,6 There is also, however, the possibility that a rodent native to the area, known
to store seeds and flowers, was responsible for their presence.6 Regardless of the possibility of
contamination, however, the presence of the flowers does not prove their function as medicines. They
could have simply formed part of the diet, as ancient medicines often originated from foods with
beneficial health effects.6
Regarding records of such plant uses; it seems as though medicines have been mentioned since the
origin of written communications, in Mesopotamia and Egypt.6 The oldest known records - from
Mesopotamia, and written in cuneiform on clay tablets - date back to about 1700 BC.6 Many, however
were found to be copies of older texts, containing drug names dating back to 2000-3000 BC.6,7 These
refer to several plant species, including Commiphora species (myrrh), Cupressus sempervirens
(cyprus) and Papaver somniferum (poppy) juice,7 though Sneader warns that the identification of the
plants in the texts is not reliable.6 Drugs derived from the species, vide supra, are still in use today.
Ancient Egyptian medicine is also represented in written records, referred to as the papyri (sing.
papyrus). These records range in date of origin from around 1820 BC to AD 250.8 The most extensive
Stellenbosch University https://scholar.sun.ac.za

2
of the medical papyri is known as the Ebers papyrus, and dates back to about 1530 BC.8 It lists over
800 prescriptions,6 most of which concern plant-based treatments.7 Like the cuneiform tablets, the
Egyptian papyri contain elements dating back further than the document itself, as far as the fourth
millennium BC.6
These early works intertwined the ideas of magic and/or religion with that of medicine, including
rituals and incantations in treatment descriptions.6,8 Many works compiling information regarding
herbal remedies and medicines followed, of course, in the centuries proceeding such ancient
civilizations. Over time, some cultures came to value approaches to medicine that excluded any
superstitious nature. This is evidenced by the works of ancient Greek authors, such as Hippocrates,
Aristotle and Dioscorides. The efforts of the ancient Greek physicians during this time period (460
BC to around AD 78) gave rise to works of great importance, such as the Hippocratic corpus, and De
Materia Medica.6 It should be noted that the use of medicinal herbs remained empirical, with little
being known regarding the plant constituents causing the observed effects, and only some of the
species in use being effective.
Towards the end of the 15th century (AD), exploratory voyages began to open new trade routes, and
it became possible for European nations to access herbs from the Americas. Coupled with the
development of the printing press in the mid-15th century, this lead to the publication of ‘herbals’,
documenting investigations of herbs, medicinal and otherwise.9 Herbals grew in popularity, leading
to an increased focus on plants as medicines, and encouraging physicians to carry out and publish
their own investigations.6 This assisted in shifting the medicinal approach somewhat towards the
logical, and away from the magical and ethereal.
Around the late 18th century, physicians finally began to carry out medical investigations that
resembled the modern scientific approach.6 James Lind famously developed a method for the first
clinical trial, when he ran experiments testing the efficacy of various scurvy treatments on sailors and
hospitalized scurvy patients10 (though it has been proven that much earlier, others reached the
conclusion that citrus fruits were a cure,11 the trial itself reflected a scientific approach10). Soon after,
during the mid- to late-18th century, other physicians began to conduct their own scientific studies on
plant medications. Examples of such include Anton von Störck - who carried out dosage
investigations on species of plants that were generally considered poisonous at the time - and William
Withering, known for his reports on foxglove (Digitalis purpurea L.).6 Such investigations as these
indicate a shift towards a scientific approach, which eventually lead to investigations resulting in the
isolation of the first active compounds from plants.
Stellenbosch University https://scholar.sun.ac.za

3
6.1.2 A brief history of natural products chemistry
As is outlined in the preceding section, crude plant remedies in many forms have been in use for
thousands of years. However, as is well known, modern medicine is based almost entirely on the
premise of utilising pure compounds and establishing their interactions within the human body. The
use of pure bioactive organic compounds as drugs began when they were first isolated from plants.
Though several naturally isolated organic acids were first discovered by Carl Wilhelm Scheele in the
late 18th century,12 these substances did not exhibit high bioactivity by interaction with receptors in
the human body, and thus (despite having many uses and health effects), are not of the same class of
drugs as the compounds to follow.
The discovery of highly active drug compounds began, quite famously, with the isolation of morphine
1 from the opium poppy, Papaver somniferum, which was carried out by Friedrich Wilhelm
Sertürner.6,13,14 Sertürner published his first report on this in 1805,13 and a year later, published a more
detailed account of the isolation of this principal active of opium.6,12,15,16 He called the substance -
which he determined to be alkaline in nature - ‘morphium’,6,17 after the Greek god of dreams.
“Morphium” was the first known plant substance that was basic in nature. The importance of this fact
was noted by Joseph Gay-Lussac, when he noticed a report published by Sertürner in 1817, in which
attention was drawn to the ability of “morphium” to form salts when reacted with acids.6 Gay-Lussac
was a highly respected French chemist, and the editor of the prestigious Annales de Chemie, in which
he published Sertürner’s work, bringing attention to the existence of plant alkalis, and sparking further
investigation of such species by chemists.6,16 Gay-Lussac suspected that more such compounds would
be found, and suggested a convention in which their names end in the suffix ‘-ine’. It was in this way
that the first isolated natural products drug was named ‘morphine’ 1 (Figure 6.1.1). To this day,
morphine 1 (generally in a salt form) remains in common use as an analgesic for the treatment of
moderate to severe pain.16–18
Figure 6.1.1 - The chemical structure of morphine 1.
At this point, it may be necessary – as a disclaimer – to note that narcotine 2 (Figure 6.1.2) (or
noscapine, also from the opium poppy) was arguably discovered before morphine 1 as the first plant
Stellenbosch University https://scholar.sun.ac.za

4
alkali. It was first isolated by Charles Louis Derosne in 1803.6,12 Interestingly, it seems he noticed its
basic nature, but ascribed it to the use of potash in the procedure during which it was obtained.6 The
reason this has been omitted is due to the lack of further investigation following its isolation, and the
fact that it was only named and classified well after morphine 1 had set the stage for alkaloid
discovery.6,12
Figure 6.1.2 - The chemical structure of narcotine 2.
Opium was of high interest for the isolation of active alkaloids, and several others were later
discovered in this species. Thebaine 3 (Figure 6.1.3) was isolated in 1832 by Thibouméry, the
manager of a factory built by Pelletier (see discussion of quinine 12 ahead) for alkaloid production.6
Thebaine 3 did not exhibit great potential as a pharmaceutical agent, but has since proven very useful
as a subject for synthetic studies on morphine-related opium alkaloids.6,21 Also in 1832, Pierre-Jean
Robiquet discovered a new alkaloid while exploring an alternative morphine 1 extraction process.21
This was called codeine 4 (Figure 6.1.3) and it exhibited pharmacological action similar to – but less
pronounced than – that of morphine 1. Codeine 4 is still used as treatment for mild to moderate pain
today. In 1848, George Merck isolated another alkaloid called papaverine 5 (Figure 6.1.3) from the
mother liquor remaining after morphine 1 extraction in his father’s factory.21
Figure 6.1.3 - The chemical structures of thebaine 3, codeine 4 and papaverine 5.
The discovery of the first of the plant alkalis (later termed the ‘alkaloids’) was the frontrunner in a
series of similar alkaloid isolations.6,16 Nicotine 6 (Figure 6.1.4) was isolated in impure form in 1809,
and as a pure crystal in 1828.12 The isolation of impure emetine 7 (Figure 6.1.4) followed in
Stellenbosch University https://scholar.sun.ac.za
5
1817,6,12,16 though the pure alkaloid was only isolated in 1887.22 This alkaloid was used as a treatment
for amoebic dysentery.6,16 In 1819, impure colchicine 8 (Figure 6.1.4) was isolated for the first time,
by the French chemists Pelletier and Caventou,16,23 and was of interest for its application as a gout
treatment. Currently it is used for the treatment of a variety of diseases and conditions.23 Again, this
alkaloid was only isolated in its pure form much later in, 1883.23 Pelletier and Caventou isolated
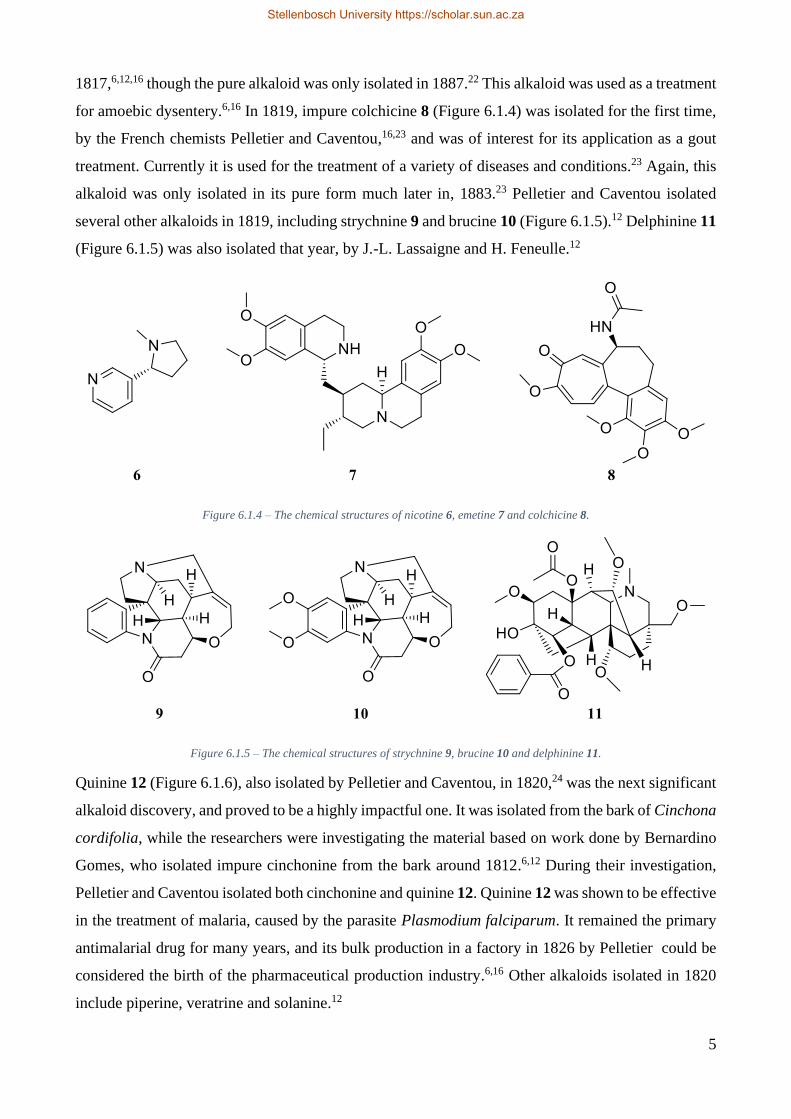
several other alkaloids in 1819, including strychnine 9 and brucine 10 (Figure 6.1.5).12 Delphinine 11
(Figure 6.1.5) was also isolated that year, by J.-L. Lassaigne and H. Feneulle.12
Figure 6.1.4 – The chemical structures of nicotine 6, emetine 7 and colchicine 8.
Figure 6.1.5 – The chemical structures of strychnine 9, brucine 10 and delphinine 11.
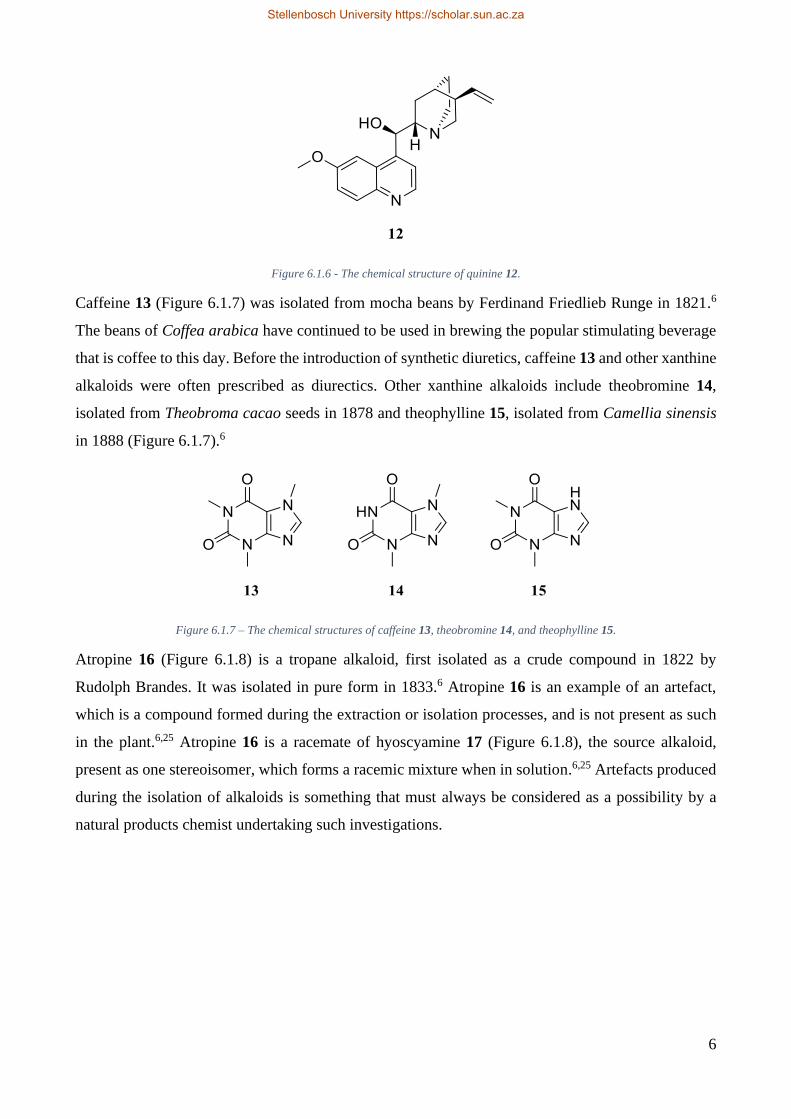
Quinine 12 (Figure 6.1.6), also isolated by Pelletier and Caventou, in 1820,24 was the next significant
alkaloid discovery, and proved to be a highly impactful one. It was isolated from the bark of Cinchona
cordifolia, while the researchers were investigating the material based on work done by Bernardino
Gomes, who isolated impure cinchonine from the bark around 1812.6,12 During their investigation,
Pelletier and Caventou isolated both cinchonine and quinine 12. Quinine 12 was shown to be effective
in the treatment of malaria, caused by the parasite Plasmodium falciparum. It remained the primary
antimalarial drug for many years, and its bulk production in a factory in 1826 by Pelletier could be
considered the birth of the pharmaceutical production industry.6,16 Other alkaloids isolated in 1820
include piperine, veratrine and solanine.12
Stellenbosch University https://scholar.sun.ac.za
6
Figure 6.1.6 - The chemical structure of quinine 12.
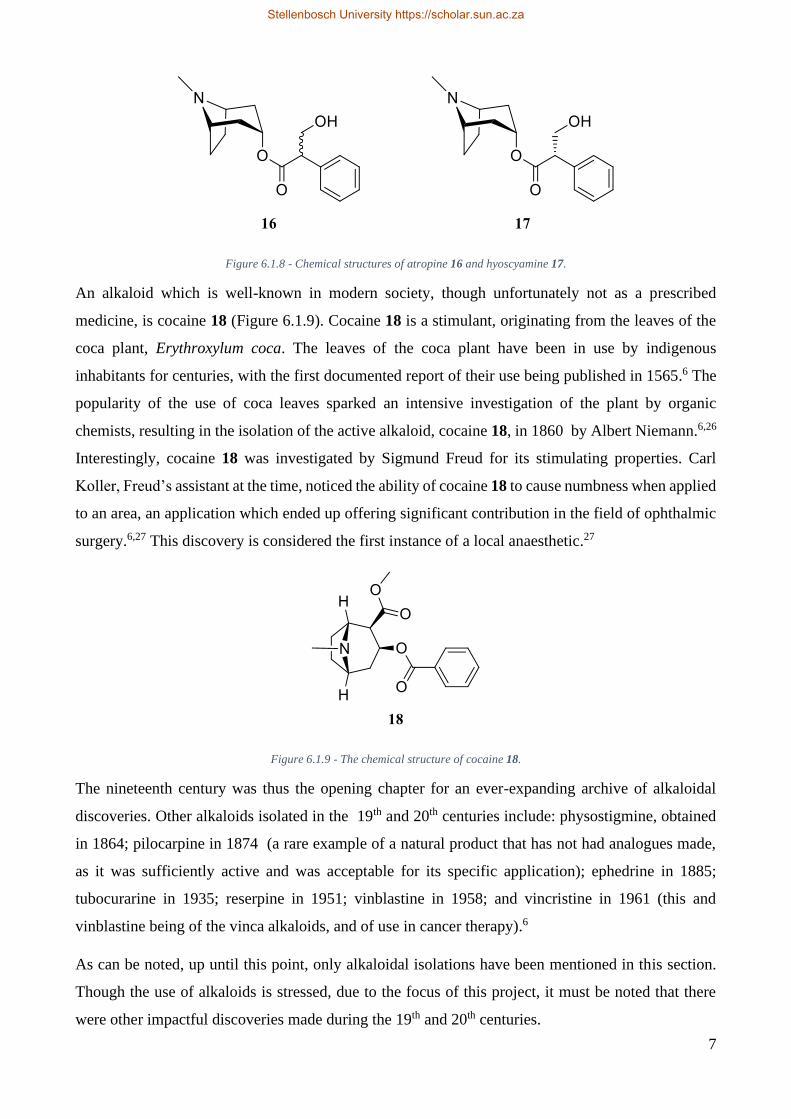
Caffeine 13 (Figure 6.1.7) was isolated from mocha beans by Ferdinand Friedlieb Runge in 1821.6
The beans of Coffea arabica have continued to be used in brewing the popular stimulating beverage
that is coffee to this day. Before the introduction of synthetic diuretics, caffeine 13 and other xanthine
alkaloids were often prescribed as diurectics. Other xanthine alkaloids include theobromine 14,
isolated from Theobroma cacao seeds in 1878 and theophylline 15, isolated from Camellia sinensis
in 1888 (Figure 6.1.7).6
Figure 6.1.7 – The chemical structures of caffeine 13, theobromine 14, and theophylline 15.
Atropine 16 (Figure 6.1.8) is a tropane alkaloid, first isolated as a crude compound in 1822 by
Rudolph Brandes. It was isolated in pure form in 1833.6 Atropine 16 is an example of an artefact,
which is a compound formed during the extraction or isolation processes, and is not present as such
in the plant.6,25 Atropine 16 is a racemate of hyoscyamine 17 (Figure 6.1.8), the source alkaloid,
present as one stereoisomer, which forms a racemic mixture when in solution.6,25 Artefacts produced
during the isolation of alkaloids is something that must always be considered as a possibility by a
natural products chemist undertaking such investigations.
Stellenbosch University https://scholar.sun.ac.za
7
Figure 6.1.8 - Chemical structures of atropine 16 and hyoscyamine 17.
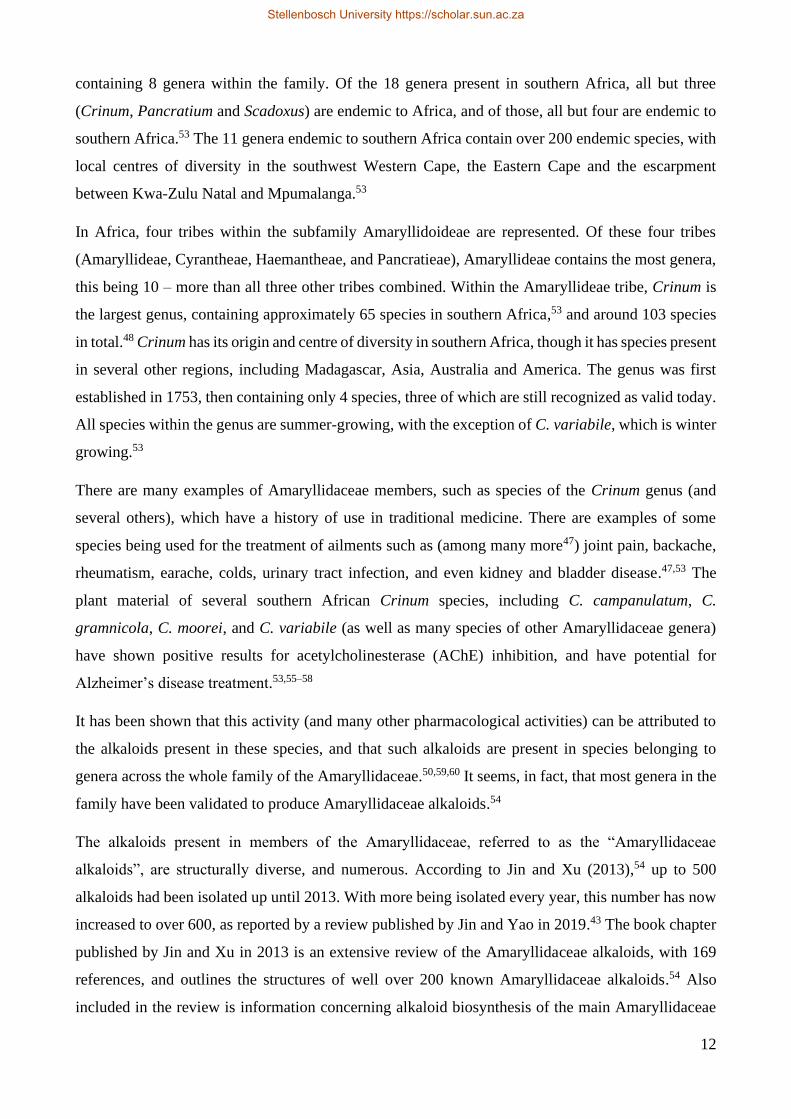
An alkaloid which is well-known in modern society, though unfortunately not as a prescribed
medicine, is cocaine 18 (Figure 6.1.9). Cocaine 18 is a stimulant, originating from the leaves of the
coca plant, Erythroxylum coca. The leaves of the coca plant have been in use by indigenous
inhabitants for centuries, with the first documented report of their use being published in 1565.6 The
popularity of the use of coca leaves sparked an intensive investigation of the plant by organic
chemists, resulting in the isolation of the active alkaloid, cocaine 18, in 1860 by Albert Niemann.6,26
Interestingly, cocaine 18 was investigated by Sigmund Freud for its stimulating properties. Carl
Koller, Freud’s assistant at the time, noticed the ability of cocaine 18 to cause numbness when applied
to an area, an application which ended up offering significant contribution in the field of ophthalmic
surgery.6,27 This discovery is considered the first instance of a local anaesthetic.27
Figure 6.1.9 - The chemical structure of cocaine 18.
The nineteenth century was thus the opening chapter for an ever-expanding archive of alkaloidal
discoveries. Other alkaloids isolated in the 19th and 20th centuries include: physostigmine, obtained
in 1864; pilocarpine in 1874 (a rare example of a natural product that has not had analogues made,
as it was sufficiently active and was acceptable for its specific application); ephedrine in 1885;
tubocurarine in 1935; reserpine in 1951; vinblastine in 1958; and vincristine in 1961 (this and
vinblastine being of the vinca alkaloids, and of use in cancer therapy).6
As can be noted, up until this point, only alkaloidal isolations have been mentioned in this section.
Though the use of alkaloids is stressed, due to the focus of this project, it must be noted that there
were other impactful discoveries made during the 19th and 20th centuries.
Stellenbosch University https://scholar.sun.ac.za

8
As briefly mentioned above, there were several organic acids isolated by Carl Wilhelm Scheele,
between 1770 and 1790.12 These acids included: tartaric acid in 1770, benzoic acid in 1775, citric
acid in 1784, oxalic acid in 1784, malic acid in 1785, glucuronic acid in 1785, and gallic acid in
1786.12
Inulin (though not a pure compound) was found in 1804 by Valentin Rose Jr., from the roots of
elecampane (Inula helenium).12 Inulin is a term applied to all β(1→2) fructans, a group of
polysaccharides. Inulin has been shown to act as a prebiotic, promoting the growth of beneficial
microbes in the gut, assisting in the formation of a healthy gut flora.28
Salicin was isolated in 1829 by Leroux, from meadowsweet, Filipendula ulmaria. Salicin was first
used as an alternative to quinine 12, as it assisted in abating the fevers that invariably accompany
malaria. It was later found that salicin could be transformed into salicylic acid, and that this process
occurred in the human body when salicin was ingested.6,29 Salicylic acid was synthesised in 1860,
and became a cheaper alternative to salicin, the use of which declined for this reason.6,29 The common
drug known as aspirin is derived from salicylic acid, being its acetic acid ester.29 Methyl salicylate
(the methyl ester of salicylic acid) was isolated by William Proctor in 1843, from wintergreen oil.6
Another noteworthy isolation was that of podophyllotoxin in 1880 by Podwyssotski,30 from the
rhizome of Podophyllum peltatum. Podophyllotoxin is very toxic, and has pronounced
gastrointestinal side effects,6 but exhibits potent cytotoxic biological activity.6,31,32 The generation of
analogues of podophyllotoxin has yielded several useful anticancer agents, such as etoposide and
teniposide.31,32 Derivatisation of podophyllotoxin in search of anticancer agents remains a subject of
interest to this day.33
A screening programme established by the US National Cancer Institute resulted in the isolation of
another useful anticancer drug in 1966,6 called paclitaxel (taxol). Paclitaxel is active against a broad
range of cancer types, and has approved applications in the treatment of ovarian and breast cancers.6,34
The information above provides only a very broad overview of just a few examples of some historical
plant-based natural products and their medicinal contributions. The true contribution of natural
products to modern medicine is immense, and in fact extends beyond the plant kingdom, with many
notable contributions from animals, bacteria and fungi. The focus of this project is plant-oriented, and
so the importance of plant-based medicinal chemistry is highlighted. As has hopefully been shown,
even disregarding the contributions from other natural products sources, the potential of plants for
medicinal applications is immense, and should be highly regarded for current and future
investigations.
Stellenbosch University https://scholar.sun.ac.za

9
6.1.3 What plants offer medicinal chemistry
As the previous section demonstrates, there are numerous compounds that have been isolated from
plants which have proven to be medicinally valuable. A concept that has added immense value to the
field of medicinal chemistry is that of the generation of analogues of new molecular entities.
Previously, morphine 1 was discussed as the first biologically active compound to be isolated from a
plant. Perhaps as a result of this early development, morphine 1 was also the subject of studies
resulting in the preparation of the first natural product analogues, by Henry How in 1853, who
generated quaternary ammonium salts of morphine 1 by heating it with alkyl iodides.6
Such analogues were only tested pharmacologically when, 15 years later, Alexander Crum Brown
sent the quaternary ammonium salts of several alkaloids to Thomas Fraser for testing. Despite the
diverse actions of the original alkaloids, the quaternary ammonium salts all exhibited paralytic
activity.6 This suggested that the quaternary ammonium function conferred this particular property.
Such was the result of the first known study correlating a structural feature to a specific activity.6
When the first structural modifications resulted in compounds that exhibited notably different
pharmacological properties, the concept of structure-activity relationships (SARs) was encountered.
The idea that the properties of a drug could be improved, in a directed fashion, by making changes to
one or more of its functional groups has proven to be of immense value in the field of drug
development. It thus transpired that natural products compounds were of use, not only as immediately
marketable drugs, but as drug leads that could be structurally altered for improved activity. It is
therefore important to include natural products analogues when discussing the contributions of natural
compounds to modern treatment options.
Despite the fact that plants and other natural sources were the origin of the first pharmacologically
active compounds, focus later shifted to synthetic approaches for drug discovery, due to the advent
of high-throughput screening strategies.1,6,35 However, it seems as though synthetic approaches have
not provided as many viable drugs as hoped for in recent years, resulting in a renewed interest in
natural products for drug lead discovery.1,7,35–38 There seems to be an increasing interest in herbal
medicines amongst the general public as well, which could be a contributing factor to the acceleration
of natural products research.39 Regardless, it is apparent that there is value to be found in biological
compounds, and that research in this area is well-justified.
The contribution of natural products to the field of drug discovery is significantly dependent upon
what one defines as a natural products contribution. There are several sources outlining recent
information on this topic, with definition-dependent statistics ranging from about one third to around
two thirds of approved drugs being related in some way to natural products.37,40,41
Stellenbosch University https://scholar.sun.ac.za

10
According to a paper by Thomford et al. published in 2018,36 of all drugs approved by the Food and
Drug Administration (FDA) and/or the European Medical Agency (EMA), about a quarter have been
plant-based. About a third of the drugs approved over the last two decades were said to have been
natural products-related, with added contributions from bacteria, fungi, animals and other natural
sources.
Thomford et al. refer to a paper published in 2016 by Patridge et al.41 when stating that a quarter of
the approved drugs have been plant-based. Considering the data presented by Patridge et al., it seems
a misunderstanding occurred. Patridge et al. report that over a third (38%) of all approved drugs are
natural products related, and that of this percentage, approximately one quarter are based on plant
compounds and their derivatives. Interestingly, this paper reports that 44% of approved natural
products related drugs were from mammalian sources.
Patridge et al.41 considered fully synthetic compounds related to their original natural counterparts as
derivatives of natural products. The reason this makes a notable difference may be because most
(around 80%) of the approved mammalian related drugs are fully synthetic (yet natural product-
inspired).41 Thus, if these are considered as natural products contributions, the statistics concerning
mammalian input increase drastically. The information regarding non-mammalian natural products
showed a higher percentage of unmodified compounds and their derivatives versus fully synthetic
analogues.41 In this data, plants dominated the non-mammalian contributors, though bacteria are
gaining increasing interest in more recent years.41 Also highlighting plant contributions, Alan Harvey
reported in 2008 that there were over 200 natural products undergoing preclinical and clinical trials,
almost half of which were plant-related.7
Anticancer agents are a group of medicines with a particularly high contribution from natural
products, with approximately 74% of anticancer drugs in 2006 being natural products or natural
products derived.42 A more recent report, published in 2019 by Jin and Yao,43 states that over 75% of
small molecule anticancer drugs are natural products or are directly related to them. This indicates
that the trend in natural products contributions to cancer treatments still prevails, and has not
diminished to date.
The purpose of this section is to outline the significance of plant contributions to the medical world
today. The topic of natural products contributions can become fairly complicated when considering
the variety of definitions, and so it may not be within efficiency’s best interests to go into too much
detail. The above information should be sufficient to convince the reader that natural products play a
significant role in the drug discovery field, and that plant products are an important resource in natural
products investigations.
Stellenbosch University https://scholar.sun.ac.za

11
Despite the inherent value of plant extracts as a resource for the discovery of new medicinal
compounds, only an estimated 10-15% of the higher plant species on earth has been investigated for
medicinal potential44. Thus, there remains a largely untapped resource in plant biodiversity.
South Africa is a region of notable plant biodiversity, being home to over 23000 plant species,45
which is over 8% of the world’s plant species, while covering less than 1% of earth’s land surface.45,46
The “fynbos” eco-region of the Cape Peninsula alone holds over 9000 plant species – a total of around
3.4% of the world’s plant species.45 This Cape Floral Kingdom represents more than 40% of the
subcontinent’s flora, in only 4% of its area. Of the plants found in this area, 6192 species are found
nowhere else – a remarkable level of endemism.45 It is therefore clear that southern African plants
hold an immense and untapped value in terms of species to be investigated for medicinal
advancement. Investigations focusing on exploring this resource are therefore of importance. Not
only are such investigations of interest for adding value to the medicinal world, but proving the
existence of such value in South African biodiversity may provide additional motivation for the
conservation of these biomes. Such reasoning was a factor backing the decision to focus on a southern
African plant as the subject of investigation for this project.
One possible outcome of this project was the isolation of active principles that were novel, in an
attempt to provide new drug leads for further development. To increase the chances of success in this
regard, choosing plant species that had not previously been thoroughly investigated was an obvious
advantage. Additionally, plant species from families known to be rich in active compounds were of
high interest. With such reasoning in mind, two species were selected, namely Crinum paludosum,
and Crinum variabile. Members of the Crinum genus have a history of use in traditional medicine47,
also adding to the likelihood of active isolations. These species are of the Amaryllidaceae family,
which has provided a plethora of novel alkaloid structures.48–51
The Amaryllidaceae alkaloids are a structurally diverse group, and have a broad range of
pharmacological actions, with several possible areas of application.49,51
6.2 The Amaryllidaceae alkaloids
6.2.1 An introduction to the Amaryllidaceae
The Amaryllidaceae is a family of monocotyledonous plants containing 75 genera and around 1600
species.52 Southern Africa is a region of pronounced diversity with regards to the Amaryllidaceae,
containing 18 genera and around 250 species, all within the subfamily Amaryllidoideae53 (the old
Amaryllidaceae54). This diversity is bested only by the Neotropics from Mexico to Chile, which
contains 26 genera and about 375 species. The Mediterranean basin is the third most speciose region,
Stellenbosch University https://scholar.sun.ac.za
12
containing 8 genera within the family. Of the 18 genera present in southern Africa, all but three
(Crinum, Pancratium and Scadoxus) are endemic to Africa, and of those, all but four are endemic to
southern Africa.53 The 11 genera endemic to southern Africa contain over 200 endemic species, with
local centres of diversity in the southwest Western Cape, the Eastern Cape and the escarpment
between Kwa-Zulu Natal and Mpumalanga.53
In Africa, four tribes within the subfamily Amaryllidoideae are represented. Of these four tribes
(Amaryllideae, Cyrantheae, Haemantheae, and Pancratieae), Amaryllideae contains the most genera,
this being 10 – more than all three other tribes combined. Within the Amaryllideae tribe, Crinum is
the largest genus, containing approximately 65 species in southern Africa,53 and around 103 species
in total.48 Crinum has its origin and centre of diversity in southern Africa, though it has species present
in several other regions, including Madagascar, Asia, Australia and America. The genus was first
established in 1753, then containing only 4 species, three of which are still recognized as valid today.
All species within the genus are summer-growing, with the exception of C. variabile, which is winter
growing.53
There are many examples of Amaryllidaceae members, such as species of the Crinum genus (and
several others), which have a history of use in traditional medicine. There are examples of some
species being used for the treatment of ailments such as (among many more47) joint pain, backache,
rheumatism, earache, colds, urinary tract infection, and even kidney and bladder disease.47,53 The
plant material of several southern African Crinum species, including C. campanulatum, C.
gramnicola, C. moorei, and C. variabile (as well as many species of other Amaryllidaceae genera)
have shown positive results for acetylcholinesterase (AChE) inhibition, and have potential for
Alzheimer’s disease treatment.53,55–58
It has been shown that this activity (and many other pharmacological activities) can be attributed to
the alkaloids present in these species, and that such alkaloids are present in species belonging to
genera across the whole family of the Amaryllidaceae.50,59,60 It seems, in fact, that most genera in the
family have been validated to produce Amaryllidaceae alkaloids.54
The alkaloids present in members of the Amaryllidaceae, referred to as the “Amaryllidaceae
alkaloids”, are structurally diverse, and numerous. According to Jin and Xu (2013),54 up to 500
alkaloids had been isolated up until 2013. With more being isolated every year, this number has now
increased to over 600, as reported by a review published by Jin and Yao in 2019.43 The book chapter
published by Jin and Xu in 2013 is an extensive review of the Amaryllidaceae alkaloids, with 169
references, and outlines the structures of well over 200 known Amaryllidaceae alkaloids.54 Also
included in the review is information concerning alkaloid biosynthesis of the main Amaryllidaceae
Stellenbosch University https://scholar.sun.ac.za

13
alkaloid types, and the biological activities of a number of these alkaloids. The review paper published
in 2019 by Jin and Yao43 in Natural Product Reports is the most recent in a series of review articles
entitled “Amaryllidaceae and Sceletium Alkaloids”. This article comprises a comprehensive analysis
of alkaloids isolated from the Amaryllidaceae family, and the closely related alkaloids from the
Sceletium genus, from mid-2015 until mid-2017. This review series frequently covers the topic, and
contains a compilation of information that is challenged by few, if any, other sources.
The first known Amaryllidaceae alkaloid, lycorine 19 (Figure 6.2.1), was isolated in 1877, from the
species Narcissus pseudonarcissus. Lycorine 19 has since been shown to exhibit a range of biological
activities, including: apoptosis-inducing effect, antitumor, antiviral, anti-inflammatory, antifungal,
antimicrobial, antimalarial, antiretroviral and AChE inhibitory activities.54 Lycorine 19 has drawn
much attention as a possible natural lead for anticancer drug design, showing activity against several
cancer types, including drug-resistant variants, at low concentration and with high specificity.61
As has been established, since the discovery of lycorine 19, the number of known Amaryllidaceae
alkaloids has increased significantly, revealing diverse structures and pharmacological activities.
Well known amongst these is galanthamine 20 (Figure 6.2.2) (also known by the drug name
galantamine, Reminyl®), a potent AChE inhibitor that was approved as a prescription drug for the
treatment of Alzheimer’s disease in 2001.43,54,62 Galanthamine 20 is produced on an industrial scale
by extraction and isolation from daffodils, though total synthesis is also possible as a means of
production.43 The value of the galanthamine 20 industry as reported in 2013 by Nair et al.62 was
approximately 150 million US dollars per year.
Also according to Nair et al. (2013),62 an anticancer drug target related to the Amaryllidaceae alkaloid
pancratistatin was undergoing advanced clinical evaluation, and was expected to be commercially
available by 2023. This is indicative of the value and potential present in the development of analogue
libraries of Amaryllidaceae alkaloids for the discovery of new drugs.
6.2.2 Classification of Amaryllidaceae alkaloids
Despite the notable structural diversity of the Amaryllidaceae alkaloids, they share biosynthetic roots
and are considered to be biogenetically related.54 They are biosynthetically derived from the precursor
norbelladine,54,61,63 which is an alkaloid present in some Amaryllidaceae species. The nature of their
biogenetic relation is such that their production in a plant is considered a fairly reliable indicator of
that plant’s classification in the family (since these alkaloids are almost entirely exclusively produced
by plants in this family). Thus, should a genus or species produce only unrelated alkaloids,
reclassification of said plant(s) could be considered.54
Stellenbosch University https://scholar.sun.ac.za
14
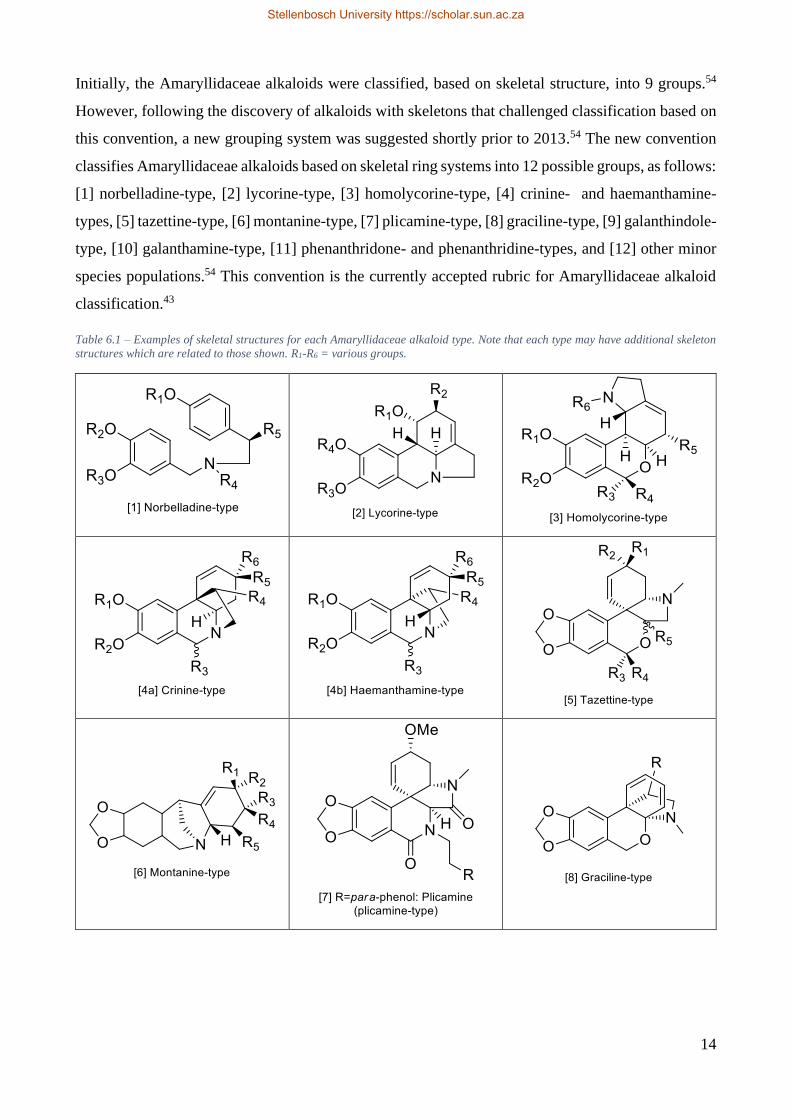
Initially, the Amaryllidaceae alkaloids were classified, based on skeletal structure, into 9 groups.54
However, following the discovery of alkaloids with skeletons that challenged classification based on
this convention, a new grouping system was suggested shortly prior to 2013.54 The new convention
classifies Amaryllidaceae alkaloids based on skeletal ring systems into 12 possible groups, as follows:
[1] norbelladine-type, [2] lycorine-type, [3] homolycorine-type, [4] crinine- and haemanthamine-
types, [5] tazettine-type, [6] montanine-type, [7] plicamine-type, [8] graciline-type, [9] galanthindole-
type, [10] galanthamine-type, [11] phenanthridone- and phenanthridine-types, and [12] other minor
species populations.54 This convention is the currently accepted rubric for Amaryllidaceae alkaloid
classification.43
Table 6.1 – Examples of skeletal structures for each Amaryllidaceae alkaloid type. Note that each type may have additional skeleton
structures which are related to those shown. R1-R6 = various groups.
Stellenbosch University https://scholar.sun.ac.za

15
6.2.3 Some Crinum alkaloids and their applications
As mentioned in Section 3.2.2, members of the Crinum genus have a long history of use in traditional
medicine for the treatment of numerous conditions and ailments. Extracts and isolates of Crinum
species have been scientifically shown to exhibit a range of pharmacological properties.47 Two
important alkaloids commonly isolated from members of the Crinum genus, which have already been
briefly discussed, are lycorine 19 and galanthamine 20,64 with lycorine 19 exhibiting promising
potential as an anticancer drug lead, and galanthamine 20 already having found its place as a treatment
for Alzheimer’s disease.54
Lycorine 19 has been the subject of several studies reporting positive results regarding the anti-
tumour activity of it and its derivatives.61,63 Lycorine 19 itself has been shown to possess activity
against many cancer types.61 Zhang et al. (2019)65 studied the activity of lycorine 19 against
metastatic melanoma, a cancer type responsible for 60% of skin cancer deaths. They reported that the
alkaloid significantly suppressed melanoma cell migration and invasion in vitro, and when tested on
tumour-bearing mice, decreased the metastasis of melanoma cells to the lung tissue. This resulted in
a significant increase in survival time of the treated mice, without obvious toxicity. Another study by
Sun et al. (2018)66 tested lycorine 19 against non-small cell lung carcinoma, reporting that treatment
resulted in significant suppression of the growth and metastasis of the lung tumour.
Stellenbosch University https://scholar.sun.ac.za

16
Reports of the activity of lycorine 19 against other cancer types are extensive in the literature. The
topic is outlined by Roy et al. (2018),61 which reviews the alkaloid and its mechanisms of action for
anticancer activities. Examples of cancer types against which lycorine 19 is active include leukaemia,
multiple myeloma, prostate cancer, human breast cancer, human bladder cancer, ovarian cancer, large
cell lung cancer, colon carcinoma and human heptatocellular carcinoma.61 Against all of these,
lycorine 19 exhibited IC50 values below 40 µM.
Figure 6.2.1 - The chemical structure of lycorine 19.
Derivatives of lycorine 19 have also been shown to exhibit activity against a range of cancer types,
some examples of which are outlined in an article by Lamoral-Theys et al. (2010).63 This paper
reviews the testing of 25 lycorine 19 derivatives on various cancer cell lines, reporting that 20 of these
proved active against at least on cell line. Additionally, it is stated that there were approximately 300
molecules sharing lycorine’s core ring structure in 2010 (this number has likely increased). That only
26 of these (including lycorine 19) had been tested is testament to the work that has yet to be done on
this topic.
Galanthamine 20 is an additional example of an Amaryllidaceae alkaloid of especial importance, and
is, to the best of our knowledge, the only Amaryllidaceae alkaloid to be marketed as an approved
drug in the developed world.43,54 As briefly discussed previously, galanthamine 20 is approved for
use in the treatment of Alzheimer’s disease (approved by the FDA). Alzheimer’s disease is the most
common form of dementia among elderly individuals67 and is also the most prevalent chronic
neurodegenerative disease, affecting around 5.7 million people in the US alone.68 Worldwide, it is
estimated that there are 50 million people suffering from dementia, 30-35 million of which have
Alzheimer’s.68
One of the effects of the disease is the loss of cortical acetylcholine receptors, which are important
for the passage of signals through synapses in the brain. Acetylcholine is a neurotransmitter which
binds to these receptors as a means of transmitting signals between synapses. Thus the loss of these
receptors weakens impulses passing between synapses, slowing cognitive function. Galanthamine 20
is a potent and reversible inhibitor of the enzyme acetylcholinesterase, which is responsible for the
Stellenbosch University https://scholar.sun.ac.za
17
catabolism of acetylcholine in the synaptic cleft. Inhibition of the enzyme that breaks down
acetylcholine allows for an increase in the number of receptors being activated by the
neurotransmitter, thus allowing for better inter-synaptic signalling despite decreased receptor
density.67
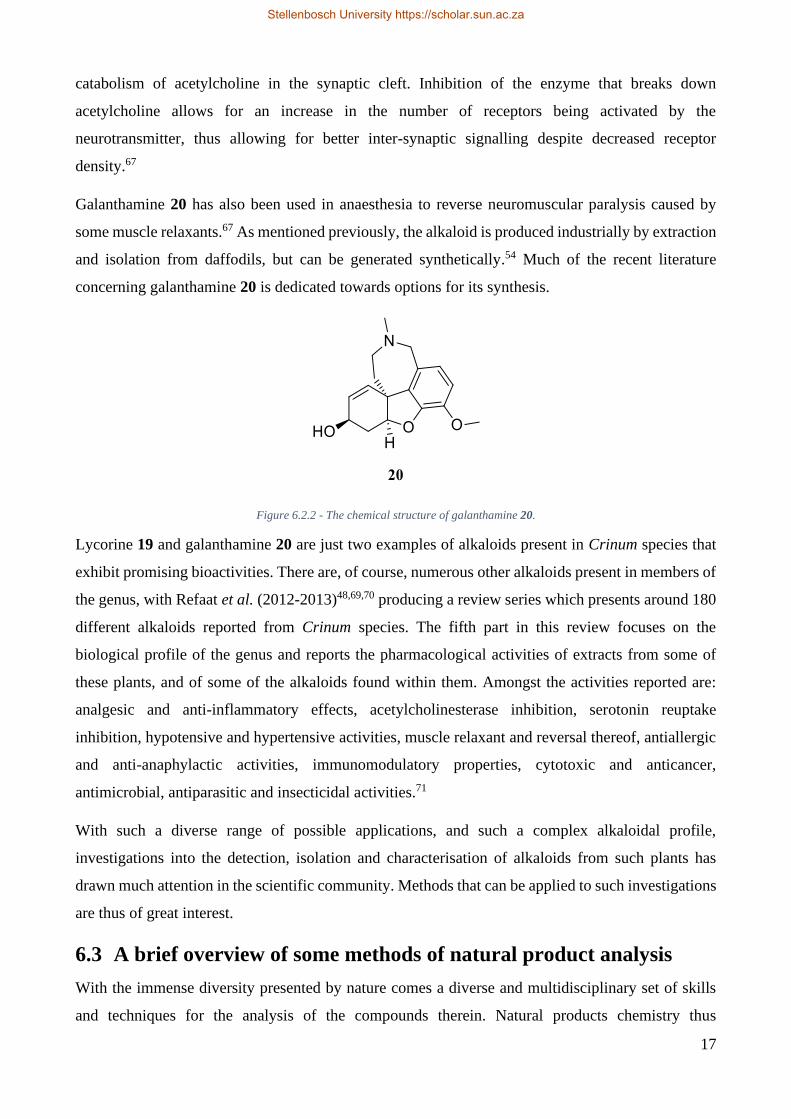
Galanthamine 20 has also been used in anaesthesia to reverse neuromuscular paralysis caused by
some muscle relaxants.67 As mentioned previously, the alkaloid is produced industrially by extraction
and isolation from daffodils, but can be generated synthetically.54 Much of the recent literature
concerning galanthamine 20 is dedicated towards options for its synthesis.
Figure 6.2.2 - The chemical structure of galanthamine 20.
Lycorine 19 and galanthamine 20 are just two examples of alkaloids present in Crinum species that
exhibit promising bioactivities. There are, of course, numerous other alkaloids present in members of
the genus, with Refaat et al. (2012-2013)48,69,70 producing a review series which presents around 180
different alkaloids reported from Crinum species. The fifth part in this review focuses on the
biological profile of the genus and reports the pharmacological activities of extracts from some of
these plants, and of some of the alkaloids found within them. Amongst the activities reported are:
analgesic and anti-inflammatory effects, acetylcholinesterase inhibition, serotonin reuptake
inhibition, hypotensive and hypertensive activities, muscle relaxant and reversal thereof, antiallergic
and anti-anaphylactic activities, immunomodulatory properties, cytotoxic and anticancer,
antimicrobial, antiparasitic and insecticidal activities.71
With such a diverse range of possible applications, and such a complex alkaloidal profile,
investigations into the detection, isolation and characterisation of alkaloids from such plants has
drawn much attention in the scientific community. Methods that can be applied to such investigations
are thus of great interest.
6.3 A brief overview of some methods of natural product analysis
With the immense diversity presented by nature comes a diverse and multidisciplinary set of skills
and techniques for the analysis of the compounds therein. Natural products chemistry thus
Stellenbosch University https://scholar.sun.ac.za

18
incorporates the use of many methods, often resulting in a number of possible approaches to a task.
With the advancement of technology comes the development of new instrumentation and faster, more
effective, techniques for the detection, isolation and characterisation of natural products compounds.
It must, however, be acknowledged that the circumstances of the researcher play a determining role
in the approaches taken during an investigation. Aspects such as available instrumentation, time
restrictions, financial limitations, availability of trained collaborators and many other such resource
and personnel limitations must be considered guiding forces in research projects.
When access to analytical instruments is limited by such restrictions, sometimes the most effective
approach is the application of simple techniques such as solvent extraction, thin layer chromatography
(TLC) and gravity column chromatography. The use of such techniques still holds a place in (even
the most established) laboratories worldwide, and their efficacy cannot be challenged.
With this in mind, recent years have seen the development of some fascinating and effective
techniques for natural products investigations. The use of high-performance liquid chromatography
(HPLC) has established itself, and has proven to be of great use, with hyphenation to a number of
detection methods further increasing its power. Ultraviolet/visible (UV/Vis) and infrared (IR)
spectroscopies, and mass spectrometry (MS) are common examples of such detection methods,
though even powerful structural elucidation tools such as nuclear magnetic resonance (NMR)
spectroscopy can be hyphenated to such systems.72
When searching for natural compounds with a specific pharmacological action, bioassays can be
employed as useful tests for the detection of compounds exhibiting the required action. In the book
edited by Colegate and Molyneux (2008),72 such a bioassay is defined as “…any in vitro or in vivo
system used to detect the biological activity of an extract or a pure substance…”. Bioassays are
numerous and varied, ranging from general to very specific. A plethora of systems are used as tests,
ranging from cell cultures to developed lab animals, and thus a range of properties and applications
are exemplified in the field. Bioassay-guided fractionation is the process in which bioassays are used
to determine the presence of bioactive substances in fractions throughout a series of separation steps,
leading towards the isolation of a pure bioactive compound. Bioassays can, unfortunately, be time-
consuming, and studies focused on increasing their speed continue.72
Important steps for the characterisation of natural compounds are, of course, separation and isolation.
The first step in such processes is generally extraction of the original biological material. Sometimes
this is done with sequentially low- to high-polarity solvents, but generally, polar alcoholic solvents
are useful as they rupture cell membranes, and can thus extract more endocellular metabolites.72 Thus,
such extractions are often carried out first, leaving more selective processes for later separation steps.
Stellenbosch University https://scholar.sun.ac.za

19
Selective extraction processes can then be applied to the crude total extract achieved in this way,
some examples being trituration with less polar solvents and acid/base extraction.
Isolation of a compound from a crude extract, or from fractions thereof, can be a demanding task,
often requiring several separation steps and multiple chromatographic methods. There are many
available methods of chromatographic separation, some of which will be outlined below.
Liquid-liquid chromatography involves the use of two immiscible liquid phases, and the mechanism
relies on differing partition coefficients of the compounds in each of the solvents. Countercurrent
chromatography (CCC) is an example of this, though HPLC and other solid support methods were
preferred when it was developed, so it was largely overlooked.72 Modern CCC, however, is much
improved compared to the technique at its conception, and current advantages include: total recovery
of loaded sample due to no irreversible adsorption, little risk of sample degradation, low solvent
consumption, variability of both phases, and no need for expensive replaceable columns.72
A chromatographic type containing several popular techniques is that of planar chromatography. This
covers chromatographic techniques in which the stationary phase is in a flat bed arrangement.
Included in this are the widespread and indispensable TLC technique, preparative TLC (PTLC) –
used for separation of larger sample quantities – and centrifugal TLC (CTLC). CTLC utilises a
circular preparative plate, which is rotated while inclined, allowing for concentric circular bands to
be collected as they reach the plate’s edge. The sample is loaded at the centre of the plate, and can be
eluted using a solvent gradient. Additional advantages include the ability to reuse plates, possible
coupling of detectors, and the ability to carry out inert separations.72
Not to be forgotten in the separation of organic compounds is the concept of column chromatography.
With a broad range of possible stationary phases, there are many techniques covered by the term. Gel
filtration (also known as size exclusion chromatography) uses a gel stationary phase to separate
compounds by molecular size. Conventional preparative column chromatography is gravity-driven
with a silica, derivatised silica and ion exchange as stationary phase examples, and is used extensively
in chemistry laboratories. Flash chromatography is similar, though solvent is forced through faster
with pressure at the top of the column.72
Modern hyphenation methods (mentioned above), using separation systems such as HPLC and gas
chromatography (GC) provide unchallenged resolution, and are imperative for dereplication
processes. Dereplication is the process of identifying known compounds in extracts before searching
for novel bioactive compounds, such that the search is more likely to provide previously
uncharacterised drug leads. Dereplication of extracts containing known compounds can be carried
out with access to standards and databases containing spectra of known compounds.72 It must be
Stellenbosch University https://scholar.sun.ac.za

20
noted that the instrumentation for such systems can be exceedingly expensive, so numerous
laboratories do not have access to many of these options.
As is well-known, and generally undisputed, nuclear magnetic resonance (NMR) spectroscopy is the
most powerful structural elucidation tool currently available at most academic institutions, and the
technique is improving as better instrumentation and experimental control are achieved. Both 1D-
and 2D-NMR spectroscopy techniques are indispensable for natural products research, providing
structural information that can rarely be matched. Some research groups are even using it as a first
step in natural products investigations, obtaining the NMR spectra of a total extract to provide some
information on the constituents, and to indicate any changes occurring during the fractionation
process. Another interesting application is the development of quantitative NMR (qNMR)
spectroscopy, which has the advantage of being non-destructive, which is particularly useful for
natural products present in trace amounts.72
A hyphenation method of particular note and promise is that of HPLC-NMR. With NMR
spectroscopy being such a powerful structural elucidation tool, and HPLC being a versatile method
of separation with relatively simple sample preparation, the combination of the two could prove to be
extremely valuable for natural products research. Current limitations of direct hyphenation include
large solvent peaks, under which other peaks are hidden, chemical shift differences, and lack of
sensitivity.72 Such limitations reduce the possible application of the technique, though solutions to
these could result in a particularly powerful analytical tool. Needless to say, the method is also a
costly one.
The methods mentioned above are only a few examples, and many more exist, with varying
specificity of application. The nature of the research being carried out thus dictates the methods that
will be useful, and decisions must be made taking the strengths and weaknesses of such methods into
consideration – a complex association of compromises is often at play.
Stellenbosch University https://scholar.sun.ac.za

21
7 Aims and objectives
As illustrated in the above sections, this project was focused on the investigation of the alkaloidal
profiles of Crinum variabile and Crinum paludosum. These species were chosen because their
alkaloid profiles had not previously been studied in depth, and because they belong to a family of
plants with a history of use in traditional medicine. The family (Amaryllidaceae) also boasts a unique
and promising record of alkaloid isolations. An additional advantage was the bulbous nature of the
species, as bulbs act as storage organs for secondary metabolites and other plant products, and thus
contain higher alkaloid concentrations.47
The aim of this project was to isolate and identify the major alkaloidal constituents of Crinum
variabile and Crinum paludosum. These investigations add value to the field of natural products
chemistry by identifying the major alkaloids present in the species, a task that has not previously been
undertaken. This provides information to future researchers and contributes towards the body of
knowledge on medicinal compounds available in the plant species in southern Africa. In the event of
the isolation of a novel compound in sufficient quantities, a small library of semi-synthetic analogues
could then be generated for a brief structure-activity relationship (SAR) study.
Also within the objectives of this project is a very brief synthetic study on two compounds,
higginsianin A and higginsianin B. These two compounds are natural products isolated from the
fungus Colletotrichum higginsianum by Cimmino et al.73 Small quantities of these compounds were
obtained from the original research group, with the intention of running small-scale test reactions for
structural modification. All products obtained and characterized would be sent for biological activity
evaluation.
Stellenbosch University https://scholar.sun.ac.za

22
8 Crinum variabile
8.1 Introduction
Crinum variabile is a winter-growing species, so named in reference to the variable colours of its
flowers, which change from white to a deep pink as they age. The species is endemic to the north-
western, western and southern areas of the Northern Cape of South Africa and grows near winter-
flowing rivers in deep sand. It was originally classified as
Amaryllis variabilis in 1804, with the first botanical
illustration being drawn of a specimen obtained from the
Cape of Good Hope. In 1873, it was transferred to the
Crinum genus, but wild specimens were only rediscovered
less than 60 years ago, in 1961. The species is easy to
cultivate and micropropagation protocols have been
established. However, flowering can be somewhat more
difficult to achieve.53
Crinum variabile has been the subject of some limited
phytochemical investigations, having been mentioned in a
paper by Tanahashi et al. (1990), entitled
“Radioimmunoassay for the Quantitative Determination
of Galanthamine 20”.74 In this paper, C. variabile was one
of the species tested for galanthamine 20 content. The
data presented shows that galanthamine 20 was found in
small amounts, that being 0.006% of the dry weight of the plant material used.74
Another paper mentioning the species was published in 2004 by Jäger et al., and was entitled
“Acetylcholinesterase inhibition of Crinum sp.”.75 This paper did not focus on the isolation of active
compounds from the species investigated, but rather tested the acetylcholinesterase inhibitory
activities of extracts from the plants. Interestingly, the leaves of C. variabile exhibited the greatest
activity in leaf extracts of the species tested. However, the C. variabile bulb and root extracts, while
displaying significant activity, were not as active as those from some of the other species, with C.
macowanii bulbs, and C. macowanii and C. moorei roots, exhibiting the greater activities.75
To the best of our knowledge, there have been no in-depth investigations regarding the alkaloidal
constituents of C. variabile. Thus, this investigation provides new information on the species and
adds value to the field.
Figure 8.1.1 – A botanical illustration of Crinum
variabile, drawn by Barbara Jeppe, taken from “The
Amaryllidaceae of Southern Africa” by Graham
Duncan, Barbara Jeppe, and Leigh Voigt
Stellenbosch University https://scholar.sun.ac.za
23
8.2 Processing, results and discussion
Please note that there is a tree diagram present in Appendix A (Fig. A.1.1) which represents the
processing of the plant material. It is recommended that this be referred to for context when reviewing
the processes described below.
8.2.1 Preparation and extraction
The plant material was acquired as bulbs, purchased from a local nursery. This means of acquisition
is preferable to removing natural specimens from their habitat, as it avoids depletion of wild
populations. Two examples of live bulbs are thriving in the Botanical Gardens at the University of
Stellenbosch (33°56'09.3"S 18°51'56.9"E) as reference material. A living specimen will be
maintained in the Botanical Gardens, and in the case of its demise, this will be converted into a dried
voucher specimen.
The bulbs were cut into slices, and air dried until constant mass was obtained (7 days at 25 °C). The
dried bulb material was placed in a sealed bag and stored in a freezer (approximately -18 °C) until
further processing. To prepare for extraction, the dried bulb material was frozen under liquid nitrogen
in a large mortar and pestle and crushed to as fine a powder as possible. This method proved very
useful, as the material was otherwise fibrous and difficult to crush without first making it brittle. Of
course, the goal of this treatment was to increase the surface area of the material to maximise
efficiency of extraction. All of the available dry bulb material (139 g) was prepared in this way.
The total mass of crushed, dry bulb was then covered with enough methanol to fully submerge it and
allow for free movement during stirring, and the mixture was agitated with a mechanical stirrer for 2
hours. The plant material was then strained, and the methanol collected. The plant material was
extracted in this way with four such portions of methanol, each extraction being left and stirred for 2
hours, except the fourth, which was left for 2 hours 40 minutes. All four portions of methanol extract
were added together, and the solvent removed under reduced pressure. After drying for 3.5 hours
under high vacuum, a total crude extract mass of 17.39 g was acquired. This crude extract was labelled
CVEXT001.
8.2.2 Processing and isolations
To the dried CVEXT001 was then added 300 mL of water, which had been acidified to pH3 using
H2SO4. The reasoning behind this was that the alkaloids present in CVEXT001 would be protonated,
and transformed into their quaternary ammonium salt forms, which would have a higher affinity for
aqueous solution. The acidified solution was found to have a pH of 6. This indicated that there were
basic components in the extract which increased the pH of the acidified water, an indication
Stellenbosch University https://scholar.sun.ac.za

24
supporting the presence of alkaloids. The solution was then acidified further to a pH of about 4 using
H2SO4 and was sonicated to evenly disperse the contents in solution.
The acidified aqueous CVEXT001 was then extracted with hexane (3×100 mL). Because the
alkaloids were in salt form, they would remain in the aqueous layer, and the hexane would remove
compounds that were not of interest. The aqueous layer after extraction with hexane was labelled
CVAq1.
CVAq1 was then exhaustively extracted with a more polar solvent, ethyl acetate (EtOAc) (7×100
mL), to further remove any unwanted compounds. The aqueous layer was then labelled CVAq2. The
aqueous extract remained at a pH of 4 throughout the extractions with both organic solvents.
CVAq2 was then basified to pH 9 with aqueous sodium hydroxide (NaOH). This was done to
deprotonate the alkaloids present, converting them to their free base forms, which have a higher
affinity for organic solvents. Following this, a continuous liquid/liquid extraction apparatus (please
see Appendix A for apparatus) was used to extract CVAq2 with EtOAc for 24 hours, during which
time, the alkaloids present in the aqueous layer should have moved into the organic layer. The EtOAc
extract was labelled CVAlk.EXT, to infer that it was the extract containing alkaloids. The acquired
mass after drying under high vacuum was 3.59 g.
8.2.2.1 Isolation of lycorine 19
Having obtained an extract containing the alkaloid content of the Crinum variabile plant material, a
few solvent systems were tested using TLC in order to find one that effectively separated the
components within the extract. The solvent system EtOAc:MeOH:H2O (85:10:5) separated the
constituents most effectively (Figure 8.2.2). An attempt was then made to dissolve CVAlk.EXT in
MeOH with the intention of proceeding with chromatographic separation methods. It was noted that
a light-coloured solid did not dissolve in the MeOH. This was filtered off, washed with MeOH, dried
under high vacuum, and weighed. This solid, labelled AlkEXT.S, was an off-white powder-like
substance, and had a mass of 0.934 g. It was decided that a crude NMR spectrum would be beneficial,
so this was carried out using DMSO-d6 as a solvent (the material was insufficiently soluble in MeOH,
CHCl3, and other organic solvents). The resulting spectrum corresponded to that of pure lycorine 19
(Figure 8.2.1). Table 8.1 and Table 8.2 illustrate the corresponding assignments based on literature
values.
Stellenbosch University https://scholar.sun.ac.za

25
Figure 8.2.1 – The numbered chemical structure of lycorine 19.
Table 8.1 – 1H NMR spectroscopy chemical shifts for lycorine 19. Literature values cited from Likhitwitayawuid et al. (1993).76
Proton Lit. Acquired
H-1 4.27 br s 4.25 br s
H-2 3.97 br s 3.95 br s
H-3 5.37 br s 5.34 br s
H-4a 2.60 d 2.58 d, J=10.3 Hz
H-6α 3.32 d 3.28 (overlap w/water signal)
H-6β 4.02 d 3.99 d, J=14.2 Hz
H-7 6.68 s 6.65 s
H-10 6.81 s 6.78 s
H-10b 2.50 m Behind solvent peak (2.48)
H-11 (2H) 2.44 m 2.44 m (solvent peak overlap)
H-12α 2.19 ddd 2.18 ddd, J=8.6, 8.6, 8.6 Hz
H-12β 3.19 dd 3.17 m
O-CH2-O 5.95 s 5.93 dd, J=5.6, 0.9 Hz
1-OH 4.79 br d 4.74 d, J=4.2 Hz
2-OH 4.90 br s 4.84 d, J=6.2 Hz
Solvent DMSO-d6 DMSO-d6
Table 8.2 - 13C NMR spectroscopy chemical shifts of lycorine 19. Literature values cited from Likhitwitayawuit et al. (1993).76
Carbon Lit. Acquired Δδ
1 70.21 70.20 -0.01
2 71.72 71.71 -0.01
3 118.48 118.46 -0.02
4 141.68 141.65 -0.03
4a 60.83 60.80 -0.03
6 56.73 56.71 -0.02
6a 129.75 129.74 -0.01
7 107.01 107.00 -0.01
Stellenbosch University https://scholar.sun.ac.za
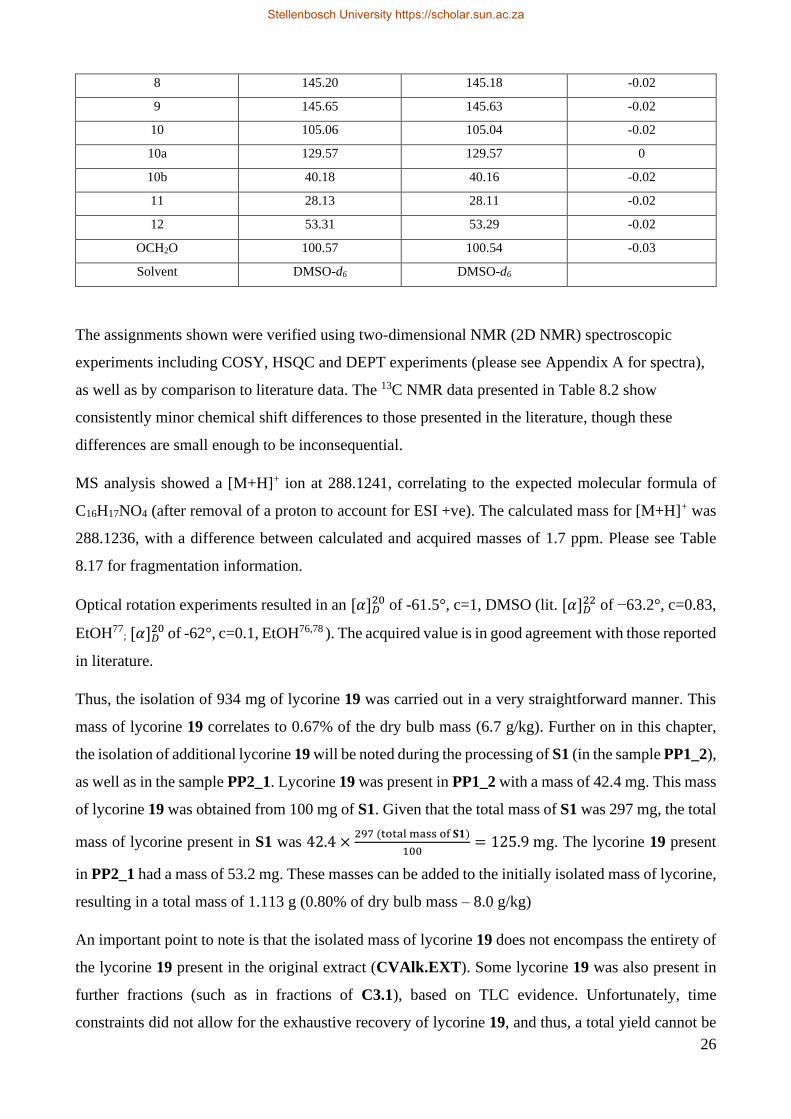
26
8 145.20 145.18 -0.02
9 145.65 145.63 -0.02
10 105.06 105.04 -0.02
10a 129.57 129.57 0
10b 40.18 40.16 -0.02
11 28.13 28.11 -0.02
12 53.31 53.29 -0.02
OCH2O 100.57 100.54 -0.03
Solvent DMSO-d6 DMSO-d6
The assignments shown were verified using two-dimensional NMR (2D NMR) spectroscopic
experiments including COSY, HSQC and DEPT experiments (please see Appendix A for spectra),
as well as by comparison to literature data. The 13C NMR data presented in Table 8.2 show
consistently minor chemical shift differences to those presented in the literature, though these
differences are small enough to be inconsequential.
MS analysis showed a [M+H]+ ion at 288.1241, correlating to the expected molecular formula of
C16H17NO4 (after removal of a proton to account for ESI +ve). The calculated mass for [M+H]+ was
288.1236, with a difference between calculated and acquired masses of 1.7 ppm. Please see Table
8.17 for fragmentation information.
Optical rotation experiments resulted in an [𝛼]𝐷20 of -61.5°, c=1, DMSO (lit. [𝛼]𝐷
22 of −63.2°, c=0.83,
EtOH77; [𝛼]𝐷
20 of -62°, c=0.1, EtOH76,78 ). The acquired value is in good agreement with those reported
in literature.
Thus, the isolation of 934 mg of lycorine 19 was carried out in a very straightforward manner. This
mass of lycorine 19 correlates to 0.67% of the dry bulb mass (6.7 g/kg). Further on in this chapter,
the isolation of additional lycorine 19 will be noted during the processing of S1 (in the sample PP1_2),
as well as in the sample PP2_1. Lycorine 19 was present in PP1_2 with a mass of 42.4 mg. This mass
of lycorine 19 was obtained from 100 mg of S1. Given that the total mass of S1 was 297 mg, the total
mass of lycorine present in S1 was 42.4 ×297 (total mass of 𝐒𝟏)
100= 125.9 mg. The lycorine 19 present
in PP2_1 had a mass of 53.2 mg. These masses can be added to the initially isolated mass of lycorine,
resulting in a total mass of 1.113 g (0.80% of dry bulb mass – 8.0 g/kg)
An important point to note is that the isolated mass of lycorine 19 does not encompass the entirety of
the lycorine 19 present in the original extract (CVAlk.EXT). Some lycorine 19 was also present in
further fractions (such as in fractions of C3.1), based on TLC evidence. Unfortunately, time
constraints did not allow for the exhaustive recovery of lycorine 19, and thus, a total yield cannot be
Stellenbosch University https://scholar.sun.ac.za

27
reported. It can, however, be assumed that total recovery of lycorine 19 from C. variabile would
likely result in a yield exceeding 0.80% of the dry bulbs mass. Though this is greater than the values
reported for many species,79,80 significantly greater yields have been reported for Sternbergia lutea,
with one study reporting a yield of over 2% from dry bulb mass.79,81
8.2.2.2 Isolation of 1,2-O,O-diacetyllycorine 21
Having identified AlkEXT.S, the mother liquor from which it was acquired (AlkEXT.F) was
subjected to further fractionation by chromatographic means. The first step in this regard was the
implementation of a relatively short silica column (i.e. a silica plug), in order to crudely fractionate
based on polarity. A consideration when deciding to use as little silica as possible for this initial
separation was that compounds can bind irreversibly to silica.72 Given that the entirety of the sample
was being used, it was considered safer to avoid the large quantities of silica that would have been
required for a column on this scale.
Before loading AlkEXT.F onto the silica plug (P1), it had to be dissolved and loaded onto silica.
MeOH was used for this, since the compounds present had previously dissolved in this solvent. The
sample was then dry loaded and eluted from P1. Twenty-six fractions of 700 mL each were
acquired (labelled P1_1-26), with eluents ranging from non-polar 100% hexane to highly polar
EtOAc:MeOH:H2O (70:20:10). For every solvent system applied to the plug, a single large fraction
was collected. A final wash was carried out with EtOAc:MeOH:Et3N (50:20:30), in the hopes that
the basic Et3N would bind to and deactivate the silica, helping to wash off any sample still on the
plug.
In order to evaluate the results of P1, a large TLC plate was spotted with each of the 26 fractions on
the baseline. It was then placed in a PLC chamber to develop, using EtOAc:MeOH:H2O (85:10:5)
(henceforth to be referred to as solvent system A) a photograph of this TLC plate is shown below
(Figure 8.2.2):
Stellenbosch University https://scholar.sun.ac.za
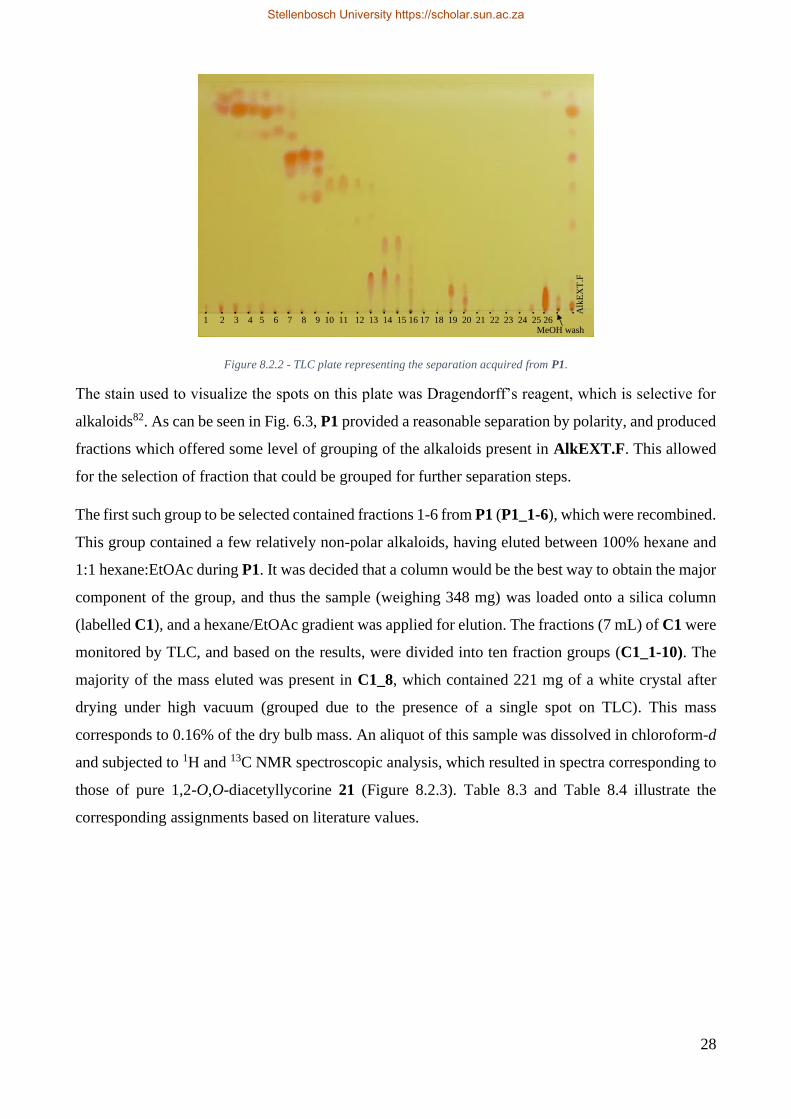
28
Figure 8.2.2 - TLC plate representing the separation acquired from P1.
The stain used to visualize the spots on this plate was Dragendorff’s reagent, which is selective for
alkaloids82. As can be seen in Fig. 6.3, P1 provided a reasonable separation by polarity, and produced
fractions which offered some level of grouping of the alkaloids present in AlkEXT.F. This allowed
for the selection of fraction that could be grouped for further separation steps.
The first such group to be selected contained fractions 1-6 from P1 (P1_1-6), which were recombined.
This group contained a few relatively non-polar alkaloids, having eluted between 100% hexane and
1:1 hexane:EtOAc during P1. It was decided that a column would be the best way to obtain the major
component of the group, and thus the sample (weighing 348 mg) was loaded onto a silica column
(labelled C1), and a hexane/EtOAc gradient was applied for elution. The fractions (7 mL) of C1 were
monitored by TLC, and based on the results, were divided into ten fraction groups (C1_1-10). The
majority of the mass eluted was present in C1_8, which contained 221 mg of a white crystal after
drying under high vacuum (grouped due to the presence of a single spot on TLC). This mass
corresponds to 0.16% of the dry bulb mass. An aliquot of this sample was dissolved in chloroform-d
and subjected to 1H and 13C NMR spectroscopic analysis, which resulted in spectra corresponding to
those of pure 1,2-O,O-diacetyllycorine 21 (Figure 8.2.3). Table 8.3 and Table 8.4 illustrate the
corresponding assignments based on literature values.
1 2 3 4 5 6 7 8 9 10 11 12 13 14 15 16 17 18 19 20 21 22 23 24 25 26 . . . . . . . . . . . . . . . . . . . . . . . . . . . . A
lkE
XT
.F
MeOH wash
Stellenbosch University https://scholar.sun.ac.za

29
Figure 8.2.3 – The numbered chemical structure of 1,2-O,O-diacetyllycorine 21.
Table 8.3 - Proton chemical shifts of 1,2-O,O-diacetyllycorine 21. Literature values cited from Lamoral-Theys et al (2009).83
Proton δ (ppm) Lit. δ (ppm) Acquired
H-1 5.75 s 5.73 br s
H-2 5.27 s 5.24 br s
H-3 5.45 s 5.51 br s
H-4a 2.89 d 2.76 d, J=10.4 Hz
H-6α 3.55 d 3.52 d, J=14.3 Hz
H-6β 4.18 d 4.15 d, J=14.1 Hz
H-7 6.76 s 6.74 s
H-10 6.59 s 6.56 s
H-10b 2.79 d 2.87 d, J=10.4 Hz
H-11 (2H) 2.67 m 2.65 m
H-12α 2.42 m 2.39 ddd, J=8.8, 8.8, 8.8 Hz
H-12β 3.38 m 3.36 m
O-CH2-O 5.94 s 5.93 s
1-O-Ac (Me) 1.97 s 1.94 s
2-O-Ac (Me) 2.09 s 2.07 s
Solvent CDCl3 CDCl3
Table 8.4 - Carbon chemical shifts of 1,2-O,O-diacetyllycorine 21. Literature values cited from Lamoral-Theys et al. (2009).83
Carbon δ (ppm) Lit. δ (ppm) Acquired Δδ
1 69.3 69.40 0.1
2 71.0 71.05 0.05
3 113.9 113.95 0.05
4 146.5 146.57 0.07
4a 61.3 61.38 0.08
6 58.9 57.05 -1.85
6a 129.5 129.57 0.07
7 105.1 105.20 0.1
8 146.4 146.45 0.05
Stellenbosch University https://scholar.sun.ac.za

30
9 146.2 146.27 0.07
10 107.4 107.45 0.05
10a 126.6 126.71 0.11
10b 40.6 40.68 0.08
11 28.7 28.82 0.12
12 53.9 53.77 -0.13
OCH2O 101.0 101.11 0.11
1-O-Ac (Me) 20.9 21.08 0.18
2-O-Ac (Me) 21.3 21.28 -0.02
1-O-Ac (CO) 172.3 170.12 -2.18
2-O-Ac (CO) 171.8 169.89 -1.91
Solvent CDCl3 CDCl3
These assignments were confirmed using 2D NMR spectroscopic experiments including COSY,
HSQC, HMBC, and DEPT (please see Appendix A for spectra), in addition to comparison with
literature data. Of the 13C NMR peak shift differences (Δδ) presented in Table 8.4, some values are
of note. C-6 and C-12, and both carbonyl signals, show lower values than those in the literature, while
most other peaks are slightly higher when compared. Additionally, the shifts of C-6 and the carbonyl
peaks differ by a greater margin than the majority of the other peaks. Reasons for these observations
may include the possible presence of impurities in the NMR sample of 21 and differences in the water
content of deuterated solvents used (water may interact with the carbonyl oxygens, affecting their
corresponding carbons). Despite the observed differences, the evidence available is sufficient that the
identity of 21 is assigned with relative confidence.
One additional difference with literature values can be noted in the 1H NMR spectrum signals for
protons H-4a and H-10b. The signal at 2.76 ppm was assigned as H-4a and that at 2.87 ppm was
assigned as H-10b, while these assignments were reversed in the report by Lamoral-Theys et al.
(2009)83. The reason the assignments were made this way was evident in the COSY spectrum, in
which the signal at 2.87 ppm was coupled to that for H-1. This coupling would only be noted for H-
10b, and not for H-4a, and so the signals reported here are more consistent with the structure of 21.
MS analysis showed a [M+H]+ ion at 372.1447, correlating to the expected molecular formula of
C20H21NO6 (after removal of a proton to account for ESI +ve). The calculated mass for [M+H]+ was
372.1447, with no difference between calculated and acquired masses. Please see Table 8.17 for
fragmentation information.
Optical rotation experiments resulted in an [𝛼]𝐷20 of +23.6°, c=1, CHCl3 (lit. [𝛼]𝐷
25 of +26.8°, c=1.22,
CHCl384; [𝛼]𝐷
24 of +11.1°, c=0.84, MeOH83).
Stellenbosch University https://scholar.sun.ac.za

31
8.2.2.3 Isolation of 2-O-acetyllycorine 22
After the analysis of the C1_8 fraction group, attention was drawn to the following fraction group of
the same column (fraction group C1_9). The reason for this was the presence of a crystalline
substance in C1_9 which was visible in the sample vial. After ensuring that the sample responded to
Dragendorff’s reagent, and did not have the same Rf as 1,2-O,O-diacetyllycorine 21, it was decided
that a silica gel column should be utilised for this compound’s purification. Based on the TLC
performance of some test solvent systems, it was decided that this column (labelled C1.1) should be
executed using a DCM/MeOH gradient. 20 mL fractions were collected, analysed by TLC, and
combined, resulting in five groups of fractions (C1.1_1–5). The compound of interest was present in
the third group (C1.1_3), with a mass of 45.2 mg. A portion of this sample was used for NMR
spectroscopic analysis, which resulted in the spectra for 2-O-acetyllycorine 22 (Figure 8.2.4). Table
8.5 and Table 8.6 illustrate the corresponding assignments based on literature values.
Figure 8.2.4 - The numbered chemical structure of 2-O-acetyllycorine 22.
Table 8.5 - Proton shifts of 2-O-acetyllycorine 22. Literature values cited from Toriizuka et al. (2008).85
Proton δ (ppm) Lit. δ (ppm) Acquired
H-1 4.52 s 4.37 br s
H-2 5.32 m 5.18 m
H-3 5.47 m 5.35 br s
H-4a 2.79 br d 2.67 d, J=10.4 Hz
H-6α 3.53 d 3.35 water peak overlap
H-6β 4.14 d 4.03 d, J=14.2 Hz
H-7 6.60 s 6.68 s
H-10 6.81 s 6.86 s
H-10b 2.71 br d 2.43 d, J=10.5 Hz
H-11 (2H) 2.65 m 2.51 m (solvent peak overlap)
H-12α 2.38 ddd 2.24 ddd, J=8.6, 8.6, 8.6 Hz
H-12β 3.37 ddd 3.21 dd, J=7.7, 7.7 Hz
O-CH2-O 5.94, 5.92 two ds 5.94 dd, J=11.0, 0.8 Hz
2-O-Ac (Me) 2.09 s 2.02 s
Stellenbosch University https://scholar.sun.ac.za

32
Solvent CDCl3 DMSO-d6
Table 8.6 - Carbon shifts of 2-O-acetyllycorine 22. Literature values cited from Toriizuka et al. (2008).85
Carbon δ (ppm) Lit. δ (ppm) Acquired
1 69.4 67.57
2 73.7 73.80
3 113.6 113.81
4 146.0 145.85
4a 60.7 61.0
6 58.3 57.03
6a 127.0 128.88
7 107.7 107.50
8 146.4 146.14
9 146.6 146.65
10 104.6 105.79
10a 130.2 130.11
10b 41.8 41.69
11 29.4 28.69
12 57.0 53.60
O-CH2-O 101.0 101.08
2-O-Ac (Me) 21.3 21.50
2-O-Ac (CO) 170.6 170.15
Solvent CDCl3 DMSO-d6
The acquired assignments were verified using 2D NMR spectroscopic experiments including HSQC,
HMBC, COSY and DEPT (please see Appendix A for spectra), as well as by comparison to spectra
in the literature. It should be noted that the spectra were acquired using DMSO-d6 as a solvent, which
explains the difference in chemical shift noted for some of the protons when compared to literature
values. Chemical shift differences for the 13C NMR peaks are not presented for this compound, as a
different solvent was used for NMR analysis of 22. The reason for this was that solubility of 22 in
CHCl3 was somewhat problematic during this investigation.
MS analysis showed a [M+H]+ ion of mass 330.1346, correlating to the expected molecular formula
of C18H19NO5 (after removal of a proton to account for ESI +ve). The calculated mass for [M+H]+
was 330.1341, with a difference between calculated and acquired masses of 1.5 ppm. Please see Table
8.17 for fragmentation information.
Stellenbosch University https://scholar.sun.ac.za

33
Optical rotation experiments resulted in an [𝛼]𝐷20 of +8.8°, c=0.77, MeOH (lit. [𝛼]𝐷
25 of +22.4, c=0.2,
CHCl383).
8.2.2.4 Isolation of 1-O-acetyllycorine 23
Focus was then turned to the second fraction group of P1. This group consisted of fractions P1_7-9
and contained a compound of moderate polarity as the major component, as can be seen in Figure
8.2.2 above. Given that the mass of P1_7-9 was somewhat higher than would be adequate for a PLC
plate, a silica gel column was chosen once again as the separation method for purification. After
testing for optimal solvent elution systems, the 286.2 mg of sample was dry loaded, and the column
(labelled C2) was eluted with an isocratic mobile phase of 100% EtOAc. The 20 mL fractions
obtained were divided into four groups (C2_1-4), and it was noted that the third of these (C2_3)
contained the major component, though it was still impure. Thus, a PLC plate was selected for further
purification. Fraction C2_3 was loaded in its entirety onto the plate (labelled PP0), which was placed
in a chamber containing EtOAc to develop.
Allowing the solvent front to run up the plate a single time, however, proved insufficient for the
effective separation of the sample’s components. Thus, the process was repeated until satisfactory
separation of bands on the plate was observed (a total of seven repetitions). The progress of this
process was observed under UV light (254 nm). When complete, the plate contained three visible
bands under UV, all of which were scraped off and collected. The compounds were removed from
the silica by washing with organic solvents (namely DCM and EtOAc). These bands were labelled
PP0_1-3, ordered by polarity such that PP0_1 was the band with the highest Rf (this ordering
convention was maintained for all separations).
It was found that the majority of the mass of the sample was present in the second band from this
plate, PP0_2. This sample (178.5 mg) was dissolved in CDCl3 and subjected to NMR spectroscopic
analysis, providing spectra correlating to those of pure 1-O-acetyllycorine 23 (Figure 8.2.5). Table
8.7 and Table 8.8 illustrate the corresponding assignments based on literature values.
Figure 8.2.5 - The numbered chemical structure of 1-O-acetyllycorine 23.
Stellenbosch University https://scholar.sun.ac.za
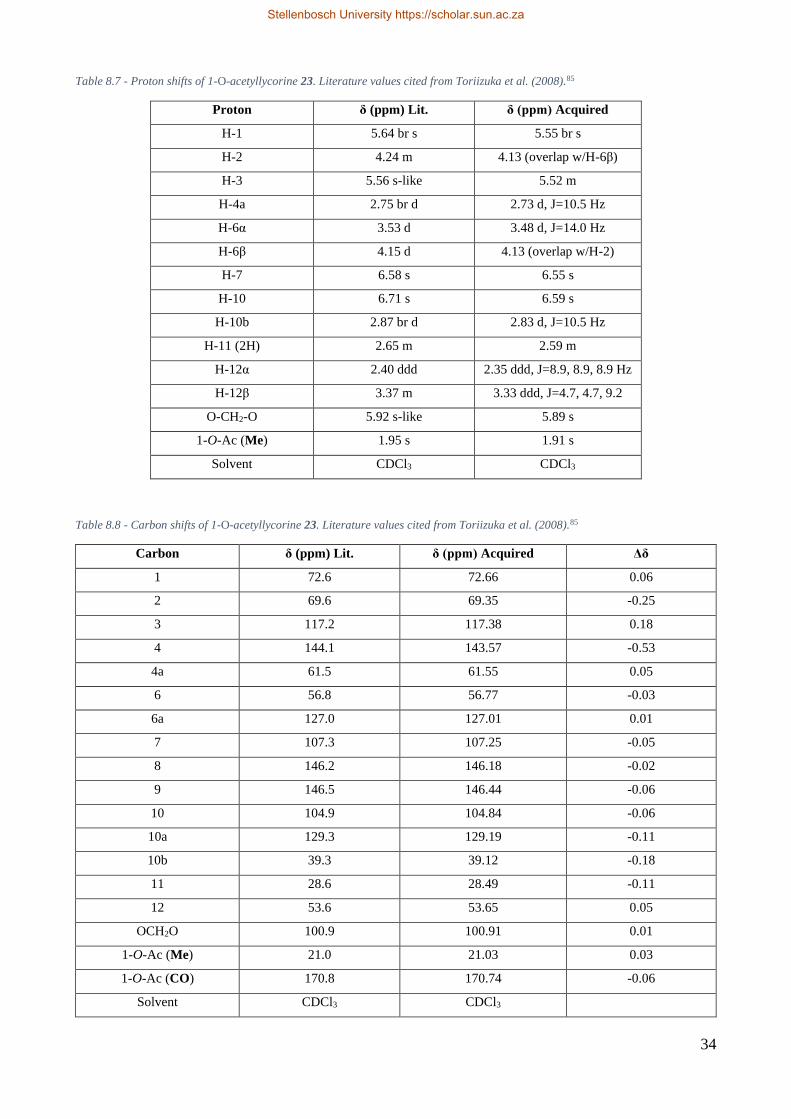
34
Table 8.7 - Proton shifts of 1-O-acetyllycorine 23. Literature values cited from Toriizuka et al. (2008).85
Proton δ (ppm) Lit. δ (ppm) Acquired
H-1 5.64 br s 5.55 br s
H-2 4.24 m 4.13 (overlap w/H-6β)
H-3 5.56 s-like 5.52 m
H-4a 2.75 br d 2.73 d, J=10.5 Hz
H-6α 3.53 d 3.48 d, J=14.0 Hz
H-6β 4.15 d 4.13 (overlap w/H-2)
H-7 6.58 s 6.55 s
H-10 6.71 s 6.59 s
H-10b 2.87 br d 2.83 d, J=10.5 Hz
H-11 (2H) 2.65 m 2.59 m
H-12α 2.40 ddd 2.35 ddd, J=8.9, 8.9, 8.9 Hz
H-12β 3.37 m 3.33 ddd, J=4.7, 4.7, 9.2
O-CH2-O 5.92 s-like 5.89 s
1-O-Ac (Me) 1.95 s 1.91 s
Solvent CDCl3 CDCl3
Table 8.8 - Carbon shifts of 1-O-acetyllycorine 23. Literature values cited from Toriizuka et al. (2008).85
Carbon δ (ppm) Lit. δ (ppm) Acquired Δδ
1 72.6 72.66 0.06
2 69.6 69.35 -0.25
3 117.2 117.38 0.18
4 144.1 143.57 -0.53
4a 61.5 61.55 0.05
6 56.8 56.77 -0.03
6a 127.0 127.01 0.01
7 107.3 107.25 -0.05
8 146.2 146.18 -0.02
9 146.5 146.44 -0.06
10 104.9 104.84 -0.06
10a 129.3 129.19 -0.11
10b 39.3 39.12 -0.18
11 28.6 28.49 -0.11
12 53.6 53.65 0.05
OCH2O 100.9 100.91 0.01
1-O-Ac (Me) 21.0 21.03 0.03
1-O-Ac (CO) 170.8 170.74 -0.06
Solvent CDCl3 CDCl3
Stellenbosch University https://scholar.sun.ac.za

35
Again, HSQC, HMBC, COSY and DEPT experiments were used to verify these assignments, in
addition to comparison with literature data (please see Appendix A for spectra). The 13C NMR peak
shift differences presented in Table 8.8 show small differences when compared to literature values,
with some being slightly higher and some slightly lower than those reported. The differences remain
relatively minor despite the differing signs, and so are not of great concern, though the Δδ value for
C-4 should be noted as a slight outlier. The possible presence of impurities in the NMR sample of 23
may explain the observed differences, or perhaps similar minor error in the literature value could be
responsible. The differences observed are sufficiently small that the identity assigned is maintained
with relative confidence.
MS analysis showed a [M+H]+ peak at 330.1346, correlating to the expected molecular formula of
C18H19NO5 (after removal of a proton to account for ESI +ve). The calculated mass for [M+H]+ was
330.1341, with a difference between calculated and acquired masses of 1.5 ppm. Please see Table
8.17 for fragmentation information.
Optical rotation experiments resulted in an [𝛼]𝐷20 of -73.6°, c=1, CHCl3 (lit. [𝛼]𝐷
25 of -64.8, c=0.9,
CHCl383).
The [𝛼]𝐷20 values acquired for 1-O-acetyllycorine 23 and 2-O-acetyllycorine 22 are evidence
supporting the correct differentiation of the two compounds, as they rotate light in opposite directions,
and the acquired values support their respective assignments.
Another telling virtue for the differentiation between 1-O-acetyllycorine 23 and 2-O-acetyllycorine
22 was evident in their H1 NMR spectra. In 1-O-acetyllycorine 23, H-1 of lycorine 19 (appearing as
a broad single peak at δ 4.25) was strongly deshielded to a single peak at δ 5.55 while H-2 of lycorine
19 (originally a broad single peak at δ 3.95) underwent a shielding effect to a single peak at δ 4.13
due to the anisotropic shielding cone of the adjacent ester carbonyl. In the corresponding case of 2-
O-acetyllycorine 22, the broad single peak of H-2 of lycorine 19 at δ 3.95 was strongly deshielded to
a single peak at δ 5.18, while H-1 of lycorine 19 – originally a broad single peak at δ 4.25 – was
shielded in 2-O-acetyllycorine 22 to a single peak at δ 4.37, again by the shielding cone of the adjacent
ester carbonyl functional group.
At this point, it had to be noted that the only compounds isolated had been lycorine 19 and acetylated
versions thereof. This raised the concern that the extraction process (carried out at relatively high
temperatures in EtOAc) could have been responsible for the formation of the acetylated analogues as
artefacts.86 Thus, an experiment was designed to test whether this was possibly the case. A small
Stellenbosch University https://scholar.sun.ac.za

36
amount of lycorine 19 was heated under reflux in EtOAc for 24 hours, to determine whether these
conditions would be capable of acetylation of the -OH groups. After a period of 24 hours, TLC
showed only one spot, with a Rf corresponding to that of lycorine 19. This showed that reflux of
lycorine in EtOAc under the same conditions as the extraction did not acetylate it, which is evidence
that the acetates were produced in the plant itself, rather than having been generated as a result of the
extraction process.
8.2.2.5 Isolation of CV3 – (6-epi)haemanthidine (24, 25)
Having confirmed the validity of the compounds isolated thus far, the process of purification of
further compounds was continued. This recommenced with the third fraction group from P1, which
was the combination of fractions 10, 11 and 12 (P1_10-12), and as can be seen in Figure 8.2.2,
contained a Dragendorff-positive compound as the major component. Thus, these fractions were
combined for further processing. Based on Figure 8.2.2, it may seem as though only one compound
was present in these fractions. However, further TLC analysis showed the presence of two
Dragendorff-positive compounds (amongst some other impurities visible under UV light), one of
which had an Rf corresponding to that of lycorine 19. The reason for the presence of the lycorine 19
spot not being immediately apparent in Figure 8.2.2 is that it does not respond strongly to
Dragendorff’s reagent, and takes some time to develop a darker colour in response to the stain.
During the process of recombining P1_10-12, a white solid did not dissolve when MeOH was added
to the samples. The fractions were recombined regardless, and the solid that did not dissolve was
filtered off and washed with cold MeOH. The mass of this white powder (labelled S1) was 297 mg.
A 30 mg sample of this was dissolved in DMSO-d6, and subjected to NMR spectroscopic analysis,
resulting in spectra which clearly indicated a mixture of at least two compounds. Thus, further
purification steps were necessary.
The white powder collected still showed two spots on TLC when stained with Dragendorff’s reagent,
one corresponding to lycorine 19, and the other with a slightly higher Rf. The two spots were well
resolved when solvent system A was used to develop the TLC. It was thus decided that a viable
separation method would be the use of a PLC plate. Thus 100 mg of S1 was dissolved in a minimum
amount of MeOH (the addition of a small amount of H2O and slightly heating the sample assisted in
dissolving it) and streaked onto a PLC plate (labelled PP1), which was developed in solvent system
A. A single development run was sufficient to resolve the bands, and they were scraped off and
isolated by washing the silica with EtOAc:MeOH (8:2). The band above that corresponding to
lycorine 19 (labelled PP1_1) had a mass of 44.8 mg after drying under high vacuum. PP1_2 produced
lycorine 19 (42.4 mg).
Stellenbosch University https://scholar.sun.ac.za

37
PP1_1, as the unknown substance, was naturally of higher interest and was thus the centre of focus.
NMR spectroscopic analysis of this material still produced what appeared to be impure NMR spectra,
despite only one spot being visible on TLC using Dragendorff’s reagent. In order to address this
challenge, the solvent system was optimised using test TLC experiments, and it was decided that a
DCM/MeOH gradient would be ideal for purification. A column (C3) was wet loaded with PP1_1 in
DCM, and eluted using 5-10% MeOH in DCM. TLC was used to analyse each of the fractions eluting
from C3, and only fractions which showed a single correlating spot under both UV light and
Dragendorff’s reagent were combined to generate the sample CV3 (20.8 mg).
1H and 13C NMR spectroscopic analysis of CV3 still provided spectra that indicated a mixture of
compounds, suggesting the presence of two compounds with identical Rf values on silica. One note
made while considering the 13C NMR spectrum of the sample was that there appeared to be smaller
“partner” peaks residing at nearby chemical shifts to those of many of the more intense peaks. This
led to the suggestion that the sample may have been a mixture of two isomers, but further data was
required before this assumption could be made. Separation of the components would, of course, be
the most favourable outcome.
Several optimisation methods were attempted, including test TLCs using a number of solvent systems
as well as TLCs with alumina (Al2O3) as a stationary phase, but all continued to show only a single
spot, and thus failed to separate the coeluting compounds. An orthogonal separation method would
be that of reversed phase (RP) chromatography, and HPLC analysis of the sample was selected as a
possible means of separating the components present in CV3. This separation method can also be
coupled to high-resolution mass spectrometry (HRMS), which could assist in providing some
structural information on eluting compounds. Thus, CV3 was subjected to HPLC-HRMS analysis
using a RP C18 column.
The resulting total ion chromatograms (TICs) showed only one major peak, with some small minor
peaks (one with a mass of 288, correlating to lycorine (19) [M+H]+). Several optimisations of the
HPLC method were attempted, but separation of the major peak into multiple components was not
achieved. This showed that the compounds in CV3 were of sufficiently similar chemical structure
that even a high-performance separation technique was not capable of resolving them. The MS data
provided by the HPLC-HRMS analysis of CV3 provided some useful information, as data including
fragmentation information (acquired using MS) was obtained.
The MS data showed a base peak ion (BPI) of m/z 318.1340. When using the MS analysis software
Masslynx©, a tool is available which allows for the prediction of the elemental composition when
provided with an accurate mass such as this. The program calculates the probability of each
Stellenbosch University https://scholar.sun.ac.za

38
composition using natural isotope abundances and reports a percentage which indicates the
confidence with which each composition can be assigned. Elemental composition analysis of the peak
of mass 318.1340 reports a molecular formula of C17H20NO5 with a confidence of 99.76%, and a
difference of 0.3 ppm between the calculated and acquired masses (calc. 318.1341, acq. 318.1340).
Given that this data was acquired in positive ionisation mode, removal of a single proton gives the
molecular formula of the major component of CV3 as C17H19NO5.
To gain further insight, the mass fragments acquired from this peak were also reviewed, a discussion
of which will follow the presentation of NMR spectroscopic data.
With the information obtained from HPLC and HRMS analyses, the NMR spectra for CV3 were
revisited with a more informed perspective. Amaryllidaceae alkaloids with the molecular formula
C17H19NO5 were researched, and the 1H NMR spectra reported for these were compared to that of
CV3. Promising results were found when a mixture of haemanthidine 24 and 6-epihaemanthidine 25
(Figure 8.2.6) was proposed.
Figure 8.2.6 - The chemical structures of haemanthidine 24 and 6-epihaemanthidine 25
Stellenbosch University https://scholar.sun.ac.za

39
Table 8.9 - The 1H NMR spectroscopic peaks of CV3 and those reported for haemanthidine (24) and 6-epihaemainthidine (25). Literature values are cited from Bastida et al. (2006),87 with an additional
report from Nishimata and Mori (1998)88, which indicates peak integrals.
Bastida et al.87 Nishimata & Mori88 CV3 peaks
Proton number Haemanthidine (24) 6-epihaemanthidine (25) (−)-haemanthidine “6-epihaemanthidine (25)” Haemanthidine (24) 6-epihaemanthidine (25)
1 6.33 d 6.37-6.40, 2H, m 6.16-6.31, 2H, m
2 6.27 dd
3 3.85 m 3.87-3.97, 2.55H, m 3.86-4.12, 2.5H, m
4α 2.36 ddd 2.21 ddd 2.33, 0.45H, dt 2.18, 0.55H, dt 2.09-2.37, 2.5H, m
4β 2.12 ddd 2.00 ddd 2.10, 0.45H, dd 2.03, 0.55H, dd
4a 3.56 dd 3.20 m 3.59, 0.45H, dd 3.78, 0.5H, dd, J=12.2, 5.8 Hz
6α 5.02 s 5.04, 0.55H, s 5.05, 0.5H, s
6β 5.69 s 5.69, 0.45H, s 5.64, 0.5H, s
7 6.94 s 6.79 s 6.98, 0.45H, s 6.83, 0.55H, s 7.00, 0.5H, s 6.84, 0.5H, s
10 6.70 s 6.73 s 6.77, 0.45H, s 6.80, 0.55H, s 6.76, 0.5H, s 6.78, 0.5H, s
11 3.92 m 3.87-3.97, 2.55H, m 3.86-4.12, 2.5H, m
12 endo 4.20 dd 3.30 m 4.20, 0.45H, dd 3.34, 0.55H, m 4.24, 0.5H, dd,
J=14.2, 6.7 Hz 3.26-3.52, 4.5H, m
12 exo 2.96 dd 3.20 m 2.94, 0.45H, dd 3.25, 0.55H, dd 3.04, 0.5H, br d, J=14.1 Hz
OCH2O 5.83 (2d) 5.86 (2d) 5.90-5.93, 2H, m 5.90-5.97, 2H, m
OMe 3.32 s 3.28 s 3.38, 1.35H, s 3.35, 1.65H, s 3.26-3.52, 4.5H, m
Solvent CDCl3 CDCl3 CDCl3
Stellenbosch University https://scholar.sun.ac.za

40
Interestingly, Nishimata and Mori (1998)88 report all their data in the above table as a single list of
peaks, as the spectral data for (−)-haemanthidine. There are, of course, too many peaks to belong to
just one isomer, and the spectral data shown correlates fairly well with a mixture of the two
diastereomers, as can be seen upon comparison with the data from Bastida et al.,87 which reports data
based on a mixture of the diastereomers.89 As is evident, the 1H NMR spectrum of CV3 shows
evidence supporting the identification of the sample as a mixture of haemanthidine 24 and 6-
epihaemanthidine 25, though some differences in chemical shift values must be noted.
The presence of 6-epihaemanthidine 25 was substantiated by the presence of additional peaks which
cannot be assigned to haemanthidine 24. In particular, the four singlets at 6.76-7.00 ppm are strong
evidence supporting a mixture, as a single epimer would only produce two singlets in this region
corresponding to protons 7 and 10.
The spectra of PP1_1 were reviewed at this point, and it was found that the sample was almost
identical to CV3, with some very minor impurity peaks. Thus, it can be surmised that the mass of
CV3 present in 100 mg of S1 was 44.8 mg, meaning that the total mass of CV3 in S1 (297 mg) was
44.8 ×297 (total mass of 𝐒𝟏)
100= 133.1 mg.
As previously mentioned, the 13C NMR spectrum of CV3 was the first noted indicator that the sample
may have been a mixture of isomers. With the additional information provided by the 1H spectrum,
as well as the HPLC-HRMS results, this notion is reinforced. The chemical shifts in the 13C NMR
spectrum of CV3 also correlated with those reported in literature for (6-epi)haemanthidine.
Table 8.10 - 13C shifts acquired for both epimers of haemanthidine (24 and 25), reported with the shifts acquired for CV3. Literature
values are cited from Bastida et al.87
13C peaks of haemanthidine87
13C peaks of CV3 Δδ Carbon
number Haemanthidine 24 6-epihaemanthidine 25
1 126.7 126.3 123.12 122.93 -3.58 -3.37
2 132.3 132.8 134.6 135.85 2.3 3.05
3 72.5 72.5 75.95 75.64 3.45 3.14
4 27.8 27.6 29.69 29.41 1.89 1.81
4a 61.6 56.2 64.83 59.56 3.23 3.36
6 85.8 88.4 85.51 88.06 -0.29 -0.34
6a 129.2 127.8 128.78 127.34 -0.42 -0.46
7 108.2 109.5 108.31 109.54 0.11 0.04
8 146.5 146.4 146.73 146.56 0.23 0.16
9 147.4 147.7 147.6 147.83 0.2 0.13
10 102.7 102.9 102.68 102.81 -0.02 -0.09
Stellenbosch University https://scholar.sun.ac.za

41
10a 134.7 135.8 136.28 136.46 1.58 0.66
10b 50.7 50.3 50.45 50.84 -0.25 0.54
11 79.2 78.3 79.01 78.13 -0.19 -0.17
12 52 57.8 51.84 57.7 -0.16 -0.1
O-CH2-O 101 101 101.12 0.12
-OMe 56.8 56.5 55.95 56.01 -0.85 -0.49
Solvent CDCl3 CDCl3
The differences noted in the 13C NMR chemical shifts are significant, especially for carbons C-1 to
C-4a, as well as C-10a and the methoxy carbon. The differing signs of the Δδ values are also a cause
for concern, as this indicates that the shift is not constant in nature (shielding/deshielding). These
varying results may be due to differing ratios of the diastereomers, or perhaps due to the presence of
some impurities in CV3. Despite the inconsistencies in the available data, (6-epi)haemanthidine (24,
25) remains the most viable identification of CV3 which can be suggested, to the best of our
knowledge.
Having acquired data that indicated the identity of CV3 as a mixture of haemanthidine epimers (24
and 25), the mass fragments acquired from the MS/MS analysis of the sample could be interpreted
with some additional insight. Figure 8.2.7 below shows the obtained mass spectrum of the primary
peak observed during HPLC-MS/MS analysis of CV3.
Figure 8.2.7 – MS/MS spectrum of CV3, showing fragmentation information.
In a book chapter by Bastida et al. (2006),87 the fragmentation of haemanthamine-type alkaloids is
discussed, and the information contained therein provided useful direction when attempting to explain
some of the observed peaks. In fragmentation mechanisms shown by Bastida et al. (2006)87 for
haemanthamine, analogous peaks can be seen in the fragmentation pattern of CV3 which are
Stellenbosch University https://scholar.sun.ac.za

42
applicable for corresponding mechanisms in haemanthidine 24. For example, the peaks in the MS
spectrum of haemanthamine indicate the loss of a CH2=NMe fragment.87 The analogous loss for
haemanthidine 24 would be that of CH(OH)=NMe (due to the presence of the 6-hydroxy group in
haemanthidine 24). As can be seen in Table 8.11, some peaks present in the spectrum can be
tentatively assigned to the loss of this fragment (amongst others).
Table 8.11 - Tentative explanations for some observed fragment ions in the MS/MS spectrum of CV3.
m/z Mass loss Possible fragments lost
318 0 None ([M+H]+)
300 18 H2O
286 32 MeOH, CHO, CH2O
268 50 MeOH, H2O
250 68 MeOH, H2O, H2O
227 91 CH(OH)=NMe, MeOH
224 94 CH(OH)=NMe,
220 98 MeOH, H2O, H2O, CH2O
209 109 CH(OH)=NMe, MeOH, H2O
199 119 MeOH, CHO, CH2NH, CHO
169 149 MeOH, CHO, CH2NH, CHO, CH2O
Important to note is that no elucidation attempts regarding mechanisms for these suggested mass
losses were made. Thus, the data presented in Table 8.11 is tentative and limited to only some of the
peaks in the spectrum. Further investigations regarding this mass spectrum are necessary before
conclusions can be drawn.
The mass fragments noted in Table 8.11 are in good agreement with those expected for haemanthidine
24, and the fragments acquired for 6-epihaemanthidine 25 will likely be analogous to those of its
epimer, which infers that this mass spectrum agrees with the notion that CV3 is a mixture of the two
epimers. Difficulty was faced in finding a literature source in which ESI+ve was utilised as an
ionisation method when obtaining the fragmentation pattern of haemanthidine 24. Thus, comparison
of the acquired data with literature data could not occur. Given that this sample was a diasteriomeric
mixture, optical rotation experiments were not carried out.
Further attempts to separate the two isomers were made, which included the acetylation of CV3, in
the hopes that increasing the size of the moiety at the diastereomeric centre would generate
sufficiently differing compound conformations to allow for separation. This attempt proved
unsuccessful, unfortunately, with the resulting sample being a single spot on TLC which could not
be resolved into multiple peaks on silica.
Stellenbosch University https://scholar.sun.ac.za
43
Unfortunately, the acetylation reaction was carried out before 2D NMR spectroscopic experiments
had been done on CV3, and time constraints did not allow for the re-isolation of the compound in
order to acquire these spectra. Despite this, the data acquired should be sufficient evidence for the
identity of CV3 as (6-epi)haemanthidine (24, 25).
Only a portion of the available sample containing (6-epi)haemanthidine (24, 25) was used in the
isolation and characterisation of the sample. Thus, the yield of this component was not acquired.
However, recovery of impure CV3 from the remaining P1_10-12 (the mother-liquor of S1) was
achieved by gravity column (C3.1), resulting in a fraction group containing CV3 as the major
component. This impure CV3 sample had a mass of 658 mg. Because the sample was impure, it
cannot be assumed that this was the mass of CV3 present in the filtrate of P1_10-12. However, given
that CV3 was the major component of the sample (based on TLC analysis, and selective
recombination of fractions containing CV3), it can be assumed that the mass of CV3 in the sample
was relatively high. With the addition of the 133.1 mg of CV3 present in S1, it seems that C. variabile
produces (6-epi)haemanthidine (24, 25) in relatively high concentrations. Unfortunately, despite the
high concentration, time constraints did not allow for the exhaustive recovery of the alkaloid.
8.2.2.6 Isolation of bulbispermine 26
Following the characterisation of the major components in the first 12 fractions from P1 (P1_1-12),
the rest of the fractions (P1_13-26) were considered. Based on TLC analysis of these fractions, it was
decided that there was little opportunity for the selection of further fraction groups, so all these
fractions were combined, and a silica column (C4) was used for the fractionation of the resulting
sample. Given the relatively high polarity of the components in the sample, a DCM/MeOH gradient
was selected as an elution strategy. This column resulted in approximately 650 fractions, which were
grouped by TLC profile into 23 fraction groups (C4_1-23).
Of these, C4_12-16 displayed TLC profiles containing components of interest, and were combined,
as the spots present suggested that these components were present across the fraction groups. The
resulting sample was dried under high vacuum and its mass was recorded at 211.2 mg. It was decided
that a PLC plate (PP2) would be preferable as a means of separation for this sample, as this technique
had provided more reliable separation of polar compounds than silica columns during previous
experiments. It must be noted that a sample of this mass required a PLC plate with a thicker stationary
phase than those previously used, to avoid overloading the plate. Thus, the entirety of the sample was
dissolved in a minimum amount of MeOH and streaked onto the baseline of a PLC plate with a 2 mm
thick coating.
Stellenbosch University https://scholar.sun.ac.za

44
The plate was developed three times in solvent system A, resulting in 4 fairly resolved bands of
interest (PP2_1-4) when viewed under UV light. These bands were all removed and washed off the
silica. They were then analysed by TLC, to gain further insight regarding their compositions. PP2_1
(53.2 mg) showed a spot corelating to that of lycorine 19, and so was placed aside in the interest of
finding a compound that had not previously been isolated from the plant. PP2_2 (66.7 mg) showed
promising results in this regard, displaying a spot with a Rf lower slightly lower than that of lycorine’s,
with relatively few, and visually less intense, additional spots (suggesting a relatively pure sample).
The sample was subjected to 1H NMR spectroscopic analysis, which showed the presence of
impurities, and so further purification steps were taken before full characterisation.
PP2_2 was loaded onto an additional PLC plate (PP3) for this purpose. The plate was developed in
solvent system A, and the band of interest (PP3_3) was removed and washed to recover the compound
(this band was by far the most intense when viewed under UV light, with the other bands showing a
very low response. Of course, the rest of the compound in the separation was not discarded, but also
recovered and kept as a separate sample, though no components of interest were identified in these).
The resulting major component (45.5 mg) was subjected to NMR spectroscopic analysis and found
to be bulbispermine 26 (Figure 8.2.8), as shown in Table 8.12 and Table 8.13.
Figure 8.2.8 - Numbered chemical structure of bulbispermine 26.
Table 8.12 - The proton chemical shifts for bulbispermine 26. Literature values are cited from Luchetti et al. (2012).90
Proton δ (ppm) Lit. δ (ppm) Acquired
H-1 6.04 d 6.03 br d, J=10.3 Hz
H-2 6.23 dd 6.22 dd, J=10.3, 2.3 Hz
H-3 4.36-4.29 m 4.31 m
H-4α 2.15-2.03 m 2.10 m
H-4β 1.98-1.91 m 1.96 m
H-4a 3.44 dd 3.23 m
H-6α 3.73 d 3.74 d, J=16.7 Hz
H-6β 4.27 d 4.28 d, J=16.7 Hz
H-7 6.52 s 6.51 s
H-10 6.85 s 6.85 s
H-11 3.95 dd 3.95 dd, J=6.7, 3.3 Hz
Stellenbosch University https://scholar.sun.ac.za
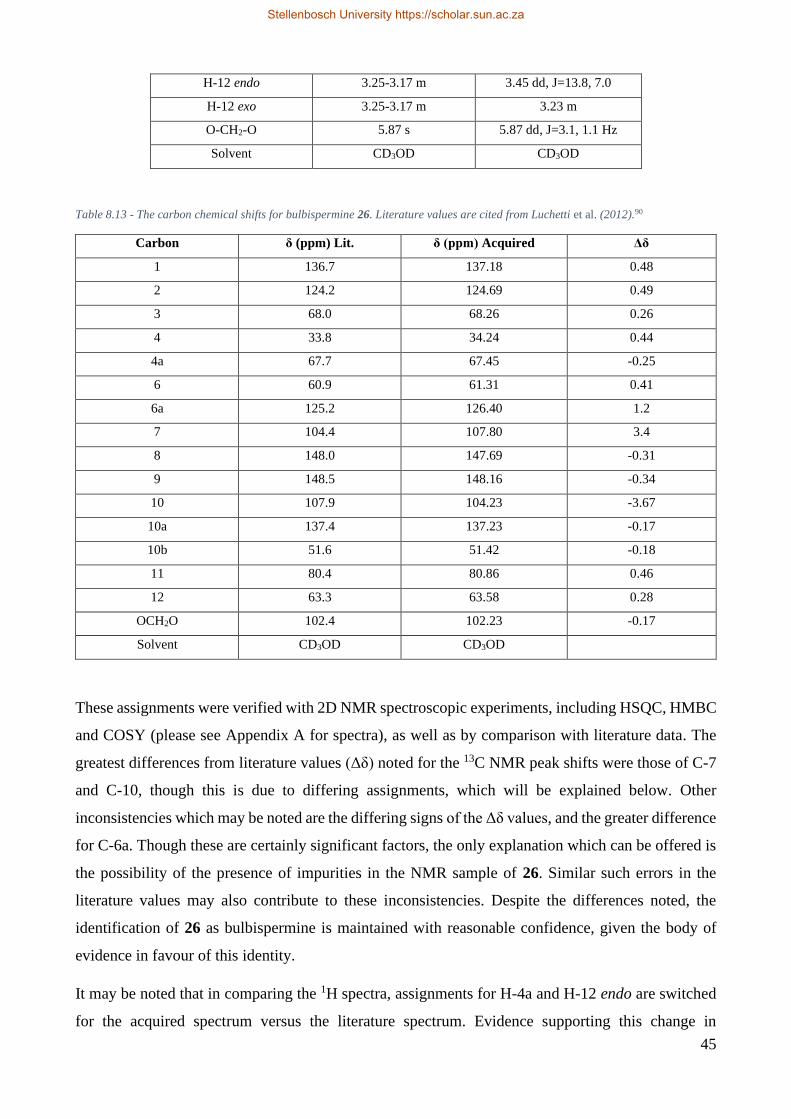
45
H-12 endo 3.25-3.17 m 3.45 dd, J=13.8, 7.0
H-12 exo 3.25-3.17 m 3.23 m
O-CH2-O 5.87 s 5.87 dd, J=3.1, 1.1 Hz
Solvent CD3OD CD3OD
Table 8.13 - The carbon chemical shifts for bulbispermine 26. Literature values are cited from Luchetti et al. (2012).90
Carbon δ (ppm) Lit. δ (ppm) Acquired Δδ
1 136.7 137.18 0.48
2 124.2 124.69 0.49
3 68.0 68.26 0.26
4 33.8 34.24 0.44
4a 67.7 67.45 -0.25
6 60.9 61.31 0.41
6a 125.2 126.40 1.2
7 104.4 107.80 3.4
8 148.0 147.69 -0.31
9 148.5 148.16 -0.34
10 107.9 104.23 -3.67
10a 137.4 137.23 -0.17
10b 51.6 51.42 -0.18
11 80.4 80.86 0.46
12 63.3 63.58 0.28
OCH2O 102.4 102.23 -0.17
Solvent CD3OD CD3OD
These assignments were verified with 2D NMR spectroscopic experiments, including HSQC, HMBC
and COSY (please see Appendix A for spectra), as well as by comparison with literature data. The
greatest differences from literature values (Δδ) noted for the 13C NMR peak shifts were those of C-7
and C-10, though this is due to differing assignments, which will be explained below. Other
inconsistencies which may be noted are the differing signs of the Δδ values, and the greater difference
for C-6a. Though these are certainly significant factors, the only explanation which can be offered is
the possibility of the presence of impurities in the NMR sample of 26. Similar such errors in the
literature values may also contribute to these inconsistencies. Despite the differences noted, the
identification of 26 as bulbispermine is maintained with reasonable confidence, given the body of
evidence in favour of this identity.
It may be noted that in comparing the 1H spectra, assignments for H-4a and H-12 endo are switched
for the acquired spectrum versus the literature spectrum. Evidence supporting this change in
Stellenbosch University https://scholar.sun.ac.za
46
assignments can be found in the HSQC spectrum, in which the peaks at 3.45 and 3.23 ppm both
couple to the same carbon atom (that assigned as C-12), while the peak at 3.23 ppm also couples to
the carbon assigned as C-4a. Another two assignments which have been interchanged from those
reported in the literature are those for C-7 and C-10 in the 13C NMR spectrum. The reason this was
done was that the HSQC showed coupling between H-10 and the peak at 104.23 ppm in the 13C NMR
spectrum, as well as coupling between H-7 and the peak at 107.8 ppm in the 13C spectrum. The reason
H-10 and H-7 were not switched as assignments instead of their corresponding carbons was that the
COSY spectrum showed stronger coupling between H-7 and H-6(α and β) than between H-10 and H-
6(α and β), which is consistent with the proposed structure.
11-hydroxyvittatine 31a (Figure 9.2.5) is a stereoisomer of bulbispermine 26, with inverted
stereochemistry of the 3-hydroxy group. The possibility that 26 was 11-hydroxyvittatine was ruled
out by comparison with the literature data, in which the acquired 1H NMR spectra were in better
agreement with bulbispermine 26 than 11-hydroxyvittatine 31a.87,90 Optical rotation experiments for
26 resulted in an [𝛼]𝐷20 of +87.5° (c=1, MeOH), which also compared more favourably to
bulbispermine (lit. [𝛼]𝐷20 of +107°, c=1.02, MeOH91) than to 11-hydroxyvittatine 31a ( lit. [𝛼]𝐷
25 of
+11.3°, c=0.88, MeOH92). The presence of some minor impurities, as well as possible human error
in terms of correct concentration values, may account for the difference between acquired values and
those from literature.
Hamayne 31b (Figure 9.2.5) is another such stereoisomer with inverted stereochemistry of the 11-
hydroxy group. Unfortunately, this alkaloid does not have well-defined spectral data available in the
literature, though the acquired [𝛼]𝐷20 value still compares more favourably with bulbispermine 26 than
with hamayne 31b (lit. [𝛼]𝐷12 of +43°, c=0.1, EtOH93).
MS analysis showed a peak for [M+H]+ at 288.1238, correlating to the expected molecular formula
of C16H17NO4 (after removal of a proton to account for ESI +ve). The calculated mass for [M+H]+ is
288.1236, with a mass difference between calculated and acquired masses of 0.7 ppm. Please see
Table 8.17 for fragmentation information.
8.2.2.7 Isolation of criwelline 27
Having characterised the major component of PP2_2, attention was turned to the other bands from
PP2. As has been established, four bands were removed from the plate, the first of which correlated
with lycorine 19 when analysed with TLC, and the second of which was characterised as
bulbispermine 26. Thus, the third and fourth bands (PP2_3-4) were then focused on, and it was
decided based on TLC analysis that they should be recombined and subjected to further separation
(this was because they still shared components with Rf values below that of bulbispermine 26, which
Stellenbosch University https://scholar.sun.ac.za
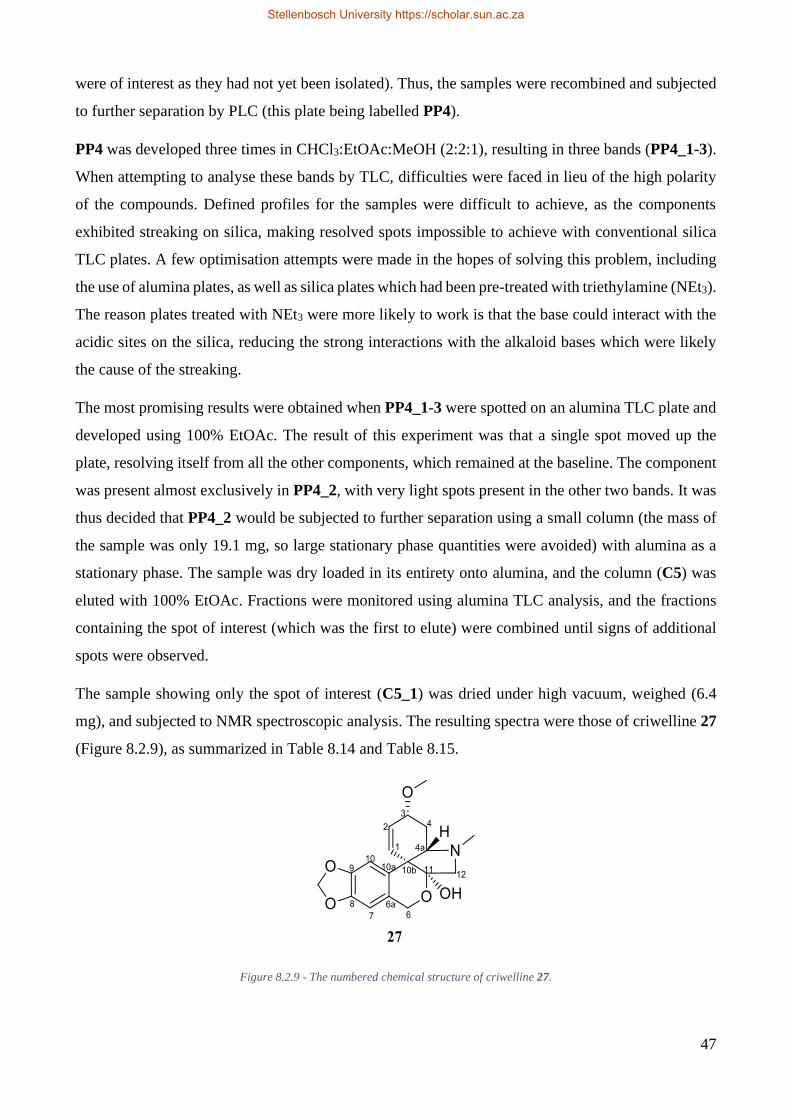
47
were of interest as they had not yet been isolated). Thus, the samples were recombined and subjected
to further separation by PLC (this plate being labelled PP4).
PP4 was developed three times in CHCl3:EtOAc:MeOH (2:2:1), resulting in three bands (PP4_1-3).
When attempting to analyse these bands by TLC, difficulties were faced in lieu of the high polarity
of the compounds. Defined profiles for the samples were difficult to achieve, as the components
exhibited streaking on silica, making resolved spots impossible to achieve with conventional silica
TLC plates. A few optimisation attempts were made in the hopes of solving this problem, including
the use of alumina plates, as well as silica plates which had been pre-treated with triethylamine (NEt3).
The reason plates treated with NEt3 were more likely to work is that the base could interact with the
acidic sites on the silica, reducing the strong interactions with the alkaloid bases which were likely
the cause of the streaking.
The most promising results were obtained when PP4_1-3 were spotted on an alumina TLC plate and
developed using 100% EtOAc. The result of this experiment was that a single spot moved up the
plate, resolving itself from all the other components, which remained at the baseline. The component
was present almost exclusively in PP4_2, with very light spots present in the other two bands. It was
thus decided that PP4_2 would be subjected to further separation using a small column (the mass of
the sample was only 19.1 mg, so large stationary phase quantities were avoided) with alumina as a
stationary phase. The sample was dry loaded in its entirety onto alumina, and the column (C5) was
eluted with 100% EtOAc. Fractions were monitored using alumina TLC analysis, and the fractions
containing the spot of interest (which was the first to elute) were combined until signs of additional
spots were observed.
The sample showing only the spot of interest (C5_1) was dried under high vacuum, weighed (6.4
mg), and subjected to NMR spectroscopic analysis. The resulting spectra were those of criwelline 27
(Figure 8.2.9), as summarized in Table 8.14 and Table 8.15.
Figure 8.2.9 - The numbered chemical structure of criwelline 27.
Stellenbosch University https://scholar.sun.ac.za

48
Table 8.14 - The proton chemical shifts for criwelline 27. Literature values are cited from Bastida et al. (2006).87
Proton δ (ppm) Lit. δ (ppm) Acquired
H-1 5.78 d 5.79 d, J=10.1 Hz
H-2 6.20 dd 6.20 dd, J=10.2, 3.6 Hz
H-3 3.89 ddd 3.89 m
H-4α 1.93 ddd 1.94 ddd, J=15.0, 6.0, 3.6 Hz
H-4β 2.09 ddd 2.09 ddd, J=14.9, 4.4, 3.5 Hz
H-4a 2.95 t 2.97 t, J=4.2 Hz
H-6 4.68 d 4.67 d, J=14.7 Hz
H-6ʹ 4.94 d 4.93 d, J=14.7 Hz
H-7 6.55 s 6.53 s
H-10 6.52 s 6.50 s
H-12 2.83 d 2.86 d, J=10.4 Hz
H-12ʹ 3.30 d 3.33 d, J=10.4 Hz
O-CH2-O 5.92 s 5.90 dd, J=4.2, 1.3 Hz
OMe 3.45 s 3.44 s
NMe 2.38 s 2.41 s
Solvent CDCl3 CDCl3
Table 8.15 - The carbon chemical shifts for criwelline 27. Literature values are cited from Bastida et al. (2006).87
Carbon δ (ppm) Lit. δ (ppm) Acquired Δδ
1 130.1 130.29 0.19
2 128.9 129.08 0.18
3 72.1 72.20 0.1
4 25.4 25.62 0.22
4a 68.2 68.60 0.4
6 62.6 62.75 0.15
6a 126.2 126.43 0.23
7 108.5 108.68 0.18
8 146.6 146.82 0.22
9 146.2 146.49 0.29
10 104.2 104.37 0.17
10a 130.9 131.66 0.76
10b 50.0 50.25 0.25
11 102.6 102.71 0.11
12 64.5 64.61 0.11
OCH2O 100.9 101.10 0.2
OMe 56.7 56.90 0.2
NMe 40.6 40.96 0.36
Stellenbosch University https://scholar.sun.ac.za

49
Solvent CDCl3 CDCl3
These assignments were verified using 2D NMR spectroscopic experiments including HMBC, HSQC
and COSY (please see Appendix A for spectra), as well as by comparison with literature data.
Regarding the Δδ values presented in Table 8.15 above, the acquired 13C NMR peak shifts are in
relatively good agreement with those reported in the literature. The values all share the same sign,
indicating a constant shift in one direction (deshielded). One possible outlying value is that for C-
10a, though this may be explained by the presence of some impurities in the NMR sample of 27, for
which there is evidence in the 1H NMR spectrum.
MS analysis showed a [M+H]+ peak at 332.1499, correlating to the expected molecular formula of
C18H21NO5 (after removal of a proton to account for ESI +ve), which adds credence to the
identification as criwelline 27. The calculated mass for [M+H]+ of this formula is 332. 1498, with a
difference between calculated and acquired masses of only 0.3 ppm. Please see Table 8.17 for
fragmentation information. Optical rotation experiments provided an [𝛼]𝐷20 of +163.1, c=0.325,
CHCl3 (lit. [𝛼]𝐷20 of +278°, c=0.213, CHCl3
94).
It was verified that compound 27 was criwelline and not tazettine 36 (Figure 9.2.10) (a stereoisomer
with inverted stereochemistry of the 3-methoxy group) by comparison of 1H NMR spectra. The 1H
NMR spectrum of tazettine did not correlate with the acquired spectrum87,95, while that of criwelline
27 did.87
8.2.3 HPLC-ESI-MS/MS analysis of CVAlk.EXT
Time constraints meant that the remaining fractions could not be investigated further, though there
were undoubtedly alkaloidal constituents remaining in some of the fractions (such as the more polar
fractions from C4, and the rest of the components from PP4). In an attempt to gain some information
to assist in the tentative identification of the remaining alkaloidal constituents, a small amount of the
original alkaloidal extract was analysed using HPLC-MS/MS. This resulted in a TIC (Figure 8.2.10)
which could provide accurate masses and fragmentation patterns for each peak.
Stellenbosch University https://scholar.sun.ac.za

50
Figure 8.2.10 - TIC of HPLC-ESI-HRMS analysis of CVAlk.EXT.
Table 8.16 - Table showing the HRMS and fragmentation (MS/MS) data for the peaks in the TIC of CVAlk.EXT.
Retention
Time/min
Molecular Formula (Mass
difference/ppm)*
[M+H]+ (m/z)
(calc.)** Fragments (m/z) Possible Identity
0.82 C16H17NO4 (1.4) 288.1232
(288.1236)
270, 252, 222, 177, 147,
119, 91 Lycorine 1996
1.03 C16H17NO4 (1.7) 288.1231
(288.1236)
266, 226, 199, 184, 147,
123, 119 Unidentified
1.14 C16H17NO4 (1.4) 288.1232
(288.1236)
270, 252, 222, 177, 147,
119, 91 Lycorine 1996
1.50 C16H17NO5 (1.3) 304.1181
(304.1185) 286, 268, 250, 226
11-hydroxyvittatine-N-
oxide 2997
1.72 C18H21NO5 (3.6) 332.1486
(332.1498) 211, 183, 140 Unidentified
1.87 C16H17NO4 (1.7) 288.1232
(288.1236)
270, 244, 226, 224, 211,
196, 181, 153, 141, 115 Bulbispermine 26
2.15 C18H19NO5 (0.0) 330.1341
(330.1341)
270, 252, 222, 194, 177,
147, 134, 119
1-O-acetyllycorine 23,
2-O-acetyllycorine 22
2.24
C17H19NO5 (1.6) 318.1346
(318.1341)
300, 286, 268, 250, 240,
227, 224, 211, 209, 199,
192, 181, 169, 165, 153,
141, 115
Haemanthidine 24 (and
6-epihaemanthidine 25)
C18H21NO5 (0.0) 332.1498
(332.1498)
Fragments are
obstructed by
haemanthidine peaks
Criwelline 27
2.47 C18H19NO6 (0.6) 346.1288
(346.1291)
328, 316, 268, 250, 226,
150
Candimine98,
tazettamide99
Stellenbosch University https://scholar.sun.ac.za

51
2.52 C18H19NO5 (0.9) 330.1344
(330.1341)
270, 266, 252, 227, 226,
211, 196, 181, 168, 153
3-O-acetylhamayne100,
3-O-acetyl-
bulbispermine
2.65 C18H19NO4 (1.0) 314.1395
(314.1392) 298, 254, 209, 141
3-O-acetylvittatine, 3-
O-acetylcrinine. 1-O-
acetylcaranine
2.77 C20H21NO6 (0.8) 372.1450
(372.1447) 270, 252, 222, 194
1,2-O,O-
diacetyllycorine 21
2.97 C18H21NO5 (1.2) 332.1494
(332.1498)
300, 268, 250, 227, 199,
197, 169, 141, 115 Unidentified
3.34 C22H17NO3 (1.2) 344.1291
(344.1287) 224, 166, 121, 103
Unidentified – structural
similarities are noted 4.11 C22H17NO2 (0.9)
328.1335
(328.1338)
367 (K adduct), 224,
166, 144, 105
4.58 C15H13NO2 (2.9) 240.1032
(240.1025)
224, 210, 182,167, 166,
139
*The difference in calculated mass and that obtained for the molecular ion. **The calculated mass for [M+H]+. Numbers in bold
represent base peak ions in cases where this is not the molecular ion.
Table 6.16 (below) can be used as a means of comparison when identifying the peaks presented above.
The peak at 1.03 min could not be conclusively identified, though Amaryllidaceae alkaloids matching
its molecular formula were researched. Pluviine was ruled out as a possibility, given that its ESI+ve
fragmentation pattern did not match that of the peak.101 Other possible compounds include
nangustine, obesine and pancracine, though their ESI+ve fragmentation patterns were unavailable for
comparison.
The peak at 1.50 min corresponds well with the ESI-MS/MS information of 11-hydroxyvittatine-N-
oxide 29 (Figure 9.2.3)97, showing good correlation with the fragments reported in the literature. An
interesting possibility to consider would be that this compound may be an N-oxide of bulbispermine
26, rather than one of 11-hydroxyvittatine 31a (Figure 9.2.5), given the presence of 26 in the extract.
However, no literature reports on bulbispermine-N-oxide are available, and so there is no evidence
available to support this notion.
The peak at 1.72 min with a molecular formula of C18H21NO5 could not be identified. This molecular
formula is shared by many Amaryllidaceae alkaloids, though of those with reported ESI+ve MS
fragmentation patterns, none were consistent with the fragments observed for this peak.
The peak at 2.15 min on the TIC is most likely that of 1-O-acetyllycorine 23. The reasoning for this
is as follows: the MS spectra of 1-O-acetyllycorine 23 and 2-O-acetyllycorine 22 differ in that 2-O-
acetyllycorine 22 does not produce mass fragments at 177 and 134 m/z, and the fragment at 147 m/z
produces a more intense peak than that from 1-O-acetyllycorine 23 (please see Table 8.17). The mass
spectrum of the eluent at 2.15 min (taken from the early-eluting edge of the peak) matches that of 1-
Stellenbosch University https://scholar.sun.ac.za

52
O-acetyllycorine 23 well, showing peaks at 177 and 134 m/z, and a less intense 147 m/z peak than
that from 2-O-acetyllycorine 22.
Interestingly, it seems as though 2-O-acetyllycorine 22 co-eluted with 1-O-acetyllycorine 23, though
22 eluted very slightly later, generating a peak for both compounds, which contained more of 22 at a
later retention time and more of 23 at an earlier retention time. The reason this is suggested is that
during the data analysis of this peak, the fragmentation spectrum of the later edge of the peak was
subtracted from that of the earlier edge (a function which is possible using Masslynx® software). The
result was a mass spectrum containing only a single fragment of m/z 134, which is a fragment present
in 1-O-acetyllycorine 23, but not in 2-O-acetyllycorine 22. This information supports the postulation
that 22 is present in the later edge and not the early edge. Additionally, a peak corresponding to 2-O-
acetyllycorine 22 was not present anywhere else on the TIC.
Eluting under the peak for (6-epi)haemanthidine (24, 25) at 2.24 min, was a peak with an [M+H]+
mass of 332. This was identified as criweline 27, as there were no other peaks matching the molecular
formula and fragmentation pattern of 27 in the TIC (the peaks at 1.72 and 2.97 min did not have
analogous fragmentation patterns). Unfortunately, the fragments could not be identified, as those of
(6-epi)haemanthidine 24, 25 were far more intense, and thus overshadowed those of the smaller peak
of m/z 332.
The peak eluting at 2.47 min with a molecular formula of C18H19NO6 corresponded to few
Amaryllidaceae alkaloids reported in the literature. Only candimine98 and tazettamide99 were
consistent with this molecular formula, based on literature searches. The fragment at m/z 316
represented the loss of CH2O from the [M+H]+ ion. This suggests the presence of a methylenedioxy-
group, though this is consistent with both structures. The major peak in the fragmentation spectrum
was that at m/z 226, This fragment is consistent with the loss of 120 mass units, corresponding to the
loss of three fragments, those being MeOH (from a methoxy substituent), CH2O (from a
methylenedioxy substituent), and CH3NCOH. The third of these is present as a substituent on
tazettamide,99 making it the more likely candidate.
The peak at 2.52 min had a molecular formula of C18H19NO5 and showed many peaks in common
with bulbispermine 26, which indicated a similar structure to 26, though with one acetylated hydroxy
group. The peak shared several mass fragments with those reported for 3-O-acetylhamayne (yeminine
A),100,102 which is an acetylated analogue of hamayne 31b, a stereoisomer of bulbispermine 26.
However, several mass fragments of the unknown compound were not present in the reported mass
spectrum of 3-O-acetylhamayne.100 The fragmentation pattern of the unknown compound was in
better agreement with that of a reported isomer of 3-O-acetylhamayne, though still showed some
Stellenbosch University https://scholar.sun.ac.za

53
peaks (m/z 196, 168) which were not reported for the aforementioned isomer.100 Given the presence
of bulbispermine 26 in the extract, it was suspected that the unknown compound was the 3-O-acetyl-
analogue thereof (theoretically 3-O-acetyl-bulbispermine).
The peak eluting at 2.65 min with a molecular formula of C18H19NO4 corresponded to three
compounds in the literature, namely 3-O-acetylvittatine, 3-O-acetylcrinine and 1-O-acetylcaranine.
3-O-acetylvittatine and 3-O-acetylcrinine were more likely, sharing structural skeletons with
bulbispermine 26. Fragmentation patterns for these compounds using electrospray ionisation were
unavailable, and so this unknown compound could not be confidently identified. However, some
fragments were shared with the EI-MS/MS fragments of 3-O-acetylvittatine103, adding further
credence to the possibility that this was the identity of the unknown compound. An interesting
consideration would be the possibility that this unknown is the theoretical 3-O-acetyl-epivittatine
(simply inverted stereochemistry of the 3-acetyl group of 3-O-acetylvittatine). The stereochemistry
of 3-O-acetyl-epivittatine would correspond more favourably with that of bulbispermine 26, which
has been shown to be present. However, 3-O-acetyl-epivittatine has not been previously reported in
the literature, and so there is no evidence available to support this notion.
The peak eluting at 2.97 min with a molecular formula of C18H21NO5 could not be matched with any
compounds for which the ESI-MS fragmentation information has been reported. However, the
presence of fragments at m/z 300 and 268 suggest the losses of MeOH and 2×MeOH respectively,
which may indicate the presence of two methoxy groups. The peak at 250 may represent the loss of
water thereafter, which could be an indication of a hydroxy group as well.
The peaks eluting at 3.34, 4.11 and 4.58 had unusual molecular formulae and fragmentation patterns,
and could not be matched to any known Amaryllidaceae alkaloids. The compounds in these peaks
appeared to be structurally similar, all producing abundant fragments at m/z 224 and 166, which are
rarely observed for ESI-MS/MS analyses of Amaryllidaceae alkaloids.96,97,100,101,104,105 These results
may indicate the presence of novel alkaloids, which could be of interest for future investigations.
The presence of two peaks corresponding perfectly in both molecular formula and fragmentation
pattern with lycorine was noted. A possible reason for this observation is the conversion of an
acetylated lycorine analogue into lycorine during the separation. The HPLC analysis was carried out
using a mobile phase containing formic acid, and the acidic conditions on the column may have
resulted in the hydrolysis of an acetate of lycorine. This may also be an alternative explanation for
the absence of a clear peak corresponding to 2-O-acetyllycorine 22 in the TIC.
Stellenbosch University https://scholar.sun.ac.za

54
Table 8.17 - The HRMS data for all isolated compounds from C. variabile.
Molecular Formula
(Mass difference/ppm)
[M+H]+
(m/z) (calc.) Fragments (m/z)
1 Lycorine 19 C16H17NO4 (1.7) 288.1241
(288.1236) 270, 252, 177, 147, 119, 91
2 1,2-O,O-diacetyllycorine 21 C20H21NO6 (0.0) 372.1447
(372.1447) 270, 252, 222, 194
3 2-O-acetyllycorine 22 C18H19NO5 (1.5) 330.1346
(330.1341) 270, 252, 222, 194, 147, 119
4 1-O-acetyllycorine 23 C18H19NO5 (1.5) 330.1346
(330.1341)
270, 252, 222, 194, 177, 147,
134, 119
5 Haemanthidine 24 (and 6-
epihaemanthidine 25) C17H19NO5 (1.6)
318.1346
(318.1341)
300, 286, 268, 250, 240, 227,
224, 211, 209, 199, 192, 181,
169, 165, 153, 141, 115
6 Bulbispermine 26 C16H17NO4 (0.7) 288.1238
(288.1236)
270, 244, 226, 224, 211, 196,
181, 153, 141, 115
7 Criwelline 27 C18H21NO5 (0.3) 332.1499
(332.1498) 314, 230 202, 181, 159, 153
8.3 General comments pertaining to the above processes
During the process of isolating components from CVAlk_EXT, the order of isolations was guided
by the Rf of components on silica TLC. Essentially, the component represented by a spot at the top
of the TLC profile was isolated first, followed by the spot directly below that, and so on and so forth.
As will have been noted in the introduction to this chapter, C. variabile has been the subject of only
one phytochemical study prior to this project.74 During the investigation, the presence of
galanthamine (20) in C. variabile was verified. Despite this finding, it must be noted that
galanthamine (20) was not isolated during this project. Tanahashi et al. (1990)74 determined a yield
of 0.006% from dried bulbs, which is a relatively low concentration of the alkaloid (6 mg per 100g
dried bulb). This value is, of course, not constant across all specimens of C. variabile, with alkaloidal
constituents of a single plant being dependant on a range of factors such as climatic conditions, time
of harvest, and several others. Thus, it cannot be expected that exactly the same concentration of
galanthamine 20 (or even any at all) would be present in the plant material used in this project.
The TIC acquired from LC-ESI-MS/MS analysis of CVAlkEXT showed no peaks containing the
mass components expected for galanthamine. None of the peaks present in the TIC provided the
molecular formula expected for galanthamine upon elemental composition analysis. The conclusion
to be drawn from this is that galanthamine was not present in the specimen used for this project,
despite the findings of Tanahashi et al. (1990)74.
Stellenbosch University https://scholar.sun.ac.za
55
When carrying out a gravity column or washing compounds off silica, solvent systems with methanol
composition higher than around 20% were generally avoided. The reason for this is that a white
residue was noted in fraction collection vessels when working with higher methanol content in mobile
phases. Thus, to avoid samples containing this residue (which would affect the masses acquired, and
thus the yields reported), methanol content was kept at 20% or below, as a general procedural
guideline.
Another precaution taken when working with PLC plates was exposure to air for long periods of time.
Given that compounds bound to silica have high surface area, exposure to air increases the risk of
oxidation. Thus, when plates were removed from the chamber after development, attempts were made
to limit their exposure time to only as long as was required for drying. If further development runs
were required, and could not be carried out immediately, plates were kept in a freezer at -18°C until
they could be further processed.
When washing compounds from silica scraped off PLC plates, filtration through a packed bed of
celite was useful as a means of ensuring no silica was washed into the filtrate. The celite was pre-
washed with the solvents to be used, so as to ensure that no celite was washed into the filtrate.
When it is stated that a 1H NMR spectrum showed impurities, the evidence for this in the spectrum
was generally the presence of smaller peaks at unexpected shifts, with integrals that did not correlate.
When an “impure” 1H NMR spectrum was acquired, the sample was purified further before 2D NMR
experiments were carried out, as these experiments were time consuming and thus expensive.
Observations such as “the sample showed a single spot under UV light and Dragendorff’s reagent”
were not taken as proof of a pure sample, but were used as a fairly reliable indicator, since the
Amaryllidaceae alkaloids are generally UV active, and Dragendorff’s reagent is selective for
alkaloids. Of course, the presence of non-alkaloidal constituents which were unresponsive to UV was
always a possibility when only a single spot was noted, but the extraction method minimised the risk
in this regard. Thus, a sample showing a single spot under both UV and Dragendorff’s reagent could
generally be taken as a tentative indicator that the sample contained an acceptably pure alkaloid.
8.4 Conclusions and future work
The isolation and complete characterisation of compounds 19, 21, 22, 23, 24&25, 26 and 27 was
successfully achieved. Unfortunately, all of these compounds have been previously reported, though
lycorine 19 was present in remarkably high concentrations in the bulbs of C. variabile. This could
prove useful as a production method for lycorine 19, which is of high interest for its multi-faceted
biological activity.
Stellenbosch University https://scholar.sun.ac.za

56
Of course, the exhaustive investigation of the compounds in a plant species is a tremendous task, and
this investigation did not result in the isolation of even all the alkaloidal constituents (as can be seen
by the HPLC-ESI-MS analysis of the extract). Thus, a task of interest for future research could be the
isolation of those compounds which could not be isolated or identified in this extract of C. variabile
bulbs. Use of HPLC-ESI-MS could prove very effective in identifying fractions containing previously
unknown compounds. The data acquired during this project could prove to be valuable for comparison
during such investigations.
Time constraints did not allow for the in-depth investigation of all the samples acquired during the
separation steps of this project. Some fractions which may have been of interest for further
investigation are as follows: C1_1-7 (though these fractions would contain relatively non-polar
compounds, and did not show much promise upon TLC analysis); the remaining C2 fractions, C2_1,2
and 4 (these were not investigated as there were no obvious targets for isolation, though further
investigation may reveal small quantities of additional alkaloids); C3.1 fractions (these fractions
contained a large portion of P1_10-12, and though CV3 was the main target during this project, TLC
analysis provided evidence of other components); C4_1-11 and 17-23 (these fractions contained some
of the more polar components of the extract, and despite the challenges faced while working with
such samples, there are likely alkaloids present which this project did not reveal).
Separation of the epimers of haemanthidine (24 and 25) could be achieved by generating analogues
which are more easily separated. A semi-synthetic investigation of this nature may reveal a simple
method of separation that could prove useful in this regard.
Acquisition of a haemanthidine 24 standard would allow for the comparison of MS fragments with
those of CV3, allowing for more conclusive results. Further investigations concerning the
fragmentation pattern acquired for CV3 may reveal fragmentation mechanisms which better explain
the observed peaks.
Previous studies have shown that the alkaloidal composition of the bulbs of a plant is not the same as
those of the leaves and roots.106 Thus, perhaps investigation of the other parts of this plant species
would be of interest.
Stellenbosch University https://scholar.sun.ac.za

57
9 Crinum paludosum
9.1 Introduction
Crinum paludosum produces white (sometimes light to deep pink) bell-shaped flowers and was first
described fairly recently in 1968. It was illustrated using a specimen grown in Limpopo, from a plant
originally found in Zululand.53 The species name paludosum refers to the marshy habitat in which the
species naturally occurs. It is found widely throughout
southern Africa, with known areas of distribution in
northern KwaZulu-Natal and Zululand, Gauteng, central
Namibia, Botswana, eastern Zimbabwe and western
Mozambique. C. paludosum is associated with seasonally
flooded pans, marshes, etc., with clay soil that dries to be
hard in the dry season. Due to the sparse and intermittent
rainfall in some of these areas, it has evolved to become
completely dormant in the dry season, sometimes
remaining so for over a decade until favourable
conditions are established.53 Cultivation methods have
been established, though susceptibility to fungal rot and
invasive caterpillars makes it somewhat challenging.53
To the best of our knowledge, there have been no
investigations focused on the alkaloidal constituents of C.
paludosum. Thus, this investigation will add some value
to the field. The aim of the investigation carried out on this species was not the isolation of novel
actives, but a time-efficient analysis of the alkaloidal constituents. It was also of interest, however, to
determine the concentration of lycorine 19 in the dry bulbs of the species, given the relatively high
concentration obtained from C. variabile, as discussed in the previous chapter.
Figure 9.1.1 – A botanical illustration of Crinum
paludosum, drawn by Barbara Jeppe, taken from “The
Amaryllidaceae of Southern Africa” by Graham
Duncan, Barbara Jeppe, and Leigh Voigt
Stellenbosch University https://scholar.sun.ac.za

58
9.2 Processing, results and discussion
9.2.1 Preparation and extraction
As with C. variabile, the bulbs of C. paludosum were obtained from a local nursery, and living
specimens are present in the Botanical Gardens at the University of Stellenbosch (33°56'09.3"S
18°51'56.9"E) as reference material. These specimens will be maintained, and dried voucher
specimens will be prepared from them in the case of their demise. The bulbs were sliced, dried in air
until constant mass was achieved, and stored in a freezer (−18°C) before further processing. The
resulting dried slices were crushed under liquid nitrogen to maximise the surface area for extraction.
The extraction of the C. paludosum bulb material began with acidic aqueous extraction of the
prepared bulb material. 100 g of the material was submerged under 300 mL of 1% H2SO4 in H2O.
This was stirred for 2 hours (pH remained acidic, as tested using litmus paper), after which the
material was strained and extracted once again in the same manner. A total of three extractions were
carried out in this way, and the aqueous portions were combined. The reasoning behind this was that
the acid present would protonate alkaloidal species, generating their sulphate salt forms, which would
be more soluble in water, given their ionic nature.
Following this, the total aqueous extract was basified (checked using litmus paper) with NaOH.
Theoretically, this will have generated the free-base forms of the alkaloids present, so that they could
be extracted from the aqueous layer using an organic solvent. It may be noted that extraction of the
acidic aqueous extract was not carried out before basification, as was done with C. variabile. This
step was omitted in the interest of preserving any alkaloidal constituents which may move into the
organic layer despite the acidic nature of the aqueous medium. Admittedly, the omission of this step
somewhat decreases the selectivity of the extraction. However, despite this, all alkaloidal constituents
would still be present in the extract, and the efficacy of the process remained robust.
Following basification, the aqueous solution was extracted with 250 mL of EtOAc. This was done
three times using a separatory funnel, and the EtOAc extracts were dried using MgSO4 and combined
to obtain an alkaloidal extract (CPAlk.EXT, 0.4874 g after drying under high vacuum). In order to
evaluate whether three EtOAc extractions was sufficient for the removal of the alkaloidal
constituents, a continuous liquid/liquid extraction with EtOAc was then carried out on the aqueous
layer (please see Appendix A for continuous liquid/liquid extraction apparatus). After 24 hours, an
EtOAc extract was obtained which, after drying, had a mass of 0.2064 g. This mass is significant,
suggesting that continuous liquid/liquid extraction is considerably more efficient than three
extractions in a separatory funnel when extracting alkaloids.
Stellenbosch University https://scholar.sun.ac.za

59
9.2.1.1 Isolation of lycorine 19
TLC analysis of CPAlk.EXT and the continuous liquid/liquid extract showed analogous alkaloidal
profiles, verifying the assumption that continuous extraction yielded more of the alkaloidal extract of
interest. Thus, both samples could be considered CPAlk.EXT aliquots. Of these aliquots, the one of
mass 0.4874 g was used for the isolation of lycorine, as was done with CVAlk.EXT in the previous
chapter. After the addition of methanol to the sample, a light-coloured solid did not dissolve. This
was filtered off and washed with cold MeOH to yield 112.5 mg of pure lycorine 19 (spectra were
identical to those shown in Appendix A for lycorine 19).
The total mass of lycorine 19 in CPAlk.EXT can be calculated using the total mass of CPAlk.EXT
(0.6938 g): total mass of lycorine 19 = 0.1125 ×0.6938
0.4874= 0.1601 g, which is 160.1 mg. This mass
is equivalent to a yield of 0.16% of the mass of dry bulbs used. This yield was not as high as that
noted from C. variabile, although this is not surprising, given the notably high concentration of
lycorine 19 present in the dried bulbs of C. variabile.
9.2.2 A brief LC-ESI-MS/MS dereplication study
Having isolated lycorine 19 in the interest of obtaining its yield from C. paludosum, a brief
dereplication study was carried out by HPLC-ESI-HRMS analysis of a small amount of CPAlk.EXT.
The sample was subjected to separation by HPLC under identical conditions to those used for
CVAlk.EXT, to allow for comparison of elution times with the identified alkaloidal components of
C. variabile. MS analysis was also carried out using identical parameters for trustworthy comparison
of fragmentation patterns. Below is shown the TIC acquired for this analysis (Figure 9.2.1).
Figure 9.2.1 – Base peak ion (BPI) TIC of HPLC-ESI-HRMS analysis of CPAlk.EXT.
Stellenbosch University https://scholar.sun.ac.za
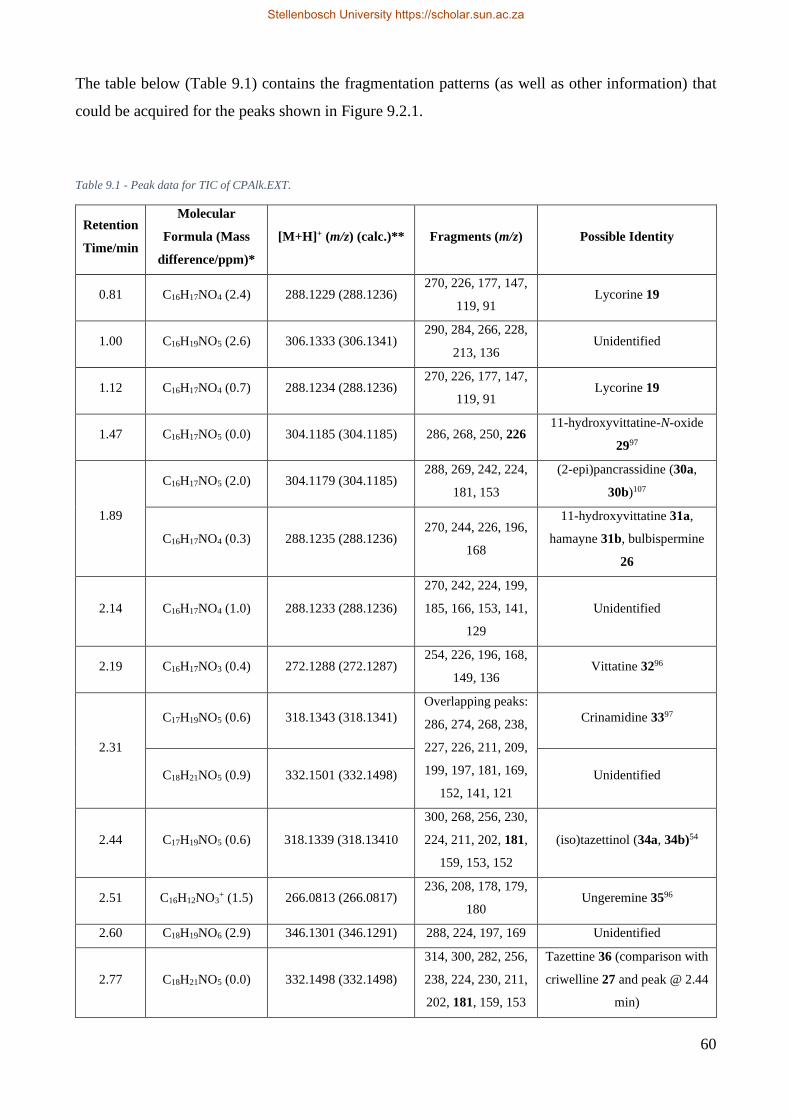
60
The table below (Table 9.1) contains the fragmentation patterns (as well as other information) that
could be acquired for the peaks shown in Figure 9.2.1.
Table 9.1 - Peak data for TIC of CPAlk.EXT.
Retention
Time/min
Molecular
Formula (Mass
difference/ppm)*
[M+H]+ (m/z) (calc.)** Fragments (m/z) Possible Identity
0.81 C16H17NO4 (2.4) 288.1229 (288.1236) 270, 226, 177, 147,
119, 91 Lycorine 19
1.00 C16H19NO5 (2.6) 306.1333 (306.1341) 290, 284, 266, 228,
213, 136 Unidentified
1.12 C16H17NO4 (0.7) 288.1234 (288.1236) 270, 226, 177, 147,
119, 91 Lycorine 19
1.47 C16H17NO5 (0.0) 304.1185 (304.1185) 286, 268, 250, 226 11-hydroxyvittatine-N-oxide
2997
1.89
C16H17NO5 (2.0) 304.1179 (304.1185) 288, 269, 242, 224,
181, 153
(2-epi)pancrassidine (30a,
30b)107
C16H17NO4 (0.3) 288.1235 (288.1236) 270, 244, 226, 196,
168
11-hydroxyvittatine 31a,
hamayne 31b, bulbispermine
26
2.14 C16H17NO4 (1.0) 288.1233 (288.1236)
270, 242, 224, 199,
185, 166, 153, 141,
129
Unidentified
2.19 C16H17NO3 (0.4) 272.1288 (272.1287) 254, 226, 196, 168,
149, 136 Vittatine 3296
2.31
C17H19NO5 (0.6) 318.1343 (318.1341)
Overlapping peaks:
286, 274, 268, 238,
227, 226, 211, 209,
199, 197, 181, 169,
152, 141, 121
Crinamidine 3397
C18H21NO5 (0.9) 332.1501 (332.1498) Unidentified
2.44 C17H19NO5 (0.6) 318.1339 (318.13410
300, 268, 256, 230,
224, 211, 202, 181,
159, 153, 152
(iso)tazettinol (34a, 34b)54
2.51 C16H12NO3+ (1.5) 266.0813 (266.0817)
236, 208, 178, 179,
180 Ungeremine 3596
2.60 C18H19NO6 (2.9) 346.1301 (346.1291) 288, 224, 197, 169 Unidentified
2.77 C18H21NO5 (0.0) 332.1498 (332.1498)
314, 300, 282, 256,
238, 224, 230, 211,
202, 181, 159, 153
Tazettine 36 (comparison with
criwelline 27 and peak @ 2.44
min)
Stellenbosch University https://scholar.sun.ac.za

61
3.59 C17H17NO3 (2.1) 284.1281 (284.1287) 147, 121, 119 3,4-anhydropowelline 3771
(low certainty)
3.73 C18H19NO4 (2.5) 314.1384 (314.1392) 336 (Na adduct),
177, 145, 117 Unidentified
4.14 C18H19NO6 (0.3) 346.1292 (346.1291) 368, 328, 271, 241,
239, 211, 181, 153
(+)-3α-hydroxy-6β-
acetylbulbispermine 38a104
4.58 C15H14NO2 (0.4) 240.1026 (240.1025) 224, 210, 182, 167,
139 Unidentified
5.00 C14H10O2 (0.9) 211.0761 (211.0759) 181, 153, 152 NON-ALKALOIDAL
*The difference in calculated mass and that obtained for the molecular ion. **The calculated mass for [M+H]+. Numbers in bold
represent base peak ions in cases where this is not the molecular ion.
The peak eluting at 1.00 min was not identified with much confidence, though the molecular formula
and the presence of the fragment at m/z 290 corresponded to lycoramine-N-oxide 28 (Figure 9.2.2).96
Some analogous peaks with the EI-MS/MS spectrum of lycoramine-N-oxide 28 were also noted,108
suggesting structural similarity.
Figure 9.2.2 - The chemical structure of lycoramine-N-oxide 28.
The peak at 1.47 min corresponds well with the known ESI-MS/MS information of 11-
hydroxyvittatine-N-oxide 29 (Figure 9.2.3),97 showing good correlation with the fragments and
molecular formula reported in the literature. The elution time of this compound is also in agreement
with that of a similarly identified peak in CVAlk.EXT (Table 8.16).
Figure 9.2.3 - Chemical structure of 11-hydroxyvittatine-N-oxide 29.
At 1.89 min, a peak eluted which contained two compounds. One of these, with molecular formula
C16H17NO5, showed good correlation to analogous EI-MS fragments reported for 2-epipancrassidine
30a (Figure 9.2.4) by Ghosal et al. (1989).107 Of course, the possibility that this compound is
pancrassidine 30b should be considered.
Stellenbosch University https://scholar.sun.ac.za
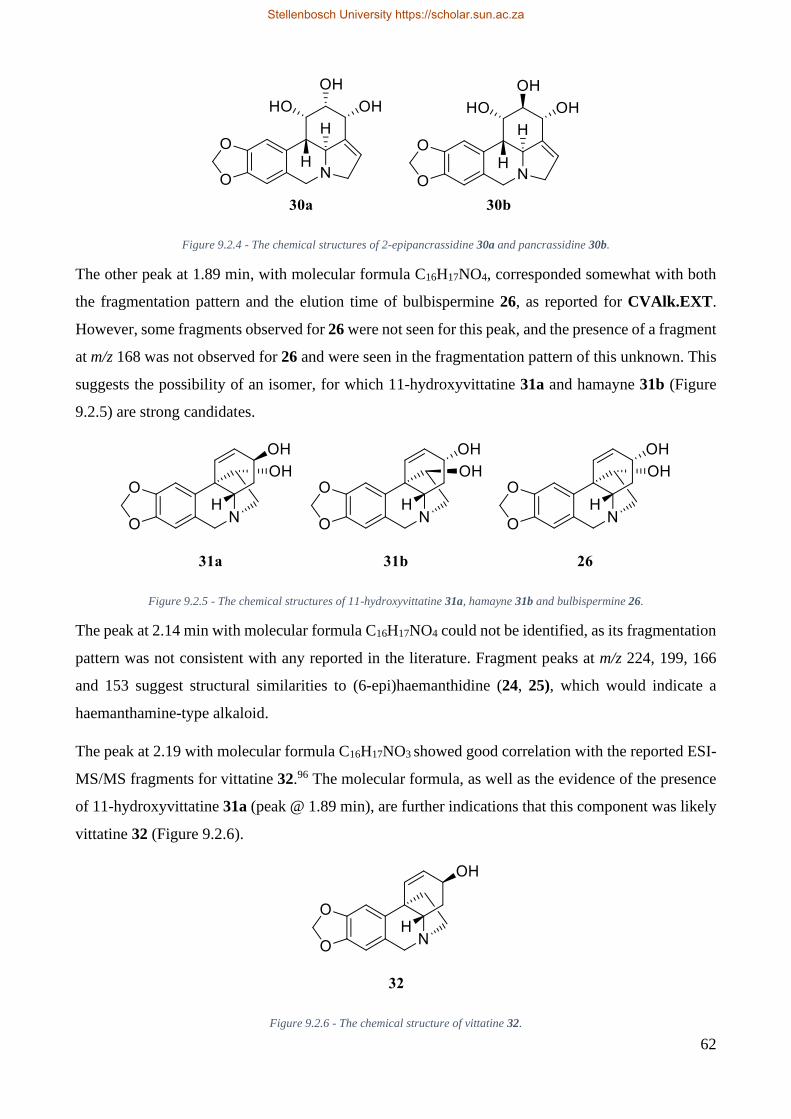
62
Figure 9.2.4 - The chemical structures of 2-epipancrassidine 30a and pancrassidine 30b.
The other peak at 1.89 min, with molecular formula C16H17NO4, corresponded somewhat with both
the fragmentation pattern and the elution time of bulbispermine 26, as reported for CVAlk.EXT.
However, some fragments observed for 26 were not seen for this peak, and the presence of a fragment
at m/z 168 was not observed for 26 and were seen in the fragmentation pattern of this unknown. This
suggests the possibility of an isomer, for which 11-hydroxyvittatine 31a and hamayne 31b (Figure
9.2.5) are strong candidates.
Figure 9.2.5 - The chemical structures of 11-hydroxyvittatine 31a, hamayne 31b and bulbispermine 26.
The peak at 2.14 min with molecular formula C16H17NO4 could not be identified, as its fragmentation
pattern was not consistent with any reported in the literature. Fragment peaks at m/z 224, 199, 166
and 153 suggest structural similarities to (6-epi)haemanthidine (24, 25), which would indicate a
haemanthamine-type alkaloid.
The peak at 2.19 with molecular formula C16H17NO3 showed good correlation with the reported ESI-
MS/MS fragments for vittatine 32.96 The molecular formula, as well as the evidence of the presence
of 11-hydroxyvittatine 31a (peak @ 1.89 min), are further indications that this component was likely
vittatine 32 (Figure 9.2.6).
Figure 9.2.6 - The chemical structure of vittatine 32.
Stellenbosch University https://scholar.sun.ac.za

63
At elution time 2.31 min, there is a peak which shows the masses for two components. The component
with molecular formula C17H19NO5 is most closely represented by crinamidine 33 (Figure 9.2.7),
which has a correlating molecular formula, as well as matching fragments in its ESI-MS/MS
spectrum.97 The component with molecular formula C18H21NO5 could not be matched with any
alkaloids for which the ESI-MS/MS data was available in the literature. However, the component
showed some analogous peaks to those of the EI-MS/MS fragments of tazettine 36 (Figure 9.2.10),109
which may indicate a tazettine-type alkaloid. This may be an unknown alkaloid and may be of interest
for further investigations.
Figure 9.2.7 - The chemical structure of crinamidine 33.
The peak at 2.44 min shows fragments remarkably similar to those of criwelline 27, though the
molecular formula suggests that instead of the 3-methoxy group, this compound has a 3-hydroxy
group. This corresponds to isotazettinol 34a (Figure 9.2.8).54 Of course, tazettinol 34b is also a strong
candidate, especially given the identification of tazettine 36 in the extract (peak @ 2.77 min)
Figure 9.2.8 - The chemical structures of isotazettinol 34a and tazettinol 34b.
Though perhaps not clearly visible in the TIC above (Figure 9.2.1), a component eluted at 2.51 min
which had a molecular formula of C16H12NO3+. The fragmentation pattern of this component
correlated with good agreement to that of ungeremine 35 (Figure 9.2.9) (This alkaloid appears to be
stable in an ionic form, and so the removal of a proton was not necessary when considering its
molecular formula), for which the ESI-MS fragmentation information is also reported.96
Stellenbosch University https://scholar.sun.ac.za
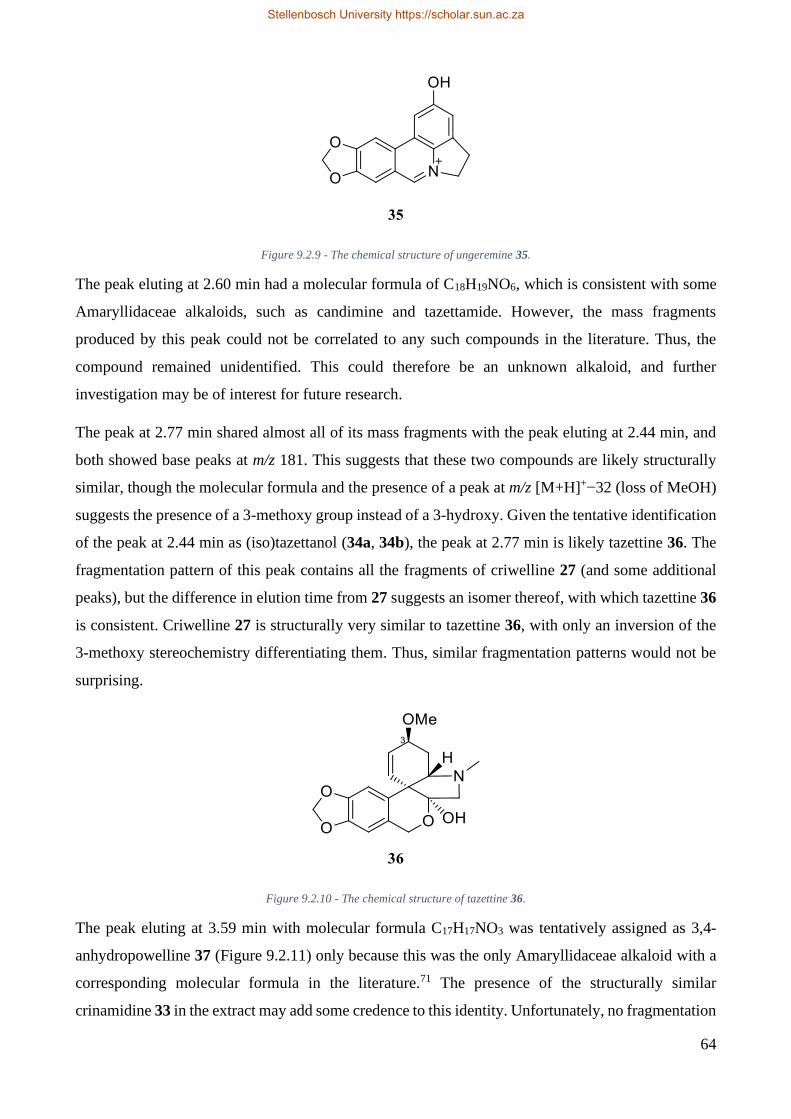
64
Figure 9.2.9 - The chemical structure of ungeremine 35.
The peak eluting at 2.60 min had a molecular formula of C18H19NO6, which is consistent with some
Amaryllidaceae alkaloids, such as candimine and tazettamide. However, the mass fragments
produced by this peak could not be correlated to any such compounds in the literature. Thus, the
compound remained unidentified. This could therefore be an unknown alkaloid, and further
investigation may be of interest for future research.
The peak at 2.77 min shared almost all of its mass fragments with the peak eluting at 2.44 min, and
both showed base peaks at m/z 181. This suggests that these two compounds are likely structurally
similar, though the molecular formula and the presence of a peak at m/z [M+H]+−32 (loss of MeOH)
suggests the presence of a 3-methoxy group instead of a 3-hydroxy. Given the tentative identification
of the peak at 2.44 min as (iso)tazettanol (34a, 34b), the peak at 2.77 min is likely tazettine 36. The
fragmentation pattern of this peak contains all the fragments of criwelline 27 (and some additional
peaks), but the difference in elution time from 27 suggests an isomer thereof, with which tazettine 36
is consistent. Criwelline 27 is structurally very similar to tazettine 36, with only an inversion of the
3-methoxy stereochemistry differentiating them. Thus, similar fragmentation patterns would not be
surprising.
Figure 9.2.10 - The chemical structure of tazettine 36.
The peak eluting at 3.59 min with molecular formula C17H17NO3 was tentatively assigned as 3,4-
anhydropowelline 37 (Figure 9.2.11) only because this was the only Amaryllidaceae alkaloid with a
corresponding molecular formula in the literature.71 The presence of the structurally similar
crinamidine 33 in the extract may add some credence to this identity. Unfortunately, no fragmentation
Stellenbosch University https://scholar.sun.ac.za

65
information for 3,4-anhydropowelline 37 was available for comparison, and so the assignment as
such is somewhat superficial.
Figure 9.2.11 - 3,4-anhydropowelline 37.
The peak eluting at 3.73 min had a molecular formula of C18H19NO4. This molecular formula
corresponded with O-acetylcaranine, and the presence of a peak at m/z 177 was shared with the
fragmentation pattern of lycorine (O-acetylcaranine is a lycorine-type alkaloid). Though these
observations may add some slight credence to the possibility that the peak was O-acetylcaranine, the
fragmentation pattern showed no analogous peaks to those reported for the EI-MS fragmentation of
O-acetylcaranine.110 Thus, no definitive assignment could be made for this compound. This
compound may be an unknown alkaloid and could be of interest for further investigation.
The peak eluting at 4.14 min contained a component which had the molecular formula C18H19NO6
and showed a fragmentation pattern which corresponded well to the reported ESI-MS/MS fragments
of (+)-3α-hydroxy-6β-acetylbulbispermine 38a (Figure 9.2.12).104 Given that there is evidence for
the presence of 11-hydroxyvittatine 31a in the extract (peak @ 1.89 min), the corresponding isomer
(theoretically 6β-acetyoxy-11-hydroxyvittatine 38b) should be considered as a possibility.
Figure 9.2.12 - The chemical structures of (+)-3α-hydroxy-6β-acetylbulbispermine 38a and the theoretical 6β-acetoxy-11-
hydroxyvittatine 38b.
The compound eluting at 4.58 min with a molecular formula of C15H14NO2 was not identified, but
was identical in both retention time and molecular formula to a peak observed in CVAlk.EXT.
The presence of a non-alkaloidal constituent (peak @ 5.00 min) can likely be explained by the
extraction process described at the beginning of this chapter. The omission of an organic extraction
of the acidic aqueous extract would mean that some non-alkaloidal constituents were not removed,
Stellenbosch University https://scholar.sun.ac.za
66
resulting in the presence of some non-alkaloidal compounds in the extract. Little can be said regarding
the structure of this compound, as the trends seen in the structures of Amaryllidaceae alkaloids cannot
be used as guidelines for non-alkaloidal constituents.
Finally, the presence of two peaks corresponding to the molecular formula and fragmentation pattern
of lycorine 19 was noted (peaks @ 0.81 and 1.12 min). As was suggested in the discussion of the
HPLC-ESI-MS/MS analysis of CVAlkEXT, this may be due to the conversion of a lycorine 19
derivative into 19 itself while on the column. The presence of formic acid in the mobile phase may
have resulted in the hydrolysis of an acetyl group, thus generating lycorine 19 from a closely related
compound, which could have then eluted at a different time to the lycorine 19 which was originally
present in the sample (due to the time taken for this conversion to occur. It must be noted that this
explanation is tentative, and further investigation would be required to confidently explain this result.
9.3 Conclusions and future work
The isolation of lycorine 19 was carried out, resulting in a yield of 0.16% from the mass of dried
bulbs used. The data acquired from the LC-ESI-MS/MS analysis of the alkaloidal extract of C.
paludosum (CPAlk.EXT) was used in a brief dereplication study to gain some insight regarding the
alkaloidal constituents of the species.
This research allowed for the tentative or partial identification of eleven alkaloids present in C.
plaudosum and offered some insight into structural aspects of four others. Five alkaloids could not be
identified from previous reports in literature, and each of these has some promise as a possibly novel
alkaloid. The pursuit of new compounds is beneficial to the field of medicinal chemistry, and so these
unidentified compounds may be targets of interest for further research in this area.
Important to note is that, despite the usefulness of the data obtained from mass spectrometric analysis,
the technique is not capable of unambiguous structural elucidation. It must therefore be kept in mind
that the assignments suggested during this study were tentative and cannot be reported with absolute
confidence. Despite this, the information provided is certainly sufficient to allow reasonable
assumptions to be made, and in some cases, even for a compound to be identified with a fair level of
certainty.
A clear possibility for future research endeavours would be the isolation of the alkaloids present in
C. paludosum, in the interest of confirming or disproving the suggested identities noted in this
chapter. Compounds which are previously undiscovered are of highest interest in this regard, and
even those compounds for which an identity has been suggested may prove to be novel (since some
identities were suggested based on close similarities with literature data, rather than identical results).
Stellenbosch University https://scholar.sun.ac.za

67
In conclusion, C. paludosum shows some promise for the discovery of novel compounds (including
those which are not alkaloids), and further investigation would be beneficial.
Stellenbosch University https://scholar.sun.ac.za

68
10 A Brief synthetic study on higginsianins A and B
10.1 Introduction
In a study by Evidente and colleagues (2016),73 two natural products compounds were isolated from
the fungus Colletotrichum higginsianum, and were named higginsianins A and B (39 and 40
respectively, Figure 10.1.1). The compounds both exhibited considerable antiproliferative activity
against the human glioma cancer cell line Hs683. Higginsianin A exhibited an IC50 value of 1 µM,
and higginsianin B one of 2 µM (these being concentrations required to inhibit cell growth by 50%
after 72 hours of incubation). The compounds also showed promising results against some other cell
lines, including a melanoma line (B16F10).73
Figure 10.1.1 - The chemical structures of higginsianin A 39 and higginsianin B 40. The atom numbers for higginsianin B reflect
those of higginsiainin A.
As was discussed in the background chapter, derivatisation of natural products has proven invaluable
in the field of drug discovery. Despite the inherent activity of the natural products compounds
isolated, drug-like properties (as well as activity) can be greatly improved by structural
alteration.37,40,41 As reported by Newman and Cragg (2016), of all the new approved drugs from 1981
to 2014, 21% were natural products derivatives.37 This highlights the importance of synthetic
modifications to natural products compounds in the search for new drugs.
Thus, as a synthetic accompaniment to the current natural products-focused project, it was decided
that a brief study would be done in which a few test reactions could be attempted on these two
compounds. The purpose of this study was the synthesis of some analogues of 39 and 40, with the
intent that the resulting compounds be tested for their bioactivity.
Stellenbosch University https://scholar.sun.ac.za
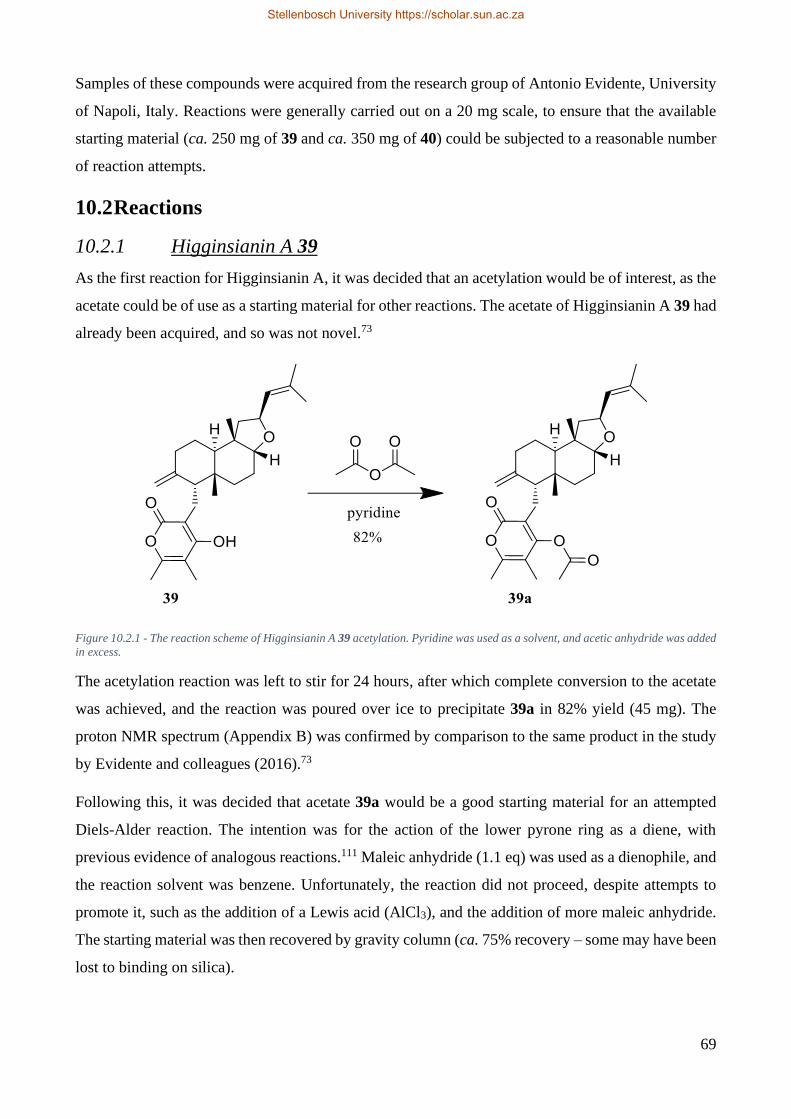
69
Samples of these compounds were acquired from the research group of Antonio Evidente, University
of Napoli, Italy. Reactions were generally carried out on a 20 mg scale, to ensure that the available
starting material (ca. 250 mg of 39 and ca. 350 mg of 40) could be subjected to a reasonable number
of reaction attempts.
10.2 Reactions
10.2.1 Higginsianin A 39
As the first reaction for Higginsianin A, it was decided that an acetylation would be of interest, as the
acetate could be of use as a starting material for other reactions. The acetate of Higginsianin A 39 had
already been acquired, and so was not novel.73
Figure 10.2.1 - The reaction scheme of Higginsianin A 39 acetylation. Pyridine was used as a solvent, and acetic anhydride was added
in excess.
The acetylation reaction was left to stir for 24 hours, after which complete conversion to the acetate
was achieved, and the reaction was poured over ice to precipitate 39a in 82% yield (45 mg). The
proton NMR spectrum (Appendix B) was confirmed by comparison to the same product in the study
by Evidente and colleagues (2016).73
Following this, it was decided that acetate 39a would be a good starting material for an attempted
Diels-Alder reaction. The intention was for the action of the lower pyrone ring as a diene, with
previous evidence of analogous reactions.111 Maleic anhydride (1.1 eq) was used as a dienophile, and
the reaction solvent was benzene. Unfortunately, the reaction did not proceed, despite attempts to
promote it, such as the addition of a Lewis acid (AlCl3), and the addition of more maleic anhydride.
The starting material was then recovered by gravity column (ca. 75% recovery – some may have been
lost to binding on silica).
Stellenbosch University https://scholar.sun.ac.za
70
Acetate 39a was also used as a starting material for an attempted epoxidation reaction using meta-
chloroperbenzoic acid (m-CPBA) and DCM as a solvent. The reaction did not proceed, and heating
to 30°C for ca. 48 hours still resulted in recovery of the starting material (ca. 90% recovery –
recovered by extraction).
Following this, hydrogenation of the double bonds of higginsianin A 39 was attempted using 10%
palladium on carbon under positive H2 pressure. The reaction was attempted using dry MeOH as the
solvent, and a balloon of H2 gas to provide a positive pressure. Unfortunately, this reaction gave rise
to a mixture of many products, and the small quantity of each did not allow for isolation and
characterisation of any primary products.
A bromination reaction was then attempted using 39, making use of N-bromosuccinimide (NBS) (1
eq.) and a catalytic amount of azobisisobutyronitrile (AIBN – a radical initiator) in DCM. The
reaction was carried out under allylic bromination conditions, and resulted in full conversion of the
starting material into two closely eluting compounds after 6 hours. Initially, an attempt was made to
separate these two compounds by preparative TLC. However, the TLC resulted in a mixture of many
compounds, suggesting degradation of the products on the silica plate. The reaction was then
repeated, and the benzoic acid side product (from the m-CPBA starting material) removed by washing
with sodium bicarbonate solution. A 1H NMR spectrum was then acquired of the product mixture
after drying of the organic layer. Another 1H NMR spectrum was acquired two days later, having left
the tube at room temperature (RT), and exposed to ambient light. The second spectrum showed that
the compounds had once more degraded. These results led to the assumption that the products were
either thermo- or photo-sensitive.
Thus, the reaction was repeated a third time, keeping tinfoil over the reaction vessel to avoid light
exposure. The products were isolated by extraction once again, and the NMR spectroscopic sample
prepared from the resulting dried organic layer was kept in the fridge, wrapped in tinfoil.
Characterisation of the product mixture by 1H, 13C and 2D NMR spectroscopic experiments (HSQC,
HMBC, COSY, DEPT) (Appendix B) led to the identification of the products shown in the scheme
below:
Stellenbosch University https://scholar.sun.ac.za

71
Figure 10.2.2 - Reaction scheme of NBS bromination of higginsianin A 39.
The reasoning behind the identification of these products is as follows: Bromination does not occur
at position 13, as the H-12 and H-13 peaks remain unaffected in the 1H NMR spectrum for the product
mixture. In the resulting 1H NMR spectrum, the peak representing H-18 (3H) was split from a singlet
in the starting material into two singlets in the product mixture. Bromination at the C-4 position of
39 would result in deshielding of the protons on C-18 (electron withdrawing nature of bromine). Thus,
the more downfield of the two H-18 singlets represented that for 39c. The relative integrals of these
two singlets suggested that approximately 40% of the 39 had been brominated at the C-4 position,
and 60% had been brominated at the C-2 position. Shifts of the H-19 peaks also suggested a mixture
of two products, as the original two peaks were split into four. The relative integrals of these peaks
suggested similar product ratios as those discussed above.
Separation of 39b-d (brominated products) was not carried out, due to time constraints not allowing
the navigation of the difficulties associated with separating sensitive compounds. Both products are,
however, novel compounds (though their medicinal promise may be challenged by their proclivity to
degradation).
Stellenbosch University https://scholar.sun.ac.za

72
10.2.2 Higginsianin B 40
As with higginsianin A 39, the first reaction carried out for this compound was an acetylation reaction.
This reaction was carried out in reagent grade chloroform, with excess pyridine and acetic anhydride.
The reaction was monitored by TLC analysis, and the reaction was stopped once all the starting
material had been consumed. At this point, two product spots were visible, and were isolated by
washing the organic layer with 1M HCl, followed by brine. After drying of the organic layer, the two
products were separated on by PLC and isolated for NMR spectroscopic analysis. The two
compounds acquired (40a, 49.3%, 29.5 mg and 40b, 35.2%, 19.3 mg) were subjected to 1H and 13C
NMR spectroscopic and HRMS analyses (Appendix B), and were identified as 8,22-O,O-
diacetylhigginsianin B 40a and 22-O-acetylhigginsianin B 40b. The scheme below shows the
resulting compounds (HRMS analysis supports the identification of the products as those shown).
Figure 10.2.3 - Reaction scheme of the acetylation of Higginsianin B 40.
Comparing the 1H NMR spectra of the starting material 40 and the products 40a and 40b (Figure
10.2.4), a shift of proton 8 only occurs in the spectrum of the diacetylated product 40a. This suggests
that acetylation occurs preferentially on the hydroxy of the lower ring. A shift of one of the protons
at the 19- position occurs in the spectra of both products, further supporting this hypothesis.
Additionally, the peaks corresponding to H-20 were also affected in both products (which adds
credence to the notion that acetylation occurred at the 22-hydroxy in both products). Furthermore, the
appearance of additional methyl peaks in the product spectra are further evidence of the formation of
the suggested products. Neither of these acetates were synthesised in the original study by Evidente
and co-workers (2016),73 and so both are novel compounds.
Stellenbosch University https://scholar.sun.ac.za

73
Figure 10.2.4 – Comparison of 1H proton spectra for 40, 40a, and 40b.
Following this, an oxidation of higginsianin B 40 was attempted using pyridinium chlorochromate
(PCC). A common problem faced when using PCC is that the by-products form “clumps”, which can
trap solid reagents, reducing surface area and slowing the reaction, as well as making the workup
challenging.112 In order to solve this, the PCC was ground with a small amount of silica before using
it in the reaction. The resulting fine yellow powder dispersed effectively in the reaction solvent. The
expected product was one in which the secondary alcohol of higginsianin B 40 was transformed to a
ketone. Unfortunately, the result of this reaction was a mixture of compounds that could not be
identified due to the small quantities present.
An ozonolysis of higginsianin B 40 was also attempted, using MeOH and DCM as solvents, and an
acetone/dry ice slurry to maintain a cold temperature (−78°C) during ozone saturation. Me2S (4 eq.)
was used to reductively work up. The reaction mixture was kept under oxygen or ozone throughout
the length of the reaction, and so following the reaction progress with TLC analysis was not possible.
TLC analysis of the resulting product mixture revealed a complex mixture. Attempts were made to
gain further insight using HRMS, but this provided no useful information, as only species of
significantly lower molecular weight than the starting material were observed, suggesting
Stellenbosch University https://scholar.sun.ac.za

74
degradation. (m/z 335, 345, 361 were acquired as masses of resulting components, suggesting
degradation to smaller compounds, as the mass of the starting material was 428.6 u).
As with higginsianin A 39, a reductive hydrogenation using palladium on carbon (Pd/C – 10%) was
attempted on higginsianin B 40. This reaction produced a promising TLC profile after reaction in dry
MeOH for 72 hours. The reaction mixture was prepared as a crude NMR spectroscopy sample, which
unfortunately degraded (supposedly due to the acidic nature of CDCl3) before separation or
characterisation were attempted. Time constraints did not allow for the repetition of this reaction, but
given that the reaction proceeded, producing what appeared to be two spots on TLC (Figure 10.2.5),
this reaction is promising for future investigation.
Figure 10.2.5 - TLC profile of reaction with 40 and Pd/C at 72 hours.
The crude 1H NMR spectrum (Appendix B) of the hydrogenation product mixture shows large shifts
of peaks for H-19 and H-13, which supports the reaction scheme shown in Figure 10.2.6, as
hydrogenation of the double bonds at these positions would result in protection of these protons,
causing upfield shifts into the aliphatic range. The presence of two spots on TLC suggests two
products, and the appearance of a quartet at δ4.13 ppm in the 1H NMR spectrum of the product
mixture suggests the possibility of hydrogenation of the double bond at C-23 on the lower ring (Figure
10.2.6). This would indicate 40d as a product, in which case H-24 may produce the aforementioned
quartet (deshielding by the adjacent electron withdrawing oxygen atom may be the reason for the
higher chemical shift value).
Stellenbosch University https://scholar.sun.ac.za

75
Figure 10.2.6 - Reaction of higginsianin B 40 with Pd/C.
Epoxidation of higginsianin B 40 using m-CPBA was then attempted in DCM. The reaction
proceeded slowly, and solubility of the starting material in DCM was sparing. However, after
approximately 50 hours of stirring at room temperature, all the solid material had dissolved, and full
conversion to a single spot on TLC was noted after 72 hours. Crude 1H NMR spectroscopic analysis
(Appendix B) showed shifts of protons at position 19, which would support the scheme shown below
(Figure 10.2.7). No shift was observed for H-13, suggesting that epoxidation did not occur at this
position. Unfortunately, time constraints (and other circumstances) did not allow for purification of
the product and full characterisation, though this would be an obvious step for further investigations.
Figure 10.2.7 - Reaction of higginsianin B 40 with m-CPBA.
10.3 Conclusions and future work
This study resulted in the generation of 22-O-acetylhigginsianin A 39a, though this analogue had
been previously reported.73 Also produced was a mixture of bromination products of 39, though full
characterisation of these was not achieved. Other reactions attempted on 39 included: PCC oxidation,
Stellenbosch University https://scholar.sun.ac.za

76
epoxidation with m-CPBA, diels alder with maleic anhydride, and hydrogenation of double bonds
with Pd/C. However, these reactions proved unsuccessful, either yielding starting material, or a
mixture of products which could not be characterised.
From Higginsianin B 40 was produced 8,22-O,O-diacetylhigginsianin B 40a and 22-O-
acetylhigginsianin B 40b, both novel analogues. Oxidation with PCC and ozonolysis of 40 were
attempted, though these reactions were unsuccessful, producing mixtures of compounds which could
not be characterised. Reductive hydrogenation of 40 using Pd/C produced promising results, though
degradation of the product(s) in CDCl3 meant that full characterisation could not be achieved. Lastly,
epoxidation of 40 using m-CPBA resulted in a single apparent product when analysed by TLC. Some
structural aspects could be inferred by crude NMR spectroscopic analysis, though time constraints
did not allow for full characterisation. Of course, full characterisation of all products making use of
2D NMR spectroscopy should be carried out to complete these studies.
This study was only preliminary, providing only a small number of analogues. Thus, development of
a more extensive library of derivatives is a key objective for future work. Additionally, biological
testing of the acquired derivatives is imperative, in the interest of developing SARs for higginsianins
A and B (39 and 40), as well as for the discovery of novel active compounds.
In conclusion, the work presented above provides some useful information for the investigation of 39
and 40 as drug leads, as well as some novel compounds for biological testing. However, far more
extensive research in this area is needed for more meaningful conclusions to be drawn, and for SARs
to be elucidated.
Stellenbosch University https://scholar.sun.ac.za

77
11 Methods and materials
All chemicals were purchased from Sigma Aldrich or Merck. All 1H, 13C and 2D nuclear magnetic
resonance spectra were obtained using a 300 MHz (75.5 MHz for 13C), 400 MHz (100 MHz for 13C)
or 600 MHz (150 MHz for 13C) Varian VNMRS using deuterated solvents.
11.1 Crinum variabile
Optical rotations were obtained on a Perkin Elmer 343 Polarimeter at 20 °C.
All chromatographic columns were prepared with a cotton wool plug at the base to minimise elution
of unwanted solids (though columns with glass frits were invariably used).
All PLC plates were of dimensions 20×20 cm and bands were visualised under UV light (254 nm
wavelength). When isolating the compounds present in bands, silica was crushed to allow for
effective washing.
Spots on TLC plates were visualised under UV light (254 nm wavelength), as well as using
Dragendorff’s reagent (prepared according to standard procedure). TLC plates used during the elution
of a column were analytical grade aluminium-backed (Merck, high performance analytical TLC, 5
cm length, F254). TLC plates used for profiling of extracts and solvent system optimisation were glass-
backed (Merck, silica gel 60, 0.25 mm film thickness, 10 cm length, F254).
11.1.1 Separation experiments
11.1.1.1 P1
CVAlk.EXT.F (2.469 g) was dissolved in MeOH and loaded onto coarse silica (Merck, silica gel 60,
0.063-0.200 mm), and placed under high vacuum to dry. P1 was prepared in a glass column (42 mm
internal diameter (i.d.)), with a cotton plug at the base, followed by silica gel (25 g) (Merck, silica gel
60, 230-400 mesh). An additional layer of cotton wool was placed above this, followed by the dried
and loaded CVAlk.EXT.F.
P1 was then eluted , in 700 mL volumes, with: 100% hexane, 10% EtOAc in hexane (EtOAc/hex),
20% EtOAc/hex, 30% EtOAc/hex, 40% EtOAc/hex, 50% EtOAc/hex, 60% EtOAc/hex, 70%
EtOAc/hex, 80% EtOAc/hex, 90% EtOAc/hex, 100% EtOAc, 2.5% MeOH/EtOAc, 5%
MeOH/EtOAc, 10% MeOH/EtOAc, 15% MeOH/EtOAc, 20% MeOH/EtOAc, 100%DCM, 2.5%
MeOH/DCM, 10% MeOH/DCM, 20% MeOH/DCM, EtOAc:MeOH:H2O (78.2:20:1.8),
EtOAc:MeOH:H2O (76.4:20:3.6), EtOAc:MeOH:H2O (74.6:20:5.4), EtOAc:MeOH:H2O
(72.5:20:7.5), EtOAc:MeOH:H2O (70:20:10), 100% MeOH.
Stellenbosch University https://scholar.sun.ac.za

78
Each of these eluents was collected as a single fraction of P1, resulting in 26 fractions (P1_1-26).
TLC analysis of these fractions (Figure 8.2.2) was carried out using EtOAc:MeOH:H2O (85:10:5) on
a glass-backed TLC plate (Merck, silica gel 60, 0.25 mm film thickness, 20×20 cm, F254). The plate
was pre-dried in an 80°C oven.
11.1.1.2 C1
50 g silica (Merck, silica 60, 230-400 mesh) was equilibrated in 100% hexane and poured into a 20
mm diameter glass column. P1_1-6 (348 mg) was loaded onto 1.4 g silica gel (Merck, silica 60, 230-
400 mesh), and dried under high vacuum before being added to the top of C1.
C1 was then eluted with: 100% hexane (70 mL), 1% EtOAc/hex (250 mL), 5% EtOAc/hex (250 mL),
10% EtOAc/hex (250 mL), 20% EtOAc/hex (250 mL), 30% EtOAc/hex (1250 mL), 50% EtOAc/hex
(500 mL), 60% EtOAc/hex (250 mL), 70% EtOAc/hex (500 mL).
The eluent was collected in 15 mL fractions, which were analysed by TLC during elution, based on
which fractions were combined into ten groups (C1_1-10). Compound 21 (221 mg) was isolated
during elution of 30% EtOAc in hexane, which is the reason for the increased elution volume using
this solvent (only once all of the compound had eluted was the solvent composition altered further).
11.1.1.3 C1.1
50 g silica (Merck, silica 60, 230-400 mesh) was equilibrated in 100% DCM and poured into a 20
mm diameter glass column. C1_9 (53.1 mg) was sonicated in DCM (ca. 10 mL) and wet loaded onto
C1.1.
C1.1 was eluted in 250 mL volumes with: 100% DCM, 1% MeOH/DCM, 2% MeOH/DCM, 3%
MeOH/DCM, 4% MeOH/DCM, 5% MeOH/DCM.
15 mL fractions were collected and grouped based on TLC profile into 5 groups (C1.1_1-5).
Compound 22 (45.2 mg) was isolated as C1.1_3.
11.1.1.4 C2
45 g silica (Merck, silica 60, 230-400 mesh) was equilibrated in 100% EtOAc and poured into a 20
mm diameter glass column. P1_7-9 (286.2 mg) was loaded onto 1.2 g silica (Merck, silica 60, 230-
400 mesh), and added to the top of C2.
C2 was eluted using a single isocratic mobile phase of 100% EtOAc. 15 mL fraction were collected
and, based on TLC analysis, were grouped into four fraction groups C2_1-4. The component of
interest was noted in the third of these fraction groups, which was further processed on PP0.
Stellenbosch University https://scholar.sun.ac.za

79
11.1.1.5 PP0
C2_3 (224 mg) was dissolved in MeOH and streaked onto the baseline of two PLC plates (Merck,
silica gel 60, 1 mm film thickness, F254). These PLC plates were developed simultaneously in 100%
EtOAc seven times, to yield three bands (PP0_1-3). The compound was removed from each of these
bands by scraping off the silica and washing with 20% MeOH in EtOAc. The component of interest
(compound 23) was noted by TLC analysis to be the sole constituent of PP0_2 (178.5 mg).
11.1.1.6 PP1
S1 (297.7 mg) was acquired by trituration of P1_10-12 with MeOH. 100 mg of S1 was dissolved in
a minimum amount of MeOH (some H2O added to assist), and was streaked onto a PLC plate (Merck,
silica gel 60, 1 mm film thickness, F254). After drying, the plate was developed once in EtOAc:MeOH,
H2O (85:10:5), showing two clearly visible bands (PP1_1-2). The top band (PP1_1, 44.8 mg)
produced a 1H NMR spectrum correlating to that of CV3 (Appendix A) and was further processed on
C3. The lower band (PP1_2, 42.4 mg) correlated by TLC to lycorine, and was kept aside.
11.1.1.7 C3
21 g silica (Merck, silica 60, 230-400 mesh) was equilibrated in 100% DCM and poured into a glass
column (1 cm diameter). PP1_1 was dissolved in DCM and wet loaded onto the surface of C3.
C3 was eluted using the following solvent systems: 5% MeOH/DCM (1000 mL), 10% MeOH/DCM
(750 mL).
20 mL fractions were collected and grouped based on TLC analysis into three fraction groups (C3_1-
3). Only fractions showing a single spot under both UV and Dragendorff’s reagent were placed
grouped together (C3_2, 20.8 mg), and the sample was labelled CV3.
11.1.1.8 C3.1
This column was carried out with the aim of purifying the CV3 present in the mother liquor of S1
(P1_10-12 remaining after trituration, ca. 800 mg).
100 g silica (Merck, silica 60, 230-400 mesh) was equilibrated in 100% EtOAc and poured into a
glass column (4 cm diameter). The remaining P1_10-12 was loaded onto silica, and C3.1 was eluted
with: 100% EtOAc (2500 mL), 1% MeOH/EtOAc (1500 mL), 2% MeOH/EtOAc (2250 mL), 4%
MeOH/EtOAc (2000 mL), 10% MeOH/EtOAc (1750 mL), EtOAc:MeOH:H2O (85:10:5), 100%
MeOH (750 mL).
20 mL fractions were collected and combined into five fraction groups (C3.1_1-5) based on TLC
profile. C3.1_4 (658 mg) contained CV3 as the major component (though this was impure – TLC
analysis showed the presence of lycorine 19).
Stellenbosch University https://scholar.sun.ac.za

80
11.1.1.9 C4
180 g silica (Merck, silica 60, 230-400 mesh) was equilibrated in 100% DCM and poured into a glass
column (4 cm diameter). P1_13-26 (ca. 760 mg) was loaded onto silica and added to the top of C4.
C4 was eluted with: 100% DCM (500 mL), 0.5% MeOH/DCM (500 mL), 1% MeOH/DCM (500
mL), 1.5% MeOH/DCM (500 mL), 2% MeOH/DCM (500 mL), 2.5% MeOH/DCM (250 mL), 3%
MeOH/DCM (250 mL), 4% MeOH/DCM (250 mL), 5% MeOH/DCM (250 mL), 6% MeOH/DCM
(250 mL), 7% MeOH/DCM (250 mL), 8% MeOH/DCM (250 mL), 10% MeOH/DCM (250 mL),
12% MeOH/DCM (250 mL), 15% MeOH/DCM (1750 mL), 20% MeOH/DCM (1000 mL), 30%
MeOH/DCM (1250 mL), 50% MeOH/DCM (1000 mL). 100% MeOH (750 mL), 10% acetic acid in
MeOH (250 mL).
15 mL fractions were collected and, based on TLC analysis, were combined into 26 fraction groups
(C4_1-26).
11.1.1.10 PP2
C4_12-16 (211 mg) was dissolved in MeOH and streaked onto a PLC plate (Merck, silica gel 60, 2
mm film thickness, F254). PP2 was developed three times in EtOAc:MeOH:H2O (85:10:5), resulting
in the visualisation of four bands (PP2_1-4). These bands were scraped off and washed with 20%
MeOH in EtOAc to isolate the compounds. PP2_2 was processed further on PP3, and PP2_3-4 was
processed further on PP4.
11.1.1.11 PP3
PP2_2 (66.7 mg) was dissolved in MeOH and streaked onto a PLC plate (Merck, silica gel 60, 1 mm
film thickness, F254). PP3 was developed once in EtOAc:MeOH:H2O (85:10:5), resulting in five
bands (PP3_1-5). PP3_3 (45.5 mg) was the most intense band, with the others showing little response
to UV light (254 nm). PP3_3 was identified as compound 26. Masses of the other bands were not
recorded.
11.1.1.12 PP4
PP2_3-4 (53.4 mg) was dissolved in MeOH and streaked onto a PLC plate (Merck, silica gel 60, 1
mm film thickness, F254). PP4 was developed three times in CHCl3:EtOAc:MeOH (2:2:1), resulting
in three bands (PP4_1-3). PP4_2 was processed further on C5.
11.1.1.13 C5
10 g of alumina (Sigma Aldrich, active neutral, 150 mesh) was equilibrated in 100% EtOAc, and
PP4_2 (19.1 mg) loaded onto 0.5 g alumina (as above) was added on top of C5.
Stellenbosch University https://scholar.sun.ac.za

81
C5 was eluted with: 100% EtOAc (750 mL – until all of compound of interest had eluted), 1%
MeOH/EtOAc (25 mL), 2%MeOH/EtOAc (25 mL), 4% MeOH/EtOAc (25 mL), 6% MeOH/EtOAc
(25 mL), 8% MeOH/EtOAc (25mL), 10% MeOH/EtOAc (150 mL), 15% MeOH/EtOAc (125 mL),
20% MeOH/EtOAc (100 mL), 100% MeOH (350 mL).
7 mL fractions were collected and grouped according to TLC profile into two fraction groups. C5_1
contained pure compound 27 (6.4 mg), and C5_2 contained all compounds which eluted after that.
11.1.2 HPLC-MS/MS of CVAlk.EXT
Sample preparation: A small quantity of the sample (ca. 2 mg) was dissolved in 1 mL of analytical
grade MeOH and filtered through a 0.2 µm syringe filter. Any necessary concentration corrections
were made by dilution before analysis.
UPLC conditions: The UPLC system consisted of ACQUITY Ultra High-Performance LC system
(Waters, Milford, MA, USA) and software MassLynx v4.1. Separation of Amaryllidaceae alkaloids
was carried out on a Waters HSS T3 column, 2.1x100mm. Solvent A: Water (0.1% formic acid),
Solvent B: Acetonitrile (0.1% formic acid). Gradient (linear programme) as follows: 0.0-0.50 min,
90%; 2.00 min, 70%; 5.50 min, 40%; 6.60 min, 10%; 6.70-10.00 min, 90% of A. Flow rate was 0.380
mL/min and injection volume was 1 µL.
ESI-MS/MS conditions: MS/MS analysis was performed on a Synapt-G2 High Definition Mass
Spectrometer equipped with an ESI source (Waters, Milford, MA, USA) and Masslynx v4.1.
Parameters as follows: polarity ES+ , capillary voltage 2.5 kV, sampling cone 15 V, extraction cone
4V, source temp. 120 °C, cone gas flow 50 L/h, desolvation temp. 275 °C, desolvation gas flow 650
L/h, Helium call gas flow 180 mL/min, trap gas flow 0.4 mL/min, trap collision energy 15 eV, ion
energy 1.8 eV.
11.2 Crinum paludosum
11.2.1 HPLC-MS/MS of CPAlk.EXT
Sample preparation: A small quantity of the sample (ca. 2 mg) was dissolved in 1 mL of analytical
grade MeOH and filtered through a 0.2 µm syringe filter. Any necessary concentration corrections
were made by dilution before analysis.
UPLC conditions: The UPLC system consisted of ACQUITY Ultra High-Performance LC system
(Waters, Milford, MA, USA) and software MassLynx v4.1. Separation of Amaryllidaceae alkaloids
was carried out on a Waters HSS T3 column, 2.1x100mm. Solvent A: Water (0.1% formic acid),
Solvent B: Acetonitrile (0.1% formic acid). Gradient (linear programme) as follows: 0.0-0.50 min,
Stellenbosch University https://scholar.sun.ac.za

82
90%; 2.00 min, 70%; 5.50 min, 40%; 6.60 min, 10%; 6.70-10.00 min, 90% of A. Flow rate was 0.380
mL/min and injection volume was 1 µL.
ESI-MS/MS conditions: MS/MS analysis was performed on a Synapt-G2 High Definition Mass
Spectrometer equipped with an ESI probe (Waters, Milford, MA, USA) and Masslynx v4.1.
Parameters as follows: polarity ES+ , capillary voltage 2.5 kV, sampling cone 15 V, extraction cone
4V, source temp. 120 °C, cone gas flow 50 L/h, desolvation temp. 275 °C, desolvation gas flow 650
L/h, Helium call gas flow 180 mL/min, trap gas flow 0.4 mL/min, trap collision energy 15 eV, ion
energy 1.8 eV.
11.3 Higginsianins A and B
11.3.1 Higginsianin A 39
11.3.1.1 Acetylation of Higginsianin A 39
To a solution of 39 (50 mg, 1.17×10⁻⁴ mols) in pyridine (5 mL) was added acetic anhydride (5 mL)
while stirring. The reaction mixture was stirred for 24 hrs, then poured over ice to precipitate the
acetate product (22-O-acetylhigginsianin A 39a, 45 mg, 81.9%), which was removed by filtration.
Purification by gravity column was carried out on silica gel (Merck, silica 60, 230-400 mesh) using
a gradient of EtOAc in hexane. Comparison of the 1H NMR spectrum to that reported in literature
confirmed the identity.73
11.3.1.2 Reaction of 39a with maleic anhydride
To a solution of 39a (20 mg, 4.27×10⁻⁵ mols) in pre-distilled benzene (ca. 10 mL) was added maleic
anhydride (1.1 eq.), and the reaction mixture was left under reflux for 5 hrs. TLC showed starting
material, and so additional 5 mg of maleic anhydride was added. No change noted on TLC after an
additional hour, and so a catalytic amount (ca. 1 mg) of AlCl3 was added. After an additional hour,
no change was noted, and the reaction was stopped and starting material recovered by gravity column.
11.3.1.3 Reaction of 39a with m-CPBA
Solid reagents (39a, 20 mg, 4.27×10⁻⁵ mols; m-CPBA, 1 eq.) were added to DCM (ca. 10 mL) and
stirred for 5 hrs at −10 °C. No reaction occurred based on TLC analysis, and the reaction mixture was
concentrated under reduced pressure to ca. 2 mL, and stirred at room temperature (RT) for a further
72 hrs. No reaction occurred after this time, and the reaction was heated to 30 °C and stirred for a
further 45 hrs, after which no reaction had occurred, and the reaction was stopped. Starting material
was recovered by extraction with sodium bicarbonate, followed by drying of the organic layer and
solvent removal.
Stellenbosch University https://scholar.sun.ac.za

83
11.3.1.4 Reductive hydrogenation of 39 with Pd/C
Solid reagents (39, 20 mg, 4.69×10⁻⁵ mols; Pd/C (10% Pd), cat.) were added to dry MeOH (3 mL),
and stirred at RT under positive H2 pressure for ca. 6 hrs, after which the reaction mixture was filtered
and the solvent removed under reduced pressure. The result was a mixture of products which were
not characterised.
11.3.1.5 Reaction of 39 with NBS
Solid reagents (39, 20 mg, 4.69×10⁻⁵ mols; NBS, 8.3 mg, 1 eq.; AIBN, cat.) were placed in the bottom
of a reaction vessel, and 1 mL of dry DCM was added to this. The reaction mixture was kept in the
dark and stirred for 7 hrs at RT. The reaction mixture was then washed with sodium bicarbonate
solution, the organic layer dried with MgSO4, and the solvent removed under reduced pressure
(exposure to light was minimised where possible by covering vessels in tinfoil). NMR spectroscopic
sample was wrapped in tinfoil and kept in the fridge (4 °C) before analysis. The result was a mixture
of products as discussed above (see Appendix B for crude NMR spectra).
11.3.2 Higginsianin B 40
11.3.2.1 Acetylation of Higginsianin B 40
Higginsianin B 40 (50 mg, 1.17×10⁻⁴ mols) was dissolved in CHCl3 (2 mL) and pyridine (0.5 mL)
mixture (CHCl3 did not adequately dissolve 40). This was added to a reaction vessel which had been
purged with N2, followed by acetic anhydride (0.5 mL). The reaction mixture was stirred under N2
atmosphere at RT for 40 hrs. The reaction mixture was then diluted with DCM, washed with water
(3×20 mL), 1 M HCl (3×20 mL), and finally brine (1×20 mL), after which the organic layer was dried
with MgSO4 and the solvent removed under reduced pressure. The resulting products were separated
by TLC (2 plates, Merck, silica gel 60, 0.25 mm film thickness, F254, 20×20 cm), developed three
times in 10% EtOAc/hexane. Please see Appendix B for 1H NMR and 13C NMR spectra of the two
products. Though full characterisation of the products was not carried out, evidence in the 1H NMR
spectrum showed the production of the expected products, as discussed in chapter 8.2.2.
11.3.2.2 Reaction of 40 with PCC
PCC (15 mg, 6.96×10⁻⁵ mols) was crushed with a spatula tip of silica in a mortar and pestle. This,
along with 40 (20 mg, 4.67×10⁻⁵ mols), was added to a reaction vessel, which was purged with N2.
Dry DCM (3 mL) was then added under positive N2 pressure. The reaction vessel was then sealed
and left to stir for 3.5 hrs at RT. Reaction was stopped by filtration through celite to remove all solid
reagents, and the solvent was removed from the filtrate. The result was a mixture of compounds which
were not characterised.
Stellenbosch University https://scholar.sun.ac.za

84
11.3.2.3 Ozonolysis of 40
40 (30 mg, 7.0×10⁻⁵ mols) was added to dry MeOH (5 mL) in a 100 mL round bottom flask. Dry
DCM (20 mL) was then added, along with a stir bar. This mixture was placed in a slurry of acetone
and dry ice (−78 °C) while stirring. Once the mixture had been left to cool to this temperature, oxygen
was bubbled through the mixture, followed by ozone (charge on ozone generator turned on to initiate
ozone flow). Ozone was bubbled through for 15 min, to allow saturation (solution went blue after ca.
5 min). Following this, oxygen was once more bubbled through until the solution was clear. Positive
N2 pressure was then quickly applied (upon removal of O2 supply), and the cold bath was removed.
Me2S (4 eq.) was then added under positive N2 pressure, and the reaction mixture was left to cool to
RT while stirring. The solvent was then removed under reduced pressure. The result was a mixture
of products which were not characterised.
11.3.2.4 Reductive hydrogenation of 40 with Pd/C
Solid reagents (40, 20 mg, 4.67×10⁻⁵ mols; Pd/C (10% Pd), cat.) were added to dry MeOH (3 mL),
and stirred at RT under positive H2 pressure for ca. 72 hrs, after which the reaction mixture was
filtered and the solvent removed under reduced pressure. The result was a single spot on TLC, though
crude 1H NMR spectroscopy suggested two possible products, which degraded in CDCl3 after crude
NMR spectroscopic analysis (see Appendix B for crude NMR spectra).
11.3.2.5 Reaction of 40 with m-CPBA
Solid reagents (40, 20 mg, 4.67×10⁻⁵ mols; m-CPBA, 2.4 eq.) were added to a reaction vessel, which
was then purged with N2. Dry DCM (2 mL) was then added under positive N2 pressure, the vessel
was sealed, and the mixture was stirred at RT for 72 hrs. Work-up was carried out by addition of
DCM (ca. 15 mL) to the reaction mixture, followed by washing with saturated sodium bicarbonate
solution, drying of the organic layer with MgSO4, and removal of the solvent under reduced pressure
to obtain the crude product. This showed a single spot on TLC, and was subjected to 1H NMR analysis
(see Appendix B for crude NMR spectra), with the intention of purification and full characterisation,
though circumstances did not allow for this.
Stellenbosch University https://scholar.sun.ac.za

85
12 Acknowledgements
Big thanks to Prof Green for his continued support and availability, both in the lab and out.
Prof. Willem van Otterlo for his efforts as supervisor.
Prof. André de Villiers for his assistance as co-supervisor.
Jaco and Elsa at NMR spectroscopy facilities for their assistance in acquiring NMR spectra.
Maritjie Stander and her colleagues at CAF for their assistance in acquiring HPLC-ESI-MS/MS data.
GOMOC (Group of Medicinal and Organic Chemists) research group.
Lab colleagues in lab 2020/2021.
Debbie, Nulunthu, Raymond and Max for their assistance as technical staff
The financial assistance of the National Research Foundation (NRF) towards this research is hereby
acknowledged. Opinions expressed and conclusions arrived at, are those of the author and are not
necessarily to be attributed to the NRF.
Stellenbosch University Faculty of Science, Department of Chemistry and Polymer Science for
equipment, chemicals, and other facilities.
My parents, for the upbringing and the genes.
Moscos, Khaya, Chris, Trégen, James, Jaco, Lydia and all other friends and colleagues present
throughout.
Loren
Stellenbosch University https://scholar.sun.ac.za

86
13 References
1 A. L. Harvey, Drug Discovery Today, 2008, 13, 894–901.
2 R. A. Halberstein, Ann. Epidemiol., 2005, 15, 686–699.
3 M. A. Huffman, Am. J. Phys. Anthropol., 1997, 40, 171–200.
4 M. Baker, Am. J. Primatol., 1996, 38, 263–270.
5 R. S. Solecki, Science, 1975, 190, 880–881.
6 W. Sneader, Drug Discovery: A History, John Wiley & Sons, Ltd, Chichester, West Sussex,
2005.
7 G. M. Cragg and D. J. Newman, Pure Appl. Chem., 2005, 77, 7–24.
8 J. F. Nunn, Ancient Egyptian Medicine, British Museum Press, London, 1996.
9 A. Arber, Herbals: Their Origin and Evolution - a Chapter in the History of Botany,
Cambridge University Press, Cambridge, 1912.
10 I. Milne, J. R. Soc. Med., 2012, 105, 503–508.
11 J. H. Baron, Nutr. Rev., 2009, 67, 315–332.
12 J. Drobnik and E. Drobnik, Fitoterapia, 2016, 115, 155–164.
13 F. W. Serturner, Trommsdorffs J. der Pharm., 1805, 14, 47–98.
14 G. Samuelsson, Drugs of Natural Origin: a Textbook of Pharmacognosy, Apotekarsocieteten,
Stockholm, Sweden, 6th edn., 2004.
15 F. W. Serturner, J. Pharm. fur Aerzte und Apotheker, 1806, 14, 47–93.
16 E. Ravina, The Evolution of Drug Discovery : From Traditional Medicines to Modern Drugs,
Wiley-VCH, Weinheim, 2011.
17 A. P. Klockgether-Radke, Anasthesiol. Intensivmed. Notfallmed. Schmerzther., 2002, 37, 244–
249.
18 F. Khosrow-Khavar, S. Kurteva, Y. Cui, K. B. Filion and A. Douros, Expert Opin. Drug Metab.
Toxicol., 2019, 15, 565–575.
19 I. Badash, C. G. Lui, K. Hur, J. R. Acevedo, E. H. Ference and B. B. Wrobel, Laryngoscope,
2019, 1–6.
Stellenbosch University https://scholar.sun.ac.za

87
20 S. Nielsen, R. Crossin, M. Middleton, C. Martin, J. Wilson, T. Lam, D. Scott, K. Smith and D.
Lubman, BMJ Open, 2019, 9, 1–9.
21 C. C. Presley and C. W. Lindsley, ACS Chem. Neurosci., 2018, 9, 2503–2518.
22 H. Kunz, Arch. Pharm. , 1887, 225, 461–479.
23 M. Karamanou, Curr. Pharm. Des., 2018, 24, 654–658.
24 J. Pelletier and B. Caventou, J. Ann Chim, 1820, 15, 289.
25 P. Śramska, A. Maciejka, A. Topolewska, P. Stepnowski and Ł. P. Haliński, J. Chromatogr.
B, 2017, 1043, 202–208.
26 R. A. Goldstein, C. DesLauriers, A. Burda and K. Johnson-Arbor, Semin. Diagn. Pathol., 2009,
26, 10–17.
27 M. Goerig, D. Bacon and A. van Zundert, Reg. Anesth. Pain Med., 2012, 37, 318–324.
28 M. B. Roberfroid, Br. J. Nutr., 2005, 93, S13–S25.
29 H. Haas, Am. J. Med., 1983, 75, 1–3.
30 V. Podwyssotski, Arch. Exp. Pathol. Pharmakol., 1880, 13, 29–52.
31 M. Guerram, Z.-Z. Jiang and L.-Y. Zhang, Chin. J. Nat. Med., 2012, 10, 161–169.
32 C. Canel, R. M. Moraes, F. E. Dayan and D. Ferreira, Phytochemistry, 2000, 54, 115–120.
33 X. Zhang, K. P. Rakesh, C. S. Shantharam, H. M. Manukumar, A. M. Asiri, H. M. Marwani
and H.-L. Qin, Bioorg. Med. Chem., 2018, 26, 340–355.
34 E. K. Rowinsky and R. C. Donehower, N. Engl. J. Med., 1995, 332, 1004–1014.
35 A. G. Atanasov, B. Waltenberger, E.-M. Pferschy-Wenzig, T. Linder, C. Wawrosch, P. Uhrin,
V. Temml, L. Wang, S. Schwaiger, E. H. Heiss, J. M. Rollinger, D. Schuster, J. M. Breuss, V.
Bochkov, M. D. Mihovilovic, B. Kopp, R. Bauer, V. M. Dirsch and H. Stuppner, Biotechnol.
Adv., 2015, 33, 1582–1614.
36 N. Thomford, D. Senthebane, A. Rowe, D. Munro, P. Seele, A. Maroyi and K. Dzobo, Int. J.
Mol. Sci., 2018, 19, 1578.
37 D. J. Newman and G. M. Cragg, J. Nat. Prod., 2016, 79, 629–661.
38 B. David, J.-L. Wolfender and D. A. Dias, Phytochem. Rev., 2015, 14, 299–315.
Stellenbosch University https://scholar.sun.ac.za
88
39 C.-T. Che and H. Zhang, Int. J. Mol. Sci., 2019, 20, 830.
40 D. J. Newman, G. M. Cragg and D. G. I. Kingston, in The Practice of Medicinal Chemistry,
Elsevier, Cambridge MA, 4th edn., 2015, pp. 101–139.
41 E. Patridge, P. Gareiss, M. S. Kinch and D. Hoyer, Drug Discovery Today, 2016, 21, 204–207.
42 G. Tan, C. Gyllenhaal and D. Soejarto, Curr. Drug Targets, 2006, 7, 265–277.
43 Z. Jin and G. Yao, Nat. Prod. Rep., 2019, 36, 1462–1488.
44 A. Alvin, K. I. Miller and B. A. Neilan, Microbiol. Res., 2014, 169, 483–495.
45 J. le Roux, The Biodiversity of South Africa 2002 - Indicators, Trends and Human Impacts,
Struik Publishers, Cape Town, 2002.
46 M. Cherry, PLoS Biol., 2005, 3, e145.
47 C. W. Fennell and J. van Staden, J. Ethnopharmacol., 2001, 78, 15–26.
48 J. Refaat, M. S. Kamel, M. A. Ramadan and A. A. Ali, Int. J. Pharm. Sci. Res., 2013, 4, 1239–
1252.
49 A. Cimmino, M. Masi, M. Evidente, S. Superchi and A. Evidente, Chirality, 2017, 29, 486–
499.
50 F. Viladomat, J. Bastida, C. Codina, J. J. Nair and W. E. Campbell, Nat. Prod. Commun.
51 Z. Jin, Nat. Prod. Rep., 2016, 33, 606–614.
52 Ç. Karakoyun, M. Masi, A. Cimmino, M. A. Önür, N. U. Somer, A. Kornienko and A.
Evidente, Nat. Prod. Commun., 2019, 14, 1–6.
53 G. Duncan, B. Jeppe and L. Voigt, The Amaryllidaceae of Southern Africa, Umdaus Press,
Pretoria, 2016.
54 Z. Jin and X.-H. Xu, in Natural Products - Phytochemistry, Botany and Metabolism of
Alkaloids, Phenolics and Terpenes, eds. K. G. Ramawat and J. M. Merillon, Springer-Verlag
Berlin Heidelberg, 1st edn., 2013, pp. 479–514.
55 R. Gotti, J. Fiori, M. Bartolini and V. Cavrini, J. Pharm. Biomed. Anal., 2006, 42, 17–24.
56 M. Šafratová, A. Hostalková, D. Hulcová, K. Breiterová, V. Hrabcová, M. Machado, D.
Fontinha, M. Prudêncio, J. Kuneš, J. Chlebek, D. Jun, M. Hrabinová, L. Nováková, R. Havelek,
M. Seifrtová, L. Opletal and L. Cahlíková, Arch. Pharm. Res., 2018, 41, 208–218.
Stellenbosch University https://scholar.sun.ac.za

89
57 N. Vaněčková, A. Hošt’álková, M. Šafratová, J. Kuneš, D. Hulcová, M. Hrabinová, I.
Doskočil, Š. Štěpánková, L. Opletal, L. Nováková, D. Jun, J. Chlebek and L. Cahlíková, RSC
Adv., 2016, 6, 80114–80120.
58 N. Cortes, R. A. Posada-duque, R. Alvarez, F. Alzate, S. Berkov, G. P. Cardona-gómez and E.
Osorio, Life Sci., 2015, 122, 42–50.
59 A. Evidente and A. Kornienko, Phytochem. Rev., 2009, 8, 449–459.
60 A. Evidente, A. S. Kireev, A. R. Jenkins, A. E. Romero, W. F. A. Steelant, S. Van Slambrouck
and A. Kornienko, Planta Med., 2009, 75, 501–507.
61 M. Roy, L. Liang, X. Xiao, P. Feng, M. Ye and J. Liu, Biomed. Pharmacother., 2018, 107,
615–624.
62 J. J. Nair, J. Bastida, C. Codina, F. Viladomat and J. van Staden, Nat. Prod. Commun., 2013,
8, 1335–1350.
63 D. Lamoral-Theys, C. Decaestecker, V. Mathieu, J. Dubois, A. Kornienko, R. Kiss, A.
Evidente and L. Pottier, Mini-Reviews Med. Chem., 2010, 10, 41–50.
64 S. G. Ghane, U. A. Attar, P. B. Yadav and M. M. Lekhak, Ind. Crops Prod., 2018, 125, 168–
177.
65 P. Zhang, M. Zhang, D. Yu, W. Liu, L. Hu, B. Zhang, Q. Zhou and Z. Cao, J. Cell. Physiol.,
2019, 234, 10566–10575.
66 Y. Sun, P. Wu, Y. Sun, F. S. Sharopov, Q. Yang, F. Chen, P. Wang and Z. Liang, Biochem.
Biophys. Res. Commun., 2018, 495, 911–921.
67 J. J. Sramek, E. J. Frackiewicz and N. R. Cutler, Expert Opin. Investig. Drugs, 2000, 9, 2393–
2402.
68 P. V. Fish, D. Steadman, E. D. Bayle and P. Whiting, Bioorg. Med. Chem. Lett., 2019, 29,
125–133.
69 J. Refaat, M. S. Kamel, M. A. Ramadan and A. A. Ali, Int. J. Pharm. Sci. Res., 2012, 3, 1883–
1890.
70 J. Refaat, M. S. Kamel, M. A. Ramadan and A. A. Ali, Int. J. Pharm. Sci. Res., 2012, 3, 3630–
3638.
71 J. Refaat, M. S. Kamel, M. A. Ramadan and A. A. Ali, Int. J. Pharm. Sci. Res., 2013, 4, 1239–
Stellenbosch University https://scholar.sun.ac.za

90
1252.
72 S. M. Colegate and R. J. Molyneux, Eds., Bioactive Natural Products: Detection, Isolation
and Structural Determination, CRC Press, Boca Raton, 2nd edn., 2008.
73 A. Cimmino, V. Mathieu, M. Masi, R. Baroncelli, A. Boari, G. Pescitelli, M. Ferderin, R. Lisy,
M. Evidente, A. Tuzi, M. C. Zonno, A. Kornienko, R. Kiss and A. Evidente, J. Nat. Prod.,
2016, 79, 116–125.
74 T. Tanahashi, A. Poulev and M. Zenk, Planta Med., 1990, 56, 77–81.
75 A. K. Jäger, A. Adsersen and C. W. Fennell, S. Afr. J. Bot., 2004, 70, 323–325.
76 K. Likhitwitayawuid, C. K. Angerhofer, H. Chai, J. M. Pezzuto, G. A. Cordell and N.
Ruangrungsi, J. Nat. Prod., 1993, 56, 1331–1338.
77 W. E. Campbell, J. J. Nair, D. W. Gammon, J. Bastida, C. Codina, F. Viladomat, P. J. Smith
and C. F. Albrecht, Planta Med., 1998, 64, 91–93.
78 J. Razafimbelo, M. Andriantsiferana, G. Baudouin and F. Tillequin, Phytochemistry, 1996, 41,
323–326.
79 G. S. Citoglu, B. S. Yilmaz and O. Bahadir, Chem. Nat. Compd., 2008, 44, 826–828.
80 G. I. Kaya, D. Cicek, B. Sarıkaya, M. A. Onur and N. U. Somer, Nat. Prod. Commun., 2010,
5, 873–876.
81 A. Evidente, I. Iasiello and G. Randazzo, J. Chromatogr. A, 1983, 281, 362–366.
82 O. B. Abdel-Halim, T. Morikawa, S. Ando, H. Matsuda and M. Yoshikawa, J. Nat. Prod.,
2004, 67, 1119–1124.
83 D. Lamoral-Theys, A. Andolfi, G. Van Goietsenoven, A. Cimmino, B. Le Calvé, N. Wauthoz,
V. Mégalizzi, T. Gras, C. Bruyère, J. Dubois, V. Mathieu, A. Kornienko, R. Kiss and A.
Evidente, J. Med. Chem., 2009, 52, 6244–6256.
84 W. C. Wildman and C. J. Kaufman, J. Am. Chem. Soc., 1954, 76, 5815–5816.
85 Y. Toriizuka, E. Kinoshita, N. Kogure, M. Kitajima, A. Ishiyama, K. Otoguro, H. Yamada, S.
Omura and H. Takayama, Bioorg. Med. Chem., 2008, 16, 10182–10189.
86 W. A. Ayer and G. C. Kasitu, Can. J. Chem., 1989, 67, 1077–1086.
87 J. Bastida, R. Lavilla and F. Viladomat, in The Alkaloids: Chemistry and Biology, ed. G. A.
Cordell, Elsevier Academic Press, Cambridge MA, 2006, vol. 63, pp. 87–179.
Stellenbosch University https://scholar.sun.ac.za
91
88 T. Nishimata and M. Mori, J. Org. Chem., 1998, 63, 7586–7587.
89 V. Pabuççuoglu, P. Richomme, T. Gözler, B. Kivçak, A. Freyer and M. Shamma, J. Nat. Prod.,
1989, 52, 785–791.
90 G. Luchetti, R. Johnston, V. Mathieu, F. Lefranc, K. Hayden, A. Andolfi, D. Lamoral-Theys,
M. R. Reisenauer, C. Champion, S. C. Pelly, W. A. L. van Otterlo, I. V Magedov, R. Kiss, A.
Evidente, S. Rogelj and A. Kornienko, ChemMedChem, 2012, 7, 815–822.
91 A. Ali, M. Ramadan and A. Frahm, Planta Med., 1984, 50, 424–427.
92 A. Evidente, J. Nat. Prod., 1986, 49, 168–169.
93 M. Ochi, H. Otsuki and K. Nagao, Bull. Chim. Soc. Japan, 1976, 49, 3363–3364.
94 H. Hauth and D. Stauffacher, Helv. Chim. Acta, 1964, 47, 185–194.
95 J. H. Rigby, A. Cavezza and M. J. Heeg, J. Am. Chem. Soc., 1998, 120, 3664–3670.
96 D. Katoch, S. Kumar, N. Kumar and B. Singh, J. Pharm. Biomed. Anal., 2012, 71, 187–192.
97 Y. Tian, C. Zhang, M. Guo and M. Iriti, Molecules, 2015, 20, 21854–21869.
98 R. B. Giordani, J. P. De Andrade, H. Verli, J. H. Dutilh, A. T. Henriques, S. Berkov, J. Bastida
and J. A. S. Zuanazzi, Magn. Reson. Chem., 2011, 49, 668–672.
99 E. Shawky, A. H. Abou-Donia, F. A. Darwish, S. M. Toaima, S. S. Takla, N. B. Pigni and J.
Bastida, Chem. Biodivers., 2015, 12, 1184–1199.
100 X. Zhang, H. Huang, X. Liang, H. Huang, W. Dai, Y. Shen, S. Yan and W. Zhang, Rapid
Commun. Mass Spectrom., 2009, 23, 2903–2916.
101 A. Ptak, A. El Tahchy, F. Dupire, M. Boisbrun, M. Henry, Y. Chapleur, M. Mós and D.
Laurain-Mattar, J. Nat. Prod., 2009, 72, 142–147.
102 Y. Endo, Y. Sugiura, M. Funasaki, H. Kagechika, M. Ishibashi and A. Ohsaki, J. Nat. Med.,
2019, 73, 648–652.
103 L. R. Tallini, J. P. de Andrade, M. Kaiser, F. Viladomat, J. J. Nair, J. A. S. Zuanazzi and J.
Bastida, Molecules, 2017, 22, 1–12.
104 G. L. Chen, Y. Q. Tian, J. L. Wu, N. Li and M. Q. Guo, Sci. Rep., 2016, 6, 1–10.
105 G. Chen, Y. Tian and M. Guo, Rapid Commun. Mass Spectrom., 2016, 30, 95–99.
106 N. Thi Ngoc Tram, T. V. Titorenkova, V. S. Bankova, N. V. Handjieva and S. S. Popov,
Stellenbosch University https://scholar.sun.ac.za

92
Fitoterapia, 2002, 73, 183–208.
107 S. Ghosal, S. Unnikrishnan and S. K. Singh, Phytochemistry, 1989, 28, 2535–2537.
108 S. Kobayashi, K. Satoh, A. Numata, T. Shingu and M. Kihara, Phytochemistry, 1991, 30, 675–
677.
109 F. M. Zhang, Y. Q. Tu, J. D. Liu, X. H. Fan, L. Shi, X. D. Hu, S. H. Wang and Y. Q. Zhang,
Tetrahedron, 2006, 62, 9446–9455.
110 S. Berkov, A. Pavlov, M. Ilieva, M. Burrus, S. Popov and M. Stanilova, Phytochem. Anal.,
2005, 16, 98–103.
111 I. E. Mark, G. R. Evans and J. Declercq, Tetrahedron, 1994, 50, 4557–4574.
112 S. V. Ley and A. Madin, in Comprehensive Organic Synthesis: Second Edition, eds. B. M.
Trost and I. Flemming, Elsevier Science Ltd., London, 2nd edn., 1991, vol. 7, pp. 251–289.
Stellenbosch University https://scholar.sun.ac.za

93
Alkaloidal constituents of Crinum variabile
and Crinum paludosum, two southern
African Amaryllidaceae species
Kim Henry Steyn
Supplementary Information - Appendices
Stellenbosch University https://scholar.sun.ac.za
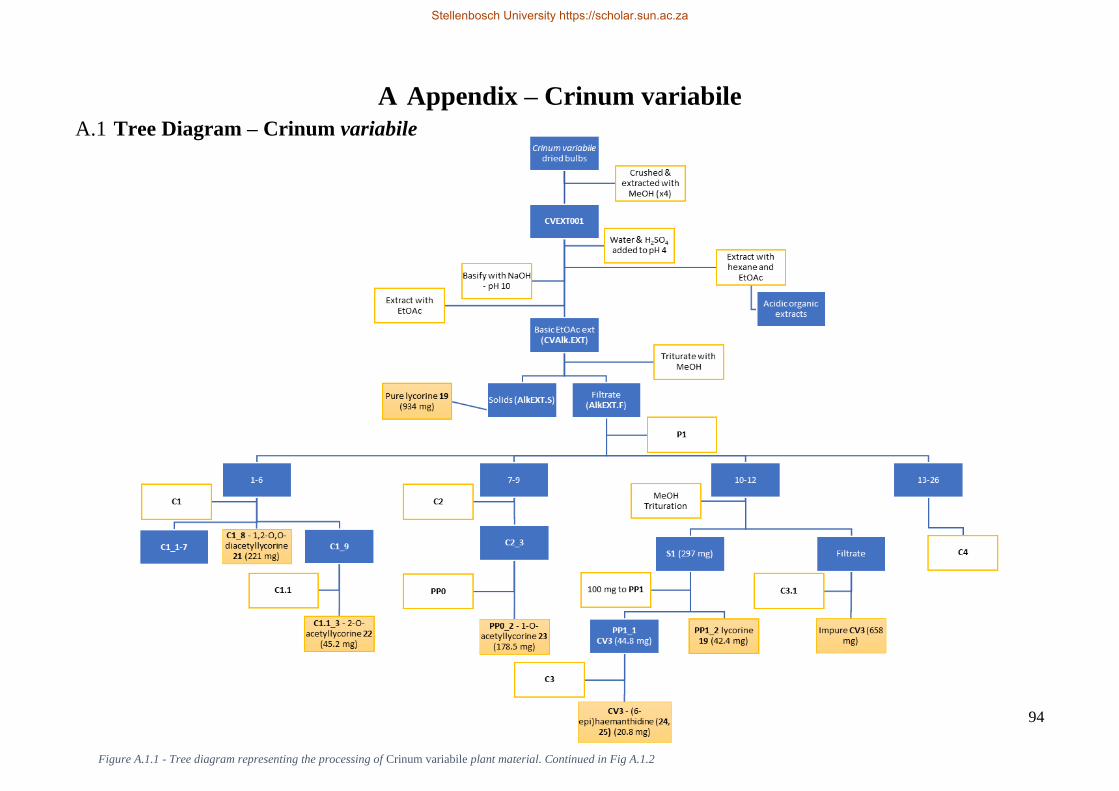
94
A Appendix – Crinum variabile
A.1 Tree Diagram – Crinum variabile
Figure A.1.1 - Tree diagram representing the processing of Crinum variabile plant material. Continued in Fig A.1.2
Stellenbosch University https://scholar.sun.ac.za

95
C4
1-11 12-16
PP2_1 lycorine 19 (53.4 mg)
PP2_2
PP3_3 -bulbispermine 26 (44.5 mg)
PP3
PP2_3-4
PP4_1 PP4_2
C5_1 - criwelline 27 (6.4 mg)
C5
PP4_3
PP4
PP2
17-23
Figure A.1.2 - Tree diagram representing the processing of Crinum variabile plant material – continued.
Stellenbosch University https://scholar.sun.ac.za
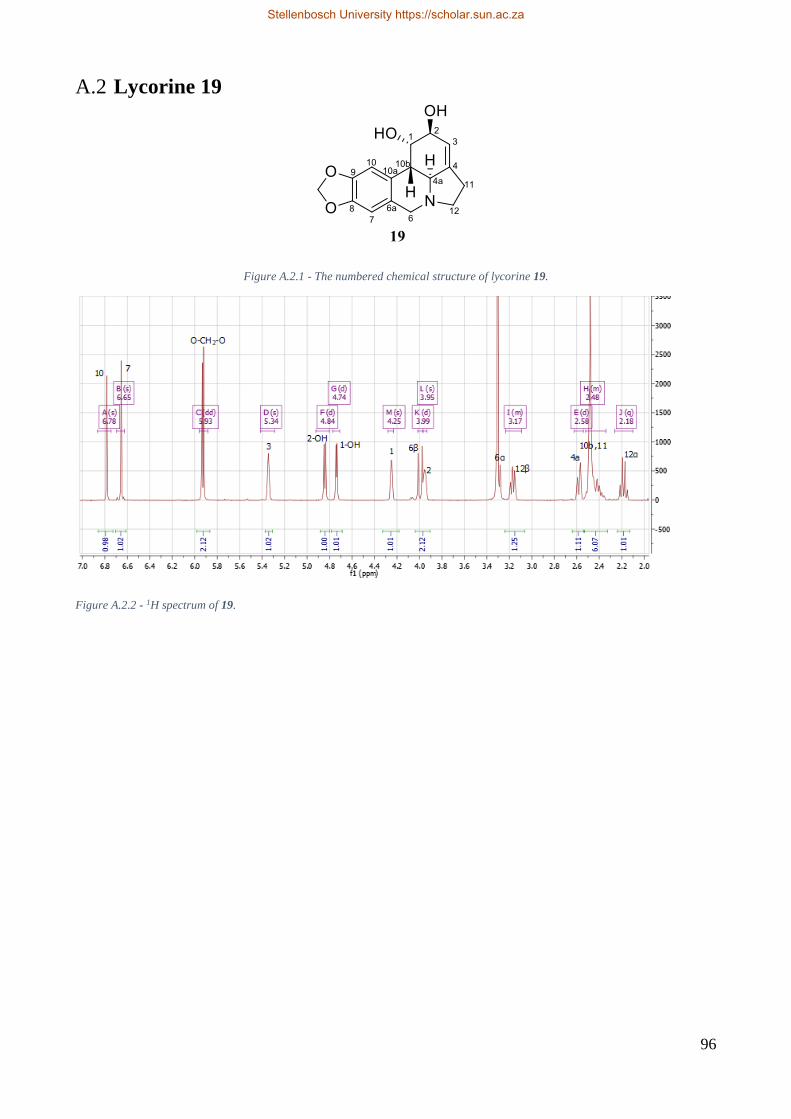
96
A.2 Lycorine 19
Figure A.2.1 - The numbered chemical structure of lycorine 19.
Figure A.2.2 - 1H spectrum of 19.
Stellenbosch University https://scholar.sun.ac.za

97
Figure A.2.3 - 13C spectrum of 19
Figure A.2.4 - COSY spectrum of 19.
Stellenbosch University https://scholar.sun.ac.za

98
Figure A.2.5 - HSQC spectrum of 19.
Figure A.2.6 - DEPT spectrum of 19.
Stellenbosch University https://scholar.sun.ac.za
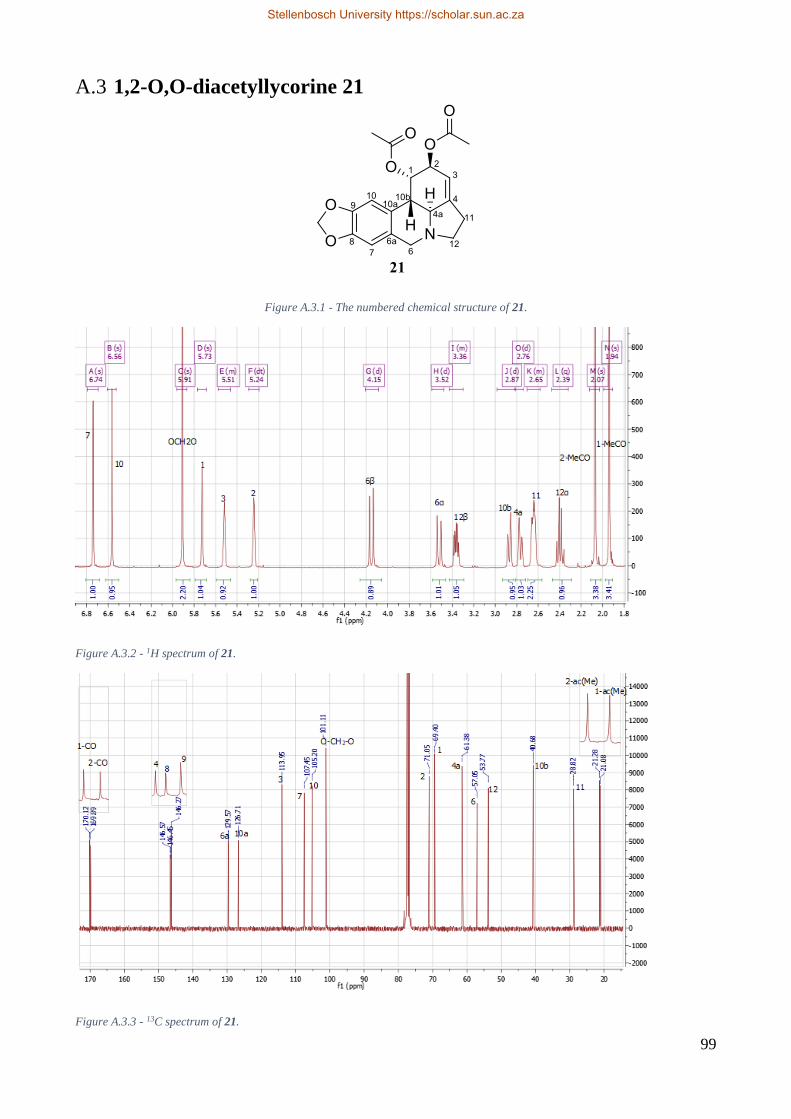
99
A.3 1,2-O,O-diacetyllycorine 21
Figure A.3.1 - The numbered chemical structure of 21.
Figure A.3.2 - 1H spectrum of 21.
Figure A.3.3 - 13C spectrum of 21.
Stellenbosch University https://scholar.sun.ac.za

100
Figure A.3.4 - HSQC spectrum of 21.
Figure A.3.5 - HMBC spectrum of 21.
Stellenbosch University https://scholar.sun.ac.za

101
Figure A.3.6 - COSY spectrum of 21.
Figure A.3.7 - DEPT spectrum of 21.
Stellenbosch University https://scholar.sun.ac.za
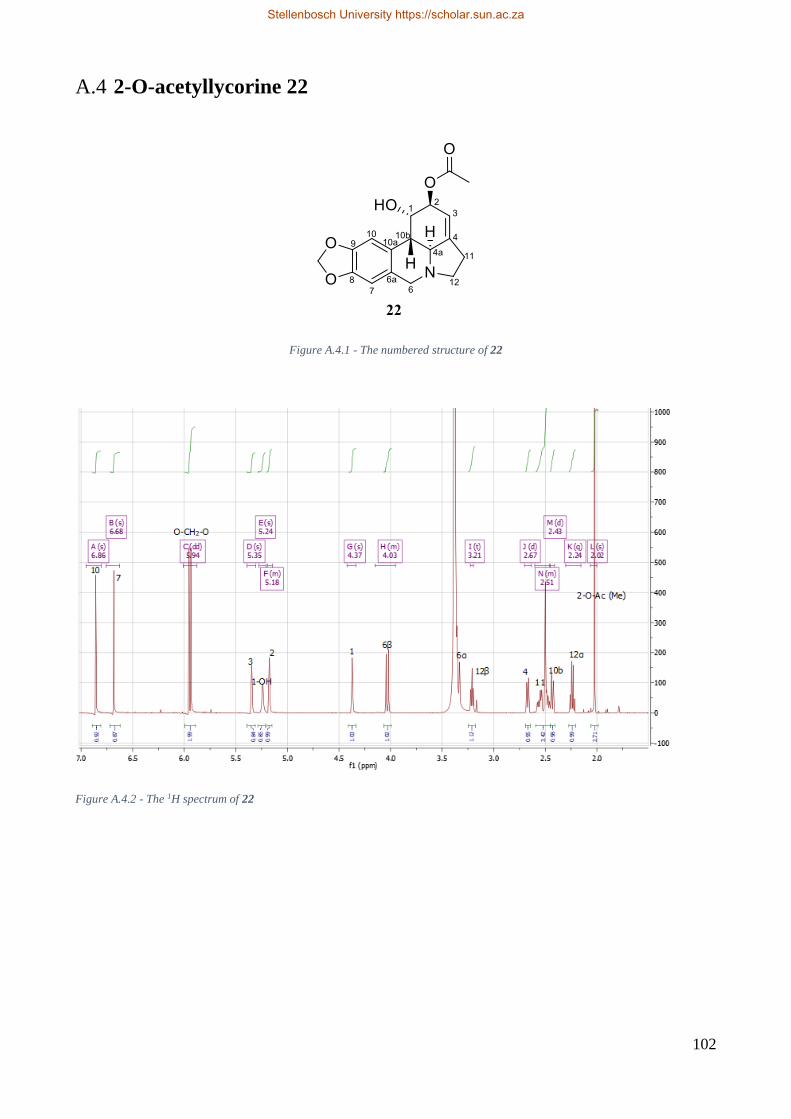
102
A.4 2-O-acetyllycorine 22
Figure A.4.1 - The numbered structure of 22
Figure A.4.2 - The 1H spectrum of 22
Stellenbosch University https://scholar.sun.ac.za

103
Figure A.4.3 - 13C spectrum of 22
Figure A.4.4 - HSQC spectrum of 22
Stellenbosch University https://scholar.sun.ac.za
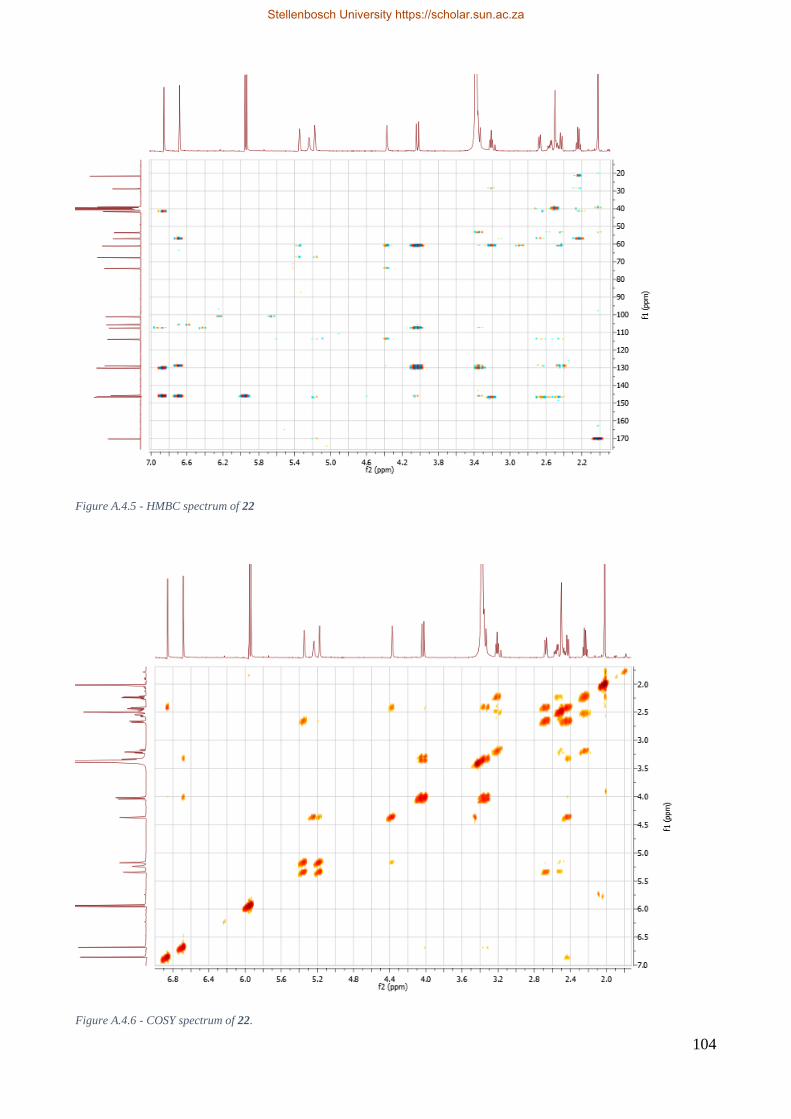
104
Figure A.4.5 - HMBC spectrum of 22
Figure A.4.6 - COSY spectrum of 22.
Stellenbosch University https://scholar.sun.ac.za

105
Figure A.4.7 - DEPT spectrum of 22.
Stellenbosch University https://scholar.sun.ac.za
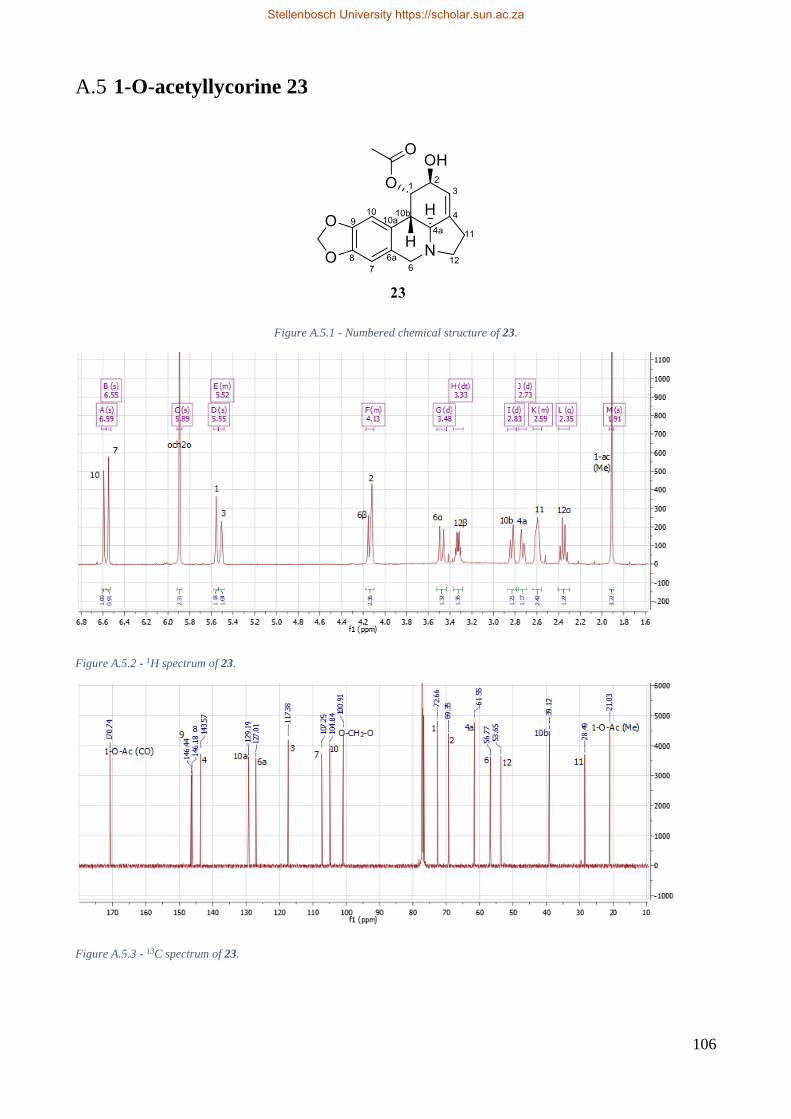
106
A.5 1-O-acetyllycorine 23
Figure A.5.1 - Numbered chemical structure of 23.
Figure A.5.2 - 1H spectrum of 23.
Figure A.5.3 - 13C spectrum of 23.
Stellenbosch University https://scholar.sun.ac.za

107
Figure A.5.4 - HSQC spectrum of 23.
Figure A.5.5 - HMBC spectrum of 23
Stellenbosch University https://scholar.sun.ac.za
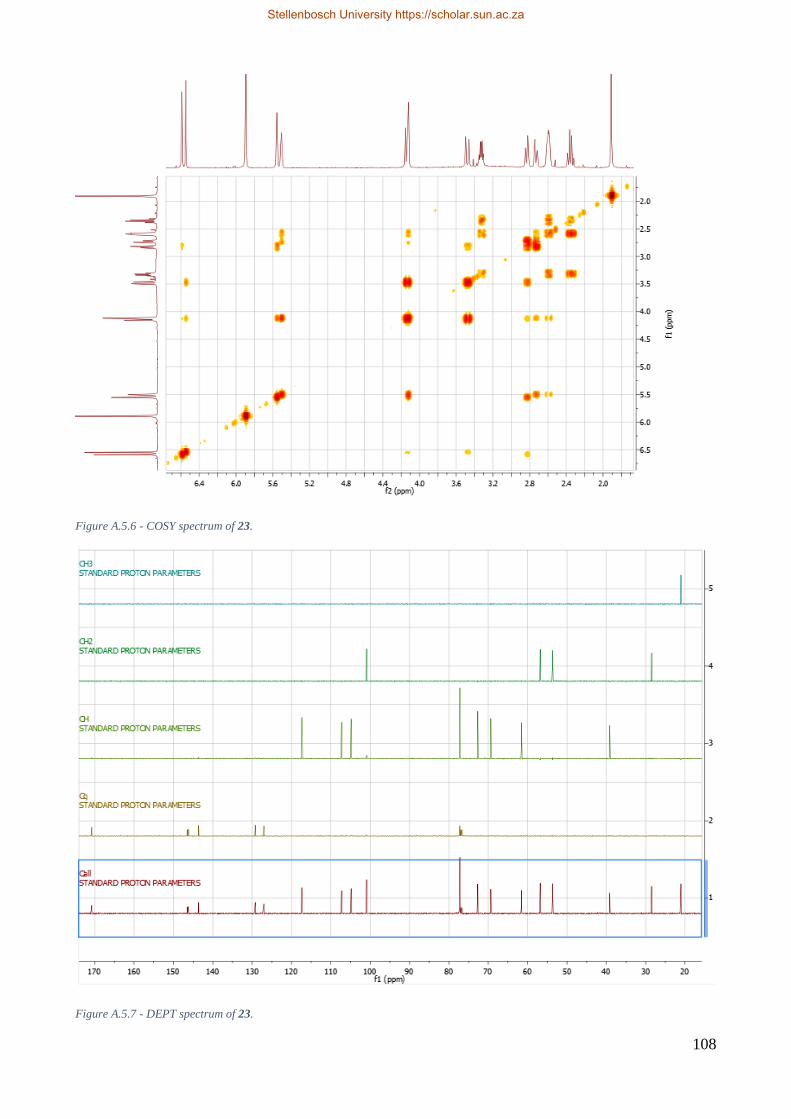
108
Figure A.5.6 - COSY spectrum of 23.
Figure A.5.7 - DEPT spectrum of 23.
Stellenbosch University https://scholar.sun.ac.za

109
Stellenbosch University https://scholar.sun.ac.za

110
A.6 Haemanthidine and 6-epihaemanthidine 24, 25
Figure A.6.1 - Chemical structures of 24 and 25.
Figure A.6.2 - 1H NMR spectrum of 24 and 25.
Stellenbosch University https://scholar.sun.ac.za

111
Figure A.6.3 - 13C NMR spectrum of 24 and 25.
Figure A.6.4 - TIC of CV3 HPLC-MS analysis
Stellenbosch University https://scholar.sun.ac.za

112
Figure A.6.5 - Elemental composition analysis of CV3 peak.
Figure A.6.6 - Fragmentation pattern of CV3.
Stellenbosch University https://scholar.sun.ac.za

113
A.7 Bulbispermine 26
Figure A.7.1 - The numbered chemical structure of bulbispermine 26.
Figure A.7.2 - 1H NMR spectrum of 26.
Figure A.7.3 - 13C spectrum of 26.
Stellenbosch University https://scholar.sun.ac.za

114
Figure A.7.4 - HSQC spectrum of 26. Using the appropriate phasing during processing, carbon atoms with 2 protons attached can be
differentiated from others (shown by red coupling peaks).
Stellenbosch University https://scholar.sun.ac.za

115
Figure A.7.5 - HMBC spectrum of 26.
Stellenbosch University https://scholar.sun.ac.za

116
Figure A.7.6 - COSY spectrum of 26
Stellenbosch University https://scholar.sun.ac.za
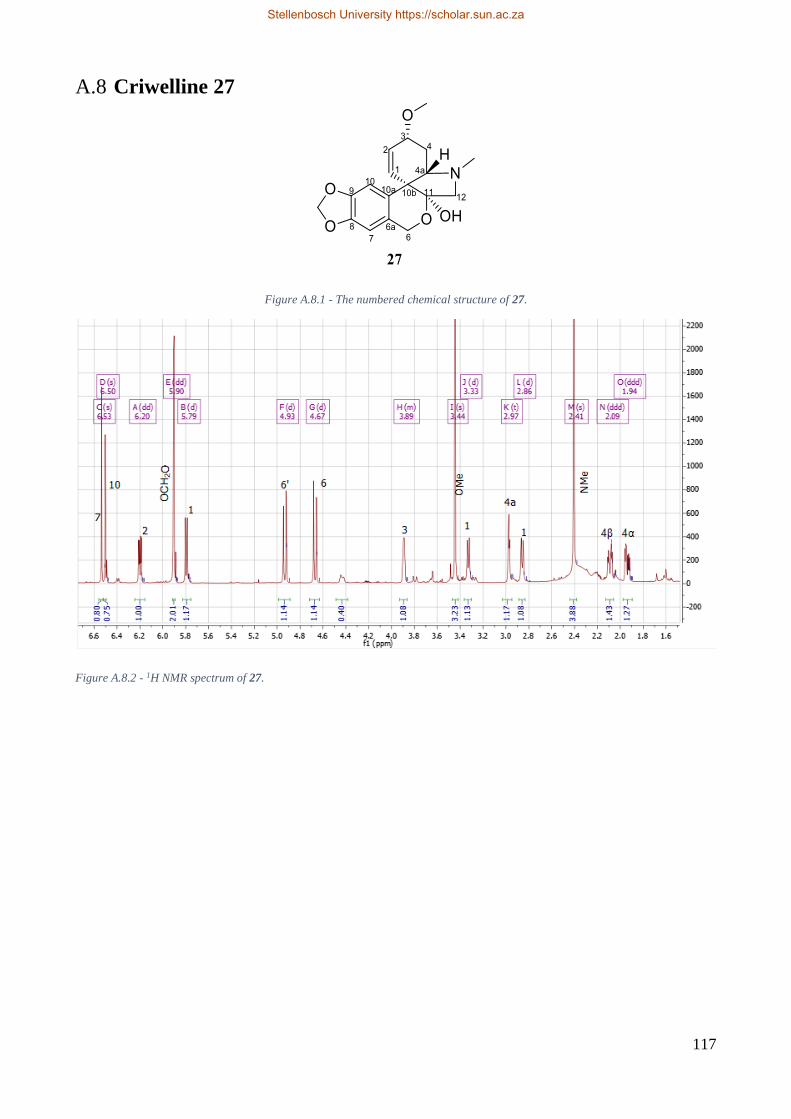
117
A.8 Criwelline 27
Figure A.8.1 - The numbered chemical structure of 27.
Figure A.8.2 - 1H NMR spectrum of 27.
Stellenbosch University https://scholar.sun.ac.za

118
Figure A.8.3 - 13C NMR spectrum of 27.
Figure A.8.4 - HSQC spectrum of 27. Using the appropriate phasing during processing, carbon atoms with 2 protons attached can be
differentiated from others (shown by red coupling peaks).
Stellenbosch University https://scholar.sun.ac.za
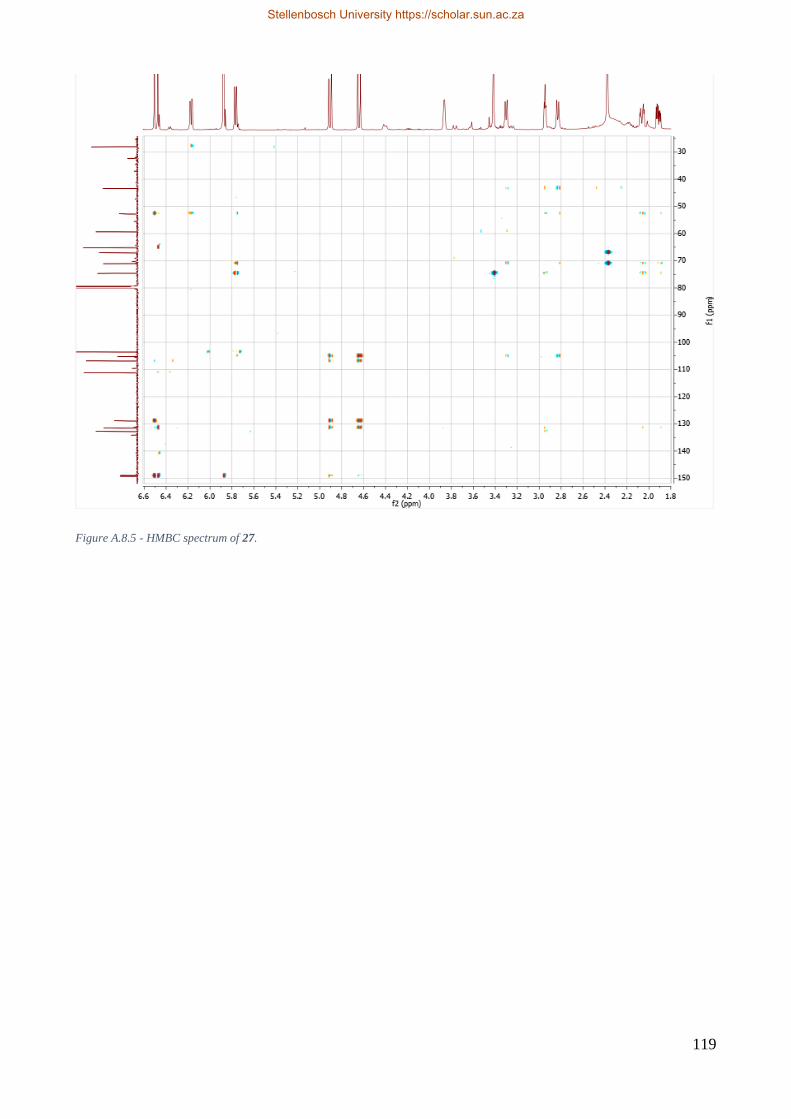
119
Figure A.8.5 - HMBC spectrum of 27.
Stellenbosch University https://scholar.sun.ac.za

120
Figure A.8.6 - COSY spectrum of 27
Stellenbosch University https://scholar.sun.ac.za

121
A.9 Continuous liquid/liquid extraction apparatus
EtOAc
DCM
Aqueous
Aqueous
Thimble carries
solvent below H2O Solvent bubbles “fall”
through aqueous layer
Solvent
recycled
Solvent
recycled
Solvent bubbles rise
through aqueous layer
Figure A.9.1 - The operation of a continuous liquid/liquid extraction apparatus. Operation with more dense solvents such as DCM shown on the left, and
operation with less dense solvents such as EtOAc shown on the right.
Stellenbosch University https://scholar.sun.ac.za

122
B Appendix – Higginsianins A and B
B.1 Higginsianin A 39
Figure B.1.1 - Numbered chemical structure of higginsianin A 39.
Figure B.1.2- 1H NMR spectrum of higginsianin A 39 acquired from corresponding research group.
Stellenbosch University https://scholar.sun.ac.za

123
B.1.1 22-O-acetylhigginsianin A 39a
Figure B.1.3 – Acetylation of 39 to 22-O-acetylhigginsianin A 39a.
Figure B.1.4 - 1H NMR spectrum of 39a.
Figure B.1.5 - 13C spectrum of 39a.
Stellenbosch University https://scholar.sun.ac.za

124
B.1.2 NBS bromination of 39
Figure B.1.6 - 1H NMR of product mixture from bromination of 39 with NBS.
Figure B.1.7 - Comparison of 39 1H NMR spectrum with that of bromination products.
Stellenbosch University https://scholar.sun.ac.za
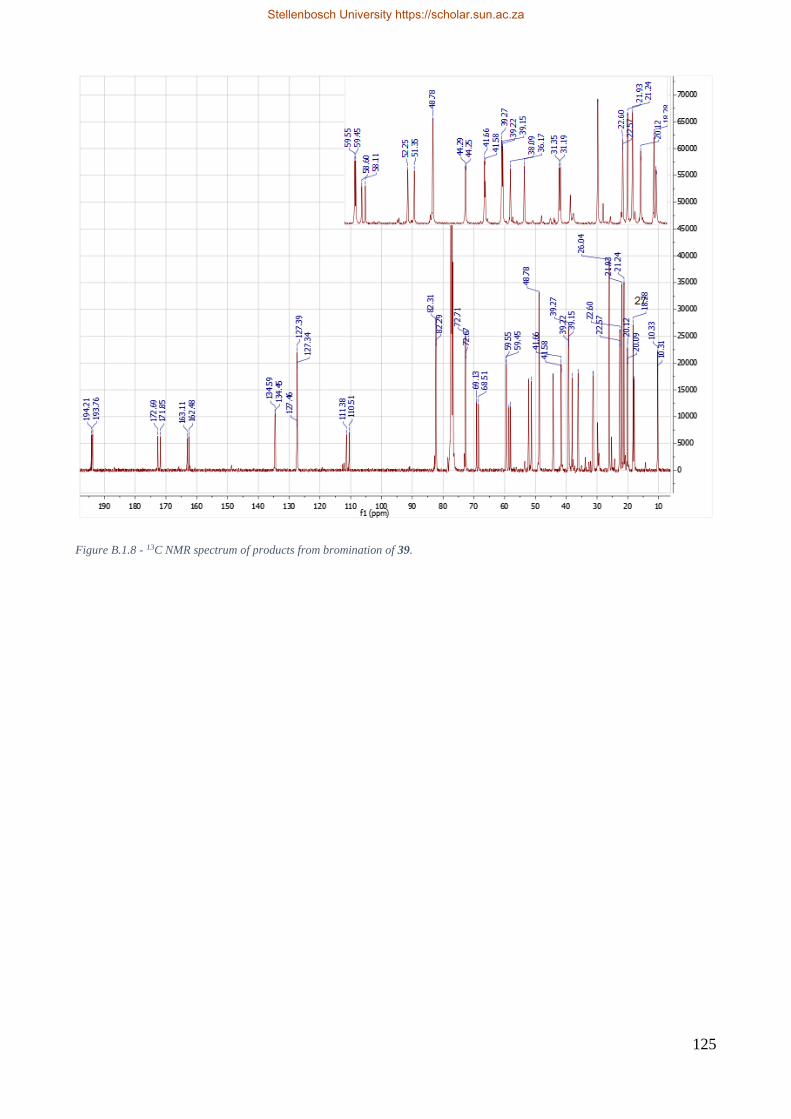
125
Figure B.1.8 - 13C NMR spectrum of products from bromination of 39.
Stellenbosch University https://scholar.sun.ac.za

126
B.2 Higginsianin B 40
Figure B.2.1 - Numbered chemical structure of higginsianin B 40.
Figure B.2.2 - 1H NMR spectrum of higginsianin B 40 as acquired from corresponding research group.
Stellenbosch University https://scholar.sun.ac.za

127
Figure B.2.3 - 13C NMR spectrum of 40 as acquired from corresponding research group.
B.2.1 Acetylation of 40
Figure B.2.4 - Scheme for the acetylation of higginsianin B 40.
Stellenbosch University https://scholar.sun.ac.za

128
Figure B.2.5 - 1H NMR spectrum of 40a.
Figure B.2.6 - 13C NMR spectrum of 40a.
Stellenbosch University https://scholar.sun.ac.za
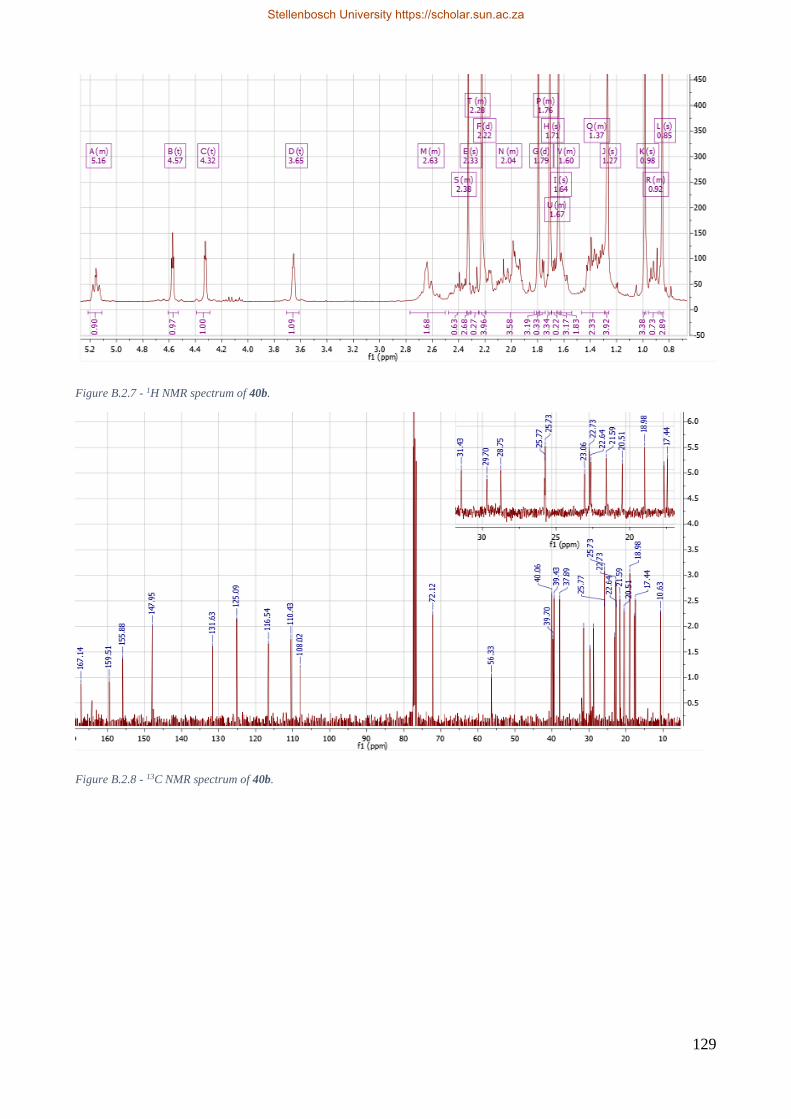
129
Figure B.2.7 - 1H NMR spectrum of 40b.
Figure B.2.8 - 13C NMR spectrum of 40b.
Stellenbosch University https://scholar.sun.ac.za
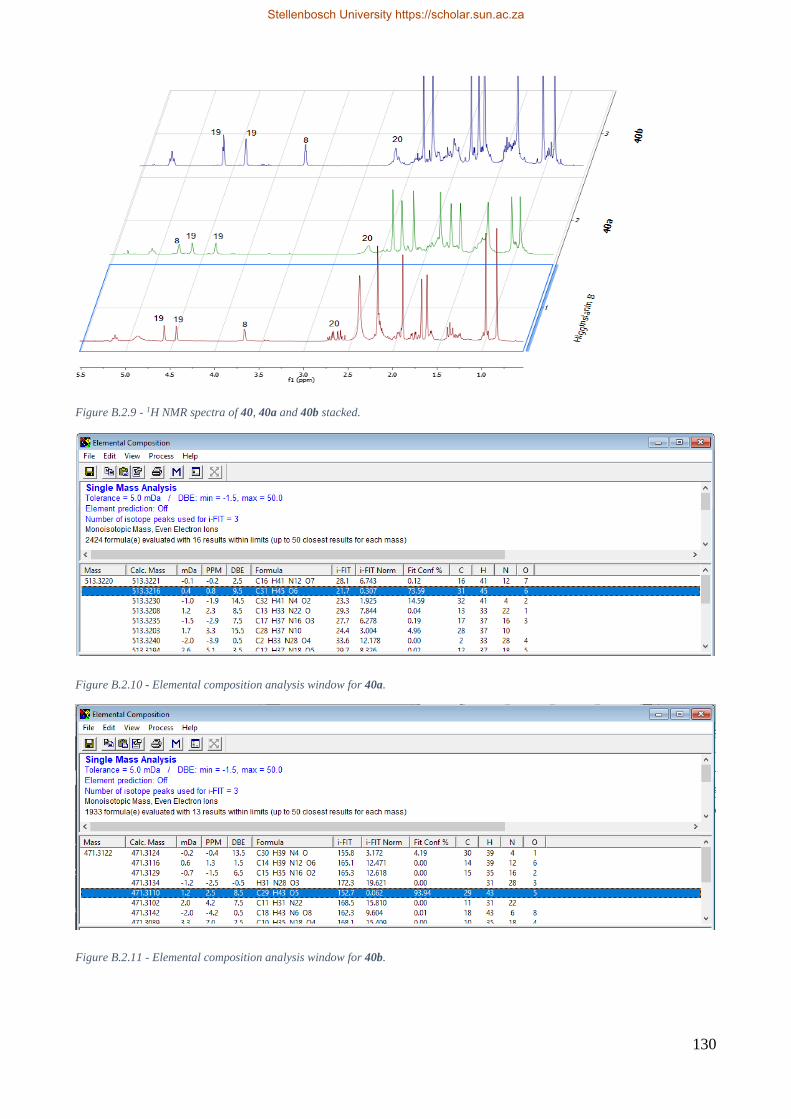
130
Figure B.2.9 - 1H NMR spectra of 40, 40a and 40b stacked.
Figure B.2.10 - Elemental composition analysis window for 40a.
Figure B.2.11 - Elemental composition analysis window for 40b.
Stellenbosch University https://scholar.sun.ac.za
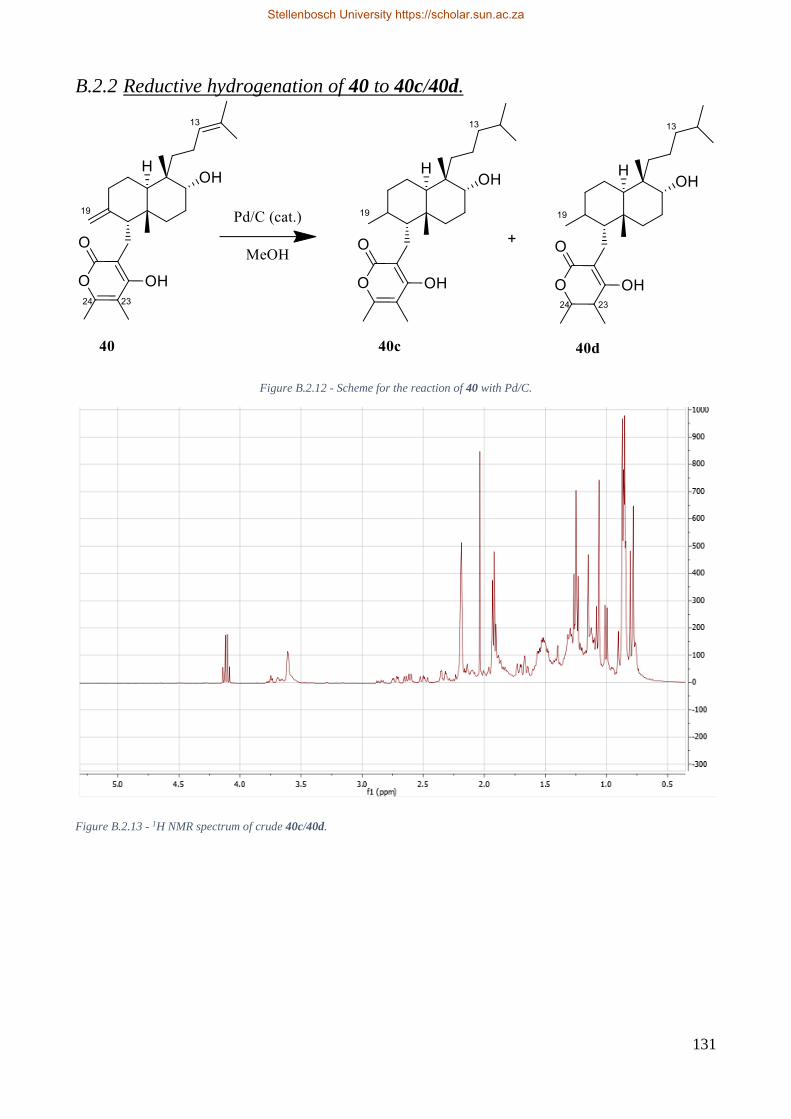
131
B.2.2 Reductive hydrogenation of 40 to 40c/40d.
Figure B.2.12 - Scheme for the reaction of 40 with Pd/C.
Figure B.2.13 - 1H NMR spectrum of crude 40c/40d.
Stellenbosch University https://scholar.sun.ac.za

132
Figure B.2.14 - Stacked spectra of 40 and crude 40c and 40d.
B.2.3 Epoxidation of 40 to 40e
Figure B.2.15 - Scheme for the reaction of 40 with m-CPBA.
/40
d
Stellenbosch University https://scholar.sun.ac.za

133
Figure B.2.16 - 1H NMR spectrum of crude 40e.
Figure B.2.17 - Stacked 1H NMR spectra of 40 and crude 40e.
e
Stellenbosch University https://scholar.sun.ac.za
Copyright © 2022 FDOKUMEN