empirical models for performance of drippers applying cashew ...
Patino, P. S. Correa and A. L. AbdallaH. M. El-Zaiat, R. C. Araujo, Y. A. Soltan, A. S. Morsy, H. Louvandini, A. V. Pires, H. O.
methane emission, and growth performance of lambsEncapsulated nitrate and cashew nut shell liquid on blood and rumen constituents,
doi: 10.2527/jas.2013-7084 originally published online March 18, 20142014, 92:2214-2224.J ANIM SCI
http://www.journalofanimalscience.org/content/92/5/2214the World Wide Web at:
The online version of this article, along with updated information and services, is located on
www.asas.org
by Fernanda Brito on May 6, 2014www.journalofanimalscience.orgDownloaded from by Fernanda Brito on May 6, 2014www.journalofanimalscience.orgDownloaded from

2214
Encapsulated nitrate and cashew nut shell liquid on blood and rumen constituents, methane emission, and growth performance of lambs1,2
H. M. El-Zaiat,*† R. C. Araujo,‡ Y. A. Soltan,§† A. S. Morsy,§# H. Louvandini,§ A. V. Pires,║ H. O. Patino,* P. S. Correa,¶ and A. L. Abdalla§3
*Federal University of Rio Grande do Sul, Faculty of Agronomy, Animal Science Department, Porto Alegre, Brazil; †Alexandria University, Faculty of Agriculture, Animal Production Department, Alexandria, Egypt; ‡GRASP Ind. & Com. LTDA, Division of Research and Development, Curitiba,
Brazil; §University of São Paulo, Centre for Nuclear Energy in Agriculture, Laboratory of Animal Nutrition, Piracicaba, Brazil; #Livestock Department, Arid Land Cultivation Research Institute, Alexandria, Egypt; ║University of São Paulo, College of Agriculture “Luiz de Queiroz”, Department of Animal Science, Piracicaba, Brazil; and ¶University of São Paulo, Centre for Nuclear Energy in Agriculture, Cellular and Molecular Biology Laboratory, Piracicaba, Brazil
ABSTRACT: Nitrate can be a source of NPN for micro-bial growth at the same time that it reduces ruminal meth-ane production. The objective of this study was to evalu-ate the effects of 2 encapsulated nitrate products used as urea replacers on blood and rumen constituents, methane emission, and growth performance of lambs. Eighteen Santa Inês male lambs (27 ± 4.9 kg) were individually allotted to indoor pens and assigned to a randomized com-plete block design with 6 blocks and 3 dietary treatments: control (CTL) = 1.5% urea, ENP = 4.51% encapsulated nitrate product (60.83% NO3
– in the product DM), and ENP+CNSL = 4.51% ENP containing cashew nut shell liquid (60.83% NO3
– and 2.96% cashew nut shell liquid [CNSL] in the product DM). Diets were isonitrogenous with 60:40 concentrate:forage (Tifton 85 hay) ratio. The experiment lasted for 92 d and consisted of 28 d for adaptation (a weekly 33% stepwise replacement of CTL concentrate by nitrate-containing concentrates) and 64 d for data collection. The ENP and ENP+CNSL showed greater (P < 0.05) red blood cell counts than CTL. Blood methemoglobin (MetHb) did not differ (P > 0.05) among
treatments, with mean values within normal range and remaining below 1.1% of total hemoglobin. There was an increase (P < 0.05) in total short-chain fatty acids con-centration at 3 h postfeeding for ENP, with an additional increase (P < 0.05) observed for ENP+CNSL. No treat-ment effects (P > 0.05) were observed on acetate to propi-onate ratio. Methane production (L/kg DMI) was reduced (P < 0.05) with nitrate inclusion, recording 28.6, 19.1, and 19.5 L/kg DMI for CTL, ENP, and ENP+CNSL, respec-tively. Addition of CNSL did not result (P > 0.05) in fur-ther reduction of methane production when compared with ENP. Final BW, DMI, ADG, and feed efficiency were similar (P > 0.05) among treatments. Values for DMI were 1.11, 1.03, and 1.04 kg/d and for ADG were 174, 154, and 158 g for CTL, ENP, and ENP+CNSL, respectively. In conclusion, encapsulated nitrate products showed no risks of toxicity based on MetHb formation. The products persistently reduced methane production without affecting performance. Inclusion of cashew nut shell liquid in the product formulation had no additional benefits on methane mitigation.
Key words: cashew nut shell liquid, methane, methemoglobin, nitrate, nitrite, nonprotein nitrogen
© 2014 American Society of Animal Science. All rights reserved. J. Anim. Sci. 2014.92:2214–2224 doi:10.2527/jas2013-7084
1First author’s scholarship was supported by the National Council for Scientific and Technological Development (CNPq/Brazil) and The World Academy of Sciences (TWAS/Italy). P. S. Correa’s scholarship was supported by CNPq/Brazil (Project RHAE number: 551518/2011-1). Funding for this study was partially provided by GRASP Ind. & Com. LTDA (Curitiba, Brazil).
2We kindly thank Prof. Selene Maia de Morais (Universidade Estadual do Ceará, Fortaleza, Brazil) and Prof. Evandro Maia Ferreira
(Universidade Estadual de Ponta Grossa, Ponta Grossa, Brazil) for performing HPLC cashew nut shell liquid and GC rumen short-chain fatty acids analyses, respectively.
3Corresponding author: [email protected] August 29, 2013.Accepted February 22, 2014.
by Fernanda Brito on May 6, 2014www.journalofanimalscience.orgDownloaded from

Encapsulated nitrate and cashew liquid for lambs 2215
INTRODUCTION
The efficacy of nitrate salts for enteric methane miti-gation has been confirmed (Nolan et al., 2010; van Zi-jderveld et al., 2010, 2011; Hulshof et al., 2012; Li et al., 2012, 2013). In the rumen, some microbes can reduce nitrate to nitrite and further to ammonia (Lewis, 1951; Iwamoto et al., 2002). When nitrate is fed continuously, an alternative and effective hydrogen sink is established competing with methanogenic Archaea.
Ammonia as the final product of nitrate reduction is a clear nutritional advantage; however, nitrate is not used as a source of NPN due to the risk of methemo-globinemia. Nonadapted animals fed high amounts of nitrate may show ruminal accumulation of nitrite. Ab-sorbed nitrite oxidizes the hemoglobin into the ferric form, hampering its ability to transport oxygen (Cock-burn et al., 2013). This problem is offset by a stepwise dietary inclusion of nitrate, allowing microbes to in-crease their nitrate- and nitrite-reducing activities as well as their numbers in the rumen (Alaboudi and Jones, 1985; Iwamoto et al., 2002; Lin et al., 2013). Consider-ing that mistakes in feed delivery and other field limita-tions make pure nitrate a potential risk, an encapsulated nitrate product was developed to improve its safety.
Cashew nut shell liquid (CNSL), a byproduct of the cashew nut industry, can reduce in vitro (Watanabe et al., 2010) and in vivo (Shinkai et al., 2012) ruminal methane production in a mode of action that is differ-ent to nitrate. The phenolic compounds (e.g., anacardic acid, cardanol, and cardol) found in CNSL have antimi-crobial properties able to reduce gram-positive bacteria, thereby increasing propionate production and, conse-quently, mitigating methane (Van Nevel et al., 1971). To explore an additive effect, another encapsulated ni-trate product version was designed including CNSL.
The aim of this study was to evaluate the effects of 2 encapsulated nitrate products as urea replacers on blood and rumen constituents, methane emission, and growth performance of lambs.
MATERIALS AND METHODS
This study was conducted from April to July 2011 in the sheep facilities of the Laboratory of Animal Nu-trition, Centre for Nuclear Energy in Agriculture, Uni-versity of São Paulo, located in Piracicaba, state of São Paulo, Brazil. All experimental protocols and animal-use procedures followed guidelines recommended by the Internal Commission for Environmental Ethics and Experimentation with Animals at the same institution.
Animals and Housing
Eighteen Santa Inês male lambs (27 ± 4.9 kg) were individually allotted to indoor pens (1.50 by 1.10 by 1.20 m) with concrete floors, feed bunks, and water cups. At the onset of the experiment, animals were dewormed with oral administrations of cobalt sulfate with albendazole (Valbazen 10; Pfizer, Guarulhos, SP, Brazil) and levamisole chloridate (Ripercol; Fort Dodge, Campinas, SP, Brazil) depending on the fecal egg count analyses and BW.
Experimental Design and Treatments
The study lasted for 92 d and consisted of 28 d for adaptation and 64 d for data collection. The animals were assigned to a randomized complete block design with 6 blocks and 3 dietary treatments. Age and initial BW were used for blocking and treatments were de-fined as follows: Control (CTL) = 1.5% urea in the di-etary DM, ENP = 4.51% encapsulated nitrate product (60.83% NO3
– in the product DM), and ENP+CNSL = 4.51% ENP containing cashew nut shell liquid (60.83% NO3
– and 2.96% CNSL in the product DM).The experimental ENP are protected by an interna-
tional patent and were manufactured by GRASP Ind. & Com. LTDA (Curitiba, PR, Brazil). Both products were manufactured using the double salt of calcium and am-monium nitrate (CAN) decahydrate coated with a con-trolled-release matrix. The product was designed to re-lease 50, 80, and 100% of nitrate within 4, 12, and 30 h, respectively. Products were composed as follows (% of DM): 86.17% DM in as-fed basis, 14.98% N, 60.83% NO3
–, and 17.84% Ca. The CNSL inclusion was 2.96% in the product DM. Its composition was determined by HPLC (Oliveira et al., 2011): 31.84% trienoic cardanol, 7.11% dienoic cardanol, 2.40% trienoic anacardic acid, 41.26% dienoic anacardic acid, 1.02% monoenoic ana-cardic acid, and 16.37% as nonidentified substances.
Feeding Management and Data Collection
Despite the encapsulation protection, sheep fed ni-trate were stepwise adapted by replacing 33% of CTL concentrate with nitrate-containing concentrates weekly. After 21 d, animals were receiving their final experi-mental diets and an extra 7-d period was allowed before beginning of data collection. Diets were isonitrogenous with 60:40 concentrate:forage (Tifton 85 hay) ratio and formulated to meet NRC (2007) recommendations for growing lambs. Composition and chemical analyses of experimental diets are shown in Table 1.
Total mixed diets were fed twice a day at 0900 and 1600 h in equal portions. Animals were allowed ad li-bitum access to feed and fresh water. To reduce feed
by Fernanda Brito on May 6, 2014www.journalofanimalscience.orgDownloaded from

El-Zaiat et al.2216
wastage and sorting, corn grain and Tifton 85 hay were ground using a 4.7- and 10-mm pore size sieves (DPM 1 mill; Nogueira, Itapira, SP, Brazil), respectively. Con-centrate ingredients were mixed using a 500-kg horizon-tal mixer (MAP Equipamentos Agropecuários e Indus-triais LTDA, Londrina, PR, Brazil). At the time of feed-ing, chopped hay was added to the concentrate mixture to produce the total mixed diet.
Quantity of feed offered to animals was calculated according to previous daily DMI and adjustments were made when needed so that refused feed did not exceed 10% of daily intake. Orts were recorded daily to deter-mine DMI and not offered back to animals. Feeds were sampled weekly throughout the trial and frozen at –20°C
for further analyses. To determine ADG and feed effi-ciency, animals were weighed at the beginning and end of experimental period after a 16-h fast.
Determination of Blood Constituents
Blood samples (5 mL) were collected every 2 wk (4 collecting days throughout experimental period) 6 h after morning feeding. Samples were collected from the jugular vein using evacuated K2 EDTA tubes (Becton Dickinson & Co., Franklin Lakes, NJ) for hematological analyses and evacuated tubes without anticoagulant agents (Bec-ton Dickinson & Co.) for biochemical analyses.
Hematological analyses were performed immediately after sampling. Packed cell volume (PCV) was deter-mined using microhematocrit tubes after centrifugation (IEC MB centrifuge, DAMON/IEC Division, Needham Heights, MA) 12,700 x g for 5 min at room temperature. Hemoglobin (Hb) was determined using commercial colorimetric kits based on the reaction with potassium cyanide (Reference 47; Labtest Diagnóstica S.A., Lagoa Santa, MG, Brazil). Methemoglobin (MetHb) concentra-tion was determined colorimetrically within 30 min after blood sampling as described by Sato (2005). Red blood cells (RBC) were counted by light microscopy using a hemocytomer. Before counting, blood samples were di-luted (1:200) with Hayem’s solution (Hepler, 1966).
All other variables were evaluated in blood serum obtained after centrifugation at 2,000 × g (CENTRA 7R model; Thermo IEC, Needham Heights, MA) for 15 min at 4°C and stored at –20°C. Blood nitrate was deter-mined using a micro ion selective electrode combined with computer software (Arrow Straight Nitric Oxide Measurement System, model number ISM-146NOXM; Lazar Research Laboratories Inc., Los Angeles, CA). Blood nitrite was determined colorimetrically using a commercial kit (Merck Merckoquant Nitrite test, cata-log number 1.14776.0001; Merck KGaA, Darmstadt, Germany). Total protein, albumin, and urea were de-termined using commercial colorimetric kits (Labtest Diagnóstica S.A. Lagoa Santa, MG, Brazil). Concentra-tions of glutamic oxaloacetic transaminase (GOT; also called aspartate transaminase or aspartate aminotrans-ferase) and glutamic pyruvic transaminase (GPT; also known as alanine aminotransferase) were determined using commercial colorimetric kits (Labtest Diagnóstica S.A., Lagoa Santa, MG, Brazil; reference 52 and refer-ence 108, respectively).
Determination of Ruminal Constituents
Rumen fluid samples (30 mL) were collected every 2 wk (4 collecting days throughout experimental period) using an esophageal probe 3 h after morning feeding.
Table 1. Ingredients and chemical composition of experimental diets (%; DM basis)
Item
Experimental diets1
CTL ENP ENP+CNSLIngredient
Chopped Tifton hay 40.00 40.00 40.00Ground corn 50.90 48.99 48.99Soybean meal 5.00 5.00 5.00Urea 1.50 – –ENP2 – 4.51 –ENP+CNSL3 – – 4.51Mineral premix4 1.50 1.50 1.50Limestone 1.10 – –
Chemical compositionDM, as-fed basis 89.35 90.03 89.58OM 95.36 94.03 93.80CP 13.51 13.43 13.48EE5 4.47 4.97 4.68NDF 67.88 67.32 67.81ADF 24.03 23.65 23.93Lignin 4.97 4.47 4.68
Calculated concentration6
NO3– – 2.74 2.74
Ca 0.82 1.25 1.25P 0.40 0.40 0.40S 0.26 0.26 0.26N:S 8.31 8.26 8.30NO3
–:S – 10.54 10.54
1CTL = control: 1.5% urea in the dietary DM; ENP = 4.51% encapsulated nitrate product (60.83% NO3
– in the product DM); ENP+CNSL = 4.51% ENP containing cashew nut shell liquid (60.83% NO3
– and 2.96% cashew nut shell liquid in the product DM).
2Encapsulated nitrate product (% of DM): 86.17% DM in as-fed basis, 14.98% N, 60.83% NO3
–, and 17.84% Ca.3Encapsulated nitrate product plus cashew nut shell liquid: inclusion rate
was 2.96% of cashew nut shell liquid in the product DM.4Composition: 8.5% P, 16.5% Ca, 1% Mg, 2.5% S, 12% Na, 350 mg/kg F,
756 mg/kg Cu, 2,800 mg/kg Zn, 2,180 mg/kg Mn, 66 mg/kg I, 44 mg/kg Co, and 14 mg/kg Se.
5EE = ether extract.6Assuming absence of NO3
– in CTL. Calcium, phosphorus, and sulfur calculated according to NRC (2001) tables.
by Fernanda Brito on May 6, 2014www.journalofanimalscience.orgDownloaded from

Encapsulated nitrate and cashew liquid for lambs 2217
Rumen pH was measured immediately after sampling using a portable pH meter (DM21 model; Digimed, São Paulo, SP, Brazil). For short-chain fatty acids (SCFA) and ammonia determination, samples were stored at –20°C without preservatives. For protozoa determination, 2-mL ruminal fluid samples were diluted in 4 mL of methyl green-formalin-saline solution and stored in glass flasks at room temperature in a dark place (Dehority, 1993).
Frozen ruminal fluid samples were thawed and cen-trifuged at 15,000 × g (RC 5B plus; Sorvall, Wilmington, DE) for 20 min at 4°C. The SCFA concentrations were de-termined according to manufacturer’s conditions (Hewlett-Packard, 1998) with some modifications by using a gas chromatograph (HP 7890A, Automatic Injector HP 7683B; Agilent Technologies, Palo Alto, CA) equipped with a capillary column HP-FFAP (19091F-112; 0.320 mm o.d., 0.50 μm i.d., and 25 m length; J&W Agilent Technologies Inc., Palo Alto, CA). A 1-μL aliquot was injected using a 20:1 split ratio with 31.35 mL/min of H2 flux (63.432 Pa). Injector and flame ionization detector temperatures were kept at 260°C. Oven heating slope was 80°C (1 min), 120°C (20°C/min for 3 min), and 205°C (10°C/min for 2 min), with 16.5 min of total analytical time. Hydrogen at 1.35 mL/min was used as carrier gas. Detector hydrogen, synthetic air, and nitrogen fluxes (make up) were kept at 40, 400, and 40 mL/min, respectively.
Ruminal NH3–N was determined by steam distillation using a micro Kjeldahl apparatus (TE-036/1 model; Tec-nal Equipamentos para Laboratório Ltda., Piracicaba, SP, Brazil) followed by collection in boric acid solution and titration with 0.01 N sulfuric acid solution (Preston, 1995). Protozoa numbers were counted according to Dehority (1993) by light microscopy using an Improved Neubauer Bright-Line hemocytomer (LaborOptik, Lancing, UK).
Determination of Methane Production
Methane was evaluated at the beginning (first week), middle (fifth week), and end (ninth week) of the data collection period. Data were obtained over 2 consecu-tive days using 6 open-circuit respiration chambers (1.57 by 0.71 by 1.67 m with 1.9 m3) as described by Abdalla et al. (2012). Animals entered in chambers in a stag-gered manner according to block, totaling 6 consecutive days to evaluate all animals within each measurement period. After methane measurements, lambs were trans-ferred back to indoor individual pens.
Animals were kept in chambers for 23 h. Gas was continuously sampled into gas collection bags using a peristaltic pump (IPC-N-8 V1.34; Ismatec, Glattbrugg-Zürich, Switzerland). Outgoing air speed was measured every 2 h using a portable digital anemometer (AD-250 model; Instrutherm Instrumentos de Medição Ltda., São Paulo, SP, Brazil) to calculate total air volume circulated
in chambers. Temperature (23 ± 2°C) and humidity (87 ± 4%) were also monitored every 2 h to correct gas volume for standard temperature and pressure (STP) conditions. Respiration chambers were previously calibrated insert-ing known amount of pure methane into each chamber. Recovered methane rate was adjusted for 100%.
Methane concentration on sampled gas was determined using a gas chromatograph (Shimadzu 2014, Tokyo, Japan) equipped with a Shincarbon ST 100/120 micro packed column (1.5875 mm o.d., 1.0 mm i.d., and 1 m length; reference number 19809; Resteck, Bellefonte, PA). Tem-peratures of column, injector, and flame ionization detector were 60, 200, and 240°C, respectively. Helium at 10 mL/min was the carrier gas. Methane concentration was deter-mined by external calibration using an analytical curve pre-pared with pure methane (White Martins PRAXAIR Gases Industriais Inc., Osasco, SP, Brazil; 995 mL/L purity).
Feed Analyses
Feed samples were thawed, composited by treatment, dried in a forced-air oven at 55°C for 72 h, and ground with a Wiley mill (Marconi, Piracicaba, SP, Brazil) to pass a 1-mm screen. The DM was determined by oven drying at 105°C for 24 h, and OM was determined by difference after heating at 550°C for 4 h (AOAC, 1990). Ether extract was determined using a commercial extrac-tion system (model XT10; ANKON, New York, NY). Nitrogen content was determined using a micro Kjel-dahl apparatus (TE-036/1; TTecnal Equipamentos para Laboratórios Ltda, Piracicaba, SP, Brazil) according to the Association of Official Analytical Chemists (AOAC, 1990). Sequential detergent fiber analyses (TE-149 fiber analyzer; Tecnal Equipamentos para Laboratório Ltda.) were used to determine NDF (Van Soest et al., 1991) and ADF (Goering and Van Soest, 1970) concentrations. The NDF was determined using heat-stable α-amilase (Ankom Technology, Tecnoglobo Equipamentos, Curi-tiba, PR, Brazil) without sodium sulfite. The NDF and ADF concentrations were ash corrected. Acid detergent lignin was determined by cellulose solubilization with 72% sulfuric acid (Robertson and Van Soest, 1981).
Statistical Analyses
Blood, ruminal, and methane data were analyzed as repeated measures over time using the MIXED proce-dure (SAS Inst. Inc., Cary, NC) for a randomized com-plete block design with 6 blocks and 3 treatments, ac-cording to the model Y = μ + Bi + Tj + Sij + Dk + (TD)jk + eijk, in which μ = overall mean, Bi = block effect (i = 1 to 6), Tj = treatment effect (j = 1 to 3), Sij = residual error associated with the sheep effect (block × treatment), Dk = day of sampling effect (k = 1 to 4), (TD)jk = interaction
by Fernanda Brito on May 6, 2014www.journalofanimalscience.orgDownloaded from

El-Zaiat et al.2218
of treatment × day of sampling, and eijk = residual error. The animal was included as a random effect. The best fitted covariance structure was autoregressive 1 (AR1). The LSMEANS option (SAS Inst. Inc.) was used to gen-erate individual treatment means. Effects of treatment, sampling day, and the interaction of treatment × sam-pling day were defined by the F-test of ANOVA. Com-parisons among treatments were performed by Tukey’s test with effects declared significant at P < 0.05.
Growth data were analyzed using the MIXED pro-cedure for a randomized complete block design with 6 blocks and 3 diets, according to the model Y = μ + Bi + Tj + eij, in which μ is the overall mean, Bi is the block ef-fect (i = 1 to 6), Tj is the treatment effect (j = 1 to 3), and eij is the residual error. The block was included as a ran-dom effect. The LSMEANS option was used to generate individual treatment means. Effects of treatment were defined by the F-test of ANOVA. Comparisons among treatments were performed by Tukey’s test with effects declared significant at P < 0.05.
RESULTS AND DISCUSSION
Blood ConstituentsAn increase in RBC concentration (P < 0.05) was
observed for both nitrate-containing treatments (Table 2). This is a typical physiological response in nitrate-fed an-imals, an attempt to offset the negative effects of nitrite on blood oxygen-carrying capacity. For instance, not only an increased RBC as well as increased PCV, Hb, and blood volume were reported when nitrate (440 and
660 mg NO3– per kg BW) was fed to pregnant heifers
that experienced MetHb concentrations from 24 to 57% (Jainudeen et al., 1964), values much greater than ob-served in our experiment.
The PCV, Hb, and MetHb did not change (P > 0.05) with inclusion of ENP or ENP+CNSL. Concentration of MetHb in nitrate-fed lambs remained <1.10% of to-tal Hb. It is highlighted that blood was collected at 6 h after feeding, when highest MetHb concentrations are likely expected (Lewis, 1951; Jainudeen et al., 1964; Burrows et al., 1987). These basal values of MetHb in-dicate that animals were not at risk for methemoglobin-emia development.
The major limitation of nitrate use in diets for ru-minants is the risk of intoxication. Clinical signs may not be apparent when blood MetHb is <60%, while concentrations >75% are considered lethal (Burrows et al., 1987). Under good management, animals can use nitrate without increases in MetHb (Farra and Satter, 1971; Alaboudi and Jones, 1985; Nolan et al., 2010; van Zijderveld et al., 2010; Li et al., 2012, 2013; Freire et al., 2013; Pereira et al., 2013).
A stepwise dietary inclusion of nitrate, N balanced diets, and adequate S and energy concentrations are ef-fective in minimizing intoxication (Leng, 2008). The slow adaptation allows microbes to increase their ni-trate- and nitrite-reducing activity as well as their num-bers in the rumen (Alaboudi and Jones, 1985; Iwamoto et al., 2002; Lin et al., 2013), leading to sheep (Li et al., 2012, 2013; Freire et al., 2013), beef cattle (Hulshof et al., 2012; Pereira et al., 2013; Hegarty et al., 2013), and dairy cows (Jones et al., 1966; van Zijderveld et al.,
Table 2. Blood constituents of Santa Inês lambs fed encapsulated nitrate or encapsulated nitrate plus cashew nut shell liquid as urea replacers
Item1
Treatment2 SEM
P-value3
CTL ENP ENP+CNSL Treat. DAY T × DNo. of lambs 6 6 6 – – – –RBC, × 106/µL 10.36a 12.75b 12.01b 0.246 <0.01 <0.01 0.71PCV, % 34.15 35.35 33.21 1.454 0.59 <0.01 0.13Hb, g/dL 11.81 12.29 11.65 0.416 0.54 <0.01 0.05MetHb, % 0.62 1.08 0.92 0.131 0.08 0.23 0.30Nitrate, mM 30.50 36.43 36.22 3.69 0.46 <0.01 0.73Nitrite, µM 2.04b 2.40a 2.19ab 0.093 0.05 0.03 0.06Total protein, g/dL 7.00 7.31 7.27 0.153 0.35 0.12 0.30Albumin, g/dL 3.19 3.20 3.12 0.069 0.72 0.03 0.26Urea, mg/dL 36.74 33.09 30.58 2.087 0.16 <0.01 0.06GOT, IU/L 51.44 46.51 45.27 1.932 0.10 0.89 0.69GPT, IU/L 6.15 8.51 6.82 0.714 0.10 0.13 0.01
a,bMeans within a row with different superscripts differ by P < 0.05.1RBC = red blood cells; PCV = packed cell volume; Hb = hemoglobin; MetHb = methemoglobin; GOT = glutamic oxaloacetic transaminase; GPT = glutamic
pyruvic transaminase.2CTL = Control: 1.5% urea in the dietary DM; ENP = 4.51% encapsulated nitrate product (60.83% NO3
– in the product DM); ENP+CNSL = 4.51% ENP containing cashew nut shell liquid (60.83% NO3
– and 2.96% cashew nut shell liquid in the product DM).3Treat. = treatment effect; DAY = day of sampling effect; T × D = interaction of treatment with day of sampling.
by Fernanda Brito on May 6, 2014www.journalofanimalscience.orgDownloaded from

Encapsulated nitrate and cashew liquid for lambs 2219
2011) to grow and perform without signs of intoxication. Additionally, due to its gradual release property, the ENP is another important strategy to improve nitrate safety.
Serum total protein, albumin, and urea did not differ (P > 0.05) among treatments, but a day effect (P < 0.05) was observed for albumin and urea. These variables were chosen to monitor protein nutritional status of lambs (Kaneko, 1989), while total protein and albumin are also useful to evaluate hydration status (Knowles and Warriss, 2007) and to indicate infection, inflammation, or injury processes (Fleck et al., 1985). Reasons for the sampling day effect on albumin and urea are unknown.
Serum GOT and GPT were also evaluated as other health indicators, being widely used to diagnose liver in-juries, myocardial infarctions, and skeletal muscle my-opathies (Wada and Kamiike, 1990). In animals, nitrate and nitrite may be converted into N-nitrous compounds, nitric oxide, and other reactive substances (Gangolli et al., 1994) that are able to promote lipid peroxidation (Salvemini and Cuzzocrea, 2002) and altered liver func-tion in mice (El-Kott et al., 2012) and poultry (Atef et al., 1991). Concentrations of GOT and GPT were not in-fluenced (P > 0.05) by treatments, showing no negative effects of nitrate feeding on liver function.
Ruminal Constituents
No effect (P > 0.05) was observed on rumen pH at 3 h after feeding (Table 3). A day effect (P < 0.05) was ob-tained for this variable, with a reduction being observed according to sampling day (data not shown). Explana-tion for this is uncertain.
Inclusion of ENP increased (P < 0.05) total SCFA and acetate concentrations compared with CTL, suggest-ing improved rumen fermentation. Nolan et al. (2010) reported a 18% increase in total SCFA concentration linked to lower mean ruminal fluid retention time when 3% KNO3 was fed to sheep. Both facts are consistent with increased rumen fermentation, but no improvements in total tract DM digestibility or in situ DM loss were ob-served (Nolan et al., 2010). Despite this, the speculation that nitrate improves rumen fermentation deserves further investigations, mostly supported by thermodynamic laws (Ungerfeld and Kohn, 2006) and observations that nitrate increased in vitro microbial synthesis (Guo et al., 2009) with some in vivo evidences (Li et al., 2012).
The ENP+CNSL showed a further increase (P < 0.05) in total SCFA and acetate concentrations when compared with ENP, indicating an additive effect be-tween nitrate and CNSL. In spite of the numerical in-crease, propionate and butyrate concentrations did not differ (P > 0.05) when ENP+CNSL was compared with ENP. The greater total SCFA concentration may indicate improved rumen fermentation by CNSL. Notwithstand-ing, rumen samples were collected only 3 h after feeding, and changes in feed intake pattern or ruminal retention time may also be responsible for this greater SCFA pro-duction at the time of sampling (Van Soest, 1994).
Isobutyrate, valerate, isovalerate, and acetate to pro-pionate (A:P) ratio were not affected (P > 0.05) by ENP or ENP+CNSL. The lack of effects on A:P ratio demon-strates that molar proportions of acetate and propionate did not change with ENP or ENP+CNSL. Despite this, in vitro (Guo et al., 2009) and in vivo (Farra and Sat-
Table 3. Ruminal constituents of Santa Inês lambs fed encapsulated nitrate or encapsulated nitrate plus cashew nut shell liquid as urea replacers
Item
Treatment1 SEM
P-value2
CTL ENP ENP+CNSL Treat. DAY T × DNo. of lambs 6 6 6 – – – –pH 6.76 6.78 6.74 0.063 0.92 <0.01 0.36SCFA,3 mM
Total 90.46c 99.47b 110.07a 2.091 <0.01 0.18 0.62Acetate 48.88c 55.21b 64.04a 1.31 <0.01 <0.01 0.43Propionate 14.77b 15.97ab 17.87a 0.81 0.04 0.64 0.97Butyrate 9.32b 11.25ab 13.01a 0.60 <0.01 0.89 0.22Isobutyrate 6.68 7.46 6.26 0.43 0.16 0.02 0.74Valerate 6.04 5.74 5.56 0.59 0.85 0.52 0.77Isovalerate 4.76 3.85 3.33 0.54 0.19 <0.01 0.84
C2:C3 3.57 3.61 3.67 0.20 0.94 0.05 0.89NH3–N, mg/dL 34.93a 26.37b 22.29c 0.281 <0.01 0.10 0.39Protozoa, × 105/mL 22.55a 19.90b 19.87b 0.41 <0.01 <0.01 0.29
a,bMeans within a row with different superscripts differ by P < 0.05.1CTL = Control: 1.5% urea in the dietary DM; ENP = 4.51% encapsulated nitrate product (60.83% NO3
– in the product DM); ENP+CNSL = 4.51% ENP containing cashew nut shell liquid (60.83% NO3
– and 2.96% cashew nut shell liquid in the product DM).2Treat. = treatment effect; DAY = day of sampling effect; T × D = interaction of treatment with day of sampling.3SCFA = short-chain fatty acids.
by Fernanda Brito on May 6, 2014www.journalofanimalscience.orgDownloaded from

El-Zaiat et al.2220
ter, 1971; Alaboudi and Jones, 1985; Nolan et al., 2010; Hulshof et al., 2012) data contradicts our findings, re-porting that nitrate supplementation increased acetate while decreasing propionate and butyrate.
Nitrate conversion to ammonia is known as a power-ful hydrogen sink able to compete not only with Archaea population for hydrogen but also with propionate- and bu-tyrate-producing bacteria. Similarly to methanogenesis, ni-trate conversion to ammonia is also energetically more fa-vorable than propionogenesis (Ungerfeld and Kohn, 2006), shifting SCFA production from propionate to acetate.
As observed here, van Zijderveld et al. (2010) have reported no changes on A:P ratio when nitrate was fed to sheep. The lack of effects was attributed to the time of rumen sampling (24 h after feeding), because meth-ane reduction was only observed in the 12-h period after feeding and the same might have occurred for A:P ratio. In our experiment rumen fluid was sampled at 3 h after feeding and we also failed to show shifts in A:P ratio. This suggests that nitrate reduction was competing most-ly with methanogenesis rather than propionogenesis. A more stable and low nitrate and nitrite concentrations in the rumen, achieved because animals were fed twice a day and due to the slow release property of ENPs, may have allowed the competition for hydrogen only with methanogenesis rather than propionogenesis.
No changes in A:P ratio were observed (P > 0.05) when ENP+CNSL was compared with ENP, indicating no benefits of CNSL. This agrees with the lack of ef-fects of CNSL on methane emission (Table 4). Anyway, it is reported that CNSL inhibits gram-positive bacteria and increases ruminal propionate production at the ex-pense of acetate (Van Nevel et al., 1971; Watanabe et al., 2010; Shinkai et al., 2012).
The NH3–N concentration decreased (P < 0.05) for ENP and ENP+CNSL when contrasted with CTL. The CTL diet had urea as NPN source, which is rapidly con-verted to ammonia in the rumen. In contrast, ENP and ENP+CNSL contained nitrate as NPN, demanding a
period of time for its total reduction to ammonia. Leng (2008) also discussed that nitrate reduction may not be coupled with ruminal ammonia release. There is a pos-sibility of intracellular ammonia production during ni-trate reduction, with only a gradual ammonia increase in rumen liquid over time. Additionally, the nitrate source used here was encapsulated, which also decreased the release rate of nitrate in the rumen.
Inclusion of ENP+CNSL resulted in a further reduc-tion (P < 0.05) of NH3–N compared with ENP. The ca-pacity of CNSL to decrease in vitro NH3 concentration has been reported, which can be explained by inhibitory effects on proteolytic or deaminating bacteria as well as on the assimilation of NH3 (Watanabe et al., 2010).
Total protozoa population decreased (P < 0.05) for ENP and ENP+CNSL compared with CTL. Protozoa establish a close symbiotic relationship with Archaea (Russell, 2002). Due to hydrogen depletion, nitrate can reduce rumen methanogenic population (van Zijderveld et al., 2010), which could negatively affect protozoa sur-vival. In contrast, other authors did not observe reduc-tions in protozoa count after feeding nitrate (Nolan et al., 2010; van Zijderveld et al., 2010; Li et al., 2012). In vitro studies have demonstrated the decline in proto-zoa count by inclusion of CNSL (Watanabe et al., 2010). However, we did not observe (P > 0.05) further decrease in protozoa population with ENP+CNSL.
Methane Production
In respiration chambers, DMI did not differ (P > 0.05) among treatments (Table 4). A day effect (P < 0.05) was observed for this variable, explained by the greater DMI over time as animals became heavier. An interaction of treatment × day (P < 0.05) was also ob-served, which is difficult to explain. The intense animal handling for methane measurements as well as for blood and ruminal sampling may have caused a feed intake variation during measurement periods.
Table 4. Methane emission of Santa Inês lambs fed encapsulated nitrate or encapsulated nitrate plus cashew nut shell liquid as urea replacers
Item
Treatment1 SEM
P-value2
CTL ENP ENP+CNSL Treat. DAY T × DNo. of lambs 6 6 6 – – – –DMI, g/d 978 980 1,065 63.8 0.56 0.01 0.04Methane
L/d 27.50a 18.27b 20.54ab 2.363 0.05 0.24 0.05L/kg BW0.75 2.04a 1.37b 1.53ab 0.176 0.05 <0.01 0.10L/kg DMI 28.57a 19.14b 19.53b 2.178 0.02 0.03 0.72
a,bMeans within a row with different superscripts differ by P < 0.05.1CTL = Control: 1.5% urea in the dietary DM; ENP = 4.51% encapsulated nitrate product (60.83% NO3
– in the product DM); ENP+CNSL = 4.51% ENP containing cashew nut shell liquid (60.83% NO3
– and 2.96% cashew nut shell liquid in the product DM).2Treat. = treatment effect; DAY = day of sampling effect; T × D = interaction of treatment with day of sampling.
by Fernanda Brito on May 6, 2014www.journalofanimalscience.orgDownloaded from

Encapsulated nitrate and cashew liquid for lambs 2221
The ENP decreased (P < 0.05) methane production (L/d and L/kg BW0.75) when compared with CTL. Meth-ane emission of ENP+CNSL (L/d and L/kg BW0.75) did not differ (P > 0.05) from CTL or ENP. This intermedi-ary methane production for ENP+CNSL is attributed to the slightly greater DMI. Expressed as liters per kilo-gram DMI, methane production was reduced (P < 0.05) for ENP and ENP+CNSL when contrasted with CTL.
Nitrate reduction to ammonia is an effective and persistent metabolic pathway in the rumen. In this ex-periment, by measuring methane emission 3 times over a 64-d period, we confirmed the results of van Zijderveld et al. (2010) in sheep and van Zijderveld et al. (2011) in dairy cows, showing that nitrate supplementation persis-tently mitigates methane.
Stoichiometrically, 1 mol of NO3– (or 62 g) convert-
ed to ammonia should reduce methane production in 1 mol (16 g or 22.4 L in STP conditions; Ungerfeld and Kohn, 2006). Therefore, 0.258 g or 0.361 L of methane is expected to be mitigated for each gram of NO3
– ingested. Considering only the ENP treatment and assuming a ho-mogeneous nitrate ingestion in the total mixed diet (i.e., no feed sorting), lambs consumed 26.9 g of NO3
–, corre-sponding to a theoretical methane decrease of 9.71 L per day. The methane reduction for ENP was 9.23 L/d, which means 95% of theoretical methane inhibition.
In recent studies, measured methane mitigation rep-resented 97.5 (Li et al., 2012), 89 (van Zijderveld et al., 2010), 86 (Li et al., 2013), 78 (Nolan et al., 2010), and 59% (van Zijderveld et al., 2011) of theoretical methane inhibition. The 95% value observed here indicates that nitrate was being reduced to ammonia and competing for hydrogen almost exclusively with methanogenesis. In contrast, when low nitrate efficiency on methane inhi-bition is observed, probably more reducing equivalents are being obtained from propionogenesis rather than methanogenesis (van Zijderveld et al., 2011).
Several factors may interfere with efficiency of ni-trate reduction, although little is known about it. Despite this, amount of nitrate ingested, intake rate of nitrate, type of diet (e.g., roughage inclusion; N and S concentrations), and type of animal (Leng, 2008) as well as feeding prac-tices (e.g., frequency of feed delivery) affect ruminal ni-trate utilization and, consequently, methane reduction.
The slow release nitrate rate achieved by encapsula-tion constitutes an advantage for the efficiency of nitrate reduction. Nitrate salts have high solubility in water and are promptly available in the rumen. Lower than pre-dicted methane mitigation reported by others might be explained by incomplete nitrate reduction to ammonia or nitrate/nitrite absorption through rumen wall and loss in urine. Lewis (1951) introduced nitrate directly into the rumen and recovered 8% of the original amount in urine. Despite this, as observed for urea evidences suggest that
nitrate can be recycled to rumen by saliva and/or rumen wall (Wang et al., 1961; Lewicki et al., 1998; Leng, 2008).
The CNSL addition did not promote (P > 0.10) fur-ther reduction in methane emission compared with ENP. Considering this, the speculated synergism between nitrate and CNSL was not confirmed. The absence of changes on propionate concentration with CNSL inclu-sion (Table 3) supports the lack of effect on methane production. Therefore, the hydrogen sink established by nitrate reduction may have been strong enough to offset the effects of CNSL on methane mitigation.
One other possible explanation is related to the total anacardic acid content, usually ranging from 60 to 65% in raw CNSL. In this experiment, the CNSL used contained 44.68% of total anacardic acid. Problems related to dos-age can be discounted, because lambs fed ENP+CNSL consumed 1.38 g of CNSL per day (4.29 g/100 kg BW considering average BW of 32 kg). According to Shinkai et al. (2012), inclusion of 4 g of CNSL per 100 kg BW ef-fectively reduced methane emission in dairy cows.
There was a significant (P < 0.05) day effect for meth-ane emission expressed as liters per kilogram BW0.75 and liters per kilogram DMI. A reduction for this vari-able was observed over time, averaging 1.80, 1.74, and 1.39 L/kg BW0.75 and 23.7, 23.1, and 20.4 L/kg DMI for measurements in the beginning, middle, and end of the experiment, respectively (data not shown).
A significant treatment × day interaction (P = 0.05) was observed for methane production expressed as liters per day. Because methane emission is closely related to DMI and ruminal fermented organic matter, the obtained interaction on methane was a consequence of the same interaction observed for DMI. The reason for this inter-action is uncertain and may be related to the interference on animal behavior due to chambers.
Growth Performance Data
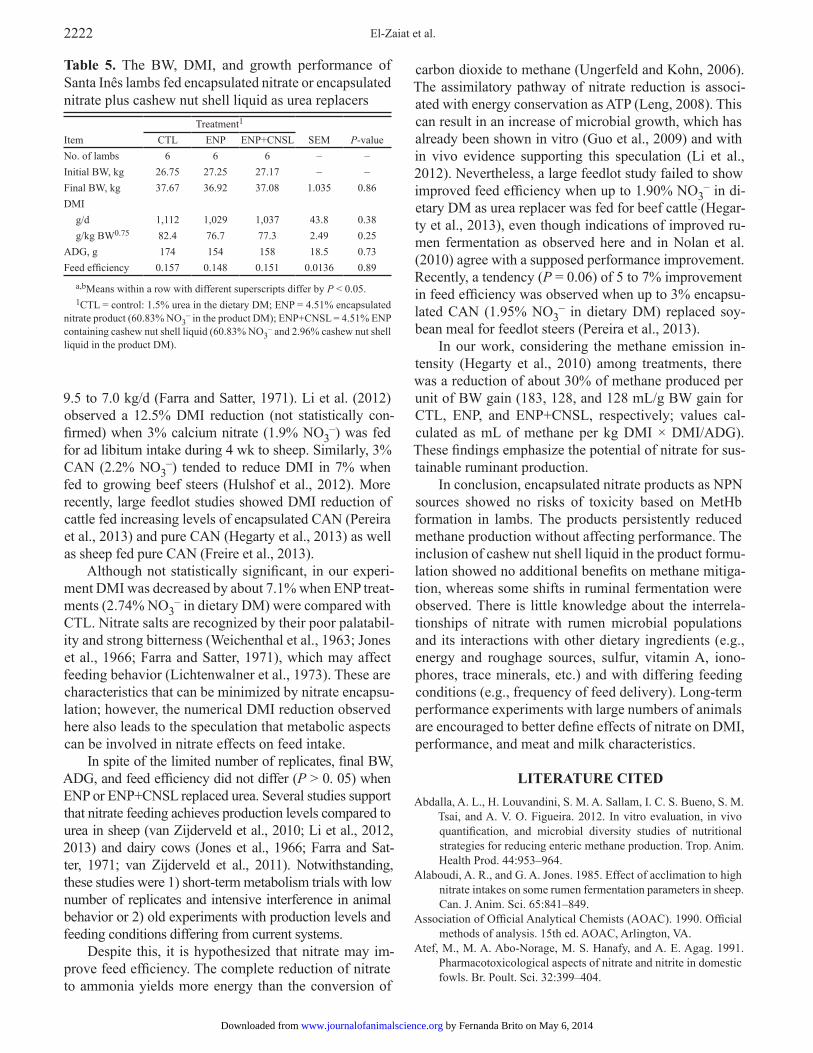
The DMI (g/d and g/kg BW0.75) was not affected (P > 0.05) by treatments (Table 5). As observed here, other metabolism trials with sheep (Nolan et al., 2010; van Zijderveld et al., 2010; Li et al., 2012) and dairy cows (van Zijderveld et al., 2011) also did not report ef-fects of nitrate on DMI. Despite this, DMI data obtained here and in the referred studies must be interpreted with caution due to feed intake restriction imposed to mini-mize interference on methane measurements or due to the limited feed intake normally observed for animals in metabolism crates or respiration chambers.
Taking into account the scarcity of experiments with large number of animals, some researches indicate that ni-trate salts may reduce DMI. Using a single cow, increas-ing levels of a mixture of potassium and sodium nitrate (from 0.67 to 5.81% NO3
– in diet) decreased DMI from
by Fernanda Brito on May 6, 2014www.journalofanimalscience.orgDownloaded from
El-Zaiat et al.2222
9.5 to 7.0 kg/d (Farra and Satter, 1971). Li et al. (2012) observed a 12.5% DMI reduction (not statistically con-firmed) when 3% calcium nitrate (1.9% NO3
–) was fed for ad libitum intake during 4 wk to sheep. Similarly, 3% CAN (2.2% NO3
–) tended to reduce DMI in 7% when fed to growing beef steers (Hulshof et al., 2012). More recently, large feedlot studies showed DMI reduction of cattle fed increasing levels of encapsulated CAN (Pereira et al., 2013) and pure CAN (Hegarty et al., 2013) as well as sheep fed pure CAN (Freire et al., 2013).
Although not statistically significant, in our experi-ment DMI was decreased by about 7.1% when ENP treat-ments (2.74% NO3
– in dietary DM) were compared with CTL. Nitrate salts are recognized by their poor palatabil-ity and strong bitterness (Weichenthal et al., 1963; Jones et al., 1966; Farra and Satter, 1971), which may affect feeding behavior (Lichtenwalner et al., 1973). These are characteristics that can be minimized by nitrate encapsu-lation; however, the numerical DMI reduction observed here also leads to the speculation that metabolic aspects can be involved in nitrate effects on feed intake.
In spite of the limited number of replicates, final BW, ADG, and feed efficiency did not differ (P > 0. 05) when ENP or ENP+CNSL replaced urea. Several studies support that nitrate feeding achieves production levels compared to urea in sheep (van Zijderveld et al., 2010; Li et al., 2012, 2013) and dairy cows (Jones et al., 1966; Farra and Sat-ter, 1971; van Zijderveld et al., 2011). Notwithstanding, these studies were 1) short-term metabolism trials with low number of replicates and intensive interference in animal behavior or 2) old experiments with production levels and feeding conditions differing from current systems.
Despite this, it is hypothesized that nitrate may im-prove feed efficiency. The complete reduction of nitrate to ammonia yields more energy than the conversion of
carbon dioxide to methane (Ungerfeld and Kohn, 2006). The assimilatory pathway of nitrate reduction is associ-ated with energy conservation as ATP (Leng, 2008). This can result in an increase of microbial growth, which has already been shown in vitro (Guo et al., 2009) and with in vivo evidence supporting this speculation (Li et al., 2012). Nevertheless, a large feedlot study failed to show improved feed efficiency when up to 1.90% NO3
– in di-etary DM as urea replacer was fed for beef cattle (Hegar-ty et al., 2013), even though indications of improved ru-men fermentation as observed here and in Nolan et al. (2010) agree with a supposed performance improvement. Recently, a tendency (P = 0.06) of 5 to 7% improvement in feed efficiency was observed when up to 3% encapsu-lated CAN (1.95% NO3
– in dietary DM) replaced soy-bean meal for feedlot steers (Pereira et al., 2013).
In our work, considering the methane emission in-tensity (Hegarty et al., 2010) among treatments, there was a reduction of about 30% of methane produced per unit of BW gain (183, 128, and 128 mL/g BW gain for CTL, ENP, and ENP+CNSL, respectively; values cal-culated as mL of methane per kg DMI × DMI/ADG). These findings emphasize the potential of nitrate for sus-tainable ruminant production.
In conclusion, encapsulated nitrate products as NPN sources showed no risks of toxicity based on MetHb formation in lambs. The products persistently reduced methane production without affecting performance. The inclusion of cashew nut shell liquid in the product formu-lation showed no additional benefits on methane mitiga-tion, whereas some shifts in ruminal fermentation were observed. There is little knowledge about the interrela-tionships of nitrate with rumen microbial populations and its interactions with other dietary ingredients (e.g., energy and roughage sources, sulfur, vitamin A, iono-phores, trace minerals, etc.) and with differing feeding conditions (e.g., frequency of feed delivery). Long-term performance experiments with large numbers of animals are encouraged to better define effects of nitrate on DMI, performance, and meat and milk characteristics.
LITERATURE CITEDAbdalla, A. L., H. Louvandini, S. M. A. Sallam, I. C. S. Bueno, S. M.
Tsai, and A. V. O. Figueira. 2012. In vitro evaluation, in vivo quantification, and microbial diversity studies of nutritional strategies for reducing enteric methane production. Trop. Anim. Health Prod. 44:953–964.
Alaboudi, A. R., and G. A. Jones. 1985. Effect of acclimation to high nitrate intakes on some rumen fermentation parameters in sheep. Can. J. Anim. Sci. 65:841–849.
Association of Official Analytical Chemists (AOAC). 1990. Official methods of analysis. 15th ed. AOAC, Arlington, VA.
Atef, M., M. A. Abo-Norage, M. S. Hanafy, and A. E. Agag. 1991. Pharmacotoxicological aspects of nitrate and nitrite in domestic fowls. Br. Poult. Sci. 32:399–404.
Table 5. The BW, DMI, and growth performance of Santa Inês lambs fed encapsulated nitrate or encapsulated nitrate plus cashew nut shell liquid as urea replacers
Item
Treatment1 SEM
P-valueCTL ENP ENP+CNSL
No. of lambs 6 6 6 – –Initial BW, kg 26.75 27.25 27.17 – –Final BW, kg 37.67 36.92 37.08 1.035 0.86DMI
g/d 1,112 1,029 1,037 43.8 0.38g/kg BW0.75 82.4 76.7 77.3 2.49 0.25
ADG, g 174 154 158 18.5 0.73Feed efficiency 0.157 0.148 0.151 0.0136 0.89
a,bMeans within a row with different superscripts differ by P < 0.05.1CTL = control: 1.5% urea in the dietary DM; ENP = 4.51% encapsulated
nitrate product (60.83% NO3– in the product DM); ENP+CNSL = 4.51% ENP
containing cashew nut shell liquid (60.83% NO3– and 2.96% cashew nut shell
liquid in the product DM).
by Fernanda Brito on May 6, 2014www.journalofanimalscience.orgDownloaded from

Encapsulated nitrate and cashew liquid for lambs 2223
Burrows, G. E., G. W. Horn, R. W. McNew, L. I. Croy, R. D. Keeton, and J. Kyle. 1987. The prophylactic effect of corn supplementation on ex-perimental nitrate intoxication in cattle. J. Anim. Sci. 64:1682–1689.
Cockburn, A., G. Brambilla, M.-L. Fernández, D. Arcella, L. R. Bor-dajandi, B. Cottrill, C. van Peteghem, and J.-L. Dorne. 2013. Nitrite in feed: From animal health to human health. Toxicol. Appl. Pharmacol. 270:209–217.
Dehority, B. A. 1993. Laboratory manual for classification and mor-phology of rumen ciliate protozoa. CRC Press, Boca Raton, FL.
El-Kott, A. F., A. M. Abdel-Aziz, A. El-K. M. A. El-Latif, E. M. El-Gamal, and A. M. Khalil. 2012. Amelioration of nitrate-induced hepatotoxicity by Allium sativum in mice. J. Med. Sci. 12:85–91.
Farra, P. A., and L. D. Satter. 1971. Manipulation of the ruminal fer-mentation. III. Effect of nitrate on ruminal volatile fatty acid production and milk composition. J. Dairy Sci. 54:1018–1024.
Fleck, A., F. Hawker, P. I. Wallace, G. Raines, J. Trotters, I. M. Led-ingham, and K. C. Calma. 1985. Increased vascular permeabil-ity: A major cause of hypoalbuminaemia in disease and injury. Lancet 325(8432):781–784.
Freire, A. P. A., R. A. Souza, D. M. Polizel, R. S. Gentil, A. V. Pires, R. C. Araujo, and I. Susin. 2013. Growth and carcass charac-teristics of ewe lambs fed high-concentrate diets containing increasing levels of calcium nitrate. J. Anim. Sci. 91(E-Suppl. 2):368–369 (Abstr.).
Gangolli, S. D., P. A. van den Brandt, V. J. Feron, C. Janzowsky, J. H. Koeman, G. J. A. Speijers, B. Spiegelhalder, R. Walker, and J. S. Wishnok. 1994. Nitrate, nitrite and N-nitroso compounds. Eur. J. Pharmacol. 292:1–38.
Goering, H. K., and P. J. Van Soest. 1970. Forage fiber analysis (ap-paratus, reagents, procedures and some applications). Agric. Handbook No. 379. ARS–USDA, Washington, DC.
Guo, W. S., D. M. Schaefer, X. X. Guo, L. P. Ren, and Q. X. Meng. 2009. Use of nitrate-nitrogen as a sole dietary nitrogen source to inhibit ruminal methanogenesis and to improve microbial ni-trogen synthesis in vitro. Asian-Aust. J. Anim. Sci. 22:542–549.
Hegarty, R. S., D. Alcock, D. L. Robinson, J. P. Goopy, and P. E. Vercoe. 2010. Nutritional and flock management options to re-duce methane output and methane per unit product from sheep enterprises. Adv. Anim. Biosci. 50:1026–1033.
Hegarty, R. S., J. Miller, D. L. Robinson, L. Li, N. Oelbrandt, K. Luijben, J. McGrath, G. Bremner, and H. B. Perdok. 2013. Growth, efficiency and carcass attributes of feedlot cattle supple-mented with calcium nitrate or urea. Animal 4(Pt. 2):440 (Abstr.).
Hepler, O. E. 1966. Manual of clinical laboratory methods. Charles C. Thomas Publisher Ltd., Springfield, IL.
Hewlett Packard. 1998. The separation of saturated and unsaturated acids and FAMEs using HP-FFAP and HP-INNOWax columns. Application Note 228–398. www.chem.agilent.com/Library/ap-plications/59663971.pdf. (Accessed 20 January 2011.)
Hulshof, R. B. A., A. Berndt, W. J. J. Gerrits, J. Dijkstra, S. M. van Zijderveld, J. R. Newbold, and H. B. Perdok. 2012. Dietary ni-trate supplementation reduces methane emission in beef cattle fed sugarcane based diets. J. Anim. Sci. 90:2317–2323.
Iwamoto, M., N. Asanuma, and T. Hino. 2002. Ability of Selenomo-nas ruminantium, Veillonella parvula, and Wolinella succino-genes to reduce nitrate and nitrite with special reference to the suppression of ruminal methanogenesis. Anaerobe 8:209–215.
Jainudeen, M. R., W. Hansel, and K. L. Davison. 1964. Nitrate toxic-ity in dairy heifers. 2. Erythropoietic responses to nitrate inges-tion during pregnancy. J. Dairy Sci. 47:1382–l387.
Jones, I. R., P. H. Weswig, J. F. Bone, M. A. Peters, and S. O. Alpan. 1966. Effect of high-nitrate consumption on lactation and vita-min A nutrition of dairy cows. J. Dairy Sci. 49:491–499.
Kaneko, J. J. 1989. Clinical biochemistry of domestic animals. 4th ed. Acad. Press, New York.
Knowles, T. G., and P. D. Warriss. 2007. Stress physiology of ani-mals during transport. In: T. Grandin, editor, Livestock handling and transport. CABI Publishing, Wallingford, UK. p. 312–328.
Leng, R. A. 2008. The potential of feeding nitrate to reduce enteric methane production in ruminants. A report to the department of climate change. Commonwealth Government of Australia, Can-berra. www.penambulbooks.com/Downloads/Leng-Final%20Modified%20%2017-9-2008.pdf (Accessed 14 December 2013.)
Lewicki, J., M. Wiechetek, W. B. Souffrant, W. Karlik, and S. Gar-wacki. 1998. The fate of nitrogen from 15N-labeled nitrate after single intravenous administration of Na15NO3 in sheep. Can. J. Physiol. Pharmacol. 76:850–857.
Lewis, D. 1951. The metabolism of nitrate and nitrite in the sheep. 1. The reduction of nitrate in the rumen of the sheep. Biochem. J. 48:175–180.
Li, L., J. Davis, J. Nolan, and R. Hegarty. 2012. An initial investiga-tion on rumen fermentation pattern and methane emission of sheep offered diets containing urea or nitrate as the nitrogen source. Anim. Prod. Sci. 52:653–659.
Li, L., C. I. Silveira, J. V. Nolan, I. R. Godwin, R. A. Leng, and R. S. Hegarty. 2013. Effect of added dietary nitrate and elemental sulfur on wool growth and methane emission of Merino lambs. Anim. Prod. Sci. 53:1195–1201.
Lichtenwalner, R. E., J. P. Fontenot, and R. E. Tucker. 1973. Effect of source of supplemental nitrogen and level of nitrate on feedlot performance and vitamin A metabolism of fattening beef calves. J. Anim. Sci. 37:837–847.
Lin, M., W. Guo, Q. Meng, D. M. Stevenson, P. J. Weimer, and D. M. Schaefer. 2013. Changes in rumen bacterial community com-position in steers in response to dietary nitrate. Appl. Environ. Microbiol. 97:8719–8727.
Nolan, J. V., R. S. Hegarty, J. Hegarty, I. R. Godwin, and R. Woodgate. 2010. Effects of dietary nitrate on fermentation, methane produc-tion and digesta kinetics in sheep. Anim. Prod. Sci. 50:801–806.
NRC. 2001. Nutrient requirements of dairy cattle. 7th rev. ed. Natl. Acad. Press, Washington, DC.
NRC. 2007. Nutrient requirements of small ruminants: Sheep, goats, cer-vids, and New World camelids. Natl. Acad. Press, Washington, DC.
Oliveira, M. S. C., S. M. Morais, D. V. Magalhães, W. P. Batista, I. G. P. Vieira, A. A. Craveiro, J. E. S. A. Manezes, A. F. U. Carvalho, and G. P. G. Lima. 2011. Antioxidant, larvicidal and antiacetyl-cholinesterase activities of cashew nut shell liquid constituents. Acta Trop. 117:165–170.
Pereira, M. L. R., V. R. M. Couto, R. C. Araujo, F. A. Lino, A. M. Mobiglia, J. A. Silva, A. C. Carvalho, P. H. J. Cunha, and J. J. R. Fernandes. 2013. Encapsulated nitrate product replacing soybean meal on feedlot performance of finishing beef steers. J. Anim. Sci. 91(E-Suppl. 2):526 (Abstr.).
Preston, T. R. 1995. Tropical animal feeding: A manual for research workers. Animal Production and Health Paper 126. Food and Agriculture Organization of the United Nations, Rome, Italy.
Robertson, J. B., and P. J. Van Soest. 1981. The detergent system of analysis. In: W. P. T. James and O. Theander, editors, The analysis of dietary fibre in food. Marcel Dekker, New York, NY. p. 123–158.
Russell, J. B. 2002. Rumen microbiology and its role in ruminant nutrition. Cornell Univ. Press, Ithaca, NY.
Salvemini, D., and S. Cuzzocrea. 2002. Superoxide, superoxide dismutase and ischemic injury. Curr. Opin. Investig. Drugs 3:886–895.
Sato, K. 2005. Methemoglobin. In: O. Suzuki and K. Watanabe, edi-tors, Drugs and poisons in humans – A handbook of practical analysis. Springer-Verlag, Heidelberg, Germany. p. 655–657.
by Fernanda Brito on May 6, 2014www.journalofanimalscience.orgDownloaded from

El-Zaiat et al.2224
Shinkai, T., O. Enishi, M. Mitsumori, K. Higuchi, Y. Kobayashi, A. Takenaka, K. Nagashima, M. Mochizuki, and Y. Kobayashi. 2012. Mitigation of methane production from cattle by feeding cashew nut shell liquid. J. Dairy Sci. 95:5308–5316.
Ungerfeld, E. M., and R. A. Kohn. 2006. The role of thermodynam-ics in the control of ruminal fermentation. In: K. Sejrsen, T. Hvelplund, and M. O. Nielsen, editors, Ruminant physiology: Digestion, metabolism and impact of nutrition on gene expres-sion, immunology and stress. Wageningen Academic Publish-ers, Wageningen, The Netherlands. p. 55–85.
Van Nevel, C. J., D. I. Demeyer, and H. K. Henderickx. 1971. Effect of fatty acid derivatives on rumen methane and propionate in vitro. Appl. Microbiol. 21:365–366.
Van Soest, P. J. 1994. Nutritional ecology of the ruminant. 2nd ed. Cornell Univ. Press, Ithaca, NY.
Van Soest, P. J., J. B. Robertson, and B. A. Lewis. 1991. Methods for dietary fiber, neutral detergent fiber, and nonstarch polysaccharides in relation to animal nutrition. J. Dairy Sci. 74:3583–3597.
van Zijderveld, S. M., W. J. J. Gerrits, J. A. Apajalahti, J. R. Newbold, J. Dijkstra, R. A. Leng, and H. B. Perdok. 2010. Nitrate and sul-fate: Effective alternative hydrogen sinks for mitigation of ru-minal methane production in sheep. J. Dairy Sci. 93:5856–5866.
van Zijderveld, S. M., W. J. J. Gerrits, J. Dijkstra, J. R. Newbold, R. B. A. Hulshof, and H. B. Perdok. 2011. Persistency of methane mitigation by dietary nitrate supplementation in dairy cows. J. Dairy Sci. 94:4028–4038.
Wada, H., and W. Kamiike. 1990. Aspartate aminotransferase iso-zymes and their clinical significance. In: Z. I. Ogita and C. L. Markert, editors, Isozymes: Structure, function, and use in biol-ogy and medicine. Wiley-Liss, New York. p. 853-876.
Wang, L. C., J. Garcia-Rivera, and R. H. Burris. 1961. Metabolism of nitrate by cattle. Biochem. J. 81:237–242.
Watanabe, Y., R. Suzuki, S. Koike, K. Nagashima, M. Mochizuki, R. J. Forster, and Y. Kobayashi. 2010. In vitro evaluation of cashew nut shell liquid as a methane-inhibiting and propionate-enhanc-ing agent for ruminants. J. Dairy Sci. 93:5258–5267.
Weichenthal, B. A., L. B. Embry, R. J. Emerick, and F. W. Whetzal. 1963. Influence of sodium nitrate, vitamin A and protein level on feedlot performance and vitamin A status of fattening cattle. J. Anim. Sci. 22:979–984.
by Fernanda Brito on May 6, 2014www.journalofanimalscience.orgDownloaded from

Referenceshttp://www.journalofanimalscience.org/content/92/5/2214#BIBLThis article cites 35 articles, 4 of which you can access for free at:
by Fernanda Brito on May 6, 2014www.journalofanimalscience.orgDownloaded from
Copyright © 2022 FDOKUMEN