Epidemiology of cashew anthracnose (Colletotrichum gloeosporioides Penz.) in Mozambique
8
This article appeared in a journal published by Elsevier. The attached copy is furnished to the author for internal non-commercial research and education use, including for instruction at the authors institution and sharing with colleagues. Other uses, including reproduction and distribution, or selling or licensing copies, or posting to personal, institutional or third party websites are prohibited. In most cases authors are permitted to post their version of the article (e.g. in Word or Tex form) to their personal website or institutional repository. Authors requiring further information regarding Elsevier’s archiving and manuscript policies are encouraged to visit: http://www.elsevier.com/authorsrights
-
Upload
independent -
Category
Documents
-
view
1 -
download
0
Transcript of Epidemiology of cashew anthracnose (Colletotrichum gloeosporioides Penz.) in Mozambique

This article appeared in a journal published by Elsevier. The attachedcopy is furnished to the author for internal non-commercial researchand education use, including for instruction at the authors institution
and sharing with colleagues.
Other uses, including reproduction and distribution, or selling orlicensing copies, or posting to personal, institutional or third party
websites are prohibited.
In most cases authors are permitted to post their version of thearticle (e.g. in Word or Tex form) to their personal website orinstitutional repository. Authors requiring further information
regarding Elsevier’s archiving and manuscript policies areencouraged to visit:
http://www.elsevier.com/authorsrights

Author's personal copy
Epidemiology of cashew anthracnose (Colletotrichum gloeosporioidesPenz.) in Mozambique
A. Uaciquete a,*, L. Korsten b, J.E. Van der Waals b
a Instituto de Investigação Agrária de Moçambique, Centro Zonal Nordeste, Nampula, MozambiquebDepartment of Microbiology and Plant Pathology, University of Pretoria, 0002 Pretoria, South Africa
a r t i c l e i n f o
Article history:Received 8 July 2012Received in revised form18 February 2013Accepted 24 February 2013
Keywords:AnacardiumNutsEpidemiologyDisease assessment
a b s t r a c t
Anthracnose of cashew (Anacardium occidentale) was studies on various genotypes and locations inMozambique. Colletotrichum gloeosporioides was identified as the anthracnose causal agent using poly-merase chain reaction. The relationships between incidence and severity of anthracnose on cashewgenotypes were statistically analyzed by regression. Anthracnose leaf incidence, which is practically easyto evaluate, was consistently associated with leaf severity, and their relationships can be estimated usingthe restricted exponential function across locations, crop seasons, genotype and fungicide trials. Pooleddata enabled estimation of initial incidence of 1.43% with percentage variance accounting for 83.2 andstandard error of 8.3. By computing incidence data into the summary equation, 24 changes of 0, 1, 5, 10and 40%, resulted in changes of severity estimates of 0.01, 0.05, 0.10, 0.50 and 1.00%, respectively. Themaximum disease incidence was estimated as 80% when the severity reached only 5%. Increase inseverity was observed afterward, approached a maximum of 25% when leaf detachment is observed. Theuse of incidence data for epidemic comparisons, genotype and fungicide evaluation in cashew orchards isrecommended. Anthracnose incidence on leaves however, could not predict incidence on nuts.
� 2013 Elsevier Ltd. All rights reserved.
1. Introduction
Fungal species in the genus Colletotrichum cause anthracnose onvarious plants. In general, morphological and cultural characterscommonly used to differentiate Colletotrichum species includeconidial morphology, presence or absence of setae, presence orabsence of teleomorph, colony color, pigment production, growthrate and appressorium features (Ivey et al., 2004). These charac-teristics have been used for the descriptions of various isolates ofColletotrichum gloeosporioides on cashew (Muniz et al., 1998).However, because definitive identification of Colletotrichum speciesbased on morphology is difficult due to overlapping ranges ofconidial and colony characteristics and the fact that variation inmorphology is accepted for isolates within species, a number ofmolecular methods have been used to characterize species of Col-letotrichum (Ivey et al., 2004).
Disease symptoms manifest in both leaves and young nuts(Freire et al., 2002). Severe infection on adult plants results indefoliation during shoot development, death of inflorescences
and later necrosis and falling of immature nuts (Freire andCardoso, 2003). Damage assessment can therefore be done atany of the above stages depending on the purpose of the evalua-tion, which can be fungicide (Da Matta and Lellis, 1973) orgermplasm screening (Cardoso et al., 1999), or epidemiologicalinvestigations (McRoberts et al., 2003; Cardoso et al., 2004). In anyof the above approaches, terminology such as disease incidence,disease severity, disease density and others are commonly used tomeasure the disease. Relative advantages and practical applica-tions of their relationships have been discussed (McRoberts et al.,2003). Nevertheless, practical limitations resulting from incon-sistency of the relationships across locations, stage of theepidemic, host genotype and crop cycle have been found (Jamesand Shih, 1973; Rouse et al., 1981; Chuang and Jeger, 1987).Some other authors have however found simple, consistent anduseful relationships in different pathosystems (Silva-Acuna et al.,1999). Tedious and time consuming work associated with severitymeasurement has been replaced by the easily measured incidence(Silva-Acuna et al., 1999; Cardoso et al., 2004). In this study, PCRtechnique was used to establish the identity of the causal agent ofcashew anthracnose and a standardized visual key (Nathaniels,1996) was adopted with an objective to explore the use of therelationship between incidence and severity to comparatively
* Corresponding author. Tel.: þ258 824062230; fax: þ258 21418552.E-mail address: [email protected] (A. Uaciquete).
Contents lists available at SciVerse ScienceDirect
Crop Protection
journal homepage: www.elsevier .com/locate/cropro
0261-2194/$ e see front matter � 2013 Elsevier Ltd. All rights reserved.http://dx.doi.org/10.1016/j.cropro.2013.02.016
Crop Protection 49 (2013) 66e72
Author's personal copy
characterize the development of cashew anthracnose epidemicsacross seasons, genotypes and locations. Furthermore, we explorethe possibility of developing a predictive model for incidence onnuts based on incidence or severity on leaves produced before thesetting of nuts.
2. Materials and methods
2.1. Pathogen identification
Anthracnose symptomatic samples were collected from all thetrial sites and pathogen isolations made on potato dextrose agar(PDA). Fungal mycelia were then harvested from PDA cultures inlaminar hood and total genomic DNA extracted using the DNeasyPlant Mini Kit (Qiagen Inc.) (Anonymous, 2004). For PCR amplifi-cation, species-specific primers from the ITS1 region of theribosomal DNA gene (Ivey et al., 2004) CaInt2 (50-GGC-GCCGGCCCCGTCACGGGGG-30) and CgInt (50-GGCCTCCCGCCTCCGGGCGG-30) for Colletotrichum acutatum and C. gloeosporioidesrespectively, were individually coupled with the universal andconserved primer ITS4 (Ivey et al., 2004; Whitelaw-Weckert et al.,2007). Amplification reactions were performed in an EpperdofMaster Thermocycler (Merck Chemicals Pty Ltd, South Africa). Eachreaction mix (microL) contained: 0.5 mL DNA, 0.5 mL of 2.5 mM eachdNTP, 1.25 mL of 50 mM MgCl2, 1� NH4 reaction buffer, 0.3 mL ofeach 1� diluted primer (24.20 nmol CaInt2; 25.30 nmol CgInt and15 mg/l ITS4), 0.25 mL of Taq DNA polymerase. Amplification cycleswere as described by Ivey et al. (2004). PCR products (0.5 mL) wereseparated by horizontal gel electrophoresis in a Maxicell EC360Melectrophoretic gel system (Electrophoretic gel system, E-C Appa-ratus Corporation) coupled to a 250/2.5 voltmeter model (Bio-Rad,South Africa). One percent agarose gels were immersed on TBEbuffer (90mM Triseborate,1 mMEDTA, pH 8.0) at 100 V for 60min.The gels contained 10 mg/ml ethidium bromide as stain. The DNAbands were visualized under UV light and photographed with theaid of Vilber Lourmat photosystem (Marne la Vallee, France).
2.2. Epidemiological analyses
Cashew orchards were located in four sites of NorthernMozambique (Table 1). The plants were rain fed and croppingpractices consisted of weeding and application of fungicidesagainst powdery mildew.
Fungicides used were: Volcano Richter (hexaconazole SC 5%,Volcano AgroScience (Pty) Ltd) and Voltriad (Triadimenol SC 5%,Volcano AgroScience (Pty)) both at a rate of 10 ml/L/tree offormulated product, three times a season at 21-day intervals(Sijaona andMansfield, 2001). At Rapale, datawere collected from afungicide trial with weekly applications of hexaconazole.
At the beginning of each crop season, from both north and southsides of individual trees, five shoots were tagged with a sisal cord ofapproximately 25 cm (Sijaona and Mansfield, 2001). Shoot devel-opment stages were 74 recorded by allocating discrete numbersfrom 1 to 9 at shoot burst and nut maturation respectively(Conticini, 1982). New shoots are easily recognizable since they aregreener and tender compared to older ones from the previous cropseason.
The disease was assessed on a maximum of ten new leaves percrop season per shoot and for two consecutive crop seasons 2006and 2007. Assessments began in May or June and ended inSeptember according to the development and maturation ofshoots. Incidence and severity were evaluated simultaneouslybased on the standardized leaf damage scale developed forcashew powdery mildew (Nathaniels, 1996). In this study, severitydescribed the percentage of necrotic leaf area while incidencereflected the percentage of diseased leaves (McRoberts et al.,2003; Cardoso et al., 2004). Later in each crop season, anthrac-nose incidence on the nuts was also assessed as percentage ofsymptomatic immature nuts/panicle/plant. Disease scores wereinitially processed to return plant mean scores as detailed byMasawe et al. (1997).
For each individual crop season, the cashew phenology, inci-dence and severity data were tabulated in an excel spreadsheet perlocation, date of observation, replicate treatment and plant. In eachlocation and cropping season, the progress of phenological stages ofthe crop was obtained by plotting means over treatment and plantagainst the date of recording.
Regression analysis of incidence and severity from un-transformed data were performed using the GenStat (2003) pack-age for windows. Variables means over date and treatment werecomputed to fit an exponential function (Snedecor and Cochran,1980; Cornell and Berger, 1987). Incidence was the responsevariant and severity the explanatory (McRoberts et al., 2003;Cardoso et al., 2004). Furthermore, leaf severity and incidence wereused as explanatory to the incidence on nuts.
Daily rainfall data were obtained from the closest districtdirectorate of agriculture of each site. Weekly sums were computedand graphically represented for each location.
3. Results
3.1. Pathogen identification
The species specific primer CgInt coupled with the ITS4 primersuccessfully amplified the same size fragment from genomic DNAof all isolates as the positive reference C. gloeosporioides isolatefrom mango. No additional band was observed closer to the refer-ence (Fig. 1). No PCR-amplified product for primer CaInt2 wasdetected. Negative controls had no amplification.
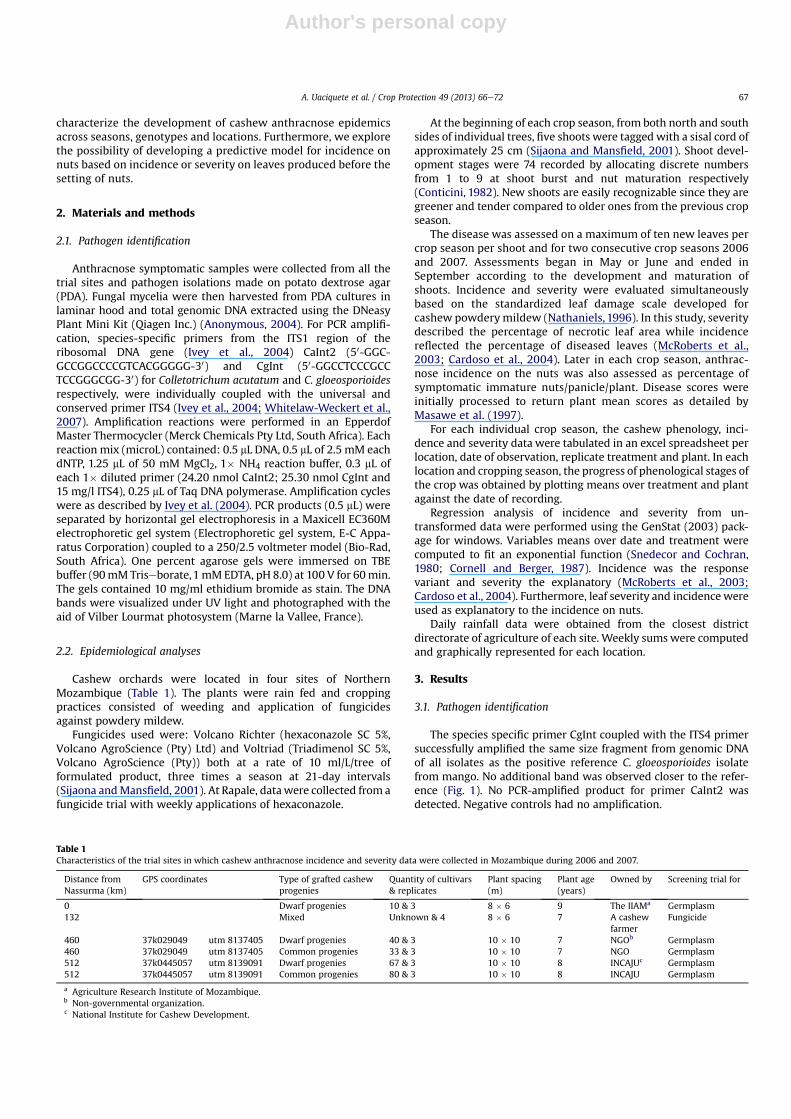
Table 1Characteristics of the trial sites in which cashew anthracnose incidence and severity data were collected in Mozambique during 2006 and 2007.
Distance fromNassurma (km)
GPS coordinates Type of grafted cashewprogenies
Quantity of cultivars& replicates
Plant spacing(m)
Plant age(years)
Owned by Screening trial for
0 Dwarf progenies 10 & 3 8 � 6 9 The IIAMa Germplasm132 Mixed Unknown & 4 8 � 6 7 A cashew
farmerFungicide
460 37k029049 utm 8137405 Dwarf progenies 40 & 3 10 � 10 7 NGOb Germplasm460 37k029049 utm 8137405 Common progenies 33 & 3 10 � 10 7 NGO Germplasm512 37k0445057 utm 8139091 Dwarf progenies 67 & 3 10 � 10 8 INCAJUc Germplasm512 37k0445057 utm 8139091 Common progenies 80 & 3 10 � 10 8 INCAJU Germplasm
a Agriculture Research Institute of Mozambique.b Non-governmental organization.c National Institute for Cashew Development.
A. Uaciquete et al. / Crop Protection 49 (2013) 66e72 67

Author's personal copy
3.2. Epidemiology
The relationship between incidence and severity of cashew leafanthracnose was consistently characterized by the restrictedexponential function (1) across locations, crop seasons, cashewgenotype or fungicide trials (Table 2).
I ¼ bð1� e� aSÞðP < 0:001Þ (1)
In this function, I stands for incidence, S for severity, b for estimatedmaximum incidence (emi) and a for estimated initial disease inci-dence (eii).
The potential for high epidemics in each location or crop seasonwas expressed by the emi value (asymptote of the restrictedexponential curve) noting however that the explicit maximum is100% (McRoberts et al., 2003). Thus, at the Nassuruma germplasmscreening trial, for the 2007 crop season the emi value was 123.5%(Fig. 2C) against 68.56% for 2006 (Fig. 2A). Therefore, the weatherconditions in 2006 were less conducive to disease spread than thefollowing crop season.
Estimated initial incidence (eii) in the restricted exponentialfunction (Table 2) expresses the abundance of inoculum or mini-mum aggregation of the pathogen that is not visually recordable(McRoberts et al., 2003). In the cashew anthracnose pathosystem,such inoculum may derive from 123 nearby infected plants andmummified fruit. More predominant inoculum may come fromleaves of previous vegetative growth that anticipate the repro-ductive growth within a year. Thus, at Nassuruma, the eii value washigher (8.74%) in the 2006 crop season than 2007 (3.00%) (Table 2).
In contrast, at Mocuba, the 2006 crop season showed a relativelyhigher emi value compared to year 2007 for both dwarf (Fig. 3A andE) and common types (Fig. 3C and G). AtMocuba and Pebane, the eiivalues of both dwarf and common cashew type trials for the cropseason 2006 were lower compared to 2007 (Table 2). This suggeststhat in the same location, the abundance of viable initial inoculumvaries from one season to another.
At the Mocuba trial on dwarf cashews, the emi was 87.63%(2006) and 76.91% (2007), lower than that of the common cashewtrial (100.7% for 2006 and 86.94% for the year 2007 respectively)(Table 2). The eii on common cashew types was 1.4% in 2006 and2.81% in 2007, both higher than that on dwarfs, which were�0.41%and 1.45% for 2006 and 2007 respectively. At Pebane, commoncashew type trial, likeMocuba (Fig. 3C and D), the 2006 crop seasonwas highly conducive to disease development (Fig. 4A, B).
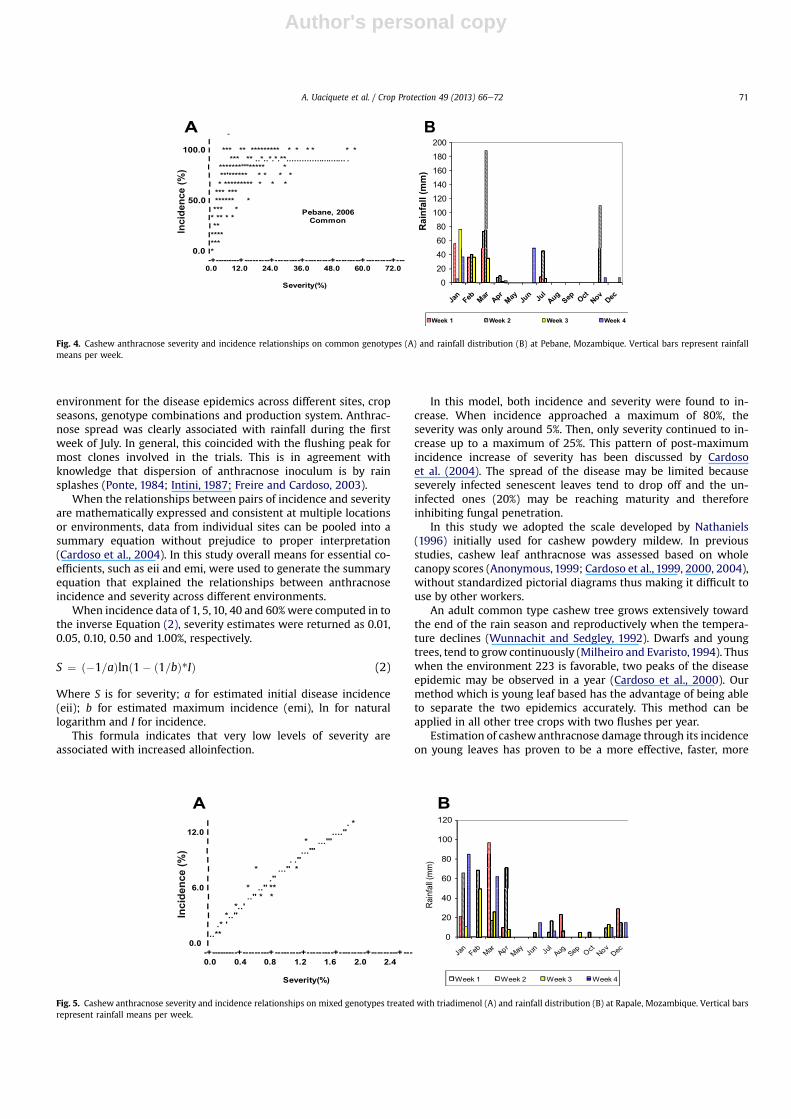
At Rapale, during the 2007 crop season the lowest value of emi(24.18%) was observed (Fig. 5A), however the incidenceeseverityrelationship remained robust as an exponential curve. At Rapale,observed maximum incidence (12%) and maximum severity (2.4%),of anthracnose were relatively lower compared to Mocuba, Nas-suruma and Pebane trial sites due to fungicides applications.
High emi values (disease spread) were consistently found inassociation with showers during the first week of July (Figs. 2AeD,3AeH, 4 and 5) regardless of location or crop season.
In general, the emi of anthracnose on new cashew leaves washigher on the common cashew type than on dwarfs and this was
Table 2Regression equations of incidence (I) on severity (S) of leaf anthracnose (Colletotrichum gloeosporioides) under different environments and different cashew (Anacardiumoccidentale) genotypes in Mozambique, 2006e2007.
Location Type germplasm Year b K a ¼ (K þ b) R Percentage varianceaccounted for
SE
Nassuruma Dwarf progenies 2006 68.56 (�59.82) 8.74 0.8595 82.5 6.340Nassuruma Dwarf progenies 2007 123.00 (�120.00) 3.00 0.9404 92.5 3.420Rapale Dwarf & common 2007 24.2 (�23.6) 0.60 0.726 91.3 1.090Mocuba Dwarf progenies 2006 87.44 (�87.85) (�0.41) 0.8650 74.5 9.860Mocuba Dwarf progenies 2007 76.91 (�75.46) 1.45 0.8056 84.8 6.950Mocuba Common Progenies 2006 100.7 (�99.3) 1.40 0.8775 82.5 7.710Mocuba Common progenies 2007 86.94 (�84.13) 2.81 0.8569 86.8 7.373Pebane Dwarf progenies 2006 78.71 (�79.06) (�0.35) 0.765 68.2 14.200Pebane Dwarf progenies 2007 55.40 (�56.32) (�0.92) 0.6608 79.8 9.380Pebane Common progenies 2006 88.26 (�87.83) 0.43 0.7980 84.6 13.100Pebane Common progenies 2007 85.22 (�86.24) (�1.02) 0.7402 88.1 12.1Overall mean 79.58 (�78.15) 1.43 0.8086 83.2 8.320
Regression equation of incidence applied for each location: I ¼ b*(1 � e**(�a*S)); SE ¼ Standard error of observations; R ¼ Coefficient of determination; b ¼ Estimatedmaximum incidence; a ¼ Estimated initial incidence; * multiply; ** power to; For all locations P < 0.001.
Fig. 1. Taxon-specific amplification products of genomic DNA from Colletotrichumgloeosporioides isolates collected from different parts of Mozambique. Negative controllane contained all reagents except DNA. C. gloeosporioides from mango, was used aspositive control. DNA from Fusarium spp. isolated from cashew was also included forcontrasting results.
A. Uaciquete et al. / Crop Protection 49 (2013) 66e7268

Author's personal copy
supported by the eii which was also higher on common cashewtrials.
Using data from three locations (Rapale, Nassuruma andPabane), the attempt to linearly associate incidence on leaves toincidence on nuts formed later in the season was not significant(P > 0.001) (data not presented).
4. Discussion
The first official record of cashew anthracnose in Mozambiquewas made by Carvalho and Mendes (1958) based on morphologicaland cultural studies. Later, the disease was found to occur in allcashew-growing provinces and positioned second after cashewpowdery mildew (Oidium anacardii Noack) (Dhindsa andMondjana, 1984). Because, C. gloeosporioides is a complex species,variable in morphology, pathogenicity and physiology (izoenzymesproduced) (Freire and Cardoso, 2003). In the present study,C. gloeosporioides and C. acutatum were targeted using the PCRtechnique. However, C. acutatum was detected. Therefore, cashewanthracnose in Mozambique was molecularly confirmed to becaused C. gloeosporioides. This is in consistence with findings fromBrazil.
Numerous publications have dealt with the incidenceeseverityrelationship of various pathosystems (Silva-Acuna et al., 1999;Cardoso et al., 2004). Various models have been produced and theirapplication and limitations were reviewed (McRoberts et al., 2003;Cardoso et al., 2004). In our study, the relationship between inci-dence and severity on cashew leaf anthracnose non-transformeddata, best fitted the restricted exponential family model. Thismodel curve was previously used by James and Shih (1973) on two
different pathosystems (McRoberts et al., 2003). Limitations asso-ciated with practical use of incidenceeseverity relationships areessentially derived from their inconsistency in relations to location,season, stage of epidemic, crop management systems and hostgenotype variations (Cardoso et al., 2004). Once the model hasproven robust across all parameters, one may opt to use the easilymeasured parameter (incidence) (Sweetmore et al., 1994; Silva-Acuna et al., 1999; Cardoso et al., 2004). Therefore, we recom-mend the use of leaf incidence in place of severity in genotype andfungicide screening trials, 173 describing models for economicthresholds or epidemics studies of cashew leaf anthracnose. How-ever, caution is needed since the cashew leaf anthracnose severityor incidence link to the panicle or nut anthracnose incidence/severity has not been established. We observed that the prevailingclimatic (rainfall) conditions at flowering or fruiting stage play amajor role in predicting leaf anthracnose before nut setting. This isin agreement with previous finding in Brazil where severity ofanthracnose was coupled with rainfall and flushing of cashew(Cardoso et al., 2000).
At Rapale, where triadimenol fungicide was applied, both inci-dence and severity of anthracnose were reduced. This confirms theefficacy of the product in reduction of inoculum as previouslyreferred (Freire et al., 2002).
In our model, we considered severity as independent variableand incidence as the dependent: Anthracnose is a polycyclic disease(Agrios, 2005). Changes in incidence over time are determined bythe dynamics of severity or sources of inoculum at initial stages ofepidemics (McRoberts et al., 2003). By exploring the regressioncurve minimum and maximum limits derived from the incidenceeseverity relationship, we have assessed the propensity of the
-I
80.0 I
I
''''* I ...............'
60.0 I * ....' ''*''''
I ** *.*.'''
I ***' *
40.0 I * .
I * '
I * * *
20.0 I * ' *
I *
I
0.0 I
-+---------+---------+---------+---------+---------+---------+---
0.0 5.0 10.0 15.0 20.0 25.0 30.0
Severity (%)
A
0
20
40
60
80
100
Ra
in
fa
ll (m
m)
Week 1 Week 2 week 3 Week 4
B
I
50.0 I
I *
I ....' *
37.5 I ...''' *
I * * ...'''
I .*'''' * *
25.0 I ...''' *
I * *.*'''
I * *..''
12.5 I * **.'*' *
I *.'*** *
I * *** *
0.0 I
-+---------+---------+---------+---------+---------+---------+---
0.0 1.2 2.4 3.6 4.8 6.0 7.2
Severity (%)
C
0
20
40
60
80
100
Rain
fall (m
m)
Week 1 Week 2 Week 3 Week 4
D
In
cid
en
ce (%
)In
cid
en
ce (%
)
Fig. 2. Cashew anthracnose severity and incidence relationships on dwarf genotypes (A) and rainfall distribution (B) at Nassuruma, Mozambique. Vertical bars represent rainfallmeans per week. Cashew anthracnose severity and incidence relationships on dwarf genotypes (C) and rainfall distribution (D) at Nassuruma, Mozambique. Vertical bars representrainfall means per week.
A. Uaciquete et al. / Crop Protection 49 (2013) 66e72 69

Author's personal copy
I
100.0 I
I
I * * ..*
I * ** ***.. .*..'''*''''''
I *** *****.*''''' *
I * ** * ****.''' **
50.0 I * * * ***** * *
I ** ****'''* ** **
I **''* ** * * *
I * ..**** ** **
I **** **
I **
0.0 I *
-+---------+---------+---------+---------+---------+---------+---
0.0 3.0 6.0 9.0 12.0 15.0 18.0
Severity (%)
A
Mocuba, 2006
Dwarf
0
20
40
60
80
100
120
140
160
Rain
fall (m
m)
Week 1 Week 2 week 3 Week 4
B
I
100.0 I
I
I * * ..*
I * ** ***.. .*..'''*''''''
I *** *****.*''''' *
I * * * ****.''' **
50.0 I * * * ****** * *
I ** ****'''* ** **
I **''* ** * * *
I * ..**** ** **
I **** **
I **
0.0 I *
-+---------+---------+---------+---------+---------+---------+--
0.0 3.0 6.0 9.0 12.0 15.0 18.0
Severity (%)
C
Mocuba, 2006
Common
0
20
40
60
80
100
120
140
160
Rain
fall (m
m)
Week 1 Week 2 week 3 Week 4
D
In
cid
en
ce (%
)In
cid
en
ce (%
)In
cid
en
ce (%
)In
cid
en
ce (%
)
I
100.0 I
I *
I * ** *
I * * ** .*...'' ''''*''''''''''''''''''''''
I ** ******''* * *
I ****'*** *
50.0 I ****** * *
I ****** *
I *****
I '**
I ***
I *
0.0 I
-+---------+---------+---------+---------+---------+---------+---
0.0 6.0 12.0 18.0 24.0 30.0 36.0
Severity(%)
Mocuba, 2007
Dwarf
E
0
20
40
60
80
100
Rain
fall (m
m)
Week 1 Week 2 Week 3 Week 4
F
I
80.0 I * **
I * * * ...... ''''''
I * *...''*' * *
I * *..''''
I ** '**''** * *
I * *****.*** *
40.0 I *.**'* *
I **.*** *
I **** *
I ***** * *
I ***'*
I ** * *
0.0 I
-+---------+---------+---------+---------+---------+---------+--
0.0 2.5 5.0 7.5 10.0 12.5 15.0
Severity (%)
Mocuba, 2007
Common
G
0
20
40
60
80
100
Rain
fall (m
m)
Week 1 Week 2 Week 3 Week 4
H
Fig. 3. Cashew anthracnose severity and incidence relationships on dwarf genotypes (A) and rainfall distribution (B) at Mocuba, Mozambique. Vertical bars represent rainfall meansper week. Cashew anthracnose severity and incidence relationships on Common genotypes (C) and rainfall distribution (D) at Mocuba, Mozambique. Vertical bars represent rainfallmeans per week. Cashew anthracnose severity and incidence relationships on dwarf genotypes (E) and rainfall distribution (F) at Mocuba, Mozambique. Vertical bars representrainfall means per week. Cashew anthracnose severity and incidence relationships on dwarf genotypes (G) and rainfall distribution (H) at Mocuba, Mozambique. Vertical barsrepresent rainfall means per week.
A. Uaciquete et al. / Crop Protection 49 (2013) 66e7270
Author's personal copy
environment for the disease epidemics across different sites, cropseasons, genotype combinations and production system. Anthrac-nose spread was clearly associated with rainfall during the firstweek of July. In general, this coincided with the flushing peak formost clones involved in the trials. This is in agreement withknowledge that dispersion of anthracnose inoculum is by rainsplashes (Ponte, 1984; Intini, 1987; Freire and Cardoso, 2003).
When the relationships between pairs of incidence and severityare mathematically expressed and consistent at multiple locationsor environments, data from individual sites can be pooled into asummary equation without prejudice to proper interpretation(Cardoso et al., 2004). In this study overall means for essential co-efficients, such as eii and emi, were used to generate the summaryequation that explained the relationships between anthracnoseincidence and severity across different environments.
When incidence data of 1, 5, 10, 40 and 60% were computed in tothe inverse Equation (2), severity estimates were returned as 0.01,0.05, 0.10, 0.50 and 1.00%, respectively.
S ¼ ð�1=aÞlnð1� ð1=bÞ*IÞ (2)
Where S is for severity; a for estimated initial disease incidence(eii); b for estimated maximum incidence (emi), ln for naturallogarithm and I for incidence.
This formula indicates that very low levels of severity areassociated with increased alloinfection.
In this model, both incidence and severity were found to in-crease. When incidence approached a maximum of 80%, theseverity was only around 5%. Then, only severity continued to in-crease up to a maximum of 25%. This pattern of post-maximumincidence increase of severity has been discussed by Cardosoet al. (2004). The spread of the disease may be limited becauseseverely infected senescent leaves tend to drop off and the un-infected ones (20%) may be reaching maturity and thereforeinhibiting fungal penetration.
In this study we adopted the scale developed by Nathaniels(1996) initially used for cashew powdery mildew. In previousstudies, cashew leaf anthracnose was assessed based on wholecanopy scores (Anonymous, 1999; Cardoso et al., 1999, 2000, 2004),without standardized pictorial diagrams thus making it difficult touse by other workers.
An adult common type cashew tree grows extensively towardthe end of the rain season and reproductively when the tempera-ture declines (Wunnachit and Sedgley, 1992). Dwarfs and youngtrees, tend to grow continuously (Milheiro and Evaristo,1994). Thuswhen the environment 223 is favorable, two peaks of the diseaseepidemic may be observed in a year (Cardoso et al., 2000). Ourmethod which is young leaf based has the advantage of being ableto separate the two epidemics accurately. This method can beapplied in all other tree crops with two flushes per year.
Estimation of cashewanthracnose damage through its incidenceon young leaves has proven to be a more effective, faster, more
-I
I *** ** ..*..*.*.**........................ .
I *******''''***** *
I **'****** * * * *
I * ********* * * *
I *** ***
I ****** *
I *** *
I* ** * *
I **
I****
I***
100.0 I *** ** ********* * * * * * *
50.0
0.0 I*
-+---------+---------+---------+---------+---------+---------+---
0.0 12.0 24.0 36.0 48.0 60.0 72.0
Severity(%)
A
Pebane, 2006
Common
020406080
100120140160180200
Rain
fall (
mm
)
Week 1 Week 2 Week 3 Week 4
B
In
cid
en
ce
(%
)
Fig. 4. Cashew anthracnose severity and incidence relationships on common genotypes (A) and rainfall distribution (B) at Pebane, Mozambique. Vertical bars represent rainfallmeans per week.
I . *
12.0 I ....''
I * ...'''
I ...'''
I . .''
I * ...'' *
I .''
6.0 I * ..'' **
I ..'' * *
I *..'
I *..''
I .* '
I..**
0.0 I
-+---------+---------+---------+---------+---------+---------+---
0.0 0.4 0.8 1.2 1.6 2.0 2.4
Severity(%)
A
0
20
40
60
80
100
120
Rain
fall (
mm
)
MonthsWeek 1 Week 2 Week 3 Week 4
B
In
cid
en
ce (%
)
Fig. 5. Cashew anthracnose severity and incidence relationships on mixed genotypes treated with triadimenol (A) and rainfall distribution (B) at Rapale, Mozambique. Vertical barsrepresent rainfall means per week.
A. Uaciquete et al. / Crop Protection 49 (2013) 66e72 71

Author's personal copy
accurate and user friendly method than severity scores. This is inline with Sweetmore et al. (1994) who found incidence data to besimpler to collect and less subjective than severity and thusrecommend for larger scale surveys. However, special attentionmay be necessary when assessing cashew anthracnose where othersimilar but distinguishable leaf diseases such as leaf blight (Sijaonaet al., 2005) and Pestalotiopsis (Intini and Sijaona, 1983) arepresent.
Acknowledgments
We are thankful to Dr. Marie Smith (Head of Biometry Depart-ment, Agricultural Research Council, RSA) for her useful commentsand help on statistical analysis of the manuscript. We also thankAFD (French Development Agency, Mozambique) for funding thisresearch through PRC/PIAC-Project.
References
Agrios, G.N., 2005. Plant Pathology, fifth ed. Elsevier Inc., Burlington, Massachusetts.Anonymous, 1999. Development of 247 Selection and Clonal Propagation Tech-
niques for Multiplication of Elite Yield and Anthracnose Tolerant Cashew(Anacardium occidentale L.). Summary Reports of European Commission Sup-ported STD-3 Projects (1992e1995). CTA. Online. http://interships.cta.int/pubs/std/vol2/pdf/221/pdf. March, 2008, pp. 111e116.
Anonymous, 2004. DNeasy Plant Mini and DNeasy Plant Max Handbook for Isola-tion of DNA from Plant Tissues. Quiagen Inc.. www.Quiagen.com.
Cardoso, J.E., Cavalcanti, J.J.V., Cavalcante, M. de J.B., Aragão, M. do L., Filipe, E.M.,1999. Genetic resistance of dwarf cashew (Anacardium occidentale L.) toanthracnose, black mold, and angular leaf spot. Crop Prot. 18, 23e27.
Cardoso, J.E., Felipe, E.M., Cavalcante, M. de J.B., Freire, F. das C.O.,Cavalcanti, J.J.V., 2000. Rainfall index and disease progress of anthracnoseand black mold on cashew nut plants (Anacardium occidentale). SummaPhytopathol. 26, 413e416.
Cardoso, J.E., Santos, A.A., Rossetti, A.G., Vidal, J.C., 2004. Relationship betweenincidence and severity of cashew gummosis in semiarid north-eastern Brazil.Plant Pathol. 53, 363e367.
Carvalho, T., Mendes, O., 1958. Doenças de plantas em Moçambique. Direcção geralde Agricultura e Florestas, Lourenço Marques, Moçambique.
Chuang, T.Y., Jeger, M.J., 1987. Relationship between incidence and severity of ba-nana leaf spot in Taiwan. Phytopathology 77, 1537e1541.
Conticini, L., 1982. Guida fenologica dell’anacardio (Anacardium occidentale L. Riv.Agr. Subtrop. Trop. 86, 221e242.
Cornell, J.A., Berger, R.D., 1987. Factors that influence the value of the coefficient ofdetermination in simple linear and nonlinear regression models. Phytopa-thology 77, 63e70.
Da Matta, E.A.F., Lellis, W.T., 1973. Fungicidas e adubação no controle da “Queima doCajueiro”. In: Boletim do Instituto Biologico de Bahia, vol. 12, pp. 37e40.
Dhindsa, P.P., Mondjana, A.M., 1984. Index of plant diseases and associated organ-isms of Mozambique. Trop. Pest Manage. 30, 407e442.
Freire, F.C.O., Cardoso, J.E., 2003. Doenças do cajueiro. In: Freire, F.C.O., Cardoso, J.E.,Viana, F.M.P. (Eds.), Doenças de Fruteiras tropicais de interesse agroindustrial.Embrapa, Informação Tecnica, Brasília, Brasil, pp. 192e225.
Freire, F.C.O., Cardoso, J.E., Dos Santos, A.A., Vian, F.M.P., 2002. Diseases of cashewnut plants (Anacardium occidentale L.) in Brazil. Crop Prot. 21, 489e494.
Intini, M., 1987. Phytopathological aspects of cashew (Anacardium occidentale L.) inTanzania. Int. J. Trop. Plant Dis. 5, 115e130.
Intini, M., Sijaona, M.E.R., 1983. Little known diseases of cashew (Anacardiumoccidentale L.) in Tanzania. Riv. Agr. Subtrop. Trop. 77, 421e429.
Ivey, M.L.L., Nava-Diaz, C., Miller, S.A., 2004. Identification and management ofColletotrichum acutatum on immature Bell Peppers. Plant Dis. 88, 1198e1204.
James, W.C., Shih, C.S., 1973. Relationship between incidence and severity of pow-dery mildew and leaf rust on winter wheat. Phytopathology 63, 183e187.
Masawe, P.A.L., Cundal, E.P., Caligari, P.D.S., 1997. Powdery mildew (Oidium ana-cardii) onset and development on flowering panicles of cashew clones(Anacardium occidentale L.) as a measure of clone resistance. Trop. Agric. 79,229e234.
McRoberts, N., Hughes, G., Madden, L.V., 2003. The 296 theoretical basis andpractical application of relationships between different disease intensity mea-surements in plants. Ann. App. Biol. 142, 191e211.
Milheiro, A.V., Evaristo, F.N., 1994. Manual do cajueiro. Cultivar. Associação deTecnicos de Culturas Tropicais, Porto, Portugal.
Muniz, M.F.S., Lemos, E.E.P., Varzea, V.M.P., Rodrigues Jr., C.J., Bessa, A.M.S., 1998.Characterization of Colletotrichum gloeosporioides (Penz.) Sacc. Isolates andresistance of cashew (Anacardium occidentale L.) to the pathogen. pp. 249e253.In: Topper, C.P., Caligari, P.D.S., Kullaya, A.K., Shomari, S.H., Kasuga, L.J.,Masawe, P.A.L., Mpunami, A.A. (Eds.), Proceedings of the International Cashewand Coconut Conference, 17e21 February, 1997. Biohybrids International Ltd,Reading.
Nathaniels, N.Q.R., 1996. Methods, including visual keys for assessment of cashewpowdery mildew (Oidium anacardii Noack) severity. Int. J. Pest Manag. 42,199e205.
Ponte, J.J., 1984. Doenças do cajueiro no Nordeste Brasileiro. EMBRAPA-Departa-mento de Difusão de Tecnologia, Brasilia, Brasil. Documento 10.
Rouse, D.I., Mackenzie, D.R., Nelson, R.R., Elliott, V.J., 1981. Distribution of wheatpowdery mildew incidence in field plots and relationship to disease severity.Phytopathology 71, 947e950.
Sijaona, M.E.R., Mansfield, J.W., 2001. Variation in the response of cashew genotypesto the targeted application of fungicide to flower panicles for control of pow-dery mildew disease. Plant Pathol. 50, 224e248.
Sijaona, M.E.R., Reeder, R.H., Waller, J.M., 2005. Cashew leaf and nut blight e anew disease of cashew in Tanzania caused by Cryptosporiopsis spp. PlantPathol. 55, 576.
Silva-Acuna, R., Maffia, L.A., Zambolim, L., Berger, R.D., 1999. Incidence-severityrelationships in the pathosystem coffea arabica-Hemileia vastatrix. Plant Dis. 83,186e188.
Snedecor, G.W., Cochran, W.G., 1980. Statistical Methods (7th 329 Edition). IowaState University Press, Ames, Iowa.
Sweetmore, A., Simons, S.A., Kenward, M., 1994. Comparison of disease progresscurves for yam anthracnose (Colletotricum gloeosporioides). Plant Pathol. 43,206e215.
Whitelaw-Weckert, M.A., Curtin, S.J., Huang, R., Steel, C.C., Blanchard, C.L.,Roffey, P.E., 2007. Phylogenetic relationships and pathogenicity of Colleto-trichum acutatum isolates from grape in subtropical Australia. Plant Pathol. 56,448e463.
Wunnachit, W., Sedgley, M., 1992. Floral structure and phenology of cashew inrelation to yield. J. Hortic. Sci. 67, 769e777.
A. Uaciquete et al. / Crop Protection 49 (2013) 66e7272