Community Forestry Enterprise's Coffe and Cashew Value Chain Analysis
Upload
khangminh22Category
view
0download
0
Revista Caatinga
ISSN: 0100-316X
Universidade Federal Rural do Semi-
Árido
Brasil
DA SILVA, KETSON BRUNO; OLIVEIRA BATISTA, RAFAEL; DE OLIVEIRA MESQUITA,
FRANCISCO; DA COSTA LEITE COELHO, DANIELA; DE OLIVEIRA SANTOS, WESLEY
EMPIRICAL MODELS FOR PERFORMANCE OF DRIPPERS APPLYING CASHEW NUT
PROCESSING WASTEWATER
Revista Caatinga, vol. 29, núm. 2, abril-junio, 2016, pp. 405-414
Universidade Federal Rural do Semi-Árido
Mossoró, Brasil
Available in: http://www.redalyc.org/articulo.oa?id=237145583017
How to cite
Complete issue
More information about this article
Journal's homepage in redalyc.org
Scientific Information System
Network of Scientific Journals from Latin America, the Caribbean, Spain and Portugal
Non-profit academic project, developed under the open access initiative

Rev. Caatinga, Mossoró, v. 29, n. 2, p. 405 – 414, abr. – jun., 2016
Universidade Federal Rural do Semi-Árido Pró-Reitoria de Pesquisa e Pós-Graduação
http://periodicos.ufersa.edu.br/index.php/sistema
ISSN 0100-316X (impresso) ISSN 1983-2125 (online)
405
EMPIRICAL MODELS FOR PERFORMANCE OF DRIPPERS APPLYING
CASHEW NUT PROCESSING WASTEWATER1
KETSON BRUNO DA SILVA2; RAFAEL OLIVEIRA BATISTA2*; FRANCISCO DE OLIVEIRA MESQUITA2;
DANIELA DA COSTA LEITE COELHO2; WESLEY DE OLIVEIRA SANTOS2
ABSTRACT – The objective of this work was to develop empirical models for hydraulic performance of
drippers operating with cashew nut processing wastewater depending on operating time, operating pressure and
effluent quality. The experiment consisted of two factors, types of drippers (D1=1.65 L h-1, D2=2.00 L h-1 and
D3=4.00 L h-1), and operating pressures (70, 140, 210 and 280 kPa), with three replications. The flow variation
coefficient (FVC), distribution uniformity coefficient (DUC) and the physicochemical and biological
characteristics of the effluent were evaluated every 20 hours until complete 160 hours of operation. Data were
interpreted through simple and multiple linear stepwise regression models. The regression models that fitted to
the FVC and DUC as a function of operating time were square root, linear and quadratic, with 17%, 17% and
8%, and 17%, 17% and 0%, respectively. The regression models that fitted to the FVC and DUC as a function
of operating pressures were square root, linear and quadratic, with 11%, 22% and 0% and the 0%, 22% and
11%, respectively. Multiple linear regressions showed that the dissolved solids content is the main wastewater
characteristic that interfere in the FVC and DUC values of the drip units D1 (1.65 L h-1) and D3 (4.00 L h-1),
operating at work pressure of 70 kPa (P1).
Keywords: Effluent. Emitters. Operating pressure. Flow variation coefficient. Distribution uniformity
coefficient.
MODELOS EMPÍRICOS DO DESEMPENHO DE GOTEJADORES APLICANDO ÁGUA
RESIDUÁRIA DA CASTANHA DE CAJU
RESUMO - Este trabalho objetivou obter modelos empíricos do desempenho hidráulico de gotejadores
operando com água residuária da castanha de caju em função do tempo de operação, da pressão de serviço e da
qualidade do efluente. O experimento foi montado com dois fatores: três tipos de gotejadores (D1 - 1,65 L h-1;
D2 - 2,00 L h-1 e D3 - 4,00 L h-1) e quatro pressões de serviço (70, 140, 210 e 280 kPa), com três repetições.
Avaliaram-se a cada 20 h os valores dos coeficientes de variação de vazão (FVC) e da uniformidade de
distribuição (DUC), além das características físico-químicas e biológicas do efluente até completar o tempo de
operação de 160 h. Os dados foram interpretados por meio das análises de regressão simples e linear múltipla
stepwise. Para os dados de FVC e DUC em função do tempo de operação, 17, 17 e 8% e 17, 17 e 0% dos
modelos de regressão ajustados foram o raiz quadrada, o linear e o quadrático, respectivamente. Na relação de
FVC e DUC com pressões de serviço, 11, 22 e 0% e 0, 22 e 11% dos modelos de regressão ajustados foram o
raiz quadrada, o linear e o quadrático, respectivamente. As regressões lineares múltiplas mostraram que o teor
de sólidos dissolvidos foi a característica da água residuária que mais interferiu nos valores de FVC e DUC das
unidades gotejadoras D1e D3 operando na pressão de serviço de 70 kPa.
Palavras-chave: Efluente. Emissores. Pressão de serviço. Coeficientes de variação da vazão e de uniformidade
de distribuição.
________________ *Corresponding author 1Received for publication in 07/29/2014; accepted in 02/16/2016.
Paper extracted from the masters dissertation of the first author. 2Department of Environmental and Technological Sciences, Universidade Federal Rural do Semi-Árido, Mossoró, RN, Brazil;
[email protected], [email protected], [email protected], [email protected],

EMPIRICAL MODELS FOR PERFORMANCE OF DRIPPERS APPLYING CASHEW NUT PROCESSING WASTEWATER
K. B. SILVA et al.
Rev. Caatinga, Mossoró, v. 29, n. 2, p. 405 – 414, abr. – jun., 2016 406
INTRODUCTION
The cashew (Anacardium occidentale L.) is
one of the most important fruit species cultivated in
tropical regions, with an area of 586,237 ha in Brazil.
Its main economic products are the edible kernel and
liquid from the nutshell (Conab, 2015). The
Brazilian Northeast region accounts for 98% of
national production of cashew nuts, with the largest
plantations located mainly in coastal and transition
bands in the states of Ceara and Rio Grande do Norte
(CONAB, 2015).
The cashew nut processing generates a waste
that is hazardous for the environment. The
processing steps such as pressing, storage, drying,
classification, washing, extraction of cashew nut
liquid and shelling produce potentially polluting
effluents (LOPES et al., 2011).
According to Souza et al. (2015), the use of
wastewater in agriculture has benefits, such as the
increased availability of water for urban and
industrial sectors, and nutrient and organic matter
contribution to agricultural crops.
Wastewater application with drip irrigation
systems has the advantage of protect surface and
ground water sources and improvement of public
health due to the adsorption of contaminants in the
clay exchange complex, nutrient uptake by plants
and minimization of pathogens (ROWAN; MANCL;
TUOVINEN, 2013).
The clogging of drippers is the major concern
in drip irrigation systems that apply wastewater,
because its high levels of suspended solids, organic
matter and nutrients (YAN et al., 2010). Previous
studies have reported causes for clogging of drippers
operating with wastewater (BATISTA et al., 2014;
FERNANDES et al., 2014; KATZ et al., 2014;
MESQUITA et al., 2015), identifying the physical
agents in the suspended solids; chemical agents from
precipitation reactions; and organic agents because
the growth and metabolism of microorganisms,
forming biofilms.
Several studies reported a compromised
hydraulic performance of drip irrigation systems
operating with different types of wastewater, due to
partial or total clogging of drippers (PUIG-
BARGUES et al., 2010; BATISTA et al., 2011;
BATISTA et al., 2013).
Empirical models relating hydraulic
performance of drip irrigation systems with the
variables operating time (BATISTA et al., 2013),
wastewater quality (BATISTA et al., 2011) and
intrinsic characteristics of drippers (BATISTA et al.,
2012; OLIVER et al., 2014) assists in choosing the
technic and the time of use preventive and corrective
measures regarding dripper obstructions when
applying wastewater.
Therefore, the objective of this work was to
develop empirical models of hydraulic performance
of drippers operating with cashew nut processing
wastewater, related to the variables operating time,
operating pressure and effluent quality.
MATERIAL AND METHODS
The experiment was conducted from March
11 to April 20, 2012, at the Water Reuse
Experimental Unit (UERA), Federal Rural
University of Semi-Arid (UFERSA) in Mossoro,
RN, Brazil (5º12'27"S and 37º19'21"W). According
to the Köppen classification, the climate is BSwh,
semiarid, hot, with rainy season in the summer
(ALVARES et al., 2013).
A 2.0 m wide, 8.0 m long experimental bench
was built in the UERA, which had waterproof floor
with slope of 1% and a channel of 2% slope to
recirculate the effluent, in order to minimize losses
by evaporation. A 5.0 m3 reservoir was built next to
the experimental bench for storage of cashew nut
processing wastewater. The experimental bench was
equipped with four drip irrigation units with a 1.0 hp
pump, a 1.5 m3 h-1 hydrometer, a 130 µm screen
filter, four PVC manifolds of 32 mm, four pressure
regulators units with gate valves and analog
manometers with glycerin and 36 polyethylene
lateral lines of 16 mm diameter and 1.8 mm thick,
with nine lateral lines per irrigation unit (Figure 1).
The experiment consisted of two factors, the
types of drippers (D1, D2 and D3) and operating
pressures (70, 140, 210 and 280 kPa), with three
replications.
Each manifold had a gate valve for
controlling the operating pressure of the drip units.
The evaluated pressures were 70 (P1), 140 (P2), 210
(P3) and 280 kPa (P4). Moreover, each manifold of
the drip units had nine connectors with sealing
rubber, for inserting the nine lateral lines of 8.0 m in
length, three for each one of the evaluated dripper
type. The characteristics of the evaluated dripper are
presented in Table 1 and their images in Figure 2.

EMPIRICAL MODELS FOR PERFORMANCE OF DRIPPERS APPLYING CASHEW NUT PROCESSING WASTEWATER
K. B. SILVA et al.
Rev. Caatinga, Mossoró, v. 29, n. 2, p. 405 – 414, abr. – jun., 2016 407
Figure 1. Scheme of the experimental bench built at the Water Reuse Experimental Unit (UERA), showing the
four drip units operating at the predetermined pressures.
Table 1. Drippers (D) used in the experiments and their characteristics regarding pressure compensating device (PCD), the
nominal flow (Q), flow coefficient (k), exponent of the flow which characterizes the flow regime (x), filtering area (A),
labyrinth length (L), manufacturing coefficient of variation (CVm), recommended pressure range (P) and spacing between
emitters (SE)
D PCD* Q *
(L h-1) k* x*
A
(mm2)
L
(mm)
CVm*
(%)
P*
(kPa)
SE*
(m)
D1 No 1,65 0,53 0,48 4,0** 37** ≤ 5 60 - 150 0,30
D2 Yes 2,00 2,00 0,00 2,0* 35* ≤ 7 50 - 400 1,00
D3 Yes 4,00 4,00 0,00 2,9* 35* ≤ 7 50 - 400 1,00
1 *Information from manufacturer’s catalogs; ** information measured with a digital caliper ruler (accuracy of 0.01 mm).
CNJ - anti-draining system.
A B C
1
Figure 2. Types of drippers (D1=A, D2=B and D3=C) used for application of cashew nut processing wastewater.
The cashew nut processing wastewater used
in the present work was from a wastewater treatment
plant (WWTP) of a cashew industry, located in
Mossoro, RN, Brazil. The collection was performed
in the sedimentation tank of the WWTP. The
reservoir of 5.0 m3 of the experimental bench was
supplied weekly with 1.0 m3 of this effluent,
compensating the water losses.
Seven equidistant emitters were identified in
all 36 lateral lines, with white paint, in order to
evaluated the hydraulic performance of the drip
units. The flow of each dripper was found by the
gravimetric method, collecting the effluent volume in
a three-minute period, following the
recommendations of ABNT (2006), using the
Equation 1,

EMPIRICAL MODELS FOR PERFORMANCE OF DRIPPERS APPLYING CASHEW NUT PROCESSING WASTEWATER
K. B. SILVA et al.
Rev. Caatinga, Mossoró, v. 29, n. 2, p. 405 – 414, abr. – jun., 2016 408
(1)
were Q = dripper flow (L h-1), V = effluent volume
collected (mL); and t = effluent collection time
(min).
The hydraulic performance indicators used to
detect dripper obstruction levels were the distribution
uniformity coefficient (DUC) (Equations 2) and flow
variation coefficient (FVC), (Equations 3),
(2)
(3)
where FVC = flow variation coefficient (%); DUC =
distribution uniformity coefficient (%); q = average
flow of drippers (L h-1); qi = flow rate of each dripper
(L h-1); ne = number of evaluated drippers; and q25% =
60t1000
VQ
q
n
FCVe
n
i
i
1100
1
2
q
qDUC %25100
average of the 25% lower values of flow of the
drippers (L h-1).
These indicators were evaluated every 20
hours of operation of the drip units, starting at zero
and ending at 160 hours of operation.
According to the recommendations of Batista
et al. (2013), the drip units work an average of four
hours a day until completing 160 h.
The operating pressures P1 (70 kPa), P2 (140
kPa), P3 (210 kPa) and P4 (280 kPa) were
maintained in the four evaluated irrigation units,
using simultaneously gate valves and analog gauges
(0-400 kPa). The initial operating time (0 h), when
there was no obstruction, presented flow variations
between drippers around 7%, as proposed by the ISO
9261 (ABNT, 2006).
The physicochemical and biological
characteristics of the cashew nut processing
wastewater was assessed following the
recommendations of the standard methods for the
examination of water and wastewater (RICE;
BAIRD; CLESCERI, 2012). Therefore, composite
samples were obtained from single samples and
analyzed by different laboratories. Table 2 presents
the physicochemical and biological characteristics of
the cashew nut processing wastewater used in this
work.
Table 2. Physicochemical and biological characteristics of the cashew nut processing wastewater used in the operating
periods of the drip irrigation units.
Characteristics Operating periods (hour)
0 20 40 60 80 100 120 140 160 Average
pH 8,45 8,50 7,57 7,00 7,19 7,32 7,66 7,71 7,07 7,61
Ca2+ (mmolc L-1) 9,47 12,32 15,08 9,17 9,00 12,90 12,62 11,47 14,95 11,89
Mg2+ (mmolc L-1) 3,58 3,52 3,91 3,85 4,02 4,30 3,76 3,40 8,50 4,32
Cl- (mmolc L-1) 22,87 24,93 20,00 19,00 22,13 25,00 30,00 26,33 20,67 23,44
CO32-(mmolc L
-1) 0,00 0,00 0,00 0,00 0,00 0,00 0,00 0,00 0,00 0,00
HCO3- (mmolc L
-1) 6,73 6,70 6,20 4,87 4,83 4,87 4,87 5,00 8,00 5,79
Mn (mg L-1) 0,33 0,31 0,34 0,34 0,32 0,24 0,24 0,30 0,30 0,3
Fe (mg L-1) 0,47 0,52 0,46 0,35 0,48 0,53 0,53 0,52 0,43 0,48
SS (mg L-1) 103 170 234 286 333 370 355 377 386 291
DS (mg L-1) 2113 2230 2340 2360 2371 2389 2408 2401 2487 2344
TC (MPN 100 mL-1) 4 495 35 97 58 50 50 545 34 153
1 DS = dissolved solids; SS = suspended solids, TC = total coliforms; and MPN = most probable number.
The effluent pH was evaluated at the
laboratory of soil, water and plant analysis (LASAP)
of the Department of Environmental Sciences and
Technology of the UFERSA. The iron (Fe) and
manganese (Mn) concentrations were evaluated by
atomic absorption spectrophotometry; the carbonate
(CO32-), bicarbonate (HCO3
-), calcium (Ca2+),
chloride (Cl-) and magnesium (Mg2+) concentrations
by the titrimetric method; the suspended solids (SS)
and total solids (TS) concentrations by the
gravimetric method; and the dissolved solids (DS)
concentration by the difference between TS and SS.
The total coliform (TC) population were
evaluated in the animal products inspection
laboratory of the Animal Sciences Department of the
UFERSA, using the multiple tube method.
Simple and multiple linear stepwise
regression models were chosen based on the
significance of the regression coefficients, by
applying the t-test at significance level of 10% to the
coefficient of determination (≥ 60%) and the process
EMPIRICAL MODELS FOR PERFORMANCE OF DRIPPERS APPLYING CASHEW NUT PROCESSING WASTEWATER
K. B. SILVA et al.
Rev. Caatinga, Mossoró, v. 29, n. 2, p. 405 – 414, abr. – jun., 2016 409
at study. The computer program System for
Statistical Analysis 9.1 (SAEG, 2007) was used for
the statistical analyzes of the data.
RESULTS AND DISCUSSION
The application of cashew nut processing
wastewater, even with physicochemical treatment,
caused obstructions of drippers with biofilm. Similar
results were found by Dazhuang et al. (2009), Yan et
al. (2010), Oliver, Hewa and Pezzaniti (2014),
Fernandes et al. (2014) and Mesquita et al. (2015)
with drip units applying different wastewaters.
However, obstruction levels were more pronounced
in drip units operating at pressure of 70 kPa, which
had lower effluent flow rate in the drips compared
with the other pressures, favoring the biofilm
formation. Similar result was found by Yavuz et al.
(2010) with irrigation at field conditions after three
years of application of water with chemical clogging
agents, in which the drippers subjected to lower
operating pressures, 40 to 70 kPa, were the most
susceptible to clogging.
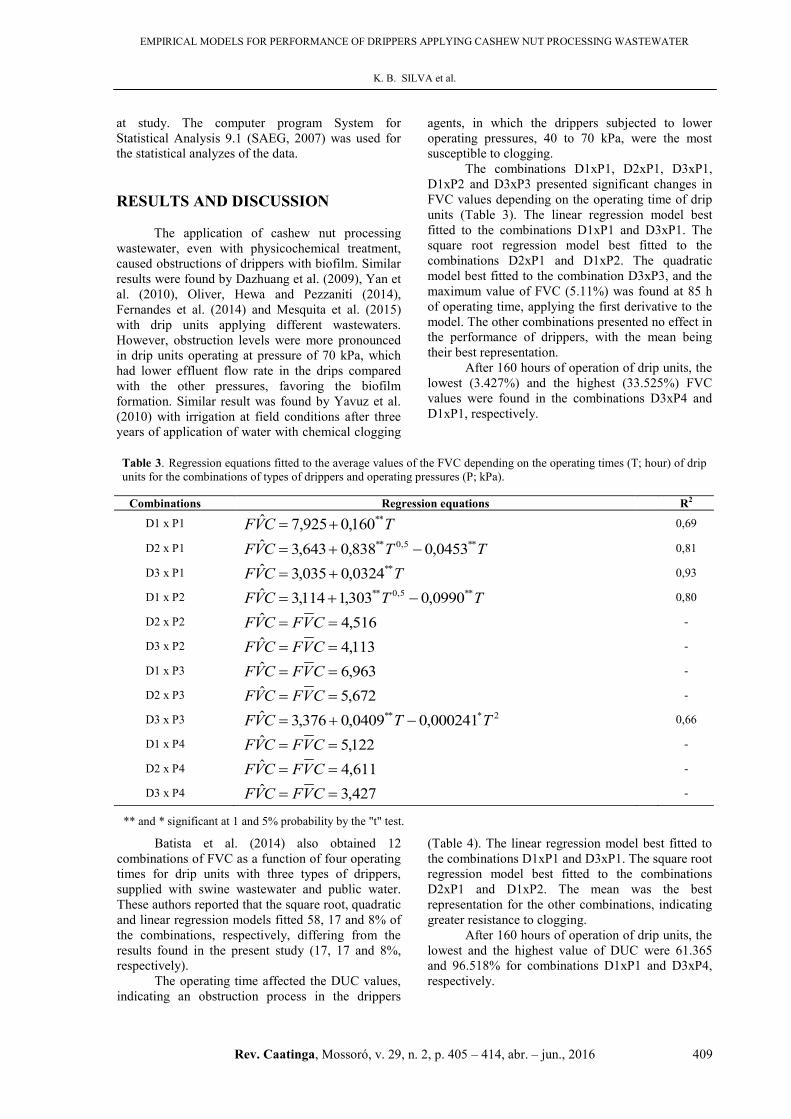
The combinations D1xP1, D2xP1, D3xP1,
D1xP2 and D3xP3 presented significant changes in
FVC values depending on the operating time of drip
units (Table 3). The linear regression model best
fitted to the combinations D1xP1 and D3xP1. The
square root regression model best fitted to the
combinations D2xP1 and D1xP2. The quadratic
model best fitted to the combination D3xP3, and the
maximum value of FVC (5.11%) was found at 85 h
of operating time, applying the first derivative to the
model. The other combinations presented no effect in
the performance of drippers, with the mean being
their best representation.
After 160 hours of operation of drip units, the
lowest (3.427%) and the highest (33.525%) FVC
values were found in the combinations D3xP4 and
D1xP1, respectively.
Table 3. Regression equations fitted to the average values of the FVC depending on the operating times (T; hour) of drip
units for the combinations of types of drippers and operating pressures (P; kPa).
Combinations Regression equations R2
D1 x P1 TCVF **160,0925,7ˆ
0,69
D2 x P1 TTCVF **5,0** 0453,0838,0643,3ˆ 0,81
D3 x P1 TCVF **0324,0035,3ˆ 0,93
D1 x P2 TTCVF **5,0** 0990,0303,1114,3ˆ 0,80
D2 x P2 516,4ˆ CVFCVF -
D3 x P2 113,4ˆ CVFCVF -
D1 x P3 963,6ˆ CVFCVF -
D2 x P3 672,5ˆ CVFCVF -
D3 x P3 2*** 000241,00409,0376,3ˆ TTCVF 0,66
D1 x P4 122,5ˆ CVFCVF -
D2 x P4 611,4ˆ CVFCVF -
D3 x P4 427,3ˆ CVFCVF
-
1 ** and * significant at 1 and 5% probability by the "t" test.
Batista et al. (2014) also obtained 12
combinations of FVC as a function of four operating
times for drip units with three types of drippers,
supplied with swine wastewater and public water.
These authors reported that the square root, quadratic
and linear regression models fitted 58, 17 and 8% of
the combinations, respectively, differing from the
results found in the present study (17, 17 and 8%,
respectively).
The operating time affected the DUC values,
indicating an obstruction process in the drippers
(Table 4). The linear regression model best fitted to
the combinations D1xP1 and D3xP1. The square root
regression model best fitted to the combinations
D2xP1 and D1xP2. The mean was the best
representation for the other combinations, indicating
greater resistance to clogging.
After 160 hours of operation of drip units, the
lowest and the highest value of DUC were 61.365
and 96.518% for combinations D1xP1 and D3xP4,
respectively.

EMPIRICAL MODELS FOR PERFORMANCE OF DRIPPERS APPLYING CASHEW NUT PROCESSING WASTEWATER
K. B. SILVA et al.
Rev. Caatinga, Mossoró, v. 29, n. 2, p. 405 – 414, abr. – jun., 2016 410
Table 4. Regression equations fitted to the average values of the DUC depending on the operating times (T; hours) of
drip units for combinations of types of drippers and operating pressures (P; kPa).
Combination Regression equations R2
D1 x P1 TCUD **212,0285,95ˆ 0,76
D2 x P1 TTCUD *5,0** 0620,0157,1470,96ˆ 0,79
D3 x P1 TCUD **0389,0709,96ˆ 0,85
D1 x P2 TTCUD **5,0** 121,0590,1914,96ˆ 0,75
D2 x P2 034,95ˆ CUDCUD -
D3 x P2 694,95ˆ CUDCUD -
D1 x P3 601,91ˆ CUDCUD -
D2 x P3 928,93ˆ CUDCUD -
D3 x P3 006,95ˆ CUDCUD -
D1 x P4 298,94ˆ CUDCUD -
D2 x P4 994,94ˆ CUDCUD -
D3 x P4 518,96ˆ CUDCUD -
1 ** and * significant at 1 and 5% probability by the "t" test.
Batista et al. (2011) reported that the
quadratic and linear regression models best fitted to
the DUC data and to the operating time with drip
units operating with secondary and tertiary domestic
wastewater, respectively. Batista et al. (2013)
reported that the quadratic regression model best
fitted to the DUC data and to the operation time with
drip units operated daily with public water for 2 h
followed by another 2 h with swine wastewater, for
160 h.
The operating pressure affected the FVC
values for the combinations D1xT20h D2xT20h,
D1xT60h, D3xT60h, D1xT80h, D2xT80h, D1xT100h,
D1xT160h and D3xT160h (Table 5). The square root
regression model best fitted to the combination
D1xT20h. The linear regression model best fitted to
the combinations D2xT20h, D1xT60h, D1xT80h,
D1xT100h, D1xT160h and D3xT160h. The quadratic
regression model best fitted to the combinations
D3xT60h and D2xT80h. The mean was the best
representation of the FVC values and operating
pressures for the other combinations.
Table 5. Regression equations fitted to the average values of the FVC depending on the operating pressure (P; kPa) of
drip units for combinations of types of drippers and operating times (T; hours).
**, * and 0 = significant at 1, 0,5 and 10% probability by the "t" test.
Combinations Regression equations R2
D1 x T0h 598,4ˆ CVFCVF -
D2 x T0h 073,4ˆ CVFCVF -
D3 x T0h -
D1 x T20h PPCVF **5,0** 193,0931,5952,50ˆ 0,99
D2 x T20h PCVF o0109,0668,6ˆ 0,72
D3 x T20h 632,3ˆ CVFCVF -
D1 x T40h 996,10ˆ CVFCVF -
D2 x T40h 978,4ˆ CVFCVF -
D3 x T40h 632,3ˆ CVFCVF -
D1 x T60h PCVF*
0578,0358,19ˆ 0,68
D2 x T60h 368,7ˆ CVFCVF -
D3 x T60h PPCVF*5,0*
127,0038,3363,11ˆ 0,97
D1 x T80h PCVF o0684,0458,21ˆ 0,71
D2 x T80h PPCVF **5,0** 158,0306,4859,32ˆ 0,99
D3 x T80h 535,4ˆ CVFCVF -
1

EMPIRICAL MODELS FOR PERFORMANCE OF DRIPPERS APPLYING CASHEW NUT PROCESSING WASTEWATER
K. B. SILVA et al.
Rev. Caatinga, Mossoró, v. 29, n. 2, p. 405 – 414, abr. – jun., 2016 411
Table 5. Continuation.
**, * and 0 = significant at 1, 0,5 and 10% probability by the "t" test.
Yavuz et al. (2010) also found drip units with
clogged emitters presenting changes to hydraulic
performance indicators with increasing operating
pressure.
Regarding the FVC as a function of operating
times, Tables 3 and 5 show that the square root,
linear and quadratic regression models fitted to 42%
of the combinations, while the FVC as a function of
operating pressures had 33% of square root and
linear regression models fitting the combinations.
The operating pressure affected the DUC
values for the combinations D1xT20h D2xT20h,
D1xT60h, D3xT60h, D1xT80h, D2xT80h, D1xT100h,
D1xT160h and D3xT160h (Table 6).
Table 6. Regression equations fitted to the average values of the DUC depending on the operating pressure (P; kPa) of
drip units for combinations of types of drippers and operating times (T; hours).
Combinations Regression equations R2
D1 x T0h 161,95ˆ CUDCUD -
D2 x T0h 613,95ˆ CUDCUD -
D3 x T0h 601,96ˆ CUDCUD -
D1 x T20h 2** 000375,0170,0929,74ˆ PPCUD 0,99
D2 x T20h PCUD o0159,0682,91ˆ 0,72
D3 x T20h 815,95ˆ CUDCUD -
D1 x T40h 371,89ˆ CUDCUD -
D2 x T40h 683,94ˆ CUDCUD -
D3 x T40h 815,95ˆ CUDCUD -
D1 x T60h PCUD *0513,0157,81ˆ 0,89
D2 x T60h 922,91ˆ CUDCUD -
D3 x T60h 2** 000220,00739,0557,98ˆ PPCUD 0,99
D1 x T80h PCUD o0782,0565,75ˆ 0,70
D2 x T80h 2** 000423,0170,0686,79ˆ PPCUD 0,99
D3 x T80h 351,95ˆ CUDCUD -
D1 x T100h PCUD o0709,0160,77ˆ 0,64
D2 x T100h 418,94ˆ CUDCUD -
D3 x T100h 187,95ˆ CUDCUD -
D1 x T120h 132,89ˆ CUDCUD -
D2 x T120h 104,93ˆ CUDCUD -
D3 x T120h 700,94ˆ CUDCUD -
D1 x T140h 534,88ˆ CUDCUD -
D2 x T140h 958,93ˆ CUDCUD -
D3 x T140h 783,94ˆ CUDCUD -
D1 x T160h PCUD o208,0793,46ˆ 0,64
D2 x T160h 930,93ˆ CUDCUD -
D3 x T160h PCUD o0208,0967,90ˆ 0,73
1
* and 0 = significant at 5 and 10% probability by the "t" test.
Combinations Regression equations R2
D1 x T100h PCVF o0730,0503,22ˆ 0,63
D2 x T100h 033,5ˆ CVFCVF -
D3 x T100h 730,4ˆ CVFCVF -
D1 x T120h 505,9ˆ CVFCVF -
D2 x T120h 705,5ˆ CVFCVF -
D3 x T120h 738,4ˆ CVFCVF -
D1 x T140h 935,9ˆ CVFCVF -
D2 x T140h 978,5ˆ CVFCVF -
D3 x T140h 925,4ˆ CVFCVF -
D1 x T160h PCVF o176,0392,45ˆ 0,65
D2 x T160h 629,5ˆ CVFCVF -
D3 x T160h PCVFo
0193,0487,8ˆ 0,74
1

EMPIRICAL MODELS FOR PERFORMANCE OF DRIPPERS APPLYING CASHEW NUT PROCESSING WASTEWATER
K. B. SILVA et al.
Rev. Caatinga, Mossoró, v. 29, n. 2, p. 405 – 414, abr. – jun., 2016 412
Combinations Regression equations R2
D1 x T0h 161,95ˆ CUDCUD -
D2 x T0h 613,95ˆ CUDCUD -
D3 x T0h 601,96ˆ CUDCUD -
D1 x T20h 2** 000375,0170,0929,74ˆ PPCUD 0,99
D2 x T20h PCUD o0159,0682,91ˆ 0,72
D3 x T20h 815,95ˆ CUDCUD -
D1 x T40h 371,89ˆ CUDCUD -
D2 x T40h 683,94ˆ CUDCUD -
D3 x T40h 815,95ˆ CUDCUD -
D1 x T60h PCUD *0513,0157,81ˆ 0,89
D2 x T60h 922,91ˆ CUDCUD -
D3 x T60h 2** 000220,00739,0557,98ˆ PPCUD 0,99
D1 x T80h PCUD o0782,0565,75ˆ 0,70
D2 x T80h 2** 000423,0170,0686,79ˆ PPCUD 0,99
D3 x T80h 351,95ˆ CUDCUD -
D1 x T100h PCUD o0709,0160,77ˆ 0,64
D2 x T100h 418,94ˆ CUDCUD -
D3 x T100h 187,95ˆ CUDCUD -
D1 x T120h 132,89ˆ CUDCUD -
D2 x T120h 104,93ˆ CUDCUD -
D3 x T120h 700,94ˆ CUDCUD -
D1 x T140h 534,88ˆ CUDCUD -
D2 x T140h 958,93ˆ CUDCUD -
D3 x T140h 783,94ˆ CUDCUD -
D1 x T160h PCUD o208,0793,46ˆ 0,64
D2 x T160h 930,93ˆ CUDCUD -
D3 x T160h PCUD o0208,0967,90ˆ 0,73
1
Combinations Regression equations R2
D1 x T0h 161,95ˆ CUDCUD -
D2 x T0h 613,95ˆ CUDCUD -
D3 x T0h 601,96ˆ CUDCUD -
D1 x T20h 2** 000375,0170,0929,74ˆ PPCUD 0,99
D2 x T20h PCUD o0159,0682,91ˆ 0,72
D3 x T20h 815,95ˆ CUDCUD -
D1 x T40h 371,89ˆ CUDCUD -
D2 x T40h 683,94ˆ CUDCUD -
D3 x T40h 815,95ˆ CUDCUD -
D1 x T60h PCUD *0513,0157,81ˆ 0,89
D2 x T60h 922,91ˆ CUDCUD -
D3 x T60h 2** 000220,00739,0557,98ˆ PPCUD 0,99
D1 x T80h PCUD o0782,0565,75ˆ 0,70
D2 x T80h 2** 000423,0170,0686,79ˆ PPCUD 0,99
D3 x T80h 351,95ˆ CUDCUD -
D1 x T100h PCUD o0709,0160,77ˆ 0,64
D2 x T100h 418,94ˆ CUDCUD -
D3 x T100h 187,95ˆ CUDCUD -
D1 x T120h 132,89ˆ CUDCUD -
D2 x T120h 104,93ˆ CUDCUD -
D3 x T120h 700,94ˆ CUDCUD -
D1 x T140h 534,88ˆ CUDCUD -
D2 x T140h 958,93ˆ CUDCUD -
D3 x T140h 783,94ˆ CUDCUD -
D1 x T160h PCUD o208,0793,46ˆ 0,64
D2 x T160h 930,93ˆ CUDCUD -
D3 x T160h PCUD o0208,0967,90ˆ 0,73
1 *and 0 = significant at 5 and 10% probability by the "t" test.
Table 6. Continuation.
The quadratic regression model best fitted to
the combinations D1xT20h, D3xT60h and D2xT80h.
Applying the first derivative in this model, the
maximum DUC values were 94.20% for operating
pressure of 227 kPa (D1xT20h) and 96.77% for
operating pressure of 201 kPa (D2xT80h); and the
minimum DCU value was 92.35% for operating
pressure of 168 kPa (D3xT60H). The linear regression
model best fitted to the combinations D2xT20h,
D1xT60h, D1xT80h, D1xT100h, D1xT160h and D3xT160h.
The mean was the best representation for the other
combinations, regarding the DUC as a function of
operating pressures.
Regarding the DUC as a function of operation
times, Tables 4 and 6 show that the linear and the
square root regression models fitted to 34% of the
combinations, while the DUC as a function of
operating pressures had 33% of linear and quadratic
regression models fitting the combinations.
Nowadays, there is no safe method for
assessing the risk of clogging by using wastewater.
In order to provide a quantitative orientation, Bucks,
Nakayama and Gilbert (1979) and Capra and
Scicolone (1998) classified the risk of clogging of
drippers with nominal flow of up to 12 L h-1 using
criteria related to quality of irrigation water. The
water quality characteristics, reported by Bucks,
Nakayama and Gilbert (1979), were suspended
solids, dissolved solids, hydrogenionic potential,
manganese, iron, hydrogen sulfide and bacterial
population; Capra and Scicolone (1998) reported the
same characteristics, adding the calcium and
magnesium.
Table 7 shows the multiple linear regression
models of the FVC as a function of physicochemical
and biological characteristics that cause obstructions
in drippers for the combinations of drippers types
and operating pressures.
Table 7. Regression equations fitted to the average values of the FVC depending on the physicochemical and biological
characteristics that cause obstructions in drippers for the combinations of drippers types and operating pressures.
Combinations Regression equations R2
D1 x P1 MnFeTCDSMgCVF *******2** 051,31742,2600642,00525,0343,4342,144ˆ 1,00
D2 x P1 809,6ˆ CVFCVF -
D3 x P1 SDCVF **0145,0281,28ˆ 0,75
D1 x P2 757,5ˆ CVFCVF -
D2 x P2 516,4ˆ CVFCVF -
D3 x P2 114,4ˆ CVFCVF -
D1 x P3 779,6ˆ CVFCVF -
D2 x P3 509,5ˆ CVFCVF -
D3 x P3 501,4ˆ CVFCVF -
D1 x P4 122,5ˆ CVFCVF -
D2 x P4 682,4ˆ CVFCVF -
D3 x P4 502,3ˆ CVFCVF -
1 ** and * = significant at 1 and 5% probability for the "t" test.
The characteristics Mg2+, DS, TC, Fe and Mn
affected the FVC values of the combinations D1xP1
and D3xP1, while there was no effect of the
physicochemical and biological characteristics that
cause obstructions on FVC values of other
combinations, indicating a low risk of obstruction.
Batista et al. (2008) selected models of
multiple linear regressions for three types of drippers
operating with tertiary domestic wastewaters, and

EMPIRICAL MODELS FOR PERFORMANCE OF DRIPPERS APPLYING CASHEW NUT PROCESSING WASTEWATER
K. B. SILVA et al.
Rev. Caatinga, Mossoró, v. 29, n. 2, p. 405 – 414, abr. – jun., 2016 413
found no effect of Mn, Fe, DS and pH on the mean
flow values for drip units with the emitters M1 (1.7 L
h-1) and M2 (2.1 L h-1), and no effect of Mn and Fe
on mean flow values for drip units with the emitter
M3 (2.0 L h-1).
Table 8 shows the multiple linear regression
models of the DUC depending on the
physicochemical and biological characteristics that
cause obstructions.
Table 8. Regression equations fitted to the average values of the DUC depending on the physicochemical and biological
characteristics that cause obstructions in drippers for the combinations of types of drippers and operating pressures.
Combinations Regression equations R2
D1 x P1 TCDSMgCUD ***2** 0160,00565,0715,5820,237ˆ 0,97
D2 x P1 987,91ˆ CUDCUD -
D3 x P1 DSCUD **0179,0523,135ˆ 0,76
D1 x P2 671,93ˆ CUDCUD -
D2 x P2 034,95ˆ CUDCUD -
D3 x P2 694,95ˆ CUDCUD -
D1 x P3 873,91ˆ CUDCUD -
D2 x P3 124,94ˆ CUDCUD -
D3 x P3 249,95ˆ CUDCUD -
D1 x P4 294,94ˆ CUDCUD -
D2 x P4 881,94ˆ CUDCUD -
D3 x P4 310,96ˆ CUDCUD -
1 ** and * = significant at 1 and 5% probability for the "t" test.
The characteristics Mg2+, DS, TC and pH
affected the DUC values of the combinations D1xP1
and D3xP1, while there was no effect of physical,
chemical and biological characteristics on the DUC
values for the other combinations. Moreover,
Dehghanisanij et al. (2005) found a linear effect of
pH, electrical conductivity, algae and zooplankton
population on the dripper flow, operating with
treated domestic wastewater.
CONCLUSIONS
The regression models that fitted to the FVC
and DUC as a function of operating time were square
root, linear and quadratic, with 17%, 17% and 8%,
and 17%, 17% and 0%, respectively.
The regression models that fitted to the FVC
and DUC as a function of operating pressures were
square root, linear and quadratic, with 11%, 22% and
0% and the 0%, 22% and 11%, respectively.
Multiple linear regressions showed that the
dissolved solids content is the main wastewater
characteristic that interfere in the FVC and DUC
values of the drip units D1 (1.65 L h-1) and D3 (4.00
L h-1), operating at work pressure of 70 kPa (P1).
REFERENCES
ABNT - Associação Brasileira de Normas Técnicas.
Equipamentos de irrigação agrícola - Emissores e
tubos emissores - Especificações e métodos de
ensaio. ABNT NBR ISO 9261. São Paulo: ABNT,
2006. 17 p.
ALVARES, C. A. et al. Köppen's climate
classification map for Brazil. Meteorologische
Zeitschrift, Stuttgart, v. 22, n. 6, p. 711-728, 2013.
BATISTA, R. O. et al. Modelos empíricos da
irrigação localizada com esgoto sanitário tratado.
Engenharia na Agricultura, Viçosa, v. 16, n. 3, p.
369-377, 2008.
BATISTA, R. O. et al. Efeito das características do
esgoto doméstico na uniformidade de aplicação de
sistemas de irrigação por gotejamento. Revista
Caatinga, Mossoró, v. 24, n. 4, p. 137-144, 2011.
BATISTA, R. O. et al. Evaluación del desempeño
hidraulico de tres goteros aplicando agua residual de
porcicultura. Dyna, Medellin, v. 79, n. 173, p. 103-
108, 2012.
BATISTA, R. O. et al. Obstrução e uniformidade de
aplicação em sistemas de irrigação por gotejamento
aplicando-se efluente da suinocultura. Revista
Brasileira de Engenharia Agrícola e Ambiental,
Campina Grande, v. 17, n. 7, p. 698-705, 2013.

EMPIRICAL MODELS FOR PERFORMANCE OF DRIPPERS APPLYING CASHEW NUT PROCESSING WASTEWATER
K. B. SILVA et al.
Rev. Caatinga, Mossoró, v. 29, n. 2, p. 405 – 414, abr. – jun., 2016 414
BATISTA, R. O. et al. Gotejadores aplicando
proporções de tempo de irrigação com efluente da
suinocultura e água de abastecimento. Bioscience
Journal, Uberlândia, v. 30, n .6, p. 1746-1756, 2014.
BUCKS, D. A.; NAKAYAMA, F. S.; GILBERT, R.
G. Trickle irrigation water quality and preventive
maintenance. Agricultural Water Management,
Amsterdam, v. 2, n. 2, p. 149-162, 1979.
CAPRA, A.; SCICOLONE, B. Water quality and
distribution uniformity in drip/trickle irrigation
systems. Journal of Agricultural Engineering
Research, London, v. 70, n. 4, p. 355-365, 1998.
CONAB. Companhia nacional de abastecimento.
Conjuntura mensal: castanha de caju novembro
de 2015. Brasília, DF: MAPA, 2015. 5 p.
DAZHUANG, Y. et al. Biofilm structure and its
influence on clogging in drip irrigation emitters
distributing reclaimed wastewater. Journal of
Environmental Sciences, v.21, n.6, p.834-841,
2009.
DEHGHANISANIJ, H. et al. The effect of chlorine
on emitter clogging induced by algae and protozoa
and the performance of drip irrigation. Transaction
of the ASAE, St. Joseph, v. 48, n. 2, p. 519-527,
2005.
FERNANDES, R. K. A. et al. Vazão de gotejadores
aplicando água residuária da castanha de caju.
Irriga, Botucatu, v. 19, n. 4, p. 585-597, 2014.
LOPES, M. S. S. et al. Remoção de macronutrientes
de efluente da indústria de castanha de caju por uso
de reator aeróbio em batelada com inóculo fúngico.
Engenharia Sanitária e Ambiental, Rio de Janeiro,
v. 16, n. 1, p. 17-26, 2011.
MESQUITA, F. O. et al. Uniformidade de aplicação
de percolado de aterro sanitário diluído em unidades
de irrigação por gotejamento. Agropecuária
Científica no Semiárido, Patos, v. 11, n 1, p. 145-
156, 2015.
OLIVER, M. M. H.; HEWA, G. A.; PEZZANITI, D.
Bio-fouling of subsurface type drip emitters applying
reclaimed water under medium soil thermal
variation. Agricultural Water Management,
Amsterdam, v. 133, n. 1, p. 12-23, 2014.
PUIG-BARGUÉS, J. et al. Effect of flushing
frequency on emitter clogging in microirrigation
with effluents. Agricultural Water Management,
Amsterdam, v. 97, n. 6, p. 883-891, 2010.
RICE, E. W.; BAIRD, R. B.; CLESCERI, A. D.
Standard methods for the examination of water
and wastewater. 22.ed. Washington: APHA,
AWWA, WPCR, 2012. 1496 p.
ROWAN, M.; MANCL, K. M.; TUOVINEN, O. H.
Evaluation of drip irrigation emitters distributing
primary and secondary wastewater effluents.
Irrigation & Drainage Systems Engineering, New
York, v. 2, n. 3, p. 2-7, 2013.
SAEG. Sistema para análises estatísticas versão 9.1.
Viçosa: Fundação Arthur Bernardes, UFV, 2007.
Disponível em: http://www.ufv.br/saeg/ Acesso em:
02 de jan. 2016.
SOUZA FILHO, H. M. et al. Barreiras às novas
formas de coordenação no agrossistema do caju na
região Nordeste, Brasil. Gestão & Produção, São
Carlos, v. 17, n. 2, p. 229-244, 2010.
SOUZA, C. F. et al. Eficiência de estação de
tratamento de esgoto doméstico visando reuso
Agrícola. Revista Ambiente & Água, Taubaté, v.
10, n. 3, p. 587-597, 2015.
YAN, D. et al. Biofilm accumulation and structure in
the flow path of drip emitters using reclaimed
wastewater. Transactions of the ASABE, St.
Joseph, v. 53, n. 3, p. 751-758, 2010.
YAVUZ, M. Y. et al. Emitter clogging and effects on
drip irrigation systems performances. African
Journal of Agricultural Research, Nairobi, v. 5, n.
7, p. 532-538, 2010.
Copyright © 2022 FDOKUMEN