Isolation and Enzyme-Inhibition Studies of the Chemical Constituents fromAjuga bracteosa
12
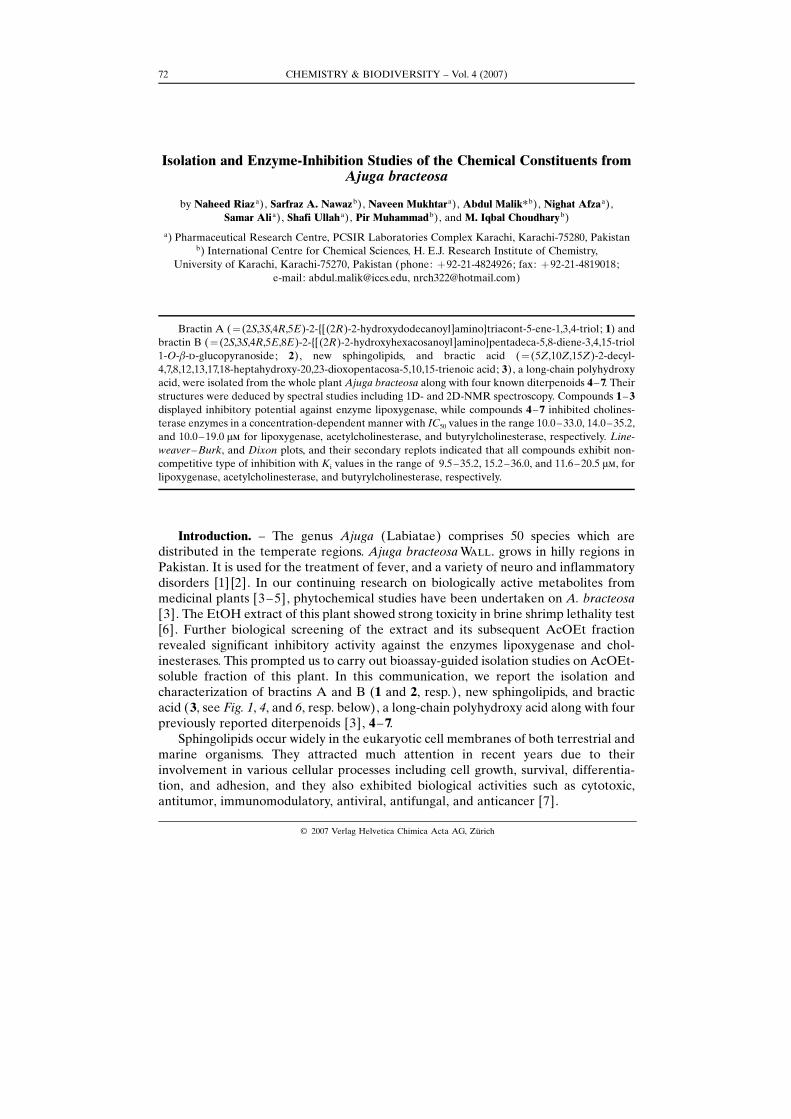
Isolation and Enzyme-Inhibition Studies of the Chemical Constituents from Ajuga bracteosa by Naheed Riaz a ), Sarfraz A. Nawaz b ), Naveen Mukhtar a ), Abdul Malik* b ), Nighat Afza a ), Samar Ali a ), Shafi Ullah a ), Pir Muhammad b ), and M. Iqbal Choudhary b ) a ) Pharmaceutical Research Centre, PCSIR Laboratories Complex Karachi, Karachi-75280, Pakistan b ) International Centre for Chemical Sciences, H.E.J. Research Institute of Chemistry, University of Karachi, Karachi-75270, Pakistan (phone: þ 92-21-4824926; fax: þ 92-21-4819018; e-mail: [email protected], [email protected]) Bractin A ( ¼ (2S,3S,4R,5E)-2-{[(2R)-2-hydroxydodecanoyl]amino}triacont-5-ene-1,3,4-triol; 1) and bractin B ( ¼ (2S,3S,4R,5E,8E)-2-{[(2R)-2-hydroxyhexacosanoyl]amino}pentadeca-5,8-diene-3,4,15-triol 1-O-b-d-glucopyranoside; 2), new sphingolipids, and bractic acid ( ¼ (5Z,10Z,15Z)-2-decyl- 4,7,8,12,13,17,18-heptahydroxy-20,23-dioxopentacosa-5,10,15-trienoic acid; 3), a long-chain polyhydroxy acid, were isolated from the whole plant Ajuga bracteosa along with four known diterpenoids 4 – 7 . Their structures were deduced by spectral studies including 1D- and 2D-NMR spectroscopy. Compounds 1 – 3 displayed inhibitory potential against enzyme lipoxygenase, while compounds 4 – 7 inhibited cholines- terase enzymes in a concentration-dependent manner with IC 50 values in the range 10.0 – 33.0, 14.0 – 35.2, and 10.0 – 19.0 mm for lipoxygenase, acetylcholinesterase, and butyrylcholinesterase, respectively. Line- weaver – Burk, and Dixon plots, and their secondary replots indicated that all compounds exhibit non- competitive type of inhibition with K i values in the range of 9.5 – 35.2, 15.2 – 36.0, and 11.6 – 20.5 mm, for lipoxygenase, acetylcholinesterase, and butyrylcholinesterase, respectively. Introduction. – The genus Ajuga (Labiatae) comprises 50 species which are distributed in the temperate regions. Ajuga bracteosa Wall. grows in hilly regions in Pakistan. It is used for the treatment of fever, and a variety of neuro and inflammatory disorders [1] [2]. In our continuing research on biologically active metabolites from medicinal plants [3 – 5], phytochemical studies have been undertaken on A. bracteosa [ 3] . The EtOH extract of this plant showed strong toxicity in brine shrimp lethality test [6]. Further biological screening of the extract and its subsequent AcOEt fraction revealed significant inhibitory activity against the enzymes lipoxygenase and chol- inesterases. This prompted us to carry out bioassay-guided isolation studies on AcOEt- soluble fraction of this plant. In this communication, we report the isolation and characterization of bractins A and B (1 and 2, resp.), new sphingolipids, and bractic acid ( 3, see Fig. 1, 4, and 6, resp. below), a long-chain polyhydroxy acid along with four previously reported diterpenoids [3], 4 – 7 . Sphingolipids occur widely in the eukaryotic cell membranes of both terrestrial and marine organisms. They attracted much attention in recent years due to their involvement in various cellular processes including cell growth, survival, differentia- tion, and adhesion, and they also exhibited biological activities such as cytotoxic, antitumor, immunomodulatory, antiviral, antifungal, and anticancer [7]. CHEMISTRY & BIODIVERSITY – Vol. 4 (2007) 72 # 2007 Verlag Helvetica Chimica Acta AG, Zɒrich
Transcript of Isolation and Enzyme-Inhibition Studies of the Chemical Constituents fromAjuga bracteosa
Isolation and Enzyme-Inhibition Studies of the Chemical Constituents fromAjuga bracteosa
by Naheed Riaza), Sarfraz A. Nawazb), Naveen Mukhtara), Abdul Malik*b), Nighat Afzaa),Samar Alia), Shafi Ullaha), Pir Muhammadb), and M. Iqbal Choudharyb)
a) Pharmaceutical Research Centre, PCSIR Laboratories Complex Karachi, Karachi-75280, Pakistanb) International Centre for Chemical Sciences, H. E.J. Research Institute of Chemistry,
University of Karachi, Karachi-75270, Pakistan (phone: þ92-21-4824926; fax: þ92-21-4819018;e-mail: [email protected], [email protected])
Bractin A (¼ (2S,3S,4R,5E)-2-{[(2R)-2-hydroxydodecanoyl]amino}triacont-5-ene-1,3,4-triol; 1) andbractin B (¼ (2S,3S,4R,5E,8E)-2-{[(2R)-2-hydroxyhexacosanoyl]amino}pentadeca-5,8-diene-3,4,15-triol1-O-b-d-glucopyranoside; 2), new sphingolipids, and bractic acid (¼ (5Z,10Z,15Z)-2-decyl-4,7,8,12,13,17,18-heptahydroxy-20,23-dioxopentacosa-5,10,15-trienoic acid; 3), a long-chain polyhydroxyacid, were isolated from the whole plant Ajuga bracteosa along with four known diterpenoids 4–7. Theirstructures were deduced by spectral studies including 1D- and 2D-NMR spectroscopy. Compounds 1–3displayed inhibitory potential against enzyme lipoxygenase, while compounds 4–7 inhibited cholines-terase enzymes in a concentration-dependent manner with IC50 values in the range 10.0–33.0, 14.0–35.2,and 10.0–19.0 mm for lipoxygenase, acetylcholinesterase, and butyrylcholinesterase, respectively. Line-weaver–Burk, and Dixon plots, and their secondary replots indicated that all compounds exhibit non-competitive type of inhibition with Ki values in the range of 9.5–35.2, 15.2–36.0, and 11.6–20.5 mm, forlipoxygenase, acetylcholinesterase, and butyrylcholinesterase, respectively.
Introduction. – The genus Ajuga (Labiatae) comprises 50 species which aredistributed in the temperate regions. Ajuga bracteosaWall. grows in hilly regions inPakistan. It is used for the treatment of fever, and a variety of neuro and inflammatorydisorders [1] [2]. In our continuing research on biologically active metabolites frommedicinal plants [3–5], phytochemical studies have been undertaken on A. bracteosa[3]. The EtOH extract of this plant showed strong toxicity in brine shrimp lethality test[6]. Further biological screening of the extract and its subsequent AcOEt fractionrevealed significant inhibitory activity against the enzymes lipoxygenase and chol-inesterases. This prompted us to carry out bioassay-guided isolation studies on AcOEt-soluble fraction of this plant. In this communication, we report the isolation andcharacterization of bractins A and B (1 and 2, resp.), new sphingolipids, and bracticacid (3, see Fig. 1, 4, and 6, resp. below), a long-chain polyhydroxy acid along with fourpreviously reported diterpenoids [3], 4–7.
Sphingolipids occur widely in the eukaryotic cell membranes of both terrestrial andmarine organisms. They attracted much attention in recent years due to theirinvolvement in various cellular processes including cell growth, survival, differentia-tion, and adhesion, and they also exhibited biological activities such as cytotoxic,antitumor, immunomodulatory, antiviral, antifungal, and anticancer [7].
CHEMISTRY & BIODIVERSITY – Vol. 4 (2007)72
G 2007 Verlag Helvetica Chimica Acta AG, ZJrich
Lipoxygenases (LOX; EC 1.13.11.12) constitute a family of non-heme iron-containing dioxygenases that are widely distributed in animals and plants. Inmammalian cells, these are key enzymes in the biosynthesis of a variety ofbioregulatory compounds such as hydroxyeicosatetraenoic acids (HETEs), leuko-trienes, lipoxins, and hepoxylines [8]. It has been found that these LOX products play arole in a variety of disorders such as bronchial asthma, inflammation [9], and tumorangiogenesis [10]. LOXs are, therefore, a potential target for the rational drug designand discovery of mechanism-based inhibitors for the treatment of bronchial asthma,inflammation, cancer, and autoimmune diseases. Compounds 1–3 showed significantinhibitory activity against LOX with IC50 values ranging between 10.0 and 33.0 mm.
Cholinesterase enzymes are implicated as key biological players in AlzheimerLsdisease (AD), which makes them logical targets for inhibitory therapeutics. The mostimportant and well-documented function of acetylcholinesterase (AChE) is thehydrolysis of the neurotransmitter acetylcholine [11]. According to the cholinergichypothesis, the memory impairment in the patients with senile dementia of AlzheimerLstype results from a deficiency in cholinergic function in the brain [12]. Hence, the mostpromising therapeutic strategy for activating central cholinergic functions has been theuse of cholinomimetic agents. Thus, the enzyme AChE has long been an attractivetarget for the rational drug design and discovery of mechanism-based inhibitors, for thetreatment of AD. The aim of AChE inhibitors is to boost up the endogenous levels ofacetylcholine in the brains of AD patients and thereby, to enhance cholinergicneurotransmission. The role of butyrylcholinesterase (BChE) in normal aging andbrain diseases is still elusive. It has been found that BChE is found in significantlyhigher quantities in AlzheimerLs plaques than in that of normal age-related non-demented brains [13]. The diterpenoids 4–7 showed inhibitory potential against bothAChE and BChE with IC50 values in the range of 14.0–35.2 mm for AChE and 10.0–19.0 mm for BChE, respectively.
Result and Discussion. – Repeated column chromatography of the AcOEt-solublefraction of the EtOH extract of the whole plant of A. bracteosa, followed bypurification by medium-pressure liquid chromatography (MPLC), afforded com-pounds 1–7 as colorless solids. Their structures were deduced by IR and, 1D- and 2D-NMR spectroscopy, and mass spectrometry.
Bractin A (1) was isolated as a colorless gummy solid and assigned the molecularformula C42H83NO5 on the basis of high-resolution fast-atom-bombardment massspectrometry (HR-FAB-MS), showing [MþH]þ ion peak at m/z 682.2924(C42H84NO5; calc. 682.2930) and implying two degrees of unsaturation. The IRspectrum showed absorption bands for OH group (3640 cm�1), secondary amide(1650 cm� l) , and an olefinic C¼C bond (1625 cm� l) , while the UV spectrum displayedno characteristic signals above 210 nm.
The 1H-NMR spectrum of 1 (Table 1) showed signals for an amide H-atom at d 7.42(d, J¼7.5 Hz, 1 H), two terminal Me groups at d 0.80 (t, J¼6.9 Hz, 6 H), anoxygenated CH2 group at d 3.70 (dd, J¼10.6, 6.3 Hz, 1 H) and 3.60 (dd, J¼10.6, 3.4 Hz,1 H), three CH�O groups at d 4.00 (dd, J¼5.1, 4.8 Hz, 1 H), 3.90 (t, J¼7.0 Hz, 1 H),and 3.47 (dd, J¼5.1, 3.1 Hz, 1 H), and a low-field signal at d 4.46–4.53 (m, 1 H), whichwas ascribed to a CH H-atom vicinal to the N-atom of the amide group [14]. Further,
CHEMISTRY & BIODIVERSITY – Vol. 4 (2007) 73
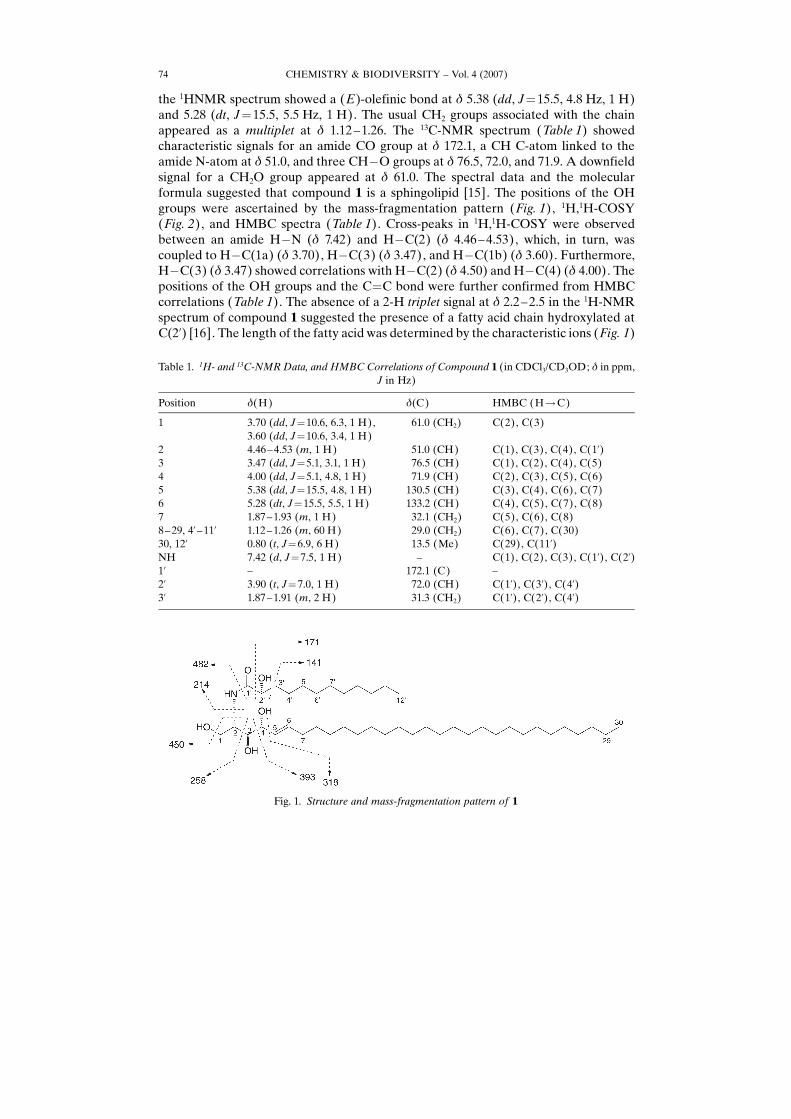
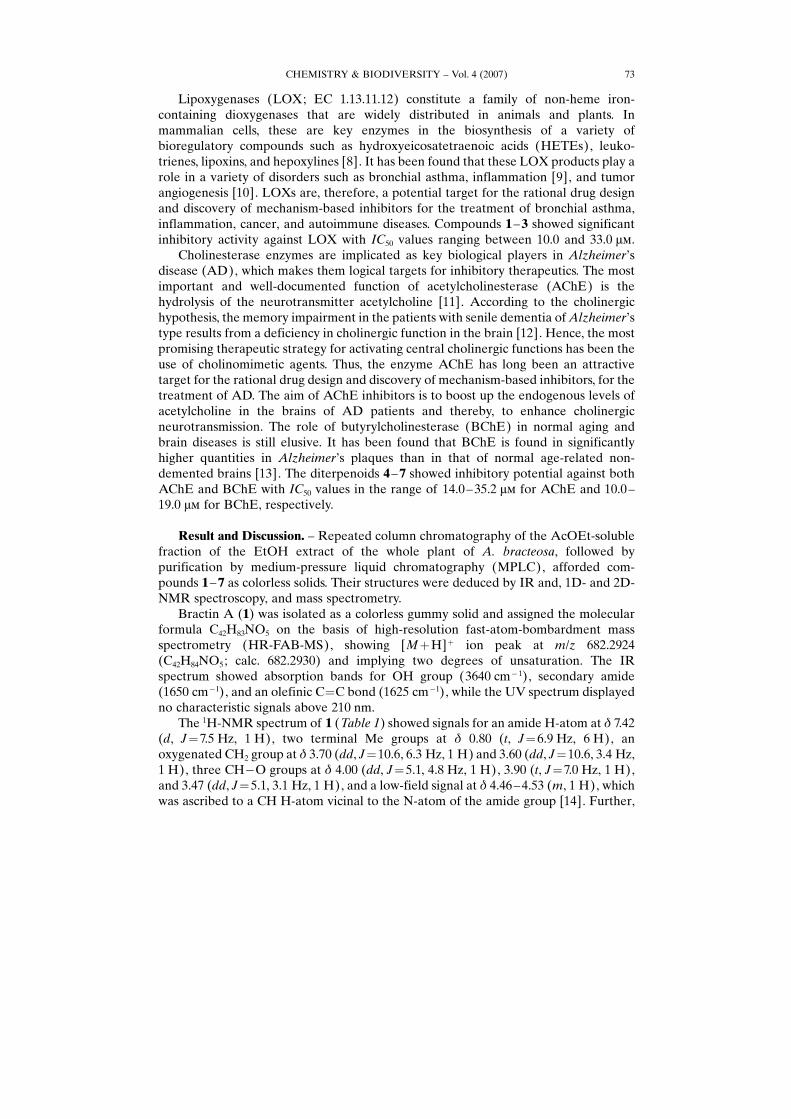
the 1HNMR spectrum showed a (E)-olefinic bond at d 5.38 (dd, J¼15.5, 4.8 Hz, 1 H)and 5.28 (dt, J¼15.5, 5.5 Hz, 1 H). The usual CH2 groups associated with the chainappeared as a multiplet at d 1.12–1.26. The 13C-NMR spectrum (Table 1) showedcharacteristic signals for an amide CO group at d 172.1, a CH C-atom linked to theamide N-atom at d 51.0, and three CH�O groups at d 76.5, 72.0, and 71.9. A downfieldsignal for a CH2O group appeared at d 61.0. The spectral data and the molecularformula suggested that compound 1 is a sphingolipid [15]. The positions of the OHgroups were ascertained by the mass-fragmentation pattern (Fig. 1), 1H,1H-COSY(Fig. 2), and HMBC spectra (Table 1). Cross-peaks in 1H,1H-COSY were observedbetween an amide H�N (d 7.42) and H�C(2) (d 4.46–4.53), which, in turn, wascoupled to H�C(1a) (d 3.70), H�C(3) (d 3.47), and H�C(1b) (d 3.60). Furthermore,H�C(3) (d 3.47) showed correlations with H�C(2) (d 4.50) and H�C(4) (d 4.00). Thepositions of the OH groups and the C¼C bond were further confirmed from HMBCcorrelations (Table 1). The absence of a 2-H triplet signal at d 2.2–2.5 in the 1H-NMRspectrum of compound 1 suggested the presence of a fatty acid chain hydroxylated atC(2’) [16]. The length of the fatty acid was determined by the characteristic ions (Fig. 1)
CHEMISTRY & BIODIVERSITY – Vol. 4 (2007)74
Table 1. 1H- and 13C-NMR Data, and HMBC Correlations of Compound 1 (in CDCl3/CD3OD; d in ppm,J in Hz)
Position d(H) d(C) HMBC (H!C)
1 3.70 (dd, J¼10.6, 6.3, 1 H), 61.0 (CH2) C(2), C(3)3.60 (dd, J¼10.6, 3.4, 1 H)
2 4.46–4.53 (m, 1 H) 51.0 (CH) C(1), C(3), C(4), C(1’)3 3.47 (dd, J¼5.1, 3.1, 1 H) 76.5 (CH) C(1), C(2), C(4), C(5)4 4.00 (dd, J¼5.1, 4.8, 1 H) 71.9 (CH) C(2), C(3), C(5), C(6)5 5.38 (dd, J¼15.5, 4.8, 1 H) 130.5 (CH) C(3), C(4), C(6), C(7)6 5.28 (dt, J¼15.5, 5.5, 1 H) 133.2 (CH) C(4), C(5), C(7), C(8)7 1.87–1.93 (m, 1 H) 32.1 (CH2) C(5), C(6), C(8)8–29, 4’–11’ 1.12–1.26 (m, 60 H) 29.0 (CH2) C(6), C(7), C(30)30, 12’ 0.80 (t, J¼6.9, 6 H) 13.5 (Me) C(29), C(11’)NH 7.42 (d, J¼7.5, 1 H) – C(1), C(2), C(3), C(1’), C(2’)1’ – 172.1 (C) –2’ 3.90 (t, J¼7.0, 1 H) 72.0 (CH) C(1’), C(3’), C(4’)3’ 1.87–1.91 (m, 2 H) 31.3 (CH2) C(1’), C(2’), C(4’)
Fig. 1. Structure and mass-fragmentation pattern of 1
at m/z 199 ([Me(CH2)9(CHOH)CO]þ ), 216 ([Me(CH2)9(CHOH)CONH2þH]þ ),and 271 ([Me(CH2)9(CHOH)C(OH)¼NC(¼CH2)CH2OH]þ ). The length of the baseunit was also determined by the characteristic ion peaks at m/z 258 ([M�Me(CH2)23(CH¼CH)(CHOH)2]þ ), 423 ([Me(CH2)23(CH¼CH)(CHOH)2]þ ), and393 ([Me(CH2)23(CH¼CH)(CHOH)]þ ) in the EI-MS [16]. Methanolysis [7] of 1with methanolic HCl gave the base and the methyl ester of the long-chain hydroxy acid.After acetylation [7] and subsequent GC/MS, the two fragments could be identified as2-acetoxydodecanoate (m/z 272) and 2-acetamino-1,3,4-triacetoxytriacont-5-ene (m/z651). It has been previously reported in literature that both the optical rotation andchemical shifts of the H-atoms attached to the stereogenic C-atoms provide a strongevidence for the absolute configuration of sphingolipids. Since most of the spectra ofsphingolipids have so far been reported in (D5)pyridine, the 1H-NMR spectrum of 1was repeated in (D5)pyridine, and the chemical shifts of the H-atoms attached to thestereogenic C-atoms and C(1) were found to be d 4.64 (dd, J¼10.5, 5.6 Hz, Ha�C(1)),4.42 (dd, J¼10.5, 4.2 Hz, Hb�C(1)), 5.15–5.10 (m, H�C(2)), 4.35 (dd, J¼4.9, 3.2 Hz,H�C(3)), 4.28 (dd, J¼4.9, 4.5 Hz, H�C(4)), and 4.59 (t, J¼6.8 Hz, H�C(2’)). Thesewere in complete agreement with those of sphingolipids with a (2S,3S,4R,2’R)-configuration [14]. The optical rotations of 1 ([a]D¼ þ34.4) and the subsequentmethanolysis products ([a]D¼ �3.2 and þ16.2) provided conclusive evidence for theassigned configuration [17–19]. Based on these evidences, bractin A (1) could beassigned the structure (2S,3S,4R,5E)-2-{[(2R)-2-hydroxydodecanoyl]amino}triacont-5-ene-1,3,4-triol.
Bractin B (2) was isolated as a gummy solid. The molecular formula C47H89NO11
was established by HR-FAB-MS, showing [MþH]þ ion peak at m/z 844.6546(C47H90NO11; calc. 844.6553). The IR spectrum of 2 was similar to that of compound 1.
The 1H-NMR spectrum (Table 2) showed signals of one terminal Me group at d 0.74(t, J¼7.0 Hz, 3 H), 22 CH2 groups at d 1.06–1.18 (m, 44 H), an amide H-atom at d 7.45(d, J¼8.9 Hz, 1 H), three CH�O groups at d 3.97 (t, J¼6.7 Hz, 1 H), 3.92 (dd, J¼5.0,4.6 Hz, 1 H), and 3.49 (dd, J¼5.0, 3.2 Hz, 1 H), and a CH2O group at d 3.61 (t, J¼6.6 Hz, 2 H). It also showed signals of two (E)-olefinic bonds (d 5.65 (dt, J¼15.4,5.1 Hz, 1 H), 5.55 (dt, J¼15.9, 5.6 Hz, 1 H), 5.35 (dd, J¼15.4, 4.6 Hz, 1 H), 5.30 (dt, J¼15.9, 5.6 Hz, 1 H)), non-equivalent CH2O H-atoms at d 3.94 (dd, J¼10.9, 5.4 Hz, 1 H)and 3.65 (dd, J¼10.9, 3.1 Hz, 1 H), and a signal at d 4.06–4.12 (m, 1 H) could beassigned to a CHH-atom vicinal to the N-atom of the amide group [14]. The signals fora hexose moiety appeared at d 4.20 (d, J¼7.0 Hz, H�C(1’’)), 3.08–3.12 (m, H�C(2’’)),3.33–3.37 (m, H�(3’’)), 3.28–3.32 (m, H�C(4’’)), 3.14–3.18 (m, H�C(5’’)), and CH2
H-atoms at d 3.67 (dd, J¼11.2, 5.6 Hz, 1 H) and 3.57 (dd, J¼11.2, 3.4 Hz, 1 H). The
CHEMISTRY & BIODIVERSITY – Vol. 4 (2007) 75
Fig. 2. Important COSY correlations of 1
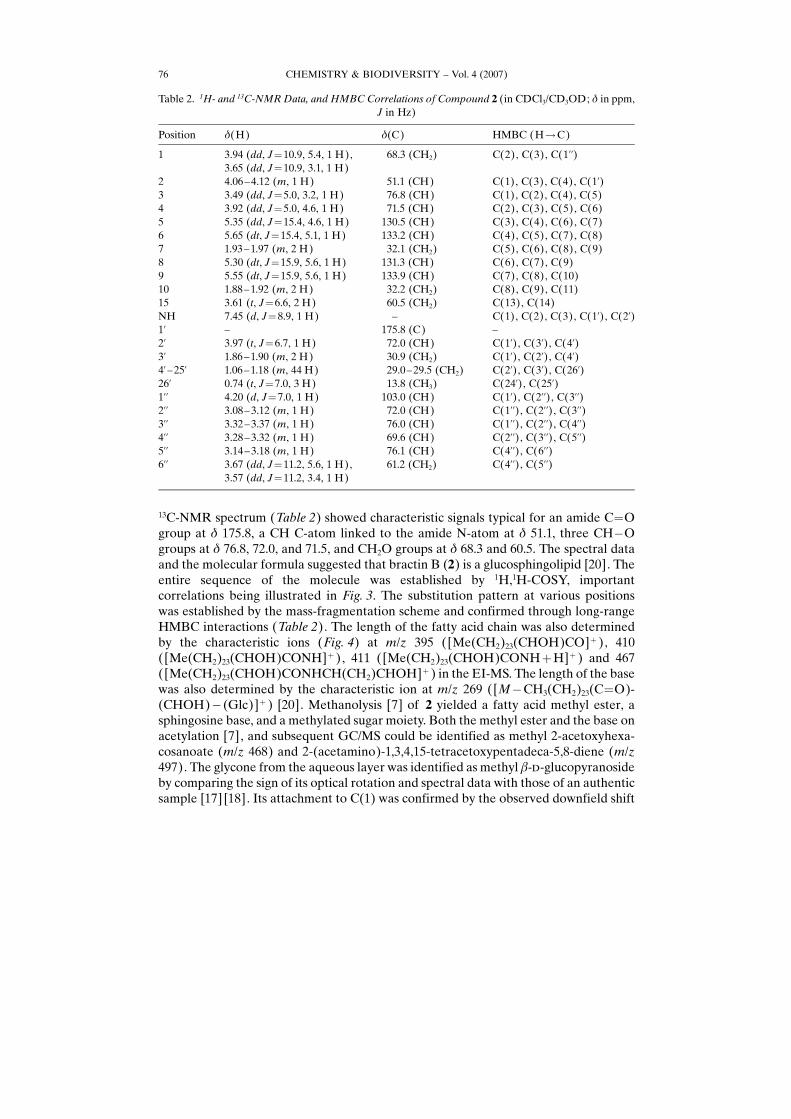
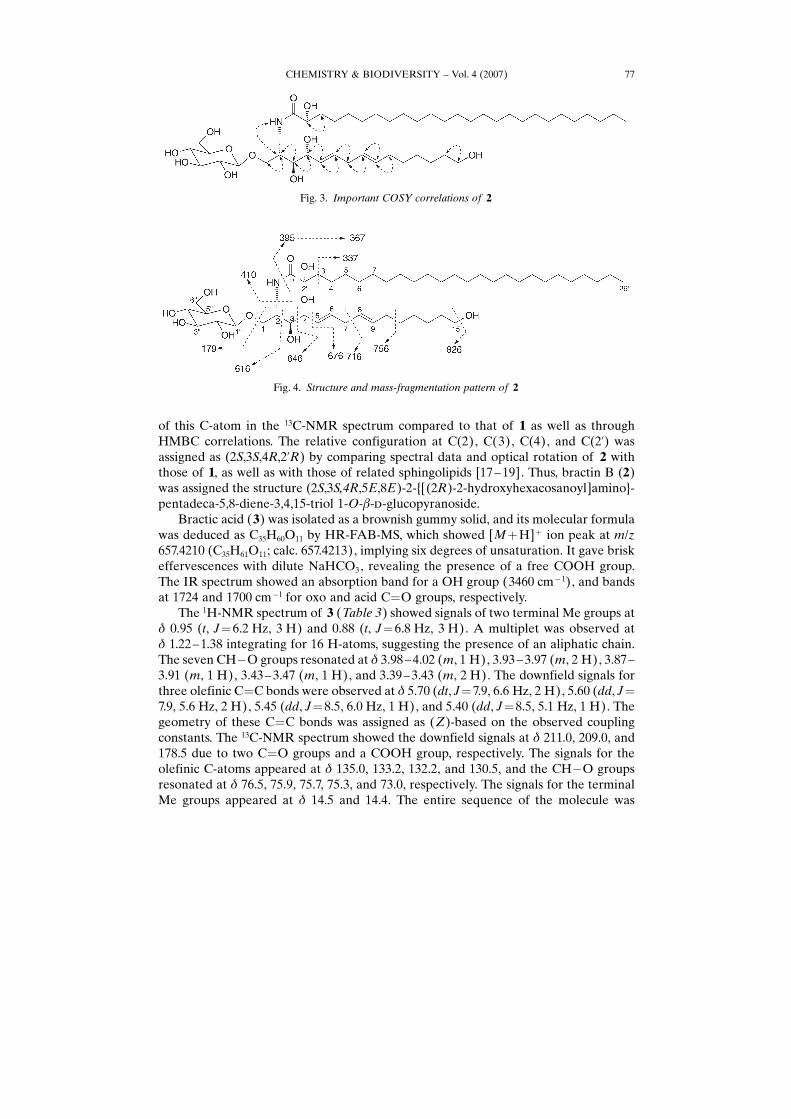
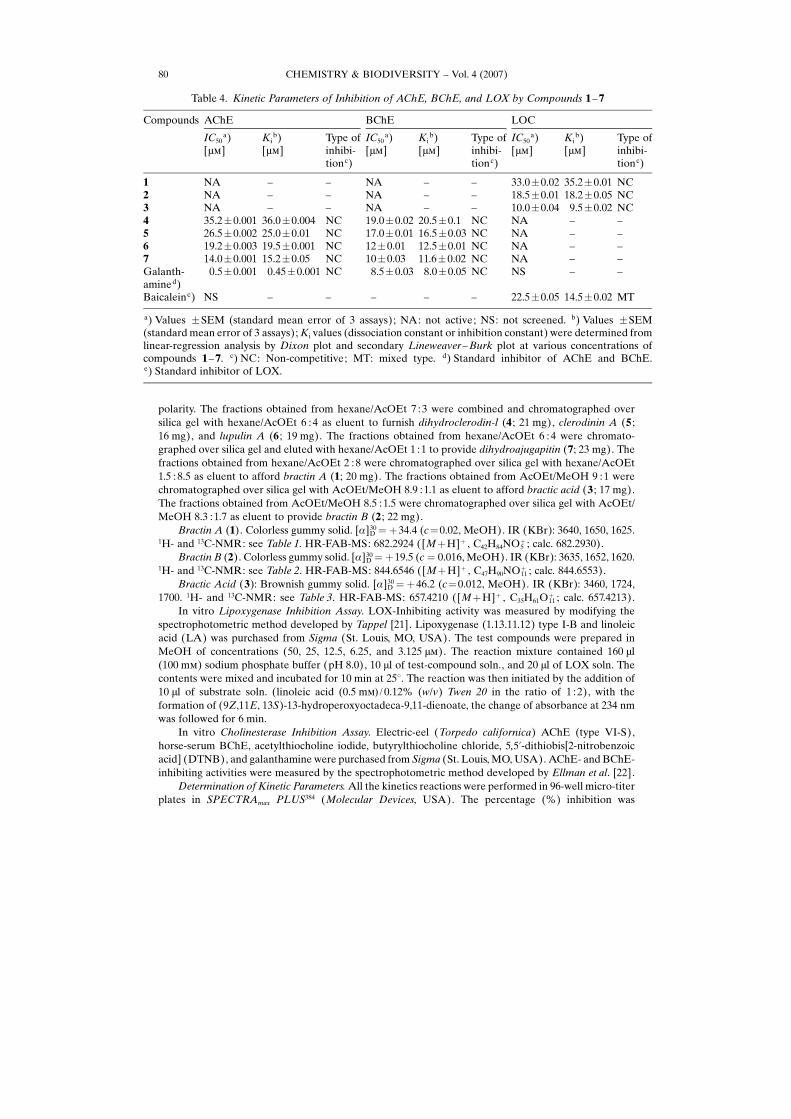
13C-NMR spectrum (Table 2) showed characteristic signals typical for an amide C¼Ogroup at d 175.8, a CH C-atom linked to the amide N-atom at d 51.1, three CH�Ogroups at d 76.8, 72.0, and 71.5, and CH2O groups at d 68.3 and 60.5. The spectral dataand the molecular formula suggested that bractin B (2) is a glucosphingolipid [20]. Theentire sequence of the molecule was established by 1H,1H-COSY, importantcorrelations being illustrated in Fig. 3. The substitution pattern at various positionswas established by the mass-fragmentation scheme and confirmed through long-rangeHMBC interactions (Table 2). The length of the fatty acid chain was also determinedby the characteristic ions (Fig. 4) at m/z 395 ([Me(CH2)23(CHOH)CO]þ ), 410([Me(CH2)23(CHOH)CONH]þ ), 411 ([Me(CH2)23(CHOH)CONHþH]þ ) and 467([Me(CH2)23(CHOH)CONHCH(CH2)CHOH]þ ) in the EI-MS. The length of the basewas also determined by the characteristic ion at m/z 269 ([M�CH3(CH2)23(C¼O)-(CHOH)� (Glc)]þ ) [20]. Methanolysis [7] of 2 yielded a fatty acid methyl ester, asphingosine base, and a methylated sugar moiety. Both the methyl ester and the base onacetylation [7], and subsequent GC/MS could be identified as methyl 2-acetoxyhexa-cosanoate (m/z 468) and 2-(acetamino)-1,3,4,15-tetracetoxypentadeca-5,8-diene (m/z497). The glycone from the aqueous layer was identified as methyl b-d-glucopyranosideby comparing the sign of its optical rotation and spectral data with those of an authenticsample [17] [18]. Its attachment to C(1) was confirmed by the observed downfield shift
CHEMISTRY & BIODIVERSITY – Vol. 4 (2007)76
Table 2. 1H- and 13C-NMR Data, and HMBC Correlations of Compound 2 (in CDCl3/CD3OD; d in ppm,J in Hz)
Position d(H) d(C) HMBC (H!C)
1 3.94 (dd, J¼10.9, 5.4, 1 H), 68.3 (CH2) C(2), C(3), C(1’’)3.65 (dd, J¼10.9, 3.1, 1 H)
2 4.06–4.12 (m, 1 H) 51.1 (CH) C(1), C(3), C(4), C(1’)3 3.49 (dd, J¼5.0, 3.2, 1 H) 76.8 (CH) C(1), C(2), C(4), C(5)4 3.92 (dd, J¼5.0, 4.6, 1 H) 71.5 (CH) C(2), C(3), C(5), C(6)5 5.35 (dd, J¼15.4, 4.6, 1 H) 130.5 (CH) C(3), C(4), C(6), C(7)6 5.65 (dt, J¼15.4, 5.1, 1 H) 133.2 (CH) C(4), C(5), C(7), C(8)7 1.93–1.97 (m, 2 H) 32.1 (CH2) C(5), C(6), C(8), C(9)8 5.30 (dt, J¼15.9, 5.6, 1 H) 131.3 (CH) C(6), C(7), C(9)9 5.55 (dt, J¼15.9, 5.6, 1 H) 133.9 (CH) C(7), C(8), C(10)10 1.88–1.92 (m, 2 H) 32.2 (CH2) C(8), C(9), C(11)15 3.61 (t, J¼6.6, 2 H) 60.5 (CH2) C(13), C(14)NH 7.45 (d, J¼8.9, 1 H) – C(1), C(2), C(3), C(1’), C(2’)1’ – 175.8 (C) –2’ 3.97 (t, J¼6.7, 1 H) 72.0 (CH) C(1’), C(3’), C(4’)3’ 1.86–1.90 (m, 2 H) 30.9 (CH2) C(1’), C(2’), C(4’)4’–25’ 1.06–1.18 (m, 44 H) 29.0–29.5 (CH2) C(2’), C(3’), C(26’)26’ 0.74 (t, J¼7.0, 3 H) 13.8 (CH3) C(24’), C(25’)1’’ 4.20 (d, J¼7.0, 1 H) 103.0 (CH) C(1’), C(2’’), C(3’’)2’’ 3.08–3.12 (m, 1 H) 72.0 (CH) C(1’’), C(2’’), C(3’’)3’’ 3.32–3.37 (m, 1 H) 76.0 (CH) C(1’’), C(2’’), C(4’’)4’’ 3.28–3.32 (m, 1 H) 69.6 (CH) C(2’’), C(3’’), C(5’’)5’’ 3.14–3.18 (m, 1 H) 76.1 (CH) C(4’’), C(6’’)6’’ 3.67 (dd, J¼11.2, 5.6, 1 H),
3.57 (dd, J¼11.2, 3.4, 1 H)61.2 (CH2) C(4’’), C(5’’)
of this C-atom in the 13C-NMR spectrum compared to that of 1 as well as throughHMBC correlations. The relative configuration at C(2), C(3), C(4), and C(2’) wasassigned as (2S,3S,4R,2’R) by comparing spectral data and optical rotation of 2 withthose of 1, as well as with those of related sphingolipids [17–19]. Thus, bractin B (2)was assigned the structure (2S,3S,4R,5E,8E)-2-{[(2R)-2-hydroxyhexacosanoyl]amino}-pentadeca-5,8-diene-3,4,15-triol 1-O-b-d-glucopyranoside.
Bractic acid (3) was isolated as a brownish gummy solid, and its molecular formulawas deduced as C35H60O11 by HR-FAB-MS, which showed [MþH]þ ion peak at m/z657.4210 (C35H61O11; calc. 657.4213), implying six degrees of unsaturation. It gave briskeffervescences with dilute NaHCO3, revealing the presence of a free COOH group.The IR spectrum showed an absorption band for a OH group (3460 cm�1), and bandsat 1724 and 1700 cm� l for oxo and acid C¼O groups, respectively.
The 1H-NMR spectrum of 3 (Table 3) showed signals of two terminal Me groups atd 0.95 (t, J¼6.2 Hz, 3 H) and 0.88 (t, J¼6.8 Hz, 3 H). A multiplet was observed atd 1.22–1.38 integrating for 16 H-atoms, suggesting the presence of an aliphatic chain.The seven CH�O groups resonated at d 3.98–4.02 (m, 1 H), 3.93–3.97 (m, 2 H), 3.87–3.91 (m, 1 H), 3.43–3.47 (m, 1 H), and 3.39–3.43 (m, 2 H). The downfield signals forthree olefinic C¼C bonds were observed at d 5.70 (dt, J¼7.9, 6.6 Hz, 2 H), 5.60 (dd, J¼7.9, 5.6 Hz, 2 H), 5.45 (dd, J¼8.5, 6.0 Hz, 1 H), and 5.40 (dd, J¼8.5, 5.1 Hz, 1 H). Thegeometry of these C¼C bonds was assigned as (Z)-based on the observed couplingconstants. The 13C-NMR spectrum showed the downfield signals at d 211.0, 209.0, and178.5 due to two C¼O groups and a COOH group, respectively. The signals for theolefinic C-atoms appeared at d 135.0, 133.2, 132.2, and 130.5, and the CH�O groupsresonated at d 76.5, 75.9, 75.7, 75.3, and 73.0, respectively. The signals for the terminalMe groups appeared at d 14.5 and 14.4. The entire sequence of the molecule was
CHEMISTRY & BIODIVERSITY – Vol. 4 (2007) 77
Fig. 3. Important COSY correlations of 2
Fig. 4. Structure and mass-fragmentation pattern of 2

determined through 1H,1H-COSY, important correlations being illustrated in Fig. 5.The substitution at various positions was established by mass-fragmentation pattern(Fig. 6) and confirmed through long-range HMBC interactions (Table 3). On the basis
CHEMISTRY & BIODIVERSITY – Vol. 4 (2007)78
Table 3. 1H- and 13C-NMR Data, and HMBC Correlations of Compound 3 (in CD3OD; d in ppm, J inHz)
Position d(H) d(C) HMBC (H!C)
1 – 178.5 (C) –2 2.23–2.27 (m, 1 H) 35.6 (CH) C(1), C(3), C(4), C(1’), C(2’)3 1.52–1.58 (m, 2 H) 24.5 (CH2) C(1), C(2), C(4), C(5), C(1’)4 3.98–4.02 (m, 1 H) 76.5 (CH) C(2), C(3), C(5), C(6)5 5.45 (dd, J¼8.5, 6.0, 1 H) 133.2 (CH) C(3), C(4), C(4), C(6), C(7)6 5.40 (dd, J¼8.5, 5.1, 1 H) 130.5 (CH) C(4), C(5), C(7), C(8)7 3.87–3.91 (m, 1 H) 75.9 (CH) C(5), C(6), C(8), C(9)8, 13 3.39–3.43 (m, 2 H) 75.7 (CH) C(6), C(7), C(9), C(10)9, 14 1.47–1.53 (m, 4 H) 31.9 (CH2) C(7), C(10), C(13), C(15)10, 15 5.70 (dt, J¼7.9, 6.6, 2 H) 135.0 (CH) C(9), C(11), C(14), C(16)11, 16 5.60 (dd, J¼7.9, 5.6, 2 H) 132.2 (CH) C(10), C(12), C(15), C(17)12, 17 3.93–3.97 (m, 2 H) 75.3 (CH) C(11), C(13), C(16), C(18)18 3.43–3.47 (m, 1 H) 73.0 (CH) C(12), C(14), C(17), C(19)19 2.14 (d, J¼5.3, 2 H) 34.9 (CH2) C(17), C(18), C(20), C(21)20 – 209.0 (C) –21 2.34 (t, J¼6.3, 2 H) 34.5 (CH2) C(19), C(20), C(22), C(23)22 2.19 (t, J¼6.3, 2 H) 34.3 (CH2) C(20), C(21), C(23), C(24)23 – 211.0 (C) –24 2.04 (q, J¼6.2, 2 H) 34.1 (CH2) C(22), C(23), C(25), C(26)25 0.95 (t, J¼6.2, 3 H) 14.5 (CH3) C(23), C(25)1’ 1.56–1.60 (m, 2 H) 26.3 (CH2) C(1), C(2), C(3), C(2’)2’–9’ 1.22–1.38 (m, 16 H) 30.5 (CH2) C(2), C(2’), C(10’)10’ 0.88 (t, J¼6.8, 3 H) 14.4 (Me) C(9’)
Fig. 5. Important COSY correlations of 3
Fig. 6. Structure and mass-fragmentation pattern of 3

of these evidences bractic acid (3) was assigned the structure (5Z,10Z,15Z)-2-decyl-4,7,8,12,13,17,18-heptahydroxy-20,23-dioxopentacosa-5,10,15-trienoic acid.
Compounds 1–7 were studied for their enzyme-inhibitory potential. The com-pounds 1–3 showed significant inhibitory activity against lipoxygenase enzyme, whilethey were inactive against cholinesterases. Bractic acid (3) was the most active with anIC50 value of 10.0 mm compared to baicalein (IC50 22.4 mm) used as standard inhibitor.Bractins A (1) and B (2) were comparatively less active. However, 2 was more activethan 1, probably due to the glucosidation at C(1).
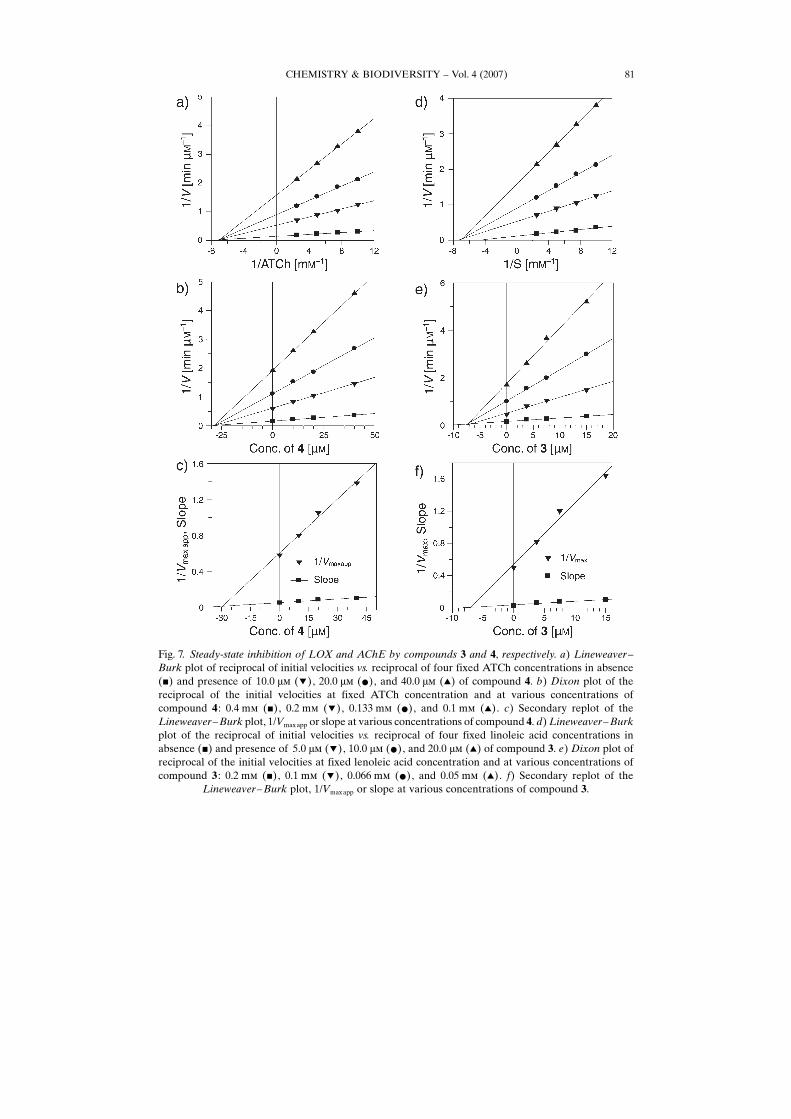
The compounds 4–7 were active against cholinesterase (AChE and BChE)enzymes, while they were inactive against lipoxygenase. The diterpenoid 7was found tobe the most active against both AChE and BChE. On the other hand, compound 6,which lacks a MeO group at C(15) showed comparatively lower activity, indicating thatthe presence of a MeO group at C(15) increases the cholinesterase inhibitory potential.The IC50 and the Ki values of compounds 1–7 are presented in Table 4, while thegraphical representations of steady-state inhibition of 3 and 4 against LOX and AChE,respectively, are shown in Fig. 7.
Experimental Part
General. Aluminum sheets pre-coated with silica gel 60 F 254 (20�20 cm, 0.2 mm thick; E. Merck)were used for TLC, and silica gel (230–400 mesh) was used for column chromatography (CC).Visualization of the TLC plates was carried out under UVat 254 and 366 nm, and by spraying with cericsulfate reagent soln. (with heating). Optical rotation: JASCO DIP-360 polarimeter. IR Spectra:Shimadzu 460 spectrometer; in cm�1. 1H- and 13C-NMR, HMQC, and HMBC spectra: Brukerspectrometer operating at 400 MHz for 1H- and 100.6 MHz for 13C-NMR, resp.; the chemical shift values(d) are reported in ppm and the coupling constants (J) are in Hz. EI-MS and HR-FAB-MS: JMS HX 110with a data system and JMS-DA 500 mass spectrometers, resp.; in m/z.
Plant Material. The whole plant of Ajuga bracteosa L. (7 kg) was collected from Swat (Pakistan) inJuly, 2002, and identified by Mr. Habib Ahmed, Plant Taxonomist, Government Post Graduate CollegeSwat, where a voucher specimen (AB-035-02) is deposited.
Extraction and Isolation. The whole plant was shade-dried, ground, and extracted with EtOH (3�45 l). The EtOH extract was evaporated to a dark greenish mass (450 g), which was partitioned betweenhexane/H2O, AcOEt/H2O, and then BuOH/H2O. The AcOEt-soluble fraction (45 g) was subjected to CCover silica gel eluting with hexane, hexane/AcOEt, AcOEt, and AcOEt/MeOH, in increasing order of
CHEMISTRY & BIODIVERSITY – Vol. 4 (2007) 79
polarity. The fractions obtained from hexane/AcOEt 7 :3 were combined and chromatographed oversilica gel with hexane/AcOEt 6 :4 as eluent to furnish dihydroclerodin-l (4 ; 21 mg), clerodinin A (5 ;16 mg), and lupulin A (6 ; 19 mg). The fractions obtained from hexane/AcOEt 6 :4 were chromato-graphed over silica gel and eluted with hexane/AcOEt 1 :1 to provide dihydroajugapitin (7; 23 mg). Thefractions obtained from hexane/AcOEt 2 :8 were chromatographed over silica gel with hexane/AcOEt1.5 :8.5 as eluent to afford bractin A (1; 20 mg). The fractions obtained from AcOEt/MeOH 9 :1 werechromatographed over silica gel with AcOEt/MeOH 8.9 :1.1 as eluent to afford bractic acid (3 ; 17 mg).The fractions obtained from AcOEt/MeOH 8.5 :1.5 were chromatographed over silica gel with AcOEt/MeOH 8.3 :1.7 as eluent to provide bractin B (2 ; 22 mg).
Bractin A (1). Colorless gummy solid. [a]30D ¼ þ34.4 (c¼0.02, MeOH). IR (KBr): 3640, 1650, 1625.1H- and 13C-NMR: see Table 1. HR-FAB-MS: 682.2924 ([MþH]þ , C42H84NOþ
5 ; calc. 682.2930).Bractin B (2). Colorless gummy solid. [a]30D ¼ þ19.5 (c ¼ 0.016, MeOH). IR (KBr): 3635, 1652, 1620.
1H- and 13C-NMR: see Table 2. HR-FAB-MS: 844.6546 ([MþH]þ , C47H90NOþ11 ; calc. 844.6553).
Bractic Acid (3): Brownish gummy solid. [a]30D ¼ þ46.2 (c¼0.012, MeOH). IR (KBr): 3460, 1724,1700. 1H- and 13C-NMR: see Table 3. HR-FAB-MS: 657.4210 ([MþH]þ , C35H61Oþ
11 ; calc. 657.4213).In vitro Lipoxygenase Inhibition Assay. LOX-Inhibiting activity was measured by modifying the
spectrophotometric method developed by Tappel [21]. Lipoxygenase (1.13.11.12) type I-B and linoleicacid (LA) was purchased from Sigma (St. Louis, MO, USA). The test compounds were prepared inMeOH of concentrations (50, 25, 12.5, 6.25, and 3.125 mm). The reaction mixture contained 160 ml(100 mm) sodium phosphate buffer (pH 8.0), 10 ml of test-compound soln., and 20 ml of LOX soln. Thecontents were mixed and incubated for 10 min at 258. The reaction was then initiated by the addition of10 ml of substrate soln. (linoleic acid (0.5 mm)/0.12% (w/v) Twen 20 in the ratio of 1 :2), with theformation of (9Z,11E, 13S)-13-hydroperoxyoctadeca-9,11-dienoate, the change of absorbance at 234 nmwas followed for 6 min.
In vitro Cholinesterase Inhibition Assay. Electric-eel (Torpedo californica) AChE (type VI-S),horse-serum BChE, acetylthiocholine iodide, butyrylthiocholine chloride, 5,5’-dithiobis[2-nitrobenzoicacid] (DTNB), and galanthamine were purchased from Sigma (St. Louis, MO, USA). AChE- and BChE-inhibiting activities were measured by the spectrophotometric method developed by Ellman et al. [22].
Determination of Kinetic Parameters. All the kinetics reactions were performed in 96-well micro-titerplates in SPECTRAmax PLUS384 (Molecular Devices, USA). The percentage (%) inhibition was
CHEMISTRY & BIODIVERSITY – Vol. 4 (2007)80
Table 4. Kinetic Parameters of Inhibition of AChE, BChE, and LOX by Compounds 1–7
Compounds AChE BChE LOC
IC50a)
[mm]Ki
b)[mm]
Type ofinhibi-tionc)
IC50a)
[mm]Ki
b)[mm]
Type ofinhibi-tionc)
IC50a)
[mm]Ki
b)[mm]
Type ofinhibi-tionc)
1 NA – – NA – – 33.0�0.02 35.2�0.01 NC2 NA – – NA – – 18.5�0.01 18.2�0.05 NC3 NA – – NA – – 10.0�0.04 9.5�0.02 NC4 35.2�0.001 36.0�0.004 NC 19.0�0.02 20.5�0.1 NC NA – –5 26.5�0.002 25.0�0.01 NC 17.0�0.01 16.5�0.03 NC NA – –6 19.2�0.003 19.5�0.001 NC 12�0.01 12.5�0.01 NC NA – –7 14.0�0.001 15.2�0.05 NC 10�0.03 11.6�0.02 NC NA – –Galanth-amined)
0.5�0.001 0.45�0.001 NC 8.5�0.03 8.0�0.05 NC NS – –
Baicaleine) NS – – – – – 22.5�0.05 14.5�0.02 MT
a) Values �SEM (standard mean error of 3 assays); NA: not active; NS: not screened. b) Values �SEM(standard mean error of 3 assays); Ki values (dissociation constant or inhibition constant) were determined fromlinear-regression analysis by Dixon plot and secondary Lineweaver–Burk plot at various concentrations ofcompounds 1–7. c) NC: Non-competitive; MT: mixed type. d) Standard inhibitor of AChE and BChE.e) Standard inhibitor of LOX.
CHEMISTRY & BIODIVERSITY – Vol. 4 (2007) 81
Fig. 7. Steady-state inhibition of LOX and AChE by compounds 3 and 4, respectively. a) Lineweaver –Burk plot of reciprocal of initial velocities vs. reciprocal of four fixed ATCh concentrations in absence(&) and presence of 10.0 mm (!), 20.0 mm (*), and 40.0 mm (~) of compound 4. b) Dixon plot of thereciprocal of the initial velocities at fixed ATCh concentration and at various concentrations ofcompound 4 : 0.4 mm (&), 0.2 mm (!), 0.133 mm (*), and 0.1 mm (~). c) Secondary replot of theLineweaver–Burk plot, 1/Vmaxapp or slope at various concentrations of compound 4. d) Lineweaver–Burkplot of the reciprocal of initial velocities vs. reciprocal of four fixed linoleic acid concentrations inabsence (&) and presence of 5.0 mm (!), 10.0 mm (*), and 20.0 mm (~) of compound 3. e) Dixon plot ofreciprocal of the initial velocities at fixed lenoleic acid concentration and at various concentrations ofcompound 3 : 0.2 mm (&), 0.1 mm (!), 0.066 mm (*), and 0.05 mm (~). f) Secondary replot of the
Lineweaver–Burk plot, 1/Vmaxapp or slope at various concentrations of compound 3.

calculated as follows (E�S)/E�100, where E is the activity of the enzyme without test compound and Sis the activity of enzyme with test compound. The concentration of test compounds that inhibited thehydrolysis of substrates (acetylthiocholine and butyrylthiocholine) or oxidation of substrate (linoleic acid(LA) by 50% (IC50) was determined by monitoring the effect of various concentrations of thecompounds in the assays on the inhibition values. The IC50 values were then calculated using the EZ-FitEnzyme Kinetics program (Perrella Scientific Inc., Amherst, USA).
Dissociation constant/inhibition constant (Ki) was determined by the interpretation of Dixon plot.Lineweaver–Burk plot and their secondary replots using initial velocities were obtained over a substrateconcentration range of 0.1–0.4 mm for acetylthiocholine iodide (ATCh) and 0.05–0.2 mm forbutyrylthiocholine chloride (BTCh), and 0.05–0.2 mm for LA. The Ki value (dissociation constant/inhibition constant of AChE–inhibitor, BChE–inhibitor, and LOX–inhibitor complex into free AChE,BChE, or LOX) was determined graphically by a Dixon plot and Lineweaver–Burk plots; firstly, 1/Vmaxapp was calculated at each intersection point of lines of every inhibitor concentration on the y-axis ofthe Lineweaver–Burk plot and then replotted against various concentrations of inhibitor. Second, theslope of each line of inhibitor concentration on the Lineweaver–Burk plot was plotted against inhibitorconcentrations. Then, replotting slope vs. various concentrations of inhibitor, Ki was the intercept on thex-axis.
Statistical Analysis. Graphs were plotted with the GraFit program [23]. Values of the correlationcoefficients, slopes, intercepts, and their standard errors were obtained by the linear-regression analysiswith the same program. The correlation for the lines of all graphs was found to be >0.99. Each point inthe constructed graphs represents the mean of three experiments.
Methanolysis. Compounds 1 and 2 (5 mg, each) were refluxed separately with 3 ml of 1n HCl and10 ml of MeOH for 15 h. The mixture was then extracted with hexane to obtain the corresponding fattyacid methyl esters, which were analyzed by GC/MS after acetylation with Ac2O/Py. The aq. layer from 1was evaporated, and the residue was acetylated. Purification over Sephadex LH-20 and elution withCH2Cl2/MeOH 1 :1 gave the corresponding acetylated sphingosine, which was analyzed by GC/MS. Theaq. layer from 2 was evaporated to dryness, and the residue was separated by TLC as sphingosine baseand methylated sugar. The base was acetylated and analyzed by GC/MS. The sugar was identified asmethyl b-d-glucopyranoside by comparing optical rotation and spectral data with those in the literature.[a]D¼ þ76 (c¼0.0025, MeOH). Rf (AcOEt/MeOH/H2O 5 :2 :0.5) 0.45.
Methyl Ester Derived from 1. 1H-NMR (CDCl3, 400 MHz): 4.32 (t, J¼6.6, H�C(2’)); 3.50 (s, MeO);2.00 (s, MeCO); 1.13–1.28 (m, CH2(3’–11’)); 0.83 (t, J¼6.8, Me(12’)). GC/MS: 272 (Mþ ).
Methyl Ester Derived from 2. 1H-NMR (CDCl3, 400 MHz): 4.38 (t, J¼6.3, H�C(2’)); 3.51 (s, MeO);1.98 (s, MeCO); 1.14–1.30 (m, CH2(3’–25’)); 0.85 (t, J¼6.6, Me(26)). GC/MS: 468 (Mþ ).
Acetylsphingamine Derived from 1. 1H-NMR (CDCl3, 400 MHz): 8.01 (d, J¼7.9, NH); 5.41 (dd, J¼15.1, 5.2, H�C(5)); 5.32 (dt, J¼15.1, 6.6, H�C(6)); 4.60 (dd, 5.0, 4.4, H�C(4)); 4.49–4.55 (m, H�C(2));4.40 (dd, 10.2, 6.1, H�C(1)); 4.31 (dd, 10.2, 3.2, H�C(1)); 4.07 (dd, 5.0, 3.2, H�C(3)); 1.98–2.02 (m, 4MeCO); 1.13–1.28 (m, CH2(7–29)); 0.87 (t, J¼6.1, Me(30)). GC/MS: 651 (Mþ ).
Acetylsphingamine Derived from 2. 1H-NMR (CDCl3, 400 MHz): 7.91 (d, J¼8.5, NH); 5.61 (dt, J¼15.1, 5.2, H�C(6)); 5.51 (dt, J¼15.1, 6.0, H�C(9)); 5.39 (dd, J¼15.1, 4.6, H�C(5)); 5.31 (dt, J¼15.1, 6.0,H�C(8)); 4.70 (dd, 10.3, 6.0, H�C(1)); 4.62 (dd, 5.0, 4.2, H�C(4)); 4.58 (dd, 10.3, 3.2, H�C(1)); 4.12–4.19 (m, H�C(2)); 4.07 (dd, 5.0, 3.0, H�C(3)); 2.00–2.04 (s, 4 MeCO). GC/MS: 497 (Mþ ).
REFERENCES
[1] S. I. Ali, Y. J. Nasir, QFlora of PakistanL, BCC & T Press, University of Karachi, 1990, Vol. 192, p. 14.[2] B. L. Manjunath, QThe Wealth of IndiaL, Council of Scientific and Industrial Research, Delhi, 1948,
Vol. 1, p. 42.[3] N. Riaz, A. Malik, A. U. Rehman, P. Muhammad, S. A. Nawaz, M. I. Choudhary, Chem. Biodiv.
2004, 1, 1289.[4] N. Mukhtar, A. Malik, N. Riaz, K. Iqbal, R. B. Tareen, S. N. Khan, J. Siddiqui, S. A. Nawaz, M. I.
Choudhary, Helv. Chim. Acta 2004, 87, 416.
CHEMISTRY & BIODIVERSITY – Vol. 4 (2007)82
[5] A. U. Rehman, A. Malik, N. Riaz, H. R. Nawaz, H. Ahmad, S. A. Nawaz, M. I. Choudhary, J. Nat.Prod. 2004, 67, 1450.
[6] B. N. Meyer, N. R. Ferrigni, J. E. Putnam, L. B. Jacobsen, D. E. Nichols, J. L. McLaughlin, PlantaMed. 1982, 45, 31.
[7] P. Muralidhar, M. M. Kumar, N. Krishna, C. B. Rao, D. V. Rao, Chem. Pharm. Bull. 2005, 53, 168.[8] W. E. M. Lands, Adv. Drug Res. 1985, 14, 147.[9] D. Steinhilber, Curr. Med. Chem. 1999, 6, 71.
[10] D. Nie, K. V. Honn, Cell Mol. Life Sci. 2002, 59, 799.[11] V. Tougu, Curr. Med. Chem. 2001, 1, 155.[12] E. K. Perry, Br. Med. Bull. 1986, 42, 63.[13] Q. S. Yu, H. W. Holloway, T. Utsuki, A. Brossi, N. H. Greig, J. Med. Chem. 1999, 42, 1855.[14] H. S. Garg, S. Agrawal, J. Nat. Prod. 1995, 58, 442.[15] V. U. Ahmad,M. Zubair,M. A. Abbasi, F. Kousar,M. A. Rashid, N. Rasool, R. B. Tareen, Nat. Prod.
Res. 2006, 20, 69.[16] N. Mukhtar, K. Iqbal, A. Malik, Chem. Pharm. Bull. 2002, 50, 1558.[17] P. Muralidhar, N. Krishna, M. M. Kumar, C. B. Rao, D. V. Rao, Chem. Pharm. Bull. 2003, 51, 1193.[18] W. Jin, K. L. Rinehart, E. A. Jares-Erijman, J. Org. Chem. 1994, 59, 144.[19] T. Natori, M. Morita, K. Akimoto, Y. Koezuka, Tetrahedron 1994, 50, 2771.[20] N. Mukhtar, K. Iqbal, I. Anis, A. Malik, Phytochemistry 2002, 61, 1005.[21] A. L. Tappel, QMethods in EnzymologyL, Academic Press, New York, London, 1962, Vol. 5, p. 539.[22] G. L. Ellman, K. D. Courtney, V. Andres, R. M. Featherstone, Biochem. Pharmacol. 1961, 7, 88.[23] R. J. Leatherbarrow, Grafit, Version 4.09, Erithacus Software Ltd., 1999.
Received July 25, 2006
CHEMISTRY & BIODIVERSITY – Vol. 4 (2007) 83