High-resolution thermal inertia derived from the Thermal Emission Imaging System (THEMIS): Thermal...
22
High-resolution thermal inertia derived from the Thermal Emission Imaging System (THEMIS): Thermal model and applications Robin L. Fergason, 1 Philip R. Christensen, 1 and Hugh H. Kieffer 2 Received 21 April 2006; revised 10 July 2006; accepted 20 July 2006; published 8 December 2006. [1] Thermal inertia values at 100 m per pixel are determined using nighttime temperature data from the Thermal Emission Imaging System (THEMIS) on the Mars Odyssey spacecraft, producing the highest-resolution thermal inertia data set to date. THEMIS thermal inertia values have an overall accuracy of 20%, a precision of 10–15%, and are consistent with both Thermal Emission Spectrometer orbital and Miniature Thermal Emission Spectrometer surface thermal inertia values. This data set enables the improved quantification of fine-scale surface details observed in high-resolution visible images. In the Tharsis region, surface textures and crater rims observed in visible images have no corresponding variation in the THEMIS thermal inertia images, indicating that the dust mantle is pervasive at THEMIS scales and is a minimum of a few centimeters and up to 1–2 m thick. The thermal inertia of bed form material indicates particle diameters expected for aeolian sediments, and these materials are likely currently saltating. Variations in the thermal inertia within interior layered deposits in Hebes Chasma can be distinguished, and the thermal inertia is too low to be consistent with bedrock or a lava flow. Thus a secondary emplacement of volcanic material or a volcanic ash deposit is a more likely method of formation. Higher-resolution THEMIS thermal inertia enables the identification of exposed bedrock on the Martian surface. In Nili Patera and Ares Vallis, bedrock material corresponds to distinct compositional and morphologic surfaces, indicating that a specific unit is exposed and is likely currently being kept free of unconsolidated material by aeolian processes. Citation: Fergason, R. L., P. R. Christensen, and H. H. Kieffer (2006), High-resolution thermal inertia derived from the Thermal Emission Imaging System (THEMIS): Thermal model and applications, J. Geophys. Res., 111, E12004, doi:10.1029/2006JE002735. 1. Introduction [2] The Thermal Emission Imaging System (THEMIS) on the Mars Odyssey spacecraft [Christensen et al., 2004] acquires daytime and nighttime infrared images at 100 m per pixel, and provides thermophysical information at the highest spatial resolution to date. THEMIS nighttime tem- perature images are used to derive thermal inertia values that quantify the physical properties and average particle sizes of surface textures and morphologies observed in high-resolution Mars Orbiter Camera (MOC) [Malin et al., 1992; Malin and Edget, 2001] and THEMIS visible images. This data set allows the comparison between similar features, such as intracrater deposits, bedrock exposures, or layered morphologies, observed in different localities on the planet and in images acquired at different local times or seasons. Understanding the processes that created surfaces at local scales allows these observations to be extrapolated to regional and global scales. [3] Thermal inertia is a valuable aid to understanding the surficial geology and recent processes that are potentially still active today. To demonstrate the insight into Martian geologic processes provided by this high-resolution data set, we will: (1) describe an algorithm that calculates thermal inertia values from THEMIS nighttime temperature data; (2) discuss the uncertainties in this method and how these uncertainties propagate into errors in thermal inertia calcu- lations; (3) compare THEMIS-derived thermal inertia val- ues to previous data sets, including orbital values from the Thermal Emission Spectrometer (TES) onboard the Mars Global Surveyor (MGS) [Christensen et al., 1992, 2001] and surface data from the Mars Exploration Rover (MER) Miniature Thermal Emission Spectrometer (Mini-TES) [Christensen et al., 2003b] experiments; and (4) investigate examples of dusty surfaces, bed form morphologies, interior layered deposits, and exposed bedrock. 1.1. THEMIS Instrument Description [4] The Mars Odyssey spacecraft is in a near-polar sun synchronous orbit with a drifting equator-crossing local time, ranging from 3 AM and 3 PM to 6 AM and 6 PM. The orbit has remained between 5 and 6 AM/PM since July 2003, and will remain in this orbit until the end of the first extended mission (August 2006). This orbit is good for observing nighttime temperatures at the mid to equatorial JOURNAL OF GEOPHYSICAL RESEARCH, VOL. 111, E12004, doi:10.1029/2006JE002735, 2006 Click Here for Full Articl e 1 School of Earth and Space Exploration, Mars Space Flight Facility, Arizona State University, Tempe, Arizona, USA. 2 Celestial Reasonings, Carson City, Nevada, USA. Copyright 2006 by the American Geophysical Union. 0148-0227/06/2006JE002735$09.00 E12004 1 of 22
-
Upload
independent -
Category
Documents
-
view
2 -
download
0
Transcript of High-resolution thermal inertia derived from the Thermal Emission Imaging System (THEMIS): Thermal...
High-resolution thermal inertia derived from the Thermal Emission
Imaging System (THEMIS): Thermal model and applications
Robin L. Fergason,1 Philip R. Christensen,1 and Hugh H. Kieffer2
Received 21 April 2006; revised 10 July 2006; accepted 20 July 2006; published 8 December 2006.
[1] Thermal inertia values at 100 m per pixel are determined using nighttime temperaturedata from the Thermal Emission Imaging System (THEMIS) on the Mars Odysseyspacecraft, producing the highest-resolution thermal inertia data set to date. THEMISthermal inertia values have an overall accuracy of �20%, a precision of 10–15%, and areconsistent with both Thermal Emission Spectrometer orbital and Miniature ThermalEmission Spectrometer surface thermal inertia values. This data set enables the improvedquantification of fine-scale surface details observed in high-resolution visible images. Inthe Tharsis region, surface textures and crater rims observed in visible images have nocorresponding variation in the THEMIS thermal inertia images, indicating that the dustmantle is pervasive at THEMIS scales and is a minimum of a few centimeters and up to1–2 m thick. The thermal inertia of bed form material indicates particle diametersexpected for aeolian sediments, and these materials are likely currently saltating.Variations in the thermal inertia within interior layered deposits in Hebes Chasma can bedistinguished, and the thermal inertia is too low to be consistent with bedrock or alava flow. Thus a secondary emplacement of volcanic material or a volcanic ash deposit isa more likely method of formation. Higher-resolution THEMIS thermal inertia enablesthe identification of exposed bedrock on the Martian surface. In Nili Patera and AresVallis, bedrock material corresponds to distinct compositional and morphologic surfaces,indicating that a specific unit is exposed and is likely currently being kept free ofunconsolidated material by aeolian processes.
Citation: Fergason, R. L., P. R. Christensen, and H. H. Kieffer (2006), High-resolution thermal inertia derived from the Thermal
Emission Imaging System (THEMIS): Thermal model and applications, J. Geophys. Res., 111, E12004, doi:10.1029/2006JE002735.
1. Introduction
[2] The Thermal Emission Imaging System (THEMIS)on the Mars Odyssey spacecraft [Christensen et al., 2004]acquires daytime and nighttime infrared images at 100 mper pixel, and provides thermophysical information at thehighest spatial resolution to date. THEMIS nighttime tem-perature images are used to derive thermal inertia valuesthat quantify the physical properties and average particlesizes of surface textures and morphologies observed inhigh-resolution Mars Orbiter Camera (MOC) [Malin etal., 1992; Malin and Edget, 2001] and THEMIS visibleimages. This data set allows the comparison between similarfeatures, such as intracrater deposits, bedrock exposures, orlayered morphologies, observed in different localities on theplanet and in images acquired at different local times orseasons. Understanding the processes that created surfacesat local scales allows these observations to be extrapolatedto regional and global scales.
[3] Thermal inertia is a valuable aid to understanding thesurficial geology and recent processes that are potentiallystill active today. To demonstrate the insight into Martiangeologic processes provided by this high-resolution data set,we will: (1) describe an algorithm that calculates thermalinertia values from THEMIS nighttime temperature data;(2) discuss the uncertainties in this method and how theseuncertainties propagate into errors in thermal inertia calcu-lations; (3) compare THEMIS-derived thermal inertia val-ues to previous data sets, including orbital values from theThermal Emission Spectrometer (TES) onboard the MarsGlobal Surveyor (MGS) [Christensen et al., 1992, 2001]and surface data from the Mars Exploration Rover (MER)Miniature Thermal Emission Spectrometer (Mini-TES)[Christensen et al., 2003b] experiments; and (4) investigateexamples of dusty surfaces, bed form morphologies, interiorlayered deposits, and exposed bedrock.
1.1. THEMIS Instrument Description
[4] The Mars Odyssey spacecraft is in a near-polar sunsynchronous orbit with a drifting equator-crossing localtime, ranging from 3 AM and 3 PM to 6 AM and 6 PM.The orbit has remained between 5 and 6 AM/PM since July2003, and will remain in this orbit until the end of the firstextended mission (August 2006). This orbit is good forobserving nighttime temperatures at the mid to equatorial
JOURNAL OF GEOPHYSICAL RESEARCH, VOL. 111, E12004, doi:10.1029/2006JE002735, 2006ClickHere
for
FullArticle
1School of Earth and Space Exploration, Mars Space Flight Facility,Arizona State University, Tempe, Arizona, USA.
2Celestial Reasonings, Carson City, Nevada, USA.
Copyright 2006 by the American Geophysical Union.0148-0227/06/2006JE002735$09.00
E12004 1 of 22

latitudes, provided the surface temperature is not below CO2
condensation temperatures (about 148 K), because at thistime the effects of albedo and slopes on surface temperaturehave largely dissipated while effects due to the physicalproperties of the surface remain [Kieffer et al., 1973, 1977;Christensen et al., 2001].[5] THEMIS infrared data are acquired using a multi-
spectral microbolometer array with 320 cross-track pixelsand 240 down-track pixels. It has an instantaneous field ofview (IFOV) of �100 m per pixel and an image width of�32 km. Spectral differentiation in the infrared is achievedwith 10 narrowband stripe filters that produce �1-mm-widebands at nine separate wavelengths from 6.78 to 14.88 mm.These bands include nine surface-sensing wavelengths(bands 1–9), and one atmospheric wavelength (band 10)[Christensen et al., 2004]. Two filters (bands 1 and 2) coverthe same wavelength range (centered at 6.78 mm) toimprove the signal to noise in that spectral region. StandardTHEMIS data processing consists of decompression, radio-metric calibration, and systematic noise removal. Imagescan also be geometrically corrected, and multiple imagescan then be mosaiced together [Christensen et al., 2004].
1.2. Thermal Inertia Background
[6] Thermal inertia represents the resistance to change intemperature of the upper few centimeters of the surfacethroughout the day, and is independent of local time,latitude, and season. It is defined as I = (krc)1/2, where kis the thermal conductivity, r is the bulk density of thesurface material, and c is the specific heat (units are J m�2
K�1 s�1/2 throughout this work; a scale factor of 41.86converts to Viking-era 10�3 cal cm�2 K�1 s�1/2 units).Under Martian atmospheric conditions, the density andspecific heat of geologic materials vary by factors of �3,whereas the conductivity varies by 3–4 orders of magnitudeand therefore has the strongest influence on the thermalinertia [e.g., Wechsler and Glaser, 1965; Neugebauer et al.,1971; Wechsler et al., 1972; Presley and Christensen,1997a]. The bulk conductivity of a material is a functionof the solid, radiative, and gas conductivity. At Martiansurface temperatures, radiative conductivity is a smallcontribution compared to the solid and gas conductivity[Wechsler et al., 1972]. The solid and gas conductivity islargely controlled by the relationship between the particlesize and the pore size relative to the mean-free-path of a gas(�5 mm at Martian pressures). When the pore size iscomparable in size or smaller than the gas mean free path(relatively small grains), gas molecule collisions with thegrains become less frequent, resulting in an inefficienttransfer of heat. Decreasing the particle size also increasesthe number of grain-to-grain contacts per unit length, andfurther decreases conduction [Jakosky, 1986; Presley andChristensen, 1997b]. As a result, the thermal inertia isstrongly controlled by particle size, and can be related toan effective particle size, assuming unconsolidated, homo-geneous spheres to a depth of �5 thermal skin depths[Kieffer et al., 1973; Presley and Christensen, 1997b].[7] Laboratory-derived relationships between particle size
and conductivity have been established [e.g., Woodside andMessmer, 1961; Wechsler and Glaser, 1965; Fountain andWest, 1970; Presley and Christensen, 1997b, 1997c] and areused to infer an effective particle size of the surface from
thermal inertia values. Fine particles have a lower thermalinertia, whereas higher thermal inertia surfaces are com-posed of sand, duricrust, rock fragments, or a combinationof these materials. Several features can complicate themodeling of thermal inertia and make interpreting thermalinertia results challenging. These include, but are not limitedto, the mixing of different particle sizes, the presence ofduricrust, subsurface layering, sub-pixel-scale slopes, dustin the atmosphere, and water-ice clouds. The interpretationof thermal inertia as an effective particle size is lessambiguous if the thermal inertia is low (dust) or very high(bedrock), but many equally plausible scenarios can resultin a particle size described by the moderate thermal inertiaof a surface. Thus thermal inertia does not provide a uniquecharacterization of the surface physical characteristics[Christensen, 1982], but does provide significant insightinto the physical nature of the surface and is uniquelyrelated to an effective particle size [e.g., Kieffer et al.,1973; Fergason et al., 2006].
1.3. Previous Work
[8] Thermophysical data of Mars were collected byMariners 6, 7, and 9 [Neugebauer et al., 1971; Kieffer etal., 1973], and the first thermal inertia maps were madeusing temperatures from the Infrared Thermal Mapper(IRTM) during the Viking Mission [Kieffer et al., 1977].The initial thermal inertia models were intentionally con-servative, assuming a homogenous, flat-lying, unlayeredsurface. The model did allow CO2 to condense and subli-mate, and modeled atmospheric radiance as 2% of thenoontime insolation [Kieffer et al., 1977]. The IRTM datashowed that thermal inertias range from 67 to about 460,and recognized regions of low thermal inertia and inter-preted these areas to be covered with fine material and fewexposed rocks. A strong anticorrelation between thermalinertia and albedo was also identified [Kieffer et al., 1977].Palluconi and Kieffer [1981] extended the work of Kiefferet al. [1977] to include a global map of thermal inertia at2 pixels per degree using diurnal temperature measure-ments. They discussed the observed relationships betweenthermal inertia, albedo, and elevation, and confirmed theanticorrelation between albedo and thermal inertia. Theyalso identified the basic global distribution of thermal inertiaand albedo, and interpreted low thermal inertia/high albedoregions to be mantled in a layer of fine dust, and speculatedon several scenarios, including a mixture of rock and finesediment or the presence of crusts, to explain higher thermalinertia surfaces.[9] Christensen and Moore [1992] presented Viking
thermal inertia data using the same modeling technique asKieffer et al. [1977], but used individual nighttime obser-vations, rather than binned diurnal temperatures [Palluconiand Kieffer, 1981] allowing higher-resolution (30 km perpixel) mapping. This inclusion of additional data revealedthe presence of small-scale (�30 km) thermal variations inall terrains, and fostered the identification of four globalunits based on thermal inertia and albedo. These unitsinclude: (1) active dust deposits; (2) active, coarse materials;(3) possible indurated surfaces; and (4) mixed coarse anddust materials, and these describe the majority of observedsurfaces on Mars. In addition to these global thermal inertiamaps, several regional studies have been performed using
E12004 FERGASON ET AL.: THEMIS THERMAL INERTIA
2 of 22
E12004

Viking IRTM data in which the resolution and accuracy ofthe thermal inertia data set and the understanding of thelocal geology was improved [e.g., Christensen and Kieffer,1979; Zimbelman and Kieffer, 1979; Zimbelman andLeshin, 1987; Bridges, 1994; Hayashi et al., 1995].[10] Haberle and Jakosky [1991] studied the effects of the
atmosphere on thermal inertia calculations, and refined theatmospheric correction of Kieffer et al. [1977] by includinga 16-layer atmosphere allowing a sensible energy exchangebetween the surface and the atmosphere. This improvedatmospheric component resulted in reducing the thermalinertia values relative to those calculated by Kieffer et al.[1977] by as much as 25%, and further verified that low-inertia regions are likely mantled in dust deposited from theatmosphere. Jakosky et al. [2000] developed a model tocalculate the thermal inertia using temperature data from theTES instrument. This model incorporates the atmosphericcorrection technique developed by Haberle and Jakosky[1991], and includes modifications to better account for thepresence of CO2 ground frost. Thermal inertia values rangebetween 24 and 800 and results are typically within 50 unitsof those calculated with IRTM [Jakosky et al., 2000].Mellon et al. [2000] present a nighttime TES-derivedbolometer-based thermal inertia map at 15 km per pixelresolution, with approximately 63% coverage between 50�Sand 70�N latitude. They also divided the surface into threethermophysical units based on TES thermal inertia andalbedo measurements, which include low thermal inertiaand high albedo; high thermal inertia and low albedo; andmoderate-to-high thermal inertia and intermediate albedo,and speculated on their origins. These divisions correspondwell with those of Christensen and Moore [1992], andconfirm the complex nature of Martian surface materials.[11] Putzig et al. [2005] refined the work of Mellon et al.
[2000] by including data from the entire MGS primarymapping mission, improving the spatial resolution to 3 kmper pixel, and extending the global coverage to between80�S and 80�N latitude. Putzig et al. [2005] also furthersubdivided the planet into seven thermophysical units,including the three units from Mellon et al. [2000]. Alow-to-intermediate albedo unit is found exclusively in thesouth polar region, and is interpreted as a low-densitymaterial caused by the desiccation of near-surface ice. Verylow albedo material is primarily observed in Syrtis Major,Acidalia, and part of Vastitas Borealis, and may indicate alack of unconsolidated surface material in these regions.Very high thermal inertia surfaces are consistent with verycoarse-grained material, highly indurated surfaces, or ex-posed bedrock. Finally, very high albedo regions likelyrepresent areas composed of very fine surface dust [Putziget al., 2005].
2. Methodology
[12] Thermal inertia values from the THEMIS data set arederived using a single temperature measurement similar toprevious orbital data sets, including Viking [Kieffer et al.,1977; Christensen and Moore, 1992] and TES [Jakoskyet al., 2000; Mellon et al., 2000]. Nighttime temperaturesonly are used in this study because the effects of albedo andsun-heated slopes have dissipated throughout the night, andthe thermal contrast due to differences in particle sizes are at
a maximum [e.g., Kieffer et al., 1977; Palluconi and Kieffer,1981; Christensen, 1982]. The brightness temperature of thesurface is determined by fitting a Planck curve to band 9(centered at 12.57 mm) calibrated radiance that has beencorrected for instrumental effects. Band 9 brightness tem-peratures are used to approximate the surface kinetic tem-perature and define the target temperature because thiswavelength range has the highest signal to noise ratio andis relatively transparent to atmospheric dust. Changes in theinstrument response function during launch and orbit inser-tion were minimal [Christensen et al., 2003a, 2004], and thenighttime temperatures are calibrated to within a precision of1.2 K and an absolute accuracy of�2.8 K at night (at 180 K),as determined in this work. These temperature accuraciesare similar to the �1–2 K accuracy measured with theThermal Emission Spectrometer (TES) infrared bolometeron the Mars Global Surveyor (MGS) [Christensen et al.,2001].[13] The thermal model used is derived from the Viking
IRTM thermal model [Kieffer et al., 1977, Appendix 1],with the primary modification being the replacement of aconstant atmospheric thermal radiation with a one-layeratmosphere that is spectrally gray at solar wavelengths,and the direct and diffuse illuminations are computed usinga two-stream delta-Eddington model; the dust single-scat-tering albedo is set at 0.9 and the Henyey-Greensteinasymmetry factor is set at 0.5. The atmosphere is radiativelycoupled to the surface using an appropriate thermal capac-ity, and the thermal radiation is assumed to be gray andisotropic with a fixed ratio of 2.0 for the visible-to-infraredopacity. Because the atmospheric opacity has a minor effect(less than 5%) on thermal inertia at night, the atmosphericcorrection adequately takes into account the effect of theatmosphere. An explicit forward finite-difference schemecalculates surface and subsurface temperatures by solvingthe heat conduction equation while satisfying a surfaceboundary condition that includes upward emission anddownwelling thermal radiation, direct and diffuse insola-tion, and the latent heat of CO2 if its saturation temperatureis attained. The local CO2 frost point is determined at eachinput using the local partial pressure computed for a specificelevation, season, and latitude. This model assumes lateralsurface homogeneity and a Lambertian surface reflection.Subsurface layers increase in thickness exponentially withdepth and are scaled to the diurnal skin depth, but in thiswork all layers are uniform in both composition andconductivity. The surface emissivity is assumed to be unityand the lower boundary is assumed to be insulating. Theeffects of three-dimensional blocks on the surface, conden-sate clouds, and the latent heat of water ice are notconsidered. This model can incorporate the effects of aradiatively coupled sloping surface at any azimuth, but forthe nominal thermal inertia calculations, slopes are notconsidered.[14] The THEMIS band 9 temperatures are converted to
a thermal inertia by interpolation within a look-up table.An individual table was generated for each framelet (256lines) by selecting values appropriate for the THEMISframelet for six input parameters: latitude, season, localsolar time, atmospheric dust opacity, elevation (atmosphericpressure), and albedo. Thermal inertia was varied from 24 to3000 in each case. These input parameters were then used to
E12004 FERGASON ET AL.: THEMIS THERMAL INERTIA
3 of 22
E12004

calculate the model-derived surface kinetic temperature forthe specified conditions and thermal inertia range using thethermal model described above, resulting in a table ofmodel-derived surface temperatures as a function of ther-mal inertia. This table and the measured band 9 surfacetemperatures are then used to interpolate the THEMISthermal inertia. Interpolation is performed on a pixel-by-pixel basis using season, latitude, and local solar time fromspacecraft ephemeris. The remaining model input param-eters are obtained from external data sets. The albedo isdetermined from the TES albedo binned at 8 pixels perdegree [Christensen et al., 1992]. Elevation is ascertainedfrom the MOLA elevation [Zuber et al., 1992; Smith et al.,1999; D. E. Smith et al., 2001] binned at 128 pixels perdegree. Finally, the opacity is determined from the TESatmospheric dust opacity binned at 0.5 pixel per degreeevery 30� Ls. Data gaps in albedo, elevation, and dustopacity maps were filled using a linear interpolationbetween neighboring bins weighted by distance. TESatmospheric dust opacity was used for the first Martianyear of MGS mapping when there were no global duststorms [Smith et al., 2000; M. D. Smith et al., 2001]. Weassume that the amount of dust in the atmosphere isrepeatable from year to year; this has been shown to bea reasonable approximation during seasons devoid ofmajor dust storms [Clancy et al., 2000; M. D. Smith etal., 2001]. To convert the TES IR atmospheric dustopacity to the equivalent opacity at visible wavelengths(the input requirement of the thermal model), the IRopacity was multiplied by a visible/9-mm extinction opac-ity ratio of 2.0 [Clancy et al., 1995].[15] The look-up table includes a thermal inertia range of
24 to 3000, and values exceeding 1800 have been observedthus far in the mission. This thermal inertia range issignificantly larger than that used in the TES standardmodel (maximum of 800), and allows the detection ofexposures of consolidated materials or bedrock on thesurface. The higher resolution of THEMIS, the fact thatmany regions on Mars saturated at the maximum value ofthermal inertia in the TES model, and initial results fromTHEMIS nighttime temperatures suggesting the presence ofbedrock [e.g., Christensen et al., 2003a] required thisextension of the thermal inertia range.[16] Thermal inertia can be used to interpret an effective
particle size of the surface [Kieffer et al., 1973], and thisparticle diameter is determined using laboratory-derivedrelationships between conductivity and the particle size ofhomogenous spheres [Presley and Christensen, 1997b]. Theeffective particle diameter (d) is given by substituting
Equation 17 from Presley and Christensen [1997b] thatdescribes the relationship between conductivity and particlesize
k ¼ CP0:6� �
d �0:11 log P=Kð Þ ð1Þ
into the thermal inertia equation, I = (krc)1/2, where C andK are the constants 0.0015 and 8.1 � 104 torr (to convert tombar, multiply 1 torr by 1.333 mbar), respectively [Presleyand Christensen, 1997b], P is atmospheric pressure in torr,and d is the particle diameter in mm. An atmosphericpressure of 3.9 torr (Mars average surface pressure of5.2 mbar (520 Pa) at an Ls = 0� [Smith and Zuber, 1998])is used, and rc is assumed to be 1 � 106 J m�3 K[Neugebauer et al., 1971]. Equation (1) is valid forthermal inertia values less than �350, and errors inderiving particle sizes with this method are expected to beless than 10–15% [Presley and Christensen, 1997b].
3. Thermal Inertia Uncertainties
[17] Sources of uncertainties in thermal model determi-nations include: (1) uncertainties in THEMIS nighttimetemperatures; (2) model sensitivities due to uncertaintiesin surface parameters, such as albedo, obtained from exter-nal data sets; (3) look-up table interpolation residuals; and(4) atmospheric, surface, and subsurface physics notaccounted for by the thermal model. Uncertainties areinherent in any model used, and important insight can begained from these uncertainties as they provide the bound-aries within which the model results can be interpreted.Uncertainties in THEMIS temperature measurements andderived thermal inertia values are discussed in detail insections 3.1; relative differences between thermal inertiavalues within a single image have precision of 10–15% andthe absolute value of thermal inertia is �20%. A summaryof the discussed uncertainties is listed in Tables 1 and 2.
Table 1. THEMIS Nighttime Temperature Calibration
Band 9 1-s NoiseEquivalent
Spectral RadianceNEDT
(at 180 K)
Signal-to-noise 2.72 � 10�6 W cm�2 str�1 mm�1 1.15 KColumn-row
correlated1.06 � 10�6 W cm�2 str�1 mm�1 0.5 K
Time-dependentchange in focalplane temperature
4.3 K
IRF slope 4 KOffset �2 to +6 KRSS total 2.8 K
Table 2. Thermal Inertia Image Uncertaintiesa
PrecisionAssignedUncertainty
PercentContribution
Nighttime temperature 1.2 K 6%Albedo 0.03 6%Elevation 100 m 0.5–1%Slopes 1� 3%Interpolation n/a 1–2%Visible/9-mm extinction opacity ratio 1.5–3 K 10%Unit emissivity 1.2 K 6%Total 11.5%
AccuracyAssignedUncertainty
PercentContribution
Nighttime temperature 2.9 K 16%Albedo 0.03 6%Elevation 100 m 0.5–1%Atmospheric opacity 0.1 3%Slopes 1� 3%Interpolation n/a 1–2%Visible/9-mm extinction opacity ratio 1.5–3 K 10%Unit emissivity 1.2 K 6%Total 21%
aBecause model parameters are uncorrelated, these values are combinedusing a Root Sum Square method. This result is then added to the averagenighttime temperature calibration to acquire the total image uncertainty.
E12004 FERGASON ET AL.: THEMIS THERMAL INERTIA
4 of 22
E12004

3.1. Measurement Uncertainties
3.1.1. THEMIS Nighttime Temperatures[18] To quantify temperature uncertainties and establish
the precision and accuracy of the THEMIS instrumentcalibration at night, the procedure used by Bandfield et al.[2004] for THEMIS daytime measurements was repeatedfor THEMIS nighttime temperatures. The THEMIS temper-atures are determined from the difference between theradiance of the scene and the internal reference calibrationflag measured in scaled, eight-bit ‘‘data numbers’’ (DN).There are several random and systematic factors that com-plicate the calibration of THEMIS data, and each one willbe discussed individually in terms of its relevance tonighttime temperatures, and specifically the 12.57-mm-wavelength region (band 9).3.1.1.1. Signal-to-Noise[19] The 1 s noise equivalent spectral radiance (NEDR)
for band 9 is 2.72 � 10�6 W cm�2 str�1 mm�1,corresponding to a noise equivalent delta temperature(NEDT) of 1.15 K at 180 K (P. R. Christensen, THEMIScalibration report, 2005, available at http://themis-data.asu.edu/pds/calib/calbi.pdf) (hereinafter referred to as Chris-tensen, Themis calibration report, 2005). This error can bereduced by averaging pixels in an area when analyzingimage data, increasing the signal-to-noise ratio.3.1.1.2. Column-Row Correlated Noise[20] Column-row correlated noise is caused by small
changes in both the detector response relative to theprelaunch response function and minor fluctuations indetector readout bias voltage, and is identified as variationsof ±1 DN along a row. This error corresponds to a NEDR of±5.31 � 10�6 W cm�2 str�1 mm�1 in band 9 and an NEDTof ±2.2 K at 180 K, and is detected and reduced duringstandard image calibration to <0.2 DN [Bandfield et al.,2004] (NEDR of ± 1.06 � 10�6 W cm�2 str�1 mm�1 inband 9 and an NEDT of ± 0.5 K at 180 K), and can befurther reduced by averaging pixels when analyzing imagedata.3.1.1.3. Time-Dependent Change in Focal PlaneTemperature[21] The THEMIS focal plane substrate is temperature
controlled to ±0.001�C (Christensen, Themis calibrationreport, 2005). However, the active surfaces of the micro-bolometer detectors change temperature in response toradiance from the surface. Temperature changes of�0.001�C result in signal changes of 2 to 3 DN (‘‘drift’’).In addition, there are higher-frequency (1–5 s) variations inthe output signal due to the actions of the focal planetemperature controller (‘‘wobble’’). These effects arereduced by assuming that the atmospheric temperature isconstant throughout an image and that band 10 (centered at14.88 mm, the fundamental CO2 absorption) should there-fore be constant. Changes in band 10 are assumed to be dueto ‘‘drift’’ and ‘‘wobble’’ and these effects are removed fromall other bands. The magnitude of this effect is typically±5 DN at night [Bandfield et al., 2004]. When the post-image calibration observation of the internal shutter/calibra-tion flag is acquired within 120 s after the completion of theimage, the total error after correction is estimated to be<2 DN for the first line of the image and zero for the last
line of the image [Bandfield et al., 2004], corresponding toan absolute error of 4.3 K at 180 K.3.1.1.4. Instrument Response Function Slope Errors[22] The THEMIS instrument response function (IRF)
was defined prelaunch using measurements of blackbodytargets at a range of temperatures in a vacuum chamber, andis constant over expected operational instrument temper-atures [Christensen et al., 2004; Christensen, Themis cali-bration report, 2005]. The accuracy of the IRF slopeis within �2% and was determined using comparativeTES data, space observations, and CO2 polar cap images[Bandfield et al., 2004]. Using a surface temperature of180 K and an instrument temperature of 270 K, errors in theIRF result in a maximum IRF slope error of 4 K.3.1.1.5. Offset Errors and Shutter Closing Image[23] Typical offset errors range from �1 to +3 DN
[Bandfield et al., 2004], which result in offset errorsbetween �2 and +6 K at 180 K. In addition, a calibrationimage is acquired of the shutter/calibration flag after imageacquisition to assess the temperature of the instrument; thisvalue is used to set the instrument offset during calibration.Ideally, the calibration flag image is taken immediatelyfollowing the planet image, but owing to software and databuffer constraints, it is typically delayed by �60 s fornighttime data, resulting in a 1–2 DN error and a temper-ature error of 2.3 K at 180 K.3.1.1.6. Absolute Calibration of Nighttime Images[24] To assess the quality of THEMIS nighttime cali-
bration considering all the above uncertainties, we calcu-lated the surface temperature at 60 locations withinnighttime THEMIS images over the southern CO2 polarcap, and assessed if the measured temperatures areconsistent with the expected saturation temperature ofthe latent heat of CO2 (148 K). The difference betweenthe expected temperature and the measured temperatureranged from 0.2 K to 18 K, and the X2 of this differencewas 7.5 K at 148 K. This result is consistent with a 1.8 Kdifference at 180 K. Considering the calibration factorsdiscussed above, a reasonable estimate of the absoluteaccuracy of the THEMIS temperature calibration at nightis between 1.8 K and 2.8 K. To assess the precision of theTHEMIS instrument, we also determined the 1-s NEDRwithin each location and converted that value to an NEDT at180 K. This precision is 1.2 K, and corresponds well withthe signal-to-noise value of 1.15 K reported by Christensen(Themis calibration report, 2005).3.1.2. Model Sensitivity and Error Propagation[25] A study was performed to determine the sensitivity
of the thermal model to variations in albedo, elevation,dust opacity, and slopes and how these sensitivitiespropagate into uncertainties in the resulting thermal iner-tia values. In this assessment, one input parameter of themodel was systematically varied for a range of latitudesand seasons, while all other parameters were held con-stant (sensitivity study input parameters are listed inTable 3). Only results where latitude was varied will bediscussed, but similar uncertainties were calculated vary-ing season as well. Because nighttime data alone wereused in this work to calculate thermal inertia values, onlyerrors for nighttime conditions (5 H) are reported, and aresimilar for all local times observed by the THEMISinstrument (3 to 6 H).
E12004 FERGASON ET AL.: THEMIS THERMAL INERTIA
5 of 22
E12004

3.1.2.1. Albedo[26] Albedo primarily affects the average surface temper-
ature and the phase of the diurnal temperature curve [Kiefferet al., 1977], and is generally found to be inverselycorrelated to thermal inertia on Mars at all spatial scales[e.g., Kieffer et al., 1977; Palluconi and Kieffer, 1981;Zimbelman and Leshin, 1987]. Uncertainties in the surfacealbedo are caused by differences between the true surfacealbedo as a function of wavelength and incidence angle andthe model input value. This discrepancy can be due in partto uncertainties in the TES albedo data set, or fromvariations in albedo below TES resolutions affecting THE-MIS surface temperatures. Error can also result from theassumption of a Lambertian surface in determining the TESalbedo from a fixed viewing geometry and the fact that theMartian surface likely has a more complex photometricbehavior.[27] Higher-resolution THEMIS or MOC visible images
may be helpful in identifying the presence of sub-TES-resolution variations in albedo, but quantifying these varia-tions is difficult. Model sensitivities associated with thermalinertia as a function of albedo are illustrated in Figure 1a.An uncertainty in albedo of 0.03 for an albedo of 0.2, resultsin an error in thermal inertia of 6% to 10% for thermalinertias of both 80 and 600. Albedo has a larger effecton surface temperature at latitudes closer to the equatorbecause in those regions the sun is above the horizon longerand later into the evening resulting in less nighttime hours todissipate the effect of albedo on surface temperature, andthus thermal inertia.3.1.2.2. Elevation[28] Elevation is used to derive the atmospheric pressure,
which is important for determining the average surface graindiameter from thermal inertia because of the pressuredependency of gas conductivity in small pores in the soil.Elevation also affects the relative amount of atmosphereabove the surface, and thus the absorption of infraredenergy and attenuation of energy through the atmosphere[e.g., Kieffer et al., 1973; Zimbelman and Kieffer, 1979;Haberle and Jakosky, 1991; Bridges, 1994]. A correctionfor atmospheric pressure is included in the thermal model,and the uncertainties due to elevation are therefore small.The primary uncertainty is due to the spatial scale of thegridded MOLA topography relative to an individual THE-MIS pixel. Model sensitivities of thermal inertia associatedwith elevation are illustrated in Figure 1b. Assuming anuncertainty of 100 m (MOLA binned at 128 ppd) at anelevation of 0 km, errors associated with elevation rangefrom 1% for a thermal inertia of 80 to 0.5% for a thermal
Table 3. Sensitivity Study Parameters
Minimum Maximum Increment Value
Latitude �90� +90� 10�Season 0� 360� 30�Albedo 0.0 0.5 0.05Elevation, km �8.0 +8.0 1.0Atmospheric dust opacity 0.0 1.0 0.05Slope 0� 30� variableSlope azimuth 0� 360� 90�
Figure 1. Thermal model input parameter sensitivities.Plots of the sensitivity of thermal inertia to variations in(a) albedo; (b) elevation; and (c) atmospheric dust opacityfor a range of latitudes, a local time of 5 H, and an Ls = 0�.The curves with symbols are calculations for a thermalinertia of 80, the solid lines represent thermal inertia valuesof 600, and different colors represent different latitudes.Uncertainties for thermal inertia values between 80 and 600can be approximated by linearly interpolating between thesecurves. To determine the uncertainty due to any inputparameter, move across the x axis to the input parametervalue that best characterizes the surface of interest. Thenmove vertically until the line best representing the thermalinertia and latitude is intercepted. Then move horizontally tointercept the y axis; this value is the partial derivative withrespect to thermal inertia. Multiply this derivative value bythe amount of uncertainty in the input parameter. Theresulting value is the corresponding error in thermal inertia.
E12004 FERGASON ET AL.: THEMIS THERMAL INERTIA
6 of 22
E12004
inertia of 600, depending on the latitude. The influence ofelevation on temperature is larger for low elevations.3.1.2.3. Atmospheric Dust Opacity[29] The primary effect of additional dust in the atmo-
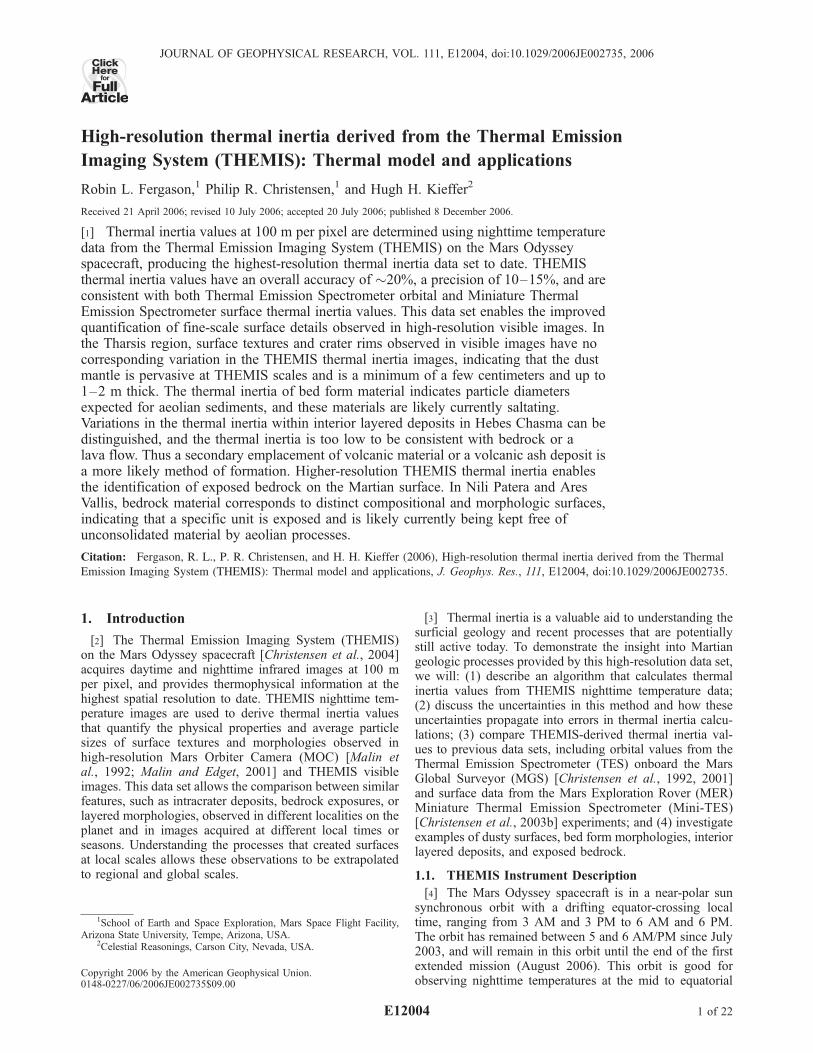
sphere is to block solar energy from being incident onto thesurface, increase the downwelling atmospheric thermalemission, and insulate the surface by preventing energyfrom escaping through the atmosphere [Pollack et al.,1979]. Dust in the atmosphere damps the amplitude of thediurnal temperature variation, mimicking a higher thermalinertia surface [Haberle and Jakosky, 1991]. Overall, how-ever, atmospheric dust opacity has a relatively small effecton thermal inertia calculations for several reasons. First, atnight the surface and atmospheric temperatures are similar,and therefore small variations in the atmospheric tempera-ture induce only small changes in the surface temperature.Increasing the amount of dust in the atmosphere increasesthe nighttime surface temperature by less than 1 K per 0.1increase in visible opacity at a thermal inertia of 200[Fergason et al., 2006]. In addition, at relatively lowopacities the atmosphere only absorbs a small percentageof solar energy, and small changes in opacity produce minorchanges in the amount of energy incident upon the surface(periods of relatively high opacity (t > 0.4) are not used todetermine thermal inertia). Finally, dust opacity does notvary dramatically spatially, and variations are largely sea-sonally repeatable from year to year [Clancy et al., 2000;M.D. Smith et al., 2001]. Uncertainties in the thermal inertiadue to opacity errors occur when the actual opacity at thetime the THEMIS image was acquired differs from theopacity at the season of image acquisition for a typical Marsyear. An uncertainty in dust opacity of 0.1 at an opacity of0.2, results in an error in thermal inertia of �1% for thermalinertias of 80, and 2% to 7% for thermal inertias of 600,depending on the latitude (Figure 1c). The uncertainties aresymmetrical about the equator, and increase towards thenorth and south poles.3.1.2.4. Local Slopes[30] Local slopes are not considered in the nominal
method for determining thermal inertia with THEMIS databecause high-resolution slope maps are not available toincorporate these data in an automated fashion. However ona larger scale, slopes can be incorporated on a framelet (256lines) basis in the derivation of thermal inertia whennecessary. Slopes are important because a sloped surfacereceives a different amount of incident thermal energyrelative a horizontal surface. In addition sloped surfacesradiate onto a hemisphere that includes surface materials,rather than to a hemisphere of only sky for a flat-lyingsurface. The effect of slopes on thermal inertia was deter-mined for slopes of 5�, 10�, 20�, and 30� at azimuths of 0�,90�, 180�, and 270� (0� is North) (Figure 2). Assuming anuncertainty in slope of 1�, errors in thermal inertia rangefrom 3% to 20%, depending on the slope and azimuth(Figure 2). Slopes facing west and east typically have alarger uncertainty than slopes facing north or south, primar-ily because more (or less) thermal energy is absorbed bysurfaces at this orientation during the afternoon. Howevernorth or south-facing slopes can also be problematicbecause the sun can be incident on the surface for adissimilar amount of time before and after 12 H, dependingon the season and the latitude.
[31] To further investigate the effect of slopes on temper-ature, and thus thermal inertia, we analyzed 12 surfacenighttime temperature pairs along the walls of VallesMarineris, craters, and mesas with slopes ranging from10� to 30� and at a range of azimuth orientations. THEMISnighttime temperatures of opposite facing slopes werecompared for each feature to determine the temperaturedifference, in order to quantify the residual effect of slopesat night. With only one exception out of these 12 examples,the temperatures of slopes with different orientationswere the same to within �3 K, which is about twice the
Figure 2. Thermal model slope input parameter sensitiv-ities. Plots of the sensitivity of thermal inertia to variationsin local slopes for a range of latitudes, a local time of 5 H,and an Ls = 0�.
E12004 FERGASON ET AL.: THEMIS THERMAL INERTIA
7 of 22
E12004

NEDT of the instrument. In some cases, differing geologysuch as more rocky material on one wall complicated themeasurement and made confirmation difficult, but theseresults suggest that any additional heat absorbed by thesloped surface during the day has sufficiently dissipated atnight to have little effect on the derived thermal inertia.Generally, slopes below 10� at all azimuths had a smalleffect on the surface temperature, and therefore the thermalinertia at night. Higher slope angles may not be problematic,but this conclusion is dependent on the slope azimuth andthe season. Owing to the potential for slopes to be a factor,surfaces with slopes greater than �10� should include slopemeasurements in the thermal inertia derivation and beinterpreted with caution.3.1.2.5. Additional Uncertainties[32] Additional uncertainties include errors in interpola-
tion within the look-up table, assuming a constant visible/9-mm extinction opacity ratio, and assuming a surfaceemissivity of unity. When creating the look-up table, thenode values were intentionally selected to minimize theerrors due to interpolation; these errors are less than 1–2%.[33] A constant visible/9-mm extinction opacity ratio of
2.0 was used in this work, but this ratio may vary between�2.0 and �2.5 for visible atmospheric dust opacity con-ditions below 1.0 [Clancy et al., 1995]. Increasing thevisible/9-mm extinction opacity ratio increases the modeledtemperature at all times of day with a greater effect at night.Varying visible/9-mm extinction opacity ratio from 2.0 to2.5 changes the modeled surface kinetic temperature �1.5 Kat night for low opacity conditions (t = 0.2) and �3 K atnight for high opacity conditions (t = 0.6), producing anuncertainty of �10% in thermal inertia.[34] Finally, a constant unit emissivity is assumed for this
work. Any constant emissivity used is an assumptionbecause different surface materials have different emissivityvalues. A unit emissivity was chosen because it is thesimplest case and is a reasonable assumption in mostinstances. This effect is not significant as changes in the
emissivity from 1.0 to 0.96, which is typical for Mars at12.57 mm (band 9) [e.g., Bandfield, 2002], only changes thesurface kinetic temperature 1.2 K, which translates to a�6% change in thermal inertia.
3.2. Repeatability of THEMIS Thermal InertiaDeterminations
[35] Considering the uncertainties and conditions thatmay affect the reliability of thermal inertia calculations, itis instructive to compare multiple images of the samelocation to quantify the repeatability of THEMIS thermalinertia measurements and to determine how well the thermalinertia model is correcting for seasonal, local time, andatmospheric dust opacity differences in data acquisition.Many areas on the Martian surface, especially those of highscientific interest such as the candidate MER landing sites,have been observed multiple times at night with the THE-MIS instrument over a range of conditions. Thermal inertiaimages from regions in Meridiani Planum, Gusev Crater,Arabia Terra, and Isidis Planitia were selected for compar-ison (Table 4). To increase the signal to noise ratio, severalhundred pixels were added together in each comparison. Ofthe images selected, the thermal inertia differences for thesame location ranged from 12 to 120, with an averagedifference of 65, corresponding to an overall agreementbetween images of �35%.[36] The difference between THEMIS thermal inertia
values is likely due to a combination of model inputparameter uncertainties and an incomplete understandingand incorporation of surface-atmospheric interactions. Theimage-to-image variation is higher than the estimated accu-racy of the THEMIS thermal inertia calculation (Table 2),and thus it is also probable that some of these differencesare due to real variations in nighttime surface temperaturecaused by day-to-day variations in haze or near-surfacewinds, or surface and subsurface heterogeneities notaccounted for by the thermal model. It should be noted,however, that although image-to-image comparisons have
Table 4. Comparison of THEMIS Thermal Inertia Measurement of the Same Location
Location Latitude Longitude Image IDThermalInertia Season (Ls) Local Time Albedo
Dust Opacity(Visible) Elevation (km)
Meridiani Region 1 3.6�S 352.5�E I11216001 210 52 4.9 0.15 0.2 �1.92I12439002 130 96 5.3 0.14 0.14 �1.63I06935007 245 218 5.4 0.14 0.56 �1.08
Meridiani Region 2 3.2�S 352.5�E I11216002 275 52 4.9 0.14 0.2 �1.73I12439002 185 96 5.3 0.15 0.28 �1.68I06935007 310 218 5.4 0.15 0.56 �1.35
Meridiani Region 3 0.5�N 352.0�E I01018006 450 339 3.1 0.23 0.42 �1.92I11216002 320 52 4.9 0.23 0.2 �1.55I12439002 310 96 5.3 0.23 0.24 �1.69I06935007 420 218 5.4 0.23 0.56 �1.92
Meridiani Region 4 5.6�N 351.6�E I01018006 270 339 3.1 0.22 0.40 �1.95I01717002 180 8 3.4 0.22 0.22 �1.95
Gusev Region 1 11.3�S 174.9�E I01511006 255 360 3.4 0.26 0.38 �1.78I08589007 140 303 4.3 0.26 0.34 0.59
Gusev Region 2 9.5�S 174.7�E I01511006 130 360 3.4 0.26 0.40 0.59I08589007 55 303 4.3 0.26 0.38 �1.48
Arabia 2.9�N 26.4�E I01229007 75 348 3.2 0.26 0.56 0.21I07895014 120 267 4.8 0.27 0.94 0.12
Isidis Region 1 12.8�N 84.5�E I06732011 255 207 5.4 0.23 0.30 �3.9I09815012 210 358 4.2 0.23 0.28 �3.9
Isidis Region 2 17.2�N 83.9�E I06732011 270 207 5.4 0.24 0.22 �3.79I09815012 210 358 4.2 0.24 0.28 �3.79
E12004 FERGASON ET AL.: THEMIS THERMAL INERTIA
8 of 22
E12004

errors of �35%, relative differences within a THEMISimage are 10% to 15%. Relative differences in a singleimage are calibrated to within �1.2 K, and any uncertaintiesin data calibration affect the entire image in a consistentmanner.
3.3. Summary of Uncertainties
[37] The accuracy of THEMIS-derived thermal inertiavalues is separated into two categories: (1) the absoluteaccuracy of THEMIS-derived thermal inertia values and(2) the relative precision of thermal inertia values within asingle image. The calibration of the THEMIS instrument isthe largest factor in determining the absolute accuracy ofthermal inertia calculations. Knowledge of model inputparameters such as albedo, elevation, and local slopes alsoplay a role, but the combined contribution of all these errorsis roughly equal to that of the instrument (Table 2). Factorssuch as assuming a visible/9-mm extinction opacity ratio of2.0 and a surface emissivity of unity may also be contrib-uting to the thermal inertia uncertainties, but their presenceand contribution is difficult to quantify. Overall, absoluteaccuracy of THEMIS-derived thermal inertia is �20%(Table 2). The precision of temperature measurementswithin an individual THEMIS image is �1.2 K. The relativedifferences between thermal inertia values within a singleimage have a precision of 10–15% (Table 2). Individualthermal inertia images are important for determining varia-tions in thermal inertia between small-scale surface features,and thermal inertia variations across these images representtrue differences in the physical properties of the surface.
4. Comparison with Previous Orbital andLander Data
4.1. Comparison with the ThermalEmission Spectrometer
[38] Differences between the TES- and THEMIS-derivedthermal inertia values are expected, and are caused byseveral factors including differences in the capabilities ofthe instruments, the method of calculating surface temper-ature, and the thermal models employed. The TES instru-ment measures the surface temperature of Mars using bothan infrared spectrometer (5.8 to 50 mm) and a broadbandthermal radiometer (5.1 to �100mm) [Christensen et al.,1992, 2001]. For the TES spectrometer, the radiance at eachwavelength is converted to brightness temperature assumingan emissivity of unity. The maximum brightness tempera-ture (away from the CO2 band) is assumed to be the surfacekinetic, or target, temperature [Christensen et al., 2001].Planetary (top of the atmosphere) brightness temperaturesare calculated using the TES bolometer by measuring thetotal emitted radiance from the Martian surface and deter-mining the temperature of an ideal blackbody correspondingto this total radiance. At night, the planetary temperature istypically 3–4 K lower than the target temperature due to thepresence of the 15-mm CO2 absorption band that reduces theintegrated radiance when the atmosphere is colder thanthe surface. Despite larger calibration uncertainties withthe TES spectrometer than the bolometer, the target temper-atures are likely the most accurate measurement of surfacetemperature because the effect of the atmosphere on thetarget temperature is well understood. Jakosky et al. [2000]
and Mellon et al. [2000] derived thermal inertia values fromboth spectral and bolometric temperatures. Rather thanusing target temperatures measured by TES to calculatespectrometer-based thermal inertias, they use a Viking-IRTM-equivalent 20-mm-band temperature. This methodwas chosen to avoid interference from atmospheric dust orclouds and to allow easily comparable results with IRTM-derived thermal inertia values [Mellon et al., 2000]. Thebolometer-based thermal inertias were calculated usingbrightness temperatures, correcting for the 15-mm CO2
absorption band [Mellon et al., 2000].[39] THEMIS uses a microbolometer detector with a
smaller wavelength range than TES, and this instrumentdesign requires a different method for deriving surfacetemperature than discussed above. A look-up table ofPlanck curve temperatures is calculated for the wavelengthregion of each band, and this look-up table is used tocalculate the brightness temperature measured by THEMISfor each filter. Rather than defining the surface kinetictemperature as maximum brightness temperature of allwavelength bands as with TES, at night band 9 (centeredat 12.57 mm) has the highest brightness temperature andprovides the best approximation of the surface kinetictemperature [Christensen et al., 2004]. However, the surfaceemissivity at this wavelength is likely to be less than unity,and this temperature does not directly correspond to eithertemperature used in the analysis of TES data.4.1.1. Comparison of Thermal InertiaModeling Techniques[40] In addition to differences in the instruments and
methods for deriving surface temperatures, different thermalmodels are also utilized when deriving the TES and THE-MIS thermal inertia values. The primary difference betweenthese models is in the treatment of the atmosphere. Bothmodels account for radiation through a dusty CO2 atmo-sphere and allow for heat exchange with the surface.However, the thermal model used in this work incorporatesa one-layer atmosphere that is spectrally gray at solarwavelengths, and direct and diffuse illuminations are com-puted using a two-stream delta-Eddington model. Thethermal model used in the derivation of TES thermal inertiavalues includes a 16-layer atmosphere [Haberle andJakosky, 1991], and incorporates the vertical transfer ofenergy through the atmosphere due to convective over-turning within the boundary layer [Jakosky et al., 2000;Mellon et al., 2000]. The different atmospheric correctionsproduce slight differences in the amount of thermal energyincident on the surfaces, and the models may responddifferently to atmospheric dust.[41] To understand these differences in the thermal mod-
els used for TES and THEMIS, we compared the twothermal models as directly as possible. The TES thermalinertia production look-up table was replicated using thethermal model used in this work by using the same inputparameter nodes (season, local time, latitude, elevation,thermal inertia, albedo, and atmospheric dust opacity) inthe thermal model and comparing the resulting temperaturevalues with those in the TES thermal inertia productionlook-up table. The thermal model temperatures agree towithin �3 K for a range of typical surfaces, dust opacities,latitudes, and seasons (Figure 3), indicating that any differ-ences between the thermal models does not significantly
E12004 FERGASON ET AL.: THEMIS THERMAL INERTIA
9 of 22
E12004

contribute to differences between TES and THEMIS-derived thermal inertia values.4.1.2. Comparison of Thermal Inertia Maps[42] The comparison of TES and THEMIS-derived ther-
mal inertia values ±40� from the equator, due to sparseTHEMIS coverage between �40� and 60� latitude, andbinned at 2 pixels per degree, is shown in Figure 4.THEMIS thermal inertia values are compared to TESbolometric thermal inertia values, because these TES valuesincorporate TES surface temperature measurements and aretherefore believed to be the most accurate representation ofthe physical nature of the surface as measured by TES. Toconstruct the global THEMIS thermal inertia map, THEMISthermal inertia data were averaged in a single image every256 lines (framelet, effectively 32 � 26 km) and this infor-mation was stored in a database along with longitude,latitude, and information about the image calibration andprocessing quality. Nighttime images selected for this maphave a high quality of calibration, have emission angles lessthan 30�, are from a period where there are no global duststorms, and have no surface CO2 frost present. The averagethermal inertia for each framelet was binned at 2 pixelsper degree and gaps in the data were filled using alinear interpolation between neighboring bins weighted bydistance.[43] To create the TES thermal inertia map, the TES
thermal inertia data were constrained to have incidenceangles greater than 95�, emission angles less than 30�, ahigh quality of thermal inertia derivation, and only seasonswith a low dust opacity and no equatorial water-ice cloudswere included. This TES thermal inertia map is similar tothe published TES global maps of Mellon et al. [2000] andPutzig et al. [2005], but the effect of H2O-ice clouds in thelow inertia equatorial regions has been reduced and the
elevated thermal inertia values in the northern polar regionhave been excluded. The THEMIS and TES-derived globalthermal inertia maps agree to within 25–30%, and thefamiliar thermophysical features, such as the low thermalinertia areas of Tharsis Montes, Elysium Planitia, andArabia Terra and the higher thermal inertia regions of thesouthern rim Isidis Planitia and Valles Marineres, areconsistent. A scatter plot and histogram (Figures 5aand 5b, respectively) of THEMIS and TES thermal inertiavalues both illustrate that THEMIS-derived thermal inertiavalues are typically higher than those derived with TES datafor an individual location. In addition, there is morevariation in thermal inertia values in the low thermal inertiaregions in the THEMIS data set. To ensure global coverage,the THEMIS thermal inertia map incorporates data spanningan entire Mars year, whereas the TES map only includesdata from Ls 30� to 60�, when the presence of globalatmospheric dust and H2O-ice clouds in the equatorialregions are minimized. Seasonal variations in surface tem-perature or atmospheric conditions, including the presenceof H2O-ice clouds, may be causing the variation in the lowthermal inertia regions observed in THEMIS data. Time ofday effects not accounted for in the thermal model may alsobe present, since THEMIS and TES data incorporated wereacquired at local times ranging from �3.5 H to �5.5 H and�2 H, respectively.[44] The highest thermal inertia areas found in Valles
Marineris, the southern rim of Isidis Planitia, the outflowchannels of Xanthe Terra, and Acidalia Planitia are similarin two data sets, but THEMIS shows less areal abundance ofhigh thermal inertia material (Figure 4). This difference ismore pronounced because of the stretch applied to the data,and actual differences are �15%. This is likely due in partto a lower than unity emissivity in these regions. Most highthermal inertia areas on Mars have a lower albedo, and theselower albedo surfaces can have an emissivity as low as�0.97 in THEMIS band 9 (12.57 mm). The THEMISthermal model assumes an emissivity of unity, and thisdiscrepancy will result in a lower estimation of the thermalinertia in these regions by �6%. The TES thermal modelalso assumes an emissivity of unity, but this issue is not aproblem with the bolometer data. Different atmosphericconditions and local times may also be contributing factors.[45] In addition, image-to-image variations in thermal
inertia due to seasonal atmospheric variations not accountedfor in the thermal model are also present in the THEMISmap resulting in a ‘‘stripy’’ appearance. Because the sea-sonal range used to create the TES map is more narrowlyconstrained and TES collects data continuously whereasTHEMIS images are targeted, there is more consistentnighttime coverage of the planet with the TES data setresulting in a cleaner, less ‘‘stripy’’ thermal inertia map.Both the thermal models used and the thermal inertia valuesproduced agree to within 25–30%, and this discrepancyis caused by a variety of factors, including differences inthe: (1) instrument, and thus the temperature measurements;(2) thermal model; (3) seasonal atmospheric conditions;and (4) local times the data were acquired. The classifica-tion of surface particle sizes used in geologic interpretationsis often divided based on the Wentworth Grade Scale[Wentworth, 1922], and this dissimilarity in thermal inertiavalues is sufficiently small to allow one to differentiate
Figure 3. KRC replica table temperatures compared toTES production table temperatures. The thermal modelutilized in this work (KRC) was used to replicate the TESthermal inertia production look-up table to allow a directcomparison between the thermal models. These data arecompared for a representative thermal inertia of 248, albedoof 0.25, atmospheric dust opacity of 0.50, all seasons, andlatitudes from 40�S to 40�N. The red line indicates a perfectagreement between the thermal models. Other thermalinertia and albedo values produce similar results.
E12004 FERGASON ET AL.: THEMIS THERMAL INERTIA
10 of 22
E12004

these common particle size classes (such as silt versussand). Therefore this difference does not effect the discrim-ination of major surface types (i.e., dust, sand, rock) or theinterpretation of the physical nature of the Martian surface.
4.2. Comparison with Mini-TES SurfaceMeasurements
[46] Surface temperatures obtained by the Mini-TESinstrument at the MER-Spirit landing site region at GusevCrater were used to derive thermal inertia values [Fergasonet al., 2006], and provides an opportunity to corroborate theTHEMIS-derived thermal inertia data. Along the traversefrom the Columbia Memorial Station landing site to Bonne-ville crater, the thermal inertia in both the Mini-TES andTHEMIS data sets increased from 175 ± 20 to 380 ± 20 and280 ± 40 to 330 ± 40, respectively (Figure 6). This increaseis likely caused by additional centimeter-sized rock frag-ments and a higher rock abundance in the Bonneville craterejecta [Golombek et al., 2005; Fergason et al., 2006]. FromBonneville crater to the Columbia Hills, the THEMIS andMini-TES thermal inertia values show similar thermalinertia patterns; Mini-TES values being on the average
20% lower and showing greater variation [Fergason et al.,2006]. Larger variations in the Mini-TES data are expectedas the spatial resolution is typically 100-fold higher thanTHEMIS. The lower Mini-TES thermal inertias may also bedue to a data bias, as the rover avoided obstacles, such asrocks or bed forms, during the traverse and the Mini-TESobservations were acquired directly in front of the rover[Fergason et al., 2006].
5. Applications
[47] THEMIS-derived thermal inertia permits the charac-terization of the physical nature of surface materials ob-served in high-resolution images. Features observed inMOC and THEMIS visible images can often be uniquelyassociated with a distinctive thermal inertia at THEMISresolution, and thus the physical nature of the surfacematerials can be determined. Dusty surfaces, bed formmaterial, interior layered deposits, and exposures of surfacebedrock have been examined to: (1) identify the thermalinertia and effective particle size of landforms and featuresin THEMIS and MOC images to aide in the interpretation of
Figure 4. Global thermal inertia maps. (a) TES-derived thermal inertia (30 km per pixel; 2 pixel perdegree resolution). (b) THEMIS-derived bolometric thermal inertia (30 km per pixel; 2 pixel per degreeresolution).
E12004 FERGASON ET AL.: THEMIS THERMAL INERTIA
11 of 22
E12004

these regions; and (2) combine this information to betterunderstand the geologic history and processes that haveaffected the Martian surface.
5.1. Dust Mantled Surfaces in Tharsis Montes
[48] Tharsis Montes is one of the classic low thermalinertia regions on Mars and is interpreted to have a surfacelayer of unconsolidated air-fall dust less than �2 m thick[Christensen, 1986]. Tharsis was first identified as having avery low thermal inertia in Viking IRTM data [Kieffer et al.,1977; Zimbelman and Kieffer, 1979; Palluconi and Kieffer,1981] at a resolution of �120 km per pixel. The improve-ment in resolution of the TES data set confirmed thepervasive nature of this low thermal inertia material at aresolution of 3–5 km per pixel [Mellon et al., 2000]. As atype example of dust-covered surfaces on Mars, a region
600 km � 1120 km in Tharsis Montes centered at 260.5�E,7�N (Figure 7) was studied using THEMIS thermal inertiavalues and THEMIS and MOC visible images. This regionwas analyzed to determine if this dust mantle is alsohomogeneous at 100 m per pixel resolution or if features,such as individual lava flows, observed in high-resolutionvisible images can be distinguished thermally.[49] This region has both a uniform THEMIS (90–115)
and TES (60–80) thermal inertia and a TES albedo of0.29–0.30, indicating the presence of a surface layer of dustgreater than a few centimeters thick. The dust cover index(DCI; 0.93–0.94) also indicates that a surface layer of fine,unconsolidated material is present [Ruff and Christensen,2002]. In visible images individual lava flow fronts andwrinkle ridges are observed, and distinctive lava flowtextures and the level of surface degradation suggest thatindividual flows are from different eruptive events. Topo-graphically lower layers often have a more uniform texture,indicating that they are likely older and more degraded. Thisregion displays erosional surfaces both at THEMIS andMOC resolution, such as the lack of crater ejecta, theerosion of lava flow fronts, and knobby lava flow textures,suggesting that a surface layer has been removed. In somecases, the surface morphology appears smoothed, particu-larly at MOC resolution, indicating the likelihood of a dustmantle on the surface.[50] Despite the presence of visible lava flow fronts and
differences in lava textures on these surfaces, there are nothermal inertia variations at THEMIS resolution associatedwith individual lava flows or the distinctive surface texturesobserved in visible images. The homogeneous nature ofTHEMIS thermal inertia values in this area indicates that thedust layer must have a minimum thickness sufficient tomask the thermal signature from underlying material (a fewcentimeters), but is still thin enough to be able to distinguishsmall craters (10–500 m in diameter) and surface textures atthe resolution of MOC visible images. Assuming a depth:diameter ratio of 1:5 to 1:3 for simple craters [Melosh, 1989,p. 126], the smallest craters observed are 2–3 m deep; thusmore than a few meters of dust would obscure thesefeatures. Also, in THEMIS visible images (18 m per pixel)it is difficult to discern the presence of a dust mantle, but inMOC images (�3 m per pixel) surface morphologies oftenappear smoothed or mantled, further indicating that the dustmantle is less than several meters thick. These observationsindicate that although unconsolidated dust is present on thesurface, it cannot be more than 1–2 m thick, and is likelythinner in many localities. Dust may currently be depositingin this region [e.g., Zimbelman and Kieffer, 1979; Palluconiand Kieffer, 1981; Christensen, 1986; Christensen andMoore, 1992], but likely some process, such as dust devilsor wind erosion [Christensen, 1982], is allowing for theremoval of that dust so that over time there is a net balanceof dust accumulation and removal in this region, preventingtens to hundreds of meters of dust accumulation.
5.2. Bed form Material
[51] The Martian surface is currently dominated by aeo-lian activity [e.g., Malin and Edgett, 2001], and aeoilan bedforms are observed in visible images in a variety of terrainsand geologic settings on Mars. Within a crater centered at63�E, 26.5�N, surfaces that have eroded into mesas, knobs,
Figure 5. Global thermal inertia scatterplot and histogram.(a) Two-dimensional scatter plot of THEMIS and TESthermal inertia values. The while line indicates the x = y lineof perfect agreement between the data sets. Red indicates ahigh frequency, whereas purple indicates a frequency of 1.(b) Histogram of THEMIS and TES derived thermal inertiavalues.
E12004 FERGASON ET AL.: THEMIS THERMAL INERTIA
12 of 22
E12004

and ridges (Figure 8, A units) have a THEMIS thermalinertia of 420 to 465 in contrast to the lower thermal inertiaof aeolian material (Figure 8, B units). Isolated areas of thishigher inertia unit are too small to be resolved in the TESthermal inertia data set. The higher THEMIS thermal inertiaand the presence of features resistant to erosion indicate thatthis surface is consolidated or lithified, and may be bedrockmaterial intermixed with varying amounts of unconsolidatedsand, resulting in a lower thermal inertia than is expected forexposed bedrock. There are at least four layers of materialobserved in MOC and THEMIS visible images, furtherindicating that these layers have been eroded or stripped toexpose underlying units.[52] The aeolian material (Figure 8, B units) has three
morphologic expressions: (1) a low albedo material with
bed forms (B1); (2) a low albedo sheet that does not havebed forms at THEMIS visible resolution (18 m per pixel)(B2); and (3) material present between consolidated surfaces(B3). The bed forms and the sheet (Figure 8, B1 and B2
units) have a THEMIS thermal inertia of 230 to 270(particle diameter of 290 to 575 mm corresponding tomedium to coarse sand), and have a TES albedo of 0.11to 0.12 and a DCI of 0.98. The particle size range impliedby the thermal inertia is consistent with grains that cansaltate under current atmospheric conditions [e.g., Greeleyet al., 1980], and the albedo and DCI indicate that little orno dust is present on the surface. The grain diameter,albedo, and DCI all suggest that these materials are active.[53] The material present between mesas, knobs, and
ridges (Unit B3 in Figure 8) has a TES thermal inertia of
Figure 6. Comparison of THEMIS-derived orbital and Mini-TES-derived surface thermal inertiavalues. (a) THEMIS thermal inertia map (100 m per pixel resolution) overlaid onto a THEMIS visibleimage (18 m per pixel resolution) from Columbia Memorial Station (CMS) to Bonneville crater to theColumbia Hills at the Gusev crater landing site region. (b) Comparison of THEMIS-derived orbital andMini- TES-derived surface thermal inertia values plotted. Modified from Fergason et al. [2006, Figures 8and 13].
E12004 FERGASON ET AL.: THEMIS THERMAL INERTIA
13 of 22
E12004

300 to 330 and a THEMIS thermal inertia of 230 to 340(particle diameter of 290 to 1500 mm corresponding tomedium sand to granules), and has an albedo comparable tothe surrounding material. In addition, lighter toned bedforms that resemble transverse aeolian ripples (TARs)[Malin and Edgett, 2001; Wilson and Zimbelman, 2004]are often observed in topographic valley regions. The higherthermal inertia range may be indicative of a larger grainsize, the subpixel mixing of unconsolidated grains withsmall amounts of consolidated material, or a crust on thissurface, which would raise the thermal inertia relative tounconsolidated material of the same grain diameter. Whenthe darker bed forms (B1) and lighter toned material (B3) areadjacent to one another, the darker bed forms cut the lighter-toned material bed forms, indicating an age relationship inwhich the lighter-toned material was in place before thedarker bed forms were deposited. This relationship alsosuggests that the smaller, lighter bed forms are inactivematerial, and the darker bed forms have been more recentlyactive [Malin and Edgett, 2001; Wilson and Zimbelman,2004].
[54] Evidence for current aeolian activity on the Martiansurface has been observed in the form of wind streakvariability [e.g., Sagan et al., 1972; Arvidson, 1974;Veverka, 1975; Veverka et al., 1977; Thomas and Veverka,1979; Thomas et al., 1981], dust devil activity [e.g., Thomasand Gierasch, 1985; Greeley et al., 2003; Fisher et al.,2005], and the movement of sand-sized particles at theMER-Spirit landing site in Gusev Crater [e.g., Arvidson etal., 2006; Greeley et al., 2006]. In the absence ofdirect observations of dune migration in visible images[Zimbelman, 2000; Edgett and Malin, 2000; Malin andEdgett, 2001], it is difficult to determine with confidencethe current activity of bed forms. However, there are othercharacteristics, such as lineations on dune slip faces and alower albedo than the surrounding surfaces, that can help toestablish the level of activity of Martian bed forms [Edgettand Malin, 2000]. The low TES albedo and DCI valueindicate that there is little dust on the surface of these bedforms. The active migration of bed form features wouldprevent dust accumulation on their surface, and thus thesedark bed forms currently may be saltating. Slip faces maybe present on the low albedo dunes in MOC images,indicating particle movement, but they are at the limit ofthe image resolution and cannot be identified with confi-dence. In addition, the particle diameter inferred fromthermal inertia data and the well-sorted nature of thismaterial is consistent with active bed forms on Earth andis further evidence for current bed form activity in this area.[55] This region consists of mesas, knobs, and ridges
indicative of consolidated or lithified units that have beeneroded (A). Three types of aeolian material are also present(B), and the different morphologic characteristics mayrepresent variable degrees of bed form activity and differentages. The close proximity of actively saltating grains to theconsolidated material suggests a feedback relationship be-tween these units. The actively saltating grains may scourthe consolidated unit, further eroding this material andexposing the observed layers. Unconsolidated sedimenteroded from the consolidated material (A) may then beadditional source material for either the dark or lighter-toned bed forms or the dark sand sheet. The erosive natureof the consolidated unit (A), and the thermal inertia, albedo,and DCI index of the unconsolidated material (B) allindicate that this region is dominated by aeolian activity.
5.3. Hebes Chasma Interior Layered Deposits
[56] Knowledge of the physical and chemical propertiesof layers on Mars is an important step toward understandingthe evolution of Martian environments and climates. HebesChasma (centered at 284�E, �1�N and �310 km wide) ispart of the Valles Marineris canyon system and contains asequence of layered deposits that is �5000 m in totalthickness in its central plateau. Many possible emplacementenvironments for these layered materials, including effusivelava flows [e.g., Komatsu et al., 1993; McEwen et al.,1999], aeolian deposition [Peterson, 1981], lacustrinedeposits [e.g., Peterson, 1981; Nedell et al., 1987; Komatsuet al., 1993; Lucchitta et al., 1994;Malin and Edgett, 2000],subice volcanism [Chapman and Tanaka, 2001], and pyro-clasic flows [e.g., Peterson, 1981; Lucchitta et al., 1994;Komatsu et al., 1993; Hynek et al., 2003], have beensuggested on the basis of morphologic characteristics
Figure 7. THEMIS visible image V10264011 of dust-mantled lava flow features in Tharsis Montes. In this region,the variation in TES albedo ranges from 0.29–0.30, andthus light and dark patterns are primarily a result of thestretch applied to the image, rather than true differences inalbedo.
E12004 FERGASON ET AL.: THEMIS THERMAL INERTIA
14 of 22
E12004

observed in visible images. The major layered units areresolvable by THEMIS infrared data, and sharp thermo-physical boundaries correspond to changes in the morpho-logic characteristics observed in MOC and THEMIS visibleimages. Thus the thermal inertia is related to the underlyingmaterial and in most cases sediment mantles are notdominating the thermophysical properties; high-resolutionthermal inertia data may help to constrain these depositional
environments. Local slopes were included in the thermalinertia calculations, improving the accuracy of the thermalinertia estimates of these materials.5.3.1. Unit Description[57] The sequence presented below is a type example for
the interior layered deposits exposed in the central plateau,consisting of five broad units (Figures 9 and 10). Thepresence of fine layers below THEMIS resolution is sug-
Figure 8. Sand in unnamed crater centered at 63�E, 26.5�N. THEMIS thermal inertia (100 m per pixelresolution) overlaid onto THEMIS visible image mosaic (18 m per pixel resolution) showing surfaces thathave eroded into mesas, knobs, and ridges (A; yellow to red) and aeolian material (B; blue). The aeolianmaterial has three morphologic expressions: a low albedo material that forms bed forms (B1); a lowalbedo sheet that does not have bed forms at THEMIS visible resolutions (B2); and material presentbetween consolidated surfaces (B3).
Figure 9. Hebes Chasma context. THEMIS daytime temperature mosaic of Hebes Chasma. The blackbox indicates the location of the THEMIS thermal inertia mosaic from Figure 10a.
E12004 FERGASON ET AL.: THEMIS THERMAL INERTIA
15 of 22
E12004

gested in MOC images for all the units, implying multipleepisodes of deposition within each unit, and possibly arepeated process. The layers appear to be continuous whereexposed around the central plateau, however, landslidedeposits obscure some areas. Beginning at the base of thecentral plateau, a �2400-m-thick unit (A) has a thermalinertia of 290 to 420 (particle diameter of 780 mm (mediumsand) and larger). This unit is eroding into a massive flutedmorphology resembling yardangs that may be the precursorto spur-and-gully-type terrain [e.g., Lucchitta, 1979], and
the presence of these erosional features on Unit A impliesthat it is indurated. Darker material is present withinerosional grooves, has a thermal inertia of 270 to 290(corresponding to a particle diameter of 575 to 780 mm;coarse sand), and is likely unconsolidated material derivedfrom either Unit A or the above layers.[58] Directly above Unit A is a �600 m thick unit (B) that
has a thermal inertia of 260 to 300 (particle diameter of 490to 900 mm; medium to coarse sand), consistent withunconsolidated sand, suggesting that material has eroded
Figure 10. Hebes Chasma interior layered deposits. (a) THEMIS thermal inertia mosaic (100 m perpixel resolution) overlaid onto a THEMIS visible image V10052001 (18 m per pixel resolution) of HebesChasma, centered at 284 E, �1 N. (b) THEMIS visible image V10052001. Capital letters represent layerunits. (c, d, e) Enlargements from MOC Narrow Angle image M0900284, courtesy of Malin SpaceScience Systems (MSSS/NASA/JPL), of each layer unit.
E12004 FERGASON ET AL.: THEMIS THERMAL INERTIA
16 of 22
E12004

from layers above and talus has preferentially accumulatedin this region. Directly above Unit B, is a �1000-m-thickunit (C) that has a thermal inertia of 275 to 385, whichcorresponds to a particle diameter of 620 mm (medium sand)and larger. This material is eroding into a fluted morphology[Lucchitta, 1979; Peterson, 1981; Nedell et al., 1987;Komatsu et al., 1993] in which the flutes are narrowerthan those observed in Unit A. The preservation of thisfluted morphology indicates that this material is indurated,but the fine nature of the flutes suggests that it is notstrongly resistant to erosion [Komatsu et al., 1993] and isless competent than Unit A. The lower thermal inertia ofUnit C relative to Unit A is also consistent with a lesscompetent material than Unit A, as suggested by themorphology. Unit C may underlie Unit B in places becausefluted material characteristic of Unit C is observed to pokethrough the unconsolidated material within Unit B.[59] Above the fluted morphology of Unit C is a �800-m-
thick unit (D), which has a thermal inertia of 190 to 250(particle diameter of 130 mm to 415 mm; fine to mediumsand). The unit has a distinctive erosional pattern, forming awavy, sinuous configuration suggestive of soft sedimentdeformation. Within Unit D, the albedo is dark toward thetop of the plateau, and dark material is trapped in the scouredgrooves toward the bottom of the unit. The peculiar erosionalpattern further suggests that this unit is distinctive from thosebelow it, and likely formed under different geologic con-ditions than the lower units. In the Melas Chasma interiorlayered deposits, material with a similar erosional pattern isobserved at the top of the layered sequence with a sharplower boundary and along the chasma floor, and is locallycovered by dark sand dunes. These curved structures areinterpreted to be due to lacustrian sedimentation within alocal depression [Quantin et al., 2005] or as block debrisderived from the erosion of the interior layered deposits[Weitz et al., 2003]. The erosional characteristics of Unit Dare strikingly similar to the Melas Chasma material, and thepossibility that Unit D was deposited in a fluvial environ-ment cannot be ruled out. In addition, subice volcaniceruptions could form morphologic features similar to thosefound in Unit D [Chapman and Tanaka, 2001], and isanother possible interpretation. The surface of the flat-lyingcentral plateau (Unit E) has a thermal inertia ranging from125 to 180, corresponding to �100 diameter particles (veryfine sand), and is some of the lowest thermal inertia materialin Hebes Chasma. This material probably consists of ahigher thermal inertia substrate and air-fall dust is currentlyaccumulating on the flat surface, thereby lowering theapparent thermal inertia.
[60] Mafic materials have been previously identified inValles Marineris layered deposits using Viking Orbiter colorimages [e.g., Lucchitta, 1987; Geissler et al., 1990;Komatsu et al., 1993] and Thermal Emission Spectrometer(TES) data [e.g., Christensen et al., 1998]. The individuallayers cannot be resolved, but the three-color Viking spectraof the Hebes Chasma deposits indicate a mafic compositionthat it is relatively unoxidized and presumed to be ofvolcanic origin [Komatsu et al., 1993], and the TES spectraare consistent with basalt [Christensen et al., 1998]. Thethermal inertia of these layers is not high enough to beconsistent with an effusive lava flow, but the mafic signa-ture does indicate a volcanic origin. The lower thermalinertia suggests the secondary deposition of volcanic mate-rial as a weakly indurated sedimentary deposit or a volcanicash deposit. This is in agreement with strength character-istics derived for interior layered deposits throughout VallesMarineris, which are consistent with softer sedimentaryrocks and nonwelded tuffs [Schultz, 2002]. Unconsolidatedsediment is present throughout these units and the subpixelmixing of lithified materials and unconsolidated sediment islikely lowering the apparent thermal inertia of these units.However, the morphologic characteristics observed in high-resolution MOC and THEMIS visible images indicate thatthe lithified material dominates the layered units. The strongcorrelation between the thermal inertia and the morphologyof these layers is an additional indication that the lithifiedmaterial, rather than the unconsolidated sediment, is dom-inating the thermophysical signature.5.3.2. Interpretation[61] The thermal inertia of the interior layered deposits
in Hebes Chasma is too low to be consistent with aneffusive lava flow. The highest thermal inertia of thesedeposits is 420, and unaltered basalt is expected to be�2800 (Table 5). In addition, lava flows would likely betoo well lithified to erode in the fluted pattern observed inUnits A and C, and therefore is not a likely formationmechanism for these materials. A secondary emplacementof volcanic material in an aeolian environment would havea mafic signature and is likely to produce a lithologysimilar to sandstone found on Earth, which has a thermalinertia comparable to effusive basaltic lava (Table 5). Thethermal inertia values are lower than expected for asandstone-type material, but these layers could consist ofa finer-grained precursor material or be weakly indurated.With the data provided, aeolian deposition of unconsoli-dated material cannot be ruled out as potential sourcematerial for the interior layered deposits.[62] A lacustrian emplacement of the layers has been
suggested for interior layered deposits observed in Hebes
Table 5. Thermal Inertia of Materialsa
Density, r, kg m�3Conductivity, k,J s�1 �K�1 m�1
Specific Heat, c,J kg�1 �K�1
Thermal Inertia,J m�1 �K�1 s�1/2
Sandstone (quartz) 2500 2.6 to 5.0 795 2270 to 3100Basalt 2800 2.1 840 2215Granite 2600 2.7 to 3.1 670 2180 to 2340Rhyolite 2500 2.3 670 1960Obsidian 2400 1.3 710 1465Tuff (welded) 1800 1.2 840 1330
aDensity, conductivity, and specific heat table values from Kahle [1980, Table 8.1].
E12004 FERGASON ET AL.: THEMIS THERMAL INERTIA
17 of 22
E12004

Chasma and other localities [e.g., Peterson, 1981; Nedell etal., 1987; Komatsu et al., 1993; Lucchitta et al., 1994;Malin and Edgett, 2000]. Horizontal layering is commonfor a lacustrian environment, and this type of layering isobserved in Units A and C. Hebes Chasma does not have awell-developed fluvial system by which materials could bebrought into the chasma. In addition, there is no observedoutlet for removing water in the enclosed Hebes Chasmabasin [e.g., Chapman and Tanaka, 2001]. The fluvialsurface characteristics and outlet could have been obscuredeither by erosion or the deposition of additional material,but it seems unlikely that this obscuration would bepervasive throughout the chasma. Owing to the lack offluvial features and outlet, a lacustrian environment is not afavored hypothesis for the formation of these deposits. Thewavy, sinuous erosional pattern of Unit D is suggestive ofsoft sediment deformation and may be the result of plasticdeformation of fluidized sediment rather than the deposi-tion in a lacustrian environment.[63] A volcanic ash deposit would have a lower thermal
inertia than that of effusive lava, and could erode into thefluted pattern observed in Units A and C. Unit C appearsless resistive to erosion and has a lower thermal inertia,implying a less indurated material than Unit A. Unit Acould be a moderately welded tuff and Unit C may be a lessconsolidated volcanic ash deposit. This type of deposition isconsistent with the observed mafic signature, derived rockstrengths, the thermal inertia, and the erosional style of thisdeposit. The closest potential source is Tharsis Montes, andhas previously been suggested as a source of volcanic ash[e.g., Edgett, 1997; Hynek et al., 2003], and as a specificsource for the interior layered deposits in Hebes Chasma[Hynek et al., 2003].[64] Aeolian deposition or a volcanic ash fall are the
favored depositional mechanisms for the interior layereddeposits in Hebes Chasma, as described in this work. Thesharp thermophysical and morphologic boundaries betweenthese layers strongly suggests a transition of depositionalenvironments between these units, and a different deposi-tional mechanism for each layer. Units A and C both erodein a fluted pattern, indicating that the material is weaklyindurated yet resistive to erosion. Because of the similarmorphologic features in these units, they likely formed by asimilar process. The fluted morphology of Units A and C isconsistent with a weakly indurated material or a fine-grained precursor material, and a weakly cemented sand-stone or volcanic ash deposit is most likely to produce thistype of morphologic pattern. Unit A is more lithified thanUnit C as evidenced by the erosional morphology presentand higher thermal inertia. Unit D exhibits a uniqueerosional pattern that is strikingly different from Units Aor C, suggesting a significant change in the depositionalenvironment and possibly the climate. This erosional patternis suggestive of soft sediment deformation requiring someliquid medium. Our favored scenario for the deposition ofthe layered deposits in Hebes Chasma includes multipleepisodes of volcanic ash or aeolian sediment depositionfollowed by lithification, resulting in the formation of UnitsA and C. Then the deposition of additional material in afluidized medium occurred, but did not necessarily include astanding body of water.
5.4. Exposed Bedrock
[65] The identification of bedrock on Mars is importantbecause it provides an opportunity to identify the chemicaland physical characteristics of in situ material, and betterconstrain ancient environments or climates. The thermalinertia of a variety of common volcanic materials rangesfrom �1300 to �2800 (Table 5), and we use a value >1200to define the thermal inertia of bedrock on Mars. Highthermal inertia surfaces corresponding to exposed bedrockhave been identified with THEMIS data, and these surfacesare found to range in size and to be exposed in a variety ofgeologic settings, such as crater interiors, channel walls,chaotic terrain, and the Martian plains [e.g., Rogers et al.,2003; Hynek, 2004; Hamilton and Christensen, 2005;Edwards et al., 2005]. Two focused studies of bedrockmaterial identified using THEMIS data include Nili Patera[Christensen et al., 2005] and Ares Vallis [Rogers et al.,2005], and we compare our thermal model results withconclusions from those works.5.4.1. Nili Patera[66] One example of high thermal inertia material is
found in Nili Patera (centered at 67�E, 9�N), which formsthe northernmost caldera on the summit of a volcano inSyrtis Major. In this work, the Nili Patera region has beenmapped (Figure 11) into four units: (A) high thermalinertia material; (B) volcanic cone; (C) lower thermalinertia material; and (D) aeolian material. The high thermalinertia material (Unit A) is found on both the western (410to 610) and eastern (560 to 1180) portion of the caldera
Figure 11. Nili Patera. THEMIS thermal inertia mosaic(100 m per pixel resolution) overlaid onto a THEMISvisible mosaic (18 m per pixel resolution) of Nili Patera,centered at 67�E, 9�N. Units A–D are discussed in the text.
E12004 FERGASON ET AL.: THEMIS THERMAL INERTIA
18 of 22
E12004

floor, and was previously recognized by Christensen et al.[2003a] as very high thermal inertia material. Both regionsof Unit A have a similar surface morphology and TESalbedo (0.11 to 0.12), and were likely formed by similarprocesses. This material is interpreted to be a relativelyfresh lava flow surface, consistent with Christensen et al.[2005]. The eastern exposure of this unit has a gradationalthermal inertia that increases towards the west with thehighest thermal inertias found closest to the aeolian sand.The highest thermal inertia material is consistent withbedrock (1180), and the lower thermal inertia (560 to930) is interpreted to be bedrock with minor amounts ofunconsolidated material that lower the observed thermalinertia, consistent with Christensen et al. [2003a, 2005]. Itis likely that bed form movement across this surface hasinhibited the accumulation of unconsolidated materials andair-fall dust and further exposed the high thermal inertiasurface.[67] The volcanic cone (Unit B) and the lower thermal
inertia material north of the cone (Unit C) have a thermalinertia of 310 to 405. Unit B corresponds to a uniquecompositional unit in the caldera, characterized by adacitic composition [Christensen et al., 2005]. Althoughthe thermal inertia of Unit B is lower than that of Unit A,it is also likely to be bedrock, because it exhibits a strongcorrelation between the thermophysical and morphologicboundaries. Superposition relationships suggest that Unit Bpostdates Unit A, but both units have similar craterdensities indicating that they are similar in age [Christensenet al., 2005]. The lower thermal inertia is likely caused by athicker layer of locally derived loose material on thebedrock surface than Unit A, which may be severalcentimeters thick. Alternatively, Unit B may be a moreporous material than Unit A, consistent with the interpreta-tion of a dacite. Unit C has a similar morphology to Unit A,but a lower thermal inertia and is consistent with a bedrocksurface overlaid by unconsolidated material. This layer ofunconsolidated material is likely a few cm thick as it mustbe thick enough to lower the thermal inertia, but notcompletely mask the thermophysical properties of theunderlying bedrock. The lower thermal inertia and theinterpretation of a thicker layer of unconsolidated materialpresent also suggests that the dunes did not recently (orever) migrate across this surface.[68] The aeolian material (Unit D) in Nili Patera is in the
form of transverse dunes in the middle of the aeolian depositand barchan dunes on the edges of the deposit. Both duneforms have a thermal inertia of 200 to 325, consistent withparticle diameters of 160 to �1 mm (fine to very coarsesand). The primary wind direction is from the northeast, asinferred from the location of the sand deposit in thesouthwestern portion of the caldera, the orientation ofthe barchan dunes, and the orientation of wind streaks tothe east of the caldera. The sand likely migrated across thecaldera floor, scouring loose sediment and leaving a surfaceof high thermal inertia.5.4.2. Ares Vallis[69] Another example of exposed bedrock detected by
THEMIS is in Ares Vallis, centered at 340�E, 7�N. Rogerset al. [2005] identified three materials (described here asmaterials A–C) in the upper Ares Vallis region based onthermophysical, topographic, morphologic, and composi-
tional evidence (Figure 12). The highest thermal inertiamaterial (A) is an olivine-rich cliff-forming material thatstands 10–250 m above the surrounding channel floor andtypically has either a pitted or scoured appearance. Rogerset al. [2005] derived an average thermal inertia of 755 forthis material using a thermal model provided by H. H.Kieffer, and interpreted this material to be in-place rockbecause of its sharp contacts, association with layeredchannel wall material, and little correlation with lowerthermal inertia areas which are presumably unconsolidatedaeolian material. Using the technique described here, thethermal inertia of this bedrock material is 950, higher thanthat derived by Rogers et al. [2005], and in agreement withthe material interpretation. The intermediate thermal inertiamaterial (B) primarily occurs in the channel floor, and isfound in the lowest albedo regions. Rogers et al. [2005]derived an average thermal inertia for material B of 570 to725, and interpreted it to be unconsolidated sand, a mixtureof sand and coarser materials, or sand overlaying higherthermal inertia bedrock material. We calculate the thermalinertia to be 550 to 820, in good agreement with the valuesderived by Rogers et al. [2005]. They derived an averagethermal inertia of 415 to 530 for layered wall materials (C);we calculate this material to have a thermal inertia of 440 to560, in agreement with values derived by Rogers et al.[2005].[70] The small differences between the thermal inertia
values reported by Rogers et al. [2005] and those calculatedhere is primarily the result of a different visible/9-mmextinction opacity ratio used in each analysis. Anotherdisparity is that we likely did not select exactly the samelocation as Rogers et al. [2005] when calculating thethermal inertia and may be incorporating slightly differentmaterial than was done in their study. However, the thermalinertia differences are not large enough to modify theinterpretation of the surface characteristics or the under-standing of geologic surfaces and processes.
6. Conclusions
[71] THEMIS infrared data have an improved spatialresolution (100 m per pixel) over previous data sets. Useof global thermal models to derive thermal inertia enablesthe quantification of surface physical characteristics todetermine particle size information and identify surfaceexposures of bedrock. This new data set provides animproved understanding of geologic processes that haveinfluenced the Martian surface. The overall accuracy ofTHEMIS thermal inertia is �20%. The precision of theTHEMIS thermal inertia values is 10–15%, and thusvariations within a single THEMIS image closely representdifferences in the physical properties of the surface.[72] Despite differences between the TES and THEMIS
data sets and the methods of deriving thermal inertia, thethermal inertia values are consistent with one another interms of interpreting the physical surface properties and thesurficial geology. THEMIS derived orbital thermal inertiavalues were compared to Mini-TES surface measurementswith an average discrepancy of 10%, and this consistencylends confidence in the thermal inertia values derived fromTHEMIS.
E12004 FERGASON ET AL.: THEMIS THERMAL INERTIA
19 of 22
E12004

[73] THEMIS thermal inertia enables an improved quan-tification of fine-scale surface detail observed in high-resolution THEMIS and MOC visible images, and alsohas near-global coverage at 100 m per pixel resolution.Dust surfaces, bed form material, interior layered deposits,and local outcrops of bedrock were studied to illustrate theimproved understanding of surfaces provided by THEMISthermal inertia data. In many cases, previously unknownstratigraphic relationships between thermal inertia and mor-phologic features were identified.[74] 1. Although variable surface textures and individual
lava flow fronts are observed in high-resolution visibleimages of Tharsis Montes, the thermal inertia at 100 mper pixel is uniform and indicates a layer of unconsolidated,likely air-fall dust that is a minimum of a few centimetersand up to 1–2 m thick. Individual features in visible imageshave no corresponding variation in the THEMIS thermalinertia images, indicating that the dust mantle is pervasive atTHEMIS scales. Dust may currently be depositing in thisregion, but likely some process is allowing for the removalof that dust so that over time there is a net balance of dustaccumulation and removal in this region.
[75] 2. Bed form material (centered at 63�E, 26.5�N) hasa thermal inertia ranging from 230 to 340, indicatingparticle diameters expected for aeolian bed forms on Mars.The low albedo and well-sorted nature of this material isconsistent with currently saltating material.[76] 3. In Hebes Chasma, high resolution thermal inertia
can distinguish variations in the physical nature of layersobserved in the interior plateau. The thermal inertia of thismaterial is too low to be consistent with bedrock or aneffusive lava flow, and thus a secondary emplacement ofvolcanic material or a volcanic ash deposit is a more likelymethod of formation.[77] 4. THEMIS thermal inertia enables the positive
identification of exposed bedrock on the surface of Mars.Outcrops of bedrock have been identified in both Nili Pateraand Ares Vallis. The thermal inertia boundaries correspondto distinct compositional and morphologic boundaries,suggesting that specific bedrock materials are exposed.The thermal inertia and morphology of adjacent terrainsuggest that these bedrock surfaces are exposed by winderosion and kept relatively free of dust and other unconsol-idated material by aeolian processes.
Figure 12. Ares Vallis. THEMIS thermal inertia mosaic (100 m per pixel resolution) overlaid onto aTHEMIS visible image mosaic (18 m per pixel resolution) of the upper region of Ares Vallis, centered at340�E, 7�N. Units A–C are discussed in the text.
E12004 FERGASON ET AL.: THEMIS THERMAL INERTIA
20 of 22
E12004

[78] Acknowledgments. Ken Tanaka and James Zimbelman providedhelpful reviews that improved this manuscript. Joshua Bandfield, DeanneRogers, and Mike Wyatt read early drafts of this work, and JoshuaBandfield provided discussions regarding the calibration of the THEMISinstrument and the interaction between the atmosphere and the surface.Christopher Edwards helped construct the table used to create the finalTHEMIS global thermal inertia map. Noel Gorelick, Christopher Edwards,and Keith Nowicki developed and continue to improve the THEMISmosaic software for both visible and infrared images, which enabled usto create the figures in this work. Ryan Luk created the first mosaic of thesand example. Saadat Anwar, Noel Gorelick, Dale Noss, and RandyKaelber provided computer programming assistance. We also wish to thankTHEMIS mission operations staff for collecting this data product, andacquiring images necessary to complete mosaics.
ReferencesArvidson, R. E. (1974), Wind-blown streaks, splotches, and associatedcraters on Mars: Statistical analysis of Mariner 9 photographs, Icarus,21, 12–27.
Arvidson, R. E., et al. (2006), Overview of the Spirit Mars Exploration RoverMission to Gusev Crater: Landing site to Backstay Rock in the ColumbiaHills, J. Geophys. Res., 111, E02S01, doi:10.1029/2005JE002499.
Bandfield, J. L. (2002), Global mineral distributions on Mars, J. Geophys.Res., 107(E6), 5042, doi:10.1029/2001JE001510.
Bandfield, J. L., D. Rogers, M. D. Smith, and P. R. Christensen (2004),Atmospheric correction and surface spectral unit mapping using ThermalEmission Imaging System data, J. Geophys. Res., 109, E10008,doi:10.1029/2004JE002289.
Bridges, N. T. (1994), Elevation-corrected thermal inertia and derived par-ticle size on Mars and implications for the Tharsis Montes, Geophys. Res.Lett., 21(9), 785–788.
Chapman, M. G., and K. L. Tanaka (2001), Interior trough deposits onMars: Subice volcanoes?, J. Geophys. Res., 106(E5), 10,087–10,100.
Christensen, P. R. (1982), Martian dust mantling and surface composition:Interpretation of thermophysical properties, J. Geophys. Res., 87(B12),9985–9998.
Christensen, P. R. (1986), Regional dust deposits on Mars: Physical proper-ties, age, and history, J. Geophys. Res., 91(B3), 3533–3545.
Christensen, P. R., and H. H. Kieffer (1979), Moderate resolution thermalmapping of Mars: The channel terrain around the Chryse Basin, J. Geo-phys. Res., 84(B14), 8233–8238.
Christensen, P. R., and H. J. Moore (1992), The Martian surface layer, inMars, edited by H. H. Kieffer, et al., pp. 686–729, Univ. of Ariz. Press,Tucson.
Christensen, P. R., et al. (1992), Thermal Emission Spectrometer experi-ment: Mars Observer Mission, J. Geophys. Res., 97(E5), 7719–7734.
Christensen, P. R., et al. (1998), Results from the Mars Global SurveyorThermal Emission Spectrometer, Science, 278, 1692–1698.
Christensen, P. R., et al. (2001), Mars Global Surveyor Thermal EmissionSpectrometer experiment: Investigation description and surface scienceresults, J. Geophys. Res., 106(E10), 23,823–23,871.
Christensen, P. R., et al. (2003a), Morphology and composition of the sur-face of Mars: Mars Odyssey THEMIS results, Science, 300, 2056–2061.
Christensen, P. R., et al. (2003b), Miniature Thermal Emission Spectro-meter for the Mars Exploration Rovers, J. Geophys. Res., 108(E12),8064, doi:10.1029/2003JE002117.
Christensen, P. R., et al. (2004), The Thermal Emission Imaging System(THEMIS) for the Mars 2001 Odyssey mission, Space Sci. Rev., 110,85–130.
Christensen, P. R., et al. (2005), Evidence for magmatic evolution anddiversity on Mars from infrared observations, Nature , 436 ,doi:10.1038/nature03639.
Clancy, R. T., S. W. Lee, G. R. Gladstone, W. W. McMillan, and T. Rousch(1995), A new model for Mars atmospheric dust based upon analysis ofultraviolet through infrared observations from Mariner 9, Viking, andPhobos, J. Geophys. Res., 100(E3), 5251–5263.
Clancy, R. T., B. J. Sandor, M. J. Wolff, P. R. Christensen, M. D. Smith,J. C. Pearl, B. J. Conrath, and R. J. Wilson (2000), An intercomparison ofground-based millimeter, MGS TES, and Viking atmospheric temperaturemeasurements: Seasonal and interannual variability of temperatures anddust loading in the global Mars atmosphere, J. Geophys. Res., 105(E4),9553–9571.
Edgett, K. S. (1997), Aeolian dunes as evidence for explosive volcanism inthe Tharsis Region of Mars, Icarus, 130, 96–114.
Edgett, K. S., and M. C. Malin (2000), New views of Mars eolian activity,materials, and surface properties: Three vignettes from the Mars GlobalSurveyor Mars Orbiter Camera, J. Geophys. Res., 105(E1), 1623–1650.
Edwards, C. S., J. L. Bandfield, P. R. Christensen, and R. L. Fergason(2005), Global distribution of bedrock on Mars using THEMIS high
resolution thermal inertia, Eos Trans. AGU, 86(52), Fall Meet. Suppl.,Abstract P21C-0158.
Fergason, R. L., P. R. Christensen, J. F. Bell III, M. P. Golombek, K. E.Herkenhoff, and H. H. Kieffer (2006), Physical properties of the MarsExploration Rover landing sites as inferred from Mini-TES derivedthermal inertia, J. Geophys. Res., 111, E02S21, doi:10.1029/2005JE002583.
Fisher, J. A., M. I. Richardson, C. E. Newman, M. A. Szwast, C. Graf,S. Basu, S. P. Ewald, A. D. Toigo, and R. J. Wilson (2005), A survey ofMartian dust devil activity using Mars Global Surveyor Mars OrbiterCamera images, J. Geophys. Res., 110, E03004, doi:10.1029/2003JE002165.
Fountain, J. A., and E. A. West (1970), Thermal conductivity of particulatebasalt as a function of density in simulated lunar and Martian environ-ments, J. Geophys. Res., 75(20), 4063–4069.
Geissler, P. E., R. B. Singer, and B. K. Lucchitta (1990), Dark materials inValles Marineris: Indications of the style of volcanism and magmatism onMars, J. Geophys. Res., 95(B9), 14,399–14,413.
Golombek, M. P., et al. (2005), Assessment of Mars Exploration Roverlanding site predictions, Nature, 436, doi:10.1038/nature03600.
Greeley, R., R. Leach, B. White, J. Iversen, and J. Pollack (1980), Thresh-old windspeeds for sand on Mars: Wind tunnel simulations, Geophys.Res. Lett., 7(2), 121–124.
Greeley, R., M. R. Balme, J. D. Iversen, S. Metzger, R. Mickelson,J. Phoreman, and B. White (2003), Martian dust devils: Laboratorysimulations of particle threshold, J. Geophys. Res., 108(E5), 5041,doi:10.1029/2002JE001987.
Greeley, R., et al. (2006), Gusev crater: Wind-related features and processesobserved by the Mars Exploration Rover Spirit, J. Geophys. Res., 111,E02S09, doi:10.1029/2005JE002491.
Haberle, R. M., and B. M. Jakosky (1991), Atmospheric effects onthe remote determination of thermal inertia on Mars, Icarus, 90, 187–204.
Hamilton, V. E., and P. R. Christensen (2005), Evidence for extensive,olivine-rich bedrock on Mars, Geology, 33(6), 433–436.
Hayashi, J. N., B. M. Jakosky, and R. M. Haberle (1995), Atmosphericeffects on the mapping of Martian thermal inertia and thermally derivedalbedo, J. Geophys. Res., 100(E3), 5277–5284.
Hynek, B. M. (2004), Implications for hydrologic processes on Mars fromextensive bedrock outcrops throughout Terra Meridiani, Nature, 431,doi:10.1038/nature02902.
Hynek, B. M., R. J. Phillips, and R. E. Arvidson (2003), Explosive volcan-ism in the Tharsis region: Global evidence in the Martian geologic record,J. Geophys. Res., 108(E9), 5111, doi:10.1029/2003JE002062.
Jakosky, B. M. (1986), On the thermal properties of Martian fines, Icarus,66, 117–124.
Jakosky, B. M., M. T. Mellon, H. H. Kieffer, P. R. Christensen, E. S.Varnes, and S. W. Lee (2000), The thermal inertia of Mars from the MarsGlobal Surveyor Thermal Emission Spectrometer, J. Geophys. Res.,105(E4), 9643–9652.
Kahle, A. B. (1980), Surface thermal properties, in Remote Sensing inGeology, edited by B. S. Siegal, and A. R. Gillespie, pp. 257–273, JohnWiley, Hoboken, N. J.
Kieffer, H. H., S. C. Chase Jr., E. Miner, G. Munch, and G. Neugebauer(1973), Preliminary report on infrared radiometric measurements fromthe Mariner 9 spacecraft, J. Geophys. Res., 78(20), 4291–4312.
Kieffer, H. H., T. Z. Martin, A. R. Peterfreund, B. M. Jakosky, E. D. Miner,and F. D. Palluconi (1977), Thermal and albedo mapping of Mars duringthe Viking primary mission, J. Geophys. Res., 82(28), 4249–4291.
Komatsu, G., P. E. Geissler, R. G. Strom, and R. B. Singer (1993), Strati-graphy and erosional landforms of layered deposits in Valles Marineris,Mars, J. Geophys. Res., 98(E6), 11,105–11,121.
Lucchitta, B. K. (1979), Landslides in Valles Marineris, Mars, J. Geophys.Res., 84(B14), 8097–8113.
Lucchitta, B. K. (1987), Recent mafic volcanism on Mars, Science, 235,565–567.
Lucchitta, B. K., N. K. Isbell, and A. Howington-Kraus (1994), Topogra-phy of Valles Marineris: Implications for erosional and structural history,J. Geophys. Res., 99(E2), 3783–3798.
Malin, M. C., and K. S. Edgett (2000), Sedimentary rocks of early Mars,Science, 290, 1927–1937.
Malin, M. C., and K. S. Edgett (2001), Mars Global Surveyor Mars OrbiterCamera: Interplanetary cruise through primary mission, J. Geophys. Res.,106(E10), 23,429–23,570.
Malin, M. C., G. E. Danielson, A. P. Ingersoll, H. Masursky, J. Veverka,M. A. Ravine, and T. A. Soulanille (1992), Mars Observer Camera,J. Geophys. Res., 97(E5), 7699–7718.
McEwen, A. S., M. C. Malin, M. H. Carr, and W. K. Hartmann (1999),Voluminous volcanism on early Mars revealed in Valles Marineris, Nat-ure, 397, 584–586.
E12004 FERGASON ET AL.: THEMIS THERMAL INERTIA
21 of 22
E12004

Mellon, M. T., B. M. Jakosky, H. H. Kieffer, and P. R. Christensen (2000),High- resolution thermal inertia mapping from the Mars Global SurveyorThermal Emission Spectrometer, Icarus, 148, 437–455.
Melosh, H. J. (1989), Impact Cratering: A Geologic Process, edited byH. Charnock, et al., 245 pp., Oxford Univ. Press, New York.
Nedell, S. S., S. W. Squyres, and D. W. Andersen (1987), Origin andevolution of the layered deposits in the Valles Marineris, Mars, Icarus,70, 409–441.
Neugebauer, G., G. Munch, H. Kieffer, S.C. Chase Jr., and E. Miner (1971),Mariner 1969 infrared radiometer results: Temperatures and thermalproperties of the Martian surface, Astron. J., 76(8), 719–728.
Palluconi, F. D., and H. H. Kieffer (1981), Thermal inertia mapping of Marsfrom 60�S to 60�N, Icarus, 45, 415–426.
Peterson, C. (1981), A secondary origin for the central plateau of HebesChasma, Proc. Lunar Planet. Sci. Conf., 12B, 1459–1471.
Pollack, J. B., D. S. Colburn, F. M. Flasar, R. Kahn, C. E. Carlston, andD. Pidek (1979), Properties and effects of dust particles suspended in theMartian atmosphere, J. Geophys. Res., 84(B6), 2929–2945.
Presley, M. A., and P. R. Christesen (1997a), Thermal conductivity mea-surements of particulate materials: 1. A review, J. Geophys. Res.,102(E3), 6535–6549.
Presley, M. A., and P. R. Christensen (1997b), Thermal conductivity mea-surements of particulate materials: 2. Results, J. Geophys. Res., 102(E3),6551–6566.
Presley, M. A., and P. R. Christensen (1997c), The effect of bulk densityand particle size sorting on the thermal conductivity of particulate mate-rials under Martian atmospheric pressures, J. Geophys. Res., 102(E4),9221–9229.
Putzig, N. E., M. T. Mellon, K. A. Kretke, and R. E. Arvidson (2005),Global thermal inertia and surface properties of Mars from the MGSmapping mission, Icarus, 173, 325–341.
Quantin, C., P. Allemand, N. Mangold, G. Dromart, and C. Delacourt(2005), Fluvial and lacustrine activity on layered deposits in MelasChasma, Valles Marineris, Mars, J. Geophys. Res., 110, E12S19,doi:10.1029/2005JE002440.
Rogers, A. D., J. L. Bandfield, and P. R. Christensen (2003), Global bed-rock composition mapping on Mars using THEMIS and TES data, LunarPlanet. Sci. [CD-ROM], XXXIV, abstract 2082.
Rogers, A. D., P. R. Christensen, and J. L. Bandfield (2005), Compositionalheterogeneity of the ancient Martian crust: Analysis of Ares Vallis bed-rock with THEMIS and TES data, J. Geophys. Res., 110, E05010,doi:10.1029/2005JE002399.
Ruff, S. W., and P. R. Christensen (2002), Bright and dark regions on Mars:Particle size and mineralogical characteristics based on Thermal EmissionSpectrometer data, J. Geophys. Res., 107(E12), 5127, doi:10.1029/2001JE001580.
Sagan, C., et al. (1972), Variable features on Mars: Preliminary Mariner 9Television results, Icarus, 17, 346–372.
Schultz, R. A. (2002), Stability of rock slopes in Valles Marineris, Mars,Geophys. Res. Lett., 29(19), 1932, doi:10.1029/2002GL015728.
Smith, D. E., and M. T. Zuber (1998), The relationship between MOLANorthern Hemisphere topography and the 6.1-mbar atmospheric pressuresurface of Mars, Geophys. Res. Lett., 25(24), 4397–4400.
Smith, D., et al. (1999), The global topography of Mars and implications forsurface evolution, Science, 284, 1495–1503.
Smith, D. E., et al. (2001), Mars Orbiter Laser Altimeter: Experimentsummary after the first year of global mapping of Mars, J. Geophys.Res., 106(E10), 23,689–23,722.
Smith, M. D., J. C. Pearl, B. J. Conrath, and P. R. Christensen (2000), MarsGlobal Surveyor Thermal Emission Spectrometer (TES) observations ofdust opacity during aerobreaking and science phasing, J. Geophys. Res.,105(E4), 9539–9552.
Smith, M. D., J. C. Pearl, B. J. Conrath, and P. R. Christensen (2001), OneMartian year of atmospheric observations by the Thermal Emission Spec-trometer, Geophys. Res. Lett., 28(22), 4263–4266.
Thomas, P., and P. J. Gierasch (1985), Dust devils on Mars, Science, 230,175–177.
Thomas, P., and J. Veverka (1979), Seasonal and secular variation of windstreaks on Mars: An analysis of Mariner 9 and Viking data, J. Geophys.Res., 84(B14), 8131–8146.
Thomas, P., J. Veverka, S. Lee, and A. Bloom (1981), Classification ofwind streaks on Mars, Icarus, 45, 124–153.
Veverka, J. (1975), Variable features on Mars V: Evidence for crater streaksproduced by wind erosion, Icarus, 25, 595–601.
Veverka, J., P. Thomas, and R. Greeley (1977), A study of variable featureson Mars during the Viking Primary Mission, J. Geophys. Res., 82(28),4167–4187.
Wechsler, A. E., and P. E. Glaser (1965), Pressure effects on postulatedlunar materials, Icarus, 4, 335–352.
Wechsler, A. E., P. E. Glaser, and J. A. Fountain (1972), Thermal propertiesof granulated materials, from Thermal Characteristics of the Moon, Prog.Astron. Aeronaut., vol. 28, edited by J. W. Lucas, pp. 215–241, MITPress, Cambridge, Mass.
Weitz, C. M., T. J. Parker, M. H. Bulmer, F. S. Anderson, and J. A. Grant(2003), Geology of the Melas Chasma landing site for the Mars Explora-tion Rover mission, J. Geophys. Res., 108(E12), 8082, doi:10.1029/2002JE002022.
Wentworth, C. K. (1922), A scale of grade and class terms for clasticsediments, J. Geol., 30, 377–392.
Wilson, S. A., and J. R. Zimbelman (2004), Latitude-dependent nature andphysical characteristics of transverse aeolian ridges on Mars, J. Geophys.Res., 109, E10003, doi:10.1029/2004JE002247.
Woodside, W., and J. H. Messmer (1961), Thermal conductivity of porousmedia: I. Unconsolidated sands, J. Appl. Phys., 32(9), 1688–1699.
Zimbelman, J. R. (2000), Non-active dunes in the Acheron Fossae region ofMars between the Viking and Mars Global Surveyor eras, Geophys. Res.Lett., 27(4), 1069–1072.
Zimbelman, J. R., and H. H. Kieffer (1979), Thermal mapping of the north-ern equatorial and temperate latitudes of Mars, J. Geophys. Res.,84(B14), 8239–8251.
Zimbelman, J. R., and L. A. Leshin (1987), A geologic evaluation ofthermal properties for the Elysium and Aeolis Quadrangles of Mars,J. Geophys. Res., 92(B4), suppl., E588–E596
Zuber, M. T., D. E. Smith, S. C. Solomon, D. O. Muhleman, J. W.Head, J. B. Garvin, J. B. Abshire, and J. L. Bufton (1992), The MarsObserver Laser Altimeter investigation, J. Geophys. Res., 97(E5),7781–7797.
�����������������������P. R. Christensen and R. L. Fergason, School of Earth and Space
Exploration, Mars Space Flight Facility, Arizona State University, Box876305, Tempe, AZ 85287–6305, USA. ([email protected])H. H. Kieffer, Celestial Reasonings, 2256 Christmas Tree Lane, Carson
City, NV 89703, USA.
E12004 FERGASON ET AL.: THEMIS THERMAL INERTIA
22 of 22
E12004