Predictive controllers for thermal comfort optimization and energy savings
Upload
khangminh22Category
view
0download
0
Thermal Comfort Monitoring and Measurement
2 th Module
MORE-CONNECT PROJECT HAS RECEIVED FUNDING FROM THE EUROPEAN UNION’S H2020 FRAMEWORK PROGRAMME FOR RESEARCH AND
INNOVATION UNDER GRANT AGREEMENT NO 633477.nTHE INFORMATION IN THIS PUBLICATION DOES NOT NECESSARILY REPRESENT THE VIEW OF
THE EUROPEAN COMMISSION.
© MORE-CONNECT
Manuela Almeida | Luis Bragança
Sandra Silva | Ricardo Mateus | Ricardo Barbosa
University of Minho
Portugal
Module overview
1. Thermal Comfort Fundamentals
2. Measurements and Models
3. Building regulations
4. Impact of renovation solutions

Prehistoric pile house**
Caves*
Source: *Wikipedia, **UNESCO, ***Wikipedia, ****Wikipedia
No matter how long ago, no matter how long after now, no
matter where, people create shelters so as to:
1. be protected by natural phenomena and
2. feel good = feel comfortable
Modern house***
Means may change, efficiency too, but end always remains
the same.
The international modular
space station****
1.Thermal Comfort Fundamentals
Introduction
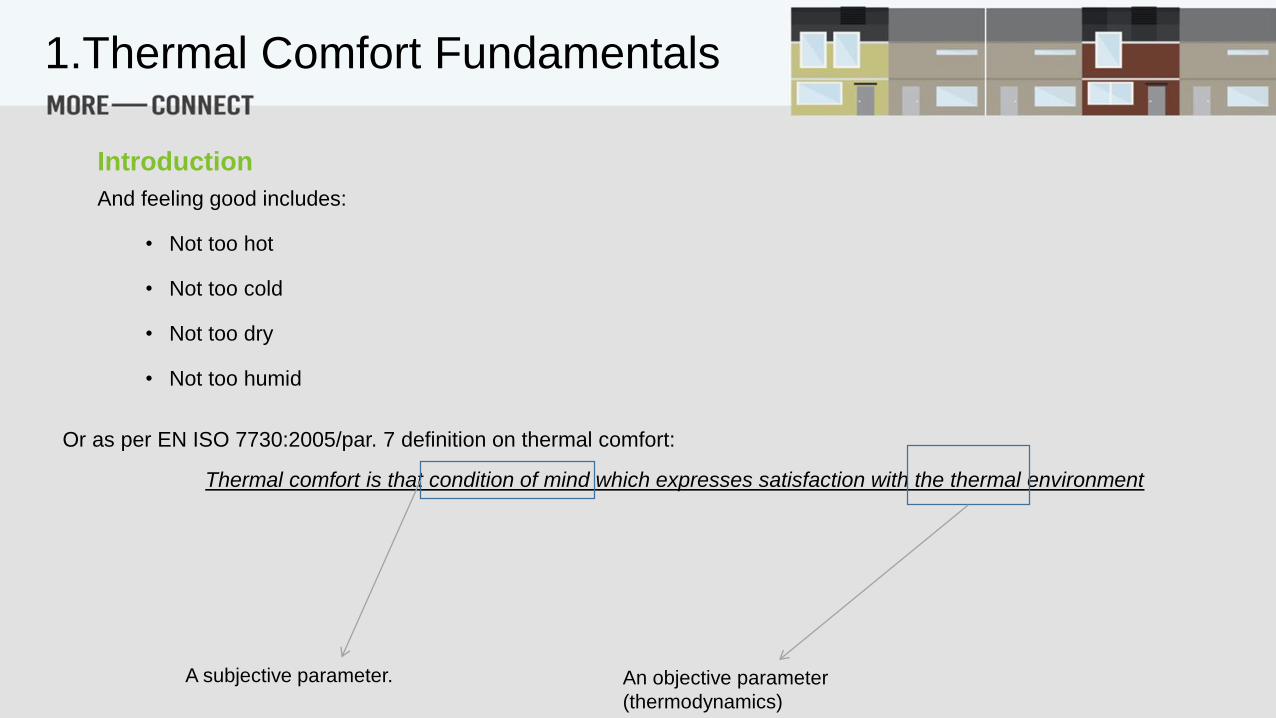
And feeling good includes:
• Not too hot
• Not too cold
• Not too dry
• Not too humid
1.Thermal Comfort Fundamentals
Or as per EN ISO 7730:2005/par. 7 definition on thermal comfort:
Thermal comfort is that condition of mind which expresses satisfaction with the thermal environment
A subjective parameter. An objective parameter
(thermodynamics)
Introduction
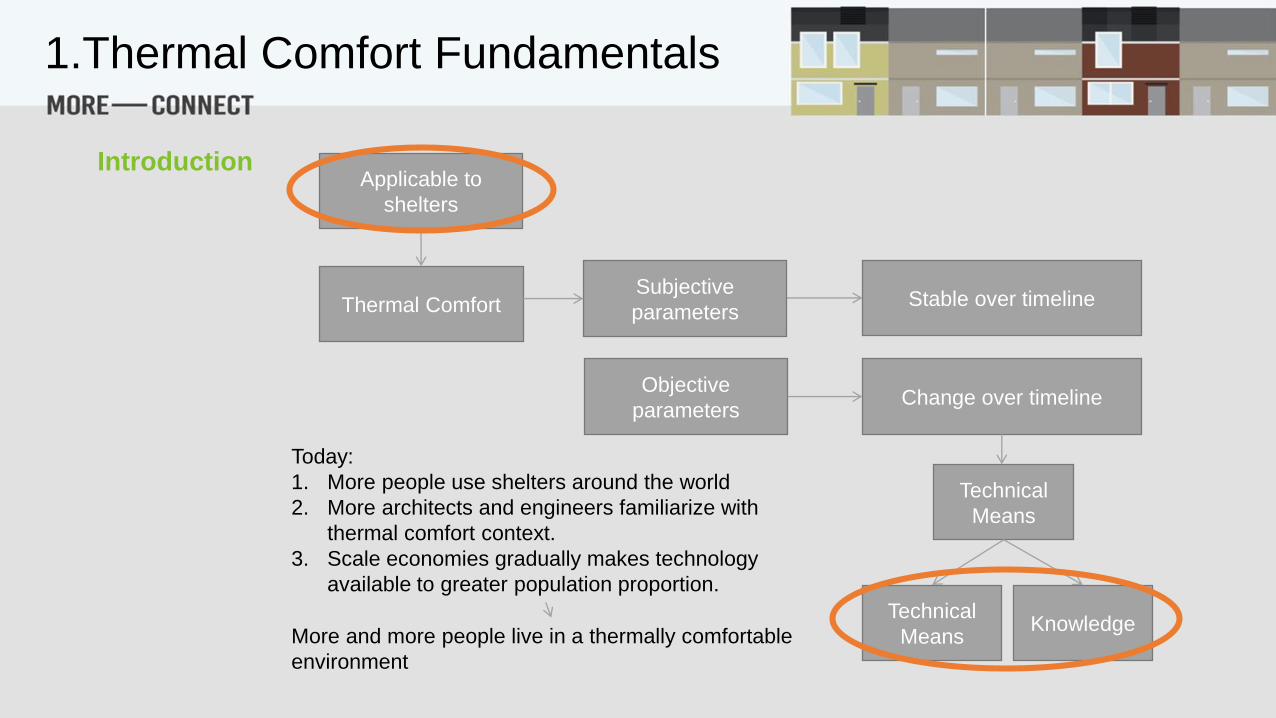
Thermal ComfortSubjective
parameters
Objective
parameters
Stable over timeline
Applicable to
shelters
Change over timeline
Technical
MeansKnowledge
Today:
1. More people use shelters around the world
2. More architects and engineers familiarize with
thermal comfort context.
3. Scale economies gradually makes technology
available to greater population proportion.
More and more people live in a thermally comfortable
environment
Technical
Means
1.Thermal Comfort Fundamentals
Introduction
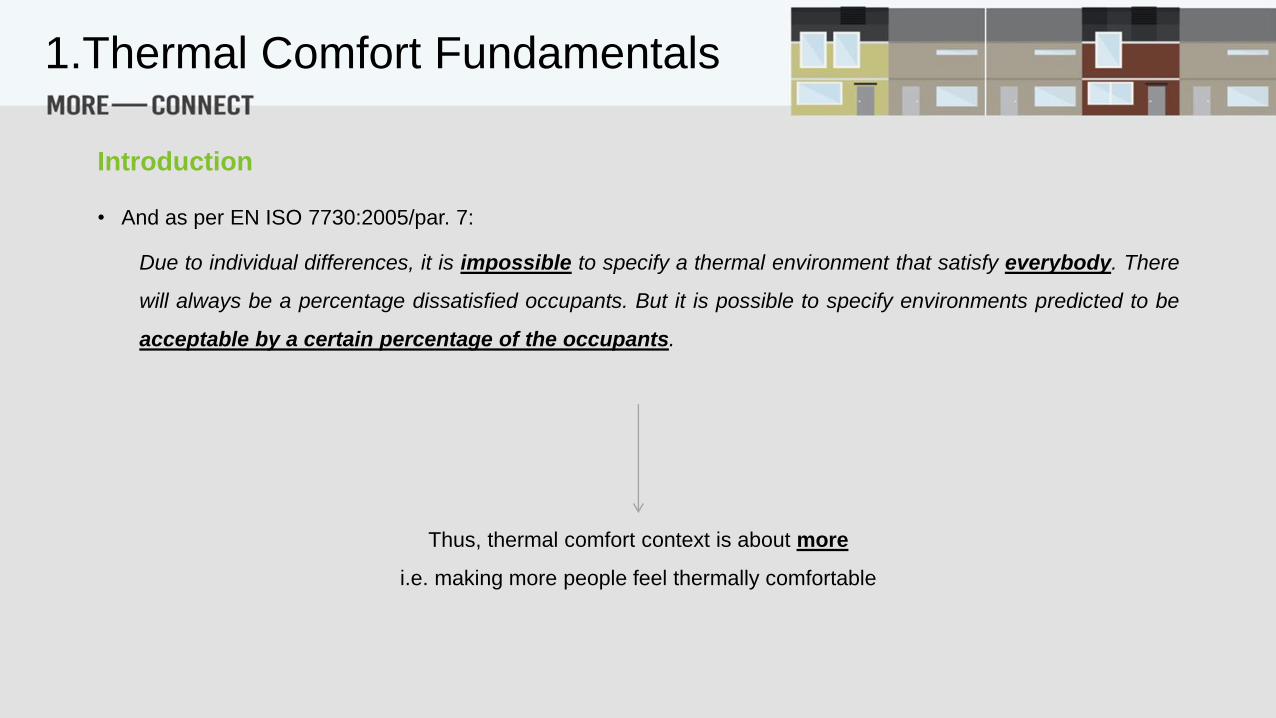
• And as per EN ISO 7730:2005/par. 7:
Due to individual differences, it is impossible to specify a thermal environment that satisfy everybody. There
will always be a percentage dissatisfied occupants. But it is possible to specify environments predicted to be
acceptable by a certain percentage of the occupants.
Thus, thermal comfort context is about more
i.e. making more people feel thermally comfortable
1.Thermal Comfort Fundamentals
Introduction

Comfort
• Is it about thermodynamics?
• How thermal comfort correlates to
human activity?
• How our body respond?
• What are the very factors affecting
thermal comfort?
1.Thermal Comfort Fundamentals
Introduction
Thermodynamics
• Thermodynamics is a branch of physics concerned with heat and temperature and their relation to energy
and work.
• It defines macroscopic variables, such as internal energy, entropy, and pressure, that partly describe a body of
matter or radiation.
• It states that the behavior of those variables is subject to general constraints, that are common to all
materials, not the peculiar properties of particular materials.
• These general constraints are expressed in the four laws of thermodynamics.
Source: Wikipedia
1.Thermal Comfort Fundamentals
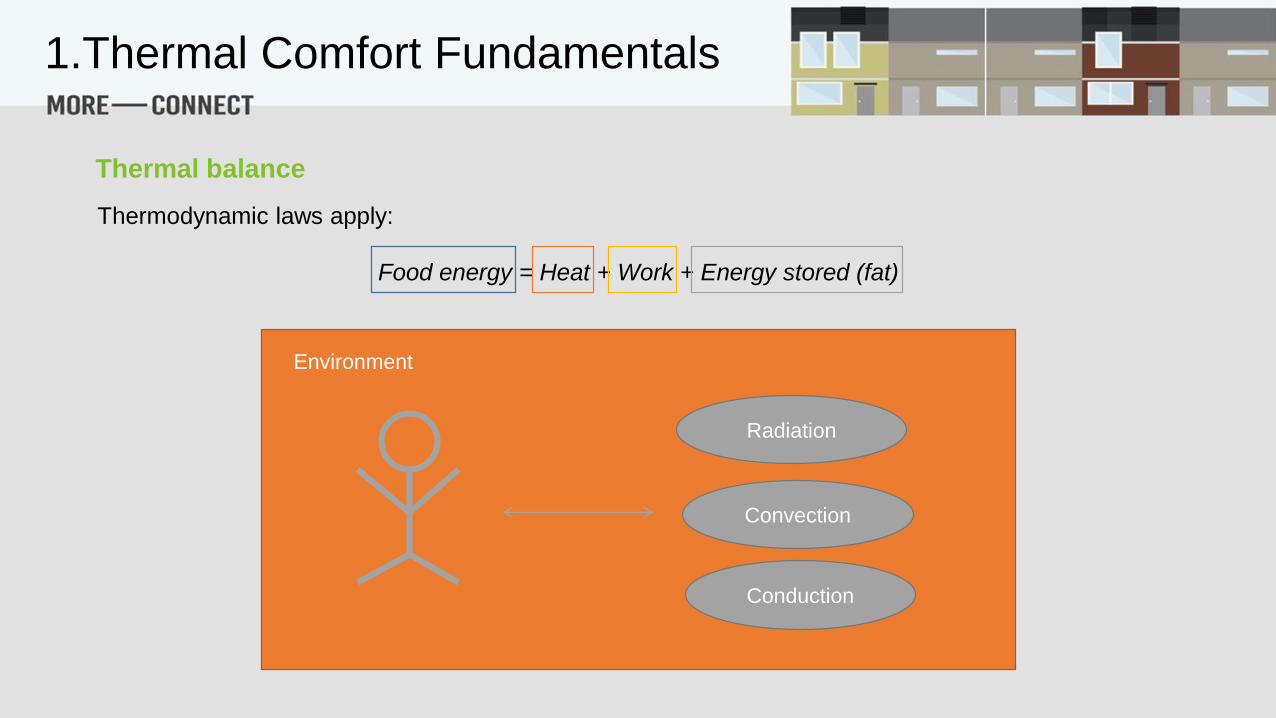
Thermal balance
Thermodynamic laws apply:
Food energy = Heat + Work + Energy stored (fat)
Radiation
Convection
Conduction
Environment
1.Thermal Comfort Fundamentals
What is heat?
• Heat is energy in transfer other than as work or by transfer of matter.
• When there is a suitable physical pathway, heat flows from a hotter body to a colder one.
• Heat refers to a process of transfer, not to a property of a system.
Source: Wikipedia
1.Thermal Comfort Fundamentals
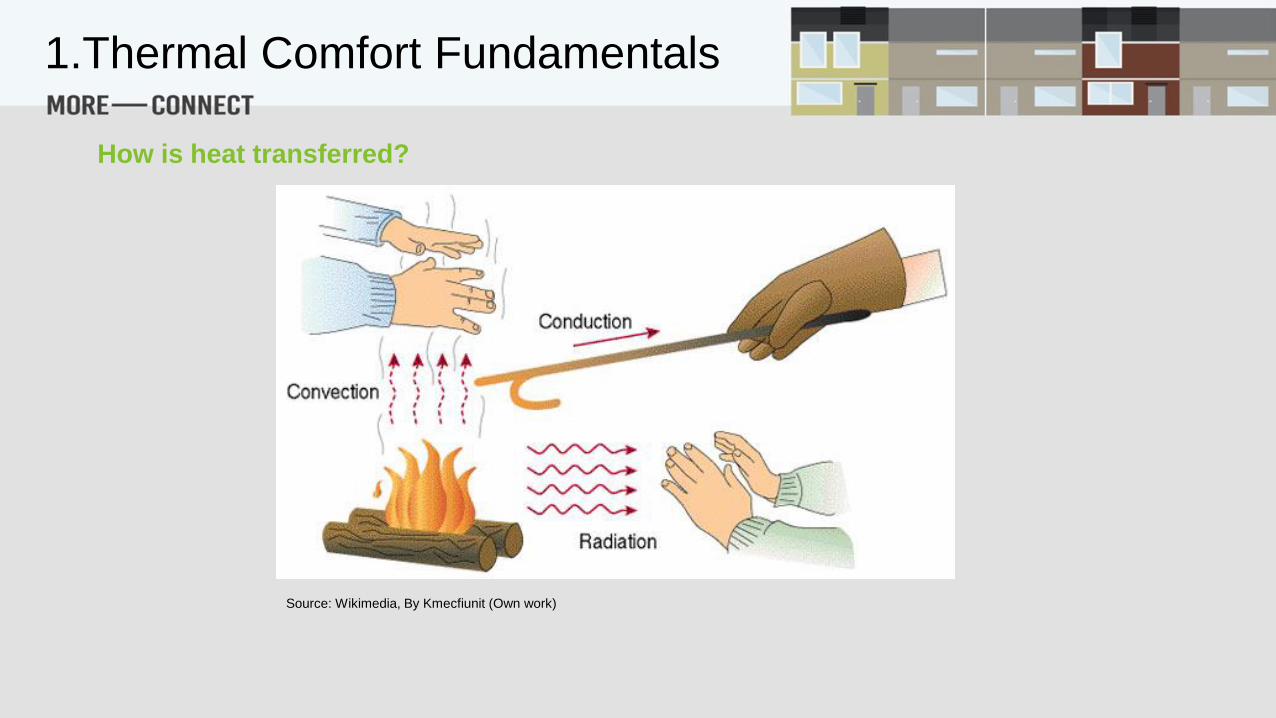
How is heat transferred?
Source: Wikimedia, By Kmecfiunit (Own work)
1.Thermal Comfort Fundamentals
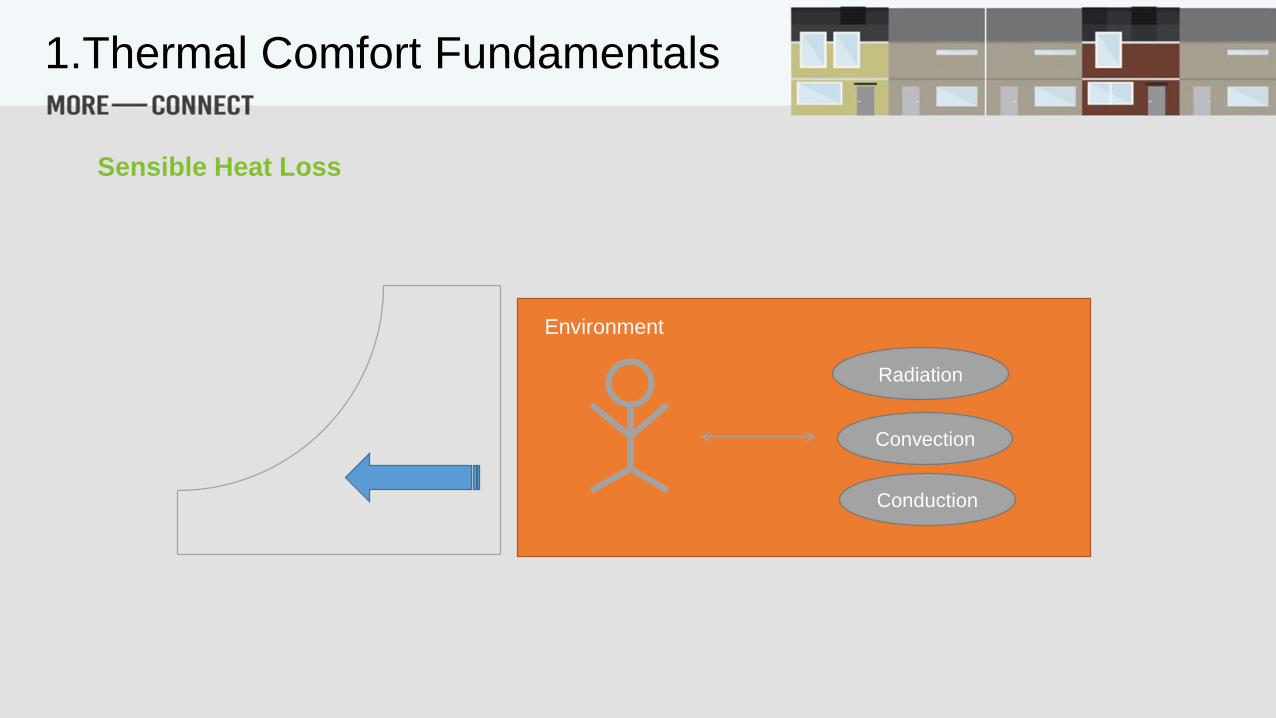
Radiation
Convection
Conduction
Environment
Sensible Heat Loss
1.Thermal Comfort Fundamentals

Evaporative heat loss
Convection
Environment
1.Thermal Comfort Fundamentals

• M = W+(R+C+K)+E+S
• M = metabolic rate
• W = external work
• R = radiant heat exchange
• C = convective heat exchange
• K = conductive heat exchange
• E = evaporative heat transfer
• S = Energy storage
1.Thermal Comfort Fundamentals
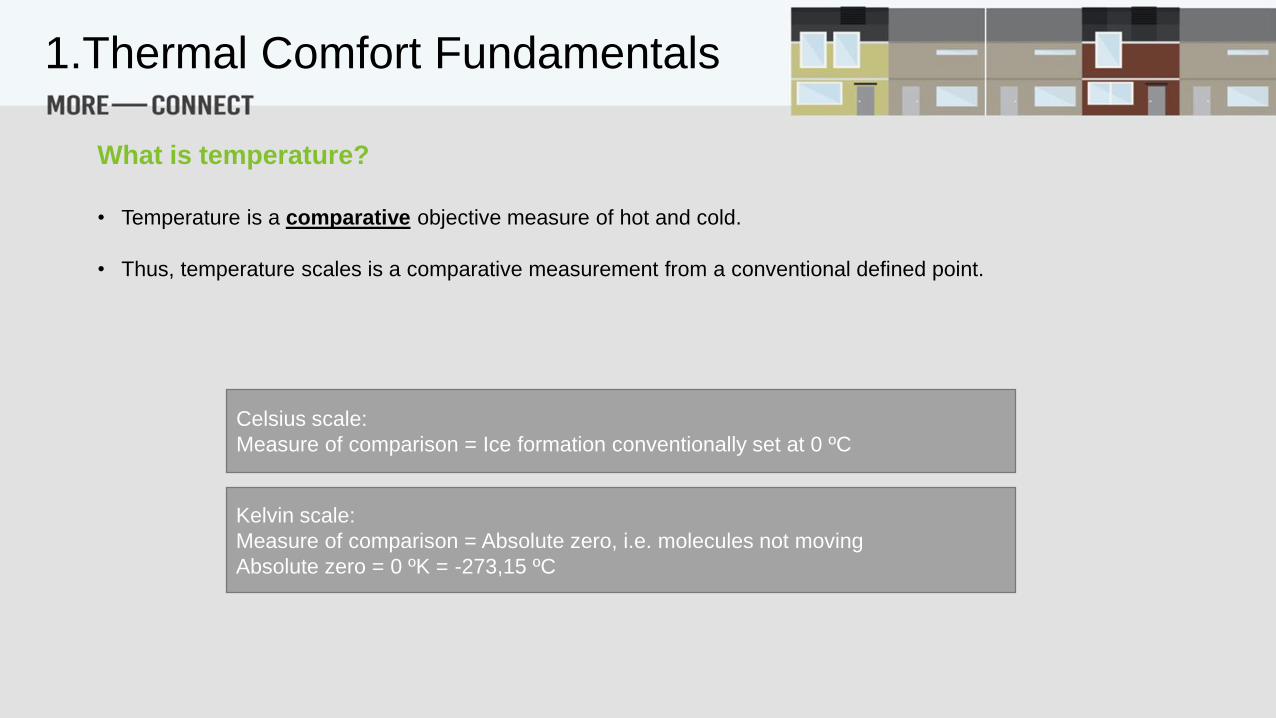
What is temperature?
• Temperature is a comparative objective measure of hot and cold.
• Thus, temperature scales is a comparative measurement from a conventional defined point.
Celsius scale:
Measure of comparison = Ice formation conventionally set at 0 ºC
Kelvin scale:
Measure of comparison = Absolute zero, i.e. molecules not moving
Absolute zero = 0 ºK = -273,15 ºC
1.Thermal Comfort Fundamentals
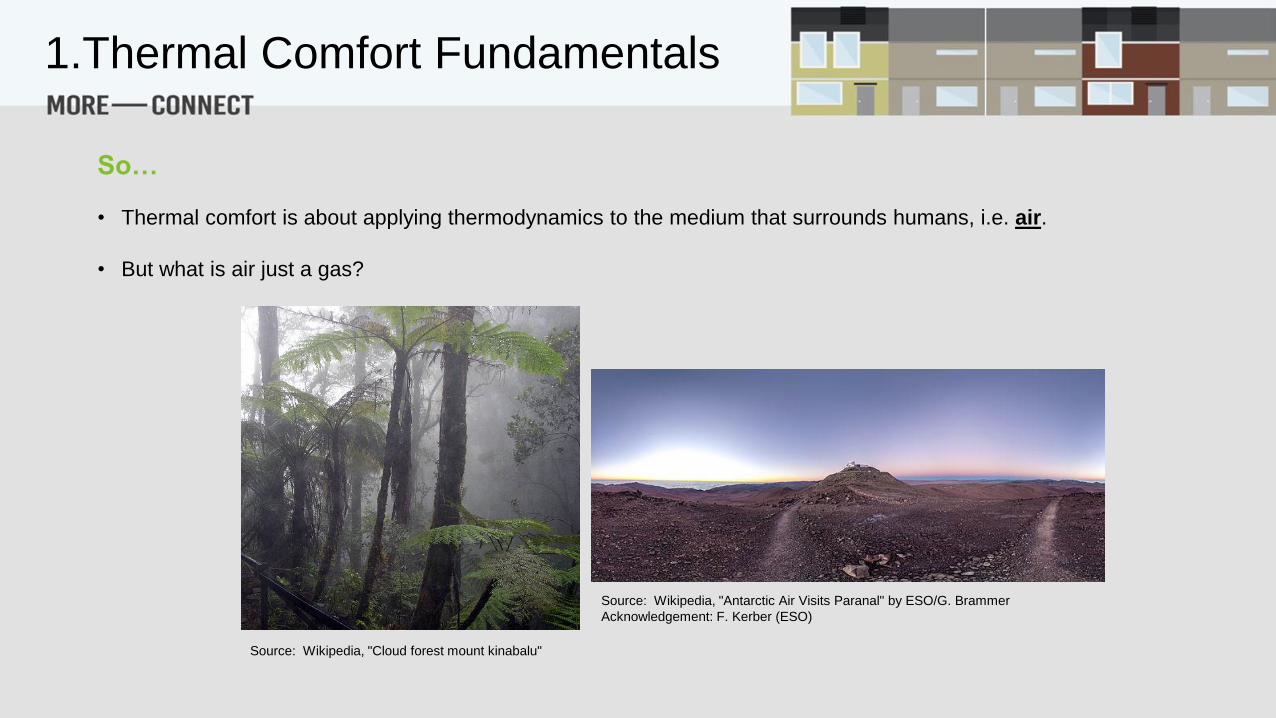
So…
• Thermal comfort is about applying thermodynamics to the medium that surrounds humans, i.e. air.
• But what is air just a gas?
Source: Wikipedia, "Cloud forest mount kinabalu"
Source: Wikipedia, "Antarctic Air Visits Paranal" by ESO/G. Brammer
Acknowledgement: F. Kerber (ESO)
1.Thermal Comfort Fundamentals
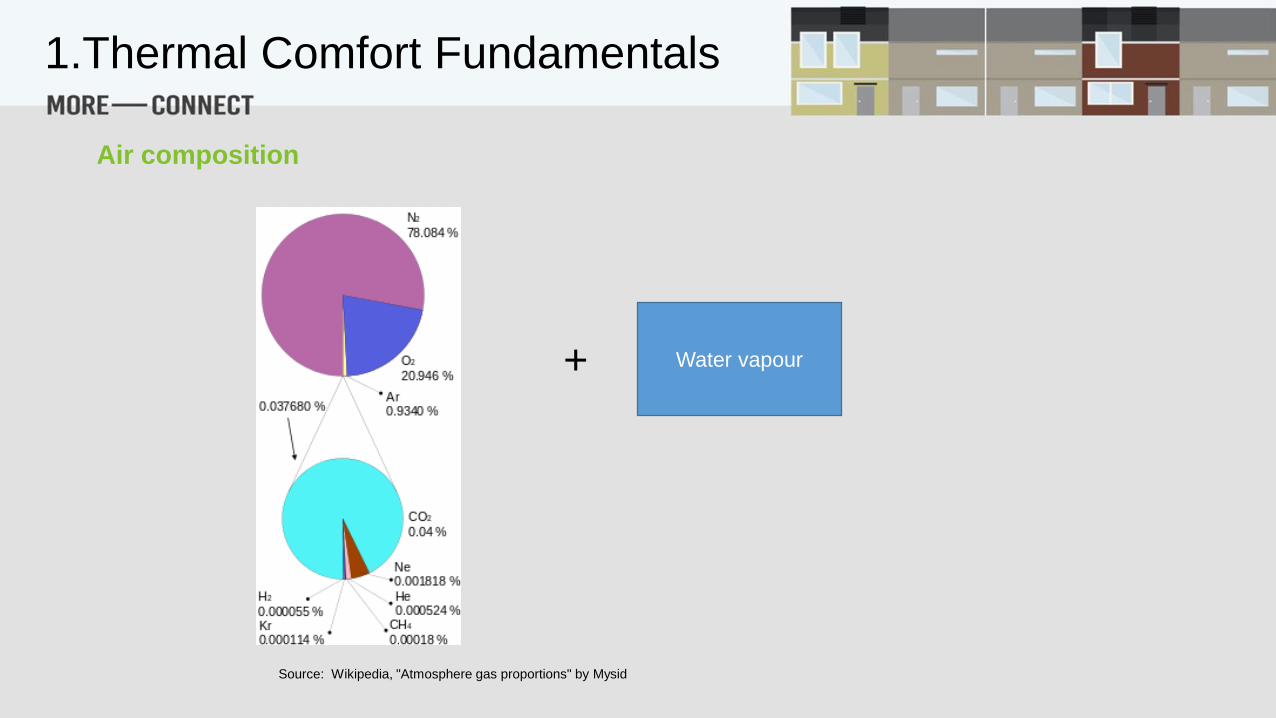
Air composition
+
Source: Wikipedia, "Atmosphere gas proportions" by Mysid
Water vapour
1.Thermal Comfort Fundamentals

Psychrometrics
Psychrometrics or psychrometry or hygrometry are terms used to describe the field of engineering concerned with
the determination of physical and thermodynamic properties of gas-vapor mixtures. The term derives from the
Greek psychron (ψυχρόν) meaning "cold“ and metron (μέτρον) meaning "means of measurement"
Source: Wikipedia
1.Thermal Comfort Fundamentals

Basic terms of psychrometry
• Humidity is the amount of water vapor in the air.
• Relative humidity or RH (φ) is the ratio of the partial pressure of water vapor to the equilibrium vapor pressure
of water at the same temperature.
• Absolute humidity is the mass of water vapor per unit volume of air containing the water vapor.
• Dry-bulb temperature (DBT) is the temperature of air measured by a thermometer freely exposed to the air but
shielded from radiation and moisture.
• Wet-bulb temperature is the temperature a parcel of air would have if it were cooled to saturation (100%
relative humidity) by the evaporation of water into it.
• Dew point or saturation temperature is the temperature at which the water vapor in a sample of air at
constant barometric pressure condenses into liquid water at the same rate at which it evaporates.
1.Thermal Comfort Fundamentals

Basic terms of psychrometry
• Sensible heat is the heat that changes the temperature of a substance when added to or abstracted from it.
• Latent heat is the heat that does not affect the temperature but changes the state of substance when added to
or abstracted from it.
• Enthalpy (h) is the combination energy which represents the sum of internal and flow energy in a steady flow
process. It is determined from an arbitrary datum point for the air mixture and is expressed as kJ per kg of dry
air.
1.Thermal Comfort Fundamentals

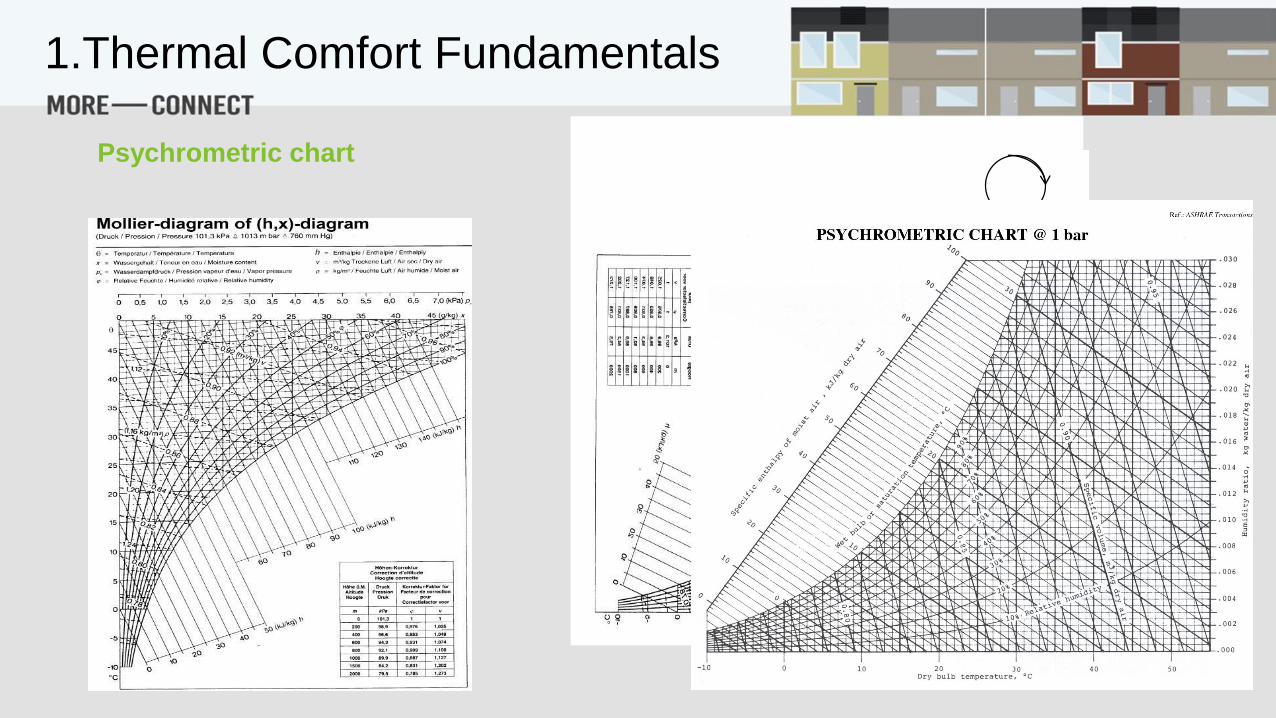
Psychrometric chart
Dry Bulb Temperature
Specific
hum
idity
Relative
humidity lines
1.Thermal Comfort Fundamentals
Psychrometric chart Flip
1.Thermal Comfort Fundamentals

Psychometric chart
Dry Bulb Temperature
Specific
hum
idity
Humidification
Dehumidification
Cooling Heating
1.Thermal Comfort Fundamentals

Mixing
𝑚3,𝑊3, ℎ3
𝑚1
𝑚2=𝑊3 −𝑊2
𝑊1 −𝑊3=ℎ3 − ℎ2ℎ1 − ℎ3
1
3
2
W1
W3
W2
t2 t3 t1
h2
h3
h1
1.Thermal Comfort Fundamentals
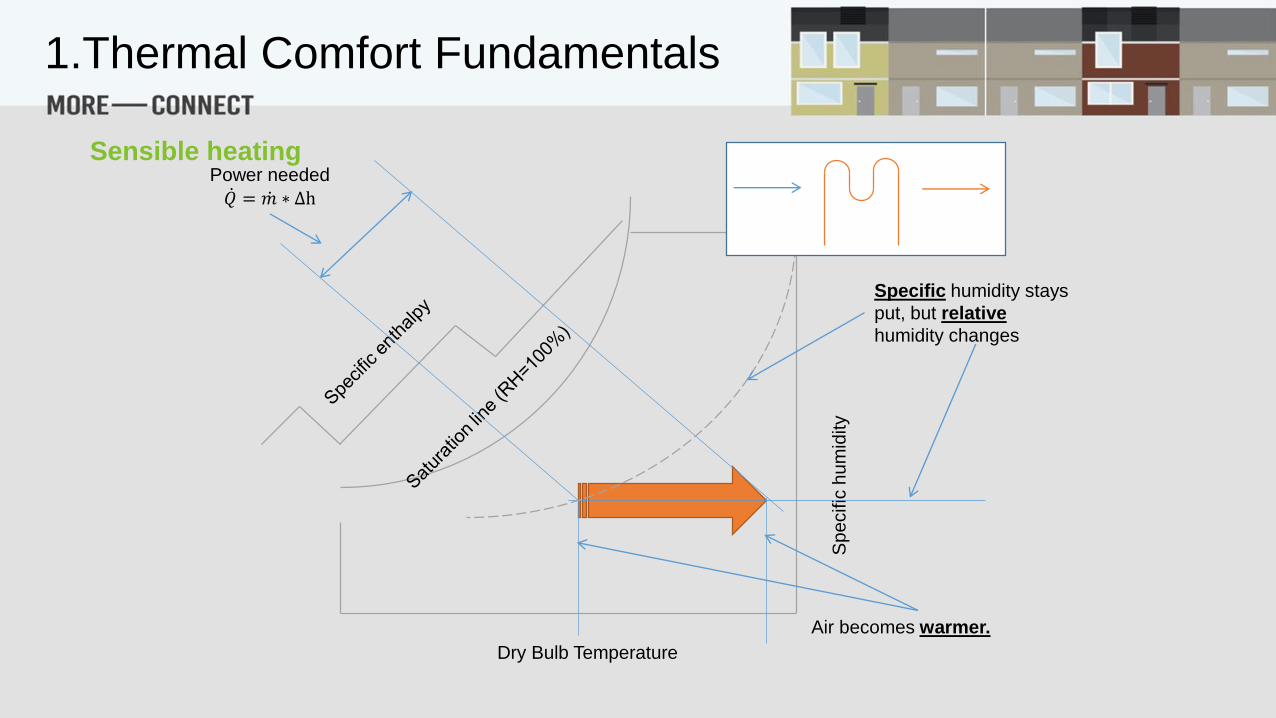
Sensible heating
Dry Bulb Temperature
Specific
hum
idity
Specific humidity stays
put, but relative
humidity changes
Power needed 𝑄 = 𝑚 ∗ Δh
Air becomes warmer.
1.Thermal Comfort Fundamentals

Sensible cooling
Dry Bulb Temperature
Specific
hum
idity
Specific humidity stays
put, but relative
humidity changes
Power needed 𝑄 = 𝑚 ∗ Δh
Air becomes cooler.
t>dp
1.Thermal Comfort Fundamentals
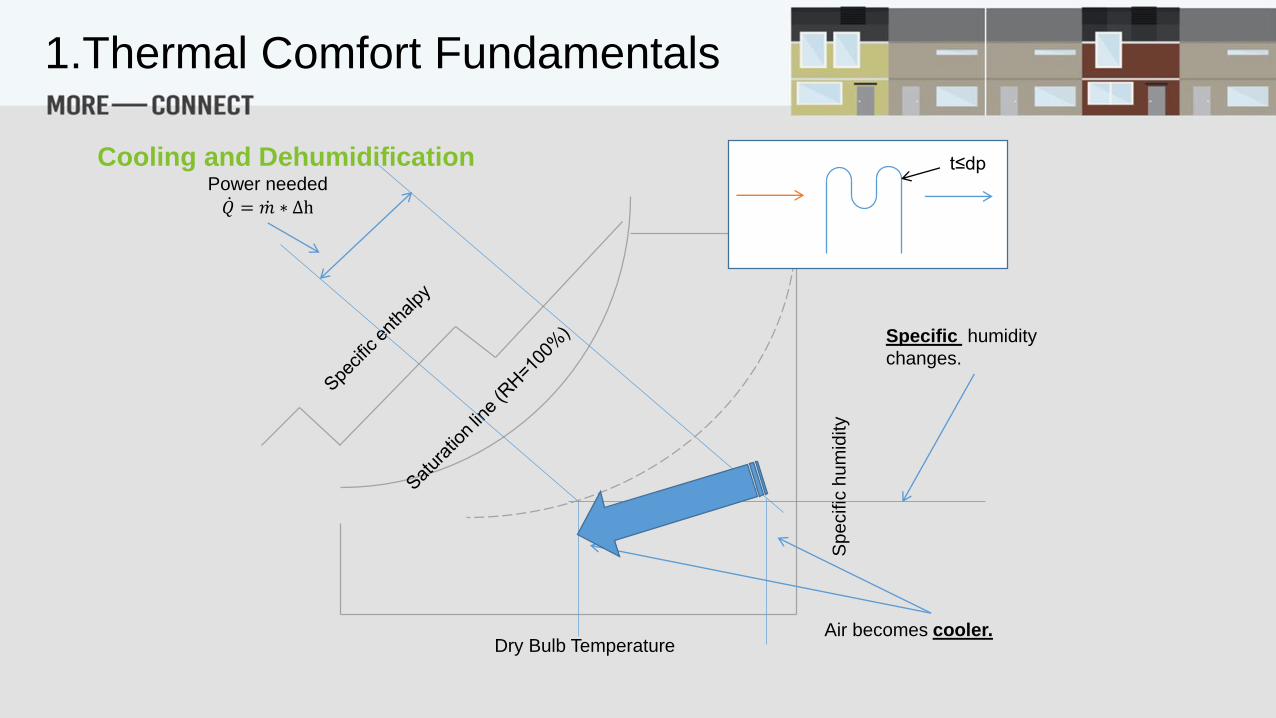
Cooling and Dehumidification
Dry Bulb Temperature
Specific
hum
idity
Specific humidity
changes.
Power needed 𝑄 = 𝑚 ∗ Δh
Air becomes cooler.
t≤dp
1.Thermal Comfort Fundamentals
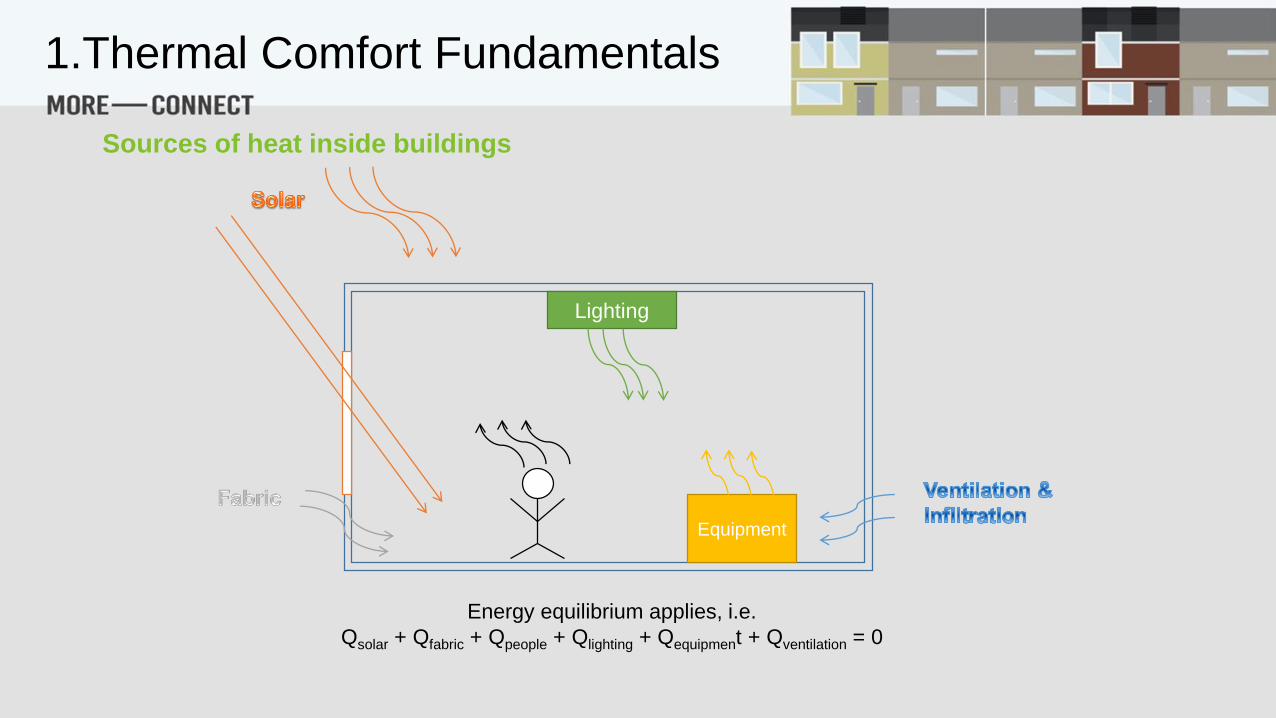
Sources of heat inside buildings
Lighting
Equipment
Energy equilibrium applies, i.e.
Qsolar + Qfabric + Qpeople + Qlighting + Qequipment + Qventilation = 0
1.Thermal Comfort Fundamentals
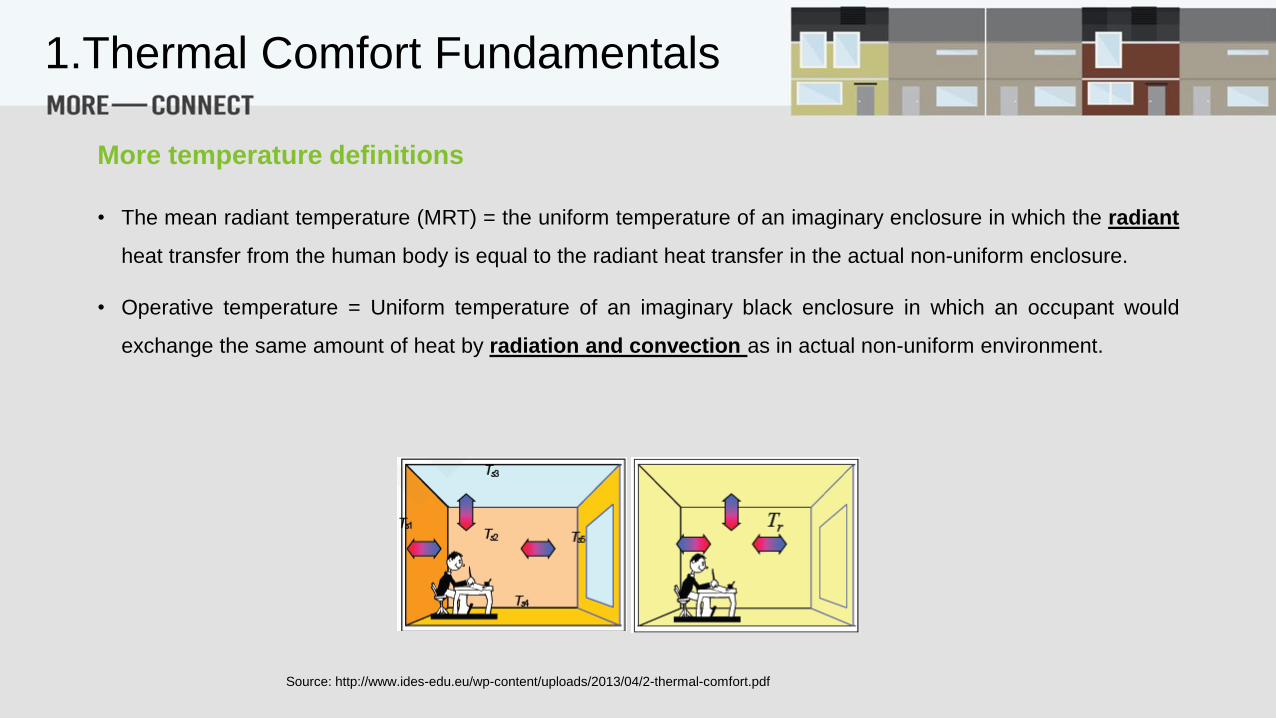
More temperature definitions
• The mean radiant temperature (MRT) = the uniform temperature of an imaginary enclosure in which the radiant
heat transfer from the human body is equal to the radiant heat transfer in the actual non-uniform enclosure.
• Operative temperature = Uniform temperature of an imaginary black enclosure in which an occupant would
exchange the same amount of heat by radiation and convection as in actual non-uniform environment.
Source: http://www.ides-edu.eu/wp-content/uploads/2013/04/2-thermal-comfort.pdf
1.Thermal Comfort Fundamentals
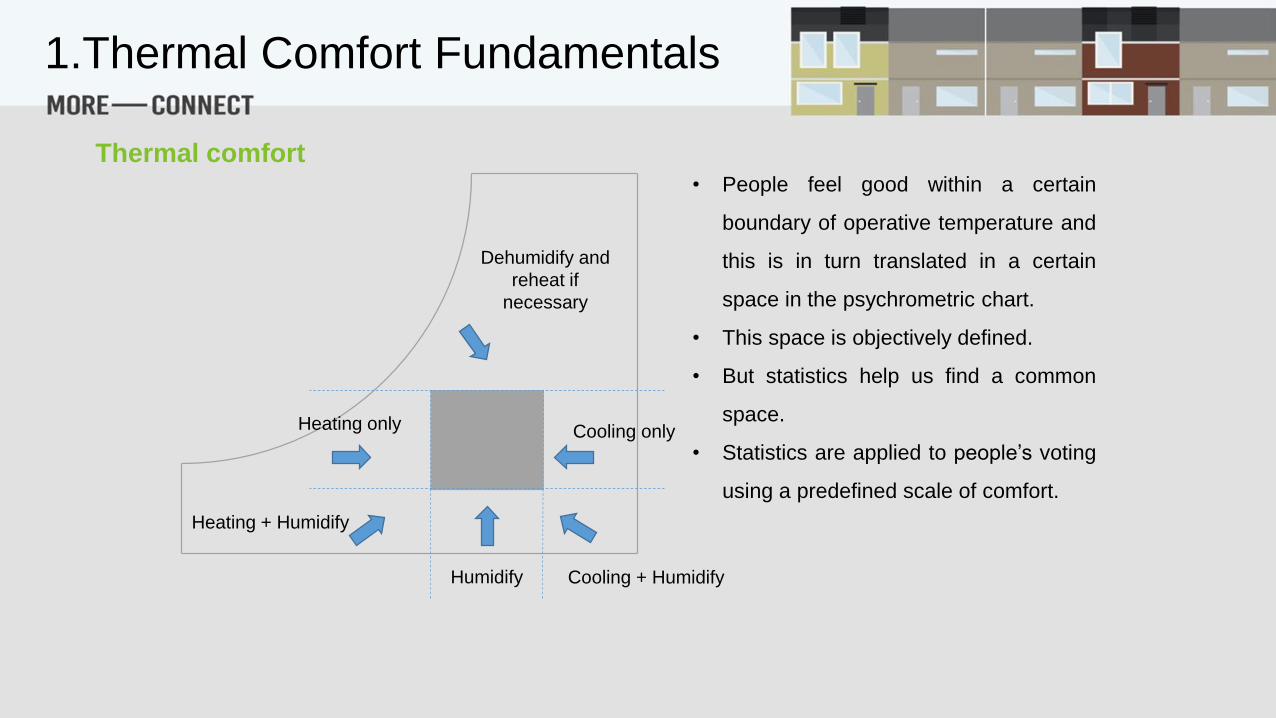
Thermal comfort• People feel good within a certain
boundary of operative temperature and
this is in turn translated in a certain
space in the psychrometric chart.
• This space is objectively defined.
• But statistics help us find a common
space.
• Statistics are applied to people’s voting
using a predefined scale of comfort.
Heating only Cooling only
Heating + Humidify
Cooling + HumidifyHumidify
Dehumidify and
reheat if
necessary
1.Thermal Comfort Fundamentals

Thermoregulatory system
• Humans are endothermic organizations, i.e. heat needed for vital needs stems from metabolic functions
• Humans are homeothermic organizations(or warm-blooded), i.e. body temperature is kept within certain bounds
• Human body uses homeostasis (i.e. preservation of relatively constant conditions), a highly complex control
system which takes place in the brain area called hypothalamus
1.Thermal Comfort Fundamentals
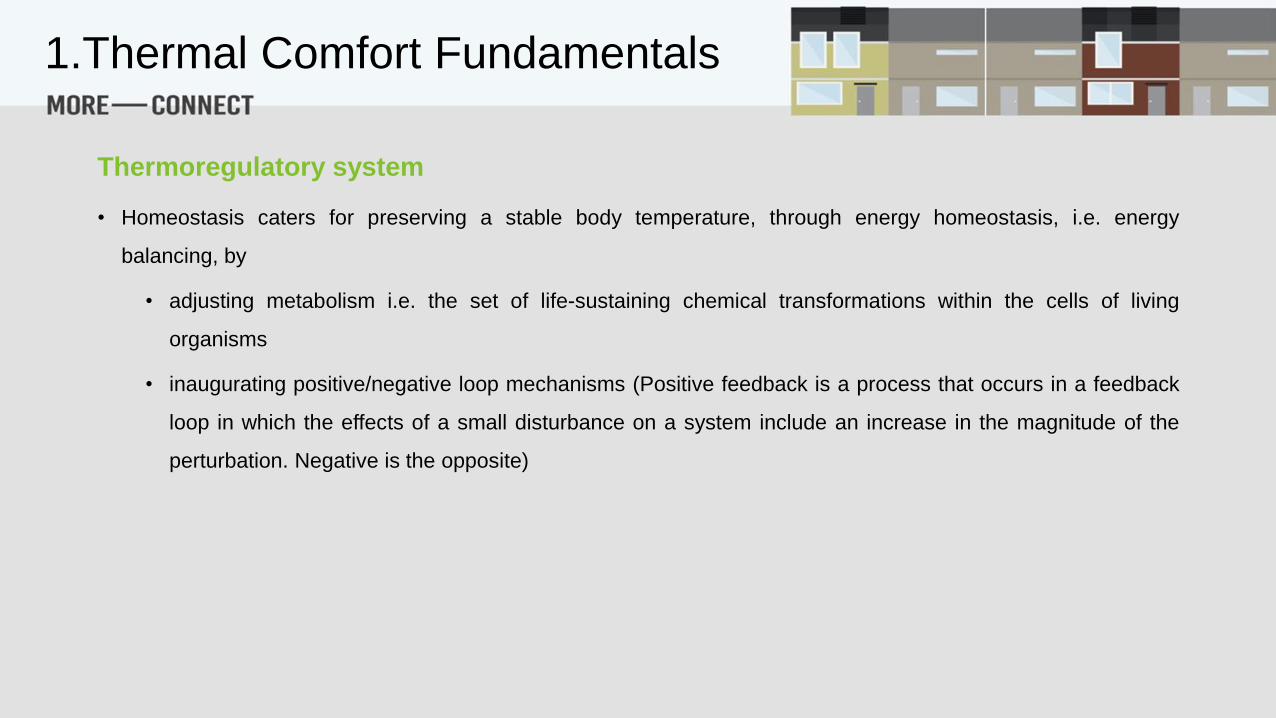
• Homeostasis caters for preserving a stable body temperature, through energy homeostasis, i.e. energy
balancing, by
• adjusting metabolism i.e. the set of life-sustaining chemical transformations within the cells of living
organisms
• inaugurating positive/negative loop mechanisms (Positive feedback is a process that occurs in a feedback
loop in which the effects of a small disturbance on a system include an increase in the magnitude of the
perturbation. Negative is the opposite)
1.Thermal Comfort Fundamentals
Thermoregulatory system
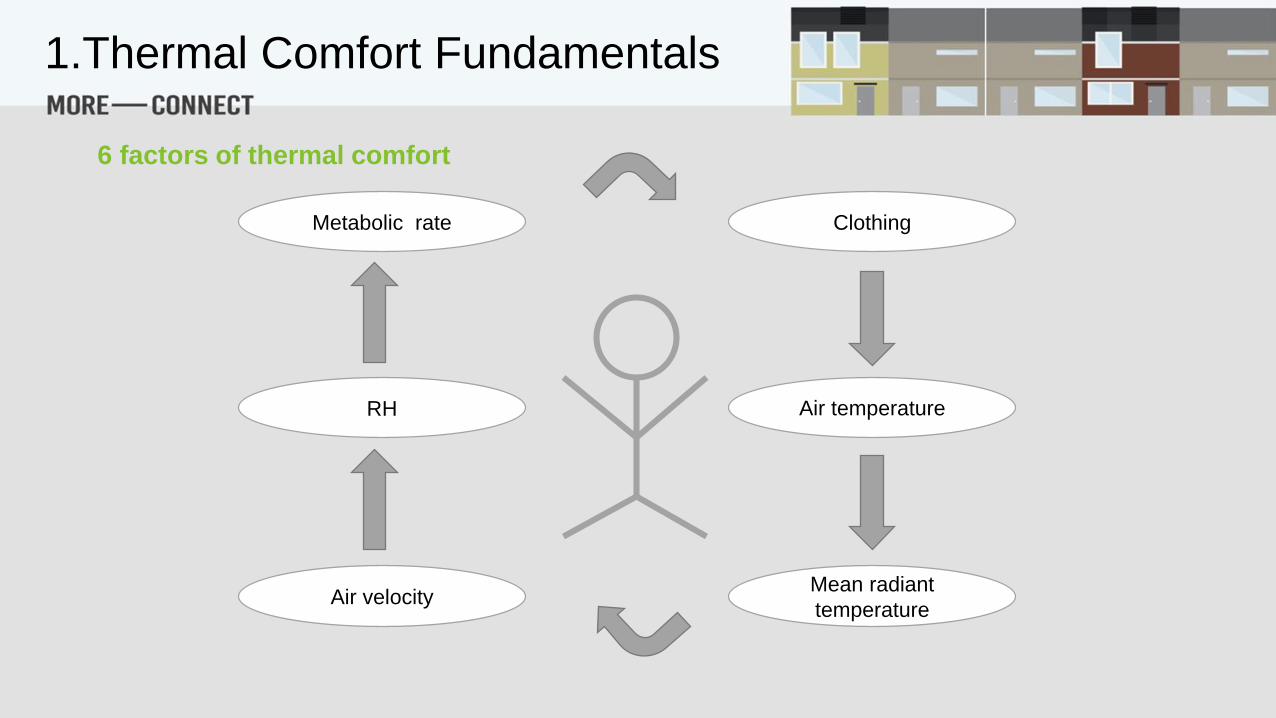
6 factors of thermal comfort
Metabolic rate Clothing
Air velocity
RH Air temperature
Mean radiant
temperature
1.Thermal Comfort Fundamentals

Metabolic rate
• Increased work leads to increased heat production → type of activity influences heat produced by the human
body and is proportional to heart rate
• Metabolic rate = Energy/time = power
• Expressed as W/m2, i.e. power per surface area of the body (as per EN ISO 8996 “average” individual is 30
years-old, 70kg weight man of 1,8m2 and 60 kg weight woman of 1,6m2)
• Additional unit used met = 58,15 W/m2
1.Thermal Comfort Fundamentals
Metabolic rate
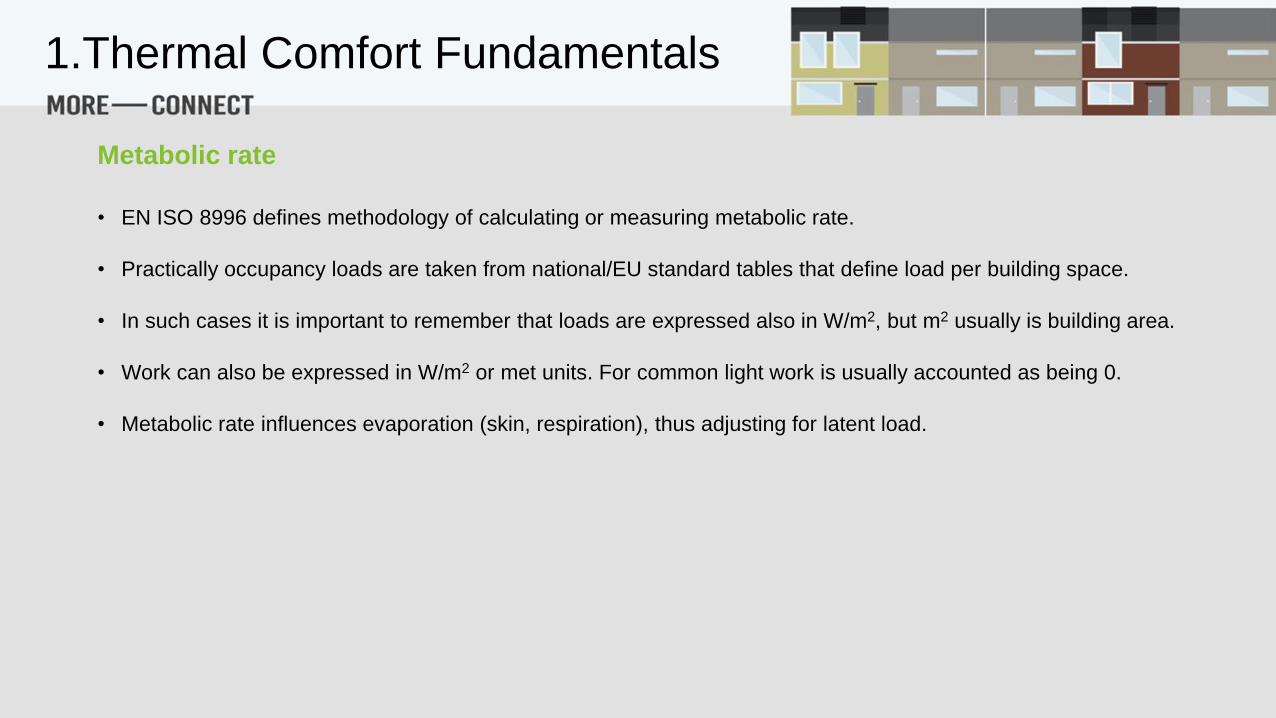
• EN ISO 8996 defines methodology of calculating or measuring metabolic rate.
• Practically occupancy loads are taken from national/EU standard tables that define load per building space.
• In such cases it is important to remember that loads are expressed also in W/m2, but m2 usually is building area.
• Work can also be expressed in W/m2 or met units. For common light work is usually accounted as being 0.
• Metabolic rate influences evaporation (skin, respiration), thus adjusting for latent load.
1.Thermal Comfort Fundamentals
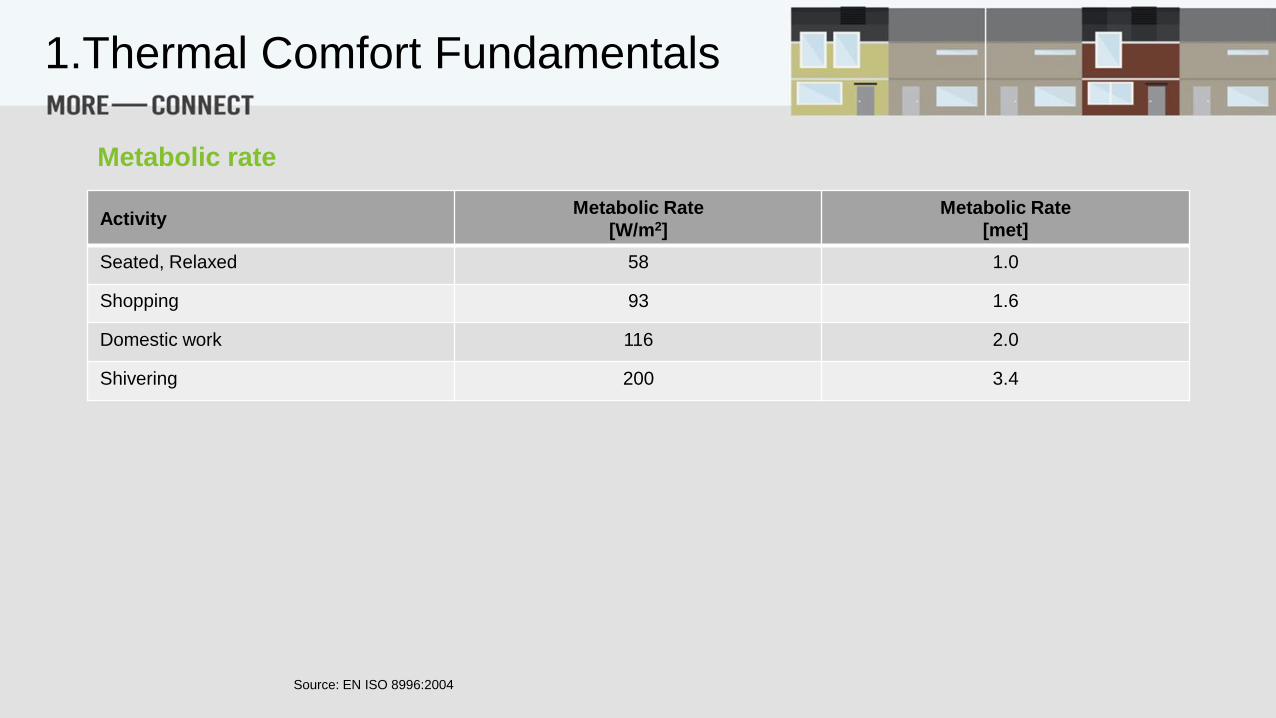
Metabolic rate
ActivityMetabolic Rate
[W/m2]
Metabolic Rate
[met]
Seated, Relaxed 58 1.0
Shopping 93 1.6
Domestic work 116 2.0
Shivering 200 3.4
Source: EN ISO 8996:2004
1.Thermal Comfort Fundamentals
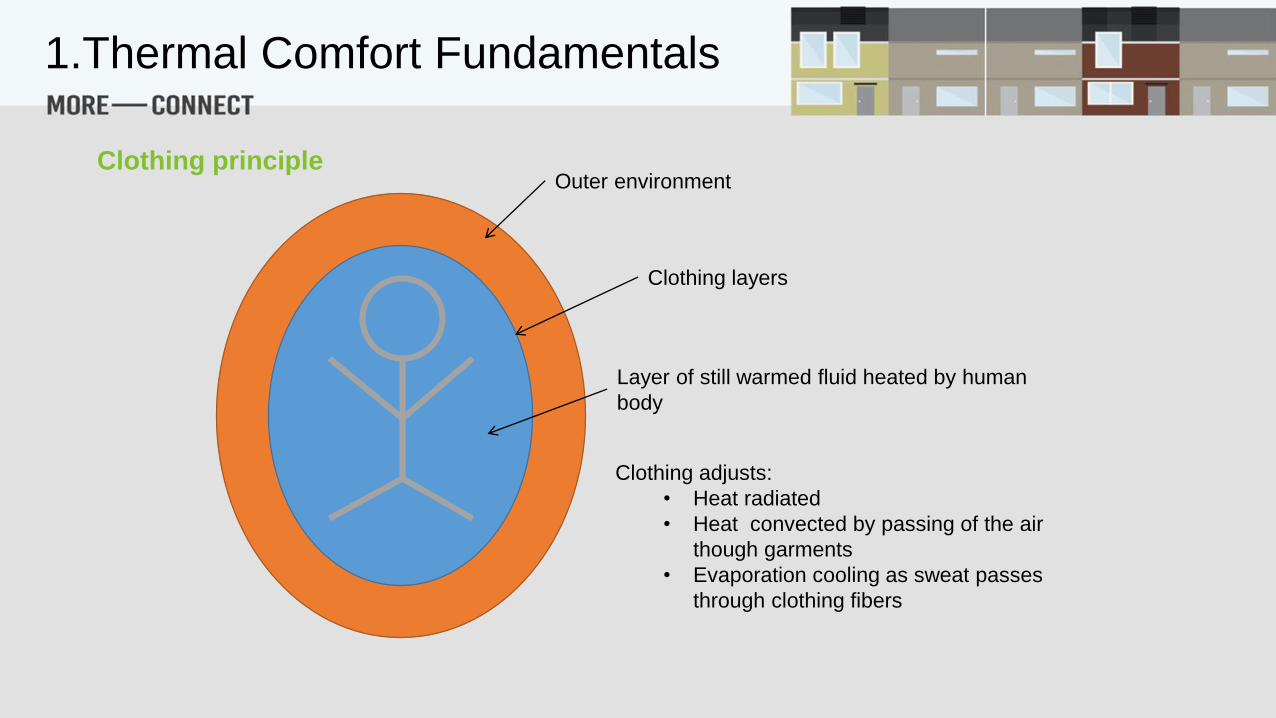
Clothing principleOuter environment
Layer of still warmed fluid heated by human
body
Clothing layers
Clothing adjusts:
• Heat radiated
• Heat convected by passing of the air
though garments
• Evaporation cooling as sweat passes
through clothing fibers
1.Thermal Comfort Fundamentals
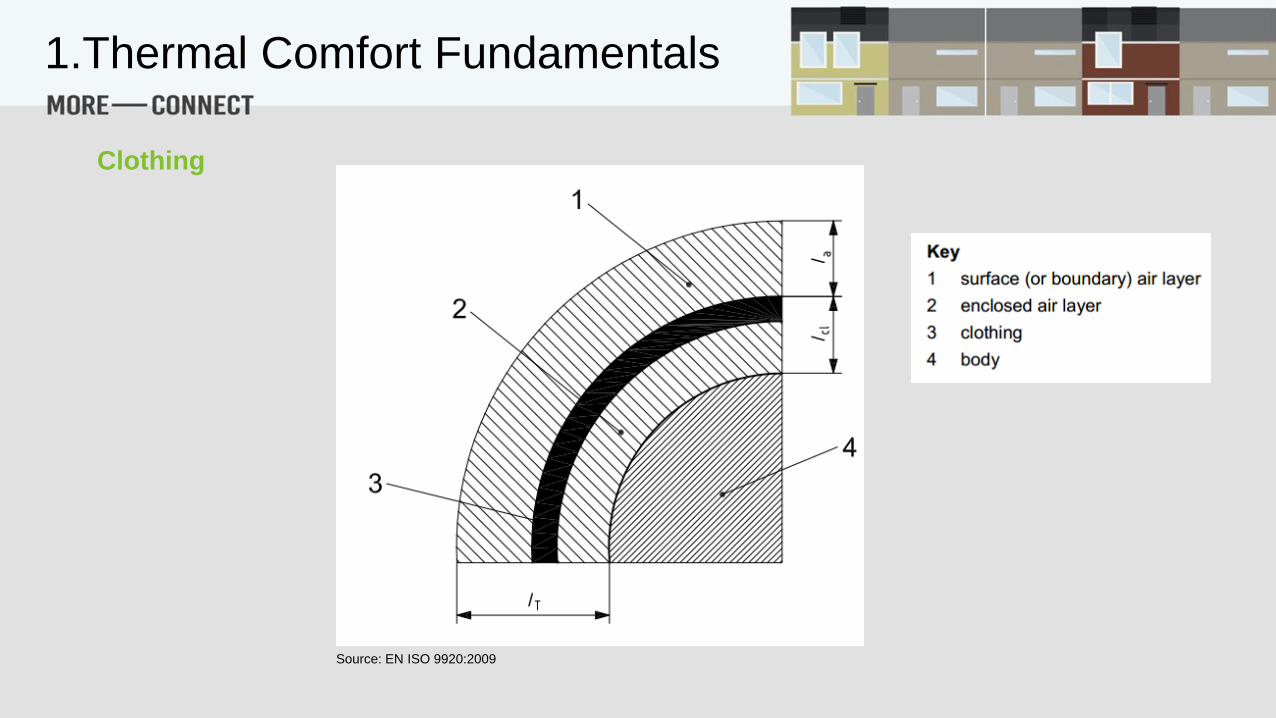
Source: EN ISO 9920:2009
1.Thermal Comfort Fundamentals
Clothing

Clothing
• Clothing insulation (Icl) is the means of maintaining this still warm layer.
• As insulation is expressed in thermal resistance units, i.e. m2K/W or clo=0,155 m2K/W
• Evaporation cooling resistance (Re) provided is proportional to clothing permeability (material specific),
approached by permeability index (im).
• As per EN ISO 9920 Re = f(im, Icl).
1.Thermal Comfort Fundamentals

Clothing
ClothingIcl
[m2K/W]
Icl
[clo]
Panties, T-shirt, shorts, light socks, sandals 0.050 0.30
Underpants, shirt with short sleeves, light trousers, light socks,
shoes0.080 0.50
Panties, shirt, trousers, jacket, socks, shoes 0.155 1
Icl continuum [clo] 0.2 0.6
Considered as nude Considered as clothed
0.5 1.0
Common summertime
design parameter
Common wintertime
design parameter
1.Thermal Comfort Fundamentals

Temperatures
• Operative temperature is a function of mean radiant temperature (MRT) and air temperature
• MRT considers for heat transferred by radiation and is commonly measured by black globe thermometer
• Air temperature considers heat transferred by convection and is measured by typical thermometers
1.Thermal Comfort Fundamentals
Air velocity
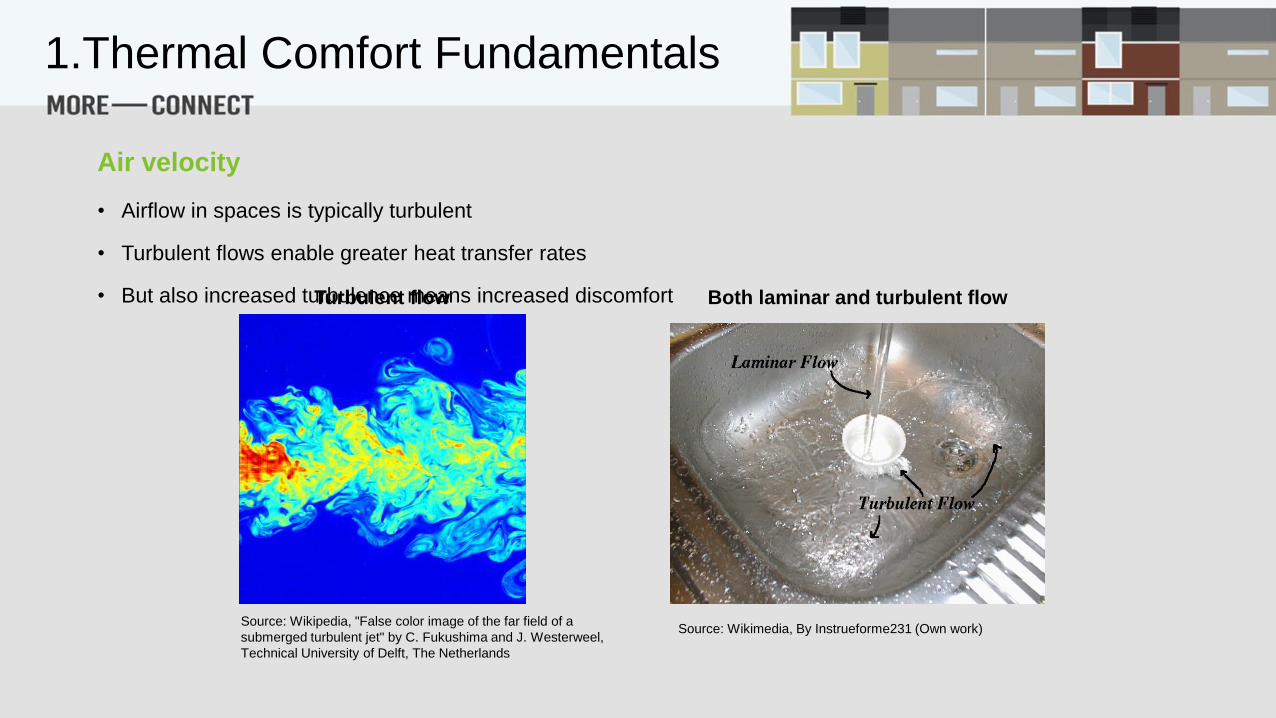
• Airflow in spaces is typically turbulent
• Turbulent flows enable greater heat transfer rates
• But also increased turbulence means increased discomfort
Source: Wikipedia, "False color image of the far field of a
submerged turbulent jet" by C. Fukushima and J. Westerweel,
Technical University of Delft, The Netherlands
Turbulent flow
Source: Wikimedia, By Instrueforme231 (Own work)
Both laminar and turbulent flow
1.Thermal Comfort Fundamentals
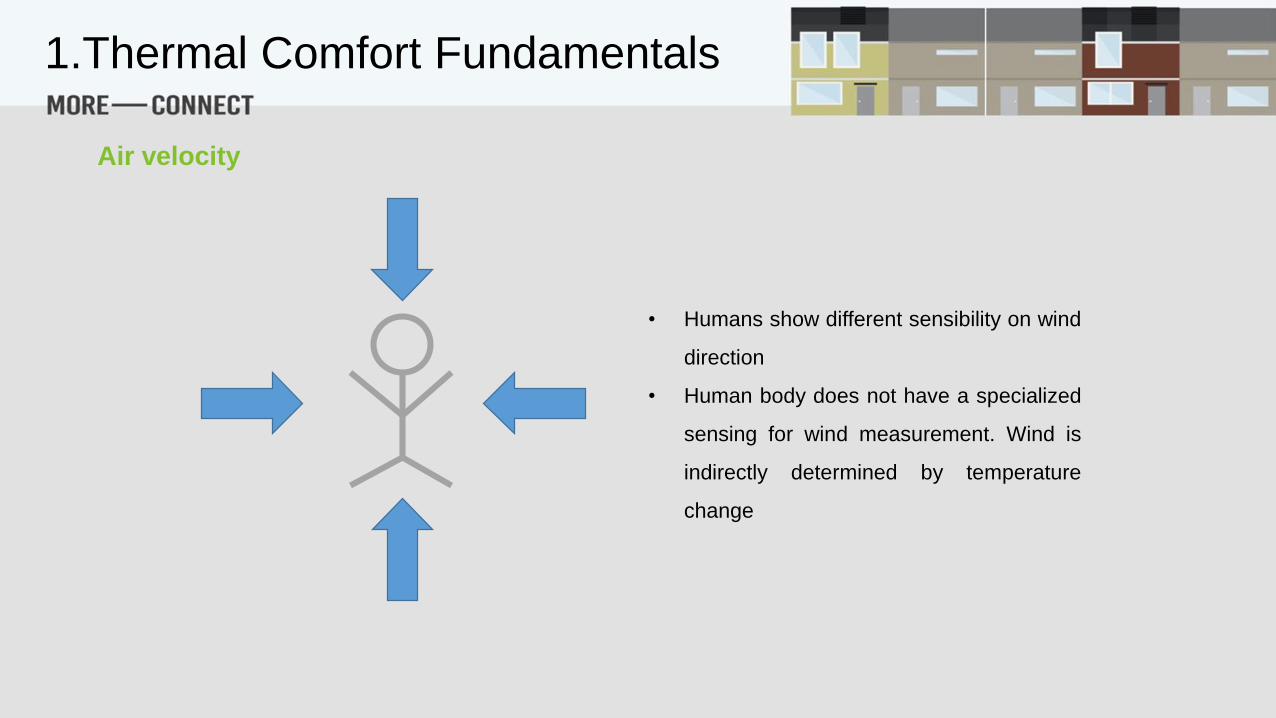
Air velocity
• Humans show different sensibility on wind
direction
• Human body does not have a specialized
sensing for wind measurement. Wind is
indirectly determined by temperature
change
1.Thermal Comfort Fundamentals

Air velocity
• Correlates to convection and evaporation heat transfer
• Difficult to measure accurately
• Fluid mechanics & heat transfer calculations are both knowledge and resource demanding
• Currently encountered either with simplistic assumptions leading to linear equations or CFD (computational fluid
dynamics) based on Navier Stokes equation (e.g. k-ω, k-ε etc)
1.Thermal Comfort Fundamentals
Humidity
• Interacts with thermoregulatory system through:
• Gas diffusion
• Sweat evaporation
• Humidification of inhaled air
• It loosely affects skin temperature
• The amount of sweat remaining on the skin is a very good indicator of discomfort
1.Thermal Comfort Fundamentals

Humidity
Measured ether by psychrometer or by hygrometer
Source: EN ISO 7726:2003
1.Thermal Comfort Fundamentals

Interdependability table
Table 1 - Main independent quantities involved in the analysis of the thermal balance between man and the thermal
environment
Elements in the thermal balance
Quantities
ta va pa Icl Rcl M W
Air
temperature
Mean radiant
temperature
Air
velocity
Absolute humidity of
the air (partial pressure
of water vapour)
Insulation
of clothing
Evaporative
resistance of
clothing
Metabolism External
work
Internal heat production, M-WX X
Heat transfer by radiation, RX X
Heat transfer by convection, C*X X X
Heat losses through evaporation:
- evaporation from the skin, E
- evaporation by respiration, Eres
X X
X
X
X
Convection by respiration, Cres
X X
* Heat transfer by convection is also influenced by body movements. The resultant air velocity at skin level is called relative air velocity (var). Heat conduction (surface
temperature) has only a limited influence on the thermal heat balance.
Source: EN ISO 7726:2003
1.Thermal Comfort Fundamentals

Some food for thought
Source: Wikipedia, "Dishdasha" by
Mary Paulose from Muscat, Oman -
Assorted Arabs.
Source: Wikipedia, "Civilian
Conservation Corps at an
experimental farm in
Beltsville, Maryland - NARA -
195831" by Unknown or not
provided - U.S. National
Archives and Records
Administration.
Source: Wikipedia,
"Chasseur sous-marin et son
équipement" by Calcineur -
Own work.
Arabs in thawb American workers Spare fisherman Farmer in Venezuela
Source: Wikipedia, "Campesino
Venezolano, Edo. Yaracuy crop" by The
Photographer - Own work
1.Thermal Comfort Fundamentals

Adaptation
• Previous analysis pre-assumed that individuals act passively on environmental parameters.
• Is this the case or:
• When you feel hot you open the window?
• When you feel cold you wear your wool shirt?
• Isn’t adaptation the cornerstone for our evolutionary straggling?
1.Thermal Comfort Fundamentals

Adaptation
• Thermoregulatory system is controlled by homeostasis system that produces stimuli.
• Thus, adaptation defined as:
the gradual decrease of the organism’s response to repeated exposure to a stimulus, involving all the actions
that make them better suited to survive in such an environment
1.Thermal Comfort Fundamentals

AdaptationAdaptive opportunity
Good Low Inexistent
Time
Tem
pera
ture
Adaptive
opportunity
Thermal discomfortThermal discomfort
Thermal
discomfort
Thermal neutrality
Adapted from: Baker and Standeven, 1996
1.Thermal Comfort Fundamentals
Adaptation
Adaptive model of thermal comfort “If a change occurs in the thermal environment which
tends to produce discomfort, people will respond in ways that tend to restore their comfort.”
(Humphreys, 1997).
Field studies and the adaptive model
1.Thermal Comfort Fundamentals
Adaptation
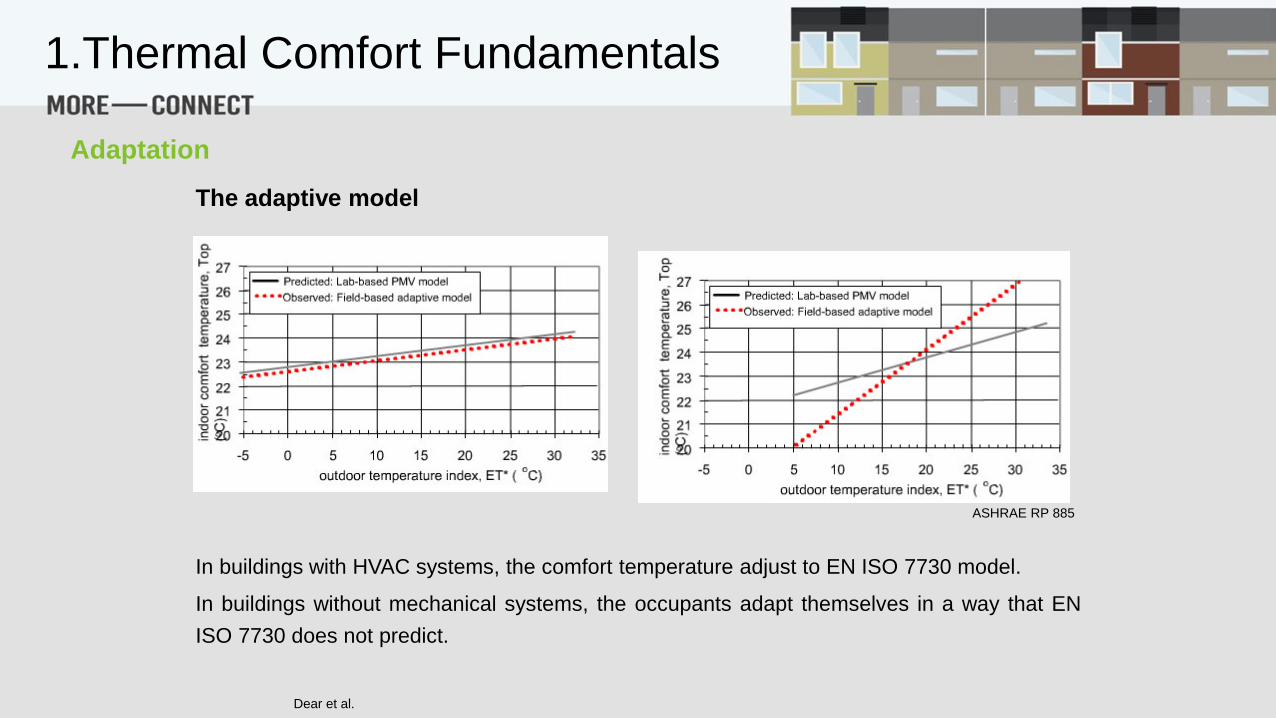
The adaptive model
In buildings with HVAC systems, the comfort temperature adjust to EN ISO 7730 model.
In buildings without mechanical systems, the occupants adapt themselves in a way that EN
ISO 7730 does not predict.
Dear et al.
ASHRAE RP 885
1.Thermal Comfort Fundamentals
Adaptation
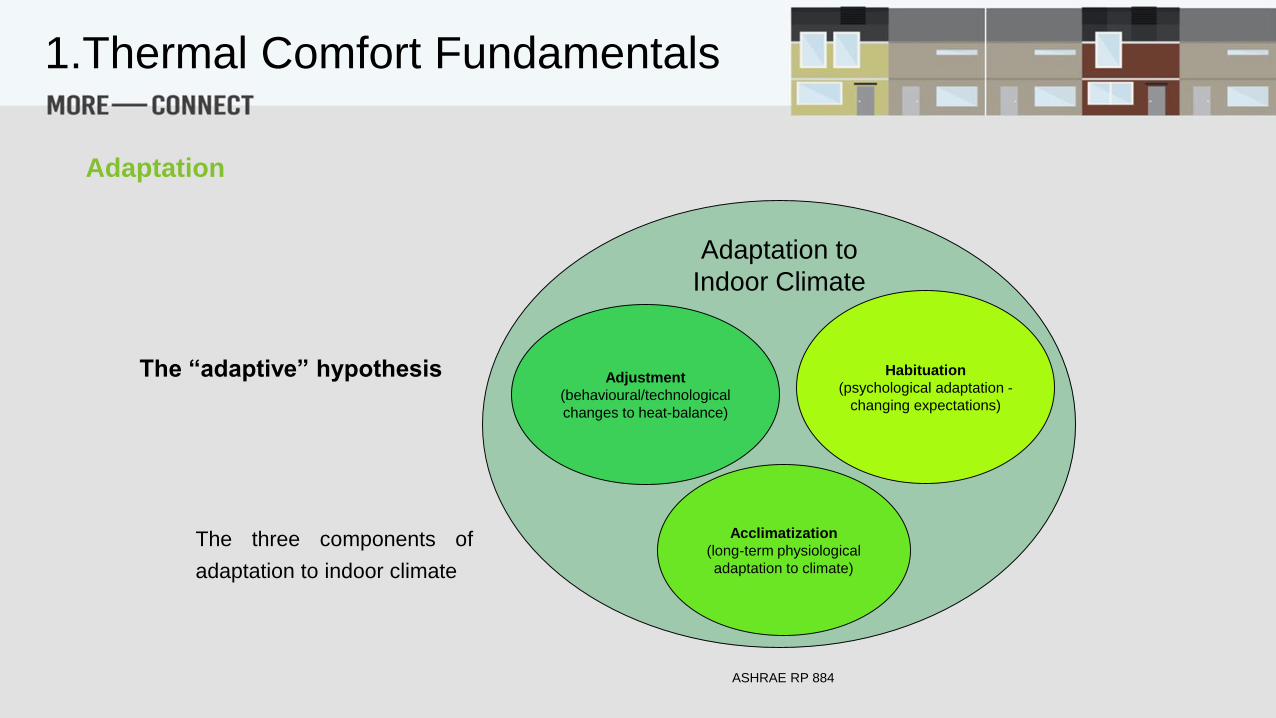
The “adaptive” hypothesis
The three components of
adaptation to indoor climate
ASHRAE RP 884
Adaptation to
Indoor Climate
Adjustment
(behavioural/technological
changes to heat-balance)
Acclimatization
(long-term physiological
adaptation to climate)
Habituation
(psychological adaptation -
changing expectations)
1.Thermal Comfort Fundamentals
Adaptation
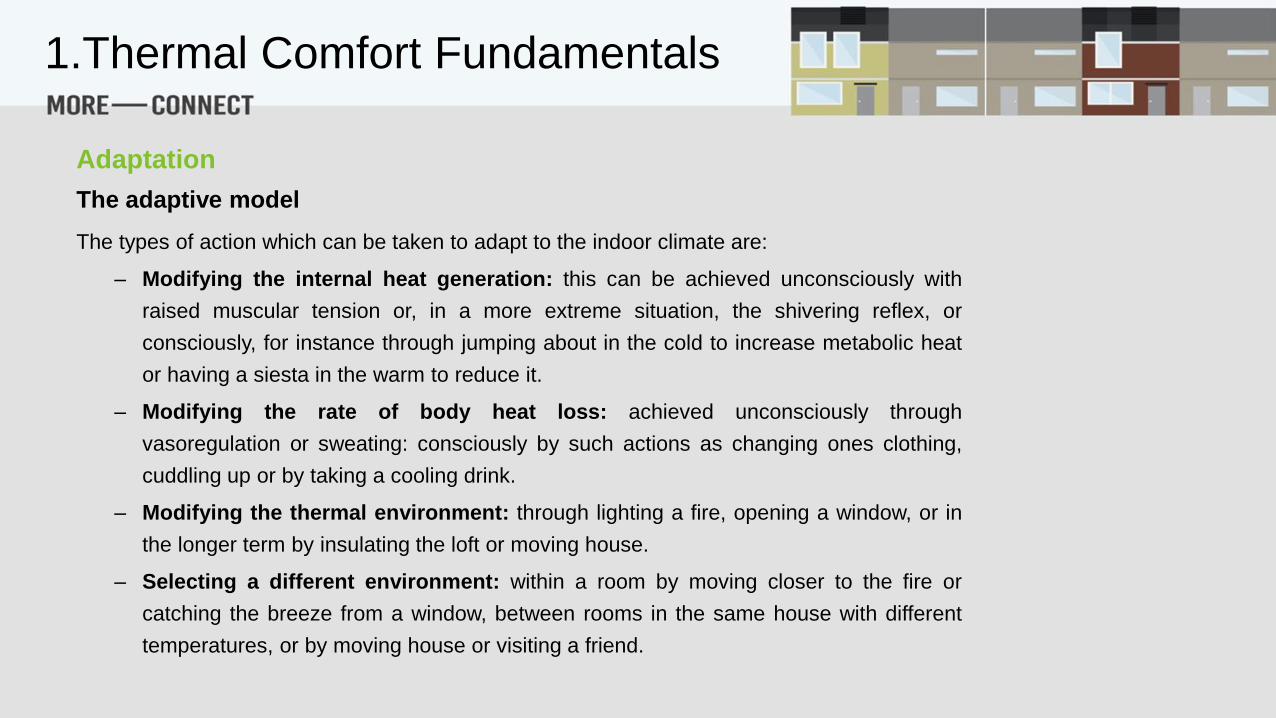
The adaptive model
The types of action which can be taken to adapt to the indoor climate are:
– Modifying the internal heat generation: this can be achieved unconsciously with
raised muscular tension or, in a more extreme situation, the shivering reflex, or
consciously, for instance through jumping about in the cold to increase metabolic heat
or having a siesta in the warm to reduce it.
– Modifying the rate of body heat loss: achieved unconsciously through
vasoregulation or sweating: consciously by such actions as changing ones clothing,
cuddling up or by taking a cooling drink.
– Modifying the thermal environment: through lighting a fire, opening a window, or in
the longer term by insulating the loft or moving house.
– Selecting a different environment: within a room by moving closer to the fire or
catching the breeze from a window, between rooms in the same house with different
temperatures, or by moving house or visiting a friend.
1.Thermal Comfort Fundamentals
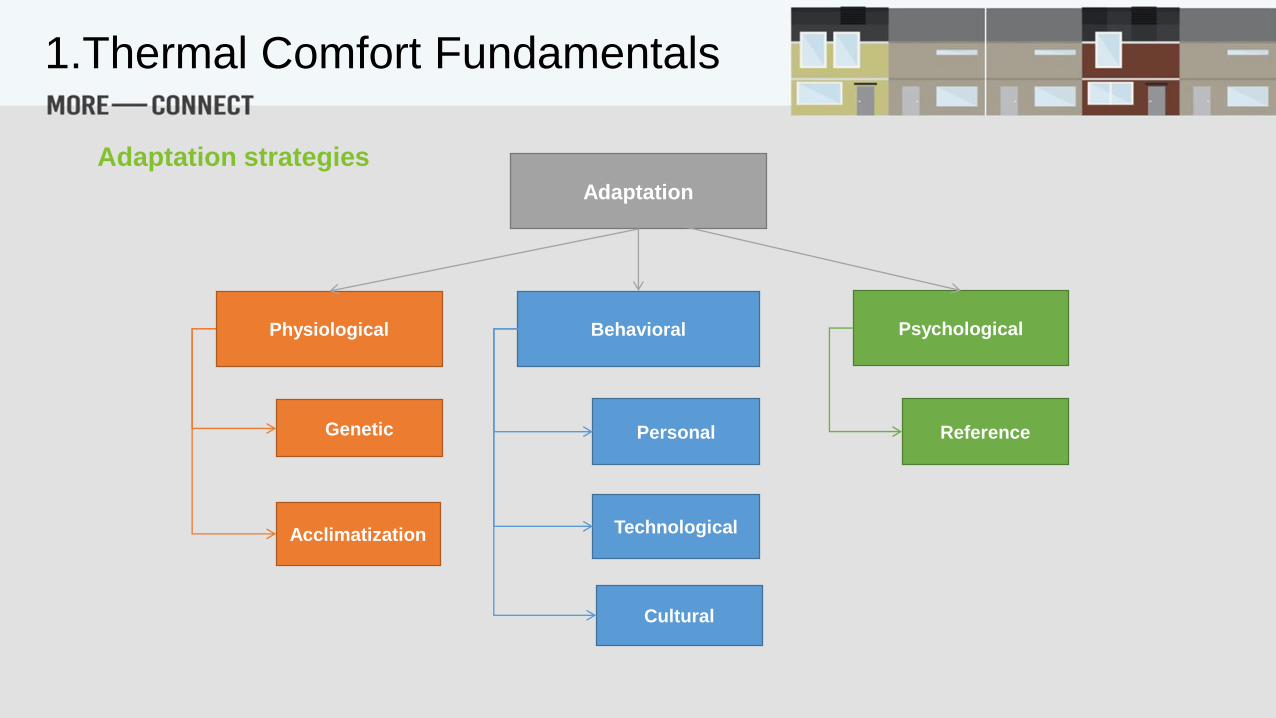
Adaptation strategies
Adaptation
Physiological Behavioral Psychological
Genetic
Acclimatization
Personal
Technological
Cultural
Reference
1.Thermal Comfort Fundamentals
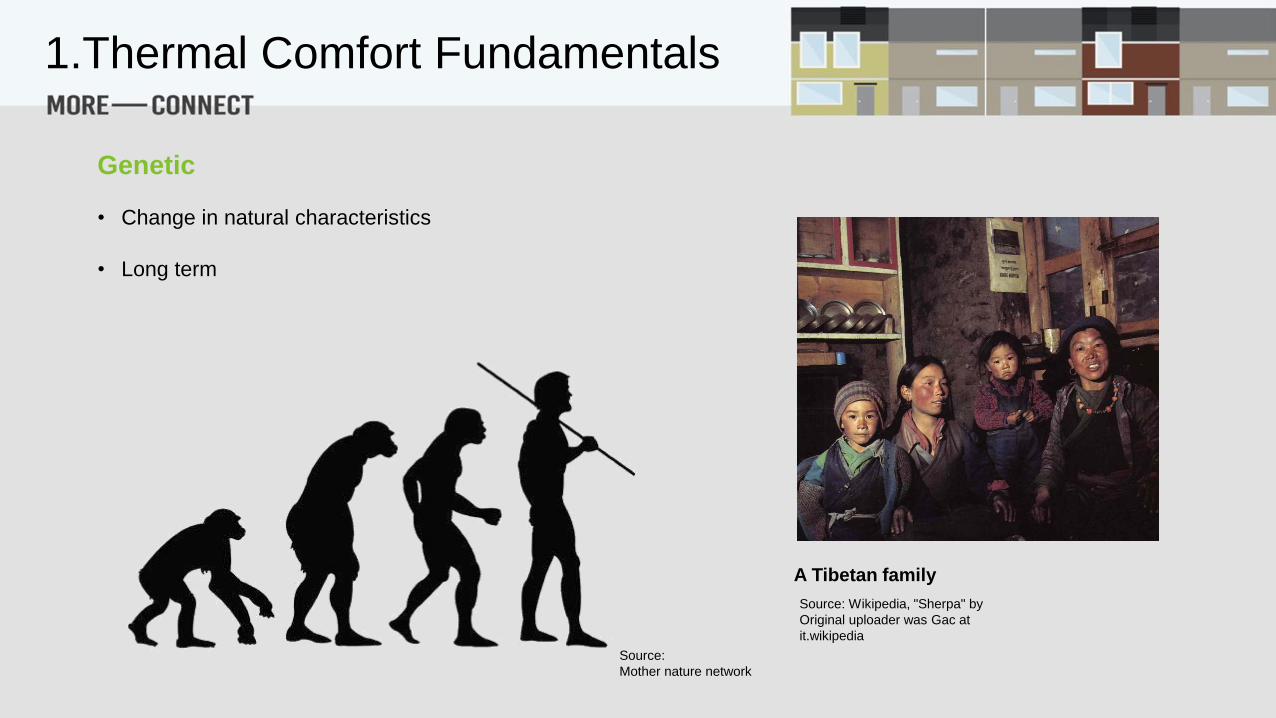
Genetic
• Change in natural characteristics
• Long term
Source: Wikipedia, "Sherpa" by
Original uploader was Gac at
it.wikipedia
A Tibetan family
1.Thermal Comfort Fundamentals
Source:
Mother nature network
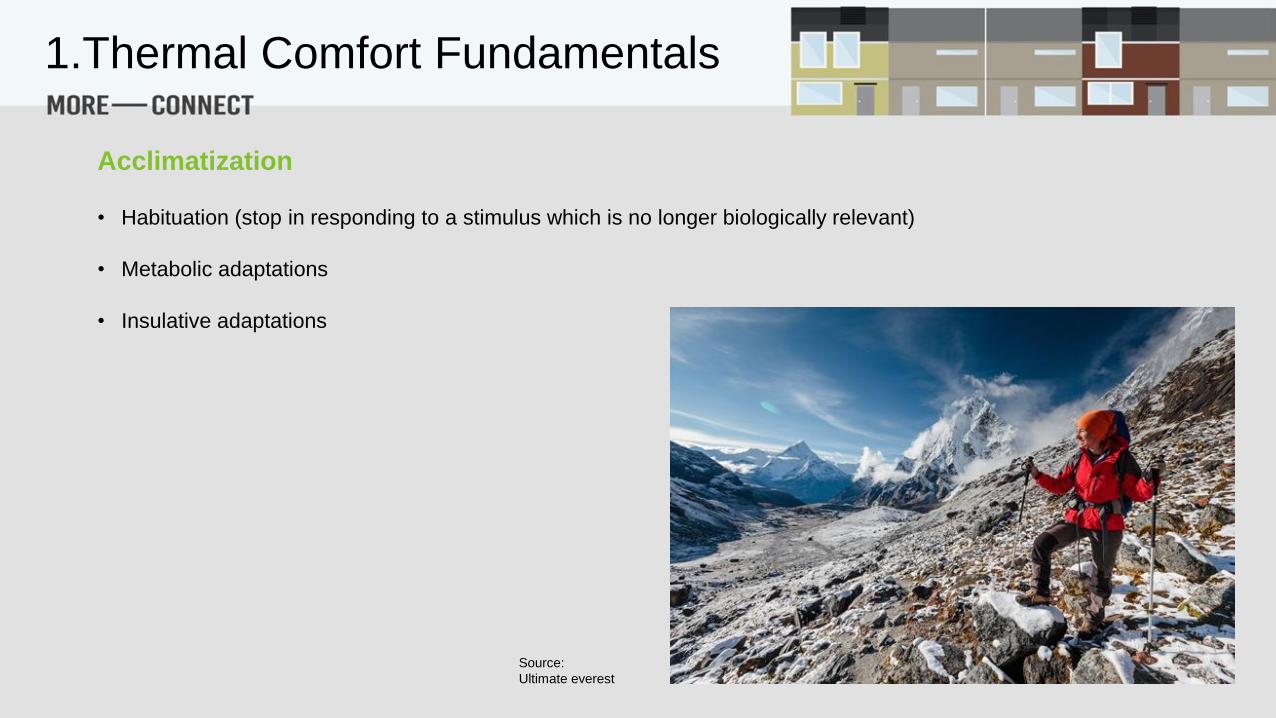
Acclimatization
• Habituation (stop in responding to a stimulus which is no longer biologically relevant)
• Metabolic adaptations
• Insulative adaptations
1.Thermal Comfort Fundamentals
Source:
Ultimate everest
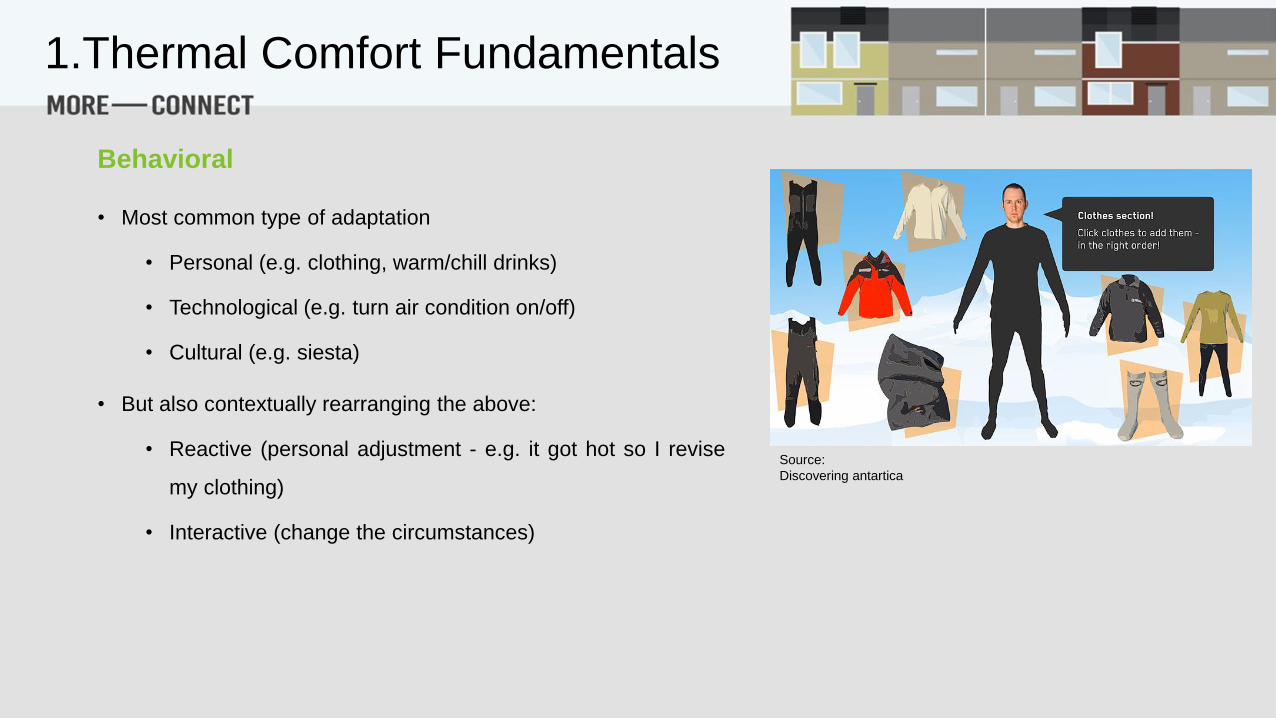
Behavioral
• Most common type of adaptation
• Personal (e.g. clothing, warm/chill drinks)
• Technological (e.g. turn air condition on/off)
• Cultural (e.g. siesta)
• But also contextually rearranging the above:
• Reactive (personal adjustment - e.g. it got hot so I revise
my clothing)
• Interactive (change the circumstances)
1.Thermal Comfort Fundamentals
Source:
Discovering antartica
Psychological
• Naturalness (free of artificiality)
• Expectations (how environment should be)
• Experience
• Short term (memory related)
• Long term (schemata in mind related)
• Time of exposure (e.g. getting out of a warm car to enter a building in winter)
• Perceived control (control over a source of discomfort)
• Environmental stimulation
1.Thermal Comfort Fundamentals

Flip-side of adaptive opportunity (i.e, the lack of...)
The flip-side of adaptive opportunity (i.e, the lack of...), is the analysis of constraints to thermal control. These
constraints may be gathered under five main headings (Nicol and Humphreys 1972, Humphreys 1994a):
a) Constraints due to climate.
b) Economic constraints.
c) Constraints due to social custom or regulation.
d) Constraints due to task or occupation.
e) Constraints due to design.
1.Thermal Comfort Fundamentals
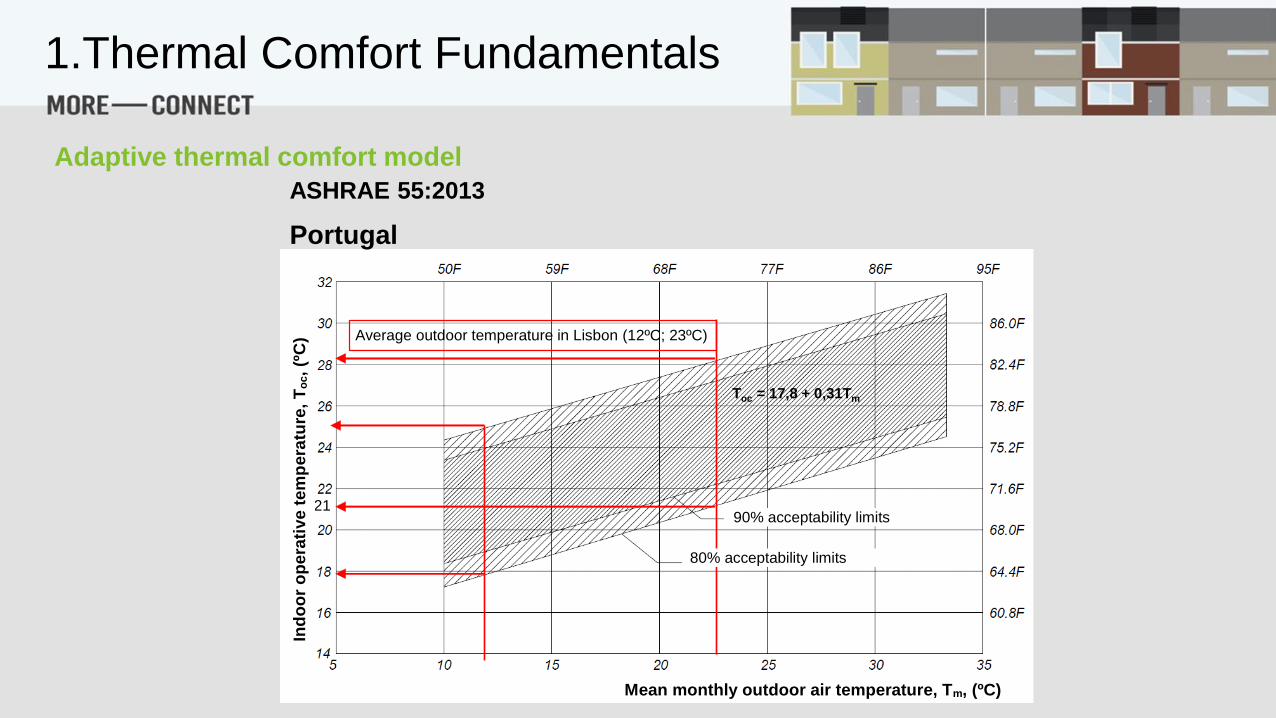
Adaptive thermal comfort model
Average outdoor temperature in Lisbon (12ºC; 23ºC)
21
Mean monthly outdoor air temperature, Tm, (ºC)
Ind
oo
r o
pe
rati
ve t
em
pe
ratu
re,
To
c,
(ºC
)
90% acceptability limits
80% acceptability limits
Toc = 17,8 + 0,31Tm
ASHRAE 55:2013
Portugal
1.Thermal Comfort Fundamentals
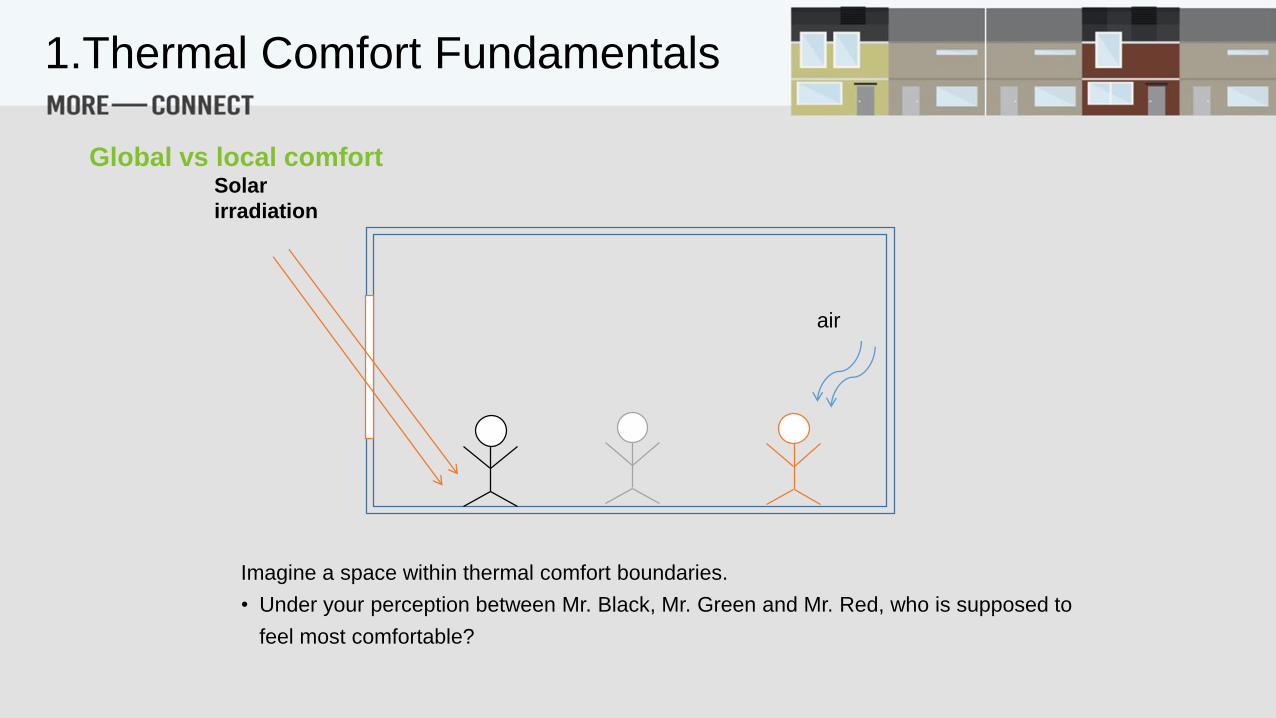
Global vs local comfort
Imagine a space within thermal comfort boundaries.
• Under your perception between Mr. Black, Mr. Green and Mr. Red, who is supposed to
feel most comfortable?
air
Solar
irradiation
1.Thermal Comfort Fundamentals

Global vs local comfort
• Thus local discomfort consists of exposing parts of body to conditions thermally uncomfortable.
Evaluating thermal
environmentGlobal comfort Local comfort= +
1.Thermal Comfort Fundamentals

Radiant asymmetry
Source: Wikipedia, By Ernst Vikne (Watching the fireplace)
• Radiant temperature asymmetry leads to
discomfort
• Warm ceilings and cold windows cause
greater discomfort than cold ceilings and warm
walls
1.Thermal Comfort Fundamentals

Vertical air temperature differences
• Unpleasant to be warm around head and cold around feet
• Temperature is measured at ankle and neck hot
cold
1.Thermal Comfort Fundamentals
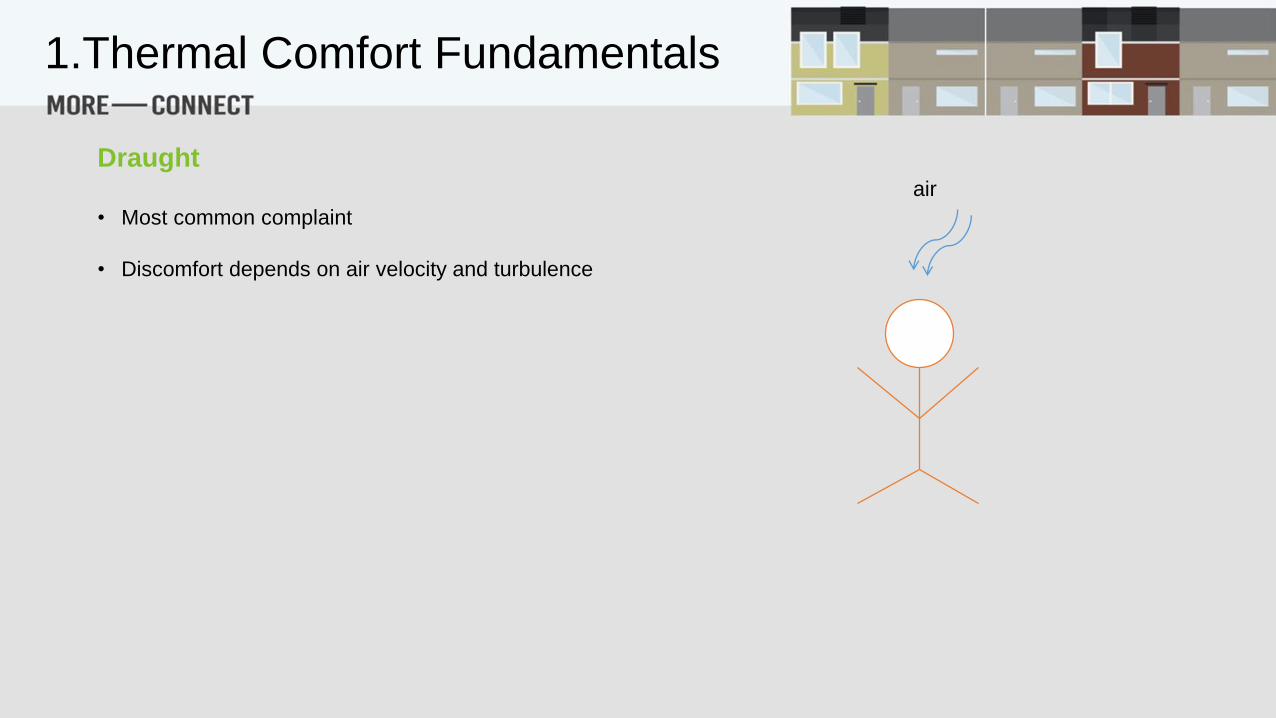
Draught
• Most common complaint
• Discomfort depends on air velocity and turbulence
air
1.Thermal Comfort Fundamentals
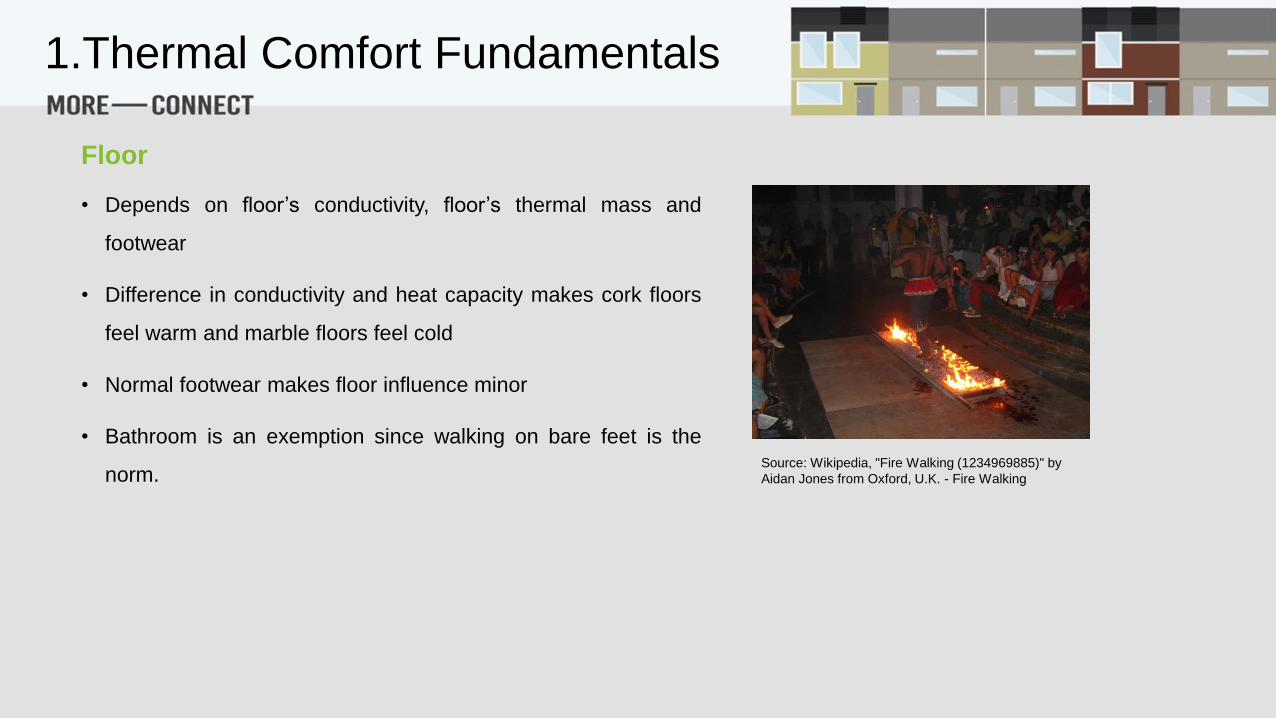
Floor
• Depends on floor’s conductivity, floor’s thermal mass and
footwear
• Difference in conductivity and heat capacity makes cork floors
feel warm and marble floors feel cold
• Normal footwear makes floor influence minor
• Bathroom is an exemption since walking on bare feet is the
norm.Source: Wikipedia, "Fire Walking (1234969885)" by
Aidan Jones from Oxford, U.K. - Fire Walking
1.Thermal Comfort Fundamentals
Natural ventilation
• Correlates to psychological adaptation, i.e. Naturalness, Environmental
stimulation
• Research is converging that natural ventilation makes individual feel
more thermally comfortable
• Depends on outside air velocity (impossible to control outside air, hard
to predict, may change as surroundings change)
• Natural sometimes also mean “natural” air born noise thus a thermally
comfortable environment may not be comfortable.
• Sometimes difficult to implement (e.g. renovation projects)
1.Thermal Comfort Fundamentals
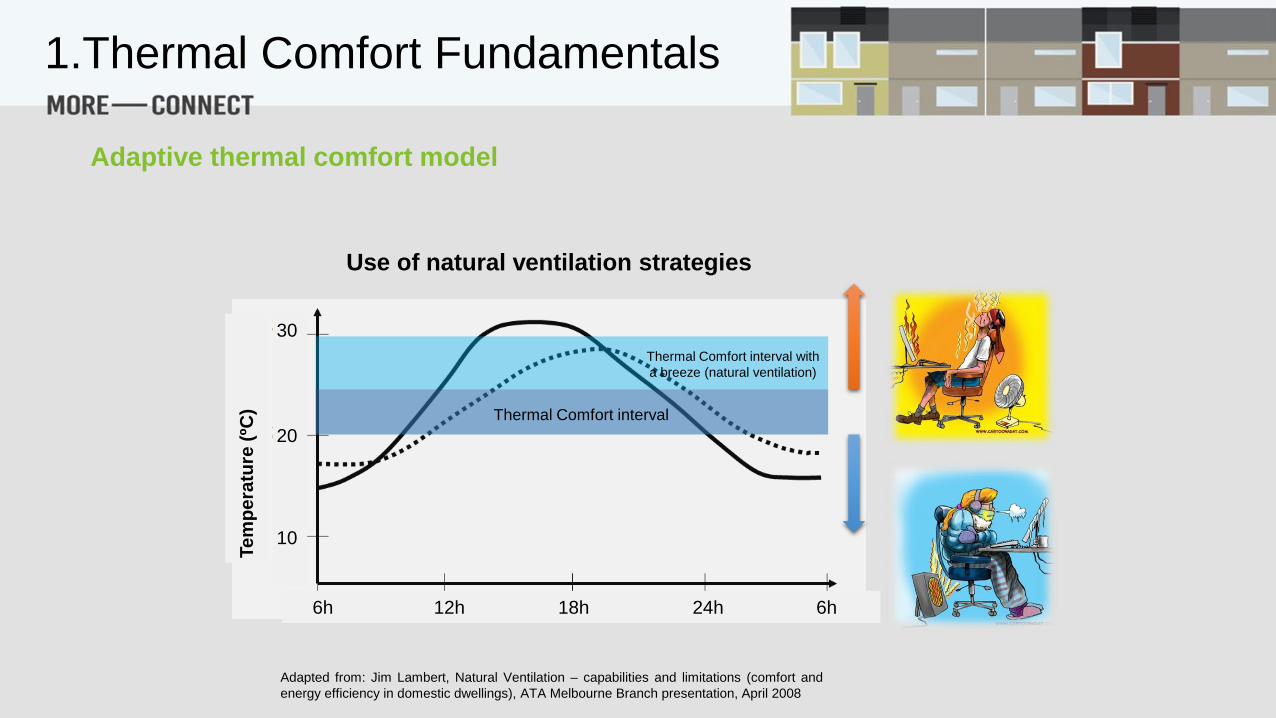
Adaptive thermal comfort model
Use of natural ventilation strategies
Adapted from: Jim Lambert, Natural Ventilation – capabilities and limitations (comfort and
energy efficiency in domestic dwellings), ATA Melbourne Branch presentation, April 2008
Thermal Comfort interval
Thermal Comfort interval with
a breeze (natural ventilation)
Te
mp
era
ture
(ºC
)
6h 12h 18h 24h 6h
30
20
10
1.Thermal Comfort Fundamentals

Age
• As people get older:
• Metabolic rate probably falls
• Sweating normally reduces
• Thermoregulation becomes harder
• But apart from physical also psyco-socio-economical parameters are influenced:
• Income tends to decrease
• Usually spend more time indoors
• Perception of what is cold and hot may change
1.Thermal Comfort Fundamentals

Gender
• Females tend to be more prone to express thermal discomfort than males
• Females are expected to have higher thermo-neutral temperature
• Differences are attribute to:
• Body fat
• Surface to mass ratio
• Regulatory hormones
• Clothing and clothing distribution across body
1.Thermal Comfort Fundamentals

Temperature changes over time
• Changes of temperature within a day
• Temperature changes from day to day
• Seasonal changes in temperature
1.Thermal Comfort Fundamentals
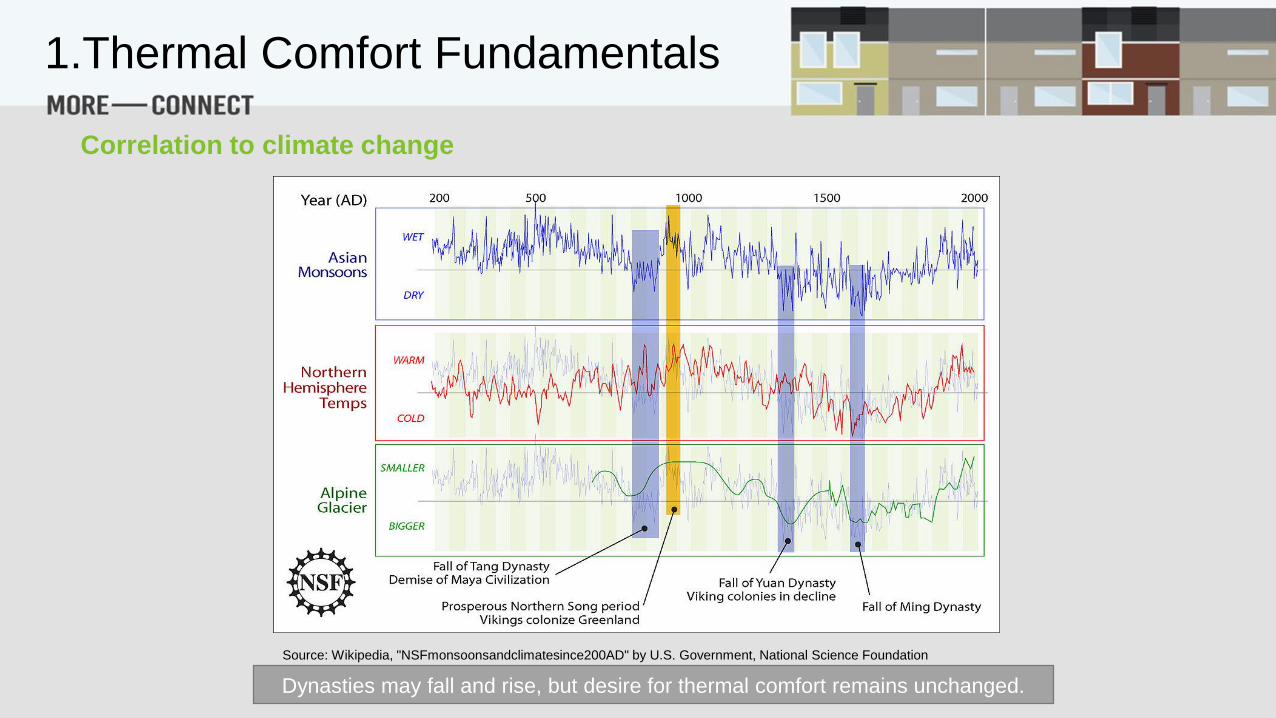
Correlation to climate change
Source: Wikipedia, "NSFmonsoonsandclimatesince200AD" by U.S. Government, National Science Foundation
(NSF)
Dynasties may fall and rise, but desire for thermal comfort remains unchanged.
1.Thermal Comfort Fundamentals
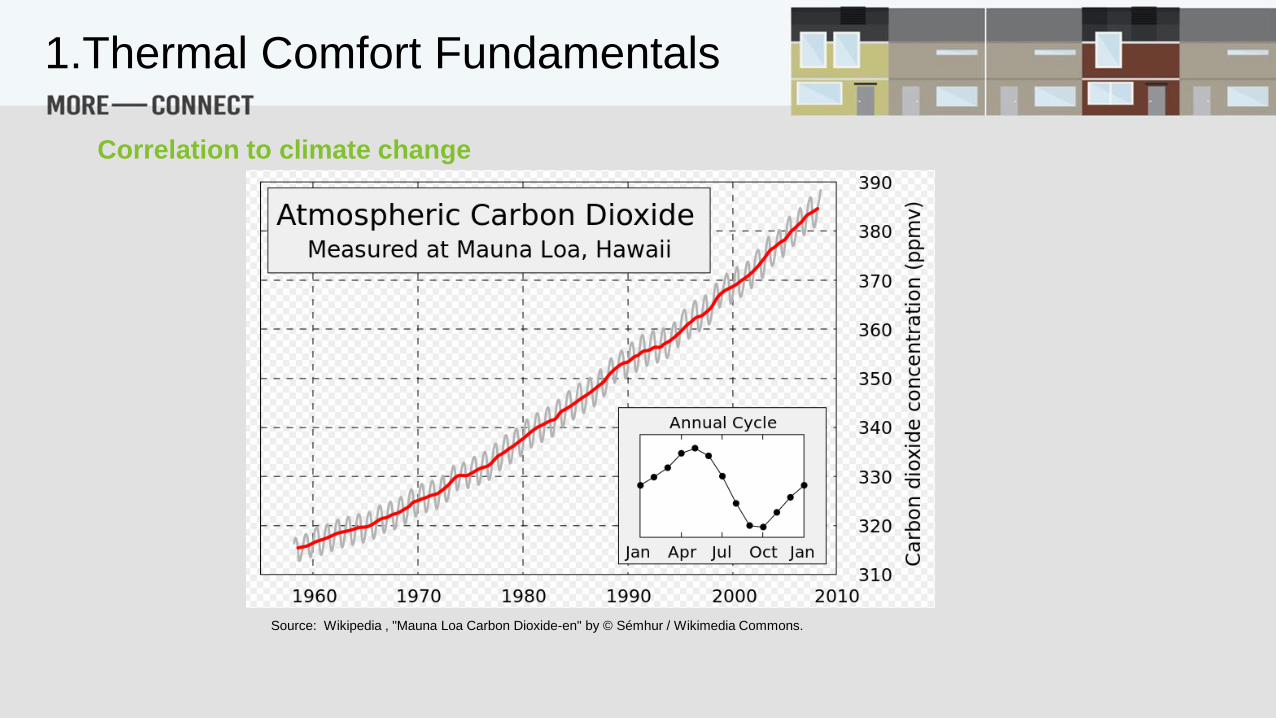
Correlation to climate change
Source: Wikipedia , "Mauna Loa Carbon Dioxide-en" by © Sémhur / Wikimedia Commons.
1.Thermal Comfort Fundamentals

Correlation to climate change
1.Thermal Comfort Fundamentals
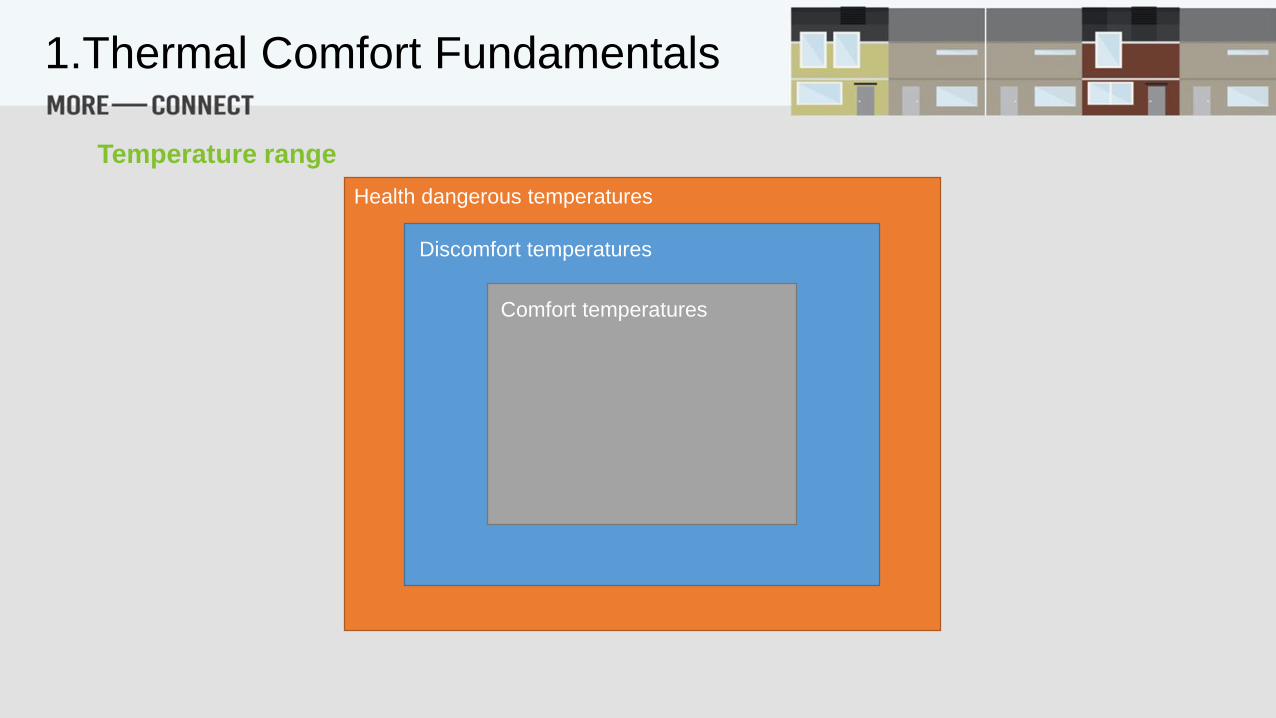
Temperature range
Health dangerous temperatures
Discomfort temperatures
Comfort temperatures
1.Thermal Comfort Fundamentals
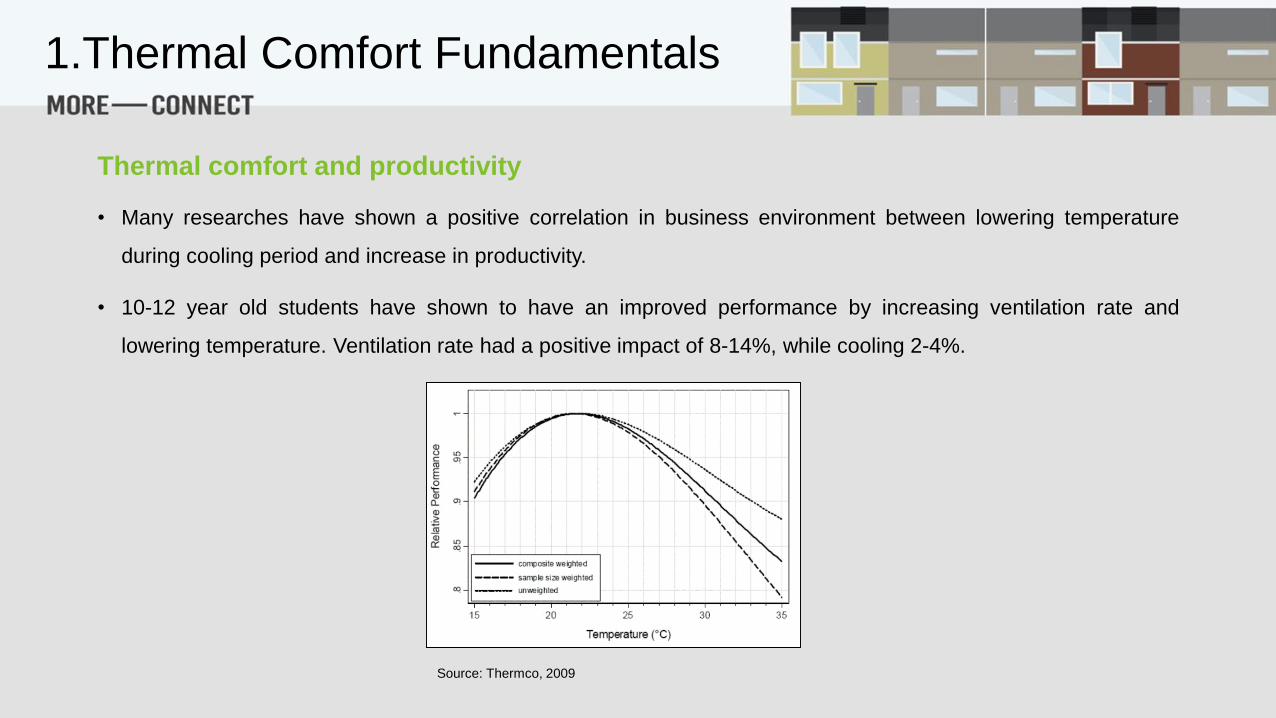
Thermal comfort and productivity
• Many researches have shown a positive correlation in business environment between lowering temperature
during cooling period and increase in productivity.
• 10-12 year old students have shown to have an improved performance by increasing ventilation rate and
lowering temperature. Ventilation rate had a positive impact of 8-14%, while cooling 2-4%.
Source: Thermco, 2009
1.Thermal Comfort Fundamentals

What is the “discomfort cost”?
• In 2000 Fisk* estimated that for the U.S. improved indoor environment could:
• Save 6-14 b$/a from reduced respiratory disease
• Save 2-4 b$/a from reduced allergies & asthma
• Save 10-30 b$/a from reduced building syndrome symptoms
• Generate extra 20-160 b$/a due to improved personnel performance
• Nicol et.al.** claim that UK medical treatment cost due to poor housing is 2,5b₤/a out of which 700m₤/a stem
from poor energy efficiency/fuel poverty.
*Fisk W., REVIEW OF HEALTH AND PRODUCTIVITY GAINS FROM BETTER IEQ, Proceedings of Healthy Buildings 2000 Vol. 4
**Nicol, S., Roys, M., Davidson, M., Summers, C., Ormandy, D., Ambrose, P., Quantifying the Cost of Poor Housing. IHS BRE Press, Watford, 2010.
1.Thermal Comfort Fundamentals
Heat stress
• Associated with the heat balance between human body and environment: it shows the load a human may be
exposed;
• Mild heat stress may cause discomfort or deterioration of performance;
• Above tolerated temperatures, heat related illness arise.
1.Thermal Comfort Fundamentals
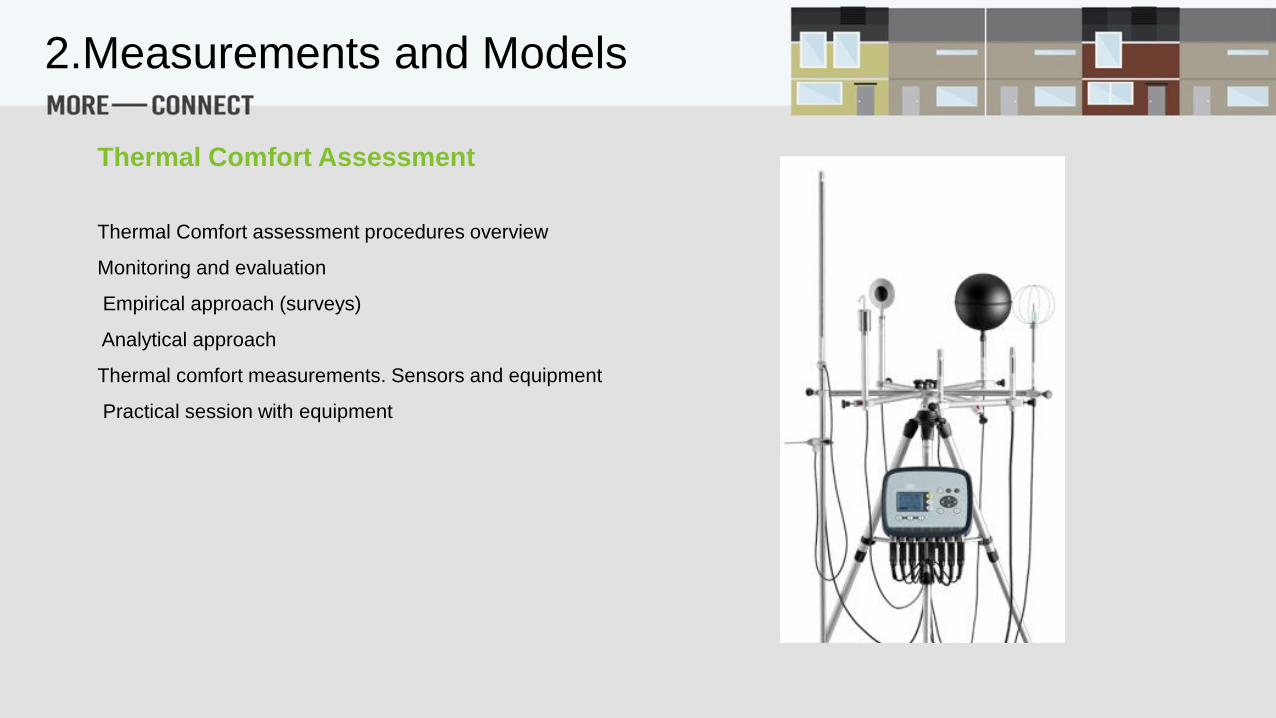
Thermal Comfort assessment procedures overview
Monitoring and evaluation
Empirical approach (surveys)
Analytical approach
Thermal comfort measurements. Sensors and equipment
Practical session with equipment
2.Measurements and Models
Thermal Comfort Assessment

Evaluation of the thermal environment
Qualitative
Quantitative
Thermal Comfort
Evaluation
Talking to and interviewing people
Observation
→ subjective judgement
Carry out measurements
→ Objective assessment
2.Measurements and Models
Thermal Comfort Assessment

Validating the Thermal Environment
Evaluation of the thermal environment
Validation Methods
In order to determine the thermal environments’ ability to meet the
defined criteria there are two methods that can be implemented
(ASHRAE 55):
• statistically determine occupant satisfaction through the
evaluation of survey results.
• technically establish comfort conditions through the
analysis of environment variables.
2.Measurements and Models
Thermal Comfort Assessment

Measuring thermal comfort
A simple way of estimating the level of thermal comfort in a workplace or home is
to ask the workers or inhabitants.
If the percentage of workers/inhabitants dissatisfied with the thermal environment
is above a certain level it is necessary to take actions.
The use of a thermal comfort checklist helps to identify whether there may be a
risk of thermal discomfort to the occupants of a room.
2.Measurements and Models
Thermal Comfort Assessment
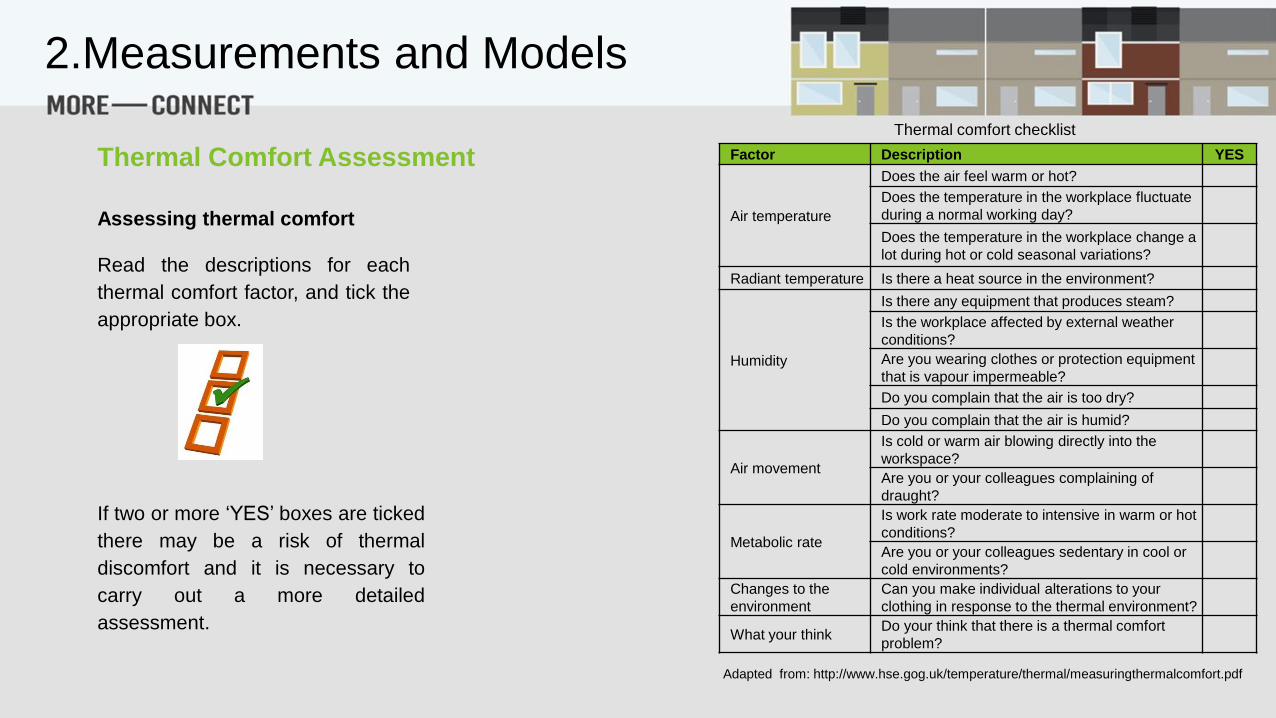
Assessing thermal comfort
Read the descriptions for each
thermal comfort factor, and tick the
appropriate box.
If two or more ‘YES’ boxes are ticked
there may be a risk of thermal
discomfort and it is necessary to
carry out a more detailed
assessment.
Factor Description YES
Air temperature
Does the air feel warm or hot?
Does the temperature in the workplace fluctuate
during a normal working day?
Does the temperature in the workplace change a
lot during hot or cold seasonal variations?
Radiant temperature Is there a heat source in the environment?
Humidity
Is there any equipment that produces steam?
Is the workplace affected by external weather
conditions?
Are you wearing clothes or protection equipment
that is vapour impermeable?
Do you complain that the air is too dry?
Do you complain that the air is humid?
Air movement
Is cold or warm air blowing directly into the
workspace?
Are you or your colleagues complaining of
draught?
Metabolic rate
Is work rate moderate to intensive in warm or hot
conditions?
Are you or your colleagues sedentary in cool or
cold environments?
Changes to the
environment
Can you make individual alterations to your
clothing in response to the thermal environment?
What your thinkDo your think that there is a thermal comfort
problem?
Thermal comfort checklist
Adapted from: http://www.hse.gog.uk/temperature/thermal/measuringthermalcomfort.pdf
2.Measurements and Models
Thermal Comfort Assessment

https://www.educate-sustainability.eu/kb/sites/www.educate-sustainability.eu.portal/files/OCCUPANT%20COMFORT%20SURVEY%20QUESTIONNAIRE.pdf
Subjective evaluations
Questionnaires
2.Measurements and Models
Thermal Comfort Assessment
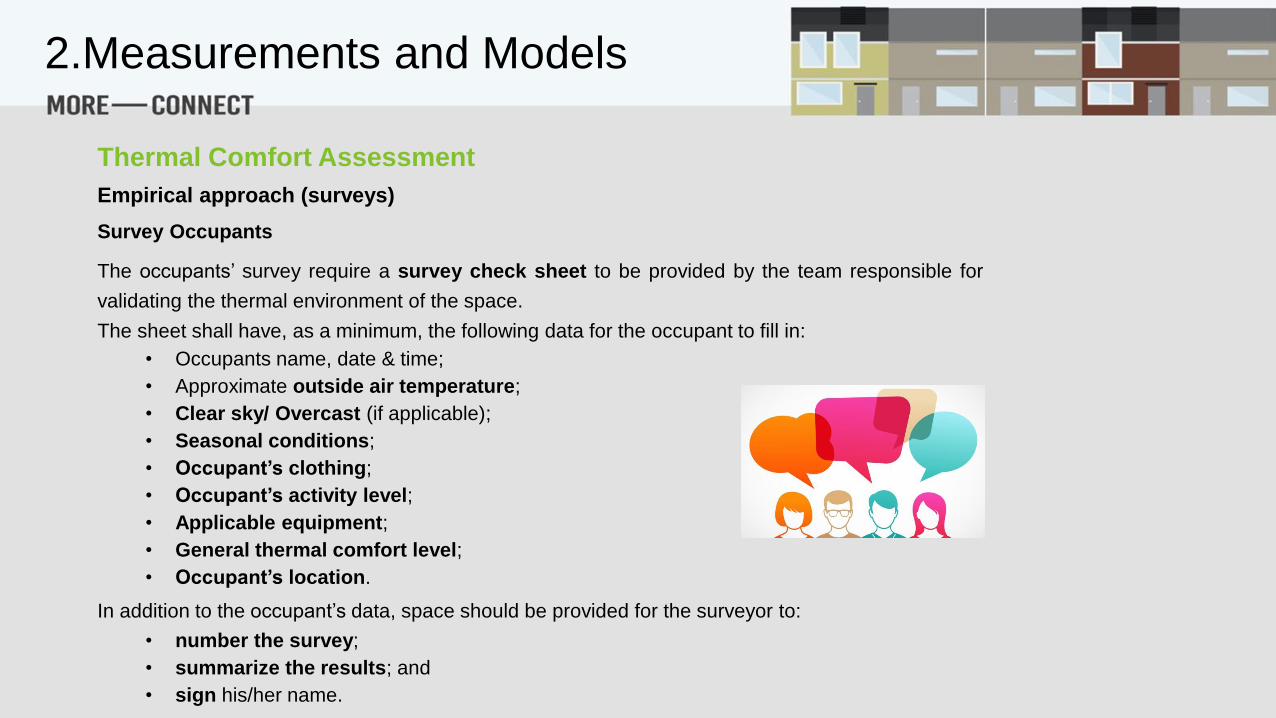
Survey Occupants
The occupants’ survey require a survey check sheet to be provided by the team responsible for
validating the thermal environment of the space.
The sheet shall have, as a minimum, the following data for the occupant to fill in:
• Occupants name, date & time;
• Approximate outside air temperature;
• Clear sky/ Overcast (if applicable);
• Seasonal conditions;
• Occupant’s clothing;
• Occupant’s activity level;
• Applicable equipment;
• General thermal comfort level;
• Occupant’s location.
In addition to the occupant’s data, space should be provided for the surveyor to:
• number the survey;
• summarize the results; and
• sign his/her name.
Empirical approach (surveys)
2.Measurements and Models
Thermal Comfort Assessment
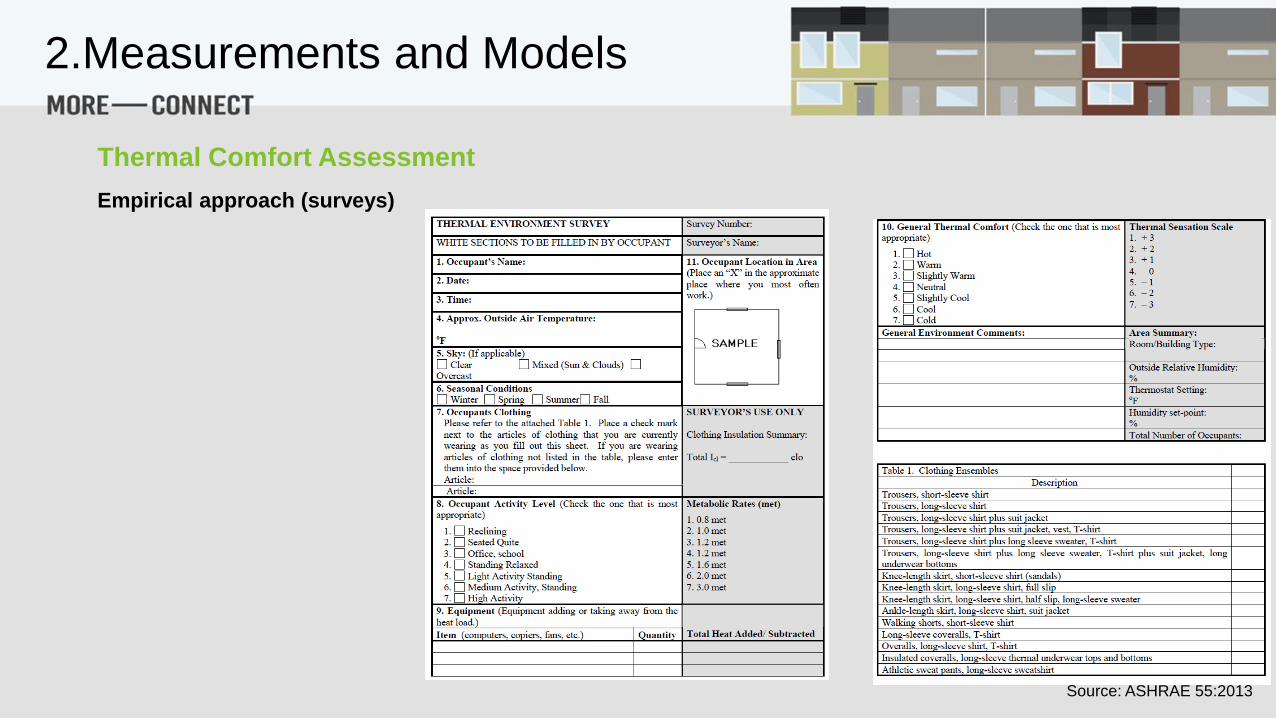
Empirical approach (surveys)
Source: ASHRAE 55:2013
2.Measurements and Models
Thermal Comfort Assessment

EN 15251:2007 - Methodologies for subjective evaluations
Subjective questionnaires can be used to evaluate the indoor environment.
Subjective scales are presented to the occupants at fixed time intervals (daily,
weekly, monthly, etc.).
The questionnaires should be filled out during middle morning or middle
afternoon. Not just after arrival or after a lunch break.
The results can be presented as average values and/or distributions.
Source: EN 15251:2007
Empirical approach (surveys)
2.Measurements and Models
Thermal Comfort Assessment

Example of a Questionnaire (Based on ASHRAE 55 and EN15251)
Empirical approach (surveys)
2.Measurements and Models
Thermal Comfort Assessment
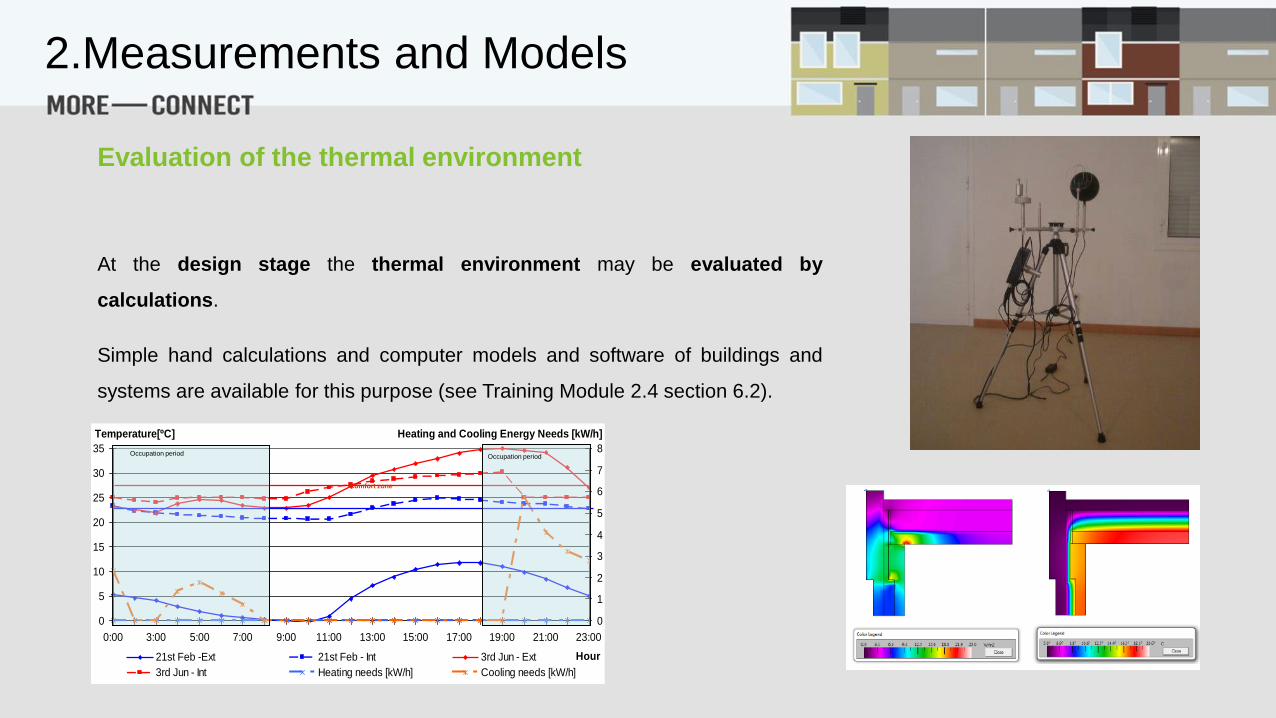
At the design stage the thermal environment may be evaluated by
calculations.
Simple hand calculations and computer models and software of buildings and
systems are available for this purpose (see Training Module 2.4 section 6.2).
Temperature[ºC]
0
5
10
15
20
25
30
35
0:00 3:00 5:00 7:00 9:00 11:00 13:00 15:00 17:00 19:00 21:00 23:00
Hour
0
1
2
3
4
5
6
7
8
Heating and Cooling Energy Needs [kW/h]
21st Feb -Ext 21st Feb - Int 3rd Jun - Ext
3rd Jun - Int Heating needs [kW/h] Cooling needs [kW/h]
Comfort zone
Occupation period Occupation period
2.Measurements and Models
Evaluation of the thermal environment
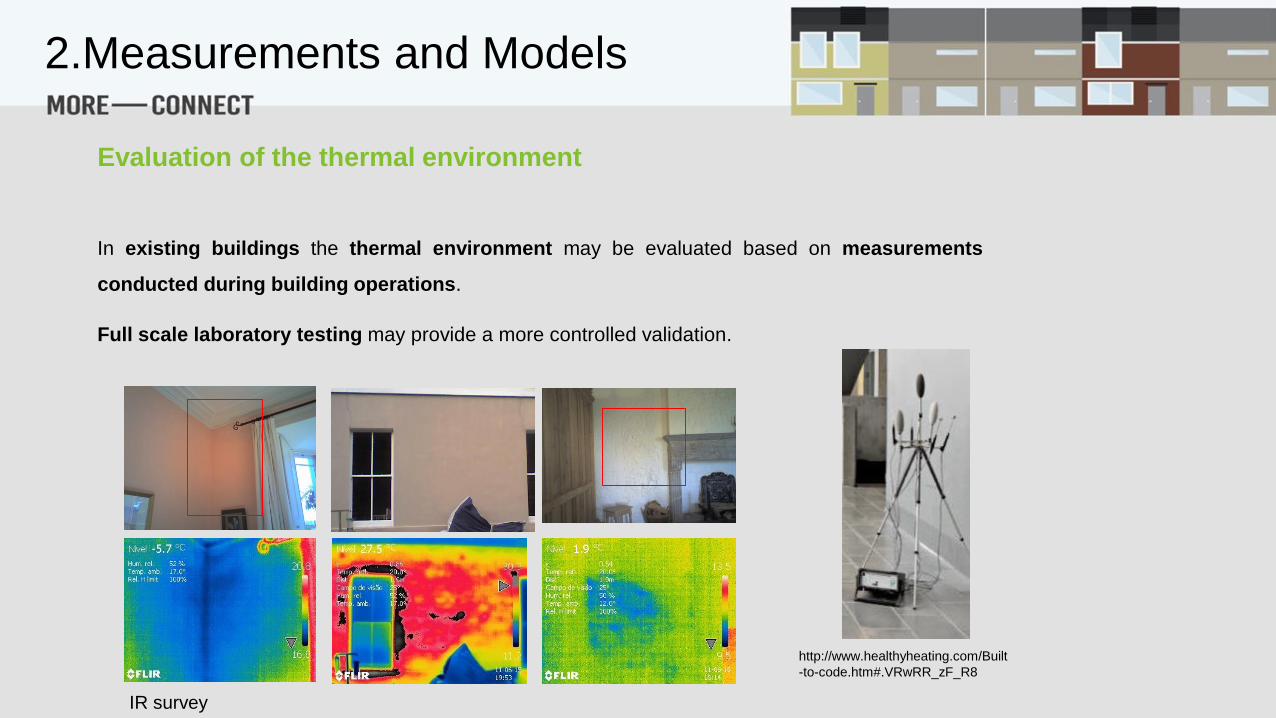
In existing buildings the thermal environment may be evaluated based on measurements
conducted during building operations.
Full scale laboratory testing may provide a more controlled validation.
http://www.healthyheating.com/Built
-to-code.htm#.VRwRR_zF_R8
IR survey
2.Measurements and Models
Evaluation of the thermal environment

Measurement positions
Location of measurements
Measurements shall be made in occupied zones of the building at locations
where the occupants are known to or are expected to spend their time.
Locations might be workstation or seating areas, depending on the function of
the space.
Occupied rooms → measurements at a representative sample of occupant
locations spread throughout the occupied zone.
Unoccupied rooms → make a good faith estimate of the most significant
future occupant locations within the room and make appropriate
measurements.
www.testo.org/en/home/products/comfort_and
_indoor_air_quality/iaq_and_comfort_level.jsp
www.testo.org/en/home/products/comfort_and
_indoor_air_quality/iaq_and_comfort_level.jsp
2.Measurements and Models
Evaluation of the thermal environment
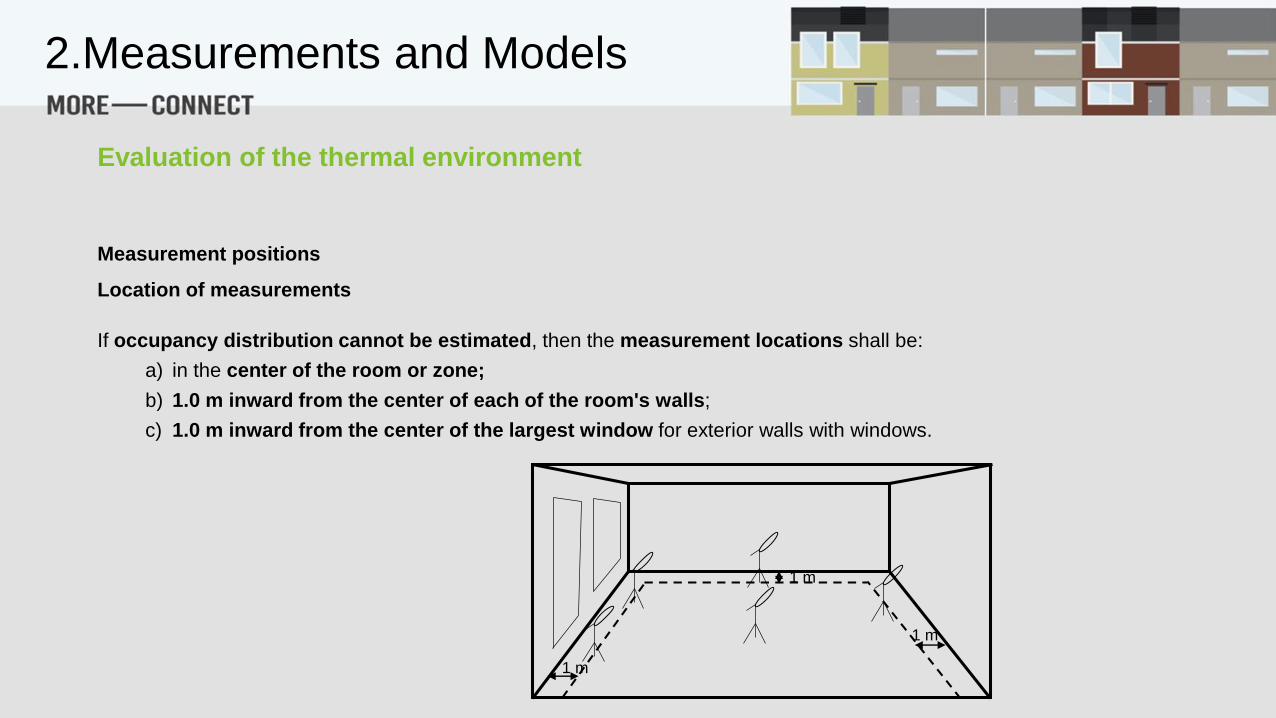
Measurement positions
Location of measurements
If occupancy distribution cannot be estimated, then the measurement locations shall be:
a) in the center of the room or zone;
b) 1.0 m inward from the center of each of the room's walls;
c) 1.0 m inward from the center of the largest window for exterior walls with windows.
1 m
1 m
1 m
2.Measurements and Models
Evaluation of the thermal environment

Measurement positions
Height above floor of measurements
http://www.blowtex-educair.it/
- 1.1 m (ta, va)
- 0.1 m (ta, va)
- 0.6 m (H, pa, ∆tpr)
- 0.1 m (ta, va)
- 1.1 m (H, pa, ∆tpr)
- 1.7 m (ta, va)
2.Measurements and Models
Evaluation of the thermal environment

Measuring Conditions
To determine the effectiveness of the building system at providing the environmental
conditions specified in the ASHRAE 55 Standard, measurements shall be made under the
following conditions:
• Heating period (winter conditions) → measurements shall be made when the indoor-
outdoor temperature difference is not less than 50% of the difference used for design
and with cloudy to partly cloudy sky conditions.
If these sky conditions are rare and not representative of the sky conditions used for
design, then sky conditions representative of design conditions are acceptable.
• Cooling period (summer conditions) → measurements shall be made when the outdoor-
indoor temperature difference and humidity difference are not less than 50% of the
differences used for design and with clear to partly cloudy sky conditions.
If these sky conditions are rare and not representative of the sky conditions used for
design, then sky conditions representative of design conditions are acceptable.
• Test interior zones of large buildings → measurements shall be made with the zone
loaded to at least 50% of the design load for at least one complete cycle of the HVAC
system, if not proportionally controlled.
Simulation of heat generated by occupants is recommended.
2.Measurements and Models
Evaluation of the thermal environment

Mechanical Equipment Operating Conditions
To determine appropriate corrective actions following the use of ASHRAE 55 Standard to
analyse the environment, the following operations of the mechanical system should be
measured concurrently with the environmental data:
• Air supply rate into the space being measured;
• Room/supply air temperature differential;
• Type and location of room diffuser or air outlet;
• Discharge air speed;
• Perimeter heat type, location and status;
• Return grille location and size;
• Type of air supply system;
• Surface temperatures of heated or cooled surfaces;
• Water supply and return temperatures of hydronic systems.
2.Measurements and Models
Evaluation of the thermal environment
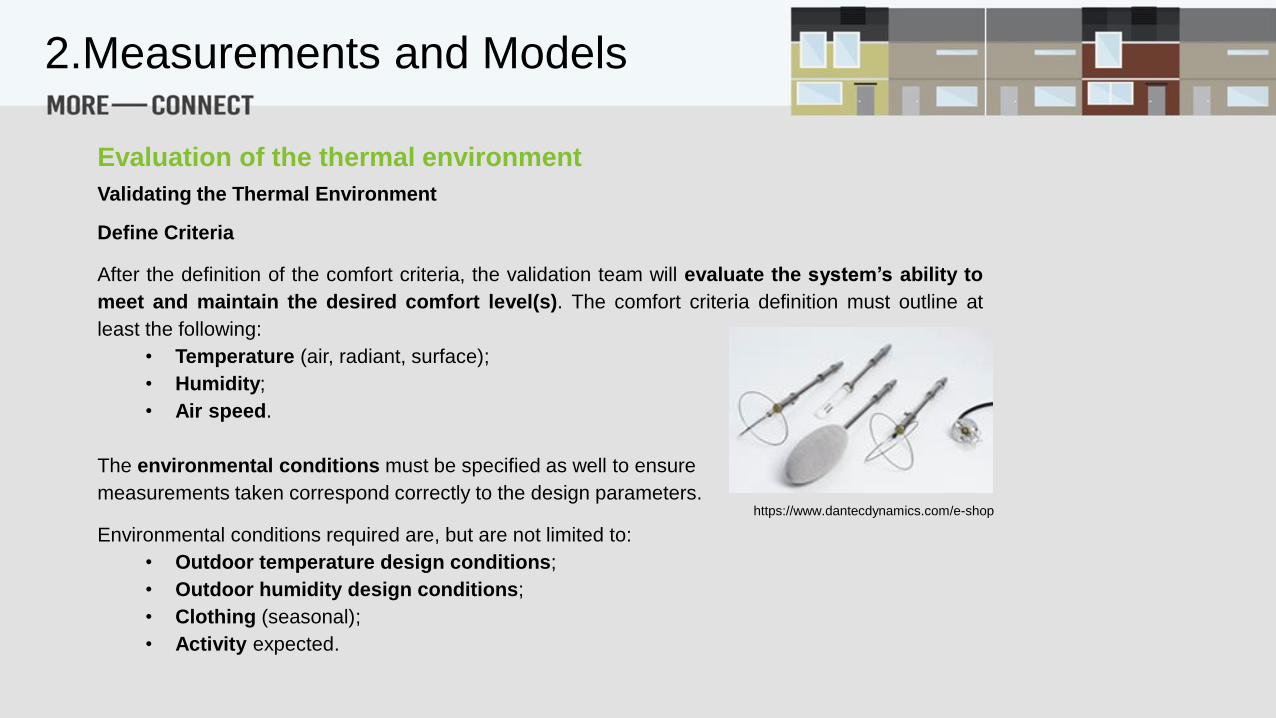
Validating the Thermal Environment
Define Criteria
After the definition of the comfort criteria, the validation team will evaluate the system’s ability to
meet and maintain the desired comfort level(s). The comfort criteria definition must outline at
least the following:
• Temperature (air, radiant, surface);
• Humidity;
• Air speed.
The environmental conditions must be specified as well to ensure
measurements taken correspond correctly to the design parameters.
Environmental conditions required are, but are not limited to:
• Outdoor temperature design conditions;
• Outdoor humidity design conditions;
• Clothing (seasonal);
• Activity expected.
https://www.dantecdynamics.com/e-shop
2.Measurements and Models
Evaluation of the thermal environment
Validating the Thermal Environment
Documentation
The validation also involves ensuring a thoroughly documented process.
The process must be well documented and turned over to the design engineer and the owner
for approval and for their records.
When surveying the occupants of a building the survey method must be developed, written, and
turned over, with the sample survey sheets to the design engineer and the owner for review
and approval.
At the completion of the survey, the survey sheets and analysis of the data shall be turned over
to the design engineer and the owner for review and sign-off of the validation process.
2.Measurements and Models
Evaluation of the thermal environment
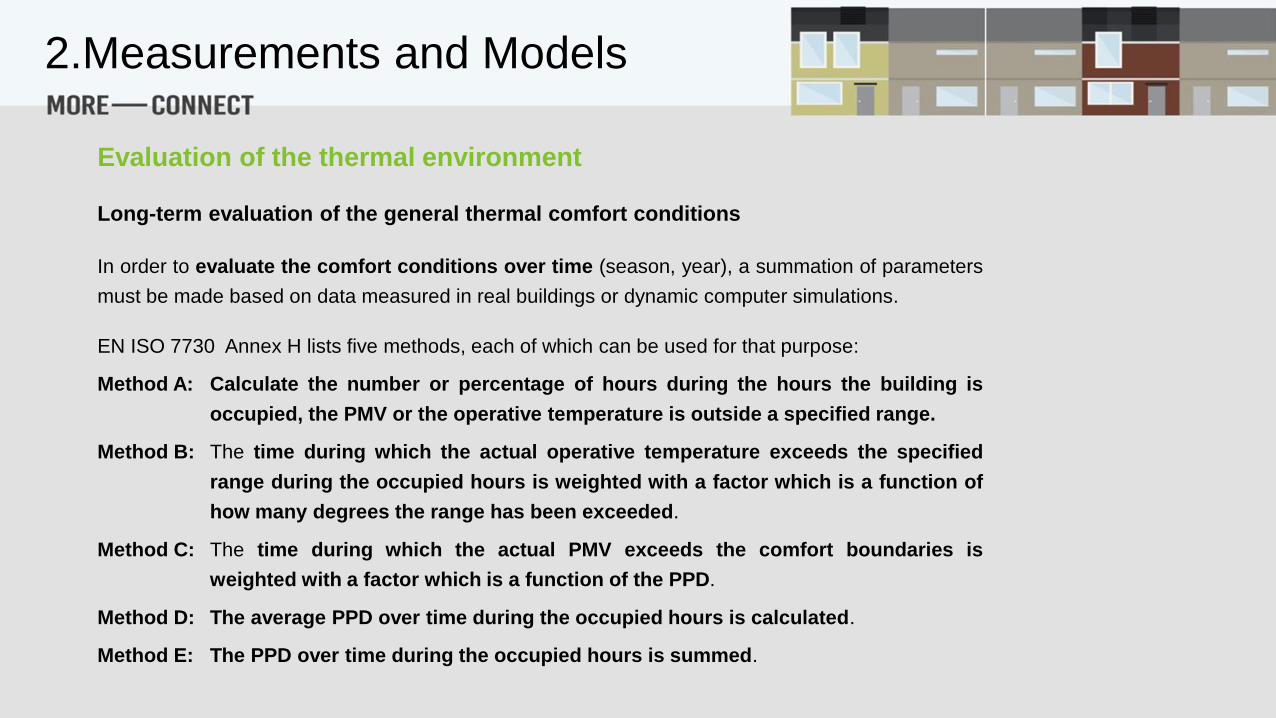
Long-term evaluation of the general thermal comfort conditions
In order to evaluate the comfort conditions over time (season, year), a summation of parameters
must be made based on data measured in real buildings or dynamic computer simulations.
EN ISO 7730 Annex H lists five methods, each of which can be used for that purpose:
Method A: Calculate the number or percentage of hours during the hours the building is
occupied, the PMV or the operative temperature is outside a specified range.
Method B: The time during which the actual operative temperature exceeds the specified
range during the occupied hours is weighted with a factor which is a function of
how many degrees the range has been exceeded.
Method C: The time during which the actual PMV exceeds the comfort boundaries is
weighted with a factor which is a function of the PPD.
Method D: The average PPD over time during the occupied hours is calculated.
Method E: The PPD over time during the occupied hours is summed.
2.Measurements and Models
Evaluation of the thermal environment

EN 15251:2007 - Inspections and measurement of the indoor environment in existing
buildings
Measurements shall be made where occupants are known to spend most of their time and under
representative weather condition of cold and warm season.
For the winter (heating season) measurements at or below mean outside temperatures for the 3
coldest months of the year.
For the summer (cooling season) measurements at or above statistic average outside temperatures
for the 3 warmest months of the year with clear sky.
The measurement period for all measured parameters should be long enough to be representative,
for example 10 days.
Air temperature in a room can be used in long term measurements and corrected for large hot or
cold surfaces to estimate the operative temperature of the room.
2.Measurements and Models
Evaluation of the thermal environment

EN 15251:2007 - Long term evaluation of the general thermal comfort conditions
According to EN 15251 to evaluate the comfort conditions over time (season, year) a
summation of parameters must be made based on data measured in real buildings or
dynamic computer simulations.
EN 15251 Annex F lists the methods, which can be used for that purpose:
Method A: Percentage outside the range - Calculate the number or percentage of occupied
hours (those during which the building is occupied) when the PMV or the operative
temperature is outside a specified range.
Method B: Degree hours criteria - The time during which the actual operative temperature
exceeds the specified range during the occupied hours is weighted by a factor
which is a function depending on by how many degrees, the range has been exceeded.
Method C: PPD weighted criteria - The time during which the actual PMV exceeds the
comfort boundaries is weighted by a factor which is a function of the PPD.
2.Measurements and Models
Evaluation of the thermal environment

Measuring instruments
Measured quantities
Main independent quantities involved in the analysis of the thermal balance between man and the thermal environment
Elements in the thermal balance
Quantities
ta va pa Icl Rcl M W
Air
temperature
Mean radiant
temperature
Air
velocity
Absolute humidity of the
air (partial pressure of
water vapour)
Insulation
of
clothing
Evaporative
resistance of
clothing
MetabolismExternal
work
Internal heat production, M-W X X
Heat transfer by radiation, R X X
Heat transfer by convection, C* X X X
Heat losses through evaporation:
- evaporation from the skin, E
- evaporation by respiration, Eres
XX
XX
X
Convection by respiration, Cres X X
* Heat transfer by convection is also influenced by body movements. The resultant air velocity at skin level is called relative air velocity (var). Heat conduction (surface
temperature) has only a limited influence on the thermal heat balance.
http://www.testolimited.com/testo-480-
high-end-vac-measuring-instrument
_
rt
Source: EN ISO 7726
2.Measurements and Models
Equipment and methods

Types of temperature sensor
a) Expansion thermometers:
1) liquid expansion thermometer (mercury);
2) solid expansion thermometer.
b) Electrical thermometers:
1) variable resistance thermometer
• platinum resistor;
• thermistor;
2) thermometer based on the generation of an electromotive force (thermocouple).
c) Thermom-anometers (variation in the pressure of a liquid as a function of temperature).
2.Measurements and Models
Equipment and methods
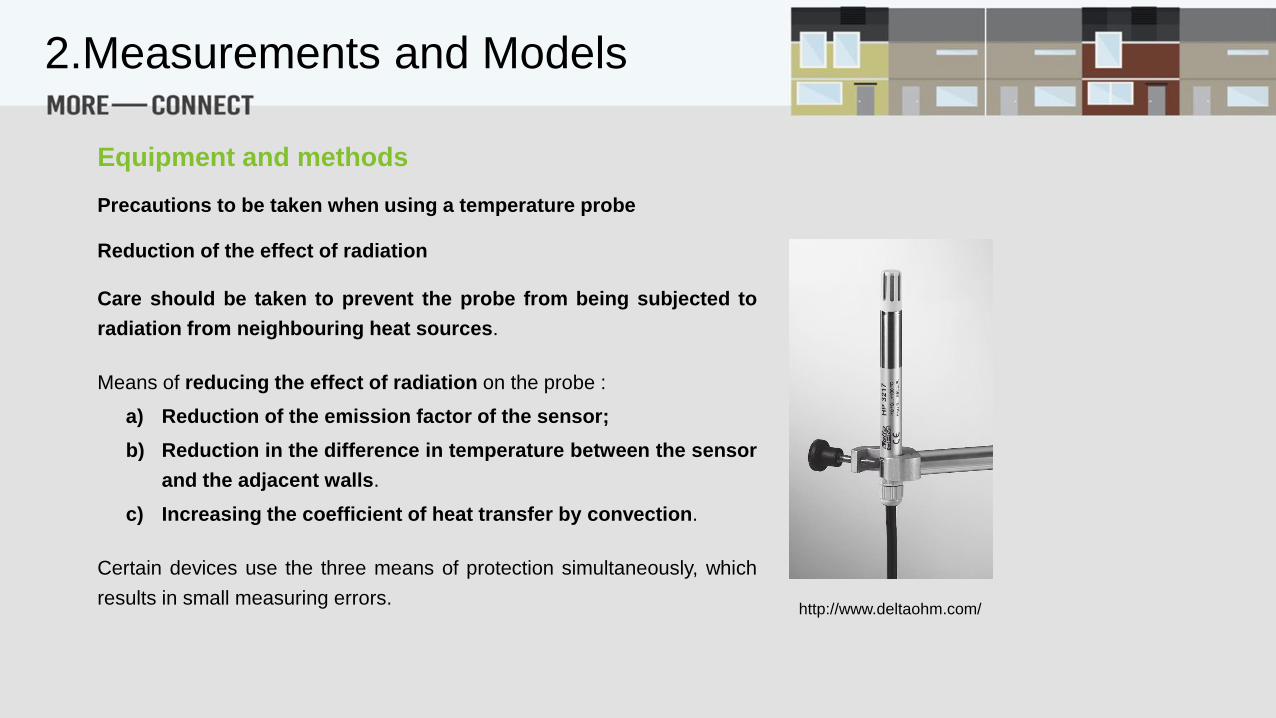
Precautions to be taken when using a temperature probe
Reduction of the effect of radiation
Care should be taken to prevent the probe from being subjected to
radiation from neighbouring heat sources.
Means of reducing the effect of radiation on the probe :
a) Reduction of the emission factor of the sensor;
b) Reduction in the difference in temperature between the sensor
and the adjacent walls.
c) Increasing the coefficient of heat transfer by convection.
Certain devices use the three means of protection simultaneously, which
results in small measuring errors.http://www.deltaohm.com/
2.Measurements and Models
Equipment and methods

The mean radiant temperature is the uniform temperature of an imaginary
enclosure in which radiant heat transfer from the human body is equal to
the radiant heat transfer in the actual non-uniform enclosure. The mean
radiant temperature is defined in relation to the human body.
The mean radiant temperature can be measured by instruments which allow
the generally heterogeneous radiation from the walls of an actual enclosure to
be "integrated" into a mean value.
The black globe thermometer is a device frequently used in order to derive
an approximate value of the mean radiant temperature from the observed
simultaneous values of the globe temperature, tg, and the temperature and the
velocity of the air surrounding the globe.
The spherical shape of the globe thermometer can give a reasonable
approximation of the shape of the body in the case of a seated person. An
ellipsoid-shaped sensor gives a closer approximation to the human shape
both in the upright position and the seated position.www.alphaomega-
electronics.com
2.Measurements and Models
Equipment and methods

Method for calculation of mean radiant temperature
Calculation from the temperature of the surrounding
surfaces
The mean radiant temperature can be calculated from
• the surface temperature of the surrounding
surfaces;
• the angle factor between a person and the
surrounding surfaces, a function of the shape,
the size and the relative positions of the surface
in relation to the person.
As most building materials have a high emissivity (e), it
is possible to disregard the reflection i.e. to assume that
all the surfaces in the room are black.
Mean value of angle factor
between a seated person and a
vertical rectangle (above or below
his centre) when the person is
rotated around a vertical axis. (To
be used when the location but not
the orientation of the person is
known).
Mean value of angle factor
between a seated person and a
horizontal rectangle (on the ceiling
or on the floor) when the person is
rotated around a vertical axis. (To
be used when the location but not
the orientation of the person is
known.)
Source: ISO
7726
2.Measurements and Models
Equipment and methods
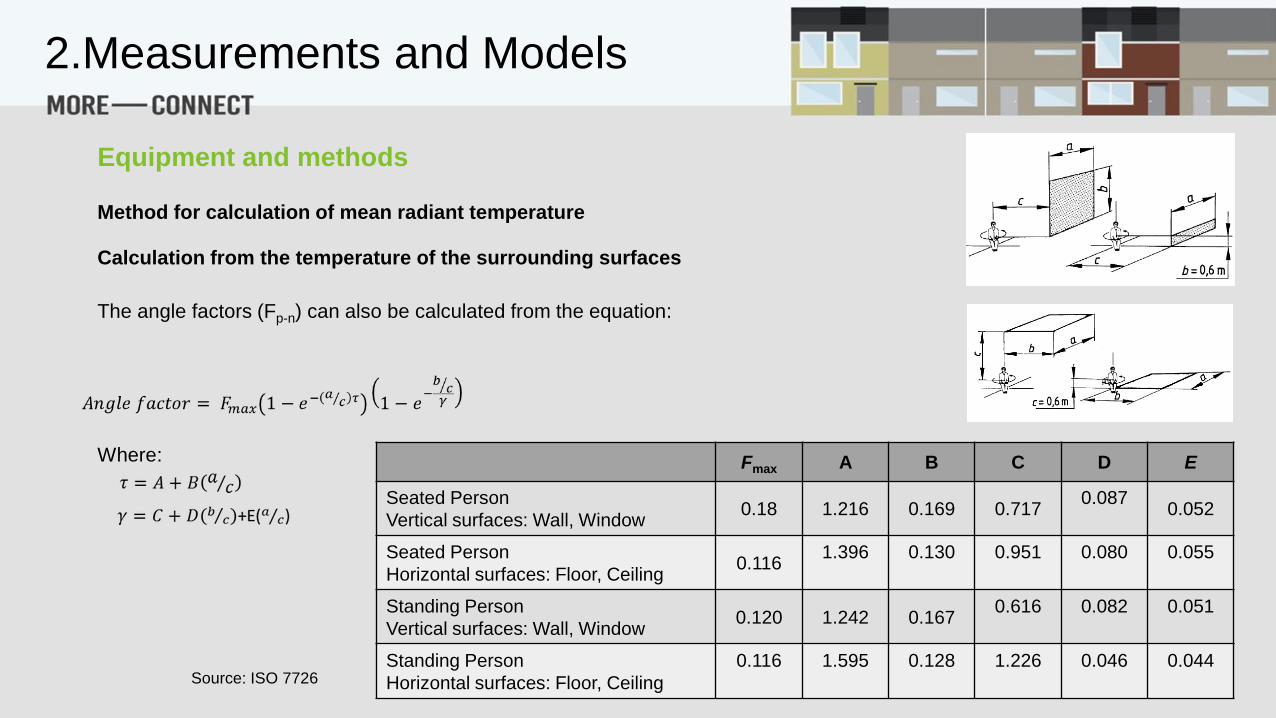
Method for calculation of mean radiant temperature
Calculation from the temperature of the surrounding surfaces
The angle factors (Fp-n) can also be calculated from the equation:
Where:
Source: ISO 7726
Fmax A B C D E
Seated Person
Vertical surfaces: Wall, Window0.18 1.216 0.169 0.717
0.0870.052
Seated Person
Horizontal surfaces: Floor, Ceiling0.116
1.396 0.130 0.951 0.080 0.055
Standing Person
Vertical surfaces: Wall, Window0.120 1.242 0.167
0.616 0.082 0.051
Standing Person
Horizontal surfaces: Floor, Ceiling
0.116 1.595 0.128 1.226 0.046 0.044
2.Measurements and Models
Equipment and methods
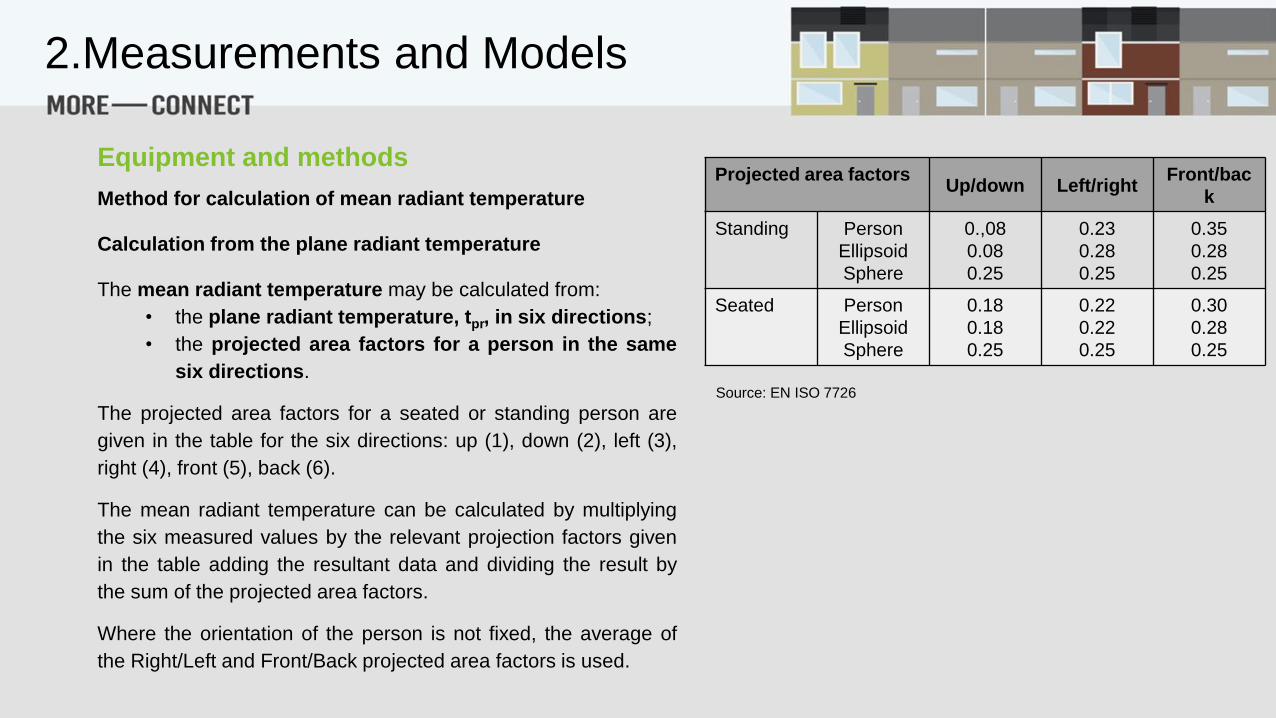
Method for calculation of mean radiant temperature
Calculation from the plane radiant temperature
The mean radiant temperature may be calculated from:
• the plane radiant temperature, tpr, in six directions;
• the projected area factors for a person in the same
six directions.
The projected area factors for a seated or standing person are
given in the table for the six directions: up (1), down (2), left (3),
right (4), front (5), back (6).
The mean radiant temperature can be calculated by multiplying
the six measured values by the relevant projection factors given
in the table adding the resultant data and dividing the result by
the sum of the projected area factors.
Where the orientation of the person is not fixed, the average of
the Right/Left and Front/Back projected area factors is used.
Projected area factorsUp/down Left/right
Front/bac
k
Standing Person
Ellipsoid
Sphere
0.,08
0.08
0.25
0.23
0.28
0.25
0.35
0.28
0.25
Seated Person
Ellipsoid
Sphere
0.18
0.18
0.25
0.22
0.22
0.25
0.30
0.28
0.25
Source: EN ISO 7726
2.Measurements and Models
Equipment and methods
www.kippzonen.com
http://www.deltaohm.com
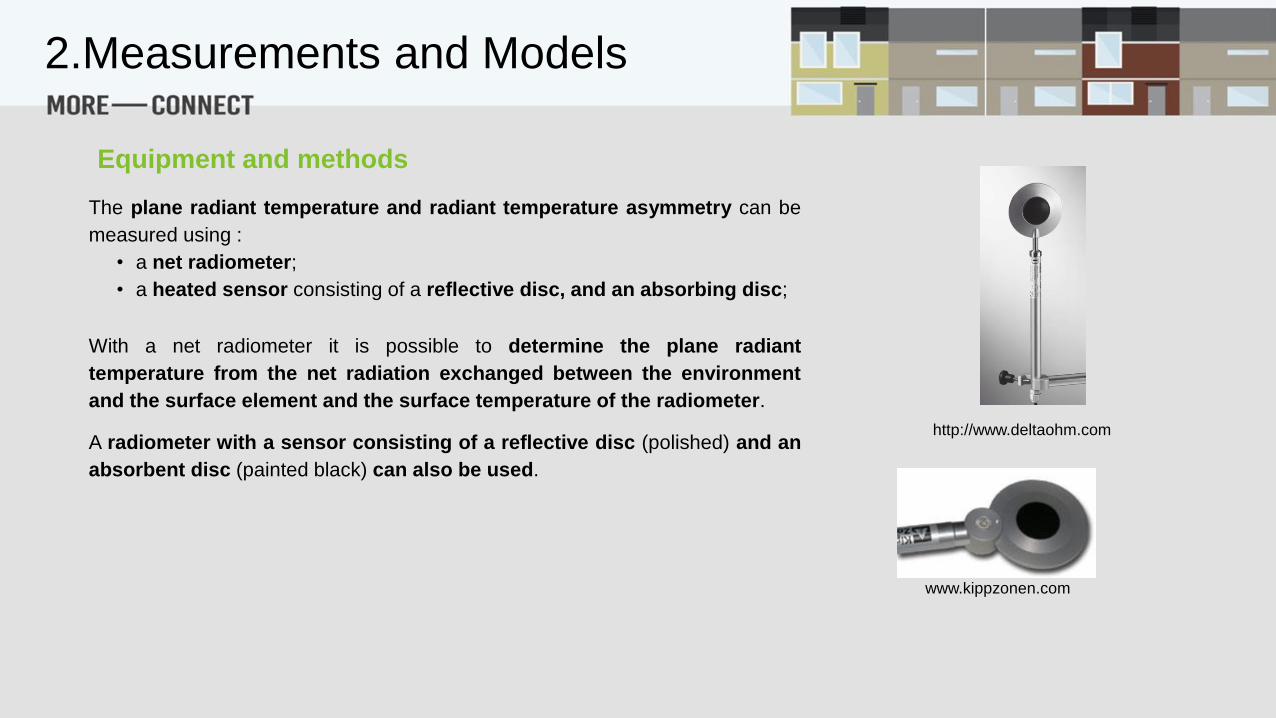
The plane radiant temperature and radiant temperature asymmetry can be
measured using :
• a net radiometer;
• a heated sensor consisting of a reflective disc, and an absorbing disc;
With a net radiometer it is possible to determine the plane radiant
temperature from the net radiation exchanged between the environment
and the surface element and the surface temperature of the radiometer.
A radiometer with a sensor consisting of a reflective disc (polished) and an
absorbent disc (painted black) can also be used.
2.Measurements and Models
Equipment and methods
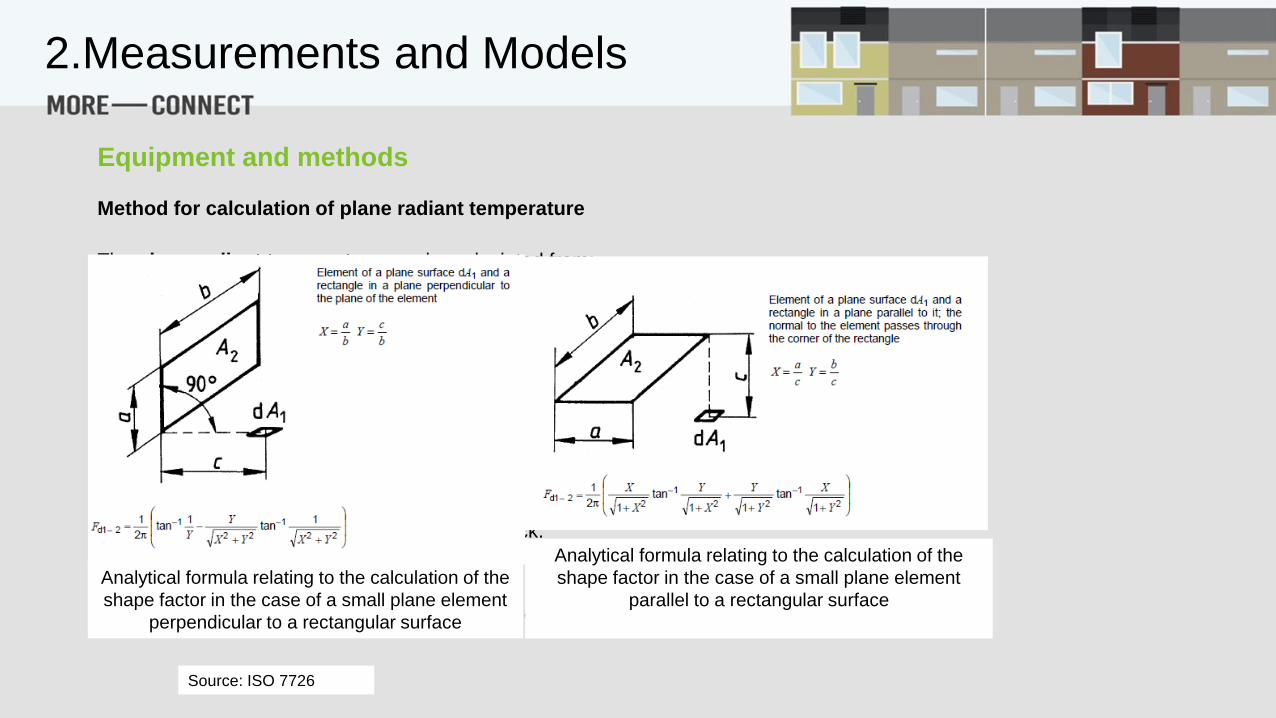
Method for calculation of plane radiant temperature
The plane radiant temperature can be calculated from:
• the surface temperature of the surrounding surfaces;
• the angle factor between a small plane element and the surrounding surfaces, a function
of the shape, the size and the relative position of the surface in relation to a person.
The radiant temperature asymmetry is estimated as the difference between the plane radiant
temperature in two opposite directions.
As most building materials have a high emittance (e), it is possible to disregard the reflections, i.e. to
assume that all the surfaces in the room are black.
The plane radiant temperature is calculated as the mean value of the surface temperatures
weighted according to the magnitude of the respective angle factors.
Analytical formula relating to the calculation of the
shape factor in the case of a small plane element
perpendicular to a rectangular surface
Analytical formula relating to the calculation of the
shape factor in the case of a small plane element
parallel to a rectangular surface
Source: ISO 7726
2.Measurements and Models
Equipment and methods
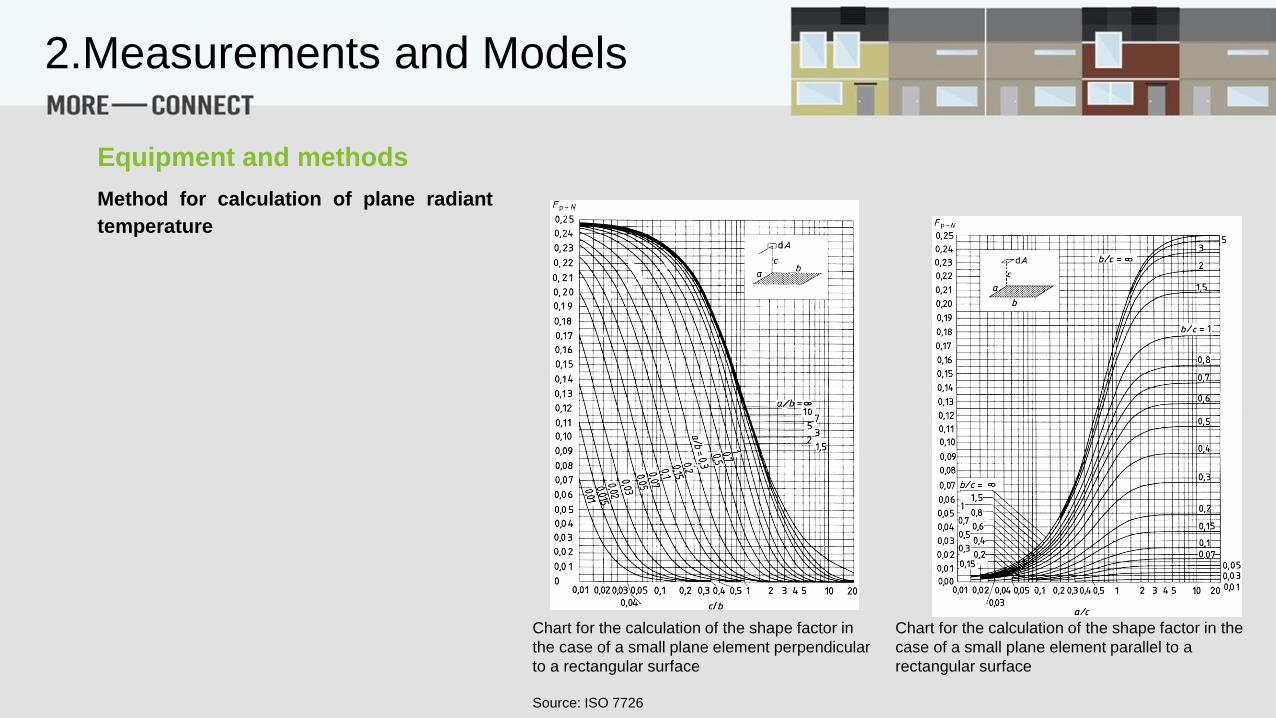
Method for calculation of plane radiant
temperature
Chart for the calculation of the shape factor in
the case of a small plane element perpendicular
to a rectangular surface
Chart for the calculation of the shape factor in the
case of a small plane element parallel to a
rectangular surface
Source: ISO 7726
2.Measurements and Models
Equipment and methods

The absolute humidity can be determined:
• Directly:
- dew-point instruments;
- electrolytic instruments; or
• Indirectly by the measurement of several quantities
simultaneously:
- relative humidity and temperature of the air;
- psychrometric wet temperature; and
- temperature of the air.
http://www.dpi.nsw.gov.au/agriculture/h
orticulture/greenhouse/structures/evap-
cooling
http://www.deltaohm.com/
2.Measurements and Models
Equipment and methods
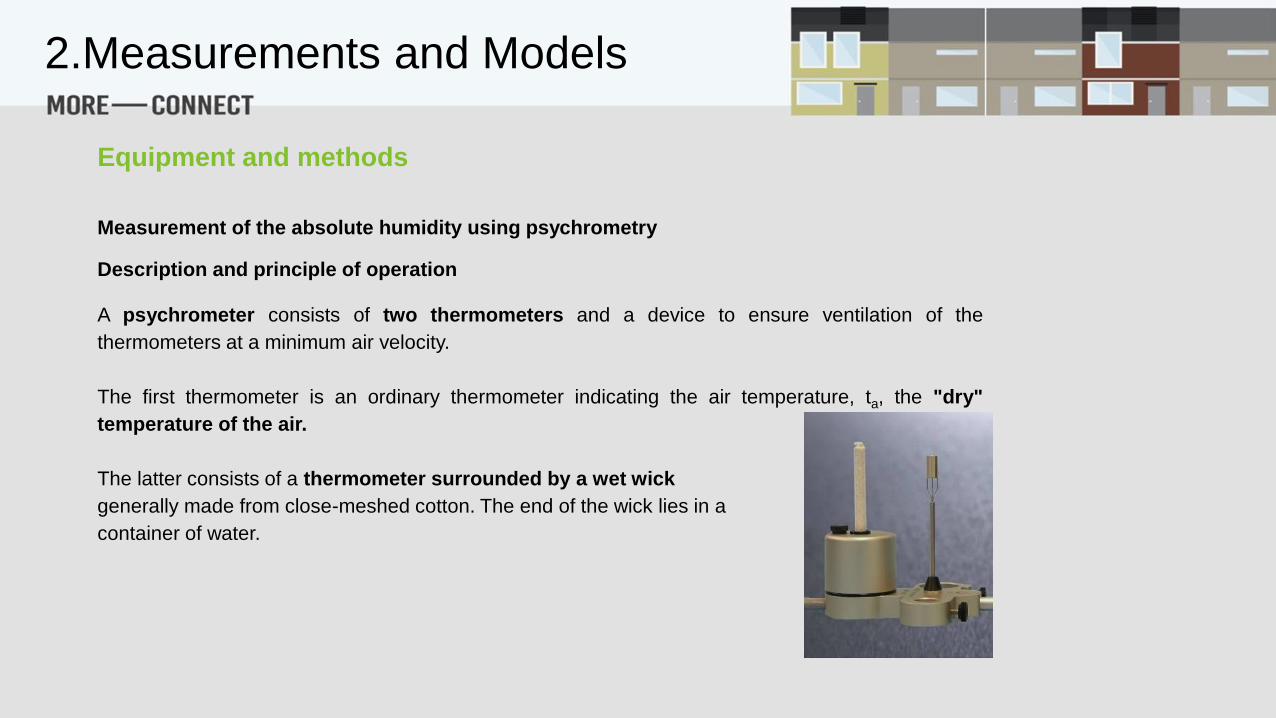
Measurement of the absolute humidity using psychrometry
Description and principle of operation
A psychrometer consists of two thermometers and a device to ensure ventilation of the
thermometers at a minimum air velocity.
The first thermometer is an ordinary thermometer indicating the air temperature, ta, the "dry"
temperature of the air.
The latter consists of a thermometer surrounded by a wet wick
generally made from close-meshed cotton. The end of the wick lies in a
container of water.
2.Measurements and Models
Equipment and methods
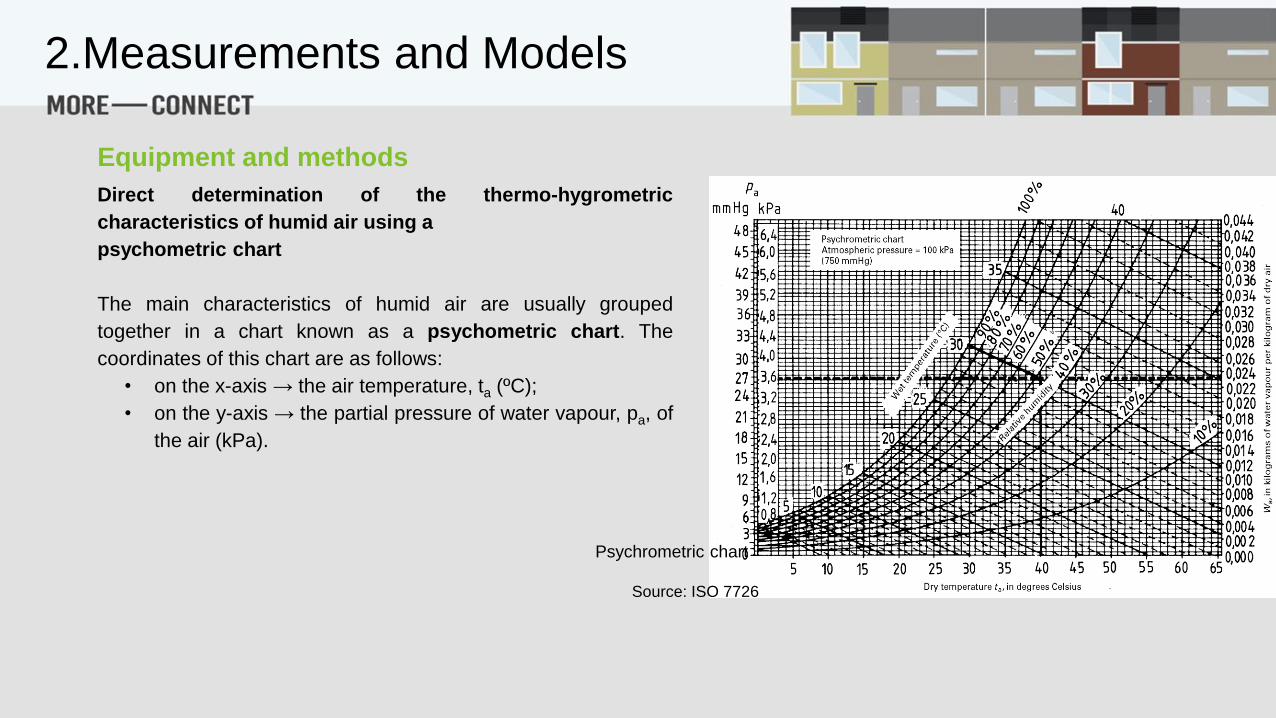
Direct determination of the thermo-hygrometric
characteristics of humid air using a
psychometric chart
The main characteristics of humid air are usually grouped
together in a chart known as a psychometric chart. The
coordinates of this chart are as follows:
• on the x-axis → the air temperature, ta (ºC);
• on the y-axis → the partial pressure of water vapour, pa, of
the air (kPa).
Psychrometric chart
Source: ISO 7726
2.Measurements and Models
Equipment and methods

The air velocity is a quantity defined by its magnitude and direction.
The quantity to be considered in the case of thermal environments is the speed of the air, i.e. the
magnitude of the velocity vector of the flow at the measuring point considered.
The following factors must be considered for accurate velocity measurements:
a) the calibration of the instrument;
b) the response time of the sensor and the instrument;
c) the measuring period.
Types of anemometers
The air velocity, Va, can be determined:
• either by the use of an omnidirectional probe which is sensitive to the magnitude of the
velocity whatever its direction (hot-sphere sensor);
• or by the use of three directional sensors which allow the components of the air velocity to
be measured along three perpendicular axis (cosine law).
In practice it is very difficult to measure accurately in one direction.
https://www.dantecdynamics.com/e-shop
2.Measurements and Models
Equipment and methods

The surface temperature can be measured by the method given in
EN ISO 7726 Annex F, including:
• contact thermometer, where the sensor is in direct contact
with the surface.
• infrared sensor, where the radiant heat flux from the surface
is measured and converted to a temperature. This may be
influenced by the emissivity of surface.
http://www.deltaohm.com
2.Measurements and Models
Equipment and methods

Characteristics of measuring instruments
Characteristics of instruments for measuring the basic quantities
Class C (Comfort) Class S (thermal stress)
CommentsMeasuring
range
Accuracy Response time
(90%)
Measuring
range
Accuracy Response time
(90%)
10ºC to
40ºC
The shortest
possible. Value
to be specified
as characteristic
of the measuring
instrument.
-40ºC to
+120ºC
The shortest
possible. Value
to be specified
as characteristic
of the measuring
instrument.
The air temperature
sensor shall be
effectively protected
from any effects of the
thermal radiation
coming from hot or
cold Wall. Na
indication of the mean
value over a period of
1 min is also desirable
Characteristics of measuring instruments – Air temperature (ta)
Source: EN ISO 7726
2.Measurements and Models
Equipment and methods

Characteristics of measuring instruments
Characteristics of instruments for measuring the basic quantities
Class C (Comfort) Class S (thermal stress)
CommentsMeasuring
range
Accuracy Response time
(90%)
Measuring
range
Accuracy Response time
(90%)
10ºC to
40ºC
Required: ± 2ºC
Desirable: ± 0.2ºC
These levels are
difficult or even
impossible to achieve
in certain cases with
the equipment
normally available.
When they cannot be
achieved, indicate the
actual measuring
precision.
The shortest
possible. Value
to be specified
as
characteristic of
the measuring
instrument.
-40ºC to
+150ºC
The shortest
possible. Value
to be specified
as
characteristic of
the measuring
instrument.
When the
measurement is
carried out with a
black sphere, the
inaccuracy relating to
the mean radiant
temperature can be
as high as ± 5ºC for
class C and ± 20ºC
for class S according
to the environment
and the inaccuracy
for Va, ta and tg.
Source: EN ISO 7726
2.Measurements and Models
Equipment and methods
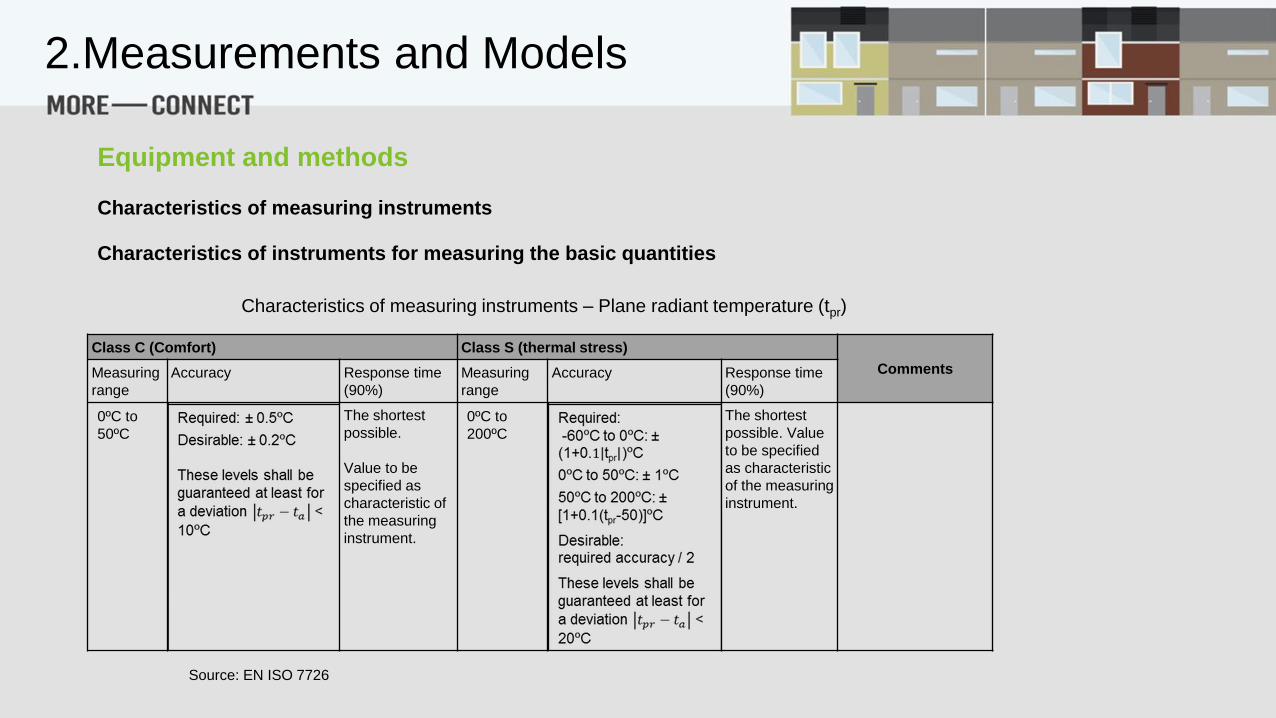
Characteristics of measuring instruments
Characteristics of instruments for measuring the basic quantities
Characteristics of measuring instruments – Plane radiant temperature (tpr)
Class C (Comfort) Class S (thermal stress)
CommentsMeasuring
range
Accuracy Response time
(90%)
Measuring
range
Accuracy Response time
(90%)
0ºC to
50ºC
The shortest
possible.
Value to be
specified as
characteristic of
the measuring
instrument.
0ºC to
200ºC
The shortest
possible. Value
to be specified
as characteristic
of the measuring
instrument.
Source: EN ISO 7726
2.Measurements and Models
Equipment and methods
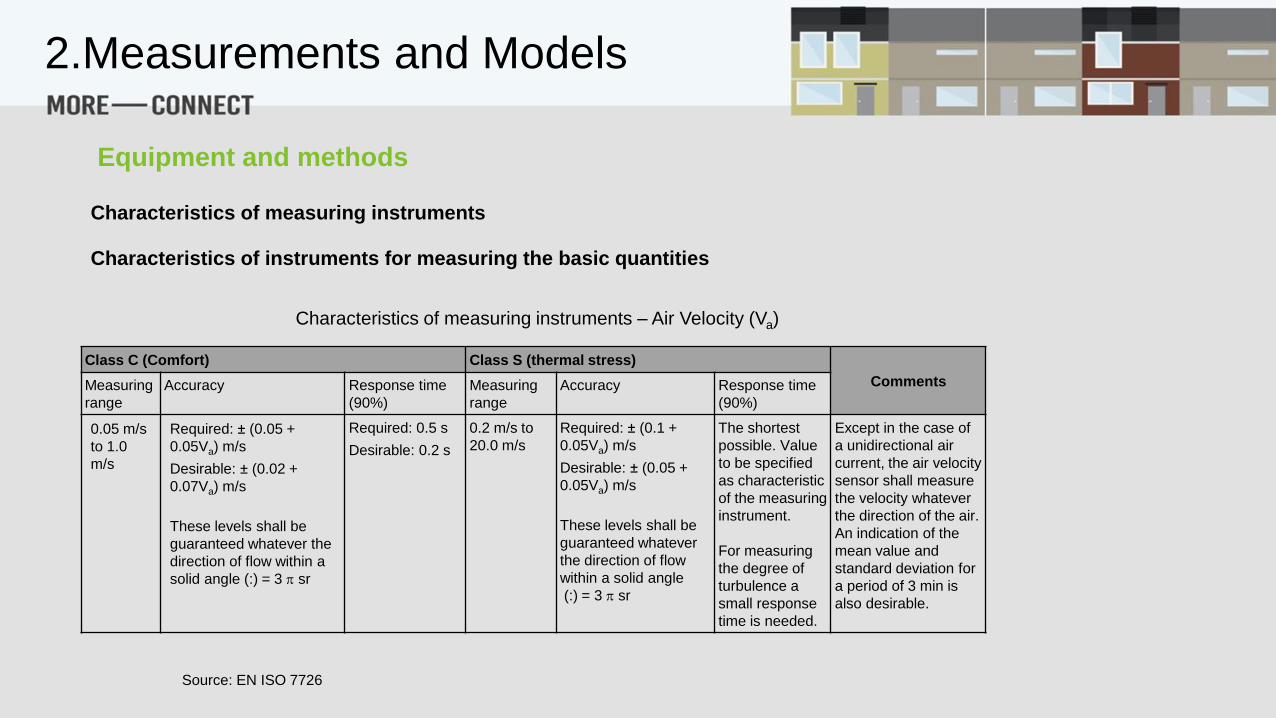
Characteristics of measuring instruments
Characteristics of instruments for measuring the basic quantities
Characteristics of measuring instruments – Air Velocity (Va)
Class C (Comfort) Class S (thermal stress)
CommentsMeasuring
range
Accuracy Response time
(90%)
Measuring
range
Accuracy Response time
(90%)
0.05 m/s
to 1.0
m/s
Required: ± (0.05 +
0.05Va) m/s
Desirable: ± (0.02 +
0.07Va) m/s
These levels shall be
guaranteed whatever the
direction of flow within a
solid angle (:) = 3 sr
Required: 0.5 s
Desirable: 0.2 s
0.2 m/s to
20.0 m/s
Required: ± (0.1 +
0.05Va) m/s
Desirable: ± (0.05 +
0.05Va) m/s
These levels shall be
guaranteed whatever
the direction of flow
within a solid angle
(:) = 3 sr
The shortest
possible. Value
to be specified
as characteristic
of the measuring
instrument.
For measuring
the degree of
turbulence a
small response
time is needed.
Except in the case of
a unidirectional air
current, the air velocity
sensor shall measure
the velocity whatever
the direction of the air.
An indication of the
mean value and
standard deviation for
a period of 3 min is
also desirable.
Source: EN ISO 7726
2.Measurements and Models
Equipment and methods

Characteristics of measuring instruments
Characteristics of instruments for measuring the basic quantities
Characteristics of measuring instruments – Absolute humidity expressed as partial pressure of water
vapour (pa)
Class C (Comfort) Class S (thermal stress)
CommentsMeasuring
range
Accuracy Response time
(90%)
Measuring
range
Accuracy Response time
(90%)
0.5 kPa to
3.0 kPa
The shortest
possible. Value
to be specified
as characteristic
of the measuring
instrument.
0.5 kPa to
6.0 kPa
The shortest
possible. Value
to be specified
as characteristic
of the measuring
instrument.
Source: EN ISO 7726
2.Measurements and Models
Equipment and methods
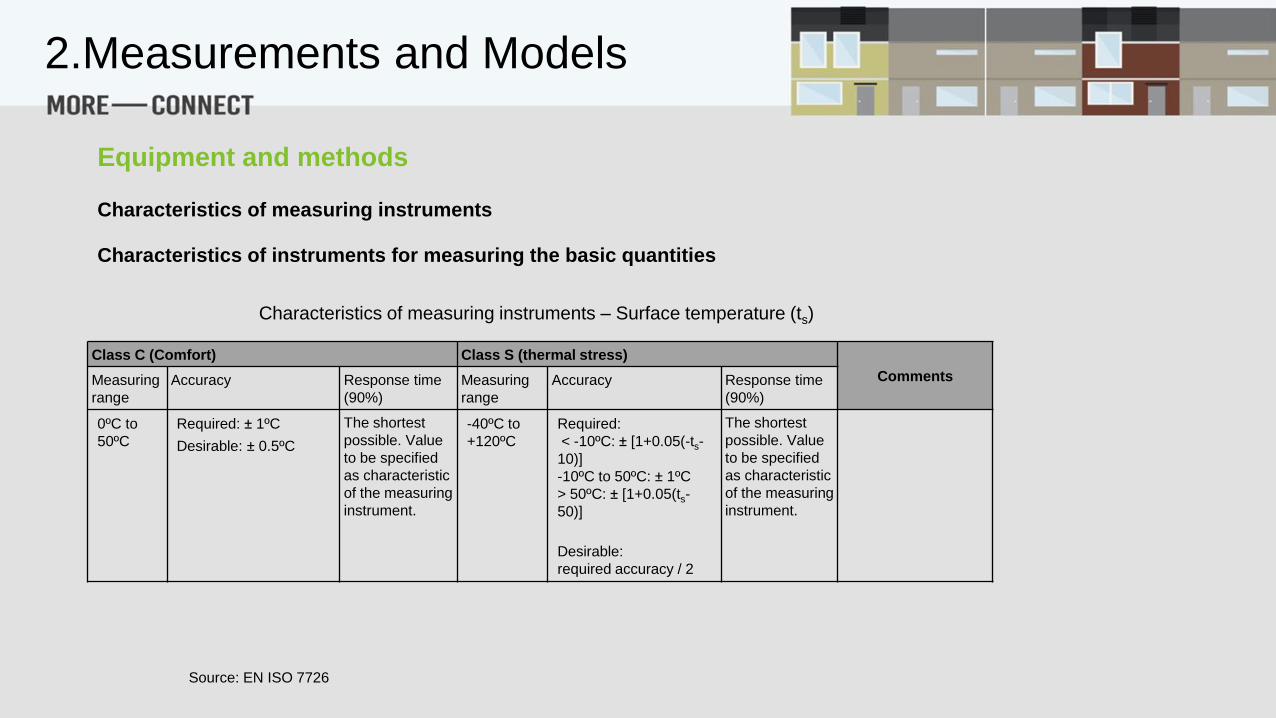
Characteristics of measuring instruments
Characteristics of instruments for measuring the basic quantities
Characteristics of measuring instruments – Surface temperature (ts)
Class C (Comfort) Class S (thermal stress)
CommentsMeasuring
range
Accuracy Response time
(90%)
Measuring
range
Accuracy Response time
(90%)
0ºC to
50ºC
Required: ± 1ºC
Desirable: ± 0.5ºC
The shortest
possible. Value
to be specified
as characteristic
of the measuring
instrument.
-40ºC to
+120ºC
Required:
< -10ºC: ± [1+0.05(-ts-
10)]
-10ºC to 50ºC: ± 1ºC
> 50ºC: ± [1+0.05(ts-
50)]
Desirable:
required accuracy / 2
The shortest
possible. Value
to be specified
as characteristic
of the measuring
instrument.
Source: EN ISO 7726
2.Measurements and Models
Equipment and methods

Characteristics of measuring instruments for measuring the basic quantities
The standard environmental conditions specified shall be used as a reference except where this
contradicts the principle for measuring the quantities under consideration.
Standard environmental conditions for the determinations of time constants of sensors
Quantities of the standard
environment
Measurement of the
response time of sensors for
ta pa va
Air temperature = ta Any < 0.15 m/s
Mean radiant temperature Any < 0.15 m/s
Absolute humidity = 20ºC = ta To be specified according to the measuring method
Air velocity = 20ºC = ta Any
Plane radiant temperature = 20ºC = ta Any < 0.15 m/s
Surface temperature = 20ºC = ta Any < 0.15 m/s
Source: EN ISO 7726
2.Measurements and Models
Equipment and methods
Specifications relating to measuring methods
The methods for measuring the physical characteristics of the environment shall take account of the
fact that these characteristics vary in location and time.
The thermal environment may vary with the horizontal location, and then account has to be taken of
how long a time a person is working at the different locations.
The environment may also vary in the vertical direction.
2.Measurements and Models
Equipment and methods
Specifications relating to measuring methods
Specifications relating to variations in the physical quantities within the space surrounding
the subject
When the environment is too heterogeneous, the physical quantities shall be measured at
several locations at or around the subject and account taken of the partial results obtained in
order to determine the mean value of the quantities to be considered in assessing the comfort or
the thermal stress.
Previous analyses of the thermal stress of the work places being studied or of work places of a
similar type may provide information which is of interest in determining whether certain of the
quantities are distributed in a homogeneous way.
In the case of poorly defined rooms or work places consider only a limited zone of occupancy
where the criteria of comfort or thermal stress shall be respected.
In case of dispute in the interpretation of data, measurements carried out presuming the
environment to be heterogeneous shall be used as a reference.
2.Measurements and Models
Equipment and methods
Specifications relating to measuring methods
Specifications relating to variations in the physical quantities within the space surrounding
the subject
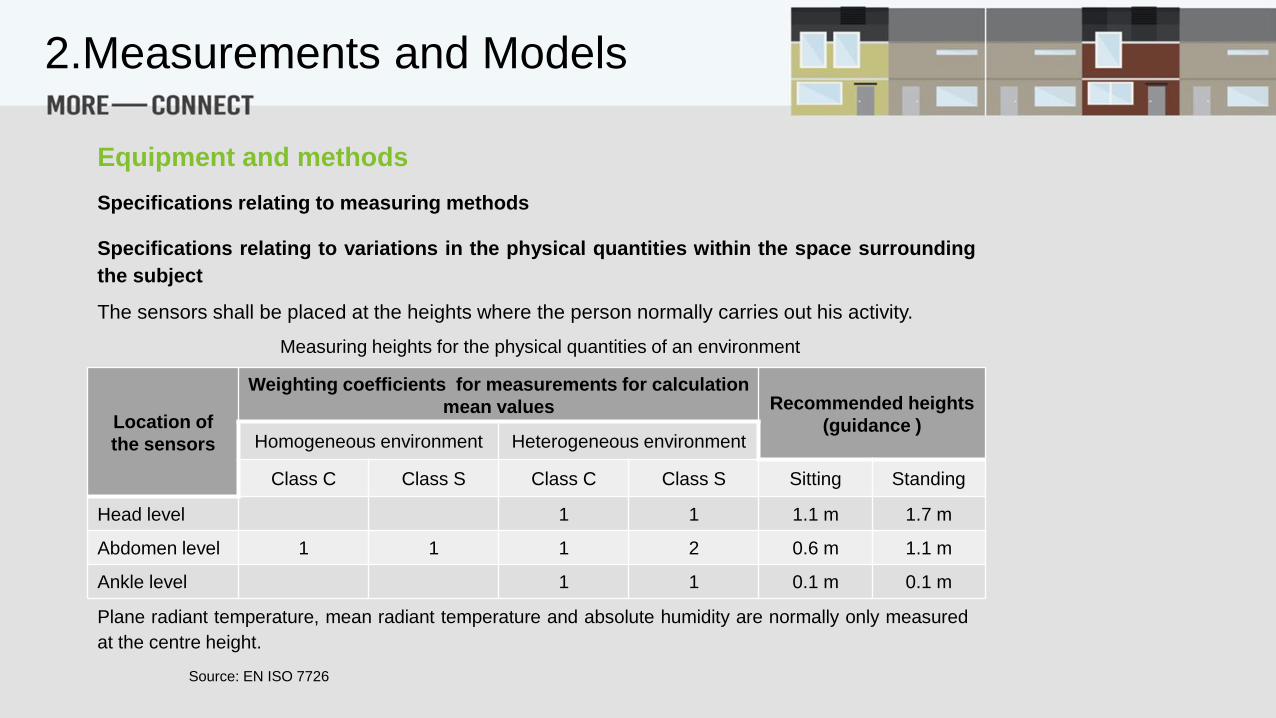
The sensors shall be placed at the heights where the person normally carries out his activity.
Location of
the sensors
Weighting coefficients for measurements for calculation
mean values Recommended heights
(guidance )Homogeneous environment Heterogeneous environment
Class C Class S Class C Class S Sitting Standing
Head level 1 1 1.1 m 1.7 m
Abdomen level 1 1 1 2 0.6 m 1.1 m
Ankle level 1 1 0.1 m 0.1 m
Measuring heights for the physical quantities of an environment
Plane radiant temperature, mean radiant temperature and absolute humidity are normally only measured
at the centre height.
Source: EN ISO 7726
2.Measurements and Models
Equipment and methods
Source: EN ISO 7726
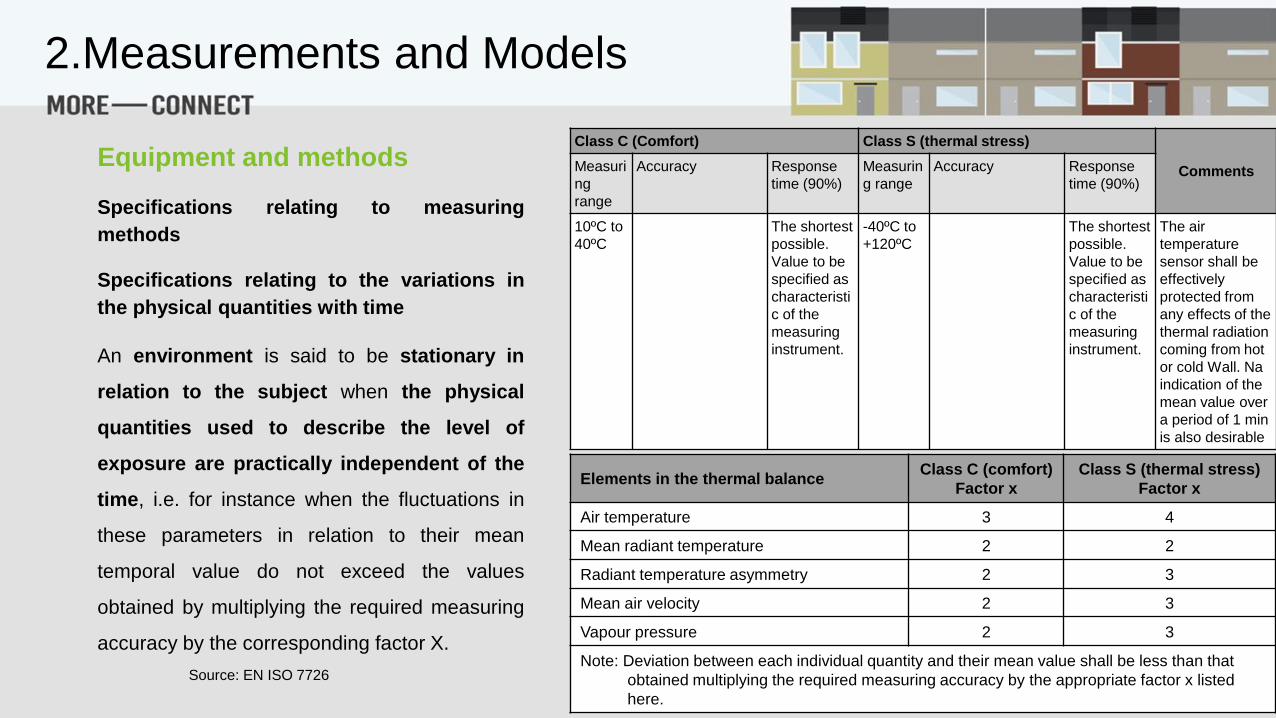
Specifications relating to measuring
methods
Specifications relating to the variations in
the physical quantities with time
An environment is said to be stationary in
relation to the subject when the physical
quantities used to describe the level of
exposure are practically independent of the
time, i.e. for instance when the fluctuations in
these parameters in relation to their mean
temporal value do not exceed the values
obtained by multiplying the required measuring
accuracy by the corresponding factor X.
Class C (Comfort) Class S (thermal stress)
CommentsMeasuri
ng
range
Accuracy Response
time (90%)
Measurin
g range
Accuracy Response
time (90%)
10ºC to
40ºC
The shortest
possible.
Value to be
specified as
characteristi
c of the
measuring
instrument.
-40ºC to
+120ºC
The shortest
possible.
Value to be
specified as
characteristi
c of the
measuring
instrument.
The air
temperature
sensor shall be
effectively
protected from
any effects of the
thermal radiation
coming from hot
or cold Wall. Na
indication of the
mean value over
a period of 1 min
is also desirable
Elements in the thermal balanceClass C (comfort)
Factor x
Class S (thermal stress)
Factor x
Air temperature 3 4
Mean radiant temperature 2 2
Radiant temperature asymmetry 2 3
Mean air velocity 2 3
Vapour pressure 2 3
Note: Deviation between each individual quantity and their mean value shall be less than that
obtained multiplying the required measuring accuracy by the appropriate factor x listed
here.
2.Measurements and Models
Equipment and methods

Operative temperature (to) is defined as the uniform temperature of an enclosure in which an
occupant would exchange the same amount of heat by radiation plus convection as in the
existing non-uniform environment.
Where:
ta – air temperature 𝑡𝑟 – mean radiant temperature
hc – heat-transfer coefficient by convection
hc – heat-transfer coefficient by radiation.
In general:
hr = 4,9 w/m2k
hc = 2,9 w/m2k
If :
- surfaces with very different temperatures - hr = 𝑡𝑟;
- high air velocities (var >0.2 m/s) - hc = (10. var ) 1/2.
𝑡𝑜 =ℎ𝑐 . 𝑡𝑎 + ℎ𝑟 . 𝑡𝑟
ℎ𝑐 + ℎ𝑟
2.Measurements and Models
Equipment and methods
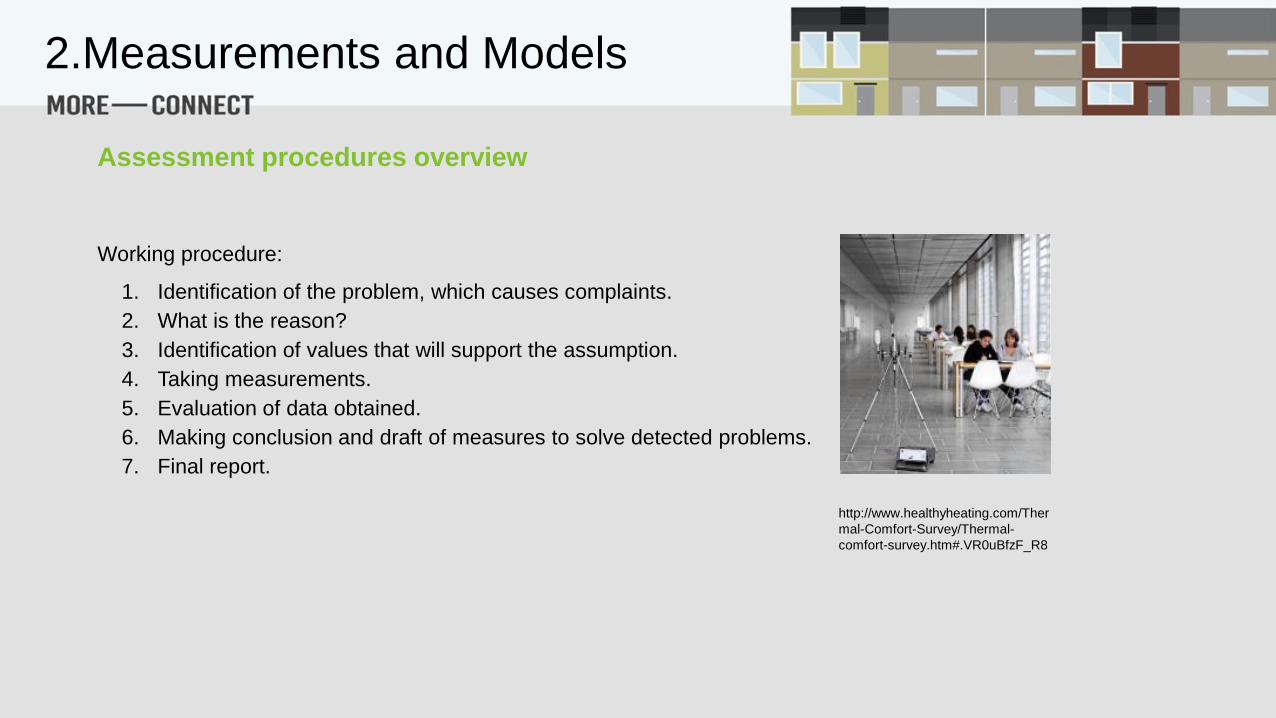
Working procedure:
1. Identification of the problem, which causes complaints.
2. What is the reason?
3. Identification of values that will support the assumption.
4. Taking measurements.
5. Evaluation of data obtained.
6. Making conclusion and draft of measures to solve detected problems.
7. Final report.
http://www.healthyheating.com/Ther
mal-Comfort-Survey/Thermal-
comfort-survey.htm#.VR0uBfzF_R8
2.Measurements and Models
Assessment procedures overview
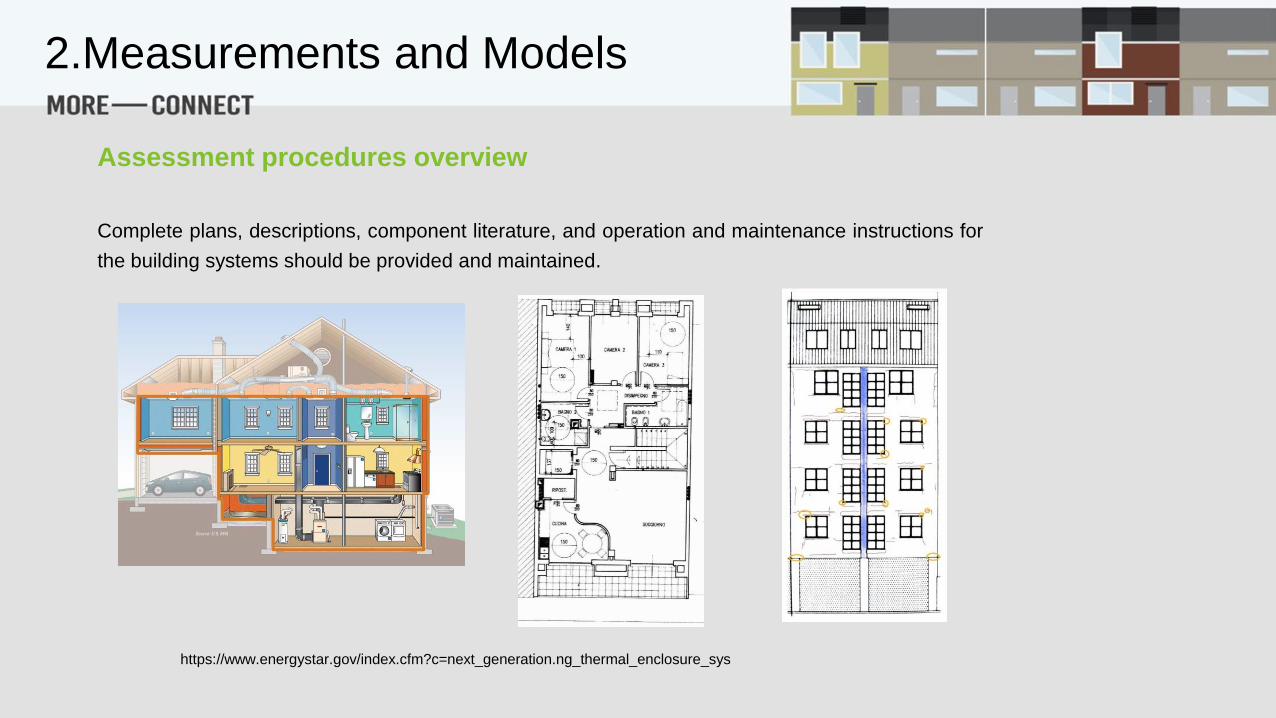
Complete plans, descriptions, component literature, and operation and maintenance instructions for
the building systems should be provided and maintained.
https://www.energystar.gov/index.cfm?c=next_generation.ng_thermal_enclosure_sys
2.Measurements and Models
Assessment procedures overview
The information should include, but not be limited to, building system design specifications
and design intent as follows:
1. The design criteria of the system in terms of indoor temperature and humidity,
including any tolerance or range, based on stated design outdoor ambient conditions
and total indoor loads, should be stated. Values assumed for comfort parameters,
including clothing and metabolic rate, used in calculation of design temperatures,
should be clearly stated.
2. The system input or output capacities necessary to attain the design indoor
conditions at design outdoor ambient conditions should be stated, as well as the full
input or output capacities of the system as supplied and installed.
3. The limitations of the system to control the environment of the zone (s) should be
stated whether based on temperature, humidity, ventilation, time of week, time of day,
or seasonal criteria.
2.Measurements and Models
Assessment procedures overview

4. The overall space supplied by the system should be shown in a plan view layout,
with individual zones within it identified. All registers or terminal units should be
shown and identified with type, flow, or radiant value.
5. Significant structural and decor items should be shown and identified if they
affect indoor comfort. Notes should be provided to identify which areas within a
space, and what locations relative to registers, terminal units, relief grills, and control
sensors should not be obstructed as this would negatively affect indoor comfort.
6. Areas within any zone that lie outside the comfort control areas, where people
should not be permanently located, should be identified.
The information should include, but not be limited to, building system design specifications
and design intent as follows:
2.Measurements and Models
Assessment procedures overview
7. Locations of all occupant adjustable controls should be identified, and each should
be provided with a legend describing what zone(s) it controls, what function(s) it
controls, how it is to be adjusted, the range of effect it can have, and the
recommended setting for various times of day, season, or occupancy load.
8. If more than one comfort level is available for any zone(s), they should be identified as
A, B, C etc., with A being the narrowest range (highest comfort), and the specifications
as above should be provided for each, along with the relative seasonal energy usage
for each at 80 % of design ambient.
The information should include, but not be limited to, building system design specifications
and design intent as follows:
2.Measurements and Models
Assessment procedures overview
9. A control schematic should be provided in block diagram with sensors, adjustable
controls, and actuators accurately identified for each zone. If zone control
systems are independent but identical, one diagram is sufficient if identified for which
zones it applies. If zones are interdependent or inter-active, their control diagram
should be shown in total on one block diagram with the point(s) of interconnection
identified.
10. The general maintenance, operation and performance of the building systems
should be stated, followed by more specific comments on the maintenance and
operation of the automatic controls and manually adjustable controls, and the response
of the system to each. Where necessary, specific seasonal settings of manual controls
should be stated, as also major system changeovers that are required to be performed
by a professional service agency should be identified.
The information should include, but not be limited to, building system design specifications
and design intent as follows:
2.Measurements and Models
Assessment procedures overview
11. Specific limits in the adjustment of manual controls should be stated.
Recommendations for seasonal setting on these should be stated along with the
degree of manual change that should be made at any one time, and the waiting time
between adjustments, in trying to fine tune the system. A maintenance and
inspection schedule for all thermal environmental related building systems
should be provided.
12. Assumed electrical load for lighting and equipment in occupied spaces (including
diversity considerations) used in HVAC load calculations should be documented,
along with any other significant thermal and moisture loads assumed in HVAC load
calculations and any other assumptions upon which HVAC and control design is
based.
The information should include, but not be limited to, building system design specifications
and design intent as follows:
2.Measurements and Models
Assessment procedures overview

EN ISO 7730:2005
EN 15251:2007
ASHRAE 55:2010
Thermal Comfort Predictive Models
Standards
2.Measurements and Models
EN ISO 7726:2001 - Ergonomics of the thermal environment - Instruments and methods for
measuring physical quantities;
EN ISO 7243:1989 - Hot environments - Estimation of the heat stress on working man, based
on the WBGT-index (wet bulb globe temperature);
ISO 7933:2004 - Ergonomics of the thermal environment - Analytical determination and
interpretation of heat stress using calculation of the predicted heat strain;
ISO 11079:2007 - Ergonomics of the thermal environment - Determination and interpretation of
cold stress when using required clothing insulation (IREQ) and local cooling effects.
Standards
2.Measurements and Models
Thermal Comfort Predictive Models

Air Temperature
Me
an
Ra
dia
nt
Te
mp
era
ture
Air Velocity
Re
lati
ve
Hu
mid
ity
Clothing Insulation
Me
tab
olic R
ate
2.Measurements and Models
Thermal Comfort Predictive Models
Air Temperature
Me
an
Ra
dia
nt
Te
mp
era
ture
Air VelocityR
ela
tive
Hu
mid
ity
Clothing Insulation
Me
tab
olic R
ate
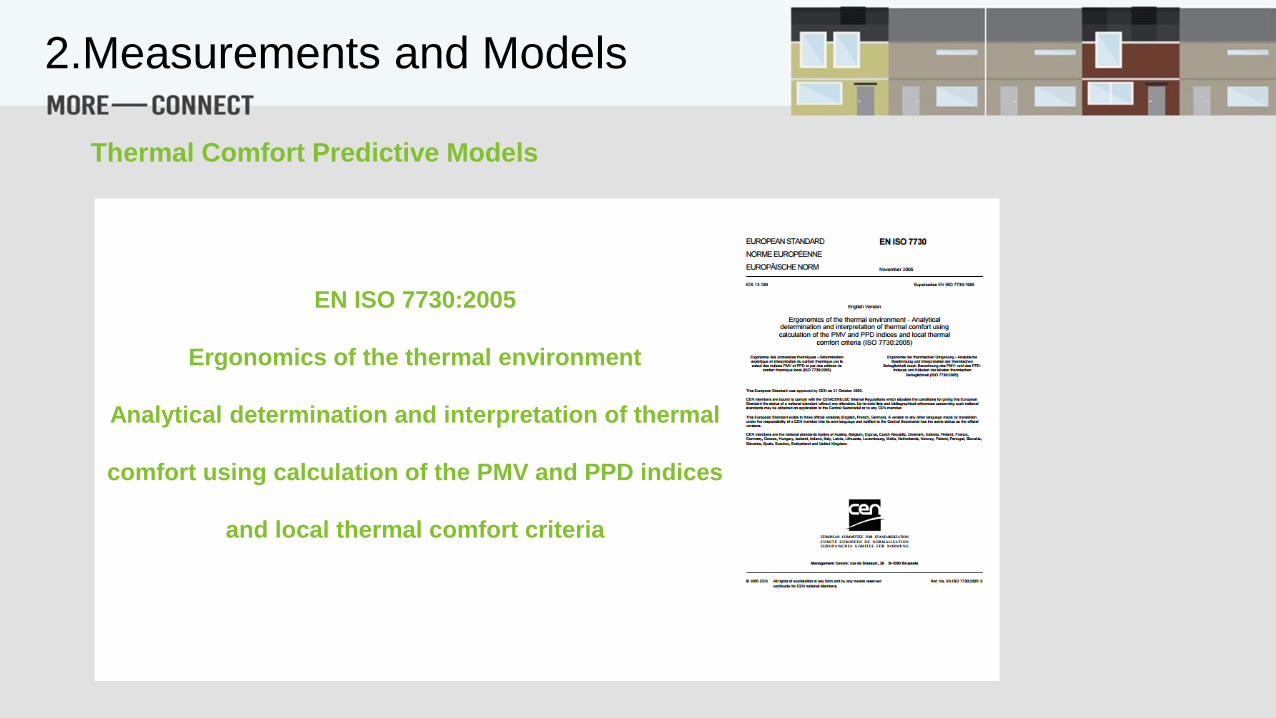
EN ISO 7730:2005
Ergonomics of the thermal environment
Analytical determination and interpretation of thermal
comfort using calculation of the PMV and PPD indices
and local thermal comfort criteria
2.Measurements and Models
Thermal Comfort Predictive Models

EN ISO 7730:2005
http://sustainabilityworkshop.autodesk.com/buildings/controls-lighting-and-daylighting
Presents methods for predicting the general thermal sensation and degree of discomfort
(thermal dissatisfaction) of people exposed to moderate thermal environments.
Also specifies how to predict the percentage dissatisfied owing to local discomfort
parameters.
2.Measurements and Models
Thermal Comfort Predictive Models
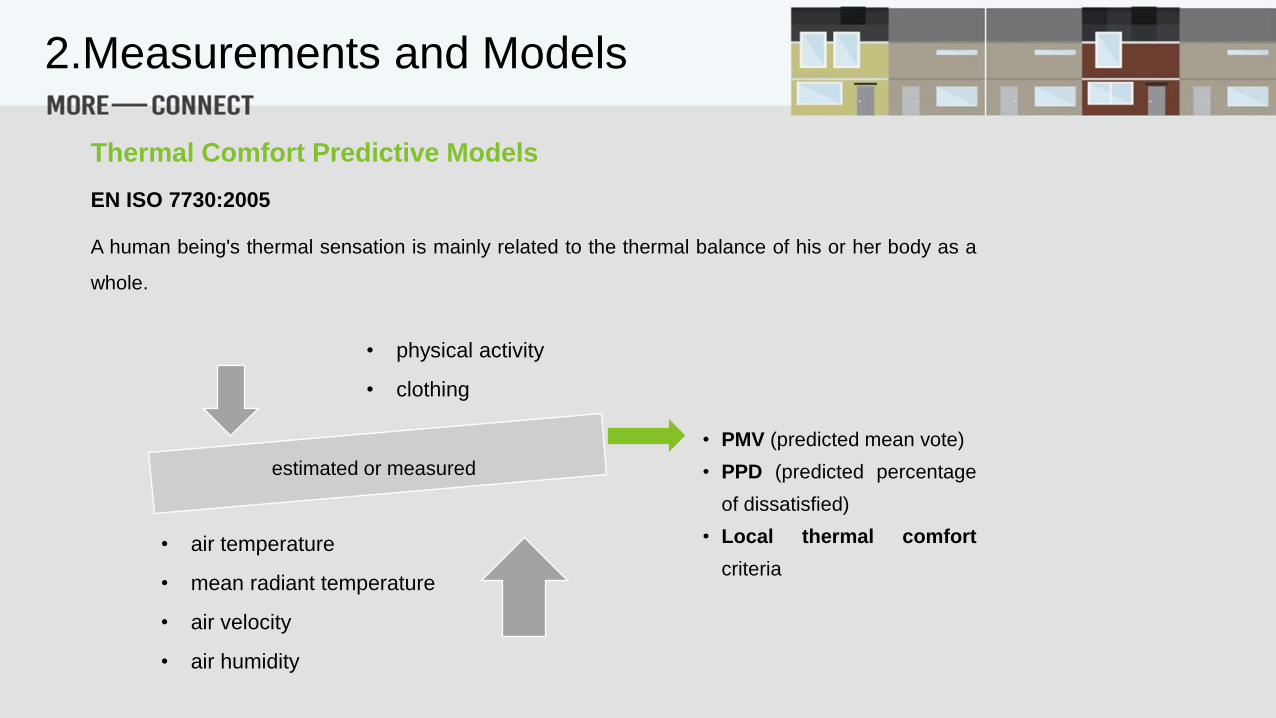
A human being's thermal sensation is mainly related to the thermal balance of his or her body as a
whole.
EN ISO 7730:2005
• PMV (predicted mean vote)
• PPD (predicted percentage
of dissatisfied)
• Local thermal comfort
criteria
• physical activity
• clothing
• air temperature
• mean radiant temperature
• air velocity
• air humidity
estimated or measured
2.Measurements and Models
Thermal Comfort Predictive Models

EN ISO 7730:2005
+ 3 → Hot
+ 2 → Warm
+ 1 → Slightly warm
0 → Neutral
− 1 → Slightly cool
− 2 → Cool
− 3 → Cold
PMV
Seven-point thermal sensation scale:
2.Measurements and Models
Thermal Comfort Predictive Models
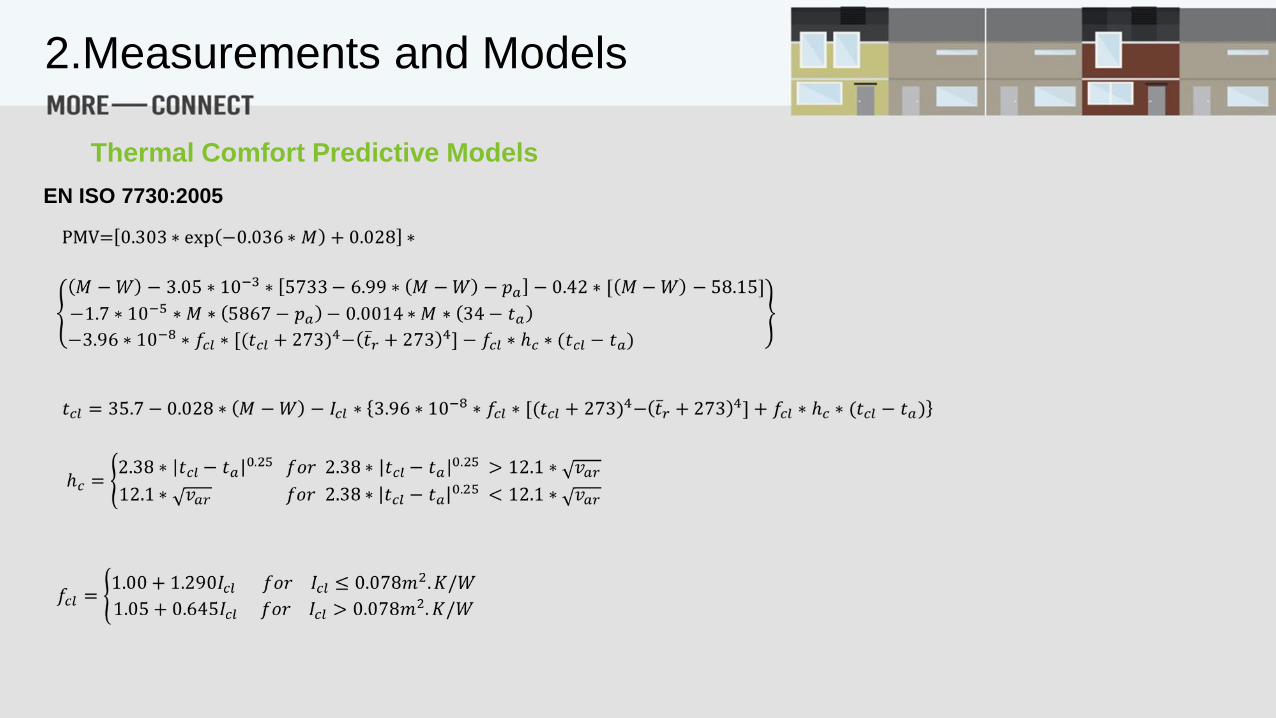
EN ISO 7730:2005
2.Measurements and Models
Thermal Comfort Predictive Models

EN ISO 7730:2005
Where:
𝑀 is the metabolic rate (W/𝑚2);
𝑊 is the effective mechanical power (W/𝑚2);
𝐼𝑐𝑙 is the clothing insulation (𝑚2⋅K/W);
𝑓𝑐𝑙 is the clothing surface area factor;
𝑡𝑎 is the air temperature (°C);
𝑡𝑟 is the mean radiant temperature (°C);
𝑣𝑎𝑟 is the relative air velocity (m/s);
𝑝𝑎 is the water vapour partial pressure (Pa);
ℎ𝑐 is the convective heat transfer coefficient [W/(𝑚2⋅ K)];
𝑡𝑐𝑙 is the clothing surface temperature (°C).
2.Measurements and Models
Thermal Comfort Predictive Models
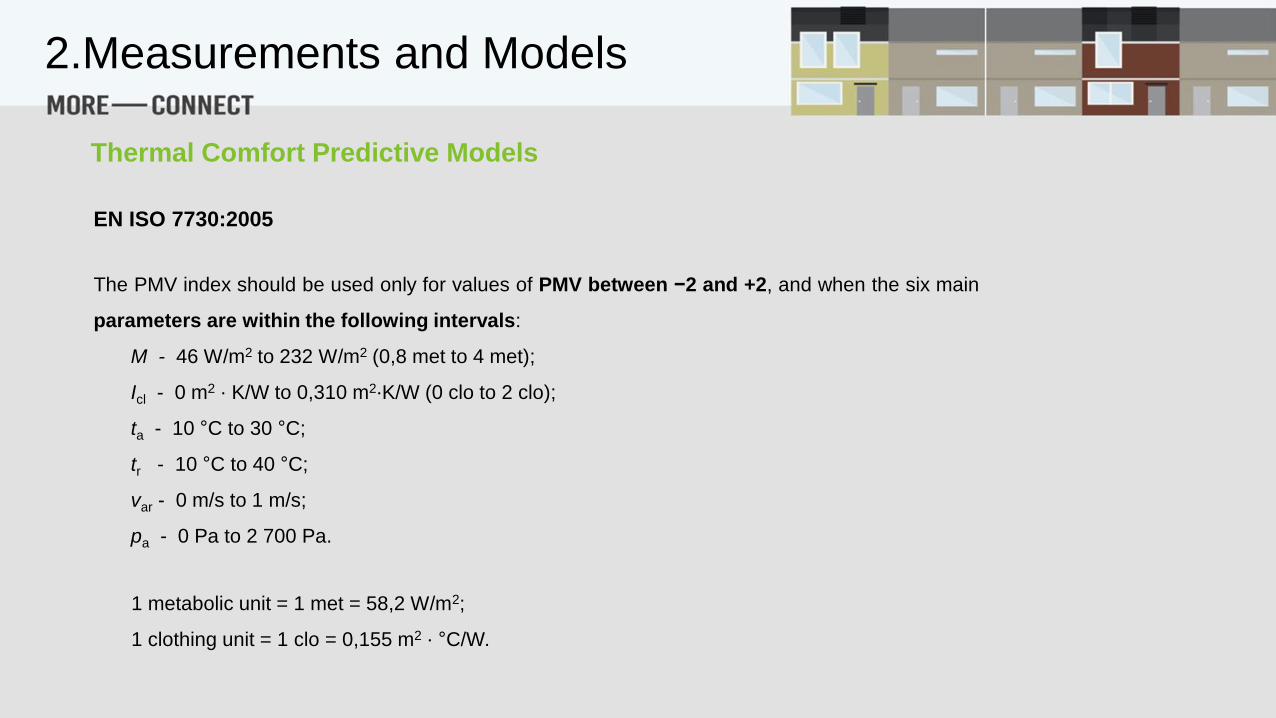
The PMV index should be used only for values of PMV between −2 and +2, and when the six main
parameters are within the following intervals:
M - 46 W/m2 to 232 W/m2 (0,8 met to 4 met);
Icl - 0 m2 ⋅ K/W to 0,310 m2⋅K/W (0 clo to 2 clo);
ta - 10 °C to 30 °C;
tr - 10 °C to 40 °C;
var - 0 m/s to 1 m/s;
pa - 0 Pa to 2 700 Pa.
EN ISO 7730:2005
1 metabolic unit = 1 met = 58,2 W/m2;
1 clothing unit = 1 clo = 0,155 m2 ⋅ °C/W.
2.Measurements and Models
Thermal Comfort Predictive Models

Predicted percentage dissatisfied (PPD)
With the PMV value determined, calculate the PPD:
EN ISO 7730:2005
Where:
PMV - predicted mean vote
PPD - predicted percentage dissatisfied (%)
The PPD predicts the number of thermally
dissatisfied persons among a large group of people.
The rest of the group will feel thermally neutral,
slightly warm or slightly cool.
𝑃𝑃𝐷 = 100 − 95 ∗ exp(−0.03353 ∗ 𝑃𝑀𝑉4 − 0.2179 ∗ 𝑃𝑀𝑉2)
0%
10%
20%
30%
40%
50%
60%
70%
80%
90%
100%
-3 -2 -1 0 1 2 3
PMV
PP
D
T = Tair - Tair comfortable
-8º -6 -4 -2 0º +2 +4 +6 +8º
-3 -2 -1 0 +1 +2 +3
Cold Cool slightly Neutral slightly Warm Hot cool warm
2.Measurements and Models
Thermal Comfort Predictive Models
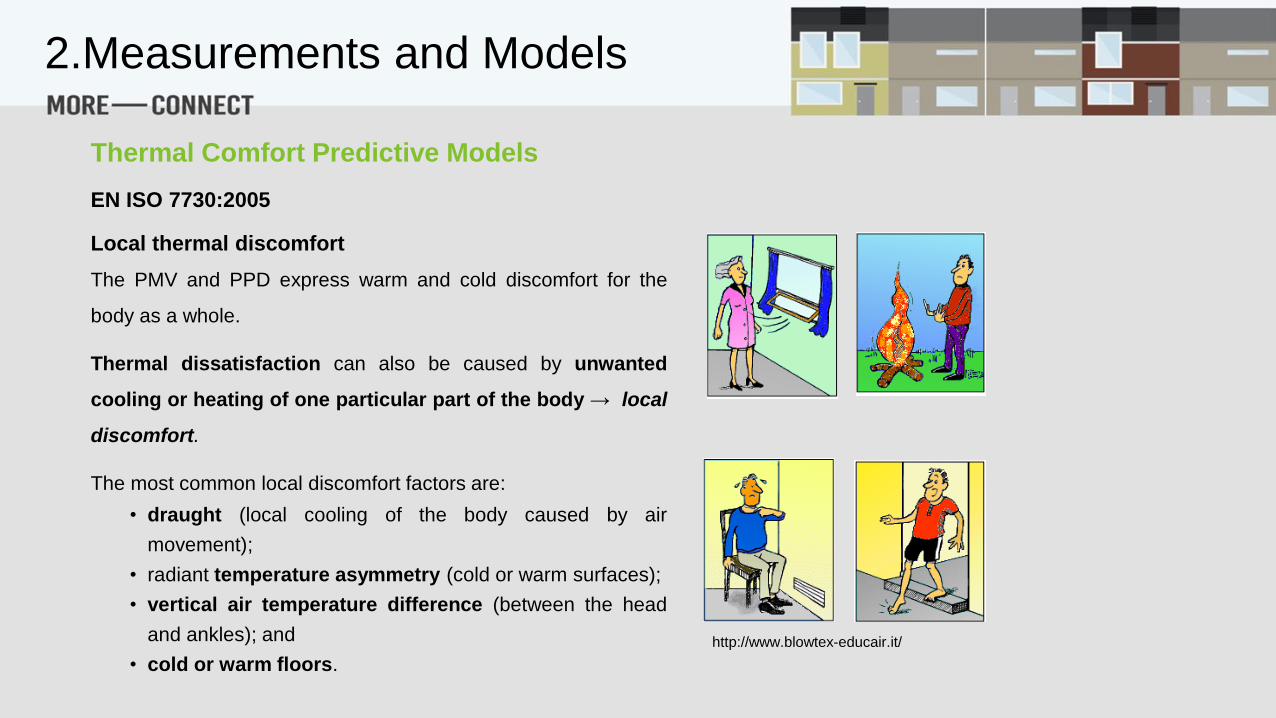
The PMV and PPD express warm and cold discomfort for the
body as a whole.
Thermal dissatisfaction can also be caused by unwanted
cooling or heating of one particular part of the body → local
discomfort.
The most common local discomfort factors are:
• draught (local cooling of the body caused by air
movement);
• radiant temperature asymmetry (cold or warm surfaces);
• vertical air temperature difference (between the head
and ankles); and
• cold or warm floors.
EN ISO 7730:2005
http://www.blowtex-educair.it/
Local thermal discomfort
2.Measurements and Models
Thermal Comfort Predictive Models

Local thermal discomfort
Draught
The discomfort due to draught may be expressed as the percentage of
people predicted to be bothered by draught. The draught rate (DR):
EN ISO 7730:2005
Where:
ta,I - local air temperature, in degrees Celsius, 20 °C to 26 °C;
𝑣𝑎,𝐼 - local mean air velocity, in metres per second, < 0,5 m/s;
Tu - local turbulence intensity, in percent, 10 % to 60 % (if unknown, 40% may be used).
𝐷𝑅 = 34 − 𝑡𝑎.𝐼 . 𝑣𝑎,𝐼 − 0.050.62
. 0.37. 𝑣𝑎,𝐼 . 𝑇𝑢 + 3.14
𝐹𝑜𝑟 𝑣𝑎,𝐼 < 0.05 𝑚/𝑠 𝑢𝑠𝑒 𝑣𝑎,𝐼 = 0.05 𝑚/𝑠
For DR > 100% use DR=100%
The model applies to people at light, mainly sedentary activity with a thermal sensation for the whole
body close to neutral and for prediction of draught at the neck. At the level of arms and feet, the
model could overestimate the predicted draught rate. The sensation of draught is lower at activities
higher than sedentary (> 1,2 met) and for people feeling warmer than neutral.
2.Measurements and Models
Thermal Comfort Predictive Models

Local thermal discomfort
Vertical air temperature difference
EN ISO 7730:2005
PD - percentage dissatisfied (%)
ta,v - vertical air temperature
difference between head and
feet (°C)
Local discomfort caused by vertical air temperature
difference, when the temperature increases
upwards
25 oC
19 oC
Local thermal discomfort
Warm and cool floors
Local thermal discomfort caused by warm or cold floors
PD - percentage dissatisfied (%)
tf - floor temperature (°C)
2.Measurements and Models
Thermal Comfort Predictive Models
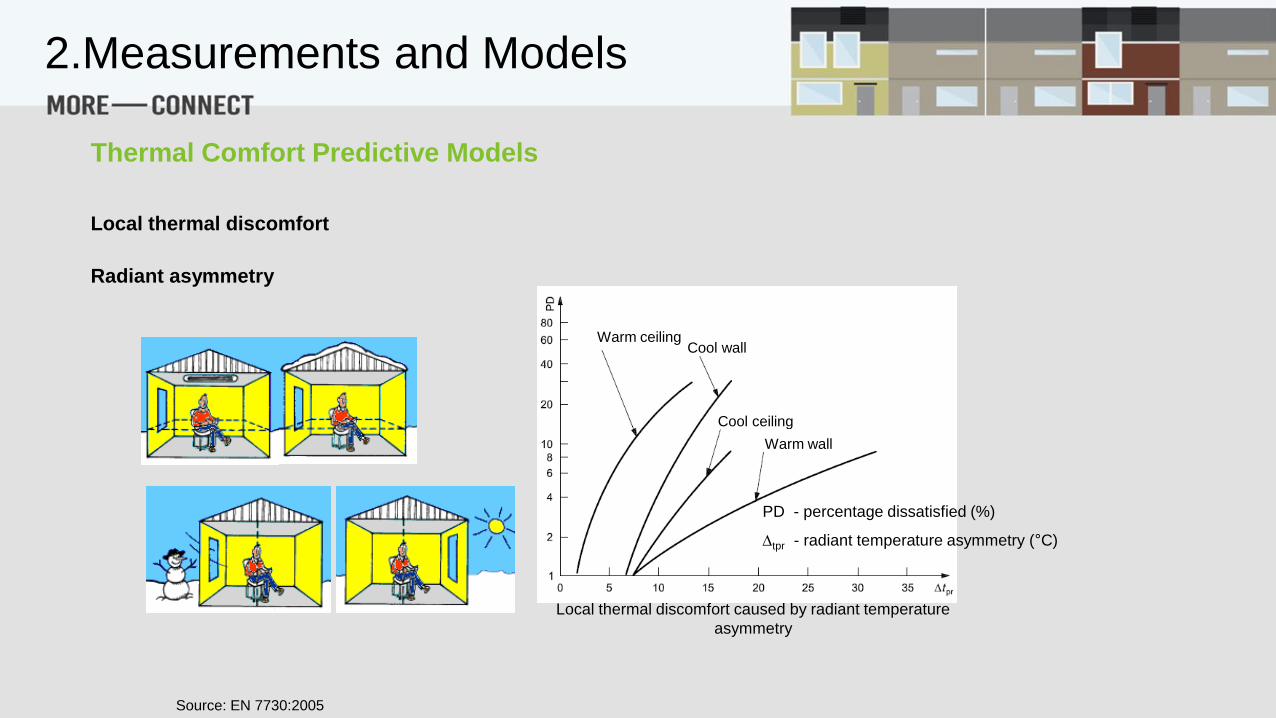
Local thermal discomfort
Radiant asymmetry
Source: EN 7730:2005
Local thermal discomfort caused by radiant temperature
asymmetry
Warm ceilingCool wall
Cool ceiling
Warm wall
PD - percentage dissatisfied (%)
tpr - radiant temperature asymmetry (°C)
2.Measurements and Models
Thermal Comfort Predictive Models
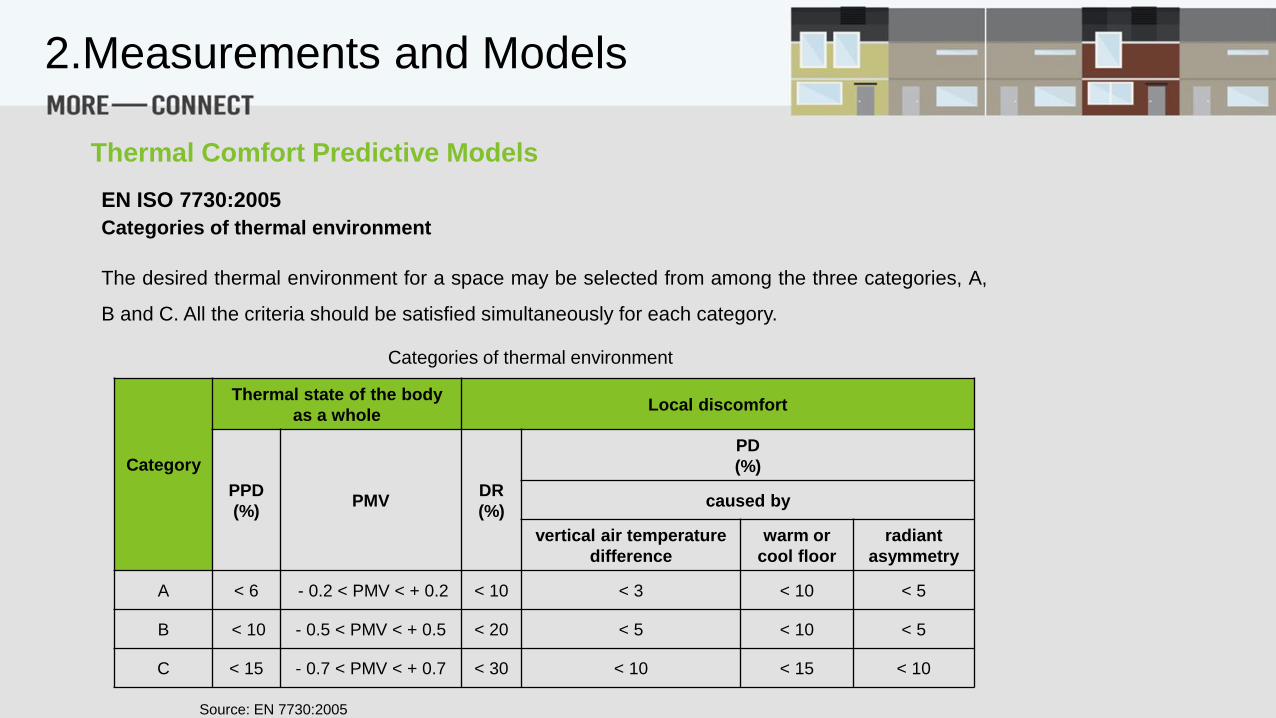
Categories of thermal environment
The desired thermal environment for a space may be selected from among the three categories, A,
B and C. All the criteria should be satisfied simultaneously for each category.
EN ISO 7730:2005
Categories of thermal environment
Category
Thermal state of the body
as a whole Local discomfort
PPD
(%)PMV
DR
(%)
PD
(%)
caused by
vertical air temperature
difference
warm or
cool floor
radiant
asymmetry
A < 6 - 0.2 < PMV < + 0.2 < 10 < 3 < 10 < 5
B < 10 - 0.5 < PMV < + 0.5 < 20 < 5 < 10 < 5
C < 15 - 0.7 < PMV < + 0.7 < 30 < 10 < 15 < 10
Source: EN 7730:2005
2.Measurements and Models
Thermal Comfort Predictive Models

Operative temperature range
For a given space there exists an optimum operative temperature corresponding to PMV = 0,
depending on the activity and the clothing of the occupants.
EN ISO 7730:2005
Category A: PPD < 6 % Category B: PPD < 10 % Category C: PPD < 15 %
Optimum operative temperature as function of clothing and activity
Clothing
Activity
Clothing
Activity
Clothing
Activity
PPD - Predicted percentage dissatisfied (%)
X - Basic clothing insulation (clo)
X′ - Basic clothing insulation (m2⋅°C/W)
Y - metabolic rate (met)
Y′ - metabolic rate (W/m2)
Source: EN 7730:2005
2.Measurements and Models
Thermal Comfort Predictive Models

Extreme environmental conditions
ISO 7243, ISO 7933 and ISO/TR 11079
Specify methods for the measurement and evaluation of the extreme thermal environments to
which human beings are exposed.
2.Measurements and Models
Thermal Comfort Predictive Models

ASHRAE 55 specifies thermal environmental conditions acceptable
Healthy adults at atmospheric pressure equivalent to altitudes up to
3000 m in indoor spaces designed for human occupancy
periods not less than 15 minutes.
The selected design criteria will influence the HVAC-system design
and may also influence the building design.
ASHRAE Standard 55:2013
2.Measurements and Models
Thermal Comfort Predictive Models
Operative Temperature
For given values of humidity, air speed, metabolic rate, and clothing insulation, a comfort zone
may be determined.
The comfort zone is defined in terms of:
- a range of operative temperatures that provides acceptable thermal environmental
conditions; or
- the combinations of air temperature and mean radiant temperature that people find
thermally acceptable.
Applied to spaces where:
- occupants activity levels’ result in metabolic rates between 1.0 met and 1.3 met;
- clothing thermal insulation between 0.5 clo and 1.0 clo.
ASHRAE Standard 55:2013
2.Measurements and Models
Thermal Comfort Predictive Models
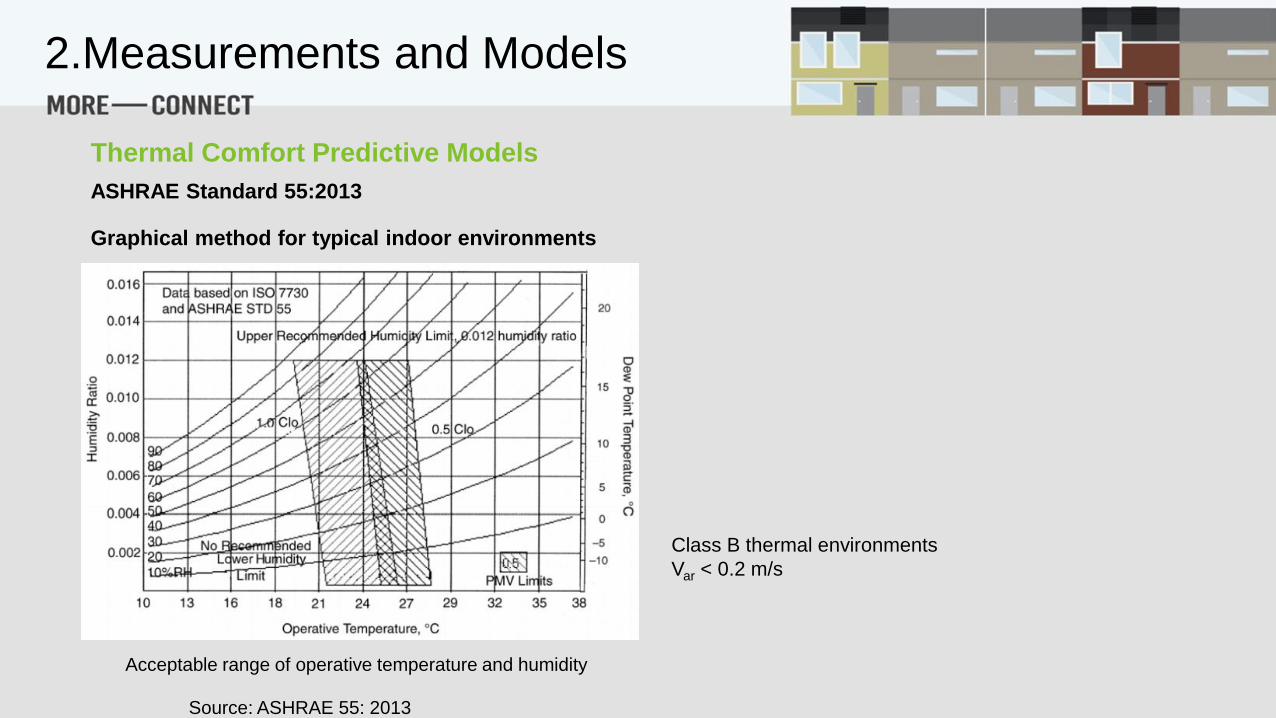
Graphical method for typical indoor environments
ASHRAE Standard 55:2013
Class B thermal environments
Var < 0.2 m/s
Acceptable range of operative temperature and humidity
Source: ASHRAE 55: 2013
2.Measurements and Models
Thermal Comfort Predictive Models

PMV and PPD
ASHRAE standard also defines three classes of thermal comfort based on the PPD allowed.
ASHRAE Standard 55:2013
Category PPD
(%)PMV
A < 6 - 0.2 < PMV < + 0.2
B < 10 - 0.5 < PMV < + 0.5
C < 15 - 0.7 < PMV < + 0.7
Three classes of acceptable thermal
environment for general comfort
Predicted percentage dissatisfied (PPD) as a function
of predicted mean vote (PMV)
Source: ASHRAE 55: 2013
𝑃𝑃𝐷 = 100 − 95 ∗ exp(−0.03353 ∗ 𝑃𝑀𝑉4 − 0.2179 ∗ 𝑃𝑀𝑉2)
2.Measurements and Models
Thermal Comfort Predictive Models
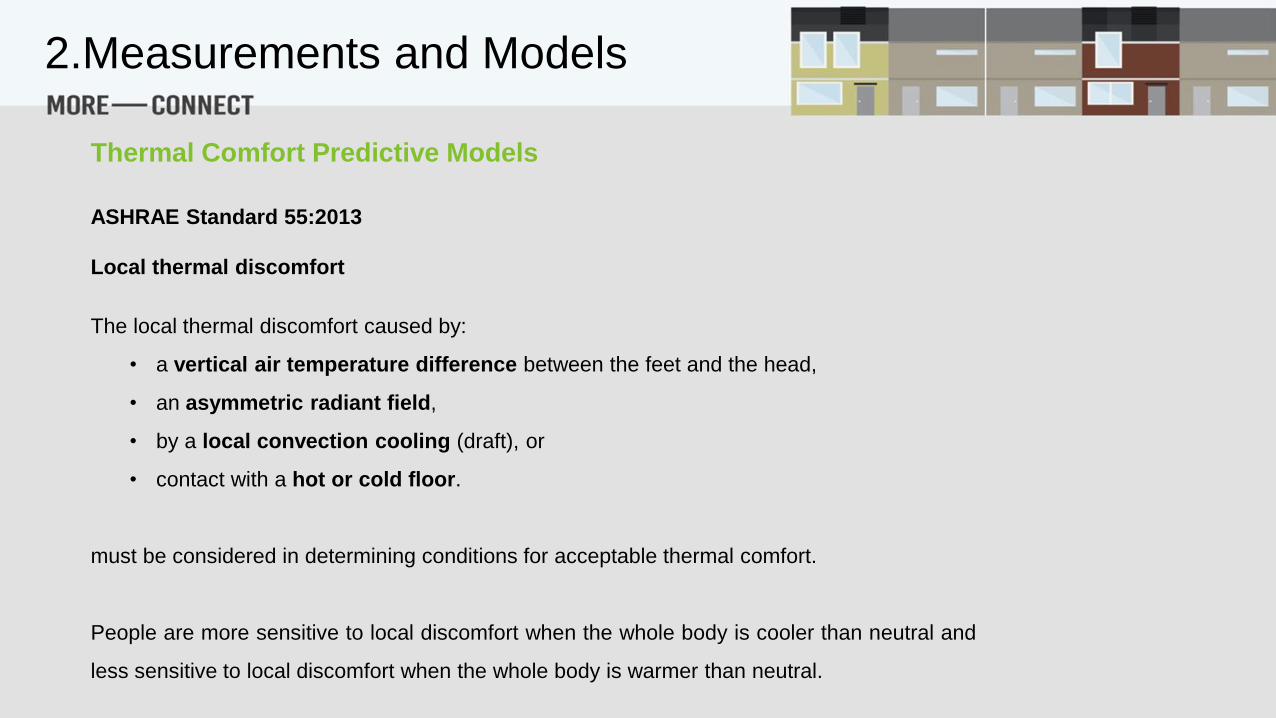
Local thermal discomfort
The local thermal discomfort caused by:
• a vertical air temperature difference between the feet and the head,
• an asymmetric radiant field,
• by a local convection cooling (draft), or
• contact with a hot or cold floor.
must be considered in determining conditions for acceptable thermal comfort.
People are more sensitive to local discomfort when the whole body is cooler than neutral and
less sensitive to local discomfort when the whole body is warmer than neutral.
ASHRAE Standard 55:2013
2.Measurements and Models
Thermal Comfort Predictive Models
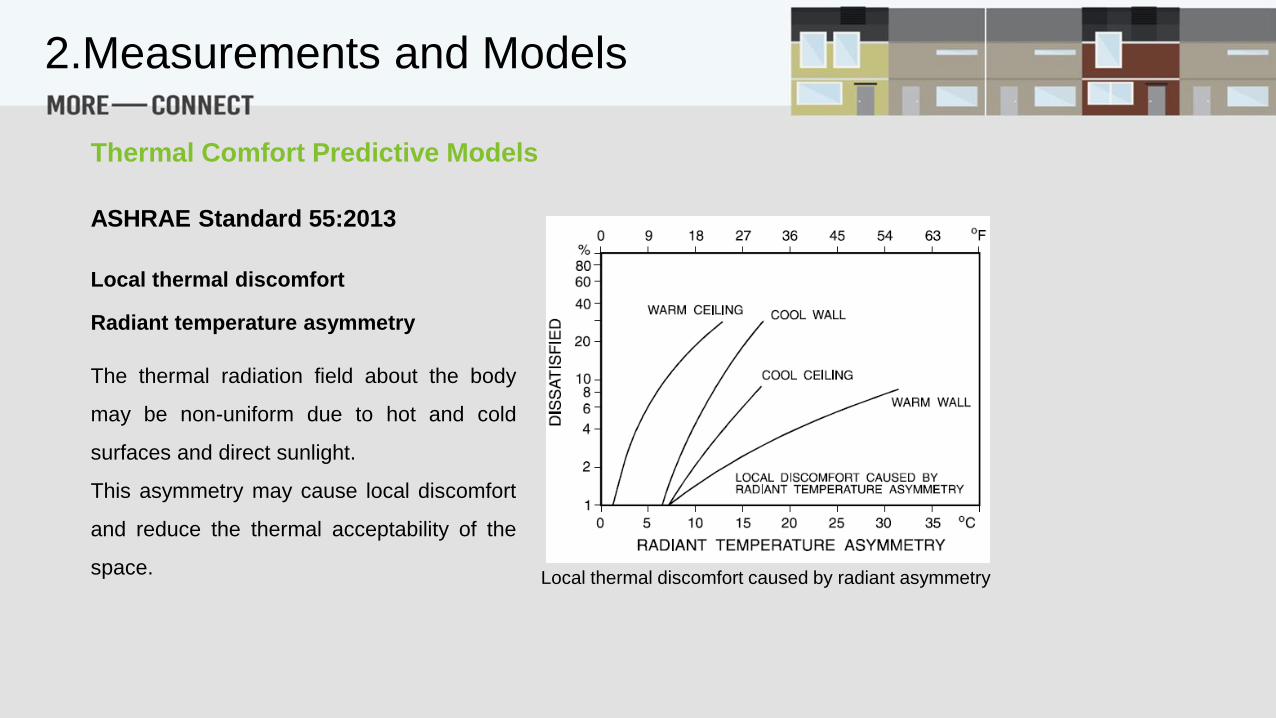
Local thermal discomfort
ASHRAE Standard 55:2013
Radiant temperature asymmetry
The thermal radiation field about the body
may be non-uniform due to hot and cold
surfaces and direct sunlight.
This asymmetry may cause local discomfort
and reduce the thermal acceptability of the
space.Local thermal discomfort caused by radiant asymmetry
2.Measurements and Models
Thermal Comfort Predictive Models
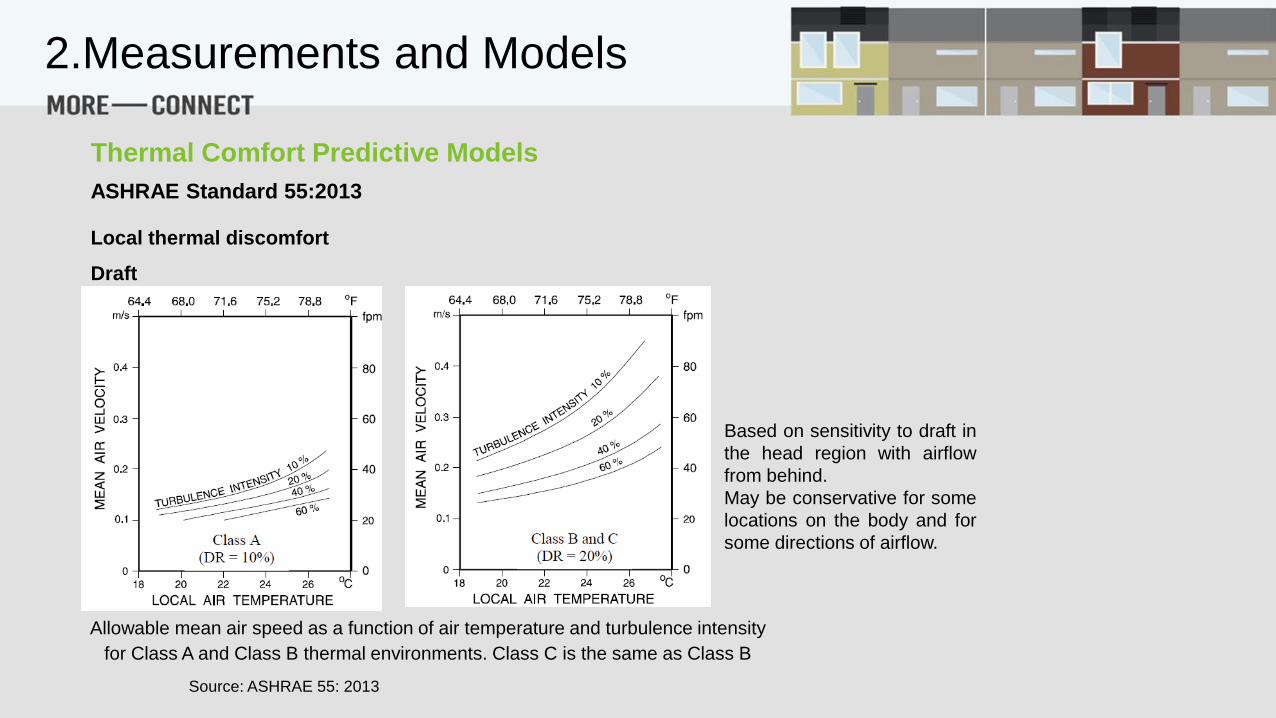
Local thermal discomfort
ASHRAE Standard 55:2013
Draft
Allowable mean air speed as a function of air temperature and turbulence intensity
for Class A and Class B thermal environments. Class C is the same as Class B
Based on sensitivity to draft in
the head region with airflow
from behind.
May be conservative for some
locations on the body and for
some directions of airflow.
Source: ASHRAE 55: 2013
2.Measurements and Models
Thermal Comfort Predictive Models
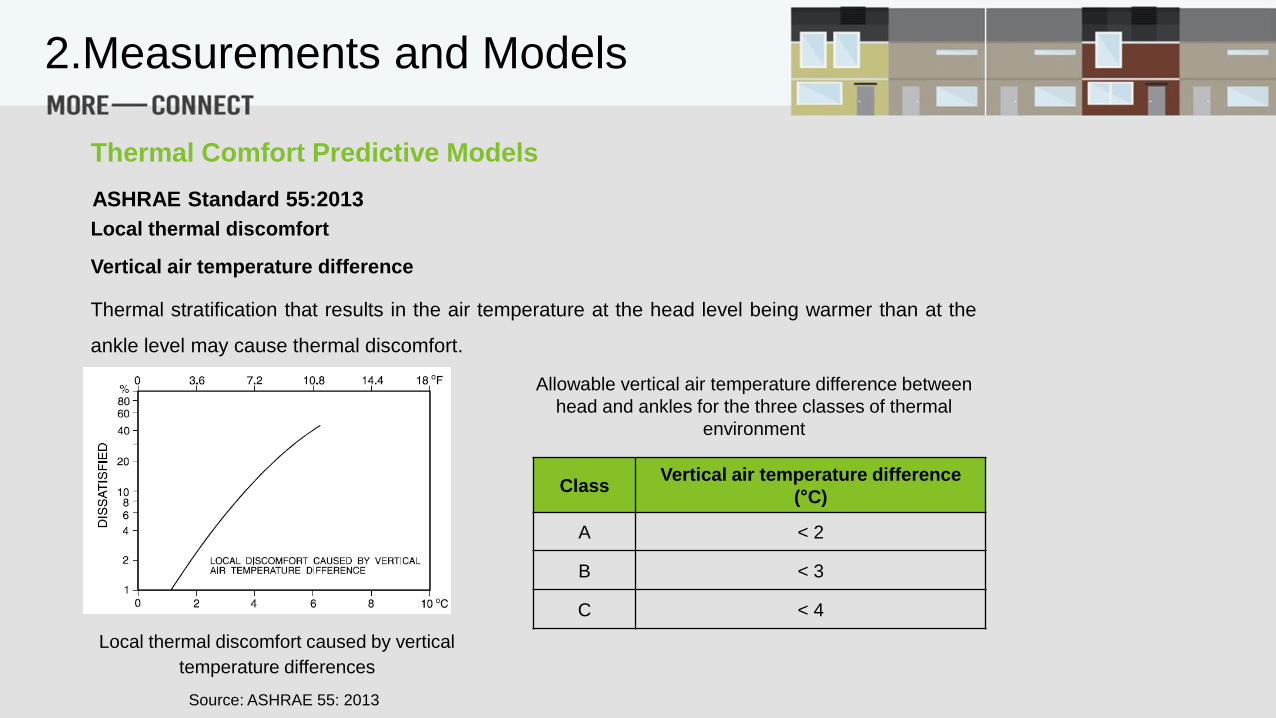
Local thermal discomfort
ASHRAE Standard 55:2013
Vertical air temperature difference
Local thermal discomfort caused by vertical
temperature differences
Thermal stratification that results in the air temperature at the head level being warmer than at the
ankle level may cause thermal discomfort.
Allowable vertical air temperature difference between
head and ankles for the three classes of thermal
environment
ClassVertical air temperature difference
(°C)
A < 2
B < 3
C < 4
Source: ASHRAE 55: 2013
2.Measurements and Models
Thermal Comfort Predictive Models
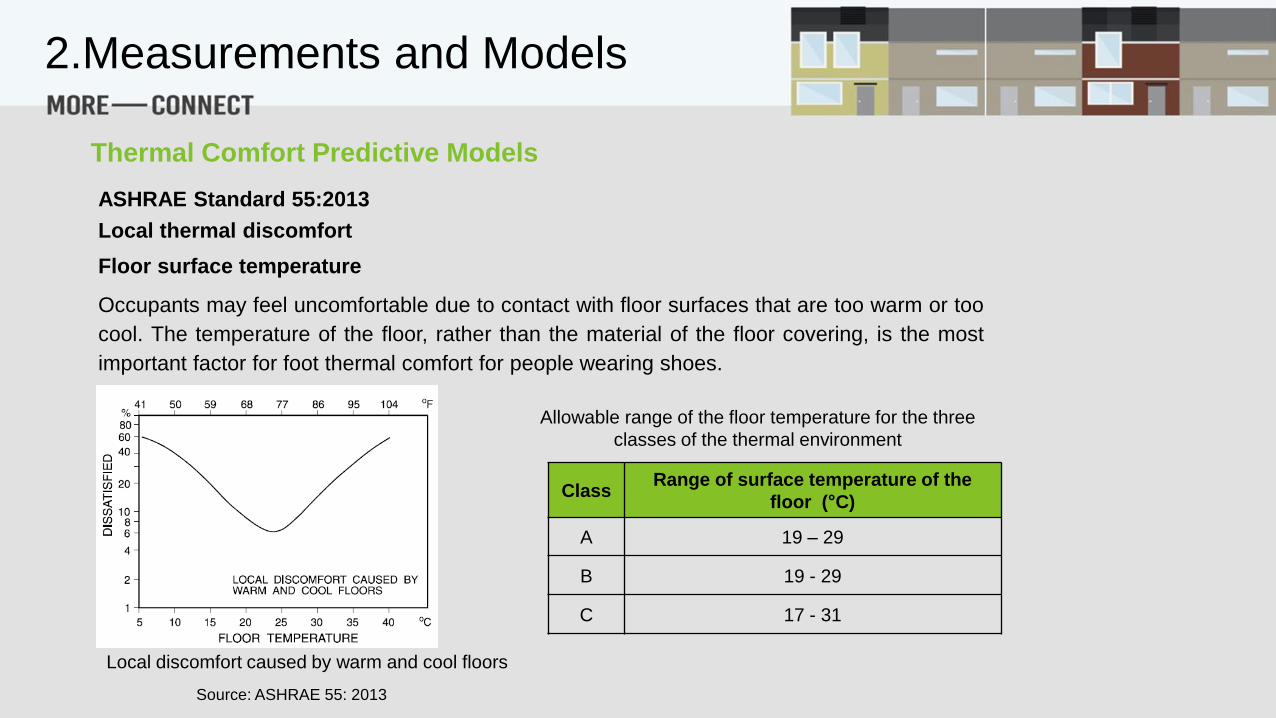
Local thermal discomfort
ASHRAE Standard 55:2013
Floor surface temperature
Occupants may feel uncomfortable due to contact with floor surfaces that are too warm or too
cool. The temperature of the floor, rather than the material of the floor covering, is the most
important factor for foot thermal comfort for people wearing shoes.
Allowable range of the floor temperature for the three
classes of the thermal environment
ClassRange of surface temperature of the
floor (°C)
A 19 – 29
B 19 - 29
C 17 - 31
Local discomfort caused by warm and cool floors
Source: ASHRAE 55: 2013
2.Measurements and Models
Thermal Comfort Predictive Models

Method for determining acceptable thermal conditions in naturally conditioned spaces
ASHRAE Standard 55:2013
Occupant-controlled naturally conditioned spaces → spaces where the thermal
conditions of the space are regulated primarily by the occupants through opening and
closing of the windows.
Occupants’ thermal responses in occupant-controlled naturally conditioned spaces
depends in part on the outdoor climate, and
may differ from thermal responses in buildings with centralized HVAC systems primarily
because of the different thermal experiences, changes in clothing, availability of
control, and shifts in occupant expectations.
2.Measurements and Models
Thermal Comfort Predictive Models
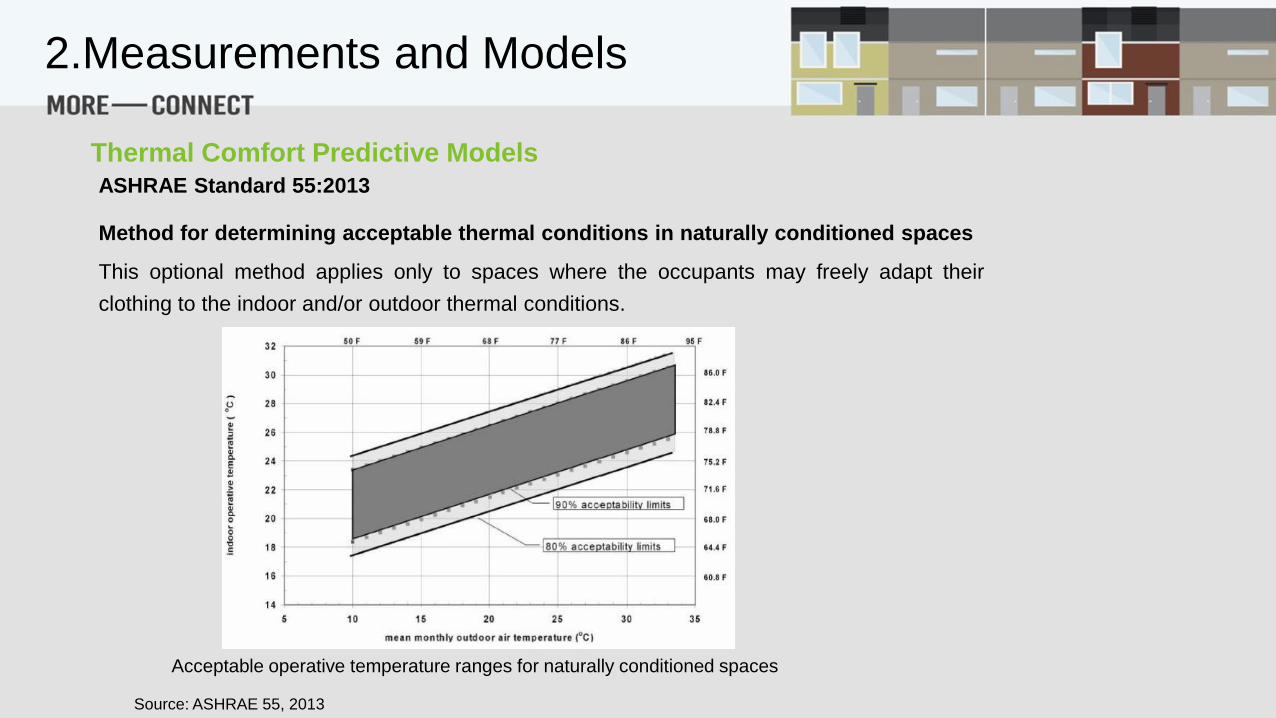
Method for determining acceptable thermal conditions in naturally conditioned spaces
ASHRAE Standard 55:2013
This optional method applies only to spaces where the occupants may freely adapt their
clothing to the indoor and/or outdoor thermal conditions.
Acceptable operative temperature ranges for naturally conditioned spaces
Source: ASHRAE 55, 2013
2.Measurements and Models
Thermal Comfort Predictive Models
Method for determining acceptable thermal conditions in naturally conditioned spaces
Portuguese Adaptive Thermal Comfort Model Based on ASHRAE Standard 55:2010
In Portugal Luís Matias performed a experimental study at national level, evaluating in situ the
thermal comfort parameters and surveying the occupants of schools, offices, elderly houses
and residential buildings.
Based on the field results the National Civil Engineering Laboratory (Laboratório Nacional de
Engenharia Civil, LNEC) defined a adaptive thermal comfort model to be used in the
assessment of the thermal conditions of the occupants of the Portuguese building stock.
Adaptive Thermal Comfort Models at National Level - Portugal
2.Measurements and Models
Thermal Comfort Predictive Models

Method for determining acceptable thermal conditions in naturally conditioned spaces
Portuguese Adaptive Thermal Comfort Model Based on ASHRAE Standard 55:2010
Two comfort temperatures were defined, Tconf:
- one to be used on spaces with the HVAC systems activated ;and
- other to be used on non-acclimatized spaces (without HVAC systems or when the systems
are turned off).
The thermal comfort temperatures is obtained based on the outdoor exponentially weighted
temperature, Tmp:
8,3
)T2,0T3,0T4,0T5,0T6,0T8,0T(T 7n6n5n4n3n2n1n
mp
where:
Tmp – outdoor exponentially weighted temperature(ºC) ;
Tn-i – average outdoor temperature of previous day (i) (ºC);
Adaptive Thermal Comfort Models at National Level - Portugal
2.Measurements and Models
Thermal Comfort Predictive Models

Portuguese Adaptive Thermal Comfort Model
Thermal comfort zone for a 90% acceptability level
defined as the thermal comfort temperature 3ºC
HV
AC
syste
m:
Off
HV
AC
syste
m:
On
Outdoor exponentially weighted temperature, Tmp, (ºC)
Th
erm
al C
om
fort
te
mp
era
ture
, T
co
mf, (
ºC)
35
30
25
20
15
10
0 5 10 15 20 25 30 35
І І І І І І І
_
_
_
_
_
Adapted from: Matias, 2010
Method for determining acceptable thermal conditions in naturally conditioned spaces
Portuguese Adaptive Thermal Comfort Model Based on ASHRAE Standard 55:2010
Adaptive Thermal Comfort Models at National Level - Portugal
2.Measurements and Models
Thermal Comfort Predictive Models
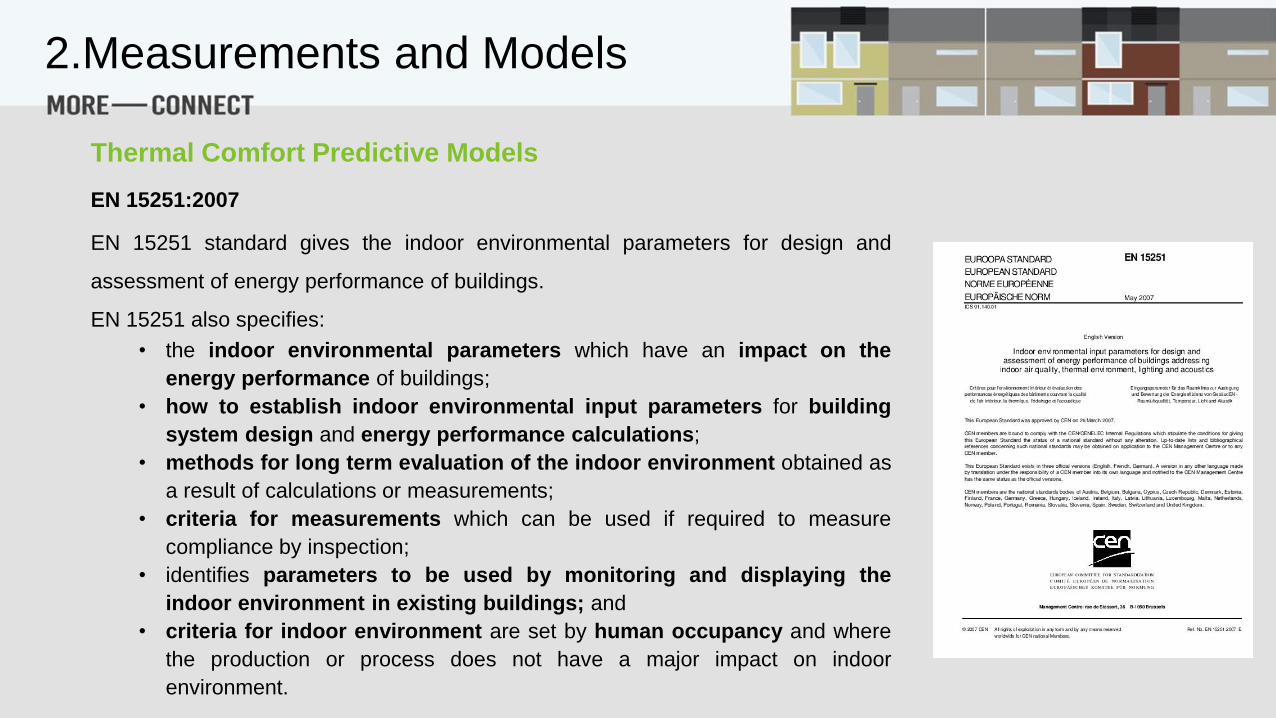
EN 15251:2007
EN 15251 standard gives the indoor environmental parameters for design and
assessment of energy performance of buildings.
EN 15251 also specifies:
• the indoor environmental parameters which have an impact on the
energy performance of buildings;
• how to establish indoor environmental input parameters for building
system design and energy performance calculations;
• methods for long term evaluation of the indoor environment obtained as
a result of calculations or measurements;
• criteria for measurements which can be used if required to measure
compliance by inspection;
• identifies parameters to be used by monitoring and displaying the
indoor environment in existing buildings; and
• criteria for indoor environment are set by human occupancy and where
the production or process does not have a major impact on indoor
environment.
2.Measurements and Models
Thermal Comfort Predictive Models
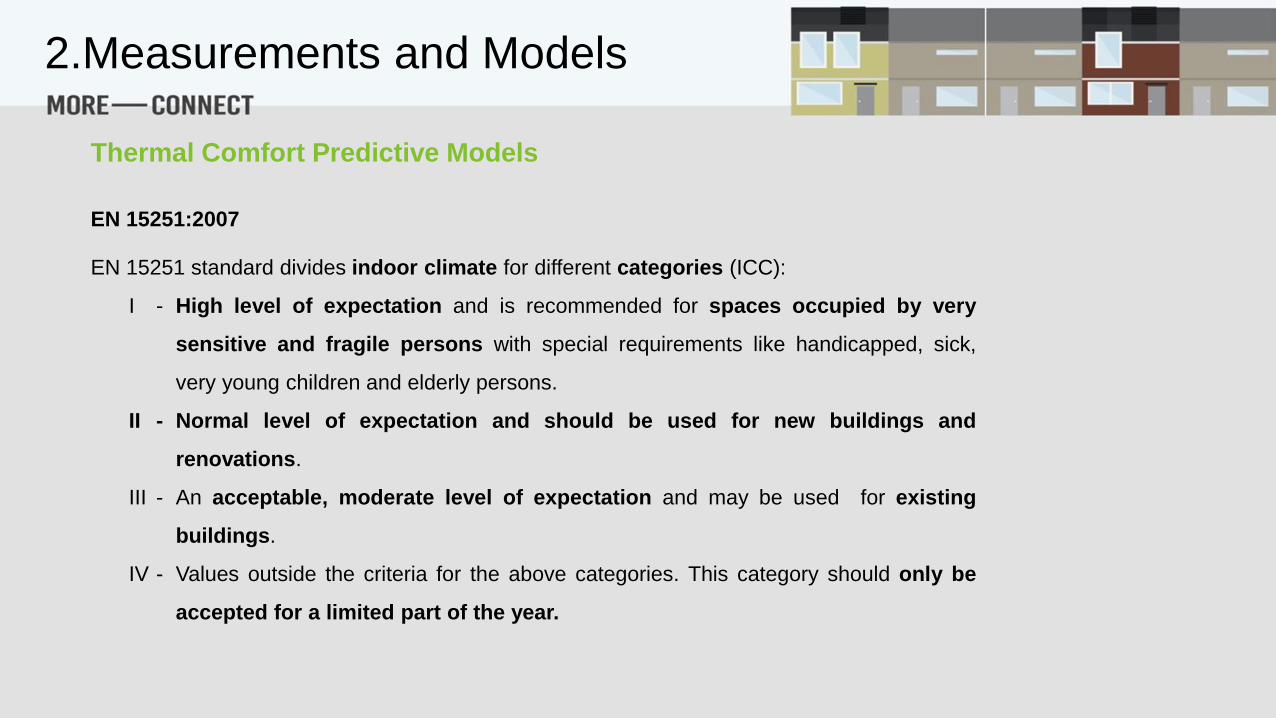
EN 15251:2007
EN 15251 standard divides indoor climate for different categories (ICC):
I - High level of expectation and is recommended for spaces occupied by very
sensitive and fragile persons with special requirements like handicapped, sick,
very young children and elderly persons.
II - Normal level of expectation and should be used for new buildings and
renovations.
III - An acceptable, moderate level of expectation and may be used for existing
buildings.
IV - Values outside the criteria for the above categories. This category should only be
accepted for a limited part of the year.
2.Measurements and Models
Thermal Comfort Predictive Models

Adaptation:
Physiological, psychological or behavioural adjustment of building occupants to the
interior thermal environment in order to avoid discomfort.
In naturally ventilated buildings these are often in response to changes in indoor
environment induced by outside weather conditions.
EN 15251:2007
2.Measurements and Models
Thermal Comfort Predictive Models

In Mechanically heated and/or cooled buildings the criteria for the thermal environment
shall be based on the thermal comfort indices PMV-PPD (predicted mean vote - predicted
percentage of dissatisfied) with assumed typical levels of activity and thermal insulation for
clothing (winter and summer).
EN 15251:2007
CategoryThermal state of the body as a whole
PPD PMV
I < 6% - 0.2 < PMV < + 0.2
II < 10% - 0.5 < PMV < + 0.5
III < 15% - 0.7 < PMV < + 0.7
Examples of recommended categories for design of mechanical
heated and cooled buildings
Source: EN 15251:2007
2.Measurements and Models
Thermal Comfort Predictive Models
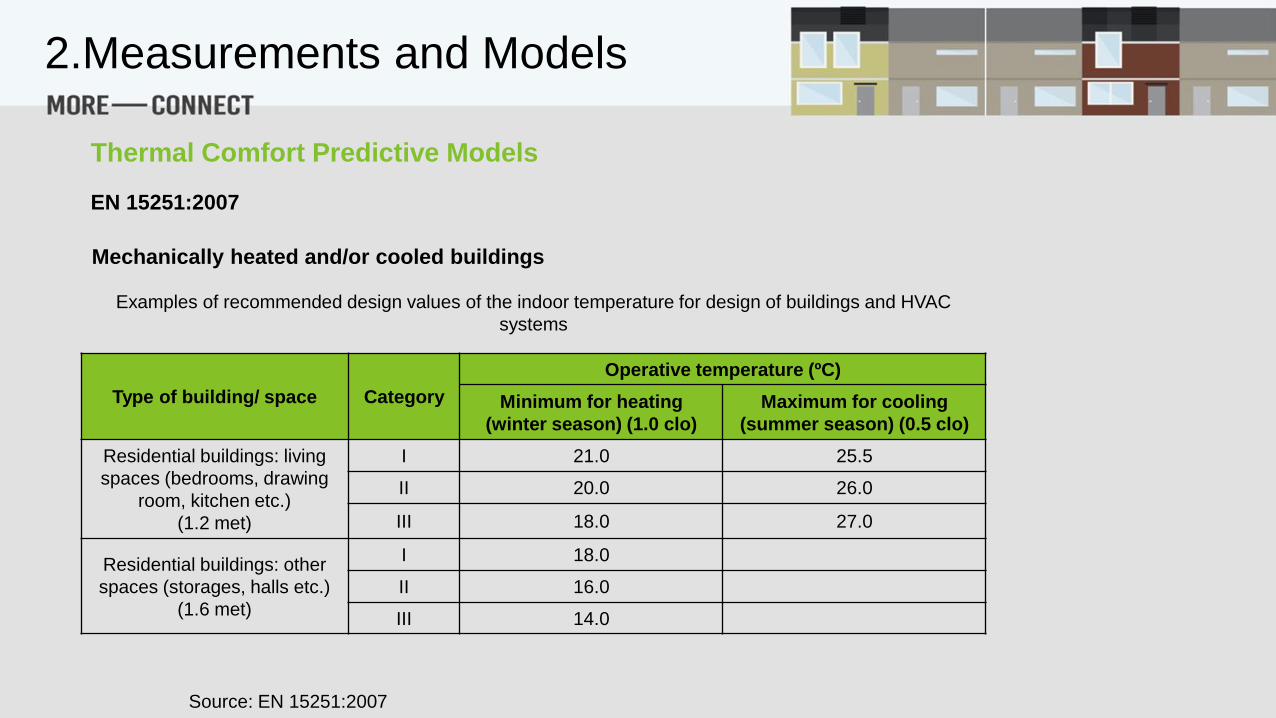
EN 15251:2007
Examples of recommended design values of the indoor temperature for design of buildings and HVAC
systems
Type of building/ space Category
Operative temperature (ºC)
Minimum for heating
(winter season) (1.0 clo)
Maximum for cooling
(summer season) (0.5 clo)
Residential buildings: living
spaces (bedrooms, drawing
room, kitchen etc.)
(1.2 met)
I 21.0 25.5
II 20.0 26.0
III 18.0 27.0
Residential buildings: other
spaces (storages, halls etc.)
(1.6 met)
I 18.0
II 16.0
III 14.0
Mechanically heated and/or cooled buildings
Source: EN 15251:2007
2.Measurements and Models
Thermal Comfort Predictive Models

EN 15251:2007
Buildings without mechanical cooling
This method only applies to spaces where :
• the occupants are engaged in near sedentary physical activities (1.0 to 1.3 met);
• strict clothing policies inside the building are avoided, in order to allow occupants to freely adapt their
clothing insulation.
In order for this method to apply:
• the spaces must be equipped with operable windows which open to the outdoors and which can be
readily opened and adjusted by the occupants of the spaces;
• there must be no mechanical cooling in operation in the space;
• mechanical ventilation with unconditioned air (in summer) may be utilized, but opening and closing of
windows must be of primary importance as a means of regulating thermal conditions in the space;
• there may in addition be other low-energy methods of personally controlling the indoor environment
such as fans, shutters, night ventilation etc..
The spaces may be provided by a heating system, but this optional method does not apply during times of the
year when the heating system is in operation.
2.Measurements and Models
Thermal Comfort Predictive Models

EN 15251:2007
Buildings without mechanical cooling
Acceptable “summer” indoor temperatures (cooling season) for
buildings without mechanical cooling systems
To I = 0,33 Trm + 18,8 - 2
To III = 0,33 Trm + 18,8 + 4
Op
era
tive
Te
mp
era
ture
, T
o(º
C)
Outdoor Running mean temperature, Trm (ºC)
To II = 0,33 Trm + 18,8 -
3
To II = 0,33 Trm + 18,8 + 3
To III = 0,33 Trm + 18,8 -
4
To I = 0,33 Trm + 18,8 + 2
Trm - running mean outdoor temperature.
These limits apply:
- upper limit →10 ºC < Trm < 30 ºC
- lower limit → 15 ºC < Trm < 30 ºC
Above 25 ºC the graphs are based on a
limited database
Source: EN 15251:2007
2.Measurements and Models
Thermal Comfort Predictive Models

EN 15251:2007
Buildings without mechanical cooling
The external running mean temperature - Trm - is the exponentially weighted running
mean of the daily outdoor temperature.
Trm = (1- ).{ Ted -1 + . Ted -2 + 2 Ted -3…..}
This equation can be simplified to:
Trm = (1- )Ted -1 + . Trm-1
Where:
Trm - Running mean temperature for today
Trm-1 - Running mean temperature for previous day
Ted-1 - Daily mean external temperature for the previous day
Ted -2 - Daily mean external temperature for the day before and so on.
- Constant between 0 and 1. Recommended to use 0.8
2.Measurements and Models
Thermal Comfort Predictive Models
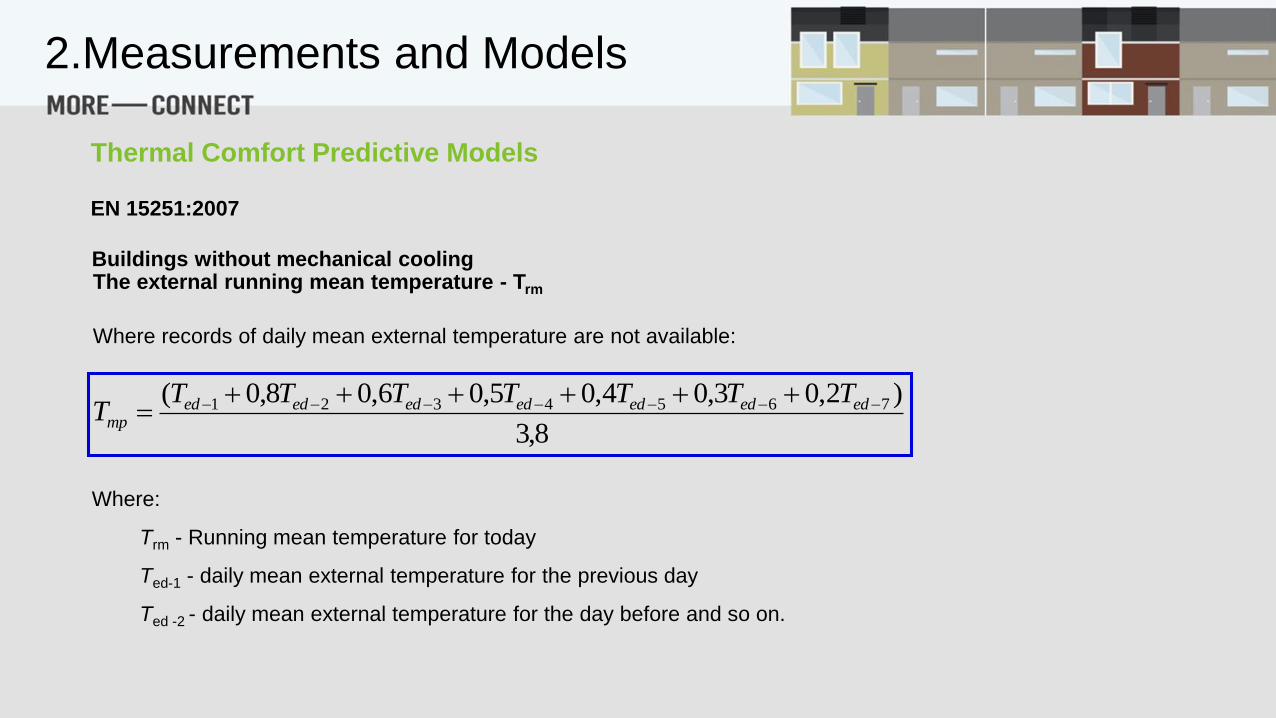
EN 15251:2007
Buildings without mechanical coolingThe external running mean temperature - Trm
Where records of daily mean external temperature are not available:
8,3
)2,03,04,05,06,08,0( 7654321 ededededededed
mp
TTTTTTTT
Where:
Trm - Running mean temperature for today
Ted-1 - daily mean external temperature for the previous day
Ted -2 - daily mean external temperature for the day before and so on.
2.Measurements and Models
Thermal Comfort Predictive Models

EN 15251:2007
Temperature ranges for hourly calculation of cooling and heating energy in three categories of indoor
environment
Type of building/ space Category
Operative temperature (ºC)
Minimum for heating
(winter season) (1.0 clo)
Maximum for cooling
(summer season) (0.5 clo)
Residential buildings: living
spaces (bedrooms, living room
etc.)
(sedentary activity - 1.2 met)
I 21.0 – 25.0 23.5 – 25.5
II 20.0 – 25.0 23.0 – 26.0
III 18.0 – 25.0 22.0 – 27.0
Residential buildings: other
spaces (kitchen, storages etc.)
(standing walking activity - 1.5
met)
I 18.0 – 25.0
II 16.0 – 25.0
III 14.0 – 25.0
Buildings without mechanical cooling
Source: EN 15251:2007
2.Measurements and Models
Thermal Comfort Predictive Models
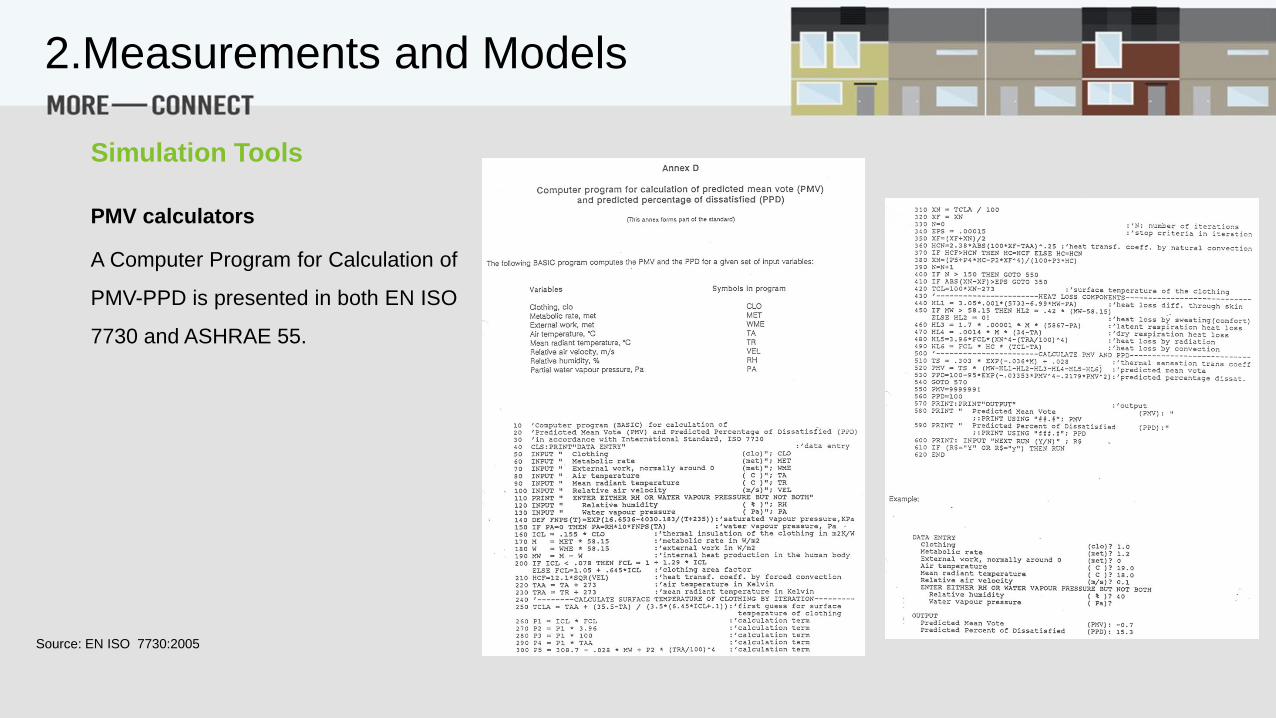
PMV calculators
A Computer Program for Calculation of
PMV-PPD is presented in both EN ISO
7730 and ASHRAE 55.
Source: EN ISO 7730:2005
2.Measurements and Models
Simulation Tools

PMV calculators
EN ISO 7730 also provides tables for determination of
predicted mean vote (PMV)
Activity level: 46,4 W/m2 (0,8 met)
Source: EN ISO 7730:2005
2.Measurements and Models
Simulation Tools
PMV calculators
A set of spreadsheets, developed in Microsoft Excel, to calculate the thermal comfort indices,
using the Fanger’s method proposed in EN ISO Standard 7730 are available online:
http://www.lumasenseinc.com/EN/products/thermal-comfort/pmv-calculation/
http://www.ddcode.com/mobile/th/thermal-comfort-pmv-calculator.html
2.Measurements and Models
Simulation Tools

PMV/PPD calculation
Excel files
2.Measurements and Models
Simulation Tools

Excel files
2.Measurements and Models
Simulation Tools

PMV/PPD Calculation
http://sustainabilityworkshop.autodesk.com/buildings/human-thermal-comfort
Apps
https://itunes.apple.com/us/app/pmv/id408246562?mt=8
2.Measurements and Models
Simulation Tools

ASHRAE 55
Simulation tools
ASHRAE's Thermal Comfort Tool
software provides a user-friendly interface
for calculating thermal comfort
parameters and making thermal comfort
predictions using several existing thermal
comfort models.
The latest version focuses on the Adaptive
and Predicted Mean Vote (PMV) Models and
has an updated user interface. Available:
https://www.ashrae.org/resources--
publications/bookstore/thermal-comfort-tool
2.Measurements and Models
Simulation Tools
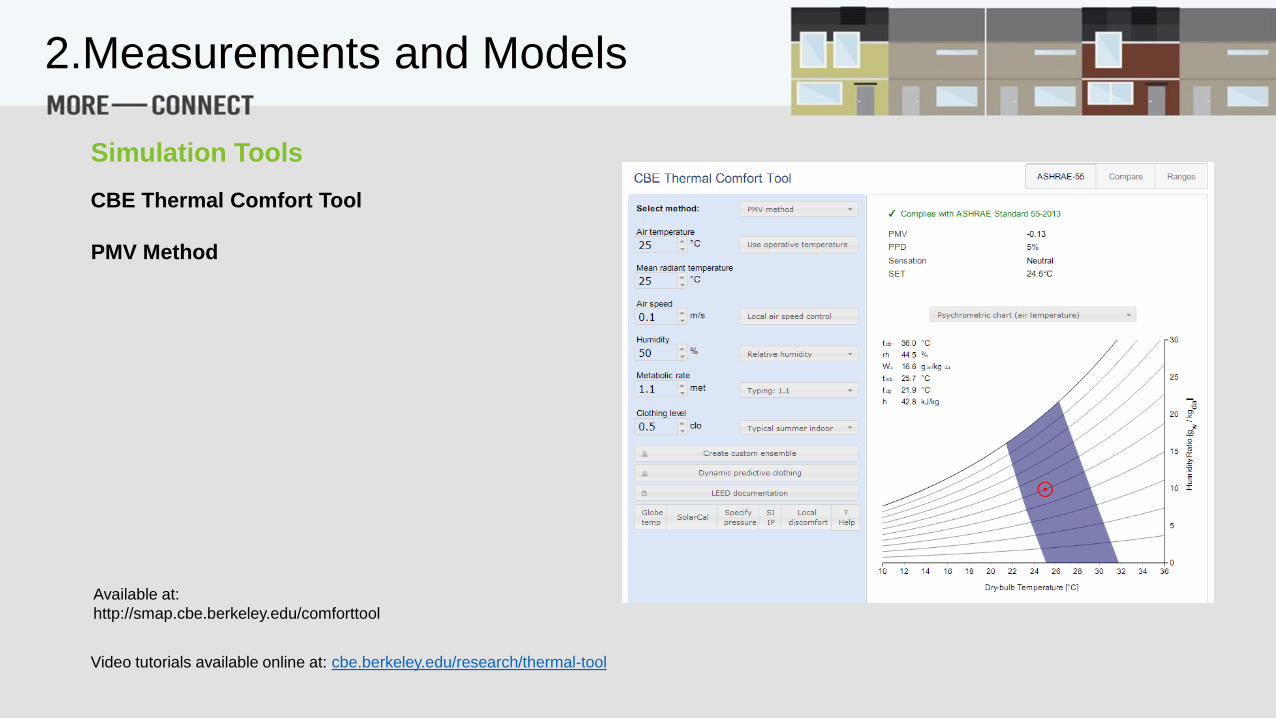
CBE Thermal Comfort Tool
Available at:
http://smap.cbe.berkeley.edu/comforttool
PMV Method
Video tutorials available online at: cbe.berkeley.edu/research/thermal-tool
2.Measurements and Models
Simulation Tools
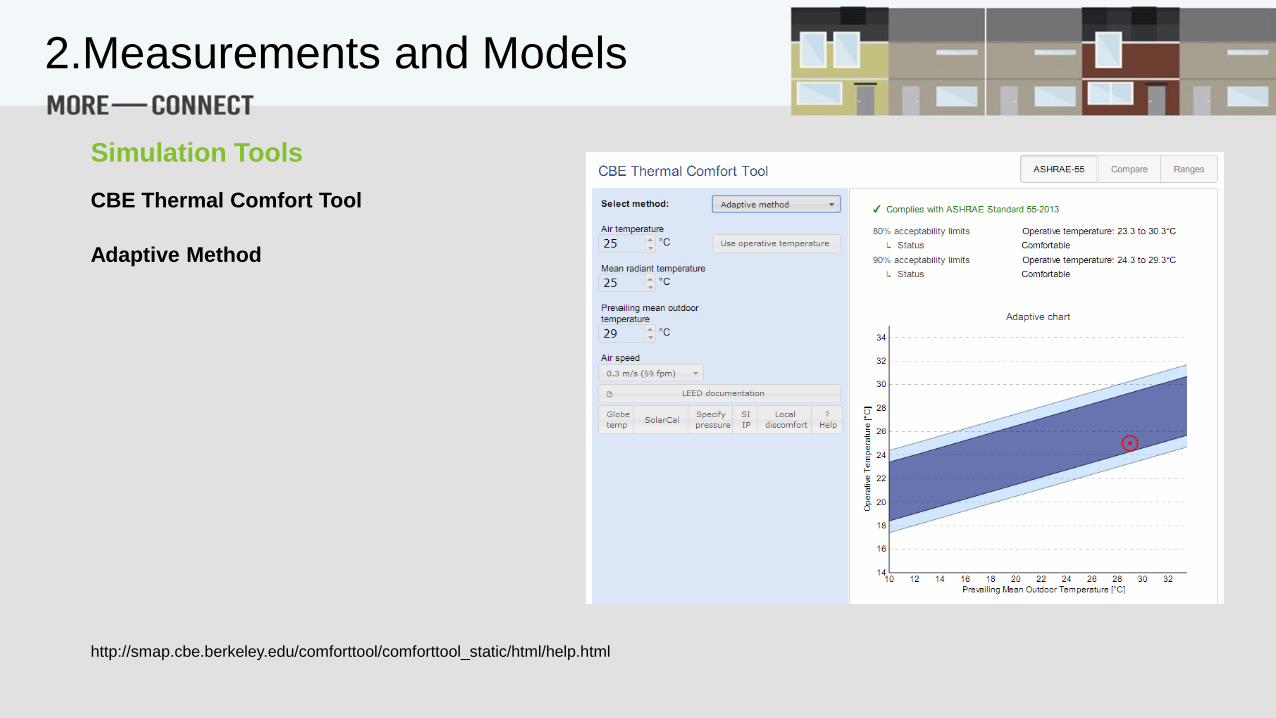
CBE Thermal Comfort Tool
Adaptive Method
http://smap.cbe.berkeley.edu/comforttool/comforttool_static/html/help.html
2.Measurements and Models
Simulation Tools

Fraunhofer IBP Thermal Comfort Tool
Source: Fraunhofer IBP
2.Measurements and Models
Simulation Tools
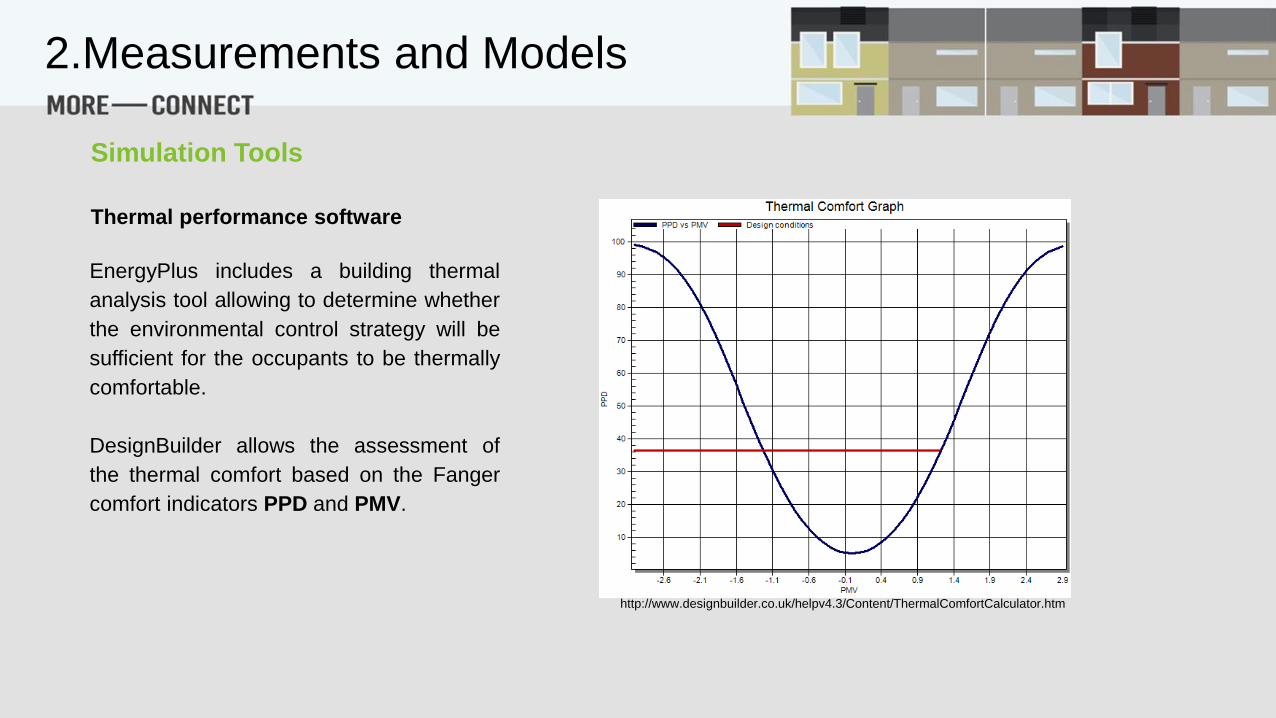
Thermal performance software
EnergyPlus includes a building thermal
analysis tool allowing to determine whether
the environmental control strategy will be
sufficient for the occupants to be thermally
comfortable.
DesignBuilder allows the assessment of
the thermal comfort based on the Fanger
comfort indicators PPD and PMV.
http://www.designbuilder.co.uk/helpv4.3/Content/ThermalComfortCalculator.htm
2.Measurements and Models
Simulation Tools
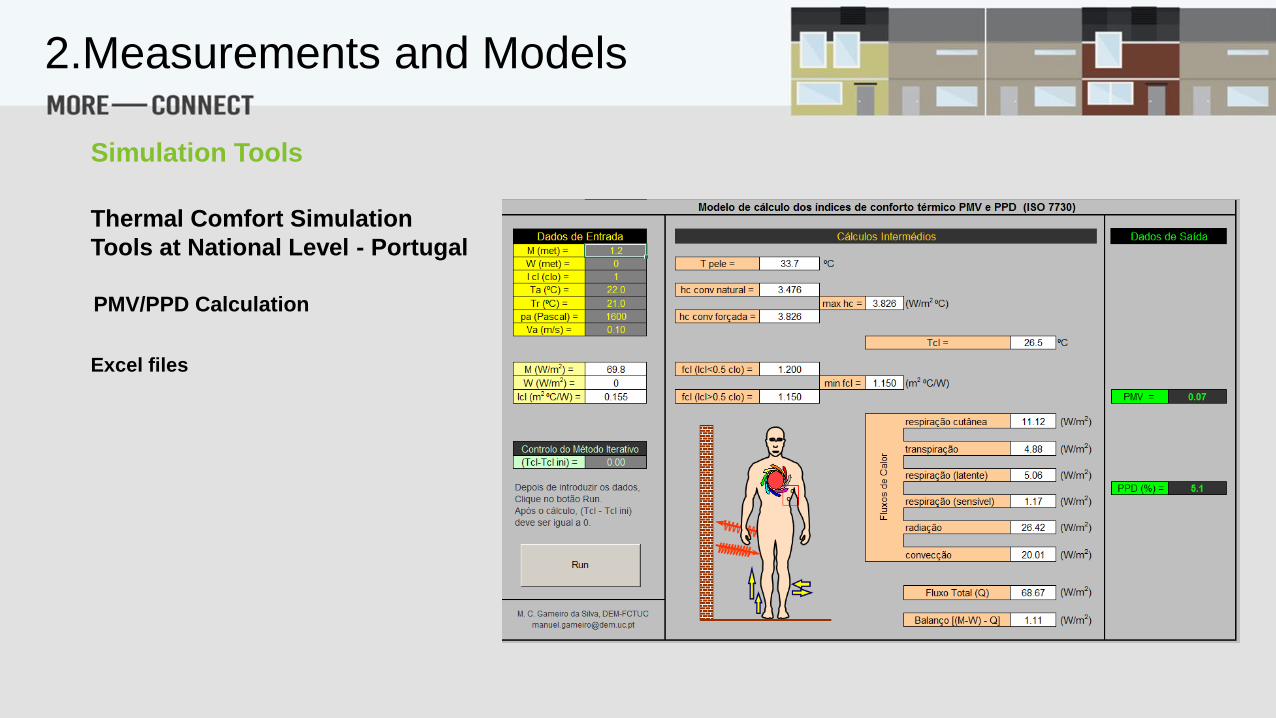
PMV/PPD Calculation
Excel files
Thermal Comfort Simulation
Tools at National Level - Portugal
2.Measurements and Models
Simulation Tools
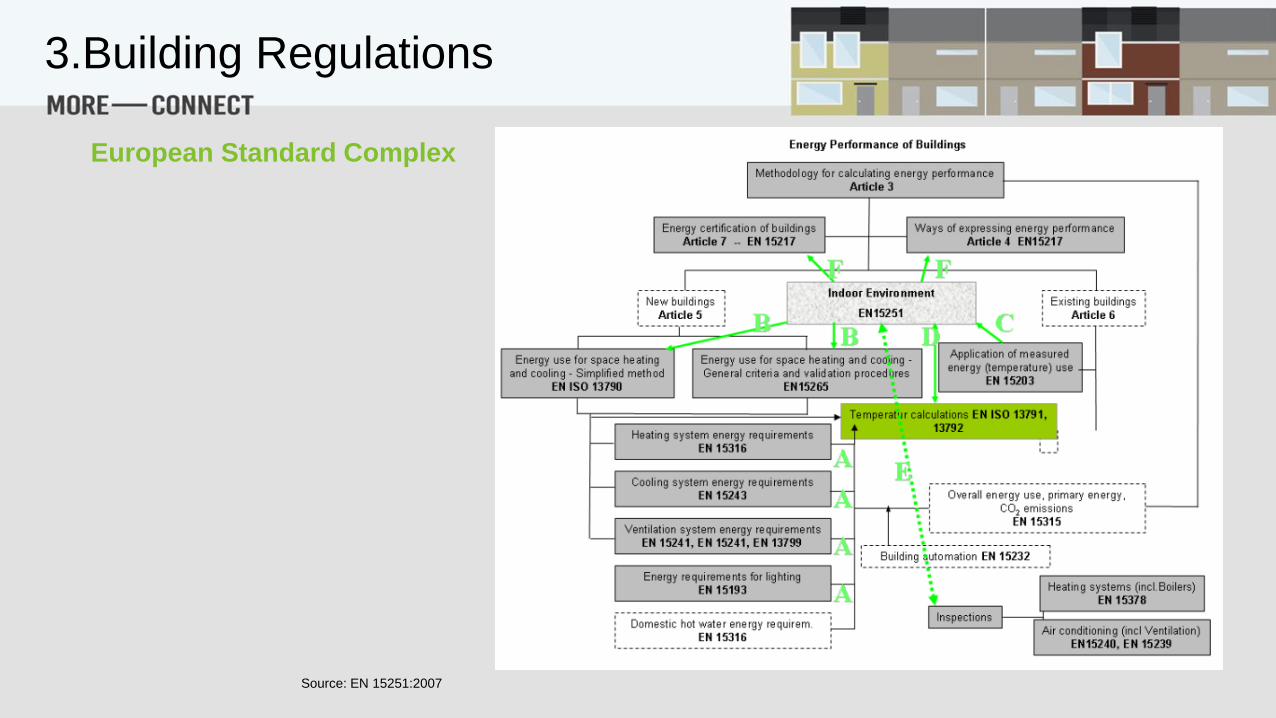
Source: EN 15251:2007
3.Building Regulations
European Standard Complex
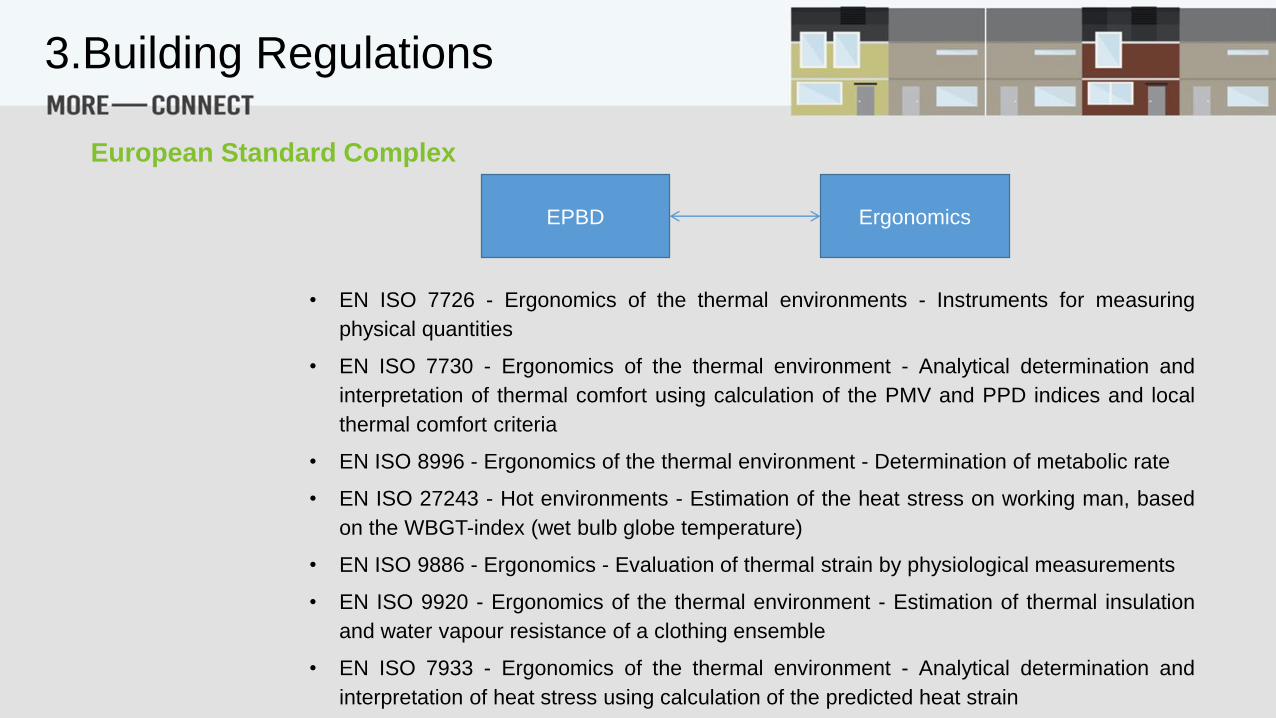
EPBD Ergonomics
• EN ISO 7726 - Ergonomics of the thermal environments - Instruments for measuring
physical quantities
• EN ISO 7730 - Ergonomics of the thermal environment - Analytical determination and
interpretation of thermal comfort using calculation of the PMV and PPD indices and local
thermal comfort criteria
• EN ISO 8996 - Ergonomics of the thermal environment - Determination of metabolic rate
• EN ISO 27243 - Hot environments - Estimation of the heat stress on working man, based
on the WBGT-index (wet bulb globe temperature)
• EN ISO 9886 - Ergonomics - Evaluation of thermal strain by physiological measurements
• EN ISO 9920 - Ergonomics of the thermal environment - Estimation of thermal insulation
and water vapour resistance of a clothing ensemble
• EN ISO 7933 - Ergonomics of the thermal environment - Analytical determination and
interpretation of heat stress using calculation of the predicted heat strain
3.Building Regulations
European Standard Complex

• Thermal comfort is part of EPBD
• Member states follow different policies, thus making a pan European approach not possible yet.
• Standardization connection between comfort and achieving EPBD energy rating has accepted criticism
throughout EU.
3.Building Regulations
European Standard Complex

A. Environmental criteria for
building and HVAC
EN 12831, EN 15243
B. Values for indoor environment
during occupancy
EN ISO 13790, EN 15255, EN
15265
Output to
C. Evaluation of annual
performance
EN 15203
Input from
D. Temperature calculations
EN ISO 13791, EN ISO 13792
E. Measurement of the indoor
environment and HVAC inspection
EN 15240, EN 15239, EN 15378
Method for
F. Categorization of indoor
environment
EN 15217
3.Building Regulations
Connection of
EN 15251 to others
Major EU standardization issues
• Natural ventilation is not adequately covered
• Demand controlled ventilation does not follow choice of occupants
• Overheating needs to be more adequately approached
3.Building Regulations

Decree-Law 118/2003, related Ordinances and
Mandamus – Portuguese Energy Certification System;
Regulation on the Energy Performance of Residential
Buildings; Regulation on the Energy Performance of Office
Buildings (sets the minimum quality of the envelope and
indoor reference ambient temperatures to ensure the
conditions for thermal comfort).
Portuguese Adaptive Thermal Comfort Model – Adaptive
Thermal Comfort Model based on the ASHRAE 55:2010
model adjusted to Portuguese conditions (LNEC, 2010).
Standards, Regulations and Methodologies at National Level -
Portugal
3.Building Regulations
Portugal context – Thermal regulation
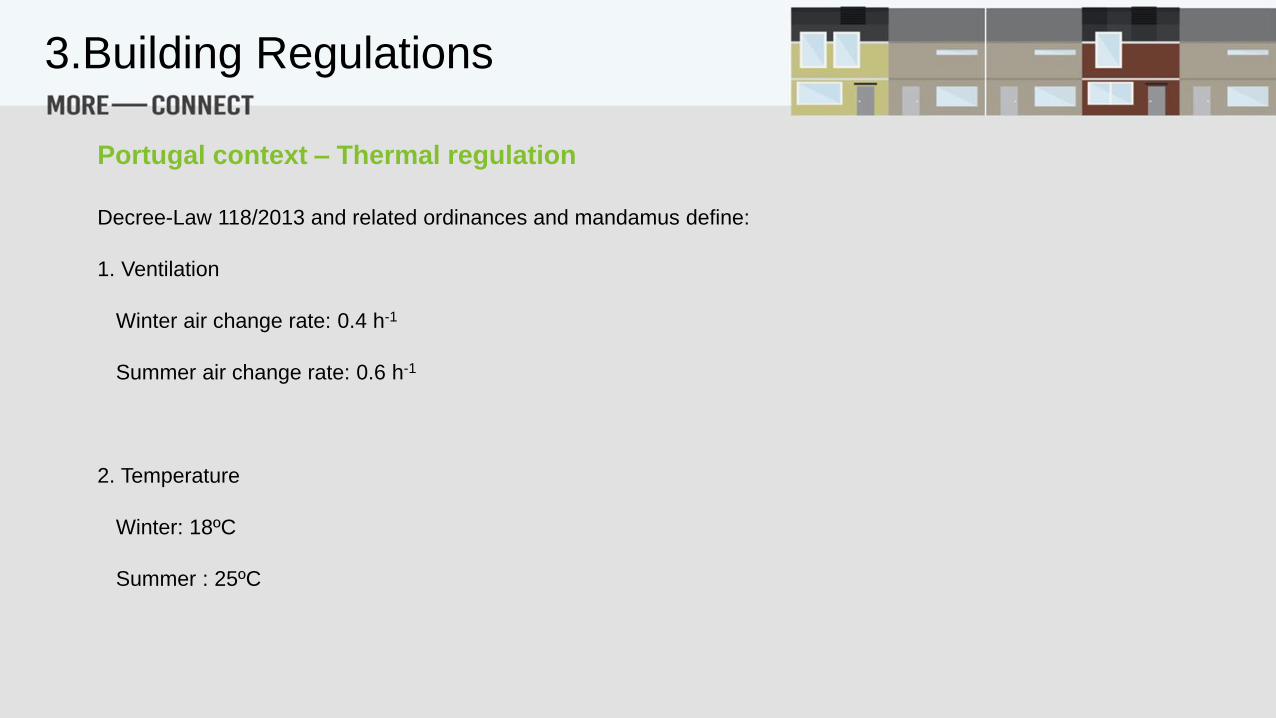
Portugal context – Thermal regulation
Decree-Law 118/2013 and related ordinances and mandamus define:
1. Ventilation
Winter air change rate: 0.4 h-1
Summer air change rate: 0.6 h-1
2. Temperature
Winter: 18ºC
Summer : 25ºC
3.Building Regulations
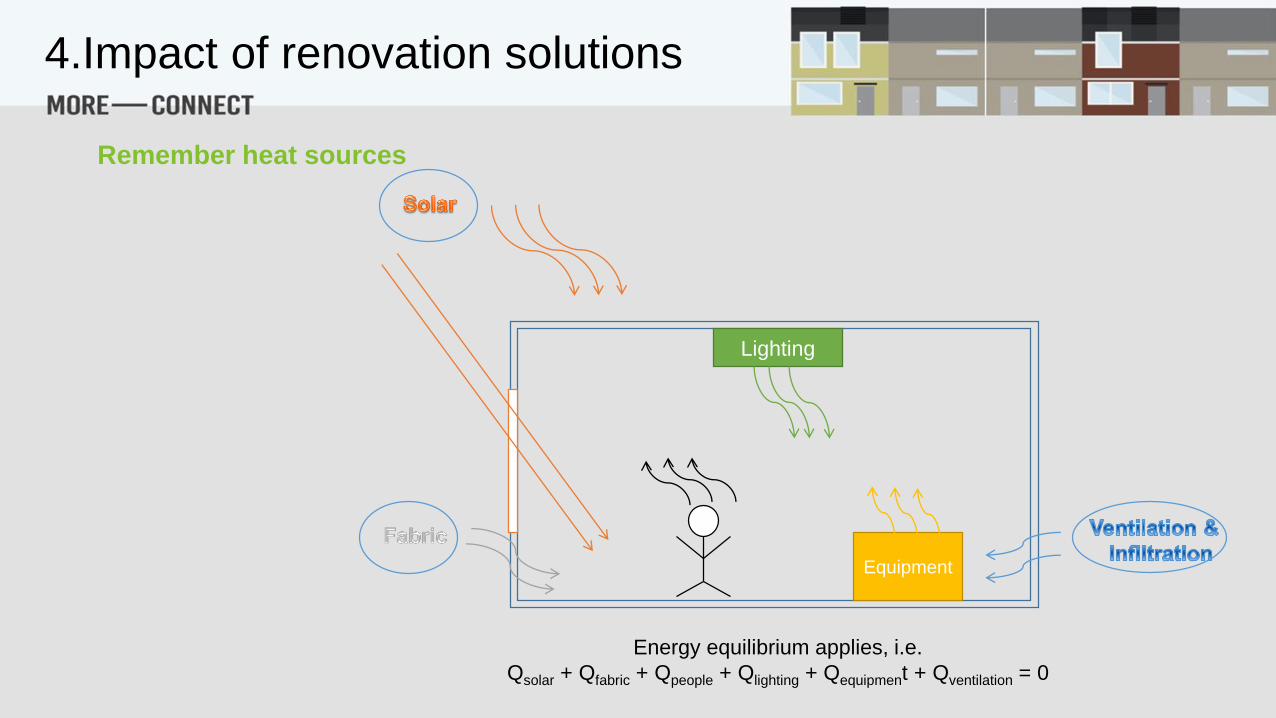
Lighting
Equipment
Energy equilibrium applies, i.e.
Qsolar + Qfabric + Qpeople + Qlighting + Qequipment + Qventilation = 0
4.Impact of renovation solutions
Remember heat sources
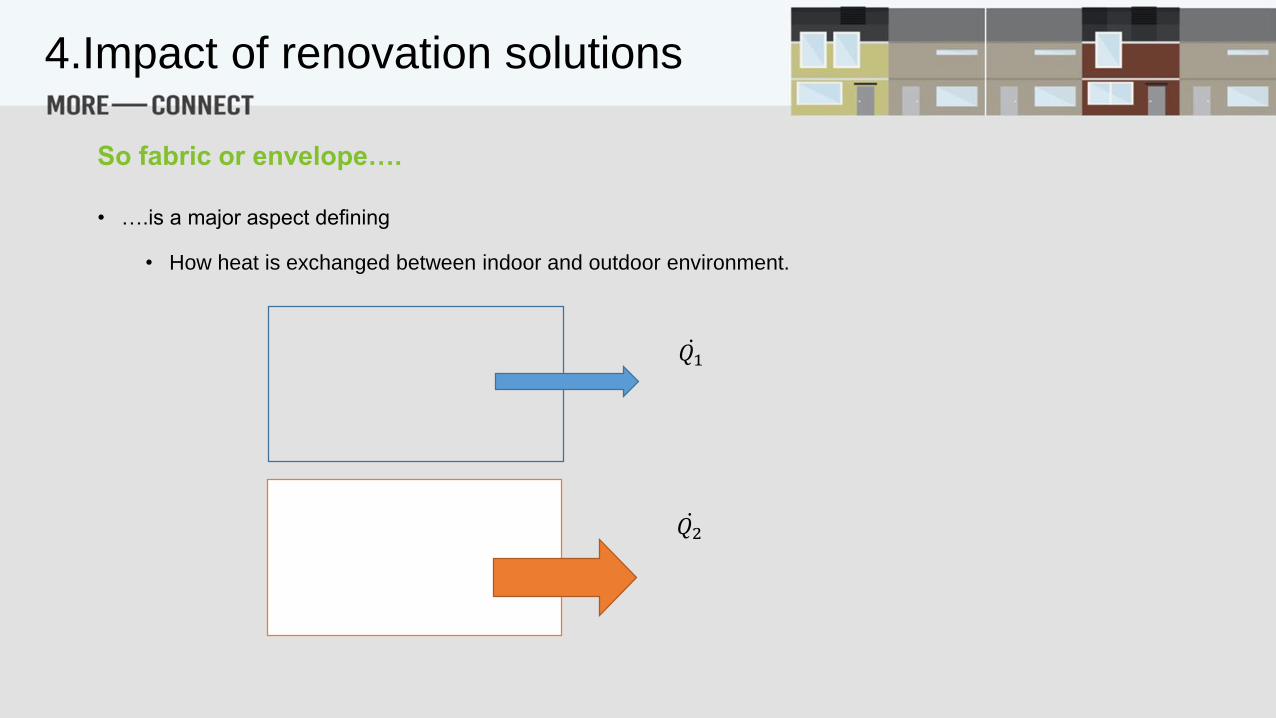
So fabric or envelope….
• ….is a major aspect defining
• How heat is exchanged between indoor and outdoor environment.
𝑄1
𝑄2
4.Impact of renovation solutions
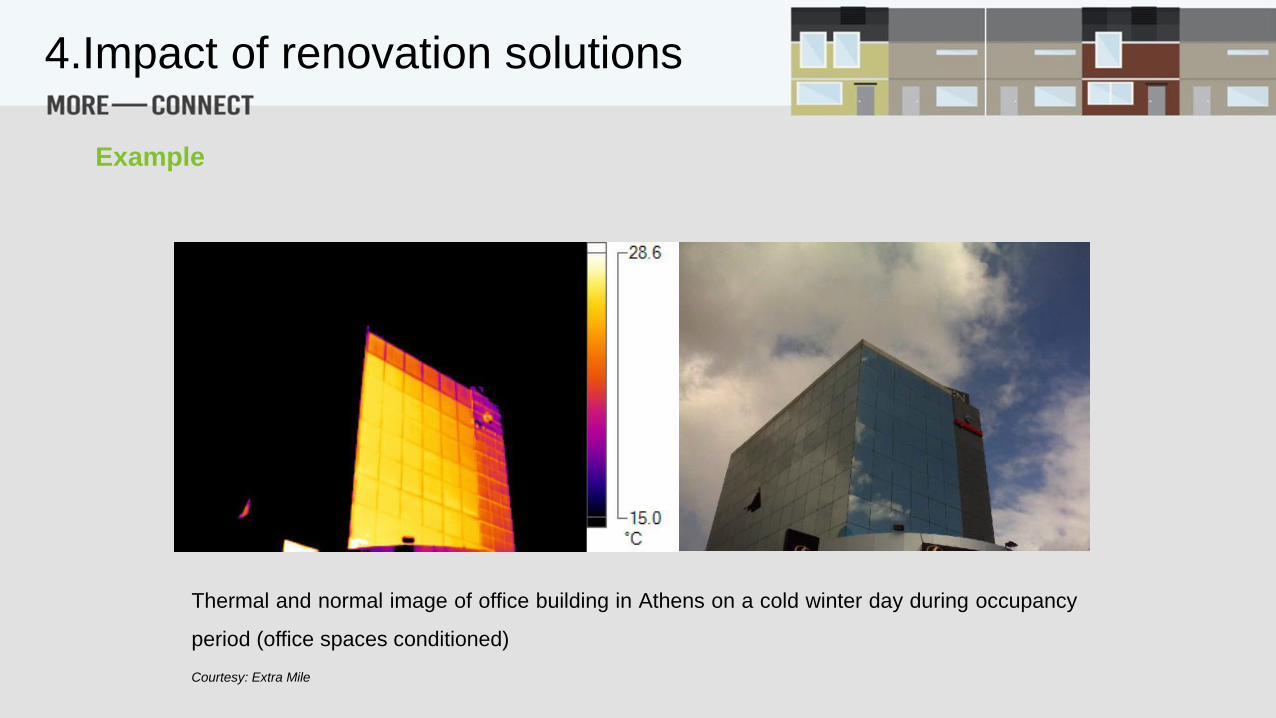
Example
Thermal and normal image of office building in Athens on a cold winter day during occupancy
period (office spaces conditioned)
Courtesy: Extra Mile
4.Impact of renovation solutions

Analogy 1
Analogous formulation
• Imagine that you have a tank of water with 100L
capacity and a tap of water which you can control.
• Also, that you feel comfortable to see it has
between 30-50L of water in it.
• But this tank has a hole in its bottom, so water
flows away…..
𝑄𝑖𝑛
𝑄𝑜𝑢𝑡
Qcomfortable
4.Impact of renovation solutions

Analogy 2
Analogous formulation
• Same as Analogy 1 but
• There are two taps. dQin1/dt is controlled by
someone else based on a known profile and
dQin2/dt is controlled by you at your own will
• also, you can only control dQout /dt only once.
𝑄𝑖𝑛1
𝑄𝑜𝑢𝑡
Qcomfortable
𝑄𝑖𝑛2
4.Impact of renovation solutions
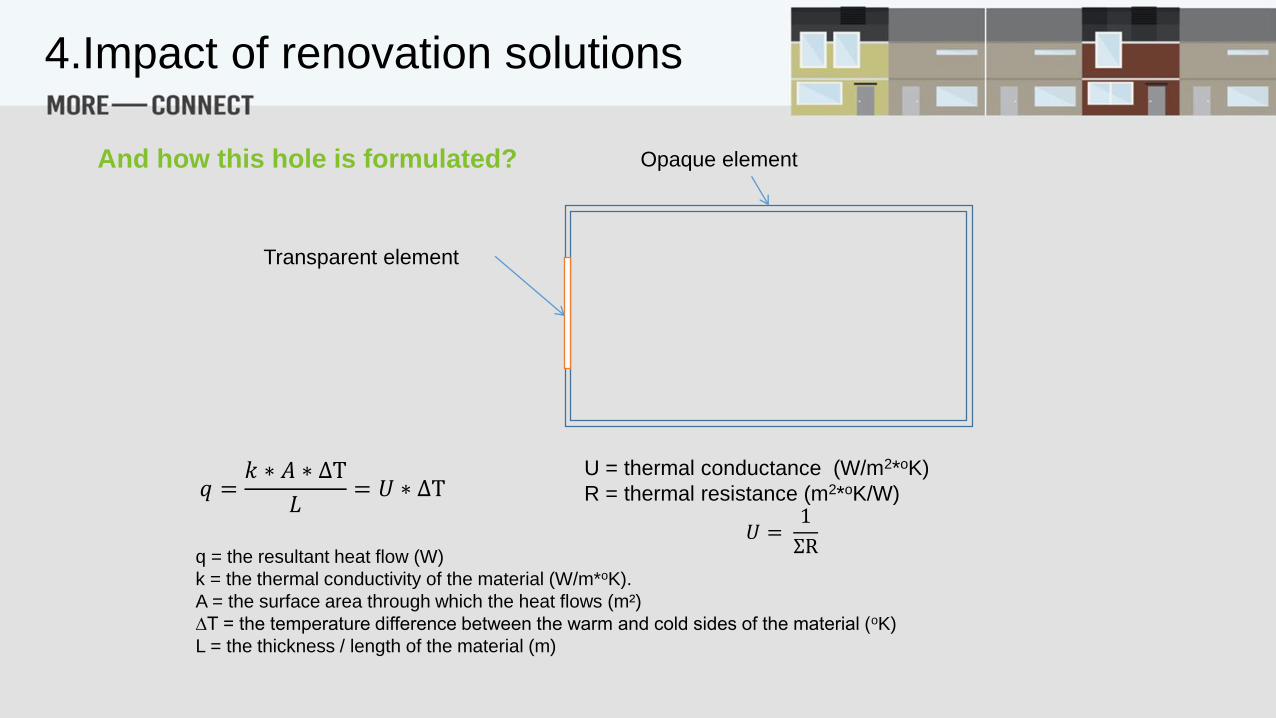
And how this hole is formulated? Opaque element
Transparent element
𝑞 =𝑘 ∗ 𝐴 ∗ ΔΤ
𝐿= 𝑈 ∗ ΔΤ
U = thermal conductance (W/m2*oK)
R = thermal resistance (m2*oK/W)
𝑈 =1
ΣRq = the resultant heat flow (W)
k = the thermal conductivity of the material (W/m*oK).
A = the surface area through which the heat flows (m²)
∆T = the temperature difference between the warm and cold sides of the material (oK)
L = the thickness / length of the material (m)
4.Impact of renovation solutions

Thermal capacity
• And since fabric participates in heat transfer
physical laws apply.
• Fabric elements store heat
• The amount of storage is analogues to:
• Density (because m=ρ*V)
• Material (because of cp)
Fabric = energy buffer
4.Impact of renovation solutions

What is the difference?
Formulation
• Two fabric elements:
• of identical dimensions
• of identical U values
• of different densities, i.e. ρ1<ρ2
• Of different cp, i.e. cp1<cp2
• One side at T1
• At t=0 T2=T3 < T1
What will happen and when?
T1
T1
T2
T3
m1
m2
4.Impact of renovation solutions

Thermal lag & comfort
Thermally
comfortable
temperatures
Temperature
time
Case 1
Lag 1
Lag 2
4.Impact of renovation solutions
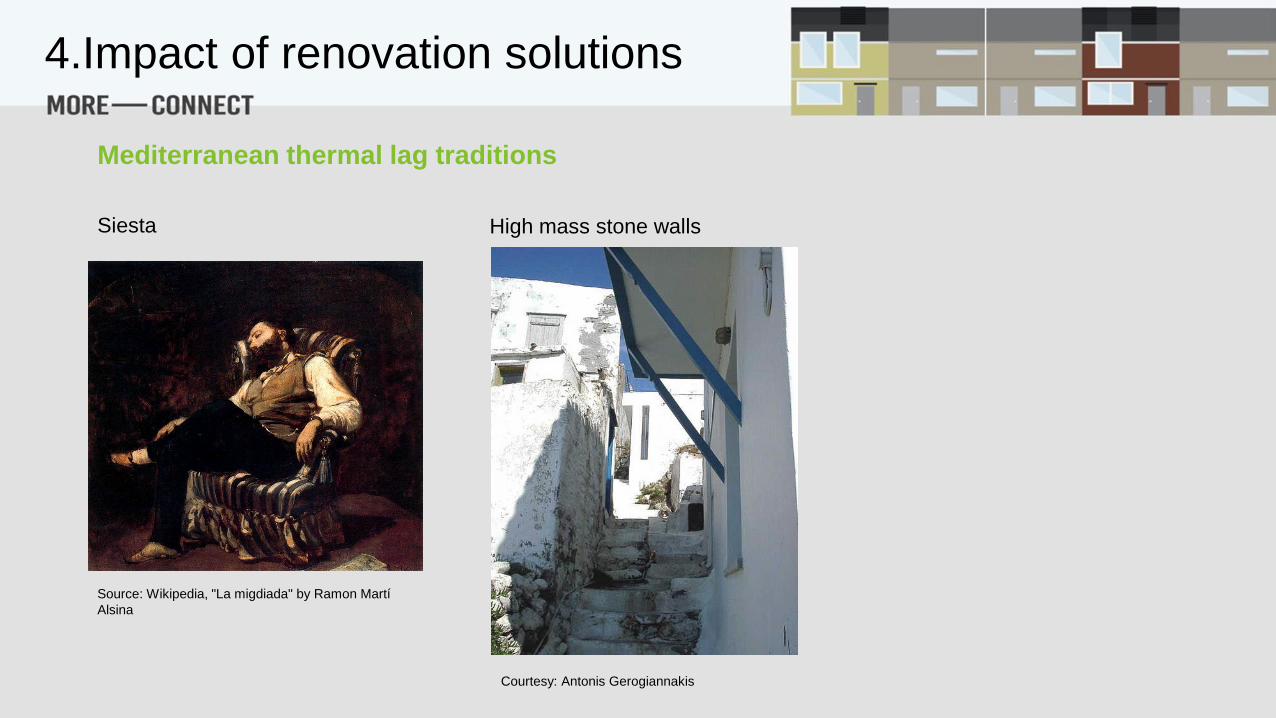
Mediterranean thermal lag traditions
Source: Wikipedia, "La migdiada" by Ramon Martí
Alsina
Siesta High mass stone walls
Courtesy: Antonis Gerogiannakis
4.Impact of renovation solutions
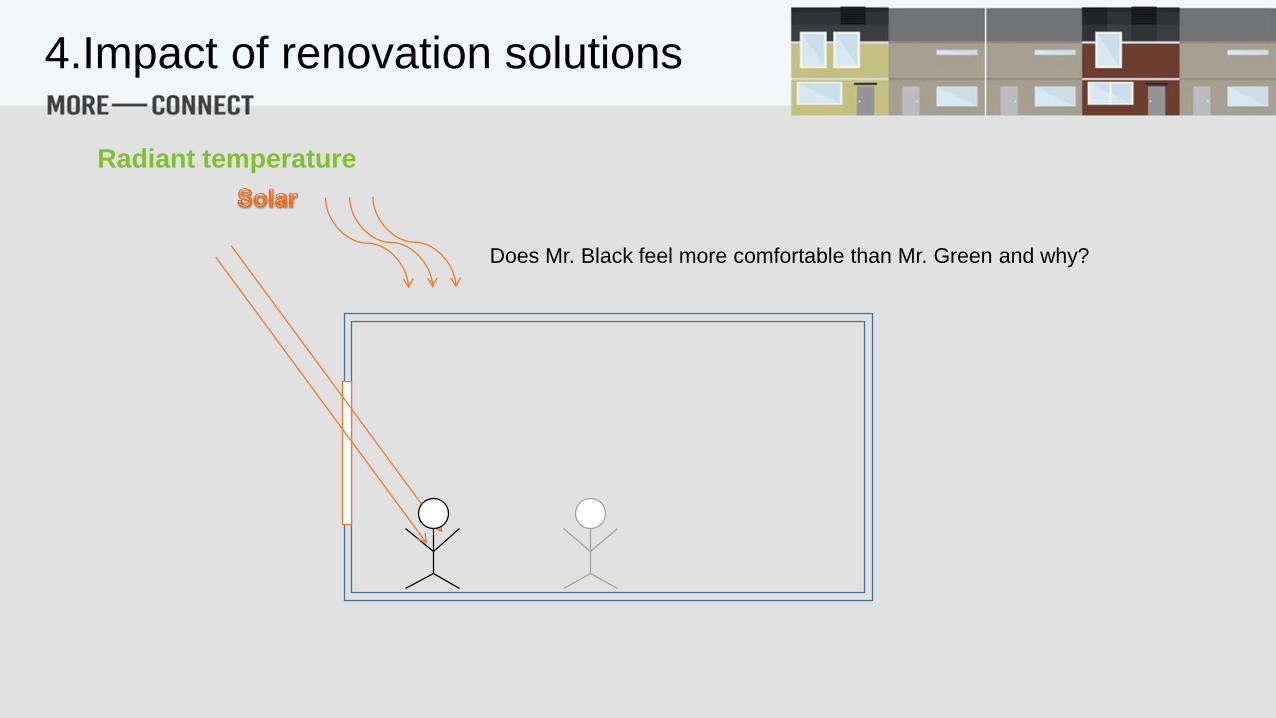
Radiant temperature
Does Mr. Black feel more comfortable than Mr. Green and why?
4.Impact of renovation solutions

But nothing is perfect…..
• There are always unwanted gaps in building envelope enabling air to pass through.
• Remember that the more the gaps the more the “hole” will be.
• Infiltration contributes to both sensible & latent loads.
4.Impact of renovation solutions

High humidity
• High relative humidity leads to indoor dampness and mould formation.
• According to WHO*:
• Houses in Europe experience indoor dampness in a percentage between 5-20%
• Houses in Europe experience mould formation in a percentage between 1,2-5%
• 12% of children living in houses with mould formation and 15% of that living in damp houses are expected
to suffer from asthma.
* World Health Organization. Regional Office for Europe, Environmental burden of disease
associated with inadequate housing, 2012
4.Impact of renovation solutions

Low humidity
• RH < 15-20% can lead to dryness and irritation of
eyes and of other organs belonging to the
respiratory track.
Courtesy Extra Mile
4.Impact of renovation solutions
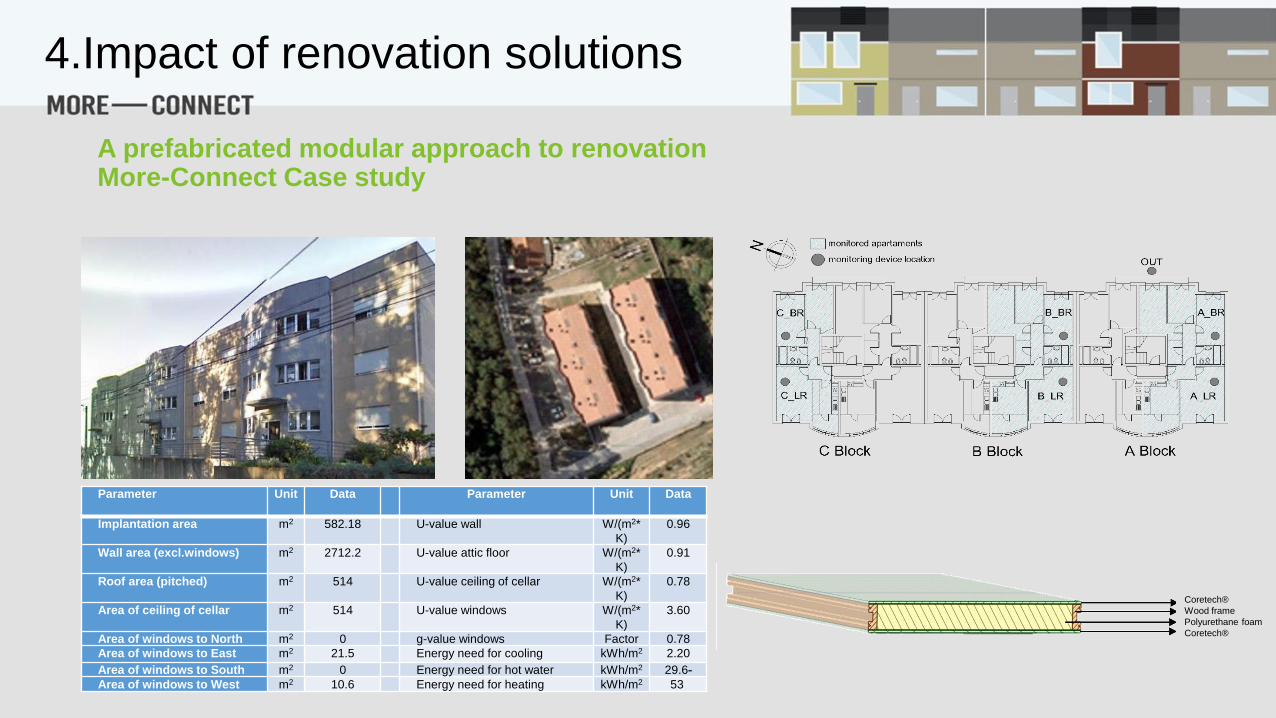
4.Impact of renovation solutions
A prefabricated modular approach to renovationMore-Connect Case study
Parameter Unit Data Parameter Unit Data
Implantation area m2 582.18 U-value wall W/(m2*
K)
0.96
Wall area (excl.windows) m2 2712.2 U-value attic floor W/(m2*
K)
0.91
Roof area (pitched) m2 514 U-value ceiling of cellar W/(m2*
K)
0.78
Area of ceiling of cellar m2 514 U-value windows W/(m2*
K)
3.60
Area of windows to North m2 0 g-value windows Factor 0.78
Area of windows to East m2 21.5 Energy need for cooling kWh/m2 2.20
Area of windows to South m2 0 Energy need for hot water kWh/m2 29.6-
Area of windows to West m2 10.6 Energy need for heating kWh/m2 53
Coretech®
Wood frame
Polyurethane foam
Coretech®

4.Impact of renovation solutions
A prefabricated modular approach to renovationMore-Connect Case study
Example of designed connection
between modules in exterior wall
corners
Example of designed connection
between modules in interior wall
corners
Example of designed connection
between modules and concrete
slabs (top view)
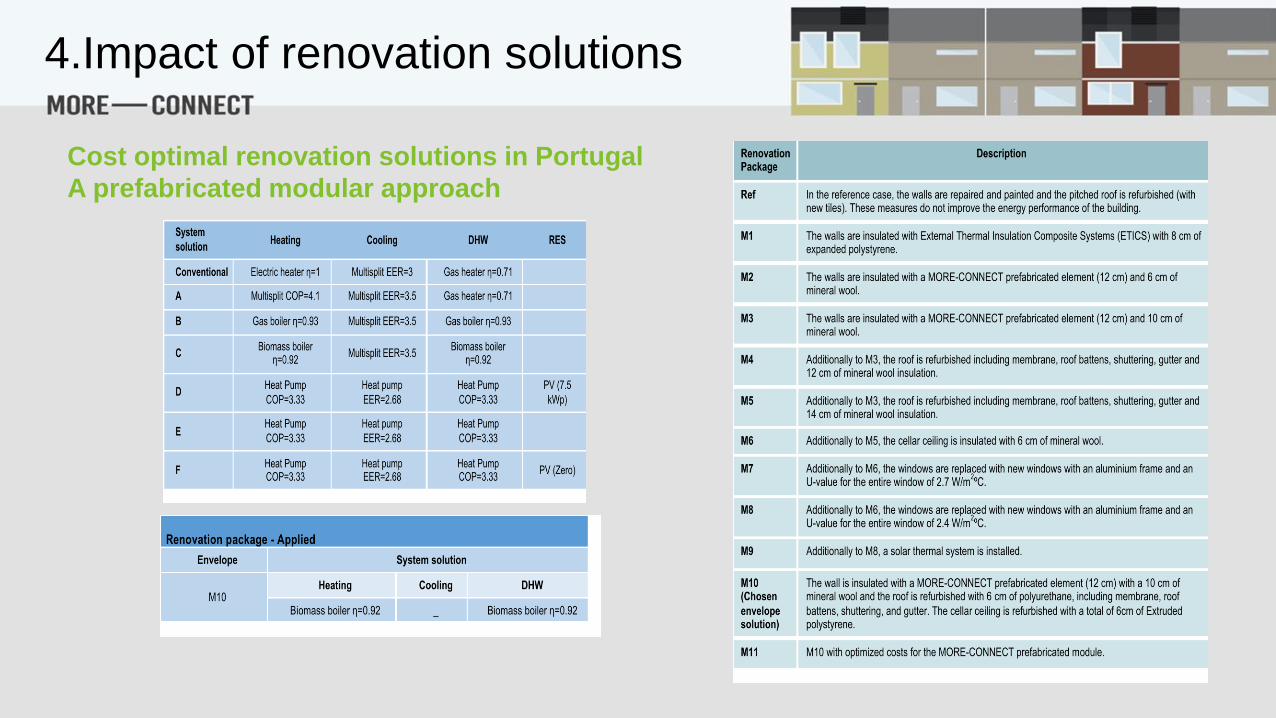
Cost optimal renovation solutions in Portugal
A prefabricated modular approach
4.Impact of renovation solutions
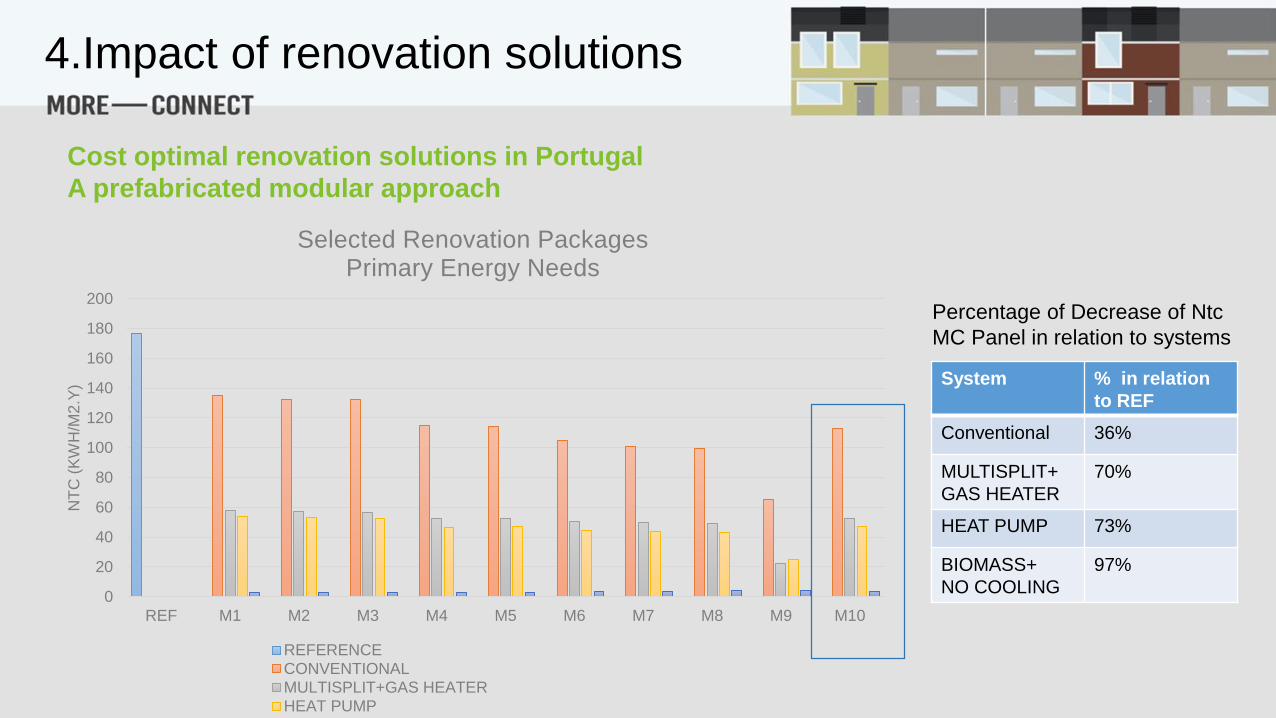
Cost optimal renovation solutions in Portugal
A prefabricated modular approach
4.Impact of renovation solutions
0
20
40
60
80
100
120
140
160
180
200
REF M1 M2 M3 M4 M5 M6 M7 M8 M9 M10
NT
C (
KW
H/M
2.Y
)
Selected Renovation PackagesPrimary Energy Needs
REFERENCECONVENTIONALMULTISPLIT+GAS HEATERHEAT PUMP
System % in relation
to REF
Conventional 36%
MULTISPLIT+
GAS HEATER
70%
HEAT PUMP 73%
BIOMASS+
NO COOLING
97%
Percentage of Decrease of Ntc
MC Panel in relation to systems

Thank you for your attention!
Bluyssen Philomena M (2009) The Indoor Environment Handbook How to Make Buildings Healthy and Comfortable, Earthscan ltd
(United Kingdom), ISBN-13: 9781844077878
Brager, G. S., de Dear, R. J. (1998) Thermal adaptation in the built environment: a literature review, Energy and Buildings 27
Ching & Adams (2003) Guide technique et pratique de la construction, p. 358-359.
CIBSE (2015): Guide A: Environmental design, ISBN: 1903287669
Clements-Croome, D. (2006). Creating the Productive Workplace, E&FN Spon, Taylor & Francis Group, London/New York, Second
edition.
Directive 2009/72/EC of the European Parliament and of the Council of 13 July 2009 concerning common rules for the internal
market in electricity and repealing Directive 2003/54/EC
Langkilde, G., Alexandersson, K., Wyon, D.P. and Fanger, P.O. (1973). Mental performance during slight cool or warm discomfort.
Archives des Sciences Physiologiques, 27, 511-518
Kolarik, J., Olesen, B.W., Toftum, J. and Mattarolo, L. (2007). Thermal Comfort, Perceived Air Quality and Intensity of SBS
Symptoms During Exposure to Moderate Operative Temperature Ramps. In proceedings of WellBeing Indoors-Clima 2007
conference, CD-ROM, Helsinki, Finland
Bibliography

Kolarik, J., Toftum, J., Olesen, B.W. and Shitzer, A. (2008). Human subjects’ perception of indoor environment and their office work
performance during exposures to moderate operative temperature ramps. 11th International Conference on Indoor Air Quality and
Climate 2008, Copenhagen, Denmark
Niemelä, R., Hannula, M., Rautio, S., Reijula, K. and Railio, J. (2002) The effect of air temperature on labour productivity in call
centres - a case study, Energy and Buildings, vol 34, pp759-764
Pepler, R.D., Warner, R.E. (1968). Temperature and learning: an experimental study. ASHRAE Transactions, Vol. 74, 211-219,
American Society of Heating, Refrigerating and Air Conditioning Engineers, Atlanta, USA
Seppänen, O. and Fisk W.J. (2005). Some quantitative relations between indoor environmental quality and work performance or
health, In: Proceedings of Indoor Air 2005, Beijing, China, pp. 40-53.
Toftum, J., Wyon, D.P., Svanekjær, H., Lantner, A. (2005). Remote Performance Measurement (RPM) – A new, internet-based
method for the measurement of occupant performance in office buildings. Indoor Air 2005, 10th International Conference on Indoor
Air Quality and Climate, 2-9 September, Beijing, China, vol. 1, pp. 357-361.
Wargocki, P. and Wyon, D. P. (2006) Effects of HVAC on Student Performance’ ASHRAE Journal, October, pp22-28
Bibliography

Wyon, D. P., Fanger, P. O., Olesen, B. W. and Pedersen, C. J. K. (1975) The mental performance of subjects clothed for comfort at
two different air temperatures, Ergonomics, vol 18, pp359-374
Wyon, D.P. (1993). Healthy buildings and their impact on productivity. In proceedings of Indoor Air (1993), 6, pp. 153-161, Helsinki,
Finland
Wyon, P.D. et al. (1975). The Mental Performance of Subjects Clothed for Comfort at Two Different Air Temperatures, Ergonomics.
vol. 18, no. 4, 359-374.
Wyon, P.D. et al. 1973. The effects of ambient temperature swings on comfort, performance and behaviour, Arch. Sci. Physiol., 27.
A 441-A458.
Wyon, P.D. et al. 1971. Factors affecting the subjective tolerance of ambient temperature swings", In Salmark, H. (editor): 5th
International Congress for Heating, ventilating and Air Conditioning, Copenhagen, vol. I, 87-107.
Bibliography
ASHRAE Standard 55, Thermal Environmental Conditions for Human Occupancy
ISO 7243, Hot environments - Estimation of the heat stress on working man, based on the WBGT index (wet bulb globe
temperature)
ISO 7726, Ergonomics of the thermal environment - Instruments for measuring physical quantities
ISO 7730, Moderate thermal environments – Determination of the PMV and PPD indices and specification of the conditions for
thermal comfort
ISO 7933, Ergonomics of the thermal environment - Analytical determination and interpretation of heat stress using calculation of
the predicted heat strain
ISO 8996, Ergonomics of the thermal environment - Determination of metabolic rate
ISO 9888, Evaluation of thermal strain by physiological measurements
ISO 9920, Ergonomics of the thermal environment - Estimation of the thermal insulation and evaporative resistance of a clothing
ensemble
ISO 10551, Ergonomics of the thermal environment - Assessment of the influence of the thermal environment using subjective
judgement scales
ISO 11399, Ergonomics of the thermal environment - Principles and application of relevant International Standards
Bibliography
ISO TR 11079, Ergonomics of the thermal environment - Analytical determination and interpretation of cold stress using calculation
of the required clothing insulation (IREQ) and the assessment of local cooling effects
EN ISO 12894, Ergonomics of the thermal environment – Medical supervision of individuals exposed to extreme hot or cold
environments
ISO 13732-3, Ergonomics of the thermal environment – Touching of cold surfaces Part 3. Ergonomics data and guidance for
application
ISO 15265, Ergonomics of the thermal environment – Risk assessment strategy for the prevention of stress and discomfort in
thermal working conditions
ISO 15743, Ergonomics of the thermal environment - cold workplaces - risk assessment and management
EN 511, Specification for protective gloves against cold
EN 563, Safety of machinery – Temperatures of touchable surfaces – Ergonomics data to establish temperature limit values for hot
surfaces
EN 14058, Protective clothing garments for protection against cool environments
EN 15251, Indoor environmental input parameters for design and assessment of energy performance of buildings addressing indoor
air quality, thermal environment, lighting and acoustics
Bibliography
Copyright © 2022 FDOKUMEN