
Using Wind Catchers for Improved Thermal Comfort ... - MDPI
18
buildings Article Keeping Cool in the Desert: Using Wind Catchers for Improved Thermal Comfort and Indoor Air Quality at Half the Energy Jamal Saif 1 , Andrew Wright 2 , Sanober Khattak 2, * and Kasem Elfadli 3 Citation: Saif, J.; Wright, A.; Khattak, S.; Elfadli, K. Keeping Cool in the Desert: Using Wind Catchers for Improved Thermal Comfort and Indoor Air Quality at Half the Energy. Buildings 2021, 11, 100. https:// doi.org/10.3390/buildings11030100 Academic Editor: Sukumar Natarajan Received: 30 December 2020 Accepted: 26 February 2021 Published: 6 March 2021 Publisher’s Note: MDPI stays neutral with regard to jurisdictional claims in published maps and institutional affil- iations. Copyright: © 2021 by the authors. Licensee MDPI, Basel, Switzerland. This article is an open access article distributed under the terms and conditions of the Creative Commons Attribution (CC BY) license (https:// creativecommons.org/licenses/by/ 4.0/). 1 Independent Researcher, Leicester LE1 4PF, UK; [email protected] 2 Faculty of Computing, Engineering and Media, De Montfort University, Leicester LEI 9BH, UK; [email protected] 3 Environmental Health Department, College of Health Sciences, The Public Authority for Applied Education and Training (PAAET), Shuwaikh, Kuwait; [email protected] * Correspondence: [email protected] Abstract: In hot arid climates, air conditioning in the summer dominates energy use in buildings. In Kuwait, energy demand in buildings is dominated by cooling, which also determines the national peak electricity demand. Schools contribute significantly to cooling demand, but also suffer from poor ventilation. This paper presents analysis of a ventilation and cooling system for school classrooms using a wind catcher for natural ventilation and evaporative cooling. A school classroom in Kuwait with single-sided ventilation was modelled using the DesignBuilder V5.4/EnergyPlus V9.1 software and calibrated using field data. The model was used to analyse the performance of a wind catcher, with and without evaporative cooling, in terms of energy use, thermal comfort and indoor air quality. Compared to the baseline of using air-conditioning only, a wind catcher with evaporative cooling was found to reduce energy use by 52% during the summer months while increasing the comfortable hours from 76% to 100% without any supplementary air conditioning. While the time below the ASHRAE CO 2 limit also improved from 11% to 24% with the wind catcher, the indoor air quality was still poor. These improvements came at the cost of a 14% increase in relative humidity. As the wind catcher solution appears to have potential with further development; several avenues for further research are proposed. Keywords: energy efficiency; thermal comfort; natural ventilation; cooling load; air-conditioning; school; wind catcher; carbon dioxide 1. Introduction Buildings are responsible for about 40% of global energy use, and usage is predicted to continuously grow further [1]. For countries in which fossil fuels dominate energy supply, use in buildings directly leads to carbon emissions. In Kuwait, primary energy is almost entirely sourced from oil and gas reserves [2]. With a hot desert climate, the energy demand for cooling dominates the country’s energy requirements due to extreme temperatures in summer [3]. Air conditioning (AC) accounts for more than 60% residential energy use and more than 85% of peak load [4]. Kuwait’s per capita energy consumption is among the highest globally; in 2014 for instance, the country’s per capita energy consumption was 15,591 kWh [5], with buildings accounting for a massive 90% of the country’s electricity demand. Peak demand has also grown rapidly, and approximately doubled since 2000, to over 14 GW in 2020 [6,7]. Thus, it becomes very important to reduce energy consumption in buildings whilst providing comfortable and healthy indoor conditions. For this purpose, the Kuwaiti government has set a target to reduce buildings energy demand by 15% by 2030 [8]. According to the Kuwaiti Ministry of Energy, in 2017 Kuwait had approximately 382,817 school students and 949 schools, which is the building type modelled in this paper [9]. The average classroom is occupied by approximately 45 students. The classrooms Buildings 2021, 11, 100. https://doi.org/10.3390/buildings11030100 https://www.mdpi.com/journal/buildings
-
Upload
khangminh22 -
Category
Documents
-
view
4 -
download
0
Transcript of Using Wind Catchers for Improved Thermal Comfort ... - MDPI

buildings
Article
Keeping Cool in the Desert: Using Wind Catchers for ImprovedThermal Comfort and Indoor Air Quality at Half the Energy
Jamal Saif 1, Andrew Wright 2 , Sanober Khattak 2,* and Kasem Elfadli 3
�����������������
Citation: Saif, J.; Wright, A.; Khattak,
S.; Elfadli, K. Keeping Cool in the
Desert: Using Wind Catchers for
Improved Thermal Comfort and
Indoor Air Quality at Half the Energy.
Buildings 2021, 11, 100. https://
doi.org/10.3390/buildings11030100
Academic Editor: Sukumar Natarajan
Received: 30 December 2020
Accepted: 26 February 2021
Published: 6 March 2021
Publisher’s Note: MDPI stays neutral
with regard to jurisdictional claims in
published maps and institutional affil-
iations.
Copyright: © 2021 by the authors.
Licensee MDPI, Basel, Switzerland.
This article is an open access article
distributed under the terms and
conditions of the Creative Commons
Attribution (CC BY) license (https://
creativecommons.org/licenses/by/
4.0/).
1 Independent Researcher, Leicester LE1 4PF, UK; [email protected] Faculty of Computing, Engineering and Media, De Montfort University, Leicester LEI 9BH, UK;
[email protected] Environmental Health Department, College of Health Sciences, The Public Authority for Applied Education
and Training (PAAET), Shuwaikh, Kuwait; [email protected]* Correspondence: [email protected]
Abstract: In hot arid climates, air conditioning in the summer dominates energy use in buildings. InKuwait, energy demand in buildings is dominated by cooling, which also determines the nationalpeak electricity demand. Schools contribute significantly to cooling demand, but also suffer from poorventilation. This paper presents analysis of a ventilation and cooling system for school classroomsusing a wind catcher for natural ventilation and evaporative cooling. A school classroom in Kuwaitwith single-sided ventilation was modelled using the DesignBuilder V5.4/EnergyPlus V9.1 softwareand calibrated using field data. The model was used to analyse the performance of a wind catcher,with and without evaporative cooling, in terms of energy use, thermal comfort and indoor air quality.Compared to the baseline of using air-conditioning only, a wind catcher with evaporative coolingwas found to reduce energy use by 52% during the summer months while increasing the comfortablehours from 76% to 100% without any supplementary air conditioning. While the time below theASHRAE CO2 limit also improved from 11% to 24% with the wind catcher, the indoor air quality wasstill poor. These improvements came at the cost of a 14% increase in relative humidity. As the windcatcher solution appears to have potential with further development; several avenues for furtherresearch are proposed.
Keywords: energy efficiency; thermal comfort; natural ventilation; cooling load; air-conditioning;school; wind catcher; carbon dioxide
1. Introduction
Buildings are responsible for about 40% of global energy use, and usage is predicted tocontinuously grow further [1]. For countries in which fossil fuels dominate energy supply,use in buildings directly leads to carbon emissions. In Kuwait, primary energy is almostentirely sourced from oil and gas reserves [2]. With a hot desert climate, the energy demandfor cooling dominates the country’s energy requirements due to extreme temperatures insummer [3]. Air conditioning (AC) accounts for more than 60% residential energy use andmore than 85% of peak load [4]. Kuwait’s per capita energy consumption is among thehighest globally; in 2014 for instance, the country’s per capita energy consumption was15,591 kWh [5], with buildings accounting for a massive 90% of the country’s electricitydemand. Peak demand has also grown rapidly, and approximately doubled since 2000, toover 14 GW in 2020 [6,7]. Thus, it becomes very important to reduce energy consumptionin buildings whilst providing comfortable and healthy indoor conditions. For this purpose,the Kuwaiti government has set a target to reduce buildings energy demand by 15% by2030 [8].
According to the Kuwaiti Ministry of Energy, in 2017 Kuwait had approximately382,817 school students and 949 schools, which is the building type modelled in thispaper [9]. The average classroom is occupied by approximately 45 students. The classrooms
Buildings 2021, 11, 100. https://doi.org/10.3390/buildings11030100 https://www.mdpi.com/journal/buildings

Buildings 2021, 11, 100 2 of 18
are cooled by split systems, which provide cooling but no fresh air, relying on infiltrationand windows for ventilation. This results in poor indoor air quality and high CO2 levels [10].If the air change rate is increased by opening windows, then the air-conditioning systemwill consume considerably more electricity during peak summer conditions—an undesiredconsequence. A review of literature reveals that such a space conditioning strategy may bedetrimental to the children’s health and educational performance.
A study by Myhrvold and Olesen [11] investigated the ability of students to concen-trate in 35 classrooms in Norway by measuring the students’ reaction times under variousrates of ventilation. The study showed that by lowering the rate of ventilation per personfrom 12 to 4 L/s, students’ reaction times slowed by 5.4%. In Japan, it was established thatby raising the rate of ventilation from 0.6 to 6 L/s, the students’ performance was enhancedby 5.5% [12]. Furthermore, Wargocki et al. [13] and Wargocki et al. [14] investigated howthe rate of ventilation affects the performance of ten-year-old school children carryingout similar tasks. They established that by raising the ventilation rate to 10 L/s from5 L/s, there was a 15% improvement in the school’s work performance and an identifiableimprovement in the learning and performance of individual children. While there havebeen several studies on classrooms in hot climates, almost all of these have been in hothumid (tropical and subtropical) climates, which are not particularly relevant [15] withfew exceptions; for instance Al-Rashidi et al., [16] found discrepancies between variouscomfort model predictions and actual sensations in mixed-mode classrooms with cooling.
Achieving high levels of comfort, energy efficiency and adequate ventilation in suchclimates is challenging, and these objectives are often compromised in practice [17]. Astudy of different cooling approaches [18] found that night ventilation could be effective,but had limitations compared to mechanical systems even in European climates.
This study focuses on thermal comfort, energy efficiency and indoor air quality (interms of CO2) in Kuwaiti classrooms. Specifically, a wind tower solution is investigated inthis work using computer simulation, with and without evaporative cooling and comparedwith the existing system for a case study classroom.
2. Wind Catchers
Natural ventilation designs can increase internal air speeds to improve thermal com-fort in warm conditions, whilst also improving indoor air quality. Additionally, naturalventilation is passive with no direct energy demand. For centuries, traditional passivecooling wind catchers (also called wind towers, or badgirs in Iran) have been employed inhot areas of Eastern Asia and Middle East [19–21]. It is called a wind catcher since it catcheswind-driven air from outside a building from a higher elevation and forces it downwardsinto an indoor space. In this strategy a vertical shaft of height ranging between 2 and 20 mabove the roof level of a building is utilized with openings inside the building level and atthe top of the shaft [22]. Traditional wind tower systems used both stack and wind forcesto capture fresher air with minimal dust at a high level.
This strategy is proposed for hot and arid climatic regions that experience largedaily temperature variation; high temperatures during the day and low temperatures atnight [23]. There are many designs and configurations, which have evolved over centuries,as a result of local climate and needs. Larger buildings and even some houses have multiplewind catchers. In one configuration, a downward current is created in the morning whenthe walls of the catchers are still cool (reverse stack effect), so the air moves down andinto the building (see Figure 1a). Air is then expelled via the building outlet openingsthat may be found in the tower or may be positioned at the building level to promote aircirculation [23,24]. At night-time, the tower and the now warm walls heat the indoor air,which rises by buoyancy [25] and is expelled via the top openings in the tower [23]; this isillustrated in Figure 1b. Some wind catchers draw air through an underground tunnel, andinclude evaporative cooling [21].

Buildings 2021, 11, 100 3 of 18Buildings 2021, 11, x 3 of 19
Figure 1. Wind tower system principles: (a) daytime down-draught operating principles and (b) night-time up-draught reverse-up [26].
According to previous studies, factors that influence the performance of wind catch-ers include: (i) wind angle of incidence at the openings [24]; (ii) location and size of the openings [11] and finally (iii) the geometry of the tower; its height, shape and cross-sec-tional area [27,28]. For example, Elmualim et al. [29] and Kolokotroni et al. [30] showed that the performance of a wind catcher system is dependent on the direction and speed of the wind. They also showed that to achieve a maximum rate of air flow, the wind catcher design that has a single opening facing the direction of the wind was most effective. A computer simulation study was made for a house in Dubai with wind catchers [31]. Dubai is about 890 km south-east of Kuwait; it has slightly lower summer temperatures, but much higher humidity. This found that the height and cross-sectional area of the towers significantly affected air flows but had a small effect on internal temperatures. The authors found that adaptive comfort could almost be achieved, and noted “Each of the [three] towers works in at least six modes that provide more or less air in or out of the bases of the wind tower shafts…”, which illustrates the complexity involved. For Kuwait, the an-nual Windrose diagram is shown in Figure 2 (right). Clearly wind speeds in excess of 10 mph are observed in a consistent direction—indicating that wind driven ventilation de-signs (such as the wind catcher) may be employed in this part of the world.
Additionally, several technological improvements to the wind catcher can be made to provide improved thermal comfort [24]. For instance, modern advanced wind catchers may include; (i) evaporative coolers like evaporative cooler pads at the tower top, wetted surfaces and columns in the tower [22,32] and at the bottom a pool [27] intended to lower the temperature of indoor air and to raise the relative humidity of indoor air especially in hot areas; (ii) solar chimneys or collectors [33], which enhance ventilation due to stack effect during periods of low winds and (iii) additional devices to increase airflow and hence air velocity in the space; for example fans powered by photovoltaic modules [33]. Several experimental studies have reviewed the effectiveness of wind-towers and the re-sults showed that they were effective at inducing indoor air movement [34–36]. In addi-tion, Sadafi et al. [25] investigated the performance of wind tower strategy using Venturi-shaped roof in Malaysia, a hot and humid climate; they found that the system effectively induced air change rate and extraction flow rate in the room used for the experiment.
From the above-mentioned technological supplements to the wind catcher, evapora-tive cooling is perhaps the most common that allows providing much improved thermal comfort at the expense of some additional electricity. A downside is the reduced effective-ness of evaporative cooling as humidity increases. Additionally, the water evaporated may also increase humidity that can cause serious health concerns, such as the risk of Legionella. Therefore, for the geographic locations where humidity is high, or if the hu-
Figure 1. Wind tower system principles: (a) daytime down-draught operating principles and (b)night-time up-draught reverse-up [26].
According to previous studies, factors that influence the performance of wind catchersinclude: (i) wind angle of incidence at the openings [24]; (ii) location and size of theopenings [11] and finally (iii) the geometry of the tower; its height, shape and cross-sectional area [27,28]. For example, Elmualim et al. [29] and Kolokotroni et al. [30] showedthat the performance of a wind catcher system is dependent on the direction and speed ofthe wind. They also showed that to achieve a maximum rate of air flow, the wind catcherdesign that has a single opening facing the direction of the wind was most effective. Acomputer simulation study was made for a house in Dubai with wind catchers [31]. Dubaiis about 890 km south-east of Kuwait; it has slightly lower summer temperatures, butmuch higher humidity. This found that the height and cross-sectional area of the towerssignificantly affected air flows but had a small effect on internal temperatures. The authorsfound that adaptive comfort could almost be achieved, and noted “Each of the [three]towers works in at least six modes that provide more or less air in or out of the bases of thewind tower shafts . . . ”, which illustrates the complexity involved. For Kuwait, the annualWindrose diagram is shown in Figure 2 (right). Clearly wind speeds in excess of 10 mphare observed in a consistent direction—indicating that wind driven ventilation designs(such as the wind catcher) may be employed in this part of the world.
Additionally, several technological improvements to the wind catcher can be madeto provide improved thermal comfort [24]. For instance, modern advanced wind catchersmay include; (i) evaporative coolers like evaporative cooler pads at the tower top, wettedsurfaces and columns in the tower [22,32] and at the bottom a pool [27] intended to lowerthe temperature of indoor air and to raise the relative humidity of indoor air especiallyin hot areas; (ii) solar chimneys or collectors [33], which enhance ventilation due to stackeffect during periods of low winds and (iii) additional devices to increase airflow and henceair velocity in the space; for example fans powered by photovoltaic modules [33]. Severalexperimental studies have reviewed the effectiveness of wind-towers and the resultsshowed that they were effective at inducing indoor air movement [34–36]. In addition,Sadafi et al. [25] investigated the performance of wind tower strategy using Venturi-shapedroof in Malaysia, a hot and humid climate; they found that the system effectively inducedair change rate and extraction flow rate in the room used for the experiment.
From the above-mentioned technological supplements to the wind catcher, evapora-tive cooling is perhaps the most common that allows providing much improved thermalcomfort at the expense of some additional electricity. A downside is the reduced effective-ness of evaporative cooling as humidity increases. Additionally, the water evaporated mayalso increase humidity that can cause serious health concerns, such as the risk of Legionella.Therefore, for the geographic locations where humidity is high, or if the humidity is highat a certain time of the year, the evaporative cooling process will be ineffective. However,

Buildings 2021, 11, 100 4 of 18
Kuwait has a hot and dry climate, thus making evaporative cooling a suitable technologyto be considered.
There are numerous applications for direct evaporative cooling. For instance, Wachen-feldt et al. [37] presented a passive downdraught evaporative cooling system with multiplewind catchers equipped with a water/vapour supply at the top of one wind catcher. Whilemaintaining conditions near saturation along its entire length, consistent droplets of waterfall down through the tower, allowing cool air to descend the tower. With successivedifferences in the density of air and within a local thermal imbalance, in this process, thewater droplets evaporate. Consequently, the air moves from the top of the tower, fromthe high-pressure zone where the air is less dense and hot to the bottom of the tower, to alower pressure zone where the air is denser and colder, with increased humidity.
Natural ventilation strategies based on wind force can provide well distributed andcontrollable indoor air movement with increased speed necessary in creating a coolingeffect and hence human comfort indoors. Though not widely used in modern buildingsor suitable for some types (such as high-rise), wind catchers can provide large volumesof air flow and hence high air changes. This is advantageous in providing safer internalenvironments with respect to the Covid-19 coronavirus, although the airflow pattern is alsoimportant [38]. The next section provides a short background on suitable thermal comfortmetric to assess naturally ventilated and air-conditioned buildings.
3. Thermal Comfort
How building occupants perceive comfort varies between individuals and how thebuilding is operated. According to ASHRAE 55 2004 [39], “Thermal comfort is the con-dition of mind that expresses satisfaction with the thermal environment and is assessedby subjective evaluation”. The most important parameters determining comfort are airand radiant temperatures, air velocity, metabolic rate and clothing, but there is large vari-ation between individuals. Many different models have been devised to assess thermalcomfort [40,41] however the most commonly used ones are the Fanger’s model, and theadaptive ANSI/ASHRAE standard 55 2017, and these were used in this study.
The Fanger model [42] has two comfort indices, the predicted mean vote (PMV) andthe predicted percentage of dissatisfied occupants (PPD). The PMV is the average voteof a group of occupants predicted by the model, based on the well-known ASHRAEseven-point vote scale from hot (3) through neutral (0) to cold (−3) [39]. While widelyused, this model is not applicable to buildings with natural ventilation systems, as in suchbuildings, the occupants can adapt to their environment [43]. De Dear et al. [44] showthat occupants may physiologically adapt to their thermal environment resulting in thedevelopment of adaptive models, incorporated into the ANSI/ASHRAE standard 55 in2004 [43]. The expected indoor thermal comfort temperature that adapts to the outdoordry bulb temperature is calculated using a linear relationship as follows (Equation (1)),
Tc = aTo + b (1)
where Tc is the predicted indoor thermal comfort temperature, To is the outdoor referencetemperature, a is the slope of the function, proportional to the degree of adaptation and bis the y-intercept.
The constants “a” and “b”, depend on empirical data gathered within a specific context,and related to the climatic conditions and cultural background, etc. The outdoor referencetemperature is defined in the ANSI/ASHRAE 55 2017 standard [45], as “prevailing meanoutdoor air temperature”, defined by Equation (2) as:
To = (1 − α)[
Te(d−1) + αTe(d−2) + α2Te(d−3) + α3Te(d−4) + · · ·]
(2)
where α is a constant (<1) and Te(d−1), Te(d−2), etc. are the daily mean external temperaturesfor yesterday, the day before, and so on. Since α < 1, this series puts greater weight onthe temperature for days closer to the current day (a value of 0 produces just yesterday’s

Buildings 2021, 11, 100 5 of 18
temperature, the “history” increases with α). A value of 0.8 is often used based on empiricalstudies, but the appropriate value depends on the variability of the climate. Lower valuesare used with more variable climate (corresponding to a more rapidly varying weightedmean), according to ASHRAE 55 Informative Appendix J, although this is not formallypart of the standard. As Kuwait has a consistent summer climate with little day to dayvariation, a higher value of α would be more appropriate.
Within Kuwait, the above equation can be used to calculate the variation in prevailingmean outdoor air temperature. This is important as it would provide information onwhether the ASHRAE standard is applicable for these weather conditions. Figure 2 (left)shows the daily average maximum and minimum temperatures by month in Kuwait City,Kuwait. The monthly mean outdoor air temperatures range from 14 ◦C in January to38.7 ◦C in July. Therefore, any adaptive model used should have a prevailing mean temper-ature that covers this range. In case of the ASHRAE adaptive model, the upper limit for theprevailing outdoor temperature limit is 33.5 ◦C. However, in Kuwait, from June to Septem-ber the outdoor reference temperature is above this limit making the ASHRAE standardunsuitable for application in these hot months. Principally, for natural ventilation-basedsystems where the running mean temperature exceeds 33.5 ◦C, neither the Fanger PMVmodel, nor the ASHRAE adaptive model is eligible for application. Advisory Appendix Jof the Standard states that “no specific guidance for such conditions is included in this stan-dard”. The adaptive model is used here for the natural ventilation-based scenarios despiteviolation of the 33.5 ◦C limit. This is because there is evidence from field visits in othersimilar hot climates, which the comfortable indoor temperature may have a much largeracceptable range than what is acceptable according to the Fanger’s model. An example ofthis is the Indian IMAC model for adaptive comfort, which predicts comfortable indoorconditions even when Fanger’s PPD% is as high as 75% [46]. For these reasons, and for thelack of a better choice, the adaptive model is used. Therefore, the results of this work mustbe considered with this limitation in mind. This does indeed highlight a knowledge gapthat needs to be addressed for good building design in hot climates, especially consideringthat our world would be hotter towards the end of this century.
Buildings 2021, 11, x 5 of 19
where α is a constant (<1) and Te(d−1), Te(d−2), etc. are the daily mean external temperatures for yesterday, the day before, and so on. Since α < 1, this series puts greater weight on the temperature for days closer to the current day (a value of 0 produces just yesterday’s tem-perature, the “history” increases with α). A value of 0.8 is often used based on empirical studies, but the appropriate value depends on the variability of the climate. Lower values are used with more variable climate (corresponding to a more rapidly varying weighted mean), according to ASHRAE 55 Informative Appendix J, although this is not formally part of the standard. As Kuwait has a consistent summer climate with little day to day variation, a higher value of α would be more appropriate.
Within Kuwait, the above equation can be used to calculate the variation in prevail-ing mean outdoor air temperature. This is important as it would provide information on whether the ASHRAE standard is applicable for these weather conditions. Figure 2 (left) shows the daily average maximum and minimum temperatures by month in Kuwait City, Kuwait. The monthly mean outdoor air temperatures range from 14 °C in January to 38.7 °C in July. Therefore, any adaptive model used should have a prevailing mean tempera-ture that covers this range. In case of the ASHRAE adaptive model, the upper limit for the prevailing outdoor temperature limit is 33.5 °C. However, in Kuwait, from June to Sep-tember the outdoor reference temperature is above this limit making the ASHRAE stand-ard unsuitable for application in these hot months. Principally, for natural ventilation-based systems where the running mean temperature exceeds 33.5 °C, neither the Fanger PMV model, nor the ASHRAE adaptive model is eligible for application. Advisory Ap-pendix J of the Standard states that “no specific guidance for such conditions is included in this standard”. The adaptive model is used here for the natural ventilation-based sce-narios despite violation of the 33.5 °C limit. This is because there is evidence from field visits in other similar hot climates, which the comfortable indoor temperature may have a much larger acceptable range than what is acceptable according to the Fanger’s model. An example of this is the Indian IMAC model for adaptive comfort, which predicts com-fortable indoor conditions even when Fanger’s PPD% is as high as 75% [46]. For these reasons, and for the lack of a better choice, the adaptive model is used. Therefore, the results of this work must be considered with this limitation in mind. This does indeed highlight a knowledge gap that needs to be addressed for good building design in hot climates, especially considering that our world would be hotter towards the end of this century.
Figure 2. Left: Climatic average outdoor monthly maximum and minimum temperature for Kuwait City, Kuwait; Right: The annual Windrose diagram for Kuwait showing the consistency in wind direction [47].
Figure 2. Left: Climatic average outdoor monthly maximum and minimum temperature for Kuwait City, Kuwait; Right:The annual Windrose diagram for Kuwait showing the consistency in wind direction [47].
4. Methodology
The performance of various systems is measured in terms of thermal comfort andenergy requirements. This is done using hourly building energy simulation with the De-signBuilder and EnergyPlus software, versions 5.4 and 9.1 respectively [48]. The followingscenarios are compared:

Buildings 2021, 11, 100 6 of 18
1. Scenario 1: Baseline, cooling with split unit, fresh air from windows only (typicalcurrent setup).
2. Scenario 2: Wind catcher based natural ventilation only, no cooling.3. Scenario 3: Wind catcher with evaporative cooling.
In the above scenarios, the baseline captures the real-world typical conditions currentlyfound in Kuwaiti classrooms. Scenario 2 replaces the AC with the wind catcher, but as itis not expected to fulfil the thermal comfort requirements in the extreme hot climate ofKuwait, Scenario 3 includes evaporative cooling as well. It should be noted that the scopeof this study is limited to climatically similar locations as Kuwait. Thus, the engineeringdesigns presented in this paper are applicable within this climatic scope, i.e., hot climate,varying humidity at different times of the year, high winds speeds throughout the year,with extreme hot temperatures during the summer season.
4.1. Baseline Modelling
The school studied is representative of schools in Kuwait and located in Ahmadiprovince in the Fahad-Alahmad Area, approximately 2.7 km east of the coast in the southernpart of Kuwait City. The building consists of 24 classrooms, 4 teaching department officesand the principal’s office, with a total area of approximately 2500 m2. Due to confidentiality,the school plans were not available for the research. However, access was provided to asingle classroom, which was used for modelling and simulation. The classroom was 5.5 mwide and 6 m long, and had single-sided ventilation (Figure 3). It was noted during fieldvisits that the windows were partially opened at certain times depending on the teacher’sview of maintaining comfortable and healthy indoor conditions.
Buildings 2021, 11, x 6 of 19
4. Methodology The performance of various systems is measured in terms of thermal comfort and
energy requirements. This is done using hourly building energy simulation with the DesignBuilder and EnergyPlus software, versions 5.4 and 9.1 respectively [48]. The fol-lowing scenarios are compared: 1. Scenario 1: Baseline, cooling with split unit, fresh air from windows only (typical
current setup). 2. Scenario 2: Wind catcher based natural ventilation only, no cooling. 3. Scenario 3: Wind catcher with evaporative cooling.
In the above scenarios, the baseline captures the real-world typical conditions cur-rently found in Kuwaiti classrooms. Scenario 2 replaces the AC with the wind catcher, but as it is not expected to fulfil the thermal comfort requirements in the extreme hot climate of Kuwait, Scenario 3 includes evaporative cooling as well. It should be noted that the scope of this study is limited to climatically similar locations as Kuwait. Thus, the engi-neering designs presented in this paper are applicable within this climatic scope, i.e., hot climate, varying humidity at different times of the year, high winds speeds throughout the year, with extreme hot temperatures during the summer season.
4.1. Baseline Modelling The school studied is representative of schools in Kuwait and located in Ahmadi
province in the Fahad-Alahmad Area, approximately 2.7 km east of the coast in the south-ern part of Kuwait City. The building consists of 24 classrooms, 4 teaching department offices and the principal’s office, with a total area of approximately 2500 m2. Due to con-fidentiality, the school plans were not available for the research. However, access was provided to a single classroom, which was used for modelling and simulation. The class-room was 5.5 m wide and 6 m long, and had single-sided ventilation (Figure 3). It was noted during field visits that the windows were partially opened at certain times depend-ing on the teacher’s view of maintaining comfortable and healthy indoor conditions.
(a)
(b)
Figure 3. The school classroom modelled in this study, viewed from outside (a) and inside (b).
The modelling of a building requires the knowledge of the building characteristics, operational profiles, occupancy profiles, and weather data. The building characteristics, lighting and HVAC information was acquired through a field visit and are provided in Table 1.
Figure 3. The school classroom modelled in this study, viewed from outside (a) and inside (b).
The modelling of a building requires the knowledge of the building characteristics,operational profiles, occupancy profiles, and weather data. The building characteristics,lighting and HVAC information was acquired through a field visit and are provided inTable 1.
Table 1. List of the classroom materials and modelling settings—(source: Department of Maintenance, Ministry of Education,field visit).
Elements Layers (Outside to Inside)
External wall materials Render 20 mm, limestone tile 50 mm, autoclaved aerated concrete (ACC) block 200 mm, plaster 13 mmInternal partition walls Plaster 13 mm, ACC Block 200 mm, plaster 13 mm.
Floor materials Cement 20 mm, Ceramic tiles 25 mmBuilding roof Ceramic tiles 25 mm, bitumen 20 mm, concrete slab 200 mm, plasterboard 13 mm.
Ceiling material Gypsum Board (15 mm thickness) no insulationExternal glazing Single glazed 6 mm

Buildings 2021, 11, 100 7 of 18
The classroom had two single glazed windows on the longer side of 1.5 m heightand 2 m length each with a total area of 3 m2, and one entrance door (see Figure 4). Thewindows had aluminium frames with single 6 mm glazing.
Buildings 2021, 11, x 7 of 19
Table 1. List of the classroom materials and modelling settings—(source: Department of Maintenance, Ministry of Educa-tion, field visit).
Elements Layers (Outside to Inside)
External wall materials Render 20 mm, limestone tile 50 mm, autoclaved aerated concrete (ACC) block 200 mm, plaster 13 mm
Internal partition walls Plaster 13 mm, ACC Block 200 mm, plaster 13 mm. Floor materials Cement 20 mm, Ceramic tiles 25 mm Building roof Ceramic tiles 25 mm, bitumen 20 mm, concrete slab 200 mm, plasterboard 13 mm.
Ceiling material Gypsum Board (15 mm thickness) no insulation External glazing Single glazed 6 mm
The classroom had two single glazed windows on the longer side of 1.5 m height and 2 m length each with a total area of 3 m2, and one entrance door (see Figure 4). The win-dows had aluminium frames with single 6 mm glazing.
(a)
(b)
Figure 4. (a) Three-dimensional axonometric view for the classroom showing the two windows and door openings and (b) external elevation showing the size and position of the windows.
The classroom was typically occupied by 29 students plus the teacher and was fur-nished with wood and aluminium tables and chairs. Due to short and mild winters, no heating is required. For cooling, the classroom had a 5.28 kW AC split unit supplying the cooling effect for the occupants with recirculated air; it did not supply any fresh air. The AC setpoint was 28 °C, the operating schedule was created in the model based on the teacher’s actions for the daily usage as these reflect the actual use. The lighting schedule reflected actual daily usage, aligned with the school opening hours (building occupancy during 7 am to 4 pm). The lighting was on 50% 07–09.00, 100% 09–16.00 and weekdays only in term-time (September–December, January–June). The modelled windows were usually closed in AC operation but opened periodically to 20% of their area as this was observed in field visits. The handheld anemometer GM8910 [49] was used to measure the wind speed at different points in the room (Figure 5, left), and the building structure was inspected based on which an average infiltration rate of 0.9 air changes per hour was cho-sen, suggesting a leaky structure by modern standards.
The baseline model was verified against data collected from field visits. Eight HOBO loggers [50] were placed at different locations in the classroom to collect temperature data at 30-min intervals for the hottest summer period (June–July) (Figure 5, right). Addition-ally, the yearly electricity use data for the facility was collected (1,105,160 kWh/year). It can be assumed that about 60% of this electricity is used for cooling [51,52], which would be 663,096 per year, or 265 kWh/m2/year (2500 m2 facility), which is high in comparison with similar schools reported in literature [53].
Figure 4. (a) Three-dimensional axonometric view for the classroom showing the two windows and door openings and (b)external elevation showing the size and position of the windows.
The classroom was typically occupied by 29 students plus the teacher and was fur-nished with wood and aluminium tables and chairs. Due to short and mild winters, noheating is required. For cooling, the classroom had a 5.28 kW AC split unit supplyingthe cooling effect for the occupants with recirculated air; it did not supply any fresh air.The AC setpoint was 28 ◦C, the operating schedule was created in the model based on theteacher’s actions for the daily usage as these reflect the actual use. The lighting schedulereflected actual daily usage, aligned with the school opening hours (building occupancyduring 7 am to 4 pm). The lighting was on 50% 07–09.00, 100% 09–16.00 and weekdaysonly in term-time (September–December, January–June). The modelled windows wereusually closed in AC operation but opened periodically to 20% of their area as this wasobserved in field visits. The handheld anemometer GM8910 [49] was used to measurethe wind speed at different points in the room (Figure 5, left), and the building structurewas inspected based on which an average infiltration rate of 0.9 air changes per hour waschosen, suggesting a leaky structure by modern standards.
Buildings 2021, 11, x 8 of 19
(a)
(b)
Figure 5. (a) Benetch anemometer for recording indoor classroom air speed and (b) temperature measurement with Hobo loggers.
The simulation was done using Design Builder V5.4 [48]. A modified DesignBuilder weather file for Kuwait International Airport was used with its corresponding latitude and longitude (29° 14 N, 47° 59 E), approximately 18 km north-west of the school. The elevation above sea level was 55 m while the square classroom building was oriented 36 degrees east of north. The dry bulb temperature, wind speed and solar radiation data in the weather file were replaced with real data available from [54,55], for the year 2017 (the year in which data was recorded). Figure 6 depicts the perspective view of the modelled classroom within the whole school, showing the orientation and the sun path.
Figure 6. School building orientation with the sun path timing—classroom shown in white colour (from the DesignBuilder model).
4.2. Scenario 1—Baseline Validation In this baseline scenario, the school classroom is cooled using air conditioning only,
which was simulated for a year. To validate the model, the recorded indoor temperature for 16 days in June is compared with the simulated data (see Figure 7). This timeframe was chosen because (i) it is representative of peak summer conditions and (ii) data was collected for this period. The root mean square error (RMSE) between the two data was
Figure 5. (a) Benetch anemometer for recording indoor classroom air speed and (b) temperaturemeasurement with Hobo loggers.

Buildings 2021, 11, 100 8 of 18
The baseline model was verified against data collected from field visits. Eight HOBOloggers [50] were placed at different locations in the classroom to collect temperature dataat 30-min intervals for the hottest summer period (June–July) (Figure 5, right). Additionally,the yearly electricity use data for the facility was collected (1,105,160 kWh/year). It canbe assumed that about 60% of this electricity is used for cooling [51,52], which would be663,096 per year, or 265 kWh/m2/year (2500 m2 facility), which is high in comparison withsimilar schools reported in literature [53].
The simulation was done using Design Builder V5.4 [48]. A modified DesignBuilderweather file for Kuwait International Airport was used with its corresponding latitudeand longitude (29◦ 14 N, 47◦ 59 E), approximately 18 km north-west of the school. Theelevation above sea level was 55 m while the square classroom building was oriented36 degrees east of north. The dry bulb temperature, wind speed and solar radiation data inthe weather file were replaced with real data available from [54,55], for the year 2017 (theyear in which data was recorded). Figure 6 depicts the perspective view of the modelledclassroom within the whole school, showing the orientation and the sun path.
Buildings 2021, 11, x 8 of 19
(a)
(b)
Figure 5. (a) Benetch anemometer for recording indoor classroom air speed and (b) temperature measurement with Hobo loggers.
The simulation was done using Design Builder V5.4 [48]. A modified DesignBuilder weather file for Kuwait International Airport was used with its corresponding latitude and longitude (29° 14 N, 47° 59 E), approximately 18 km north-west of the school. The elevation above sea level was 55 m while the square classroom building was oriented 36 degrees east of north. The dry bulb temperature, wind speed and solar radiation data in the weather file were replaced with real data available from [54,55], for the year 2017 (the year in which data was recorded). Figure 6 depicts the perspective view of the modelled classroom within the whole school, showing the orientation and the sun path.
Figure 6. School building orientation with the sun path timing—classroom shown in white colour (from the DesignBuilder model).
4.2. Scenario 1—Baseline Validation In this baseline scenario, the school classroom is cooled using air conditioning only,
which was simulated for a year. To validate the model, the recorded indoor temperature for 16 days in June is compared with the simulated data (see Figure 7). This timeframe was chosen because (i) it is representative of peak summer conditions and (ii) data was collected for this period. The root mean square error (RMSE) between the two data was
Figure 6. School building orientation with the sun path timing—classroom shown in white colour(from the DesignBuilder model).
4.2. Scenario 1—Baseline Validation
In this baseline scenario, the school classroom is cooled using air conditioning only,which was simulated for a year. To validate the model, the recorded indoor temperaturefor 16 days in June is compared with the simulated data (see Figure 7). This timeframewas chosen because (i) it is representative of peak summer conditions and (ii) data wascollected for this period. The root mean square error (RMSE) between the two data was1.1 and the correlation coefficient (R) was 0.75. Energy data could not be collected, but thesimulated annual energy demand of 117 kW/m2/year was comparable to what has beenreported for similar schools in Kuwait (69–149 kW/m2/year as reported by [53]).
Figure 7 shows that without exception, the classroom air temperature goes beyond28 ◦C every afternoon. Therefore, it is expected that the indoor thermal comfort willbe poor in this baseline scenario, which represents the current situation in practice. Toaddress this issue in an energy efficient manner, the following scenarios introduce naturalventilation-based designs to solve this problem.
Buildings 2021, 11, 100 9 of 18
Buildings 2021, 11, x 9 of 19
1.1 and the correlation coefficient (R) was 0.75. Energy data could not be collected, but the simulated annual energy demand of 117 kW/m2/year was comparable to what has been reported for similar schools in Kuwait (69–149 kW/m2/year as reported by [53]).
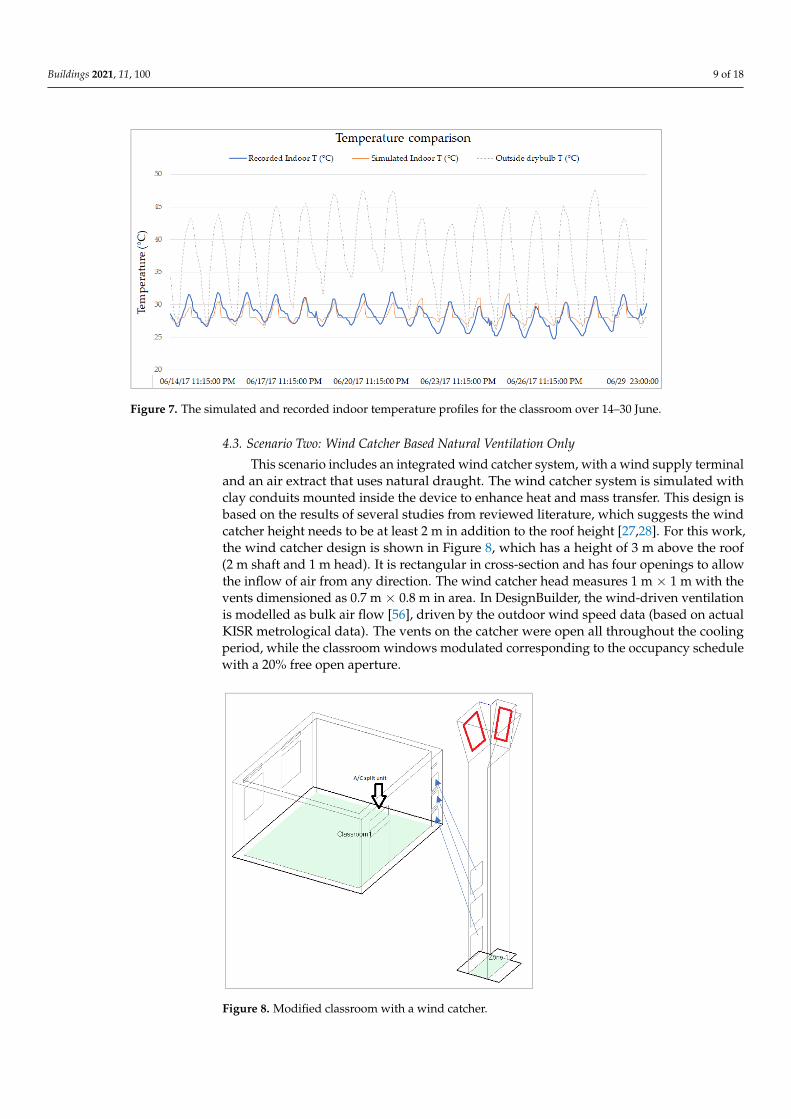
Figure 7. The simulated and recorded indoor temperature profiles for the classroom over 14–30 June.
Figure 7 shows that without exception, the classroom air temperature goes beyond 28 °C every afternoon. Therefore, it is expected that the indoor thermal comfort will be poor in this baseline scenario, which represents the current situation in practice. To ad-dress this issue in an energy efficient manner, the following scenarios introduce natural ventilation-based designs to solve this problem.
4.3. Scenario Two: Wind Catcher Based Natural Ventilation Only This scenario includes an integrated wind catcher system, with a wind supply termi-
nal and an air extract that uses natural draught. The wind catcher system is simulated with clay conduits mounted inside the device to enhance heat and mass transfer. This design is based on the results of several studies from reviewed literature, which suggests the wind catcher height needs to be at least 2 m in addition to the roof height [27,28]. For this work, the wind catcher design is shown in Figure 8, which has a height of 3 m above the roof (2 m shaft and 1 m head). It is rectangular in cross-section and has four openings to allow the inflow of air from any direction. The wind catcher head measures 1 m × 1 m with the vents dimensioned as 0.7 m × 0.8 m in area. In DesignBuilder, the wind-driven ventilation is modelled as bulk air flow [56], driven by the outdoor wind speed data (based on actual KISR metrological data). The vents on the catcher were open all throughout the cooling period, while the classroom windows modulated corresponding to the occupancy schedule with a 20% free open aperture.
Figure 7. The simulated and recorded indoor temperature profiles for the classroom over 14–30 June.
4.3. Scenario Two: Wind Catcher Based Natural Ventilation Only
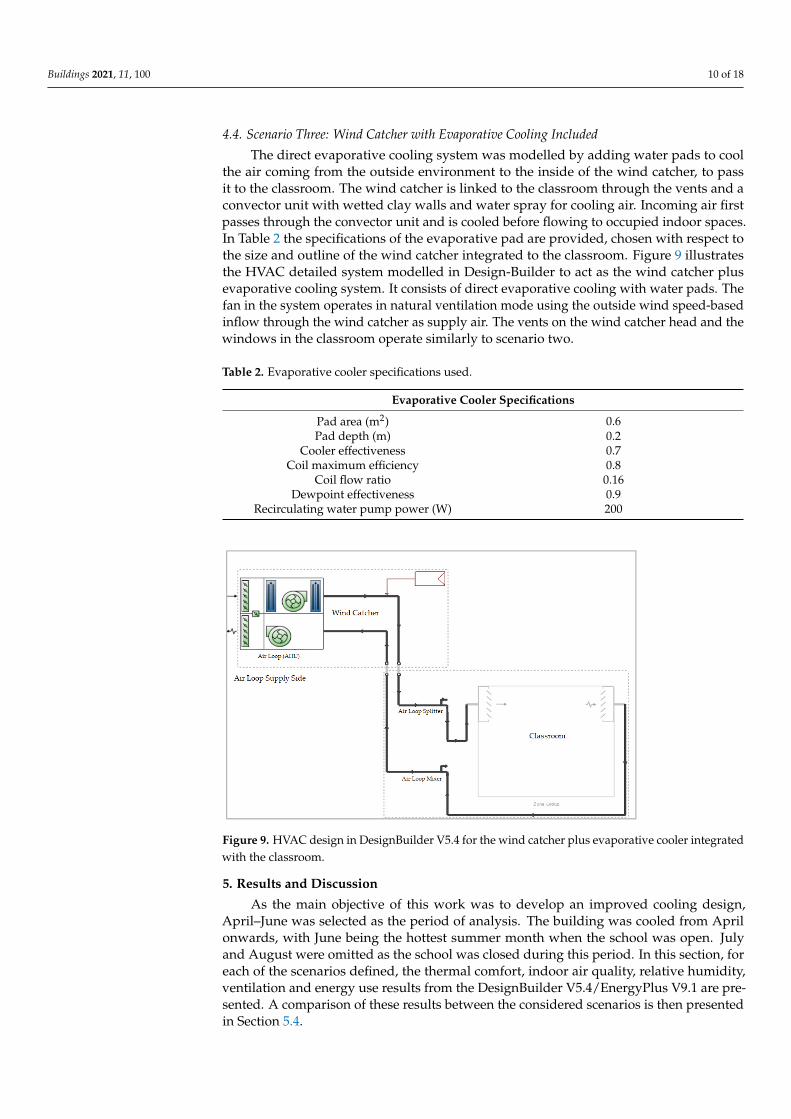
This scenario includes an integrated wind catcher system, with a wind supply terminaland an air extract that uses natural draught. The wind catcher system is simulated withclay conduits mounted inside the device to enhance heat and mass transfer. This design isbased on the results of several studies from reviewed literature, which suggests the windcatcher height needs to be at least 2 m in addition to the roof height [27,28]. For this work,the wind catcher design is shown in Figure 8, which has a height of 3 m above the roof(2 m shaft and 1 m head). It is rectangular in cross-section and has four openings to allowthe inflow of air from any direction. The wind catcher head measures 1 m × 1 m with thevents dimensioned as 0.7 m × 0.8 m in area. In DesignBuilder, the wind-driven ventilationis modelled as bulk air flow [56], driven by the outdoor wind speed data (based on actualKISR metrological data). The vents on the catcher were open all throughout the coolingperiod, while the classroom windows modulated corresponding to the occupancy schedulewith a 20% free open aperture.Buildings 2021, 11, x 10 of 19
Figure 8. Modified classroom with a wind catcher.
4.4. Scenario Three: Wind Catcher with Evaporative Cooling Included The direct evaporative cooling system was modelled by adding water pads to cool
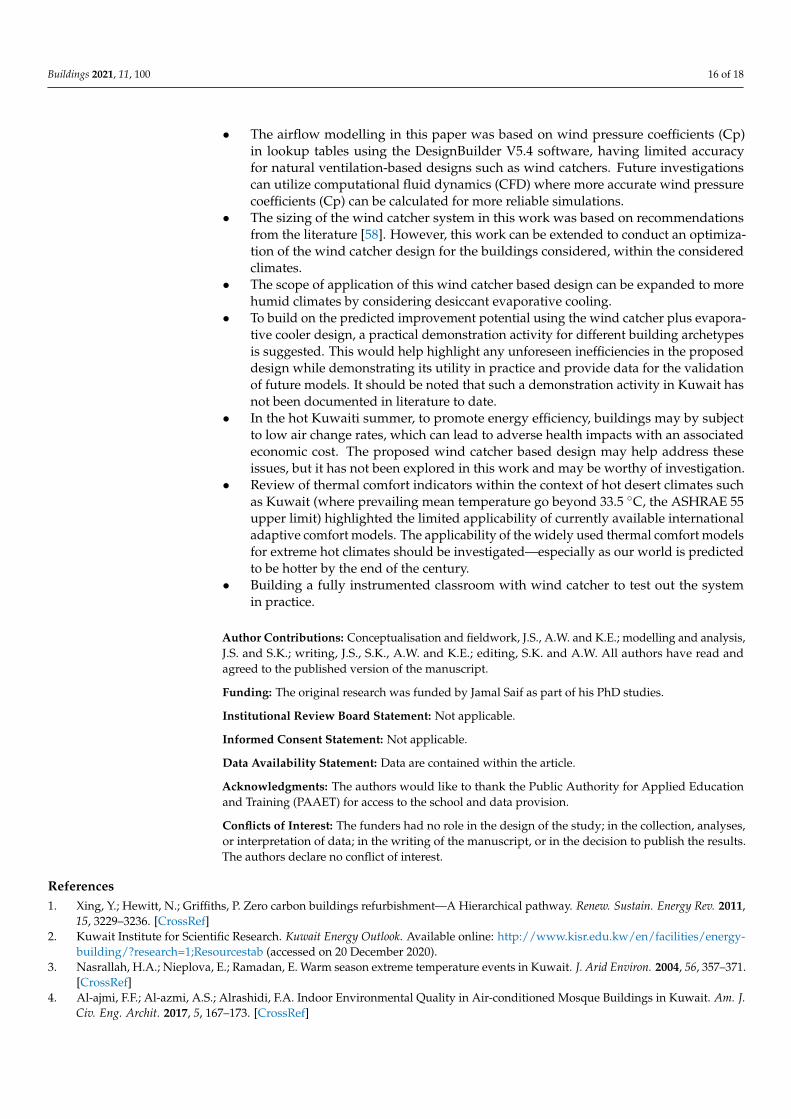
the air coming from the outside environment to the inside of the wind catcher, to pass it to the classroom. The wind catcher is linked to the classroom through the vents and a convector unit with wetted clay walls and water spray for cooling air. Incoming air first passes through the convector unit and is cooled before flowing to occupied indoor spaces. In Table 2 the specifications of the evaporative pad are provided, chosen with respect to the size and outline of the wind catcher integrated to the classroom. Figure 9 illustrates the HVAC detailed system modelled in Design-Builder to act as the wind catcher plus evaporative cooling system. It consists of direct evaporative cooling with water pads. The fan in the system operates in natural ventilation mode using the outside wind speed-based inflow through the wind catcher as supply air. The vents on the wind catcher head and the windows in the classroom operate similarly to scenario two.
Table 2. Evaporative cooler specifications used.
Evaporative Cooler Specifications Pad area (m2) 0.6 Pad depth (m) 0.2
Cooler effectiveness 0.7 Coil maximum efficiency 0.8
Coil flow ratio 0.16 Dewpoint effectiveness 0.9
Recirculating water pump power (W) 200
Figure 8. Modified classroom with a wind catcher.
Buildings 2021, 11, 100 10 of 18
4.4. Scenario Three: Wind Catcher with Evaporative Cooling Included
The direct evaporative cooling system was modelled by adding water pads to coolthe air coming from the outside environment to the inside of the wind catcher, to passit to the classroom. The wind catcher is linked to the classroom through the vents and aconvector unit with wetted clay walls and water spray for cooling air. Incoming air firstpasses through the convector unit and is cooled before flowing to occupied indoor spaces.In Table 2 the specifications of the evaporative pad are provided, chosen with respect tothe size and outline of the wind catcher integrated to the classroom. Figure 9 illustratesthe HVAC detailed system modelled in Design-Builder to act as the wind catcher plusevaporative cooling system. It consists of direct evaporative cooling with water pads. Thefan in the system operates in natural ventilation mode using the outside wind speed-basedinflow through the wind catcher as supply air. The vents on the wind catcher head and thewindows in the classroom operate similarly to scenario two.
Table 2. Evaporative cooler specifications used.
Evaporative Cooler Specifications
Pad area (m2) 0.6Pad depth (m) 0.2
Cooler effectiveness 0.7Coil maximum efficiency 0.8
Coil flow ratio 0.16Dewpoint effectiveness 0.9
Recirculating water pump power (W) 200Buildings 2021, 11, x 11 of 19
Figure 9. HVAC design in DesignBuilder V5.4 for the wind catcher plus evaporative cooler inte-grated with the classroom.
5. Results and Discussion As the main objective of this work was to develop an improved cooling design,
April–June was selected as the period of analysis. The building was cooled from April onwards, with June being the hottest summer month when the school was open. July and August were omitted as the school was closed during this period. In this section, for each of the scenarios defined, the thermal comfort, indoor air quality, relative humidity, venti-lation and energy use results from the DesignBuilder V5.4/EnergyPlus V9.1 are presented. A comparison of these results between the considered scenarios is then presented in Sec-tion 5.4.
5.1. Scenario 1: Baseilne—AC Based Cooling Only As the baseline scenario is an AC cooled operation, without any kind of natural ven-
tilation intervention, Fanger’s PMV is a suitable thermal comfort indicator. The PMV is calculated within the software, which has internal values of radiant temperature, etc., to calculate PMV. For example, the clo summer value was 0.5, which is representative of light summer clothing. Figure 10 (left) shows the comfort curve over the three months. The ASHRAE 80% comfort criteria correspond to a PMV of ±0.85. While most points lie within this range, significant hours lie in the overheating region (PMV > 0.85). While there are some overcooled hours, these are relatively few. The PMV box plot in Figure 10 (right) shows that the overcooled hours (PMV < −0.85) were outliers within the dataset. A tem-poral analysis of the data revealed that these overcooling hours occurred in either early morning or late afternoon. This is because (i) the outdoor conditions were cooler during these times and (ii) the AC was kept ON 24/7 from April onwards, which was the actual practice at the school.
Specifically, 204 h had PPD% greater than 20%, which corresponded to 26% of the total occupied hours. The lower and upper quartiles of the PMV were 0.17 and 0.63 re-spectively, from which one might say that most of the time the occupants were comforta-ble. For air quality, only 11% of the occupied hours (88 h) had a CO2 concentration below the 1100 ppm threshold (ASHRAE stipulated that CO2 concentration should be at most 700 ppm above the outdoor). Here, the CO2 concentration was based on the carbon dioxide generation rate per person as calculated by the software using the number of occupants, their schedule and activity had a fixed CO2 generation rate of 3.82 × 10⁻⁸ m3/s-W (obtained from ASHRAE standard 62.1-2007 value at 0.0084 cfm/met/person over the general adult population).
Figure 9. HVAC design in DesignBuilder V5.4 for the wind catcher plus evaporative cooler integratedwith the classroom.
5. Results and Discussion
As the main objective of this work was to develop an improved cooling design,April–June was selected as the period of analysis. The building was cooled from Aprilonwards, with June being the hottest summer month when the school was open. Julyand August were omitted as the school was closed during this period. In this section, foreach of the scenarios defined, the thermal comfort, indoor air quality, relative humidity,ventilation and energy use results from the DesignBuilder V5.4/EnergyPlus V9.1 are pre-sented. A comparison of these results between the considered scenarios is then presentedin Section 5.4.

Buildings 2021, 11, 100 11 of 18
5.1. Scenario 1: Baseilne—AC Based Cooling Only
As the baseline scenario is an AC cooled operation, without any kind of naturalventilation intervention, Fanger’s PMV is a suitable thermal comfort indicator. The PMVis calculated within the software, which has internal values of radiant temperature, etc.,to calculate PMV. For example, the clo summer value was 0.5, which is representative oflight summer clothing. Figure 10 (left) shows the comfort curve over the three months.The ASHRAE 80% comfort criteria correspond to a PMV of ±0.85. While most pointslie within this range, significant hours lie in the overheating region (PMV > 0.85). Whilethere are some overcooled hours, these are relatively few. The PMV box plot in Figure 10(right) shows that the overcooled hours (PMV < −0.85) were outliers within the dataset. Atemporal analysis of the data revealed that these overcooling hours occurred in either earlymorning or late afternoon. This is because (i) the outdoor conditions were cooler duringthese times and (ii) the AC was kept ON 24/7 from April onwards, which was the actualpractice at the school.
Buildings 2021, 11, x 12 of 19
The median relative humidity (RH) within the classroom within the occupied period was 60%, with the interquartile RH% ranging from 53 to 71%. The median air change rate during occupied hours was 0.56, with the interquartile values ranging from 0.41 to 0.65. Finally, the energy use for these three summer months was 38 kWh/m2.
In summary, the baseline scenario had somewhat comfortable conditions with about a quarter of the time exceeding the ASHRAE 80% comfort criteria but had unacceptable CO2 concentration levels.
(a)
(b)
Figure 10. (a) Predicted mean vote (PMV) vs. predicted percentage of dissatisfied occupants (PPD%) comfort curve and (b) box plot for the PMV data.
5.2. Scenario Two: Wind Catcher Based Natural Ventilation Only As the building is naturally ventilated in this case, the thermal comfort was analysed
using the ASHRAE adaptive thermal comfort model (with the caveat of the 33.5 °C limit as already discussed).
The air change rate was higher than the baseline as expected from this natural venti-lation-based design, with a median 2.35 ach for the occupied hours. The interquartile range was between 1.29 and 3.29 ach, indicating a much greater amount of fresh air flow into the classroom. This translated into improved air quality, but the median CO2 concen-tration was 1190 ppm, still above the 1100 ppm stipulated threshold for good indoor air quality. The energy use was only a fraction of the baseline, at 7.6 kWh/m2, only 20% of the baseline. On the downside, the indoor conditions were not thermally comfortable, as 44% occupied hours were uncomfortable according to the ASHRAE 55 adaptive thermal com-fort metric.
In summary, with the wind catcher operating in only the ventilation mode, thermally comfortable conditions could not be reached in the hot desert summer, although large energy reductions and IAQ (indoor air quality) improvements were achieved.
5.3. Scenario Three: Wind Catcher with Evaporative Cooling Included In this scenario, an evaporative cooler was added to the wind catcher to improve
thermal comfort performance. As this approach also employs natural ventilation, thermal comfort was assessed through the ASHRAE 55 adaptive thermal comfort model. The evaporative cooler certainly made an improvement in this regard, as no hours were pre-dicted to be uncomfortable. The energy use was 18.1 kWh/m2, which was less than half (47.6%) of the baseline energy consumption. The air change rate was also better than the baseline, averaging at 0.87 ach during occupied hours. Compared to the baseline, this also
Figure 10. (a) Predicted mean vote (PMV) vs. predicted percentage of dissatisfied occupants (PPD%) comfort curve and (b)box plot for the PMV data.
Specifically, 204 h had PPD% greater than 20%, which corresponded to 26% of the totaloccupied hours. The lower and upper quartiles of the PMV were 0.17 and 0.63 respectively,from which one might say that most of the time the occupants were comfortable. For airquality, only 11% of the occupied hours (88 h) had a CO2 concentration below the 1100 ppmthreshold (ASHRAE stipulated that CO2 concentration should be at most 700 ppm abovethe outdoor). Here, the CO2 concentration was based on the carbon dioxide generation rateper person as calculated by the software using the number of occupants, their schedule andactivity had a fixed CO2 generation rate of 3.82 × 10⁻⁸ m3/s-W (obtained from ASHRAEstandard 62.1-2007 value at 0.0084 cfm/met/person over the general adult population).
The median relative humidity (RH) within the classroom within the occupied periodwas 60%, with the interquartile RH% ranging from 53 to 71%. The median air change rateduring occupied hours was 0.56, with the interquartile values ranging from 0.41 to 0.65.Finally, the energy use for these three summer months was 38 kWh/m2.
In summary, the baseline scenario had somewhat comfortable conditions with about aquarter of the time exceeding the ASHRAE 80% comfort criteria but had unacceptable CO2concentration levels.

Buildings 2021, 11, 100 12 of 18
5.2. Scenario Two: Wind Catcher Based Natural Ventilation Only
As the building is naturally ventilated in this case, the thermal comfort was analysedusing the ASHRAE adaptive thermal comfort model (with the caveat of the 33.5 ◦C limit asalready discussed).
The air change rate was higher than the baseline as expected from this naturalventilation-based design, with a median 2.35 ach for the occupied hours. The interquartilerange was between 1.29 and 3.29 ach, indicating a much greater amount of fresh air flowinto the classroom. This translated into improved air quality, but the median CO2 concen-tration was 1190 ppm, still above the 1100 ppm stipulated threshold for good indoor airquality. The energy use was only a fraction of the baseline, at 7.6 kWh/m2, only 20% ofthe baseline. On the downside, the indoor conditions were not thermally comfortable, as44% occupied hours were uncomfortable according to the ASHRAE 55 adaptive thermalcomfort metric.
In summary, with the wind catcher operating in only the ventilation mode, thermallycomfortable conditions could not be reached in the hot desert summer, although largeenergy reductions and IAQ (indoor air quality) improvements were achieved.
5.3. Scenario Three: Wind Catcher with Evaporative Cooling Included
In this scenario, an evaporative cooler was added to the wind catcher to improvethermal comfort performance. As this approach also employs natural ventilation, thermalcomfort was assessed through the ASHRAE 55 adaptive thermal comfort model. The evap-orative cooler certainly made an improvement in this regard, as no hours were predictedto be uncomfortable. The energy use was 18.1 kWh/m2, which was less than half (47.6%)of the baseline energy consumption. The air change rate was also better than the baseline,averaging at 0.87 ach during occupied hours. Compared to the baseline, this also improvedthe indoor air quality, as the median CO2 concentration was simulated to be 2836 ppm,which was unfortunately still much above the 1100 ppm threshold. These improvementsupon the baseline came at the cost of using 0.12 m3 of water in the evaporative cooler,leading to higher humidity levels. The median relative humidity in the classroom wassimulated to be 74%, with the interquartile values ranging from 52% to 92%. Despite thishigher humidity, the conditions were predicted to be comfortable for all occupied hours.
In summary, this scenario resulted in a drastic improvement in energy use and thermalcomfort, at the cost of higher relative humidity, but could not sufficiently improve the CO2concentration levels. Now, the three scenarios were compared as follows.
5.4. Scenarios Comparison
Figure 11 depicts the indoor air temperature for two weeks in June (the hottest monthof analysis), from which the cooling effect of scenario 3 was clearly evident. In additionto lower daytime temperature peak, the operation of the wind catcher and evaporativecooling purges heat from the building at nighttime, as evident from the troughs in thetemperature profile.
A comparison of the temperature distributions over the analysis period (April–June) ispresented in Figure 12. The effect of evaporative cooling on the windcatcher for improvedindoor air temperature is evident from the figure, as the temperature distribution forScenario 3 is markedly more to the left than that of Scenario 2. The mean values are 28.1 ◦C,30.7 ◦C and 28.4 ◦C for the Scenarios 1, 2 and 3 respectively. The utilization of evaporativecooling together with the wind catcher not only brings the average indoor temperaturemuch closer to the baseline, but is also a natural ventilation scenario, thus allowing thebuilding occupants to adapt to their surroundings, and to achieve thermal comfort at higherindoor air temperatures as compared to mechanical air-conditioning only. The result is acompletely thermally comfortable environment, as already discussed in Sections 5.1–5.3.

Buildings 2021, 11, 100 13 of 18
Buildings 2021, 11, x 13 of 19
improved the indoor air quality, as the median CO2 concentration was simulated to be 2836 ppm, which was unfortunately still much above the 1100 ppm threshold. These im-provements upon the baseline came at the cost of using 0.12 m3 of water in the evaporative cooler, leading to higher humidity levels. The median relative humidity in the classroom was simulated to be 74%, with the interquartile values ranging from 52% to 92%. Despite this higher humidity, the conditions were predicted to be comfortable for all occupied hours.
In summary, this scenario resulted in a drastic improvement in energy use and ther-mal comfort, at the cost of higher relative humidity, but could not sufficiently improve the CO2 concentration levels. Now, the three scenarios were compared as follows.
5.4. Scenarios Comparison Figure 11 depicts the indoor air temperature for two weeks in June (the hottest month
of analysis), from which the cooling effect of scenario 3 was clearly evident. In addition to lower daytime temperature peak, the operation of the wind catcher and evaporative cool-ing purges heat from the building at nighttime, as evident from the troughs in the tem-perature profile.
Figure 11. Indoor temperature comparison across the three scenarios over two weeks in June.
A comparison of the temperature distributions over the analysis period (April–June) is presented in Figure 12. The effect of evaporative cooling on the windcatcher for im-proved indoor air temperature is evident from the figure, as the temperature distribution for Scenario 3 is markedly more to the left than that of Scenario 2. The mean values are 28.1 °C, 30.7 °C and 28.4 °C for the Scenarios 1, 2 and 3 respectively. The utilization of evaporative cooling together with the wind catcher not only brings the average indoor temperature much closer to the baseline, but is also a natural ventilation scenario, thus allowing the building occupants to adapt to their surroundings, and to achieve thermal comfort at higher indoor air temperatures as compared to mechanical air-conditioning only. The result is a completely thermally comfortable environment, as already discussed in Sections 5.1, 5.2 and 5.3.
Figure 11. Indoor temperature comparison across the three scenarios over two weeks in June.Buildings 2021, 11, x 14 of 19
Figure 12. Histograms of indoor air temperature for the three scenarios.
As mentioned previously, this improvement in thermal comfort comes at the cost of increased humidity as presented in Figure 13. The box plots clearly show this, as both the median and the spread of relative humidity results were the highest in Scenario 3. This was expected as evaporative cooling directly adds moisture to the classroom environ-ment, thus increasing humidity. However, this did not affect the comfort as the ASHRAE adaptive comfort indicator results in a prediction of 100% comfortable occupied hours. Here, the limited applicability of this adaptive comfort metric had already been discussed, and that this comfort analysis should be understood with this limitation in mind. Figure 14 is a similar plot for carbon dioxide concentration; while the wind catcher achieved the lowest values here, thermal comfort was very poor.
Figure 12. Histograms of indoor air temperature for the three scenarios.
As mentioned previously, this improvement in thermal comfort comes at the cost ofincreased humidity as presented in Figure 13. The box plots clearly show this, as both themedian and the spread of relative humidity results were the highest in Scenario 3. This wasexpected as evaporative cooling directly adds moisture to the classroom environment, thusincreasing humidity. However, this did not affect the comfort as the ASHRAE adaptivecomfort indicator results in a prediction of 100% comfortable occupied hours. Here, thelimited applicability of this adaptive comfort metric had already been discussed, and thatthis comfort analysis should be understood with this limitation in mind. Figure 14 is asimilar plot for carbon dioxide concentration; while the wind catcher achieved the lowestvalues here, thermal comfort was very poor.

Buildings 2021, 11, 100 14 of 18
Buildings 2021, 11, x 14 of 19
Figure 12. Histograms of indoor air temperature for the three scenarios.
As mentioned previously, this improvement in thermal comfort comes at the cost of increased humidity as presented in Figure 13. The box plots clearly show this, as both the median and the spread of relative humidity results were the highest in Scenario 3. This was expected as evaporative cooling directly adds moisture to the classroom environ-ment, thus increasing humidity. However, this did not affect the comfort as the ASHRAE adaptive comfort indicator results in a prediction of 100% comfortable occupied hours. Here, the limited applicability of this adaptive comfort metric had already been discussed, and that this comfort analysis should be understood with this limitation in mind. Figure 14 is a similar plot for carbon dioxide concentration; while the wind catcher achieved the lowest values here, thermal comfort was very poor.
Figure 13. Relative humidity comparison across the three scenarios.
Buildings 2021, 11, x 15 of 19
Figure 13. Relative humidity comparison across the three scenarios.
It is interesting that none of the scenarios could deliver satisfactory indoor air quality. Even in the complete natural ventilation case, the wind catcher without evaporative cool-ing that delivers unsatisfactory thermal comfort, also had a median CO2 concentration above the 1100 ppm ASHRAE stipulated threshold. Clearly, the issue of indoor air quality is a challenge, which is in agreement with similar studies on schools in literature [57].
Figure 14. CO2 concentration comparison across the three scenarios.
The summary table to conclude this analysis is presented in Table 3. The baseline operates at the highest energy use amongst the three scenarios, but also suffers from poor air quality and mediocre thermal comfort. The wind catcher only design uses a fifth of the AC’s energy, somewhat improves the air quality but leads to a prediction of unacceptable thermal comfort result. The addition of the evaporative cooler to the wind catcher was simulated to deliver 100% comfortable hours, at 47.6% energy use of the baseline, but at higher humidity levels in the classroom and a small water use amount.
Table 3. Results summary table comparing the different scenarios for the timeframe April to June.
Baseline
(AC Cooling) Scenario 2
(Wind Catcher)
Scenario 3 (Wind Catcher with
Evaporative Cooling) Energy use (kWh/m2) 38 7.6 18.1 Air quality (% occupied hours < 1100 ppm CO2) 88 (11.1%) 240 (30.3%) 191 (24.1%) Discomfort hours (> 20% PPD/adaptive comfort = 0) 204 (25.8%) 347 (43.8%) 0 (0%) Median relative humidity(%) 60 41 74 Water Usage (m3) N/A N/A 0.12
Costs were not considered here. Clearly, installing a wind catcher involves cost; add-ing evaporative cooling adds further capital and maintenance costs; the cost of water is small. While it would be possible to retrofit to existing schools, it would be easier and cheaper to include in new build or major refurbishment projects. Costs will be offset by much reduced energy cost, and replacement and maintenance of mechanical cooling sys-tems. A much greater benefit however will come from the improvement in comfort and
Figure 14. CO2 concentration comparison across the three scenarios.
It is interesting that none of the scenarios could deliver satisfactory indoor air quality.Even in the complete natural ventilation case, the wind catcher without evaporative coolingthat delivers unsatisfactory thermal comfort, also had a median CO2 concentration abovethe 1100 ppm ASHRAE stipulated threshold. Clearly, the issue of indoor air quality is achallenge, which is in agreement with similar studies on schools in literature [57].
The summary table to conclude this analysis is presented in Table 3. The baselineoperates at the highest energy use amongst the three scenarios, but also suffers from poorair quality and mediocre thermal comfort. The wind catcher only design uses a fifth of theAC’s energy, somewhat improves the air quality but leads to a prediction of unacceptablethermal comfort result. The addition of the evaporative cooler to the wind catcher was

Buildings 2021, 11, 100 15 of 18
simulated to deliver 100% comfortable hours, at 47.6% energy use of the baseline, but athigher humidity levels in the classroom and a small water use amount.
Table 3. Results summary table comparing the different scenarios for the timeframe April to June.
Baseline(AC Cooling)
Scenario 2(Wind Catcher)
Scenario 3(Wind Catcher with
Evaporative Cooling)
Energy use (kWh/m2) 38 7.6 18.1Air quality (% occupied hours < 1100 ppm CO2) 88 (11.1%) 240 (30.3%) 191 (24.1%)Discomfort hours (>20% PPD/adaptive comfort = 0) 204 (25.8%) 347 (43.8%) 0 (0%)Median relative humidity(%) 60 41 74Water Usage (m3) N/A N/A 0.12
Costs were not considered here. Clearly, installing a wind catcher involves cost;adding evaporative cooling adds further capital and maintenance costs; the cost of wateris small. While it would be possible to retrofit to existing schools, it would be easier andcheaper to include in new build or major refurbishment projects. Costs will be offsetby much reduced energy cost, and replacement and maintenance of mechanical coolingsystems. A much greater benefit however will come from the improvement in comfort andIAQ and—according to the literature—better educational outcomes. These are very hard toquantify, but likely to far outweigh system costs. A detailed cost analysis, preferably on areal building, would be useful exercise.
6. Conclusions
In this paper, a natural ventilation design, the wind catcher was assessed that couldprovide thermal comfort in educational buildings in Kuwait, whilst reducing the coolingenergy demand and indoor CO2 levels. Compared to air-conditioning only, the windcatcher with evaporative cooling was found to be the best option that resulted in a reductionof energy use by 52.4%, and improved thermal comfort with the percentage comfortablehours increasing from 74% to 100%. While the indoor CO2 levels improved as well, inall three scenarios the CO2 concentration was above the ASHRAE stipulated limit for alarge portion of the occupied hours. In summary, this study established that within theclimatic scope of this work, the recommended strategy of the wind catcher with evaporativecooling is a highly energy efficient option that can successfully provide thermal comfort,but slightly improved indoor air quality. The key findings from this work were as follows:
• Using only a split room cooling system with single sided window ventilation toprovide thermal comfort in Kuwaiti classrooms led to high energy use, considerablediscomfort and poor indoor air quality.
• In this case, the wind catcher supplemented by the evaporative cooler was the bestdesign solution, resulting in highly comfortable conditions in the summer (zero un-comfortable hours) accompanied by a drastic reduction in energy use (52.4% reduction)but a slight improvement in indoor air quality, at the cost of increased humidity levels.
While the energy savings and improved thermal comfort is promising, the challengeof improving indoor air quality in schools still remains—at least with this design. Theseresults are subject to the limitations in the modelling work and the unavailability of asuitable thermal comfort metric for naturally ventilated buildings in such hot climaticconditions. For the lack of a better choice and because developing a suitable adaptivethermal model was beyond the scope of this paper, the ASHRAE adaptive model was usedhere, despite the fact that the outdoor running mean prevailing temperature exceeded the33.5 ◦C limit for significant parts of the summer. Additionally, costs were not analysed,although they were briefly discussed. In view of these limitations and the previouslypresented conclusions, several avenues for future work are suggested as follows,
Buildings 2021, 11, 100 16 of 18
• The airflow modelling in this paper was based on wind pressure coefficients (Cp)in lookup tables using the DesignBuilder V5.4 software, having limited accuracyfor natural ventilation-based designs such as wind catchers. Future investigationscan utilize computational fluid dynamics (CFD) where more accurate wind pressurecoefficients (Cp) can be calculated for more reliable simulations.
• The sizing of the wind catcher system in this work was based on recommendationsfrom the literature [58]. However, this work can be extended to conduct an optimiza-tion of the wind catcher design for the buildings considered, within the consideredclimates.
• The scope of application of this wind catcher based design can be expanded to morehumid climates by considering desiccant evaporative cooling.
• To build on the predicted improvement potential using the wind catcher plus evapora-tive cooler design, a practical demonstration activity for different building archetypesis suggested. This would help highlight any unforeseen inefficiencies in the proposeddesign while demonstrating its utility in practice and provide data for the validationof future models. It should be noted that such a demonstration activity in Kuwait hasnot been documented in literature to date.
• In the hot Kuwaiti summer, to promote energy efficiency, buildings may by subjectto low air change rates, which can lead to adverse health impacts with an associatedeconomic cost. The proposed wind catcher based design may help address theseissues, but it has not been explored in this work and may be worthy of investigation.
• Review of thermal comfort indicators within the context of hot desert climates suchas Kuwait (where prevailing mean temperature go beyond 33.5 ◦C, the ASHRAE 55upper limit) highlighted the limited applicability of currently available internationaladaptive comfort models. The applicability of the widely used thermal comfort modelsfor extreme hot climates should be investigated—especially as our world is predictedto be hotter by the end of the century.
• Building a fully instrumented classroom with wind catcher to test out the systemin practice.
Author Contributions: Conceptualisation and fieldwork, J.S., A.W. and K.E.; modelling and analysis,J.S. and S.K.; writing, J.S., S.K., A.W. and K.E.; editing, S.K. and A.W. All authors have read andagreed to the published version of the manuscript.
Funding: The original research was funded by Jamal Saif as part of his PhD studies.
Institutional Review Board Statement: Not applicable.
Informed Consent Statement: Not applicable.
Data Availability Statement: Data are contained within the article.
Acknowledgments: The authors would like to thank the Public Authority for Applied Educationand Training (PAAET) for access to the school and data provision.
Conflicts of Interest: The funders had no role in the design of the study; in the collection, analyses,or interpretation of data; in the writing of the manuscript, or in the decision to publish the results.The authors declare no conflict of interest.
References1. Xing, Y.; Hewitt, N.; Griffiths, P. Zero carbon buildings refurbishment—A Hierarchical pathway. Renew. Sustain. Energy Rev. 2011,
15, 3229–3236. [CrossRef]2. Kuwait Institute for Scientific Research. Kuwait Energy Outlook. Available online: http://www.kisr.edu.kw/en/facilities/energy-
building/?research=1;Resourcestab (accessed on 20 December 2020).3. Nasrallah, H.A.; Nieplova, E.; Ramadan, E. Warm season extreme temperature events in Kuwait. J. Arid Environ. 2004, 56, 357–371.
[CrossRef]4. Al-ajmi, F.F.; Al-azmi, A.S.; Alrashidi, F.A. Indoor Environmental Quality in Air-conditioned Mosque Buildings in Kuwait. Am. J.
Civ. Eng. Archit. 2017, 5, 167–173. [CrossRef]

Buildings 2021, 11, 100 17 of 18
5. Bank, T.W. Electric Power Consumption (kWh Per Capita)—Kuwait. Available online: https://data.worldbank.org/indicator/EG.USE.ELEC.KH.PC?locations=KW (accessed on 20 January 2021).
6. Krarti, M.; Hajiah, A. Analysis of impact of daylight time savings on energy use of buildings in Kuwait. Energy Policy 2011, 39,2319–2329. [CrossRef]
7. Alhajeri, H.M.; Almutairi, A.; Alenezi, A.; Alshammari, F. Energy Demand in the State of Kuwait during the Covid-19 Pandemic:Technical, Economic, and Environmental Perspectives. Energies 2020, 13, 4370. [CrossRef]
8. Cerezo, C.; Sokol, J.; Alkhaled, S.; Reinhart, C.; Al-mumin, A.; Hajiah, A. Comparison of four building archetype characterizationmethods in urban building energy modeling (UBEM): A residential case study in Kuwait City. Energy Build. 2017, 154, 321–334.[CrossRef]
9. CEIC Kuwait Education Statistics. Available online: https://www.ceicdata.com/en/kuwait/education-statistics (accessed on 1February 2021).
10. Clements, C.J.; Awbi, H.B.; Bakó-Biró, Z.; Kochhar, N.; Williams, M. Ventilation rates in schools. Build. Environ. 2008, 43, 362–367.[CrossRef]
11. Myhrvold, A. Pupils health and performance due to renovation of schools. In Proceedings of the Healthy Buildings/IAQ,Washington, DC, USA, 27 September 1997.
12. Wargocki, P.; Wyon, D.P. Research report on effects of HVAC on student performance. ASHRAE J. 2006, 48, 22.13. Wargocki, P.; Wyon, D.P. The effects of moderately raised classroom temperatures and classroom ventilation rate on the
performance of schoolwork by children (RP-1257). HVAC R Res. 2007, 13, 193–220. [CrossRef]14. Wargocki, P.; Wyon, D.P.; Lynge-Jensen, K.; Bornehag, C.G. The effects of electrostatic particle filtration and supply-air filter
condition in classrooms on the performance of schoolwork by children (RP-1257). HVAC R Res. 2008, 14, 327–344. [CrossRef]15. Jindal, A. Thermal comfort study in naturally ventilated school classrooms in composite climate of India. Build. Environ. 2018,
142, 34–46. [CrossRef]16. Al-Rashidi, K.E.; Loveday, D.L.; Al-Mutawa, N.K. Investigating the Applicability of Different Thermal Comfort Models in Kuwait
Classrooms Operated in Hybrid Air-Conditioning Mode. In Proceedings of the Sustainability in Energy and Buildings; Howlett, R.J.,Jain, L.C., Lee, S.H., Eds.; Springer: Berlin/Heidelberg, Germany, 2009; pp. 347–355.
17. Anand, P.; Sekhar, C.; Cheong, D.; Santamouris, M.; Kondepudi, S. Occupancy-based zone-level VAV system control implicationson thermal comfort, ventilation, indoor air quality and building energy efficiency. Energy Build. 2019, 204, 109473. [CrossRef]
18. Engelmann, P.; Kalz, D.; Salvalai, G. Cooling concepts for non-residential buildings: A comparison of cooling concepts in differentclimate zones. Energy Build. 2014, 82, 447–456. [CrossRef]
19. Ghiaus, C.; Allard, F. Natural Ventilation in the Urban Environment; Routledge: Abingdon-on-Thames, UK, 2016; ISBN9781138994393.
20. Da Silva, J.J.C. Passive downdraught evaporative cooling applied to an auditorium. Int. Conf. Passiv. Low Energy Cool. BuiltEnviron. Greece 2005, 555–560. Available online: https://citeseerx.ist.psu.edu/viewdoc/download?doi=10.1.1.526.9413&rep=rep1&type=pdf (accessed on 20 December 2020).
21. Roaf, S. Air-conditioning avoidance: Lessons from the windcatchers of Iran. In Proceedings of the International Conference“Passive and Low Energy Cooling for the Built Environment, Santorini, Greece, 19–21 May 2005; pp. 1053–1057.
22. Bahadori, M.N. Viability of wind towers in achieving summer comfort in the hot arid regions of the Middle East. Renew. Energy1994, 5, 879–892. [CrossRef]
23. Bansal, N.; Hauser, G.; Minke, G. Passive Building Design: A Handbook of Natural Climate Control; Elsevier Science B.V.: Amsterdam,The Netherlands, 1994.
24. Khan, N.; Su, Y.; Riffat, S. A review on wind driven ventilation techniques. Energy Build. 2008, 40, 1586–1604. [CrossRef]25. Allard, F. Natural Ventilation in Buildings: A Design Handbook; James & James (Science Publishers) Ltd.: London, UK, 1998.26. Gonzelez-Trevizo, M.E.; Gonzelez-Licon, H.J.; Gomez-amador, A.; Pozo, C.E.D.; Lopez, C.J. Exhaust ventilation through a wind
tower as response to high hermeticity in welfare housing. In Proceedings of the PLEA2013—29th Conference, SustainableArchitecture for a Renewable Future, Minich, Germany, 10–12 September 2013.
27. Bouchahm, T.; Bourbia, F.; Balhamri, A. Performance analysis and improvement of the use of wind tower in hot dry climate.Renew. Energy 2011, 36, 898–906. [CrossRef]
28. Ghadiri, M.H.; Ibrahim, N.L.N.; Mohamed, M.F. Applying computational fluid dynamic to evaluate the performance of four-sidedrectangular wind catcher with different height. Res. J. Appl. Sci. Eng. Technol. 2014, 7, 502–509. [CrossRef]
29. Elmualim, A.; Awbi, H. Evaluating the performance of a windcatcher system using wind tunnel testing. In Proceedings of the22nd Annual AIVC Conference, Bath, UK, 11–14 September 2001.
30. Kolokotroni, M.; Ayiomamitis, A.; Ge, Y. The suitability of wind driven natural ventilation towers for modern offices in the UK: Acase-study. In Proceedings of the World Renewable Energy Congress VII (WREC), Cologne, Germany, 29 June–5 July 2002.
31. McCabe, C.; Roaf, S. The wind towers of Bastakiya: Assessing the role of the towers in the whole house ventilation system usingdynamic thermal modelling. Archit. Sci. Rev. 2013, 56, 183–194. [CrossRef]
32. Bahadori, M.N.; Mazidi, M.; Dehghani, A.R. Experimental investigation of new designs of wind towers. Renew. Energy 2008, 33,2273–2281. [CrossRef]
33. Hughes, B.R.; Calautit, J.K.; Ghani, S.A. The development of commercial wind towers for natural ventilation: A review. Appl.Energy 2012, 92, 606–627. [CrossRef]

Buildings 2021, 11, 100 18 of 18
34. Van Hooff, T.; Blocken, B.; Aanen, L.; Bronsema, B. A venturi-shaped roof for wind-induced natural ventilation of buildings:Wind tunnel and CFD evaluation of different design configurations. Build. Environ. 2011, 46, 1797–1807. [CrossRef]
35. Blocken, B.; van Hooff, T.; Aanen, L.; Bronsema, B. Computational analysis of the performance of a venturi-shaped roof fornatural ventilation: Venturi-effect versus wind-blocking effect. Comput. Fluids 2011, 48, 202–213. [CrossRef]
36. Sadafi, N.; Salleh, E.; Haw, L.C.; Jaafar, Z. Evaluating thermal effects of internal courtyard in a tropical terrace house bycomputational simulation. Energy Build. 2011, 43, 887–893. [CrossRef]
37. Wachenfeldt, B.J.; Dagfinn, B. Building Integrated Energy Systems in Smart Energy Efficient Buildings—A State-of-the-Art; ProjectReport; SINTEF Civil and Environmental Engineering: Trondheim, Norway, 2003.
38. Bhagat, R.K.; Davies Wykes, M.S.; Dalziel, S.B.; Linden, P.F. Effects of ventilation on the indoor spread of COVID-19. J. Fluid Mech.2020, 903. [CrossRef]
39. Turner, S.C.; Paliaga, G.; Lynch, B.M.; Arens, E.A.; Aynsley, R.M.; Brager, G.S.; Deringer, J.J.; Ferguson, J.M.; Filler, J.M.; Hogeling,J.J.; et al. ASHRAE STANDARD Thermal Environmental Conditions for Human Occupancy; ASHRAE: Peachtree Corners, GA,USA, 2010.
40. Winslow, C.E.A.; Herrington, L.P.; Gagge, A.P. Relations between Atmospheric Conditions, Physiological Reactions and Sensationsof Pleasantness. Am. J. Hyg. 1937, 26, 103–115.
41. Vellei, M.; Le Dréau, J. A novel model for evaluating dynamic thermal comfort under demand response events. Build. Environ.2019, 160, 106215. [CrossRef]
42. BSI BS EN ISO 7730. Ergonomics of the Thermal Environment. Analytical Determination and Interpretation of Thermal Comfort UsingCalculation of the PMV and PPD Indices and Local Thermal Comfort Criteria; ISO: Geneva, Switzerland, 2005.
43. Carlucci, S.; Bai, L.; de Dear, R.; Yang, L. Review of adaptive thermal comfort models in built environmental regulatory documents.Build. Environ. 2018, 137, 73–89. [CrossRef]
44. De Dear, R.J.; Brager, G.S. Developing an adaptive model of thermal comfort and preference. ASHRAE Trans. 1998, 104, 145–167.45. ANSI/ASHRAE ANSI/ASHRAE Standard 55-2017: Thermal Environmental Conditions for Human Occupancy; ASHRAE Inc.: Atlanta,
GA, USA, 2017; Volume 2017, p. 66. ISSN 1041-2336.46. Khattak, S.H.; Natarajan, S.; Chung, W.J. Out with the power outages: Peak load reduction in the developing world. In
Proceedings of the Windsor 2020 Resilient Comfort, Windsor, UK, 16–19 April 2020; pp. 904–922.47. Atlas, W. Average Temperature: Kuwait City, Kuwait. Available online: https://www.weather-atlas.com/en/kuwait/kuwait-
city-climate#temperature (accessed on 20 February 2020).48. Designbuilder Software Limited Design Builder. Available online: http://www.designbuilder.co.uk/ (accessed on 3 Febru-
ary 2021).49. BENETECH GM8910 Eng Brochure.pdf. Available online: www.ponpe.com (accessed on 20 February 2021).50. ONSET HOBO® UX100 Series and UX120-014M Data Loggers. Available online: https://tmseurope.co.uk/datasheets/hobo_ux1
00_ux120-014m_data-loggers-datasheet.pdf (accessed on 20 February 2020).51. Katramiz, E.; Al Jebaei, H.; Alotaibi, S.; Chakroun, W.; Ghaddar, N.; Ghali, K. Sustainable cooling system for Kuwait hot climate
combining diurnal radiative cooling and indirect evaporative cooling system. Energy 2020, 213, 119045. [CrossRef]52. Alajmi, T.; Phelan, P. Modeling and forecasting end-use energy consumption for residential buildings in Kuwait using a bottom-up
approach. Energies 2020, 13, 1981. [CrossRef]53. Al-Otaibi, A.; Al-Qattan, A.; Fairouz, F.; Al-Mulla, A. Performance evaluation of photovoltaic systems on Kuwaiti schools’ rooftop.
Energy Convers. Manag. 2015, 95, 110–119. [CrossRef]54. University, I.S. Iowa Environmental Mesonet. Available online: https://mesonet.agron.iastate.edu/request/download.phtml?
network=KW__ASOS (accessed on 1 February 2021).55. NREL NSRDB: National Solar Radiation Database. Available online: https://nsrdb.nrel.gov/ (accessed on 1 February 2021).56. Gu, L. Airflow network modeling in energyplus. IBPSA 2007—Int. Build. Perform. Simul. Assoc. 2007, 10, 964–971.57. Al-rashidi, K.; Loveday, D.; Al-mutawa, N. Impact of ventilation modes on carbon dioxide concentration levels in Kuwait
classrooms. Energy Build. 2012, 47, 540–549. [CrossRef]58. Awbi, H. Ventilation Systems Design and Performance; Taylor & Francis: New York, NY, USA, 2013; Volume 53.