Design for wind comfort in The Netherlands
14
1 Corresponding author: Tel. + 31 527 248662; Fax. + 31 527 248582; E-mail address: [email protected] Design for wind comfort in The Netherlands: procedures, criteria and open research issues Eddy Willemsen a,1 Jacob A. Wisse b a German-Dutch Wind Tunnels (DNW), P.O. Box 175, Emmeloord, the Netherlands b Eindhoven University of Technology, P.O. Box 513, Eindhoven, the Netherlands Abstract A code for the assessment of wind comfort and wind danger in the built environment in The Netherlands is presented. The code is not another legal building requirement, but a helping hand to incorporate wind comfort in a building programme. It regulates technical procedures and some quality control. A decision scheme indicates which building plans need professional assessment by wind engineers. Local wind speed data are predicted from wind tunnel or CFD simulations. The code puts requirements to the providing institutes to ensure a good quality of their data. The statistics of a reference wind speed at the building location is needed to calculate the frequency of occurrence that a threshold wind speed is exceeded. The code prescribes a method to calculate the statistics of the reference wind speed at a height of 60m. This method is built in a software package and incorporates the most up-to-date data from a network of meteorological stations in The Netherlands. Five grades of wind comfort A-E are distinguished and defined by the frequency of occurrence that the local wind speed exceeds a threshold value of 5 m/s for the hourly mean value. For three different activity areas these grades of wind comfort are assessed in terms of a poor, moderate or good local wind climate. The code is unique in its kind and eliminates possible differences in the approach of wind comfort assessment by prescribing the underlying procedures. Keywords: wind comfort; comfort criteria; comfort evaluation; wind tunnel comparison; town planning
-
Upload
nationalaerospacelaboratorynlrnetherlands -
Category
Documents
-
view
1 -
download
0
Transcript of Design for wind comfort in The Netherlands
1 Corresponding author: Tel. + 31 527 248662; Fax. + 31 527 248582; E-mail address: [email protected]
Design for wind comfort in The Netherlands:
procedures, criteria and open research issues
Eddy Willemsena,1
Jacob A. Wisseb
aGerman-Dutch Wind Tunnels (DNW), P.O. Box 175, Emmeloord, the Netherlands
bEindhoven University of Technology, P.O. Box 513, Eindhoven, the Netherlands
Abstract
A code for the assessment of wind comfort and wind danger in the built environment in The Netherlands is presented.
The code is not another legal building requirement, but a helping hand to incorporate wind comfort in a building
programme. It regulates technical procedures and some quality control. A decision scheme indicates which building
plans need professional assessment by wind engineers.
Local wind speed data are predicted from wind tunnel or CFD simulations. The code puts requirements to the
providing institutes to ensure a good quality of their data.
The statistics of a reference wind speed at the building location is needed to calculate the frequency of occurrence that
a threshold wind speed is exceeded. The code prescribes a method to calculate the statistics of the reference wind speed
at a height of 60m. This method is built in a software package and incorporates the most up-to-date data from a
network of meteorological stations in The Netherlands.
Five grades of wind comfort A-E are distinguished and defined by the frequency of occurrence that the local wind
speed exceeds a threshold value of 5 m/s for the hourly mean value. For three different activity areas these grades of
wind comfort are assessed in terms of a poor, moderate or good local wind climate.
The code is unique in its kind and eliminates possible differences in the approach of wind comfort assessment by
prescribing the underlying procedures.
Keywords: wind comfort; comfort criteria; comfort evaluation; wind tunnel comparison; town planning
2
1. Introduction
Growing awareness by the general public and local authorities on wind comfort in
public space, a considerable increase in high rise building and a confusing diversity of
applied wind comfort criteria called for an initiative. Local authorities, architects, city
planners, project developers and scientists were invited by The Netherlands
Normalisation Institute NEN to a workshop. This workshop established a need for a
code on wind comfort assessment. Consequently, NEN conducted a project in close
cooperation with eight Dutch cities, three wind tunnel institutes and many other parties
concerned.
The present paper presents the final results of this project, which resulted in the
publication of NEN 8100, March 2006. This code is not a legal building requirement
but offers a strict method to incorporate wind comfort in a building programme.
It is in line with the present day practice in The Netherlands, where since about 30 years
three wind tunnel laboratories have been testing building plans for (mechanical) wind
comfort. They have developed a rapport with their clients and received feed-back from
them. The validations of building plans were based on wind comfort criteria by Lawson
& Penwarden (1975) and introduced to the Dutch market by Visser (1980). However, in
later years several cities adapted different criteria for reasons of clearness and
comprehensibility to users and the general public, as well as adaptations for building
near the coastline.
The present code is based on the non-documented experience of these laboratories and
of course on the state of the art acquired by the international wind engineering
community. Apart from published research, much has been learned from work within
and outside the framework of the EC COST-C14 project, entitled The Impact of Wind
and Storm on City Life and Built Environment (see www.costc14.bham.ac.uk). A
summary of wind comfort criteria used by eight participating laboratories is given in
Koss (2004) and in Sanz-Andres and Cuerva (2004).
2. Wind comfort analysis, yes or no
Architecture and urban planning with respect to the wind climate is in its infancy. Urban
wind climate design virtually does not exist. Designers, their clients and local
authorities have very little notion of the relation between urban geometry and pedestrian
comfort. This state of affairs is realistic because of three issues.
Firstly, the perception of urban space by the public is badly understood. Sociological,
cultural and psychological influences are of importance as well as exposure to rain,
3
sunshine and wind. Urban designers do not know professionally to what extent
pedestrian comfort is important.
Secondly, the correlation between urban geometry and local climate is poorly
documented, even in wind engineering literature. Available literature is
incomprehensible to designers. Including urban climate into their design is unrealistic if
the subject is a closed domain of technical people.
Thirdly, these technical people may advise expensive alterations or additions, which
may even be ugly or unpractical.
The new Dutch code NEN 8100 does not bridge the gap between designers, their clients
and authorities. It aims to bring some order in the field by giving decision rules to
discriminate between building plans which do or do not require action with regard to
wind comfort. It offers assistance in making a building programme by offering a format
for requirements with regard to urban wind climate. Parties may agree on a level of
wind comfort to strive for. The code also includes requirements to obtain a good quality
wind tunnel or CFD simulation.
The decision scheme that indicates which building plans need professional assessment
by wind engineers is based on experience and on research from Beranek & Van Koten
(1980) and Bottema (1993). The decision scheme discriminates between building height
smaller than 15m and 30m as well as sheltered or unsheltered buildings. For sheltered
buildings up to a height of 15m no further evaluation regarding the wind climate is
necessary. For sheltered buildings with a height between 15m and 30m and for
unsheltered buildings up to a height of 30m the assessment from an expert is necessary
to decide whether or not a CFD or wind tunnel investigation is necessary. For buildings
higher than 30m such an investigation is always necessary.
A building and its direct environment are sheltered when for all wind sectors the
following conditions are satisfied:
the local surface area is covered for 20% or more with obstacles like trees (tops) and
buildings up to a radius of 300m,
the building is lower than 150% of the average height h of the obstacles within a
radius of 300m,
the distance from the building to the surrounding obstacles does not exceed ten
times the average height h.
Stathopoulos (2006) mentions some comparable criteria for Montréal, where an
exclusion clause for low buildings is dealt with by specifying a minimum height (like
the 15m mentioned above) and adding the condition of exposed height (building height
higher than the height of the surrounding buildings) to be more than a third. In addition
4
there is an intermediate category of buildings that requires attention but not necessarily
a boundary layer wind tunnel study. In such cases a report from a wind engineering
expert is generally sufficient.
A test is a full assessment which includes wind tunnel or CFD simulation of the
building plan, evaluation of alternative geometries or additional measures. Generally,
remedial measures are decided in dialogue between wind engineer and client.
3 Methodology
The authors discussed the methodology to assess wind comfort in Willemsen and Wisse
(2002); see also Blocken et al. (2004). Wind speed ratios CV between pedestrian level
wind and a relevant reference wind are determined as function of the natural wind
direction ß in a wind tunnel experiment (or through CFD calculations).
)ß(V
)ß(V)ß(C
WT,REF
WT,PED
WT,V and )ß(V
)ß(V)ß(C
IS,REF
IS,PED
IS,V (1)
VPED is the wind speed at pedestrian level and VREF the wind speed at a reference
height. The subscript “wt” denotes the wind tunnel and “is” the in-situ condition.
In The Netherlands time-mean wind speeds are used. There is a pending issue about the
optimal wind parameter: mean wind speed_
V , gust duration and gust speed or an
effective wind speed VEFF. An effective wind speed may be defined as follows:
σ.k_VVEFF (2)
σ is the standard deviation and V/σ the turbulence intensity. In literature k has a value
between 0.0 and 3.5; see e.g. ASCE (1999). Heated thermistors are used in The
Netherlands as measuring devices. These sensors provide some kind of a time-mean
effective wind speed with yet unknown response to the dynamic wind speed component,
i.e. unknown k-value. However, the existing experience with wind comfort assessment
is based on this technique (Visser, 1990), making further refinements redundant.
In a perfect simulation the calculated CV (ß) values are the same as in-situ. In-situ
pedestrian level wind speeds can then be calculated:
)ß(V)ß(C)ß(V IS,REFWT,VIS,PED (3)
Quality criteria for wind comfort consist of the combination of a threshold wind speed
VTHR and a probability P that a local wind speed VPED,IS exceeds the threshold value
VTHR. At a certain level of P the public will experience the location as not comfortable.
5
The frequency distribution of the pedestrian level wind can be calculated from the wind
tunnel or CFD results with Equation 3, if the frequency distribution of the in-situ
reference wind speed is known. Consequently, the probability that a threshold wind
speed VTHR is exceeded can be calculated, i.e. P(VPED,IS >VTHR).
There exists a fairly good correlation between P(VPED,IS >VTHR) and VTHR values, which
has been discussed by Koss (2004) and Sanz-Andres and Cuerva (2004). The present
authors analyzed a rather common wind comfort investigation in a wind tunnel
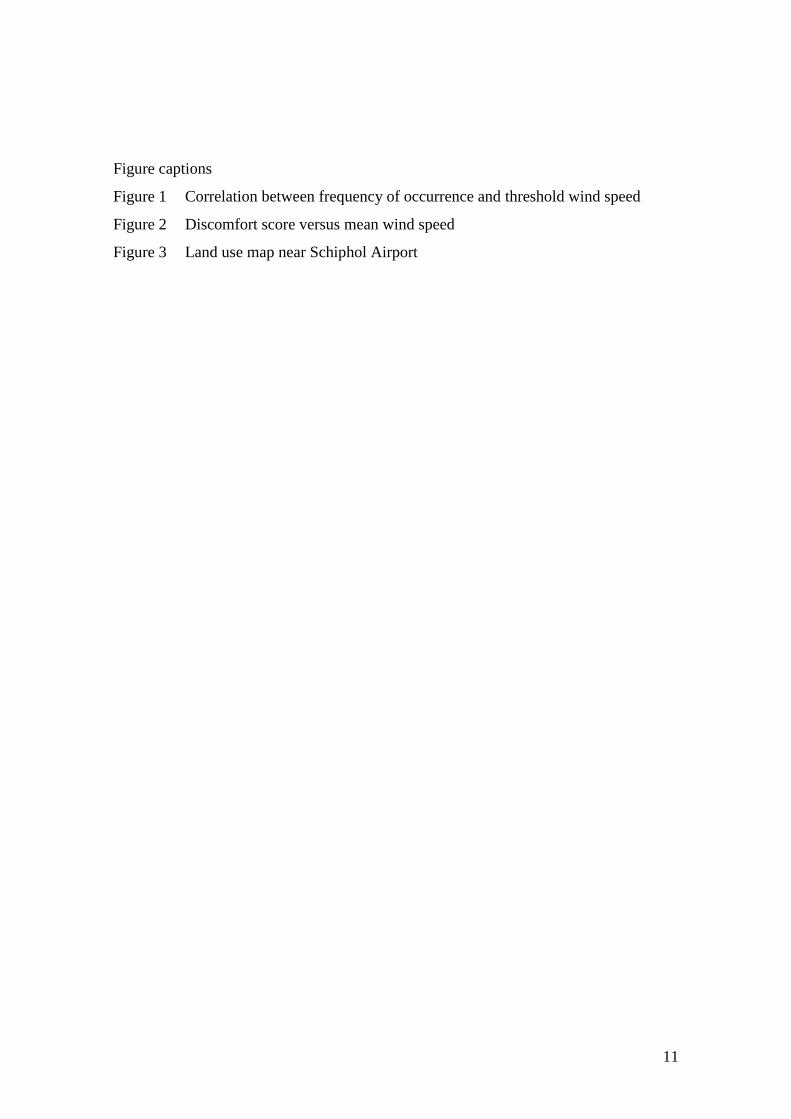
(Willemsen and Wisse, 2003). Figure 1 shows the sensitivity of the process. When at
5 m/s the VTHR value is changed with only 0.5 m/s (i.e. 10%), the P(VPED,IS >VTHR)
value is changed with 25% (for example: a P-value of 16% might change towards 12%
or 20%, depending on an increase or decrease of the VTHR-value).
Figure 1 demonstrates that a threshold wind speed is a relative, arbitrary criterion. No
information is available on either the acceptable degree of discomfort or the acceptable
maximum percentage of the people in public space that experience discomfort.
The authors derived figure 2 from data presented by Jackson (1978). We may conclude
that a mean wind speed of 5 m/s indicates an above-average degree of wind discomfort,
say two of every three passers-by. We do not know what level of discomfort is
acceptable to the public. Neither in terms of a score, nor in terms of mean wind speed.
Inherently, a maximum probability cannot be defined in an absolute sense. VTHR and
PTHR(VPED,IS>VTHR) are values on a relative scale.
4 Criteria
The current practice by some European laboratories has been discussed by a European
working group of the late Cost-C14 project. Results are reviewed and analyzed by Koss
& Sahlmen (2002) and Delpech et al. (2005). It appears that the range of criteria used
can be partly explained by the dependence between threshold wind velocity and
maximum probability of occurrence; see fig.1.
To set criteria for mechanical wind comfort is to choose a value for k in equation 2 as
well as values of VTHR and the maximum value for the probability P(VPED,IS >VTHR).
These choices have to depend on the foreseen function of the public space or
alternatively of a certain grade of wind comfort to be achieved. The choices made in the
code NEN 8100 are given in table 1. The choices are discussed in Willemsen & Wisse
(2003). To summarize: because literature is inconclusive and codification has to be a
consolidation of current practice, k is chosen to be zero. This means that the code is not
based on criteria of for example Hunt (1976), Gandemer (1978), Melbourne (1978) and
others. There methods require information on the standard deviation, which is not
measured in a standard wind climate investigation in a wind tunnel in The Netherlands.
6
A prognosis of the standard deviation in an urban canopy is difficult; see for example
Rotach (1995). Isyumov (private communication, 2003) stated that in general the mean
wind speed is a good indicator, but in his experience discomfort in some cases could
only be explained by gustiness. A 3-second gust is used by Murakami (1986). In the
code NEN 8100 the threshold in the mean wind speed is 5 m/s for all grades of wind
comfort and 15 m/s for danger by wind forces on pedestrians. Longstanding practice in
The Netherlands is based on this mean wind speed, which had been chosen after
Lawson & Penwarden (1975). Too little is known about the relation between the
probability P(VIS>VTHR) and the perception of comfort and danger by the public. No
documentation is found on its dependence of the local weather climate, apart from some
intuitive statements.
The present paper is relevant for mechanical pedestrian comfort only.
The choice of the probability P(VIS > 5 m/s) in NEN 8100 is based on feed-back by
clients, especially by developers of shopping-centres. The code defines five grades of
wind comfort A-E. The corresponding P-ranges are in agreement with the attainable
overall accuracy in wind tunnel simulations. The maximum shift in comfort grade due
to possible errors is one grade. The acceptable P(VPED, IS >VTHR) values are dependent
of the foreseen function of the public. The code specifies grades of comfort, not
functions of the urban place. Firstly, urban places such as building entrances or squares
are meant for different use by all kinds of public. Secondly, it is preferable to leave the
decision on the demanded grade of comfort to the client, the local authorities and the
urban planners.
Quality criteria may be mathematically precise and physically correct but will always
also be used for ill-defined applications. Civil officers need clarity and precision.
Therefore, an explaining consultant who can assess the situation at hand is necessary.
5 Quality of wind tunnel and CFD simulations
Wind tunnel experiments have a long standing history of feedback from building
practice. CFD is a newcomer and still in the stage that it has to prove itself. It is
considered unpractical to exclude the newcomer. For both techniques specific
knowledge and expertise is required. Three quality demands are defined for the
involved institutes, offices and alike. The first demand is sufficient capabilities and
education of the involved personnel, regarding among others aerodynamic theory, wind
climate and modelling techniques. The second demand is the production of a quality
document in English, to be updated every five years. The quality document should
address issues like description of the wind tunnel or CFD-code, modelling of the
atmospheric boundary layer, quality of the applied instruments, procedure for defining
7
the model characteristics, and alike. The third demand is the completion of a technical
information sheet for every measurement or calculation, which should be attached to the
final report to the client. It shall include prescribed items and contain the most relevant
information regarding the model, test set-up or grid definition, data management and
deliverables. The purpose of this form is to allow a review by the client.
6 Climatological input
To calculate P(VPED, IS >VTHR) from values of CV, WT (ß) generated by a wind tunnel or
CFD simulation, a climatology of VREF, IS is needed; see equation 3. Therefore, data of at
least one meteorological station has to be transformed into probabilistic wind data at the
building site. This transformation is discussed by Willemsen & Wisse (2002) and by De
Wit et al. (2003). Before the new code was accepted in The Netherlands, a rather wide
range of methods was in use in choosing the appropriate meteorological station and to
transform its data to values for the location of interest. To eliminate the corresponding
differences in the final assessment of the wind climate at pedestrian level height, a
computer application was custom made by the Royal Netherlands Meteorological
Institute KNMI to form one of the pillars of NEN 8100. The code prescribes this
improved and standardized method. The output of the computer application is statistical
wind data at the project location at a reference height of 60 meter.
The KNMI application is a spin-off of a project called HYDRA, whereby an update of
the wind climate statistics all over the country, including the water-land (and vice versa)
transition zones was obtained. The project was funded by the National Institute for
Coastal and Marine Management (RIKZ) and the Institute for Inland Water
Management and Waste Water Treatment (RIZA) in The Netherlands, who are legally
obliged to redo their risk assessment of the Dutch dike systems regularly. On the
IJsselmeer, the Waddenzee and parts of the Zeeland waters wind is the main generator
of waves. Available wind speed records were re-analysed and updated, resulting in a set
wind climate data of high standard. The initial focus of the HYDRA project was on
extreme wind speeds, but could easily be translated to yearly mean wind speeds.
For the transformation of the wind statistics from one place to another a two-layer
model, with a neutral surface layer wind profile up to 60m and a geostrophic drag
relation from Deacon (1973) was used. Internal boundary layer development is
modelled following Panofsky and Dutton (1984). A description of underlying principles
is given by Verkaik & Smits (2001), as well as by Wieringa (1976, 1986). The wind
speed at an arbitrary location is estimated from wind velocity statistics at upstream
meteorological stations, implying that the choice of the meteorological station varies
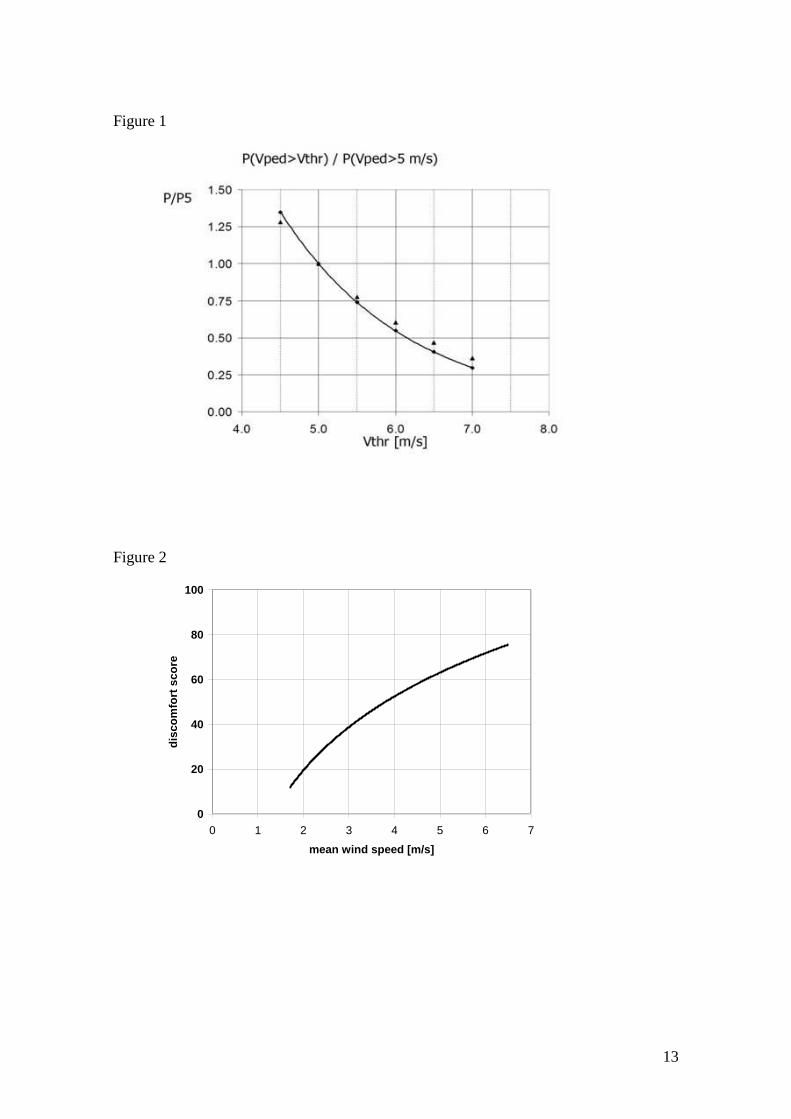
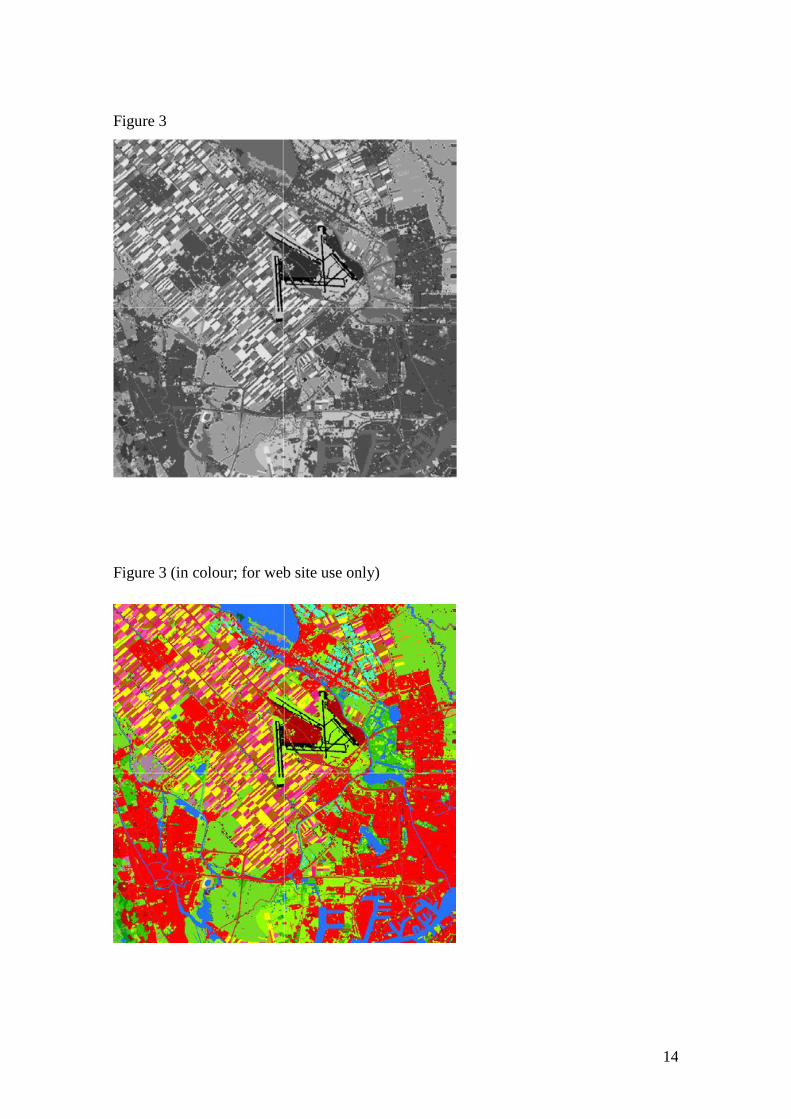
with wind direction. Mesoscale roughness lengths are determined from high resolution
8
land use maps, obtained from satellite images with a resolution of 25 meter. The land
use map distinguishes 46 different zo-values, between 0.0002m for the muddy flat
condition and 1.6m for a built-up urban area. Figure 3 shows a land use map for a
building site near Schiphol Airport, illustrating the high level of input data.
7 Open research issues
Drafters of the code are aware of the relative importance of consulting with respect to
wind comfort in urban planning. In fact, urban planners have to satisfy very complex
programmes in an environment of local politics and economy. To include urban physics
in their design is difficult. Research and demonstration projects are needed. Application
of wind engineering to problems in urban planning is born out of a definite need to
analyse and improve too windy places. Research has been mainly conducted by wind
engineers in order to find a more firm basis for their consults. What is needed to
improve our contribution to urban planning is cooperation with urban planners and
architects in a collective research in the perception of urban space. The effect of very
different parameters has to be quantified. Perhaps, at the end, we might get some
information on the maximum acceptable probability P(VIS > VTHR) if sociological,
psychological, cultural and architectural features as well as patterns of the use of urban
space are compared to the impact of weather parameters in a scientific way. Moreover,
the experience of wind engineers in consulting in urban planning and the feedback of
their clients is not objectively documented and analyzed. If so, we could learn the value
of this experience. A European working group of the late Cost-C14 programme did set
up a project to compare the criteria used by different European laboratories. Partly, this
was discussed by Koss & Sahlmen (2002) and Delpech et al. (2005). Research on
thermal wind comfort has been started; see e.g. Sasaki et al. (2000) and Stathopoulos et
al. (2004). This may widen the perspective of the contribution of physics to the
appreciation of an urban place to urban planning. However, in the opinion of the present
authors it is not likely that new design rules will emerge. If temperature and humidity
can be designed at all, it is by planning of green areas and water surfaces at a much
larger scale than urban design; in contrast to local wind and radiation which are
dependent of local urban geometry.
Even more specific for wind engineers is research into the aerodynamics of urban flow.
What is a roughness length for cities in dependence of their geometry? Is it possible to
define roughness lengths for cities at all?

9
8. Acknowledgements
The initiatives and management of the Netherlands Normalisation Institute NEN was
essential for the success of the codification project. Especially the endeavours of
Ir. R. Nouwen should be mentioned. Also the contributions of experts and their
institutes of TNO, NLR/DNW, Peutz and TU/e were indispensable. The project has
been funded by the cities of Amersfoort, Amsterdam, Lelystad, Rotterdam, The Hague,
Tilburg, Utrecht and Maastricht
9. References
American Society of Civil Engineers, 1999. Wind Tunnel Studies of Building and Structures. ASCE
Manuals and Reports on Engineering, Practice No 67.
Beranek, W.J., 1980. General rules for the determination of wind environment. Proceedings 5th
Int. Conf.
on Wind Engineering, Fort Collins, Colorado. Ed. Cermak J.E.
Blocken et al., 2004. Modification of pedestrian wind comfort in the Silvertop Tower passages by an
automatic control system. Journal of Wind Engineering and Industrial Aerodynamics 92(10), 849-873.
Bottema, M., 1993. Wind climate and urban geometry. PhD thesis Technical University Eindhoven,
http://alexandria.tue.nl/extra3/proefschrift/PRF9A/9321101.pdf
Cost C14-working group, 2001. Assessment and evaluation of Pedestrian Wind Comfort. Working
document 1.
Deacons, E.L. , 1973. Geostrophic drag coefficients. Boundary Layer Meteorology, vol 5, 321-340.
Delpech, Ph., Willemsen, E., Stathopoulos, T., Koss, Baker, C.J., Sanchez, A. , 2005. Pedestrian wind
comfort assessment criteria: A comparative case study, Proc. 4EACWE, Prague, 82-83
Gandemer, J., 1978, Aerodynamic studies of built-up areas made by C.S.T.B. at Nantes, France, J. of
Industrial Aerodynamics 3, pp 227-240
Hunt, J.C.R. et al., 1976, The effects of wind on people; New criteria based on wind tunnel experiments,
Building and Environment 11, pp 15-28
Isyumow, N. , Davenport A.G., 1975, The ground level wind environment in built-up areas, Proceedings
4th
Int. Conf. on Build. And Struct., Heathrow, pp 403-422
Jackson, P.S., 1978. The evaluation of windy environments. Build. and environment, vol 13, pp 251– 260
Koss, H.H., Sahlmen, J., 2002. Methods in pedestrian wind comfort assessment; Theoretical and practical
comparisons. In: Proc. of COST Action C14 Workshop, Nantes, pp.70-89.
Koss, H.H., 2004. On differences and similarities of applied wind comfort criteria. Impact of wind and
storm on city life and built environment. Proceedings of the Int. Conference on Urban wind
engineering and building aerodynamics, Von Karman Institute, Belgium May 5-7 2004
Lawson. T.V., Penwarden, A.D., 1975. The effects of wind on people in the vicinity of buildings. Proc.
4th
Conf. on Buildings and Structures. Heathrow. UK. p. 605-622
Lawson, T.V., 1978, The wind contnt of the built environment, J. of Industrial Aerodynamics, 3, 93-105
Melbourne, W.H., 1978, Criteria for environmental wind conditions, J. of Industrial aerodynamics, 3,
241-249

10
Murakami, S. et al., 1986, Study on acceptable criteria for assessing wind environment on ground level
based on resident’s diaries, J. of Wind Engineering and Ind. Aerodynamics 24, 1-18
NEN, Netherlands , Wind comfort en wind danger in the built environment, NEN 8100, (in Dutch),
March 2006.
Panofsky, J.A., Dutton, J. A. (1984) Atmospheric turbulence, Models and Methods for Engineering
Applications, John Wiley & Sons, New York
Rotach, M.W., Profiles of turbulence statistics in and above an urban street canyon, Atmospheric
Environment, Volume 29, no.13, 1473-1486.
Sanz-Andres, A., Cuerva,A, 2004. Pedestrian wind comfort, feasibility study of criteria homogenisation,
International Journal of Wind Engineering and Industrial Applications, 2006 (in press).
Sasaki, R., Yamada, Uematsu, Saeki, 2000. Comfort environment assessment based on bodily sensation
in open air: relationship between comfort sensation and meteorological factors. Journal of wind
engineering and industrial aerodynamics, Volume 87, pp 93 – 110
Stathopoulos, T., Wu, H., Zacharias, J., 2004. Outdoor human comfort in an urban climate. Building and
Environment 39, 297 – 305
Stathopoulos, T.,2006a, Pedestrian level winds and outdoor human comfort, International Journal of
Wind Engineering and Industrial Applications, (in press)
Stathopoulos, T., 2006b, Cadre Rélementaire, Arrondissement Ville-Marie, Ville de Montréal, April
1992, pp 50-51
Stichting Bouwresearch, 1979. Beperken van windhinder om gebouwen, rapport 65, 2 delen
Stichting Bouwresearch, 1982. Windhinder, rapport F3
Verkaik, J.W., Smits, A., 2001. Interpretation and estimation of the local wind climate. Proceedings of the
third European & African conference on wind engineering. Eindhoven, 43-57
Visser, G. Th., 1980. Literatuuronderzoek naar en voorstellen voor het hanteren van uniforme TNO-
windhindercriteria. TNO-MT rapport 80-02746
Visser, G. Th., 1990. Inventarisatie en evaluatie van windhindercriteria. TNO-MT rapport 90-376
Wieringa J., 1976. An objective exposure correction method for average wind speeds at a sheltered
location. Quart.J.Roy.Meteor.Soc., vol 102, pp. 241-253
Wieringa, J, 1986, Roughness-dependent geographical interpolation of surface wind speed averages,
Quart.J.Roy.Meteor.Soc., vol 112, pp. 867-889.
Willemsen, E., Wisse, J.A. , 2002. Accuracy of assessment of wind speed in the built environment. J.
Wind Eng. Ind. Aerodyn., pp. 1183-1190
Willemsen, E., Wisse, J.A., 2003. Standardisation of wind comfort evaluation in the Netherlands.
Proceedings eleventh Int. Conference on wind engineering, Lubbock, Vol 2, 2411-2419
Wisse, J.A., Krüs, H.W., Willemsen, E., 2002. Wind comfort Assessment by CFD. Proceedings Impact of
wind and storm on city life and built environment, CSTB, Nantes
Wit, de, M., Stathopoulos, T., Wisse, J.A., 2003. Airport wind speeds used for the design in urban
environments: the Eindhoven case. Journal of Wind Engineering and Industrial Aerodynamics, nr. 90,
pp. 1289-1298
11
Figure captions
Figure 1 Correlation between frequency of occurrence and threshold wind speed
Figure 2 Discomfort score versus mean wind speed
Figure 3 Land use map near Schiphol Airport

12
Table 1 Criteria for wind comfort and danger
wind comfort
P(VIS>5m/s)
in % hours per year
activity area
grade business
walking
pedestrian
walking sitting & standing
< 2.5 A good good good
2.5–5.0 B good good moderate
5.0–10 C good moderate poor
10–20 D moderate poor poor
> 20 E poor poor poor
wind danger
P(VIS>15 m/s) limited risk 0.05-0.3 % hours per year
dangerous > 0.3 % hours per year
13
Figure 1
Figure 2
0
20
40
60
80
100
0 1 2 3 4 5 6 7
mean wind speed [m/s]
dis
co
mfo
rt s
co
re
14
Figure 3
Figure 3 (in colour; for web site use only)