UNIT – I - Climate and comfort – SAR1204
50
SCHOOL OF BUILDING AND ENVIRONMENT DEPARTMENT OF ARCHITECTURE UNIT – I - Climate and comfort – SAR1204
-
Upload
khangminh22 -
Category
Documents
-
view
0 -
download
0
Transcript of UNIT – I - Climate and comfort – SAR1204
SCHOOL OF BUILDING AND ENVIRONMENT
DEPARTMENT OF ARCHITECTURE
UNIT – I - Climate and comfort – SAR1204
Unit I: Climate and comfort
1. Components of Climate :
SOLAR RADIATION
AMBIENT TEMPERATURE
AIR HUMIDITY
PRECIPITATION
SKY CONDITION
WIND
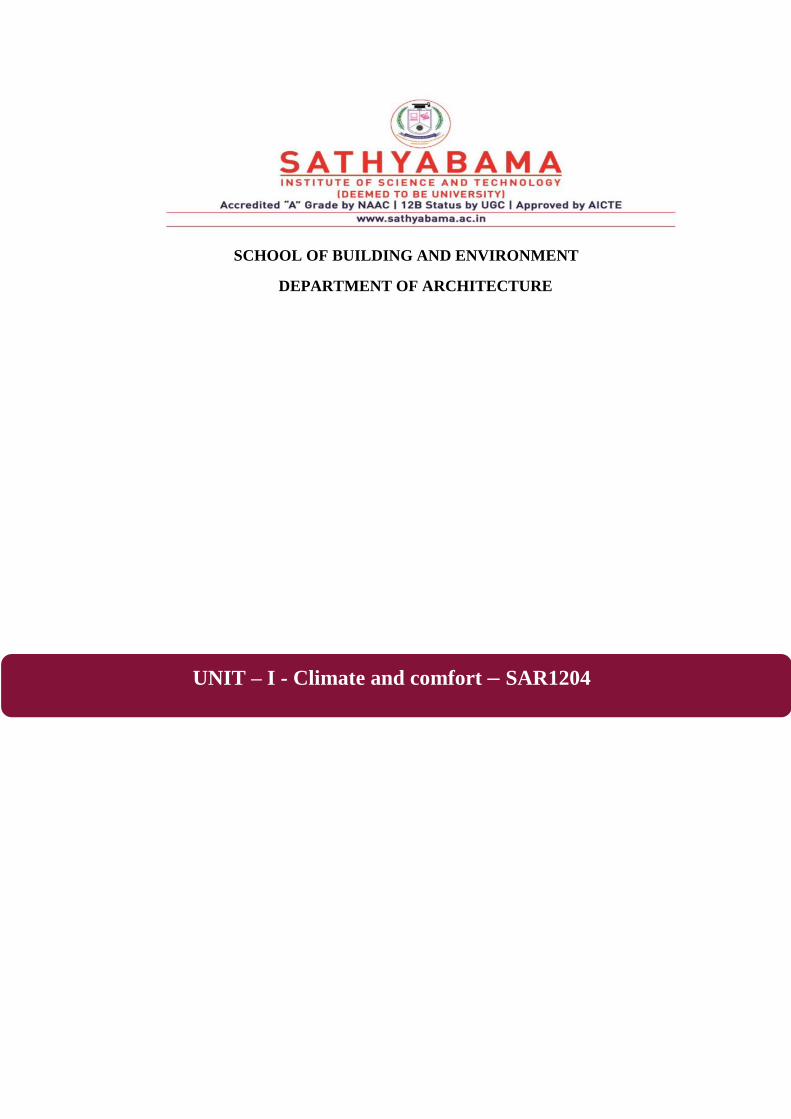
I. Solar Radiation : Solar radiation is the radiant
energy received from the sun. It is the intensity
of sunrays falling per unit time per unit area
and is usually expressed in Watts per square
metre (W/m2).
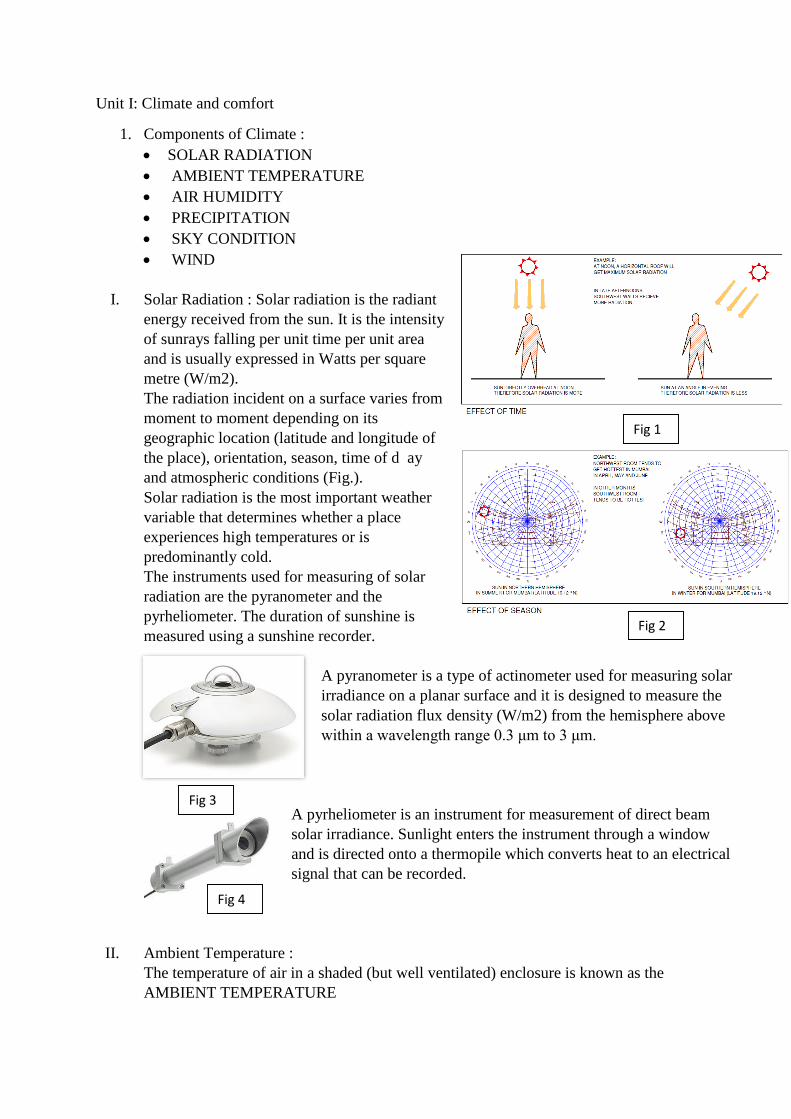
The radiation incident on a surface varies from
moment to moment depending on its
geographic location (latitude and longitude of
the place), orientation, season, time of d ay
and atmospheric conditions (Fig.).
Solar radiation is the most important weather
variable that determines whether a place
experiences high temperatures or is
predominantly cold.
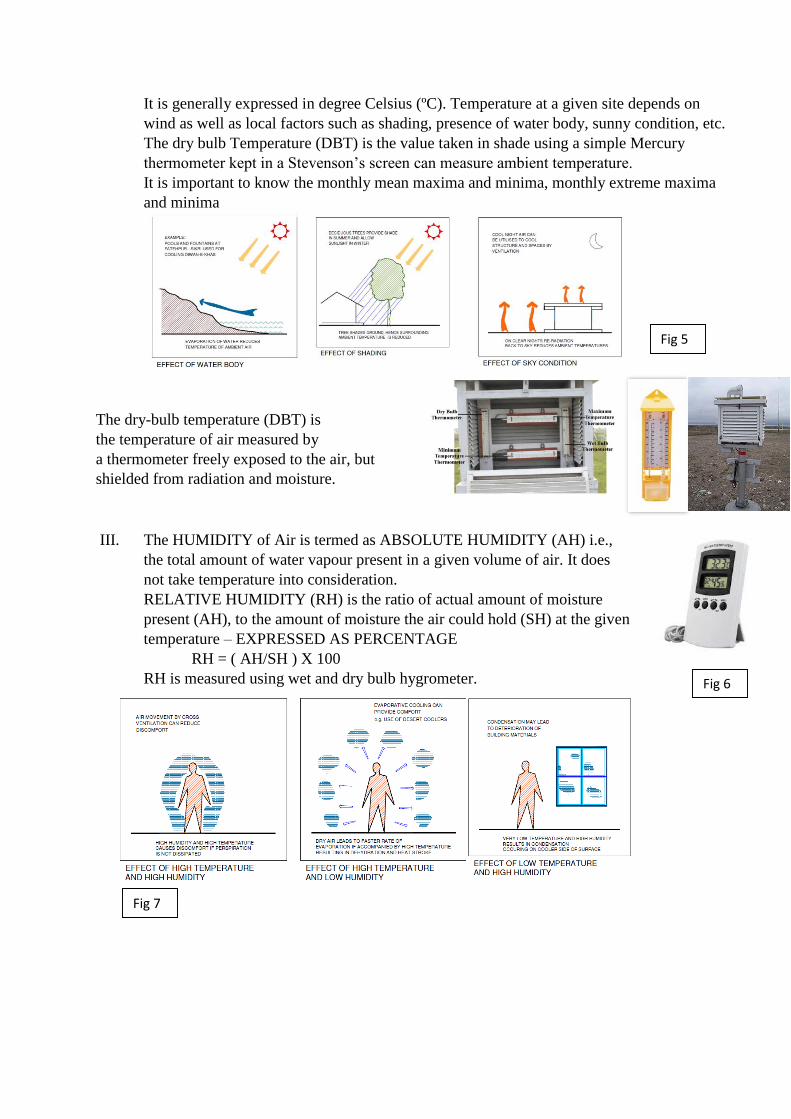
The instruments used for measuring of solar
radiation are the pyranometer and the
pyrheliometer. The duration of sunshine is
measured using a sunshine recorder.
A pyranometer is a type of actinometer used for measuring solar
irradiance on a planar surface and it is designed to measure the
solar radiation flux density (W/m2) from the hemisphere above
within a wavelength range 0.3 μm to 3 μm.
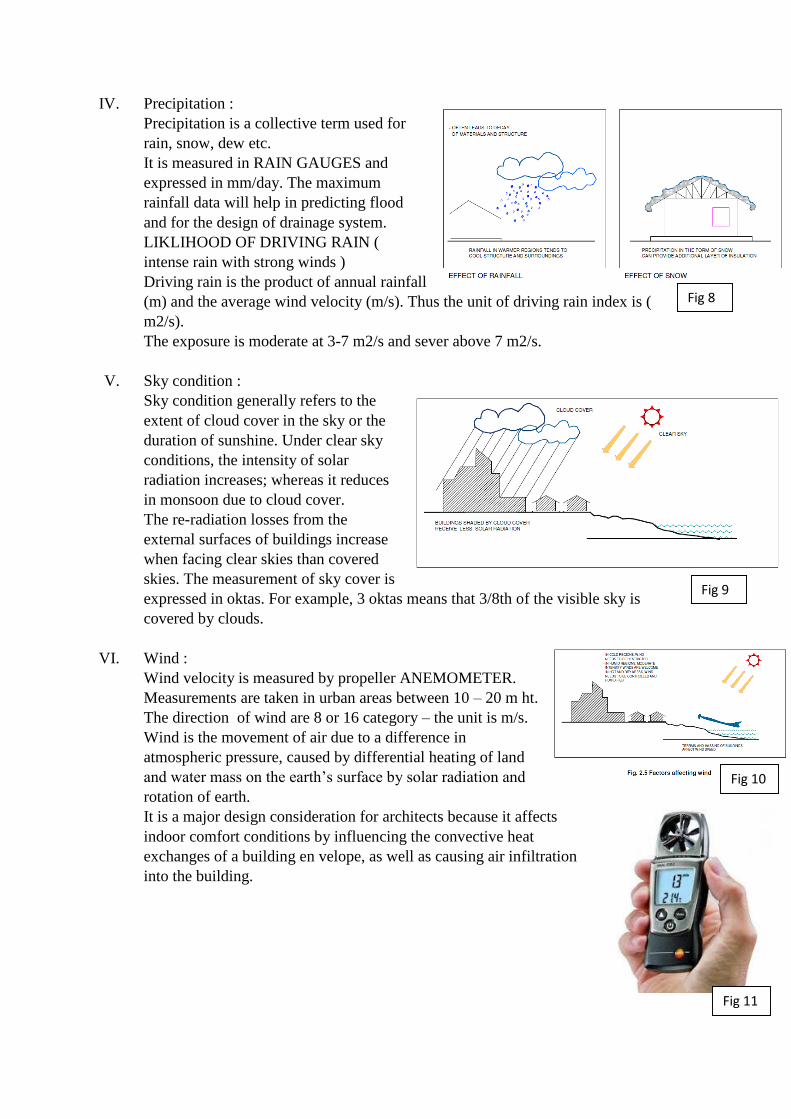
A pyrheliometer is an instrument for measurement of direct beam
solar irradiance. Sunlight enters the instrument through a window
and is directed onto a thermopile which converts heat to an electrical
signal that can be recorded.
II. Ambient Temperature :
The temperature of air in a shaded (but well ventilated) enclosure is known as the
AMBIENT TEMPERATURE
Fig 1
Fig 2
Fig 3
Fig 4
It is generally expressed in degree Celsius (ºC). Temperature at a given site depends on
wind as well as local factors such as shading, presence of water body, sunny condition, etc.
The dry bulb Temperature (DBT) is the value taken in shade using a simple Mercury
thermometer kept in a Stevenson’s screen can measure ambient temperature.
It is important to know the monthly mean maxima and minima, monthly extreme maxima
and minima
The dry-bulb temperature (DBT) is
the temperature of air measured by
a thermometer freely exposed to the air, but
shielded from radiation and moisture.
III. The HUMIDITY of Air is termed as ABSOLUTE HUMIDITY (AH) i.e.,
the total amount of water vapour present in a given volume of air. It does
not take temperature into consideration.
RELATIVE HUMIDITY (RH) is the ratio of actual amount of moisture
present (AH), to the amount of moisture the air could hold (SH) at the given
temperature – EXPRESSED AS PERCENTAGE
RH = ( AH/SH ) X 100
RH is measured using wet and dry bulb hygrometer.
Fig 5
Fig 6
Fig 7
IV. Precipitation :
Precipitation is a collective term used for
rain, snow, dew etc.
It is measured in RAIN GAUGES and
expressed in mm/day. The maximum
rainfall data will help in predicting flood
and for the design of drainage system.
LIKLIHOOD OF DRIVING RAIN (
intense rain with strong winds )
Driving rain is the product of annual rainfall
(m) and the average wind velocity (m/s). Thus the unit of driving rain index is (
m2/s).
The exposure is moderate at 3-7 m2/s and sever above 7 m2/s.
V. Sky condition :
Sky condition generally refers to the
extent of cloud cover in the sky or the
duration of sunshine. Under clear sky
conditions, the intensity of solar
radiation increases; whereas it reduces
in monsoon due to cloud cover.
The re-radiation losses from the
external surfaces of buildings increase
when facing clear skies than covered
skies. The measurement of sky cover is
expressed in oktas. For example, 3 oktas means that 3/8th of the visible sky is
covered by clouds.
VI. Wind :
Wind velocity is measured by propeller ANEMOMETER.
Measurements are taken in urban areas between 10 – 20 m ht.
The direction of wind are 8 or 16 category – the unit is m/s.
Wind is the movement of air due to a difference in
atmospheric pressure, caused by differential heating of land
and water mass on the earth’s surface by solar radiation and
rotation of earth.
It is a major design consideration for architects because it affects
indoor comfort conditions by influencing the convective heat
exchanges of a building en velope, as well as causing air infiltration
into the building.
Fig 8
Fig 9
Fig 10
Fig 11
GLOBAL CLIMATIC FACTORS
1. SOLAR RADIATION QUALITY
2. SOLAR RADIATION QUANTITY
3. TILT OF THE EARTH AXIS
4. RADIATION AT EARTH SURFACE
5. THE EARTHS THERMAL BALANCE
6. WINDS – Thermal Forces
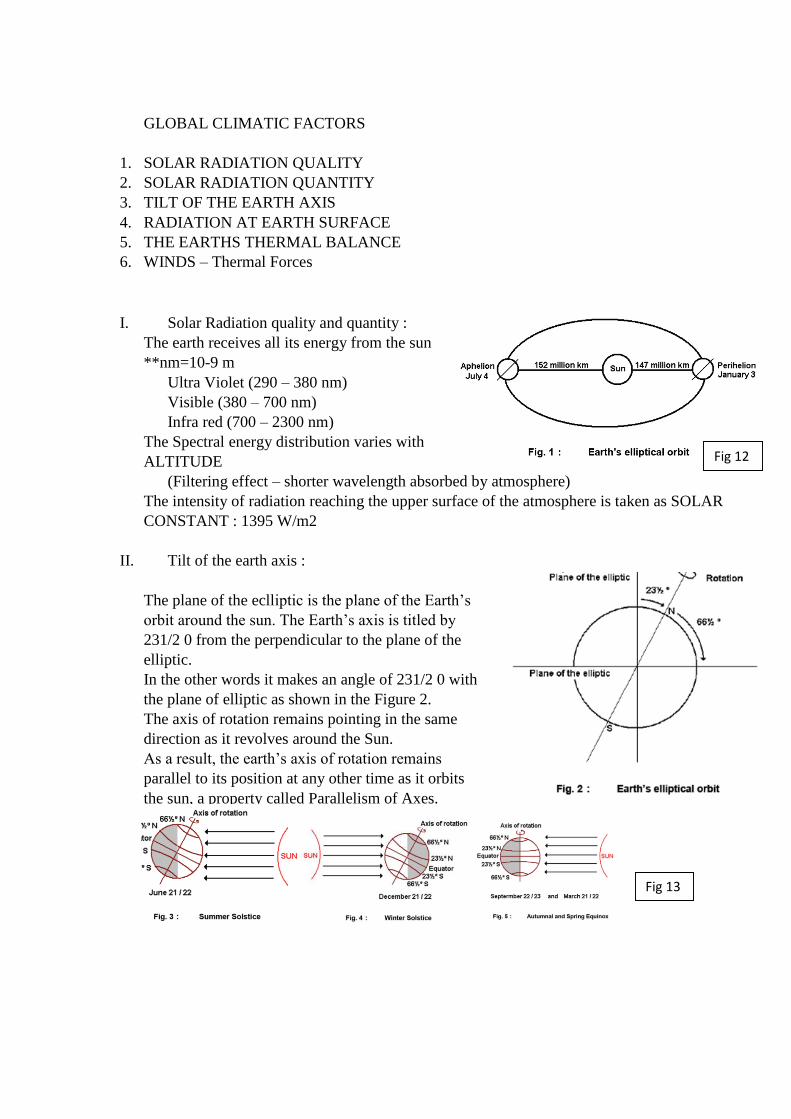
I. Solar Radiation quality and quantity :
The earth receives all its energy from the sun
**nm=10-9 m
Ultra Violet (290 – 380 nm)
Visible (380 – 700 nm)
Infra red (700 – 2300 nm)
The Spectral energy distribution varies with
ALTITUDE
(Filtering effect – shorter wavelength absorbed by atmosphere)
The intensity of radiation reaching the upper surface of the atmosphere is taken as SOLAR
CONSTANT : 1395 W/m2
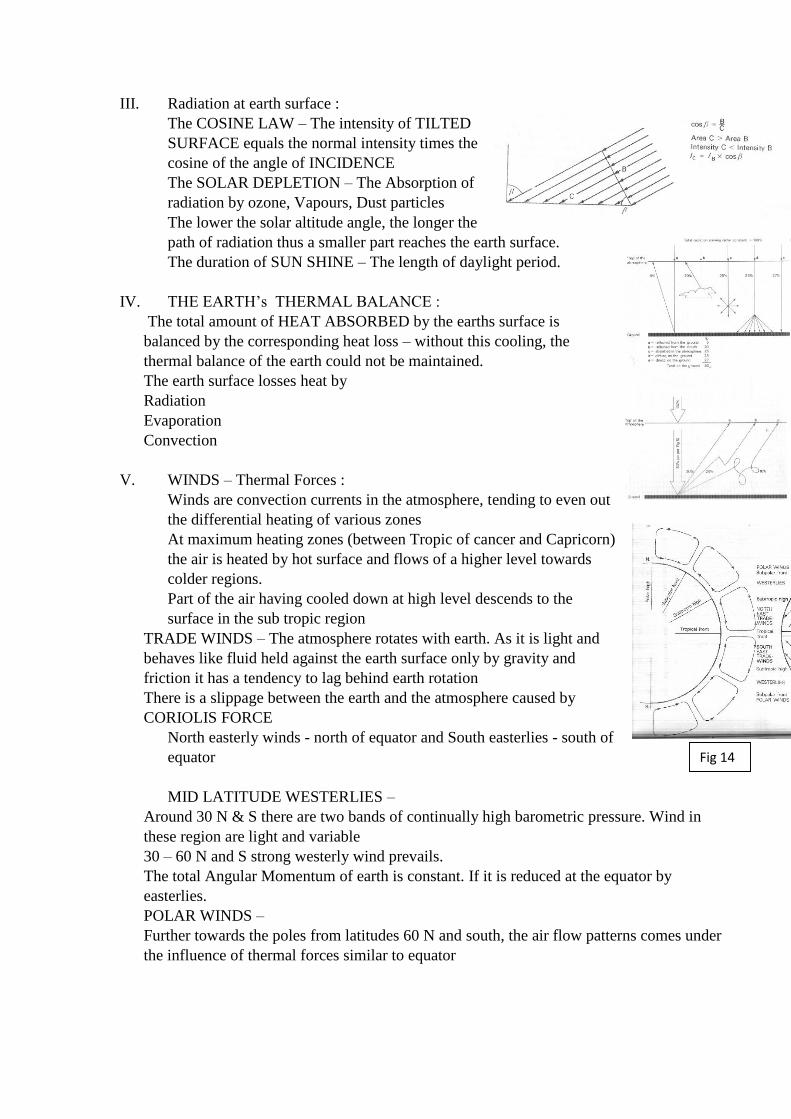
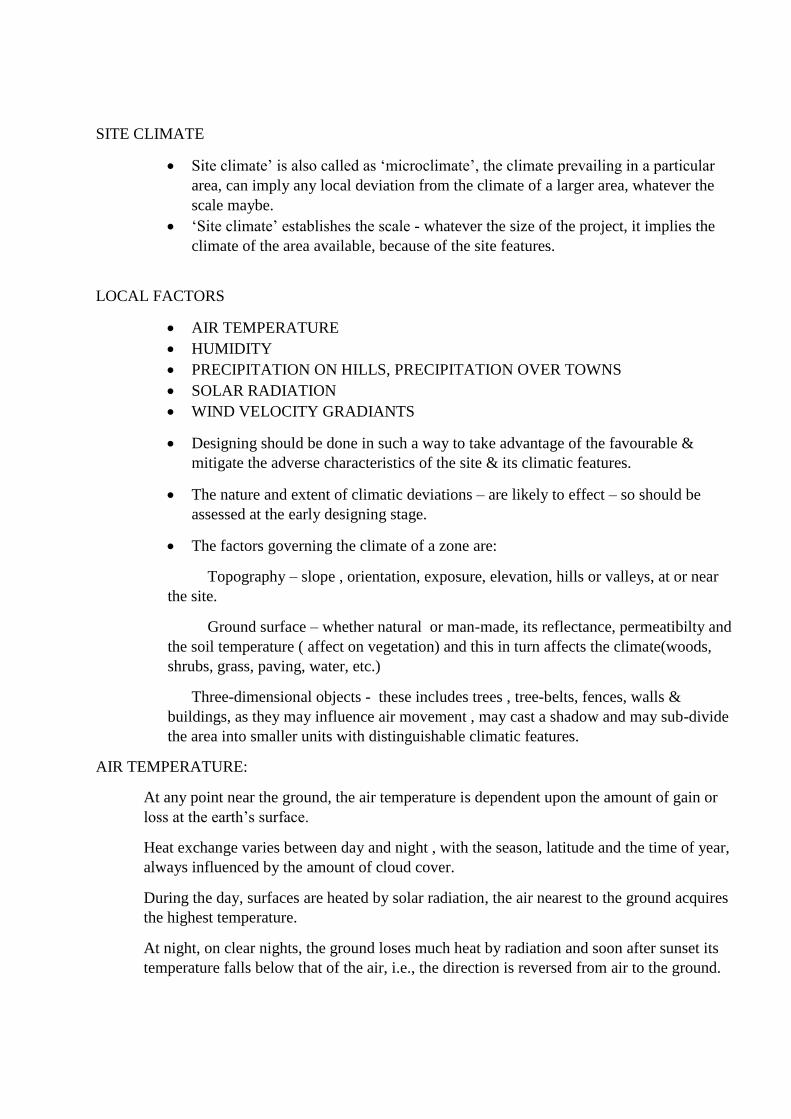
II. Tilt of the earth axis :
The plane of the eclliptic is the plane of the Earth’s
orbit around the sun. The Earth’s axis is titled by
231/2 0 from the perpendicular to the plane of the
elliptic.
In the other words it makes an angle of 231/2 0 with
the plane of elliptic as shown in the Figure 2.
The axis of rotation remains pointing in the same
direction as it revolves around the Sun.
As a result, the earth’s axis of rotation remains
parallel to its position at any other time as it orbits
the sun, a property called Parallelism of Axes.
Fig 12
Fig 13
III. Radiation at earth surface :
The COSINE LAW – The intensity of TILTED
SURFACE equals the normal intensity times the
cosine of the angle of INCIDENCE
The SOLAR DEPLETION – The Absorption of
radiation by ozone, Vapours, Dust particles
The lower the solar altitude angle, the longer the
path of radiation thus a smaller part reaches the earth surface.
The duration of SUN SHINE – The length of daylight period.
IV. THE EARTH’s THERMAL BALANCE :
The total amount of HEAT ABSORBED by the earths surface is
balanced by the corresponding heat loss – without this cooling, the
thermal balance of the earth could not be maintained.
The earth surface losses heat by
Radiation
Evaporation
Convection
V. WINDS – Thermal Forces :
Winds are convection currents in the atmosphere, tending to even out
the differential heating of various zones
At maximum heating zones (between Tropic of cancer and Capricorn)
the air is heated by hot surface and flows of a higher level towards
colder regions.
Part of the air having cooled down at high level descends to the
surface in the sub tropic region
TRADE WINDS – The atmosphere rotates with earth. As it is light and
behaves like fluid held against the earth surface only by gravity and
friction it has a tendency to lag behind earth rotation
There is a slippage between the earth and the atmosphere caused by
CORIOLIS FORCE
North easterly winds - north of equator and South easterlies - south of
equator
MID LATITUDE WESTERLIES –
Around 30 N & S there are two bands of continually high barometric pressure. Wind in
these region are light and variable
30 – 60 N and S strong westerly wind prevails.
The total Angular Momentum of earth is constant. If it is reduced at the equator by
easterlies.
POLAR WINDS –
Further towards the poles from latitudes 60 N and south, the air flow patterns comes under
the influence of thermal forces similar to equator
Fig 14
SITE CLIMATE
Site climate’ is also called as ‘microclimate’, the climate prevailing in a particular
area, can imply any local deviation from the climate of a larger area, whatever the
scale maybe.
‘Site climate’ establishes the scale - whatever the size of the project, it implies the
climate of the area available, because of the site features.
LOCAL FACTORS
AIR TEMPERATURE
HUMIDITY
PRECIPITATION ON HILLS, PRECIPITATION OVER TOWNS
SOLAR RADIATION
WIND VELOCITY GRADIANTS
Designing should be done in such a way to take advantage of the favourable &
mitigate the adverse characteristics of the site & its climatic features.
The nature and extent of climatic deviations – are likely to effect – so should be
assessed at the early designing stage.
The factors governing the climate of a zone are:
Topography – slope , orientation, exposure, elevation, hills or valleys, at or near
the site.
Ground surface – whether natural or man-made, its reflectance, permeatibilty and
the soil temperature ( affect on vegetation) and this in turn affects the climate(woods,
shrubs, grass, paving, water, etc.)
Three-dimensional objects - these includes trees , tree-belts, fences, walls &
buildings, as they may influence air movement , may cast a shadow and may sub-divide
the area into smaller units with distinguishable climatic features.
AIR TEMPERATURE:
At any point near the ground, the air temperature is dependent upon the amount of gain or
loss at the earth’s surface.
Heat exchange varies between day and night , with the season, latitude and the time of year,
always influenced by the amount of cloud cover.
During the day, surfaces are heated by solar radiation, the air nearest to the ground acquires
the highest temperature.
At night, on clear nights, the ground loses much heat by radiation and soon after sunset its
temperature falls below that of the air, i.e., the direction is reversed from air to the ground.
HUMIDITY:
It depends on air temperature as on the
actual amount of water vapour present
in the air.
During the day, the lowest layer of air
is being heated by the ground surface, its RH is rapidly decreased.
At night, the situation is reversed.
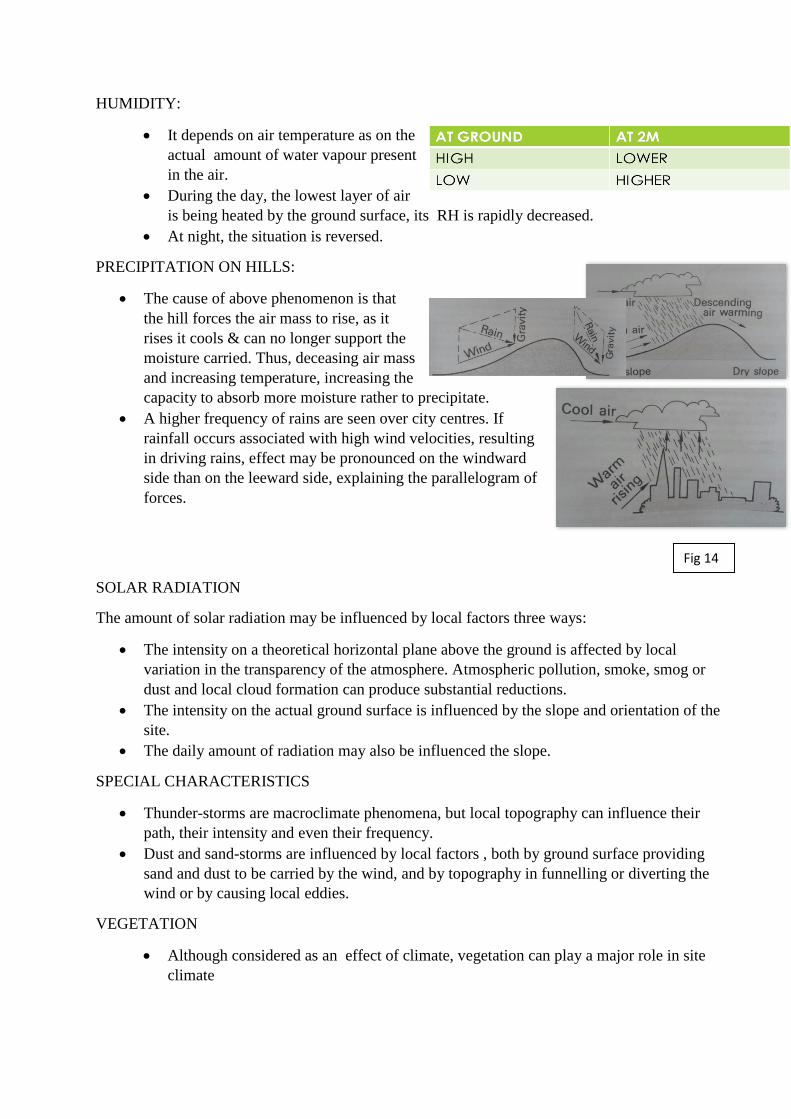
PRECIPITATION ON HILLS:
The cause of above phenomenon is that
the hill forces the air mass to rise, as it
rises it cools & can no longer support the
moisture carried. Thus, deceasing air mass
and increasing temperature, increasing the
capacity to absorb more moisture rather to precipitate.
A higher frequency of rains are seen over city centres. If
rainfall occurs associated with high wind velocities, resulting
in driving rains, effect may be pronounced on the windward
side than on the leeward side, explaining the parallelogram of
forces.
SOLAR RADIATION
The amount of solar radiation may be influenced by local factors three ways:
The intensity on a theoretical horizontal plane above the ground is affected by local
variation in the transparency of the atmosphere. Atmospheric pollution, smoke, smog or
dust and local cloud formation can produce substantial reductions.
The intensity on the actual ground surface is influenced by the slope and orientation of the
site.
The daily amount of radiation may also be influenced the slope.
SPECIAL CHARACTERISTICS
Thunder-storms are macroclimate phenomena, but local topography can influence their
path, their intensity and even their frequency.
Dust and sand-storms are influenced by local factors , both by ground surface providing
sand and dust to be carried by the wind, and by topography in funnelling or diverting the
wind or by causing local eddies.
VEGETATION
Although considered as an effect of climate, vegetation can play a major role in site
climate
Fig 14
Trees and vegetation form an intermediate layer between the earth’s surface and the
atmosphere.
The moderating effect can be referred with respect to air temperature, humidity,
radiation and air movement.
IMPACT OF RAINFALL IN THE DESIGN OF BUILDINGS
In regions having high rainfall, a pitched roof will most often be used. In regions having
driving rainfall and where ventilation is important, one of the most difficult problems which
a designer must attempt to solve is to provide large openings, but at the same time give
protection from driving rain, insects, smells and noise, without radically reducing air
movement.
Broad eaves can be provided to shade the walls and openings, provide protection from
driving rain and sky glare and permit the openings to be kept open most of the time.
Large projecting eaves and wide verandahs are needed in the warm-humid season in the out-
door living areas, to reduce sky glare, keep out the rain and provide shade.
Brise-soleils, louvers and other sun breaks used to protect openings during the hot-dry
period, are also advantageous in the rainy season, serving as protection against rain.
Rain protection and special protective measures are needed if rain is frequent and heavy -
such as deep verandahs, wide overhangs and covered passages.
With heavy rainfall occurring even in one month of the year, special provisions for roof
drainage will be necessary.
In low cost building, spouts at roof level or eaves discharge is acceptable if the foot of the
walls is surrounded by a concrete path or approx 0.5 m wide, sloping away from the
building.
THERMAL COMFORT
Our life cycle comprises activity, fatigue and recovery.
Recovery is essential to counter balance against mental and physical fatigue through
recreation, rest and sleep.
This can be affected by unfavorable climatic conditions and the resulting stress on body and
mind causes discomfort, loss of efficiency and breakdown of health.
Thermal comfort is the condition of mind that expresses satisfaction with thermal
environment and is assessed by subjective evaluation. (ANSI/ASHRAE Standard 55)
The task of the designer is to create the best possible indoor climate or even the
environment for the users as they judge the quality of design based on physical and
emotional point of view.
Thermal comfort is considered to be a necessary component of workplace contentment and
production.
The thermal comfort has to be satisfied in spaces where people will spend most of their
lives. For e.g. Schools are the buildings where children spend most of their active day time.
Thermal discomfort in school buildings can create unsatisfactory conditions for both
teachers and students which is disturbing for them, reducing their working productivity,
attention and performance in studies.
INDICES OF THERMAL COMFORT
Thermal comfort refers to the subjective feeling of temperature in an environment.
Optimum levels of thermal comfort helps in maximizing productivity.
Measurement of thermal comfort levels are complex and many indices have been proposed
over the years.
THERMAL COMFORT SCALE
A single scale which combines the effects of various thermal comfort factors ( such as air
temperature, humidity, air movement and radiation) is called a THERMAL INDEX or
COMFORT SCALE.
The designer has to handle four such factors to understand the effect of climatic conditions
on the body’s heat dissipation process.
It depends on the environmental factors of air temperature, relative humidity, air velocity
and solar radiation, also the incorporation of highly variable personal factors like the
amount of clothing being worn, A person’s resting metabolic rate, level of physical activity.
To create such a scale , experiments were done in specially built rooms where climatic
conditions could be produced.
The subjects were placed in the room and were asked to fill questionnaires after each
variation in the conditions according to a set scale ranging from ‘very hot’ to ‘very cold’.
The answers were then evaluated statistically and plotted on a graph to find relationship
among the factors.
At least 30 or more scales were devised in this process.
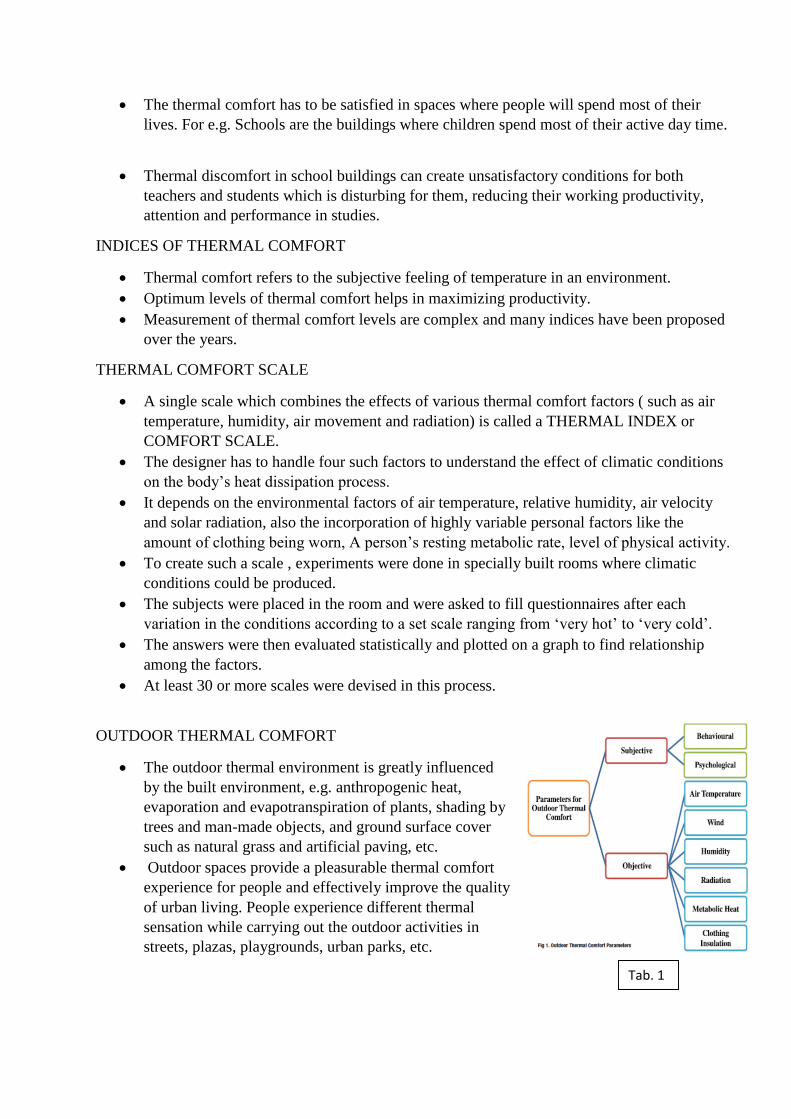
OUTDOOR THERMAL COMFORT
The outdoor thermal environment is greatly influenced
by the built environment, e.g. anthropogenic heat,
evaporation and evapotranspiration of plants, shading by
trees and man-made objects, and ground surface cover
such as natural grass and artificial paving, etc.
Outdoor spaces provide a pleasurable thermal comfort
experience for people and effectively improve the quality
of urban living. People experience different thermal
sensation while carrying out the outdoor activities in
streets, plazas, playgrounds, urban parks, etc.
Tab. 1
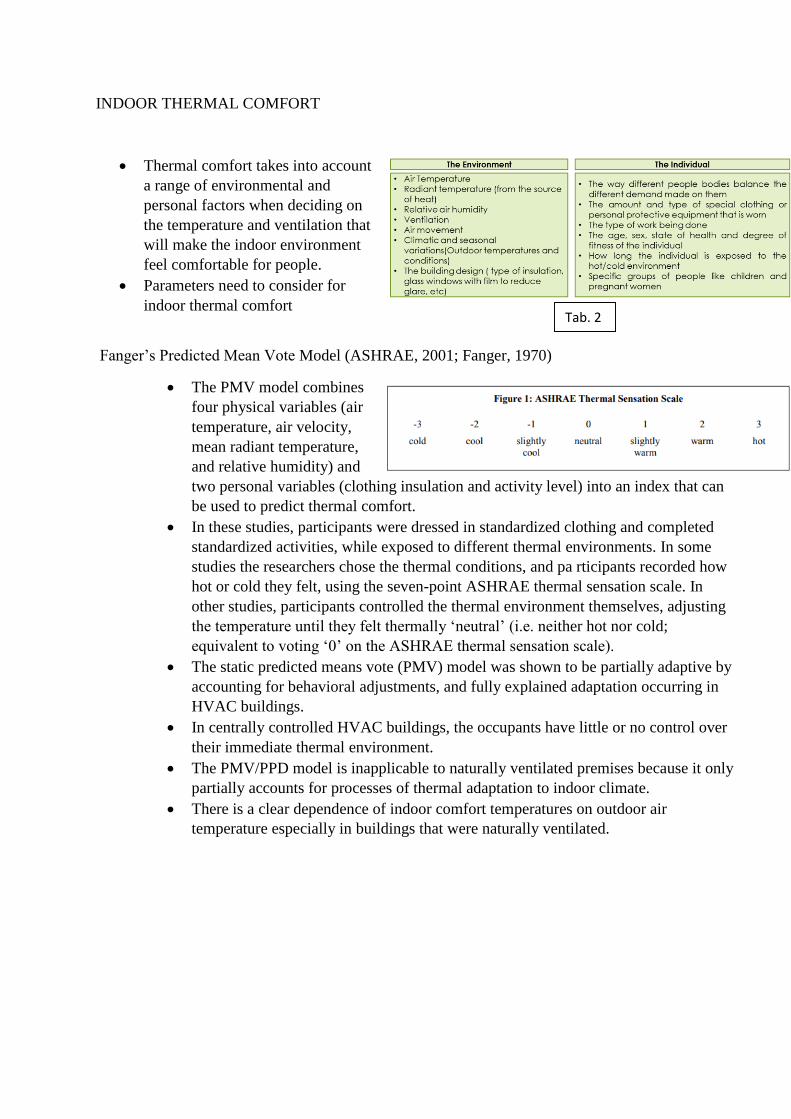
INDOOR THERMAL COMFORT
Thermal comfort takes into account
a range of environmental and
personal factors when deciding on
the temperature and ventilation that
will make the indoor environment
feel comfortable for people.
Parameters need to consider for
indoor thermal comfort
Fanger’s Predicted Mean Vote Model (ASHRAE, 2001; Fanger, 1970)
The PMV model combines
four physical variables (air
temperature, air velocity,
mean radiant temperature,
and relative humidity) and
two personal variables (clothing insulation and activity level) into an index that can
be used to predict thermal comfort.
In these studies, participants were dressed in standardized clothing and completed
standardized activities, while exposed to different thermal environments. In some
studies the researchers chose the thermal conditions, and pa rticipants recorded how
hot or cold they felt, using the seven-point ASHRAE thermal sensation scale. In
other studies, participants controlled the thermal environment themselves, adjusting
the temperature until they felt thermally ‘neutral’ (i.e. neither hot nor cold;
equivalent to voting ‘0’ on the ASHRAE thermal sensation scale).
The static predicted means vote (PMV) model was shown to be partially adaptive by
accounting for behavioral adjustments, and fully explained adaptation occurring in
HVAC buildings.
In centrally controlled HVAC buildings, the occupants have little or no control over
their immediate thermal environment.
The PMV/PPD model is inapplicable to naturally ventilated premises because it only
partially accounts for processes of thermal adaptation to indoor climate.
There is a clear dependence of indoor comfort temperatures on outdoor air
temperature especially in buildings that were naturally ventilated.
Tab. 2

1
SCHOOL OF BUILDING AND ENVIRONMENT
DEPARTMENT OF ARCHITECTURE
UNIT 2 – CLASSIFICATION OF CLIMATE – SAR1204
2
Unit II: CLASSIFICATION OF CLIMATE
KOPPEN CLIMATE CLASSIFICATION SYSTEM
ATKINSON CLIMATE CLASSIFICATION
CHARACTERISTICS OF TROPICAL CLIMATE
PARAMETERS AFFECTING CLIMATE ZONES
Latitude
Altitude
Low and high pressure zones
Global wind patterns
Proximity to oceans and large seas
Ocean currents
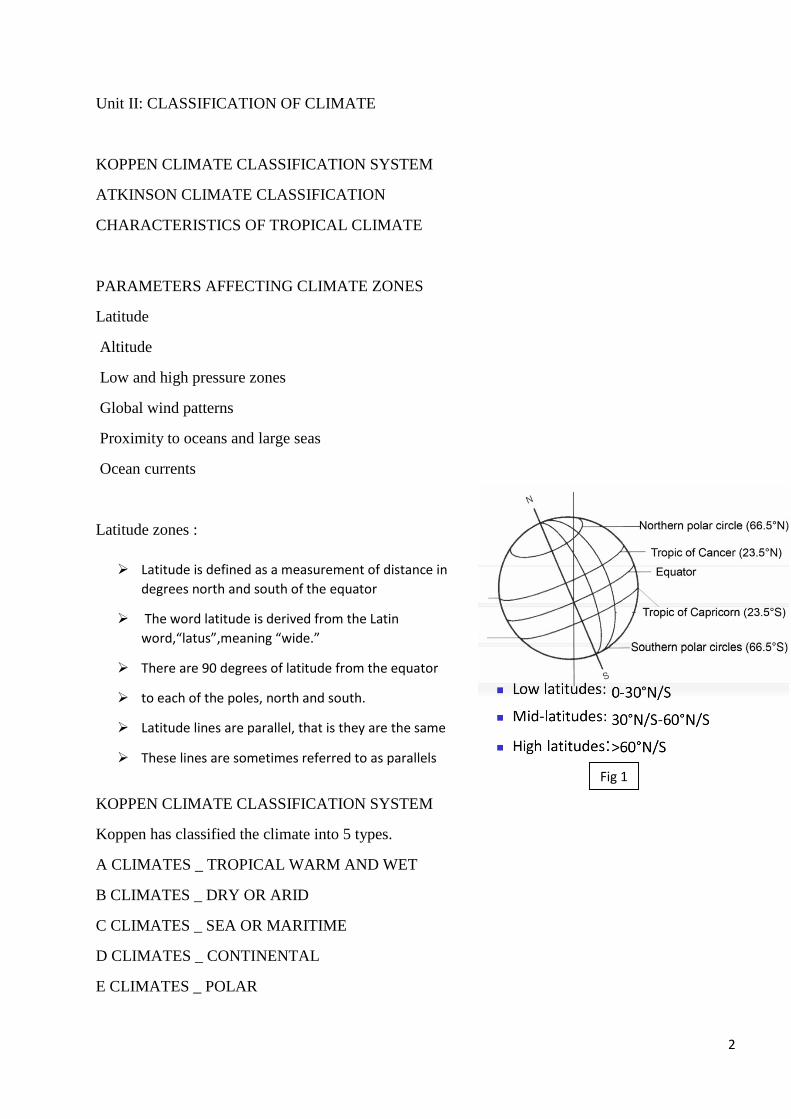
Latitude zones :
KOPPEN CLIMATE CLASSIFICATION SYSTEM
Koppen has classified the climate into 5 types.
A CLIMATES _ TROPICAL WARM AND WET
B CLIMATES _ DRY OR ARID
C CLIMATES _ SEA OR MARITIME
D CLIMATES _ CONTINENTAL
E CLIMATES _ POLAR
Latitude is defined as a measurement of distance in
degrees north and south of the equator
The word latitude is derived from the Latin
word,“latus”,meaning “wide.”
There are 90 degrees of latitude from the equator
to each of the poles, north and south.
Latitude lines are parallel, that is they are the same
These lines are sometimes referred to as parallels
Fig 1
3
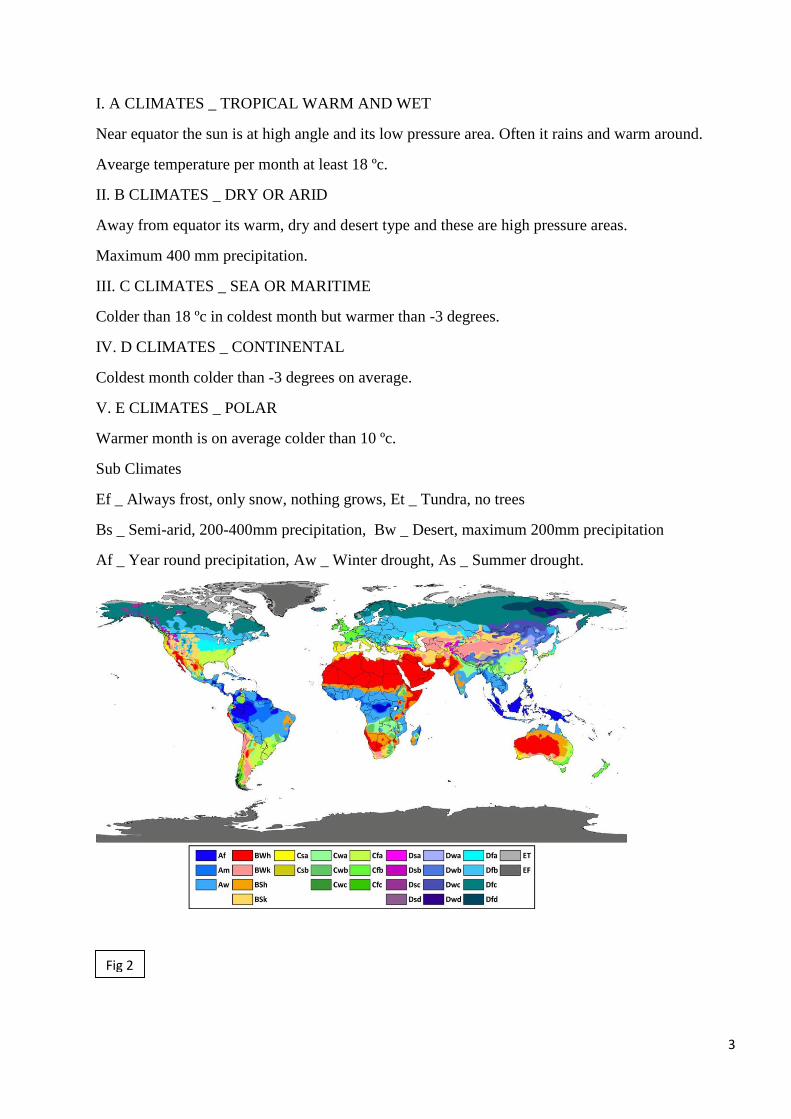
I. A CLIMATES _ TROPICAL WARM AND WET
Near equator the sun is at high angle and its low pressure area. Often it rains and warm around.
Avearge temperature per month at least 18 ºc.
II. B CLIMATES _ DRY OR ARID
Away from equator its warm, dry and desert type and these are high pressure areas.
Maximum 400 mm precipitation.
III. C CLIMATES _ SEA OR MARITIME
Colder than 18 ºc in coldest month but warmer than -3 degrees.
IV. D CLIMATES _ CONTINENTAL
Coldest month colder than -3 degrees on average.
V. E CLIMATES _ POLAR
Warmer month is on average colder than 10 ºc.
Sub Climates
Ef _ Always frost, only snow, nothing grows, Et _ Tundra, no trees
Bs _ Semi-arid, 200-400mm precipitation, Bw _ Desert, maximum 200mm precipitation
Af _ Year round precipitation, Aw _ Winter drought, As _ Summer drought.
Fig 2
4
Fig 2
5
Fig 3
6
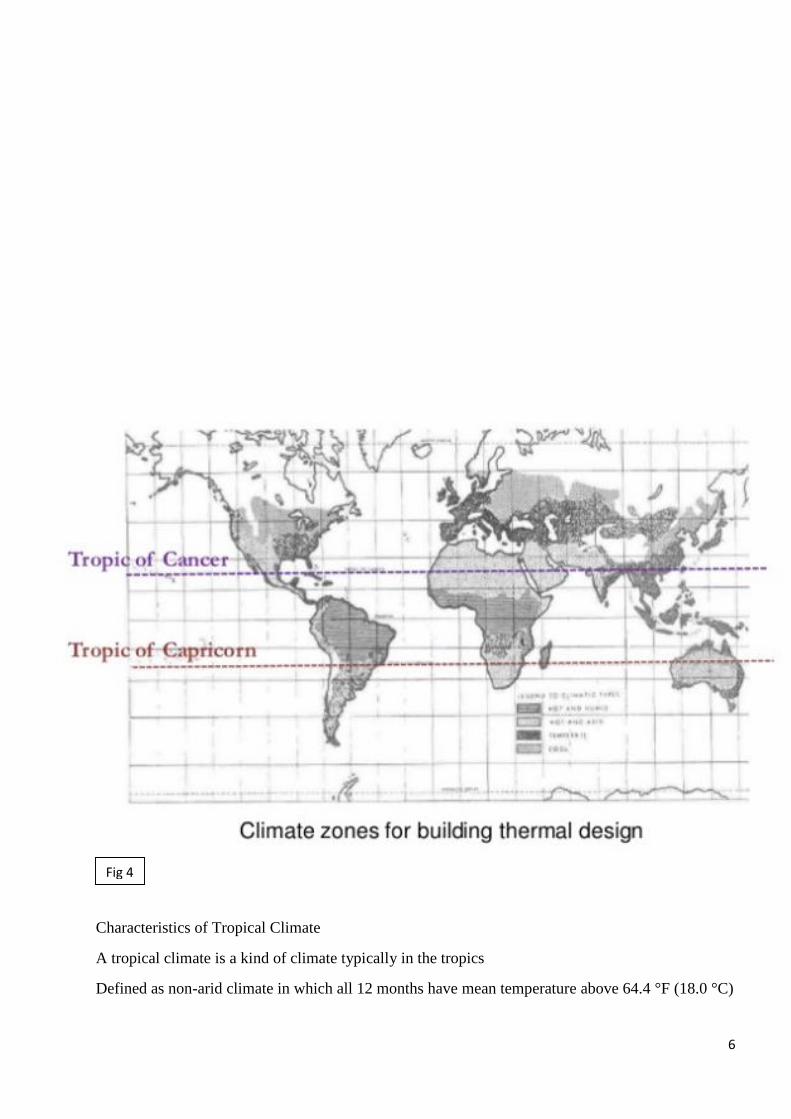
Characteristics of Tropical Climate
A tropical climate is a kind of climate typically in the tropics
Defined as non-arid climate in which all 12 months have mean temperature above 64.4 °F (18.0 °C)
Fig 4
7
Cover the largest area of earth (20% of land surface and 43% of ocean surface) - the home to almost
half of the world ’s population
South Florida, The Caribbean, Central Africa, Coastal India, Southeast Asia, North Queensland,
Hawaii, Central America, or most of Brazil.
A tropical climate is a kind of climate typically in the tropics
Defined as non-arid climate in which all 12 months have mean temperature above 64.4 °F (18.0 °C)
Cover the largest area of earth (20% of land surface and 43% of ocean surface) - the home to almost
half of the world ’s population
South Florida, The Caribbean, Central Africa, Coastal India, Southeast Asia, North Queensland,
Hawaii, Central America, or most of Brazil.
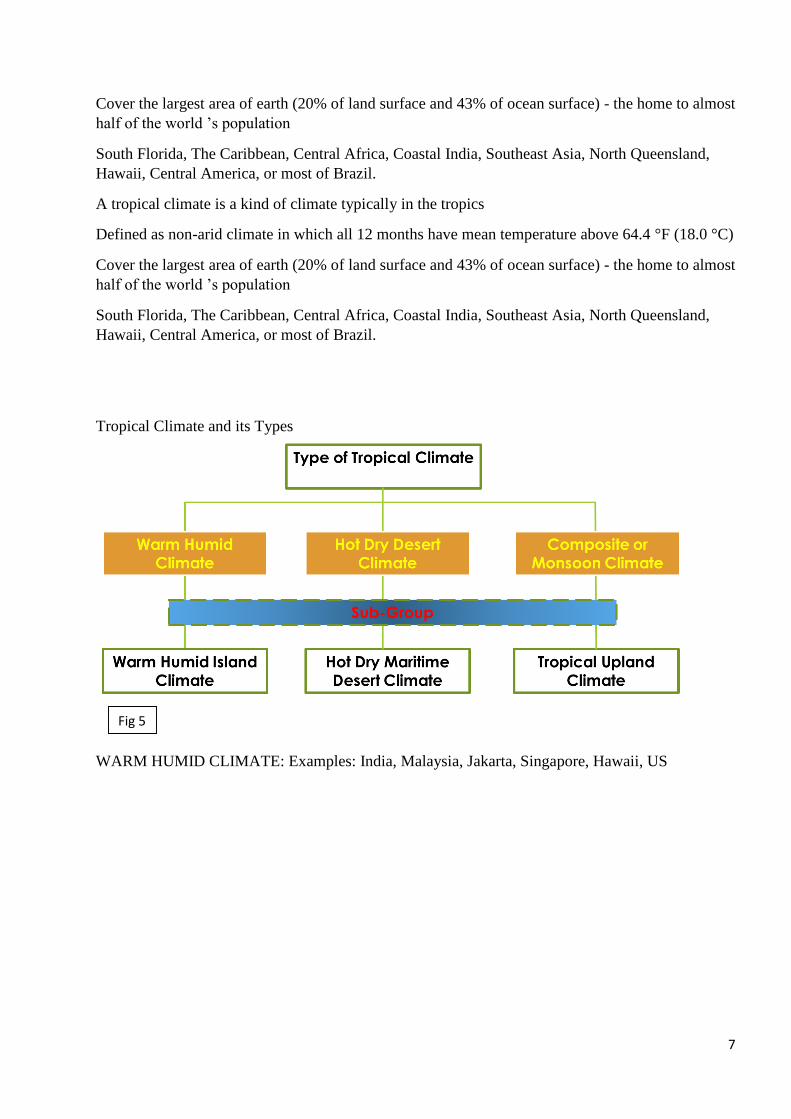
Tropical Climate and its Types
WARM HUMID CLIMATE: Examples: India, Malaysia, Jakarta, Singapore, Hawaii, US
Fig 5

8
WARM HUMID ISLAND CLIMATE
CARIBBEAN
Philippine
Fig 6
9
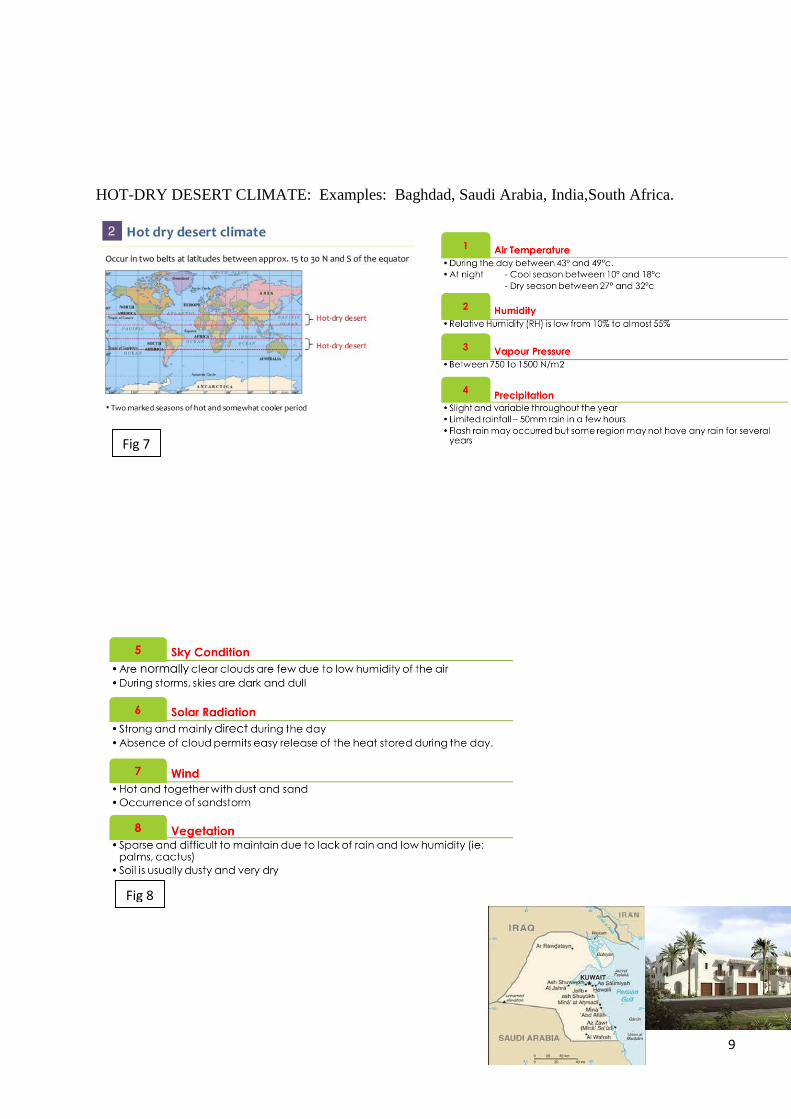
HOT-DRY DESERT CLIMATE: Examples: Baghdad, Saudi Arabia, India,South Africa.
Fig 7
Fig 8
10
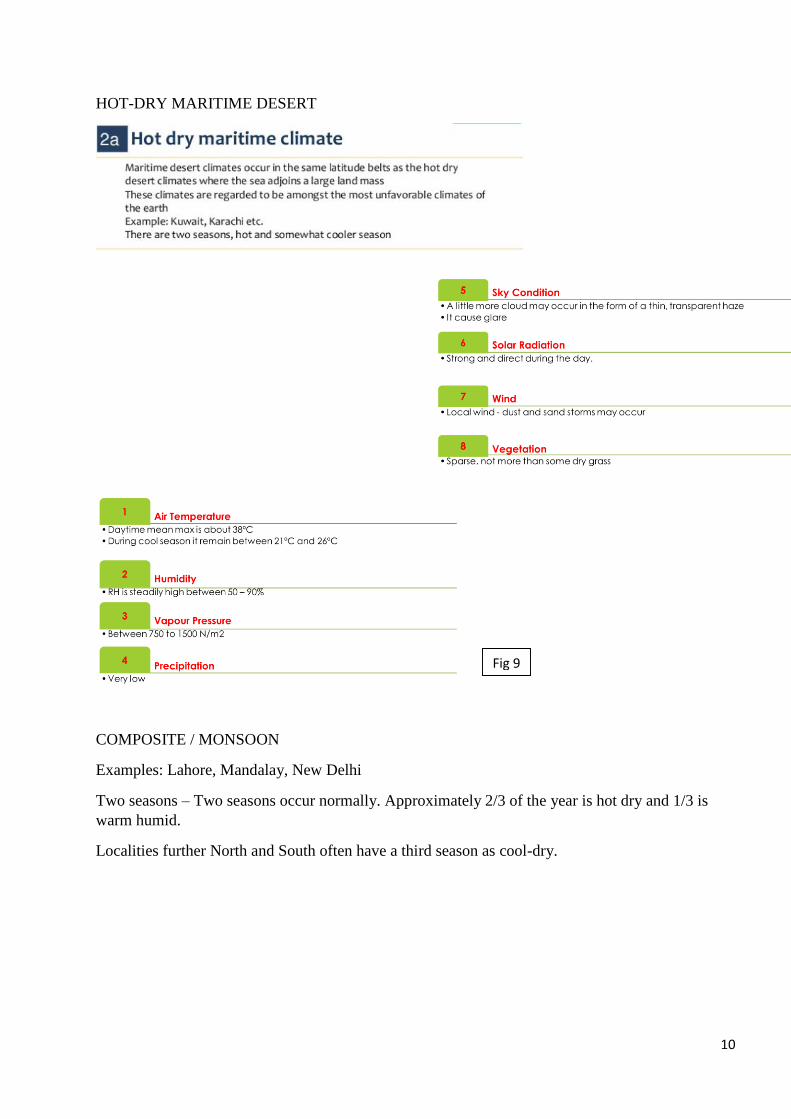
HOT-DRY MARITIME DESERT
COMPOSITE / MONSOON
Examples: Lahore, Mandalay, New Delhi
Two seasons – Two seasons occur normally. Approximately 2/3 of the year is hot dry and 1/3 is
warm humid.
Localities further North and South often have a third season as cool-dry.
Fig 9
11
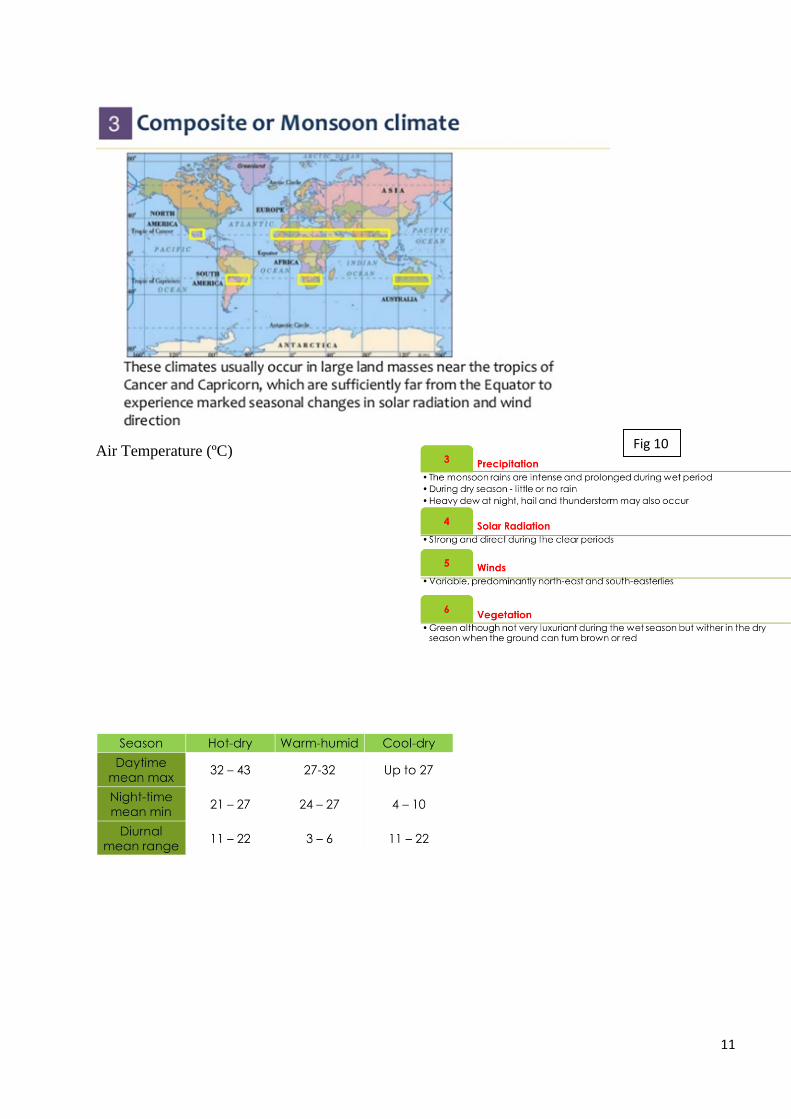
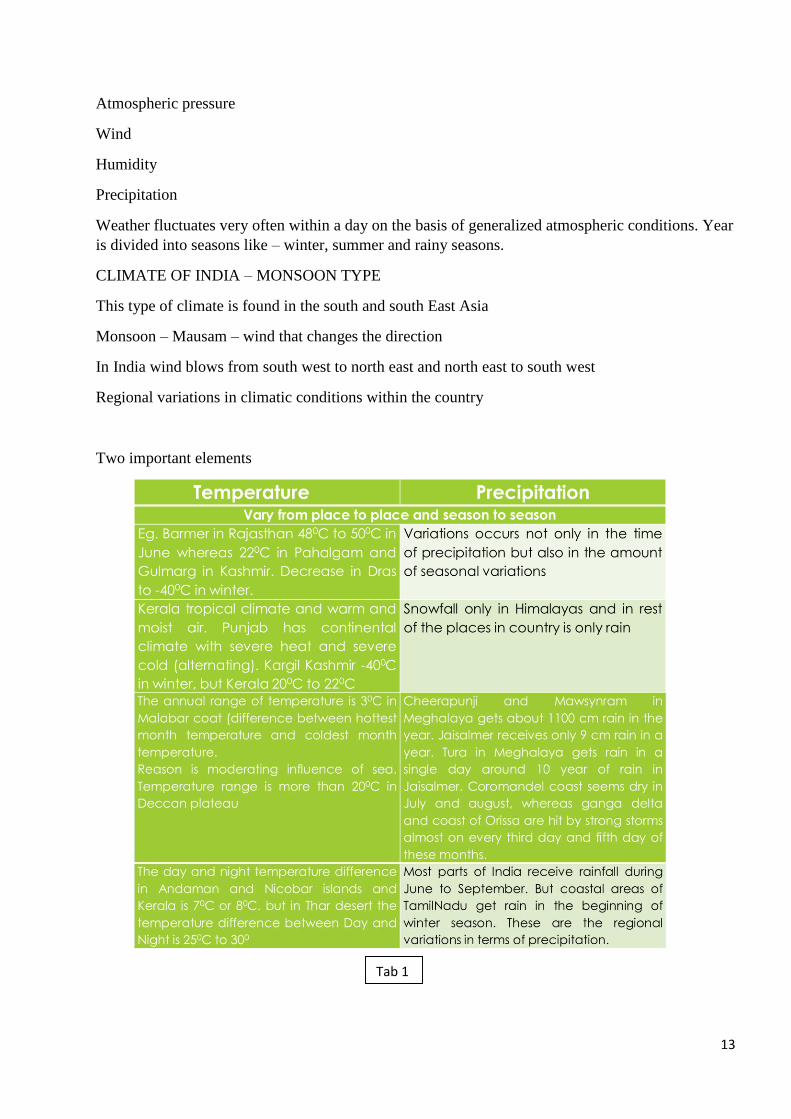
Air Temperature (ºC)
Fig 10
12
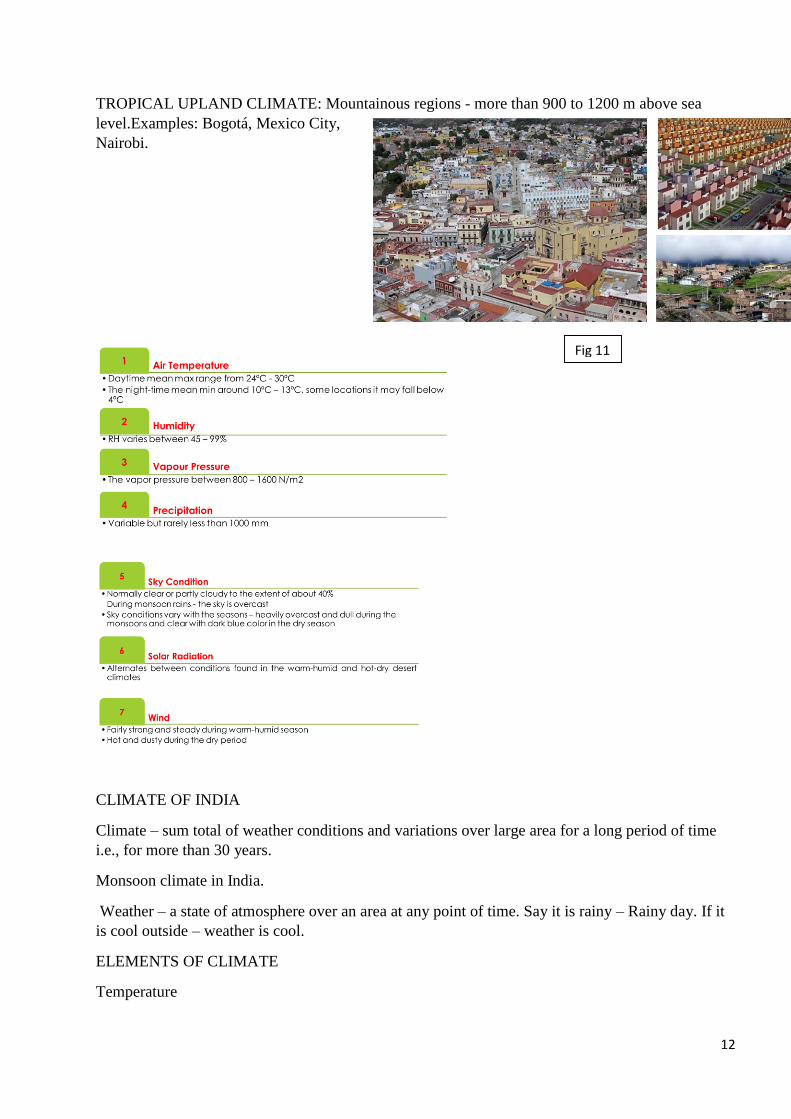
TROPICAL UPLAND CLIMATE: Mountainous regions - more than 900 to 1200 m above sea
level.Examples: Bogotá, Mexico City,
Nairobi.
CLIMATE OF INDIA
Climate – sum total of weather conditions and variations over large area for a long period of time
i.e., for more than 30 years.
Monsoon climate in India.
Weather – a state of atmosphere over an area at any point of time. Say it is rainy – Rainy day. If it
is cool outside – weather is cool.
ELEMENTS OF CLIMATE
Temperature
Fig 11
13
Atmospheric pressure
Wind
Humidity
Precipitation
Weather fluctuates very often within a day on the basis of generalized atmospheric conditions. Year
is divided into seasons like – winter, summer and rainy seasons.
CLIMATE OF INDIA – MONSOON TYPE
This type of climate is found in the south and south East Asia
Monsoon – Mausam – wind that changes the direction
In India wind blows from south west to north east and north east to south west
Regional variations in climatic conditions within the country
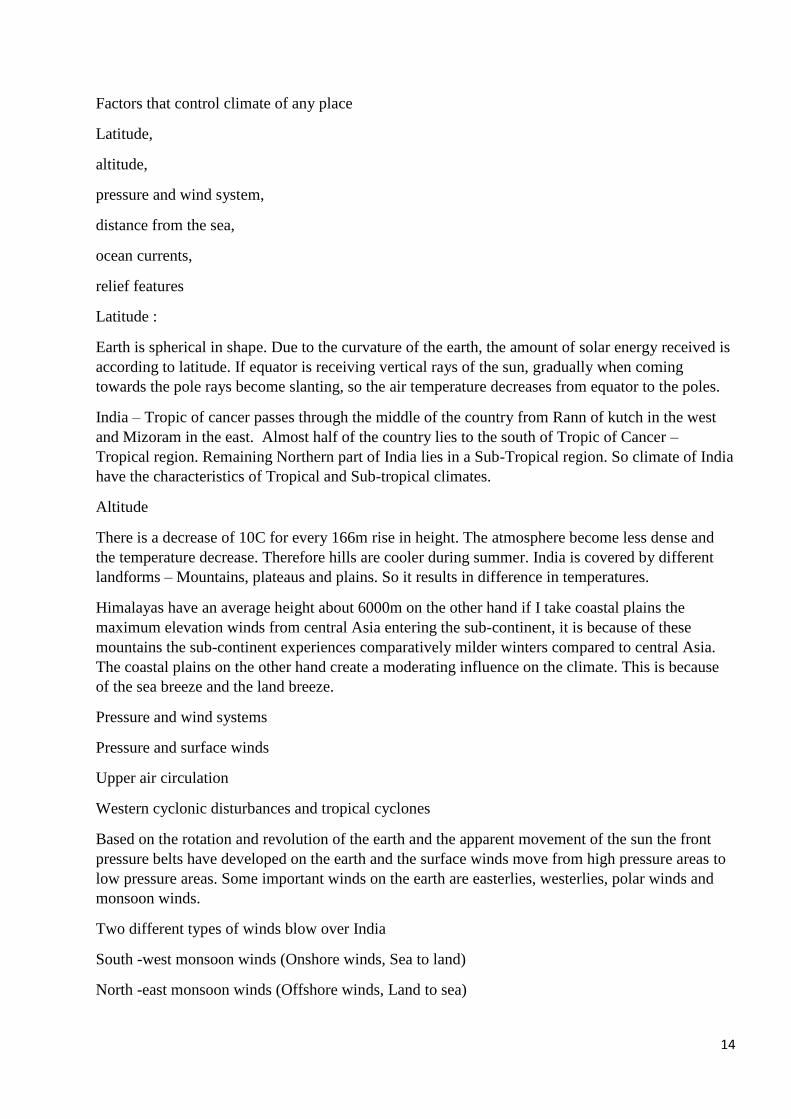
Two important elements
Tab 1
14
Factors that control climate of any place
Latitude,
altitude,
pressure and wind system,
distance from the sea,
ocean currents,
relief features
Latitude :
Earth is spherical in shape. Due to the curvature of the earth, the amount of solar energy received is
according to latitude. If equator is receiving vertical rays of the sun, gradually when coming
towards the pole rays become slanting, so the air temperature decreases from equator to the poles.
India – Tropic of cancer passes through the middle of the country from Rann of kutch in the west
and Mizoram in the east. Almost half of the country lies to the south of Tropic of Cancer –
Tropical region. Remaining Northern part of India lies in a Sub-Tropical region. So climate of India
have the characteristics of Tropical and Sub-tropical climates.
Altitude
There is a decrease of 10C for every 166m rise in height. The atmosphere become less dense and
the temperature decrease. Therefore hills are cooler during summer. India is covered by different
landforms – Mountains, plateaus and plains. So it results in difference in temperatures.
Himalayas have an average height about 6000m on the other hand if I take coastal plains the
maximum elevation winds from central Asia entering the sub-continent, it is because of these
mountains the sub-continent experiences comparatively milder winters compared to central Asia.
The coastal plains on the other hand create a moderating influence on the climate. This is because
of the sea breeze and the land breeze.
Pressure and wind systems
Pressure and surface winds
Upper air circulation
Western cyclonic disturbances and tropical cyclones
Based on the rotation and revolution of the earth and the apparent movement of the sun the front
pressure belts have developed on the earth and the surface winds move from high pressure areas to
low pressure areas. Some important winds on the earth are easterlies, westerlies, polar winds and
monsoon winds.
Two different types of winds blow over India
South -west monsoon winds (Onshore winds, Sea to land)
North -east monsoon winds (Offshore winds, Land to sea)
15
Deflect
Right in Northern hemisphere
Left in Southern hemisphere
The reason behind is Coriolis force
Coriolis force – it is an apparent force caused by earth’s rotation. The earth rotates from west to east
at a speed of 1600 km/hr, the coriolis force is responsible for deflecting winds towards right in
northern hemisphere and towards left in the southern hemisphere. This is also known as the Ferals
law.
The pressure and wind conditions over india are unique. During winter there is a high pressure area
north of Himalayas, cold dry winds blow from these regions to the low pressure areas over the
oceans to the south. In summer low pressure area develops over the interior Asia and North western
India causes a complete reversal of the direction of winds during summer.
They are most from high pressure area over southern Indian Ocean in a south easterly direction
crossing the equator and turn right towards the low pressure area over the Indian sub-continent.
These are known as south-west monsoon winds and these winds blow over the warm oceans
gathering moisture and bringing wide spread rainfall over the main land of India.
The upper air circulation in this region is dominated by westerly flow an important component of
this is Jet streams. It refers to winds that flow at a great speed. These jet streams are located
approximately over 27-300 N and S lalitude and therefore they are known as sub-tropical westerly
jet streams. Over India these jet streams blow south of Himalayas although the year except summer.
Then the western cyclonic disturbances, now these are experienced in north and the North western
part of the country and they are brought down by the westerly flow. In summer the sub-tropical
westerly jet streams move north of Himalayas with the apparent movement of the sun. And the
easterly jet streams called the tropical easterly jet streams blow over peninsular India. This is
approximately over 140N during summer months.
Now the western disturbances are weather phenomena brought in by westerly flow from the
Mediterranean region. They occur in the months of winter and cause rainfall in North and North
western part of India. The moisture in these storms usually originate over the Mediterranean sea
and the Atlantic ocean, and they travel towards east. Although the amount of rainfall is meager it is
highly beneficial to rabi crops especially wheat, now the same winds cause snowfall in the
mountains.
Distance from the Sea
Now the sea exerts a moderating influence on climate.
During the day time both the land and sea gets heated. The land gets heated more than the sea, so at
land the temperature is high, pressure is low and in water bodies temperature is relatively low,
pressure is high. So wind starts blowing from sea to land (SEA BREEZE)-coastal area.
At night land gets cooler than the sea, so at the land the temperature is low and the pressure is high,
so the wind starts blowing from land towards sea (LAND BREEZE)
16
Relief Features
Relief is variations in height (Climate of a place)
In Mountain – Relief is high
In Plateau / plains – Relief is relatively low.
High barriers for cold and hot winds cause precipitation if high enough to lie in path of rain bearing
winds.
Leeward side of the mountains remains dry. The Western Ghats obstructs the south west monsoon
winds and they are responsible for heavy rainfall along the western coast.
Deccan plateau form the leeward side, where there is relatively low rainfall.

1
SCHOOL OF BUILDING AND ENVIRONMENT
DEPARTMENT OF ARCHITECTURE
UNIT 3 – Thermal property of building envelope – SAR1204
2
TEMPERATURE
HEAT & SPECIFIC HEAT
CONDUCTIVITY AND RELAVANCE OF DENSITY
CONDUCTANCE AND SURFACE CONDUCTANCE
TRANSMITTANCE
CAVITIES
CONVECTION
RADIATION
SOL AIR TEMPERATURE
SOLAR GAIN FACTOR
a) TEMPERATURE
It is an outward appearance of the thermal state of a body
Measured in CELCIUS SCALE
Temperature of an object is º c but an interval or difference is deg C
Absolute Zero kelvin = -273.15ºC
b) HEAT
It is a form of energy with certain electromagnetic radiation (700-10000nm)
Measured in joules (J)
1 BTU = 1055.06J
c) SPECIFIC HEAT
Amount of heat energy necessary to cause unit temperature increase of a unit mass of
substance
Measured in j/kg degC
d) LATENT HEAT
Is the amount of heat energy absorbed by unit mass of the substance at change of
state without any change in temperature
Measured in j/kg
Latent heat of water
Of fusion 0º C ice to water = 335 kj/kg
Of evaporation 100ºC = 2261kj/kg
e) CONDUCTIVITY AND RELAVANCE OF DENSITY
The rate of heat flow through varies with different material and is described as a property
of the material - its thermal conductivity or k-value
Conductivity is defined as the rate of heat flow through unit area of unit thickness of the
material when there is unit temperature difference between the two sides.
The unit of measurement is W/m deg C
Its value varies between 0.03 W/m deg C for insulating materials and up to 400 W/m deg C
for metals
The lower the conductivity the better the insulator a material is.
Resistivity is the reciprocal of this quantity (1/k) measured in units of m degC/W. Better
insulators will have higher resistivity values.
Density is often an indicator of conductivity, higher density materials have higher k-value
but it might not always be true.
3
The relationship is due to the fact that air has very low conductivity value , and as
lightweight materials tend to be porous, thus containing more air, their conductivity tends
to be less.
f) CONDUCTANCE AND SURFACE CONDUCTANCE
Conductance is the heat flow rate through a unit area of the body when the temperature
difference between the two surfaces is 1 deg C. The unit measurement is W/m2 degC
Thermal conduction is the process of heat transfer from one part of a body at a higher
temperature to another (or between bodies in direct contact) at a lower temperature.
This happens with negligible movement of the molecules in the body, because the heat is
transferred from one molecule to another in contact with it.
While conductivity and resistivity are properties of a material, the corresponding
properties of body of a given thickness are described as conductance ( C ) or its reciprocal,
resistance ( R ): C=1/R
Resistance of a body is the product of its thickness and the resistivity of its material and its
unit measurement is m2 deg C/W
R=bx1/k= b/k where b is the thickness in meters.
g) SURFACE CONDUCTANCE
In addition to the resistance of a body to the flow of heat, a resistance will be offered by its
surfaces, where a thin layer of film separates the body from the surrounding air.
A measure of this is the surface or film resistance, denoted by 1/f (m2 deg C/W) f being the
surface or film conductance (W/m2 deg C)
Surface conductance includes the convective and the radiant components of the heat
exchange at surfaces.
If the heat flow from air on one side through the body, to air or the other side is
considered, both surface resistances must be taken in to account.
The overall air-to-air resistance ( Ra)is the sum of the body's resistance and the surface
resistances.
Ra =1/fi +Rb+1/f0
where 1/fi= internal surface resistance
Rb = Resistance of the body
1/f0 =External surface resistance
h) TRANSMITTANCE
o The reciprocal of this air-to -air resistance is the air-to-air transmittance or U-value
U=1/Ra
o Its unit of measurement is the same as for conductance - W/m2 degC.
o This is the quantity most often used in building heat loss and heat gain problems, as its use
greatly simplifies the calculations.
THERMAL COMFORT FACTORS AND INDICES
TEMPERATURE
HEAT & SPECIFIC HEAT
CONDUCTIVITY AND RELAVANCE OF DENSITY
CONDUCTANCE AND SURFACE CONDUCTANCE
TRANSMITTANCE
4
CAVITIES
CONVECTION
RADIATION
SOL AIR TEMPERATURE
SOLAR GAIN FACTOR
CAVITIES
If an air space or cavity is enclosed within a body, through which heat transfer is considered,
this will offer another barrier to the passage of heat.
It is measured as the cavity Resistance (Rc).
The reciprocal of this value is the cavity conductance.
Almost the value for an empty cavity may be the sum of internal and external surface
resistances. It is less if the cavity is less than 50 mm or if strong convection currents can
develop inside the cavity.
An unventilated cavity is a good insulator (R=0.15 m2degC/W),equal to about 180 mm brick
wall.
The inner leaf of the wall should be the main mass (eg.230mm brick wall) as the insulation
should happen outside the main mass and the outer leaf should be the lesser dense mass (ex
hollow blocks) reducing the conductivity thereby improving insulation
CONVECTION
Convection (The transfer of heat by bodily movement of a carrying medium), may be due to
thermal forces alone (Self generating) or may be propelled by an applied force.
The rate of transfer in convection depends on three factor:
Temperature difference
The rate of movement of the carrying medium in terms of kg/s or m3/s
The specific heat of the carrying medium in J/kg deg C or J/m3 deg C
These quantities will be used in ventilation heat loss or cooling calculations.
RADIATION
The rate of heat flow depends on temperatures of the emitting and receiving surfaces and on
certain qualities of these surfaces - the emittance and absorbance.
Radiation received by a surface can be partly absorbed and partly reflected: the proportion of
these two components is expressed by the coefficients absorbance (a) and reflectance (r) .The
sum of these two coefficients is always 1
Light coloured ,smooth and shiny surfaces tend to have a high reflectance and dark surfaces
tend to have high absorbance.
The theoretical white body is a perfect reflector with coefficients a=0 and r=1 while the
theoretical black body is a perfect absorber with coefficients a=1 and r=0
The practical significance of this is that both light coloured surface and dark coloured surface
when exposed to solar radiation will reflect and absorb same amount of heat but the light
coloured surface will re-emit much of the absorbed heat where as the dark surface will not and
therefore will attain a high temperature.
SOL AIR TEMPERATURE
5
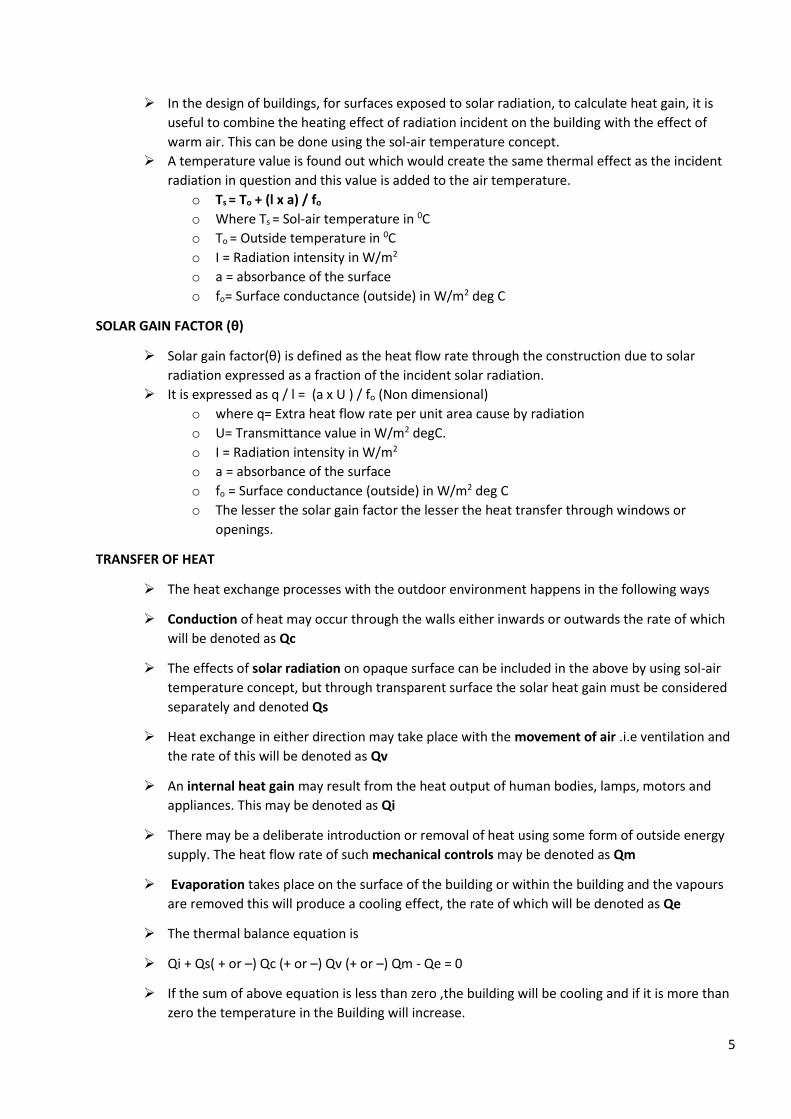
In the design of buildings, for surfaces exposed to solar radiation, to calculate heat gain, it is
useful to combine the heating effect of radiation incident on the building with the effect of
warm air. This can be done using the sol-air temperature concept.
A temperature value is found out which would create the same thermal effect as the incident
radiation in question and this value is added to the air temperature.
o Ts = To + (l x a) / fo
o Where Ts = Sol-air temperature in 0C
o To = Outside temperature in 0C
o I = Radiation intensity in W/m2
o a = absorbance of the surface
o fo= Surface conductance (outside) in W/m2 deg C
SOLAR GAIN FACTOR (θ)
Solar gain factor(θ) is defined as the heat flow rate through the construction due to solar
radiation expressed as a fraction of the incident solar radiation.
It is expressed as q / l = (a x U ) / fo (Non dimensional)
o where q= Extra heat flow rate per unit area cause by radiation
o U= Transmittance value in W/m2 degC.
o I = Radiation intensity in W/m2
o a = absorbance of the surface
o fo = Surface conductance (outside) in W/m2 deg C
o The lesser the solar gain factor the lesser the heat transfer through windows or
openings.
TRANSFER OF HEAT
The heat exchange processes with the outdoor environment happens in the following ways
Conduction of heat may occur through the walls either inwards or outwards the rate of which
will be denoted as Qc
The effects of solar radiation on opaque surface can be included in the above by using sol-air
temperature concept, but through transparent surface the solar heat gain must be considered
separately and denoted Qs
Heat exchange in either direction may take place with the movement of air .i.e ventilation and
the rate of this will be denoted as Qv
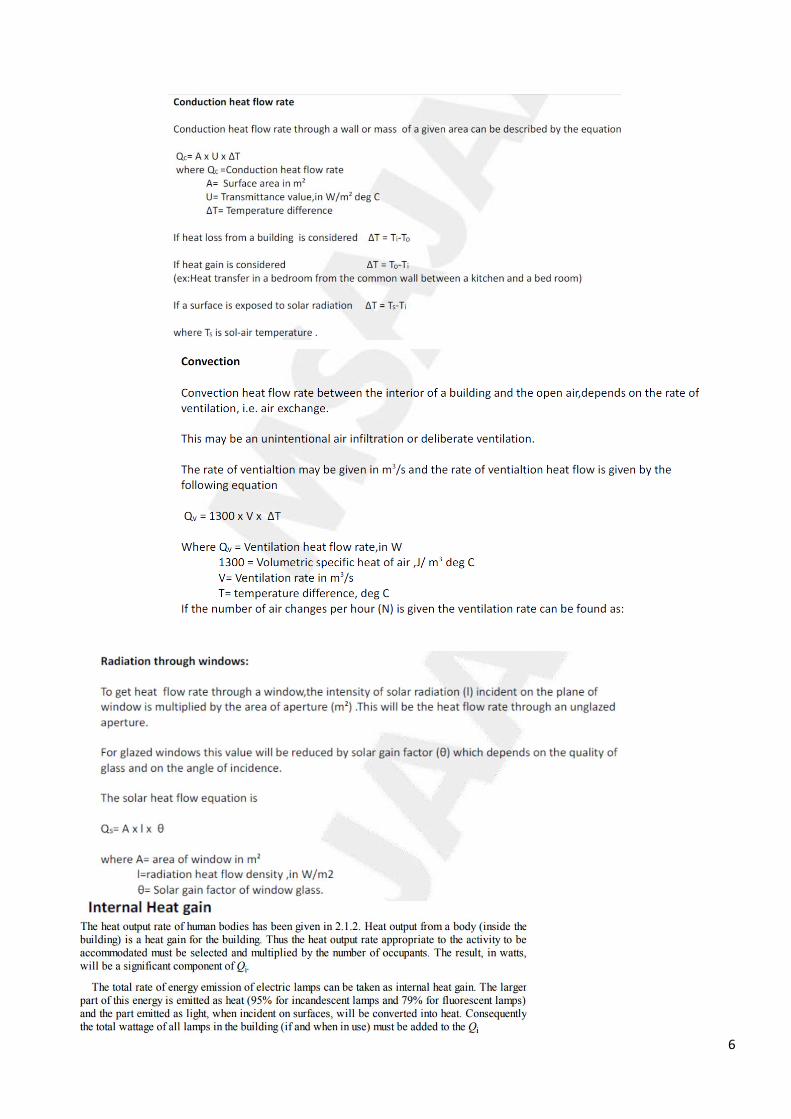
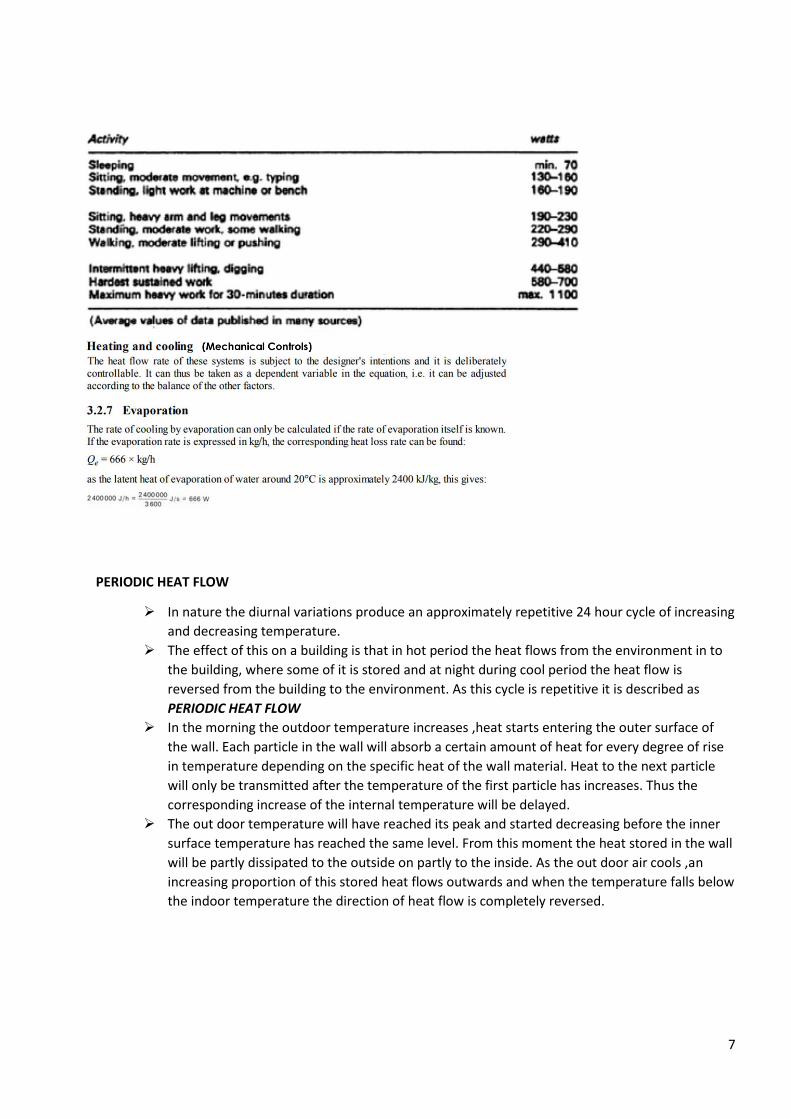
An internal heat gain may result from the heat output of human bodies, lamps, motors and
appliances. This may be denoted as Qi
There may be a deliberate introduction or removal of heat using some form of outside energy
supply. The heat flow rate of such mechanical controls may be denoted as Qm
Evaporation takes place on the surface of the building or within the building and the vapours
are removed this will produce a cooling effect, the rate of which will be denoted as Qe
The thermal balance equation is
Qi + Qs( + or –) Qc (+ or –) Qv (+ or –) Qm - Qe = 0
If the sum of above equation is less than zero ,the building will be cooling and if it is more than
zero the temperature in the Building will increase.
6
7
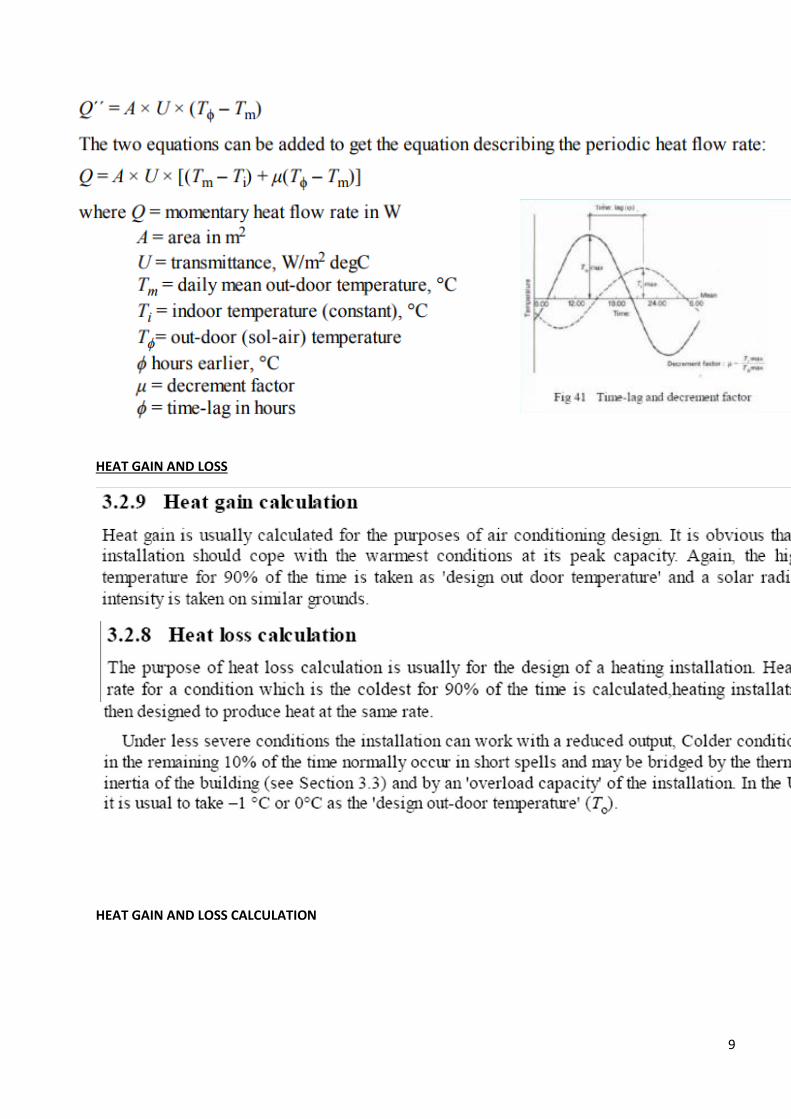
PERIODIC HEAT FLOW
In nature the diurnal variations produce an approximately repetitive 24 hour cycle of increasing
and decreasing temperature.
The effect of this on a building is that in hot period the heat flows from the environment in to
the building, where some of it is stored and at night during cool period the heat flow is
reversed from the building to the environment. As this cycle is repetitive it is described as
PERIODIC HEAT FLOW
In the morning the outdoor temperature increases ,heat starts entering the outer surface of
the wall. Each particle in the wall will absorb a certain amount of heat for every degree of rise
in temperature depending on the specific heat of the wall material. Heat to the next particle
will only be transmitted after the temperature of the first particle has increases. Thus the
corresponding increase of the internal temperature will be delayed.
The out door temperature will have reached its peak and started decreasing before the inner
surface temperature has reached the same level. From this moment the heat stored in the wall
will be partly dissipated to the outside on partly to the inside. As the out door air cools ,an
increasing proportion of this stored heat flows outwards and when the temperature falls below
the indoor temperature the direction of heat flow is completely reversed.
8
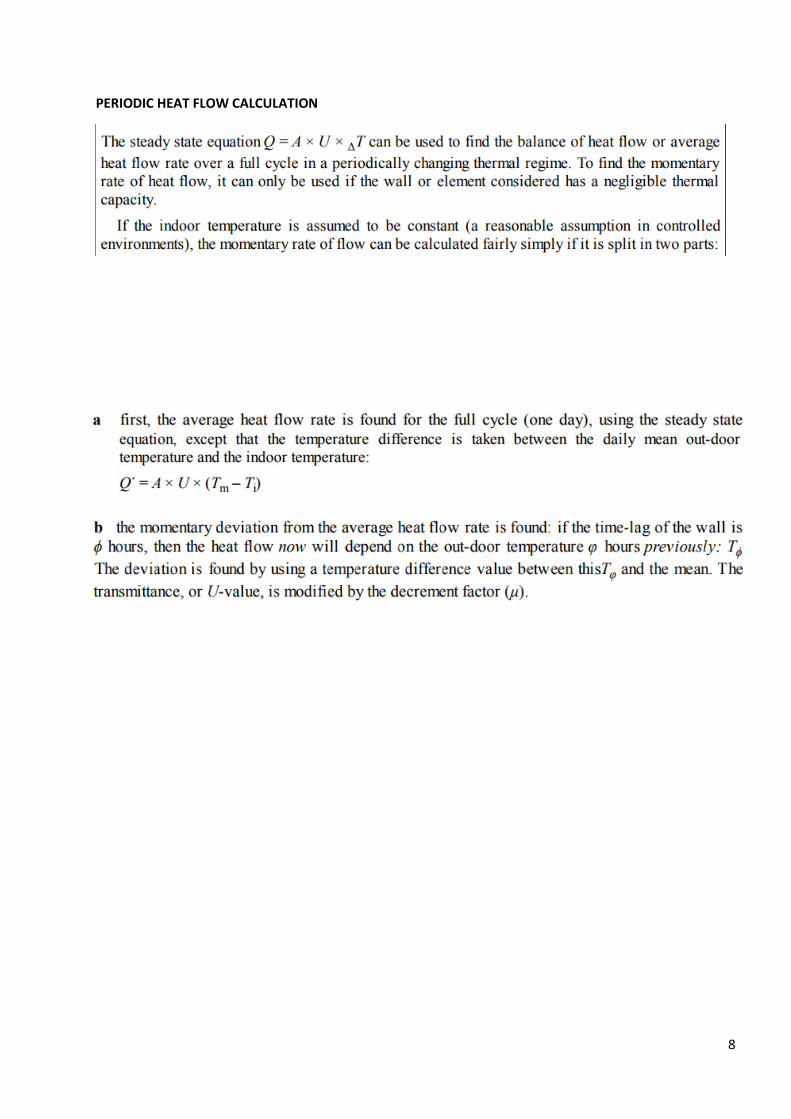
PERIODIC HEAT FLOW CALCULATION
9
HEAT GAIN AND LOSS
HEAT GAIN AND LOSS CALCULATION
10
11
12
13
THERMAL MASS AND THERMAL CAPACITY
The thermal mass of the house is a measure of its capacity to store and regulate internal heat.
Buildings with a high thermal mass take a long time to heat up but also take a long time to cool
down.
As a result they have a very steady internal temperature. This is sometimes called the thermal
flywheel effect because, like a flywheel, the thermal mass can store and even out fluctuations
in temperature.
Buildings with a low thermal mass are very responsive to changes in internal temperature -
they heat up very quickly but they also cool down quickly. They are often subject to wide
variables in internal temperature.
Everything inside the house contributes to its thermal mass according to its capacity to absorb
and store heat, known as its 'thermal capacity'.
The best materials for storing heat are those that are very dense, heat up slowly, and then give
out that heat gradually. Brick, concrete and stone have a high thermal capacity and are the
main contributors to the thermal mass of a house.
Water has a very high thermal capacity, so it is well suited for climates that have high diurnal
variations. Air has a very low thermal capacity - it warms up fast but cannot stay warm for long.
14
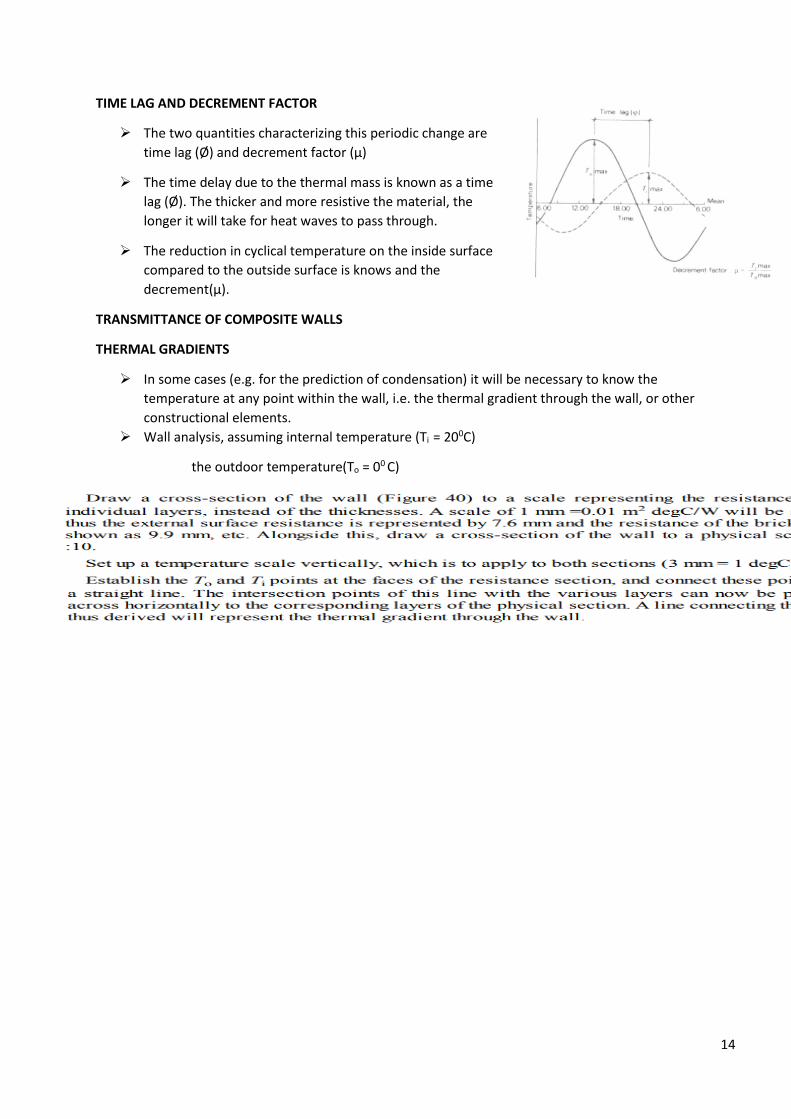
TIME LAG AND DECREMENT FACTOR
The two quantities characterizing this periodic change are
time lag (Ø) and decrement factor (μ)
The time delay due to the thermal mass is known as a time
lag (Ø). The thicker and more resistive the material, the
longer it will take for heat waves to pass through.
The reduction in cyclical temperature on the inside surface
compared to the outside surface is knows and the
decrement(μ).
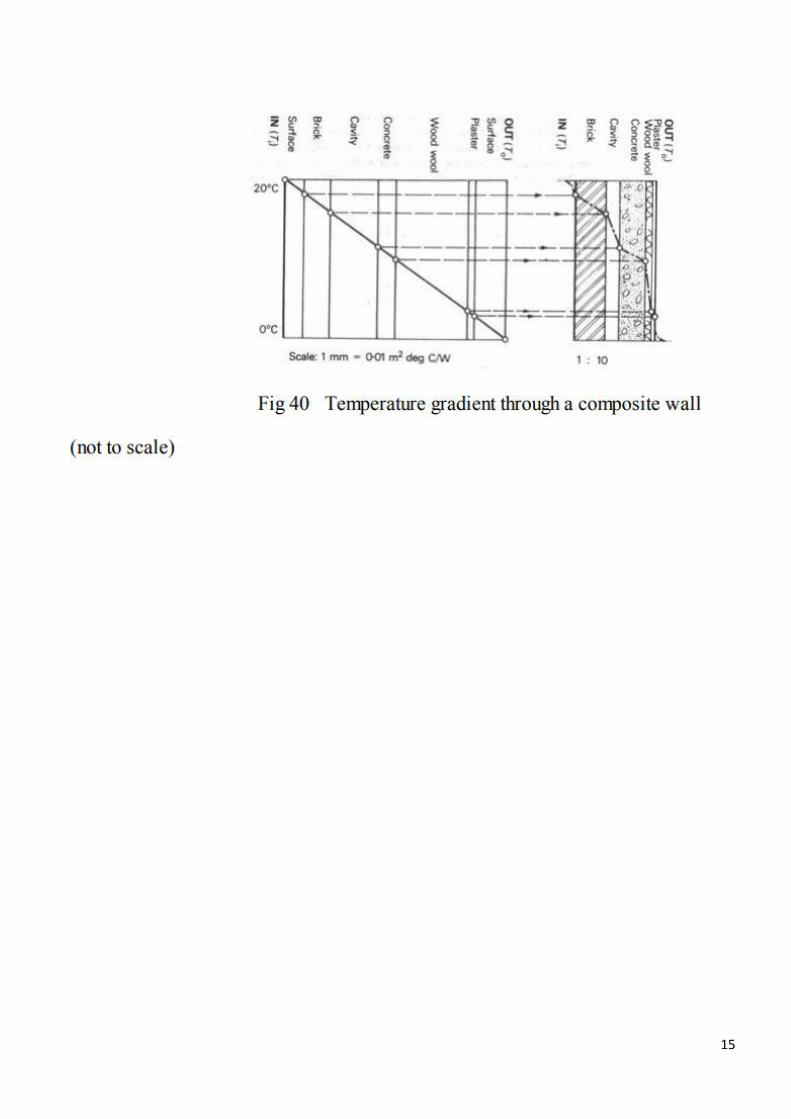
TRANSMITTANCE OF COMPOSITE WALLS
THERMAL GRADIENTS
In some cases (e.g. for the prediction of condensation) it will be necessary to know the
temperature at any point within the wall, i.e. the thermal gradient through the wall, or other
constructional elements.
Wall analysis, assuming internal temperature (Ti = 200C)
the outdoor temperature(To = 00 C)
15
1
SCHOOL OF BUILDING AND ENVIRONMENT
DEPARTMENT OF ARCHITECTURE
UNIT 4 – Ventilation and Day lighting – SAR1204
2
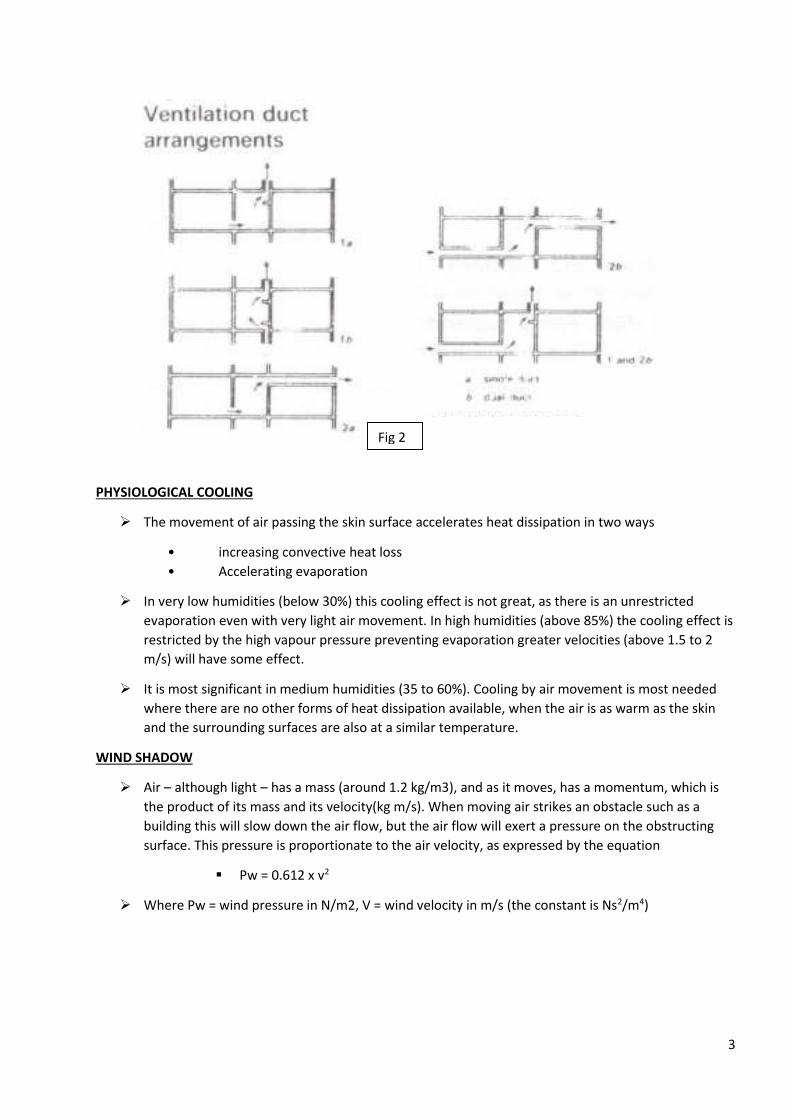
UNIT IV : Ventilation and Day lighting
FUNCTIONS OF VENTILATION
It has three distinctly different functions:
o supply of fresh air
o convective cooling
o physiological cooling
There is a radical difference in the form of provisions for 1 and 2 and for 3: therefore, the first two
functions will be considered as ‘ventilation’ but the last function is considered separately as ‘air
movement’
SUPPLY OF FRESH AIR
The requirements of fresh air supply are governed by the type of occupancy, number and
activity of the occupants and by the nature of any processes carried out in the space
For natural ventilation usually certain limited solutions are prescribed and not the expected
performance. The provision of ‘permanent ventilators’, i.e. of openings which cannot be
closed, may be compulsory. These may be grilles or ‘air bricks’ built into a wall, or may be
incorporated with windows. The size of open-able windows may be stipulated in relation to the
floor area or the volume of the room.
The aim of all these rules is to ensure ventilation, but the rigid application of such rules may
often be inadequate. To ensure a satisfactory performance of the principles involved must be
clearly understood.
Window wall ratio – 1 : 3
CONVECTIVE COOLING
The exchange of indoor air with fresh out-door air can provide
cooling, if the out-door air is at a lower temperature than the indoor
air. The moving air acts as a heat carrying medium.
A situation where this convective cooling is a practical proposition,
can arise in moderate or cold climates, when the internal heat gain
is causing a temperature increase, but also in warm climates, when
the internal heat gain or solar heat gain through windows would raise the indoor temperature
even higher than the out-door air temperature.
FUNCTIONS OF VENTILATION
Ventilation i.e. both the supply of fresh air and convective cooling, involves the movement of air at
a relatively slow rate. The motive force can be either thermal or dynamic (wind).
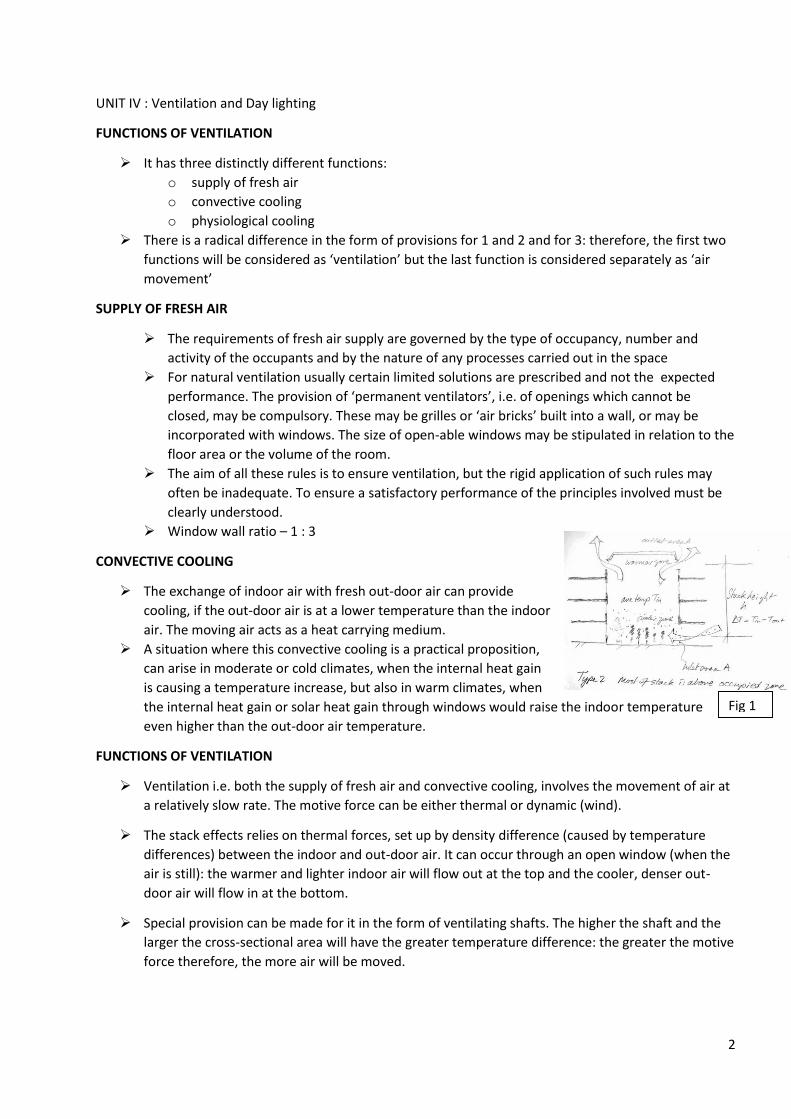
The stack effects relies on thermal forces, set up by density difference (caused by temperature
differences) between the indoor and out-door air. It can occur through an open window (when the
air is still): the warmer and lighter indoor air will flow out at the top and the cooler, denser out-
door air will flow in at the bottom.
Special provision can be made for it in the form of ventilating shafts. The higher the shaft and the
larger the cross-sectional area will have the greater temperature difference: the greater the motive
force therefore, the more air will be moved.
Fig 1
3
PHYSIOLOGICAL COOLING
The movement of air passing the skin surface accelerates heat dissipation in two ways
• increasing convective heat loss
• Accelerating evaporation
In very low humidities (below 30%) this cooling effect is not great, as there is an unrestricted
evaporation even with very light air movement. In high humidities (above 85%) the cooling effect is
restricted by the high vapour pressure preventing evaporation greater velocities (above 1.5 to 2
m/s) will have some effect.
It is most significant in medium humidities (35 to 60%). Cooling by air movement is most needed
where there are no other forms of heat dissipation available, when the air is as warm as the skin
and the surrounding surfaces are also at a similar temperature.
WIND SHADOW
Air – although light – has a mass (around 1.2 kg/m3), and as it moves, has a momentum, which is
the product of its mass and its velocity(kg m/s). When moving air strikes an obstacle such as a
building this will slow down the air flow, but the air flow will exert a pressure on the obstructing
surface. This pressure is proportionate to the air velocity, as expressed by the equation
Pw = 0.612 x v2
Where Pw = wind pressure in N/m2, V = wind velocity in m/s (the constant is Ns2/m4)
Fig 2
4
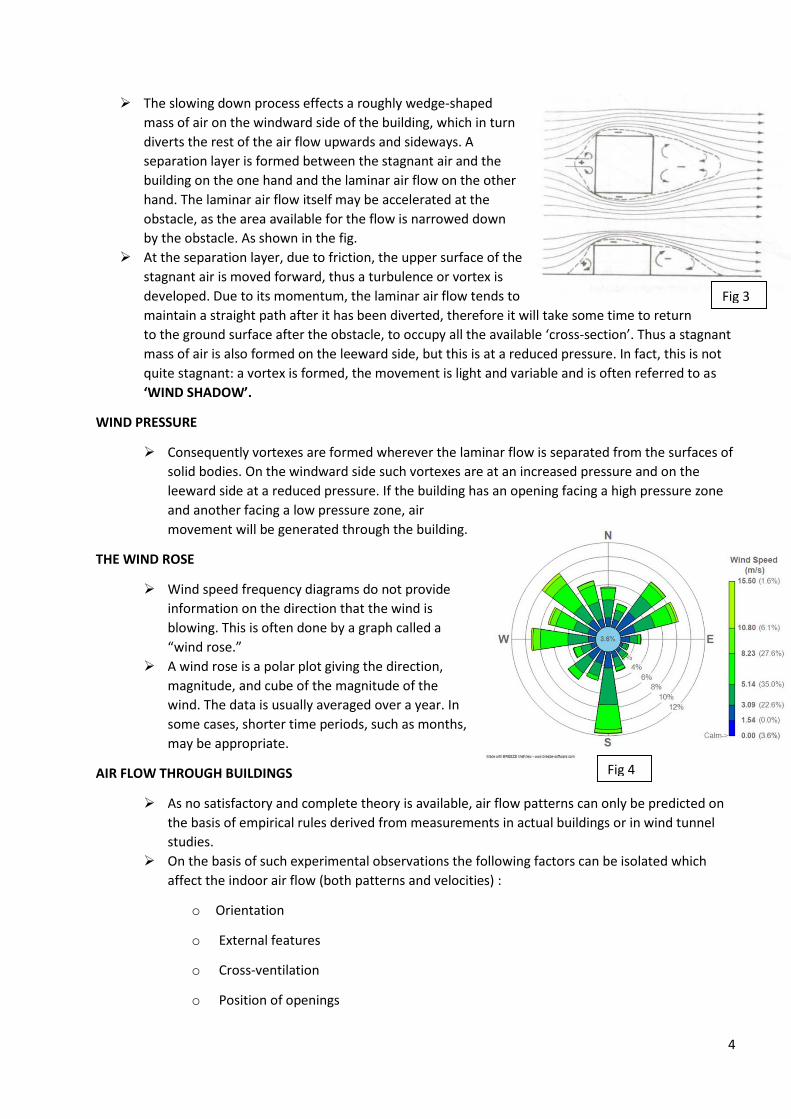
The slowing down process effects a roughly wedge-shaped
mass of air on the windward side of the building, which in turn
diverts the rest of the air flow upwards and sideways. A
separation layer is formed between the stagnant air and the
building on the one hand and the laminar air flow on the other
hand. The laminar air flow itself may be accelerated at the
obstacle, as the area available for the flow is narrowed down
by the obstacle. As shown in the fig.
At the separation layer, due to friction, the upper surface of the
stagnant air is moved forward, thus a turbulence or vortex is
developed. Due to its momentum, the laminar air flow tends to
maintain a straight path after it has been diverted, therefore it will take some time to return
to the ground surface after the obstacle, to occupy all the available ‘cross-section’. Thus a stagnant
mass of air is also formed on the leeward side, but this is at a reduced pressure. In fact, this is not
quite stagnant: a vortex is formed, the movement is light and variable and is often referred to as
‘WIND SHADOW’.
WIND PRESSURE
Consequently vortexes are formed wherever the laminar flow is separated from the surfaces of
solid bodies. On the windward side such vortexes are at an increased pressure and on the
leeward side at a reduced pressure. If the building has an opening facing a high pressure zone
and another facing a low pressure zone, air
movement will be generated through the building.
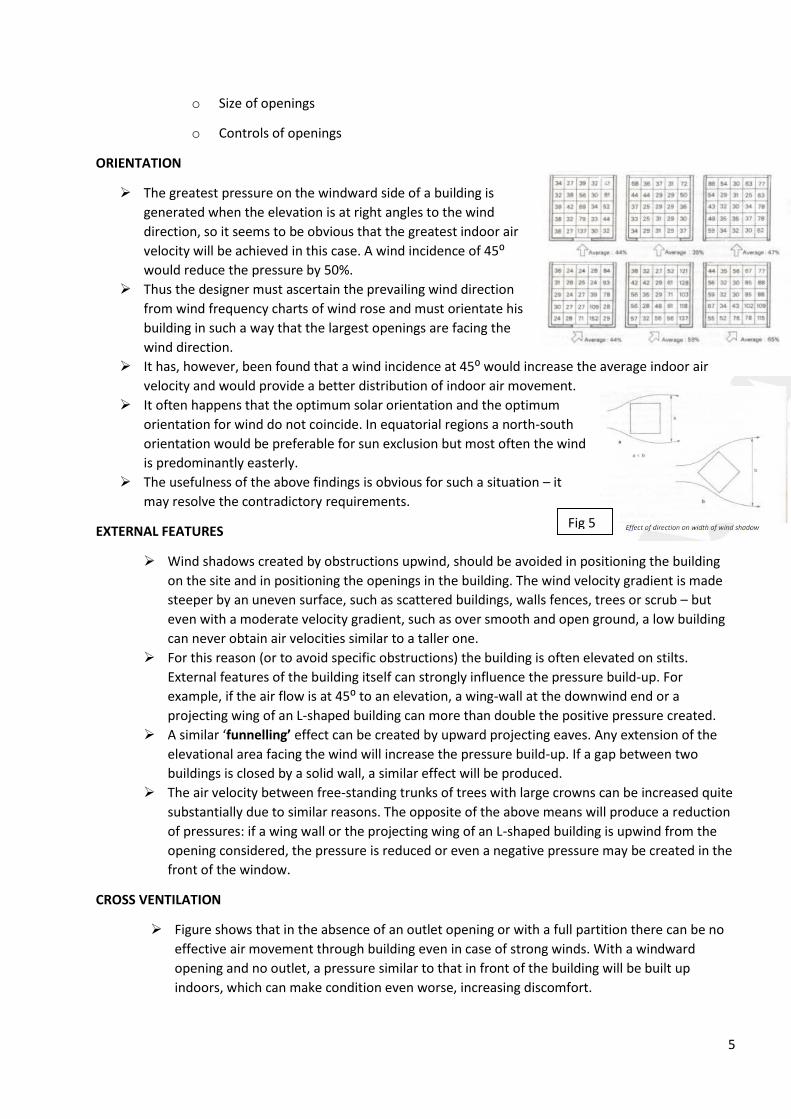
THE WIND ROSE
Wind speed frequency diagrams do not provide
information on the direction that the wind is
blowing. This is often done by a graph called a
“wind rose.”
A wind rose is a polar plot giving the direction,
magnitude, and cube of the magnitude of the
wind. The data is usually averaged over a year. In
some cases, shorter time periods, such as months,
may be appropriate.
AIR FLOW THROUGH BUILDINGS
As no satisfactory and complete theory is available, air flow patterns can only be predicted on
the basis of empirical rules derived from measurements in actual buildings or in wind tunnel
studies.
On the basis of such experimental observations the following factors can be isolated which
affect the indoor air flow (both patterns and velocities) :
o Orientation
o External features
o Cross-ventilation
o Position of openings
Fig 3
Fig 4
5
o Size of openings
o Controls of openings
ORIENTATION
The greatest pressure on the windward side of a building is
generated when the elevation is at right angles to the wind
direction, so it seems to be obvious that the greatest indoor air
velocity will be achieved in this case. A wind incidence of 45⁰
would reduce the pressure by 50%.
Thus the designer must ascertain the prevailing wind direction
from wind frequency charts of wind rose and must orientate his
building in such a way that the largest openings are facing the
wind direction.
It has, however, been found that a wind incidence at 45⁰ would increase the average indoor air
velocity and would provide a better distribution of indoor air movement.
It often happens that the optimum solar orientation and the optimum
orientation for wind do not coincide. In equatorial regions a north-south
orientation would be preferable for sun exclusion but most often the wind
is predominantly easterly.
The usefulness of the above findings is obvious for such a situation – it
may resolve the contradictory requirements.
EXTERNAL FEATURES
Wind shadows created by obstructions upwind, should be avoided in positioning the building
on the site and in positioning the openings in the building. The wind velocity gradient is made
steeper by an uneven surface, such as scattered buildings, walls fences, trees or scrub – but
even with a moderate velocity gradient, such as over smooth and open ground, a low building
can never obtain air velocities similar to a taller one.
For this reason (or to avoid specific obstructions) the building is often elevated on stilts.
External features of the building itself can strongly influence the pressure build-up. For
example, if the air flow is at 45⁰ to an elevation, a wing-wall at the downwind end or a
projecting wing of an L-shaped building can more than double the positive pressure created.
A similar ‘funnelling’ effect can be created by upward projecting eaves. Any extension of the
elevational area facing the wind will increase the pressure build-up. If a gap between two
buildings is closed by a solid wall, a similar effect will be produced.
The air velocity between free-standing trunks of trees with large crowns can be increased quite
substantially due to similar reasons. The opposite of the above means will produce a reduction
of pressures: if a wing wall or the projecting wing of an L-shaped building is upwind from the
opening considered, the pressure is reduced or even a negative pressure may be created in the
front of the window.
CROSS VENTILATION
Figure shows that in the absence of an outlet opening or with a full partition there can be no
effective air movement through building even in case of strong winds. With a windward
opening and no outlet, a pressure similar to that in front of the building will be built up
indoors, which can make condition even worse, increasing discomfort.
Fig 5
6
In some cases oscillating pressure changes, known as ‘buffeting’ can also occur. The latter
may also be produced by an opening on the leeward side only, with no inlet. Air flow loses
much of its kinetic energy each time it is diverted around or over an obstacle.
Several right angle bends, such as internal walls or furniture within a room can effectively stop
a low velocity air flow . Where internal partitions are unavoidable, some air flow can be
ensured if partition screens are used, clear of the floor and the ceiling.
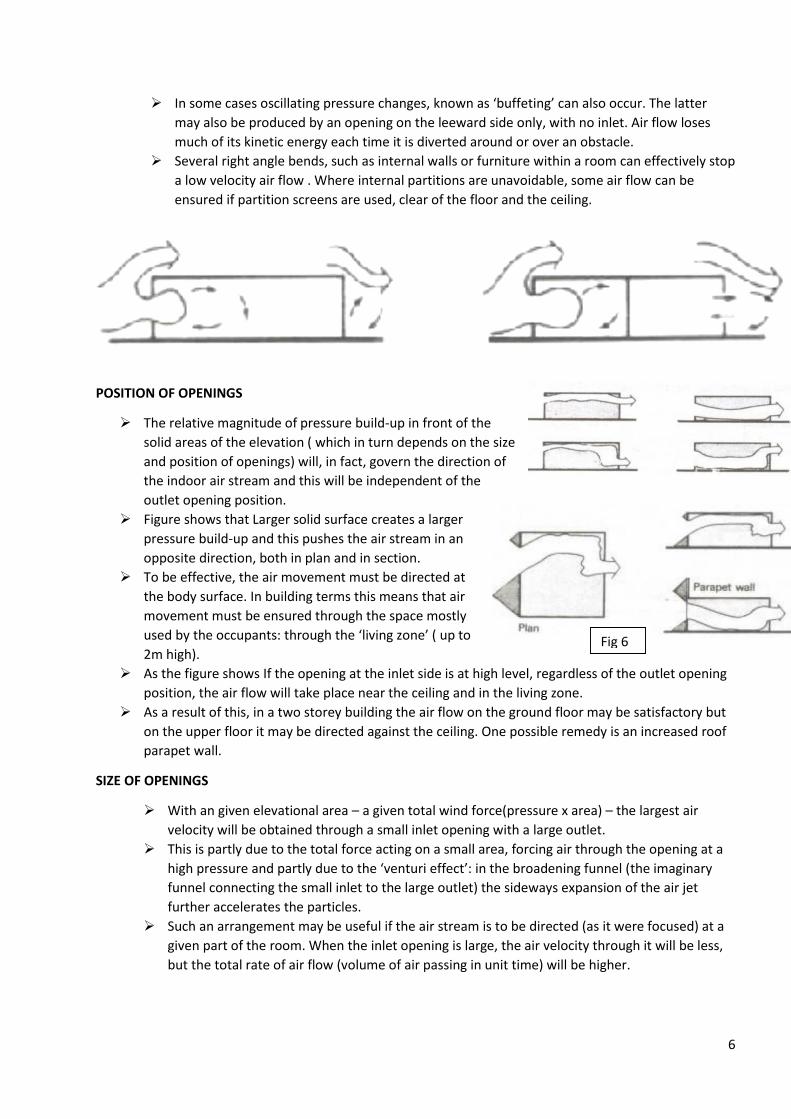
POSITION OF OPENINGS
The relative magnitude of pressure build-up in front of the
solid areas of the elevation ( which in turn depends on the size
and position of openings) will, in fact, govern the direction of
the indoor air stream and this will be independent of the
outlet opening position.
Figure shows that Larger solid surface creates a larger
pressure build-up and this pushes the air stream in an
opposite direction, both in plan and in section.
To be effective, the air movement must be directed at
the body surface. In building terms this means that air
movement must be ensured through the space mostly
used by the occupants: through the ‘living zone’ ( up to
2m high).
As the figure shows If the opening at the inlet side is at high level, regardless of the outlet opening
position, the air flow will take place near the ceiling and in the living zone.
As a result of this, in a two storey building the air flow on the ground floor may be satisfactory but
on the upper floor it may be directed against the ceiling. One possible remedy is an increased roof
parapet wall.
SIZE OF OPENINGS
With an given elevational area – a given total wind force(pressure x area) – the largest air
velocity will be obtained through a small inlet opening with a large outlet.
This is partly due to the total force acting on a small area, forcing air through the opening at a
high pressure and partly due to the ‘venturi effect’: in the broadening funnel (the imaginary
funnel connecting the small inlet to the large outlet) the sideways expansion of the air jet
further accelerates the particles.
Such an arrangement may be useful if the air stream is to be directed (as it were focused) at a
given part of the room. When the inlet opening is large, the air velocity through it will be less,
but the total rate of air flow (volume of air passing in unit time) will be higher.
Fig 6
7
Such an arrangement may be useful if the air stream is to be directed (as it were focused) at a
given part of the room. When the inlet opening is large, the air velocity through it will be less,
but the total rate of air flow (volume of air passing in unit time) will be higher.
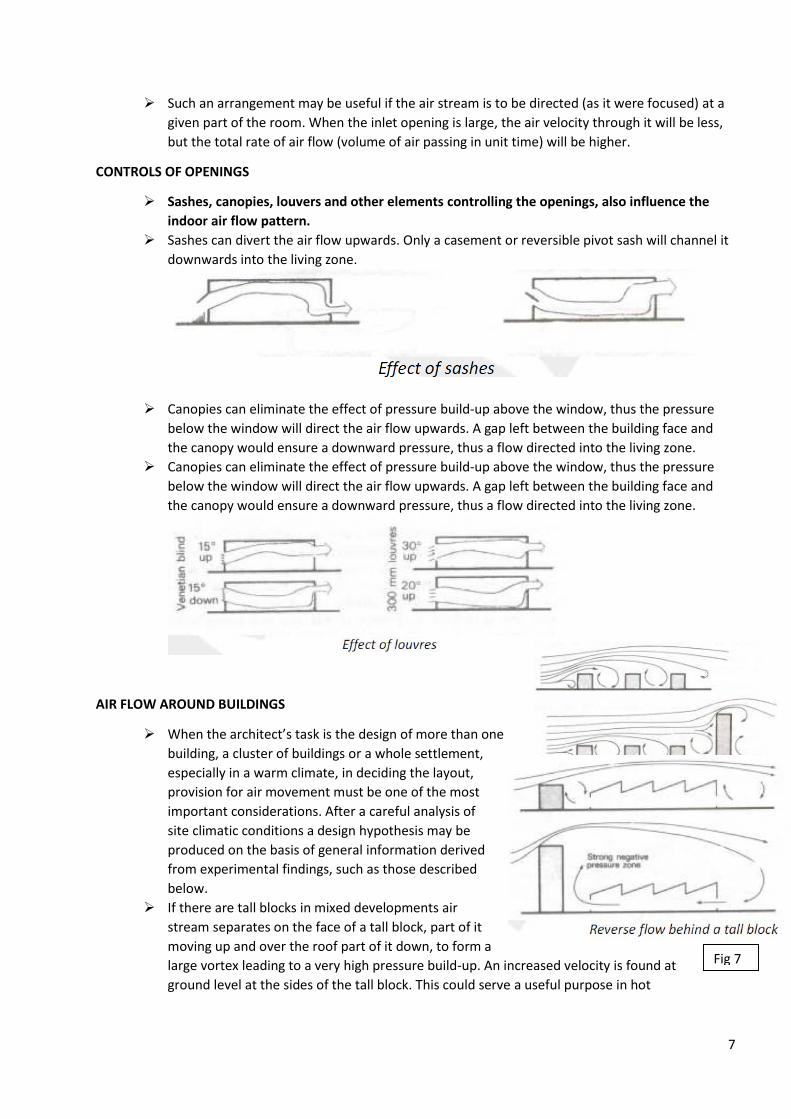
CONTROLS OF OPENINGS
Sashes, canopies, louvers and other elements controlling the openings, also influence the
indoor air flow pattern.
Sashes can divert the air flow upwards. Only a casement or reversible pivot sash will channel it
downwards into the living zone.
Canopies can eliminate the effect of pressure build-up above the window, thus the pressure
below the window will direct the air flow upwards. A gap left between the building face and
the canopy would ensure a downward pressure, thus a flow directed into the living zone.
Canopies can eliminate the effect of pressure build-up above the window, thus the pressure
below the window will direct the air flow upwards. A gap left between the building face and
the canopy would ensure a downward pressure, thus a flow directed into the living zone.
AIR FLOW AROUND BUILDINGS
When the architect’s task is the design of more than one
building, a cluster of buildings or a whole settlement,
especially in a warm climate, in deciding the layout,
provision for air movement must be one of the most
important considerations. After a careful analysis of
site climatic conditions a design hypothesis may be
produced on the basis of general information derived
from experimental findings, such as those described
below.
If there are tall blocks in mixed developments air
stream separates on the face of a tall block, part of it
moving up and over the roof part of it down, to form a
large vortex leading to a very high pressure build-up. An increased velocity is found at
ground level at the sides of the tall block. This could serve a useful purpose in hot
Fig 7
8
climates, although if the tall block is not fully closed but is permeable to wind, these effects
may be reduced.
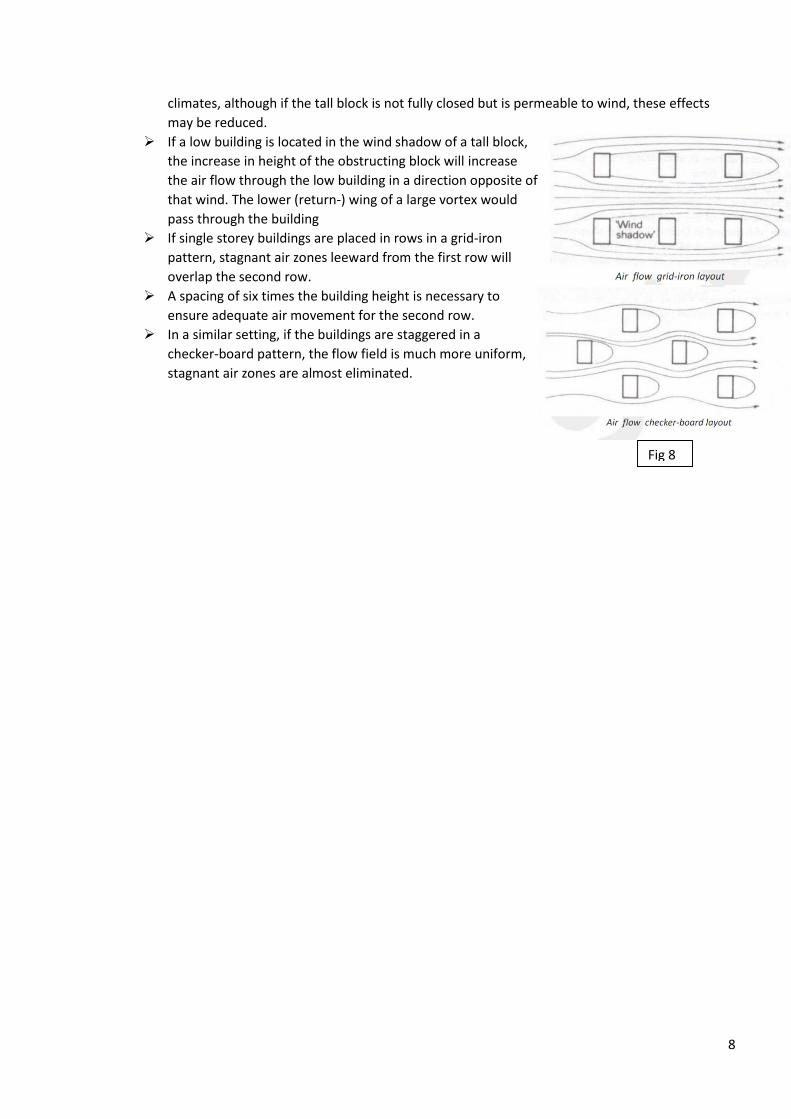
If a low building is located in the wind shadow of a tall block,
the increase in height of the obstructing block will increase
the air flow through the low building in a direction opposite of
that wind. The lower (return-) wing of a large vortex would
pass through the building
If single storey buildings are placed in rows in a grid-iron
pattern, stagnant air zones leeward from the first row will
overlap the second row.
A spacing of six times the building height is necessary to
ensure adequate air movement for the second row.
In a similar setting, if the buildings are staggered in a
checker-board pattern, the flow field is much more uniform,
stagnant air zones are almost eliminated.
Fig 8