Heat-related Morbidity and Thermal Comfort - KEEP
146
Heat-related Morbidity and Thermal Comfort: a Comparison Study of Phoenix and Chicago by Donna Hartz A Dissertation Presented in Partial Fulfillment of the Requirements for the Degree Doctor of Philosophy Approved April 2012 by the Graduate Supervisory Committee: Anthony Brazel, Chair Randall Cerveny Gordon Heisler ARIZONA STATE UNIVERSITY May 2012
-
Upload
khangminh22 -
Category
Documents
-
view
0 -
download
0
Transcript of Heat-related Morbidity and Thermal Comfort - KEEP

Heat-related Morbidity and Thermal Comfort:
a Comparison Study of Phoenix and Chicago
by
Donna Hartz
A Dissertation Presented in Partial Fulfillment of the Requirements for the Degree
Doctor of Philosophy
Approved April 2012 by the Graduate Supervisory Committee:
Anthony Brazel, Chair
Randall Cerveny Gordon Heisler
ARIZONA STATE UNIVERSITY
May 2012

i
ABSTRACT
I present the results of studies from two historically separate fields of research:
heat related illness and human thermal comfort adaptation. My research objectives were:
(a) to analyze the relationships between climate and heat related morbidity in Phoenix,
Arizona and Chicago, Illinois; (b) explore possible linkages of human thermal comfort
adaptation to heat-related illness; and (c) show possible benefits of collaboration
between the two fields of research. Previous climate and mortality studies discovered
regional patterns in summertime mortality in North America: lower in hot, southern cities
compared to more temperate cities. I examined heat related emergency (911) dispatches
from these two geographically and climatically different cities. I analyzed with local
weather conditions with 911 dispatches identified by responders as "heat" related from
2001 to 2006 in Phoenix and 2003 through 2006 in Chicago. Both cities experienced a
rapid rise in heat-related dispatches with increasing temperature and heat index, but at
higher thresholds in Phoenix. Overall, Phoenix had almost two and half times more
heat-related dispatches than Chicago. However, Phoenix did not experience the large
spikes of heat-related dispatches that occurred in Chicago. These findings suggest a
resilience to heat-related illness that may be linked to acclimatization in Phoenix.
I also present results from a survey based outdoor human thermal comfort field
study in Phoenix to assess levels of local acclimatization. Previous research in outdoor
human thermal comfort in hot humid and temperate climates used similar survey-based
methodologies and found higher levels of thermal comfort (adaptation to heat) that in
warmer climates than in cooler climates. The study presented in this dissertation found
outdoor thermal comfort thresholds and heat tolerance levels in Phoenix were higher than
previous studies from temperate climates more similar to Chicago. These differences
ii
were then compared to the differences in weather conditions associated with heat-related
dispatches. The higher comfort thresholds in Phoenix were similar in scale to the climate
differences associated with the upsurge in heat-related dispatches in Phoenix and
Chicago. This suggests a link between heat related illness and acclimatization, and
illustrates potential for collaboration in research between the two fields.

iii
DEDICATION
To my family: my husband, George, our grandchildren: Jacob, Joshua, Ethan and Ellie,
and our kids: George and Aimee; Becky and Germaine; Jeff and Brittney who have good-
naturedly put up with (and sometimes helped) with all the endeavors towards my PhD.
Always follow your dreams.
iv
ACKNOWLEDGMENTS
Pursuit of a PhD is not the endeavor or perseverance of just one person, but that
of many. So many people and organizations need to be thanked. FIRST my husband,
George – without whom this journey might not have begun but definitely not completed.
He was a sounding board to my ideas (good and bad), proofread nearly everything I
wrote without complaint (falling asleep or eyes glazed over), and the BEST research
assistant: he moved, carried, set up and disassembled equipment. I was given the
freedom to work, write, research – and he became a fabulous cook. He kept me
grounded when my head was in the clouds, and picked me up when I slunk into the pit of
despair. And most importantly, he helped me to never lose sight of MY priorities. Thank
you. A heartfelt thank you to my family – ALL of my "kids" (biological or by
relationship) – I am proud to be your mom/"mom", and my siblings (especially my
sister/best friend, Chris). I love you for your patience when I was prattling on or
distracted. I will never forget nor take for granted, your unwavering encouragement. To
Jacob, Joshua, Ethan and Ellie – my wonderful, smart, funny, adorable, grandchildren:
though not around when I started graduate school, I hope I will inspire you to follow
YOUR dreams. Thank you to Jeff, Brittney and Jacob (whose stroller carried
equipment). It is you, my family, who help remind me every day of what is and is NOT
important.
A thank you is also not nearly adequate to Dr. Anthony Brazel who worked with
me for more than a decade. He sparked my love for field research in the undergrad Field
Methods course. This achievement was possible with his support, encouragement,
understanding, guidance, advice and an occasional "encouragement from behind". I
count myself among the lucky to have him as committee chair. Thank you. A heartfelt
thank you to my committee members – present and past: Gordon Heisler, an early
v
mentor in human thermal comfort, whose collaboration transformed my Field Methods
research into a peer-reviewed publication – he was an invaluable inspiration. Thank you
Randal Cerveny for agreeing to be on my committee and for statistics. Your book
"Freaks of the Storm" sits atop my desk's "geek pile" reminding me of two important
things: remember to keep a sense of humor – and you just never know what will come
from your research. A debt of gratitude also goes to Jay Golden. Though he left ASU for
pursuits elsewhere, he was instrumental in initiating the passion for climate and health
needed to get through a PhD.
There are so very many people who have helped me along the way – with
friendship, collaboration, challenges, and education – particularly the Geography
Department and IGERT program for several years of funding and for instilling the
invaluable skill to view issues from interdisciplinary perspectives. I know I am going to
leave out someone, and for that I am truly sorry. I am very indebted to Nancy Selover for
data, equipment and always a sounding board. Barbara Trapido-Lurie for technical
advice. I need to thank several people who played an instrumental role in my research:
Tzu Ping Lin at National Chung Hsing University in Taiwan; Andreas Matzarakis of the
University of Freiburg, Germany and my dear friend and colleague Margaret Loughnan
from Monash University, Melbourne Australia. Thank you to ALL of my professors,
though several warrant a special mention: Pat Gober, Soe Myint, Libby Wentz and my
first geography professor: Ron Dorn. I had the privilege to collaborate, share ideas and
build friendships with so many graduate students, that to list them all will extend beyond
the allowable space here, though several friends/classmates/officemates need to be
mentioned are Brent Hedquist; Winston Chow; Wen-Ching Chuang; Lela Prashad;
Shouraseni Sen Roy; Chona Sister; Last, but certainly not least: my MOMs friends. I
am truly blessed with your friendship and your faith in me all of these years.
vi
TABLE OF CONTENTS
Page
LIST OF TABLES ................................................................................................................ viii
LIST OF FIGURES ................................................................................................................. ix
CHAPTER
1 INTRODUCTION ............................................................................................... 1
2 A BIOMETEOROLOGY STUDY OF CLIMATE AND HEAT-RELATED
MORBIDITY IN PHOENIX FROM 2001 TO 2006 ........................... 11
3 CLIMATE AND HEAT-RELATED EMERGENCIES IN CHICAGO,
ILLINOIS (2003-2006) ......................................................................... 32
4 A COMPARATIVE CLIMATE ANALYSIS OF HEAT-RELATED
EMERGENCY 911 DISPATCHES: CHICAGO, ILLINOIS AND
PHOENIX, ARIZONA USA 2003 TO 2006 ....................................... 62
5 THERMAL COMFORT ADAPTATION IN PHOENIX .............................. 87
6 CONCLUSIONS .............................................................................................. 113
REFERENCES ................................................................................................................... 120
APPENDIX
A MAPS OF PHOENIX AND CHICAGO HRD ........................................... 129
B THERMAL COMFORT SURVEY ............................................................ 131
C INSTITUTIONAL REVIEW BOARD DOCUMENT .............................. 134

vii
LIST OF TABLES
Table Page
1. Universal Thermal Comfort Index ................................................................................ 6
2. Percentage of HRD with monthly means for dew point and maximum temperatures
compared to "normal" monthly means for Phoenix, Arizona ............................ 21
3. Fourth of July HRD. ..................................................................................................... 21
4. 2006 Monthly Mean Number of HRD with Mean Temperature and Dew Point:
Deviation From Normal ..................................................................................... 24
5. Heat Index and Heat-Related Dispatches Three Days Prior to and Three Days
Following a Heat Warning / Heat Advisory Event: Phoenix, Arizona, 2006 ... 28
6. HRD Count and Monthly Distribution of HRD Calls by Percentage of Calls .......... 42
7. Results of Spatial Autocorrelation Analyses ............................................................... 46
8. Mean and normal Maximum Temperature, Maximum Heat Index and Minimum
Temperature Categorized by HRD Counts ........................................................ 50
9. Stepwise Regression Models and Results... ............................................................... 50
10. Stepwise Regression Variables ................................................................................. 50
11. Stepwise Regression Results. .................................................................................... 51
12. Results of Statistical Analyses .................................................................................. 53
13. Annual HRD Counts and Averages and the Associated Mean Tmax, MHI and
Normal Tmax for Days with HRD and the Five Highest Days of HRD. ......... 58
14. Comparison of the Number, Means, Medians, Standard Deviations and Percentages
of HRD between Chicago and Phoenix .............................................................. 72
15. Multivariate Stepwise Analyses: Variables and Model Inclusion. .......................... 74
16. Results of the Cubic Regression Analyses of HRD to Tmax, MHI and Tmin for
Phoenix and Chicago .......................................................................................... 75
viii
Table Page
17. Results of the Difference of Means Analyses .......................................................... 76
18. SSC Air Mass Types That Produced the Highest HRD Counts. ............................. 78
19. HRD: Ten Highest Days and in the Highest 97th Percentile of Counts .................. 80
20. Ten Highest Days with Tmax or MHI > Normal Tmax ........................................... 83
21. Results of Davis Vantage Pro 2 Weather Station Calibration ................................. 97
22. Heat Tolerance. ........................................................................................................ 103
23. Thermal Comfort Thresholds for Phoenix ............................................................ 103
24. Thermal Comfort from Different Locations and Climates ..................................... 104
25. Percent of Respondents in Sun, Shade Or Indoors. ................................................. 110

ix
LIST OF FIGURES
Figure Page
1. Annual Minimum Temperatures ................................................................................. 14
2. Heat-related Dispatches in Phoenix 2001 to 2006 ..................................................... 20
3. Daily HRD patterns ..................................................................................................... 23
4. Summer 2006: Deviation from Normal Maximum Temperature and Dew Point with
HRD counts.. ....................................................................................................... 25
5. Heat-related Dispatches to Mean Heat Index : April–September 2006 .................... 27
6. Peak Electricity Demand Compared to the Heat Related Dispatches for 2003......... 31
7. HRD with Maximum Temperature and Maximum Heat Index ................................. 43
8. Percentage of HRD by month, hour and time of day ................................................ 45
9. Percentage of HRD by1 Kilometer Grids for Chicago ............................................. 47
10. Temperature and Maximum Heat Index and Normal Maximum Temperature with
Grouped HRD .................................................................................................... 49
11. Maximum Temperature and Maximum Heat Index Scatterplot with Trendlines ... 54
12. Heat Wave Period, Summer 2006 ............................................................................ 58
13. Scatterplots of Daily HRD Counts and the Associated Tmax or MHI. .................. 74
14. Highest daily counts of HRD .................................................................................... 79
15. Scatterplots Difference From Normal to Daily HRD Counts .................................. 81
16. Seasonal Plots of HRD by Difference from Normal and Corresponding Tmax or
MHI .................................................................................................................... 82
17. Map of Phoenix Survey Locations ........................................................................... 95
18. Identification of Thermal Neutral ........................................................................... 101
19. Thermal Acceptability ............................................................................................. 102
20. Thermal Thresholds for All Indices ......................................................................... 105

x
Figure Page
21. Phoenix and Chicago HRD ...................................................................................... 106
22. Thresholds of Acclimatization and HRD ............................................................... 108
1
CHAPTER 1: INTRODUCTION
Before attempting to express the sensible temperature in degrees, on the Fahrenheit scale, we are forced to realize that no two individuals are likely to agree very closely as to whether a given condition of the atmosphere should be called hot or cold, comfortable or uncomfortable. (Abbe1 1898)
In a typical year, high temperatures, often combined with high humidity, are
responsible for more deaths than all other weather events, such as tornados, hurricanes
and floods combined (NOAA 2007). Hundreds and sometimes thousands of deaths are
attributed to heat wave events, such the 1995 heat wave in Chicago and the 2003 heat
wave in Europe. Weather conditions that in one location produce only a few heat related
deaths or illnesses can produce huge spikes in other cities. Several mortality studies such
as Curriero (2002) and Davis et al. (2003) document regional differences in summer
mortality which they partially attribute to "acclimatization". Research has yet to quantify
“acclimatization” or explore linkages between human thermal comfort adaptations to
heat-related illness. This dissertation begins to address that knowledge gap by
combining studies of heat-related illness and outdoor thermal comfort adaptation.
Exploration and quantification of acclimatization and possible linkages to heat-health
outcomes may prove to be another important avenue of research towards improving
future mitigation planning.
Heat-related Mortality and Morbidity
Prior to 1995, few heat-related mortality (HRM) studies appear in the scientific
journals, and fewer yet are studies of heat-related illness (HRI), though heat related
illnesses impact many more people than heat-related deaths. Over the past 20 years,
HRM and HRI studies published in peer-reviewed journals have dramatically increased –
1 Cleveland Abbe, Meteorologist US Weather Bureau, Editor of Monthly Weather Review (1892 to 1909) and Director of the Cincinnati Observatory

2
reflecting the growing concern of the future health impacts of heat. Organizations such
as the Intergovernmental Panel on Climate Change (Parry 2007), the World Health
Organization (WHO 2003), U.S. Environmental Protection Agency (EPA 2012), and the
U.S. Center for Disease Control (CDC 2008) call for more research to better understand
heat and its impacts on health, and the need to create plans to address future climate and
demographic changes facing the world. These changes include, but are not limited to
(McGeehin and Mirabelli 2001; Luber and McGeehin 2008)
• increased heat from rapidly expanding urbanization
• an increasing elderly population, a vulnerable group
• regional warming due to climate change
Heat-related deaths and heat-related illnesses are largely preventable through
effective emergency plans based on local conditions that put people at risk of illness or
death (Kalkstein et al. 2009). Many more people are hit by heat-related illness and, as a
result, it provides a much larger data set than heat-related mortality data, allowing for
finer scale analysis. However, heat-related mortality data studies have dominated the
literature until recently, when more HRI studies began to show up in the literature.
HRM and HRI research has focused on identification and quantification of a
range of factors that impact the heat-health relationship such as weather conditions,
personal health conditions (e.g. heart and lung disorders), socioeconomic status, housing
stock, and connectedness to the community. Mortality studies (e.g. Curriero et al. 2002,
Medina-Ramon and Schwartz 2007, Sheridan and Kalkstein 2010, Anderson and Bell
2011) found regional differences in mortality between hot, southern cities in North
America and cooler northern cities: southern cities in North America do not experience
the summertime increase in deaths that occur in cooler more temperate cities further
north. Some of these studies attributed this to southern cities' increased access to air-

3
conditioning, the number one preventative of heat-related mortality and heat-related
illness, but they also point to “acclimatization as another factor.
Human Thermal Comfort
Human thermal comfort is not static, but dynamic and highly subjective,
impacted by not only physiological-climate conditions but also psychological factors,
such as a person's previous experiences and expectations, as well as local customs (de
Dear and Bragger 1998; de Dear and Bragger 2002; Hoppe 2002; Knez and Thorsson
2006; Lin et al. 2011). Perceptions of human comfort under extreme heat can vary
considerably and, as Abbe pointed out more than a century ago – “no two individuals are
likely to agree very closely” on the comfort of the environment they are encountering.
Human thermal comfort is not only a physiological reaction to the surrounding
atmospheric environment, but is also a psychological reaction influenced by factors such
as design (e.g. green versus concrete); previous experience, both short term and long
term; perceptions of the ability to control the environment; and amount of time spent in
that environment. (Nikolopoulou and Steemers 2003; Thorsson et al. 2004). One
cannot, however, completely counteract the physiological impacts of the weather –
particularly in a place like Phoenix, Arizona, where heat is a constant companion for at
least five months of the year.
Efforts to create a single thermal comfort model or index that can predict human
thermal comfort go back almost a century to an index defined as Effective Temperature
(Gonzalez et al. 1974). Great strides were made in the 1960's and 1970's with the work
of P.O. Fanger (1972) and of Gagge, Stolwijk, Hardy (1967). Fanger's book “Thermal
Comfort" (1972) describes a series of equations that combine the environmental

4
variables (temperature, humidity, mean radiant temperature2, air velocity) with levels of
activity and clothing, which resulted in the comfort index known as PMV (predicted
mean vote. PMV is in simple terms the mean comfort or thermal sensation of a group of
people on a seven point scale from +3 (hot) to -3 (cold) with 0 being neutral, derived
from a survey. The research of Gagge's team and that of Fanger used small groups of
people, and a controlled climate chamber. These studies led to a series of equations that
can identify human thermal comfort (HTC) with a version that became the indoor thermal
comfort standards adopted by ASHRAE (the American Society of Heating, Refrigerating
and Air-Conditioning Engineers) and laid the groundwork for today's HTC models
(Janssen 1999). Gonzalez et al. (1974) published an improved version: Standard
Effective Temperature (SET). Much HTC research falls into the bailiwick of the
engineering and design of more comfortable buildings, cities and environments.
Human thermal comfort can be estimated (calculated) by a number of models
producing different indexes commonly used in thermal comfort research: PMV;
Physiologically Equivalent Temperature (PET); SET (Standard Effective Temperature);
OUTSET (outdoor standard effective temperature). Each model makes assumptions in
the equations used to model/determine thermal comfort, but there are key environmental
and human parameters that make up the human energy balance. The environmental
factors include air temperature, humidity, wind speed and solar radiation. The human
components include clothing worn and physical activity (metabolic rate).
Hoppe (2002) states that while there are other definitions of HTC, there are three
basic ways that it is defined: " the human energy balance when heat flows to and from the
human body are balanced and skin temperature and sweat rate are within a comfort
2 Mean Radiant Temperature (MRT) is an important factor in human thermal comfort or
energy budget. MRT is defined as the net balance of radiant heat fluxes that are received (or lost) by the human body when exposed to surrounding heat sources.

5
range"; thermo-physiological “based on the firing of the thermal receptors in the skin and
hypothalamus"; and psychological – basically when the mind thinks you are comfortable
(Hoppe 2002).
During the late 1990s de Dear and Bragger (1998) reported on findings from an
ASHRAE study of 160 buildings around the world, and found that thermal comfort is not
static. They concluded HTC is not just the effect of physiologic parameters but is also
largely influenced by psychological factors that can be impacted by cultural norms and
expectations. Thus, they recommended that there should be investigation of variance in
indoor HTC thresholds. They suggest an "adaptive hypothesis" be used for assessment of
indoor human thermal comfort.
HTC research shows that comfort or acceptability can vary from individual to
individual and with circumstances. Thermal comfort is impacted by a person's
experience, their expectations and their perceived ability to control their environment (de
Dear and Bragger 1998; Hoppe 2002; Knez and Thorsson 2006; Lin, et al. 2010). HTC
research found that acceptability can vary in different environments within the same city,
such as between home and the office (Hwang et al. 2009). This variability in thermal
comfort perceptions sparked increased interest in the thermal comfort differences –
particularly those between indoor and outdoor comfort levels.
Modification/improvement of the indoor thermal comfort thresholds to outdoor
environments led to the inclusion of complex radiation fluxes (Hoppe 1999) to better
assess outdoor human thermal comfort (OHTC). The thresholds and ranges of comfort
were adjusted to take into consideration the wider range of thermal comfort, and
established a set of "standard" thresholds for outdoor thermal comfort. Outdoor Human
Thermal Comfort research can be divided into several categories, which Spagnolo and de
Dear (2003) define as:

6
• Thermal comfort in the urban environment (e.g. urban structure or design
modification)
• Pedestrian comfort
• Human thermal comfort impacts in tourism
In 2000 the International Society of Biometeorology established a commission to
develop Universal Thermal Comfort Index “which takes into account all mechanisms of
heat exchange can be universally valid and can be applied to all climates, all regions,
every season, every scale, and in general, every biometeorological application” (ISB
2010). Their efforts produced a “Universal Thermal Comfort” index (Table 1) with
defined thresholds that can be used for a variety of applications (e.g. Matzarakis et al.
1999; Höppe 1999).
Table 1. Universal Thermal Comfort Index. Temperature ranges for levels of human thermal stress (ISB Commission 6, 2010).
UTCI (°C) range Stress Category
above +46 extreme heat stress
+38 to +46 very strong heat stress
+32 to +38 strong heat stress
+26 to +32 moderate heat stress
+9 to +26 no thermal stress
+9 to 0 slight cold stress
0 to -13 moderate cold stress
-13 to -27 strong cold stress
-27 to -40 very strong cold stress
below -40 extreme cold stress
Previous thermal comfort studies in arid regions document urban heat islands and
assess thermal comfort of urban design comfort or pedestrian comfort. Numerous studies
have been done at a microclimate scale of neighborhoods and urban canyons (e.g.
Pearlmutter et al. 1999; Toudert and Mayer 2003; Shashua-Bar and Hoffman 2003;
7
Johansson 2006). Most used micrometeorological measurements to directly assess
"thermal comfort” and found high levels of discomfort, and make recommendations for
adaptation of urban design aimed at mitigation of heat storing elements in the urban
structure to reduce the urban heat island and improve thermal comfort for pedestrians.
For example, the study by Pearlmutter et al. (1999) assessed thermal comfort in urban
canyons in hot and arid Israel and found that orientation of buildings to maximize wind
flow and reduce solar radiation impacts within the canyons can make a considerable
improvement in thermal conditions and comfort. However, all of these studies in arid
climates use a “standard” outdoor thermal comfort range.
Documenting Thermal Comfort Adaptation: Survey-Based HTC Studies
Questions have been raised about the accuracy and adequacy of these standard
OHTC models modified from indoor comfort models or indexes (Spagnolo and de Dear
2003; Nikolopoulou et al. 2001). As a result, a new set of methodologies and research
developed, aimed at quantification of thermal comfort with thresholds specific to outdoor
environments. This methodology includes a survey-based outdoor human thermal
comfort (OHTC) measurement that was adapted from the indoor thermal comfort
research of Fanger. Though not yet used in many places, researchers have documented
variability in levels of thermal acceptance and preferences in several geographically and
climatically different areas of the world, noting particularly that comfort thresholds are
higher in populations of warmer climates (e.g. Spagnolo and de Dear 2003; Hwang and
Lin 2007; Lin and Matzarakis 2008). This then raises a possible issue with thermal
comfort studies such as the previously mentioned urban canyon/design in arid
environments. These studies used standard thermal comfort ranges that were not yet
tested and verified for possible local thermal comfort adaptation. While these studies are
8
useful in comparing comfort of urban design differences between local sites or those of
other geographic-climate regions, they may be limited in that they may not accurately
reflect the thermal comfort sensations of the local population.
The research of Lin and Matzarakis (2008) compares the traditional thermal
comfort ranges in Taiwan to those they define as central/western Europe. Taiwan's upper
(heat) thresholds were found to be higher than those of central-western Europe. Taiwan's
climate is sub-tropical with an average maximum temperature of 33°C in July –
considerably cooler than Phoenix where the average maximum temperature in July is
41.4°C (106.6°F) (NOAA 2011). The studies done in Sydney, Australia (Spagnolo and
de Dear 2003) and in central Taiwan (Hwang and Lin 2007) were in the field of "tourism
climate".
There are several other, not yet published, studies underway to assess
acclimatization in other localities: Australia (Margaret Loughnan, personal
communication 2011) and in the Negev area of Israel (David Pearlmutter, personal
communication 2011). Israel's climate is hot and dry but not as extreme as that of
Phoenix. Survey-based thermal comfort adaptation studies like those in Taiwan and
Australia have not been done in a climate such as Phoenix's, and levels of thermal
comfort adaptation may prove to be even higher in Phoenix than those in Australia,
Taiwan, or Israel.
To my knowledge, survey-based research of human thermal comfort adaptation
has not yet been applied to human health impacts. However, this type of research could
prove valuable in understanding some of the differences that are occurring in HRM and
HRI as well as in estimating current and future impacts of heat. In the late 1990s, the
criteria used by the National Weather Service (NWS) to issue heat warnings were quite
simple, using predicted temperatures or temperature and humidity thresholds that were

9
relatively uniformly applied in most locations throughout the United States (NOAA
2005). Since that time, the NWS and researchers in climate and health have recognized
the need for more accurate criteria to set warning levels that are based on local climate
conditions. Working with local governmental emergency response personnel, more
advanced Heat Health Watch and Warning Systems (HHWWS) are slowly being
implemented across the United States (NOAA 2005; Kalkstein et al. 2009). The results
from the heat-related illness studies in Phoenix and Chicago contained in this dissertation
were used to assist in the improvement of the emergency response plans in those two
cities and in all likelihood have helped save lives (Jay Golden, personal communication
e-mail April 24, 2011). Adding outdoor human thermal comfort studies could prove to
be an important additional layer of analysis that could be applied to continuing
improvement to local HHWWS.
The dissertation format is four journal articles with an introduction and
conclusion that contextualize the research with both previous research and future research
needs. There are four main chapters, which are first or co-authored original papers
submitted to and, in some cases, accepted and published in peer-reviewed journals.
Chapter 2 is a co-authored study of climate and 911 heat-related emergency
dispatch data for Phoenix, Arizona (co-authors J.S. Golden, A. Brazel, G. Luber and P.
Phelan – see Golden et al. 2008): The HRD data are from 2001 through 2006. It
includes a statistical analysis of the HRD for climate conditions that trigger increases or
spikes in the 911 calls. I was second author, working in conjunction with several other
co-authors, though I was responsible for more than 2/3 of the research - and performed
(and wrote) the climate and spatial analyses sections. This chapter was published in the
International Journal of Biometeorology in 2008.

10
Chapter 3 presents an even more detailed climate study of HRD and climate, but
for data from Chicago, Illinois, USA. It uses a four-year data set of heat-related 911
emergency dispatches from 2003 through 2006. This is a first authored paper published
in January 2012 in the International Journal of Biometeorology (co-authors: J. Golden, C.
Sister; W-C Chung, and A. Brazel; see Hartz et al. 2011).
Chapter 4 is a comparison study of climate and HRD between Phoenix, Arizona,
and Chicago, Illinois. It used HRD and climate data sets from 2003 through 2006. It was
submitted to the International Journal of Biometeorology in January 2012 and is currently
under review and co-authored with A. Brazel and J. Golden.
Chapter 5 is the results of a survey-based outdoor human thermal comfort study
for Phoenix, Arizona. It uses survey-based methodology adapted from Spagnolo and de
Dear (2003) and Hwang and Lin (2007). There were 714 surveys taken while concurrent
microclimate measurements were recorded during spring, summer and fall of 2010. The
survey went through the IRB process (Internal Review Board) at Arizona State
University. A copy of the IRB decisions and survey are included in the appendices (see
Appendices A and B).
There is a short concluding chapter that brings together a summary of the HRD
and the OHTC study for Phoenix. I evaluate the contributions made to both the heat-
related mortality and morbidity field, as well as the OHTC field, and then assess the
contributions made through the combining of these two sets of methodologies.

11
Chapter 2
A BIOMETEOROLOGY STUDY OF CLIMATE AND HEAT-RELATED
MORBIDITY IN PHOENIX FROM 2001 TO 2006
Golden, J. S., D. Hartz, A. Brazel, G. Luber, and P. Phelan. (2008) A biometeorology study of climate and heat-related morbidity in Phoenix from 2001 to 2006. International Journal of Biometeorology 52 (6):471-480. Abstract
Heat waves kill more people in the United States than hurricanes, tornadoes,
earthquakes, and floods combined. Recently, international attention focused on the
linkages and impacts of human health vulnerability to urban climate when Western
Europe experienced over 30,000 excess deaths during the heat waves of the summer of
2003(Kosatsky2005) —surpassing the 1995 heat wave in Chicago, Illinois, that killed
739. While Europe dealt with heat waves, in the United States, Phoenix, Arizona,
established a new all-time high minimum temperature for the region on July 15, 2003. A
low temperature of 35.5°C (96°F) was recorded, breaking the previous all-time high
minimum temperature record of 33.8°C (93°F). While an extensive literature on heat-
related mortality exists, greater understanding of influences of heat-related morbidity is
needed due to climate change and rapid urbanization influences. We undertook an
analysis of 6 years (2001– 2006) of heat-related dispatches through the Phoenix Fire
Department regional dispatch center to examine temporal, climatic and other non-spatial
influences contributing to high-heat-related medical dispatch events. The findings
identified that there were no significant variations in day-of-week dispatch events. The
greatest incidence of heat-related medical dispatches occurred between the times of peak
solar irradiance and maximum diurnal temperature, and during times of elevated human

12
comfort indices (combined temperature and relative humidity).
Introduction
Concerns regarding system interactions and complexities between global climate
change and human health vulnerability are increasing significantly. Recently, the summer
of 2003 brought international focus on the linkages and impacts of human health
vulnerability to climate change not at the global scale but rather at the urban scale.
Western Europe experienced over 30,000 excess deaths during the heat waves of the
summer of 2003 (Kosatsky 2005)—surpassing the 1995 heat wave in Chicago, Illinois,
that killed 739 (Shrader-Frechette 2002; Kalkstein and Greene 1997).
Concurrent with the European heat waves, in the United States, Phoenix, Arizona,
established a new all-time high minimum temperature for the region on July 15, 2003.
The low temperature of 35.5°C (96°F) was recorded, breaking the previous all-time high
minimum temperature record of 33.8°C (93°F) which was set on June 27 1990, July 20,
1989 and July 14, 2003. In the US, heat waves kill more people than hurricanes,
tornadoes, earthquakes, and floods combined (Klinenberg1999; NOAA 2007a).
A strong volume of literature exists concerning the system dynamics of heat
waves and the urban heat islands in regards to sustainable development (Golden 2004;
Golden et al. 2006) including heat-related mortality (Centers for Disease Control 1995;
Semenza et al. 1996; Kalkstein et al. 1996). This paper is focused on heat-related
morbidity and is the result of a joint research effort by the National Center of Excellence
on SMART Innovations for Urban Climate and Energy at Arizona State University
(NCE) and the National Center for Environmental Health at the Centers for Disease
Control and Prevention (CDC). The NCE in partnership with the CDC is undertaking
studies of multiple urban regions to increase understanding of how climate change,

13
including heat waves and electricity blackouts, influence human health vulnerability. This
project examines findings from 6 years of emergency response dispatches for heat-related
health incidents in the Phoenix metropolitan region. These fire/EMS dispatches were
tracked and analyzed in comparison to meteorological conditions including heat waves
and National Weather Service Heat Advisory Warnings.
Region of study
Phoenix, Arizona, was selected as the region of study. A Centers for Disease
Control (Centers for Disease Control and Prevention 2005) study revealed that, from
1979 to 2002, a total of 4,780 heat-related deaths in the US resulted from weather
conditions and that, from 1993 to 2002, the total incidence of such deaths was three to
seven times greater in Arizona than in the US overall. Additionally, over the twentieth
century, average annual temperatures in the arid subtropical Phoenix region increased
1.7°C (3.1°F) (Brazel et al. 2000). However, the urban portions of the region have
realized mean annual temperature increases of 4.2°C (7.6°F), a rate of three times the
total regional mean increase representing the pronounced influence of the built
environment (Fig. 1).
The setting, Phoenix, Arizona (elevation 345.9 m, 33°25′40″N, 112°0′14″W) was
incorporated in 1881 and is one of the nation's fastest growing cities and fifth largest in
population (1,475,834 as of September 1, 2005 (U.S. Census 2007). Geographically the
city is over 1,295 km2 (500 square miles) and larger than the City of Los Angeles. The
Phoenix Fire Department 911 call center dispatches for the majority of the regional fire
departments. Maricopa County, the regional jurisdiction containing the City of Phoenix,
has a population of approximately 3.6 million (U.S. Census 2007) and a land area of

14
Fig 1. Annual Minimum Temperatures: Graph shows annual minimum temperature in Phoenix and nearby rural weather station at Casa Grande National Monument (left Y axis). The (exponential) trend line shows the rising population in Phoenix between 1945 and 2005 (right Y axis).
23,836 km2 (9,203 square miles). It is the fourth most populous county in the nation, and
is home to more people than 21 states and the District of Columbia. The jurisdictions
located within Maricopa County and dispatched by Phoenix Fire include Tempe,
Chandler, Scottsdale (added in 2005), Glendale, Surprise, Buckeye, Tolleson, Peoria,
Paradise Valley, Guadalupe and Goodyear. Phoenix Fire does not dispatch for the City of
Mesa, Arizona, which is located only 9.5 km (6 miles) from the Phoenix border. Mesa
with a population of 452,000 is larger than (or similar in population to) Miami, FL;
Cincinnati, Pittsburgh, PA; St. Louis, MO; Atlanta, GA; and Minneapolis, MN.
Therefore, heat-related dispatches by the Mesa Fire Department are not included within
this research, but should be considered in regards to the totality of heat-related impacts
for the region.

15
Materials and Methods
Climate data used in this study are from the National Weather Service Automated
Surface Observing System located at Sky Harbor International Airport in Phoenix. Daily
normal temperature data were obtained from the National Weather Service. Daily
maximum and minimum temperature data were acquired from the National Climate Data
Center. Hourly temperature, dew point and relative humidity, and cloud cover data were
provided by the Arizona Office of Climatology. Solar radiation data were acquired from
the Maricopa County Flood Control District's Durango weather station (central Phoenix).
To correspond to the daily normal temperature data, the 30-year average daily dew point
“normal” was calculated using the hourly dew point temperature data from January 1,
1971 through December 31, 2000 (which had <0.02% missing data points).
We examined the Heat Index (HI) as a possible explanation for annual variances.
The heat index, also known as the “apparent temperature,” is an index commonly used by
the US National Weather Service and incorporates temperature with relative humidity to
estimate the "feels like" temperature. Daily HI was calculated using hourly temperature
and relative humidity data from 1500 hours Local Standard Time (LST). For our human
comfort index we use the model called OUTCOMES—OUTdoor COMfort Expert
System (Heisler and Wang 2002)—that estimates the energy budget of a cylindrical
person using weather data and a site's surrounding radiative and thermal environmental
fluxes based upon inputs such as a site's vegetation, landscaping, shade, moisture, nearby
buildings and ground cover, etc. In addition to producing an estimate of energy in watts
per square meter, OUTCOMES also produces a level of comfort ranging from too cold or
too hot which, in effect, is a function of a rational vote among a group of people based on
past comfort research (e.g., Brown and Gillespie 1995). We used this model because it
allows for incorporation of the many elements encountered at a given site.
16
The OUTCOMES model uses inputs for air temperature, wind speed, humidity,
solar radiation, pre-specified shading objects, reflectivity of the ground and nearby
objects, the sky view, tree and building cover of the site and clothing and human activity.
For our daily human comfort estimates we used temperature and relative humidity
records from 1500 hours LST. The diurnal human comfort estimations used a mean
hourly temperature and humidity calculated from hourly temperature and relative
humidity using all of the data from June and July, 2001–2006. Solar radiation
measurements were measured on a typical clear day in June 2006 from a central Phoenix
weather station. While we used actual measured climate variables we did not attempt to
include variables for the multiplicity of sites likely encountered across the metropolitan
area where Heat-related Dispatches (HRD) were encountered—this will be explored in-
depth in future research. For our study, we chose input variables for OUTCOMES to
produce a site more representative of a harsh site—conditions that would likely produce
circumstances more taxing to a person and more likely to produce a h emergency. Inputs
included sky object: concrete uncolored building; Ground Cover: concrete uncolored;
Sky View of 50%; upwind cover of 50%; Pollution: fairly polluted; Activity: standing or;
walking slowly; clothing: T-Shirt, short pants, running shoes. In addition, we examined
regional climatic and fire department HRD in comparison to the National Oceanic and
Atmospheric Administration's (NOAA) National Weather Service (NWS) excessive heat
products which are developed to provide advance notice of excessive heat events. These
products are issued based on a single heat index value, derived from temperature and
humidity, originated by Steadman (1979):
• Excessive Heat Outlook: used when the potential exists for an excessive heat
event to develop in the next 3– 7 days

17
• Excessive Heat Watch: used when conditions are favorable for an excessive
heat event to develop in the next 12– 48 hours
• Excessive Heat Warning: used when an excessive heat event is occurring,
imminent, or has a high probability of occurrence in the next 36 hours and
poses a threat to life and property
• Heat Advisory: used when a heat event is occurring, imminent, or has a high
probability of occurrence in the next 36 hours and causes significant
inconvenience and, if caution is not exercised, could become life threatening
Results
We found that similar to HRD calls declining in 2002 and 2004, there is a
corresponding relative decline in the mean summer heat index for those years (Fig. 2a).
And, as calls for service increase in 2003, 2005 and 2006, there is a corresponding
increase in the mean summer Heat Index.
Annual Distribution
For the study period of 2001–2006, there was an overall increase in the number
of HRD by the regional dispatch center (Fig. 2a). A small portion of the increase for
emergency services is attributable to the population increase of the region. According to
the U.S. Census (2007), the Phoenix metropolitan area had an increase of 787,306
persons from April 1, 2000 to July 1, 2006, placing it as one of the top 5 highest
numerical population growth regions in the United States. The City of Scottsdale, which
had a private subscription fire and medial service provider (Rural Metro), organized its
own municipal fire department on July 1, 2005 with dispatch services being transferred to
the Phoenix Fire Regional dispatch center at the same time. However, as noted in the

18
results, the annual total of HRD calls for service varied between years. Calls for service
dropped from 785 (2001) to 650 (2002) and then increased to 897 (2003) and declined
again to 788 calls (2004). The number spiked to 1,261 calls (2005) and somewhat leveled
to 1,264 calls in 2006.
Monthly Distribution
The monthly distribution of HRD events peaks in July as presented in Fig. 2b.
This is consistent throughout the 6-year study. Analysis of monthly dew point and
maximum temperatures for the Phoenix region (Table 2) provides a platform to
understand this monthly dynamic. For the study period, the month of July had both the
highest maximum temperature of 41.8°C (107.2°F) and dew point of 12.8°C (55.1°F).
Although June had the second highest average maximum temperature for the period of
40.8°C (105.4°F) as compared to August with the third-highest average maximum
temperature of 40.2°C (104.3°F), it was August with the second-highest number of
dispatch calls. This is potentially due to August having a higher average dew point of
12.7°C (54.8°F) than June with 9.9°C (49.9°F). Further discussion of departures from
normal temperatures and the human comfort index are presented later in this paper.
As would be expected, there was a strong seasonality to the data, with summer
having the overwhelming number of calls, though a few HRD were made during winter
months. We arbitrarily established a threshold of >5 HRD's/day as a high HRD day.
There were 45 days with high HRD in 2001, 44 in 2002, 62 in 2003, 48 in 2004, 79 in
2005 and 95 in 2006. The majority of high HRD days had maximum temperatures
considerably higher than normal. This is particularly the case during the months of May
and June where the temperatures average about 7.2°C (13°F) higher than normal. On
days with higher dew points, the ambient temperatures were higher than normal, but only

19
about 3.3°C (6°F) higher. The 2006 summer season was particularly active in h
emergency calls in both overall numbers and single day counts—with July 22 and July 24
having 34 and 32 calls, respectively. For this reason, we have examined this summer in
detail. The urban climate variability section provides further analysis in regards to
variance in the dispatch events.
Day of week and diurnal trends
For 2006, the average daily number of h medical dispatch calls was 3.47 calls per
day. However, for the months of May–August 2006, the average HRD were 9.12 per day.
Two days had 30+ related medical calls (22 and 24 July, 2006) with 7 days throughout
the period with over 20 dispatch events. The distribution of fire department dispatches is
fairly evenly distributed throughout the week for the years 2001– 2006 (Fig. 2c).
Saturdays have the highest cumulative total which might be attributed to greater outdoor
activities of residents, in combination with outdoor job and work-related situations, while
Sundays are the lowest day for dispatches, perhaps reflecting a reduction in both outdoor
job-related activities or recreational activities, or both. While there was no day of week
bias, the data do occasionally show an increase in calls associated with summer holidays.
The Fourth of July holiday impacts HRD the most, with 4 of 6 years showing large spikes
in calls (Table 3). A few Memorial Day and Labor Day holiday weekends also show
spikes in HRD, but of a lesser magnitude.

20
Fig 2. Heat-related Dispatches in Phoenix 2001 to 2006. a) Total heat-related dispatches and summer mean heat index by year b) Monthly distribution of heat-related dispatch calls c) Day of week distribution of heat-related dispatches

21
Table 2. Percentage of HRD with monthly means for dew point and maximum temperatures compared to "normal" monthly means for Phoenix, Arizona.
Percent of
HRD
2001–2006 dew point
1971–2000 normal
dew point
2001–2006 maximum
temperature
1971–2000 average
maximum temperature
% °C °F °C °F °C °F °C °F
Jan 0.2 −0.1 31.9 0.6 33.1 20.2 68.3 18.3 65 Feb 0.1 0.9 33.6 0.8 33.4 21.0 69.8 20.8 69.4 Mar 1.8 2.4 36.4 1.4 34.5 25.2 77.3 23.5 74.3 Apr 2.9 4.2 39.5 0.4 32.7 29.4 84.9 28.3 83 May 10.7 7.1 44.7 2.2 35.9 36.0 96.8 33.3 91.9 Jun 17.7 9.9 49.9 4.3 39.7 40.8 105.4 38.9 102 Jul 33.3 12.8 55.1 13.1 55.6 41.8 107.2 40.1 104.2 Aug 21.6 12.7 54.8 14.8 58.7 40.2 104.3 39.1 102.4 Sep 9.1 10.7 51.3 11.6 52.8 38.3 101 36.3 97.4 Oct 2.2 6.6 43.8 6.2 43.2 31.8 89.2 30.2 86.4 Nov 0.3 2.2 36 1.9 35.5 24.6 76.3 22.9 73.3 Dec 0.1 −0.1 31.9 0.6 33.1 19.1 66.3 18.3 65
Table 3. Fourth of July HRD. Four of 6 years (shown in bold italics) experienced an increase in calls
Year Date Calls Day of Week
Temp °F
Temp °C
Heat Index °F
Heat Index °C
2001 July 3 34 Tuesday 114 45.6 109.3 42.9 July 4 20 Wednesday 108 42.2 109.9 43.3 July 5 4 Thursday 98 36.7 98.3 36.8 2002 July 3 2 Wednesday 107 41.7 103.9 39.9 July 4 11 Thursday 107 41.7 99.8 37.7 July 5 4 Friday 108 42.2 99.3 37.4 2003 July 3 10 Thursday 110 43.3 103.8 39.9 July 4 26 Friday 113 45.0 104.6 40.4 July 5 3 Saturday 111 43.9 104.9 40.5 2004 July 3 6 Saturday 105 40.6 95.4 35.2 July 4 5 Sunday 103 39.4 94.1 34.5 July 5 4 Monday 107 41.7 98.4 36.9 2005 July 2 3 Saturday 111 43.9 102.3 39.1 July 3 10 Sunday 109 42.8 101.7 38.7 July 4 9 Monday 108 42.2 101.7 38.7 July 5 9 Tuesday 109 42.8 104.6 40.4 2006 July 3 8 Monday 106 41.1 105.3 40.7 July 4 22 Tuesday 106 41.1 106.0 41.1 July 5 1 Wednesday 96 35.6 85.7 29.8

22
Diurnal variability is an important factor for local and regional agencies
developing daily resource allocation and capacity. When evaluating the average diurnal
distribution of HRD, we examined the influence of ambient temperature as derived from
the National Weather Service station at Phoenix Sky Harbor International Airport as well
as solar incidence. Figure 3a shows the peak dispatch time falls in between peak solar
radiance and maximum ambient temperature, and this was consistent for weekday and
weekend dispatches.
Examining the solar radiation of a typical mid-June day with the hourly
distribution of HRD shows that HRD is lowest at 0600 to 0700 hours LST and reaches
the maximum at 1600 hours, about an hour prior to the maximum temperature. Solar
radiation maximizes at about 1200 hours—indicating a two to three hour lag in the HRD
after solar maximum, but generally preceding the diurnal maximum temperature (Fig.
3a). We examined the diurnal range of human comfort using the OUTCOMES model for
an "average" day and compared our results to HRD. An average day was constructed
using hourly temperature and humidity for June, July and August, 2001—2006,
aggregated into hourly means. During the summer months, by 10:00 LST the
OUTCOMES comfort index reaches the level that produces a "heat stress warning" in its
output. OUTCOMES, which is an index that incorporates temperature, humidity, solar
radiation, shade (or lack thereof) and activity level, produced a similar pattern to the
hourly totals for HRD. Both peak in mid-afternoon when human comfort is at its greatest
discomfort level (Fig.3b).

23
Fig 3. Daily HRD patterns 2001 to 2006. Circles are total HRD by hour of occurrence; open squares are mean temperature (°C) diamonds are solar radiation (W/m2) and solid squares are for predicted thermal comfort in W/m2 as calculated using OUTCOMES. a) Diurnal variability of heat-related dispatches for 2001–2006 in Phoenix, Arizona, in relationship with solar radiance and ambient temperature. b) Heat-related dispatches in comparison to mean temperature and human comfort (2001–2006) Horizontal line is the threshold at which OUTCOMES produces a heat stress warning.
Urban climate role in heat dispatches
There were 361 high HRD days in 2001—2006. All but 2 days had maximum
temperatures higher than normal. The mean normal maximum temperature for these 361
high HRD days would be expected to be 38.7°C (101.6°F), but the actual measured
maximum temperature for high HRD days averaged 41.5°C (106.7°F). To increase
understanding of how climate variability impacts HRD, we examined dew point,
maximum temperature, the heat index and departure from normal maximum temperature
in relation to dispatch events for the period of April 1 to September 30, 2006 (Table 4).
On average, May and June had considerably warmer monthly mean temperatures by
3.3°C (6.0°F) and 3.0°C (5.4°F) than normal. May had much drier than normal dew
points averaging 3.1°C (5.5F) lower than normal, while June was nearly normal. July
experienced both warmer temperatures and higher dew points. August's temperatures and
dew points were close to normal. A comparison between HRD and deviations from

24
normal for maximum temperatures and dew points for the period of May-August 2006
are shown in Fig. 4.
Table 4. 2006 Monthly Mean Number of HRD with Mean Temperature and Dew Point Deviation From Normal
Mean
number of HRD
Maximum temperature:
deviation from normal
Dew point deviation
from normal
calls (°C) (°F) (°C) (°F) April 1.2 1.0 1.9 −2.0 −2.6 May 4.2 3.4 6.0 −2.5 −5.5 June 9.2 3.0 5.4 0.9 0.2 July 14.5 1.4 2.5 0.5 2.7 August 8.6 0.3 0.6 1.1 0.4 September 2.7 −0.5 −0.8 −5.0 −4.3 Average(Apr – Sept)
2.6 1.5 −1.7 0.8 6.8
Increases in temperature and/or dew point alone do not initiate elevated HRD
events as evidenced by days with high dew point and low dispatch events (late July 2006)
and days with elevated dispatch events but lower than normal dew points (∼July 20,
2006). Similarly, maximum temperature alone does not provide a direct relationship as
evident on May 15. However, due to the relatively low dew points during Phoenix's
summer season, most days' heat indices were lower than the measured ambient air
temperature. Regression analyses of HRD to daily mean, maximum and minimum
temperature, dew point and heat index show the strongest correlation to the heat index.

25
Fig 4. Summer 2006: Deviation from Normal Maximum Temperature and Dew Point with HRD counts. The bars are mean maximum temperature (a and b) or dew point ( c) as compared to normals (lines) and the number of HRD (line with diamond markers). Hollow bars in 4b are days with a heat index higher than the maximum temperature a) Change from normal maximum temperature and heat-related dispatches May – August 2006 b) Maximum temperature with heat-related dispatches May – August 2006 c) Dew point with heat-related dispatches May – August 2006
26
The numbers of HRD for summer of 2006 were then grouped into five
categories: 1 to 4 calls; 5 to 9; 10 to 14; 15 to 20; and 21+ calls. Data for the 1500 LST
heat index were categorized for mean heat index, minimum heat index, and maximum
heat index for the days within the categories. The categories with a high number of HRD
show a high, direct linear relationship to the mean heat index (Fig. 5). Given forecasts of
a mid-afternoon heat index for a day, it should to be possible to anticipate the relative
magnitude of expected calls of HRD within one of these categories based on the records
thus far. Deviation within a category may be further explained by other non-climatic
factors, such as holidays, etc.
Results in Regards to Human Health Heat Warnings
During 2006, the National Weather Service issued for Phoenix a handful of
warnings and advisories:
• Four Heat Advisory days: June 13, June 25, July 15 and July 23
• Three Excessive Heat days: July 14, July 21 and July 22
The two days with the highest number of high heat-related responses during
2001–2006 occurred during July 2006. July 22, 2006 had an excessive heat advisory and
July 24, 2006 was a day following a heat advisory warning. As can be seen in Table 5, all
of the warning advisory dates have "high" HRD—only June 13 is below the mean of 9
calls for summer. Notice the heat index for June 13 is considerably higher than the
average for the previous three days. The July 15 heat index is lower than the previous
three -day means.
An additional evaluation criterion is the volume of HRD prior to and following a
NWS heat event. Specifically, we evaluated the three days prior and three days post
either a Heat Warning or Heat Advisory date for 2006. Table 5 shows all of the days

27
when the National Weather Service issued Heat Advisories or Warnings met our high
HRD criteria. However, only June 15 and July 22 (the day with the highest HRD for the
season) did not have at least one other day either prior to or subsequent of the
advisory/warning with a higher number of HRD. Of the seven Heat Warning/ Advisory
days issued by the NWS for 2006, three days had at least one day with a higher number
of HRD occurring during the three days prior to the NWS event, and three days had at
least one day with a higher number of HRD subsequent to the event.
Fig 5. Heat-related Dispatches to Mean Heat Index : April–September 2006
Discussion
McGeehin and Mirabelli (2001) presented an overview of health impacts from
extended heat events (heat waves). Their identification of research gaps and future
research needs included a call for further research in quantifying which weather
parameters are important in the relationship between heat events and health. This
includes increased understanding of the relationship of heat and morbidity, which is the
focus of this paper. Our research effort attempts to build upon prior heat-related
surveillance research, primarily of hospital data by Leonardi et al. (2006); Mastrangelo et
al. (2006); Michelozzi et al. (2006) and Schwartz et al. (2004), by analyzing paramedic

28
and emergency medical technician emergency dispatch data specific for heat-related
emergencies in Phoenix.
The findings of our research indicate that high Heat Index, a combination of
humidity and temperature, had the highest statistical correlation to heat-related
dispatches. Exceedances from the expected normal temperatures were a very strong
influence as well for dispatch events. Diurnally, calls for service were highest post
highest solar radiance (1300 hours) occurring greatest at 1400–1600 hours
In addition, we find that our results add to work completed by Sheridan (2006)
that analyzed municipal heat warning system efficacy in Phoenix and three other North
American cities (Dayton, Philadelphia and Toronto). As presented in Sheridan's findings,
the City of Phoenix has no official heat mitigation plan, yet this research indicates that
the impacts of the large volume of heat-related health emergency calls necessarily taps
multiple financial and manpower resources of the local government as
Table 5. Heat Index and Heat-Related Dispatches Three Days Prior to and Three Days Following a Heat Warning / Heat Advisory Event: Phoenix, Arizona, 2006. Date of heat warning or advisory and the number of HRD and heat index on that date with the average heat index for the previous three days, and number of HRD for the three days prior to and following the advisory or warning.
Date Heat- related
Dispatches
Heat Index (HI)
Mean HI
3 days prior
Mean # calls 3 days prior
# calls previous 3 days
# calls for 3 Subsequent
days
Heat June 13 7 101.1 97.6 5 5, 7, 4 7, 7, 3 Advisory June 25 14 105.6 101.5 9 11, 9, 7 14, 14, 8 Event July 15 13a,b 106.1 108.4 23 22, 24, 22 7, 20, 23 July 23 26 a,b 107.1 108.7 23 9, 27, 34 32. 13, 9 Heat July 14 22a 109.0 106.9 22 20, 22, 24 13, 7, 20 Warning July 21 27 b 111.2 106.9 16 23, 17, 9, 34, 26, 32 Event July 22 34 108.7 108.0 18 17, 9, 27 26, 32, 13 a At least 1 day with a higher number of HRD prior warning events b At least 1 day with a higher HRD 3 days subsequent warning event

29
well as other local resources. However, in May 2006, The Arizona Department of Health
Services Division of Public Health Preparedness, Division of Behavioral Health Services,
Division of Licensing, Maricopa County Department of Emergency Management and
City of Phoenix Emergency Management Office began working together to establish a
statewide Heat Emergency Response Plan. This plan seeks to identify the roles and
responsibilities of the state, county, city and other responsible agencies, and to establish a
response upon the issuance of heat warnings (ADHS 2006; City of Phoenix 2006).
Because the Phoenix region exhibits two distinct summer time climates (elevated
temperatures and low humidity, and elevated temperatures with high humidity during the
'monsoon'), we were able to examine how urban climate variability influences human
health vulnerability. The findings indicate that the heat index (heat and humidity)
significantly drives the calls for service, and oppressive heat is the primary driver of calls
for service. Additionally, there is a lag for heat-related emergency calls as compared to
maximum solar radiation, with a maximum lag of 3 hours. While there is little variation
in day-of-week calls, Sunday is historically the lowest day for calls of service, but
traditional outdoor holidays such as Independence Day (Fourth of July) and weekend
days preceding these holidays often show an above average number of calls for service.
Our use of the OUTCOMES model suggests that a more comprehensive index,
rather than relying on simply temperature or even the temperature/humidity heat index,
could be of considerable value for identifying probable days or times of day for increases
in HRD. Our future plans to study the urban morphology in local pockets with high
incidences of HRD, used in conjunction with a model such as OUTCOMES, could
expand our ability to spatially predict vulnerability. Identification of temporal patterns,
and eventually spatial patterns, will assist considerably in emergency response planning
for capacity and geographical distribution of personnel and resources.
30
During the summer of 2006, the summer with the largest number of calls, only
seven heat warnings or advisories were issued, yet many days in the Phoenix area have
extreme climatic conditions. It is unclear whether or not heat warnings make a difference
in the number of HRD. Our study shows that some of our highest days of HRD are on
days with heat warnings, but many days without heat warnings also had very high HRD.
In Sheridan's (2006) study, of the four cities, nine out of ten respondents knew of the
issuance of heat warnings. However, Phoenix respondents were the lowest in adjusting to
the hot weather (35%), potentially due to the relatively high number of days of excessive
heat in the region. The local National Weather Service personnel were continuously
adjusting the parameters for issuing heat warnings and advisories during the study period.
This suggests that one possible need is for local government to undertake further analysis
of calls for service in relationship to urban morphology and climate to provide more
specific and localized warnings.
Additionally, electricity blackouts and prolonged interruptions are highly
relevant and can be even more problematic for policy makers in development of
emergency response planning and resource allocations for manpower and equipment. As
urban regions continue to grow, greater stress will be placed on existing infrastructure.
As recently as August 14, 2003, the United States and Canada experienced the largest
blackout ever, when more than 61,800 MW of electrical load was lost, causing power
disruption to an estimated 50 million people. In Phoenix, a large transformer fire
occurred on July 4, 2004 at the Arizona Public Service Westwing Substation causing a
significant blackout (North American Electric Reliability Council 2006). However, the
replacement transformer had to be trucked in from the State of Washington and did not
arrive until July 31, 2004. Significant conservation measures had to be implemented as
the maximum electric power that could be delivered within the Valley as a result of the
31
fire was a range of 10,000–10,200 MW, while the forecasted summer peak was at 10,300
MW (Arizona Public Service 2004). The Westwing Substation, which services both
Tucson and the Valley, operated at one-third capacity, creating the threat of rolling
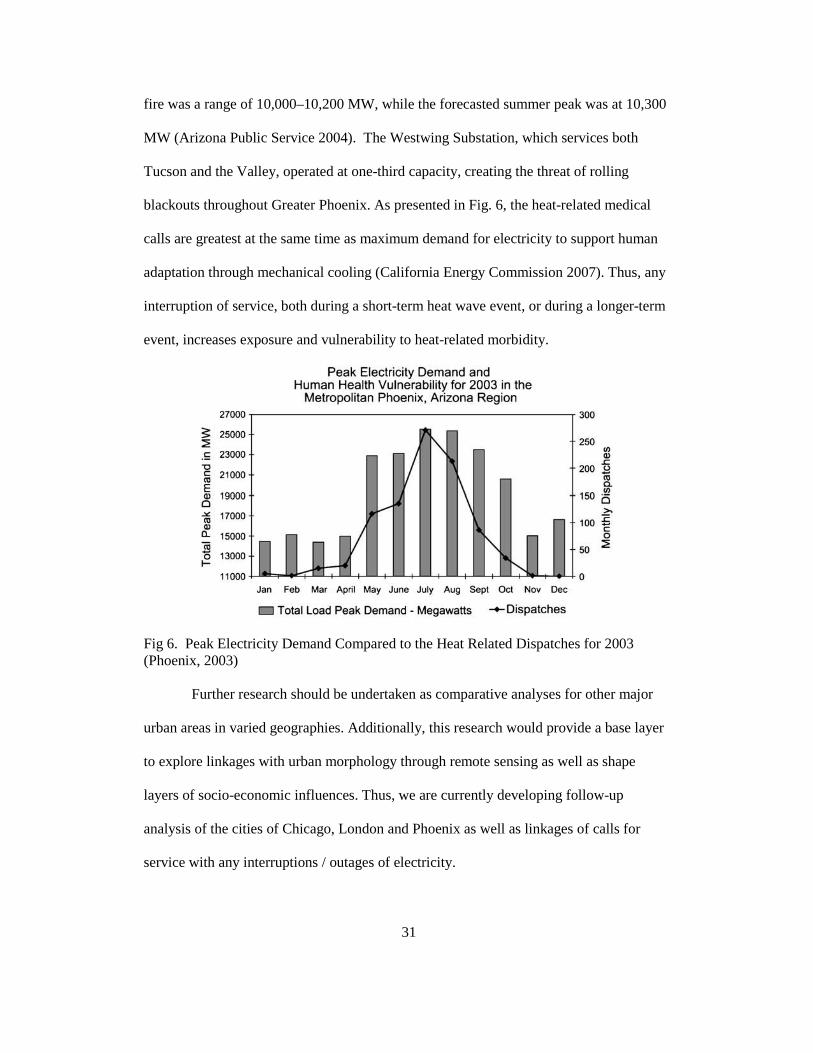
blackouts throughout Greater Phoenix. As presented in Fig. 6, the heat-related medical
calls are greatest at the same time as maximum demand for electricity to support human
adaptation through mechanical cooling (California Energy Commission 2007). Thus, any
interruption of service, both during a short-term heat wave event, or during a longer-term
event, increases exposure and vulnerability to heat-related morbidity.
Fig 6. Peak Electricity Demand Compared to the Heat Related Dispatches for 2003 (Phoenix, 2003)
Further research should be undertaken as comparative analyses for other major
urban areas in varied geographies. Additionally, this research would provide a base layer
to explore linkages with urban morphology through remote sensing as well as shape
layers of socio-economic influences. Thus, we are currently developing follow-up
analysis of the cities of Chicago, London and Phoenix as well as linkages of calls for
service with any interruptions / outages of electricity.

32
Chapter 3
CLIMATE AND HEAT-RELATED EMERGENCIES IN CHICAGO, ILLINOIS (2003-
2006)
Hartz D, Golden J, Sister C, Chuang W-C, Brazel A (2011) Climate and heat-related emergencies in Chicago, Illinois (2003–2006). International Journal of Biometeorology 56 (1):71-83
Abstract
Extreme heat events are responsible for more deaths in the United States than
floods, hurricanes and tornados combined. Yet, highly publicized events, such as the
2003 heat wave in Europe, which caused in excess of 35,000 deaths, and the Chicago
heat wave of 1995 that produced over 500 deaths, draw attention away from the countless
thousands who, each year, fall victim to non-fatal health emergencies and illnesses
directly attributed to heat. The health impact of heat waves and excessive heat are well
known. Cities worldwide are seeking to better understand heat-related illnesses in
respect to the specifics of climate, social demographics and spatial distributions. This
information can support better preparation for heat-related emergency situations with
regards to planning for response capacity and placement of emergency resources and
personnel.
This study deals specifically with the relationship between climate and heat-
related dispatches (HRD, emergency 911 calls) in Chicago, Illinois between 2003 and
2006. It is part of a larger, more in-depth study that includes urban morphology and
social factors that impact heat-related emergency dispatch calls in Chicago. The highest
occurrences of HRD are located in the central business district, but are generally scattered
across the city. Though temperature can be a very good predictor of high HRD, heat
index is a better indicator. We determined temperature and heat index thresholds for high

33
HRD. We were also able to identify a lag in HRD as well as other situations that
triggered higher (or lower) HRD than would typically be generated for the temperature
and humidity levels, such as early afternoon rainfall and special events.
Introduction
Heat is the natural disaster that kills more people annually than any other weather
related natural disaster (NOAA 2007). The health impacts of high temperature events
such as the heat wave in Chicago in 1995 that killed 521 people (Klinenberg 2002) and
the European heat wave of 2003 which killed tens of thousands, primarily in cities, are
well known. The United Nations announced that in 2008 half the world's population
became urban, and is expected to reach sixty percent by 2030 (UNFPA 2007). This
highlights the need for accurate warning systems and effective adaptation, response and
mitigation plans to avert the impacts of heat events. A growing body of literature in both
climate and health journals is evidence of the concern and activity of a large research
community worldwide (e.g. McGeehin and Mirabelli 2001; Kalkstein and Smoyer 1993;
Knowlton et al. 2009; Nakai et al.1999; Conti et al. 2005; Diaz et al. 2002; Tan et al.
2007; Hutter et al. 2007; Fouillet et al. 2006; Nitschke et al. 2007)
Both health and climate journals publish studies that examine climate and socio-
economic factors associated with substantial increases in mortality due to heat events or
heat waves. Some studies use an interdisciplinary, epidemiological approach that use
factors such as socio-economic status, pollution, and seasonality, along with climate
variables, to help explain excess mortality under high heat conditions (Gosling et al.
2009). Other researchers concentrate on climate conditions in seeking to better
understand the thresholds for high mortality. Fewer studies focus on morbidity data.
High heat events exacerbate many illnesses, such as cardiac and pulmonary conditions,

34
and can put vulnerable populations such as the elderly and very young at high risk, which
can lead to premature death. However, many people, including healthy adults, must seek
emergency room services due to high heat. Though not resulting in deaths, heat stress
emergencies generate costs in terms of health care and emergency response expenditures.
This study examines the climate conditions associated with 911 emergency call
data for “heat-related” emergency dispatches for the City of Chicago, for the years 2003
through 2006. It is part of a larger research project by the National Center of Excellence
on SMART Innovations for Urban Climate & Energy (NCE), which assisted the City of
Chicago in examining potential human health vulnerability to heat waves and urban heat
islands. These studies include factors such as regional climatology, urban morphology,
and socio-economic drivers, as well as adaptation, response and mitigation strategies.
This biometeorology study builds upon prior works by the research team (Golden et al.
2008) that evaluated 911 heat-related dispatch calls in the Phoenix, Arizona region by
examining causative factor linkages of the heat with heat-related dispatches. By using
Chicago's heat-related 911 calls, we can identify climate thresholds and conditions
associated with patterns of increased HRD calls in a different climate regime.
There is not uniformity in morbidity data; types of data used, how data are reported, and
in how they are analyzed. The handful of morbidity and heat studies that use emergency
ambulance call (morbidity) data, utilize different types of emergency data and methods,
for a variety of objectives (Dolney and Sheridan, 2006; Golden et al. 2008; Bassil et al.
2009; Knowlton et al. 2009). Data can be actual emergency calls identified as “heat-
related” by emergency responders or medical personnel (Golden et al. 2008, Bassil et al.
2009). In addition to emergency call data, Basil et al. (2009) also use emergency
department visits. In lieu of identified heat emergency calls, some researchers also
utilize methods often seen in mortality and climate studies, which are estimates gleaned
35
from the increase in all emergency calls that occur during hot weather or heat waves
(Dolney and Sheridan 2006, Weiskoff et al. 1992). Jones et al. (1982) and Knowlton et
al. (2009) used hospitalization and emergency room visits identified as heat-related by
medical personnel.
There are also temporal differences in morbidity and heat studies. Similar to this
study, the Golden et al. (2008) Phoenix, Arizona study examines the entire warm weather
season and specific heat wave periods. Many studies are not comprehensive seasonal
examinations of heat-related morbidity, but focus upon specific periods identified as
“heat waves” (e.g. three consecutive days with maximum temperatures above a specific
temperature or apparent temperature threshold). Dolney and Sheridan's (2006) Toronto,
Canada study, however, analyzes the increase in emergency ambulance calls for the city
over a four-year period between 1999 and 2002. They specifically compare differences
in calls between all days, non-heat alert days and heat alert days. They examine
increased ambulance calls and climate variables at specific times of day (temperature at
0500 and temperature, apparent temperature and dew point at 1700). They found a
statistically significant relationship between increased calls and the climate variables, the
highest correlation for apparent temperature. Their geospatial analyses use land use and
census derived demographic data. Dolney and Sheridan (2006) found, similar to Bassil et
al. (2009), that waterfront (recreational) areas and the city core experienced larger
increases in ambulance calls during heat waves than other parts of the city. Industrial
areas and the city core experienced more calls during weekdays during hot weather,
suggesting that the population adjusts their activities on hot weekend days.
Bassil et al. (2009) use two morbidity data sets; emergency calls identified as
“heat/cold exposure” but limit data to those of summer months to increase the likelihood
of the call being heat-related illness (HRI); as well as emergency department visits (ED)

36
in Toronto, Canada for 2002 through 2005. Their objective, linking HRI and ED to the
Toronto heat health warning system, focused upon days declared as heat emergencies.
The study tracked daily ED and HRI counts, and found similar temporal patterns in ED
and HRI; but also observed spikes in calls on non-heat emergency days. Their geospatial
/ demographic analyses showed higher occurrences of heat incidents in inner city, low
income areas, and areas along the waterfront where many summer recreational activities
were located.
Knowlton et al. (2009) examined hospitalization discharges and emergency
department (ED) visits (excluding injury and poisonings) during a 2006 heat wave in
California. Researchers classified data by specific diagnoses for known heat-related
illnesses as well as mental illness, and included age, race and region to derive excess
morbidity and illness rate ratios. They did not evaluate the heat wave intensity or
incremental increases in climate variables on increased ED or hospitalizations. They
found a “substantial” increase in morbidity on heat wave days relative to normal
temperature days, with considerably more ED visits than hospitalizations.
Study area
Chicago, Illinois is situated on the southwestern edge of Lake Michigan and has a
population of 2.8 million (Census 2009). Chicago's climate is primarily humid,
continental, with hot, humid summers and cool to cold winters. Thus, year round, the
city experiences extremes in climate. The climate is modified by the proximity to Lake
Michigan. Normal monthly temperatures range between -1.3°C (29.6°F) in January to an
average of 27.3°C (81.2°F) in July. Summer temperatures can reach 37.8°C (100 °F) and
winter temperatures can drop well below -17.8°C (0°F). Chicago averages 38.0 inches
of snowfall and about 31.7 inches of rainfall each year. The EPA reports that researchers

37
from Northwestern University found an urban heat island (UHI) of 1.7 – 2.8°C (3 – 5°F)
in the nearby suburbs that lie away from the lake, but found little to no UHI in the core
downtown area near Lake Michigan. (EPA 2008)
Data and Methods
Emergency 911 call data, provided by the City of Chicago Office of Emergency
Management, had been previously screened by City of Chicago personnel to include only
heat-related dispatches (HRD) – those calls that emergency responders had coded as
“heat” for the event classification. HRD data include time of call and location, but do not
include demographic information or the specific criteria used by emergency responders to
categorize calls as “heat” related. All HRD fell within the time periods of May 1 through
September 30, with two exceptions, each with a single HRD, one in January 2004, and
one in October 2005. These two dates were not included in the data set. Otherwise, all
days with HRD are included. The official weather station for Chicago is located at
O'Hare International Airport and, while it is a part of the city, the airport lies in a pocket
removed from the main city proper and is surrounded by suburbs. Therefore, we chose to
use climate data from the Federal Aviation Administration's Surface Observing System
(ASOS) station located at Midway International Airport in Chicago, Illinois. Midway
Airport is surrounded by the city, and lies about 10 miles to the southwest of downtown
Chicago, and about 10 miles inland from Lake Michigan. Climate data include hourly
climate records, plus daily maximum and minimum temperature. Daily climate
“normals” and hourly climate data were obtained on line from the National Climatic Data
Center (NCDC 2008). Data were then imported into spreadsheets for compilation,
sorting and some analysis.

38
The heat index (accurate to ±1.3°F) was calculated in Fahrenheit for all hours
where dry bulb temperature was at or above 80°F (26.7°C) using the formula:
where T = ambient dry bulb temperature (°F) and R = relative humidity as an integer
percentage (Rothfusz 1990). We chose to use the National Weather Service's (NWS)
heat index formula because heat index is what would be typically reported by media, plus
the non-scientific community decision makers or emergency response planners can easily
calculate heat index using the NOAA/NWS heat index calculator found on their various
web sites. A column for “maximum heat index” used the highest heat index generated
for each day with recorded ambient air temperature at or above 80°F (26.7°C). For days
where the maximum temperature was <80°F (26.7°C) the maximum temperature was
used in lieu of a calculated heat index. Data matrices were assembled corresponding to
each year of heat-related emergency dispatch data (2003 through 2006).
Data matrices for each year include HRD and climate variables. Climate and
HRD data were compiled into full data sets containing all data, plus monthly, daily, and
hourly data sets. Climate data included temperature (maximum, minimum and mean
temperature), precipitation, humidity data (dew point and/or relative humidity), and
calculated heat index data. Data matrices were created for various time periods and for
each year. The first includes all days between 1 May and 30 September and another
matrix included only the days with HRD. Basic descriptive statistics were calculated
(means, sums, etc.). Analyses were done to identify periods of extreme heat (heat
waves). Assessment for time of day was made. A heat wave from July 25, 2006 to
2224-23-22-
23
R6T-1.99x10 - TR8.5282x10 RT1.22874x10 R05.481717x1 -
T-6.83783x10 - TR0.22475541 - 7R10.1433312 T2.04901523 42.379- HI
++
++=

39
August 2, 2006 was identified and used to create another data matrix. This heat wave
was examined in detail.
Time series analyses were used to examine seasonality, differences in time of
day, and possible lags in HRD. Additionally, we used moving averages of daily
maximum temperature and daily heat index with HRD at seven day and thirty day
intervals to smooth out the variability in the data, allowing us to look for temporal
patterns in the data.
There are a large number of potential explanatory climate and climate related
variables that could impact the HRD, therefore we applied a multivariate analysis using
stepwise regression using a standard statistical software package (SPSS 16). In this case
we included the dependent variable, daily HRD, and 10 independent variables. The
analysis incorporated four climate variables: daily measurements of maximum
temperature; maximum heat index; minimum temperature; mean dew point. We included
three climate intensity variables: “difference from normal” for maximum temperature,
maximum heat index and minimum temperature. These are the amount by which these
three climate parameters varied above and below the normals for that date, and are in
increments of 0.1°C. Daily maximum temperature normals were used for the difference
in maximum temperature and maximum heat index, and normal minimum temperatures
used minimum temperature's difference from normal. A large positive number would be
an indicator of the intensity of heat (or heat and humidity). Three climate related
variables dealing with duration of heat events were also included in the form of the
number of preceding consecutive days when temperature or heat index exceeded the
normal, and number of preceding days where minimum temperature exceeded the normal
minimum temperature. The analysis also included a nominal, non-climate variable;
whether the date was either early or late in the season. Several studies found that early
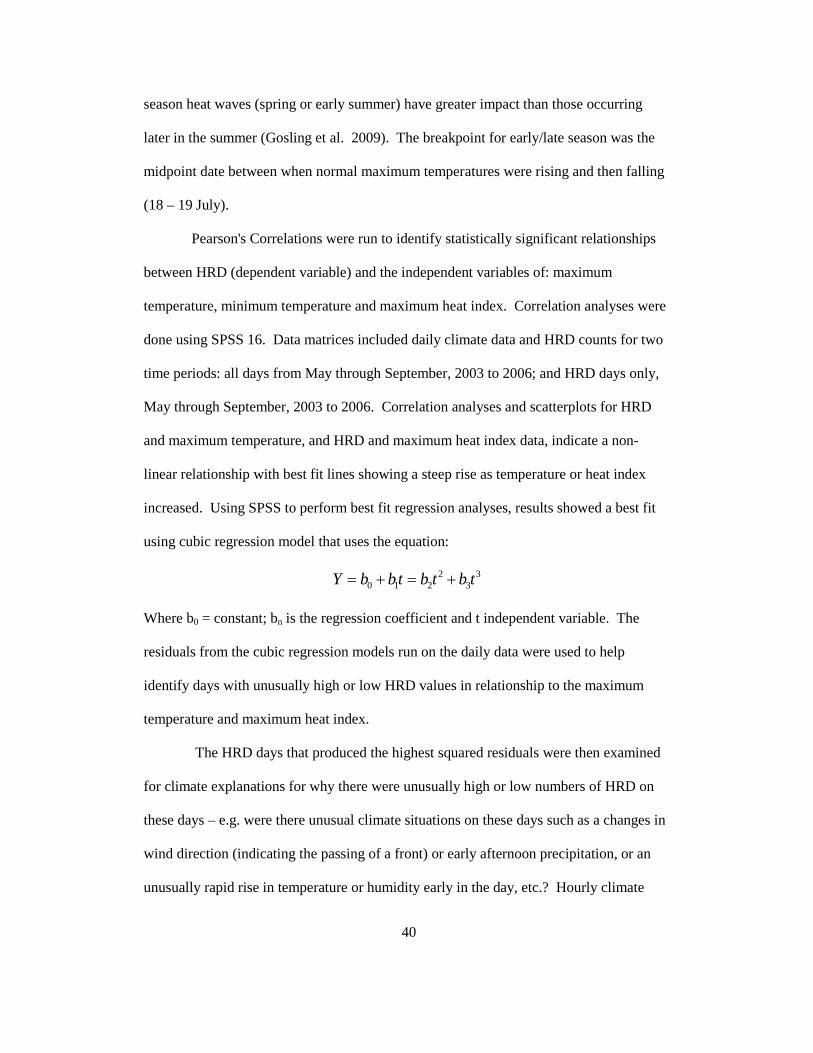
40
season heat waves (spring or early summer) have greater impact than those occurring
later in the summer (Gosling et al. 2009). The breakpoint for early/late season was the
midpoint date between when normal maximum temperatures were rising and then falling
(18 – 19 July).
Pearson's Correlations were run to identify statistically significant relationships
between HRD (dependent variable) and the independent variables of: maximum
temperature, minimum temperature and maximum heat index. Correlation analyses were
done using SPSS 16. Data matrices included daily climate data and HRD counts for two
time periods: all days from May through September, 2003 to 2006; and HRD days only,
May through September, 2003 to 2006. Correlation analyses and scatterplots for HRD
and maximum temperature, and HRD and maximum heat index data, indicate a non-
linear relationship with best fit lines showing a steep rise as temperature or heat index
increased. Using SPSS to perform best fit regression analyses, results showed a best fit
using cubic regression model that uses the equation:
33
2210 tbtbtbbY +=+=
Where b0 = constant; bn is the regression coefficient and t independent variable. The
residuals from the cubic regression models run on the daily data were used to help
identify days with unusually high or low HRD values in relationship to the maximum
temperature and maximum heat index.
The HRD days that produced the highest squared residuals were then examined
for climate explanations for why there were unusually high or low numbers of HRD on
these days – e.g. were there unusual climate situations on these days such as a changes in
wind direction (indicating the passing of a front) or early afternoon precipitation, or an
unusually rapid rise in temperature or humidity early in the day, etc.? Hourly climate
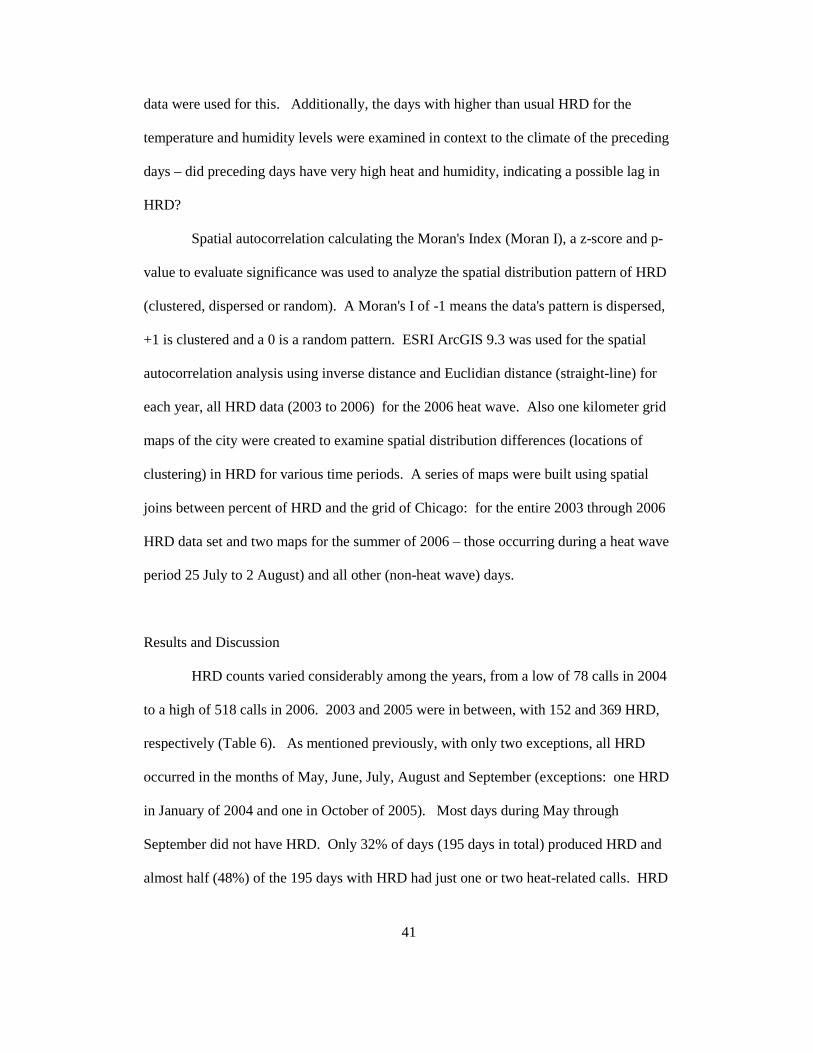
41
data were used for this. Additionally, the days with higher than usual HRD for the
temperature and humidity levels were examined in context to the climate of the preceding
days – did preceding days have very high heat and humidity, indicating a possible lag in
HRD?
Spatial autocorrelation calculating the Moran's Index (Moran I), a z-score and p-
value to evaluate significance was used to analyze the spatial distribution pattern of HRD
(clustered, dispersed or random). A Moran's I of -1 means the data's pattern is dispersed,
+1 is clustered and a 0 is a random pattern. ESRI ArcGIS 9.3 was used for the spatial
autocorrelation analysis using inverse distance and Euclidian distance (straight-line) for
each year, all HRD data (2003 to 2006) for the 2006 heat wave. Also one kilometer grid
maps of the city were created to examine spatial distribution differences (locations of
clustering) in HRD for various time periods. A series of maps were built using spatial
joins between percent of HRD and the grid of Chicago: for the entire 2003 through 2006
HRD data set and two maps for the summer of 2006 – those occurring during a heat wave
period 25 July to 2 August) and all other (non-heat wave) days.
Results and Discussion
HRD counts varied considerably among the years, from a low of 78 calls in 2004
to a high of 518 calls in 2006. 2003 and 2005 were in between, with 152 and 369 HRD,
respectively (Table 6). As mentioned previously, with only two exceptions, all HRD
occurred in the months of May, June, July, August and September (exceptions: one HRD
in January of 2004 and one in October of 2005). Most days during May through
September did not have HRD. Only 32% of days (195 days in total) produced HRD and
almost half (48%) of the 195 days with HRD had just one or two heat-related calls. HRD

42
are scattered across most areas of Chicago, but the downtown area, where a large number
of people work, has the highest concentrations of HRD.
Table 6. Annual HRD Count and Monthly Distribution of HRD calls by Percentage of Calls.
Year HRD Count
May % June % July % Aug % Sept %
2003 152 1.3 13.8 37.5 44.7 2.6 2004 77 1.3 40.3 27.3 23.4 7.8 2005 351 0 40.7 41.5 15.2 2.7 2006 516 5.8 5.4 53.5 35.3 0 2003-2006 1114 2.8 20.6 45.6 29.2 1.8
Seasonality, Monthly, and Diurnal Trends
As previously mentioned, HRD are primarily a summer occurrence, with most
HRD occurring in June, July and August during periods of high maximum temperature,
and high maximum heat index (Fig. 7 a and b). The curves generated for maximum
temperature and maximum heat index are, not surprisingly, very similar. However, the
“top of the curve” for heat index is higher than that of maximum temperature. Time-
series analyses, using the seven day and thirty day moving averages, smooths out the day
to day variances, and emphasizes trends in the data (Fig.7c, 7d, 7e and 7f). The seven
day moving average for HRD, maximum temperature and maximum heat index, one can
identify periods of high HRD, maximum temperature and maximum heat index. During
June, July and August periods of high temperature and heat index, there is a
corresponding increase in HRD. However, during the early or late season, some spikes in
temperature and humidity do not necessarily increase HRD (see Fig. 7c and 7d ---
September 2003, May 2004 and September 2005). The 30 day moving average (Fig. 7e
and 7f) clearly show annual trend differences of HRD. Years with higher HRD tend to
have higher maximum temperature and maximum heat index, with seasonal patterns of
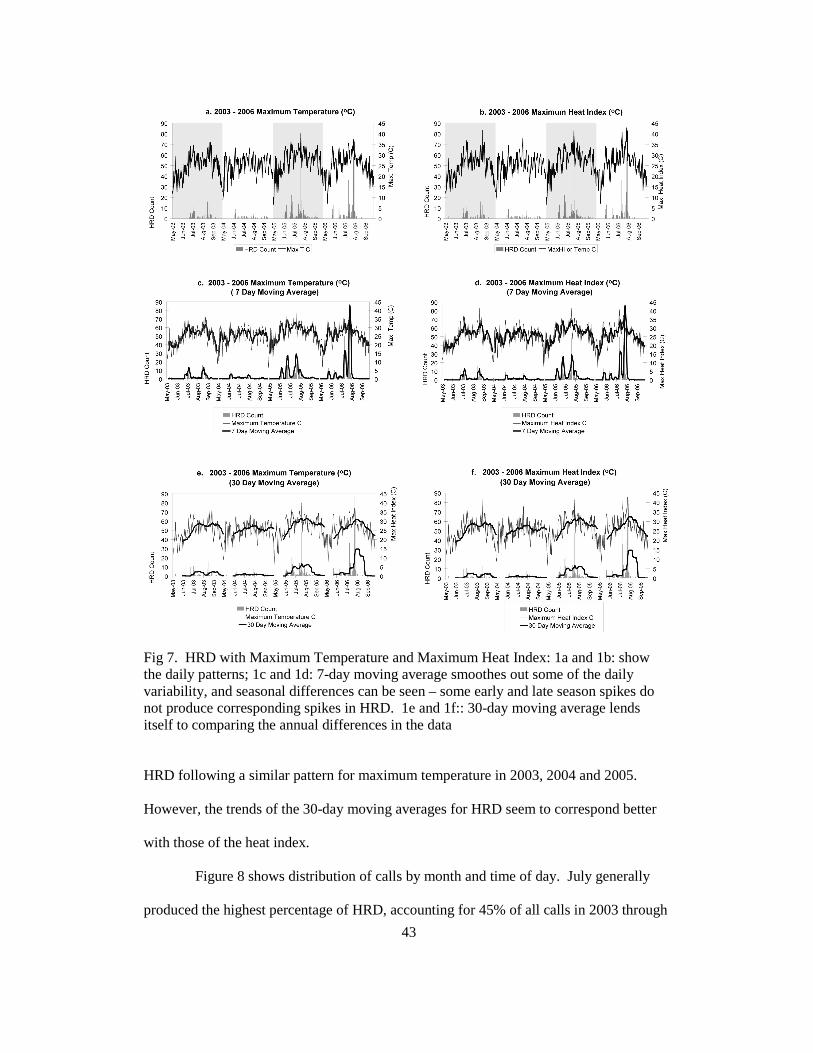
43
Fig 7. HRD with Maximum Temperature and Maximum Heat Index: 1a and 1b: show the daily patterns; 1c and 1d: 7-day moving average smoothes out some of the daily variability, and seasonal differences can be seen – some early and late season spikes do not produce corresponding spikes in HRD. 1e and 1f:: 30-day moving average lends itself to comparing the annual differences in the data
HRD following a similar pattern for maximum temperature in 2003, 2004 and 2005.
However, the trends of the 30-day moving averages for HRD seem to correspond better
with those of the heat index.
Figure 8 shows distribution of calls by month and time of day. July generally
produced the highest percentage of HRD, accounting for 45% of all calls in 2003 through

44
2006. May and September, with their lower temperatures, consistently had much lower
HRD than June, July and August. However, as can be seen in Table 6, the percentage of
HRD calls varied by year andJuly generally produced the highest percentage of HRD
(between 27.3% and 53.3%). In 2004, June had the highest percentage of HRD with
40.3% of calls while July produced only 27.3%.
HRD also vary considerably by time of day. Each year produced a similar
pattern with few calls overnight, between 2300 and 800 LT (local time). Calls increased
in volume until 1500 LT, and reduced beginning in late afternoon and through the night
(Fig. 8). Almost 60% of HRD take place during the hottest part of the day, between 1200
and 1800 LT. The next highest percentage of calls occur from 1800 to 2400 LT when
temperatures are beginning to cool down but are still relatively high, and when victims
could also be reacting to the stresses caused by the high temperatures from earlier in the
day.

45
Fig. 8. Percentage of HRD by month (a); hour (b); and time of day (c).

46
Spatial Analyses
Results of the spatial autocorrelation analysis of the HRD data (Table 7) indicates
a considerable amount of clustering for the full data set and for all years except 2004 (z-
scores and p-values <0.05 or >0.95 show statistical significance). Moran's Index
(Moran's I) values closer to -1 are dispersed, +1 clustered and O is random (ESRI 2012).
2004 with only 77 HRD, has a Moran's I of 0.02 (p-value 0.96) indicating the spatial
pattern of HRD was random but statistically significant. This could simply be the result
of such a low number of HRD. The 2006 heat wave, with 301 HRD, had a Moran's I of
0.36, indicating a pattern of clustering, but it was not statistically significant with a p-
value of 0.25, and thus the pattern could be by random chance.
Table 7. Results of spatial autocorrelation analyses. Moran's Index values closer to -1 are dispersed, +1 clustered and O is random. (* p-value is statistically significant at the 0.05 level)
Time Period HRD Count
Moran's Index
Z Score*
2003 - 2006 1114 0.346675 10.008258* 2003 152 0.572024 3.399495* 2004 77 0.022457 0.049824* 2005 351 0.519885 7.955723* 2006 516 0.474861 3.564491* 2006 Heat Wave 301 0.369871 1.133713
The one kilometer grid maps of the city provide a tool to compare the spatial
distribution of calls for different time periods, using percentage of HRD. Many
southeastern and northwestern grid areas of Chicago had no HRD calls during 2003 to
2006 (Fig. 9).

47
Fig. 9. Percentage of HRD by1 Kilometer Grids for Chicago. (a) 2003 – 2006 All Calls (b) 2006 Non-heat wave days (c) 2006 heat wave days. The Central Business District is indicated by the box.
The grid maps show the largest concentration of calls occurring in and nearby to
the central business district (CBD). Without demographic information on the HRD we
cannot know if some of these calls are produced by homeless in the area, people working
in the area, or even living in the numerous high rise condominiums or other older stock
(unairconditioned) housing that are located in or near the CBD. However, the high
concentration of HRD in the CBD may simply be a result of the area's high daytime
population density. It may also be impacted by recreational activities, as a number of
HRD were at locations adjacent to Grant Park, which attracts joggers/runners and is also
the location of many ball fields. Interestingly, there is not a statistically significant
clustering of HRD during the heat wave period of 2006. This is supported by the grid
maps of percentage of calls for that grid – it is one of the few time periods examined that
did not show a high concentration of HRD in the CBD. We can only speculate on the

48
reason for this lower percentage of HRD during the heat wave. It may be that people
working in offices or living in modern condominiums in the CBD have easy access to air
conditioning, which provides respite and protection from the intense heat. It could also
be that people living and working in the CBD choose to limit their outdoor activities and
thus reduce their exposure when the heat and humidity are very high for such an extended
period of time. Additional demographic information on the victims of HRD or an in-
depth sociological study might help elucidate some of the reasons for the clustering of
HRD found in the CBD, but is beyond the scope of this paper.
Climate and HRD
Few days (7 of 231 days) had HRD when the maximum temperature was <
23.9°C (75°F) during the months of May through September, 2003 - 2006. Of the 27
days with a maximum temperature of 25°C (77°F), five had HRD, two of which had 2
HRD. Only when maximum temperature reached 28.3°C (83°F) did more than two HRD
occur. A maximum temperature that was higher than the normal maximum temperature
is present on 76% of days with HRD—by an average of 2.4°C (4.3°F) higher than the
normal maximum temperature (Table 8). Days with HRD also had higher than normal
minimum temperatures, by an average of 2.6°C (4.7°F).
Generally, the higher the HRD, the higher maximum temperature was above
normal (Fig. 10). Days with < 5 HRD had a mean maximum temperature of 29.2°C
(84.6°F) a bit higher than the normal mean maximum temperature of 28°C (82.4°F).
Days with a high number of HRD (10 to 20 HRD) had a mean ambient air temperature of
33.8°C (93°F) but a “normal” maximum temperature of 28.5°C (83.3°F). On days with
very high HRD (>20) the mean maximum temperature averaged 6.3°C (11.3°F) higher

49
than normal. Typically, days with HRD had high enough humidity to create a heat index
that averaged 0.5°C (0.9°F) higher than the mean maximum air temperature. Again, as
with maximum air temperature, the number of HRD increased as maximum heat index
increased, particularly when compared to the normal air temperature for that date. Days
with < 5 HRD had a mean heat index of 29.3°C (84.7°F) only a bit higher than the
measured air temperature of 29.2°C (84.6°F). On the days with very high HRD (>20)
the mean heat index was 39.0°C (102.2°F) — 3.6°C (6.5°F) higher than the ambient air
temperature but 10.1 °C (18.2°F) higher than the mean normal air temperature (Table 8).
This suggests that there is likely a fairly strong correlation between the increase in the
number of HRD and increased temperature and heat index.
Fig. 10. Temperature and Maximum Heat Index and Normal Maximum Temperature with Grouped HRD. Black bars show maximum temperature; dark gray bars are the maximum heat index and light gray bars are normal maximum temperature.
The results of the stepwise regression are seen in Tables 4, 5 and 6. Of the 10
independent variables, only Early/Late Season did not return a statistically significant
relationship to HRD (p>0.05). Many of the remaining climate variables were
considerably autocorrelated, including some of the four variables that contributed to an

50
adjusted R2 value of 0.397: Maximum Temperature's Difference From Normal Maximum
Temperature; the Number Of Preceding Consecutive Days With Heat Index Exceeding
Normal Maximum Temperature; Maximum Temperature; And Dew Point.
Table 8. Mean and normal Maximum Temperature, Maximum Heat Index and Minimum Temperature Categorized by HRD Counts. The first column shows the number of days within each category.
Number of Days
Mean Max
Temp °C
Mean Max Heat
Index °C
Mean Normal
Tmax °C
Mean Minimum Temp °C
Mean Normal
Minimum Temp °C
All HRD 195 30.4 30.8 28.0 20.2 17.6 >20 HRD 9 35.4 39.0 29.1 24.9 19.2 10 to 20 HRD 17 33.8 34.9 28.3 22.9 17.8 5 to 9 HRD 34 31.9 32.4 28.1 21.2 17.6 <5 HRD 135 29.2 29.3 27.9 19.3 17.7 Table 9. Stepwise Regression Models and Results. Table shows R, R2, Adjusted Rs and Standard Error of the estimate. See Table 10 for the variables included in in each model
Model (see Table 10 for variables)
R R Square Adjusted R Square
Std. Error of the Estimate
1 .522 .273 .272 5.741 2 .594 .353 .351 5.419 3 .616 .380 .377 5.311 4 .633 .401 .397 5.223
Table 10. Stepwise Regression Variables. Table shows the variables that are included in the stepwise regression and the resulting Pearson's correlations to HRD.
* Variable in Model Included In Model Number
Pearson's Correlation to HRD (p<0.05)
Heat Index difference from normal maximum temperature
1, 2, 3, 4 0.522
Number of consecutive preceding days with heat index exceeding normal maximum temperature
2, 3, 4 0.429
Maximum Temperature 3, 4 0.394
Dew Point 4 0.330

51
Table 11. Stepwise Regression Results. Table shows the variables included in the stepwise regression and the resulting Pearson's correlations to HRD.
HRD Count
MHI Difference from
Normal Max Temp
Consecutive Days HI > Norm Tmax
Temp Max Temp
Dew Point
HRD Count 1.000* .522* .429* .394* .330*
MHI difference from Normal Tmax °C
.522* 1.000* .305* .226* .433*
Consecutive Days HI T > norm Tmax .429* .305* 1.000* .533* .427*
Tmax °C .394* .226* .533* 1.000* .771* Dew Point °C .330* .433* .427* .771* 1.000*
The variable “Early/Late Season” also did not show a statistically significant
relationship to HRD as a separate variable, however, seasonality comes into play with the
strongest variable in the stepwise regression results: “Difference between Maximum
Heat Index and the Normal Maximum Temperature”. This variable, instead of being
simply the measured maximum heat index, is better defined as the difference between the
weather that residents experience versus what they would typically expect to encounter at
that time of year. The second variable identified as significant – “Number of Preceding
Days with a Heat Index Exceeding Normal Maximum Temperature” – is consistent with
heat morbidity and mortality studies that show increasingly negative health impacts with
cumulative days of high temperatures (Saez et al. 1995; Hajat et al. 2006).
We used Pearson's correlations to identify statistically significant relationships
between the HRD and the variables identified in the multiple regressions and maximum
heat index, and to ascertain if one proved a stronger predictor of HRD. Results show a
statistically significant (p<0.0005) relationship to maximum temperature for the entire
data set (May – September, 2003-2006), however, it is not overly strong, with an R-value

52
of 0.398 (Table 10). The relationship improves for heat index (r = 0.468, p<0.0005).
Mean minimum temperature statistical analyses were essentially identical to those for
maximum temperature – only few percentage points different for the statistical analyses –
therefore are not reported separately. Correlations on HRD to maximum temperature
and to heat index improved considerably when including only days with HRD, with R-
values going from 0.398 to 0.537 for maximum temperature, and from 0.468 to 0.641 for
maximum heat index. The relationship between HRD and maximum temperature or heat
index in Chicago becomes exponential rather than linear, when temperatures rise above
about 32°C (89.6°F) and heat index above 36°C (96.8°F) (Fig. 11). However, there are
exceptions to this, which will be discussed later. Given the steep increase in HRD with
higher maximum temperature and maximum heat index, cubic regression model analyses
proved to be a much better fit than linear regression.
Cubic regression model analyses, which fits a third order polynomial to the data,
thereby incorporating a better fit to the steeply rising HRD with increasing temperature
and heat index, were run using the entire data set and also on the data set with only HRD
days. Both returned high and statistically significant (p<0.05) relationships. Unlike the
Pearson's correlations, the R2 values were quite similar between the full data set and the
data set with only the HRD days (Table 12). For example, for temperature and HRD the
values were 0.511 for the full data set versus 0.488 for the data set with only HRD days.
However, the differences were substantial between temperature and heat index. The R2
values for heat index, which takes into consideration the impacts of humidity and
temperature, jump more than 20 percentage points – from 0.511 to 0.712 for the full data
set and 0.488 to 0.700 for the data set with HRD only. Thus, from these analyses, we
find that though maximum temperature is a predictor of HRD calls, heat index is a more
effective predictor.
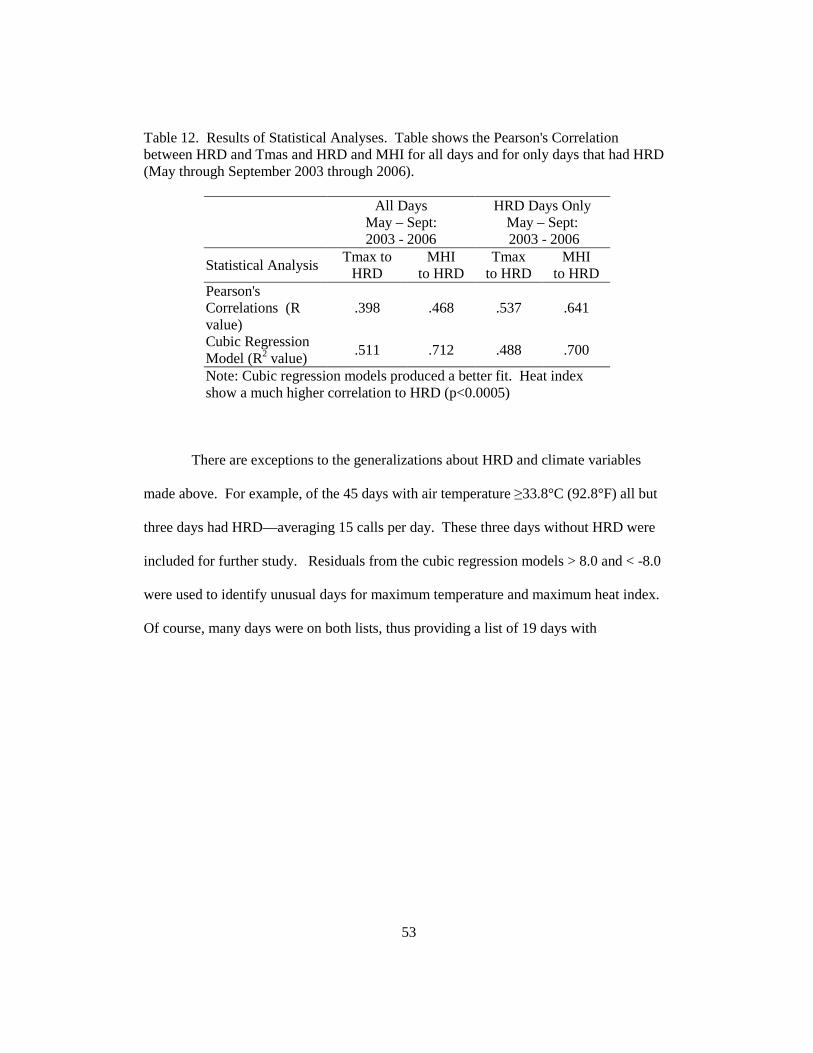
53
Table 12. Results of Statistical Analyses. Table shows the Pearson's Correlation between HRD and Tmas and HRD and MHI for all days and for only days that had HRD (May through September 2003 through 2006).
All Days
May – Sept: 2003 - 2006
HRD Days Only May – Sept: 2003 - 2006
Statistical Analysis Tmax to
HRD MHI
to HRD Tmax
to HRD MHI
to HRD Pearson's Correlations (R value)
.398 .468 .537 .641
Cubic Regression Model (R2 value)
.511 .712 .488 .700
Note: Cubic regression models produced a better fit. Heat index show a much higher correlation to HRD (p<0.0005)
There are exceptions to the generalizations about HRD and climate variables
made above. For example, of the 45 days with air temperature ≥33.8°C (92.8°F) all but
three days had HRD—averaging 15 calls per day. These three days without HRD were
included for further study. Residuals from the cubic regression models > 8.0 and < -8.0
were used to identify unusual days for maximum temperature and maximum heat index.
Of course, many days were on both lists, thus providing a list of 19 days with

54
Fig. 11. Maximum Temperature and Maximum Heat Index Scatterplot with Trendlines. HRD generally increase exponentially with increasing maximum temperature and maximum heat index. Days with very high HRD have a much higher maximum heat index than maximum temperature
“unusually high or low” HRD. These unusual days received a detailed examination in an
attempt to identify other possible reasons for why there might have been fewer or more
HRD than was typical for the climatic conditions recorded. Eight of these identified days
occurred during a period of unusually high temperatures from July 15 through August 2,
2006 and are discussed later in the detailed look at 2006. Two other days simply had
unusually low temperatures and did not produce any calls. Eight had unusually low HRD
for the measured maximum temperature or heat index. Four days had a relatively high
heat index but had only a few calls. Hourly data and precipitation data show the heat
index on these four days' peaked by early afternoon, but more importantly, the city
experienced rainfall in early to mid-afternoon that brought lower temperatures and relief
to residents, thus reducing the number of HRD that would typically happen on a day with
such a high maximum heat index or temperature.

55
Several days with very high HRD experienced rapidly rising temperature and
humidity throughout the afternoon, and in one case, into the early evening. Exposure to
such a prolonged period of increasingly high temperatures and humidity seem to be a
driving factor on many days with anomalously high HRD. An extreme example of this
condition is July 25, 2005 with 17 HRD, though the heat index only hit 35.6°C (96.1°F)
while similarly hot days produced an average of 9 calls. Examination of hourly data
provides illumination of the conditions that accompanied such a spike in calls. At noon
on July 25, 2005, the heat index was 23.9°C (75.0°F), climbing rapidly to 29.4°C
(84.9°F) by 1 pm and then steadily rose until hitting the maximum heat index for the day
of 35.6°C (96.1°F) at 7 pm. Such a rapid rise in heat index for such a prolonged period
could explain the high number of HRD. However, for other days, like earlier in the same
year, on Saturday, June 25, 2005, simple climate conditions did not lend itself to an
explanation of unusually high HRD. On this day, a maximum temperature of 32.2°C
(90°F) with a heat index 32.8°C (91°F) was measured at noon and again at 2 pm, and
then steadily cooled down. It was hot and humid, but not enough to routinely produce the
22 HRD—many more than would typically be seen at this level of temperature and
humidity. The Chicago Tribune newspaper reported a widespread power outage affecting
51,000 customers, beginning at 8:30 pm on June 25, 2005, however, only two HRD
happened after 8:30 pm (Sheehan and Noel 2005). Six HRD occurred between 2 and 4
pm from the same location, Grant Park. Investigation shows it as the venue of the
Chicago Country Music Festival June 25th and 26th, 2005 (Chicago, 2008). Special
events such as this, on a relatively hot, humid, though not stifling, day can contribute to
abnormally high HRD. On the second day of the festival, Chicago experienced far fewer
HRD (13) despite having a maximum heat index of 2.4°C (4.5°F) hotter. A reduction in
HRD such as this might be a reflection of fewer participants. However, given the

56
previous day's experience, it is hoped that festival or city officials would have undertaken
mitigation or education measures, thus reducing the number of HRD calls on Sunday.
Annual HRD variability aligns with the mean temperature and heat index
differences (Table 13). For example, though the summer of 2004 had the lowest number
of HRD (77), it did not have the overall lowest mean temperature or heat index May to
September. However, for days with HRD, 2004 did have the lowest mean maximum
temperature and mean maximum heat index. Table 13 shows the five highest HRD days
for each year and the degree to which 2004's days were much cooler can be seen.
Examination of the five highest HRD days each year consistently show higher
temperature and heat index with higher HRD. 2006 had HRD calls ranging from 40 to
87 HRD for these five days, and a mean maximum heat index of 41.1°C (106°F) – 12°C
(21.6°F) above the normal maximum air temperature. 2006, in addition to being the year
with the largest number of calls, also had seven of the eight highest HRD days, averaging
52 calls per day for these 7 days. The summer of 2006 had several extended periods of
high temperature and humidity, which initiated further evaluations of the data.
Table 13. Annual HRD Counts and Averages and the Associated Mean Tmax, MHI and Normal Tmax for Days with HRD and the Five Highest Days of HRD.
YEAR HRD Count
Mean HRD Count/day
Mean Tmax °C
Mean MHI °C
Mean Normal
Tmax °C Only Days with HRD
2003 152 3.4 29.9 30.4 28.0 2004 77 2.0 28.5 28.9 27.8 2005 369 6.4 31.5 31.6 28.5 2006 518 14.8 31.2 32.4 28.4
Highest 5 days of HRD per year 2003 5 11.6 33.8 35.6 28.2 2004 5 5.8 31.0 31.2 27.2 2005 5 24.6 35.0 35.7 28.7 2006 5 60.8 35.9 41.1 29.1

57
Summer 2006
A detailed look at an extended period of high heat and humidity during the
summer of 2006 produced some insight into climate indicators for days with very high
HRD. The summer of 2006 was the hottest of these four years. It experienced a heat
wave from 25 July to 2 August, when there was an average of 34 HRD per day. This
heat wave produced the three highest HRD days in Chicago during these four years. 31
July, 1 and 2 August averaged 71 calls per day (58, 87, and 69, respectively) and also
experienced a very high maximum air temperature. The mean maximum air temperature
during this three day period was 36.7°C (98°F), while the normal temperature would have
been 28.9°C (84°F). More importantly, the maximum heat index during the three days
reached an astonishing 42.4°C (108°F). The chart in Figure 12 shows two periods of
high heat that begin with the period from 13 July (prior to the 25 July heat wave), when
several days also experienced high heat and humidity but considerably lower HRD. This
early period of high heat and humidity may have played a role in already putting stress
upon residents susceptible to extreme heat prior to the period of even longer and more
intense heat and humidity that took place less than two weeks later. During the heat
wave of 25 July through 2 August, 2006, the number of HRD rose dramatically. A slight
lag in HRD is also seen in the data set. 31 July, had the highest maximum air
temperature of 37.2°C (99°F) and the highest maximum heat index at 43.1°C (110°F) but
it was not until the next day, Tuesday, 1 August, with a slightly lower ambient air
temperature and maximum heat index that the highest number of HRD at 87 occurred.
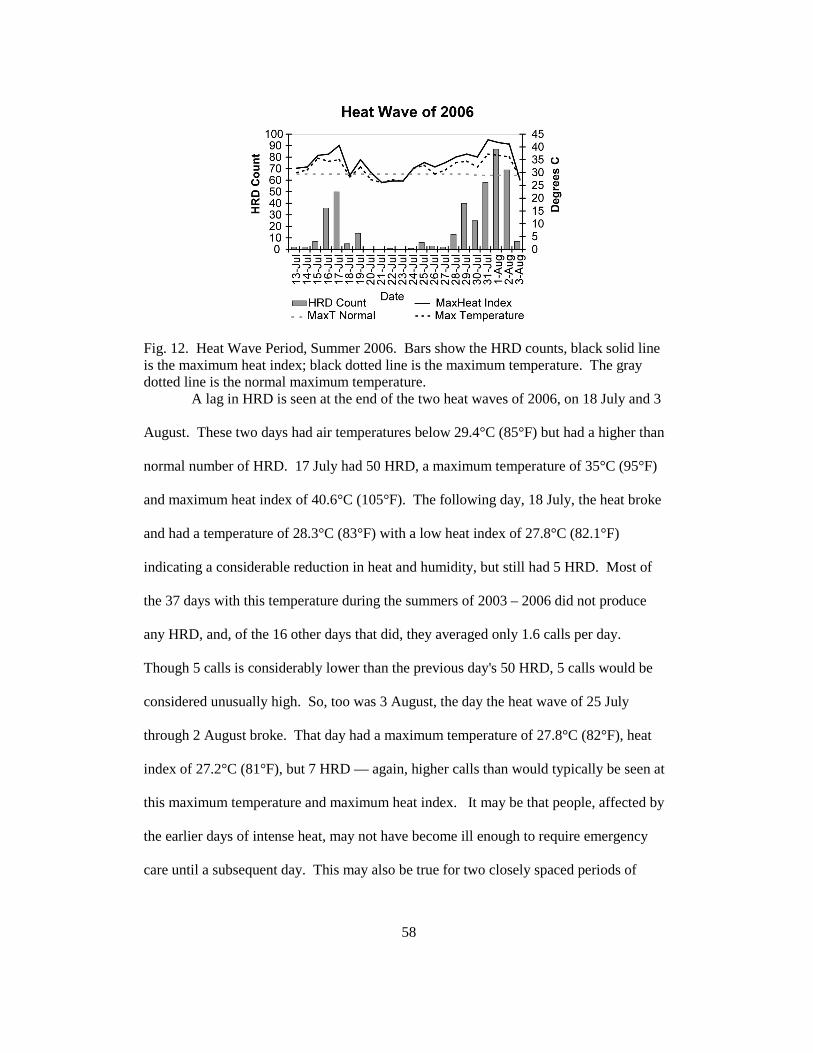
58
Fig. 12. Heat Wave Period, Summer 2006. Bars show the HRD counts, black solid line is the maximum heat index; black dotted line is the maximum temperature. The gray dotted line is the normal maximum temperature.
A lag in HRD is seen at the end of the two heat waves of 2006, on 18 July and 3
August. These two days had air temperatures below 29.4°C (85°F) but had a higher than
normal number of HRD. 17 July had 50 HRD, a maximum temperature of 35°C (95°F)
and maximum heat index of 40.6°C (105°F). The following day, 18 July, the heat broke
and had a temperature of 28.3°C (83°F) with a low heat index of 27.8°C (82.1°F)
indicating a considerable reduction in heat and humidity, but still had 5 HRD. Most of
the 37 days with this temperature during the summers of 2003 – 2006 did not produce
any HRD, and, of the 16 other days that did, they averaged only 1.6 calls per day.
Though 5 calls is considerably lower than the previous day's 50 HRD, 5 calls would be
considered unusually high. So, too was 3 August, the day the heat wave of 25 July
through 2 August broke. That day had a maximum temperature of 27.8°C (82°F), heat
index of 27.2°C (81°F), but 7 HRD — again, higher calls than would typically be seen at
this maximum temperature and maximum heat index. It may be that people, affected by
the earlier days of intense heat, may not have become ill enough to require emergency
care until a subsequent day. This may also be true for two closely spaced periods of
59
intense heat, thus driving even higher HRD in the second round as experienced 25 July
through 2 August 2006, which had three days with more than 50 HRD.
Conclusions
Heat-related illness and death are cause for community and national concern. In
recent years, much emphasis has been given to climate change and the impact that heat
has on the population of cities. Officials from the City of Chicago, in the wake of the
heat wave of 1995 that caused more than 700 deaths (Klinenberg 2002) are very
conscious of the impact of heat in their city. Every year, heat-related illness is an issue in
Chicago. They are distributed across most parts of the city, with the highest
concentrations of HRD occurring within the central business district.
It is clear from these Chicago HRD data of 2003 through 2006 that heat-related
emergencies are largely driven by climate, and HRD can begin to climb exponentially as
the maximum temperature rises above 32°C (89.6°F) and heat index rises above 36°C
(96.8°F) in Chicago. Higher than normal temperatures play a critical role in HRD calls;
76% of days with HRD have higher than normal maximum temperature. When
maximum temperature rises above 30°C (86°F) most days will have HRD, and the
number of calls begin to rise rapidly. However, the highest number of HRD occurs when
the heat index is considerably higher than the normal maximum temperature, and even
the measured ambient air temperature. Days with a high heat index produce high HRD
and the statistical analyses confirm that humidity accompanied by high air temperatures
plays an even more critical role, with regression coefficients increasing by more than 20
points for maximum heat index and HRD.
We identified several thresholds of climate conditions associated with high HRD.
With few exceptions, when the maximum heat index hits 31°C (87.8°F), city officials can

60
expect HRD, and in many situations, multiple calls. For example, 50% of days with
HRD and a maximum temperature or maximum heat index above 31°C (87.8°F) will
have greater than 5 HRD. The thresholds for 10 HRD begins when the maximum
temperature reaches 31.7°C (89°F), but the maximum heat index is more than one degree
higher at 32.8°C (91°F). However, when days reach a maximum heat index of 35°C
(95°F), one can expect more than 10 calls per day. However, there are exceptions to this.
Lower than normal HRD can be expected when maximum temperature and humidity
levels are reached early in the day and then drop due to rainfall interrupting the upwards
climb of discomfort. Higher than normal numbers of HRD calls can be generated when
the heat index climbs very rapidly by midday and continues to rise more slowly, as the
day progresses.
There appears to be a lag in HRD on particularly hot days – calls continue into
the evening, even after temperatures begin to drop. Also, during periods of high heat and
humidity, the highest day for HRD calls does not necessarily happen when temperatures
are highest - but sometimes occurs on the following day. HRD can be higher than would
be typically be generated at that level of heat and humidity on the first cool day at the end
of a heat wave.
There is variability in the HRD data that could not be directly attributed to
climate. We found that outdoor special events can generate more HRD than would
typically be seen at those temperatures. On the other hand, early afternoon rainfall on
days that reach a high maximum temperature or heat index early in the day will have
lower HRD than would typically be expected. Overall, however, a high maximum
temperature, and even more so, a high heat index can be a very good predictor for HRD.
As the issue of climate change captures the attention of the public, emergency
responders, city officials and policy makers, understanding the nuances of the climate
61
drivers on heat-caused illness should be front and center of the discussion. Cities are
often warmer than surrounding rural areas. With predictions of increased frequency and
intensity of heat waves due to climate change, it is even more important to understand the
climate linkages to increased heat-related emergency 911 calls. Quantification of HRD
climate thresholds and understanding special circumstances which produce anomalously
high (or low) HRD could be quite beneficial in mitigation strategies, and help
communities successfully plan for the likelihood of large increases in emergency calls,
and assist in maximizing management of emergency personnel and resources, now and in
the future.

62
Chapter 4
A COMPARATIVE CLIMATE ANALYSIS OF HEAT-RELATED EMERGENCY 911
DISPATCHES: CHICAGO, ILLINOIS AND PHOENIX, ARIZONA USA 2003 TO
2006
Hartz DA, Brazel AJ, Golden J. A Comparative Climate Analysis of Heat-Related Emergency 911 Dispatches: Chicago, Illinois and Phoenix, Arizona USA 2003 to 2006. Submitted to International Journal of Biometeorology – in revision.
Abstract
Large numbers of heat-related deaths and illnesses occur during high heat events
such as those experienced during the 1995 heat wave in Chicago and the more recent
2003 heat wave in Europe (Golden et al 2008). The summers of 2010 and 2011 were
some of the hottest on record in many areas of the world (Blunden et al. 2011; NOAA
2011b), exposing large numbers of people to longer and more intense heat. Events such
as these illustrate the importance of careful public safety planning and implementation of
strategies to reduce heat-related mortality (HRM) and heat-related illness (HRI). HRM
and HRI can be avoidable through effective planning by local and regional authorities.
However, to be effective, emergency planning requires a heat health watch and warning
system (HHWWS) that is calibrated for the local climate, living conditions and residents'
experience with high heat (Ebi 2007, Kalkstein et al. 2009). Hot weather conditions that
severely impact residents of one city causing large spikes in heat-related illnesses and
deaths, may not generate similar increases in other cities. Studies such as Curriero et al.
(2002), Medina-Ramon and Schwartz (2007), Sheridan and Kalkstein (2010) and
Anderson and Bell (2011) found regional differences in summertime mortality and HRM
in North America. Southern cities did not experience increased mortality. This is often

63
attributed to wide-spread use of air conditioning and possible acclimatization. HRI
patterns may follow a similar pattern.
Our study, which uses heat-related emergency (911) dispatches (referred to as
Heat-related Dispatches - HRD) in Phoenix, Arizona and Chicago Illinois USA, expands
upon two previous HRI studies of Golden et al. 2008 and Hartz et al. 2011. The purpose
of this study is to provide an analysis of the climate conditions associated with heat-
related 911 emergency dispatches (HRD) using four years of data (2003 – 2006) from
two regionally and climatically different cities. Phoenix is located in the hot, arid desert
of southwestern United States, and Chicago, in the upper mid-western U.S, with a cooler
more temperate climate. Heat-related emergency dispatch data are a much larger data set
than that of mortality data. We identify and compare the climate conditions associated
with increased HRD between these two cities. Analysis of these data can be helpful in
forming strategies and plans to reduce the impact of predicted increased risks from high
heat events. Increased risk is associated with increasing temperatures due to
urbanization, and also a growing elderly population, a demographic group who is more
vulnerable to heat stress and illness (Kovats and Hajat 2008, Luber and McGeehin 2008).
Additionally, increases in HRM and HRI could also become a reality if possible climate
change conditions increases frequency and intensity of heat waves, as warned by
organizations such as the Intergovernmental Panel on Climate Change and the World
Health Organization (Parry 2007, WHO 2003). Development of HRM and HRI
reduction strategies is frequently interdisciplinary, involving research scientists such as
epidemiologists, social scientists, climatologists, and community decision makers who
are involved with emergency planning aimed at reducing HRM and HRI. Large numbers

64
of HRM and HRI occur each year, often associated with heat waves, but, as in the case of
Phoenix, HRI occur almost every day during the summer months (Golden et al. 2008).
Since the turn of the 21st century, a proliferation in literature on HRM and HRI
illustrates the increased interest and efforts to reduce the impact of HRM and HRI. The
heat health literature has been dominated by HRM studies and is primarily focused on
urban settings. In cities, conditions can be much hotter than nearby rural areas,
particularly at night, due to the phenomenon known as an “urban heat island” thus
increasing urban residents' heat exposure and increasing their vulnerability to heat.
However, the past decade has brought more research focused on HRI, the precursor of a
heat caused death. Comparisons between HRI studies are difficult because data, methods
and time frames can vary considerably. Illness data can be actual incident data such as
emergency call data (Golden et al 2008, Basil et al. 2009, Hartz et al 2011) or emergency
department visits, hospitalizations or a combination of these (Bassil et al. 2009,
Knowlton et al. 2009). Data can also be estimates of HRI made from identification of the
“excess” of emergency calls – the increase in emergency calls or emergency room visits
from a typical day – a methodology used by Weiskoff et al. (1992) for Milwaukee,
Wisconsin or by Dolney and Sheridan (2006) for Toronto, Ontario. Time periods also
vary. Some are limited to heat wave periods (Dolney and Sheridan 2006; Knowlton et al.
2009) while others use data that spans multiple years (Dolney and Sheridan 2006, Golden
et al 2008, Bassil et al. 2009, Hartz el al. 2011). Our study, spans multiple years and uses
essentially the same types of HRD data, although there are some caveats which we
discuss in greater detail in our methods.

65
Study Areas
Chicago, Illinois is a city of approximately 2.8 million people located in the
upper mid-western region of the United States and sits on the southeastern edge of Lake
Michigan. It encompasses an area of 227 square miles (588 square kilometers) and is
densely populated, averaging 12,750 people per square mile (U.S. Census Bureau 2009).
Chicago's climate is one of extremes. Its humid continental climate can produce frigidly
cold days during winter and hot, humid days during the summer. January's normal high
temperature averages –0.5°C (31°F) with temperatures dropping below -17.8C (0°F ),
and July's normal high temperature is 28.8°C3 (84°F) with numerous days hitting high
temperatures >32.2°C (90°F), and occasionally reaching 37.8°C (100°F) (NOAA 2008).
Our Phoenix study area includes most of the cities within the metropolitan
Phoenix, Arizona (the 911 response area) with a population size of about 2.7 million
residents. Located in Maricopa County this area is much larger and less densely
populated than Chicago. It encompasses 9203 square miles, but that also takes into
account a large amount of undeveloped land, including some large parks and preserves.
Maricopa County's average population density is 414 people per square mile (Census
2010), but density varies from city to city within our study area, and ranged from about
6200 people per square mile to only 44 people per square mile.
Phoenix's climate is much hotter and drier than Chicago's. The hot, arid desert
climate averages a daily high temperature (Tmax) of 19.5°C (67.1°F) in December (its
coolest month) and 41.4°C (106.6°F) in July (NOAA 2008). From 1979 through 2006
Phoenix averaged 109 days each year with temperatures exceeding 37.7°C (100°F) and
18 days above 43.3°C (110°F); and once hit an all-time high temperature of 50°C

66
(122°F). Phoenix experiences a considerable UHI effect of about 5.5°C to 8.3°C (10 to
15°F) year round (Brazel et al. 2000).
The synoptic weather patterns of Phoenix and Chicago are very different,
particularly during the warm weather seasons in our study. Large-scale weather patterns
are associated with changing air masses ranging from moist to dry, and from cool to hot
during our study period. Spatial Synoptic Classification (SSC) data were used for air
mass types (Sheridan 2010). The SSC air mass types that are associated with a “hot”
weather regime are: “Dry Tropical” (DT); Moist Tropical (MT); Moist Tropical plus
(MT+); and Moist Tropical double plus (MT++), with MT+ and MT++ being the two
most oppressive air mass classifications. SSC classifications are adjusted to the local
climate conditions thus air masses that would classify as MT+ in Chicago are likely not
to be the same classification in Phoenix. SSC in Chicago were quite variable, during our
study period from the coolest driest conditions (Dry Polar – DP) to Moist Tropical++,
often changing every few days, though some air masses can linger on for a week or more.
The percentage of days with moist versus dry conditions are about the same. MT, MT+
and MT++ occurred on 21% of days during our study period and 4% of days were
classed as MT+ and 5.4% days an MT++. In Phoenix, the weather is much more stable,
particularly during early to mid-summer, when Dry Topical air masses dominate. DT
conditions occurred on 61% of days between 1April through 31 October. Later in the
summer Phoenix experiences a summer “monsoon” rainy season which can last into early
fall, which brings intermittent thunderstorms and a considerable rise in humidity, causing
hot and humid days. MT, MT+ and MT++ occurred on 14% of days and MT+ and
MT++ on 8.8% of days.

67
Methods
Our data include climate and heat-related emergency dispatch (HRD) data for the
years of 2003 through 2006. In both cities, the HRD are 911emergency calls that were
identified and coded as heat-related by the responding emergency personnel. These data
include the date, time and location of the 911 call, but no additional demographic data.
One of the difficulties with data used in heat-related illness and mortality studies is that
there is no standardization for the criteria used to identify a heat-related illness or death.
Thus, there is the possibility that the same criteria were not always used between Phoenix
and Chicago or even among the different response teams within the same city. However,
although these are caveats with the HRD data, these limitations should not negate use of
these data, but does require careful interpretation of results and conclusions.
Chicago's HRD are from the City of Chicago Office of Emergency Management.
All but two occurred during the warm/hot weather season of 1 May and 30 of September.
These two dates, one in October and one in January, had one HRD each and, as outliers
are excluded from our analysis. Chicago has a population (approximately 2.8 million) is
similar in size to the population served by Phoenix's 911 call center. Phoenix HRD data
are from the Phoenix Fire Department's 911 call center with a regional jurisdiction that
includes the majority towns in Maricopa County: including the cities of Phoenix,
Buckeye, Chandler, Glendale, Goodyear, Guadalupe, Paradise Valley, Peoria, Surprise,
Tempe, Tolleson, and, as of 2005, Scottsdale. It does not include the large nearby city of
Mesa, which at the time of the study had its own 911 call center. In Phoenix 98% of
HRD occurred during its the warm/hot weather months of 1 April to 31 October, though
100+ calls (2%) occur outside of those months, and are included in the analyses, except
where noted (when an analysis was limited to the hot weather months).

68
For Chicago's climate data we chose to use climate data from the Federal
Aviation Administration's Automated Surface Observing System (ASOS) station, which
is located at Midway International Airport, rather than Chicago's official National
Weather Service station at O'Hare International Airport. The Midway station is more
centrally located and thus is more likely to be representative of the weather conditions in
within Chicago. The Phoenix climate data are the weather data recorded at the National
Weather Service's ASOS station located at Sky Harbor International Airport. Phoenix's
hourly and normal climate data were acquired from the Arizona State Climate Office.
Additional climate data are from the National Climatic Data Center.
Climate data includes hourly temperature, dew point, and relative humidity as
well as daily maximum (Tmax) and minimum (Tmin) temperature, and the daily normal
maximum and minimum temperature for both cities. The daily maximum heat index
(MHI) is the highest calculated heat index for each day using hourly temperature and
relative humidity using the National Weather Service's formula (Rothfusz 1990), which is
derived from Steadman (1979):
where T = ambient dry bulb temperature in °F and R = relative humidity. We used this
formula because it is easily calculated using the NWS heat index calculator, and is also
an index that is used by media and thus understood by local residents. When the
temperature was < 80°F, the maximum temperature was used in lieu of a calculated heat
index. On days when the relative humidity is low, and thus the heat index (HI) was lower
than the daily maximum temperature, we chose to use the highest daily calculated HI for
2224-23-22-
23
R6T-1.99x10 - TR8.5282x10 RT1.22874x10 R05.481717x1 -
T-6.83783x10 - TR0.22475541 - 7R10.1433312 T2.04901523 42.379- HI
++
++=

69
maximum heat index (MHI). This was the case for many days, particularly in Phoenix.
By using these HI values that were lower than maximum temperature, we were better
able to preserve the relative impact of low humidity in our analyses. All Fahrenheit data
were converted to Celsius. HRD data were aggregated into daily HRD counts and
percentages by year, and for the entire four year data set.
Two “extreme HRD” data sets were assembled: one for days that fell into the 97th
percentile of HRD (Chicago 5 days, Phoenix 22 days); and, because of the difference in
the number of days that fell into the 97th percentile, we included a data set for the highest
10 days of HRD. Additional data sets were extracted for a data set based on the Tmax
difference from normal Tmax (Tmax-DFN) and MHI temperature difference from normal
Tmax (MHI-DFN). Data were sorted and grouped by one degree C divisions for the
Tmax-DFN data set and the MHI-DFN data sets. We used the “normal Tmax” for daily
MHI-DFN because a “normal” MHI is not an available data set. We ran a comparison of
MHI to Tmax normal using our four years of data and found a statistically significant R2
of 0.998 in both Phoenix and Chicago using our four years of data. Since “normal” are
calculated using 30 years of data, we believe that the normal Tmax and a 30 year
calculated normal MHI would be close to identical, thus supporting our methodology for
calculation of an “MHI difference from normal” using the normal Tmax. The Tmax-
DFN and MHI-DFN data were then separated into three seasonal divisions: early, mid,
and late seasons. The seasonal divisions were made by first identifying the mid-point
where the normal Tmax is transitioning from a rising Tmax to a declining Tmax. These
dates were not the same for Phoenix and Chicago. To keep Phoenix from being unduly
skewed for an overly large “mid-season” we limited the dates used to determine the break
points to the hot weather months (1 April to 31 October) when 98% of HRD occurred.

70
We combined 1/3 of the days prior to the midpoints and 1/3 of the days following the
midpoint for the “mid-season” data. Days prior to 1 April and after 31 October were then
assigned to the appropriate early season or late season, using 1 January as late-early break
points. Mid-season was 5 June through 15 Aug for Phoenix and 21 June through 10
August for Chicago.
Statistical Analyses
Basic descriptive statistics, as well as multivariate and regression analyses were
calculated for several combinations of data for each city: one data set that included only
days with HRD and one that included all days, which also included days without HRD.
Multivariate analyses used stepwise regression with limits of 0.05 for inclusion and 0.10
for exclusion. The dependent variable was daily HRD counts and we used 10
independent climate or climate intensity variables. The climate variables were daily
maximum temperature (Tmax), minimum temperature (Tmin) and maximum heat index
(MHI), and mean dew point. The remaining six variables are best described as climate
“intensity” variables: difference from normal variables in 0.1°C increments: Tmax
difference from the normal Tmax (Tmax-DFN); Tmin difference from normal Tmin
(Tmin-DFN); and MHI difference from normal Tmax (MHI-DFN). The remaining three
variables were the number of consecutive days when Tmax, Tmin or MHI exceeded their
normal.
The most significant independent variables were then included for additional
regression analyses. Some analyses used linear regression. Relationships between HRD
and the climate variables (Tmax, MHI, Tmax-DFN and MHI-DFN) were not linear;
therefore we calculated cubic regression equations which provided a better fit for our
data. Cubic regression uses a third order polynomial and we used a confidence interval

71
(CI) of 0.05. We compiled two data sets for each city's warm weather period, one that
included all days (including days without HRD), and one that was limited to only days
with HRD. We performed difference of means analyses between Phoenix and Chicago
data for HRD, Tmax, Tmin, and MHI. Spatial Synoptic Classification (SSC) and HRD
counts were analyzed using linear and cubic regression analyses.
Results
Basic Characteristics of the HRD data:
The differences in HRD between Chicago and Phoenix could be described as
intensity of HRD in Chicago versus persistence of HRD in Phoenix (Table 14). Phoenix,
with 4,218 HRD, had more than three times that of Chicago (1,116 HRD) in the four
years of 2003 through 2006. In both cities, most HRD (≥ 98%) occurred during their
warm weather months—which for Chicago is May through September, and averaged 1.8
HRD per day. In Chicago only 32% of days May through September had HRD.
Phoenix's warm weather season was two months longer – April through October, and
79% of those days had an HRD (an average of 4.8 HRD per day). Between 1 May
through 30 September Phoenix had HRD on 92% of days, averaging 6.4 HRD per day.
Using only days with HRD, these two cities averaged virtually the same number of HRD
per day (5.7 and 5.6 HRD). However, Chicago's HRD counts had a much wider range
which is evidenced by their differences in standard deviations (Chicago11, Phoenix 5.5).
In Chicago most days with HRD have only one or two calls, and its highest day reaches
87 HRD, much higher than Phoenix's highest day of 35 HRD.
In both cities, HRD climb rapidly with increasing Tmax and MHI, however the
thresholds between the cities are different (Fig. 13a and 13b). Scatterplots of daily HRD
counts to Tmax and MHI illustrate these differences (Fig. 13a; 13b: 13c; and 13d)

72
Chicago's scatterplots (Fig. 13a) show HRD occur at a much lower Tmax than MHI,
especially when on days with high HRD counts. In Phoenix (Fig. 13b) there is little
difference between Tmax and MHI, a result of Phoenix's dry climate. Comparison
scatter plots between Phoenix and Chicago for Tmax to HRD (Fig. 13c) show that in
Chicago HRD occur at a Tmax much lower than in Phoenix and climb quickly when
Table 14. Comparison of the Number, Means, Medians, Standard Deviations and Percentages of HRD between Chicago and Phoenix.
# of Days
with HRD
# of
HRD
Percent Days with HRD
% HRD
WithinTime Period
High- est #
HRD
# of Days with 1 or 2 HRD
% of Days with 1 or 2 HRD
Mean HRD per day
Med- ian
HRD
Std. Dev
Chicago Days with HRD
196 1116 100 - 87 107 55% 5.7* 2.0 11.0
Phoenix Days with HRD
752 4218 100 - 35 286 38% 5.6* 4.0 5.5
Chicago
1May- 30 Sept 2003 – 06
194 1114 32 99.8 - 105 55% 1.8 0.00 6.7
Phoenix
1May - 30Sept 2003 – 06
563 3892 92 92 - 125 20% 6.4 5.0 5.0
Phoenix 1 April – 31 Oct.
680 4114 79 98 - 216 25% 4.8 4.8 3.0
Tmax hits about 33°C (91.4°F); while in Phoenix the Tmax is about 40°C (104°C) before
HRD begin to rapidly increase. The MHI to HRD scatter plot shows the gap between the
two cities closes considerably (Fig. 13d). This is due to Chicago's MHI frequently being
higher than the Tmax on days with HRD, and Phoenix's MHI frequently calculating

73
lower than its Tmax. Again, many days in Phoenix still had a much higher MHI than in
Chicago, but resulted in much lower HRD counts.
Multivariate and Cubic Regression Analyses
Multivariate stepwise regression analyses were done on two data sets for each
city (Table 15). The first is on all days including those without HRD. In Chicago: all
days 1 May through 30 September (2003- 2006) and in Phoenix: all days 1 January
through 31 December (2003 – 2006). The second includes only days with HRD hereafter
identified as HRD Events). The R2 values explain about 50% of the variability in the
HRD. In both cities, MHI has the strongest relationship to HRD, though Tmax is also an
influential variable in the models (2nd or 3rd). Consecutive Days with a Tmin > normal
have a smaller but identifiable influence on HRD in all the models, and Number of
Consecutive Days with a Tmax > normal were significant in 3 of the 4 models. In
Chicago, Mean Daily Dew Point is also strong in both data sets; but not in Phoenix's
models. We expected to find a strong relationship to humidity in Chicago; however we
also found a strong relationship with the MHI in Phoenix. Additionally, the impacts of
extended periods when heat and/or humidity exceed the normally expected conditions are
important.
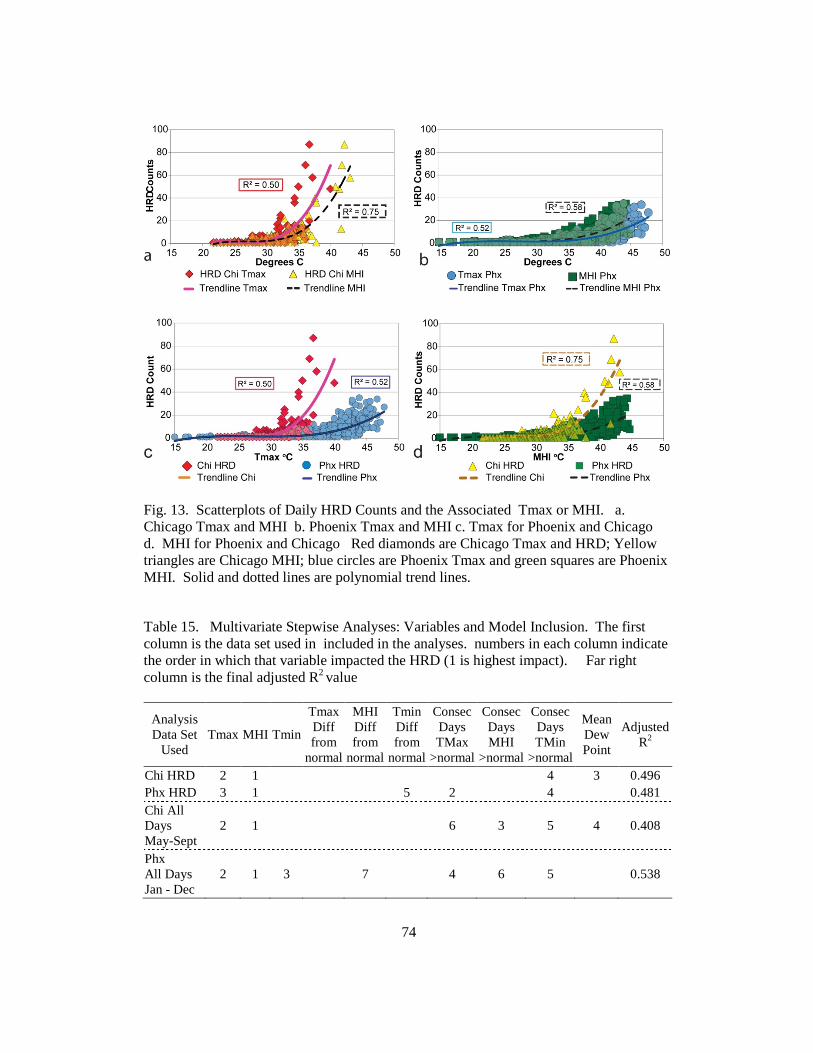
74
Fig. 13. Scatterplots of Daily HRD Counts and the Associated Tmax or MHI. a. Chicago Tmax and MHI b. Phoenix Tmax and MHI c. Tmax for Phoenix and Chicago d. MHI for Phoenix and Chicago Red diamonds are Chicago Tmax and HRD; Yellow triangles are Chicago MHI; blue circles are Phoenix Tmax and green squares are Phoenix MHI. Solid and dotted lines are polynomial trend lines.
Table 15. Multivariate Stepwise Analyses: Variables and Model Inclusion. The first column is the data set used in included in the analyses. numbers in each column indicate the order in which that variable impacted the HRD (1 is highest impact). Far right column is the final adjusted R2 value
Analysis Data Set
Used Tmax MHI Tmin
Tmax Diff from
normal
MHI Diff from
normal
Tmin Diff from
normal
Consec Days TMax
>normal
Consec Days MHI
>normal
Consec Days TMin
>normal
Mean Dew Point
Adjusted R2
Chi HRD 2 1 4 3 0.496 Phx HRD 3 1 5 2 4 0.481 Chi All Days May-Sept
2 1 6 3 5 4 0.408
Phx All Days Jan - Dec
2 1 3 7 4 6 5 0.538
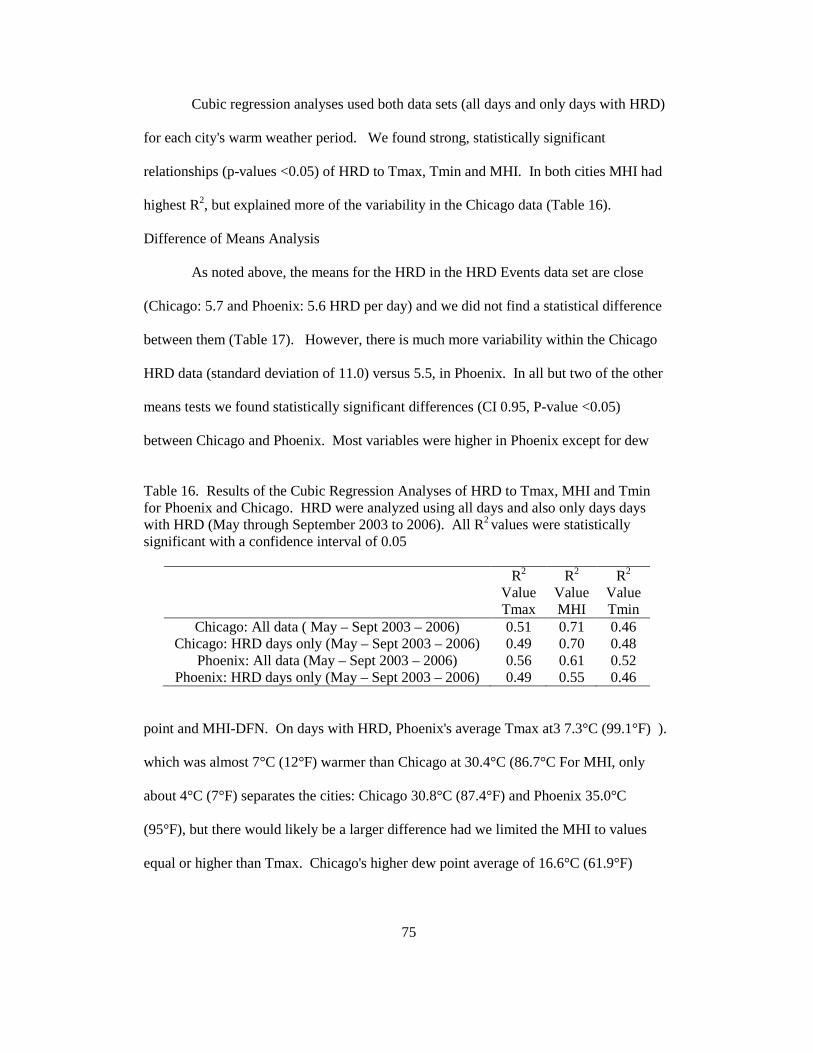
75
Cubic regression analyses used both data sets (all days and only days with HRD)
for each city's warm weather period. We found strong, statistically significant
relationships (p-values <0.05) of HRD to Tmax, Tmin and MHI. In both cities MHI had
highest R2, but explained more of the variability in the Chicago data (Table 16).
Difference of Means Analysis
As noted above, the means for the HRD in the HRD Events data set are close
(Chicago: 5.7 and Phoenix: 5.6 HRD per day) and we did not find a statistical difference
between them (Table 17). However, there is much more variability within the Chicago
HRD data (standard deviation of 11.0) versus 5.5, in Phoenix. In all but two of the other
means tests we found statistically significant differences (CI 0.95, P-value <0.05)
between Chicago and Phoenix. Most variables were higher in Phoenix except for dew
Table 16. Results of the Cubic Regression Analyses of HRD to Tmax, MHI and Tmin for Phoenix and Chicago. HRD were analyzed using all days and also only days days with HRD (May through September 2003 to 2006). All R2 values were statistically significant with a confidence interval of 0.05
R2 Value Tmax
R2 Value MHI
R2 Value Tmin
Chicago: All data ( May – Sept 2003 – 2006) 0.51 0.71 0.46 Chicago: HRD days only (May – Sept 2003 – 2006) 0.49 0.70 0.48
Phoenix: All data (May – Sept 2003 – 2006) 0.56 0.61 0.52 Phoenix: HRD days only (May – Sept 2003 – 2006) 0.49 0.55 0.46
point and MHI-DFN. On days with HRD, Phoenix's average Tmax at3 7.3°C (99.1°F) ).
which was almost 7°C (12°F) warmer than Chicago at 30.4°C (86.7°C For MHI, only
about 4°C (7°F) separates the cities: Chicago 30.8°C (87.4°F) and Phoenix 35.0°C
(95°F), but there would likely be a larger difference had we limited the MHI to values
equal or higher than Tmax. Chicago's higher dew point average of 16.6°C (61.9°F)

76
versus 6.7°C (44.1°F) in Phoenix, and higher MHI-DFN, are indicative of how much
more of a role humidity plays in Chicago.
Table 17. Results of the Difference of Means Analyses. Table shows Chicago's and Phoenix's means for : Days with HRD, Tmax, Tmin, MHI, Tmax difference from normal Tmax, MHI difference from normal Tmax, Tmin difference from normal Tmin, number of days consecutive days when Tmax exceeded the normal Tmax, number of days consecutive days when MHI exceeded the normal Tmax, number of days consecutive days when Tmin exceeded the normal Tmin and dew point, Nearly all means between Chicago and Phoenix cites were statistically different (CI 0.05). Asterisks indicate variables that data did not show a statistical difference in the means between Chicago and Phoenix.
Days with HRD
Tmax °C
Tmin °C
MHI °C
Tmax Diff from
Normal Tmax
°C
MHI Diff from
Normal Tmax
°C
Tmin Diff from
Normal Tmin
°C
Consec- utive Days W
Tmax >
normal
Consec- utive
Days w MHI
> normal
Consec- utive
Days w Tmin
> normal
Mean Dew Point °C
Chicago Means
5.7* 30.4 20.2 30.8 2.3* 2.8 5.5 2.7 2.7* 3.8 16.6
Phoenix Means
5.6* 37.3 23.9 35.0 2.2* -0.1 2.1 5.3 2.3* 7.3 6.1
Two variables with means that were not statistically different between Chicago
and Phoenix were Tmax-DFN and number of consecutive days when the MHI was higher
than the normal Tmax. The similarities in the number of consecutive days with MHI
higher than normal Tmax are probably not very meaningful. This is likely a phenomenon
of Phoenix's relatively long and consistent period of relatively high humidity during the
mid to late summer monsoon period. Given that almost every day during the mid to late
summer has an HRD in Phoenix, when humidity rises with the monsoon season and
produces an MHI higher than the normal Tmax, it can do so for many days, uninterrupted
by a day without HRD. So Phoenix had fewer but longer runs of consecutive days, while
Chicago had many more but shorter periods when MHI was higher than the normal Tmax
– but they resulted in similar means.
77
An unexpected finding was that on days with HRD the amount by which the
ambient Tmax varied from normal was very similar in Chicago (2.3°C) and Phoenix
(2.2°C). This suggests that on average these two cities possibly experienced similar
increases in maximum temperatures above normal on days with HRD, the HRD count
was often much higher in Chicago. The highest MHI-DFN, in Chicago was considerably
higher than in Phoenix: 13.9°C versus 9.8°C (25°F vs. 17.6°F), and Chicago's high HRD
counts occurred on these days. In Phoenix, days with high MHI-DFN did not coincide
with Phoenix's highest days of HRD. These different outcomes prompted us to take a
more in depth look at the conditions on the days with extremely high HRD, which we
will discuss in more detail in a subsequent section.
Air Masses
We examined the role of air mass types on HRD using SSC. Air mass types,
especially those that are associated with “oppressive” conditions of(MT (moist tropical),
MT+ (moist tropical plus) and MT++ moist tropical double plus, are often associated
with increased HRI and HRM (Sheridan et al 2009). In both cities, these three “tropical”
SSC types MT, MT+ and MT++) were associated with the high percentages of HRD,
although several days in Phoenix with high HRD were dry tropical (DT). We found that
cubic regression analyses produced the strongest correlations between SSC and HRD.
Though the relationships were statistically significant (CI of < 0.05), the R2 values were
low at 0.30 for Chicago and 0.04 for Phoenix. Phoenix's low R2 values are attributable to
its very low variability in weather during its hot months, when 72% of days April through
October were classified as Dry Tropical. Most days with one of the two extreme SSC
types (MT+ and MT++) had HRD. Overall, Phoenix had more MT+ and MT++ days
(76), and all but two of these days (MT++) had HRD, however, MT+ and MT++

78
produced only 15% of Phoenix's HRD. Chicago had fewer of these extreme days (33),
and not all had HRD. However, on the on days when MT+ and MT++ did produce HRD,
the counts were often very high – 46% of Chicago's HRD occurred on MT+ or MT++
days (Table 18).
Table 18. SSC Air Mass Types That Produced the Highest HRD Counts. Most of Phoenix's HRD (61%) occurred on day with Dry Tropical (DT) air masses – the SSC that dominates Phoenix's weather during its hot weather season
SSC Type #
Days
% of days with SSC
type producing
HRD
% of total HRD
Average #HRD per day
Average Tmax
°C
Average MHI °C
Dry Chicago 74 74% 16% 10.2 34 33.5 Tropical Phoenix 434 83% 61% 5.9 38.8 35.9 Moist Chicago 96 74% 15% 10.2 30.7 31.6 Tropical Phoenix 44 82% 5% 5.8 37.9 37.9 Moist Chicago 17 88% 15% 11.1 32.5 33.2 Tropical + Phoenix 43 100% 8% 8.1 38.3 38.0 Moist Chicago 16 81% 31% 26.8 33.8 36.5 Tropical++ Phoenix 33 94% 7% 9 40.4 39.9
Extreme Heat Events
We analyzed two different “extreme” HRD data sets: days that fell into 97th
percentile of HRD (Chicago 5 days, Phoenix 22 days), and a data set for the highest 10
days of HRD (Table 19). We looked at air mass types on these extreme HRD days. In
Chicago, the type of air mass plays a more identifiable role with high HRD, and all but
two of the high HRD days had an air mass of MT+ or MT++. However, in Phoenix, 9 of
the 10 highest HRD days were under the influence of its typical summer air mass, DT.
These high days of HRD show the pattern of persistence of HRD in Phoenix, versus
fluctuation in Chicago. In Phoenix, there was little difference in the average number of

79
HRD between its two extreme data sets of (27 HRD and 31 HRD per day). Chicago's
average number of HRD was much more variable averaging 62 HRD per day at the 97th
percentile (more than double that of Phoenix) and drops to an average of 46 HRD per day
for Chicago's highest 10 days of HRD – one and a half times higher than Phoenix (Table
19). Phoenix's Tmax and MHI averages on extreme days were higher than Chicago's but
resulted in much lower HRD counts. This suggests that, although Phoenix's residents
experience hotter conditions, they are less impacted by the heat. Chicago's extreme
Tmax and MHI were considerably higher than its normal, thus exposing residents to
conditions much worse than they would typically expect. On Phoenix's highest days of
HRD, the Tmax-DFN and MHI-DFN were not nearly as high as those in Chicago. (Fig.
14 and Table 19).
Fig. 14. Highest daily counts of HRD: Left: Days in the 97th percentile. Right: 10 highest days of HRD. Red bars are Chicago data and blue bars are Phoenix data. The left Y axis are the mean number of HRD that are associated with the first set of bars in 97th percentile and and highest 10 days of HRD. The right Y-axis is the mean temperature for Tmax, Tmin and MHI.
Difference from Normal
The Tmax-DFN and MHI-DFN reached much higher levels in Chicago than in
Phoenix, particularly on days with very high HRD counts. Plots of HRD to Tmax and
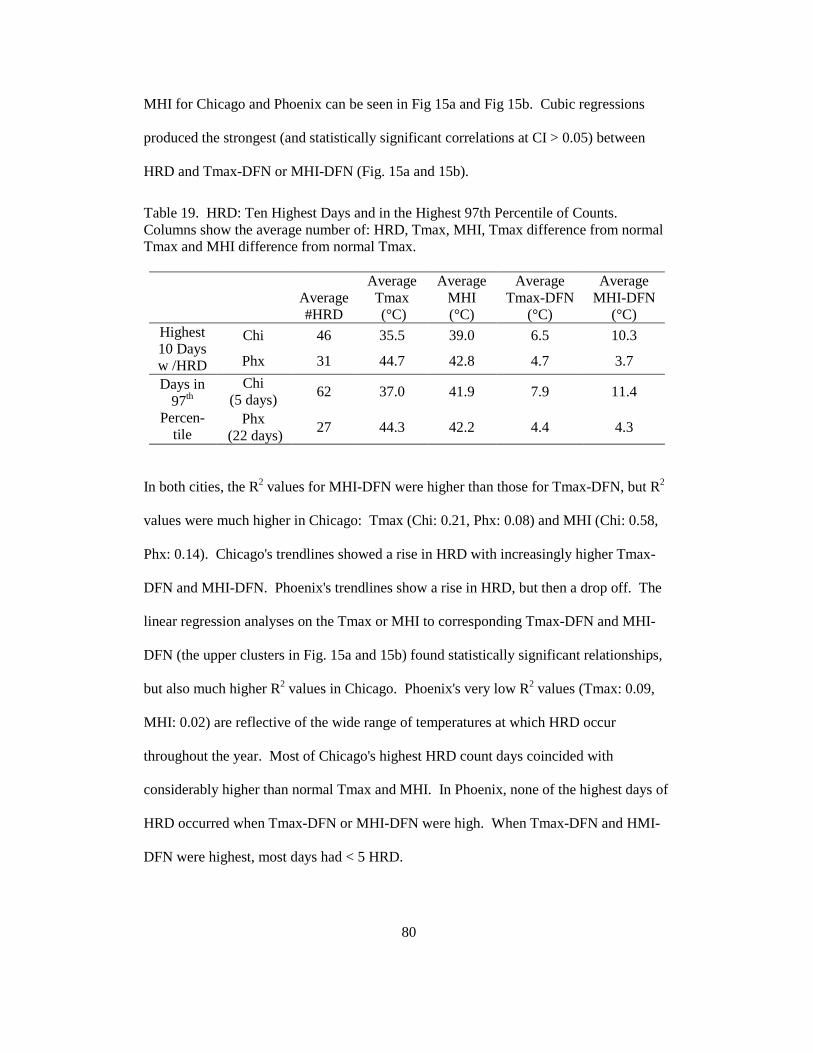
80
MHI for Chicago and Phoenix can be seen in Fig 15a and Fig 15b. Cubic regressions
produced the strongest (and statistically significant correlations at CI > 0.05) between
HRD and Tmax-DFN or MHI-DFN (Fig. 15a and 15b).
Table 19. HRD: Ten Highest Days and in the Highest 97th Percentile of Counts. Columns show the average number of: HRD, Tmax, MHI, Tmax difference from normal Tmax and MHI difference from normal Tmax.
Average #HRD
Average Tmax (°C)
Average MHI (°C)
Average Tmax-DFN
(°C)
Average MHI-DFN
(°C) Highest 10 Days w /HRD
Chi 46 35.5 39.0 6.5 10.3
Phx 31 44.7 42.8 4.7 3.7
Days in 97th
Percen- tile
Chi (5 days)
62 37.0 41.9 7.9 11.4
Phx (22 days)
27 44.3 42.2 4.4 4.3
In both cities, the R2 values for MHI-DFN were higher than those for Tmax-DFN, but R2
values were much higher in Chicago: Tmax (Chi: 0.21, Phx: 0.08) and MHI (Chi: 0.58,
Phx: 0.14). Chicago's trendlines showed a rise in HRD with increasingly higher Tmax-
DFN and MHI-DFN. Phoenix's trendlines show a rise in HRD, but then a drop off. The
linear regression analyses on the Tmax or MHI to corresponding Tmax-DFN and MHI-
DFN (the upper clusters in Fig. 15a and 15b) found statistically significant relationships,
but also much higher R2 values in Chicago. Phoenix's very low R2 values (Tmax: 0.09,
MHI: 0.02) are reflective of the wide range of temperatures at which HRD occur
throughout the year. Most of Chicago's highest HRD count days coincided with
considerably higher than normal Tmax and MHI. In Phoenix, none of the highest days of
HRD occurred when Tmax-DFN or MHI-DFN were high. When Tmax-DFN and HMI-
DFN were highest, most days had < 5 HRD.

81
Fig. 15. Scatterplots of Difference from Normal and Daily HRD Counts. (a) Tmax (b) MHI. Lower clusters are plots of the daily number of HRD for the difference from normal Tmax (a) Tmax (b) MHI (Trendlines for difference from normal (lower clusters) are3rd order polynomial for HRDupper clusters are the Tmax and MHI that occurred on those days. Upper cluster trendlines are linear.
Seasonality in Tmax and MHI Difference from Normal
To evaluate if there might be seasonal differences within and between the cities,
we broke the data into early season (Fig. 16a and 16b), mid-season (Fig. 16c and 16d)
and late season (Fig. 16e and 16f). Cubic regressions for the HRD to Tmax-DFN and
MHI-DFN produced the strongest R2 values while linear regressions were best for Tmax
to Tmax-DFN and MHI to MHI-DFN (Table 20). All R2 values but one were statistically
significant (only Chicago's late season HRD to Tmax-DFN had a P-value >0.05).
Seasonality is clearly playing a role in the differences we found between Phoenix and
Chicago, and how the Tmax-DFN and MHI-DFN impacted HRD in both cities. In every
season, Chicago produced higher R2 values for HRD to Tmax-DFN and MHI-DFN.
Almost all of Chicago's highest days of Tmax-DFN and MHI-DFN occurred during its
mid-season, when normal Tmax is highest, resulting in some of its hottest days of the
study period. This was not the case in Phoenix. Phoenix's highest days of Tmax-DFN
and MHI-DFN occurred during early and late season when its normal Tmax was lower.
This is likely one reason why Phoenix had low HRD counts on these unusually hot days.

82
During early and late seasons, the Phoenix DFN trendlines for HRD show a rise and then
a slight drop off. Chicago's HRD to DFN trendlines show a similar dropping off pattern
for Tmax, but continue to rise for MHI.
Fig. 16. Seasonal Plots of HRD by Difference from Normal and Corresponding Tmax or MHI (0.1°C). a. Early season Tmax b. Early season MHI c. Mid-season Tmax d. Mid-season MHI e. Late season Tmax f. Late season MHI. Phoenix's highest days of Tmax and MHI higher than normal occurred during the early and late season, and resulted with low HRD counts. In Chicago, the days with Tmax and MHI much higher than normal occurred primarily during mid-season and were generally associated with high HRD. All R2 values were statistically significant except for Chicago's late season HRD counts.
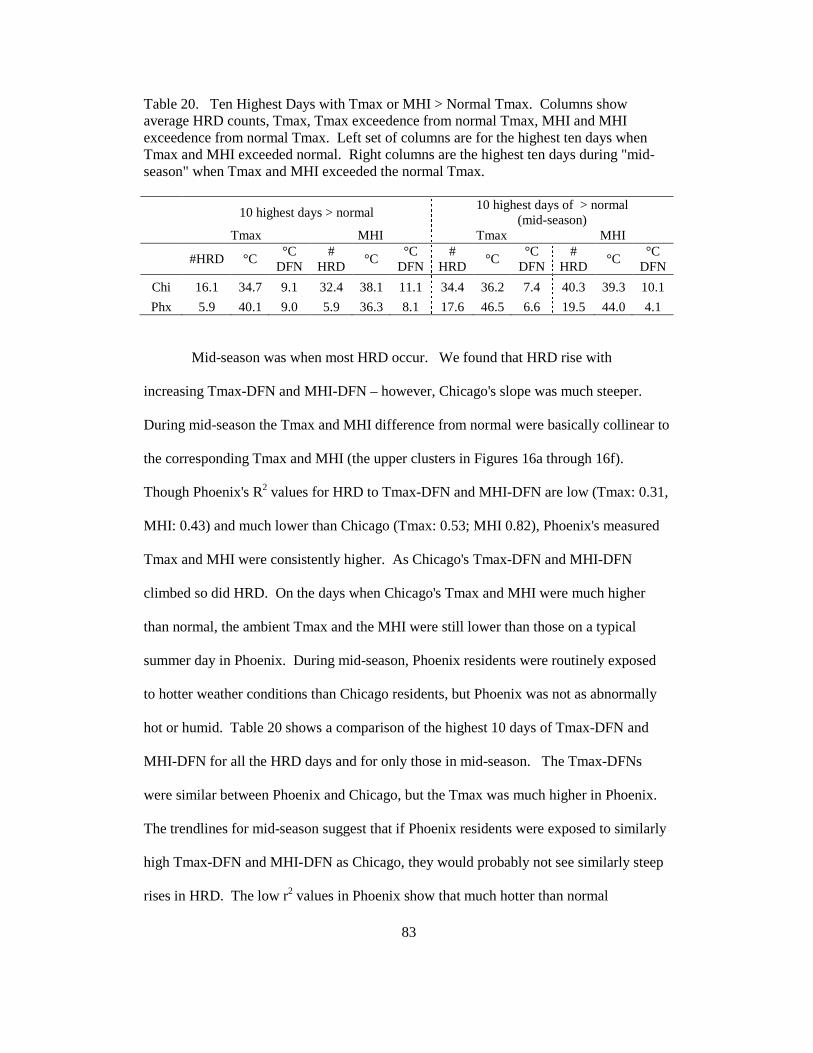
83
Table 20. Ten Highest Days with Tmax or MHI > Normal Tmax. Columns show average HRD counts, Tmax, Tmax exceedence from normal Tmax, MHI and MHI exceedence from normal Tmax. Left set of columns are for the highest ten days when Tmax and MHI exceeded normal. Right columns are the highest ten days during "mid-season" when Tmax and MHI exceeded the normal Tmax.
10 highest days > normal 10 highest days of > normal
(mid-season) Tmax MHI Tmax MHI
#HRD °C °C
DFN #
HRD °C
°C DFN
# HRD
°C °C
DFN #
HRD °C
°C DFN
Chi 16.1 34.7 9.1 32.4 38.1 11.1 34.4 36.2 7.4 40.3 39.3 10.1
Phx 5.9 40.1 9.0 5.9 36.3 8.1 17.6 46.5 6.6 19.5 44.0 4.1
Mid-season was when most HRD occur. We found that HRD rise with
increasing Tmax-DFN and MHI-DFN – however, Chicago's slope was much steeper.
During mid-season the Tmax and MHI difference from normal were basically collinear to
the corresponding Tmax and MHI (the upper clusters in Figures 16a through 16f).
Though Phoenix's R2 values for HRD to Tmax-DFN and MHI-DFN are low (Tmax: 0.31,
MHI: 0.43) and much lower than Chicago (Tmax: 0.53; MHI 0.82), Phoenix's measured
Tmax and MHI were consistently higher. As Chicago's Tmax-DFN and MHI-DFN
climbed so did HRD. On the days when Chicago's Tmax and MHI were much higher
than normal, the ambient Tmax and the MHI were still lower than those on a typical
summer day in Phoenix. During mid-season, Phoenix residents were routinely exposed
to hotter weather conditions than Chicago residents, but Phoenix was not as abnormally
hot or humid. Table 20 shows a comparison of the highest 10 days of Tmax-DFN and
MHI-DFN for all the HRD days and for only those in mid-season. The Tmax-DFNs
were similar between Phoenix and Chicago, but the Tmax was much higher in Phoenix.
The trendlines for mid-season suggest that if Phoenix residents were exposed to similarly
high Tmax-DFN and MHI-DFN as Chicago, they would probably not see similarly steep
rises in HRD. The low r2 values in Phoenix show that much hotter than normal

84
conditions had little correlation to HRD counts – even in mid-season when the Tmax and
MHI are normally very high. Chicago's highest difference from normal days had a Tmax
and MHI that was lower than residents in Phoenix experience on a typical day. When
Tmax and MHI > normal, Phoenix's HRD rise but do not spike. Had we not used the
Tmax values when the MHI calculated lower than Tmax, Phoenix's average MHI-DFN
would have been only a few degrees lower than Chicago's. On days when Phoenix's
Tmax was at least 5°C (9°F) > normal and also >43°C (109.4°F) Phoenix averaged 17
HRD, ranging from as low as 7 to as high as 34 HRD. These are weather conditions that
are challenging to anyone, even if high temperatures are typical, as in Phoenix. In
Phoenix, 8 of the highest 10 days with Tmax and MHI > norm were in early season. The
Tmax averaged 33.5°C (92.3°F ) yet only averaged 1.6 HRD during the time when
residents would have yet to be exposed to its high summertime temperatures. The low
HRD counts under both of these conditions would suggest that Phoenix's residents may
have a level of year round acclimatization or tolerance to high temperatures, creating a
level of adaptive capacity in Phoenix residents. Some of Phoenix's adaptive capacity
would be residents' near universal access to air conditioning. However, it may also
suggest some level behavioral adaptation as well. High Tmax and MHI resulting in
relatively low HRD counts would also suggest that people not only use their air
conditioning, but likely also choose not to participate in activities that might put them at
risk of HRI.
Conclusions
This study found that although Phoenix was much hotter, had many more HRDs
in each year, and had a much longer season when HRD occurred, it was not subject to the

85
large spikes in heat-related 911 calls that were seen in Chicago. HRD in Chicago
increased dramatically when the Tmax and especially MHI were much higher than
normal. In Chicago when MHI-DFN was highest it also recorded some of its highest
HRD counts but its Tmax and MHI were still lower, and in some cases much lower, than
those that Phoenix residents experienced on a routine basis. In Phoenix, many of the
days with high HRD counts were not associated with Phoenix's highest days of Tmax-
DFN and MHI-DFN. The days that had high Tmax-DFN and MHI-DFN (>6°C) and also
had high HRD occurred primarily when the Tmax was > 43°C (110⁰F). Remarkably,
even under these extreme temperature conditions Phoenix's daily HRD were much lower
than on days when Chicago experienced its most extreme weather conditions. Our
analyses could have provided much more detail had the HRD data sets included
additional demographic or situational information such as age, sex, if the victim had
access to air conditioning, what activities they were engaged in when the incident
occurred or even the location of their residence. However, in many cases this
information was not included due to confidentiality constraints.
Even without demographic data, our morbidity study parallels the findings of
mortality studies (e.g. Curriero et al. 2002, Medina-Ramon and Schwartz 2007, Sheridan
and Kalkstein 2010, Anderson and Bell 2011) – that cities in hotter southern locations in
North America are less affected by high heat events. Some of the differences we found
in HRD between Phoenix and Chicago are likely due to Phoenix's near universal
existence of air conditioning, which is a highly effective adaptive measure to reduce HRI
and HRM. However, the results of our study and the phenomenon of lower summer
mortality in hot cities suggest a level of adaptive capacity or resilience in residents of
these warmer cities, including Phoenix. Our study suggests many questions beyond the
scope of this paper as to what factors might be contributing to this resiliency. These

86
include investigating whether residents of hot cities such as Phoenix become acclimated
to heat or are they exposed to more information on the dangers of heat, thus adapting
behavior and activities that put them at risk of HRI. Further investigation into what might
be contributing to what seems to be a resilience to HRI despite frequent exposure to
extreme heat –could prove helpful in creating strategies to help other more temperate
cities reduce HRI and HRM.

87
Chapter 5
OUTDOOR THERMAL COMFORT ADAPTATION IN PHOENIX
Abstract
This paper presents the findings of a survey-based outdoor human thermal comfort
study in Phoenix, Arizona, USA. The purpose of the study is to document residents'
outdoor human thermal comfort adaptation to Phoenix's hot, dry climate. Several
locations within the metropolitan area were used to collect people's perceptions of the
weather conditions during the spring, summer and fall of 2010, using questionnaires and
concurrent micro-meteorological measurements to document thermal perceptions and
acceptance of outdoor conditions. Though Phoenix residents have near universal access
to air conditioning, the study found indications of a high level of outdoor thermal
adaptation. Surveys collected thermal comfort sensations of local residents, which were
then used to calculate several comfort indices: “thermal neutral”, the temperature at
which respondents were neither hot nor cold and thermal and “acceptance thresholds” –
the temperatures that residents found acceptable calculated from the percentage of people
whose perception of the temperature was “a bit cool”, “OK” or "a bit warm”. The study
also introduces a “heat tolerance” index – the upper microclimate thresholds where 80%
of responders, even though saying that the temperature was “a bit hot” or “hot”, also
reported being “comfortable” in those conditions. Two percentage limits were used to
identify the thresholds of thermal acceptability and heat tolerance: 80% and a more
rigorous 90%. These thresholds are given in multiple indices of climate – ambient
temperature, heat index, and three energy budget indices that include the effects of
additional weather parameters such as wind or solar radiation: Physiologically Equivalent
Temperature (PET); Standard Effective Temperature (SET); and Universal Thermal
Comfort Index (UTCI). Analysis showed a high level of adaptation to heat, and while

88
respondents' preference in weather is similar to those of other more temperate regions,
they are also accepting of, and tolerant of, much hotter conditions. These thresholds of
heat tolerance-adaptation are then compared to the results of a previous study comparing
heat-related 911 emergency dispatches (HRD) between Phoenix and the more temperate
city of Chicago, Illinois, USA. (For more detail see Hartz et al. 2010). In both cities,
HRD begin to climb rapidly with increasingly high temperature and heat index, but
Chicago's HRD began its exponential climb at much lower climate thresholds than those
in Phoenix. The differences in the thresholds of temperature and heat index associated
with the steep rises in HRD are comparable to the differences in thermal comfort
adaptation found in Phoenix and those of the thermal comfort thresholds found in more
temperate climates.
Introduction
Entities such as the World Health Organization, U.S. Environmental Protection
Agency (EPA) and the U.S. Centers for Disease Control and Prevention (CDC) are
concerned about the impacts of increasing heat and its effects on human health caused by
a warming planet, and also with the rapid expansion of urbanization (EPA 2012, CDC
2008,WHO 2003). As urban centers grow, an ever increasing number of people are
exposed to the additional heat associated with urbanization, a phenomenon known as the
urban heat island effect, where urbanized areas are warmer than nearby rural areas.
McGeehin and Mirabelli (2001) estimated possible future health impacts of increased
exposure to heat from possible climate change. Their estimates took into consideration
future mitigating factors such as increased access to air conditioning and possible future
“acclimatization”. Potential acclimatization levels are not well researched or

89
documented. Extrapolations could be made from documentation of current levels of
acclimatization that exists in populations living in hot climates.
There is a sphere of ongoing acclimatization research underway – studies aimed
at identification of human thermal comfort ranges and thresholds of people living in
different climates (e.g. Spagnolo and de Dear 2003; Nikolopoulou and Lykoudis 2006;
Hwang & Lin 2007). These studies are associated with the field of tourism climate to
estimate local thermal comfort differences, and extrapolate to possible impacts that
climate change may have on the tourism industry. There are also urban design thermal
comfort studies focused on improvement of comfort and usability of outdoor spaces and
mitigating heat in cities (e.g. Pearlmutter et al. 1999; Toudert and Mayer 2003; Shashua-
Bar and Hoffman 2003; Johansson 2006). Human thermal comfort (HTC) studies are
yet to be widely applied to human health though application of HTC but could be
beneficial in that field.
Human thermal comfort sensations are not static, but are highly subjective. In
addition to being impacted by physiological conditions, it is also greatly influenced by
psychological factors such as expectations, previous experience, and local customs (de
Dear and Bragger 1998; de Dear and Bragger 2002; Hoppe 2002; Knez and Thorsson
2006; Lin et al. 2010). There have been relatively few outdoor thermal comfort studies
aimed at documenting local adaptation to climate, but those studies have yielded several
important findings:
a) people are also more accepting of a wider range of temperatures in
outdoor spaces (Nikolopoulou and Steemers 2003)
b) people living in different climates also have differing levels of thermal
comfort (see Nikolopoulou and Lykoudis 2006)
90
c) people living in warmer climates have higher thresholds of thermal
comfort that those in more temperate climates (Hwang and Lin 2007;
Lin and Matzarakis 2008).
These thermal comfort differences may parallel differences found in mortality
studies such as those Curriero et al. (2002), and Davis et al. (2004). These North
American studies found a greater risk of death in cooler, northern cities than in hotter,
southern cities. This regional difference is often attributed to residents' increased access
to air conditioning and to “acclimatization”. Hartz et al. (2010) found similar regional
differences in the heat-related 911 emergency calls between two geographically and
climatically different cities in the United States: Chicago, Illinois and Phoenix, Arizona,
which has led to the further research in this current study. Thermal comfort studies that
documented adaptation were done in places with temperate or hot and humid climates,
but not in the hot, dry conditions epitomized by Phoenix.
From studies of heat-related 911 emergency dispatches (HRD) in Chicago (Hartz
et al. 2011) and Phoenix (Golden et al 2008) researchers found that both cities
experienced a rapid increase in 911 calls with increasingly higher temperature and heat
index. Although Phoenix had many more HRD in a given year, it did not experience the
spikes in HRD that occurred in Chicago. Additionally, the threshold temperature and
heat index where HRD began to rapidly climb were much higher in Phoenix, and thus
suggests these differences might be linked to acclimatization.
This current study seeks to document levels of outdoor thermal comfort
adaptation and heat tolerance in Phoenix, a city that experiences very hot weather
conditions for much of the year. Chicago has a more temperate climate, and residents are
likely to have thermal comfort levels similar to those found in other more temperate parts
91
of the world, such as central-western Europe. Differences in thermal comfort/climate
adaptation between Phoenix and those cities with a temperate climate may be similar to
the differences found in the temperature and heat index thresholds at which HRD began
to rapidly climb in Chicago.
Background
Thermal comfort or acceptance of one's thermal environmental surroundings can
vary across many scales – from individual to individual sitting in a room, to a wider more
regional scale differing between people living in different climate regions. Outdoor
Human Thermal Comfort (OHTC) indices and models have their roots in indoor thermal
comfort studies aimed at design and engineering of HVAC systems to achieve a more
comfortable indoor environment (Janssen 1999). Efforts to create a single thermal
comfort model or index that can predict human thermal comfort go back almost a century
to an index defined as Effective Temperature (Gonzalez et al. 1974). Great strides in
documenting thermal comfort were made in the 1960's and 1970's with the work of P.O.
Fanger (1972) and Gagge et al. (1967). Fanger's book “Thermal Comfort” (1972)
describes a series of equations associated with the comfort index known as PMV
(predicted mean vote). PMV is a seven point thermal sensation scale from +3 (hot) to -3
(cold) with 0 being neutral. Thresholds of comfort were derived from studies using
relatively small groups of young and presumably healthy adults in the controlled
environment of a climate chamber. The laboratories were located in temperate climates,
suggesting that participants likely had the thermal comfort preferences of people living in
that climate. These studies identified climate conditions that the majority of people
(80%) would find comfortable, and eventually led to the indoor thermal comfort
standards adopted by ASHRAE (the American Society of Heating, Refrigerating and Air-
92
Conditioning Engineers), and laid the groundwork for today's HTC models (Janssen
1999).
Early outdoor comfort models were modifications of indoor HTC models through
the addition of radiation fluxes (Hoppe 1999). Questions arose about the accuracy and
adequacy of these early outdoor human thermal comfort (OHTC) models modified from
indoor comfort models or indices (Spagnolo and de Dear 2003; Nikolopoulou et al.
2001). In the late 1990s de Dear and Bragger (1998) reported in an ASHRAE study of
160 buildings located around the world, that thermal comfort is not static, and can be
highly variable. Researchers found that when conditions are not considered to be directly
controllable (as in outdoor situations contrasted with indoor conditions) people's
expectations for acceptable levels of comfort expand (Nikolopoulou and Steemers 2003).
To document thermal acceptability differences in varying climates OHTC research
basically uses two methodologies: (a) observation of behavior in outdoor venues, and (b)
a more direct method that uses surveys to assess people's perceptions and acceptance of
the climate conditions they are encountering. Both methodologies generally include in
situ measurement of climate parameters – temperature, humidity, wind, and sometimes
solar radiation. Observational studies primarily document behavior in an outdoor setting
such as parks or squares, recording choices on where people sit (sun or shade, open or
exposed, etc.) or tracking the number of people using an outdoor space (e.g. Thorsson et
al. 2004; Thorsson et al. 2004). The direct methodologies for thermal comfort studies fall
into basically two categories: (a) thermal comfort analyses of outdoor spaces or urban
design (b) methods designed to identify location/climate specific levels of outdoor
thermal comfort adaptation that could be applied in geographically different climates.
The vast percentage of outdoor HTC studies that measure differences in outdoor spaces
(such as green spaces with parks or trees, or differing urban designs such as wide,

93
shallow urban canyons versus narrow, deep urban canyons). These studies used
previously established thresholds of comfort used for all climates which do not take into
account possible adaptation to local climate.
There are also thermal comfort studies that identify local thermal comfort
adaptation, or levels, and use a survey to record perceptions of comfort while concurrent
microclimate measurements are taken, primarily temperature, humidity, wind speed and
sometimes solar radiation (Spagnolo and de Dear 2003; Hwang and Lin 2007). These
climate measurements can later be used in thermal comfort index models to give a better
grasp of the more complex, and generally more accurate, assessment of the conditions
encountered by participants, other than just temperature or temperature and humidity.
Studies that measure acclimatization/thermal comfort are limited in number, and not
all used the same questions/methodologies, or even the same scales of measurement, thus
making comparisons difficult. Thermal comfort is calculated using different
methodologies and can be reported in differing climate units: ambient temperature and
also temperature indices from more complex energy balance models such as
Physiologically Equivalent Temperature (PET); Standard Effective Temperature (SET);
OUTSET and Effective Temperature (ET). Most studies report the “thermal neutral” –
the temperature at which respondents are neither hot nor cold – though methods for
determining “thermal neutral” can vary. Questionnaires used in the studies were
generally adapted from those used by Fanger in the 1970's in conjunction with the 7-
point scale of respondents' perceptions of the climate conditions they were experiencing
which range from -3 to +3 (see methods for more detail). The percentage of respondents
used to identify thermal comfort levels also varied, though most used the 80%
comfortable limit that was used for the ASHRAE standards.

94
Thermal comfort studies done in Sydney, Australia (Spagnolo and de Dear 2003)
and in Taiwan (Hwang and Lin 2007; Lin and Matzarakis 2008) used similar
methodology to this current study in Phoenix. These included a questionnaire that used a
variation of the ASHRAE 7 point thermal sensation vote scale for comfort of -3 (very
cold) to +3 (very hot) along with in-situ recording of micrometeorological measurements
to identify thresholds and ranges of thermal comfort.
Methods
Climate and Survey Locations
Phoenix is located in the Sonoran Desert of the southwestern United States. It has a
hot, arid climate, receiving about 19 mm of rainfall each year. Summer temperatures
routinely exceed 37.7°C (100°F) and have reached 50°C (122°F). Winter temperatures
are warm during the day and cool at night, with a few freezes each year. Additionally,
over the twentieth century, average annual temperatures in the arid subtropical Phoenix
region increased 1.7°C (3.1°F) (Brazel et al. 2000). However, the urban portions of the
region have had increases of 4.2°C (7.6°F) in the annual average temperature, a rate three
times higher that of the region, reflecting the pronounced local influence of urbanization.
Phoenix has a substantial urban heat island (UHI) in both size and intensity.
An issue with all outdoor thermal comfort surveys is identifying appropriate venues
where respondents are likely to be representative of an area's population. Thus, careful
consideration of appropriate sites was required, as there is an element of self-selection in
people who spend more than a few minutes in an outdoor location. Also for this study,
it was important to identify locations where potential interviewees were likely to be
outdoors for more than the few minutes it takes to traverse between buildings and/or
modes of transportation. This can be particularly important in a place like very hot
Phoenix.

95
Field data were collected during the spring, early summer and early fall of 2010 in
several public outdoor locations within metropolitan Phoenix, primarily in parks where
people were more likely to be spending time outdoors (Fig. 17). Several late spring
special event venues were used, but the majority of surveys were taken at one park that,
throughout the year, draws a wide range of people from across the metropolitan area, as
well as non-local visitors. This park contains several recreational-
Fig. 17. Map of Phoenix Survey Locations. Survey locations (stars) were scattered across the metropolitan area, the largest star is where the majority of surveys were taken. entertainment attractions, including an operating train and a large historic carousel. The
park is a favorite venue for corporate events and family celebrations throughout the year,
96
including during the summer months. As such, it attracted visitors of all ages throughout
the survey period. Anecdotal comments by respondents indicated routine attendance by
many who would not typically choose to spend time outdoors. All but one site provided
at least some shade from trees, and the main survey location also had structure-shaded
open-sided picnic areas that are scattered in several locations of the park. This shade
provided an opportunity for some relief from the intense sun and heat when needed.
However, each site was primarily open and unshaded. Locations where surveys were
taken were unshaded. The surface covering at the main survey site was concrete paving
stones, often measured in excess of 50°C (122°F) on an infrared thermometer. Field
survey collection was limited to time periods when the largest number of people would
be in attendance, as well as to include a wider cross-section of ages of potential
respondents. Thus surveys were taken during weekends and, during the hot weather
months, limited to mornings and early afternoons.
Survey questions and analysis methodologies were adapted from two previous
studies: Spagnolo and de Dear (2003) in Sydney, Australia and Hwang and Lin (2007) in
Central Taiwan. Survey and study design was reviewed by, and complied with, the
institutional review board (IRB) at Arizona State University (see Appendix A for survey
questions and B for the IRB letter of approval). Survey questionnaires had two sections:
a demographic information section and the respondents' climate perceptions.
Demographic information included sex and age range; how long they had been outdoors;
activities engaged in during the previous 30 minutes and whether that activity was in sun,
shade or indoors; zip code of their primary residence; and whether they cooled their home
and, if so, by what methods. The clothing worn was also recorded.
Climate perception questions used the ASHRAE seven-point satisfaction scale
for temperature, humidity, sunshine and wind. Respondents were asked their
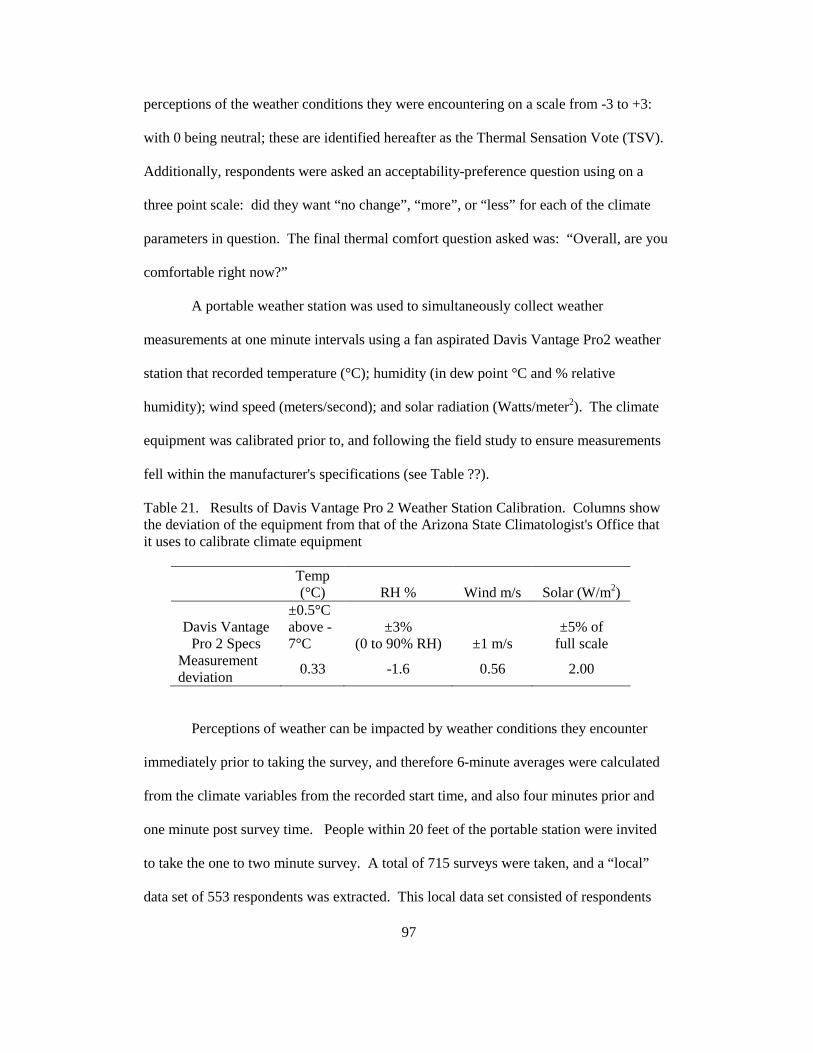
97
perceptions of the weather conditions they were encountering on a scale from -3 to +3:
with 0 being neutral; these are identified hereafter as the Thermal Sensation Vote (TSV).
Additionally, respondents were asked an acceptability-preference question using on a
three point scale: did they want “no change”, “more”, or “less” for each of the climate
parameters in question. The final thermal comfort question asked was: “Overall, are you
comfortable right now?”
A portable weather station was used to simultaneously collect weather
measurements at one minute intervals using a fan aspirated Davis Vantage Pro2 weather
station that recorded temperature (°C); humidity (in dew point °C and % relative
humidity); wind speed (meters/second); and solar radiation (Watts/meter2). The climate
equipment was calibrated prior to, and following the field study to ensure measurements
fell within the manufacturer's specifications (see Table ??).
Table 21. Results of Davis Vantage Pro 2 Weather Station Calibration. Columns show the deviation of the equipment from that of the Arizona State Climatologist's Office that it uses to calibrate climate equipment
Temp (°C) RH % Wind m/s Solar (W/m2)
Davis Vantage Pro 2 Specs
±0.5°C above -7°C
±3% (0 to 90% RH) ±1 m/s
±5% of full scale
Measurement deviation
0.33 -1.6 0.56 2.00
Perceptions of weather can be impacted by weather conditions they encounter
immediately prior to taking the survey, and therefore 6-minute averages were calculated
from the climate variables from the recorded start time, and also four minutes prior and
one minute post survey time. People within 20 feet of the portable station were invited
to take the one to two minute survey. A total of 715 surveys were taken, and a “local”
data set of 553 respondents was extracted. This local data set consisted of respondents

98
whose primary residence was located within metropolitan Phoenix or in several
climatically similar locations outside of the metropolitan area.
The microclimate measurements were added to each survey: ambient temperature
and heat index, and three energy balance indices – Physiologically Equivalent
Temperature (PET); Standard Effective Temperature (SET); and Universal Thermal
Comfort Index (UTCI). The indices were calculated using RayMan Pro, acquired from
Andreas Matzarakis (personal communication 2011). RayMan Pro is the most recent
version of the thermal comfort model RayMan, developed by Andreas Matzarakis, Frank
Rutz, and Helmut Mayer (see Matzarakis et al. 2007). The model estimates radiation
fluxes taking into consideration the impacts of clouds and surrounding surfaces.
RayMan calculates mean radiant temperature, and several other energy budget indices:
PET, PMV, SET and UTCI to assess the thermal bioclimate. The model uses a range of
data: geographic coordinates; time/date; meteorological data (temperature, and humidity,
though other measurements can also be input into the model); site data (obstacles, sky
view); thermophysiological data: (activity and clothing); and personal physiological data
(sex, age, weight). These can be input manually or by a data file.
A data file was used with RayMan runs that included information from each of
the surveys: climate variables of temperature, relative humidity, solar radiation, and
wind speed; the clothing worn (in clo – the unit of thermal resistance/insulating value
where 0 is naked and 1 would be a typical business suit (Engineering Tool Box 2011a);
and the average metabolic rate (in watts) of the previous 30 minutes' activities
(Engineering Tool Box 2011b). Sky view factors were input through using 180° fisheye
photographs taken at each survey site. The personal/human physiological data consisted
of two hypothetical American adults: an “average” man (weighing 88 kg, 1.8 m in height
and aged 35 years) and an “average” woman (75 kg; 1.6 m; 35 years).

99
Ambient temperature and heat index plus multiple indices obtained from
RayMan (PET, SET and UTCI) were included in the analyses, allowing for comparison
to previous studies, as well as to possible future research. Data sets were then compiled
into 1°C bins for each index to reduce the likelihood that individual surveys made an
undue influence on results – the same methodology previously used by Spagnolo and de
Dear (2003) in Sydney, Australia, and Hwang and Lin (2007) and Lin and Matzarakis
(2008) in central Taiwan. The mean thermal sensation vote (MTSV) was calculated for
each 1°C bin. Some bins had low survey counts. To analyze the impact of these low
count bins played on the MTSV, regression analyses were done using a systematic
elimination of low count survey bins (1 survey bins, then 2 survey bins … etc.). The
data set with five or fewer survey in the bin surveys produced the consistently strongest
R2 values with the lowest number of bin exclusions. Thus, data used did not include
temperature bins with 5 or fewer surveys.
“Thermal neutral” is a term used to identify the temperature at which respondents
perceived as neither hot nor cold – and therefore neutral. This is derived by finding
MTSV for each 1°C temperature bin using the ASHRAE 7 point scale from -3 (much too
cool) to +3 (much too hot) and where 0 is “OK” – neither hot nor cold. Plots for MTSV
to 1°C temperature bins were created for each index (temperature, heat index, PET, SET
and UTCI). A linear fitted line was added to the plots. The temperature where the line
crosses 0 is the “thermal neutral” temperature for each index (Hwang and Lin 2007).
“Thermal acceptability” identifies the temperature range that was “acceptable”
to respondents using their TSV (Hwang and Lin 2007). Three categories of TSVs were
combined into an “acceptable” category: “a bit cold” (-1 TSV), “OK” (0 TSV) or “a bit
hot” (1 TSV). These TSVs are considered as within the range of “acceptable” to
respondents. The percent of people who responded -1, 0 or +1 for temperature was
100
calculated and then plotted for each 1°C temperature bin. A second-degree polynomial
was fit to the percentage satisfied plots. The acceptability limit was set to 80% of
responses and a more rigorous 90%. Where the fitted curve crossed the 80% and 90%
acceptable (or 20% and 10% percent dissatisfied) identifies the upper and lower limits of
“thermal acceptable”. This current study's focus was to identify heat acclimatization and
a limited number of surveys were taken in cooler weather. Thus, only the upper limit for
thermal acceptance is discernible.
An additional thermal index was calculated– a thermal “heat tolerance” index.
This is a heat tolerance level identified using the same methodology used to find the
thermal acceptance values, but identifies the number of people who responded
“comfortable” even though their TSV was outside of the three previously identified as
acceptable. This index was calculated because the vast majority (82%) of respondents
with a TSV 1 or TSV 2 reported being “comfortable”. Again the percentage of people
who reported being comfortable for each 1°C bin was plotted for and fitted with a
second-order polynomial. The point at which the fit line crosses 80% and 90%
thresholds are the “heat tolerance” temperature.
Results
Thresholds of Thermal Neutral, Acceptability and Heat Tolerance
“Thermal neutral” is the average temperature where respondents felt the
temperature was neither warm nor cool. In Phoenix ambient temperature “thermal
neutral” was 22.2°C (72.0°F) and heat index was lower at 19.2°C (66.6°F) (Fig. 18 ).
The R2 values were strong and statistically significant to MTSV. PET, SET and UTCI
were considerably higher (from 27.2°C to 32.6°C) with PET at 32.6°C – more than 10°C
higher than that of ambient temperature. Wind speeds tend to be quite low in Phoenix,

101
and solar radiation is generally very intense due to its elevation, latitude, and generally
cloudless, clear sky, which can make it feel much warmer than the ambient temperature.
Fig 18: Identification of Thermal Neutral. The symbols are the temperature (x-axis) to the Mean Thermal Sensation Vote for each 1°C temperature bin (y-axis). The lines are fitted linear trendline. Where the lines cross 0 is the temperature where respondents were neither warm nor cool and therefore "neutral". Thermal Neutral values for the five indices used are shown in the upper left corner, along with the associated R2 values.
Thermal acceptance is the temperature that respondents found within an acceptable
range. The data allowed for calculation of the upper threshold of thermal acceptance and
the high R2 values between 0.83 and 0.96 show a good fit to the polynomial line. All of
the “thermal acceptance” values were more than 10°C higher than those of “thermal
neutral”. All three indices produced high values of acceptability at both 80% and 90%
thresholds. The 80% thresholds were a PET of 44.6°C (112.3°F) ; UTCI 37.0°C (98.6°F)
and SET was between them at 40.3°C (104.5°F) The 90% thresholds were cooler
ranging between 45.2°C PET (113.4°F) and 29.1°C PET for Heat Index (84.4°F) (Fig.
19).

102
Fig. 19. Thermal Acceptability. Symbols are the plotted temperature and percent of local people surveyed who responded that the temperature was a bit cool (-1 TSV), OK (TSV 0), or a bit warm (TSV +1) for each degree C temperature bin. The lines are a fitted second order polynomial line fitted to the plotted data. The threshold temperature of thermal acceptance for each index was identified by where the trendlines cross either the 80% or the more rigorous 90% acceptable line. The table below shows the thermal acceptability thresholds for each index at 80% and 90% cut offs and the associated R2 values.
A high percentage of respondents who thought that the temperature was “a bit hot”
(TSV 1 – 91%) or “hot” (TSV 2 – 69%), reported being comfortable thus suggesting a
high level of heat tolerance in Phoenix (Table 21 ). The heat tolerance levels were all
high – considerably higher than thermal neutral and somewhat higher than thermal
acceptance levels (Table 22). The 80% heat tolerance thresholds ranged from a high of
52.0°C (125.6°F) for PET, and 33.4°C (92.1°F) for Heat Index.

103
Table 22: Heat Tolerance: Upper threshold of heat tolerance – the temperature at which 80% and 90% of respondents reported being comfortable – even though many perceived the temperature as “a bit hot” or “hot”.
Index 80% Limit (°C) 90% Limit (°C) R2
PET 52.0 45.2 0.61
SET 47.6 40.4 0.70
UTCI 41.6 37.8 0.66
Ambient Temperature 34.5 30.5 0.69
Heat Index 33.4 29.1 0.61
Comparison to Other Locations/Studies
Thermal comfort studies using surveys from other localities use a variety of
indices, and methodologies so, making comparisons can be cumbersome, though
inferences can be done cautiously. Thermal neutral is the most reported index. Thermal
neutral is reported for 7 European cities by Nikolopoulou and Lydoudis (2006) give air
temperature values for each season and an overall mean – Table 23 gives the average
thermal neutral. They used 1°C temperature bins but each bin included data between
0.5°C below and above the bin temperature. Therefore thermal comfort thresholds may
be slightly underestimated when compared to Phoenix. Their key finding has
applicability to the Phoenix study: the cities with warmer climates had higher thermal
neutrals.
Table 23. Thermal Comfort Thresholds for Phoenix.
Thermal Neutral (°C)
Thermal Acceptance (°C)
Thermal-Heat Tolerance (°C)
PET 32.6 44.6 52.0 SET 27.2 40.3 47.6 UTCI 28.4 37.0 41.6 Ambient Temperature 22.2 31.5 34.5 Heat Index 19.2 29.4 33.4
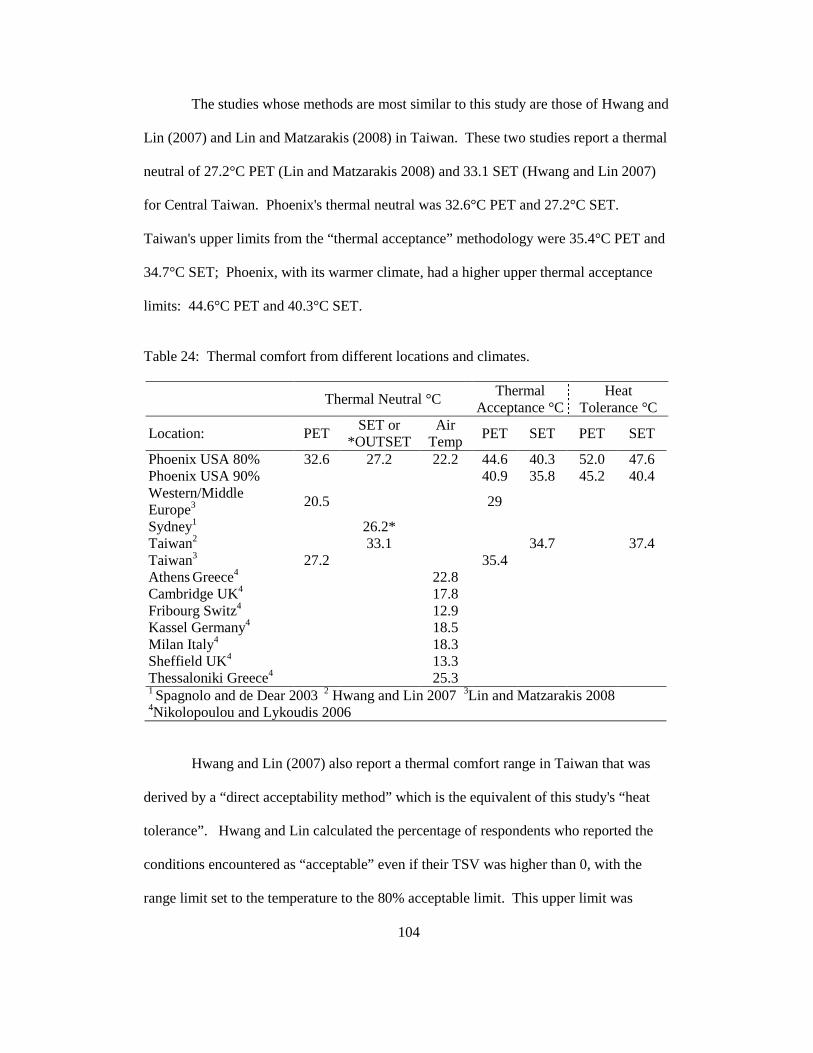
104
The studies whose methods are most similar to this study are those of Hwang and
Lin (2007) and Lin and Matzarakis (2008) in Taiwan. These two studies report a thermal
neutral of 27.2°C PET (Lin and Matzarakis 2008) and 33.1 SET (Hwang and Lin 2007)
for Central Taiwan. Phoenix's thermal neutral was 32.6°C PET and 27.2°C SET.
Taiwan's upper limits from the “thermal acceptance” methodology were 35.4°C PET and
34.7°C SET; Phoenix, with its warmer climate, had a higher upper thermal acceptance
limits: 44.6°C PET and 40.3°C SET.
Table 24: Thermal comfort from different locations and climates.
Thermal Neutral °C Thermal
Acceptance °C Heat
Tolerance °C
Location: PET SET or
*OUTSET Air
Temp PET SET PET SET
Phoenix USA 80% 32.6 27.2 22.2 44.6 40.3 52.0 47.6 Phoenix USA 90% 40.9 35.8 45.2 40.4 Western/Middle Europe3
20.5
29
Sydney1 26.2* Taiwan2 33.1 34.7 37.4 Taiwan3 27.2 35.4 Athens Greece4 22.8 Cambridge UK4 17.8 Fribourg Switz4 12.9 Kassel Germany4 18.5 Milan Italy4 18.3 Sheffield UK4 13.3 Thessaloniki Greece4 25.3 1 Spagnolo and de Dear 2003 2 Hwang and Lin 2007 3Lin and Matzarakis 2008 4Nikolopoulou and Lykoudis 2006
Hwang and Lin (2007) also report a thermal comfort range in Taiwan that was
derived by a “direct acceptability method” which is the equivalent of this study's “heat
tolerance”. Hwang and Lin calculated the percentage of respondents who reported the
conditions encountered as “acceptable” even if their TSV was higher than 0, with the
range limit set to the temperature to the 80% acceptable limit. This upper limit was
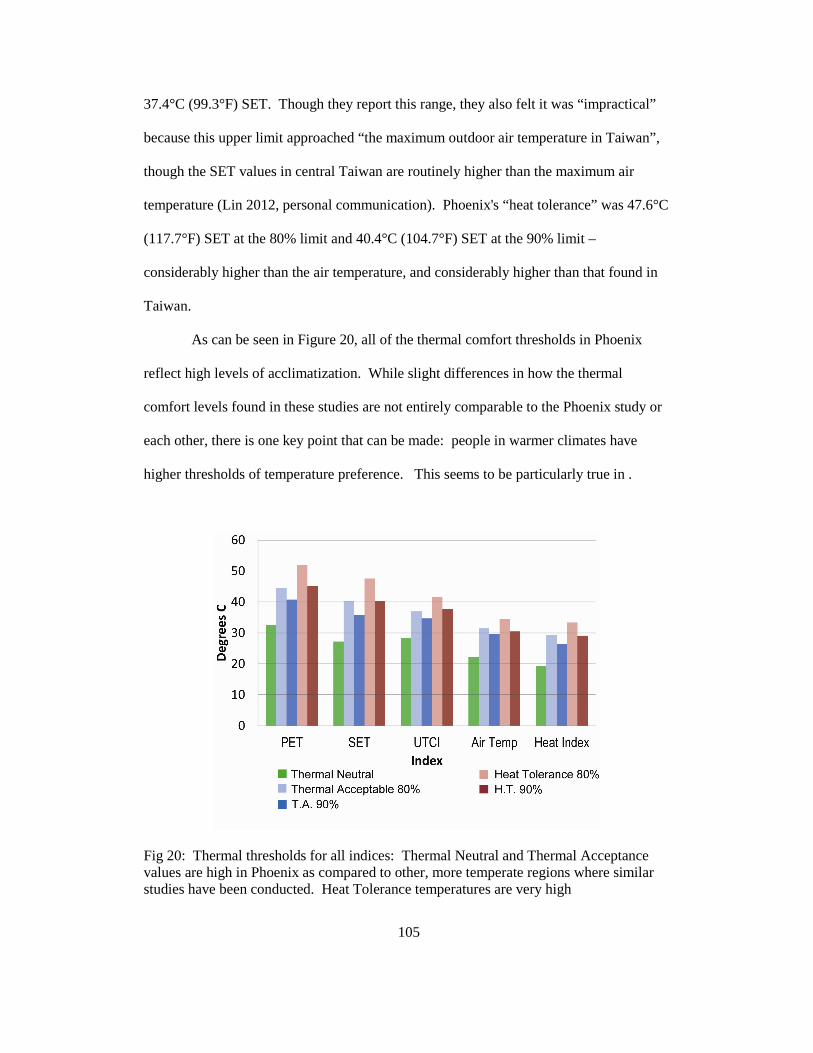
105
37.4°C (99.3°F) SET. Though they report this range, they also felt it was “impractical”
because this upper limit approached “the maximum outdoor air temperature in Taiwan”,
though the SET values in central Taiwan are routinely higher than the maximum air
temperature (Lin 2012, personal communication). Phoenix's “heat tolerance” was 47.6°C
(117.7°F) SET at the 80% limit and 40.4°C (104.7°F) SET at the 90% limit –
considerably higher than the air temperature, and considerably higher than that found in
Taiwan.
As can be seen in Figure 20, all of the thermal comfort thresholds in Phoenix
reflect high levels of acclimatization. While slight differences in how the thermal
comfort levels found in these studies are not entirely comparable to the Phoenix study or
each other, there is one key point that can be made: people in warmer climates have
higher thresholds of temperature preference. This seems to be particularly true in .
Fig 20: Thermal thresholds for all indices: Thermal Neutral and Thermal Acceptance values are high in Phoenix as compared to other, more temperate regions where similar studies have been conducted. Heat Tolerance temperatures are very high
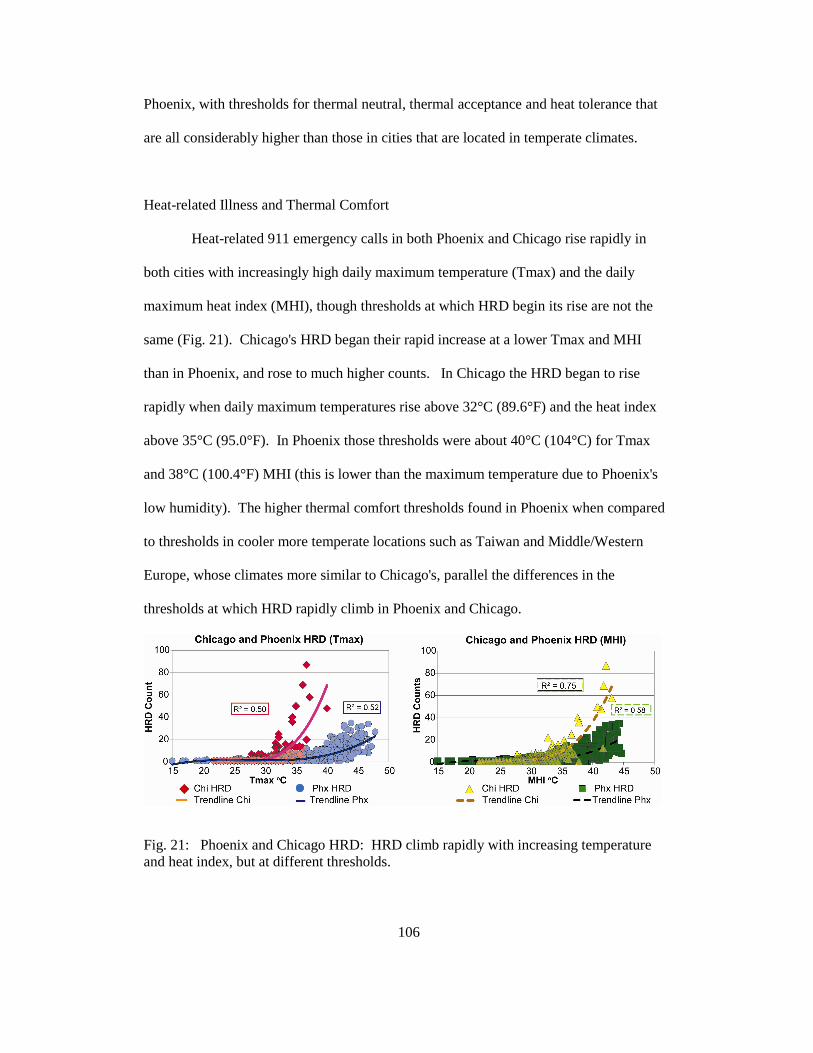
106
Phoenix, with thresholds for thermal neutral, thermal acceptance and heat tolerance that
are all considerably higher than those in cities that are located in temperate climates.
Heat-related Illness and Thermal Comfort
Heat-related 911 emergency calls in both Phoenix and Chicago rise rapidly in
both cities with increasingly high daily maximum temperature (Tmax) and the daily
maximum heat index (MHI), though thresholds at which HRD begin its rise are not the
same (Fig. 21). Chicago's HRD began their rapid increase at a lower Tmax and MHI
than in Phoenix, and rose to much higher counts. In Chicago the HRD began to rise
rapidly when daily maximum temperatures rise above 32°C (89.6°F) and the heat index
above 35°C (95.0°F). In Phoenix those thresholds were about 40°C (104°C) for Tmax
and 38°C (100.4°F) MHI (this is lower than the maximum temperature due to Phoenix's
low humidity). The higher thermal comfort thresholds found in Phoenix when compared
to thresholds in cooler more temperate locations such as Taiwan and Middle/Western
Europe, whose climates more similar to Chicago's, parallel the differences in the
thresholds at which HRD rapidly climb in Phoenix and Chicago.
Fig. 21: Phoenix and Chicago HRD: HRD climb rapidly with increasing temperature and heat index, but at different thresholds.

107
Figure 22 shows a comparison of the thresholds of HRD to thermal comfort thresholds
for Phoenix, Taiwan and Middle/Western Europe The bars are thermal comfort
thresholds of Phoenix and those of Taiwan and Middle/Western Europe. Taiwan's
thresholds are in values for SET (from Hwang and Lin 2007) and also PET (from Lin and
Matzarakis 2008). The Europe thresholds in PET are also from Lin and Matzarakis
(2008). The thermal comfort thresholds are higher than those of Taiwan and Europe at
both 80% and the more rigorous 90% . The horizontal red and blue lines are the data for
the higher thresholds at which HRD rapidly increased in Phoenix and Chicago. The
differences in the HRD thresholds and the thermal comfort thresholds parallel each other,
This does not definitively link thermal comfort adaptation to the climate differences in
the HRD, but it does suggest that possibility. Research in other climates is needed to help
prove or disprove linkages of acclimatization to heat-related illness.
Discussion
This study and previous studies from other locations show that people living in cities
with warmer climates have adapted to their warmer climate. The temperature that people
prefer when living in warmer cities, (at which they are neither hot nor cold) is higher than
those found in more temperate cities. Few studies have looked at thermal acceptance and
heat tolerance levels. Of those that have, there is evidence that people's levels of thermal
acceptance are also higher in warmer locations. This study found that even though
Phoenix residents would prefer cooler conditions, they were also relatively comfortable
in conditions they also reported as hot – much hotter than those reported in studies in
other climates. The temperatures that people in Phoenix found thermally acceptable are
higher than those found in other locations, and Phoenix's “heat tolerance” levels are even

108
Fig. 22. Thresholds of Acclimatization and HRD. The bars show the thermal comfort thresholds of Phoenix and those of Taiwan and Middle/Western Europe. Taiwan's thresholds are in SET (from Hwang and Lin 2007) and in PET (from Lin and Matzarakis 2008). The Europe thresholds in PET are also from Lin and Matzarakis (2008). The climate in Taiwan and Europe are more temperate than Phoenix, and closer to the climate of Chicago. The thermal comfort thresholds are higher at both 80% and the more rigorous 90% than those of Taiwan and Europe. The horizontal red and blue lines are the data s for the higher thresholds at which HRD rapidly increased in Phoenix and Chicago. The differences in the HRD thresholds and the thermal comfort thresholds parallel each other. This suggests that some of differences in HRD between Phoenix and Chicago may be linked to acclimatization.
higher. In such a hot environment, “heat tolerance” may be a very good methodology for
identification of adaptation to heat because residents are exposed to high heat during
much of the year. These high levels of thermal comfort and heat tolerance are likely due
in part to the continuous exposure to air temperatures that frequently exceed 40°C
(104°F) during 5 months of the year. It could also be attributable to air conditioning
access.
All of the surveys' local respondents reported some form of air cooling
mechanism in their residences: 97% had central air conditioning; 2 used only window air
109
conditioning units; 4 used only evaporative cooling; and 18 used a combination of air
conditioning and evaporative cooling, likely using their central air conditioning unit when
increased humidity levels make evaporative cooling ineffective. Despite this wide spread
access to air conditioning, this study found high levels of outdoor acclimatization to heat.
Perhaps the access to air conditioning may influence people's heat tolerance. The survey
questions in this current study do not themselves provide a definitive answer to the role
that air conditioning may be making to perceptions of thermal comfort, although
anecdotal conversations with respondents suggests that even though it was hot, the
conditions they were encountering were not nearly as hot as they could be, thus
suggesting a perception of relative coolness. Also, as one respondent commented, being
outdoors gave them a break from being cooped up in air conditioning. It seemed that
outdoor activities provided a change from their typically indoor, air conditioned routines
during the hot weather period and may contribute to their perceptions of comfort. A
study by Aljawabra and Nikolopoulou (2009) compared outdoor use by residents in
Phoenix to those Marrakesh – a city that is only slightly cooler than Phoenix. They found
a high level of tolerance to heat in Phoenix that they suggest may be because residents
spend a large part of their day in air conditioning.
A bit of caution does need to be taken in the thermal comfort conclusions, as
participants in the survey chose to be outdoors – sometimes in hot conditions. As
previously mentioned, on hot days many survey participants commented they typically
would not spend much time outdoors at that time of year. The survey questions do not
lend themselves to estimate how much of the high levels of thermal comfort could be
attributable to people's knowledge and use of heat-stress reducing strategies, such as
increasing the intake of fluids, and wearing loose fitting, light colored and light-weight
clothing.

110
One of the reasons a 90% acceptable limit was included in the analysis is that
having access to shade seems to be playing an important role in thermal comfort. There
were only 21% of people surveyed who reported having spent the previous 30 minutes in
the sun and these were the least likely to be comfortable – although 76% did report being
comfortable. The majority of interviewees (64%) reported being in shade some of the 30
minutes prior to taking the survey. People who reported being primarily in shade (35%
of surveys) were less likely to be comfortable than those who had been in both sun and
shade (84% versus 88% reported being comfortable). In an arid environment, stepping
into shade can dramatically increase thermal comfort. Perhaps some of the high levels of
heat tolerance is related to people knowing that relief is easily available by moving into
shade or air conditioned spaces when needed. People who had been primarily inside
(12% of surveys), which generally meant an air conditioned building or car, during the
previous 30 minutes were the most likely to still be comfortable (Table 24). The
questionnaire used did not include questions that could assess if the attractiveness of the
environment could have played a role in respondents' perceptions of comfort. There is a
need for research that could better measure this dynamic in very warm places like
Phoenix.
Table: 25. Percent of Respondents In Sun, Shade Or Indoors. Participants were asked what they had been doing the previous 30 minutes, and if these activities were primarily in sun; shade; inside or a combination of these.
% of surveys taken
% surveys Comfortable
Sun 21 76.5 Sun and Shade 29 88.0
Shade 35 84.6
Indoors 12 92.4
111
Conclusions
Thermal comfort studies similar to this have documented increased
acclimatization in a few locations and climates, and found increased levels of thermal
acceptability in warm climates. This study found an even higher level of acclimatization
in the people who live in the hot, dry climate of metropolitan Phoenix – evidenced by the
high level of thermal comfort in hot conditions and high thresholds of heat tolerance.
The majority of people surveyed (82%) who thought weather conditions were “a bit hot”
or “hot” reported that they were also comfortable. People surveyed who had been
primarily indoors during the previous 30 minutes were the most likely to be comfortable
and those who had been primarily in the shade were the least likely to report being
comfortable. Also, most people surveyed (64%) had spent some or most of the previous
30 minutes in shade, suggesting that shade and access to air conditioning may play an
important role in people's perceptions of comfort.
High levels of acclimatization in Phoenix may also be playing a role in the
differences found in the heat-relatedeat-related 911 emergency dispatches between
Chicago and Phoenix that inspired this thermal comfort study. Though Phoenix had more
HRD over the course of a year, it did not experience the large spikes in calls that occurred
in Chicago. Both cities experienced a rapid increase in HRD with increasing temperature
and humidity, however, the thresholds at which this occurred were much higher in
Phoenix. This difference is roughly comparable to the thermal comfort adaptation
differences found between Phoenix and those of cities with a more temperate climate –
climates more similar to that of Chicago.
McGeehin and Mirabelli (2001) suggest some of the regional differences they
found in mortality is likely attributable to “acclimatization”. Though not definitive, this
study suggests that a high level of acclimatization could be playing a role in Phoenix's

112
resilience to high spikes in heat-related illness, despite resident's exposure to high heat
for much of the summer. It is unknown how much of Phoenix's acclimatization is
physiological and how much is psychological. Does living in a in a hot climate also
encourage or even necessitate a better understanding of the dangers of heat and
knowledge of strategies that enhance comfort such as modification of clothing and
behavior to help stay cool and therefore possibly reduce the risk of heat-related illness?
Additional research aimed at understanding the physiology and psychology of thermal
comfort and thermal comfort adaptation is needed. So, too is more research that can
assess possible linkages of thermal comfort adaptation and heat tolerance to heat-related
illness differences in other climates.
Additional research to identify current levels of acclimatization in populations
already living in a hot climate could provide more substance and accuracy to future
estimates. This information could prove important toward applications of future planning
and mitigation strategies and estimating health impacts under increasingly hot conditions
in cities and elsewhere around the globe.

113
Chapter 6
CONCLUSIONS AND CONTRIBUTIONS
This dissertation is comprised of studies coupling two fields of research: heat-
related morbidity with human thermal comfort adaptation. Historically, these two fields
of research have been separate. The heat-related morbidity components of the research
are climate studies of heat-related 911 emergency dispatch data (HRD) from two
geographically and climatically different cities in the United States: hot and dry Phoenix,
Arizona in the Southwestern U.S. and the more temperate Chicago, Illinois located in the
upper Midwest. I analyze the weather conditions associated with heat-related emergency
911 dispatches (HRD) in Phoenix, Arizona and then Chicago, Illinois, separately and
then compare the weather-HRD relationships between these two cities. These are
followed by a survey-based field study to assess outdoor human thermal comfort
adaptation in Phoenix. A key objective is to show the benefits possible from
collaboration between these two fields.
Heat-related climate impacts on health is a growing concern worldwide as
evidenced by organizations such as the World Health Organization, U.S. Environmental
Protection Agency (EPA) and the U.S. Centers for Disease Control and Prevention
(CDC) who have made health and climate a research priority (EPA 2012, CDC
2008,WHO 2003). Studies of climate linkages to mortality discovered regional patterns
in summertime mortality in North America, which showed a reduction of risk in hotter
Southern cities in North America when compared to more temperate cities (Curriero et al.
2002; , Medina-Ramon and Schwartz 2007; Sheridan and Kalkstein 2010; and Anderson
and Bell 2011). The current climate-HRD analyses showed this pattern also exists in
heat-related morbidity data.

114
The HRD studies are followed by a survey-based field study that quantifies
human thermal comfort (HTC) adaptation in people living in the hot dry climate of
metropolitan Phoenix. The results of this HTC study are then compared to the findings of
the HRD studies.
Chapter 2 examines the heat-related 911 emergency dispatches (HRD) in
Phoenix, Arizona for the years 2001 through 2006. The study identified several temporal
patterns: all 12 months of the year had at least some HRD, but the majority occurred
during the hot weather months, peaking in July. Diurnally, the fewest calls occurred
between all 0600 local standard time (LST) and 0700 LST and peaked between 1400 and
1600 LST. HRD counts were compared to maximum temperature (Tmax) and heat index
(HI) calculated at 1500 LST. HI was the stronger predictor of HRD. During this study
period there were 361 days with HRD counts of >5 dispatches and all but two had a
Tmax higher than the normal Tmax. The highest days of HRD occurred during a heat
wave of 2006, and a detailed examination of that period showed that the highest day of
HRD followed the day with the highest Tmax. The study found that holiday periods
could increase HRD. Analyses using the energy balance model OUTCOMES, which
includes influences of radiation and wind along with temperature and humidity,
suggested that use of a more complete index than air temperature or even heat index may
improve accuracy in prediction and issuance of heat warnings.
Chapter 3 analyzes the climate and spatial parameters of HRD in Chicago from
2003 through 2006 in greater detail than the Phoenix study. Statistical analyses found
high correlations between the weather and HRD, though the strongest correlations were to
the maximum heat index (MHI). HRD began to exponentially climb with increasingly
high Tmax and MHI. When the Tmax rose above 32° C (89.6°F) or the MHI rose above
36°C (96.8°F), HRD rapidly increased. A spatial analysis using one kilometer grids
115
found HRD were more randomly spaced than clustered. However, a cluster of higher
HRD counts that occurred in the downtown central business district grid were not evident
during the heat wave period of 2006. Several situations produced lower or higher HRD
counts than what would typically be expected for the climate conditions: special events
sometimes increased HRD, and days with a very high MHI that occurred early in the day,
but was interrupted by rainfall in the early afternoon, would produce lower than typical
HRD counts.
Chapter 4 compares the HRD and climate conditions between Phoenix, Arizona
and Chicago Illinois for the years 2003 through 2006. Both cities experienced the
majority of HRD during their warm/hot weather seasons, although Phoenix's season is
two months longer, ranging from 1 April to 31 October. MHI was the strongest predictor
of HRD, though Tmax was also strong. Overall, Phoenix had more HRD than Chicago
and both cities experienced the rapid rise in HRD with increasing Tmax and MHI. In
Chicago, HRD began to rise rapidly when the Tmax was above 32°C (89.6° F) and the
MHI was above 35°C (96.8°F). In Phoenix the thresholds were higher – about 40°C
(104°F) for Tmax and 38°C (100.4°F) MHI (the calculated MHI was often lower than the
Tmax in Phoenix due to low humidity). Chicago's highest count of HRD was 87 calls,
almost 2.5 times higher than the 35 calls on Phoenix's highest HRD day. On the ten
highest days of HRD, Chicago averaged 46 HRD dispatches while Phoenix averaged 31
calls. Most of Chicago's highest days of HRD were also days where Tmax and MHI had
the greatest difference from normal, but these conditions were still cooler than many days
in Phoenix. The absence of high spikes in HRD in Phoenix despite its much hotter
conditions suggests a level of resilience to heat in Phoenix.
Chapter 5 investigated thermal comfort adaptation and levels of heat tolerance in
residents of the Phoenix area. Most studies that assess urban design and microclimates

116
use thermal comfort thresholds that are commonly accepted as comfortable everywhere,
though they have been found to be reflective of populations from western/middle Europe
(Lin and Matzarakis 2008). However, several survey-based studies have found that these
levels do not accurately represent comfort everywhere, and that cities in warmer climates
have higher thresholds of comfort.
I used methodologies designed to assess perceptions of thermal comfort and
acceptability: The questionnaire and analysis methods were adapted from the previously
mentioned studies, which were done in localities with hot and humid climates or more
temperate climate than Phoenix's climate. This current study found a high level of
thermal comfort adaptation in Phoenix.
The microclimate parameters recorded at the time of the surveys were later used
in an energy balance model (RayMan) to calculate three energy balance indices: PET,
SET and UTCI. Phoenix residents' thermal comfort preference and acceptance
levels/thresholds as well as heat tolerance thresholds were calculated for these three
indices, as well as air temperature and heat index. Phoenix's thermal neutral, the
temperature that is neither cool nor warm but “comfortable”, was warmer than those
commonly accepted from western/middle Europe. The study by Hwang & Lin (2007) in
Central Taiwan, which has a more temperate climate than Phoenix, used similar
methodology of that used for this dissertation. They discovered the thermal neutral in
Taiwan was higher than that of western/middle Europe. Phoenix's thermal neutral was
more similar to that of Taiwan. However, the range of temperatures that Phoenix
respondents' found acceptable was higher than those in Taiwan. The heat tolerance
thresholds, the temperature at which respondents were still comfortable, were even higher
than the acceptance thresholds. The current study found that Phoenix residents preferred
temperatures similar to or slightly warmer than those documented in other climates, but

117
residents were comfortable at much higher temperatures, indicating a considerable
amount of adaptation/acclimatization to the local, hot climate.
Comparing the results of the HTC study to those of HRD produced some
interesting parallels. Phoenix's increased levels of acclimatization when compared to
those of more temperature climates are similar to the different responses to weather found
in the HRD data. Though a few HRD occur nearly every day in Phoenix from May
through September, Phoenix was resistant to the very large spikes in HRD that occurred
in Chicago. Some or even much of this resilience can be attributed to the near ubiquitous
access to air conditioning or other cooling devices in the Phoenix area, which is not the
case in the Chicago area. The high level of adaptation to heat found in Phoenix may also
be a factor, though to what degree is not discernible from the design of this study, and
verification or quantification requires additional research.
Contributions and Gaps in the Literature
This dissertation adds to several different sets of literature: climate- heat-related
morbidity and mortality, the field of human thermal comfort and acclimatization, and in
crossover or amalgamation of these two areas of research
In the heat-related morbidity field this dissertation adds to the literature in several
ways and helps to fill the gap identified by McGeehin and Mirabelli in 2001 – a great
need for more heat morbidity studies.
• Firstly, it provides a better understanding of the climate conditions that generate
and exacerbate heat-related illness for two cities.
• Secondly, it compares the climate linkages to HRD morbidity data in two
distinct climates and geographical locations: Phoenix, Arizona and Chicago,
118
Illinois. The findings of the study reinforces that the regional pattern found in
the mortality data also exists in morbidity data.
This dissertation also adds to the human thermal comfort literature, particularly
useful in the arena of outdoor urban design. Though the “relative” thermal comfort of
different designs can be attained with the commonly used thresholds, having more
accurate estimates for thermal comfort can prove to be important in assessing strategies
to obtain achievable levels of comfort in a hot, dry climate. Quantification of thermal
comfort adaptation in a hot, dry climate can be beneficial in urban and microclimate
design studies for outdoor thermal comfort.
There is a third area to which this dissertation makes an important contribution:
the role that thermal comfort adaptation plays in heat-related morbidity. This is a field
that is just beginning to be explored, and it is hoped that some of the ideas and research
methodologies contained within this dissertation will encourage the growth in this
important field of research.
In addition to its contributions, this dissertation also points to gaps and areas
where more is needed. One is the need for uniformity in defining data such as the criteria
used to classify a 911 dispatch as “heat-related”. Definitions of morbidity data (and also
mortality data) vary considerably across studies making comparisons difficult. A key
limitation in this research was the lack of demographic data for the HRD. Much more
detailed analyses could have been made had data also included information such as age;
sex; activities engaged in prior to the incident; whether the victim had been indoors or
outdoors prior to the incident; were they at home, the office, shopping or a park; where
did they live – were they a local or visitor. With a home address, analyses could be made
on the possible connections to their home and neighborhood. Future studies should

119
include these additional data, if at all possible. Additional human thermal comfort
adaptation studies are needed to document acclimatization in other cities and in other
climates and more accurately define localized human thermal comfort. There is also a
need for more studies of acclimatization levels in relationship to heat-related morbidity
and mortality that could provide more validation of this research's the findings.
Research is needed to assess the knowledge differences that might exist between
people living in temperate city like Chicago and those living in a hot city like Phoenix. It
would be very beneficial for planning purposes and resource allocations to know if some
of the differences in HRD could also be attributable to a better local understanding of the
dangers of heat in Phoenix, knowing the early warning signs of heat stress, and the
awareness of effective mitigation strategies and behaviors. The questionnaire did not
lend itself to evaluating to what degree thermal comfort perceptions were affected by
availability of shade, the appeal of the locations or knowing that relief from the intense
heat is easily accessible. Research of this kind could be very beneficial to the creating
cooler, more comfortable and sustainable urban design.
The National Science Foundation's Act of 1950 sets a mission statement that
includes the importance of research with “broader impacts” that can also “promote the
progress of science; to advance the national health, prosperity, and welfare…” (NSF
2007). This goal was an integral component of this dissertation.

120
REFERENCES
Abbe C (1898) Sensible Temperatures or the Curve of Comfort. Monthly Weather Review 26 (8):362.
Aljawabra F, Nikolopoulou M Outdoor Thermal Comfort in the Hot Arid Climate. In:
PLEA 2009; 26th Conference on Passive and Low Energy Architecture Quebec City, Canada, 22-24 June 2009 2009.
Arizona Department of Health Services (ADHS) (2006) Available at:
http://www.azdhs.gov/phs/oeh/pdf/heatplan606.pdf Accessed June 2008. Arizona Public Service (APS) (2004). Available at: https://www.aps.com/general_
info/newsrelease/newsreleases/NewsRelease_265.html Accessed July 2008. Anderson GB, Bell ML (2011) Heat Waves in the United States: Mortality Risk during
Heat Waves and Effect Modification by Heat Wave Characteristics in 43 U.S. Communities. Environmental Health Perspectives 119 (2):210 – 218.
Bassil KL, Cole DC, Moineddin R, Craig AM, Lou WYW, Schwartz B, Rea E (2009)
Temporal and spatial variation of heat-related illness using 911 medical dispatch data. Environmental Research.
Blunden J, S. AD, O. BM (2011) State of the Climate in 2010. Bulletin of the American
Meteorological Society 92 (6):S1-S266. Brazel A, Selover N, Vose R, Heisler G (2000) The tale of two climates - Baltimore and
Phoenix urban LTER sites. Climate Research 15 (2):123-135. Brown RD, Gillespie TJ (1995) Microclimatic Landscape Design. J. Wiley & Sons, New
York. California Energy Commission (2007). Final staff forecast for 2008 peak demand.
California Energy Commission, Sacramento, CA, CEC-200-2007-006SF. Centers for Disease Control and Prevention (1995). Heat-related mortality-Chicago, July 1995. Morb Mortal Wkly Rep 44:577–579.
Centers for Disease Control and Prevention (2005) Heat-related mortality-Arizona,
1993–2002, and the United States 1979– 2002. Morb Mort Wkly Rep 54(25):628–630, Department of Health and Human Services, July 1 2005.
Centers for Disease Control and Prevention (CDC) (2008) Heat-Related Morbidity and
Mortality. Available at: http://www.cdc.gov/climatechange/effects/ heat_related.htm. Accessed: March 2010.
City of Phoenix (2006) http://www.mag.maricopa.gov/pdf/cms.resource
/RESPONSE_PLAN_FOR_SU MMER_HEAT79908.pdf .

121
Conti, S., P. Meli, G. Minelli, R. Solimini, V. Toccaceli, M. Vichi, C. Beltrano, and L. Perini. (2005) Epidemiologic study of mortality during the Summer 2003 heat wave in Italy. Environmental Research 98 (3):390-399.
Curriero FC, Heiner KS, Samet JM, Zeger SL, Strug L, Patz JA (2002) Temperature and
mortality in 11 cities of the eastern United States. American Journal of Epidemiology 155 (1):80-87.
Davis RE, Knappenberger PC, Michaels PJ, Novicoff WM (2003) Changing heat-related
mortality in the United States. Environmental Health Perspectives 111 (14):1712-1718.
de Dear R, Brager GS (1998) Towards an Adaptive Model of Thermal Comfort and
Preference. ASHRAE Transactions 104 (1):145-167. de Dear RJ, Brager GS (2002) Thermal comfort in naturally ventilated buildings:
revisions to ASHRAE Standard 55. Energy and Buildings 34 (6):549-561. Diaz, J., A. Jordan, R. Garcia, C. Lopez, J. C. Alberdi, E. Hernandez, and A. Otero.
(2002) Heat waves in Madrid 1986-1997: effects on the health of the elderly. International Archives of Occupational and Environmental Health 75 (3):163-170.
Dolney TJ, Sheridan SC (2006) The relationship between extreme heat and ambulance
response calls for the city of Toronto, Ontario, Canada. Environmental Research 101 (1):94-103.
Ebi KL (2007) Towards an early warning system for heat events. Journal of Risk
Research 10 (5):729-744. Engineering Tool Box (2011a) Clothing thermal insulation. Available at:
http://www.engineeringtoolbox.com/clo-clothing-thermal-insulation-d_732.html1 Accessed 8 August 2010.
Engineering Tool Box (2011b) Metabolic Rates. Available at: http://www.engineeringtoolbox.com/met-metabolic-rate-d_733.html Accessed 8 August 2010.
Environmental Protection Agency. The Heat Island Effect; Chicago (2008) Available at: http://www.epa.gov/hiri/pilot/chicago.html. Accessed: 4 May 2008.
Environmental Protection Agency (EPA) (2012) Climate Change and Health Effects.
http://www.epa.gov/climatechange/downloads/Climate_Change_Health.pdf. Accessed March 2012 .
ESRI (2012) ESRI Developer's Network: Spatial Autocorrelation (Morans I) (Spatial
Statistics). http://edndoc.esri.com/arcobjects/9.2/NET/shared/geoprocessing/ spatial_statistics_tools/spatial_autocorrelation_morans_i_spatial_statistics_.htm. Accessed: April 12, 2012

122
Fanger PO (1972) Thermal comfort: analysis and applications in environmental engineering. McGraw-Hill, New York.
Fouillet, A., G. Rey, F. Laurent, G. Pavillon, S. Bellec, C. Guihenneuc-Jouyaux, J.
Clavel, E. Jougla, and D. Hemon. (2006) Excess mortality related to the August 2003 heat wave in France. International Archives of Occupational and Environmental Health 80 (1):16-24.
Gagge AP, Stolwijk JAJ, Hardy JD (1967) Comfort and thermal sensations and
associated physiological responses at various ambient temperatures. Environmental Research 1 (1):1-20.
Golden JS (2004) The built environment induced urban heat island effect in rapidly
urbanizing arid regions -a sustainable urban engineering complexity. Environ Sci 1(4):321–349.
Golden J, Brazel A, Salmond J, Laws D (2006) Energy and water sustainability -the role
of urban climate change from metropolitan infrastructure. Engineering for Sustainable Development 1 (1):55–70.
Golden, J. S., D. Hartz, A. Brazel, G. Luber, and P. Phelan. (2008) A biometeorology
study of climate and heat-related morbidity in Phoenix from 2001 to 2006. International Journal of Biometeorology 52 (6):471-480.
Gonzalez RR, Nishi Y, Gagge AP (1974) Experimental evaluation of standard effective
temperature a new biometeorological index of man's thermal discomfort. International Journal of Biometeorology 18 (1):1-15.
Gosling, S., J. Lowe, G. McGregor, M. Pelling, and B. Malamud. (2009) Associations
between elevated atmospheric temperature and human mortality: a critical review of the literature. Climatic Change 92 (3):299-341.
Hajat S, Armstrong B, Baccini M, Biggeri A, Bisanti L, Russo A, Paldy A, Menne B,
Kosatsky T (2006) Impact of high temperatures on mortality - Is there an added heat wave effect? Epidemiology 17 (6):632-638.
Hartz DA, Brazel AJ, Golden J. A Comparative Climate Analysis of Heat-Related
Emergency 911 Dispatches: Chicago, Illinois and Phoenix, Arizona USA 2003 to 2006. Submitted to International Journal of Biometeorology – in revision.
Hartz D, Golden J, Sister C, Chuang W-C, Brazel A (2011) Climate and heat-related
emergencies in Chicago, Illinois (2003–2006). International Journal of Biometeorology 56 (1):71-83
Hartz DA, Sister C, Chuang W-C (2010) A comparison study of heat-related emergency
911 Calls: Phoenix, Arizona and Chicago, Illinois from 2003 to 2006. AMS Annual Meeting: First Environment and Health Symposium, Atlanta 2010.

123
Heisler GM, Wang Y (2002) Applications of a human thermal comfort model. Fourth Symposium on the Urban Environ ment. May 2002. Norfolk, VA (American meteorological Society)
Höppe P (1999) The physiological equivalent temperature – a universal index for the
biometeorological assessment of the thermal environment. International Journal of Biometeorology 43 (2):71-75.
Hoppe P (2002) Different aspects of assessing indoor and outdoor thermal
comfort.Energy and Buildings 34 (6):661-665. Hutter, H. P., H. Moshammer, P. Wallner, B. Leitner, and M. Kundi. (2007) Heatwaves
in Vienna: effects on mortality. Wiener Klinische Wochenschrift 119 (7-8):223-227.
Hwang R-L, Lin T-P (2007) Thermal Comfort Requirements for Occupants of Semi-
Outdoor and Outdoor Environments in Hot-Humid Regions. Architectural Science Review 50:357-364.
Hwang RL, Cheng MJ, Lin TP, Ho MC (2009) Thermal perceptions, general adaptation
methods and occupant's idea about the trade-off between thermal comfort and energy saving in hot-humid regions. Building and Environment 44 (6):1128-1134.
International Society of Biometeorology (ISB) Commission 6 (2010) Universal Thermal
Comfort Index. http://www.utci.org/. Accessed September 8, 2010. Janssen J (1999) The history of ventilation and temperature control. American Society of
Heating, Refrigerating and Air-Conditioning Engineers 41:47 – 52. Johansson E (2006) Influence of urban geometry on outdoor thermal comfort in a hot dry
climate: A study in Fez, Morocco. Building and Environment 41 (10):1326-1338. Jones TS, Liang AP, Kilbourne EM, Griffin MR, Patriarca PA, Wassilak SGF, Mullan
RJ, Herrick RF, Donnell HD, Jr., Choi K, Thacker SB (1982) Morbidity and Mortality Associated With the July 1980 Heat Wave in St Louis and Kansas City, Mo. JAMA 247 (24):3327-3331. doi:10.1001/jama.1982.03320490025030.
Kalkstein, L. S., and K. E. Smoyer. (1993) Human Biometeorology - the Impact of
Climate-Change on Human Health - Some International Implications. Experientia 49 (11):969-979.
Kalkstein LS, Greene JS (1997) An evaluation of climate/mortality relationships in large
U.S. cities and the possible impacts of a climate change. Environ Health Perspectives 105(1):84–93.
Kalkstein LS, Jamason P, Greene J, Libby J, Robinsonet L (1996) The Philadelphia hot
weather–health watch/warning system: development and application, summer 1995. Bull Am Meteorol Soc 77:1519–1528.
124
Kalkstein LS, Sheridan SC, Kalkstein AJ (2009) Heat/Health Warning Systems: Development, Implementation, and Intervention Activities. In: McGregor GR (ed) Biometeorology for Adaptation to Climate Variability and Change, vol 1.Biometeorology. Springer Netherlands, pp 33-48.
Klineberg E (1999) Denaturalizing disaster: A social autopsy of the 1995 Chicago heat
wave. Theory Soc 28(2):239–295. Klinenberg, E. (2002) Heat wave: a social autopsy of disaster in Chicago. Chicago;
London: University of Chicago Press. Knez I, Thorsson S (2006) Influences of culture and environmental attitude on thermal,
emotional and perceptual evaluations of a public square. International Journal of Biometeorology 50 (5):258-268.
Kosatsky T (2005) The 2003 European heat waves. Eurosurveillance 10:148–149, #7–9,
Jul-Sept 2005. Knowlton, K., M. Rotkin-Ellman, G. King, H. G. Margolis, D. Smith, G. Solomon, R.
Trent, and E. Paul. (2009) The 2006 California Heat Wave: Impacts on Hospitalizations and Emergency Department Visits. Environmental Health Perspectives 117 (1).
Kovats RS, Hajat S (2008) Heat stress and public health: A critical review. Annual
Review of Public Health 29:41- 55. Leonardi GS, Hajat S, Kovats RS, Smith GE, Cooper D, Gerard E (2006) Syndromic
surveillance use to detect the early effects of heat-waves: an analysis of NHS direct data in England. Soz-PraÉventivmed 51(4):194–201.
Lin T-P, Matzarakis A (2008) Tourism climate and thermal comfort in Sun Moon Lake,
Taiwan. International Journal of Biometeorology 52 (4):281-290. Lin TP, Matzarakis A, Hwang RL (2010) Shading effect on long-term outdoor thermal
comfort. Building and Environment 45 (1):213-221. Lin T-P, de Dear R, Hwang R-L (2011) Effect of thermal adaptation on seasonal outdoor
thermal comfort. International Journal of Climatology 31 (2):302-312. Luber G, McGeehin M (2008) Climate Change and Extreme Heat Events. American
Journal of Preventive Medicine 35 (5):429-435. Matzarakis A, Mayer H, Iziomon MG (1999) Applications of a universal thermal index:
physiological equivalent temperature. International Journal of Biometeorology 43 (2):76-84.
Matzarakis A, Rutz F, Mayer H (2007) Modelling radiation fluxes in simple and complex
environments - application of the RayMan model. International Journal of Biometeorology 51 (4):323-334.

125
Mastrangelo G, Hajat S, Fadda E, Buja A, Fedeli U, Spolaore P (2006) Contrasting
patterns of hospital admissions and mortality during heat waves: are deaths from circulatory excess or an artifact? Med Hypotheses 66(5):1025–1028.
McGeehin MA, Mirabelli M (2001) The potential impacts of climate variability and
change on temperature-related morbidity and mortality in the United States. Environmental Health Perspectives 109:185-189.
Medina-Ramon M, Schwartz J (2007) Temperature, temperature extremes, and mortality:
a study of acclimatisation and effect modification in 50 US cities. Occupational and Environmental Medicine 64 (12):827-833.
Michelozzi P, Accetta G, D'Ippoliti D, D'Ovidio M, Marino C, Perucci C, Ballester F,
Bisanti L, Goodman P, Schindler C (2006) Short-term effects of apparent temperature on hospital admissions in European cities: Results from the PHEWE project. Epidemiology 17(6):S84.
Nakai, S., T. Itoh, and T. Morimoto. (1999) Deaths from heat-stroke in Japan: 1968-
1994. International Journal of Biometeorology 43 (3):124-127. National Science Foundation: 20007: Merit Review Broader Impacts Criterion:
Representative Activities. July 2007. Available at: http://www.nsf.gov/pubs/gpg/ broaderimpacts.pdf. Accessed March 2012.
National Climatic Data Center (2008) U.S. Climate Normals 1971-2000.
http://www.ncdc.noaa.gov/oa/climate/normals/usnormalsprods.html. Accessed April 2008.
Nikolopoulou M, Baker N, Steemers K (2001) Thermal comfort in outdoor urban spaces:
understanding the human parameter. Solar Energy 70 (3):227-235. Nikolopoulou M, Steemers K (2003) Thermal comfort and psychological adaptation as a
guide for designing urban spaces. Energy and Buildings 35 (1):95-101. Nikolopoulou M, Lykoudis S (2006) Thermal comfort in outdoor urban spaces: Analysis
across different European countries. Building and Environment 41 (11):1455-1470.
Nitschke, M., G. R. Tucker, and P. Bi. (2007) Morbidity and mortality during heatwaves
in metropolitan Adelaide. Medical Journal of Australia 187 (11-12):662-665. North American Electric Reliability Council (2006). 2006 Long-Term Reliability
Assessment. The Reliability of the Bulk Power Systems in North America. National Oceanic and Atmospheric Administration (NOAA) (2005) NOAA's National
Weather Service's Heat/Health Watch Warning System improving forecasts and warnings for excessive heat. Available at :http://www.nws.noaa.gov/pa/fstories /2005/0105/fs11jan2005a.php Accessed July 2010.

126
National Oceanic and Atmospheric Administration. (NOAA) (2007a) Heat Wave: A
Major Summer Killer. Available at: http://www.noaawatch.gov/themes/heat.php Accessed 2 Dec 2008.
National Oceanic and Atmospheric Administration. (NOAA) (2011a) July New Normals.
Available at: http://www.wrh.noaa.gov/psr/pns/2011/July/newNormals.php Accessed 2012.
National Oceanic and Atmospheric Administration. (NOAA) (2011b) Summer 2011
Recap: Across the U.S., Heat Broke Records. http://www.climatewatch.noaa.gov/ image/ 2011/summer-2011-recap-across-the-u-s-heat-broke-records. Accessed November 8, 2011.
Parry ML, Canziani OF, Palutikof JP, van der Linden PJ, Hanson CE (2007) Inter-
relationships between adaptation and mitigation. In: Parry ML, Canziani OF, Palutikof JP, van der Linden PJ, Hanson CE (eds) Climate Change 2007: Impacts, Adaptation and Vulnerability. Contribution of Working Group II to the Fourth Assessment Report of the Intergovernmental Panel on Climate Change. Cambridge, p 982.
Pearlmutter D, Bitan A, Berliner P (1999) Microclimatic analysis of "compact" urban
canyons in an arid zone. Atmospheric Environment 33 (24-25):4143-4150. Rothfusz, L. P. (1990). The Heat Index Equation: or, More Than You Ever Wanted to
Know About Heat Index. National Oceanic and Atmospheric Administration. Available at: http://www.srh.noaa.gov/ffc/html/studies/ta_htindx.PDF. Accessed 7 April 2007.
Saez, M., J. Sunyer, J. Castellsague, C. Murillo, and J. M. Anto. 1995. Relationship
between Weather Temperature and Mortality: A Time Series Analysis Approach in Barcelona. International Journal of Epidemiology. 24 (3):576-582.
Schwartz J, Samet JM, Patz JA (2004) Hospital admissions for heart disease: The effects
of temperature and humidity. Epidemiology 15(6):755–761. Semenza JC, Rubin CH, Falter KH, Selanikio JD, Flanders WD, Howe HL, JL Wilhelm
(1996) Heat-related deaths during the July 1995 heat wave in Chicago. N Engl J Med 335:84–90.
Shashua-Bar L, Hoffman ME (2003) Geometry and orientation aspects in passive cooling
of canyon streets with trees. Energy and Buildings 35 (1):61-68. Sheehan, C., and J. Noel. (2005) Power outage adds to the heat - Fire at substation leaves
51,000 in dark. Chicago Tribune (IL), 1. Sheridan SC (2006) A survey of public perception and response to heat warnings across
four North American cities: an evaluation of municipal effectiveness. Int J Biometeorol 52: (1) 3-15.

127
Sheridan SC (2010) Spatial Synoptic Classification. Available at: http://sheridan.goeg. kent.edu/ssc2.html. Accessed August 2011.
Sheridan S, Kalkstein A, Kalkstein L (2009) Trends in heat-related mortality in the
United States, 1975–2004. Natural Hazards 50 (1):145-160. Sheridan S, Kalkstein A (2010) Seasonal variability in heat-related mortality across the
United States. Natural Hazards 55 (2):291-305. Shrader-Frechette KS (2002) Environmental justice: Creating equality, reclaiming
democracy. Environmental ethics and science policy series. Oxford University Press, Oxford, New York.
Spagnolo J, de Dear R (2003) A field study of thermal comfort in outdoor and semi-
outdoor environments in subtropical Sydney Australia. Building and Environment 38 (5):721-738.
Steadman RG (1979) The assessment of sultriness, Part I: a temperature-humidity index
based on human physiology and clothing science. J Appl Meteorol 18: 861–873. Tan, J. G., Y. F. Zheng, G. X. Song, L. S. Kalkstein, A. J. Kalkstein, and X. Tang. (2007)
Heat wave impacts on mortality in Shanghai, 1998 and 2003. International Journal of Biometeorology 51 (3):193-200.
Thorsson S, Honjo T, Lindberg F, Eliasson Ir, Lim E-M (2007) Thermal Comfort and
Outdoor Activity in Japanese Urban Public Places. Environment and Behavior 39 (5):660-684.
Thorsson S, Lindqvist M, Lindqvist S (2004) Thermal bioclimatic conditions and patterns
of behaviour in an urban park in Goteborg, Sweden. International Journal of Biometeorology 48 (3):149-156.
Toudert FA, Mayer H (2003) Street Design and Thermal Comfort In Hot And Dry
Climate. Paper presented at the International Conference on Urban Climate, LodzPoland, 1-5 September .
United Nations Population Fund (UNFPA). (2007) State of the World Population 2007:
Unleashing the Potential of Urban Growth, 108: United Nations. Available at: http://www.unfpa.org/publications/index.cfm. Accessed 18, Feb. 2009.
United States Census Bureau. (2007) 50 fastest growing metro areas concentrated in the
west and south. Available at: http://www.census.gov/Press-Release/www/releases/ archives/ population/009865.html.
United States Census Bureau. (2009) Quick Facts: Chicago. Available at
http://egov.cityofchicago.org/webportal/COCWebPortal/COC_EDITORIAL/Demographics0607.pdf. Accessed: May 2010.
128
United States Census Bureau. (2010) American Fact Finder: Maricopa County Arizona. Available at: http://factfinder.census.gov/home/saff/main.html. Accessed: July 2011.
Weisskopf MG, Anderson HA, Foldy S, Hanrahan LP, Blair K, Torok TJ, Rumm PD
(2002) Heat Wave Morbidity and Mortality, Milwaukee, Wis, 1999 vs 1995: An Improved Response? Am J Public Health 92 (5):830-833.
World Health Organization (2003) Climate change and human health: risks and responses
In: McMichael AJ, Campbell-Lendrum DH, Corvalán CF et al. (eds).

129
APPENDIX A
MAPS OF CHICAGO AND PHOENIX HRD

130

131
APPENDIX B
THERMAL COMFORT SURVEY
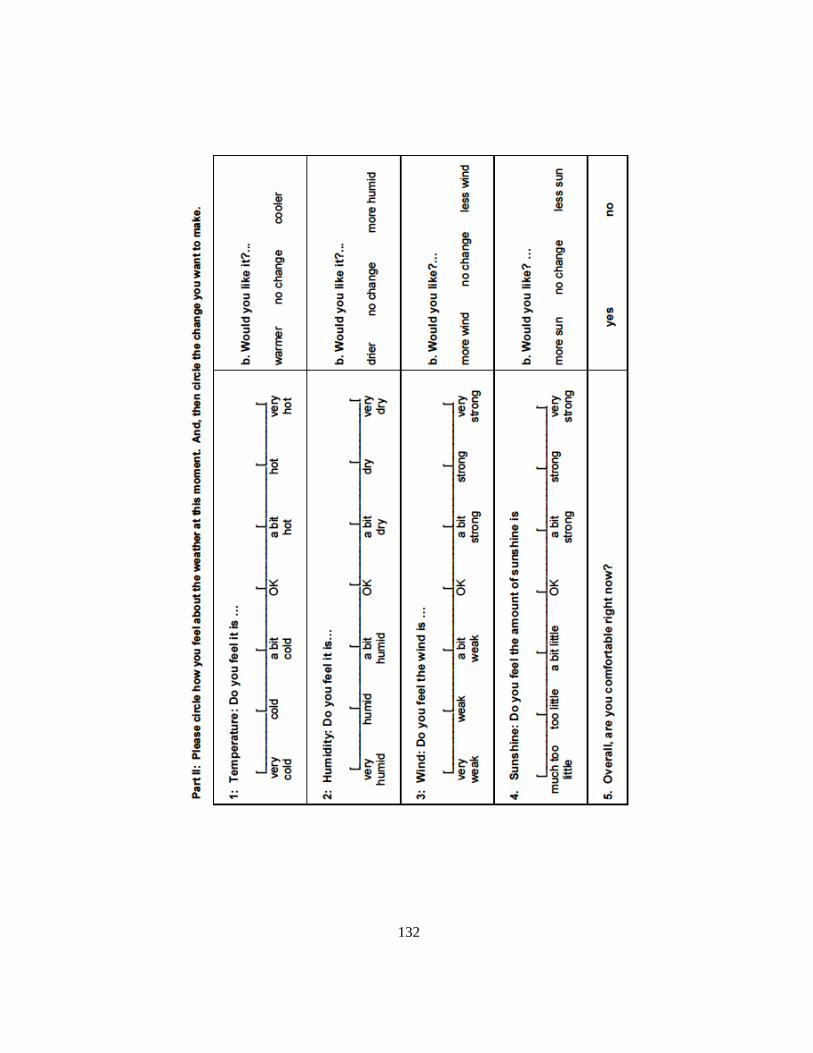
132
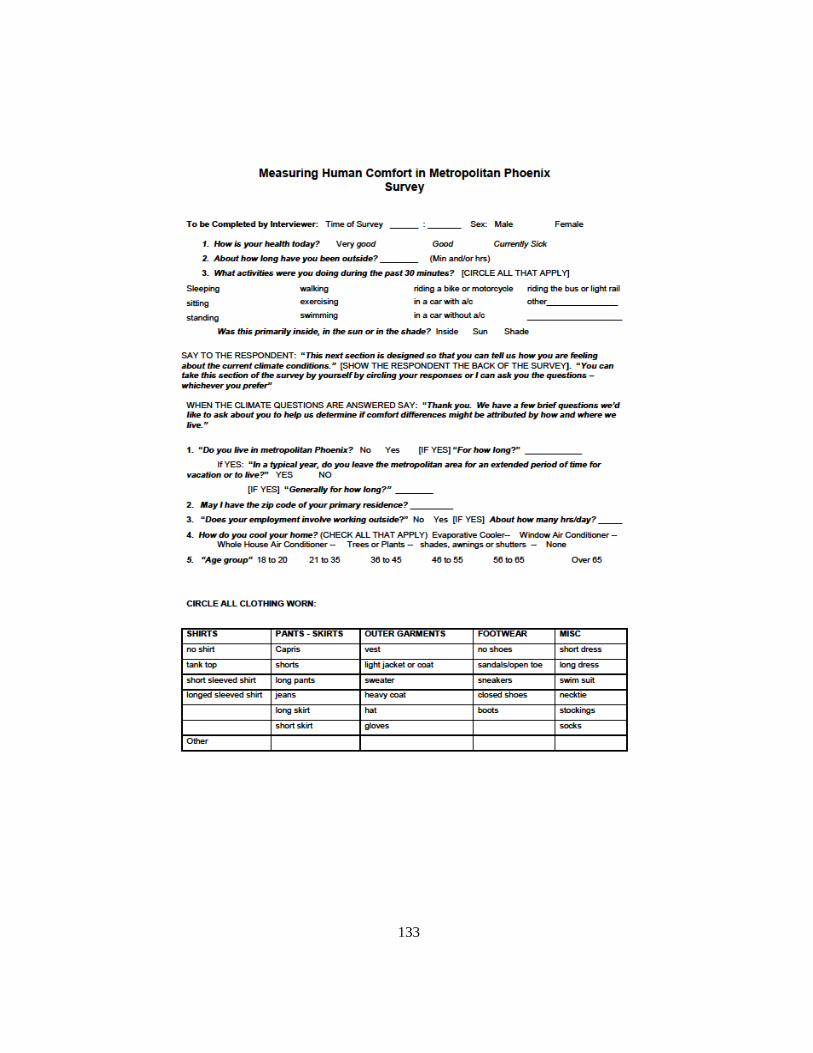
133

134
APPENDIX C
INSTITUTIONAL REVIEW BOARD DOCUMENTATION

135
135