Mortality and Morbidity: The Matlab Experience
61
-
Upload
khangminh22 -
Category
Documents
-
view
0 -
download
0
Transcript of Mortality and Morbidity: The Matlab Experience


The International Development Research Centre is a public corporation created by the Parliament of canada in 1970 to support research designed to adapt science and technology to the needs of developing countries. The Centre's activity is concentrated in six sectors: agriculture, food and nutrition sciences; health sciences; information sciences; social sciences; earth and engineering sciences; and communications. IDRC is financed solely by the Parliament of Canada; its policies, however, are set by an international Board of Governors. The Centre's headquarters are in Ottawa, Canada. Regional offices are located in Africa, Asia, Latin America, and the Middle East.
Publications on this subject:
Mortality and Morbidity: The Matlab Experience * (IDRC-TS56e) S. D'Souza, A. Bhuiya, S. Zimicki, K. Sheikh Efecto del Descenso de la Fecundidad en la Mortalidad Infantil (IDRC-TS57s) E. Taucher
West African Sources of Health and Mortality information: A Compara- tive Review* (IDRC-TS58e) A.G. Hill, W.J. Graham Techniques de collecte et d'analyse de données sur la mortalité périnatale à Kinshasa, Zaïre (IDRC-TS61lj D. Nzita Kikhela
Child Health and Mortality in Sub-Saharan Africa: An Annotated Bibliog- raphy from the 1975-86 Literature/Santé et mortalité infantiles en Afrique subsaharienne : bibliographie annotée de la documentation de 1975 à 1986 (IDRC-259e,f F7iona Mackenzie (Compiler/Compilatrice)
Research issues in Child Health and Child Care in West Africa: Proceed- ings of a Workshop, Accra, Ghana, 22-26 September 1986 *
(IDRC-266e) Fiona Mackenzie (Editor), Kodwo Ewusi (Associate Editor)
*11 existe également une version française de ces publications.

Technical Study 56e
Mortality and Morbidity:
The Matlab Experience
Stan D'Souza, A. Bhuiya,
Susan Zimicki, and K. Sheikh
Infant Mortality and Health Studies

©International Development Research Centre 1988
Postal Address: P.O. Box 8500, Ottawa, Ont., Canada K1G 3H9
D'Souza, S.
Bhuiya, A.
Zimicki, S.
Sheikh, K. IDRC-TS56e
Mortality and morbidity: the Matlab experience. Ottawa, Ont.,
IDRC, 1988. 60 p.: ill. (Infant mortality and health studies series).
/Data processing/, /vital statistics/, /mortality/, /morbidity/,
/Bangladesh/ - /data bases/, /reporting systems/, /causes of death/,
/trends/.
UDC: 002:312,2(549.3)
Technical editor: K. Kealey
A microfiche edition is available.
ISBN: 0-88936-501-6
The views expressed in this publication are those of the authors and
do not necessarily represent those'of the International Development
Research Centre. Mention of proprietary names does not constitute
endorsement of the product and is given only for information.

Abstract The increased interest in mortality studies in recent years has
seen the proliferation of frameworks and models to study the factors underlying mortality. However, insufficient attention has been focused on the fact that in developing countries appropriate data rarely exist to test the validity of such models. Accurate vital registration systems are practically nonexistent, and developing countries have relied on surveys for estimates, developed usually on indirect procedures. Unfortunately, although these approaches have provided reliable levels of mortality, differentials such as those due to sex, have been masked because of cultural factors involved in sex- selective omissions in remembrance and responses regarding children that have died.
The Matlab field station in Bangladesh has acquired international recognition because of the availability of longitudinal data of reliable quality since its inception in 1966. Scientific results based on Matlab data, and specially designed studies in the area, have been published in various medical and demographic journals. This paper is intended to present examples of studies showing how mortality and morbidity can be studied within a "small area." Recent efforts to ensure timely processing and linkage of data, through the use of an appropriate numbering system and new approaches in data base techno- logy, have been provided. The possibility of grafting small studies at relatively little cost onto an ongoing longitudinal system is described. The study of correlates stressed in mortality frameworks is thus facilitated. The paper attempts to establish that although cost considerations prevent population laboratories like that of Matlab being replicated in every developing country, regional centres particularly in Africa could be usefully considered.
Résumé L'intérêt accru qui entoure depuis peu les études de la mortalité
explique la prolifération de cadres et de modèles applicables à ce genre d'étude. Cependant, on a négligé le fait que les pays en développement possèdent rarement les données voulues pour vérifier la validité de ces modèles. Ces pays n'ont pour ainsi dire pas de bureaux de l'état civil et leurs estimations se fondent sur des enquêtes habituellement faites indirectement. Bien que ces méthodes aient permis d'établir assez justement les niveaux de la mortalité, elles masquent les causes de différences statistiques, comme celles attribuables au sexe, en raison des facteurs culturels qui interviennent au moment de la déclaration du nombre ou du sexe des enfants décédés.
La station de Matlab au Bangladesh s'est acquis une réputation internationale parce qu'elle fournit des données longitudinales de bonne qualité depuis sa création en 1966. Des études scientifiques fondées sur des données de Matlab et des études conçues pour la région ont été publiées dans divers périodiques médicaux et démographiques. Dans cet ouvrage, l'auteur donne des exemples d'études montrant que la mortalité et la morbidité peuvent être étudiées dans de petities régions. Il aborde aussi les récents efforts faits pour traiter et lier les données à l'aide d'un système de numérotation et les

4
nouvelles démarches appliquées à la technologie des bases de données. Il décrit la possibilité de greffer, sans grands frais, de petities études sur le système longitudinal; l'étude de corrélats, sur laquelle les cadres proposés pour l'étude de la mortalité mettent l'accent, se trouve ainsi facilitée. L'auteur essaie de montrer que, même si les
coûts interdisent la création de laboratoires démographiques comme celui de Matlab dans chaque pays en développement, il vaudrait la
peine de songer à établir des centres régionaux, particulièrement en
Afrique.
Resumen Ultimamente et creciente interés en los estudios de mortalidad ha
visto proliferar marcos de referencia y modelos para estudiar los factores subyacentes a esta. Sin embargo, se ha prestado poca atenciôn al hecho de que en los payses en desarrollo rara vez existe informaciôn adecuada para probar la validez de tales modelos. En
estos payses, prâcticamente no existen sistemas confiables de registro vital por lo cual han tenido que valerse de encuestas para los estimativos, que generalmenet desarrollan mediante procedimientos indirectos. Desafortunadamente, aunque estos enfoques han ofrecido niveles confiables de mortalidad, hay diferenciales, como et sexo, que
quedan ocultas en razôn de los factores culturales involucrados en las
omisiones relacionadas con et sexo los recuentos y respuestas en torno a los decesos infantiles.
Desde su creaciôn en 1966, la estaciôn de campo Matlab en Bangladesh ha adquirido renombre internacional gracias a la
disponibilidad de informaciôn longitudinal confiable. Resultados cientfficos, basados en esta informaciôn, asy como estudios de diseffo
especial en et ârea, han aparecido en revistas médicas y de demografia. Este trabajo presenta ejemplos de estudios que demuestran
cômo la mortalidad y la morbilidad pueden ser estudiadas dentro de una "pequen'a ârea". Se ilustran esfuerzos-rectentes para asegurar et
procesamiento y la vinculaciôn oportuna de datos, mediante et uso de un sistema apropiado de numeraciôn y nuevos enfoques en tecnologïa de base de datos. Se describe la posibilidad de insertar pequen'os estudios, a un costo relativamente bajo, en un sistema longitudinal en
curso. Con ello se facilita et estudio de correlacionadas, tan importantes en et marco de la mortalidad. El trabajo intenta establecer que, aunque las consideraciones de costo impiden replicar laboratorios de demografia como et de Matlab en todos los payses en
desarrollo, se puede considerar la posibilidad de centros regionales, particularmente en Africa.

CONTENTS
Foreword 7
Introduction 9
The Matlab Demographic Surveillance System 11
Mortality Levels, Trends, and Differentials 14
Matlab DSS Cause of Death Reporting 24
Assessment of Health Interventions 27
Some Cost Considerations 30
Some Conclusions 35
References 37
Appendix 41
FOREWORD
The Population, Health and Development (PHD) project of the Social Sciences Division of IDRC was created in 1983 as a temporary mechanism to support and to strengthen the capacity of developing- country researchers in carrying out interdisciplinary investigations of the persistent problems of high levels of infant and child mortality and poor health. To this end and with the active involve- ment of the Health Sciences Division, the project has organized a
number of activities. These include a series of interdisciplinary regional workshops in Latin America and Africa of health scientists and social scientists, the preparation of two research bibliographies, and the sponsoring of several researchers to international conféren- ces. In addition, the PHD project has commissioned a series of technical research papers on widely recognized problems or gaps in
infant mortality research. These papers were reviewed by peers and published in the International Development Research Centre (IDRC) Infant Mortality and Health Studies series. They are intended to address specific methodological and conceptual issues in the research, data sources, data collection, and analysis of data.
It should be noted that the Infant Mortality and Health Studies series is not intended to be based exclusively on original or primary data. Rather the series of monographs is intended to examine and update researchers whose work successfully integrates conceptual and methodological approaches from both the health science and the social science research traditions. Where appropriate, a field manual approach and style was encouraged. Otherwise, an operational and illustrative approach was used in preparing the papers for publi- cation.
"Mortality and Morbidity: The Matlab Experience" illustrates the relative strengths and utility of using the "population laboratory" approach for the monitoring of mortality-morbidity processes and is an important reference document for investigators considering this approach. The authors, Stan D'Souza, Abbas Bhuiya, Susan Zimicki, and Kashem Sheikh have had extended affiliation with the International Centre for Diarrhoeal Disease Research, Bangladesh (ICDDR,B) where the Matlab research was carried out. Stan D'Souza, the principal author, is currently the Senior Demographer/Analyst for the United Nations Development Programme (UNDP) in Benin.
Sandra Witt Coordinator Population, Health and Development Project IDRC

INTRODUCTION
In recent years, there has been an increased interest in mortality studies, and efforts have been made to develop frameworks within which to examine factors underlying mortality. Socioeconomic and biological correlates are usually studied, although models of increasing complexity are proposed to cover, for instance, structural and environmental variables (Mosley and Chen 1984). The problem with these models for the developing-country situation is that appropriate data are not available. In fact, vital registration systems of reliable quality rarely exist, and recourse has been made to indirect estimation procedures to assess levels and trends of mortality. These estimates, although useful, often mask underlying problems that could arise from cultural and other biases that exist in the responses based on retrospective approaches.
The purpose of this paper is to present examples from a field station set up by the International Centre for Diarrhoeal Diseases Research, Bangladesh (ICDDR,B) (originally called the Cholera Research Laboratory) showing how mortality and morbidity processes can be studied within the context of "small area" studies. Several papers have documented the Matlab experience (D'Souza 1981a). This paper presents an updated and abbreviated version of existing documentation and aims at illustration rather than presentation of research results. Thus, figures are provided, without the underlying tables, so that the researcher interested in applications of health and mortality research can rapidly get a grasp of the flexibility and power of an integrated data base. New advances in the field of microcomputers have also made available to the researcher in the Third World setting techniques of data base linkage that initially could only be done on large computers usually based in developed countries. This paper stresses the need for appropriate numbering systems to ensure that linkage is efficiently executed even on micros. The negative aspects of the earlier situation can easily be imagined. Research analysis was done away from the practitioners in the field who collected the data. Thus, studies on famine are published years after the famine has decimated the local population and reliable data are not available at the time when the practitioners can make an impact on the morbidity and mortality situation of the area in which they are working.
In the case of Matlab, data processing was done at the Johns Hopkins University in the United States. Matlab was used as a field station for mainly expatriate researchers, and the need to have compu- terized data analysis in Bangladesh was not felt. In fact, it was only after internationalization of the centre in 1979 that an IBM S34 minicomputer was acquired for the DSS in Dakha under a UNFPA grant.

10
To indicate that variations of the Matlab experience are in fact
replicable, data from another field study in Bangladesh is presented
briefly as comparison in terms of costs and registration coverage,
etc., in the study of mortality and morbidity within the Third World
(D'Souza 1981b).

THE MATLAB DEMOGRAPHIC SURVEILLANCE SYSTEM
Brief History
The Matlab Demographic Surveillance System (DSS) is a unique demographic resource in Asia. Beginning in 1963, ICDDR,B initiated a DSS in selected villages within an area adjacent to Matlab Thana, Comilla District, Bangladesh. The DSS combined periodic censures of the study population with continuous registration of vital events: births, deaths, and migrations. In 1966, a census was conducted in the Matlab Demographic Surveillance Area (DSA), covering a population of 110,000 people residing in 132 villages referred to as the Old Trial Area (OTA). The DSA was doubled in 1968 with the addition of 101 adjacent villages, referred to as the New Trial Area (NTA). At the 1974 census, the population of the total DSA was 254,000 residing in 233 villages. In October 1978, the study area was reduced to 149 villages containing an estimated 1974 population of 160,000. All these retained villages are within Matlab Thana (Becker et al. 1982). In 1982, a new census update was undertaken. The 1982 population total was about 180,000.
According to the 1974 census, the study area population is 88% Muslim and 12% Hindu. The average household consists of six persons. Households of patrilineally related families are grouped in clusters called "baris," having a common courtyard. Landholding is skewed, with 18% of the households owning 47% of the land. About 40% of the males and 16% of the females over age 15 have completed 4 years of schooling. About 70% of the males and 6% of the females are classified as "economically active." Over the part decade, the Matlab DSS has generated an enormous volume of unusually reliable data. Population censuses are available for 1966 (OTA), 1968 (NTA), 1970 (OTA), 1974 (DSA), and 1982 (reduced DSA and present DSS coverage). Vital events have been registered since 1966 in the OTA and since 1968 in the NTA. Beginning in January 1975, continuous registration of marital unions and dissolutions was introduced. Depending upon the census, selected socioeconomic information is available for all households. During the past few years, census books updated to 1982 have been prepared. A 1982 socioeconomic survey of individual households also has been undertaken. The data have been computerized and indicate little change in socioeconomic status (SES) of the population since the 1974 socioeconomic survey (D'Souza et al. 1983).
Numbering System of the 1982 Census Update
The importance of an appropriate numbering system must be stressed. The value of a data base can be seriously undermined if linkage problems exist when attempts are made to link mortality, for instance, with other variables. Furthermore, field retrieval of

12
individuals in longitudinal studies becomes difficult if a numbering
system is set up that cannot cope with movement of the population.
Each person in the Matlab system was assigned a registration
number at the time of a census. This number, however, originally
intended to provide identification in the field of households and
individuals, tended to become quickly out of date because of
population movement, split households, etc. For the 1982 census
update, a dual numbering system was introduced. A current
identification number (current ID) was set to designate present
residence and would change with change of address. A permanent
registration number was also designated. This number, in cases
present at the 1974 census, would be the 1974 census number. For
individuals entering after that date, the registration number assigned
at the time of entry was designated as the permanent registration
number. Forms would cease to carry earlier census numbers. Also, a
new ID corresponding to actual location would be designated. Thus, an
individual living in village V47 and having family residence number
0044 and being the head of the household would have current ID
V47-0044-01. The last two digits, -01, constitute his or her
individual number and were assigned by the computer, based on relation
to the head of the household. A check code (1 or 2) was also inserted
on the file to indicate if the person entered before or after the 1982
census. This was to avoid possible duplication of registration
numbers for new entries. The registration number of this individual
would be his 1974 census number: V47-0036-01 (see Appendix).
It was decided that the resident population of the 149 villages
in the DSS area retained in October 1978 would constitute the target
population of the 1982 census update. In the de-jure census a
resident was defined as (a) a person resident in the DSS area on a
regular basis including persons who return to the area at least once a
month and stay at least 1 night; and (b) a person resident in the DSS
for at least 6 months a year (usually migratory workers). Temporary
visitors and guests who were present at the time of the census were
excluded from the count. The mid-year population of 1982 was the
target.
To increase the analytic utility of the census update an SES
update was also planned. The last SES data for the area had been
collected in 1974 and, because of the various crises caused by floods
and famine as well as political instability that had ravaged
Bangladesh since that year, it was felt that a new SES baseline was
necessary.
It was decided to collect SES information at the same time as the
field visits for the census update. This decision was based on
efforts to economize on transport costs as well as to reduce
inconvenience to Matlab inhabitants caused by renewed visits for
sociological inquiry purposes. As a complement to the SES survey of
households, a village survey was first undertaken during which
information on a few structural variables, such as the existence of a
market, a school, a post office, etc., was sought.

13
Data Collection and Processing Procedures
The scientific "support" work of the ICDDR,B is undertaken by "branches," each branch having a specific technical role. The DSS Dhaka, the Demographic Surveillance Program of the Matlab Field Station, headed by a Senior Field Research Officer, is responsible for the field operation and collection of the surveillance data. The Dhaka Data Management Branch is responsible for editing, processing, and initial tabulations of the demographic field data. The Computer Branch is responsible for the computerization of data. The following is an operational diagram of the DSS activities.
Field Station Data Management Computer Branch Matlab Branch, Dhaka Dhaka
Field operation -------- Editing, coding ---->Data entry, preliminary and data collection tabulations
Verification ----------- Verification
Preparation of ----->Final tabulations annual reports
The current data collection system is a three-tier system. Detection of vital events is primarily the responsibility of the 110 female community health workers (CHWs). Eighty CHWs undertake primary detection of the vital events in half of the surveillance area as part of their work in providing village-based maternal child health-family planning (MCH-FP) services. Each CHW covers about 200 households and visits each family fortnightly. In the remaining half of the Matlab study area, 30 CHWs, covering about 500 households each, do only demographic surveillance work, visiting each household fortnightly. All CHWs have at least a 7th grade education. They inquire about births, deaths, migrations, and marriages and divorces, and record these events in register books. The work of CHWs is checked by 12-16 male health assistants (HAs) who, accompanied by the CHWs, visit each household monthly to review the completeness of the registration and to record the vital events on standard registration fores (see Appendix). The area covered by an HA is called a "field unit," and contains about 16,000 people (2800 households). The work of HAs is checked by 3 or 4 senior health assistants (SHAs), who visit each household at least three times annually. All these workers are supervised by the DSS Senior Field Research Officer who, along with two assistant supervisors, randomly checks on the quality and completeness of the fieldwork.

MORTALITY LEVELS, TRENDS, AND DIFFERENTIALS
The existence of a continuous data base with reliable vital
registration from 1966 is unique in the developing world. The data
provide valuable insight into the movement of mortality parameters at
moments of stress. Postneonatal mortality and child mortality
register noticeable rises. The long period also indicates that
earlier optimism about a steady mortality decline attainable in
developing countries is premature. In fact, mortality levels
fluctuate around a fairly high plateau. The lower level in particular
years is often due to fortuitous circumstances of good harvests and
sustained health inputs. The fragile equilibrium of such levels is
manifest as soon as stress conditions appear. The situation in
several African countries recently ravaged by drought and war
corroborate this point.
Mortality rates for the Matlab area for the period 1966-82 are
provided in Fig. 1. Conventional rates are presented except when
specifically indicated for some results in 1975 and 1976. Even though
180
160
140
120 o o 100
a Q m 80
CE 60
40 -
20
Infant mortality Neonatal mortality Postneonatal mortality 1-4 years Crude death
0 66-6767-6868-6969-7070-7171-7272-7373-74 75 76 77 78 79 80 81 82
Years
Fig. 1. Infant (neonatal and postneonatal) mortality rate,
1-4 year child death rate, and crude death rate in
Matlab, Bangladesh (1966-82).

15
the base populations are different for the period 1966-82, the size of the study area has been large enough to ensure against random fluctuations. Variations in death rates reflect the conditions in the country. For the period 1966-71, the crude death rate (COR) per thousand was about 15. From 1971 to 1975 the CDR fluctuated substantially, reaching about 21/1000 during the liberation struggle (1971) and the famine period (1975). In 1976 the COR was back to normal (14.8). It remained around the same level in subsequent years until 1982. Fertility variables are also under study in the Matlab area. The crude rate of natural increase (RNI) has varied from about 2.5 to 3.3%.
Differentials in Mortality
The study of differentials is extremely important in the understanding of mortality and morbidity processes. Such studies when based uniquely on indirect methods can be misleading. The Bangladesh Retrospective Survey on Fertility and Mortality showed consistently that male mortality was higher than female mortality. This error arose from the cultural biases that ensure that the recollection of male child deaths is more accurate than that of female child deaths. Because of close surveillance and supervision, the Matlab area has been able to detect deaths of children in the first few months of life that could have been missed if retrospective procedures had been used.
Sex Differentials
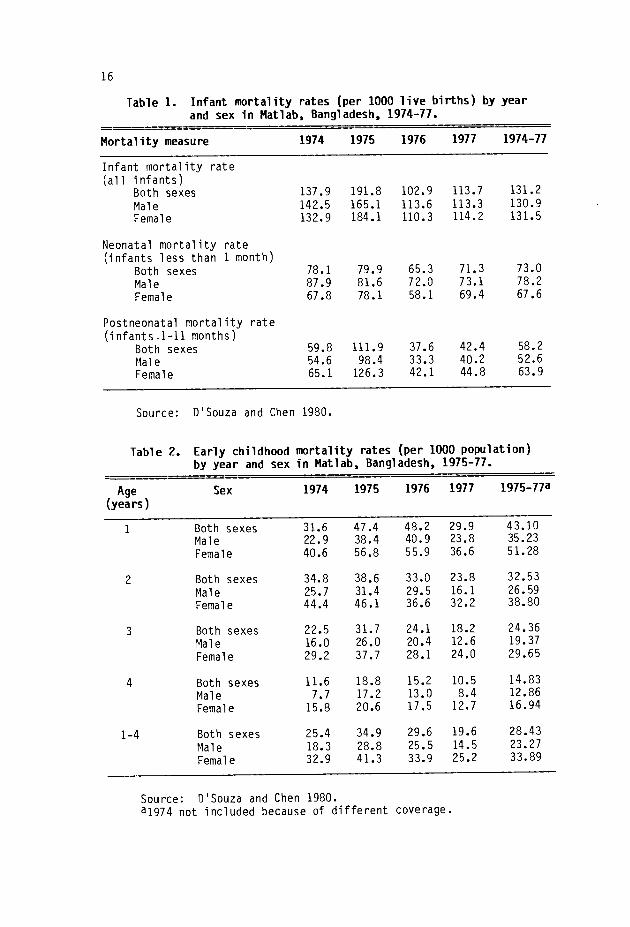
The results in this section are based on DSS data for 1974-77 (D'Souza and Chen 1980). Table 1 shows that occasionally male infant mortality rates appear to be higher than female rates. However, a
review of the neonatal and postneonatal rates indicates that, although it is true that neonatal male rates are in fact higher than the corresponding female rates, the situation is reversed if one considers postneonatal rates. The higher female mortality rates are maintained for child mortality rates of 1-4 years (Table 2). Results from Matlab show that the higher female mortality persists into older age groups.
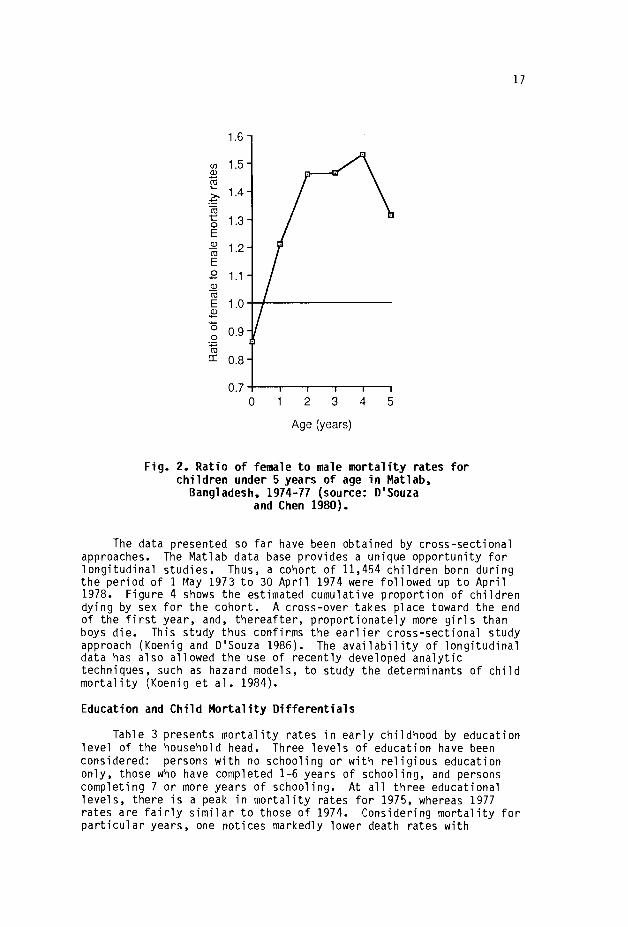
Figure 2 depicts the direction and magnitude of sex differentials in mortality for children under 5 years of age for 1974-77. The ratios of female to male (F/M) mortality at specific ages are plotted. Male mortality exceeds female mortality only during the neonatal period. Thereafter, female mortality exceeds male mortality by increasing amounts up to 3 years of age, when female death rates are 46-53% higher than the corresponding male rate.
The consequences of extreme privation for sex differentials in mortality can be examined during times of crisis. This is attempted in Fig. 3 where the percentage of "excess" female death rates in comparison to male rates is shown during the food shortage of 1974-75 and during the normal years 1976-77. For three critical age groups (1-12 months, 1-4 years, and 5-14 years) "excess" female mortality was consistently higher during the food-shortage years. This would indicate that female children experience disaster disproportionately. Scarce resources are allocated more readily to boys than girls. A food allocation study in the Matlab area brought this fact to the surface (Chen et al. 1981).
16
Table 1. Infant mortality rates (per 1000 live births) by year
and sex in Matlab, Bangladesh, 1974-77.
Mortality measure 1974 1975 1976 1977 1974-77
Infant mortality rate
(all infants) Both sexes 137.9 191.8 102.9 113.7 131.2
Male 142.5 165.1 113.6 113.3 130.9
Female 132.9 184.1 110.3 114.2 131.5
Neonatal mortality rate
(infants less than 1 month)
Both sexes 78.1 79.9 65.3 71.3 73.0
Male 87.9 81.6 72.0 73.1 78.2
Female 67.8 78.1 58.1 69.4 67.6
Postneonatal mortality rate
(infants.1-11 months) Both sexes 59.8 111.9 37.6 42.4 58.2
Male 54.6 98.4 33.3 40.2 52.6
Female 65.1 126.3 42.1 44.8 63.9
Source: D'Souza and Chen 1980.
Table 2. Early childhood mortality rates (per 1000 population)
by year and sex in Matlab, Bangladesh, 1975-77.
Age (years)
Sex 1974 1975 1976 1977 1975-77a
1 Both sexes 31.6 47.4 48.2 29.9 43.10
Male 22.9 38.4 40.9 23.8 35.23
Female 40.6 56.8 55.9 36.6 51.28
2 Both sexes 34.8 38.6 33.0 23.8 32.53
Male 25.7 31.4 29.5 16.1 26.59
Female 44.4 46.1 36.6 32.2 38.80
3 Both sexes 22.5 31.7 24.1 18.2 24.36
Male 16.0 26.0 20.4 12.6 19.37
Female 29.2 37.7 28.1 24.0 29.65
4 Both sexes 11.6 18.8 15.2 10.5 14.83
Male 7.7 17.2 13.0 8.4 12.86
Female 15.8 20.6 17.5 12.7 16.94
1-4 Both sexes 25.4 34.9 29.6 19.6 28.43
Male 18.3 28.8 25.5 14.5 23.27
Female 32.9 41.3 33.9 25.2 33.89
Source: D'Souza and Chen 1980.
a1974 not included because of different coverage.
17
1.6
n 1.5 q) ro
1.4
1.3 E
1.2 E
1.1 N Co
E 1.0 a
0.9
0.8
0.7
0 2 3
Age (years)
4 5
Fig. 2. Ratio of female to male mortality rates for
children under 5 years of age in Matlab, Bangladesh, 1974-77 (source: D'Souza
and Chen 1980).
The data presented so far have been obtained by cross-sectional approaches. The Matlab data base provides a unique opportunity for longitudinal studies. Thus, a cohort of 11,454 children born during the period of 1 May 1973 to 30 April 1974 were followed up to April 1978. Figure 4 shows the estimated cumulative proportion of children dying by sex for the cohort. A cross-over takes place toward the end of the first year, and, thereafter, proportionately more girls than boys die. This study thus confirms the earlier cross-sectional study approach (Koenig and D'Souza 1986). The availability of longitudinal data has also allowed the use of recently developed analytic techniques, such as hazard models, to study the determinants of child mortality (Koenig et al. 1984).
Education and Child Mortality Differentials
Table 3 presents mortality rates in early childhood by education level of the household head. Three levels of education have been considered: persons with no schooling or with religious education only, those who have completed 1-6 years of schooling, and persons completing 7 or more years of schooling. At all three educational levels, there is a peak in mortality rates for 1975, whereas 1977 rates are fairly similar to those of 1974. Considering mortality for particular years, one notices markedly lower death rates with
°
ô

18
Period of food shortage (1974-75) 70 - Normal period (1976-77)
60
o-
10
0
i5
1-11 months 1-4 years 5-14 years
Age Fig. 3. Percentage by which female mortality rates exceeded male
mortality rates in infancy and childhood during a period of food shortage (1974-75) and
during normalcy (1976-77) Matlab, Bangladesh (source: D'Souza and Chen 1980).
increasing education. The ratio of mortality rates at the lowest education level to the highest (I:III) exceeds 1.70 in each of the 4 years, although a slight decline in this ratio is noticed with time. Of note, too, is the fact that during the crisis year of 1975 the mortality rate at the lowest educational level was 44.6.
The education of mothers has generally been shown to be an important predictor of mortality levels. Because of limited data, matching of deaths with levels of education of mothers, obtained in
the 1974 census, can be done only for children who died between the ages of 1 and 3 and only for the years 1975-77. These results are presented in Table 4. As in Table 3, an inverse relationship between increasing education and mortality levels is evident, although the ratio I:III is now as high as 5.3. The conclusion one may draw at
this stage is that education levels are important to understanding differential mortality. Although for practical purposes the education of the household head is sufficient to identify the group more susceptible to death, mothers' education may, in fact, be a more sensitive indicator and should be used, especially when young children are concerned.

19
0.3
0.2
0.0
12 18 24 30 36 42 48 54 60
Age (months)
Fig. 4. Estimated cumulative proportion of children dying by sex
for the cohort born between 1973 and 1974, Matlab, Bangladesh
(source: Koenig and D'Souza 1986).
Number of years of education of the household head or mother is
relatively easy to measure. But a problem exists regarding the type
of school attended. Religious schools (Maktab) may not have the same
type of modernizing influence on health practices as secular schools.
Hence, it is important that allowance be made for the type of school
attended.
Table 3. Mortality ratesa (per 1000) at ages 1-4 for both sexes by education (years of completed schooling) of household head, Matlab, Bangladesh 1974-77.
Education of household head
(years of schooling)
Number of persons in
1974 974 975 976 977 974-77
I 0 (no schooling)b 15406 27.3 44.6 37.3 26.0 34.5
II 1-6 9854 21.2 33.9 27.9 19.0 25.8
III 7+ 3569 12.0 23.3 21.4 15.4 18.1
All 28829 23.3 38.3 32.1 22.2 29.4
Ratio 1:111 2.23 1.91 1.74 1.72
Source: D'Souza and Bhuiya 1982.
aUnder usual statistical assumptions, the differences in mor-
tality rates at educational levels I and III are highly significant
(t
bOr schooling only. =

20
Table 4. Mortality rates (per 1000) at ages 1-3 for both sexes by education (years of schooling) of mother for the 1974 birth cohort followed through 1977, Matlab, Bangladesh.
Education of mother (years of schooling)
Number of mothers 1975-77
I 0 (no schooling)a 21278 33.3 II 1-6 7439 20.2 III 7+ 853 6.3 Ail 29480 29.2 Ratio 1:111 5.29
Source: D'Souza and Bhuiya 1982. aor religious (Maktab) schooling only.
Socioeconomic and Biologic Differentials
The results from Matlab show a clear inverse relationship between various levels of mortality and socioeconomic status (D'Souza and Bhuiya 1982). This inverse relationship persists for all age groups considered: 1-4, 5-14, and 15-44 years. The criteria used for assessing socioeconomic status - years of education of head of household or mother, occupation, size of dwelling, ownership of cows, and health practices - were all effective for demonstrating higher mortality rates for the lower socioeconomic groups (see Fig. 5).
Clearly, the variables mentioned are correlated. Persons of higher education are likely to belong to families having more possessions, larger houses, etc. To assess whether education would still be important after controlling for the various other parameters
Cattle owned by household
- No cattle 1-2 cattle 3 + cattle
Fig. 5. Mortality rates (1974-77) of children aged 1-4 years by number of cows owned by the household
(source: D'Souza and Bhuiya 1982).
74 75 76 77
Year
74 75 76 77

Table 5.
Mortality rates (per 1000) for children of both sexes aged 1-4 years by education of household head
and other socioeconomic variables, Mattab. Bangladesh 1974-77.
Occupation
Number of
Education of household head
(years of schooling)
persons in
1974
Agricultural
laborer
Owner/worker
Landowner
All
0 (no schooling)a
128772
32.8
23.0
20.4
25.2
1-6
83066
26.9
18.5
8.9
19.1
7+
30021
9.5
13.5
10.4
13.1
Ail
241859
31.2
19.9
13.5
21.7
Area of dwelling in ft2
169
170-242
243+
Ail
0 (no schooling)a
142350
31.4
26.7
18.3
25.3
1-6
90324
24.8
19.6
16.2
18.8
7+
32596
17.0
19.6
11.5
12.9
Ail
265270
28.9
23.5
16.2
21.5
Number of cows owned
0
1-2
3+
Ail
0 (no schooling)a
142250
29.2
22.6
16.9
25.3
1-6
90324
22.0
17.6
14.0
18.9
7+
32596
14.3
13.1
10.3
13.0
All
265270
25.3
19.6
14.8
21.5
Use of fixed latrine
Yes
No
Al 1
0 (no schooling)a
142350
22.3
28.7
25.3
1-6
90324
18.7
19.6
18.8
7+
32596
12.6
16.0
12.9
All
265270
20.6
26.0
21.5
Source:
D'Souza and Bhuiya 1982.
aOr religious (Maktab) schooling only.

22
Table 6. Number of children under age 5, number of deaths and death rates by height for age, weight for height, and weight for age, 1981-82 (source: D'Souza et al. 1983).
------------------------
Number Deaths Rate/1000
Height for age Severe (85%) 312 17 54.5 Moderate (85-89%) 618 14 22.7
Mild (90-94%) 581 7 12.1 Normal (95%) 211 4 19.0
Total 1722 42 24.4
Weight for height
Severe (70%) 32 5 156.3 Moderate (70-79%) 325 17 52.3
Mild (80-89%) 919 17 18.5
Normal (90%) 446 3 6.7
Total 1722 42 24.4
Weight for age Severe (60%) 233 24 103.0
Moderate (60-74%) 996 13 13.1
Normal (75%) 493 5 10.1
Total 1722 42 24.4
- occupation, area of dwelling, number of cows owned, use of a fixed
latrine - three-way tabulations were prepared (Table 5). The inverse
relationship of mortality rates with education, even controlling for other socioeconomic characteristics, is quite clear from the table. Using data from the Bangladesh Fertility Study (BFS), Mitra in 1979
constructed a simple index of economic status - poor, middle, and rich
- depending on the possession of such items as a radio or watch. With
this definition of controlling for economic status, he found a similar
inverse relationship between parents' literacy and mortality.
Apart from the development of methodological tools for mortality
studies, the major importance of the results from the Matlab
investigations is that serious differentials in mortality levels have
been documented for various socioeconomic strata in a rural area of
Bangladesh - the lowest strata having the highest mortality levels. The vulnerability of the lowest socioeconomic status groups to the
very high mortality rates during times of crisis also has been shown.
Higher SES groups appear to have a higher capacity to withstand the
hardships arising from floods and subsequent shortage of food.

23
Differentials in infant mortality rates by SES are linked to such
biological factors as month of gestation, height of mother, or weight
of infant (Chowdhury 1982). Preterm deliveries were common among
mothers with no education. Higher neonatal death rates are found
among children of mothers with no education. More studies on infant
mortality need to be undertaken to separate the various confounding
social and biological variables. Further studies relating birth
weights and infant mortality can be undertaken in the rural setting of
Matlab.
An IDRC-funded study (D'Souza et al. 1983) has confirmed the
continued existence of mortality differentials. The plan was to study
in depth some of the underlying reasons for mortality differentials,
particularly nutrition. More intensive data were collected in five
villages and were used as a pilot study for the 1982 census and SES
survey in the Matlab area. Of interest are the tables linking
mortality rates and anthropometric measures. "Weight for height" and
"weight for age" measures discriminate quite clearly between the
groups that are most likely to be at mortality risk (Table 6). These
simple measures can thus be utilized for programs related to special
nutrition for high-risk children. It must be remembered, however,
that such programs, in isolation, have only a limited value. A deeper
understanding of the "cause of death" process including social and
economic linkages is necessary to reduce infant and child mortality in
developing countries.

MATLAB DSS CAUSE OF DEATH REPORTING
The ICDDR,B has been using a lay reporting system for cause of death since 1966. Some of the problems encountered and the potential for improvement will be discussed briefly here. Preliminary trials of new approaches tried both in Bangladesh and in Niakhar, near Dakar, Senegal, are reported in detail elsewhere (Garenne and Fontaine 1986; Zimicki 1986).
The death reporting system in the Matlab field trial area has been operating since 1966, in a population that in 1982 numbered about 180,000. Twelve field and two office staff of the demographic surveillance system are responsible for death reporting. The field- workers, who are responsible for reporting all vital events, interview families about the cause of death and complete a "death report" form. Beginning in 1974, the number of categories was extended to 27, and a new report form was gradually introduced with boxes for fieldworkers to tick for some specific and "other" classifications and space to write a description of symptoms leading to death (see Appendix). In the office, this information is used to check the field coding and to categorize death marked "other" by the fieldworker. The final coded forms are key-punched and maintained in files for each year. Recently, a new precoded form has been introduced (death registration form, Appendix), which incorporates the dual numbering system but, for reasons not quite clear, sex of the dead person has not been included as a question on the form. Basic tabulations are available (DSS annual yearbooks and Zimicki et al. 1985). Figure 6 provides "cause of death" of child mortality for some diseases in Matlab for 1975-81. Apart from the higher mortality rates during the difficult period of 1975, it is worth noting the consistently higher female mortality in most categories (D'Souza 1984).
There are problems with the procedures used for reporting "cause of death," leading to a lack of assurance about the validity of the coded causes of death (Zimicki et al. 1985). Circumstances of death are determined from the retrospective open-ended interview with relatives, carried out by experienced but nonmedically trained interviewers, and classified by office workers. There is no documentation of decision rules that have been used in such cases. In
fact, for both elicitation of information about circumstances of death and classification of cause, the system has relied greatly on the common sense of the workers. The potential for respondent, interviewer, and classifier bias is obvious.
Furthermore, one of the most important reasons for misclassifica- tion is the lack of fit between local and medical notions of why people die. A good example of this discrepancy can be seen by evaluating deaths attributed to neonatal tetanus. Although tetanus is
the coded cause for about half the neonatal deaths, examination of the

Females age 1-4
40 `t 38 T 36 ro 34 E 32
30 ô 28
26
24
â 22 20
18
-° 16 E 14 C)
12
Males age 1-4
ro 30 28
ô 26 24 22-i
o 20' ° - 18
141 E 12
° 10 _À3.- Y ô 10 R \ n/i " _/ t57 n 6 1 ar--or ti-- - '- 6-1
m 4
n 2 L 2
25 - Measles - Dysentery Diarrhea
-o Fever i- Dropsy o Respiratory
- - Other Drowning
0 (D 0
Year 75 76 77 78 79 80 81 ' 75 76 77 78 79 80 81
Number 17293 15947 14652 10652 10413 10651 11570 18166 16910 15674 11447 11213 11433 12442
Fig. 6. Selected death rates by sex and cause of children aged 1-4 years in Matlab, Bangladesh (1975-81) (source: D'Souza 1984).
day of death and the sex ratios of deaths suggests that many "tetanus"
deaths may be a result of other causes.
Zimicki (1986) has proposed and tested a new approach. As a
partial experimental solution to the problems of the reporting system
for "cause of death," a comprehensive questionnaire has been substi-
tuted for the open-ended interview. Most symptoms that are important
to distinguish between various causes of death are described fairly
easily and unambiguously by people in Matlab (rash and convulsions are
two exceptions). In the system being tried, fieldworkers ask a set of
questions to ascertain the presence or absence of symptoms or condi-
tions during the period before death and their time of onset and
duration. Using this information and decision rules, such as those
suggested by WHO (1978), deaths can be categorized. Physicians
independently determine cause of death for a sample of deaths to
calibrate the system.
The new system attempts to standardize reporting by field-
workers. It also provides more exact knowledge of the absence as well
as the presence of conditions that might contribute to death.
Documentation of decision rules clarifies the meaning of various
categories and the use of rules improves consistency of
classifications. Because information is coded and permanently retrievable, different sets of decision rules can be applied, as we
learn more about epidemiology, clinical manifestations, and cultural
perceptions of diseases through small, intensive studies. The
potential for multiple classification is also useful, because interest
in various categories may change with time or point of view. The
International Classification of Disease (WHO 1967) and systems derived
o -i
E
o 16
-
a\ \)&
°- 4 U
T1 1 1 1 1

26
from it are based on a medical (patho-physiological) model of disease (rather than, say, a nutritional deficiency model) and are most useful for evaluating the effect of medical interventions, such as
immunization programs or the use of penicillin by community health workers. Even as a basis for decisions about medical interventions, the classification systems currently used may be problematic, because they only allow deaths to be classified by a single cause. Death often is multicausal and, in situations where mortality might be reduced by intervening against an antecedent cause or contributory condition (say, malnutrition or measles in the measles-viral pneumonia progression), knowledge about these contributory causes may be more important than about direct causes for which no intervention is feasible.

ASSESSMENT OF HEALTH INTERVENTIONS
The Matlab data base is highly suited to assess the impact of
health interventions according to specified designs. Since the
introduction of a health intervention program in 1978, the DSA has
been divided roughly into two areas - treatment and comparison areas
(Bhatia et al. 1980). Both areas had a population of about 80,000,
and both could receive treatment for diarrhea at the Matlab field
hospital. In addition, in the treatment area, various health
interventions including family planning were gradually introduced.
The evaluation of particular health interventions such as oral therapy
has, thus, been possible.
An oral therapy field trial was conducted in the Matlab area from
January 1979 through to December 1980. The entire DSA "treatment"
area was divided into subpopulations of 40,000, both being earmarked
as "oral therapy treatment" areas. In these two subpopulations, two
different oral rehydration solutions (ORS) were made available in
homes: a WHO-approved packet solution and a salt/sugar (labon/gur)
solution made from local ingredients. A subpopulation of 40,000,
about half the DSA "comparison" area, was earmarked as an "oral
therapy reference" area. A decline in clinic attendance because of
ORS treatment at home was expected in the treatment area.
The smoothed curves (3-month moving averages) of crude
population-based monthly clinic attendance rates show the seasonal
component and illustrate the decline that occurred during the 4-year
period 1977-80 (Fig. 7) in the treatment and reference areas. There
are two peaks each year; the first, in March-May, is associated mainly
with Escherichia coli, and the second, in August-October, with both
E. coli and V. cholera. The pattern of decline and the component
attributable to cholera are similar for the packet and lobon/gur
areas. Attendance rates due to cholera diminished somewhat in 1979
and 1980, possibly because of the absence of a large-scale cholera
epidemic. This absence is particularly evident in the reference area
attendance rates for cholera. However, the major reduction in
treatment area attendance occurred for patients with diarrheas other
than cholera. In particular, the March-May peaks were greatly reduced
- in 1980, they almost disappeared - in the two treatment areas,
although they persisted in the reference area.
Comparison of the crude clinic attendance rates for the 2 years
preceding the study and the 2 study years indicates a similar significant reduction in both treatment areas. This decline is 30%
greater than that observed for the reference area, which was also
significant (Zimicki et al. 1984).
Figure 8 represents the number of cases of measles occurring per
month in the Matlab area over the period November 1979 to December

28
Year
100
90
80
70
60
50
40
30
20
10
0
77 78 79 80
Fig. 7. Effect on clinic attendance of oral rehydration solutions (ORS) distribution (1977-80), Matlab, Bangladesh
(source: Zimicki et al. 1984).
1983. From a fairly low 200 cases/month in November 1975, the outbreak of measles gradually peaked until more than 1500 cases were reported in March 1980. Lower peaks were noted in 1981 and 1982. In
1983, measles cases were substantially lower, possibly because of the
Ail

29
1500- 1400-
1300- 1200- 1100- 1000- 900- 800- 700-
E 600 D Z 500-
400- 300- 200- 100-
ND 1
JFMAMJJASON JFMAMJJASONDJFMAMJJASOND JFMAMJJASOND Month
Year 1979 1980 1981 1982 1983
Fig. 8. Number of measles cases by month (1979-83), Matlab, Bangladesh.
introduction of measles vaccine in some areas. Measles is an
important cause of death in a developing country, and programs of
maternai and child health tend to include a measles vaccine where
feasible. An inhibiting factor is that an expensive "cold chain" to
maintain measles vaccine is necessary. Data on measles cases were
obtained by an additional set of questions asked during the usual
visits of CHWs. The eventual monitoring of morbidity as well as
mortality is one of the goals of the DSS.
The data base provided by the DSS has been shown to be
indispensable in terms of evaluation of health intervention programs.
An extremely important component of the DSS system consists of
accurate information on the whereabouts of particular individuals
within a rural setting. This element makes it possible to set up
studies where "follow-up" methods are part of the investigation. On a
worldwide basic, in the case of choiera vaccine trials conducted in
1974 and again in 1984 when WHO support was obtained, the DSS Matlab
has been the major reason for site selection.
Illlllll eaaea®®B®aB®

SOME COST CONSIDERATIONS
In this section, nome data related to the cost of the DSS and the diarrhea treatment centre in Matlab are presented. The collection of mortality data on the DSS is a costly, intensive affair, which cannot easily be replicated elsewhere. The 1982 DSS census update, however, has provided an opportunity to show that an update operation can be done relatively inexpensively once a system has been set in place. An IDRC-funded project at a level of 50,000 Canadian dollars (CAD) enabled the ICDDR,B to update both the census figures as well as SES data (D'Souza et al. 1983). A comparison of the costs involved in the DSS with other projects that monitor vital events in "small areas" can provide important elements for policy decisions regarding vital registrations. Design and costs of data collection from the Companiganj health project are briefly compared with the DSS to point out some strengths and weaknesses of the two systems. With regard to the treatment of diarrhea, the cost per patient utilizing the Matlab treatment centre and a small decentralized unit at Shotaki village in the Matlab area are compared. Results attempting to quantify the "cost per death averted" are shown.
Comparative Vital Registration Costs
A detailed description of the DSS was presented at the beginning of this report. The Companiganj Health Project (CHP) started a joint venture of the Government of Bangladesh and a voluntary agency. It was designed to establish a model of the National Integrated and Family Planning Program of 1973 in a single "thana." In this model, it was proposed that various features of the government's program would be tested and evaluated and that there would be experimentation with certain modifications, particularly local recruitment of women to work in their own unions (a subunit of a thana) and the development of a maternal child care program.
In September 1974, a separate Evaluation Unit was established that carried out a 10% enumeration survey and began monthly vital registration to record all births, deaths, and migrations in a 10% sample of households. The objective was to observe changes in vital rates that might occur as a result of project interventions and to provide basic information on demographic and health variables in a
defined population (Ashraf et al. 1980).
Table 7 presents a comparison of some of the main items distinguishing the Matlab and Companiganj health projects. One striking element is clearly the difference in cost. The DSS has cost around $300,000/year, in comparison with $20,000/year for the CHP. On a per capita survey basis, however, the costs are not very different.

31
Table 7. Items of comparison between the Matlab and the Companiganj Health Project (source: D'Souza 1981b).
Item Matlab Companiganj
Population (1974)
Cost ($/year)
Type
Sample
Lowest level data collection personnel
Purpose
Studies undertaken
Time period
Scope
160000
300,000
Longitudinal
100%
Educated female workers
Research oriented with special reference to diarrheal diseases
Vital rates/several in-depth studies
1966 to present
Related to national and international programs
International staff Presence continuing
114000
20,000
Longitudinal
10% systematic
Uneducated female workers
Program evaluation oriented with reference to
integrated and family planning programs
Vital rates/causes of death
1975-80
Related to national programs
Present for first
few years
Twenty percent of the budget has been allocated to transport costs. Personnel costs are high, accounting for nearly half of the overall budget. Cheaper surveillance systems are clearly necessary. The question remains whether the type of intensive field checkups, both in terms of vital registration and in terms of in-depth studies, that can be done in Matlab are feasible using cheaper surveillance systems.
The Companiganj project has been conducted on a sample basis. The evaluation unit costs about $20,000/year. Some of the advantages of the Matlab project are shared by the CHP. However, intensive field case-control studies have not been carried out in the CHP because the orientation of the two projects is quite different. Of interest in the Companiganj project is the fact that an evaluation unit can be attached to a health intervention program without much additional cost as reported by Chowdhury et al. in 1978. If one needed vital rates and changes only, evaluation units of the Companiganj type would be sufficient. Similar inverse relations between mortality and socioeconomic status were recorded within Matlab and Companiganj. However, even in Companiganj, because of the size of the effects of the famine, it has not been possible to separate the effects of the program from those caused by the famine.

32
Limitations of the Matlab project also would apply to the Companiganj health project. For instance, if long-term use of the same sample areas were envisaged, a "contamination" effect would set in. To avoid this, some sort of sample rotation would be necessary. In fact, the Companiganj evaluation unit has been closed for lack of funding. As in the case of Matlab, the Companiganj project also suffered from inadequate data reporting; the first full-scale reports covering the 5-year period were issued in 1980. The need for timely data reporting is overlooked in many projects in developing countries. The time lag between data collection and publication of reports often is as long as 3-5 years, making the results less useful (D'Souza 1981a,b).
Cost-Effectiveness Studies
The Matlab treatment centre was opened in 1963 to treat diarrheal diseases in the area, particularly cholera. Although services were provided, the focus of work was mainly for research, and speedboats were used as ambulances to prevent any deaths in the study area. One study showed that the treatment centre was more effective than a
cholera vaccine campaign (Mosley et al. 1972). During the cholera epidemic, it was estimated that the treatment centre averted 159 deaths of the 318 cases treated. The assumption was that 50% of the severely dehydrated cases would have died. Innoculation against cholera would have averted fewer than 143 of the hospital cases and, thus, fewer deaths. In 1980 prices, using a World Bank price index, the cost of treatment per patient would have been $14.91 and the cost per death averted, $603.48. Mosley's cost estimates for the treatment centre and an immunization program suggest that the former would have been more cost-effective. A later study (Oberle et al. 1980) showed that the cost per patient in the hospital was between $38 and $81. Translated into 1980 prices, costs would have been $13.83/patient treated and $48-120/death averted. The cost of an immunization campaign was not calculated but was indicated to be higher. A more recent study compares the cost-effectiveness of the Matlab treatment centre with its speedboat ambulance service and an alternative decentralized unit in Shotaki village in the Matlab area. When an ambulance boat was withdrawn from Shotaki, the unit was set up with community participation for diarrheal treatment. The ICDDR,B supplies the necessary medical and office supplies and has trained six volunteers to give oral and I.V. fluids as well as certain drugs.
Table 8 presents a summary of cost-effectiveness figures for the Matlab treatment centre and for the Shotaki clinic. The term "long- run average cost" includes both user-dependent costs (drugs, food, gasoline) and user-independent colts (wages, etc.), as well as equipment and depreciation costs. In the determination of costs, the concept of "economic resource" costs was utilized. Even for a
resource that is available free to the centre, such as the building of the Matlab treatment centre, a cost was imputed equivalent to the cost that would have been necessary to rent the facility. Furthermore, because the treatment centre has a research function, some joint costs had to be allocated partially as a service cost. Various estimates have been provided in the working paper. The maximum variant has been shown in the table.

33
Table 8. Summary of cost-effectiveness figures.
Matlab Treatment Centre Shotaki
Long-run average cost (USD)a
Per patient 16.77 3.36
Per severe patientb 676.21 93.59
Per "death averted"c 1352.40 187.19
User numbers 10618 891
Number severely dehydrated 263 32
Source: Horton 1982.
aUnited States dollar (USD) = 1.33 Canadian dollars (CAD).
bPatients for whom severe dehydration was recorded on admission.
CIt is assumed 50% of severely dehydrated patients would have
died in the absence of treatment.
The cost "per death averted" by the treatment centre is more than
twice that estimated by Mosley and more than 12 times that of Oberle.
Clearly, there are differences of methodology and assumptions. The
Oberle study, for instance, takes no account of expatriate
supervision. The estimates of "cost per patient treated" are Gloser
in the various studies if the rising costs of gasoline are reviewed
separately. If one compares the table data for the Matlab treatment
centre and Shotaki, a first assessment would be that decentralization
is cost-effective, even when the high ambulance costs are separated
out. However, there are serious problems of comparability. For
example, the classification of dehydration status by the volunteers of
Shotaki and the staff at the Matlab treatment centre could be
different. The economic resource cost of Shotaki could have been
underestimated. The efficacy of Shotaki depends to a large extent on
the continuing logistic and technical support of the Matlab treatment
centre. Estimation of the colt of each support only in terms of
supplies delivery would be inadequate. A fairer comparison would
estimate the costs of servicing the whole study area by a set of
decentralized units completely independent of the Matlab treatment
centre. The ability to handle epidemic situations that occur
seasonally also should be compared. The working paper provides
interesting results and highlights the complexity of cost-
effectiveness studies, particularly when the confounding effects of
both research and services are present and must be separated.
This brief section on cost considerations points to the need for
further research and standardization of methodology. Questions
related to effectiveness, cost, and availability must be studied.
Clearly, immunization such as that administered to pregnant mothers
against neonatal tetanus affecting their future children is both
effective and cost effective. Measles vaccine still is costly,

34
although quite effective. Both these immunization approaches require a cold chain, which is difficult to maintain in rural areas without electricity. A vaccine for cholera that is effective still must be developed. Savings in costs for diarrhea treatment by the use of oral rehydration rather than I.V. fluid are considerable. Decentralization of treatment to the village or home also could be a future avenue for cost savings, as well as assuring availability. Studies of costs for introducing preventive measures - water and sanitation and health education especially of the mother - should be undertaken.

SOME CONCLUSIONS
As mentioned in the introduction, this paper has not presented
new results. Rather it has provided updated documentation on the
Matlab experience. It has attempted to illustrate the utility of a
longitudinal data base for the study of mortality and morbidity
processes. Even within the context of the limited examples provided,
the scope of the type of studies that have been and can be conducted
in the area is quite large.
Few countries of the developing world have functional and
accurate vital registration systems. In Senegal, the data base in
Niakhar has proved quite useful (Garenne and Fontaine 1986). In some
African countries, such as Benin, through recent surveys in the
context of the World Fertility and Enquêtes à passages répetées
programs, some data on mortality has been obtained. Although indirect
and survey methods have proved useful, they cannot provide a
substitute for careful vital registration in developing countries. Longitudinal studies are known to suffer from follow-up problems. In
the case of Matlab, because of the fairly sedentary nature of the
population and the frequent visits by CHWs, who are well known to the
village population, these problems have not been important. More
important has been the timeliness and accuracy of data processing
particularly when available computing facilities were mainly in the
U.S.
The five-village study shows how, with relatively little extra colt and logistic difficulty, it is possible to graft important
studies, relating to mortality and morbidity, onto an ongoing longitudinal vital registration system. Some of these studies,
particularly those related to vaccine trials and oral rehydration, have been of worldwide interest. The documentation of sex biases in
mortality reporting through retrospective methods has also been
significant.
The paper has provided some details of the census update to
highlight areas where an appropriate numbering system and new
approaches in the use of data base technology can ensure linkage and
shed more light on the correlates stressed in mortality frameworks. Serious backlogs in data processing and the publication of reports
that had plagued the Matlab experience can also thus be avoided. Microprocessors are now more readily available and their increasing
sophistication with respect to memory and speed of operation make their use more important and feasible each year. In fact, in view of
relatively lower costs of maintenance than mainframe computers, serious efforts should be made to develop microprocessor technology in
various developing countries. The availability of software packages for demographic analysis using micros also facilitates the task of
researchers in the Third World setting.

36
Cost considerations prevent population laboratories like that of Matlab being replicated in every developing country, but regional centres could be usefully considered. The profound insights that the Matlab centre has provided for the understanding of mortality and morbidity processes in the South Asian area would indicate that regions of Africa, with similar disease and cultural patterns, could pool resources to maintain a longitudinal data base coupled with a research and training centre.

REFERENCES
Ashraf, A., Alam, N., Khan, A.H. 1980. Companiganj demographic
survey 1975: baseline survey results. Evaluation Unit, Christian
Commission for Development in Bangladesh, Dhaka, Bangladesh.
Report 01.
Bangladesh, Census Commission, Statistics Division. 1977. Report on
the 1974 Bangladesh retrospective survey of fertility and
mortality. Ministry of Planning. Dhaka, Bangladesh.
Becker, S., Razzak, A., Sarder, A.M. 1982. Census update (DSS
Matlab, vol. 8). International Centre of Diarrheal Diseases
Research - Bangladesh, Dhaka, Bangladesh. Scientific Publication
55.
Bhatia, S., Mosley, W.H., Faruque, A.S.G., Chakraborty, J. 1980. The
Matlab family planning health services project. Studies in
Family Planning, 11, 202-212.
Chen, L.C., Huq, E., D'Souza, S. 1981. Sex bias in the family
allocation of food and health care in rural Bangladesh.
Population and Development Review, 7, 55-70.
Chen, L.C., Maklishur, R., D'Souza, S., Chakraborty, J., Sarder,
A.M., Yunus, M. 1983. Mortality impact of an MCH-FP program in
Matlab, Bangladesh. Studies in Family Planning, 14(Nov. 9).
Chowdhury, A.K.M.A. 1982. Education and infant survival in rural
Bangladesh. Health, Policy Education, 2, 369-374.
D'Souza, S. 1981a. Population laboratories for studying disease
processes and mortality; the demographic surveillance system, Matlab. Paper presented at the International Union for the
Scientific Study of Population seminar on Methodology and Data
Collection in Mortality Studies, Dakar, July 1981.
1981b. Small area intensive studies for understanding
mortality and morbidity processes - two models from Bangladesh:
the Matlab Project and the Companiganj Project. Paper presented
at the World Health Organization/United Nations (WHO/UN) Working
Group on Data Bases and Measurement of Levels, Trends and
Differentials in Mortality, Bangkok, October 1981.
1984. Measures of preventable deaths in developing countries
some methodological issues and applications. Paper presented at
the International Union for the Scientific Study of Population
Mortality Seminar in Tokyo, Japan, November 1984.

38
1985. Mortality case study, Matlab. Paper prepared for the United Nations/World Health Organization (UN/WHO) Third Collaborators' Meeting on Correlates of Mortality Change and Differentials, Geneva, December 1982. International Centre of Diarrheal Diseases Research - Bangladesh, Dhaka, Bangladesh. Internal Special Publication 24.
D'Souza, S., Bhuiya, A. 1982. Socioeconomic differentials in a rural area of Bangladesh. Population and Development Review, 8, 753-769.
D'Souza, S., Chen, L.C. 1980. Sex differentials in mortality in rural Bangladesh. Population and Development Review, 6, 257-270.
D'Souza, S., Karim, M., Razzak, A. 1986. The 1982 data base update of the population laboratory at Matlab, Bangladesh: implication for mortality analysis. Paper presented at the International Union for the Scientific Study of Population Seminar on Comparative Studies of Mortality and Morbidity: Old and New Approaches to Measurement and Analysis, Siena, Italy, July 1986.
D'Souza, S., Karim, M., Razzak, A., Zimicki, S. 1983. The 1982 socioeconomic survey of Matlab. Report prepared for the International Development Research Centre, Ottawa, Ont., Canada.
Horton, S., Claquin, P. 1982. Cost effectiveness study of hospital and of ambulance services at Matlab Treatment Centre. International Centre of Diarrheal Diseases Research - Bangladesh, Dhaka, Bangladesh. Working Paper 26.
Garenne, M., Fontaine, 0. 1986. Assessing probable causes of deaths using a standardised questionnaire - a study in rural Senegal. Paper presented at the International Union for the Scientific Study of Population Seminar on Comparative Studies of Mortality and Morbidity: Old and New Approaches to Measurement and Analysis, Siena, Italy, July 1986.
Koenig, M., D'Souza, S. 1986. Sex differences in childhood mortality in rural Bangladesh. Social Science in Medicine, 22.
Koenig, M., D'Souza, S., Karim, M. 1984. The determinants of infant and child mortality in rural Bangladesh. Paper presented at the Population Association of America Meeting, Minneapolis, MN, USA.
Mosley, W.H., Bart, K.J., Sommer, A. 1972. An epidemiological assessment of cholera control programs in rural East Pakistan. International Journal of Epidemiology, 1, 5-11.
Mosley, W.H., Chen, L.C. 1984. An analytical framework for the study of child survival in developing countries. Population and Development Review, 10 (suppl.).
Oberle, N.W., Merson, M.H., Islam, M.S., et al. 1980. Diarrheal disease in Bangladesh: epidemiology, mortality averted and costs at a rural treatment centre. International Journal of Epidemiology, 9, 341-348.
WHO (World Health Organization). 1967. International classification of disease. WHO, Geneva, Switzerland.

39
1978. Lay reporting of health information. WHO, Geneva,
Switzerland.
Zimicki, S. 1986. Old and new approaches to assessment of the census
structure of mortality: a case study for Bangladesh. Paper
presented at the International Union for the Scientific Study of
Population Seminar on Comparative Studies of Mortality and
Morbidity: Old and New Approaches to Measurement and Analysis,
Siena, Italy, July 1986.
Zimicki, S., Naber, L., Sarder, A.M., D'Souza, S. 1985. Cause of
death reporting in Matlab: source book of cause-specific
mortality rates 1975-1981 (DSS Matlab, vol. 13). International
Centre of Diarrheal Diseases Research - Bangladesh, Dhaka,
Bangladesh. Scientific Report 63.
Zimicki, S., Yunus, M., Chakrabarty, J., D'Souza, S. 1984. A field
trial of home based oral rehydration solution in rural
Bangladesh. Centre for Population Studies, Harvard University,
Cambridge, MA, USA. Discussion Paper Series.


APPENDIX
Matlab DSS 1982 census update (village pop. totals) by area
Treatment area (pop. total, 94795)
Village Popula- Village Popula-
Comparison area (pop. total, 92779)
Village Popula- Village Popula-
code tiona code tiona code tiona code tiona
D 1436 V59 795 A 2316 V78 231
W 2445 V60 862 B 1683 V79 305
V10 1361 V61 634 C 3116 V80 942
Vil 1248 V62 708 F 1163 V90 1032
V31 7882 V72 4947 G 2239 V95 916
V32 2244 J 409 V96 469
U 6980 V97 407
vol 687 V98 203
H 1197 V26 2299 V02 437 V99 654
V12 441 V56 1293 V03 631 VB1 1109
V13 704 V82 1214 V04 223 VB2 835
V19 3117 V83 429 V05 2940 VB3 2496
V20 927 V85 374 V06 2173 VB4 2559
V21 446 V87 513 V07 369 VB5 782
V22 598 VB12 3555 V08 1148 VB6 381
V23 573 VB13 4021 V09 1023 VB7 184
V24 2338 V14 926 VB8 945
V35 3184 VB9 144
V36 4537 VB10 1491
K 850 V40 680 V37 367 D28 1112
L 410 V41 1246 V38 1463 D29 168
M 137 V42 643 V45 853 D30 700
N 1858 V43 833 V46 313 D31 1031
0 1180 V44 535 V47 1655 D32 543
P 1767 V64 4308 V48 603 D33 933
Q 336 V86 667 V49 1126 D34 1262
V27 818 V88 429 V50 733 D35 648
V28 1179 VB11 2229 V51 1380 D88 1797
V30 493 D100 2993 V53 2906 D89 579
V39 322 D101 1177 V58 1216 D90 2513
V65 614 D91 953
V66 852 D92 527
R 1292 V34 778 V68 763 D93 725 S 1071 V52 237 V69 1126 D94 912 T 1397 V54 540 V70 660 D95 334
V15 540 V55 510 V71 358 D96 208
V16 715 V57 1030 V73 699 D97 598
V17 1045 V63 1948 V74 1130 D98 2605
V18 3322 V67 542 V75 336 D99 1835
V25 1228 V81 508 V76 1374
V29 580 V84 1938
V33 628 V89 1255
aAs of July 1, 1982.

UPDATE DATE 31/05/82
INTERNATIONAL CENTRE FOR DIARRHOEAL DISEASE RESEARCH, BANGLADESH
DEMOGRAPHIC SURVEILLANCE SYSTEM: MATLAB
FAMILY REGISTRATION BOOK
VILLAGE: V47
NAME: TULATALI
BARI: 007
NAME: MIZI BARI
FAM.RES.NO: 0044
SIZE:
06 RELGN: MUSLIM
-------------------------------------------------------------------------------------------------------------------
IND
RELN
MOTHER'S
MAP
SPOUSE'S ENT
MEMBER'S
DATE OF
DATE OF
DATE OF
DATE OF
INTER-VIL
REM
NO.
NAME
SEX
MMM
REGN.NO.
STA
REGN.NO. YER
REGN.NO.
BIRTH
DEATH
MIGR.IN
MIGR.OUT
MIGR.
ARK
-------------------------------------------------------------------------------------------------------------------
01
SHAIZUDDIN
M
HEAD
M 1V47003602 74
1V47003601
0/00/20
02
HALEMA KHA
F
WIFE
M 1V47003601 74
1V47003602
0/00/35
03
ANNA
F
DAUG 1V47003602
S
75
1V47003640 20/09/75
04
TAZMAHAL
F
DAUG 1V47003602
S
74
1V47003607 23/10/71
05
HELENA
F
DAUG 1V47003602
S
74
1V47003604
0/00/64
06
RASHID
M
SON
1V47003602
S
74
1V47003605
6/07/66

43
INTERNATIONAL CENTRE FOR DIARRHOEAL DISEASE RESEARCH, BANGLADESH
DEMOGRAPHIC SURVEILLANCE SYSTEM: MATLAB
FAMILY REGISTER
VILLAGE CODE: V47 NAME: TULATALI
DATE: 31/08/82
BARI CODE: 007
BARI NAME: MIZI BARI FAM.RES.NO: 0044 UPDATE DATE: 31/05/82
IND MO SP DATE OF MEMBER'S REPORT
NO. NAME NO. NO. BIRTH SEX REGN.NO. SERIAL NO. REMARK
01 SHAIZUDDIN 02 0/00/20 M 1V47003601
02 HALEMA KHA 01 0/00/35 F 1V47003602
03 ANNA 02 20/09/75 F 1V47003640
04 TAZMAHAL 02 23/10/71 F 1V47003607
05 HELENA 02 0/00/64 F 1V47003604
06 RASHID 02 6/07/66 M 1V47003605

DEATH REGISTRATION FORM
ICDDR, B-MATLAB
Serial No, Village Code: Date of death:
1-3 4-6
Dl
Narre of deceased: Date of birth: Sex: 1 M 2 F 3 UNK DD MM YY
Current id. No.
Mother's current id. No.
13 -18 Registration No,
Registration No. 40-49 50-59
Mental Status al the Lime of death:
Never Married 0 Married Dl
Education al death;
61 62
DD MM YY
7-12
Separated 0 Occupation al death:
63 - 64
Events and symptoms leading up to death:
Measles
Tetanus
Drowning
Murder
Suicide
02
03
04
O5
06
Diarrhoea: Acute
Dysentery: Acute
Childbirth
Jaundice
Other net covered above
07
09
11
12
13
Other
Symptoms leading up to death: II 65-66
Place of death: Village
Type of Doctor Consuhed:
Licenced Allopath Allopath quack 2 Homeopath
Reported by:
Date:
Date entered: Field Vol.
P.S. Diat. Code
Dl Kabiraj
Divorced
El
Dl
Chronic
Chronic
08
10
Doctor not consuhed
67
F ri Entered by;
Date: D Remarks:
Widowed
J
n
n 60
6-8

DEATH REGISTRATION FORM
ICDDR, B
1. Si. No. 2. Village (Code)
4. Place of death: Village Upazila
Name
Deceased
Mother's
7. Marital slatus et the lime
of death: 2
Never married
Married
Wldowed
Separated
Divorced
3
4
Current Id No.
8. Type of doclor
consulted 2
4
32
11. Detailed description of avants and symptoms leading up ici death:
12. Specific causes ol death (Hks report);
02
03
04
05
06
Measles
Teranus
Drowning
Murder
Suicide
13. Reponed by: (Code)
15. Date 01 reporting
D D M M Y Y
07
08
09
m
3. Date of death
n
D D M M Y Y
Registration No.
Allopath
Allopalh quack
Homeopath
Kabiraj
Others
Doctor col consulted
Diarrhoea acide
Diarrhoea chronic
Dysenlery acute
Dysenlery chronic
Child bidh
Jaundice
Chers not covered above
Date of bidh
D D M M Y Y
D D M M Y Y
9. Educalion
et death
10. Occupation ai death
14. Date entered inlo:
Field Vol.
Matlab Vol.
m m
16. Remarks:
et

Card No.
2
, Study No.
, Village:
, Bari:
2 4
20. Individual Information:
57
8
10 ,
Family No.
T l
Religion:
1
14
15
o ,- o
w
0 Education
Occupation
Si.
No. L
Registra-
tion No.
Name
V)
b z
+
" N
i V
)
z°
V) V)
Date of
birth
r ô
Cl) î
Type
Years of
schooling
Primary
Secondary
16-
17
18
19
20 - 28
29 30-
31
32
33-
34
35 - 40 41-
42
43
44 - 45
46 - 47
48 - 49
1 2
3
4
5
6
7 8
9
10
12
13
14
15
Name of the interviewer:
Time taken (in minutes):
1
4-
- v
v L
v
O
â o
N N
ru :°
61
+ .
11

PREGNANCY HISTORY FOR EVER MARRIED WOMEN:
nd.
No.
ame
Total no. of
pregnancies
No. of living
children
No. of children
born alive, now
dead
Total no. of
miscarriages
and stillbirths
Son
Daughter
Son
Daughter

BIRTH REGISTRATION FORM
DSS-MATLAB, ICDDR,B
1. Serial No. J 2. Mother's residence village (code):
3. Place of birth: Village Upazila
4.
5.
Name Current Id. No.
oFl t é Father
I rm Registration No. Date of Birth
El
D D M M Y Y
D D M M Y Y
6. Size: 7. Name of newborn: 8. Registration No. 9. Sex: Single
1 Male 2 Twin*
2 Female 3 Triplet*
3 U nk .
10. Relation to head: 11. Date of birth: M D D M M Y Y
12. Result: 13. Duration of 14. The delivery 1 Normal
1 Miscarriage induced ( <7 m) (months): was: Difficult 2 or
2 Miscarriage spon ta neo us (<7 m) Unusual 15. If difficult or
3 Stillbirth (>7.m ) unusual: Was there
excessive maternai 1 No
4 Live birth bleeding? 2 Yes
16. Any other complications related to pregnancy, specify:
r-I
17. The presentation of the baby was:
1
2
3
4
Head 18. Duration of labour:
Breech
Face
Limb
1
2
More than 24 h
Less than 24 h
19. The baby cried: 1 Immediately 20 . Anyt
to m
hing d
ake
1 No
2 nome time baby cry? 2 Yes
If y
21. Delivery was attended by:
22. Umbilical cord cut by:
23 . used for
sing of the
1 Da i 1 New 1 Burnt ashes
2 trained 2 Old 2 Burnt cow
D ai
3 3 Bamboo 3 Medicated r egular Dai
Other 4 Catechu
Other
Specify: Specify: Specify:
(continued)
1
pre
i i i l l i i i u
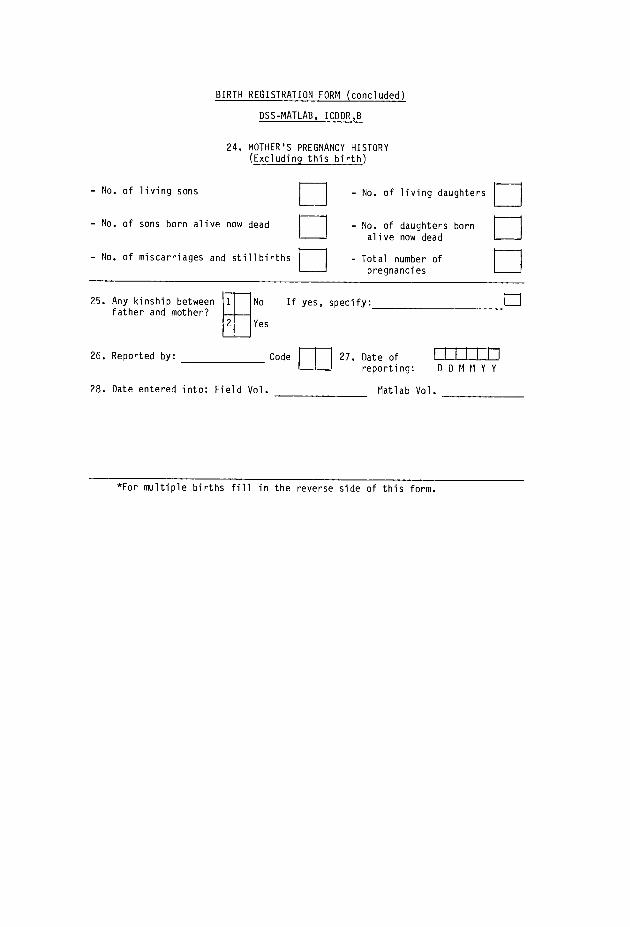
BIRTH REGISTRATION FORM (concluded)
DSS-MATLAB, ICDDR,B
24. MOTHER'S PREGNANCY HISTORY (Excluding this birth)
- No. of living sons
- No. of sons born alive now dead
- No. of miscarriages and stillbirths
25. Any kinship between father and mother?
1
2
E - No. of living daughters
- No. of daughters born
alive now dead
Total number of pregnancies
No If yes, specify:
Yes
26. Reported by: Code f 27. Date of
reporting: D D M M Y Y
28. Date entered into: Field Vol. Platlab Vol.
*For multiple births fill in the reverse side of this form.

Information on pregnancy outcome for the 2nd of multiple births
Results:
1 2
3
4
Miscarriage induced (<7 m)
Miscarriage spontaneous (<7 m)
Stillbirth (>_7 m)
Live birth
The presentation
of the baby was:
1
2 3
4
Head
Breech
Face
Other
The baby cried:
2
Immediately after'birth
After some time
m
Anything done to
make the baby cry?
If yes, specify:
Name of newborn:
Registration No.
Information on pregnancy outcome for the 3rd of multiple births
Results:
1 2
3 4
Miscarriage induced (<7 m)
Miscarriage spontaneous (<7 m)
Stillbirth (>7 m)
Live birth
The presentation
of the baby was:
1 2
3 4
Head
Breech
Face
Other
Name of newborn:
Registration No.
The baby cried:
1
2
Immediately after birth
After some time
Anything done to
make the baby cry?
If yes, specify:
Sex:
2
3
1 2
Sex:
2
3
1 2
Male
Female
Unk.
No
Yes
Male
Female
Unk.
No
Yes

IN-MIGRATION REGISTRATION FORM
DSS-MATLAB, ICDDR,B
1.
Serial No.
= 2. V
illage (Code)
3. Type of movement
1 2
3
6.
Where from: Village
Town
Country
1
3
8.
Whether creating a new family
9.
_iI
Village
Family
10.
2
4.
Dat
e of
Si
ngle
m
ovem
ent
L
L_L
L
L I
D D M M Y Y
Partial family
Whole family
Upazila
7.
Dis
t.
No
Family No.
Bari name
(new or in
ww
ii ch
Yes
joined)
1
Rural
Urban
Abroad
2
Bar
i N
o.
5. Religion
N.H.F.
1 2
3
Islam
Hinduism
Other
Ind.
Relation Mother's Marital Spouse
Date of Birth
Cause of
No.
Name
Sex
to head
Ind. No. Status
Ind.No
Registration Number
D
M
M
Y
'7- Education Occupation
movement
11. Reported by:
Date of report
D D M M Y Y
Code m 1
2. Date entered: Field Vol.
13. Remarks
Matlab Vol.
* For ever married women fill in the reverse side of this form.
I 1
L_W
-L1
I

OUT-MIGRATION REGISTRATION FORM
DSS-MATLAB, ICDDR,B
1.
Serial No.
H 2.
Village (Code)
3. Type of movement
1
2
3
5.
Where to:
Village
Town
Country
Upazi1a
Dist.
3
Village
Family
8.
Ind. No.
9.
Reported by:
Narre
Code ni
Sex
Single
Partial family
Whole family
6.
1 2
Registration Number
10. Date entered: Field Vol.
Matlab Vol.
Rural
Urban
Abroad
4. Date of movement
Cause of movement
I
D D M M Y Y
10. Date of report
12. Remarks:
D 0 M M Y Y
7.
II

MARITAL STATUS REGISTRATION FORM DSS-MATLAB, ICDDR,B
1. Serial No. f fTl
2. Village (Code)
4. Event
5. Narre
6. Current Id. No.
7. Registration No.
8. Date of birth
9. Usual residence
10. Marital status prior to this event
11. Duration of prior status in months (excepting never married)
Marriage
Divorce
Male Partner
3. Date of event
rrrrr-rrr, I D D M M Y Y
Vill. UZ d
D D M M Y Y
Female Partner
D D M M Y Y
Vill. UZ U
rri 12. No. of previous events : Marr.c Wid.- Div.E Marr.n Wid.
LJ -y Div.n
1-1 13. Education
14. Occupation
15. Marriage initiated by
1
2
3
If other, specify:
17. Partners from the same 1
2
3
4
5
16. Kinship between Partners partners:
Guardians
Other
Bari
Village
Union
Upazila
Other
19. Reported by: Code
20. Date r-r-I I I ty
If yes, specify:
18. Event regis- tered by Quazi:
m 1 No
2 Yes
1 No
2
21. Date entered: Field Vol. Matlab Vol. D D M M Y Y
Yes
Remarks:
1

INTERNAL MOVEMENT REGISTRATION FORM
DSS-MATLAB, ICDDR,B
1.
Serial No.
= 2.
Village (Code)
3. Type of movement
1
2 3
5.
Whether creating a new family
7.
1 L
1
I I
Village
Family
8.
2
1
Single
Partial family
Whole family
4. Date of movement
D D M M Y Y
No
6. Family No.
Bari name
Bari No.
N.H.F.
(new or in which
rrn
Yes
joined)
Relation Mother's Marital Previous Spouse
Date of Birth
Ind. No.
Name
Sex
to head
Ind. No. Status
Id. No.
Ind.No.
Registration Number
Cause of movement
9.
From: Village
Bari
Reported by
11. Date entered:
Field Vol.
Code m D
ate
r-.r
--r-
r-1
f I
0DM
MY
Y
Matlab Vol.
10. To: Village
Bari
Reported by
Code m D
ate
LIL
Lm
D
D
M
M
Y
Y
12. Remarks:
D
0

55
DSS PUBLICATIONS
Anonymous. March 1978. Methods and procedures. Demographic Surveillance System (DSS) - Matlab: Volume 1. International Centre for Diarrhoeal Disease Research - Bangladesh, Dhaka, Bangladesh. Scientific Report 9, 28 p.
Ruzicka, L.T., Chowdhury, A.K.M.A. March 1978. Census 1974. Demographic Surveillance System (DSS) - Matlab: Volume 2.
International Centre for Diarrhoeal Disease Research -
Bangladesh, Dhaka, Bangladesh. Scientific Report 10, 48 p.
Ruzicka, L.T., Chowdhury, A.K.M.A. March 1978. Vital events and migration, 1975. Demographic Surveillance System (DSS) - Matlab: Volume 3. International Centre for Diarrhoeal Disease Research -
Bangladesh, Dhaka, Bangladesh. Scientific Report 11, 45 p.
Ruzicka, L.T., Chowdhury, A.K.M.A. March 1978. Vital events and migration, 1975. Demographic Surveillance System (DSS) - Matlab: Volume 4. International Centre for Diarrhoeal Disease Research -
Bangladesh, Dhaka, Bangladesh. Scientific Report 12, 48 p.
Ruzicka, L.T., Chowdhury, A.K.M.A. March 1978. Vital events and migration and marriages, 1978. Demographic Surveillance System (DSS) - Matlab: Volume 5. International Centre for Diarrhoeal Disease Research - Bangladesh, Dhaka, Bangladesh. Scientific Report 13, 55 p.
Samad, A., Shaikh, K., Sardar, A.M., Becker, S., Chen, L.C. February 1979. Vital events and migration, 1977. Demographic Surveillance System (DSS) - Matlab: Volume 6. International Centre for Diarrhoeal Disease Research - Bangladesh, Dhaka, Bangladesh. Scientific Report 18, 65 p.
Chowdhury, M.K., Becker, S., Razzak, A., Sardar, A.M., Shaikh, K., Chen, Lincoln C. May 1981. Vital events and migration, 1978. Demographic Surveillance System (DSS) - Matlab: Volume 7. International Centre for Diarrhoeal Disease Research - Bangladesh, Dhaka, Bangladesh. Scientific Report 47, 80 p.
Becker, S., Razzak, A., Sarder, A.M. 1982. Census update. Demographic Surveillance System (DSS) - Matlab: Volume 8. International Centre for Diarrhoeal Disease Research -
Bangladesh, Dhaka, Bangladesh. Scientific Report 55.
Chowdhury, M.K., Razzak, A., Becker, S., Sardar, A.M., D'Souza, S. May 1982. Vital events and migration, 1979. Demographic Surveillance System (DSS) - Matlab: Volume 9. International Centre for Diarrhoeal Disease Research - Bangladesh, Dhaka, Bangladesh. Scientific Report 56, 56 p.
Chowdhury, M.K., Razzak, A., Mostafa, G., Sardar, A.M., D'Souza, S. November 1982. Vital events and migration tables, 1979. Demographic Surveillance System (DSS) - Matlab: Volume 10. International Centre for Diarrhoeal Disease Research - Bangladesh, Dhaka, Bangladesh. Scientific Report 58, 61 p.

56
Chowdhury, M.K., Karim, M.R., Mostafa, G., Sardar, A.M., D'Souza, S.
November 1983. Vital events and migration tables, 1981. Demographic Surveillance System (DSS) - Matlab: Volume 11.
International Centre for Diarrhoeal Disease Research -
Bangladesh, Dhaka, Bangladesh. Scientific Report 59, 60 p.
Shaikh, K., Mostafa, G., Sardar, A.M., Wojtyniak, B. August 1984.
Vital events and migration table, 1982. Demographic Surveillance
System (DSS) - Matlab: Volume 12. International Centre for
Diarrhoeal Disease Research - Bangladesh, Dhaka, Bangladesh.
Scientific Report 62, 61 p.
Chowdhury, A.I., Aziz, K.M.A., Shaikh, K. April 1981. Demographic
studies in rural Bangladesh: May 1969-April 1970. April 1981.
International Centre for Diarrheoal Disease Research -
Bangladesh, Dhaka, Bangladesh. Working Paper 16, 28 p.
Chowdhury, A.I., Aziz, K.M.A., Shaikh, K. April 1981. Demographic
studies in rural Bangladesh: Play 1970-April 1971. International
Centre for Diarrheoal Disease Research - Bangladesh, Dhaka,
Bangladesh. Working Paper 17, 31 p.

SES 1982
ICDDR,B
1.
Card No.
1
2.
Study No.
_,
3.
Village:
4.
Bari:
_$70
5.
Family No.
, 6. (74/) Family registration No.
, 7. Religion:
, 8. Date of interview:
I1-14
15-18
19
9.
Main sources of water during
season (from
to
Drinking:
,
Cooking:
,
Bathe:
,
Washing:
26
Codes: Tube well (1), Tank (2), River (3), Ditch/Canal
(4), Other (5)
10. Structure of the largest room: Wall:
, Roof:
30
16-25
29-
Codes: Wall tin + Roof tin (1), Wall pucca + Roof tin (2), Wall tin + Roof others, Wall others + Roof tin (3),
Other
(4)
11. Items owned
: Lep (01), Hurricane (02), Bicycle (04), Any watch
(08), Radio (16), Remittance (32)
31-3
12. No. of cows owned:
13.
No. of boats owned:
34
14. Total land owned (excluding homestead) in decimals:
35-38
If own land: Self cultivated (1)
If no land: Takes rent (1)
Renting out
(2)
39
Shares crop
(2)
-
Share cropping (4)
Other (specify) (4)
15. Use of fixed latrine: Male
Yes/No
, Within 15 yards from used water sources: Yes/No
Female
Yes/No
41
42
16. Highest education of former member now outside DSS/Abroad:
, Type:
, Years of schooling:
43
44
17. Highest education in the family:Type
, Years of schooling:
47
48-49
45-46
18. Occupation of household Head:
19.
Family size:
50-51
52-53
,
1 -9
70

58
Instructions for the Field Workers - SES '82
1. Card No.
2. Study No.
3. Current Id. No.
Leave blank.
Leave blank.
To be copied from census update form. It will consist of current village code and current family No.
4. Bari (code)
5. Date of interview
6. (74/ ) family registration
7. Religion
8. Education of household
9. Occupation of household head
10. Highest education in
the family
11. Highest education of former member now outside DSS/abroad
12. Family size
13. Items owned
To be copied from census update form.
Please write date of interview.
1974 number will be written down if it exists; otherwise, the number that the family first had on inclusion to DSS.
To be copied from census update form.
To be copied from census update form.
To be copied from census update form.
To be copied from census update form.
If a former member of the family is now living outside DSS, then his type of education, years of
schooling, and place of present residence will be noted. For more than one such member, information on the individual
with the highest education will
be taken.
To be copied from census update form.
Every item owned by the family
should be ticked. Remittance: if
the family receives cash or money order more than once a year from former member(s) of the family,
it will be considered to have remittance.
.
.

59
14. No. of cows owned : Exact no. of cows owned by the
family.
15. No. of boats owned . Exact no. of boats owned by the family.
16. Total land owned in Total land owned by family
decimals excluding homestead. Ownership will include (a) land for which proper documentation exists and (b) land owned through inheritance, although proper
documentation does not exist.
If own land Tick the appropriate entries.
If no land : Tick the appropriate entries.
17. Main sources of water : Main sources used during major
period of the specified season by majority of members of the family
against every purpose as
mentioned.
18. Structure of the largest : Materials used in mort of wall
room and roof of the largest
dwelling. Nonexistence of dwelling should be mentioned.
19. Area of dwelling : Please write length and breadth of the rooms used by the
household members (write in
descending order).
20. Use of fixed latrine : Whether fixed latrine is used by
the majority of male and female members (more than 7 years of age) of the family. Whether it
is within 15 yards of used water source. Tick the appropriate entries.
:

Head office IDRC, P.O. Box 8500, Ottawa, Ontario, Canada K1 G 3H9
Regional office for Southeast and East Asia IDRC, Tanglin P.O. Box 101, Singapore 9124, Republic of Singapore
Regional Office for South Asia IDRC, 11 Jor Bagh, New Delhi 110003, India
Regional office for Eastern and Southem Africa IDRC, P.O. Box 62084, Nairobi, Kenya
Regional office for the Middle East and North Africa IDRC/CRDI, P.O. Box 14 Orman, Giza, Cairo, Egypt
Regional Office for West and Central Africa CRDI, B.P. 11007, CD Annexe, Dakar, Senegal
Regional Office for Latin America and the Caribbean CIID, Apartado Aéreo 53016, Bogota, D.E., Colombia
Please direct requests for information about IDRC and its activities to the IDRC office in your region.