Impact of Janani Suraksha Yojana on Institutional Delivery Rate and Maternal Morbidity and...
15
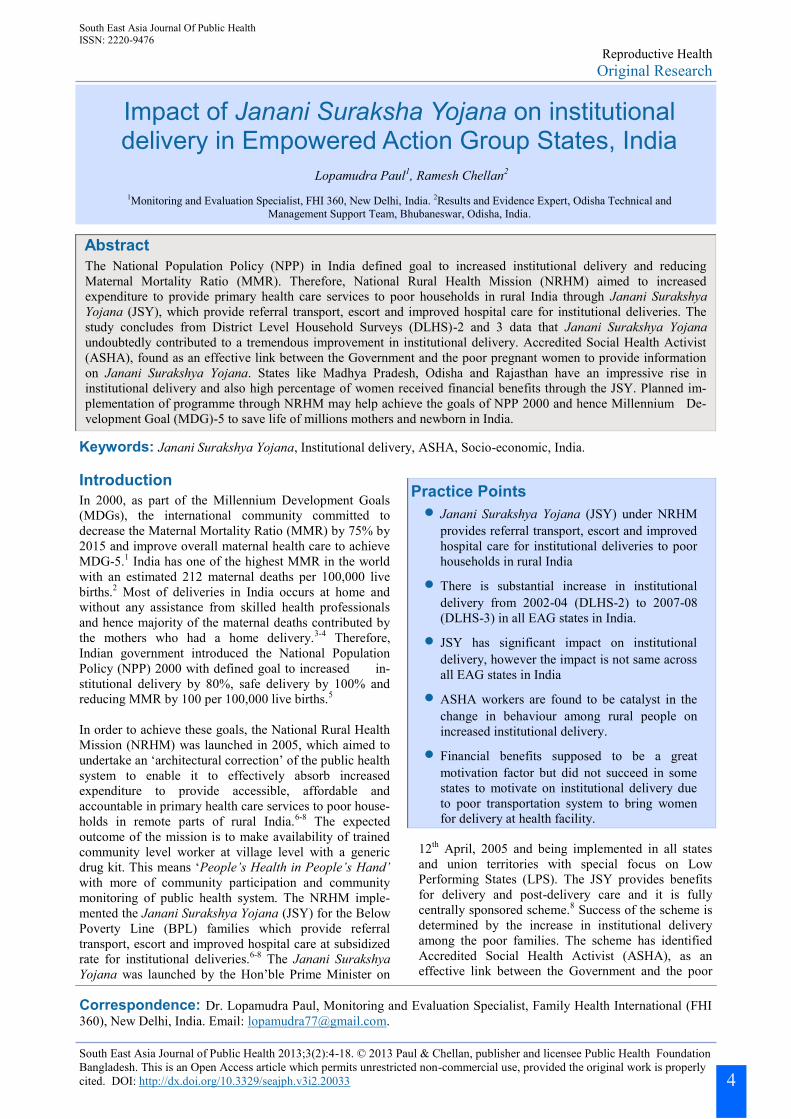
Impact of Janani Suraksha Yojana on institutional delivery in Empowered Action Group States, India Lopamudra Paul 1 , Ramesh Chellan 2 1 Monitoring and Evaluation Specialist, FHI 360, New Delhi, India. 2 Results and Evidence Expert, Odisha Technical and Management Support Team, Bhubaneswar, Odisha, India. Reproductive Health Original Research South East Asia Journal Of Public Health ISSN: 2220-9476 Abstract The National Population Policy (NPP) in India defined goal to increased institutional delivery and reducing Maternal Mortality Ratio (MMR). Therefore, National Rural Health Mission (NRHM) aimed to increased expenditure to provide primary health care services to poor households in rural India through Janani Surakshya Yojana (JSY), which provide referral transport, escort and improved hospital care for institutional deliveries. The study concludes from District Level Household Surveys (DLHS)-2 and 3 data that Janani Surakshya Yojana undoubtedly contributed to a tremendous improvement in institutional delivery. Accredited Social Health Activist (ASHA), found as an effective link between the Government and the poor pregnant women to provide information on Janani Surakshya Yojana. States like Madhya Pradesh, Odisha and Rajasthan have an impressive rise in institutional delivery and also high percentage of women received financial benefits through the JSY. Planned im- plementation of programme through NRHM may help achieve the goals of NPP 2000 and hence Millennium De- velopment Goal (MDG)-5 to save life of millions mothers and newborn in India. Keywords: Janani Surakshya Yojana, Institutional delivery, ASHA, Socio-economic, India. South East Asia Journal of Public Health 2013;3(2):4-18. © 2013 Paul & Chellan, publisher and licensee Public Health Foundation Bangladesh. This is an Open Access article which permits unrestricted non-commercial use, provided the original work is properly cited. DOI: http://dx.doi.org/10.3329/seajph.v3i2.20033 In 2000, as part of the Millennium Development Goals (MDGs), the international community committed to decrease the Maternal Mortality Ratio (MMR) by 75% by 2015 and improve overall maternal health care to achieve MDG-5. 1 India has one of the highest MMR in the world with an estimated 212 maternal deaths per 100,000 live births. 2 Most of deliveries in India occurs at home and without any assistance from skilled health professionals and hence majority of the maternal deaths contributed by the mothers who had a home delivery. 3-4 Therefore, Indian government introduced the National Population Policy (NPP) 2000 with defined goal to increased in- stitutional delivery by 80%, safe delivery by 100% and reducing MMR by 100 per 100,000 live births. 5 In order to achieve these goals, the National Rural Health Mission (NRHM) was launched in 2005, which aimed to undertake an ‘architectural correction’ of the public health system to enable it to effectively absorb increased expenditure to provide accessible, affordable and accountable in primary health care services to poor house- holds in remote parts of rural India. 6-8 The expected outcome of the mission is to make availability of trained community level worker at village level with a generic drug kit. This means ‘People’s Health in People’s Hand’ with more of community participation and community monitoring of public health system. The NRHM imple- mented the Janani Surakshya Yojana (JSY) for the Below Poverty Line (BPL) families which provide referral transport, escort and improved hospital care at subsidized rate for institutional deliveries. 6-8 The Janani Surakshya Yojana was launched by the Hon’ble Prime Minister on Introduction Practice Points Janani Surakshya Yojana (JSY) under NRHM provides referral transport, escort and improved hospital care for institutional deliveries to poor households in rural India There is substantial increase in institutional delivery from 2002-04 (DLHS-2) to 2007-08 (DLHS-3) in all EAG states in India. JSY has significant impact on institutional delivery, however the impact is not same across all EAG states in India ASHA workers are found to be catalyst in the change in behaviour among rural people on increased institutional delivery. Financial benefits supposed to be a great motivation factor but did not succeed in some states to motivate on institutional delivery due to poor transportation system to bring women for delivery at health facility. Correspondence: Dr. Lopamudra Paul, Monitoring and Evaluation Specialist, Family Health International (FHI 360), New Delhi, India. Email: [email protected] . 4 12 th April, 2005 and being implemented in all states and union territories with special focus on Low Performing States (LPS). The JSY provides benefits for delivery and post-delivery care and it is fully centrally sponsored scheme. 8 Success of the scheme is determined by the increase in institutional delivery among the poor families. The scheme has identified Accredited Social Health Activist (ASHA), as an effective link between the Government and the poor
-
Upload
independent -
Category
Documents
-
view
0 -
download
0
Transcript of Impact of Janani Suraksha Yojana on Institutional Delivery Rate and Maternal Morbidity and...
Impact of Janani Suraksha Yojana on institutional delivery in Empowered Action Group States, India
Lopamudra Paul1, Ramesh Chellan2
1Monitoring and Evaluation Specialist, FHI 360, New Delhi, India. 2Results and Evidence Expert, Odisha Technical and
Management Support Team, Bhubaneswar, Odisha, India.
Reproductive Health
Original Research
South East Asia Journal Of Public Health ISSN: 2220-9476
Abstract
The National Population Policy (NPP) in India defined goal to increased institutional delivery and reducing
Maternal Mortality Ratio (MMR). Therefore, National Rural Health Mission (NRHM) aimed to increased
expenditure to provide primary health care services to poor households in rural India through Janani Surakshya
Yojana (JSY), which provide referral transport, escort and improved hospital care for institutional deliveries. The
study concludes from District Level Household Surveys (DLHS)-2 and 3 data that Janani Surakshya Yojana
undoubtedly contributed to a tremendous improvement in institutional delivery. Accredited Social Health Activist
(ASHA), found as an effective link between the Government and the poor pregnant women to provide information
on Janani Surakshya Yojana. States like Madhya Pradesh, Odisha and Rajasthan have an impressive rise in
institutional delivery and also high percentage of women received financial benefits through the JSY. Planned im-
plementation of programme through NRHM may help achieve the goals of NPP 2000 and hence Millennium De-
velopment Goal (MDG)-5 to save life of millions mothers and newborn in India.
Keywords: Janani Surakshya Yojana, Institutional delivery, ASHA, Socio-economic, India.
South East Asia Journal of Public Health 2013;3(2):4-18. © 2013 Paul & Chellan, publisher and licensee Public Health Foundation
Bangladesh. This is an Open Access article which permits unrestricted non-commercial use, provided the original work is properly
cited. DOI: http://dx.doi.org/10.3329/seajph.v3i2.20033
In 2000, as part of the Millennium Development Goals
(MDGs), the international community committed to
decrease the Maternal Mortality Ratio (MMR) by 75% by
2015 and improve overall maternal health care to achieve
MDG-5.1 India has one of the highest MMR in the world
with an estimated 212 maternal deaths per 100,000 live
births.2 Most of deliveries in India occurs at home and
without any assistance from skilled health professionals
and hence majority of the maternal deaths contributed by
the mothers who had a home delivery.3-4 Therefore,
Indian government introduced the National Population
Policy (NPP) 2000 with defined goal to increased in-
stitutional delivery by 80%, safe delivery by 100% and
reducing MMR by 100 per 100,000 live births.5
In order to achieve these goals, the National Rural Health
Mission (NRHM) was launched in 2005, which aimed to
undertake an ‘architectural correction’ of the public health
system to enable it to effectively absorb increased
expenditure to provide accessible, affordable and
accountable in primary health care services to poor house-
holds in remote parts of rural India.6-8 The expected
outcome of the mission is to make availability of trained
community level worker at village level with a generic
drug kit. This means ‘People’s Health in People’s Hand’
with more of community participation and community
monitoring of public health system. The NRHM imple-
mented the Janani Surakshya Yojana (JSY) for the Below
Poverty Line (BPL) families which provide referral
transport, escort and improved hospital care at subsidized
rate for institutional deliveries.6-8 The Janani Surakshya
Yojana was launched by the Hon’ble Prime Minister on
Introduction Practice Points
Janani Surakshya Yojana (JSY) under NRHM
provides referral transport, escort and improved
hospital care for institutional deliveries to poor
households in rural India
There is substantial increase in institutional
delivery from 2002-04 (DLHS-2) to 2007-08
(DLHS-3) in all EAG states in India.
JSY has significant impact on institutional
delivery, however the impact is not same across
all EAG states in India
ASHA workers are found to be catalyst in the
change in behaviour among rural people on
increased institutional delivery.
Financial benefits supposed to be a great
motivation factor but did not succeed in some
states to motivate on institutional delivery due
to poor transportation system to bring women
for delivery at health facility.
Correspondence: Dr. Lopamudra Paul, Monitoring and Evaluation Specialist, Family Health International (FHI
360), New Delhi, India. Email: [email protected].
4
12th April, 2005 and being implemented in all states
and union territories with special focus on Low
Performing States (LPS). The JSY provides benefits
for delivery and post-delivery care and it is fully
centrally sponsored scheme.8 Success of the scheme is
determined by the increase in institutional delivery
among the poor families. The scheme has identified
Accredited Social Health Activist (ASHA), as an
effective link between the Government and the poor
Paul & Chellan Impact of Janani Suraksha Yojana on Institutional Delivery
South East Asia Journal of Public Health 2013;3(2):4-18
pregnant women in ten low performing states, namely
the eight Empowered Action Group (EAG) states
(Bihar, Chhattisgarh, Jharkhand, Madhya Pradesh,
Odisha, Rajasthan, Uttrakhand and Uttar Pradesh),
Assam, Jammu and Kashmir and the remaining North-
eastern states.8 In rest of the states, Anganwadi Workers
(AWW) and Trained Birth Attendants (TBA) or ASHA
like activists have been engaged with JSY for providing
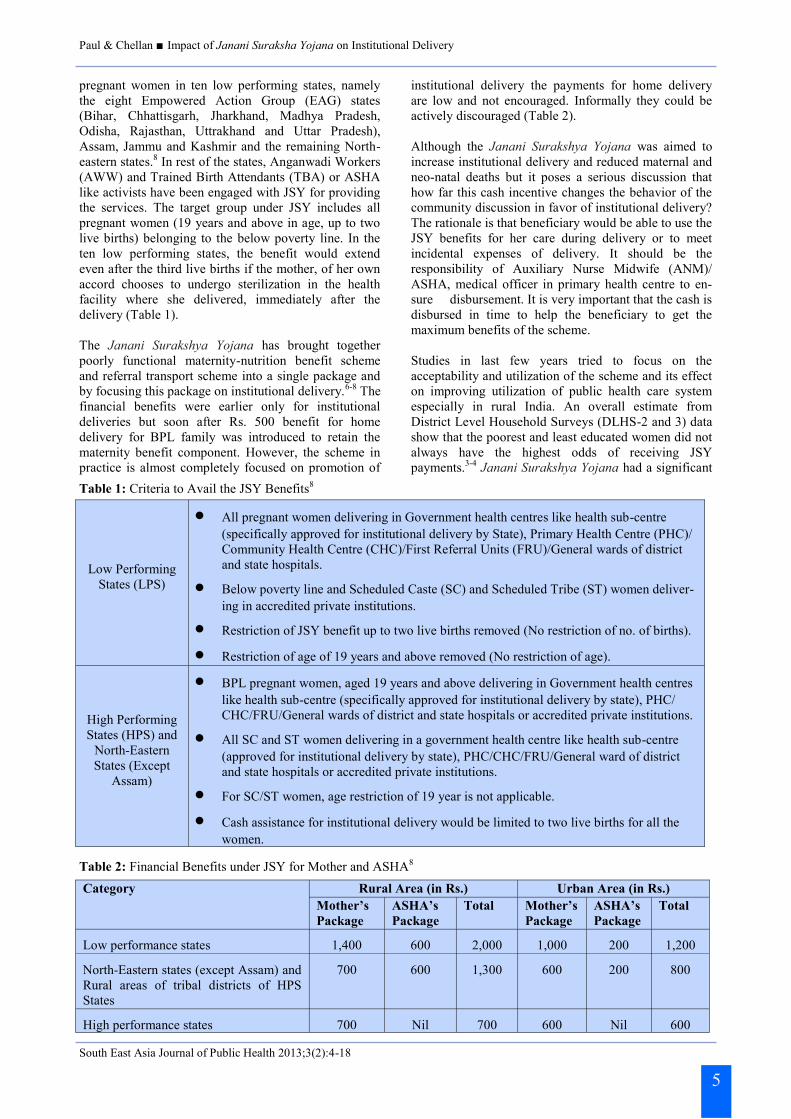
the services. The target group under JSY includes all
pregnant women (19 years and above in age, up to two
live births) belonging to the below poverty line. In the
ten low performing states, the benefit would extend
even after the third live births if the mother, of her own
accord chooses to undergo sterilization in the health
facility where she delivered, immediately after the
delivery (Table 1).
The Janani Surakshya Yojana has brought together
poorly functional maternity-nutrition benefit scheme
and referral transport scheme into a single package and
by focusing this package on institutional delivery.6-8 The
financial benefits were earlier only for institutional
deliveries but soon after Rs. 500 benefit for home
delivery for BPL family was introduced to retain the
maternity benefit component. However, the scheme in
practice is almost completely focused on promotion of
institutional delivery the payments for home delivery
are low and not encouraged. Informally they could be
actively discouraged (Table 2).
Although the Janani Surakshya Yojana was aimed to
increase institutional delivery and reduced maternal and
neo-natal deaths but it poses a serious discussion that
how far this cash incentive changes the behavior of the
community discussion in favor of institutional delivery?
The rationale is that beneficiary would be able to use the
JSY benefits for her care during delivery or to meet
incidental expenses of delivery. It should be the
responsibility of Auxiliary Nurse Midwife (ANM)/
ASHA, medical officer in primary health centre to en-
sure disbursement. It is very important that the cash is
disbursed in time to help the beneficiary to get the
maximum benefits of the scheme.
Studies in last few years tried to focus on the
acceptability and utilization of the scheme and its effect
on improving utilization of public health care system
especially in rural India. An overall estimate from
District Level Household Surveys (DLHS-2 and 3) data
show that the poorest and least educated women did not
always have the highest odds of receiving JSY
payments.3-4 Janani Surakshya Yojana had a significant
5
Table 1: Criteria to Avail the JSY Benefits8
Category
Rural Area (in Rs.) Urban Area (in Rs.) Mother’s
Package
ASHA’s
Package
Total Mother’s
Package
ASHA’s
Package
Total
Low performance states 1,400 600 2,000 1,000 200 1,200
North-Eastern states (except Assam) and
Rural areas of tribal districts of HPS
States
700 600 1,300 600 200 800
High performance states 700 Nil 700 600 Nil 600
Table 2: Financial Benefits under JSY for Mother and ASHA8
Low Performing
States (LPS)
All pregnant women delivering in Government health centres like health sub-centre
(specifically approved for institutional delivery by State), Primary Health Centre (PHC)/
Community Health Centre (CHC)/First Referral Units (FRU)/General wards of district
and state hospitals.
Below poverty line and Scheduled Caste (SC) and Scheduled Tribe (ST) women deliver-
ing in accredited private institutions.
Restriction of JSY benefit up to two live births removed (No restriction of no. of births).
Restriction of age of 19 years and above removed (No restriction of age).
High Performing
States (HPS) and
North-Eastern
States (Except
Assam)
BPL pregnant women, aged 19 years and above delivering in Government health centres
like health sub-centre (specifically approved for institutional delivery by state), PHC/
CHC/FRU/General wards of district and state hospitals or accredited private institutions.
All SC and ST women delivering in a government health centre like health sub-centre
(approved for institutional delivery by state), PHC/CHC/FRU/General ward of district
and state hospitals or accredited private institutions.
For SC/ST women, age restriction of 19 year is not applicable.
Cash assistance for institutional delivery would be limited to two live births for all the
women.

Paul & Chellan Impact of Janani Suraksha Yojana on Institutional Delivery
South East Asia Journal of Public Health 2013;3(2):4-18
effect on increasing antenatal care and in-facility births.9
Another study among 100 beneficiaries in selected
villages in Bikaner district in Rajasthan shows that
major advantages of the Janani Surakshya Yojana were
perceived by the beneficiaries such as safe delivery at
PHCs and CHCs, payment of cheque after delivery and
full protection after delivery.10 A study among 400
currently married women aged 15-35 years living in
rural areas of Seraikela-Kharsawan districts in West
Singhbhum in Jharkhand on knowledge and awareness
of Janani Surakshya Yojana revealed that 83% of the
respondents have heard about the JSY and also know
someone who had received its benefits but 54% did not
know the types of benefits and 18% knew that if
delivery is done in a hospital they will get Rs. 1,650.
The respondents also reported that they have knowledge
that Saahiya (ASHA) gets financial benefits for
accompanying mother for institutional delivery and post
natal care. About three-fifths of women stated that they
came to know about JSY from ANM.11
A study conducted in rural Odisha to estimate the
impact of JSY scheme. Six blocks from three districts
were selected for the study and data were collected from
both beneficiary and non-beneficiary mothers and other
stakeholders of the Janani Surakhya scheme.12 The
study found that less than half of both beneficiaries as
well non-beneficiary mothers knew about the various
aspects of the JSY scheme. Three-fourths of the
beneficiaries reported to first contact with ASHA for
ANC in between the third and sixth month of the
pregnancy. Most of the respondents feel that there are
problems of communication and transport.
The ASHAs also played a major role in motivation for
institutional deliveries in two-thirds of the beneficiaries
but lack of orientation of the health staffs other than
ASHAs on JSY is a significant finding emerging from
this study. It is found that there is a gap in utilization of
JSY may be contributed by many unforeseen factors.
The main aim of the scheme is to increase the
institutional delivery and hence reduce maternal deaths
to achieve the MDG-5. Therefore, to understand the
effect of JSY on institutional delivery and the utilization
of the scheme across the various socio-economic
sections in the society, the present study has focused on
the impact of utilization of JSY in the eight EAG states
in India. The impact here denoted as increase in institu-
tional delivery per se.
The major objectives of the paper are as follows:
To assess the change in institutional delivery in
between 2002-04 and 2007-08.
To examine the influence of socio-economic-
demographic and programme factors on the change
in utilisation of institutional delivery in the
Empowered Action Group states over time.
To investigate the whether there are any impacts of
Accredited Social Health Activist workers and cash
incentives on change in percentage of institutional
deliveries in the Empowered Action Group states.
Materials and Methods Data on institutional delivery is available in the three
round of National Family Health Surveys (1992-93,
1998-99, and 2005-06) and also from the three rounds
of District Level Household Surveys, (1998-99, 2002-
04, and 2007-08) in India.3-4, 13-16 Data of utilization of
JSY was collected during District Level Household and
Facility Survey (DLHS-3) and hence to determine the
reach and utilization of services under the Janani
Surakshya Yojana scheme in EAG states, data from
DLHS-3, 2007-08 was used.3 The survey provides data
on institutional delivery, deliveries facilitated by
ASHAs, institutional deliveries by trained birth
attendants, and utilization of the JSY scheme by women
belonging to different socio-economic and demographic
backgrounds. To analyze the change in the utilization of
institutional delivery before and after implementation of
Janani Surakshya Yojana data from two different time
points were required. The DLHS-2, 2002-04 was con-
ducted nationwide before initiation of NRHM and
implementation of JSY in 2005. Therefore, to compare
the change which may affect the utilization of
institutional delivery after initiation of the scheme data
from DLHS-2 was used. Finally, to understand the net
effect attributed by JSY which data was collected during
DLHS-3, and hence comparison between DLHS-2 and
DLHS-3 rounds are made. A cross-sectional study on
utilization of JSY scheme and institutional delivery was
carried out from the individual data of 116,268 among
currently married women from DLHS-3 who had their
last live/still birth in the last three years prior to the
DLHS-3 survey. Similar analysis was also carried out
from DLHS-2 data among 104,452 women living in the
EAG states.
Primarily the paper seeks the change in behaviour on
utilization of Janani Surakshya Yojana and institutional
delivery across EAG states and the region as a whole.
First, the gross differentials in institutional delivery by
selected socio-economic and demographic factors are
obtained and examined through bivariate analysis for
DLHS-2 and DLHS-3. This analysis depicts the change
in the behavior and level of utilization of institutional
delivery across the socio-economic classes before and
after implementation of JSY. Key variable of JSY,
‘whether motivated by ASHA for institutional delivery’,
is used in DLHS-3. It is well discussed that socio-
economic variables are interrelated to each other and
hence to examine the net effect of an individual
variable, multivariate analysis was carried out
employing the binary logistic regression model, since
the response variable, utilisation of institutional delivery
is dichotomous and predictor variables are in
categorized form (for details see Retherford and Choe,
1993).17 Standard of living was calculated in DLHS-2
but in DLHS-3 wealth index was computed to show the
economic condition of the households. To make the
comparison uniform between both the surveys, type of
houses is used as a proxy for the standard of living in
the study.
In addition, the paper also analyzed the data on people
6
Paul & Chellan Impact of Janani Suraksha Yojana on Institutional Delivery
South East Asia Journal of Public Health 2013;3(2):4-18
who have received financial benefits from JSY in EAG
states. Motivation for institutional delivery by ASHA is
an important factor as NRHM promotes these health
care functionaries at grass root level to help the commu-
nity to avail the services and also increase awareness on
the free services available. Therefore, separate analysis
with socio-economic factors of motivation by ASHA on
institutional delivery was done to understand whether
all section of the community gets the said facility or not.
Transportation plays an important role on institutional
delivery. In rural areas inaccessibility to health facility
influenced more on home delivery. Therefore, role of
transportation to health facility for delivery is important
and JSY provides financial assistance on transportation
for institutional delivery.
Results and Discussion
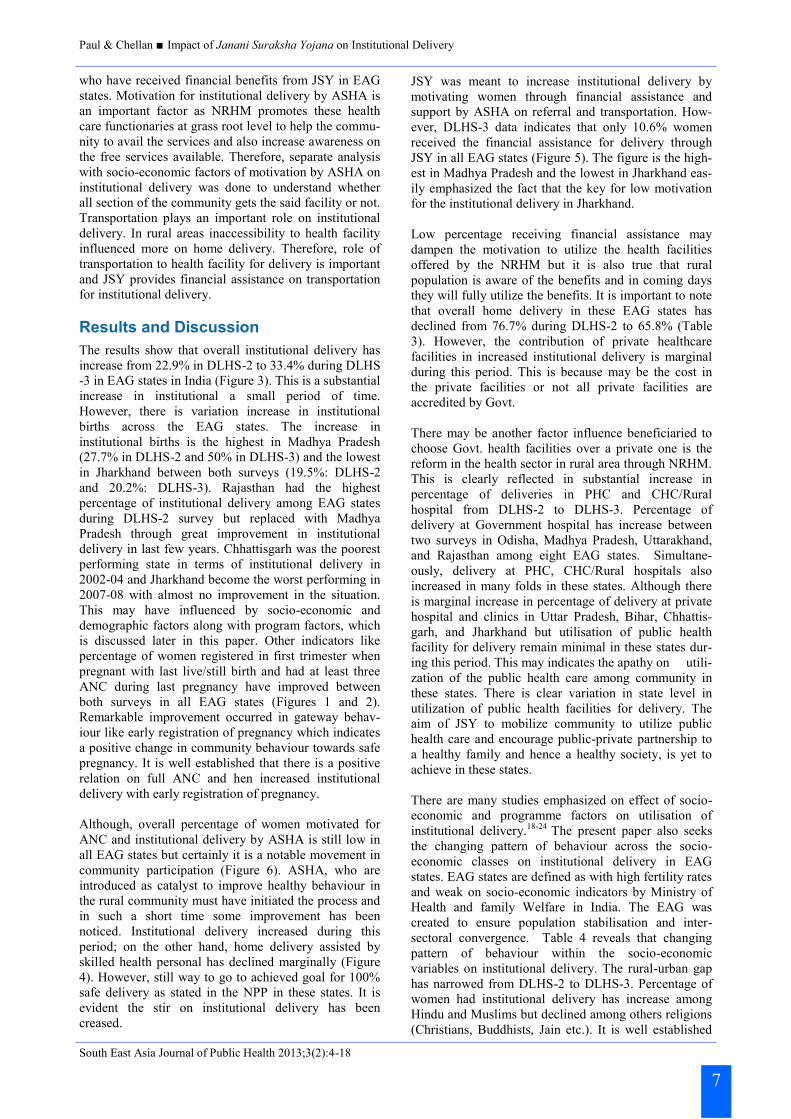
The results show that overall institutional delivery has
increase from 22.9% in DLHS-2 to 33.4% during DLHS
-3 in EAG states in India (Figure 3). This is a substantial
increase in institutional a small period of time.
However, there is variation increase in institutional
births across the EAG states. The increase in
institutional births is the highest in Madhya Pradesh
(27.7% in DLHS-2 and 50% in DLHS-3) and the lowest
in Jharkhand between both surveys (19.5%: DLHS-2
and 20.2%: DLHS-3). Rajasthan had the highest
percentage of institutional delivery among EAG states
during DLHS-2 survey but replaced with Madhya
Pradesh through great improvement in institutional
delivery in last few years. Chhattisgarh was the poorest
performing state in terms of institutional delivery in
2002-04 and Jharkhand become the worst performing in
2007-08 with almost no improvement in the situation.
This may have influenced by socio-economic and
demographic factors along with program factors, which
is discussed later in this paper. Other indicators like
percentage of women registered in first trimester when
pregnant with last live/still birth and had at least three
ANC during last pregnancy have improved between
both surveys in all EAG states (Figures 1 and 2).
Remarkable improvement occurred in gateway behav-
iour like early registration of pregnancy which indicates
a positive change in community behaviour towards safe
pregnancy. It is well established that there is a positive
relation on full ANC and hen increased institutional
delivery with early registration of pregnancy.
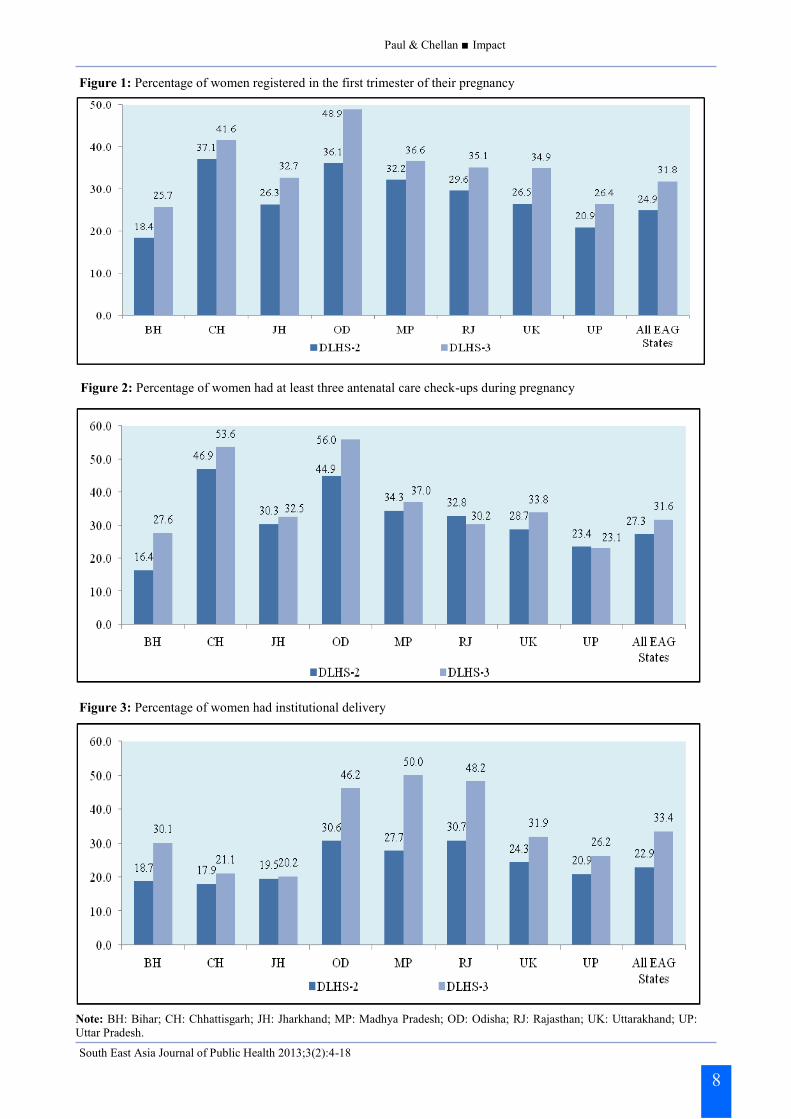
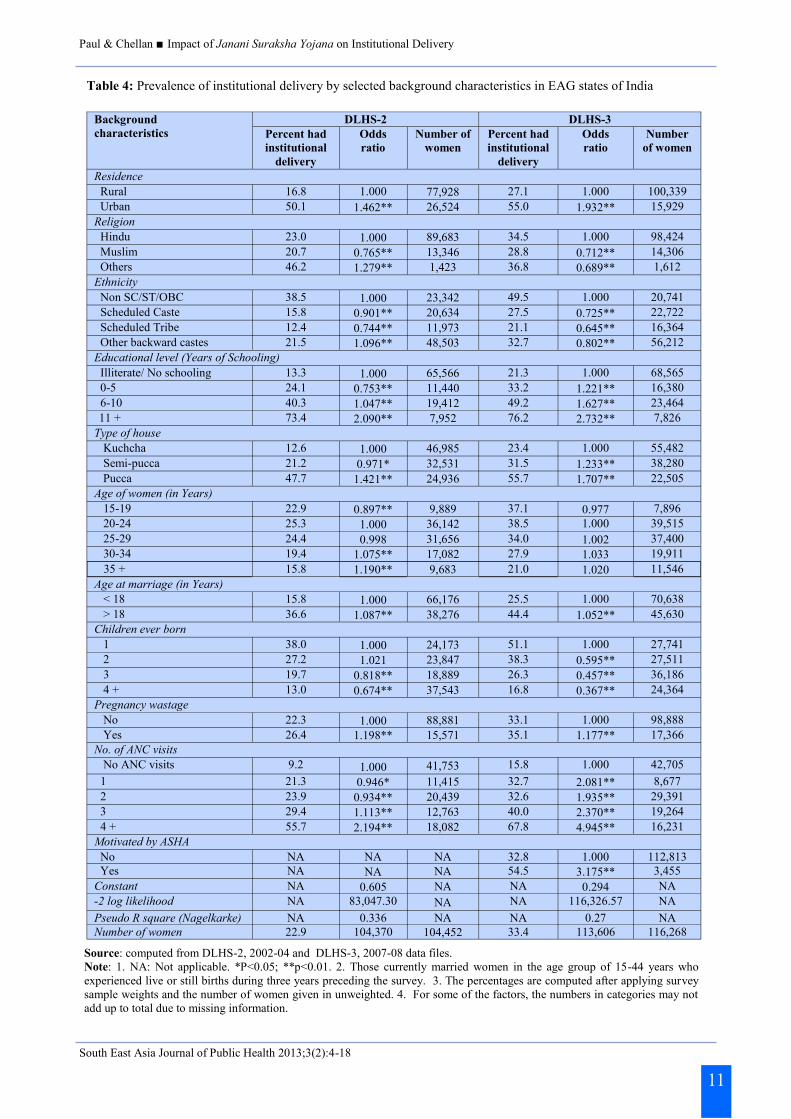
Although, overall percentage of women motivated for
ANC and institutional delivery by ASHA is still low in
all EAG states but certainly it is a notable movement in
community participation (Figure 6). ASHA, who are
introduced as catalyst to improve healthy behaviour in
the rural community must have initiated the process and
in such a short time some improvement has been
noticed. Institutional delivery increased during this
period; on the other hand, home delivery assisted by
skilled health personal has declined marginally (Figure
4). However, still way to go to achieved goal for 100%
safe delivery as stated in the NPP in these states. It is
evident the stir on institutional delivery has been
creased.
JSY was meant to increase institutional delivery by
motivating women through financial assistance and
support by ASHA on referral and transportation. How-
ever, DLHS-3 data indicates that only 10.6% women
received the financial assistance for delivery through
JSY in all EAG states (Figure 5). The figure is the high-
est in Madhya Pradesh and the lowest in Jharkhand eas-
ily emphasized the fact that the key for low motivation
for the institutional delivery in Jharkhand.
Low percentage receiving financial assistance may
dampen the motivation to utilize the health facilities
offered by the NRHM but it is also true that rural
population is aware of the benefits and in coming days
they will fully utilize the benefits. It is important to note
that overall home delivery in these EAG states has
declined from 76.7% during DLHS-2 to 65.8% (Table
3). However, the contribution of private healthcare
facilities in increased institutional delivery is marginal
during this period. This is because may be the cost in
the private facilities or not all private facilities are
accredited by Govt.
There may be another factor influence beneficiaried to
choose Govt. health facilities over a private one is the
reform in the health sector in rural area through NRHM.
This is clearly reflected in substantial increase in
percentage of deliveries in PHC and CHC/Rural
hospital from DLHS-2 to DLHS-3. Percentage of
delivery at Government hospital has increase between
two surveys in Odisha, Madhya Pradesh, Uttarakhand,
and Rajasthan among eight EAG states. Simultane-
ously, delivery at PHC, CHC/Rural hospitals also
increased in many folds in these states. Although there
is marginal increase in percentage of delivery at private
hospital and clinics in Uttar Pradesh, Bihar, Chhattis-
garh, and Jharkhand but utilisation of public health
facility for delivery remain minimal in these states dur-
ing this period. This may indicates the apathy on utili-
zation of the public health care among community in
these states. There is clear variation in state level in
utilization of public health facilities for delivery. The
aim of JSY to mobilize community to utilize public
health care and encourage public-private partnership to
a healthy family and hence a healthy society, is yet to
achieve in these states.
There are many studies emphasized on effect of socio-
economic and programme factors on utilisation of
institutional delivery.18-24 The present paper also seeks
the changing pattern of behaviour across the socio-
economic classes on institutional delivery in EAG
states. EAG states are defined as with high fertility rates
and weak on socio-economic indicators by Ministry of
Health and family Welfare in India. The EAG was
created to ensure population stabilisation and inter-
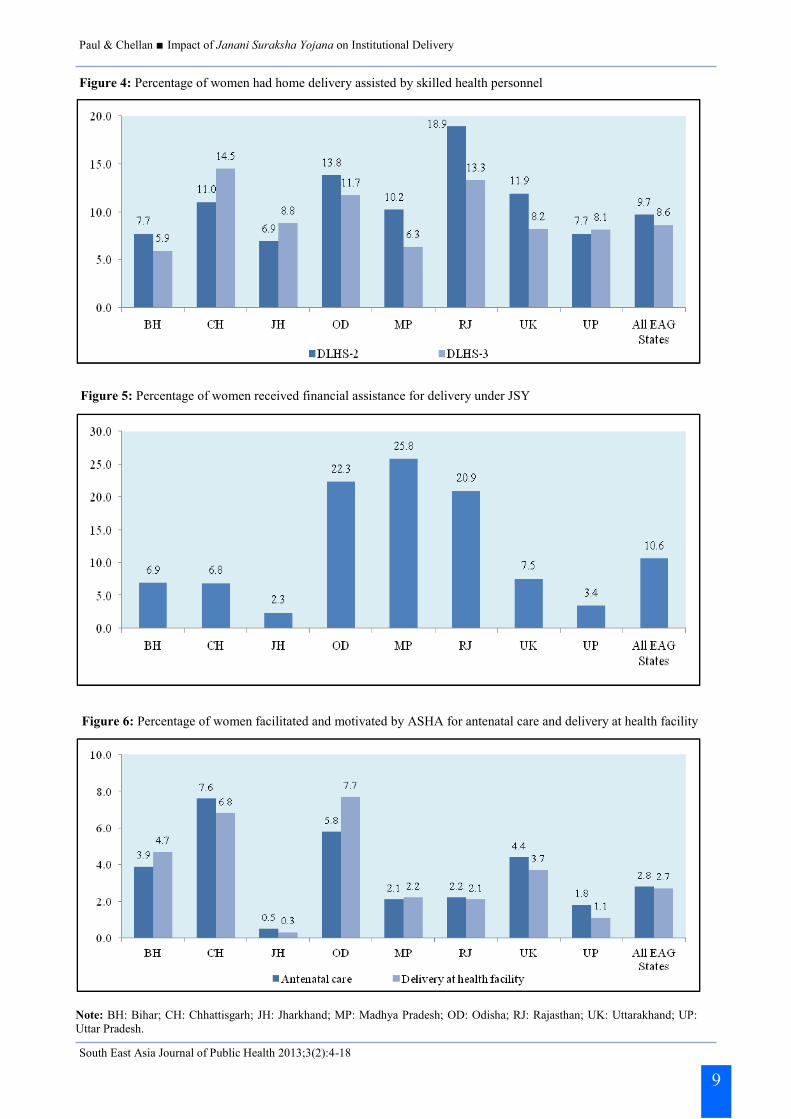
sectoral convergence. Table 4 reveals that changing
pattern of behaviour within the socio-economic
variables on institutional delivery. The rural-urban gap
has narrowed from DLHS-2 to DLHS-3. Percentage of
women had institutional delivery has increase among
Hindu and Muslims but declined among others religions
(Christians, Buddhists, Jain etc.). It is well established
7
Paul & Chellan Impact
South East Asia Journal of Public Health 2013;3(2):4-18
8
Figure 1: Percentage of women registered in the first trimester of their pregnancy
Figure 2: Percentage of women had at least three antenatal care check-ups during pregnancy
Figure 3: Percentage of women had institutional delivery
Note: BH: Bihar; CH: Chhattisgarh; JH: Jharkhand; MP: Madhya Pradesh; OD: Odisha; RJ: Rajasthan; UK: Uttarakhand; UP:
Uttar Pradesh.
Paul & Chellan Impact of Janani Suraksha Yojana on Institutional Delivery
South East Asia Journal of Public Health 2013;3(2):4-18
9
Figure 4: Percentage of women had home delivery assisted by skilled health personnel
Figure 5: Percentage of women received financial assistance for delivery under JSY
Figure 6: Percentage of women facilitated and motivated by ASHA for antenatal care and delivery at health facility
Note: BH: Bihar; CH: Chhattisgarh; JH: Jharkhand; MP: Madhya Pradesh; OD: Odisha; RJ: Rajasthan; UK: Uttarakhand; UP:
Uttar Pradesh.

Paul & Chellan Impact of Janani Suraksha Yojana on Institutional Delivery
South East Asia Journal of Public Health 2013;3(2):4-18
in literature on public health that marginalised groups
are not reached by health system and the utilisation of
health facilities are very poor among these groups. As
the JSY scheme focused on to mainstreaming the
marginalised group like Scheduled Caste, Scheduled
Tribe and Other Backward Castes (OBCs) in the society
to access the institutional delivery services, the results
show an increase in percentage of women who had
utilised institutional delivery from DLHS-2 to DLHS-3
in these groups of people. This provides a bright picture
for the scheme’s success. Percentage of women having
institutional delivery increases with rise in level of
education. Although, the pattern in utilisation of institu-
tional delivery remains the same from round two to
round three of DLHS across the educational categories
but the there is substantial in utilisation of institutional
delivery among illiterate women and women with
primary education during DLHS-3. This provides the
effect of the JSY scheme where women with none/low
education also motivated to deliver their baby at health
facilities. However, the gap across the economic classes
(types of house considered as proxy) did not change on
utilisation of institutional delivery between two surveys,
only the level has increased over time. Similar scenario
found for women with different age groups, age at
marriage and with number of ANC visits. It is necessary
to highlight that percentage of women has increased
substantially with lower birth order (one and two) to
delivery at health facilities during DLHS-3 compared to
DLHS-2, whereas it is marginally increased for higher
birth orders. ASHA workers are the catalyst on utilisa-
tion of JSY scheme and 54.5%women had reported that
they were motivated by ASHA to have institutional
delivery among who have institutional delivery. This
provides that community participation in health system
is flourishing in rural India.
The logistic regressions results also convey the same
massage that pattern of utilisation of institutional
delivery did not change across the socio-economic
categories per se expect few isolated cases (Table 4) at
two different time points (DLHS-2 and DLHS-3). It
shows that women belong to OBC community are less
likely to have institutional delivery compared to women
belong to non-SC/ST/OBC community during DLHS-3,
whereas the situation was reversed during DLHS-2.
Similarly, DLHS-3 estimates shows that likelihood of
having institutional delivery is low among Muslim
women compared to Hindus while opposite scenario
was prevailed during DLHS-2 survey. Women with two
children are significantly less likely to utilise facility for
institutional delivery than women with one child,
however, it was not significant during DLHS-2. As ex-
pected, rise in education and standard of living has
significantly positive impact on utilisation institutional
delivery. Motivation to have an institutional delivery by
ASHA is highly significant after controlling for all other
variables. It clearly reveals that JSY scheme and
10
Place of Delivery BH CH JH MP OD RJ UK UP All EAG
States DLHS-2
Government/Municipal Hospital 3.2 5.2 3.8 11.8 13.2 9.6 9.2 5.0 6.6 Government Dispensary 0.8 2.8 0.2 2.2 1.5 3.7 0.7 0.7 1.4 UHC/UHP/UFWC 0.1 0.0 0.0 0.1 0.3 0.4 0.0 0.1 0.1 CHC/Rural hospital 0.1 0.1 0.1 1.5 3.4 2.1 0.2 0.5 0.9 PHC 0.4 0.4 0.5 1.4 4.5 2.6 0.5 1.4 1.4 Sub center 0.1 0.2 0.0 0.3 0.4 0.5 0.1 0.4 0.3 NGO/Trust hospital 0.1 0.3 0.6 0.1 0.2 0.0 0.4 0.2 0.2 Government ISM hospital/clinic 0.1 0.2 0.1 0.1 0.2 0.1 0.2 0.1 0.1 Private ISM hospital/clinic 0.2 0.3 0.4 0.3 0.5 0.4 1.7 0.7 0.5 Private Hospital/Clinic 13.9 8.4 13.8 9.9 6.4 11.3 11.2 11.8 11.6 Home 81.0 82.0 80.2 72.0 68.3 68.8 75.6 78.6 76.7 Others 0.2 0.7 0.3 0.3 1.0 0.5 0.1 0.4 0.3 Number of women 18,311 5,361 7,442 15,926 9,188 13,509 3,710 31,005 104,452
DLHS-3 Government Hospital 5.9 6.2 4.2 17.9 20.1 13.6 12.1 3.8 8.8 Government Dispensary 0.1 0.0 0.0 0.1 0.3 0.3 0.0 0.1 0.1 UHC/UHPC/UFWC 0.1 0.1 0.1 0.3 0.6 0.3 0.2 0.1 0.2 CHC/Rural hospital 0.6 2.8 0.1 13.4 7.5 13.0 2.3 2.0 4.9 PHC 6.1 1.8 1.2 7.5 8.8 8.7 4.4 2.8 5.0 Sub center 0.4 0.7 0.2 0.8 0.4 0.9 0.3 0.8 0.6 AYUSH hospital/clinic 0.1 0.0 0.0 0.0 0.1 0.0 0.0 0.0 0.0 NGO/Trust/Clinic 0.2 0.2 0.1 0.2 0.2 0.2 0.2 0.4 0.2 Private Hospital/Clinic 16.5 9.1 13.4 9.7 8.0 11.2 11.8 15.9 13.3 Private AYUSH Hospital/Clinic 0.2 0.1 0.4 0.2 0.3 0.2 0.4 0.3 0.3 Home 69.1 78.6 79.4 49.3 52.6 51.0 67.6 72.9 65.8 Others 0.9 0.3 0.5 0.7 1.1 0.7 0.4 0.9 0.8 Number of women 21,315 6,114 11,298 15,839 7,637 12,405 4,097 37,563 116,268
Table 3: Percentage distribution of place of delivery in EAG states of India
Source: computed from DLHS-2, 2002-04 and DLHS-3, 2007-08 data files .
Note: 1. BH: Bihar; CH: Chhattisgarh; JH: Jharkhand; MP: Madhya Pradesh; OD: Odisha; RJ: Rajasthan; UK: Uttarakhand; UP:
Uttar Pradesh; UHC: Urban Health Centre; UHP: Urban Health Post; UFWC: Urban Family Welfare Centre; CHC: Community
Health Centre; ISM: Indian System of Medicine; NGO: Non Governmental Organisation. 2. Those currently married women in the
age group of 15-44 years who experienced live or still births during three years preceding the survey. 3. The percentages are com-
puted after applying survey sample weights and the number of women given in unweighted.
Paul & Chellan Impact of Janani Suraksha Yojana on Institutional Delivery
South East Asia Journal of Public Health 2013;3(2):4-18
11
Table 4: Prevalence of institutional delivery by selected background characteristics in EAG states of India
Source: computed from DLHS-2, 2002-04 and DLHS-3, 2007-08 data files.
Note: 1. NA: Not applicable. *P<0.05; **p<0.01. 2. Those currently married women in the age group of 15-44 years who
experienced live or still births during three years preceding the survey. 3. The percentages are computed after applying survey
sample weights and the number of women given in unweighted. 4. For some of the factors, the numbers in categories may not
add up to total due to missing information.
Background
characteristics DLHS-2 DLHS-3
Percent had
institutional
delivery
Odds
ratio Number of
women Percent had
institutional
delivery
Odds
ratio Number
of women
Residence
Rural 16.8 1.000 77,928 27.1 1.000 100,339 Urban 50.1 1.462** 26,524 55.0 1.932** 15,929
Religion Hindu 23.0 1.000 89,683 34.5 1.000 98,424
Muslim 20.7 0.765** 13,346 28.8 0.712** 14,306 Others 46.2 1.279** 1,423 36.8 0.689** 1,612
Ethnicity
Non SC/ST/OBC 38.5 1.000 23,342 49.5 1.000 20,741 Scheduled Caste 15.8 0.901** 20,634 27.5 0.725** 22,722
Scheduled Tribe 12.4 0.744** 11,973 21.1 0.645** 16,364 Other backward castes 21.5 1.096** 48,503 32.7 0.802** 56,212
Educational level (Years of Schooling)
Illiterate/ No schooling 13.3 1.000 65,566 21.3 1.000 68,565 0-5 24.1 0.753** 11,440 33.2 1.221** 16,380
6-10 40.3 1.047** 19,412 49.2 1.627** 23,464 11 + 73.4 2.090** 7,952 76.2 2.732** 7,826
Type of house Kuchcha 12.6 1.000 46,985 23.4 1.000 55,482
Semi-pucca 21.2 0.971* 32,531 31.5 1.233** 38,280
Pucca 47.7 1.421** 24,936 55.7 1.707** 22,505 Age of women (in Years)
15-19 22.9 0.897** 9,889 37.1 0.977 7,896 20-24 25.3 1.000 36,142 38.5 1.000 39,515
25-29 24.4 0.998 31,656 34.0 1.002 37,400 30-34 19.4 1.075** 17,082 27.9 1.033 19,911
35 + 15.8 1.190** 9,683 21.0 1.020 11,546
Age at marriage (in Years) < 18 15.8 1.000 66,176 25.5 1.000 70,638
> 18 36.6 1.087** 38,276 44.4 1.052** 45,630 Children ever born
1 38.0 1.000 24,173 51.1 1.000 27,741 2 27.2 1.021 23,847 38.3 0.595** 27,511
3 19.7 0.818** 18,889 26.3 0.457** 36,186
4 + 13.0 0.674** 37,543 16.8 0.367** 24,364 Pregnancy wastage
No 22.3 1.000 88,881 33.1 1.000 98,888 Yes 26.4 1.198** 15,571 35.1 1.177** 17,366 No. of ANC visits No ANC visits 9.2 1.000 41,753 15.8 1.000 42,705
1 21.3 0.946* 11,415 32.7 2.081** 8,677
2 23.9 0.934** 20,439 32.6 1.935** 29,391 3 29.4 1.113** 12,763 40.0 2.370** 19,264
4 + 55.7 2.194** 18,082 67.8 4.945** 16,231 Motivated by ASHA
No NA NA NA 32.8 1.000 112,813 Yes NA NA NA 54.5 3.175** 3,455
Constant NA 0.605 NA NA 0.294 NA -2 log likelihood NA 83,047.30 NA NA 116,326.57 NA
Pseudo R square (Nagelkarke) NA 0.336 NA NA 0.27 NA Number of women 22.9 104,370 104,452 33.4 113,606 116,268
Paul & Chellan Impact of Janani Suraksha Yojana on Institutional Delivery
South East Asia Journal of Public Health 2013;3(2):4-18
motivation by ASHA has significant impact on increase
of institutional delivery in EAG states. Community
participation through the community member must have
significant impact on increase in institutional delivery.
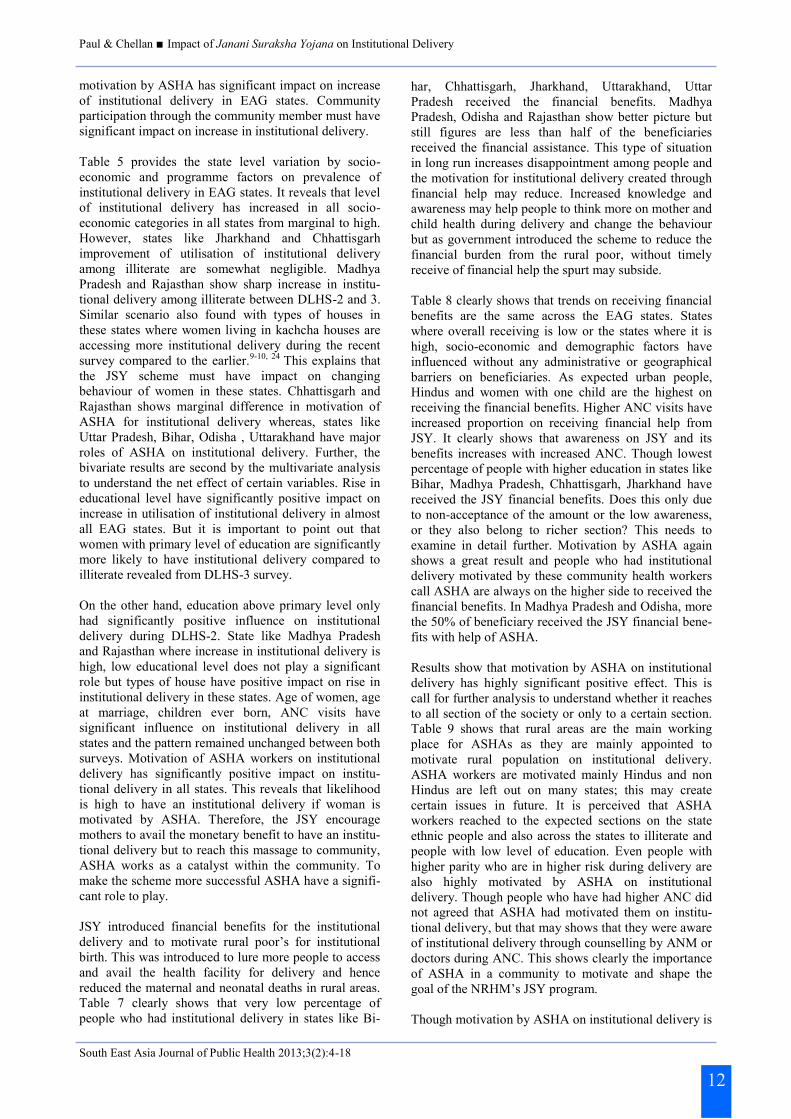
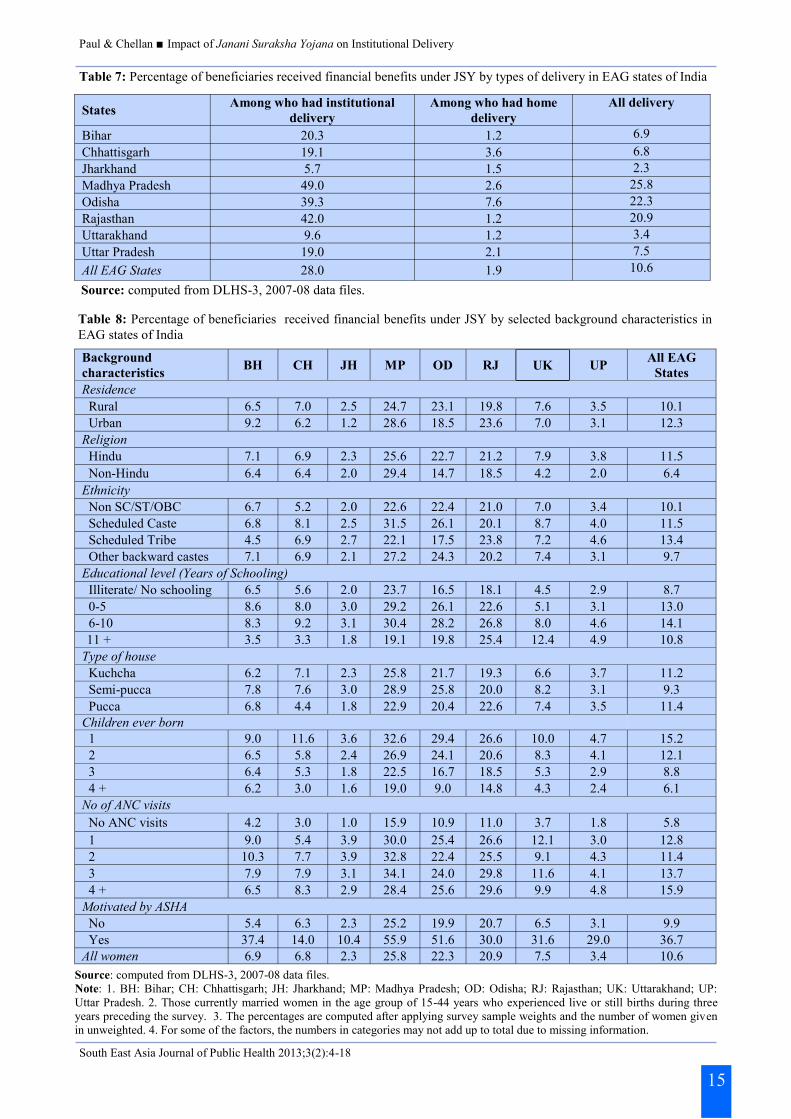
Table 5 provides the state level variation by socio-
economic and programme factors on prevalence of
institutional delivery in EAG states. It reveals that level
of institutional delivery has increased in all socio-
economic categories in all states from marginal to high.
However, states like Jharkhand and Chhattisgarh
improvement of utilisation of institutional delivery
among illiterate are somewhat negligible. Madhya
Pradesh and Rajasthan show sharp increase in institu-
tional delivery among illiterate between DLHS-2 and 3.
Similar scenario also found with types of houses in
these states where women living in kachcha houses are
accessing more institutional delivery during the recent
survey compared to the earlier.9-10, 24 This explains that
the JSY scheme must have impact on changing
behaviour of women in these states. Chhattisgarh and
Rajasthan shows marginal difference in motivation of
ASHA for institutional delivery whereas, states like
Uttar Pradesh, Bihar, Odisha , Uttarakhand have major
roles of ASHA on institutional delivery. Further, the
bivariate results are second by the multivariate analysis
to understand the net effect of certain variables. Rise in
educational level have significantly positive impact on
increase in utilisation of institutional delivery in almost
all EAG states. But it is important to point out that
women with primary level of education are significantly
more likely to have institutional delivery compared to
illiterate revealed from DLHS-3 survey.
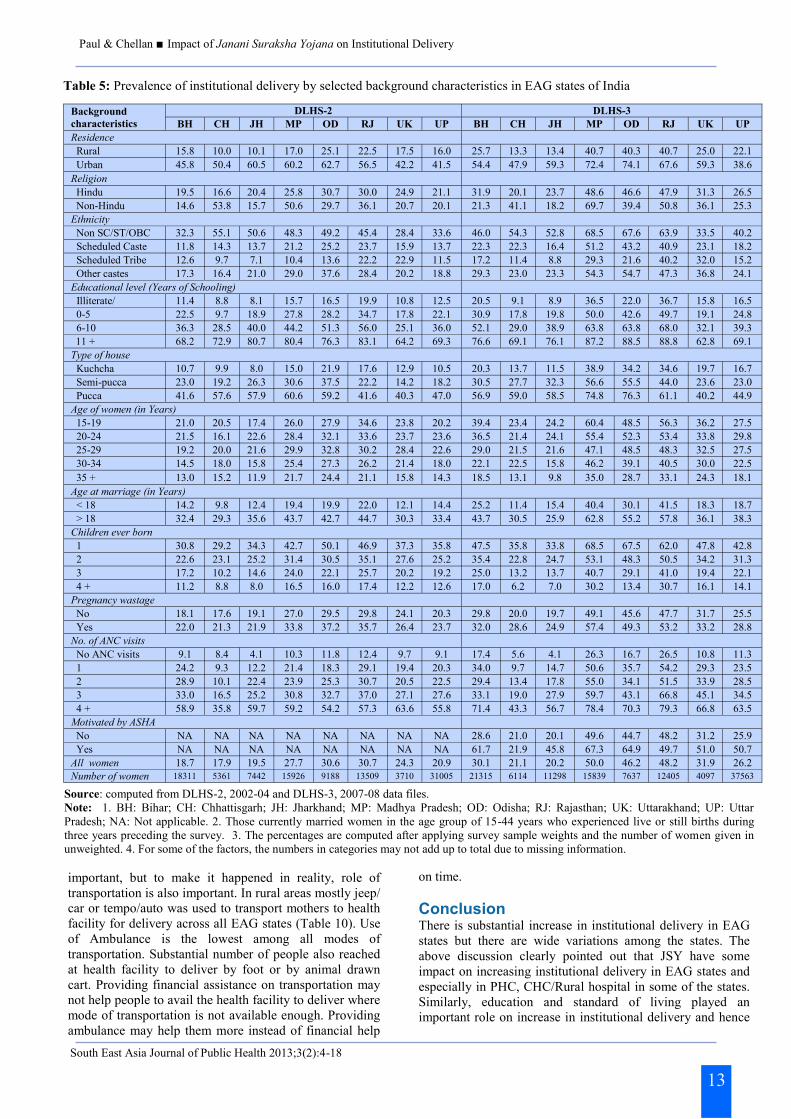
On the other hand, education above primary level only
had significantly positive influence on institutional
delivery during DLHS-2. State like Madhya Pradesh
and Rajasthan where increase in institutional delivery is
high, low educational level does not play a significant
role but types of house have positive impact on rise in
institutional delivery in these states. Age of women, age
at marriage, children ever born, ANC visits have
significant influence on institutional delivery in all
states and the pattern remained unchanged between both
surveys. Motivation of ASHA workers on institutional
delivery has significantly positive impact on institu-
tional delivery in all states. This reveals that likelihood
is high to have an institutional delivery if woman is
motivated by ASHA. Therefore, the JSY encourage
mothers to avail the monetary benefit to have an institu-
tional delivery but to reach this massage to community,
ASHA works as a catalyst within the community. To
make the scheme more successful ASHA have a signifi-
cant role to play.
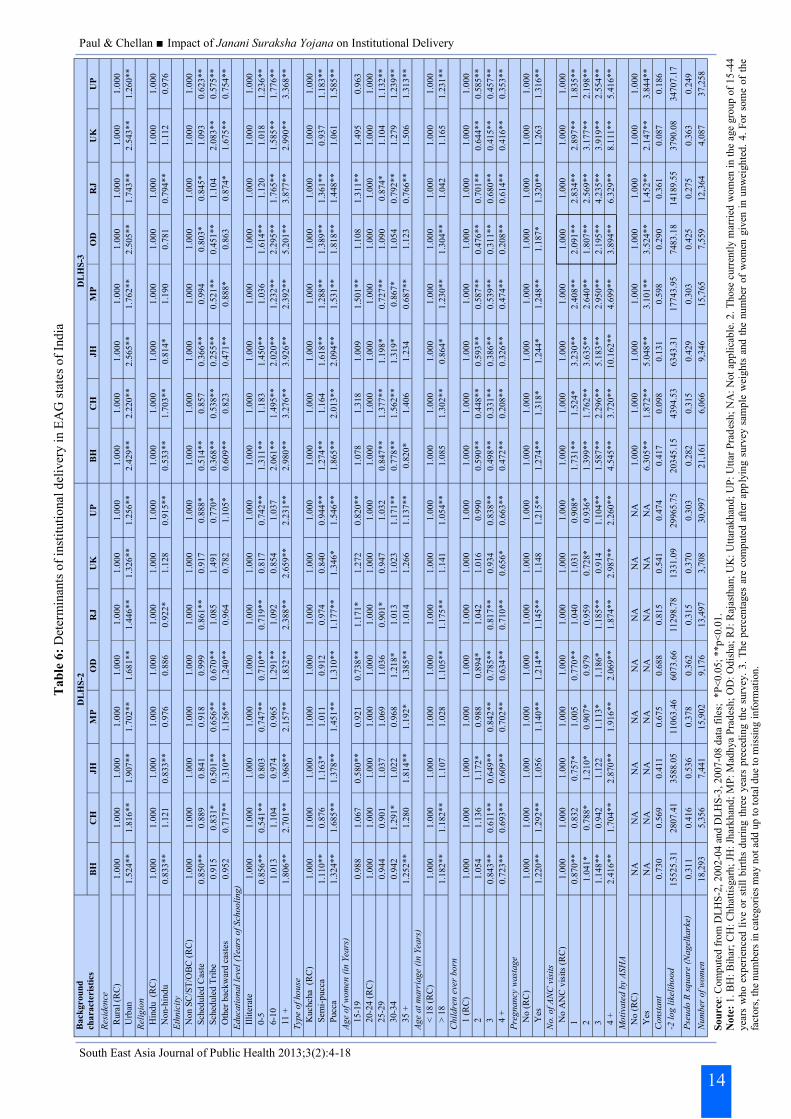
JSY introduced financial benefits for the institutional
delivery and to motivate rural poor’s for institutional
birth. This was introduced to lure more people to access
and avail the health facility for delivery and hence
reduced the maternal and neonatal deaths in rural areas.
Table 7 clearly shows that very low percentage of
people who had institutional delivery in states like Bi-
har, Chhattisgarh, Jharkhand, Uttarakhand, Uttar
Pradesh received the financial benefits. Madhya
Pradesh, Odisha and Rajasthan show better picture but
still figures are less than half of the beneficiaries
received the financial assistance. This type of situation
in long run increases disappointment among people and
the motivation for institutional delivery created through
financial help may reduce. Increased knowledge and
awareness may help people to think more on mother and
child health during delivery and change the behaviour
but as government introduced the scheme to reduce the
financial burden from the rural poor, without timely
receive of financial help the spurt may subside.
Table 8 clearly shows that trends on receiving financial
benefits are the same across the EAG states. States
where overall receiving is low or the states where it is
high, socio-economic and demographic factors have
influenced without any administrative or geographical
barriers on beneficiaries. As expected urban people,
Hindus and women with one child are the highest on
receiving the financial benefits. Higher ANC visits have
increased proportion on receiving financial help from
JSY. It clearly shows that awareness on JSY and its
benefits increases with increased ANC. Though lowest
percentage of people with higher education in states like
Bihar, Madhya Pradesh, Chhattisgarh, Jharkhand have
received the JSY financial benefits. Does this only due
to non-acceptance of the amount or the low awareness,
or they also belong to richer section? This needs to
examine in detail further. Motivation by ASHA again
shows a great result and people who had institutional
delivery motivated by these community health workers
call ASHA are always on the higher side to received the
financial benefits. In Madhya Pradesh and Odisha, more
the 50% of beneficiary received the JSY financial bene-
fits with help of ASHA.
Results show that motivation by ASHA on institutional
delivery has highly significant positive effect. This is
call for further analysis to understand whether it reaches
to all section of the society or only to a certain section.
Table 9 shows that rural areas are the main working
place for ASHAs as they are mainly appointed to
motivate rural population on institutional delivery.
ASHA workers are motivated mainly Hindus and non
Hindus are left out on many states; this may create
certain issues in future. It is perceived that ASHA
workers reached to the expected sections on the state
ethnic people and also across the states to illiterate and
people with low level of education. Even people with
higher parity who are in higher risk during delivery are
also highly motivated by ASHA on institutional
delivery. Though people who have had higher ANC did
not agreed that ASHA had motivated them on institu-
tional delivery, but that may shows that they were aware
of institutional delivery through counselling by ANM or
doctors during ANC. This shows clearly the importance
of ASHA in a community to motivate and shape the
goal of the NRHM’s JSY program.
Though motivation by ASHA on institutional delivery is
12
Paul & Chellan Impact of Janani Suraksha Yojana on Institutional Delivery
South East Asia Journal of Public Health 2013;3(2):4-18
13
Table 5: Prevalence of institutional delivery by selected background characteristics in EAG states of India
Source: computed from DLHS-2, 2002-04 and DLHS-3, 2007-08 data files.
Note: 1. BH: Bihar; CH: Chhattisgarh; JH: Jharkhand; MP: Madhya Pradesh; OD: Odisha; RJ: Rajasthan; UK: Uttarakhand; UP: Uttar
Pradesh; NA: Not applicable. 2. Those currently married women in the age group of 15-44 years who experienced live or still births during
three years preceding the survey. 3. The percentages are computed after applying survey sample weights and the number of women given in
unweighted. 4. For some of the factors, the numbers in categories may not add up to total due to missing information.
Background
characteristics DLHS-2 DLHS-3
BH CH JH MP OD RJ UK UP BH CH JH MP OD RJ UK UP Residence Rural 15.8 10.0 10.1 17.0 25.1 22.5 17.5 16.0 25.7 13.3 13.4 40.7 40.3 40.7 25.0 22.1 Urban 45.8 50.4 60.5 60.2 62.7 56.5 42.2 41.5 54.4 47.9 59.3 72.4 74.1 67.6 59.3 38.6 Religion Hindu 19.5 16.6 20.4 25.8 30.7 30.0 24.9 21.1 31.9 20.1 23.7 48.6 46.6 47.9 31.3 26.5 Non-Hindu 14.6 53.8 15.7 50.6 29.7 36.1 20.7 20.1 21.3 41.1 18.2 69.7 39.4 50.8 36.1 25.3 Ethnicity Non SC/ST/OBC 32.3 55.1 50.6 48.3 49.2 45.4 28.4 33.6 46.0 54.3 52.8 68.5 67.6 63.9 33.5 40.2 Scheduled Caste 11.8 14.3 13.7 21.2 25.2 23.7 15.9 13.7 22.3 22.3 16.4 51.2 43.2 40.9 23.1 18.2 Scheduled Tribe 12.6 9.7 7.1 10.4 13.6 22.2 22.9 11.5 17.2 11.4 8.8 29.3 21.6 40.2 32.0 15.2 Other castes 17.3 16.4 21.0 29.0 37.6 28.4 20.2 18.8 29.3 23.0 23.3 54.3 54.7 47.3 36.8 24.1 Educational level (Years of Schooling) Illiterate/ 11.4 8.8 8.1 15.7 16.5 19.9 10.8 12.5 20.5 9.1 8.9 36.5 22.0 36.7 15.8 16.5 0-5 22.5 9.7 18.9 27.8 28.2 34.7 17.8 22.1 30.9 17.8 19.8 50.0 42.6 49.7 19.1 24.8 6-10 36.3 28.5 40.0 44.2 51.3 56.0 25.1 36.0 52.1 29.0 38.9 63.8 63.8 68.0 32.1 39.3 11 + 68.2 72.9 80.7 80.4 76.3 83.1 64.2 69.3 76.6 69.1 76.1 87.2 88.5 88.8 62.8 69.1
Type of house Kuchcha 10.7 9.9 8.0 15.0 21.9 17.6 12.9 10.5 20.3 13.7 11.5 38.9 34.2 34.6 19.7 16.7 Semi-pucca 23.0 19.2 26.3 30.6 37.5 22.2 14.2 18.2 30.5 27.7 32.3 56.6 55.5 44.0 23.6 23.0 Pucca 41.6 57.6 57.9 60.6 59.2 41.6 40.3 47.0 56.9 59.0 58.5 74.8 76.3 61.1 40.2 44.9 Age of women (in Years) 15-19 21.0 20.5 17.4 26.0 27.9 34.6 23.8 20.2 39.4 23.4 24.2 60.4 48.5 56.3 36.2 27.5 20-24 21.5 16.1 22.6 28.4 32.1 33.6 23.7 23.6 36.5 21.4 24.1 55.4 52.3 53.4 33.8 29.8 25-29 19.2 20.0 21.6 29.9 32.8 30.2 28.4 22.6 29.0 21.5 21.6 47.1 48.5 48.3 32.5 27.5 30-34 14.5 18.0 15.8 25.4 27.3 26.2 21.4 18.0 22.1 22.5 15.8 46.2 39.1 40.5 30.0 22.5 35 + 13.0 15.2 11.9 21.7 24.4 21.1 15.8 14.3 18.5 13.1 9.8 35.0 28.7 33.1 24.3 18.1 Age at marriage (in Years) < 18 14.2 9.8 12.4 19.4 19.9 22.0 12.1 14.4 25.2 11.4 15.4 40.4 30.1 41.5 18.3 18.7 > 18 32.4 29.3 35.6 43.7 42.7 44.7 30.3 33.4 43.7 30.5 25.9 62.8 55.2 57.8 36.1 38.3 Children ever born 1 30.8 29.2 34.3 42.7 50.1 46.9 37.3 35.8 47.5 35.8 33.8 68.5 67.5 62.0 47.8 42.8 2 22.6 23.1 25.2 31.4 30.5 35.1 27.6 25.2 35.4 22.8 24.7 53.1 48.3 50.5 34.2 31.3 3 17.2 10.2 14.6 24.0 22.1 25.7 20.2 19.2 25.0 13.2 13.7 40.7 29.1 41.0 19.4 22.1 4 + 11.2 8.8 8.0 16.5 16.0 17.4 12.2 12.6 17.0 6.2 7.0 30.2 13.4 30.7 16.1 14.1 Pregnancy wastage No 18.1 17.6 19.1 27.0 29.5 29.8 24.1 20.3 29.8 20.0 19.7 49.1 45.6 47.7 31.7 25.5 Yes 22.0 21.3 21.9 33.8 37.2 35.7 26.4 23.7 32.0 28.6 24.9 57.4 49.3 53.2 33.2 28.8 No. of ANC visits No ANC visits 9.1 8.4 4.1 10.3 11.8 12.4 9.7 9.1 17.4 5.6 4.1 26.3 16.7 26.5 10.8 11.3 1 24.2 9.3 12.2 21.4 18.3 29.1 19.4 20.3 34.0 9.7 14.7 50.6 35.7 54.2 29.3 23.5 2 28.9 10.1 22.4 23.9 25.3 30.7 20.5 22.5 29.4 13.4 17.8 55.0 34.1 51.5 33.9 28.5 3 33.0 16.5 25.2 30.8 32.7 37.0 27.1 27.6 33.1 19.0 27.9 59.7 43.1 66.8 45.1 34.5 4 + 58.9 35.8 59.7 59.2 54.2 57.3 63.6 55.8 71.4 43.3 56.7 78.4 70.3 79.3 66.8 63.5 Motivated by ASHA No NA NA NA NA NA NA NA NA 28.6 21.0 20.1 49.6 44.7 48.2 31.2 25.9
Yes NA NA NA NA NA NA NA NA 61.7 21.9 45.8 67.3 64.9 49.7 51.0 50.7
All women 18.7 17.9 19.5 27.7 30.6 30.7 24.3 20.9 30.1 21.1 20.2 50.0 46.2 48.2 31.9 26.2
Number of women 18311 5361 7442 15926 9188 13509 3710 31005 21315 6114 11298 15839 7637 12405 4097 37563
important, but to make it happened in reality, role of
transportation is also important. In rural areas mostly jeep/
car or tempo/auto was used to transport mothers to health
facility for delivery across all EAG states (Table 10). Use
of Ambulance is the lowest among all modes of
transportation. Substantial number of people also reached
at health facility to deliver by foot or by animal drawn
cart. Providing financial assistance on transportation may
not help people to avail the health facility to deliver where
mode of transportation is not available enough. Providing
ambulance may help them more instead of financial help
on time.
Conclusion There is substantial increase in institutional delivery in EAG
states but there are wide variations among the states. The
above discussion clearly pointed out that JSY have some
impact on increasing institutional delivery in EAG states and
especially in PHC, CHC/Rural hospital in some of the states.
Similarly, education and standard of living played an
important role on increase in institutional delivery and hence
Paul & Chellan Impact of Janani Suraksha Yojana on Institutional Delivery
South East Asia Journal of Public Health 2013;3(2):4-18
14
Ta
ble
6:
Det
erm
inan
ts o
f in
stit
uti
onal
del
iver
y i
n E
AG
sta
tes
of
Ind
ia
Ba
ck
gro
un
d
ch
ara
cte
ris
tics
D
LH
S-2
D
LH
S-3
B
H
CH
J
H
MP
OD
R
J
UK
U
P
BH
C
H
JH
M
P
OD
R
J
UK
U
P
Res
iden
ce
Rura
l (R
C)
1.0
00
1.0
00
1.0
00
1.0
00
1.0
00
1.0
00
1.0
00
1.0
00
1.0
00
1.0
00
1.0
00
1.0
00
1.0
00
1.0
00
1.0
00
1.0
00
U
rban
1.5
24
**
1.8
16
**
1.9
07
**
1.7
02
**
1.6
81
**
1.4
46
**
1.3
26
**
1.2
56
**
2.4
29
**
2.2
20
**
2.5
65
**
1.7
62
**
2.5
05
**
1.7
43
**
2.5
43
**
1.2
60
**
Rel
igio
n
Hin
du
(RC
) 1.0
00
1.0
00
1.0
00
1.0
00
1.0
00
1.0
00
1.0
00
1.0
00
1.0
00
1.0
00
1.0
00
1.0
00
1.0
00
1.0
00
1.0
00
1.0
00
N
on-h
ind
u
0.8
33
**
1.1
21
0.8
33
**
0.9
76
0.8
86
0.9
22
*
1.1
28
0.9
15
**
0.5
33
**
1.7
03
**
0.8
14
*
1.1
90
0.7
81
0.7
94
**
1.1
12
0.9
76
Eth
nic
ity
No
n S
C/S
T/O
BC
(R
C)
1.0
00
1.0
00
1.0
00
1.0
00
1.0
00
1.0
00
1.0
00
1.0
00
1.0
00
1.0
00
1.0
00
1.0
00
1.0
00
1.0
00
1.0
00
1.0
00
S
ched
ule
d C
aste
0.8
50
**
0.8
89
0.8
41
0.9
18
0.9
99
0.8
61
**
0.9
17
0.8
88
*
0.5
14
**
0.8
57
0.3
66
**
0.9
94
0.8
03
*
0.8
45
*
1.0
93
0.6
23
**
S
ched
ule
d T
rib
e 0.9
15
0.8
31
*
0.5
01
**
0.6
56
**
0.6
70
**
1.0
85
1.4
91
0.7
70
*
0.3
68
**
0.5
38
**
0.2
55
**
0.5
21
**
0.4
51
**
1.1
04
2.0
83
**
0.5
75
**
O
ther
bac
kw
ard
cas
tes
0.9
52
0.7
17
**
1.3
10
**
1.1
56
**
1.2
40
**
0.9
64
0.7
82
1.1
05
*
0.6
09
**
0.8
23
0.4
71
**
0.8
88
*
0.8
63
0.8
74
*
1.6
75
**
0.7
54
**
Ed
uca
tio
na
l le
vel
(Yea
rs o
f Sch
ooli
ng)
Illi
tera
te
1.0
00
1.0
00
1.0
00
1.0
00
1.0
00
1.0
00
1.0
00
1.0
00
1.0
00
1.0
00
1.0
00
1.0
00
1.0
00
1.0
00
1.0
00
1.0
00
0
-5
0.8
56
**
0.5
41
**
0.8
03
0.7
47
**
0.7
10
**
0.7
19
**
0.8
17
0.7
42
**
1.3
11
**
1.1
83
1.4
50
**
1.0
36
1.6
14
**
1.1
20
1.0
18
1.2
36
**
6
-10
1.0
13
1.1
04
0.9
74
0.9
65
1.2
91
**
1.0
92
0.8
54
1.0
37
2.0
61
**
1.4
95
**
2.0
20
**
1.2
32
**
2.2
95
**
1.7
65
**
1.5
85
**
1.7
76
**
11
+
1.8
06
**
2.7
01
**
1.9
68
**
2.1
57
**
1.8
32
**
2.3
88
**
2.6
59
**
2.2
31
**
2.9
80
**
3.2
76
**
3.9
26
**
2.3
92
**
5.2
01
**
3.8
77
**
2.9
90
**
3.3
68
**
Typ
e o
f h
ou
se
Kuchcha
(R
C)
1.0
00
1.0
00
1.0
00
1.0
00
1.0
00
1.0
00
1.0
00
1.0
00
1.0
00
1.0
00
1.0
00
1.0
00
1.0
00
1.0
00
1.0
00
1.0
00
S
emi-
pucc
a 1.1
10
**
0.8
76
1.1
63
*
1.0
11
0.9
12
0.9
74
0.8
40
0.9
44
**
1.2
74
**
1.1
64
1.6
18
**
1.2
88
**
1.3
89
**
1.3
61
**
0.9
37
1.1
83
**
P
ucc
a 1.3
24
**
1.6
85
**
1.3
78
**
1.4
51
**
1.3
10
**
1.1
77
**
1.3
46
*
1.5
46
**
1.8
65
**
2.0
13
**
2.0
94
**
1.5
31
**
1.8
18
**
1.4
48
**
1.0
61
1.5
85
**
Ag
e o
f w
om
en
(in
Yea
rs)
15-1
9
0.9
88
1.0
67
0.5
80
**
0.9
21
0.7
38
**
1.1
71
*
1.2
72
0.8
20
**
1.0
78
1.3
18
1.0
09
1.5
01
**
1.1
08
1.3
11
**
1.4
95
0.9
63
2
0-2
4 (
RC
) 1.0
00
1.0
00
1.0
00
1.0
00
1.0
00
1.0
00
1.0
00
1.0
00
1.0
00
1.0
00
1.0
00
1.0
00
1.0
00
1.0
00
1.0
00
1.0
00
2
5-2
9
0.9
44
0.9
01
1.0
37
1.0
69
1.0
36
0.9
01
*
0.9
47
1.0
32
0.8
47
**
1.3
77
**
1.1
98
*
0.7
27
**
1.0
90
0.8
74
*
1.1
04
1.1
32
**
3
0-3
4
0.9
42
1.2
91
*
1.0
22
0.9
68
1.2
18
*
1.0
13
1.0
23
1.1
71
**
0.7
78
**
1.5
62
**
1.3
19
*
0.8
67
*
1.0
54
0.7
92
**
1.2
79
1.2
39
**
3
5 +
1.2
52
**
1.2
80
1.8
14
**
1.1
92
*
1.3
85
**
1.0
14
1.2
66
1.1
37
**
0.8
20
*
1.4
06
1.2
34
0.6
87
**
1.1
23
0.7
66
**
1.5
06
1.3
13
**
Ag
e a
t m
arr
iag
e (i
n Y
ears
)
<
18
(R
C)
1.0
00
1.0
00
1.0
00
1.0
00
1.0
00
1.0
00
1.0
00
1.0
00
1.0
00
1.0
00
1.0
00
1.0
00
1.0
00
1.0
00
1.0
00
1.0
00
>
18
1.1
82
**
1.1
82
**
1.1
07
1.0
28
1.1
05
**
1.1
75
**
1.1
41
1.0
54
**
1.0
85
1.3
02
**
0.8
64
*
1.2
30
**
1.3
04
**
1.0
42
1.1
65
1.2
31
**
Ch
ild
ren
eve
r b
orn
1
(R
C)
1.0
00
1.0
00
1.0
00
1.0
00
1.0
00
1.0
00
1.0
00
1.0
00
1.0
00
1.0
00
1.0
00
1.0
00
1.0
00
1.0
00
1.0
00
1.0
00
2
1.0
54
1.1
36
1.1
72
*
0.9
88
0.8
94
*
1.0
42
1.0
16
0.9
90
0.5
90
**
0.4
48
**
0.5
93
**
0.5
87
**
0.4
76
**
0.7
01
**
0.6
44
**
0.5
85
**
3
0.8
43
**
0.6
11
**
0.6
49
**
0.8
42
**
0.7
85
**
0.8
17
**
0.9
34
0.8
38
**
0.4
98
**
0.3
31
**
0.3
86
**
0.5
39
**
0.3
11
**
0.6
80
**
0.4
15
**
0.4
57
**
4
+
0.7
23
**
0.6
93
**
0.6
09
**
0.7
02
**
0.6
34
**
0.7
10
**
0.6
56
*
0.6
63
**
0.4
72
**
0.2
08
**
0.3
26
**
0.4
74
**
0.2
08
**
0.6
14
**
0.4
16
**
0.3
53
**
Pre
gn
an
cy w
ast
ag
e
No
(R
C)
1.0
00
1.0
00
1.0
00
1.0
00
1.0
00
1.0
00
1.0
00
1.0
00
1.0
00
1.0
00
1.0
00
1.0
00
1.0
00
1.0
00
1.0
00
1.0
00
Y
es
1.2
20
**
1.2
92
**
1.0
56
1.1
40
**
1.2
14
**
1.1
45
**
1.1
48
1.2
15
**
1.2
74
**
1.3
18
*
1.2
44
*
1.2
48
**
1.1
87
*
1.3
20
**
1.2
63
1.3
16
**
No
. o
f A
NC
vis
its
No
AN
C v
isit
s (R
C)
1.0
00
1.0
00
1.0
00
1.0
00
1.0
00
1.0
00
1.0
00
1.0
00
1.0
00
1.0
00
1.0
00
1.0
00
1.0
00
1.0
00
1.0
00
1.0
00
1
0.8
70
**
0.8
32
0.7
57
*
1.0
05
0.7
70
**
1.0
40
1.0
31
0.9
08
*
1.7
31
**
1.5
24
*
3.2
30
**
2.4
08
**
2.0
91
**
2.8
34
**
2.8
97
**
1.8
35
**
2
1.0
41
*
0.7
88
*
1.2
10
*
0.9
07
*
0.9
79
0.9
59
0.7
28
*
0.9
36
*
1.3
99
**
1.7
62
**
3.6
35
**
2.6
40
**
1.8
07
**
2.5
69
**
3.1
77
**
2.1
98
**
3
1.1
48
**
0.9
42
1.1
22
1.1
13
*
1.1
86
*
1.1
85
**
0.9
14
1.1
04
**
1.5
87
**
2.2
96
**
5.1
83
**
2.9
50
**
2.1
95
**
4.2
35
**
3.9
19
**
2.5
54
**
4
+
2.4
16
**
1.7
04
**
2.8
70
**
1.9
16
**
2.0
69
**
1.8
74
**
2.9
87
**
2.2
60
**
4.5
45
**
3.7
20
**
10.1
62
**
4.6
99
**
3.8
94
**
6.3
29
**
8.1
11
**
5.4
16
**
Mo
tiva
ted
by
AS
HA
No
(R
C)
NA
N
A
NA
N
A
NA
N
A
NA
N
A
1.0
00
1.0
00
1.0
00
1.0
00
1.0
00
1.0
00
1.0
00
1.0
00
Y
es
NA
N
A
NA
N
A
NA
N
A
NA
N
A
6.3
05
**
1.8
72
**
5.0
48
**
3.1
01
**
3.5
24
**
1.4
52
**
2.1
47
**
3.8
44
**
Co
nst
an
t 0.7
30
0.5
69
0.4
11
0.6
75
0.6
88
0.8
15
0.5
41
0.4
74
0.4
17
0.0
98
0.1
31
0.5
98
0.2
90
0.3
61
0.0
87
0.1
86
-2 l
og
lik
elih
oo
d
15525.3
1
2807.4
1
35
88
.05
1
10
63
.46
6
07
3.6
6
11
29
8.7
8
13
31
.09
2
99
65
.75
2
03
45
.15
4394.5
3
6343.3
1
17743.9
5
7483.1
8
14189.5
5
3790.0
8
34707.1
7
Pse
ud
o R
sq
ua
re (
Na
gel
kark
e)
0.3
11
0.4
16
0.5
36
0.3
78
0.3
62
0.3
15
0.3
70
0.3
03
0.2
82
0.3
15
0.4
29
0.3
03
0.4
25
0.2
75
0.3
63
0.2
49
Nu
mb
er o
f w
om
en
18,2
93
5,3
56
7,4
41
15
,90
2
9,1
76
13
,49
7
3,7
08
30
,99
7
21
,16
1
6,0
66
9,3
46
15,7
65
7,5
59
12,3
64
4,0
87
37,2
58
So
urce
: C
om
pute
d f
rom
DL
HS
-2,
200
2-0
4 a
nd
DL
HS
-3,
2007
-08
dat
a fi
les;
*P
<0
.05
; **p<
0.0
1.
No
te:
1.
BH
: B
ihar
; C
H:
Ch
hat
tisg
arh
; JH
: Jh
arkh
and
; M
P:
Mad
hya
Pra
des
h;
OD
: O
dis
ha;
RJ:
Raj
asth
an;
UK
: U
ttar
akh
and;
UP
: U
ttar
Pra
des
h;
NA
: N
ot
app
lica
ble
. 2
. T
hose
cu
rren
tly m
arri
ed w
om
en i
n t
he
age
gro
up
of
15
-44
yea
rs w
ho e
xp
erie
nce
d l
ive
or
stil
l b
irth
s du
rin
g t
hre
e yea
rs p
rece
din
g t
he
surv
ey.
3.
Th
e p
erce
nta
ges
are
com
pute
d a
fter
app
lyin
g s
urv
ey s
amp
le w
eigh
ts a
nd
th
e nu
mb
er o
f w
om
en g
iven
in
un
wei
gh
ted
. 4
. F
or
som
e of
the
fact
ors
, th
e n
um
ber
s in
cat
egori
es m
ay n
ot
add
up
to t
ota
l d
ue
to m
issi
ng i
nfo
rmat
ion
.
Paul & Chellan Impact of Janani Suraksha Yojana on Institutional Delivery
South East Asia Journal of Public Health 2013;3(2):4-18
15
Table 7: Percentage of beneficiaries received financial benefits under JSY by types of delivery in EAG states of India
States Among who had institutional
delivery
Among who had home
delivery
All delivery
Bihar 20.3 1.2 6.9
Chhattisgarh 19.1 3.6 6.8
Jharkhand 5.7 1.5 2.3
Madhya Pradesh 49.0 2.6 25.8
Odisha 39.3 7.6 22.3
Rajasthan 42.0 1.2 20.9
Uttarakhand 9.6 1.2 3.4
Uttar Pradesh 19.0 2.1 7.5
All EAG States 28.0 1.9 10.6
Background
characteristics BH CH JH MP OD RJ UK UP
All EAG
States
Residence
Rural 6.5 7.0 2.5 24.7 23.1 19.8 7.6 3.5 10.1
Urban 9.2 6.2 1.2 28.6 18.5 23.6 7.0 3.1 12.3
Religion
Hindu 7.1 6.9 2.3 25.6 22.7 21.2 7.9 3.8 11.5
Non-Hindu 6.4 6.4 2.0 29.4 14.7 18.5 4.2 2.0 6.4
Ethnicity
Non SC/ST/OBC 6.7 5.2 2.0 22.6 22.4 21.0 7.0 3.4 10.1
Scheduled Caste 6.8 8.1 2.5 31.5 26.1 20.1 8.7 4.0 11.5
Scheduled Tribe 4.5 6.9 2.7 22.1 17.5 23.8 7.2 4.6 13.4
Other backward castes 7.1 6.9 2.1 27.2 24.3 20.2 7.4 3.1 9.7
Educational level (Years of Schooling)
Illiterate/ No schooling 6.5 5.6 2.0 23.7 16.5 18.1 4.5 2.9 8.7
0-5 8.6 8.0 3.0 29.2 26.1 22.6 5.1 3.1 13.0
6-10 8.3 9.2 3.1 30.4 28.2 26.8 8.0 4.6 14.1
11 + 3.5 3.3 1.8 19.1 19.8 25.4 12.4 4.9 10.8
Type of house
Kuchcha 6.2 7.1 2.3 25.8 21.7 19.3 6.6 3.7 11.2
Semi-pucca 7.8 7.6 3.0 28.9 25.8 20.0 8.2 3.1 9.3
Pucca 6.8 4.4 1.8 22.9 20.4 22.6 7.4 3.5 11.4
Children ever born
1 9.0 11.6 3.6 32.6 29.4 26.6 10.0 4.7 15.2
2 6.5 5.8 2.4 26.9 24.1 20.6 8.3 4.1 12.1
3 6.4 5.3 1.8 22.5 16.7 18.5 5.3 2.9 8.8
4 + 6.2 3.0 1.6 19.0 9.0 14.8 4.3 2.4 6.1
No of ANC visits
No ANC visits 4.2 3.0 1.0 15.9 10.9 11.0 3.7 1.8 5.8
1 9.0 5.4 3.9 30.0 25.4 26.6 12.1 3.0 12.8
2 10.3 7.7 3.9 32.8 22.4 25.5 9.1 4.3 11.4
3 7.9 7.9 3.1 34.1 24.0 29.8 11.6 4.1 13.7
4 + 6.5 8.3 2.9 28.4 25.6 29.6 9.9 4.8 15.9
Motivated by ASHA
No 5.4 6.3 2.3 25.2 19.9 20.7 6.5 3.1 9.9
Yes 37.4 14.0 10.4 55.9 51.6 30.0 31.6 29.0 36.7
All women 6.9 6.8 2.3 25.8 22.3 20.9 7.5 3.4 10.6
Source: computed from DLHS-3, 2007-08 data files.
Table 8: Percentage of beneficiaries received financial benefits under JSY by selected background characteristics in
EAG states of India
Source: computed from DLHS-3, 2007-08 data files.
Note: 1. BH: Bihar; CH: Chhattisgarh; JH: Jharkhand; MP: Madhya Pradesh; OD: Odisha; RJ: Rajasthan; UK: Uttarakhand; UP:
Uttar Pradesh. 2. Those currently married women in the age group of 15-44 years who experienced live or still births during three
years preceding the survey. 3. The percentages are computed after applying survey sample weights and the number of women given
in unweighted. 4. For some of the factors, the numbers in categories may not add up to total due to missing information.

Paul & Chellan Impact of Janani Suraksha Yojana on Institutional Delivery
South East Asia Journal of Public Health 2013;3(2):4-18
16
Table 9: Percentage of women motivated by ASHA for institutional delivery by selected background characteristics
among who had institutional delivery in EAG states of India
Source: computed from DLHS-3, 2007-08 data files.
Note: 1. BH: Bihar; CH: Chhattisgarh; JH: Jharkhand; MP: Madhya Pradesh; OD: Odisha; RJ: Rajasthan; UK: Uttarakhand; UP: Uttar
Pradesh. 2. Those currently married women in the age group of 15-44 years who experienced live or still births during three years
preceding the survey.
Table 10: Percentage of women used different mode of transport to have institutional delivery in EAG states of India
Source: computed from DLHS-3, 2007-08 data files.
Note: 1. BH: Bihar; CH: Chhattisgarh; JH: Jharkhand; MP: Madhya Pradesh; OD: Odisha; RJ: Rajasthan; UK: Uttarakhand; UP: Uttar
Pradesh. 2. Those currently married women in the age group of 15-44 years who experienced live or still births during three years
preceding the survey. 3. The percentages are computed after applying survey sample weights and the number of women given in
unweighted. 4. For some of the factors, the numbers in categories may not add up to total due to missing information.
Background
characteristics BH CH JH MP OD RJ UK UP
All EAG
States
Residence
Rural 12.4 13.3 0.8 4.8 14.7 3.2 8.0 3.1 6.6
Urban 2.2 1.3 0.3 0.4 0.9 0.6 2.2 0.5 0.8
Religion
Hindu 9.5 7.4 0.4 3.1 11.0 2.3 6.3 2.6 4.8
Non-Hindu 9.9 3.6 1.5 1.2 7.9 1.3 3.3 0.8 2.6
Ethnicity
Non SC/ST/OBC 5.0 1.9 0.2 1.6 7.6 1.0 6.4 1.4 2.8
Scheduled Caste 15.1 5.6 0.9 2.4 12.5 3.5 8.5 4.5 6.5
Scheduled Tribe 3.3 14.7 1.5 7.4 17.6 3.2 6.1 4.2 7.6
Other castes 10.0 6.5 0.5 2.4 10.8 2.1 2.0 2.1 4.2
Educational level (Years of Schooling)
Illiterate 14.1 13.7 0.9 3.4 17.5 3.0 5.2 3.4 6.1
0-5 12.2 7.8 1.2 4.0 12.3 2.3 6.9 2.5 5.5
6-10 5.5 7.2 0.4 2.9 10.4 1.7 6.3 1.4 3.8
11 + 1.0 1.7 0.4 0.6 4.6 0.3 5.4 1.0 1.5
Type of house
Kuchcha 14.1 12.6 1.0 4.7 14.1 4.2 5.0 5.2 7.4
Semi-pucca 10.6 4.4 0.0 2.4 9.8 2.5 8.2 2.1 4.6
Pucca 3.6 0.6 0.5 0.7 6.8 1.2 5.4 0.8 1.9
Children ever born
1 7.3 5.6 0.7 2.6 8.5 2.1 5.6 2.1 3.9
2 6.5 6.3 0.4 2.7 11.6 2.3 6.0 1.9 4.0
3 11.8 9.7 0.9 3.4 15.9 2.1 7.0 2.5 5.2
4 + 16.0 14.1 0.6 3.7 14.4 2.6 3.0 2.5 6.0
No. of ANC visits
No ANC visits 9.0 11.1 0.6 3.1 8.5 2.6 3.7 1.7 4.1
1 11.2 11.4 4.0 5.3 13.0 2.5 18.4 1.5 5.8
2 16.7 12.9 0.8 3.9 16.0 2.6 10.1 3.2 6.3
3 9.5 9.9 0.4 3.3 12.3 2.7 4.8 1.9 4.7
4 + 2.7 3.9 0.4 1.4 8.9 1.2 4.1 1.2 2.8
All women 9.6 7.1 0.6 2.9 10.9 2.2 5.9 2.2 4.5
Mode of Transport BH CH JH MP OD RJ UK UP All EAG
States
Ambulance 1.7 3.1 2.2 2.2 3.3 0.6 2.4 0.5 1.6
Jeep/Car 25.6 45.3 38.3 29.6 40.3 54.9 56.1 32.7 36.7
Motor cycle/Scooter 4.5 11.5 9.4 16.1 4.7 9.4 9.1 11.5 10.3
Bus/Train 4.5 4.6 3.8 9.2 1.7 2.7 4.3 3.9 4.8
Tempo/Auto/Tractor 39.1 19.9 32.9 27.4 37.6 24.0 12.4 23.5 28.1
Animal drawn cart 7.0 0.7 3.5 2.6 0.2 1.2 4.6 5.8 3.7
Foot march 9.4 5.8 3.1 8.8 2.4 5.7 8.5 6.5 6.8
Other 8.3 9.1 6.9 4.2 9.8 1.6 2.6 15.4 8.1
Total 100.0 100.0 100.0 100.0 100.0 100.0 100.0 100.0 100.0
Number of women 5,906 1,100 2,006 7,450 3,369 5,642 1,232 9,248 35,953

Paul & Chellan Impact of Janani Suraksha Yojana on Institutional Delivery
South East Asia Journal of Public Health 2013;3(2):4-18
the benefits of the JSY scheme but states like Madhya
Pradesh, Rajasthan and Odisha where massive rise in
institutional delivery has been observed, these factors
failed to explain the totality. Motivation by ASHA for
institutional delivery came out as an important factor in
the study.
The study thus concludes that the JSY undoubtedly
contributed to a substantial improvement in
institutional delivery and increased pressure on the
public health system especially in PHC, CHC/rural
hospitals. Institutional delivery needs to be backed by
good quality of both basic Emergency Obstetric Care
(EmOC) and comprehensive emergency obstetric care.
Most of the EAG states are not fully equipped with
EmOC services. Even sometime lack of skilled human
resource makes C-section unavailable in rural setups.
Transport for referral is also a burning side of
accessing/utilizing institutional delivery. Moreover,
micro birth plan and birth preparedness are rare in rural
India. ASHA workers may provide support to mothers
on these with more hands on training.
It was obvious that each state in India has unique
characteristics even if we try to bring them under one
umbrella for programme point of view. The present
study came out with vivid description how each state
responded differently on the same JSY scheme. Health
is under state and centrally sponsor scheme like JSY
need special attention from state on implementation.
The utilisation of the scheme differs across the EAG
states and its impact on institutional delivery. Even the
receiving financial benefits under the JSY also vary
across the states. Moreover, people with different socio
-economic groups in these states responded differently
on institutional delivery after implementation of JSY.
The scheme was aimed to bring the marginalized and
poorer section of the community to forefront and
provide them the maternal health care through
promoting institutional delivery. But women belong to
SC/ST/OBC community are still not availing the ser-
vices in these states. This depicts that the scheme still
not reached to a particular section of the society for
which it meant for. The scheme offered safe delivery/
institutional delivery or BPL households and the study
shows that the JSY provided support to them. Madhya
Pradesh, Odisha, and Rajasthan have an impressive rise
in institutional delivery and also high percentage of
women received financial benefits through the JSY.
This should use as a model case and promote in other
states like Jharkhand and Chhattisgarh where
acceptance is low. Role of ASHA is very important in
this entire program. A person from community obvi-
ously influenced people more than any other channel of
media.
The paper clearly shows that ASHA workers are the
champions of the entire program to reach to this high
level of success. Many other progamatic factors
influence in success of a scheme in certain states and
further research may focus on more of programmatic
factors to understand the difference in utilization of the
JSY scheme in EAG states. Planned implementation of
programme through NRHM may help achieve the goals
of NPP 2000 and hence MDG-5.
References
1. World Health Organization. The World Health
Report 2003: Shaping the future. Geneva: World
Health Organization, 2003.
2. India, Registrar General. Special Bulletin on
Maternal Mortality in India 2007-09, Sample
Registration System. New Delhi: Ministry of
Home Affair, 2011.
3. International Institute for Population Sciences
(IIPS). District Level Households and Facility
Survey (DLHS-3), 2007-08: Mumbai: IIPS,
2010.
4. International Institute for Population Sciences
(IIPS). District Level Household Survey -
Reproductive and Child Health, 2002-04, India.
Mumbai: IIPS, 2006.
5. Ministry of Health and Family Welfare
(MOHFW). National Population Policy 2000.
New Delhi: Ministry of Health and Family
Welfare, 2000.
6. Ministry of Health and Family Welfare
(MOHFW). National Rural Health Mission
(2005-2012), Mission Document, Government of
India. New Delhi: Ministry of Health and Family
Welfare, 2005.
7. Ministry of Health and Family Welfare. Janani
Suraksha Yojana: features and frequently asked
questions and answers. New Delhi: Maternal
Health Division, Ministry of Health and Family
Welfare, Government of India, 2006.
8. Ministry of Health and Family Welfare
(MOHFW). Janani Suraksha Yojana: Guidelines
for Implementation, Government of India. New
Delhi: Ministry of Health and Family Welfare,
2005.
9. Lim SS, Dandona L, Hoisington JA, James SL,
Hogan MC, Gakidou E. India's Janani Suraksha
Yojana, a conditional cash transfer programme to
increase births in health facilities: an impact
evaluation. Lancet 2010; 375(9730):2009-23.
10. Kumari V, Dhawan D, Singh AR. Advantages as
perceived by the beneficiaries of Janani Suraksha
Yojana (JSY) in Bikaner district. J Dairying
Foods Home Sci 2009; 28 (3 & 4): 247-9.
11. Mehta P, Shubhra D. A Study on Awareness
about Janani Suraksha Yojana (JSY) among
Rural Women. https://www.socialtext.net/.../
Report%20of%20study%20on%20JSY.doc
(accessed Dec 2013)
17

Paul & Chellan Impact of Janani Suraksha Yojana on Institutional Delivery
South East Asia Journal of Public Health 2013;3(2):4-18
12. Deoki N, Shobha M, Tripathy RM, Poonam K,
Nair KS, Tekhre YL. A Rapid Appraisal on
Functioning of Janani Suraksha Yojana in South
Orissa. New Delhi: National Institute of Health
and Family Welfare, 2008.
13. International Institute for Population Sciences
and Macro International. National Family Health
Survey (NFHS-3), 2005-06: India: Volume 1,
Mumbai: IIPS, 2007.
14. International Institute for Population Sciences
and ORC Macro. National Family Health Survey
(NFHS-2), 1998-99: India, Mumbai: IIPS, 2000.
15. International Institute for Population Sciences.
National Family Health Survey (NFHS-1), 1992-
93: India, Mumbai: IIPS.1995.
16. International Institute for Population Sciences.
Rapid Household Survey - Reproductive and
Child Health (RHS-RCH-1&2), 1998-99, India,
Mumbai: IIPS, 2001.
17. Retherford RD, Choe MK. Statistical Model for
Causal Analysis. New York: John Wiley and
Sons, INC, 1993.
18. Kesterton AJ, Cleland J, Sloggett A, Ronsmans
C. Institutional delivery in rural India: the
relative importance of accessibility and eco-
nomic status. BMC Pregnancy Child-
birth 2010;10:30.
19. Paul L, Chellan R. Delivery Care for Scheduled
Tribe Women in India: A Disaggregated
Regional Analysis. Artha Vijnana 2009:LI(3):
297-314.
20. Gupta SK, Pal DK, Tiwari R, Garg R,
Shrivastava AK, Sarawagi R, Patil R, Agarwal L,
Gupta P, Lahariya C. Impact of Janani Suraksha
Yojana on institutional delivery rate and
maternal morbidity and mortality: an observa-
tional study in India. J Health Popul Nutr 2012;
30(4):464-71.
21. Sharma MP, Soni SC, Bhattacharya M, Datta U,
Gupta S, Nandan D. An assessment of
institutional deliveries under JSY at different
levels of health care in Jaipur District,
Rajasthan. Indian J Public Health 2009;53:177-
82.
22. Sugathan K, Mishra V, Retherford R. Promoting
Institutional Deliveries in Rural India: The Role
of Antenatal-Care Services. Mumbai, India:
International Institute for Population Sciences,
and Honolulu: East-West Center, Population and
Health Studies, USA, 2001.
23. Panja TK, Mukhopadhyay DK, Sinha N, Saren
AB, Sinhababu A, Biswas AB. Are institutional
deliveries promoted by Janani Suraksha Yojana
in a district of West Bengal, India? Indian J
Public Health 2012;56(1);69-72.
24. United Nations Population Fund (UNFPA).
Concurrent Assessment of Janani Suraksha
Yojana (JSY) in Selected States: Bihar, Madhya
Pradesh, Orissa, Rajasthan, Uttar Pradesh.
UNFPA: New Delhi, 2009.
18