subjects and their belongings (f. 55r). Indra Mantri orders them ...
Upload
khangminh22Category
view
3download
0
PERFORMANCE EVALUATION OF PRADHAN MANTRI FASAL BIMA YOJANA (PMFBY)PART II
“Uptake and Willingness-To-Pay”
Project Coordinator Ranjan Kumar Ghosh
Center for Management in Agriculture (CMA) Indian Institute of Management Ahmedabad (IIMA) Vastrapur, Ahmedabad – 380015
Supported by Ministry of Agriculture and Farmers Welfare, Government of India
FEBRUARY 2019


FINAL REPORT
PERFORMANCE EVALUATION OF PRADHAN MANTRI FASAL
BIMA YOJANA (PMFBY)
PART II
“Uptake and Willingness-To-Pay”
Project Coordinator Ranjan Kumar Ghosh
Center for Management in Agriculture (CMA) Indian Institute of Management Ahmedabad (IIMA)
Vastrapur, Ahmedabad – 380015
Supported by Ministry of Agriculture and Farmers Welfare
Government of India
FEBRUARY 2019


iii“Uptake and Willingness-To-Pay”
PERFORMANCE EVALUATION OF PRADHAN MANTRI FASAL BIMA YOJANA (PMFBY)
The study would not have become a reality without the Ministry of Agriculture and Farmers Welfare (MoA&FW), Government of India promptly accepting my proposal to evaluate the performance of Pradhan Mantri Fasal Bima Yojana (PMFBY). It also provided the necessary support under the aegis of the Agro-Economic Research (AER) system of the Department of Agriculture, Cooperation and Farmers Welfare (DAC&FW). My special thanks here to Prof. Vasant Gandhi, Chairperson, CMA (IIM-Ahmedabad) for facilitating the entire process, Mr. S.K. Pattanayak (Secretary, MoA&FW), Dr. Ashish Kumar Bhutani (Joint Secretary, MoA&FW and CEO, PMFBY) and Mr. P.C. Bodh (Adviser, DAC&FW) for the approval and support.
This was a coordinated study jointly conducted by nine state Agro-Economic Research Centers (AERCs) and without the complete dedication and involvement of each one of them, the task would have not proceeded one step beyond conceptualization. I am especially grateful to Prof. Vasant Gandhi (Chair, CMA) for his invaluable guidance throughout the project duration and leadership of the AER system. I wish to thank all the research and administrative staff of all the involved AERCs but especially Mr. Rakesh Kumar (MoA&FW); Dr. Brajesh Jha (IEG); Mr. Hasib Ahmad, Dr. H.C. Malviya and Prof. R.S. Singh (AERC Allahabad); Dr. Hari Om Sharma and Dr. Deepak Rathi (AERC Jabalpur); Dr. Ranjan Sinha and Dr. Basant Jha (AERC Bhagalpur); Dr. B.C. Roy, Dr. Ranjan Biswas, Dr. Bitan Mondal and Dr. Vivekananda Dutta (AERC Shantiniketan); Dr. Ranveer Singh, Dr. Nisha Devi and Ms. Vamika Darhel (AERC Shimla); Dr. S.S. Kalamkar, Dr. Mrutyunjay
Contributors and Acknowledgements

PERFORMANCE EVALUATION OF PRADHAN MANTRI FASAL BIMA YOJANA (PMFBY)
“Uptake and Willingness-To-Pay” iv
Swain and Ms. Kalpana Kapadia (AERC V.V Nagar); Dr. Sangeeta Shroff and Ms. Manasi Phadke (AERC Pune); Dr. I. Maruthi, Dr. Lenin Babu and Ms. Shweta B.G (ISEC Bangalore); and Dr. Anup Das and Dr. Jotin Bordoloi (AERC Jorhat).
I was fortunate to have a dedicated and highly motivated team at Centre for Management in Agriculture (CMA), IIM Ahmedabad. A special thanks to Ms. Nikita Tank for her enthusiastic, dedicated and high quality research support that made the finalization of the report possible in time. Mr. Umesh Yadav provided very timely support in collating dispersed information. I got prompt help whenever required from other CMA colleagues Mr. Divyansh Mathur, Mr. S. Pranav Rajan, Ms. Diana Frenchman, Ms. Nikita Pandey, Ms. Dipali Chauhan, Ms. Mini Nair and Ms. Viji Bejoy. The work benefited tremendously from support and guidance of CMA faculty Prof. Sukhpal Singh, Prof. Anil Gupta and Prof. Poornima Varma at all stages.
My thanks to the various stakeholders and experts in the field of crop insurance, especially all the officers at the state agricultural departments, executives of insurance companies and independent agricultural experts such as Mr. Malay Poddar (NIC), Dr. Patrick Ward, Ms. Vartika Singh, Dr. Berber Kramer and Shweta Gupta (IFPRI); Dr. S.K. Goel (Addl. Chief Secretary, Maharashtra); for sharing their expertise and knowledge. Needless to say, all the errors and omissions are solely my own. The analysis and views presented are personal and do not represent the position of supporting institutions IIM Ahmedabad or the Ministry of Agriculture & Farmers Welfare.
v“Uptake and Willingness-To-Pay”
PERFORMANCE EVALUATION OF PRADHAN MANTRI FASAL BIMA YOJANA (PMFBY)
- Executive Summary ix
Chapter 1 Introduction 1
Chapter 2 Socio-Economic and Farm-Level Characteristics 5
Chapter 3 Insurance Behavior 29
Chapter 4 Willingness-To-Pay 41
Chapter 5 Summary and Policy Insights 53
- References 59
Contents


vii“Uptake and Willingness-To-Pay”
PERFORMANCE EVALUATION OF PRADHAN MANTRI FASAL BIMA YOJANA (PMFBY)
List of TablesTable List of Tables Page
Chapter 2: Socio-Economic and Farm-Level Characteristics 5
Table 2.1a: Selected states 5
Table 2.1b: State-wise list of sampled districts based on uptake 6
Table 2.2: Farmer categories 6
Table 2.3: Family demography 7
Table 2.4: Socio-economic profile of farmers 8
Table 2.5: Caste distribution 9
Table 2.6: Agriculture as primary or secondary occupation 10
Table 2.7: Sources of non-agriculture income 12
Table 2.8: Sources of credit 14
Table 2.9a: Purpose of credit 15
Table 2.9b: Average quantum of credit 16
Table 2.10: State wise average irrigated and un-irrigated land details 18
Table 2.11: Cropping pattern: State wise percentages of the major crop distribution 19
Table 2.12: State wise cropping intensity and per household net operated area 20
Table 2.13: Overall coverage of the crop insurance for the Rabi and Kharif season 21
Table 2.14: State wise production per farm during Kharif season 24
Chapter 3: Insurance Behavior 29
Table 3.1: Awareness of PMFBY 29
Table 3.2: Availed any crop insurance scheme earlier 31
Table 3.3: Insured under PMFBY 33
Table 3.4: Medium of information 35
Table 3.5: Satisfaction level 36
Table 3.6: Overall experiences 38
Chapter 4: Willingness-To-Pay 41
Table 4.1: Attributes and attribute levels included in discrete choice experiment 46
Table 4.2: Descriptive statistics of sample households 48
Table 4.3: Utility function estimates from discrete choice experiment 50
List of FiguresFigure List of Figures Page
Chapter 4: Willingness-To-Pay 41
Figure 4.1 Example choice set 47


ix“Uptake and Willingness-To-Pay”
PERFORMANCE EVALUATION OF PRADHAN MANTRI FASAL BIMA YOJANA (PMFBY)
This report presents results from a primary survey conducted with a sample of farmers in nine Indian states that were covered under the Pradhan Mantri Fasal Bima Yojana (PMFBY) in the year 2017-18. These results give insights on various features of the sampled insured farmers such as their socio-economic characteristics, the farm-level features, their response and attitude towards insurance and also their willingness-to-pay for crop insurance. A stratified random sample of 1362 farmers was drawn from over 27 districts of 9 states - Assam, Bihar, Gujarat, Himachal Pradesh, Maharashtra, West Bengal, Karnataka and Madhya Pradesh. Nearly 80% of the sampled farmers were enrolled/insured under PMFBY at least once during 2015-17. The mean agricultural income was Rs. 1, 36,187 whereas the mean non-agricultural income was Rs. 1,21,554. The mean net operated irrigated area was 3.54 acres and unirrigated was 2.53 acres. The highest mean agricultural incomes of insured farmers were in the states of Himachal Pradesh, Madhya Pradesh and Gujarat. Non-agricultural income was higher than agricultural income, on an average, in the states of Madhya Pradesh, Karnataka, West Bengal, Maharashtra and Gujarat.
Average outstanding loans were highest in the states of Karnataka, Maharashtra and Himachal Pradesh. In Bihar, we could not get farmers to provide data with clarity. Net operated irrigated area per farmer is highest in the states of Madhya Pradesh and Gujarat. In the states of Assam and Himachal Pradesh, unirrigated area is higher on average than irrigated. Every surveyed farmer was also asked about their perceptions about crop insurance and experiences with PMFBY. In Assam, Himachal Pradesh and Uttar Pradesh, over 95% of the loanee insured farmers had heard of PMFBY whereas in West Bengal and Gujarat, less than 75% of farmers were aware of PMFBY. In Karnataka, while none of the non-loanee farmers had availed of the previous insurance schemes like NAIS, nearly 72 percent of the loanee farmers had availed crop insurance at some point in the past. Among non-insured control group farmers in Karnataka, all had availed of the previous NAIS scheme. On the other hand, in Gujarat, among the loanee farmers, 70 percent had availed of previous schemes, and among the non-loanee farmers, 100
Executive Summary

PERFORMANCE EVALUATION OF PRADHAN MANTRI FASAL BIMA YOJANA (PMFBY)
“Uptake and Willingness-To-Pay” x
percent had availed previous schemes. In Madhya Pradesh, respondents suggested that there should be higher as well as timely compensation in order to improve the scheme, while a few others suggested that the premiums should be lower. In West Bengal, the respondents surveyed suggested that the awareness must be increased among the farmers and that the panchayat should play a leading role. In Gujarat, while all the loanee farmers informed the concerned insurance companies about their individual losses, all the non-loanee farmers informed about the loss to the government. While 53 percent of the loanee and 72 percent of the non-loanee farmers in Madhya Pradesh reported their losses to the government, 47 percent of the loanee and 27 percent of the non-loanee farmers reported their losses to the concerned banks.
The Willingness-to-Pay (WTP) study focused on the assessment of the demand for agriculture insurance using Discrete Choice Experiments (DCE’s), a form of stated choice analysis in which preferences are sought from participants based on responses to hypothetical scenarios rather than observed choices in actual market settings. It allows studying preferences for specific characteristics or attributes of an insurance product – in an experimental setting – by controlling product attributes. The specific attributes for which farmer’s preferences were analyzed included insurance coverage period, the method of loss assessment, the delivery of insurance payments, the sum insured, and the cost of insurance. For example, under PMFBY, insurance covers the entire period from pre-sowing until after harvest. Other alternatives could include only the period from sowing until harvest, or merely pre-sowing or post-harvest. Choice sets were translated in local languages (Hindi for Uttar Pradesh and Himachal Pradesh, Kannada for Karnataka and Gujarati for Gujarat) to ensure respondents could read and interpret the choice sets with aid from the enumerators.
Results from analyzing farmers’ selections of the choice sets indicate that they value full coverage very highly. Farmers would require significant discounts for policies covering only the pre-sowing and only the post-harvest periods. Additionally, farmers would require a smaller discount for policies covering only the period from sowing to harvest, so it seems clear that farmers perceive some risks of crop loss due to sources apart from just rainfall (which presumably would be covered by a sowing to harvest policy). Farmers would require discounts for policies in which the method of assessment was either remote sensing or rainfall indices. In principle, giving such discounts would be more cost-effective than going for the very costly manual CCEs. Farmers are willing-to-pay a significantly higher premium for insurance if they believe that payments would be timely (i.e., guaranteed within six weeks of loss assessment). With other potential methods of loss assessment available that could speed up the turnaround time, it may be possible for insurance providers to guarantee more timely insurance payments. This way, they will gain a greater market and make up for the loss due to offering discounts. Overall, farmers are willing-to-pay significantly higher premiums. On an average, farmers would be willing to pay nearly a 10 percent premium for a policy similar to PMFBY, much higher than the present rates, indicating a generally high acceptance for crop insurance products.
1“Uptake and Willingness-To-Pay”
1.1. PMFBY: OverviewPradhan Mantri Fasal Bima Yojana (PMFBY) is one of the world’s largest crop insurance programs aimed at providing risk cover to Indian farmers from production vulnerabilities. It was launched in early 2016 with the key feature being a highly subsidized and affordable premium for farmers. Under PMFBY, farmers pay a very low premium of maximum 2% during Kharif sowing, 1.5% during Rabi sowing for food and oilseed crops, whereas for annual commercial crops they have to pay a maximum of 5%. The difference between actuarial premium rates and the farmer rates is shared equally between the Central and the State governments. PMFBY has replaced the previously existing schemes of National Agricultural Insurance Scheme (NAIS) as well as the modified NAIS. All farmers that avail of seasonal crop loans (loanee farmers) are by default expected to be included in the PMFBY scheme whereas other farmers can purchase the insurance voluntarily at similar net premium burden. Different types of important risks such as yield losses due to climatic factors, damages from pests and post-harvest losses, among others are covered under this scheme. The scheme is implemented on an ‘area approach’ where insured unit is usually the village panchayat level for major crops.
As of the latest available figures, close to 5 crore farmers were enrolled in the year 2017-18 for both the Kharif and Rabi seasons. This is a jump of nearly 40% from the year 2015 when earlier insurance schemes were present. It has been projected that these numbers will significantly increase with every season as farmers across the world have shown to have a strong aversion to production related risks. The promise of this increased coverage will depend on the successful implementation of the program that can be judged by some important parameters such as: increase in voluntary take-up by non-loanee farmers, claims to premium ratio, and a viable business model for insurance agencies. The attractiveness of the scheme for the two important stakeholders, farmers
Introduction
Chapter 1
PERFORMANCE EVALUATION OF PRADHAN MANTRI FASAL BIMA YOJANA (PMFBY)
“Uptake and Willingness-To-Pay” 2
and insurance providers, however, depends on accuracy of yield assessment and timeliness of delivery as only these can ensure equity and efficiency. This hinges on the governance structure of the scheme’s implementation – the bureaucratic apparatus and the level of stakeholder engagement.
In this context, we select 9 states of Assam, Bihar, Gujarat, Himachal Pradesh, Karnataka, Madhya Pradesh, Maharashtra, Uttar Pradesh and West Bengal to achieve the three following objectives:
Assess the status of PMFBY implementation for both Kharif and Rabi seasons in the years 2017-18 and 2016-17, beginning from the processes of crop notification, insurance company empanelment, premium calculation, yield assessment to claims disbursement.
Study the characteristics of sampled farming households that are beneficiaries of PMFBY, both loanee and non-loanee and to assess the factors that can lead to better uptake of crop insurance
To find the Willingness-to-Pay (WTP) for crop insurance under Indian conditions through controlled choice experiments with a randomized sample of households.
1.2. Study Design For Objective 1 – Governance Analysis – the process of implementation at the state level was comprehensively mapped with the assistance of nine states Agro-Economic Research Centers (AERCs) involved in the project. The study involved mixed methods of data collection and involved the use of secondary data, as well as collection of primary stakeholder interviews. The tools included directed and open-ended questions to relevant state authority, insurance company or nodal agencies. AERCs approached state level nodal agencies/authorities responsible for PMFBY. These include the State Department of Agriculture, State Statistics Department, State Level Coordination Committee on Crop Insurance (SLCCCI), District Level Technical Committee (DLTC) or any other relevant body. The objective was to gather information on the functions of the contacted agencies, details of banks and insurance companies involved in the concerned districts and district-wise progress report of the PMFBY for Kharif 2016 and Rabi 2017 in the particular state. For the year 2017-18, available state level data was used.
For Objective 2 – Uptake Analysis – the process involved understanding what factors promote or dissuade farmers from enrolling under PMFBY, what are the other risk management strategies that farmers have and what are the reasons behind farmers opting for each of them. The study relied on a primary survey questionnaire. A total of 1,350 farmers across all the nine states were surveyed based on random sampling. AERCs sampled roughly 150 farmers across three districts of each state. These three districts were categorized based on the number of farmers and area insured, and each category and each district had a sample size of 50 farmers. No district with zero loanee

3“Uptake and Willingness-To-Pay”
PERFORMANCE EVALUATION OF PRADHAN MANTRI FASAL BIMA YOJANA (PMFBY)
farmers were selected. A low uptake district was that which had lowest number of loanee and non-loanee farmers, a medium uptake district was the one with median number of farmers whereas a high uptake district had the highest number of farmers enrolled. Best attempts were made to sample on an average 30 loanee, 10 non-loanee and 10 uninsured farmers (control group) from each district.
For Objective 3 – Willingness-to-Pay (WTP) – the behavior of farmers with respect to awareness and uptake of crop insurance was investigated, and a detailed experiment on their choice preferences of various insurance policies was conducted. The experiments were performed in collaboration with International Food Policy Research Institute (IFPRI) in the four states of Gujarat, Himachal Pradesh, Karnataka and Uttar Pradesh, through enumerators of AERCs, using Computer Assisted Personal Interviewing (CAPI) tool. This involved use of electronic tablets in the process of data collection where surveys and experiments being conducted could be tracked in real-time at a centralized server base. A training workshop was conducted at Indian Agricultural Research Institute (IARI) – New Delhi with the objective of enabling the enumerators collect precise data in the prescribed manner for choice experiments. The choice experiments were conducted with a total of 575 individual farmers in a controlled ‘lab-in-the-field’ setting to collect the necessary data.
The present report discusses the data and result from Objective 2 and 3 of the study – Uptake and Willingness-to-Pay.


5“Uptake and Willingness-To-Pay”
PERFORMANCE EVALUATION OF PRADHAN MANTRI FASAL BIMA YOJANA (PMFBY)
IntroductionThis chapter describes the socio-economic background of the farmers surveyed in the various states. Socio-economic profile indicates information on the average age, years of schooling, caste, gender, occupation, family size and income of the various categories of the farmers.
2.1. Socio-economic characteristics of sampled households Table 2.1a: Selected states
State Districts Taluka/Tehsil Village Farmers per state
Assam 3 16 45 150
Bihar 3 3 6 155
Gujarat 3 4 22 150
Himachal Pradesh 3 3 56 150
Karnataka 3 14 41 150
Madhya Pradesh 3 8 49 150
Maharashtra 3 6 32 157
Uttar Pradesh 3 16 43 150
West Bengal 3 3 7 150
Total 27 73 301 1,362Source: Own compilation
Chapter 2
Socio-Economic and Farm-Level Characteristics

PERFORMANCE EVALUATION OF PRADHAN MANTRI FASAL BIMA YOJANA (PMFBY)
“Uptake and Willingness-To-Pay” 6
Table 2.1a provides the information related to survey conducted in the villages of the different states. The coverage of survey at village level was highest in the state of Madhya Pradesh, Assam, Uttar Pradesh and Karnataka.
Table 2.1b: State-wise list of sampled districts based on uptake
StateDistricts
High Uptake Medium Uptake Low Uptake
Assam Dhubri Goalpara Kamrup Metro
Bihar Samastipur Jamui Saharsa
Gujarat Rajkot Sabarkantha Vadodra
Himachal Pradesh Hamirpur Solan Shimla
Karnataka Bidar Kalaburgi Hassan
Madhya Pradesh Sagar Jabalpur Umaria
Maharashtra Jalna Amravati Pune
Uttar Pradesh Jhansi Hardoi Jaunpur
West Bengal Burdwan North 24 Pargana Dakshin DinajpurSource: Own compilation
Table 2.1b shows the districts where primary surveys were conducted to analyse the uptake behaviour of insured farmers. These were selected as high, low and medium uptake districts based on the number of farmers enrolled for PMFBY.
Table 2.2: Farmer categories
State/Farmers category Loanee insured farmers
Non-loanee insured farmers
Non-insured farmers (Control)
Overall sample
Assam 100 10 40 150
Bihar 124 0 31 155
Gujarat 110 10 30 150
Himachal Pradesh 89 31 30 150
Karnataka 90 30 30 150
Madhya Pradesh 90 30 30 150
Maharashtra 51 73 33 157
Uttar Pradesh 90 30 30 150
West Bengal 90 30 30 150
Sample All (N=1362) 834 244 284 1362Source: Own compilation

7“Uptake and Willingness-To-Pay”
PERFORMANCE EVALUATION OF PRADHAN MANTRI FASAL BIMA YOJANA (PMFBY)
The farmers have been classified into three categories i.e. Loanee Insured Farmers, Non- Loanee Insured farmers and Control Group. The details of the farmers related to the categories have been provided in the following table 2.2. The average number of the farmers surveyed from each state is nearly 150 including all the three categories.
Table 2.3: Family demography
States/Farmers category
Loanee insured farmers Non-loanee insured farmers Non-insured farmers (Control)
Average Family Size
Average of
Minors < 16
Years
Average Senior
Citizens < 59
Years
Average Family Size
Average of
Minors < 16
Years
Average Senior
Citizens < 59
Years
Average Family Size
Average of
Minors < 16
Years
Average Senior
Citizens < 59
Years
Assam 5 1.4 0.6 5.8 1.5 0.5 5.2 1.2 0.6
Bihar 6.4 3.2 0.1 NA NA NA 6.3 3.13 NA
Gujarat 5.6 1.1 1 4.8 0.4 0.7 5.5 1.2 0.8
Himachal Pradesh 5.2 1.2 0.7 5.6 1.2 0.7 5.5 1.3 0.8
Karnataka 6.0 2.3 1.5 6.5 2.3 1.4 6.1 2.1 1.6
Madhya Pradesh 6.1 1.5 0.6 7 2 0.7 7.3 2.5 0.6
Maharashtra 6.4 1.6 1 5.3 1.6 1 6.1 1.3 1
Uttar Pradesh 8.5 2.3 0.9 7.9 2.6 0.7 9.7 3.4 0.8
West Bengal 5.5 1.8 1.1 4.6 1.5 1.1 4.8 1.4 1.1
Average 6 1.8 0.8 6 1.8 0.8 6.2 1.9 0.8Source: Own compilation
Table 2.3 indicates the family profile of the farmers. The average family size was highest in Uttar Pradesh followed by Maharashtra, and Madhya Pradesh. The lowest average family size is in Himachal Pradesh. The results also indicate the level of dependency in the different states. The average minors’ dependents are highest in Bihar followed by Uttar Pradesh, Karnataka which are higher than the average. Though in Maharashtra the average size of the family is above the average, the minor dependency is lower in Maharashtra. Senior citizen dependency is highest in the state of Karnataka followed by west Bengal, Gujarat, Maharashtra and Uttar Pradesh. It is the lowest in Bihar’s loanee category. Similar demographic trend is followed in non-loanee insured and control group.

PERFORMANCE EVALUATION OF PRADHAN MANTRI FASAL BIMA YOJANA (PMFBY)
“Uptake and Willingness-To-Pay” 8
Tabl
e 2.
4: S
ocio
-eco
nom
ic p
rofil
e of
farm
ers
Stat
e
Loan
ee in
sure
d fa
rmer
sNo
n-lo
anee
insu
red
farm
ers
Non-
insu
red
farm
ers
(Con
trol)
Age
Year
s
Fam
ily
mem
bers
in
volv
ed in
Ag
ricul
ture
Agric
ultu
re
inco
me
(in
Rs.
)
Age
Year
s
Fam
ily
mem
bers
in
volv
ed in
Ag
ricul
ture
Agric
ultu
re
inco
me
(in R
s.)
Age
Year
s
Fam
ily
mem
bers
in
volv
ed in
Ag
ricul
ture
Agric
ultu
re in
com
e (in
Rs.
)
Assa
m42
.92.
356
,735
39.6
2.6
31,5
8641
.82.
341
,590
Biha
r46
.32.
158
,115
NANA
NA42
.42.
242
,498
Guja
rat
55.1
2.9
2,30
,973
54.8
3.5
1,20
,400
51.3
3.3
2,00
,666
Him
acha
l Pra
desh
53.8
33,
44,7
7855
.83.
24,
13,6
1649
.32.
73.
22,9
16
Karn
atak
a52
.51.
245
,356
51.3
1.2
32,2
6648
.61.
143
,533
Mad
hya
Prad
esh
47.3
2.5
3,48
,593
47.3
3.3
2,84
,122
45.8
2.9
1,84
,289
Mah
aras
htra
48.9
3.4
1,00
,959
48.4
2.8
1,15
,357
48.2
3.1
47,3
43
Utta
r Pra
desh
54.7
2.4
1,60
,449
52.6
2.1
93,2
2247
.53.
684
,478
Wes
t Ben
gal
531.
71,
26,5
8647
.21.
81,
24,9
5049
.61.
772
,213
Tota
l50
.52.
391,
63,6
1649
.63
2.56
1,51
,940
47.1
72.
5489
,576
Sour
ce: O
wn c
ompi
latio
n

9“Uptake and Willingness-To-Pay”
PERFORMANCE EVALUATION OF PRADHAN MANTRI FASAL BIMA YOJANA (PMFBY)
Table 2.4 shows the socio economic profile of farmers. The average age of surveyed farmers is highest in Gujarat, Uttar Pradesh, Himachal Pradesh and Karnataka respectively. Maharashtra has the largest number of family members engaged in the agriculture occupation followed by Himachal Pradesh. This explains the dependency of people on agriculture as their source of income and livelihood. The average annual income earned by the farmers is lowest in the state of Karnataka, Assam and Bihar. In Bihar the average family size is higher than the average but earn a very low annual income from their occupation. Madhya Pradesh, Himachal Pradesh and Gujarat are earning the highest amount from agriculture.
Table 2.5: Caste distribution
Farmer category Caste Assam Bihar Gujarat Himachal
Pradesh Karnataka Madhya Pradesh Maharashtra Uttar
PradeshWest
Bengal
Loanee insured
SC 9.33 5.84 4.67 10.00 10.00 2.67 1.91 5.33 12.00
ST 4.67 0.00 0.67 0.00 5.33 0.00 0.00 0.00 3.33
OBC 14.67 43.51 5.33 15.33 31.33 34.67 7.01 36.67 23.33
GEN 38.00 31.17 62.67 34.00 13.33 22.67 22.29 16.67 21.33
NA 0.00 0.00 0.00 0.00 0.00 0.00 2.00 2.00 0.00
Non loanee insured
SC 0.00 0.00 0.00 4.67 2.67 2.00 0.64 2.00 3.33
ST 0.67 0.00 0.00 0.00 1.33 0.00 0.64 0.00 3.33
OBC 1.33 0.00 5.33 4.67 11.33 11.33 11.46 14.67 8.67
GEN 4.67 0.00 1.33 11.33 4.67 6.67 32.48 3.33 4.67
NA 0.00 0.00 0.00 0.00 0.00 0.00 1.27 0.00 0.00
Non-insured (Control)
SC 2.00 2.60 0.00 4.67 0.67 0.67 1.91 0.00 5.33
ST 2.00 0.00 0.00 0.00 3.33 1.33 0.64 0.67 3.33
OBC 7.33 10.39 1.33 1.33 9.33 13.33 3.18 15.33 5.33
GEN 15.33 6.49 18.67 14.00 6.67 4.67 14.65 4.00 6.00
NA 0.00 0.00 0.00 0.00 0.00 0.00 0.64 0.00 0.00Source: Own compilation
It is clear from Table 2.5 that majority of the farmers insured are either from the General (GEN) or the Other Backward Class (OBC) than the Scheduled Castes (SC) or Scheduled Tribes (ST). Assam, Gujarat and Himachal Pradesh are the states where farmers from general category have received the benefit of the scheme. Whereas in the state of Bihar, Karnataka, Madhya Pradesh, Uttar Pradesh and West Bengal, OBCs have got the higher benefits from the schemes than other categories. It is also very evident from our results that the coverage of the scheme is very limited in case of STs. This provides a direction to the various agencies to reach out to farmers in these categories and help in making the schemes even more inclusive.

PERFORMANCE EVALUATION OF PRADHAN MANTRI FASAL BIMA YOJANA (PMFBY)
“Uptake and Willingness-To-Pay” 10
Tabl
e 2.
6: A
gric
ultu
re a
s pr
imar
y or
sec
onda
ry o
ccup
atio
n
Stat
esLo
anee
insu
red
farm
ers
No
n-lo
anee
in
sure
d fa
rmer
s
Non-
loan
ee
insu
red
farm
ers
(Con
trol)
Ov
eral
l Agr
i. as
Prim
ary
Occu
patio
n
Over
all A
gri.
as S
econ
dary
Oc
cupa
tion
Ag
ricul
ture
as
Prim
ary
sour
ce
Agric
ultu
re
as S
econ
dary
so
urce
Agric
ultu
re a
s Pr
imar
y so
urce
Agric
ultu
re
as S
econ
dary
so
urce
Agric
ultu
re a
s Pr
imar
y so
urce
Agric
ultu
re
as S
econ
dary
so
urce
Assa
m77
2310
029
1111
634
(5
1.3)
(15.
3)(6
.7)
(0.0
)(1
9.3)
(7.3
)(7
7.3)
(22.
7)Bi
har
105
170
023
712
824
(6
9.08
)(1
1.18
)(0
.00)
(0.0
0)(1
5.13
)(4
.61)
(84.
21)
(15.
79)
Guja
rat
108
29
129
014
63
(7
2.48
)(1
.34)
(6.0
4)(0
.67)
(19.
46)
(0.0
0)(9
7.99
)(2
.01)
Him
acha
l Pra
desh
3740
1515
1217
6472
(2
7.21
)(2
9.41
)(1
1.03
)(1
1.03
)(8
.82)
(12.
50)
(47.
06)
52.9
4Ka
rnat
aka
900
300
300
150
0
(60)
(0)
(20)
(0)
(20)
(0)
(100
)(0
)M
adhy
a Pr
ades
h90
330
226
514
610
(5
7.69
)(1
.92)
(19.
23)
(1.2
8)(1
6.67
)(3
.21)
(93.
59)
(6.4
1)M
ahar
asht
ra49
067
130
014
61
(3
3.33
)(0
.00)
(45.
58)
(0.6
8)(2
0.41
)(0
.00)
(99.
32)
(0.6
8)
Utta
r Pra
desh
7219
247
227
118
33(4
7.68
)(1
2.58
)(1
5.89
)(4
.64)
(14.
57)
(4.6
4)(7
8.15
)(2
1.85
)
Wes
t Ben
gal
855
300
291
144
6(5
6.67
)(3
.33)
(20.
00)
(0.0
0)(1
9.33
)(0
.67)
(96.
00)
(4.0
0)So
urce
: Own
com
pila
tion;
Fig
ures
in b
rack
ets
are
perc
enta
ges
11“Uptake and Willingness-To-Pay”
PERFORMANCE EVALUATION OF PRADHAN MANTRI FASAL BIMA YOJANA (PMFBY)
Table 2.6 gives a sense of the proportion of farmers having agriculture as primary and secondary occupation. As per our results it seems that Gujarat has the highest percentage of loanee farmers choosing agriculture as their primary occupation whereas Himachal Pradesh has the highest dependency on agriculture as their secondary occupation. Under non-loanee category, Maharashtra has the highest dependency on agriculture as primary occupation. Overall Maharashtra and Gujarat farmers have the highest dependency on agriculture as their primary occupation.
Table 2.7 provides information related to the various other non-agriculture source of the income. We will look at the non-agriculture sources of income for the farmers of loanee category. Farmers in Madhya Pradesh earn maximum average income from milk whereas Gujarat receives it from the livestock. The highest average income for the farm labour is again observed in the state of Madhya Pradesh. The scheme of MGNREGA seems to be providing higher benefit to the farmers of Gujarat and Maharashtra than any other state. Least earnings from MGNREGA are observed in the state of Uttar Pradesh and West Bengal. If we observe the data for pension, Bihar has the highest average income from this source. Uttar Pradesh records the highest non-agriculture income from salaries whereas Himachal Pradesh and Gujarat receive maximum from business. Himachal Pradesh farmers also receive high rent on land and house. This table helps us in understanding which states are specializing in which of the activities other than agriculture.
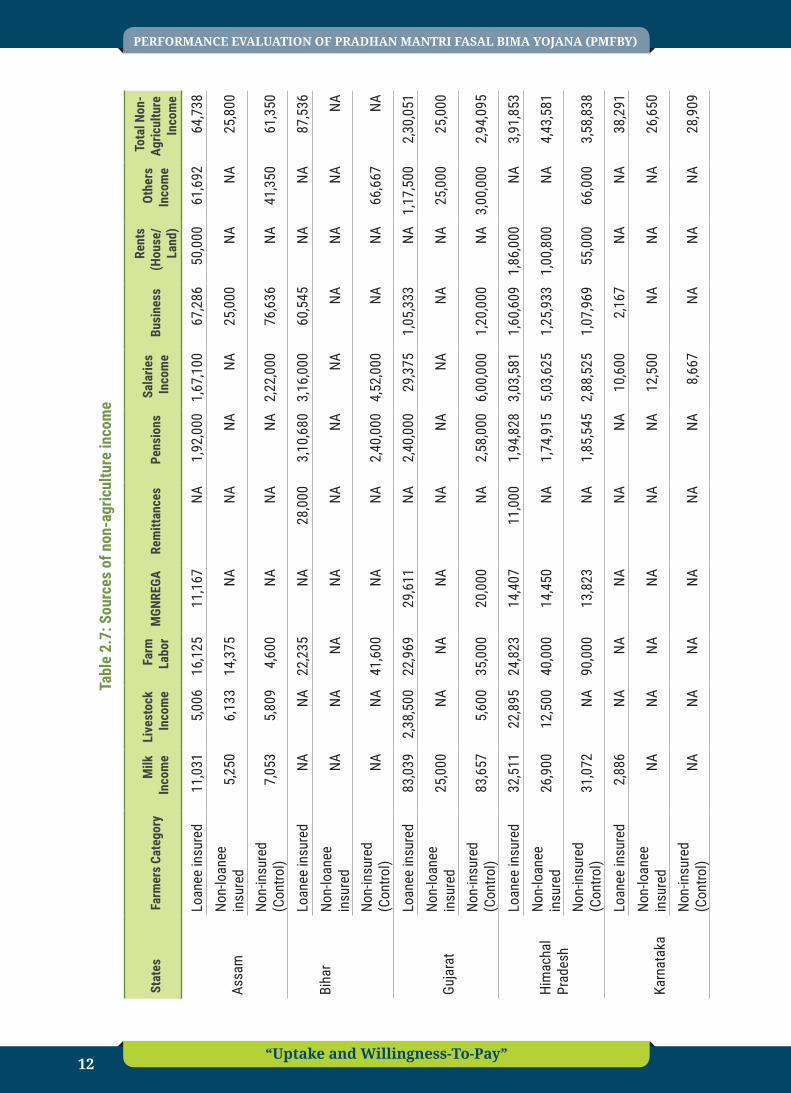
PERFORMANCE EVALUATION OF PRADHAN MANTRI FASAL BIMA YOJANA (PMFBY)
“Uptake and Willingness-To-Pay” 12
Tabl
e 2.
7: S
ourc
es o
f non
-agr
icul
ture
inco
me
Stat
esFa
rmer
s Ca
tego
ry
Milk
In
com
eLi
vest
ock
Inco
me
Farm
La
bor
MGN
REGA
Rem
ittan
ces
Pens
ions
Sala
ries
Inco
me
Busi
ness
Rent
s (H
ouse
/La
nd)
Othe
rs
Inco
me
Tota
l Non
-Ag
ricul
ture
In
com
e
Assa
m
Loan
ee in
sure
d11
,031
5,00
616
,125
11,1
67NA
1,92
,000
1,67
,100
67,2
8650
,000
61,6
9264
,738
Non-
loan
ee
insu
red
5,25
06,
133
14,3
75NA
NANA
NA25
,000
NANA
25,8
00
Non-
insu
red
(Con
trol)
7,05
35,
809
4,60
0NA
NANA
2,22
,000
76,6
36NA
41,3
5061
,350
Biha
r
Loan
ee in
sure
dNA
NA22
,235
NA28
,000
3,10
,680
3,16
,000
60,5
45NA
NA87
,536
Non-
loan
ee
insu
red
NANA
NANA
NANA
NANA
NANA
NA
Non-
insu
red
(Con
trol)
NANA
41,6
00NA
NA2,
40,0
004,
52,0
00NA
NA66
,667
NA
Guja
rat
Loan
ee in
sure
d83
,039
2,38
,500
22,9
6929
,611
NA2,
40,0
0029
,375
1,05
,333
NA1,
17,5
002,
30,0
51No
n-lo
anee
in
sure
d25
,000
NANA
NANA
NANA
NANA
25,0
0025
,000
Non-
insu
red
(Con
trol)
83,6
575,
600
35,0
0020
,000
NA2,
58,0
006,
00,0
001,
20,0
00NA
3,00
,000
2,94
,095
Him
acha
l Pr
ades
h
Loan
ee in
sure
d32
,511
22,8
9524
,823
14,4
0711
,000
1,94
,828
3,03
,581
1,60
,609
1,86
,000
NA3,
91,8
53No
n-lo
anee
in
sure
d26
,900
12,5
0040
,000
14,4
50NA
1,74
,915
5,03
,625
1,25
,933
1,00
,800
NA4,
43,5
81
Non-
insu
red
(Con
trol)
31,0
72NA
90,0
0013
,823
NA1,
85,5
452,
88,5
251,
07,9
6955
,000
66,0
003,
58,8
38
Karn
atak
a
Loan
ee in
sure
d2,
886
NANA
NANA
NA10
,600
2,16
7NA
NA38
,291
Non-
loan
ee
insu
red
NANA
NANA
NANA
12,5
00NA
NANA
26,6
50
Non-
insu
red
(Con
trol)
NANA
NANA
NANA
8,66
7NA
NANA
28,9
09

13“Uptake and Willingness-To-Pay”
PERFORMANCE EVALUATION OF PRADHAN MANTRI FASAL BIMA YOJANA (PMFBY)
Stat
esFa
rmer
s Ca
tego
ry
Milk
In
com
eLi
vest
ock
Inco
me
Farm
La
bor
MGN
REGA
Rem
ittan
ces
Pens
ions
Sala
ries
Inco
me
Busi
ness
Rent
s (H
ouse
/La
nd)
Othe
rs
Inco
me
Tota
l Non
-Ag
ricul
ture
In
com
e
Mad
hya
Prad
esh
Loan
ee in
sure
d10
5850
35,0
0058
400
NANA
30,0
006,
333
5,35
01,
000
1,50
03,
77,7
21No
n-lo
anee
in
sure
d52
195
NA51
100
NANA
20,0
005,
971
4,31
3NA
NA6,
234
Non-
insu
red
(Con
trol)
3650
0NA
7227
0NA
NA10
,000
8,13
7NA
NA5,
000
5,26
6
Mah
aras
htra
Loan
ee in
sure
d21
,667
11,0
0022
,000
23,3
3360
,000
40,0
001,
25,0
0096
,400
NA22
,143
64,6
30No
n-lo
anee
in
sure
d45
,000
18,3
3342
,625
20,8
0046
,625
51,0
0060
,125
91,2
5020
,000
35,4
7473
,546
Non-
insu
red
(Con
trol)
28,0
0020
,000
24,5
008,
000
NANA
77,5
0020
,000
NA48
,333
66,3
64
Utta
r Pr
ades
h
Loan
ee in
sure
d28
,873
38,9
4422
,850
8,72
590
,667
1,10
,000
4,88
,000
92,3
6012
,000
79,4
1786
,528
Non-
loan
ee
insu
red
25,5
609,
000
19,3
823,
480
50,0
00NA
1,07
,000
NANA
38,6
6741
,282
Non-
insu
red
(Con
trol)
NANA
22,1
006,
625
66,0
00NA
1,80
,000
36,0
00NA
40,0
0046
,150
Wes
t Ben
gal
Loan
ee in
sure
dNA
NA19
,903
9,08
4NA
2,20
,000
2,46
,182
46,2
6721
,667
45,1
4380
,359
Non-
loan
ee
insu
red
NANA
18,0
388,
667
12,0
001,
80,0
0048
,000
75,3
00NA
22,0
0050
,982
Non-
insu
red
(Con
trol)
NANA
23,7
789,
567
NANA
1,26
,000
81,5
00NA
26,8
0063
,100
Sam
ple
All
Loan
ee in
sure
d40
,836
58,5
5726
,163
16,0
5547
,416
1,67
,189
1,88
,019
70,7
0254
,133
54,5
661,
57,9
67No
n-lo
anee
in
sure
d29
984
11,4
9230
,920
11,8
4936
,208
1,06
,478
1,22
,870
64,3
5960
,400
30,2
8586
,634
Non-
insu
red
(Con
trol)
37,2
5610
,470
39,2
3111
,603
66,0
001,
73,3
862,
18,0
9273
,684
55,0
0074
,269
1,15
,509
Sour
ce: O
wn c
ompi
latio
n
PERFORMANCE EVALUATION OF PRADHAN MANTRI FASAL BIMA YOJANA (PMFBY)
“Uptake and Willingness-To-Pay” 14
Table 2.8: Sources of credit
State Category Cooperative banks
Commercial banks
Rural banks
Money lender
Savings group Other Total
Assam
Loanee 24 76 NA NA NA NA 100
Non-loanee NA NA NA NA NA NA NA
Non-insured (Control) NA NA NA NA NA NA NA
Bihar
Loanee NA NA NA NA NA NA NA
Non-loanee NA NA NA NA NA NA NA
Non-insured (Control) 1 NA NA NA NA NA 1
Gujarat
Loanee 62 47 NA NA NA 1 110
Non- loanee NA NA NA NA NA 10 10
Non-insured (Control) 15 1 NA NA NA 14 30
Himachal Pradesh
Loanee 14 75 NA NA NA NA 89
Non- loanee 3 4 NA NA NA NA 7
Non-insured (Control) 1 3 NA NA NA NA 4
Karnataka
Loanee 34 42 13 NA NA NA 89
Non- loanee 1 NA NA NA NA NA 1
Non-insured (Control) 16 10 4 NA NA NA 30
Madhya Pradesh
Loanee 7 21 NA NA NA NA 28
Non- loanee NA 6 NA NA NA NA 6
Non-insured (Control) 1 NA NA NA NA NA 1
Maharashtra
Loanee 25 5 14 NA NA 2 44
Non- loanee 8 NA 6 NA NA 1 15
Non-insured (Control) 1 6 NA NA NA NA 7
Uttar Pradesh
Loanee 1 59 22 NA NA NA 82
Non- loanee NA NA NA NA NA NA NA
Non-insured (Control) NA NA NA NA NA NA NA
West Bengal
Loanee NA NA NA NA NA NA NA
Non- loanee NA NA NA NA NA NA NA
Non-insured (Control) NA NA NA NA NA NA NA
Source: Own compilation
15“Uptake and Willingness-To-Pay”
PERFORMANCE EVALUATION OF PRADHAN MANTRI FASAL BIMA YOJANA (PMFBY)
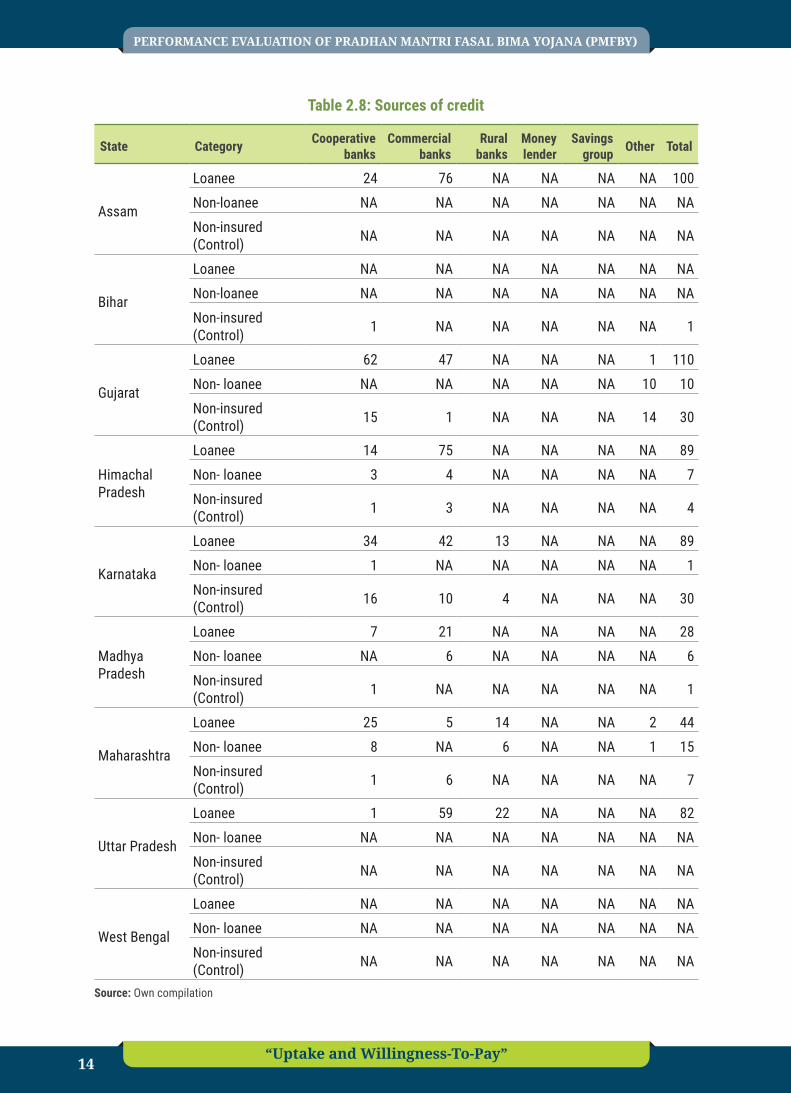
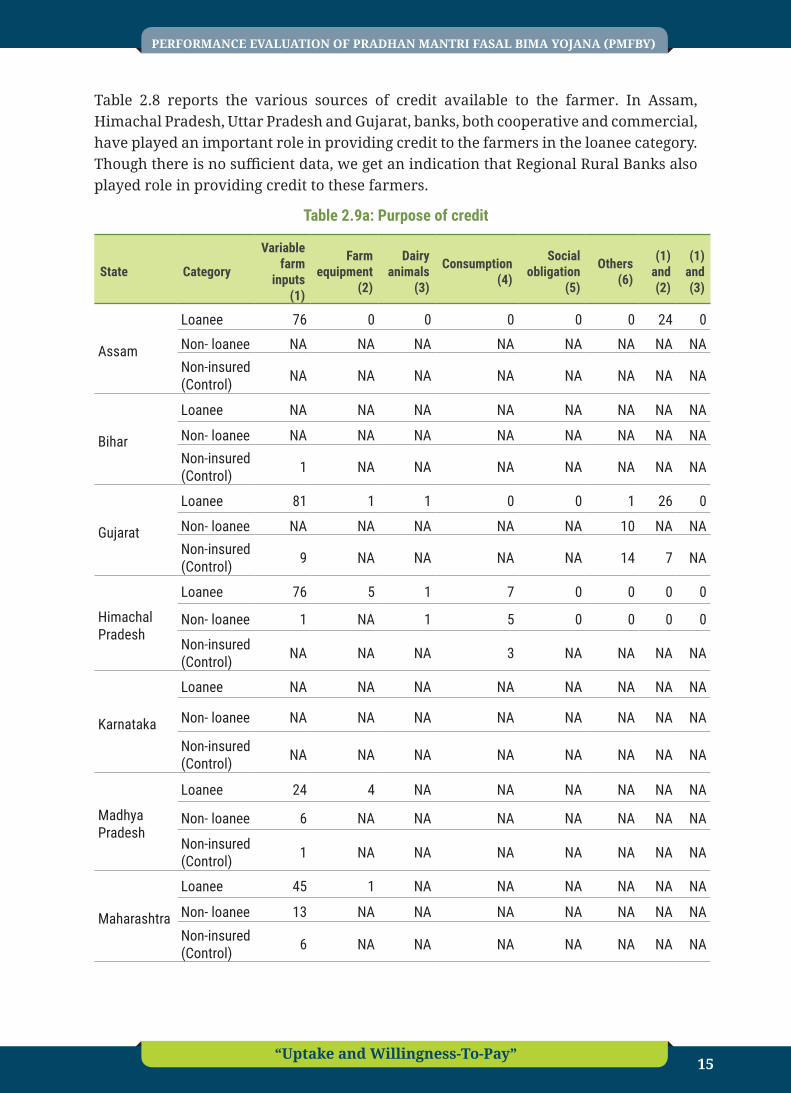
Table 2.8 reports the various sources of credit available to the farmer. In Assam, Himachal Pradesh, Uttar Pradesh and Gujarat, banks, both cooperative and commercial, have played an important role in providing credit to the farmers in the loanee category. Though there is no sufficient data, we get an indication that Regional Rural Banks also played role in providing credit to these farmers.
Table 2.9a: Purpose of credit
State Category
Variable farm
inputs (1)
Farm equipment
(2)
Dairy animals
(3)
Consumption (4)
Social obligation
(5)
Others (6)
(1) and (2)
(1) and (3)
Assam
Loanee 76 0 0 0 0 0 24 0
Non- loanee NA NA NA NA NA NA NA NANon-insured (Control) NA NA NA NA NA NA NA NA
Bihar
Loanee NA NA NA NA NA NA NA NA
Non- loanee NA NA NA NA NA NA NA NANon-insured (Control) 1 NA NA NA NA NA NA NA
Gujarat
Loanee 81 1 1 0 0 1 26 0
Non- loanee NA NA NA NA NA 10 NA NANon-insured (Control) 9 NA NA NA NA 14 7 NA
Himachal Pradesh
Loanee 76 5 1 7 0 0 0 0
Non- loanee 1 NA 1 5 0 0 0 0
Non-insured (Control) NA NA NA 3 NA NA NA NA
Karnataka
Loanee NA NA NA NA NA NA NA NA
Non- loanee NA NA NA NA NA NA NA NA
Non-insured (Control) NA NA NA NA NA NA NA NA
Madhya Pradesh
Loanee 24 4 NA NA NA NA NA NA
Non- loanee 6 NA NA NA NA NA NA NA
Non-insured (Control) 1 NA NA NA NA NA NA NA
Maharashtra
Loanee 45 1 NA NA NA NA NA NA
Non- loanee 13 NA NA NA NA NA NA NANon-insured (Control) 6 NA NA NA NA NA NA NA
PERFORMANCE EVALUATION OF PRADHAN MANTRI FASAL BIMA YOJANA (PMFBY)
“Uptake and Willingness-To-Pay” 16
State Category
Variable farm
inputs (1)
Farm equipment
(2)
Dairy animals
(3)
Consumption (4)
Social obligation
(5)
Others (6)
(1) and (2)
(1) and (3)
Uttar Pradesh
Loanee 77 5 NA NA NA NA NA NA
Non- loanee NA NA NA NA NA NA NA NANon-insured (Control) NA NA NA NA NA NA NA NA
West Bengal
Loanee NA NA NA NA NA NA NA NA
Non- loanee NA NA NA NA NA NA NA NA
Non-insured (Control) NA NA NA NA NA NA NA NA
Source: Own compilation
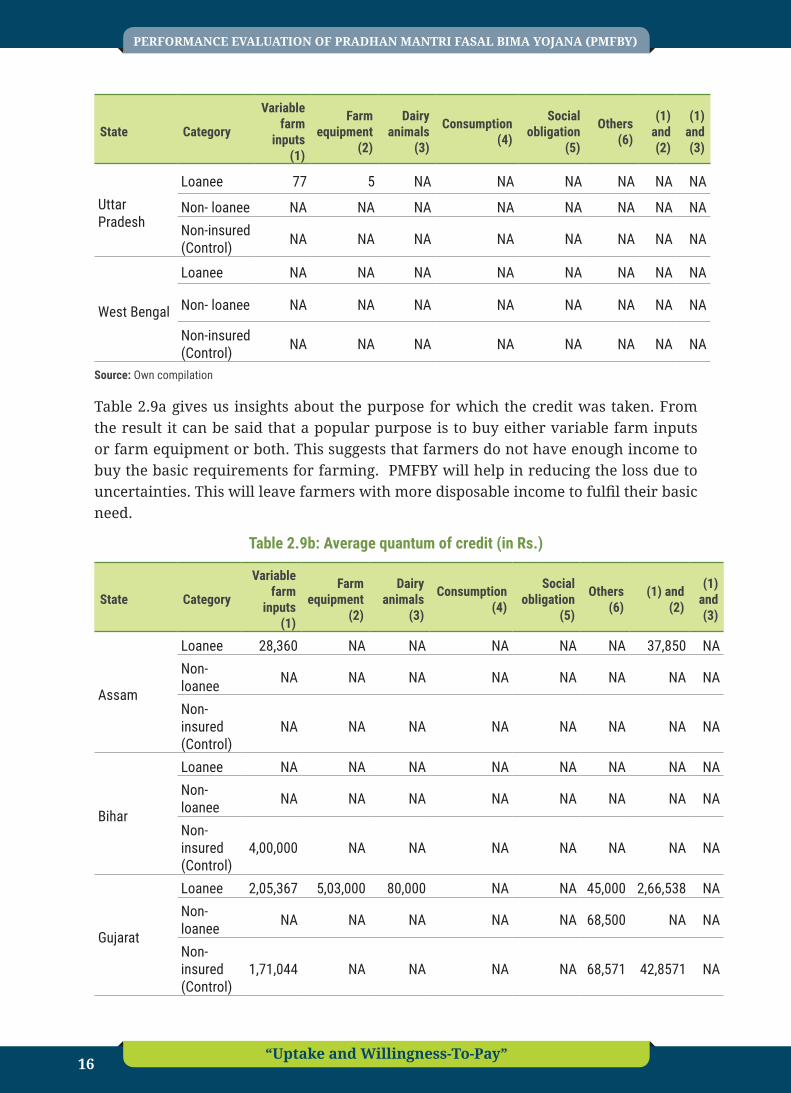
Table 2.9a gives us insights about the purpose for which the credit was taken. From the result it can be said that a popular purpose is to buy either variable farm inputs or farm equipment or both. This suggests that farmers do not have enough income to buy the basic requirements for farming. PMFBY will help in reducing the loss due to uncertainties. This will leave farmers with more disposable income to fulfil their basic need.
Table 2.9b: Average quantum of credit (in Rs.)
State Category
Variable farm
inputs (1)
Farm equipment
(2)
Dairy animals
(3)
Consumption (4)
Social obligation
(5)
Others (6)
(1) and (2)
(1) and (3)
Assam
Loanee 28,360 NA NA NA NA NA 37,850 NANon- loanee NA NA NA NA NA NA NA NA
Non-insured (Control)
NA NA NA NA NA NA NA NA
Bihar
Loanee NA NA NA NA NA NA NA NANon- loanee NA NA NA NA NA NA NA NA
Non-insured (Control)
4,00,000 NA NA NA NA NA NA NA
Gujarat
Loanee 2,05,367 5,03,000 80,000 NA NA 45,000 2,66,538 NANon- loanee NA NA NA NA NA 68,500 NA NA
Non-insured (Control)
1,71,044 NA NA NA NA 68,571 42,8571 NA

17“Uptake and Willingness-To-Pay”
PERFORMANCE EVALUATION OF PRADHAN MANTRI FASAL BIMA YOJANA (PMFBY)
State Category
Variable farm
inputs (1)
Farm equipment
(2)
Dairy animals
(3)
Consumption (4)
Social obligation
(5)
Others (6)
(1) and (2)
(1) and (3)
Himachal Pradesh
Loanee 1,35,395 1,82,000 1,00,000 88,286 NA NA NA NANon- loanee 2,70,000 NA 1,50,000 10,80,000 NA NA NA NA
Non-insured (Control)
NA NA NA 3,00,000 NA NA NA NA
Karnataka
Loanee NA NA NA NA NA NA NA NANon- loanee NA NA NA NA NA NA NA NA
Non-insured (Control)
NA NA NA NA NA NA NA NA
Madhya Pradesh
Loanee 1,43,482 3,11,000 NA NA NA NA NA NANon- loanee 1,53,333 NA NA NA NA NA NA NA
Non-insured (Control)
NA NA NA NA NA NA NA NA
Maharashtra
Loanee 1,54,422 2,50,000 NA NA NA NA NA NANon- loanee 82,923 NA NA NA NA NA NA NA
Non-insured (Control)
50,283 NA NA NA NA NA NA NA
Uttar Pradesh
Loanee 1,01,342 1,14,000 NA NA NA NA NA NANon- loanee NA NA NA NA NA NA NA NA
Non-insured (Control)
NA NA NA NA NA NA NA NA
West Bengal
Loanee NA NA NA NA NA NA NA NANon- loanee NA NA NA NA NA NA NA NA
Non-insured (Control)
NA NA NA NA NA NA NA NA
Source: Own Compilation

PERFORMANCE EVALUATION OF PRADHAN MANTRI FASAL BIMA YOJANA (PMFBY)
“Uptake and Willingness-To-Pay” 18
The average loan amount is very high in some states like Gujarat, Maharashtra, Madhya Pradesh, Himachal Pradesh and Uttar Pradesh for buying variable farm inputs. In the same states the demand for the credit is even higher for buying farm equipment and dairy animals.
2.2. Farm level characteristics of sampled households The main focus of this section is to look at the land holding and cropping patterns of farmers across the states surveyed.
Table 2.10: State wise average irrigated and un-irrigated land details (in acres)
StateOwn Land (Acres) Leased-In Land (Acres) Leased-Out Land (Acres)
Total Irrigated Un-Irrigated Total Irrigated Un-
Irrigated Total Irrigated Un-Irrigated
Assam 3 1.5 2.1 0.8 0.8 0.7 0.7 0.6 0.8
Bihar 2.1 1.6 1.4 3.5 2.6 4.1 3.9 3.3 3.7
Gujarat 6.7 6.5 3.5 7 7.9 4 NA NA NA
Himachal Pradesh 4.8 2.2 4.4 NA NA NA 0.2 NA 0.2
Karnataka 6 4.2 5.3 NA NA NA NA NA NA
Madhya Pradesh 7.9 7.5 3.7 6.7 7.4 3 NA NA 3.6
Maharashtra 4.9 4 3.4 4.7 5 4.6 2.2 1.8 2
Uttar Pradesh 3 2.7 2 0.8 0.8 NA NA NA NA
West Bengal 2.4 2 0.6 0.9 0.9 0.5 2.3 1.8 1.5
Sample All 4.5 3.58 2.93 3.49 3.63 2.82 1.86 1.88 1.97Source: Own compilation
Table 2.10 focuses on the different categories of land holding among farmers. We have categorized it into three categories for all the farmers:
a. Own land
b. Leased-in land
c. Leased-out land
Each of the categories is again subdivided into irrigated or un-irrigated land. It is observed that farmers in Madhya Pradesh have highest land holding in own land holding followed by Gujarat. The value is significantly higher than the overall average. A reverse pattern is observed in the case of leased-in land. Gujarat has the highest average leased-in land and Madhya Pradesh stands at second position. Farmers in Assam and West Bengal have very low level of farm holding in all the three categories. Whereas Bihar has lowest own farm land holding but has near about average in the other two
19“Uptake and Willingness-To-Pay”
PERFORMANCE EVALUATION OF PRADHAN MANTRI FASAL BIMA YOJANA (PMFBY)
categories. The farmers in Maharashtra hold land close to the overall average in all the three categories.
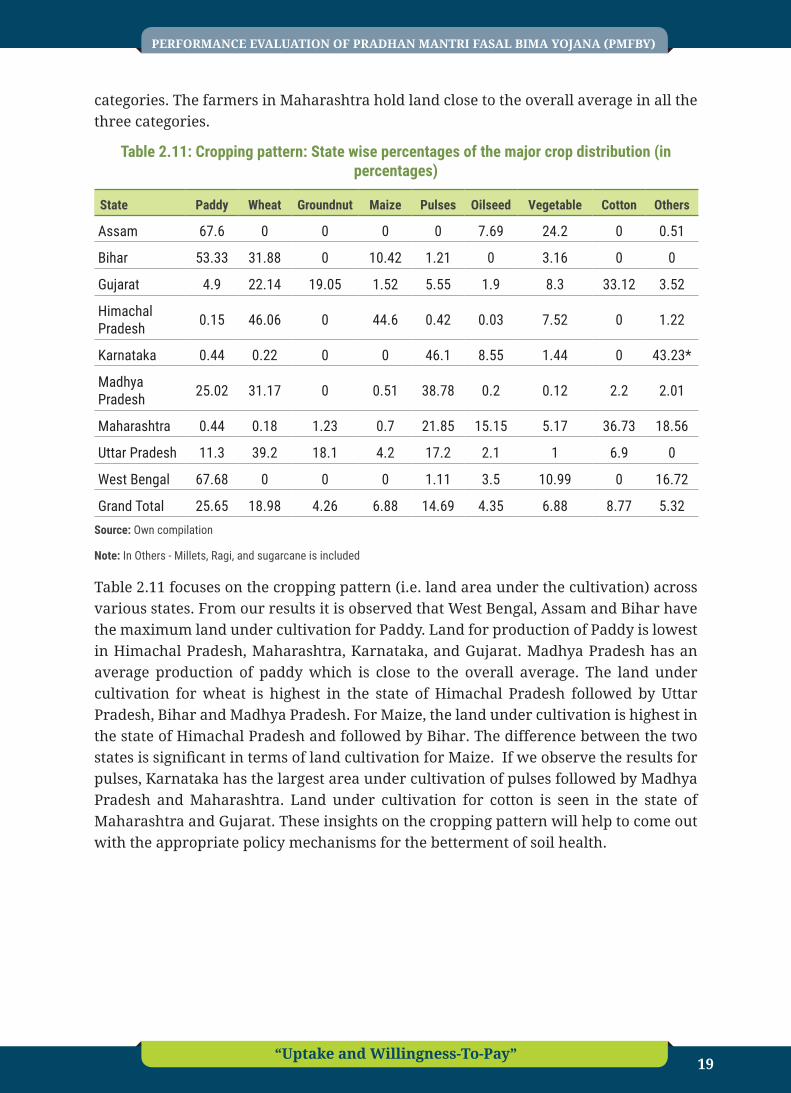
Table 2.11: Cropping pattern: State wise percentages of the major crop distribution (in percentages)
State Paddy Wheat Groundnut Maize Pulses Oilseed Vegetable Cotton Others
Assam 67.6 0 0 0 0 7.69 24.2 0 0.51
Bihar 53.33 31.88 0 10.42 1.21 0 3.16 0 0
Gujarat 4.9 22.14 19.05 1.52 5.55 1.9 8.3 33.12 3.52
Himachal Pradesh 0.15 46.06 0 44.6 0.42 0.03 7.52 0 1.22
Karnataka 0.44 0.22 0 0 46.1 8.55 1.44 0 43.23*
Madhya Pradesh 25.02 31.17 0 0.51 38.78 0.2 0.12 2.2 2.01
Maharashtra 0.44 0.18 1.23 0.7 21.85 15.15 5.17 36.73 18.56
Uttar Pradesh 11.3 39.2 18.1 4.2 17.2 2.1 1 6.9 0
West Bengal 67.68 0 0 0 1.11 3.5 10.99 0 16.72
Grand Total 25.65 18.98 4.26 6.88 14.69 4.35 6.88 8.77 5.32Source: Own compilation
Note: In Others - Millets, Ragi, and sugarcane is included
Table 2.11 focuses on the cropping pattern (i.e. land area under the cultivation) across various states. From our results it is observed that West Bengal, Assam and Bihar have the maximum land under cultivation for Paddy. Land for production of Paddy is lowest in Himachal Pradesh, Maharashtra, Karnataka, and Gujarat. Madhya Pradesh has an average production of paddy which is close to the overall average. The land under cultivation for wheat is highest in the state of Himachal Pradesh followed by Uttar Pradesh, Bihar and Madhya Pradesh. For Maize, the land under cultivation is highest in the state of Himachal Pradesh and followed by Bihar. The difference between the two states is significant in terms of land cultivation for Maize. If we observe the results for pulses, Karnataka has the largest area under cultivation of pulses followed by Madhya Pradesh and Maharashtra. Land under cultivation for cotton is seen in the state of Maharashtra and Gujarat. These insights on the cropping pattern will help to come out with the appropriate policy mechanisms for the betterment of soil health.
PERFORMANCE EVALUATION OF PRADHAN MANTRI FASAL BIMA YOJANA (PMFBY)
“Uptake and Willingness-To-Pay” 20
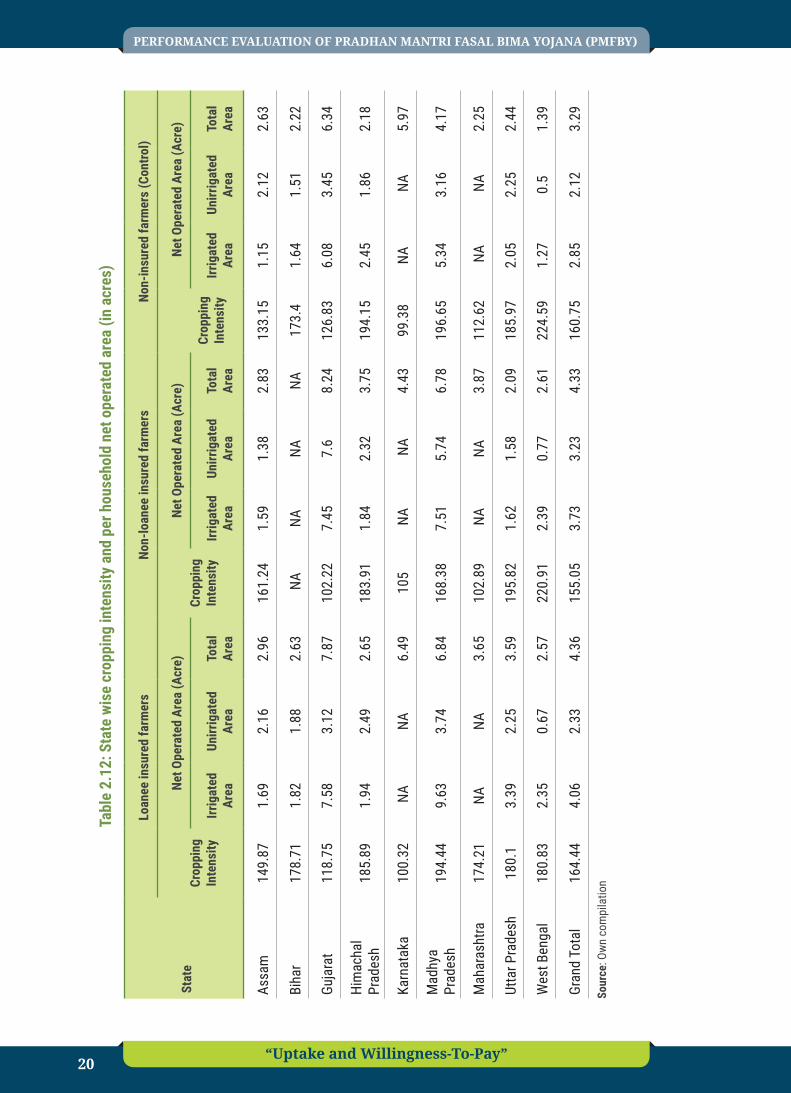
Tabl
e 2.
12: S
tate
wis
e cr
oppi
ng in
tens
ity a
nd p
er h
ouse
hold
net
ope
rate
d ar
ea (i
n ac
res)
Stat
e
Loan
ee in
sure
d fa
rmer
sNo
n-lo
anee
insu
red
farm
ers
Non-
insu
red
farm
ers
(Con
trol)
Crop
ping
In
tens
ity
Net O
pera
ted
Area
(Acr
e)Cr
oppi
ng
Inte
nsity
Net O
pera
ted
Area
(Acr
e)
Crop
ping
In
tens
ity
Net O
pera
ted
Area
(Acr
e)
Irrig
ated
Ar
eaUn
irrig
ated
Ar
eaTo
tal
Area
Irrig
ated
Ar
eaUn
irrig
ated
Ar
eaTo
tal
Area
Irrig
ated
Ar
eaUn
irrig
ated
Ar
eaTo
tal
Area
Assa
m14
9.87
1.69
2.16
2.96
161.
241.
591.
382.
8313
3.15
1.15
2.12
2.63
Biha
r17
8.71
1.82
1.88
2.63
NA
NANA
NA17
3.4
1.64
1.51
2.22
Guja
rat
118.
757.
583.
127.
8710
2.22
7.45
7.6
8.24
126.
836.
083.
456.
34
Him
acha
l Pr
ades
h18
5.89
1.94
2.49
2.65
183.
911.
842.
323.
7519
4.15
2.45
1.86
2.18
Karn
atak
a10
0.32
NA
NA
6.49
105
NA
NA
4.43
99.3
8NA
N
A5.
97
Mad
hya
Prad
esh
194.
449.
633.
746.
8416
8.38
7.51
5.74
6.78
196.
655.
343.
164.
17
Mah
aras
htra
174.
21NA
NA
3.
6510
2.89
NA
NA
3.87
112.
62 N
A N
A2.
25
Utta
r Pra
desh
180.
13.
392.
253.
5919
5.82
1.62
1.58
2.09
185.
972.
052.
252.
44
Wes
t Ben
gal
180.
832.
350.
672.
5722
0.91
2.39
0.77
2.61
224.
591.
270.
51.
39
Gran
d To
tal
164.
444.
062.
334.
3615
5.05
3.73
3.23
4.33
160.
752.
852.
123.
29
Sour
ce: O
wn c
ompi
latio
n

21“Uptake and Willingness-To-Pay”
PERFORMANCE EVALUATION OF PRADHAN MANTRI FASAL BIMA YOJANA (PMFBY)
Table 2.12 shows that the cropping intensity among the loanee category is highest in Madhya Pradesh and Himachal Pradesh. Karnataka, Gujarat and Assam have the lowest crop intensity among the loanee category of farmers. Bihar, Uttar Pradesh and West Bengal have the crop intensity close to the overall average. West Bengal, Uttar Pradesh and Himachal Pradesh are among the highest cropping intensity for the non-loanee farmer. Gujarat and Maharashtra have the lowest cropping intensity in the same category. The net operated area1 is further classified as irrigated land and un-irrigated land. In both loanee and non-loanee category, Madhya Pradesh has the highest irrigated land followed by Gujarat. For control group, Madhya Pradesh has highest irrigated land after Gujarat. Assam has the lowest irrigated land in all the three categories. In the case of uncultivated land, Madhya Pradesh and Gujarat have the largest net operated area whereas West Bengal and Bihar have the lowest in loanee category. Similar trend is followed in case of control group. In case of non loanee category, un-irrigated land is very low in West Bengal, Assam and Uttar Pradesh. If we look at the total net operated area then highest net operated area is in Gujarat, Madhya Pradesh and Karnataka for loanee farmers. Similar pattern is also observed in case of non loanee and control group.
Table 2.13: Overall coverage of the crop insurance for the Rabi and Kharif season
State Farmer category
Kharif Season Rabi Season
Premiums Paid (INR) Loss (INR) Compensation
(INR)PremiumsPaid (INR) Loss (INR) Compensation
(INR)
Assam
Loanee insured NA NA NA 1,407.60 NA NA
Non-loanee insured NA NA NA 201.6 NA NA
Non-insured (Control) NA NA NA NA NA NA
Bihar
Loanee insured 943.0 47,152.5 22,843.52 801.60 62,916.67 23,305.02
Non-loanee insured NA NA NA NA NA NA
Non-insured (Control) NA NA NA NA NA NA
Gujarat
Loanee insured 3,903.72 18,061.86 11,270.28 4,800.00 NA NA
Non-loanee insured 4,629.33 21,850.44 15,480.00 3,525.00 NA NA
Non-insured (Control) NA NA NA NA NA NA
1 We have calculated the net operated area as the sum of own land and leased-in land minus leased-out land and uncultivated land.

PERFORMANCE EVALUATION OF PRADHAN MANTRI FASAL BIMA YOJANA (PMFBY)
“Uptake and Willingness-To-Pay” 22
State Farmer category
Kharif Season Rabi Season
Premiums Paid (INR) Loss (INR) Compensation
(INR)PremiumsPaid (INR) Loss (INR) Compensation
(INR)
Himachal Pradesh
Loanee insured 162.81 12,119.14 1,348.16 133.37 10,144.68 NA
Non-loanee insured 192.96 12,030.77 1,430.19 228.14 17,650.00 NA
Non-insured (Control) NA NA NA NA NA NA
Karnataka
Loanee insured NA NA NA NA NA NA
Non-loanee insured NA NA NA NA NA NA
Non-insured (Control) NA NA NA NA NA NA
Madhya Pradesh
Loanee insured 2,425.78 1,761.11 8,235.81 1,819.30 NA NA
Non-loanee insured 2,027.90 1,500.00 6,378.83 1,520.90 NA NA
Non-insured (Control) NA NA NA NA NA NA
Maharashtra
Loanee insured 1,245.45 35,378.95 NA 1,000.00 2,675.00 NA
Non-loanee insured 968.27 33,648.48 4921.42 519.09 7,727.27 NA
Non-insured (Control) NA NA NA NA NA NA
Uttar Pradesh
Loanee insured 572.97 255 406.85 609.28 159.09 87
Non-loanee insured 763.33 4,000.00 NA 237.73 NA NA
Non-insured (Control) NA NA NA NA NA NA
West Bengal
Loanee insured NA NA NA NA NA NA
Non-loanee insured NA NA NA NA NA NA
Non-insured (Control) NA NA NA NA NA NA
Source: Own compilation

23“Uptake and Willingness-To-Pay”
PERFORMANCE EVALUATION OF PRADHAN MANTRI FASAL BIMA YOJANA (PMFBY)
Table 2.13 gives insights about the overall coverage of the crop insurance for different seasons. The highest premium for the Kharif season is recorded for the state of Gujarat, Madhya Pradesh and Maharashtra in loanee category. It is lowest in the state of Himachal Pradesh, Uttar Pradesh and Bihar respectively. When we see the results for non-loanee category it follows the same trend. However, the premium for non-loanee category is higher than loanee category in the state of Himachal Pradesh and Uttar Pradesh. For Rabi season the highest premium for the loanee category is recorded in the state of Gujarat followed by Madhya Pradesh, Assam and Maharashtra. There are not much changes in the premium as in the case of loanee farmers of Kharif season. This means that the overall premium is both the season is less in the state of Himachal Pradesh, Uttar Pradesh, and Bihar for loanee farmers. However, the data of Karnataka and West Bengal is not sufficient to draw any conclusions. In case of non-loanee farmers, in Rabi season the premium is lower than premium of Kharif season in all the state except Himachal Pradesh. The highest seasonal loss (for both Kharif and Rabi) is recorded in Bihar for loanee farmers followed by Maharashtra and Gujarat. The absolute seasonal compensation for loanee farmers is higher in Bihar followed Gujarat and Madhya Pradesh for Kharif season. The data for seasonal compensation for Rabi is not sufficient to draw any conclusions.
PERFORMANCE EVALUATION OF PRADHAN MANTRI FASAL BIMA YOJANA (PMFBY)
“Uptake and Willingness-To-Pay” 24
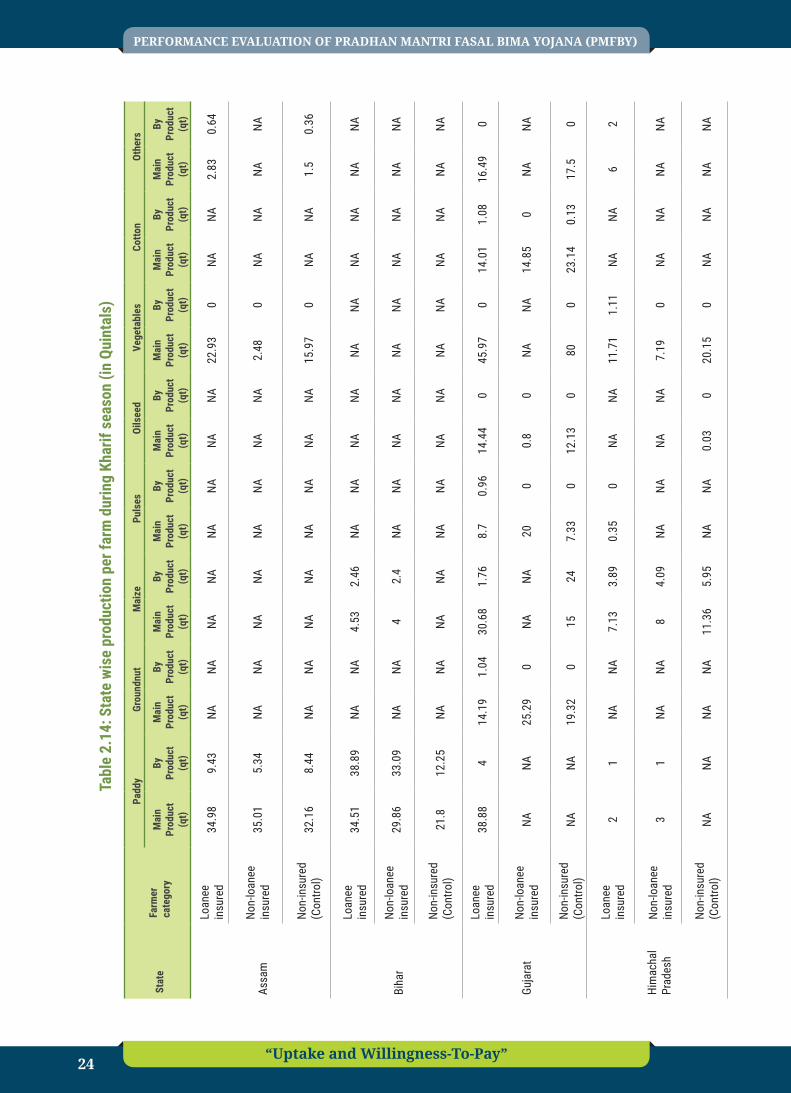
Tabl
e 2.
14: S
tate
wis
e pr
oduc
tion
per f
arm
dur
ing
Khar
if se
ason
(in
Quin
tals
)
Stat
eFa
rmer
ca
tego
ry
Padd
yGr
ound
nut
Mai
zePu
lses
Oils
eed
Vege
tabl
esCo
tton
Othe
rs
Mai
n Pr
oduc
t (q
t)
By
Prod
uct
(qt)
Mai
n Pr
oduc
t (q
t)
By
Prod
uct
(qt)
Mai
n Pr
oduc
t (q
t)
By
Prod
uct
(qt)
Mai
n Pr
oduc
t (q
t)
By
Prod
uct
(qt)
Mai
n Pr
oduc
t (q
t)
By
Prod
uct
(qt)
Mai
n Pr
oduc
t (q
t)
By
Prod
uct
(qt)
Mai
n Pr
oduc
t (q
t)
By
Prod
uct
(qt)
Mai
n Pr
oduc
t (q
t)
By
Prod
uct
(qt)
Assa
m
Loan
ee
insu
red
34.9
89.
43NA
NANA
NANA
NANA
NA22
.93
0NA
NA2.
830.
64
Non-
loan
ee
insu
red
35.0
15.
34NA
NANA
NANA
NANA
NA2.
480
NANA
NANA
Non-
insu
red
(Con
trol)
32.1
68.
44NA
NANA
NANA
NANA
NA15
.97
0NA
NA1.
50.
36
Biha
r
Loan
ee
insu
red
34.5
138
.89
NANA
4.53
2.46
NANA
NANA
NANA
NANA
NANA
Non-
loan
ee
insu
red
29.8
633
.09
NANA
42.
4NA
NANA
NANA
NANA
NANA
NA
Non-
insu
red
(Con
trol)
21.8
12.2
5NA
NANA
NANA
NANA
NANA
NANA
NANA
NA
Guja
rat
Loan
ee
insu
red
38.8
84
14.1
91.
0430
.68
1.76
8.7
0.96
14.4
40
45.9
70
14.0
11.
0816
.49
0
Non-
loan
ee
insu
red
NANA
25.2
90
NANA
200
0.8
0NA
NA14
.85
0NA
NA
Non-
insu
red
(Con
trol)
NANA
19.3
20
1524
7.33
012
.13
080
023
.14
0.13
17.5
0
Him
acha
l Pr
ades
h
Loan
ee
insu
red
21
NANA
7.13
3.89
0.35
0NA
NA11
.71
1.11
NANA
62
Non-
loan
ee
insu
red
31
NANA
84.
09NA
NANA
NA7.
190
NANA
NANA
Non-
insu
red
(Con
trol)
NANA
NANA
11.3
65.
95NA
NA0.
030
20.1
50
NANA
NANA

25“Uptake and Willingness-To-Pay”
PERFORMANCE EVALUATION OF PRADHAN MANTRI FASAL BIMA YOJANA (PMFBY)
Stat
eFa
rmer
ca
tego
ry
Padd
yGr
ound
nut
Mai
zePu
lses
Oils
eed
Vege
tabl
esCo
tton
Othe
rs
Mai
n Pr
oduc
t (q
t)
By
Prod
uct
(qt)
Mai
n Pr
oduc
t (q
t)
By
Prod
uct
(qt)
Mai
n Pr
oduc
t (q
t)
By
Prod
uct
(qt)
Mai
n Pr
oduc
t (q
t)
By
Prod
uct
(qt)
Mai
n Pr
oduc
t (q
t)
By
Prod
uct
(qt)
Mai
n Pr
oduc
t (q
t)
By
Prod
uct
(qt)
Mai
n Pr
oduc
t (q
t)
By
Prod
uct
(qt)
Mai
n Pr
oduc
t (q
t)
By
Prod
uct
(qt)
Karn
atak
a
Loan
ee
insu
red
NANA
NANA
NANA
18.9
65
11.8
5NA
NANA
NANA
19.7
410
7.7
Non-
loan
ee
insu
red
NANA
NANA
NANA
13.2
913
.29
12NA
NANA
NANA
9.82
9.82
Non-
insu
red
(Con
trol)
NANA
NANA
NANA
13.3
513
.35
7.5
NANA
NANA
NA18
.25
18.2
Mad
hya
Prad
esh
Loan
ee
insu
red
120.
243
.14
NANA
2.5
026
.06
7.62
7.5
0NA
NANA
NANA
NA
Non-
loan
ee
insu
red
100.
237
.75
NANA
5.5
015
.15
2.92
80
NANA
NANA
NANA
Non-
insu
red
(Con
trol)
65.6
353
NANA
NANA
16.4
63.
77NA
NANA
NANA
NANA
NA
Mah
aras
htra
Loan
ee
insu
red
80
NANA
NANA
NANA
NANA
37.5
0NA
NANA
NA
Non-
loan
ee
insu
red
NANA
NANA
NANA
NANA
NANA
160
0NA
NANA
NA
Non-
insu
red
(Con
trol)
NANA
NANA
NANA
NANA
NANA
30NA
NANA
00

PERFORMANCE EVALUATION OF PRADHAN MANTRI FASAL BIMA YOJANA (PMFBY)
“Uptake and Willingness-To-Pay” 26
Stat
eFa
rmer
ca
tego
ry
Padd
yGr
ound
nut
Mai
zePu
lses
Oils
eed
Vege
tabl
esCo
tton
Othe
rs
Mai
n Pr
oduc
t (q
t)
By
Prod
uct
(qt)
Mai
n Pr
oduc
t (q
t)
By
Prod
uct
(qt)
Mai
n Pr
oduc
t (q
t)
By
Prod
uct
(qt)
Mai
n Pr
oduc
t (q
t)
By
Prod
uct
(qt)
Mai
n Pr
oduc
t (q
t)
By
Prod
uct
(qt)
Mai
n Pr
oduc
t (q
t)
By
Prod
uct
(qt)
Mai
n Pr
oduc
t (q
t)
By
Prod
uct
(qt)
Mai
n Pr
oduc
t (q
t)
By
Prod
uct
(qt)
Utta
r Pra
desh
Loan
ee
insu
red
24.1
516
.74
18.6
07.
468.
53.
882.
69NA
NANA
NANA
NA3.
753.
75
Non-
loan
ee
insu
red
14.9
715
.64
9.47
04.
864.
52.
621.
77NA
NANA
NANA
NANA
NA
Non-
insu
red
(Con
trol)
22.4
21.9
17.6
40
7.18
8.47
2.11
2.15
NANA
NANA
NANA
NANA
Wes
t Ben
gal
Loan
ee
insu
red
36.4
149
.65
NANA
NANA
NANA
NANA
NANA
NANA
11.6
16.5
Non-
loan
ee
insu
red
37.6
951
.34
NANA
NANA
NANA
NANA
NANA
NANA
18.3
126
.6
Non-
insu
red
(Con
trol)
23.7
32.5
8NA
NANA
NANA
NANA
NANA
NANA
NA11
.09
16.0
Sour
ce: O
wn c
ompi
latio
n

27“Uptake and Willingness-To-Pay”
PERFORMANCE EVALUATION OF PRADHAN MANTRI FASAL BIMA YOJANA (PMFBY)
Table 2.14 focuses on the state wise production during the Kharif season. For paddy as a main product Madhya Pradesh has the highest production whereas the least is recorded for Himachal Pradesh. For vegetables, it is Gujarat followed by Maharashtra and Assam. Highest production of maize is recorded in the state of Gujarat. If we see state wise, Assam, Bihar, Madhya Pradesh, Uttar Pradesh and West Bengal have the highest production of Paddy. Gujarat, Himachal Pradesh and Maharashtra have the maximum production of Vegetables. Karnataka records highest production of pulses across other crop varieties.


29“Uptake and Willingness-To-Pay”
PERFORMANCE EVALUATION OF PRADHAN MANTRI FASAL BIMA YOJANA (PMFBY)
IntroductionThis part of the project focuses on insurance behavior among the farmers across various states. It covers various parameters such as awareness about PMFBY, the various mechanisms for the information and the role of various agencies in implementing the scheme across different states. This allows us to understand the effectiveness of the schemes in different states and helps in identifying some areas for improvement. Thus, the results help for the better implementation at the grass root level taking into consideration farmers’ views.
3.1. FindingsThe data comes from primary surveys conducted in nine Indian States (Assam, Bihar, Gujarat, Himachal Pradesh, Karnataka, Madhya Pradesh, Maharashtra, Uttar Pradesh, and West Bengal). There is an attempt to cover all major Indian geographical, although we do not claim a perfect representation. This also gives a picture of effectiveness of the schemes in different parts of India.
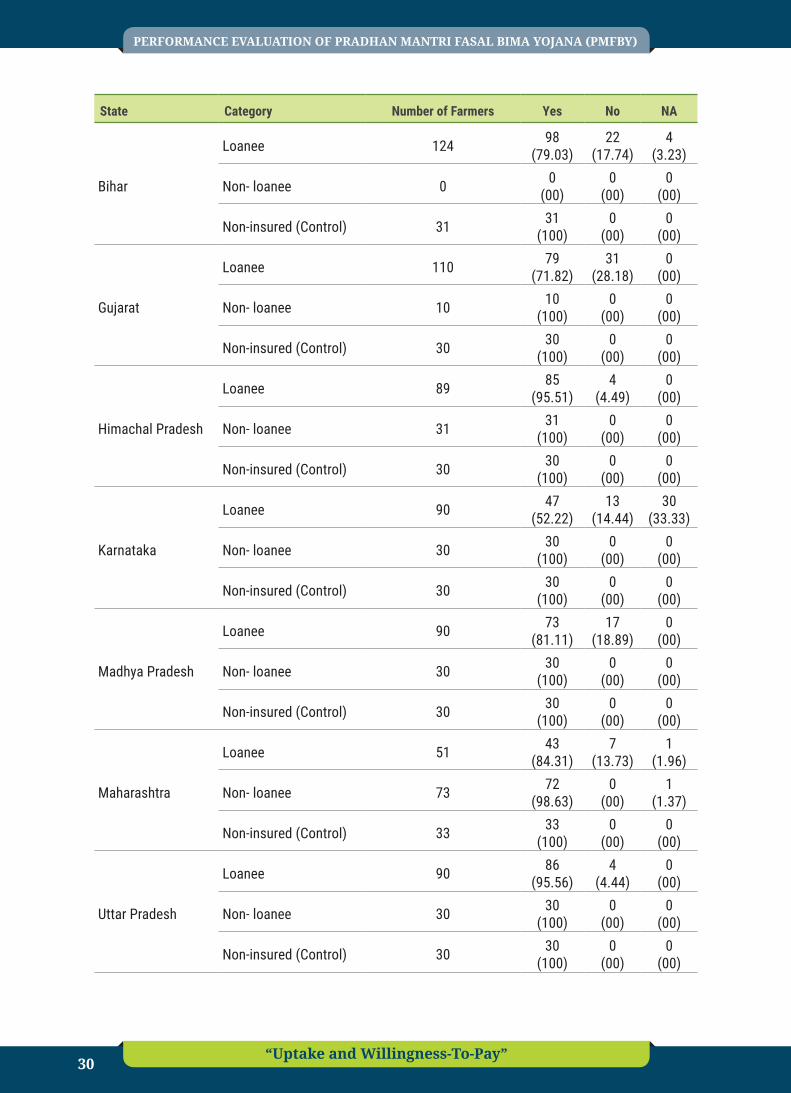
Table 3.1: Awareness of PMFBY
State Category Number of Farmers Yes No NA
Assam
Loanee 100 100(100)
0(00)
0(00)
Non- loanee 10 10(100)
0(00)
0(00)
Non-insured (Control) 40 40(100)
0(00)
0(00)
Chapter 3
Insurance Behavior
PERFORMANCE EVALUATION OF PRADHAN MANTRI FASAL BIMA YOJANA (PMFBY)
“Uptake and Willingness-To-Pay” 30
State Category Number of Farmers Yes No NA
Bihar
Loanee 124 98(79.03)
22(17.74)
4(3.23)
Non- loanee 0 0(00)
0(00)
0(00)
Non-insured (Control) 31 31(100)
0(00)
0(00)
Gujarat
Loanee 110 79(71.82)
31(28.18)
0(00)
Non- loanee 10 10(100)
0(00)
0(00)
Non-insured (Control) 30 30(100)
0(00)
0(00)
Himachal Pradesh
Loanee 89 85(95.51)
4(4.49)
0(00)
Non- loanee 31 31(100)
0(00)
0(00)
Non-insured (Control) 30 30(100)
0(00)
0(00)
Karnataka
Loanee 90 47(52.22)
13(14.44)
30(33.33)
Non- loanee 30 30(100)
0(00)
0(00)
Non-insured (Control) 30 30(100)
0(00)
0(00)
Madhya Pradesh
Loanee 90 73(81.11)
17(18.89)
0(00)
Non- loanee 30 30(100)
0(00)
0(00)
Non-insured (Control) 30 30(100)
0(00)
0(00)
Maharashtra
Loanee 51 43(84.31)
7(13.73)
1(1.96)
Non- loanee 73 72(98.63)
0(00)
1(1.37)
Non-insured (Control) 33 33(100)
0(00)
0(00)
Uttar Pradesh
Loanee 90 86(95.56)
4(4.44)
0(00)
Non- loanee 30 30(100)
0(00)
0(00)
Non-insured (Control) 30 30(100)
0(00)
0(00)

31“Uptake and Willingness-To-Pay”
PERFORMANCE EVALUATION OF PRADHAN MANTRI FASAL BIMA YOJANA (PMFBY)
State Category Number of Farmers Yes No NA
West Bengal
Loanee 90 65(72.22)
25(27.78)
0(00)
Non- loanee 30 30(100)
0(00)
0(00)
Non-insured (Control) 30 0(00)
0(00)
30(100)
Source: Own Compilation
Table 3.1 deals with awareness about the scheme among different categories of the farmers in all the states surveyed. The state of Assam shows the highest level of awareness (100 per cent) in loanee category followed by, Uttar Pradesh (95.56) Himachal Pradesh (95.51), Maharashtra (84.31), and Madhya Pradesh (81.11) whereas the farmers of Karnataka (52.22) were the least aware about the scheme.
Table 3.2 focuses at the insurance history of the farmers, for instance, if they were insured earlier under the schemes like National Agricultural Insurance Scheme (NAIS) or modified NAIS (MNAIS) or Weather Index-Based Crop Insurance in India (WIBCIS).
Table 3.2: Availed any crop insurance scheme earlier
State Category Total number of farmers surveyed Yes No NA
Assam
Loanee 100 0(00)
100(100)
0(00)
Non- loanee 10 0(00)
10(100)
0(00)
Non-insured (Control) 40 0(00)
25(62.5)
15(37.5)
Bihar
Loanee 124 9(7.26)
111(89.52)
4(3.22)
Non- loanee 0 0(00)
0(00)
0(00)
Non-insured (Control) 31 0(00)
0(00)
31(100)
Gujarat
Loanee 110 77(70)
33(30)
0(00)
Non- loanee 10 10(100)
0(00)
0(00)
Non-insured (Control) 30 0(00)
0(00)
30(100)

PERFORMANCE EVALUATION OF PRADHAN MANTRI FASAL BIMA YOJANA (PMFBY)
“Uptake and Willingness-To-Pay” 32
State Category Total number of farmers surveyed Yes No NA
Himachal Pradesh
Loanee 89 28(31.46)
61(68.54)
0(00)
Non- loanee 31 10(32.26)
21(67.74)
0(00)
Non-insured (Control) 30 0(00)
30(100)
0(00)
Karnataka
Loanee 90 44(48.89)
16(17.78)
30(33.33)
Non- loanee 30 0(00)
30(100)
0(00)
Non-insured (Control) 30 0(00)
0(00)
30(100)
Madhya Pradesh
Loanee 90 8(8.89)
82(91.11)
0(00)
Non- loanee 30 2(6.67)
28(93.33)
0(00)
Non-insured (Control) 30 0(00)
0(00)
30(100)
Maharashtra
Loanee 51 28(54.90)
20 (39.22)
3(5.88)
Non- loanee 73 47(64.38)
23(31.51)
3(4.11)
Non-insured (Control) 33 0(00)
0(00)
33(100)
Uttar Pradesh
Loanee 90 22(24.44)
68(75.56)
0(00)
Non- loanee 30 5(16.67)
25(83..33)
0(00)
Non-insured (Control) 30 0(00)
0(00)
30(100)
West Bengal
Loanee 90 41(45.56)
48(53.33)
1(1.11)
Non- loanee 30 11(36.67)
19(63.33)
0(00)
Non-insured (Control) 30 0(00)
0(00)
30(100)
Source: Own compilation
33“Uptake and Willingness-To-Pay”
PERFORMANCE EVALUATION OF PRADHAN MANTRI FASAL BIMA YOJANA (PMFBY)
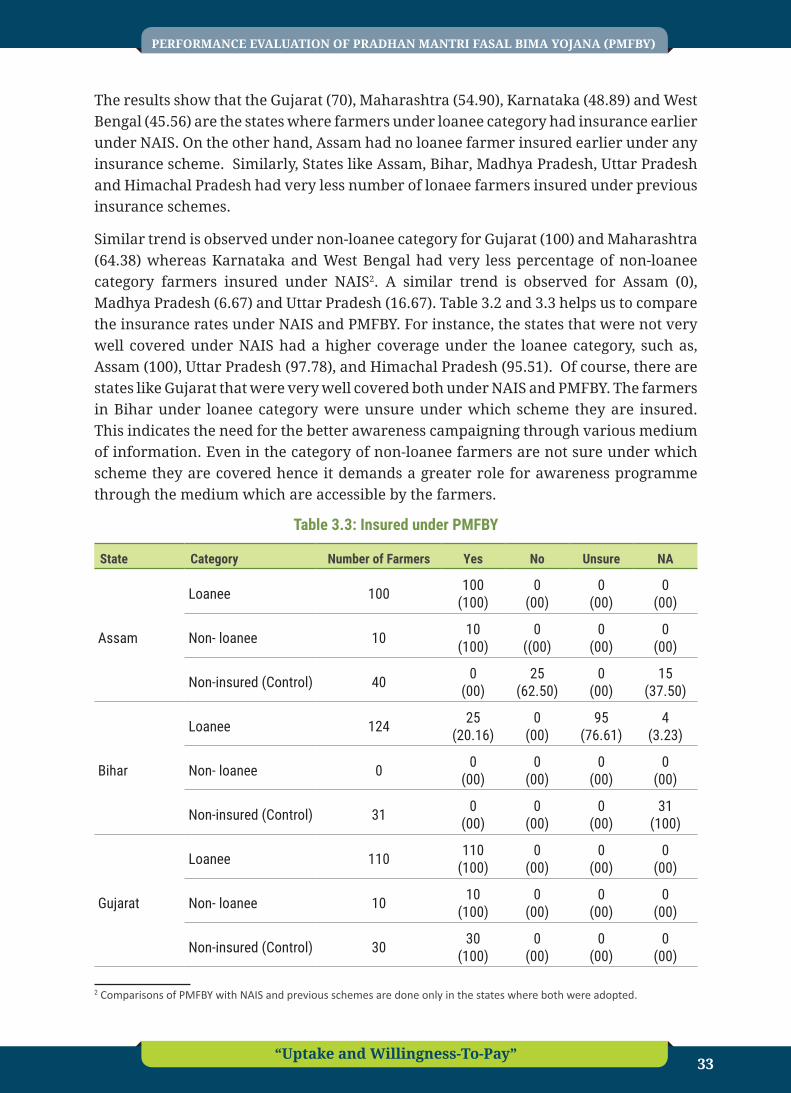
The results show that the Gujarat (70), Maharashtra (54.90), Karnataka (48.89) and West Bengal (45.56) are the states where farmers under loanee category had insurance earlier under NAIS. On the other hand, Assam had no loanee farmer insured earlier under any insurance scheme. Similarly, States like Assam, Bihar, Madhya Pradesh, Uttar Pradesh and Himachal Pradesh had very less number of lonaee farmers insured under previous insurance schemes.
Similar trend is observed under non-loanee category for Gujarat (100) and Maharashtra (64.38) whereas Karnataka and West Bengal had very less percentage of non-loanee category farmers insured under NAIS2. A similar trend is observed for Assam (0), Madhya Pradesh (6.67) and Uttar Pradesh (16.67). Table 3.2 and 3.3 helps us to compare the insurance rates under NAIS and PMFBY. For instance, the states that were not very well covered under NAIS had a higher coverage under the loanee category, such as, Assam (100), Uttar Pradesh (97.78), and Himachal Pradesh (95.51). Of course, there are states like Gujarat that were very well covered both under NAIS and PMFBY. The farmers in Bihar under loanee category were unsure under which scheme they are insured. This indicates the need for the better awareness campaigning through various medium of information. Even in the category of non-loanee farmers are not sure under which scheme they are covered hence it demands a greater role for awareness programme through the medium which are accessible by the farmers.
Table 3.3: Insured under PMFBY
State Category Number of Farmers Yes No Unsure NA
Assam
Loanee 100 100(100)
0(00)
0(00)
0(00)
Non- loanee 10 10(100)
0((00)
0(00)
0(00)
Non-insured (Control) 40 0(00)
25(62.50)
0(00)
15(37.50)
Bihar
Loanee 124 25(20.16)
0(00)
95(76.61)
4(3.23)
Non- loanee 0 0(00)
0(00)
0(00)
0(00)
Non-insured (Control) 31 0(00)
0(00)
0(00)
31(100)
Gujarat
Loanee 110 110(100)
0(00)
0(00)
0(00)
Non- loanee 10 10(100)
0(00)
0(00)
0(00)
Non-insured (Control) 30 30(100)
0(00)
0(00)
0(00)
2 Comparisons of PMFBY with NAIS and previous schemes are done only in the states where both were adopted.

PERFORMANCE EVALUATION OF PRADHAN MANTRI FASAL BIMA YOJANA (PMFBY)
“Uptake and Willingness-To-Pay” 34
State Category Number of Farmers Yes No Unsure NA
Himachal Pradesh
Loanee 89 85(95.51)
1(1.12)
3(3.37)
0(00)
Non- loanee 31 30(96.77)
0(00)
1(3.23)
0(00)
Non-insured (Control) 30 0(00)
30(100)
0(00)
0(00)
Karnataka
Loanee 90 9(10.00)
51(56.67)
0(00)
30(33.33)
Non- loanee 30 0(00)
0(00)
30(100)
0(00)
Non-insured (Control) 30 0(00)
0(00)
0(00)
30(100)
Madhya Pradesh
Loanee 90 64(71.11)
26(28.89)
0(00)
0(00)
Non- loanee 30 27(90.00)
0(00)
3(10.00)
0(00)
Non-insured (Control) 30 0(00)
0(00)
0(00)
30(100)
Maharashtra
Loanee 51 35(68.63)
7(13.73)
7(13.73)
2(3.92)
Non- loanee 73 59(80.82)
0(00)
12(16.44)
2(2.74)
Non-insured (Control) 33 0(00)
0(00)
0(00)
33(100)
Uttar Pradesh
Loanee 90 88(97.78)
2(2.22)
0(00)
0(00)
Non- loanee 30 30(100)
0(00)
0(00)
0(00)
Non-insured (Control) 30 0(00)
0(00)
0(00)
30(100)
West Bengal
Loanee 90 53(58.89)
9(10.00)
26(28.89)
2(2.22)
Non- loanee 30 17(56.67)
0(00)
13(43.33)
0(00)
Non-insured (Control) 30 0(00)
0(00)
0(00)
30(100)
Source: Own compilation
From tables 3.1 and 3.3, it is clear that the farmers need more awareness. Through table 3.4, we will be looking at the contribution of the various agencies that helped in spreading awareness among the farmers.

35“Uptake and Willingness-To-Pay”
PERFORMANCE EVALUATION OF PRADHAN MANTRI FASAL BIMA YOJANA (PMFBY)
Table 3.4: Medium of information
State CategoryGovernment Awareness Programme
Insurance agent
Pan-cha- yat
Other village Others NA
Bank NewsOther than these
Total
Assam
Loanee 10 0 0 12 78 0 0 78 0
Non- loanee 10 0 0 0 0 0 0 0 0
Non-insured (Control) 0 0 0 6 0 1 0 1 33
Bihar
Loanee 6 0 0 7 9 0 0 9 102
Non- loanee 0 0 0 0 0 0 0 0 0
Non-insured (Control) 0 0 0 0 0 0 0 0 31
Gujarat
Loanee 36 8 17 20 0 0 0 52 0
Non- loanee 9 0 0 2 0 0 0 1 0
Non-insured (Control) 0 0 0 0 0 0 0 0 30
Himachal Pradesh
Loanee 56 3 11 1 4 3 0 7 16
Non- loanee 20 6 4 0 0 0 0 0 2
Non-insured (Control) 0 0 0 0 0 0 0 0 30
Karnataka
Loanee 5 0 27 12 0 0 0 0 46
Non- loanee 0 0 0 0 0 0 0 0 30
Non-insured (Control) 0 0 0 0 0 0 0 0 0
Madhya Pradesh
Loanee 29 9 10 11 0 0 0 31 0
Non- loanee 6 4 2 7 0 0 0 11 0
Non-insured (Control) 0 0 0 0 0 0 0 0 30
Maharashtra
Loanee 23 2 26 25 1 0 3 4 6
Non- loanee 26 8 39 48 0 1 0 1 4
Non-insured (Control) 0 0 0 0 0 0 0 0 0
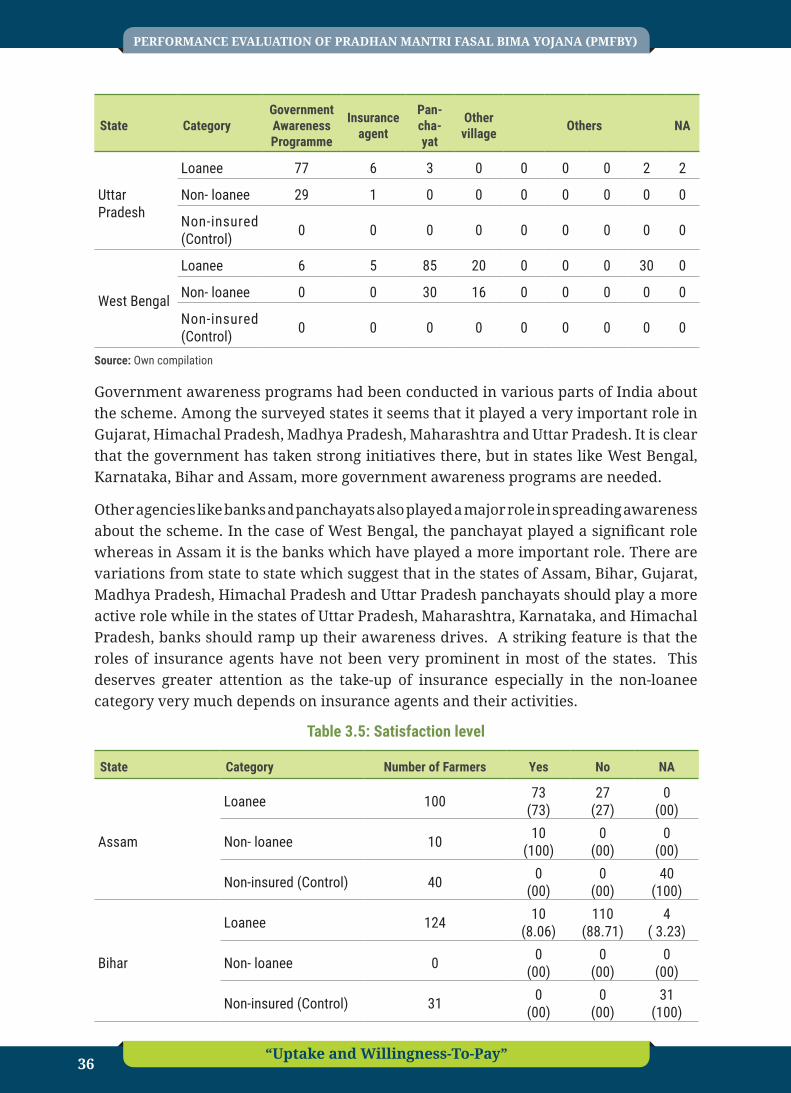
PERFORMANCE EVALUATION OF PRADHAN MANTRI FASAL BIMA YOJANA (PMFBY)
“Uptake and Willingness-To-Pay” 36
State CategoryGovernment Awareness Programme
Insurance agent
Pan-cha- yat
Other village Others NA
Uttar Pradesh
Loanee 77 6 3 0 0 0 0 2 2
Non- loanee 29 1 0 0 0 0 0 0 0
Non-insured (Control) 0 0 0 0 0 0 0 0 0
West Bengal
Loanee 6 5 85 20 0 0 0 30 0
Non- loanee 0 0 30 16 0 0 0 0 0
Non-insured (Control) 0 0 0 0 0 0 0 0 0
Source: Own compilation
Government awareness programs had been conducted in various parts of India about the scheme. Among the surveyed states it seems that it played a very important role in Gujarat, Himachal Pradesh, Madhya Pradesh, Maharashtra and Uttar Pradesh. It is clear that the government has taken strong initiatives there, but in states like West Bengal, Karnataka, Bihar and Assam, more government awareness programs are needed.
Other agencies like banks and panchayats also played a major role in spreading awareness about the scheme. In the case of West Bengal, the panchayat played a significant role whereas in Assam it is the banks which have played a more important role. There are variations from state to state which suggest that in the states of Assam, Bihar, Gujarat, Madhya Pradesh, Himachal Pradesh and Uttar Pradesh panchayats should play a more active role while in the states of Uttar Pradesh, Maharashtra, Karnataka, and Himachal Pradesh, banks should ramp up their awareness drives. A striking feature is that the roles of insurance agents have not been very prominent in most of the states. This deserves greater attention as the take-up of insurance especially in the non-loanee category very much depends on insurance agents and their activities.
Table 3.5: Satisfaction level
State Category Number of Farmers Yes No NA
Assam
Loanee 100 73(73)
27(27)
0(00)
Non- loanee 10 10(100)
0(00)
0(00)
Non-insured (Control) 40 0(00)
0(00)
40(100)
Bihar
Loanee 124 10(8.06)
110(88.71)
4( 3.23)
Non- loanee 0 0(00)
0(00)
0(00)
Non-insured (Control) 31 0(00)
0(00)
31(100)

37“Uptake and Willingness-To-Pay”
PERFORMANCE EVALUATION OF PRADHAN MANTRI FASAL BIMA YOJANA (PMFBY)
State Category Number of Farmers Yes No NA
Gujarat
Loanee 110 26(23.64)
49(44.55)
35(31.82)
Non- loanee 10 7(70.00)
3(30.00)
0(00)
Non-insured (Control) 30 0(00)
0(00)
30(100)
Himachal Pradesh
Loanee 89 30(33.71)
59(66.29)
0(00)
Non- loanee 31 6(19.35)
25(80.65)
0(00)
Non-insured (Control) 30 0(00)
0(00)
30(100)
Karnataka
Loanee 90 45(50.00)
15(16.67)
30(33.33)
Non- loanee 30 0(00)
30(100)
0(00)
Non-insured (Control) 30 0(00)
0(00)
30(100)
Madhya Pradesh
Loanee 90 9(10.00)
81(90.00)
0(00)
Non- loanee 30 1(3.33)
29(96.67)
0(00)
Non-insured (Control) 30 0(00)
0(00)
30(100)
Maharashtra
Loanee 51 25(49.02)
19(37.25)
7(13.73)
Non- loanee 73 38(52.05)
32(43.84)
3(4.11)
Non-insured (Control) 33 0(00)
0(00)
33(100)
Uttar Pradesh
Loanee 90 50(55.56)
40(44.44)
0(00)
Non- loanee 30 18(60.00)
12(40.00)
0(00)
Non-insured (Control) 30 0(00)
0(00)
30(100)
West Bengal
Loanee 90 33(36.67)
57(63.33)
0(00)
Non- loanee 30 7(23.33)
23(76.67)
0(00)
Non-insured (Control) 30 0(00)
0(00)
30(100)
Source: Own compilation

PERFORMANCE EVALUATION OF PRADHAN MANTRI FASAL BIMA YOJANA (PMFBY)
“Uptake and Willingness-To-Pay” 38
In many states such as Assam, Bihar, Gujarat, Himachal Pradesh, Madhya Pradesh, and West Bengal, farmers demanded timely compensation. Farmers in these states also suggest reducing the time taken for paper work completion and to lower the premium amounts. In some states, less time to finish paper work (Maharashtra) and lower premium (Uttar Pradesh) is more preferred over timely compensation. The other suggestions across states include higher compensation, transparency in the scheme, more awareness programs, inclusion of loss of animals and the increasing role of panchayat.
Table 3.6: Overall experiences
State Category Total Number
Better than
earlier schemes
Worse than
earlier schemes
Same as any of the
earlier schemes
Never insured earlier
Can’t say NA
Assam
Loanee 100 0(00)
0(00)
0(00)
75(75)
25(25)
0 (00)
Non- loanee 10 0 (00)
0(00)
0(00)
8(80)
2(20)
0(00)
Non-insured (Control) 40 0
(00)0
(00)0
(00)0
(00)0
(00)40
(100)
Bihar
Loanee 124 22(17.74)
0(00)
10(8.01)
64(51.61)
2419.35
43.23
Non- loanee 0 0(00)
0(00)
0(00)
0(00)
0(00)
0(00)
Non-insured (Control) 31 0
(00)0
(00)0
(00)0
(00)0
(00)31
(100)
Gujarat
Loanee 110 50(45.45)
7(6.36)
10(9.09)
40(36.36)
3(2.73)
0(00)
Non- loanee 10 7(70)
2(20)
0(00)
0(00)
1(10)
0(00)
Non-insured (Control) 30 0
(00)0
(00)0
(00)0
(00)0
(00)30
(100
Himachal Pradesh
Loanee 89 41(46.07)
11(12.36)
15(16.85)
4(4.49)
18(20.22)
0(00)
Non- loanee 31 11(35.48)
5(16.13)
4(12.90)
2(6.45)
9(29.03)
0(00)
Non-insured (Control) 30 0
(00)0
(00)0
(00)0
(00)0
(00)30
(100)
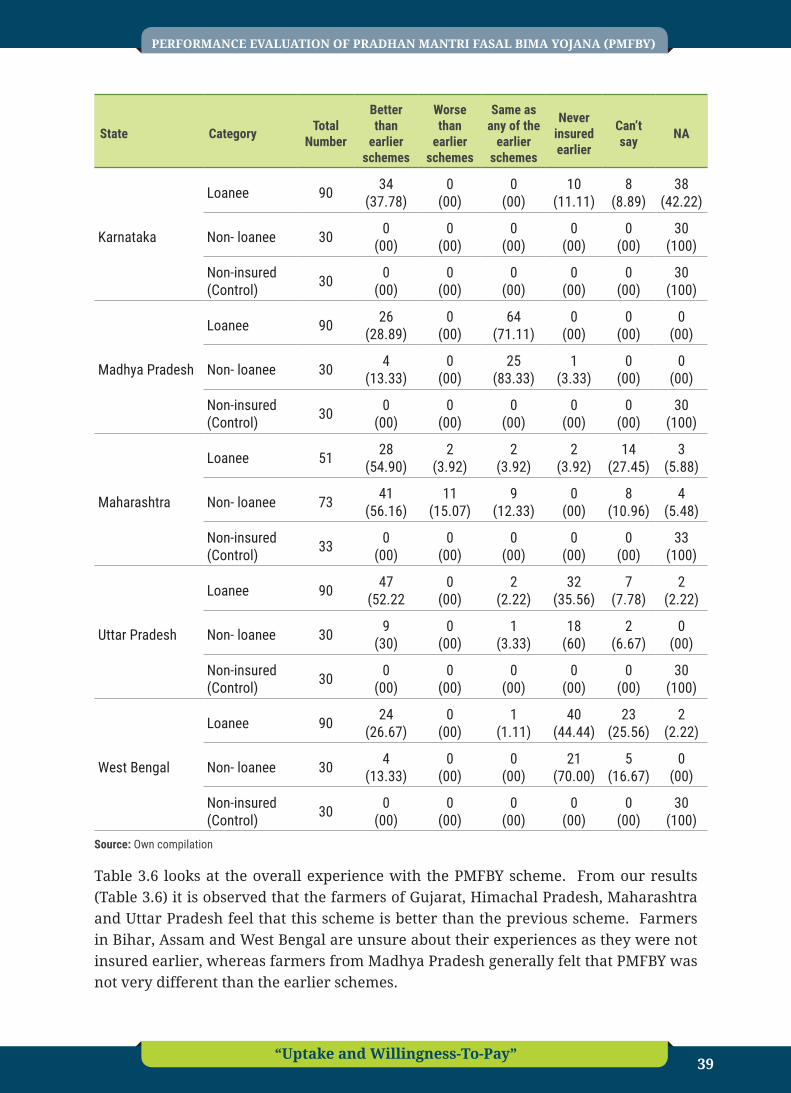
39“Uptake and Willingness-To-Pay”
PERFORMANCE EVALUATION OF PRADHAN MANTRI FASAL BIMA YOJANA (PMFBY)
State Category Total Number
Better than
earlier schemes
Worse than
earlier schemes
Same as any of the
earlier schemes
Never insured earlier
Can’t say NA
Karnataka
Loanee 90 34(37.78)
0(00)
0(00)
10(11.11)
8(8.89)
38(42.22)
Non- loanee 30 0(00)
0(00)
0(00)
0(00)
0(00)
30(100)
Non-insured (Control) 30 0
(00)0
(00)0
(00)0
(00)0
(00)30
(100)
Madhya Pradesh
Loanee 90 26(28.89)
0(00)
64(71.11)
0(00)
0(00)
0(00)
Non- loanee 30 4(13.33)
0(00)
25(83.33)
1(3.33)
0(00)
0(00)
Non-insured (Control) 30 0
(00)0
(00)0
(00)0
(00)0
(00)30
(100)
Maharashtra
Loanee 51 28(54.90)
2(3.92)
2(3.92)
2(3.92)
14(27.45)
3(5.88)
Non- loanee 73 41(56.16)
11(15.07)
9(12.33)
0(00)
8(10.96)
4(5.48)
Non-insured (Control) 33 0
(00)0
(00)0
(00)0
(00)0
(00)33
(100)
Uttar Pradesh
Loanee 90 47(52.22
0(00)
2(2.22)
32(35.56)
7(7.78)
2(2.22)
Non- loanee 30 9(30)
0(00)
1(3.33)
18(60)
2(6.67)
0(00)
Non-insured (Control) 30 0
(00)0
(00)0
(00)0
(00)0
(00)30
(100)
West Bengal
Loanee 90 24(26.67)
0(00)
1(1.11)
40(44.44)
23(25.56)
2(2.22)
Non- loanee 30 4(13.33)
0(00)
0(00)
21(70.00)
5(16.67)
0(00)
Non-insured (Control) 30 0
(00)0
(00)0
(00)0
(00)0
(00)30
(100)Source: Own compilation
Table 3.6 looks at the overall experience with the PMFBY scheme. From our results (Table 3.6) it is observed that the farmers of Gujarat, Himachal Pradesh, Maharashtra and Uttar Pradesh feel that this scheme is better than the previous scheme. Farmers in Bihar, Assam and West Bengal are unsure about their experiences as they were not insured earlier, whereas farmers from Madhya Pradesh generally felt that PMFBY was not very different than the earlier schemes.

PERFORMANCE EVALUATION OF PRADHAN MANTRI FASAL BIMA YOJANA (PMFBY)
“Uptake and Willingness-To-Pay” 40
3.2. ConclusionsAs far as perceptions go, PMFBY has achieved success in many states but also has scope for a better acceptance among the intended stakeholders. The insights presented here can help in making further improvements for a greater take-up of this very important intervention aimed at farmers’ welfare. Leveraging cooperative federalism i.e. seeking more and more involvement of the state, district and village level agencies can enhance the efficiency of the scheme and its take-up.

41“Uptake and Willingness-To-Pay”
PERFORMANCE EVALUATION OF PRADHAN MANTRI FASAL BIMA YOJANA (PMFBY)
Introduction This component of the project3 aimed to primarily focus on the assessment of demand for agriculture insurance, considering the highly popularized Pradhan Mantri Fasal Bima Yojana. Our research has been exploring novel strategies for providing comprehensive risk management solutions to farmers without relying on such massive public expenditures. To this end, this part of the project aimed to elicit farmers’ willingness to pay using discrete choice experiments (DCE’s), a stated preference method in which preferences are estimated based on participants’ responses to hypothetical market scenarios. These survey-based exercises are referred to as experiments because the researcher controls the combination of product characteristics to which the survey participant is exposed. This methodology allows us to better understand Indian farmer’s preferences for various crop insurance packages or elements of crop insurance packages in a way not typically feasible using other means. In particular, we are interested in better understanding farmers’ preferences for insurance coverage period, method of yield loss assessment, total sum insured, levels of actuarially fair premium rates and timing of insurance payouts. While our choice sets are agnostic to any specific insurance scheme, they include what are believed to be all the important attributes that are present in the current large-scale new insurance program in India, as well as some features that could rather easily be integrated into this program. Thus, our results not only contribute to the broader literature on WTP for multi-peril crop insurance, but are also valuable for Indian policymakers in their efforts at optimizing insurance design.
3 This chapter has been written and compiled based on contributions of Patrick Ward (Duke Kunshan University), Vartika Singh (IFPRI), Shweta Gupta (IFPRI) and IIMA team.
Chapter 4
Willingness-To-Pay

PERFORMANCE EVALUATION OF PRADHAN MANTRI FASAL BIMA YOJANA (PMFBY)
“Uptake and Willingness-To-Pay” 42
4.1. LiteratureA fundamental question that has bothered scholars, policy makers and markets alike over the past few decades is: how valuable is crop insurance for farmers? In developed countries, there is no evidence to suggest that risk aversion among farmers is high enough to pay for purely private actuarial premiums (Goodwin, 2001, Smith and Glauber, 2012). Patrick (1988) found almost negligible willingness to pay full costs of offering insurance above the actuarially fair premium, and no buyers in the instance of loading factor exceeding 20 percent. In another assessment, farmers were not willing to pay higher than 5 percent of the actuarially fair premium (Bardsley et al., 1984). In developing countries, crop insurance is one of the many tools governments use to smooth farm incomes, in addition to policy mechanisms such as quotas, minimum support prices, input subsidies, and low interest agricultural loans, among others (Mahul and Stutley, 2010). In the presence of these, it is difficult to find out what is the real demand for insurance. Some options may also promote moral hazard where a combination of high input subsidy, low interest loans and insurance leads to poor management practices in a low investment - assured return setting (Hazell and Hess, 2010). In South Asia, a peculiar interaction further complicates the understanding of insurance demand: forgiveness of agricultural credit. This hampers the loan repayment culture and the solvency of banks (Report GoB, 2009) while simultaneously failing to translate increased liquidity into higher agricultural investments or productivity (Kanz, 2016). In some recent interactions with farmers in the Indian state of Karnataka, the authors discovered that indebted farmers do not visit rural banks (that are in-charge of managing insurance). This is out of both a fear of having to repay a loan and the hope that there will be a political intervention during an election cycle whereby outstanding loans would be forgiven in an attempt to shore up support among rural communities (Ghosh, 2018)
Consequently, estimating insurance demand through observed prices (in this case, premium rates) may not paint a complete picture about the potential for or constraints within rural financial markets. Therefore, in recent times, there have been some, though very limited, efforts to estimate demand or the WTP for insurance using direct valuation methods, such as contingent valuation (CV) or DCEs. Arshad et al. (2016) performed a double-bound dichotomous choice-based CVM to elicit WTP insurance premiums in a hypothetical insurance market for two extreme weather events, floods and droughts. The experimental sample consisted of 240 farmers from across 12 agro-climatic zones of Pakistan. Only 28.44% of respondents were willing to opt for insurance which meant a very low WTP of 627 PNR (Pakistani rupees) per year per acre of land for drought and PNR 659 per year per acre for floods. The WTPs were inversely related to the bid values and accesses to canal irrigation, whereas were directly related to incomes. Although low in values, positive WTPs for crop insurance confirmed that there is a potential to develop agricultural insurance markets in Pakistan. Liesivaara and Myyrä (2017) conducted a split sample DCE to include disaster aid as a constant variable in estimating

43“Uptake and Willingness-To-Pay”
PERFORMANCE EVALUATION OF PRADHAN MANTRI FASAL BIMA YOJANA (PMFBY)
WTP for different attributes of a crop insurance product in Finland. They found that expectations of disaster relief meant farmers would be less worried about crop losses. In such a situation, premiums would have to be highly subsidized for insurance take-up implying expansive use of taxpayers’ money for very low marginal benefits. Essentially, the government would be better off spending either on premium subsidies or on disaster relief, but not on both.
The Liesivaara and Myyrä (2017) study evaluates attributes of an insurance product, but the relevance of the insights are largely limited to the EU context. Moreover, the focus has been on interaction with co-risk mitigation options. Other studies (e.g., Arshad et al., 2016; Fahad and Jing, 2018, both in Pakistan) give meaningful insights for insurance demand in a developing country context, but have limitations of their own. First, the assessment is for two named perils, floods and droughts, thus limiting insights on multi-peril insurance products. Second, they adopt a holistic CV approach which can only speak generally of WTP for insurance. This approach yields little insight on farmers’ valuations for various features of insurance contracts (such as coverage period, timeliness of indemnity payments, or loss assessment), and thereby does not help in optimizing insurance design. An assessment of WTP for multi-peril insurance in India, that also evaluates the preferences for attributes, is therefore, invaluable to understand insurance demand behavior in developing countries more comprehensively. This is especially true in a context where one of the largest governments subsidized multi-peril insurance programs in the world is currently operational. It provides an opportunity to validate outcomes and experiment with optimized insurance design.
4.2. MethodologyAs has been discussed, discrete choice experiments allow researchers to analyze stated preferences for products or services, but beyond that they allow researchers a means for parsing out preferences for specific characteristics or attributes of a good or service. This is particularly useful if the researcher believes, as Lancaster (1966) suggested, it is not the good or service that is the object of utility, but rather it is from the underlying characteristics of the good or service from which utility is derived. In a discrete choice experiment, preferences are elicited through survey participants’ responses to a series of hypothetical choice scenarios. These survey-based exercises are referred to as experiments because the researcher controls the combination of product characteristics to which the survey participant is exposed.
It is typically assumed that observed choices arise from a process of random utility maximization (McFadden, 1974). Specifically, within the context of a discrete choice experiment, it is assumed that the observed (stated) choice that an individual makes within a particular choice scenario is the choice that, on average, maximizes her utility among the set of potential alternatives. Utility consists of both a systematic (deterministic) component, and a stochastic component. The deterministic component

PERFORMANCE EVALUATION OF PRADHAN MANTRI FASAL BIMA YOJANA (PMFBY)
“Uptake and Willingness-To-Pay” 44
reflects individual tastes and preferences that map the expression of product characteristics directly into utility, while the stochastic component reflects, among other things, random variations in tastes and preferences and errors in optimization. We can write our random utility model as:
* ' /ijt ijt i ijt iu x b e (1)
where *ijtu is the observed indirect utility (i.e., the utility of the utility maximizing
option j) obtained by individual i during choice scenario t, xijt is a vector of insurance policy characteristics or attributes, bi is a vector of preference weights, eijt is a mean zero, independently and identically distributed error term, and i is a scale factor. It is not possible to separately identify i, so in standard practice it is assumed that i can be normalized to 1. Taking partial derivatives of *
ijtu with respect to the attributes provides estimates for the change in utility associated with incremental changes in the expression of the attributes; in other words, the bi terms can be directly interpreted as marginal utilities. The ratio of two marginal utilities is directly interpretable as the marginal rate of substitution between the two attributes (i.e., the rate at which an individual would be willing to give up a unit of the attribute in the denominator to acquire an increment of the attribute in the numerator). If one of the marginal utilities is the marginal utility of income, then the marginal rate of substitution with respect to income is an estimate of WTP. We are rarely able to directly observe the marginal utility, but this can be proxied by the marginal disutility of product cost. Since cost is almost always deemed to be one of the important features driving purchase decisions, it is almost universally included as an attribute in a DCE. An estimate for the WTP for a specific attribute would therefore just be the ratio of the marginal utility of the attribute to the marginal disutility of product price.
If one assumes that preferences are fixed in the population, then estimating marginal utilities and arriving at estimates for WTP is relatively straightforward using conditional logit estimation. The assumption of fixed (or constant) preferences in the population is quite restrictive, however, and imposes some potentially unrealistic assumptions on, among other things, the substitution patterns that are permitted by the model. A common approach to incorporating preference heterogeneity is to estimate the choice model using a mixed logit (also known as a random parameter logit) model. Under this approach, the researcher assumes a distribution for the preference parameters, and derives an estimate for WTP as the ratio of the random parameters. This approach, however, can lead to distributions for WTP that have undefined moments (e.g., the ratio of two normally distributed random variables takes a Cuachy distribution, for which neither the mean nor the variance is defined). Train and Weeks (2005) suggested a modification to equation (1) in which the underlying utility model is re-parameterized and specified in willingness-to-pay space rather than preference space. In particular, we can re-write the utility function as

45“Uptake and Willingness-To-Pay”
PERFORMANCE EVALUATION OF PRADHAN MANTRI FASAL BIMA YOJANA (PMFBY)
* '[ ]ijt i ijt ijt i ijtu p x Ya e (2)
where pijt is the price of option j faced by individual i during choice scenario t, and Yi= bi /ai. Now, rather than assuming the distributions for the marginal utilities, the researcher can directly specify the distribution for WTP without having to worry about ratio distributions with undesirable properties. This model can then be estimated by appealing to the generalized multinomial logit (GMNL) model developed by Fiebig et al. (2010), which Hensher and Greene (2010) have demonstrated is a generalization of choice models estimated in both preference space as well as WTP space.
To allow for even greater flexibility in estimation, we consider the possibility that the randomly distributed WTPs for the different insurance product attributes could be correlated. As was previously mentioned, if there is scale heterogeneity, then WTPs will be correlated by definition, and even if there is no scale heterogeneity, there is the possibility for correlated WTPs simply due to correlation among preferences for different attributes. Hensher, Rose, and Greene (2015) have further noted that, in virtually all data sets, there are likely unobserved effects that are correlated among alternatives in a given choice situation and allowing for WTP parameters to be correlated is one way to account for this. Failing to control for this can lead to imprecise estimates of WTP, which has obvious implications for the reliability of the policy implications that be derived from these estimates (Mariel & Meyerhoff, 2018).
In the present study, our principal interest is to evaluate Indian farmers’ preferences for various elements of crop insurance. While there are potentially innumerable different dimensions with which to characterize and differentiate insurance products, to maintain tractability we are necessarily limited in the scope of attributes over which we can attempt to elicit preferences. As such, we narrowed the field of potential attributes to those which we assumed would be particularly salient in farmers’ minds when they evaluate risk management alternatives. We were interested in estimating farmers’ preferences for the insurance coverage period, the method of loss assessment, the delivery of insurance payments, the coverage amount (referred to in the Indian context as the insured sum), and the cost of insurance. For the coverage period, there are several potential alternatives that insurance providers could consider. For example, under PMFBY, insurance covers the entire period from pre-sowing until after harvest. Other alternatives could include only the period from sowing until harvest, or merely pre-sowing or post-harvest. We also included in our experiment a variable capturing the insured sum of the hypothetical insurance policies.

PERFORMANCE EVALUATION OF PRADHAN MANTRI FASAL BIMA YOJANA (PMFBY)
“Uptake and Willingness-To-Pay” 46
Table 4.1: Attributes and attribute levels included in discrete choice experiment
Attribute Levels
Coverage period
Pre-sowing to post-harvest Sowing to harvest Pre-sowing only
Post-harvest only
Method of loss assessment
Crop-cutting exercise at village/panchayat
Remote-sensing (satellite) based metric
Rainfall-based index (pays out if rainfall less than 75 percent of historical average)
Timing of insurance payments
Within six weeks of loss assessment (100 percent guaranteed)
50 percent change of payment within six weeks; 50 percent chance payment more than 6 months delayed
Insured sum INR 20,000/hectare INR 30,000/hectare INR 40,000/hectare
Premium 2.5 percent of insured sum 4 percent of insured sum 10 percent of insured
sum
This is not because we were especially interested in preferences for larger policies versus smaller policies (we would assume a priori that larger payouts would be preferable to smaller payouts), but more so because we needed for there to be a baseline against which the study participants could evaluate the policy premium and the other insurance policy characteristics. In our experiment, we allowed for the insured sum to take three possible levels, specifically INR 20,000, INR 30,000, or INR 40,000 per hectare. Table 4.1 summarizes the various attributes of an insurance policy and their various level included in this experiment. Figure 4.1 below is a snapshot of 1 of the choice sets used in the experiment, 6 of each were faced by every respondent in the survey.

47“Uptake and Willingness-To-Pay”
PERFORMANCE EVALUATION OF PRADHAN MANTRI FASAL BIMA YOJANA (PMFBY)
Figure 4.1: Example choice setNote: Choice sets were translated in local languages (Hindi for Uttar Pradesh and Himachal Pradesh, Kannada for Karnataka, and Gujarati for Gujarat) to ensure respondents could read and interpret the choice sets with aid from the enumerators.
4.3. DataThe data used in the present study come from a household survey conducted across four Indian states (Gujarat, Himachal Pradesh, Karnataka, and Uttar Pradesh). Table 4.2 provides some basic characteristics of the households included in the sample. While not intended to be nationally representative, the diversity of state coverage allows for some heterogeneity in agro-ecological and social conditions. The survey and DCE were conducted from mid-February to mid-March 2018, with most agricultural questions

PERFORMANCE EVALUATION OF PRADHAN MANTRI FASAL BIMA YOJANA (PMFBY)
“Uptake and Willingness-To-Pay” 48
targeted toward kharif (monsoon season) 2017. Two staff members of the Agricultural Economics Research Centres (AERCs) from each of the states were trained in New Delhi for four days on the survey methodology, including the use of digital data collection methods (computer-assisted personal interviewing, or CAPI) and the specific CAPI software that would be used (SurveyCTO). We also partnered with a private survey firm to provide enumerator support to AERC staff in technical issues around the usage of tablets, data collection, monitoring and data transmittal to the central server. Daily monitoring of the field data was conducted by research staff from the International Food Policy Research Institute and Centre for Management in Agriculture to ensure that regular feedback was provided to the survey teams.
Table 4.2: Descriptive statistics of sample households
Full Sample Gujarat Himachal
Pradesh Karnataka Uttar Pradesh
Age47.84 51.69 48.04 43.81 47.83
(0.54) (1.02) (1.08) (1.05) (1.10)
Gender (proportion male)0.86 1.00 0.59 0.89 0.97
(0.01) 0.00 (0.04) (0.03) (0.01)
Farming experience (in years)24.55 26.09 25.86 21.39 24.84
(0.57) (1.16) (1.19) (1.02) (1.11)
General caste (proportion)0.50 0.70 0.74 0.30 0.24
(0.02) (0.04) (0.04) (0.04) (0.04)
Other backward class (proportion)0.34 0.20 0.04 0.42 0.68
(0.02) (0.03) (0.02) (0.04) (0.04)
Scheduled tribe/Scheduled caste (SC/ST; proportion)
0.16 0.10 0.22 0.25 0.08
(0.02) (0.03) (0.03) (0.04) (0.02)
Area cultivated during kharif 2017 (acres)5.39 9.61 2.25 6.43 3.32
(0.31) (0.71) (0.29) (0.85) (0.24)
Total grain harvested during kharif 2017 (tonnes)
4.99 8.82 1.43 6.22 3.54
(0.53) (1.52) (0.50) (1.31) (0.33)
AERC staff surveying in Gujarat. Pic credit: Diana Frenchman

49“Uptake and Willingness-To-Pay”
PERFORMANCE EVALUATION OF PRADHAN MANTRI FASAL BIMA YOJANA (PMFBY)
Full Sample Gujarat Himachal
Pradesh Karnataka Uttar Pradesh
Primary kharif crop is rice (proportion)0.70 0.94 0.0112.986679 0.85 1.00
(0.02) (0.02) (0.01) (0.03) 0.00
Primary kharif crop is maize (proportion)0.22 0.00 0.85 0.01 0.00
(0.02) 0.00 (0.03) (0.01) 0.00
Duration of primary crop from sowing to harvest (days)
119.63 123.59 106.04 142.61 106.67
(1.24) (1.91) (2.15) (2.80) (1.53)
Insured during kharif 2017 (proportion)0.11 0.11 0.06 0.14 0.14
(0.01) (0.03) (0.02) (0.03) (0.03)
Insured in 2017 because loanee farmers (proportion)
0.09 0.11 0.06 0.08 0.12
(0.01) (0.03) (0.02) (0.02) (0.03)
Number of observations 572 142 144 142 144Note: Standard errors in parentheses
4.4. Findings Table 4.3 produces the WTP estimates from the discrete choice experiment estimated by (1) scaled multinomial logit and (2) generalized multinomial logit. Results from the choice experiment suggest that farmers highly value full coverage for their cropping seasons, as indicated by the negative coefficients on the other coverage period attributes. Farmers would require significant discounts for policies covering only the pre-sowing or only the post-harvest periods, while demanding smaller discounts for policies covering the period from sowing to harvest. These results would indicate that farmers perceive some risk of crop loss due to sources apart from just rainfall (which, due to prevailing monsoon-season production practices, would presumably be covered by a policy covering the period from sowing to harvest).
Farmers have a clear preference for the prevailing loss assessment practice of crop-cutting exercises at the panchayat level. Consequently, they would require discounts for policies in which the method of assessment was either remote sensing or rainfall indices, though farmers seem less sensitive to alternative loss assessment methods than they do changes in the coverage period. This result has potentially important implications for overall insurance costs. Crop-cutting exercises are quite expensive to implement on any sort of scale, so although farmers would typically be willing to pay more for insurance policies backed by crop cutting assessments, the higher costs associated with these policies may impinge on insurers’ profit margins. These other loss assessment methods are considerably less expensive, so although farmers are not willing to pay as much for these policies as they would those with losses determined by crop cutting exercises, such policies may prove to be more profitable on a per policy basis. Ultimately a more thorough analysis would be required to make such a determination.

PERFORMANCE EVALUATION OF PRADHAN MANTRI FASAL BIMA YOJANA (PMFBY)
“Uptake and Willingness-To-Pay” 50
Table 4.3: Utility function estimates from discrete choice experiment
(1) (2)
S-MNL GMNL
WTP FOR PRODUCT CHARACTERISTICS: -
Coverage: Sowing to harvesting -0.991*** -0.977***
(0.198) (0.202)
Coverage: Pre-planting -4.403*** -5.004***
(0.4) (0.474)
Coverage: Post-harvest -4.531*** -4.807***
(0.376) (0.411)
Loss determination: Remote sensing -0.245 -0.435**
(0.186) (0.194)
Loss determination: Rainfall index -0.028 -0.433**
(0.182) (0.196)
Certainty of payment 1.06*** 1.014***
(0.185) (0.165)
Sum insured 0.12*** 0.098***
(0.01) (0.009)
het. (Intercept) 1.136*** -0.212
(0.072) (0.178)
DISTRIBUTION OF WTP:
SD (Coverage-Sowing to harvesting) 2.213***
(0.314)
SD (Coverage- Pre-planting) 3.791***
(0.401)
SD (Coverage-Post-harvest) 3.485***
(0.396)
SD (Loss determination -Remote sensing) 2.061***
(0.239)
SD (Loss determination -Rainfall index) 2.140***
(0.258)
SD (Certainty of payment) 0.767*
(0.351)
SD (Sum insured) 0.054***

51“Uptake and Willingness-To-Pay”
PERFORMANCE EVALUATION OF PRADHAN MANTRI FASAL BIMA YOJANA (PMFBY)
(1) (2)
S-MNL GMNL
(0.015)
Tau 1.152***
SD (Tau) (0.163)
Log likelihood function value 3164.249 3041.031
Number of iterations 8 187
Number of Halton draws used 1 1000
Number of choice observations (N) 3432 3432
Number of choice sets per individual (K) 6 6
Number of individuals (N/K) 572 572
Standard errors in parenthesis
***Significant at 1 percent; **Significant at 5 percent; *Significant at 10 percent
We find that farmers are willing to pay a significant premium for insurance if they could believe that payments would be timely (i.e., guaranteed within six weeks of loss assessment). Concerns about payment delivery are likely one of the factors constraining the diffusion of insurance, as can be seen in the current experiences under PMFBY. With other potential methods of loss assessment available that could speed up the turnaround time, it may be possible for insurance providers to guarantee more timely insurance payments, thereby re-capturing some of the cost of insurance that might have been lost due to offering discounts for remotely-sensed or index-based loss assessments.
Finally, the estimates suggest that farmers would be willing to pay significantly higher premiums than they currently are asked to pay overall. We find that on average, farmers would be willing to pay nearly a 10 percent premium for a policy like the existing policies being offered under PMFBY. This premium amount is still low relative to what would likely be needed for insurance (especially an indemnity-based insurance product with high administrative and loss assessment costs) to be commercially viable but is still nearly 4 times higher than the premiums they are currently paying under PMFBY. At the same time, the results from the distribution of utility parameters suggest that there is presence of heterogeneity in these estimates indicating several individual specific characteristics that need to be considered.


53“Uptake and Willingness-To-Pay”
PERFORMANCE EVALUATION OF PRADHAN MANTRI FASAL BIMA YOJANA (PMFBY)
Any country that is serious about its developmental goals cannot ignore the importance of insuring farmers against unintended losses. Farming is the largest private enterprise of Indians. There are two key differences though: inputs and outputs are plagued with uncertainties of the highest order, unlike any other private business; moreover, the distribution, pricing and value chains are more of public goods, again unlike a traditional private business. So, farmers cannot be left to fight it out alone. Take the example of maize cultivation in Bihar, touted as a very promising crop for the state with high production value. Earlier this year, researchers from the government’s Agro-Economic Research (AER) system had alerted that transport, logistics and processing plants need to be strengthened for maize markets in Bihar to thrive. Action was initiated on that front, with a processing plant also potentially making substantial investment. But as farmers ramped up cultivation hoping for a good season, a significant quantity of maize turned out not to have kernels (cobs)! Reportedly, several suicides in Bihar earlier this year have been linked to maize failure. This is agriculture in India. Post production uncertainties do not seem to be going away anywhere.
Insurance in such situation is a necessity. Moreover, given the low awareness and education level of farmers, it has to be mandatory. Wherever there are private players involved, there has to be an extra dose of regulatory supervision. Up to this point, the Pradhan Mantri Fasal Bima Yojana (PMFBY), has struck all the right cords. Unlike the previous schemes such as MNAIS, PMFBY has opened the possibilities for private insurers while cushioning the farmers with a very high premium subsidy, thus introducing competition. It follows an area-based approach, minimizing basis risk present in other indicator-based insurance schemes and covers a range of non-preventable risks from prevented sowing to post-harvest losses. As part of an exercise, commissioned by the Ministry of Agriculture, and conducted by IIM Ahmedabad with the support of publicly funded Agro-Economic Research Centers (AERCs), we extracted district wise data in – Assam, Bihar, West Bengal, Uttar Pradesh, Himachal Pradesh,
Chapter 5
Summary and Policy Insights

PERFORMANCE EVALUATION OF PRADHAN MANTRI FASAL BIMA YOJANA (PMFBY)
“Uptake and Willingness-To-Pay” 54
Gujarat, Maharashtra, Madhya Pradesh and Karnataka, for the latest available year of PMFBY’s implementation, that is, Kharif and Rabi, 2016/2017. We also collected state-level general statistics for the immediate past year 2017-18. In addition, we conducted primary surveys in several states (details provided in earlier chapters) to find out close approximation of what drives farmers towards insurance and how much are they willing to pay for purchase of multi-peril or named insurance products. The data (both primary and secondary) is collected up to March, 2018 and in some cases up to May, 2018. Hence our numbers, estimates and analysis do not cover the developments that have taken place beyond that period.
To summarize, a total of over 5.5 crore farmers were officially insured under PMFBY in 2016-17. Out of this, nearly 75% farmers got mandatory coverage if they had applied for any seasonal crop loans, premiums for which got deducted from the loan amounts. Twenty-five percent of the insured opted for insurance voluntarily. Among the sampled states, Maharashtra saw the highest enrollment followed by Uttar Pradesh and West Bengal, whereas states like Gujarat, Karnataka and Himachal Pradesh have witnessed very low uptake. A total cultivable area of roughly 5.5 crore hectare (Ha) has been insured. This means on an average, 1 Ha per farmer has been insured in the year 2016-17. The gross premium collected by insuring companies was Rs. 16,399 crores in Kharif season and Rs. 5,826 crores in Rabi, making it a total of Rs. 22,165 crores in year 2016-17 (Table 1). Private insurance companies share in this was Rs. 10,390 crores, nearly 46% of the total, whereas public agencies (primarily Agricultural Insurance Company, AIC) collected Rs. 11,774 crores or 54%. Out of the total gross premium collected, the insurance companies paid out Rs. 13,858 crores, as claims to beneficiary farmers. This makes the claims-to-premium (CP) ratio close to 62.5%. In Kharif the CP ratio was lower at 59.4%, but was a notch higher at 71.3% in Rabi. The CP ratio was nearly same for private as well as public agencies.
In 2017-18 (as recorded till 31.05.18), total farmers insured under the scheme was 5.01 crores (taking both Kharif and Rabi together). This is a reduction of 10.27% from the previous Year 2016-17. Assam, Jammu & Kashmir, Orissa, Karnataka and Meghalaya saw the highest gains in enrollment. Bihar, Goa, Kerala, Rajasthan and Uttar Pradesh saw a fall in enrollment. The total insured area decreased 13.27% to 4.89 crore Ha. The area insured per farmer in 2017-18 was 0.98 Ha. which is 0.02 Ha. lesser than 2016-17. The total sum insured under the scheme in year 2017-18 was Rs. 1.91 Lakh crores with a marginal 0.12% increase from 2016-17. The sum insured per farmer increased by Rs. 4,597 and sum insured per hectare increased by Rs. 3,580. The total premium collected by insuring agencies in year 2017-18 was Rs. 23,206.18 Crores, which was an increase of 11.6% compared to the previous year’s collections. The average premium paid per farmer was Rs. 4,634 which was 20% higher than what farmers paid in 2016-17. Some significant additions in states have taken place in 2017-18. The most striking is Jammu & Kashmir, Assam, Kerala and Sikkim which saw major expansions as in most of these states PMFBY was implemented for the first time in the Kharif season, 2017. Around 1.46

55“Uptake and Willingness-To-Pay”
PERFORMANCE EVALUATION OF PRADHAN MANTRI FASAL BIMA YOJANA (PMFBY)
lakh farmers in these states got insured for the first time during Kharif 2017. However, majority of the north-eastern states have yet to see any penetration of PMFBY.
Where PMFBY needs greater push is the implementation. For instance, the core edifice on which any successful crop insurance (or for that matter, any insurance) depends is accurate loss assessment. In the case of crop insurance, it is assessment of how much actual yields varied from average expected yields for a particular crop in a particular region. Given the tens of millions of small and medium sized farm plots in India, the only way to achieve this is to go for a rigorous sampling of plots and do yield assessment. In technical terms this is called as Crop Cutting Experiments (CCEs). Now, assuming, there are two plots selected per Gram Panchayat level (for the insured crop), at the end of every harvest season we will need 35-40 Lakh (3.5 to 4 million) CCEs, and all simultaneously – this simply means so many dedicated agricultural officers at one time performing a coordinated exercise.
Manual Crop Cutting Experiments (CCEs) are not only inadequate but also prone to human errors and manipulation, by different stakeholders. During our field research in various states, we found that in many instances the primary agricultural workers side with the insurers in providing inflated yield data. Interestingly, in many places, farmers also manipulate yield assessment. When a farm is selected at the beginning of the sowing season as an experimental plot for CCEs, neighboring farmers bribe the selected farmer to ensure there is poor farm management practice and thereby low yield. Insurance agencies find it difficult to send their staff for each and every CCE as they do not have built-in local infrastructure or offices. A related problem faced by insurance agencies is formulating a long-term plan due to the lowest bid (L1) bidding system every year. Insurers have to offer lowest possible actuarial premiums, at the same time accounting for a variety of risks. This generates pressure on their management to prevent or delay claims by raising objections on yield data. Since the agencies are not sure if they will win the bids in the same region in the next season, they have hardly any incentive to set up rural infrastructure. This small operational window incentivizes short-term profit maximization and fly-by-night attitudes.
There are implementation issues on the farmer enrollment side as well: while PMFBY is mandatory for loanee farmers it is not always the case as, de-facto, farmers do have a choice to opt out even if they have taken seasonal agricultural loans. For instance, in low risk areas having good access to irrigation and inputs, farmers want to avoid paying premiums. In such cases, banks get a written consent from farmers that in the particular village panchayat level, PMFBY should not be implemented. In fact, we observed that there is a tendency for local rural banks to avoid implementing PMFBY. Reason? PMFBY puts additional burden on the already stressed IT infrastructure of the banks. This is also the main reason why claim disbursements are getting inordinately delayed, season after season. Unless banks upload the data to the Central Crop Insurance Portal (www.pmfby.gov.in) correctly, the companies cannot demand it from the state government. Further, unless the state government gives the subsidy, central government won’t
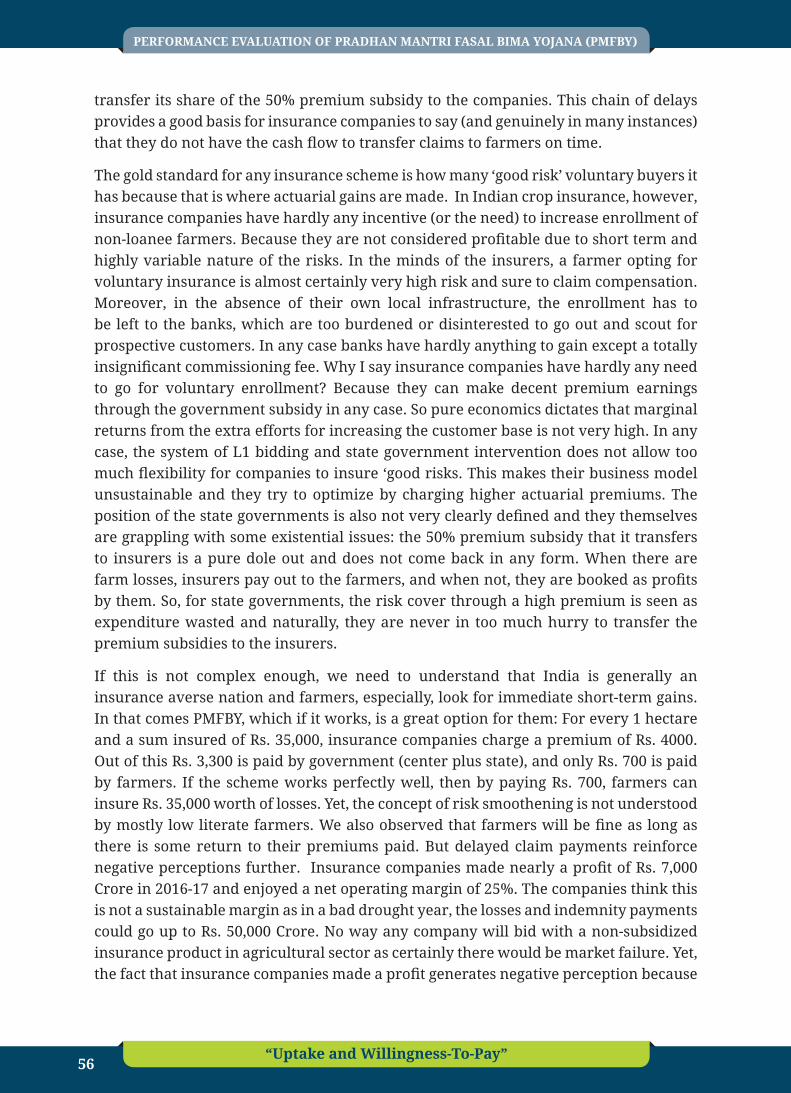
PERFORMANCE EVALUATION OF PRADHAN MANTRI FASAL BIMA YOJANA (PMFBY)
“Uptake and Willingness-To-Pay” 56
transfer its share of the 50% premium subsidy to the companies. This chain of delays provides a good basis for insurance companies to say (and genuinely in many instances) that they do not have the cash flow to transfer claims to farmers on time.
The gold standard for any insurance scheme is how many ‘good risk’ voluntary buyers it has because that is where actuarial gains are made. In Indian crop insurance, however, insurance companies have hardly any incentive (or the need) to increase enrollment of non-loanee farmers. Because they are not considered profitable due to short term and highly variable nature of the risks. In the minds of the insurers, a farmer opting for voluntary insurance is almost certainly very high risk and sure to claim compensation. Moreover, in the absence of their own local infrastructure, the enrollment has to be left to the banks, which are too burdened or disinterested to go out and scout for prospective customers. In any case banks have hardly anything to gain except a totally insignificant commissioning fee. Why I say insurance companies have hardly any need to go for voluntary enrollment? Because they can make decent premium earnings through the government subsidy in any case. So pure economics dictates that marginal returns from the extra efforts for increasing the customer base is not very high. In any case, the system of L1 bidding and state government intervention does not allow too much flexibility for companies to insure ‘good risks. This makes their business model unsustainable and they try to optimize by charging higher actuarial premiums. The position of the state governments is also not very clearly defined and they themselves are grappling with some existential issues: the 50% premium subsidy that it transfers to insurers is a pure dole out and does not come back in any form. When there are farm losses, insurers pay out to the farmers, and when not, they are booked as profits by them. So, for state governments, the risk cover through a high premium is seen as expenditure wasted and naturally, they are never in too much hurry to transfer the premium subsidies to the insurers.
If this is not complex enough, we need to understand that India is generally an insurance averse nation and farmers, especially, look for immediate short-term gains. In that comes PMFBY, which if it works, is a great option for them: For every 1 hectare and a sum insured of Rs. 35,000, insurance companies charge a premium of Rs. 4000. Out of this Rs. 3,300 is paid by government (center plus state), and only Rs. 700 is paid by farmers. If the scheme works perfectly well, then by paying Rs. 700, farmers can insure Rs. 35,000 worth of losses. Yet, the concept of risk smoothening is not understood by mostly low literate farmers. We also observed that farmers will be fine as long as there is some return to their premiums paid. But delayed claim payments reinforce negative perceptions further. Insurance companies made nearly a profit of Rs. 7,000 Crore in 2016-17 and enjoyed a net operating margin of 25%. The companies think this is not a sustainable margin as in a bad drought year, the losses and indemnity payments could go up to Rs. 50,000 Crore. No way any company will bid with a non-subsidized insurance product in agricultural sector as certainly there would be market failure. Yet, the fact that insurance companies made a profit generates negative perception because

57“Uptake and Willingness-To-Pay”
PERFORMANCE EVALUATION OF PRADHAN MANTRI FASAL BIMA YOJANA (PMFBY)
this is profit made on perceived ‘agrarian distress’. Moreover, it is government aided subsidy which ensures that insurance companies can operate under such high risk-high premium market, thereby making profits in good year. This further fuel the negative public perception. Are there ways to improve uptake, implementation and perceptions? We take it up in the final part of the article series. However, given the experience so far, there is hardly any doubt that PMFBY seems to be taking shaky steps, but in the right direction.
We then focus on what can be done to warrant higher acceptability and effectiveness. A new model of financial administration can be thought of which ensures companies make sustainable profits. According to one top expert this is akin to a ‘cap-and-cup’ approach. Insurance companies can carry the risk with a cap of, say, 120% and a cup of, say, 80%. Which means pure losses (claim ratio i.e., claim/premium) on the insurer’s book beyond 120% falls on Centre and State at a pre-agreed ratio of 50:50 or 60:40, whereas surplus arising out of pure losses below 80% is ploughed back to the Centre and State in the same pre-agreed ratio. The Centre and State have to create a separate crop insurance fund (as there was during CCIS regime) which will be used only for crop insurance. The participating insurance company will be given parameterized target to perform and receive performance-linked-incentive or be penalized for below-par performance. Essentially, this means that in a profit year, insurance companies will plough back all the money beyond its normal capped profit to the PMFBY managed special fund. In a loss year, this fund can be used to compensate the company’s losses. This will reduce the cost of re-insurance and ensure companies keep participating while farmers get assured claims when under losses.
Another vital plug is a higher reliance on technology for yield assessment, and not, on humans. There have been many successful pilots using variation of technologies internationally (especially in Africa and South Asia), that have demonstrated that human intervention can be minimized, and relegated only to ground truthing of satellite or imagery data. Closer home, the Agricultural Insurance Company (AIC), India’s largest crop insurer, has had a successful experience with using technology interventions in the RIICE project in Tamil Nadu. Satellite imagery and Remote Sensing Technology (RST) can provide area estimation of crop with 90% accuracy at village/panchayat level. Combined with ground-truthing, reasonable yield assessment can be made. Several indices are already available: Normalized Difference Vegetation Index (NDVI), Normalized Difference Wetness Index (NDWI), Standard Precipitation Index (SPI), Vegetation Health Index (VHI), Leaf Area index (LAI). European Space Agency has come up with Sentinel Series (Copernicus Program). Crop signatures, protocols and auxiliary variables need to be developed. However, what is absolutely non-negotiable is that some scientific institution of high repute, capability and intent such as the National Remote Sensing Centre (NRSC) of Indian Space Research Organization (ISRO) has to lead it. No less credible, talented and independent an institution, which is also devoid of conflicts of interest can be trusted to carry this out. Certainly, no routine bureaucratic, quasi-scientific organization is capable of being an effective conduit.

PERFORMANCE EVALUATION OF PRADHAN MANTRI FASAL BIMA YOJANA (PMFBY)
“Uptake and Willingness-To-Pay” 58
On the agency front, rather than being focused on increasing the breadth of participation through bids from a higher number of private insurers, for the teething years there should be emphasis on deepening experience and expertise. Once companies with deep assets are empaneled, they should be given longer operational windows. The system of L1 bidding with high frequency does not generate incentive for long term investments in supporting infrastructure (especially by private companies) unless there is at least a three-year window. Such a short window is only full of moral hazards. There are several other improvements required such as faster processing or uploading of data through the web portal (which is a great enabler), re-assessing the role of coordination committees that should include independent experts, a big push in generating awareness of PMFBY, land record digitization to include tenant farmers and linking with Aadhar eventually. Bringing about these changes on a dynamic basis, cannot be left to the limited mind space of busy bureaucrats. It requires deeper institutional memory. Maybe it requires a strong, credible and independent institutional mechanism to be set up. This may require a legislation on agricultural insurance eventually, but for foundations to be strengthened and long run horizon in mind, steps in this direction will sooner or later become a compulsion. PMFBY is a good blend of a yield-index insurance product that takes care of systemic or covariate risks associated with widespread vagaries of weather as well as idiosyncratic losses. No scheme previously has offered such a comprehensive protection. With the indexed weather-based insurance products also struggling to maintain popularity, the field is all open for PMFBY to become the prime source of risk smoothening for the Indian farmers.

59“Uptake and Willingness-To-Pay”
PERFORMANCE EVALUATION OF PRADHAN MANTRI FASAL BIMA YOJANA (PMFBY)
ARSHAD, M., AMJATH-BABU, T., KÄCHELE, H. & MÜLLER, K. 2016. What drives the willingness to pay for crop insurance against extreme weather events (flood and drought) in Pakistan? A hypothetical market approach. Climate and Development, 8, 234-244.
BARDSLEY, P., ABEY, A. & DAVENPORT, S. V. 1984. The economics of insuring crops against drought. Australian Journal of Agricultural Economics, 28.1, 1-14.
FAHAD, S. & JING, W. 2018. Evaluation of Pakistani farmers’ willingness to pay for crop insurance using contingent valuation method: The case of Khyber Pakhtunkhwa province. Land use policy, 72, 570-577.
GOODWIN, B. K. 2001. Problems with market insurance in agriculture. American Journal of Agricultural Economics, 83.3, 643-649.
GOODWIN, B. K. & SMITH, V. H. 2003. An ex post evaluation of the conservation reserve, federal crop insurance, and other government programs: program participation and soil erosion. Journal of Agricultural and Resource Economics, 201-216.
Ghosh, R. K., 2018. Performance Evaluation of Pradhan Mantri Fasal Bima Yojana (Part 1): Governance Analysis, Center for Management in Agriculture (CMA), Indian Institute of Management Ahmedabad, India.
HAZELL, P. B. & HESS, U. 2010. Drought insurance for agricultural development and food security in dryland areas. Food Security, 2, 395-405.
HENSHER, D.A., ROSE, J.M., & GREENE, W.H. 2015. Applied choice analysis, 2e. Cambridge: Cambridge University Press.
KANZ, M. 2016. What Does Debt Relief Do for Development? Evidence from India’s Bailout for Rural Households. American Economic Journal: Applied Economics, 8, 66-99.
References

PERFORMANCE EVALUATION OF PRADHAN MANTRI FASAL BIMA YOJANA (PMFBY)
“Uptake and Willingness-To-Pay” 60
LIESIVAARA, P. & MYYRÄ, S. 2017. The demand for public–private crop insurance and government disaster relief. Journal of Policy Modeling, 39, 19-34.
MAHUL, O. & STUTLEY, C. J. 2010. Government Support to Agricultural Insurance Challenges and Options for Developing Countries, the World Bank. Washington DC.
MARIEL, P. & MEYERHOFF, J. 2018. A more flexible model or simply more effort? On the use of correlated random parameters in applied choice studies. Ecological Economics 154: 419–429.
PATRICK, G. F. 1988. Mallee wheat farmers’ demand for crop and rainfall insurance. Australian Journal of Agricultural Economics, 32.1, 37-49.
REPORT GOB, C. C. C. 2009. Crop insurance as a risk management strategy in Bangladesh. Department of Environment. Ministry of Environment and Forests. Government of the People’s Republic of Bangladesh, Dhaka.
SAKURAI, T. & REARDON, T. 1997. Potential demand for drought insurance in Burkina Faso and its determinants. American Journal of Agricultural Economics, 79, 1193-1207.
SMITH, V. H. & GLAUBER, J. W. 2012. Agricultural insurance in developed countries: where have we been and where are we going? Applied Economic Perspectives and Policy, 34.3, 363-390.
SMITH, V. H. & GOODWIN, B. K. 1996. Crop insurance, moral hazard, and agricultural chemical use. American Journal of Agricultural Economics, 78.2, 428-438.
SMITH, V. H. & GOODWIN, B. K. 2010. Private and public roles in providing agricultural insurance in the United States. Public Insurance and Private Markets, 173-210.
SMITH, V. H. & WATTS, M. 2010. The new Standing Disaster Program: A SURE invitation to moral hazard behavior. Applied Economic Perspectives and Policy, 32, 154-169.

61“Uptake and Willingness-To-Pay”
PERFORMANCE EVALUATION OF PRADHAN MANTRI FASAL BIMA YOJANA (PMFBY)

Center for Management in Agriculture (CMA) Indian Institute of Management Ahmedabad (IIMA)
Vastrapur, Ahmedabad – 380015
e-mail: [email protected] | Phone: +91-79-6632-4650, 6632-4651 | Fax: +91-79-6632-4652 Web: www.iima.ac.in
Copyright © 2022 FDOKUMEN