Predictive controllers for thermal comfort optimization and energy savings
13
Predictive controllers for thermal comfort optimization and energy savings Roberto Z. Freire a, * , Gustavo H.C. Oliveira b , Nathan Mendes c a Pontifical Catholic University of Parana ´, Rua Imaculada Conceic ¸a ˜o, 1155, 80215-901 Curitiba, PR, Brazil b Industrial and Systems Engineering Graduate Program – PPGEPS, Pontifical Catholic University of Parana ´, Rua Imaculada Conceic ¸a ˜o, 1155, 80215-901 Curitiba, PR, Brazil c Thermal Systems Laboratory – LST, Pontifical Catholic University of Parana ´, Rua Imaculada Conceic ¸a ˜o, 1155, 80215-901 Curitiba, PR, Brazil Received 21 March 2007; received in revised form 19 December 2007; accepted 25 December 2007 Abstract The present work is focused on the study of indoor thermal comfort control problem in buildings equipped with HVAC (heating, ventilation and air conditioning) systems. The occupants’ thermal comfort sensation is addressed here by the well-known comfort index known as PMV (predicted mean vote) and by a comfort zone defined in a psychrometric chart. In this context, different strategies for the control algorithms are proposed by using an only-one-actuator system that can be associated to a cooling and/or heating system. The first set of strategies is related to the thermal comfort optimization and the second one includes energy consumption minimization, while maintaining the indoor thermal comfort criterion at an adequate level. The methods are based on the model predictive control scheme and simulation results are presented for two case studies. The results validate the proposed methodology in terms of both thermal comfort and energy savings. # 2008 Elsevier B.V. All rights reserved. Keywords: Predictive control; Thermal comfort; Energy saving; HVAC systems 1. Introduction Thermal comfort has a great influence on the productivity and satisfaction of indoor building occupants. The majority of heating, ventilation and air conditioning (HVAC) systems for thermal comfort are based either on a single temperature control loop or, in some cases, on a multivariable temperature and relative humidity control loop. However, as far as thermal comfort optimization is concerned, other parameters should be considered in order to provide thermal satisfaction to the occupants. The interactions between people and the thermal environment are complex and have been the subject of much study, therefore, the science of thermal comfort is taking into account all these considerations [1–5]. As it is discussed further in this paper, thermal comfort in buildings is a concept which is difficult to define. Over the last decades, a large number of thermal comfort indices have been established for indoor climate analysis and HVAC control system design (see [4]) and a quite disseminated one is the PMV (predicted mean vote), proposed in Ref. [1]. This index considers environmental variables and individual factors and the closer to zero the PMV value, the better the occupants’ thermal comfort sensation. Another example of thermal comfort index is presented in Ref. [6], where a least enthalpy estimator (LEE) is proposed. Such scheme utilizes the concept of thermal comfort and an enthalpy-based theory to provide a suitable setting on the effective temperature line for the HVAC control system to achieve thermal comfort and energy saving purposes. The effective temperature (ET*) indicates the rate at which indoor air temperature can be increased with decreased relative humidity while maintaining the same thermal comfort. Associated to the thermal comfort concept, energy consumption is another important issue related to HVAC systems performance. Energy efficiency in buildings is nowadays an important issue due to the growth of energy costs, energy consumption and environmental impacts, especially those related to global warming. According to www.elsevier.com/locate/enbuild Available online at www.sciencedirect.com Energy and Buildings 40 (2008) 1353–1365 * Corresponding author. E-mail addresses: [email protected] (R.Z. Freire), [email protected] (G.H.C. Oliveira), [email protected] (N. Mendes). URL: http://www.pucpr.br/lst 0378-7788/$ – see front matter # 2008 Elsevier B.V. All rights reserved. doi:10.1016/j.enbuild.2007.12.007
-
Upload
independent -
Category
Documents
-
view
0 -
download
0
Transcript of Predictive controllers for thermal comfort optimization and energy savings

www.elsevier.com/locate/enbuild
Available online at www.sciencedirect.com
08) 1353–1365
Energy and Buildings 40 (20Predictive controllers for thermal comfort optimization
and energy savings
Roberto Z. Freire a,*, Gustavo H.C. Oliveira b, Nathan Mendes c
a Pontifical Catholic University of Parana, Rua Imaculada Conceicao, 1155, 80215-901 Curitiba, PR, Brazilb Industrial and Systems Engineering Graduate Program – PPGEPS, Pontifical Catholic University of Parana,
Rua Imaculada Conceicao, 1155, 80215-901 Curitiba, PR, Brazilc Thermal Systems Laboratory – LST, Pontifical Catholic University of Parana, Rua Imaculada Conceicao,
1155, 80215-901 Curitiba, PR, Brazil
Received 21 March 2007; received in revised form 19 December 2007; accepted 25 December 2007
Abstract
The present work is focused on the study of indoor thermal comfort control problem in buildings equipped with HVAC (heating, ventilation and
air conditioning) systems. The occupants’ thermal comfort sensation is addressed here by the well-known comfort index known as PMV (predicted
mean vote) and by a comfort zone defined in a psychrometric chart. In this context, different strategies for the control algorithms are proposed by
using an only-one-actuator system that can be associated to a cooling and/or heating system. The first set of strategies is related to the thermal
comfort optimization and the second one includes energy consumption minimization, while maintaining the indoor thermal comfort criterion at an
adequate level. The methods are based on the model predictive control scheme and simulation results are presented for two case studies. The results
validate the proposed methodology in terms of both thermal comfort and energy savings.
# 2008 Elsevier B.V. All rights reserved.
Keywords: Predictive control; Thermal comfort; Energy saving; HVAC systems
1. Introduction
Thermal comfort has a great influence on the productivity
and satisfaction of indoor building occupants. The majority of
heating, ventilation and air conditioning (HVAC) systems for
thermal comfort are based either on a single temperature
control loop or, in some cases, on a multivariable temperature
and relative humidity control loop. However, as far as thermal
comfort optimization is concerned, other parameters should be
considered in order to provide thermal satisfaction to the
occupants. The interactions between people and the thermal
environment are complex and have been the subject of much
study, therefore, the science of thermal comfort is taking into
account all these considerations [1–5].
As it is discussed further in this paper, thermal comfort in
buildings is a concept which is difficult to define. Over the last
* Corresponding author.
E-mail addresses: [email protected] (R.Z. Freire),
[email protected] (G.H.C. Oliveira), [email protected]
(N. Mendes).
URL: http://www.pucpr.br/lst
0378-7788/$ – see front matter # 2008 Elsevier B.V. All rights reserved.
doi:10.1016/j.enbuild.2007.12.007
decades, a large number of thermal comfort indices have been
established for indoor climate analysis and HVAC control
system design (see [4]) and a quite disseminated one is the
PMV (predicted mean vote), proposed in Ref. [1]. This index
considers environmental variables and individual factors and
the closer to zero the PMV value, the better the occupants’
thermal comfort sensation. Another example of thermal
comfort index is presented in Ref. [6], where a least enthalpy
estimator (LEE) is proposed. Such scheme utilizes the
concept of thermal comfort and an enthalpy-based theory to
provide a suitable setting on the effective temperature line for
the HVAC control system to achieve thermal comfort and
energy saving purposes. The effective temperature (ET*)
indicates the rate at which indoor air temperature can be
increased with decreased relative humidity while maintaining
the same thermal comfort.
Associated to the thermal comfort concept, energy
consumption is another important issue related to HVAC
systems performance. Energy efficiency in buildings is
nowadays an important issue due to the growth of energy
costs, energy consumption and environmental impacts,
especially those related to global warming. According to

R.Z. Freire et al. / Energy and Buildings 40 (2008) 1353–13651354
[7,8], in the United States and other developed countries, about
one-third of all energy use can be attributed to buildings.
Actually, research works on the design of efficient building
are growing fast and, in many countries, projects of comercial
and residential buildings must contain improvements on energy
saving strategies. Existing efforts to improve the energy
efficiency of buildings are discussed in Ref. [9], where a
computational fluid dynamics (CFD) model has been applied to
simulate and evaluate changes on energy demand when
different control strategies and changes in the building material
are used. However, there is a trade-off between energy
consumption and indoor thermal comfort, which relevance
has been progressively attracting the attention of industrial and
academic researches. The aim is to save energy while
maintaining the occupants’ thermal comfort.
In this way, the present paper proposes control strategies for
reducing energy consumption and maintaining acceptable
indoor air conditions related to thermal comfort. Therefore, one
should first include the thermal comfort concept into the control
law.
One idea related to the thermal comfort control approach is
to assume a PMV sensor, so that the PMV is measured and
controlled, i.e., it is the feedback variable of an ordinary closed-
loop structure. In Ref. [10], a fuzzy control law is used and, in
Ref. [11], a PID and a fuzzy controller are proposed and
compared. In Ref. [12], a direct neural network, capable to
predict a comfort level (based on PMV) on specific user by
learning the user’s comfort zone, was used to maintain the
indoor comfort level within the desired range. A different
proposal, but still in the PMV-context, is presented in Refs.
[13,14], where the control algorithm set-point is changed on-
line or off-line as a function of the indoor PMV measurement.
In those works, a fuzzy logic expert system defines set-points
for temperature and air velocity signals of a multivariable
controller. Finally in Ref. [15], a genetic algorithm is used to
find optimal set-point values of an HVAC system in order to
reduce energy consumption, while maintaining thermal
comfort within an acceptable range.
Some works treating thermal comfort as comfort zone are
presented in the sequence. Both [16,17] use a fuzzy control
strategy applied to an HVAC system in order to maintain
acceptable thermal comfort conditions and energy savings. In
Ref. [16], the issue is approached by regulating the airflow of
different zones of a residential building and, in Ref. [17], by
maintaining the zone conditions at preferred set point values
applied to the ventilation system and by using the HVAC plant
when necessary. In Refs. [13,18], based on the fact that, on the
thermal comfort context, it might be enough just setting a
temperature band value instead of having a temperature
regulation control at a precise preset value, comfort zone control
strategies are proposed. Another study related to thermal comfort
and energy saving purposes is presented in Ref. [19] where a
hierarchical control strategy is developed integrating the
classical control techniques with fuzzy logic rules.
In Ref. [20], a first approach using PMV related to the
MBPC (model based predictive control) law [21,22] applied to
an HVAC system, in order to optimize occupants thermal
comfort sensation, is presented. The manipulated variable is the
input for the HVAC device. A system identification procedure
has been performed using linear regression, for a heating
system integrated to a building model, presented in Ref. [23].
The aim is to obtain a model that describes the HVAC system
and building behaviour in a structure that is useful for advanced
control law synthesis such as the MBPC. These models have
been used in Ref. [24] as an introduction to the PMV-based
energy saving non-linear control scheme.
The present paper summarizes and extends the previous
mentioned work line. Here, two strategies to define thermal
comfort for the occupants are addressed. The first strategy
assumed that thermal comfort can be identified by a comfort
zone within a psychrometric chart region. Five control schemes
for improving the thermal comfort by using the two approaches
for measuring thermal comfort are addressed in the following
sections. A characteristic of these schemes is the assumption of
a SIMO (single input, multiple outputs) building system, where
indoor temperature and relative humidity are measured
variables and the single manipulated variable is the power
applied to the HVAC device. All these five schemes use model
based predictive control fundamentals. The first control law
assures that the temperature signal lies within a comfort bound
while minimizes the energy consumption. The second assures
that the temperature signal lies whithin a comfort bound while
optimizing the relative humidity. The third one computes the
optimal value for the input power based on cost function using
temperature and relative humidity optimization. The fourth one
is a PMV-based-predictive control since it calculates the control
signal that optimizes the PMV index in terms of thermal
comfort. Finally, the fifth control algorithm optimizes the
energy consumption and maintains the PMV index inside
acceptable conditions.
This article is organized as follows: in the next section
concepts related to thermal comfort are reviewed, including the
PMV prediction equation. In Section 3 the proposed control
laws are presented and in Section 4 some simulation results are
presented in terms of two case studies: (i) constant values for
metabolic rate and cloth index and (ii) occupants metabolic
rates varying between low and moderate levels. Results are
obtained by using an hourly weather data of a cold week in the
city of Curitiba, Brazil. Finally in Section 5 the conclusions are
addressed.
2. Thermal comfort
Definition and control of indoor conditions for reaching
thermal comfort in buildings are hard to be established. As
thermal satisfaction depends on several parameters, research
works on thermal comfort have been conducted and some
comfort indices have been proposed over the last 50 years. An
example is the thermal comfort index called effective
temperature, which is computed by using the indoor
temperature and relative humidity signals and have been
adopted by ASHRAE [4] for decades. The present work is
focused on the development of control laws based on two ways
to measure thermal comfort. This is discussed as follows.

Fig. 1. ASHRAE comfort zone representation.
R.Z. Freire et al. / Energy and Buildings 40 (2008) 1353–1365 1355
Thermal comfort can be identified by a comfort zone within
a psychrometric chart. The ASHRAE comfort zone is shown in
Fig. 1[25].
On the other hand, a quite disseminated index for evaluating
indoor thermal comfort is the PMV [1], which combines
environmental variables and individual parameters. This index
is based on a theoretical model combined with the results from
experiments with approximately 1300 subjects, and can be
written as a function of four environmental variables
(temperature, T; relative humidity, f; mean radiant temperature,
T rm; air velocity, v) and two individual parameters (metabolic
rate, M; cloth index, Icl), as follows:
PMV ¼ Gðtbs;f; T rm; v;M; IclÞ (1)
3. Model based predictive control laws for thermal
comfort and energy savings
Based on the previous section discussions, the aim of a
thermal comfort based control law is to keep the indoor
hygrothermal conditions inside the comfort zone (see Fig. 1) or
within the PMV-based comfort bounds. Moreover, there is a
trade-off between thermal comfort optimization and energy
consumption. Classical control strategies usually cannot
provide these benefits to a single-zone building. The MBPC
technique makes it possible to minimize both problems when
cost functions and constraints are adequately implemented.
The model based predictive control strategy cannot be
defined as a specific control law, but can be viewed as a strategy
which uses several control methods linked by means of some
common ideas [21,22]. The methodology is related to
controllers that present almost the same structure and
characteristics in common, that is, MPC or MBPC controllers
are defined by the process model, which is obtained for control
purposes, and are characterized by the following four main
steps:
(i) Process modeling: where data from input (manipulated)
Fig. 2. MBPC controllers scheme.
and output (controlled) signals are used to predict theprocess behaviour (output prediction) in a future horizon,
defined as prediction horizon (Ny).
(ii) C
ost function definition: where the system closed-loopperformance during the prediction horizon is specified. It is
defined by using the output prediction, the reference signal
and the control effort.
(iii) C
ost function optimization: the cost function is optimizedas a function of the set of future control signals (control
horizon, Nu) to be applied to the process during the
prediction horizon. In this step, constraints in the
manipulated and controlled variable can be added in order
to deal with the system operation constraints, e.g., limits on
the actuators of the HVAC system.
(iv) R
eceding horizon strategy: only the first control signalcomputed from the cost function optimization is applied to
the real process and, in the next step time, all the algorithm
is repeated.
MBPC has found place in many industrial applications, as
well as in HVAC control applications, for instance [22,26–28].
The generic scheme for the MBPC controllers is shown in
Fig. 2.
The present work deals with MBPC for thermal comfort.
Two ways for including thermal comfort issues in the control
law are discussed, one based on the psychrometric chart and
another based on the PMV index. These are the main points that
make the controllers presented in this paper different from the
classical MBPC laws. The first approach leads to a linear
representation for the process model. The models are defined by
a MISO (multiple-input/single-output) ARMAX (auto-regres-
sive with exogenous input) representation of a building coupled
to the HVAC system. The manipulated input signal is uðkÞ,which represents the signal applied to a heating/cooling system
and the disturbance inputs are the outdoor temperature
(TEXTðkÞ), outdoor relative humidity (HEXTðkÞ) and total solar
radiation (SEXTðkÞ). Finally, the controlled output signals are
the indoor temperature (yTðkÞ) and indoor relative humidity
(yHðkÞ). The two models are presented as follows:
AiðqÞyiðkÞ ¼ BiðqÞuðkÞ þ BT;iðqÞTEXTðkÞ þ BH;iðqÞHEXTðkÞþ BS;iðqÞSEXTðkÞ þ CiðqÞjiðkÞ (2)
where i ¼ T or H represents the indoor temperature and indoor
relative humidity models. jiðkÞ is a random disturbance signal,
zero mean, variance s. The models parameters are given by the
AiðqÞ, BiðqÞ, BT;iðqÞ, BH;iðqÞ, BS;iðqÞ and CiðqÞ, which have the

;
Fig. 3. Representation of a Wiener structure.
R.Z. Freire et al. / Energy and Buildings 40 (2008) 1353–13651356
following form:
AiðzÞ ¼ 1þ a1q�1 þ a2q�2 þ � � � þ ana q�na ;
BiðzÞ ¼ b0 þ b1q�1 þ b2q�2 þ � � � þ bnbq�nb ;
CiðzÞ ¼ 1þ c1q�1 þ c2q�2 þ � � � þ cnc q�nc
(3)
For the controller internal temperature and relative humidity
predictions (first step of the MBPC scheme) the outdoor climate
is assumed non measurable as it is usually found in several
HVAC facilities. Based on models (2) the canonic and
observable state-space model representation is
xiðk þ 1Þ ¼ AixiðkÞ þ biuðkÞ þ gijiðkÞ;
yiðkÞ ¼ cTi xiðkÞ þ jiðkÞ
(4)
where xi is the system state vector and the matrixes A, b, g and
cT can be written as
Ai ¼
�a1 1 0 . . . 0
�a2 0 1 . . . 0
..
. ...
�an 0 0 . . . 0
0 . . . 0
..
. ...
0 . . . 1
0 . . . 0
2666666666664
3777777777775
; bi ¼
0
..
.
0
b0
..
.
bn
266666664
377777775
(5)
gi ¼
c1 � a1
..
.
cn � an
0
..
.
0
266666664
377777775
; cTi ¼ ½1 0 . . . 0� (6)
By using this model structure, output predictions during the
prediction horizon for the temperature and relative humidity
signals, that is, yTðk þ jjkÞ and yHðk þ jjkÞ for j ¼ 1; . . . ;Ny,
can be made (see for instance [29]).
Moreover, as it is classic in MBPC derivations (see [21,22]),
each set of output predictions can be put in a matrix
representation, i.e.:
yT ¼ HT Duþ ylT; yH ¼ HH Duþ ylH (7)
In the set of Eq. (7), yT and yH are vectors containing the
temperature and relative humidity output predictions. HT and
HH are known as dynamic matrices (constructed using the
model step response parameters). Finally, ylT and ylH are
known as the free output predictions for temperature and
relative humidity models.
The second approach, that is, the PMV one, leads to a non-
linear representation for the process model since its output is
obtained by the non-linear PMV computation. In this case the
model is represented by a series structure made with the linear
model that relates the input signal and the temperature and
relative humidity output signals followed by a non-linear static
operator that transforms these signals in the PMV index. This
kind of structure is known as a non-linear Wiener model, as
shown in Fig. 3.
Following, based on these two approaches, the MBPC
algorithms are proposed. They are further divided into two
groups: (i) the algorithms for promoting better thermal comfort
based on a comfort zone, within the psychrometric chart, where
one of them, while optimizing thermal comfort, reduces energy
consumption of the HVAC system; (ii) the PMV-based
algorithms, which are responsible for maintaining acceptable
indoor thermal comfort conditions, where one of them is also
capable to minimize energy consumption by setting PMV
bounds for the indoor air conditions.
3.1. Algorithms based on a comfort zone in the
psychrometric chart
This section presents thermal comfort optimization MBPC
algorithms.
3.1.1. Algorithm based on setting temperature signal
boundaries and on relative humidity optimization
Here, the psychrometric chart’s comfort zone is used to
define hard bounds on the internal temperature. Therefore, the
control law objective is to find the optimal control signal that
brings the internal relative humidity as close as possible to the
comfort zone (see Section 2). Therefore, the control law is
given by the following optimization problem:
minDuðkjkÞ;Duðkþ1jkÞ;...;DuðkþNu�1jkÞ
Jk
s: to
Duðk þ jjkÞ ¼ 0 8 j ¼ Nu; . . . ;Ny
umin � uðk þ jjkÞ � umax 8 j ¼ 1; . . . ;Nu
yT;min � yTðk þ jjkÞ � yT;max 8 j ¼ 1; . . . ;Ny
(8)
The first constraint set is related to the control horizon, while
the second one is the constraint over the control signal, imposed
by the HVAC device. The interval ½yT;min ; yT;max �, that is, the
constraints over the temperature signal are defined equal to the
comfort zone temperature bounds. Duðk þ jjkÞ is the optimal
control signal variation at time k þ j computed at time k. The
cost function Jk is given by
Jk ¼XNy
j¼1
ðyHðk þ jjkÞ � wHÞ2 þXNu�1
j¼0
l Du2ðk þ jjkÞ (9)
where wH is the relative humidity set-point defined as the mean
relative humidity value in the comfort zone and l is a weighting

R.Z. Freire et al. / Energy and Buildings 40 (2008) 1353–1365 1357
factor. This optimization problem can be rewritten as
minDu
ðyH � wHÞT þ l DuTDu
s: to
ADu � b
HT
�HT
� �Du � yT;max � ylTðk þ jjkÞ
�yT;min þ ylTðk þ jjkÞ
� � (10)
where
A ¼
�1 0 0
1 0 0
�1 �1 0 ...
1 1 0
. . .
266664
377775 ; b ¼
�umin uðk � 1Þumax �uðk � 1Þ�umin uðk � 1Þumax �uðk � 1Þ
..
. ...
2666664
3777775
; Du ¼
DuðkjkÞDuðk þ 1jkÞDuðk þ 2jkÞ
..
.
Duðk þ Nu � 1jkÞ
2666664
3777775
(11)
and
yT;min ¼ ½yT;min yT;min . . . yT;min �T;
yT;max ¼ ½yT;max yT;max . . . yT;max �T;
wH ¼ ½wH wH . . . wH�T(12)
Considering QH ¼ ðHTHHH þ lIÞ and f T
H ¼2ðylH � wHÞTHH, the optimization problem is presented as
minDu
DuTQH Duþ f H Du
s: to
ADu � b
HT
�HT
� �Du � yT;max � ylTðk þ jjkÞ
�yT;min þ ylTðk þ jjkÞ
� � (13)
The optimal solution of (13), given by means of Nu future
values for the control signal variation, is obtained by using a
quadratic programming algorithm. The signal uðkÞ applied to
the process at the time instant k is obtained as:
uðkÞ ¼ DuðkjkÞ þ uðk � 1Þ.
3.1.2. Algorithm based on temperature and relative
humidity optimization
Now, the second control strategy based on the psychrometric
chart is described. The building occupants thermal comfort
sensation is given by defining a trade-off between the internal
temperature and relative humidity errors in relation to pre-
defined set-point values. The set-points for these signals are
defined as the center of a comfort region within a psychrometric
chart. Therefore, the control law is given by the following
optimization problem:
minDuðkjkÞ;Duðkþ1jkÞ;...;DuðkþNu�1jkÞ
Jk
s: to
Duðk þ jjkÞ ¼ 0 8 j ¼ Nu; . . . ;Ny
umin � uðk þ jjkÞ � umax 8 j ¼ 1; . . . ;Nu
(14)
In Eq. (14), the cost function Jk is given by
Jk ¼�XNy
j¼1
ðyTðk þ jjkÞ � wTÞ2 þ rXNy
j¼1
ðyHðk þ jjkÞ � wHÞ2�
þXNu�1
j¼0
lDu2ðk þ jjkÞ
(15)
where r defines the trade-off between the temperature and
relative humidity errors. By stipulating the relative weight
given to these two variables on the thermal comfort. Hence,
the optimization problem is
minDu
ðHT Duþ ylT � wTÞTðHT Duþ ylT � wTÞþ rððHH Duþ ylH � wHÞTðHH Duþ ylH � wHÞÞþ l DuT Du
s: to
ADu � b
(16)
In a matricial representation, it can be rewritten as
minDu
DuTQ Duþ f T Du
s: to
ADu � b
(17)
where Q and f are defined as:
Q ¼ HTTHT þ rðHT
HHHÞ þ lI (18)
f ¼ 2ðylT � wTÞTHT þ 2rðylH � wHÞTHH (19)
As before, problem (14) defines a quadratic programming
problem and the control signal applied to the process is
obtained as: uðkÞ ¼ DuðkjkÞ þ uðk � 1Þ.
3.1.3. Algorithm based on setting temperature signal
boundaries and minimizing energy consumption
In this case, if it is assumed that, to provide thermal comfort,
the temperature signal can vary within a thermal comfort zone.
The objective is to find the optimal value for the HVAC power
signal providing that the temperature signal lies inside limits in
order to maintain acceptable indoor thermal comfort. Through
these limits, it is possible to maintain acceptable thermal
comfort conditions and to reduce energy consumption.
In this problem, the cost function is defined by the energy
consumption. The constraints are equivalent to the ones given
by Problem (8).The last constraint set assures that the
remaining of the indoor temperature lies in an acceptable
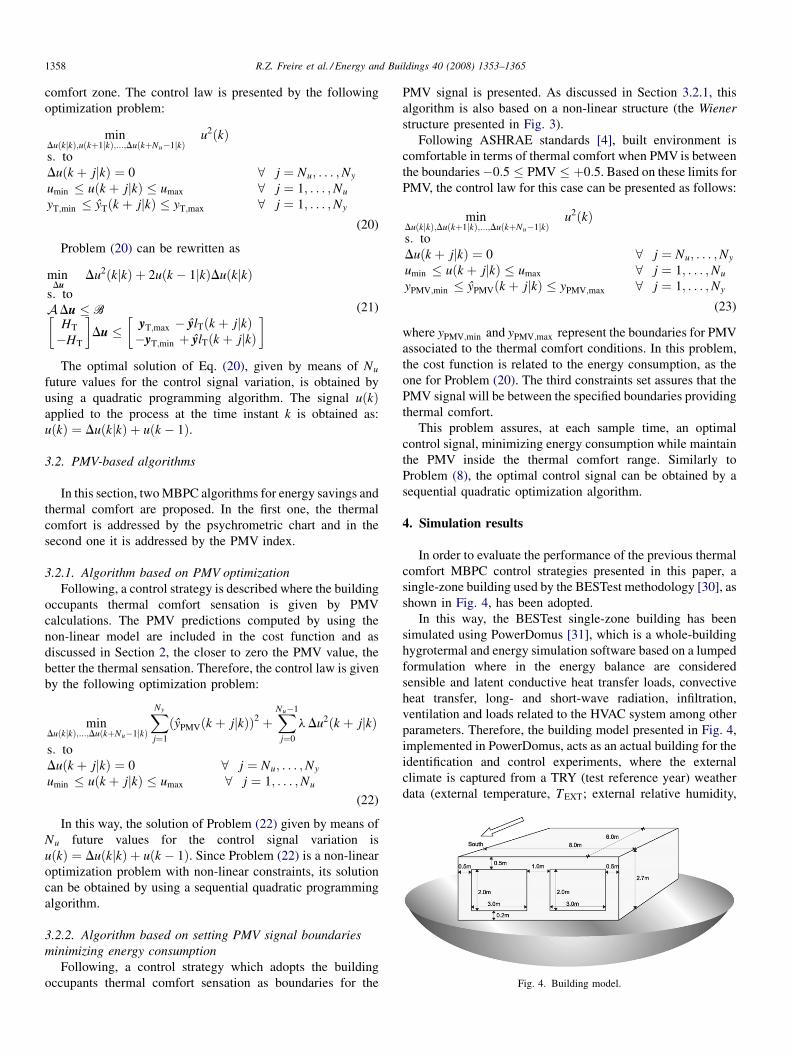
Fig. 4. Building model.
R.Z. Freire et al. / Energy and Buildings 40 (2008) 1353–13651358
comfort zone. The control law is presented by the following
optimization problem:
minDuðkjkÞ;uðkþ1jkÞ;...;DuðkþNu�1jkÞ
u2ðkÞs: to
Duðk þ jjkÞ ¼ 0 8 j ¼ Nu; . . . ;Ny
umin � uðk þ jjkÞ � umax 8 j ¼ 1; . . . ;Nu
yT;min � yTðk þ jjkÞ � yT;max 8 j ¼ 1; . . . ;Ny
(20)
Problem (20) can be rewritten as
minDu
Du2ðkjkÞ þ 2uðk � 1jkÞDuðkjkÞs: to
ADu � b
HT
�HT
� �Du � yT;max � ylTðk þ jjkÞ
�yT;min þ ylTðk þ jjkÞ
� � (21)
The optimal solution of Eq. (20), given by means of Nu
future values for the control signal variation, is obtained by
using a quadratic programming algorithm. The signal uðkÞapplied to the process at the time instant k is obtained as:
uðkÞ ¼ DuðkjkÞ þ uðk � 1Þ.
3.2. PMV-based algorithms
In this section, two MBPC algorithms for energy savings and
thermal comfort are proposed. In the first one, the thermal
comfort is addressed by the psychrometric chart and in the
second one it is addressed by the PMV index.
3.2.1. Algorithm based on PMV optimization
Following, a control strategy is described where the building
occupants thermal comfort sensation is given by PMV
calculations. The PMV predictions computed by using the
non-linear model are included in the cost function and as
discussed in Section 2, the closer to zero the PMV value, the
better the thermal sensation. Therefore, the control law is given
by the following optimization problem:
minDuðkjkÞ;...;DuðkþNu�1jkÞ
XNy
j¼1
ðyPMVðk þ jjkÞÞ2 þXNu�1
j¼0
l Du2ðk þ jjkÞ
s: to
Duðk þ jjkÞ ¼ 0 8 j ¼ Nu; . . . ;Ny
umin � uðk þ jjkÞ � umax 8 j ¼ 1; . . . ;Nu
(22)
In this way, the solution of Problem (22) given by means of
Nu future values for the control signal variation is
uðkÞ ¼ DuðkjkÞ þ uðk � 1Þ. Since Problem (22) is a non-linear
optimization problem with non-linear constraints, its solution
can be obtained by using a sequential quadratic programming
algorithm.
3.2.2. Algorithm based on setting PMV signal boundaries
minimizing energy consumption
Following, a control strategy which adopts the building
occupants thermal comfort sensation as boundaries for the
PMV signal is presented. As discussed in Section 3.2.1, this
algorithm is also based on a non-linear structure (the Wiener
structure presented in Fig. 3).
Following ASHRAE standards [4], built environment is
comfortable in terms of thermal comfort when PMV is between
the boundaries�0:5 � PMV � þ0:5. Based on these limits for
PMV, the control law for this case can be presented as follows:
minDuðkjkÞ;Duðkþ1jkÞ;...;DuðkþNu�1jkÞ
u2ðkÞs: to
Duðk þ jjkÞ ¼ 0 8 j ¼ Nu; . . . ;Ny
umin � uðk þ jjkÞ � umax 8 j ¼ 1; . . . ;Nu
yPMV;min � yPMVðk þ jjkÞ � yPMV;max 8 j ¼ 1; . . . ;Ny
(23)
where yPMV;min and yPMV;max represent the boundaries for PMV
associated to the thermal comfort conditions. In this problem,
the cost function is related to the energy consumption, as the
one for Problem (20). The third constraints set assures that the
PMV signal will be between the specified boundaries providing
thermal comfort.
This problem assures, at each sample time, an optimal
control signal, minimizing energy consumption while maintain
the PMV inside the thermal comfort range. Similarly to
Problem (8), the optimal control signal can be obtained by a
sequential quadratic optimization algorithm.
4. Simulation results
In order to evaluate the performance of the previous thermal
comfort MBPC control strategies presented in this paper, a
single-zone building used by the BESTest methodology [30], as
shown in Fig. 4, has been adopted.
In this way, the BESTest single-zone building has been
simulated using PowerDomus [31], which is a whole-building
hygrotermal and energy simulation software based on a lumped
formulation where in the energy balance are considered
sensible and latent conductive heat transfer loads, convective
heat transfer, long- and short-wave radiation, infiltration,
ventilation and loads related to the HVAC system among other
parameters. Therefore, the building model presented in Fig. 4,
implemented in PowerDomus, acts as an actual building for the
identification and control experiments, where the external
climate is captured from a TRY (test reference year) weather
data (external temperature, TEXT; external relative humidity,

Fig. 5. External temperature, relative humidity and total solar radiation for the
simulation period in Curitiba, Brazil.
R.Z. Freire et al. / Energy and Buildings 40 (2008) 1353–1365 1359
HEXT; total solar radiation, SEXT) of the city of Curitiba, Brazil.
By means of least-square based identification procedures [32],
the following equations for the combined HVAC (a heating
system of 5 kW maximum power) and building envelope
model under analysis were obtained [23,33].
ð1� 0:97000q�1ÞyTðkÞ
¼ þð0:08395q�1Þu0ðkÞ þ ð0:02527q�1ÞTEXTðkÞ
þ ð0:20340q�1ÞHEXTðkÞ þ ð�0:07245q�1ÞSEXTðkÞ
þ ð1þ 0:67670q�1ÞjTðkÞ(24)
ð1� 0:96920q�1ÞyHðkÞ
¼ þð�0:002107q�1Þu0ðkÞ þ ð0:0002751q�1ÞTEXTðkÞ
þ ð0:01759q�1ÞHEXTðkÞ þ ð0:003342q�1ÞSEXTðkÞ
þ ð1þ 0:72390q�1ÞjHðkÞ(25)
In Eqs. (24) and (25), the units for temperature is (�C) and
the sampling time is 1 min. In these models u0ðkÞ is given by:
u0ðkÞ ¼ uðkÞ þ uPðkÞ (26)
where uðkÞ is the manipulated signal provided by the control
law and uPðkÞ is a disturbance representing the heating gener-
ated by the building occupants.
Now some closed-loop results are presented by using two
case studies. In all cases, the controller is turned on at the 0-th
hour of the third day (time equal to 48 h—two days of warm-up
simulation period) and the simulation period is 1 week (168 h).
The controller parameters are: Ny ¼ 10 and Nu ¼ 1. It is
assumed here a heating system, therefore, uðkÞ is constrained to
the limits [0,5]. The external climate data adopted during the
closed-loop simulations, i.e., temperature, relative humidity
and total solar radiation, are shown in Fig. 5. For the first case
study, the results are related to the analysis of the properties of
the control schemes presented in Sections 3.1 and 3.2, where
the main objective is to maintain the best thermal comfort
conditions with or without energy consumption reduction. In
the sequence, i.e., in the second case study, only the control
schemes related to thermal comfort and energy savings are
discussed (see Section 3.2) and the effect of changes on the
occupants’ metabolic rate and cloth index is also analyzed.
4.1. Case study I—controller performance analysis
The control strategies presented in Sections 3.1 and 3.2 are
evaluated in terms of temperature, relative humidity, PMV and
energy consumption. In this case, two occupants are considered
inside the building environment, where their clothing index and
metabolic rate are constant equal to 0.66 clo and 1.20 met.
These values are related to usual office clothing and metabolic
rate [4].
Following, in Figs. 6–10 , results for the five control
strategies are presented and discussed. Figs. 6(Solution 1) to
8(Solution 3) are related to the strategies based on the
psychrometric chart comfort zone and Figs. 9(Solution 4) and
10(Solution 5) are related to the ones based on the PMV index.
In Fig. 6, the controller is tuned assuming that the temperature
comfort bound in the psychrometric chart is (22 �C, 26 �C) and
the median value of the comfort bound is 0.5 (or 50%).
Following Problem 8, these parameters set the choice of wH and
[yT;min , yT;max ]. It can be noticed that the performance
requirements are satisfied, the constraints are satisfied and
the relative humidity tends to the set-point.
In Fig. 7(Solution 2), the controller set-points are made
equal to 24 � C and 0.5, i.e., the medium value of the comfort
zone. The trade-off r between the temperature and relative
humidity errors is set as 100, which explains why the
temperature error is lower than the one for the relative
humidity signal. PMV index obtained for this case is better than
the one found in the previous solution since the PMV is very
sensitive to the temperature signal.
In Fig. 8(Solution 3), the results were obtained by a
controller that has, additionally, considered energy con-
sumption minimization. The bounds on the temperature
signal are set as the same as the one presented in the first
solution. Table 1 presents the energy consumption of these
three solutions based on the psychrometric chart. As
expected, it can be seen that the lowest energy consumption
for the controllers based on a comfort zone within the
psychrometric chart is obtained.
Figs. 9 and 10 present the results obtained by using the
controller based on the PMV index. The optimal PMV index is
obtained by the controller presented in Fig. 9(Solution 4). It can
be seen by Table 1 that this is the case where the PMV is closer
to zero.

Fig. 6. Case study I—indoor temperature, indoor relative humidity, PMVand control signal for the algorithm based on setting temperature signal boundaries and on
relative humidity optimization.
R.Z. Freire et al. / Energy and Buildings 40 (2008) 1353–13651360
Fig. 10(Solution 5) presents a controller that includes energy
reduction minimization. The constraints over the PMV index
are set equal to [�0:5; 0:5]. As expected, the energy
consumption is lower than in the previous solution. By
comparing the two energy saving solutions (i.e. Figs. 8 and 10),
Fig. 7. Case study I—indoor temperature, indoor relative humidity, PMV and c
optimization.
it can be noticed that for the latter, the PMV based energy
reduction strategy could take advantage of this, particularly,
individual and external climate condition, and provide an
additional energy saving in relation to the other analogous
controller (Solution 3).
ontrol signal for the algorithm based on temperature and relative humidity

Fig. 8. Case study I—indoor temperature, indoor relative humidity, PMV and control signal for the algorithm based on setting temperature signal boundaries and
minimizing energy consumption.
R.Z. Freire et al. / Energy and Buildings 40 (2008) 1353–1365 1361
4.2. Case study II—varying metabolic rate and
clothing index
In this section, only the controllers based on energy
consumption minimization are considered, which perfor-
mance is analyzed for variations on metabolic rate and clothing
index.
Fig. 9. Case study I—indoor temperature, indoor relative humidity, PM
In Figs. 11 and 12, the results are presented in terms of
indoor temperature, indoor relative humidity, PMV and energy
consumption. Variations on the metabolic rate and clothing
index are presented in Table 2, where during the day (from 7 am
to 10 pm), the occupants’ metabolic rate is equivalent to a
physical activity of a person working in an office, while at night
(from 10 pm to 7 am), it is assumed the occupants are sleeping.
V and control signal for the algorithm based on PMV optimization.

Fig. 10. Case study I—indoor temperature, indoor relative humidity, PMV and control signal for the algorithm based on setting PMV signal boundaries minimizing
energy consumption.
R.Z. Freire et al. / Energy and Buildings 40 (2008) 1353–13651362
By analyzing the results in terms of temperature, it can be
noticed that the controller that uses the PMV as a comfort
parameter (Fig. 12) increases the indoor temperature during
the period when metabolic rate is low in order to provide a
better thermal comfort sensation. When the metabolic rate
becomes higher, the internal temperature decreases propor-
Fig. 11. Case study II—indoor temperature, indoor relative humidity, PMV and con
minimizing energy consumption.
tionally in order to provide adequate thermal sensation to the
occupants. On the other hand, analyzing the results presented
in Fig. 11, the temperature signal does not vary due to
changes on the metabolic rate and/or clothing index, which
affects the indoor thermal comfort. The energy consumption
are 114.81 kWh and 202.26 kWh for the psychrometric
trol signal for the algorithm based on setting temperature signal boundaries and
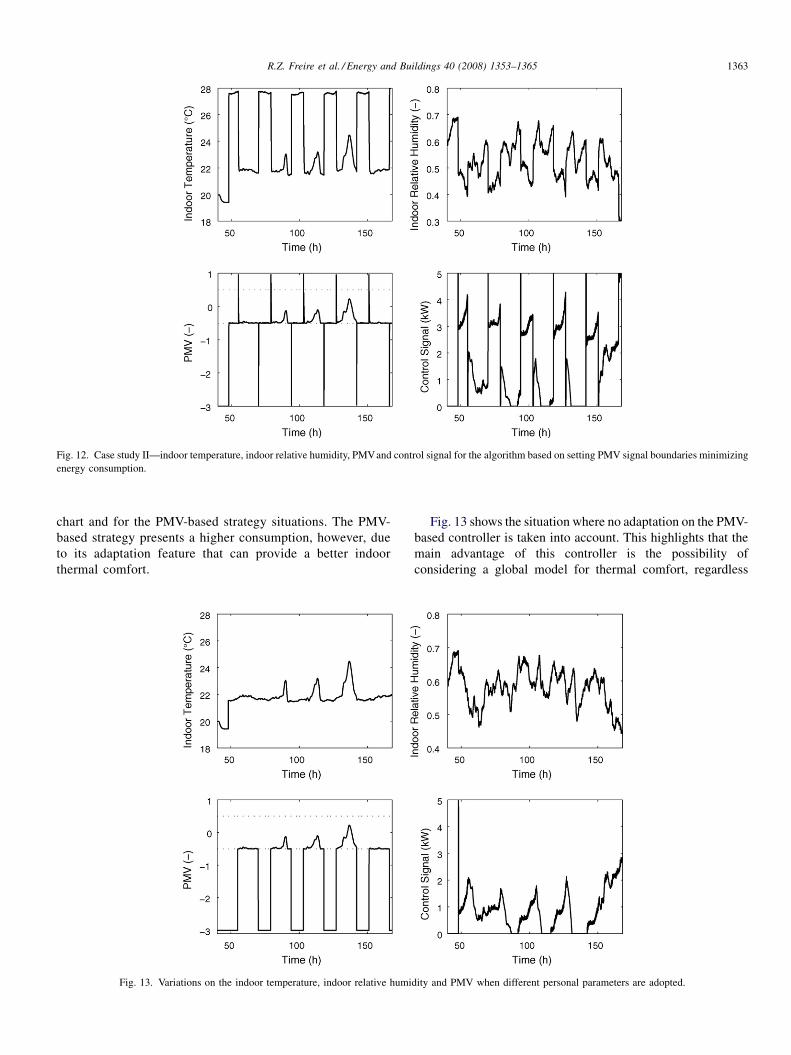
Fig. 12. Case study II—indoor temperature, indoor relative humidity, PMVand control signal for the algorithm based on setting PMV signal boundaries minimizing
energy consumption.
R.Z. Freire et al. / Energy and Buildings 40 (2008) 1353–1365 1363
chart and for the PMV-based strategy situations. The PMV-
based strategy presents a higher consumption, however, due
to its adaptation feature that can provide a better indoor
thermal comfort.
Fig. 13. Variations on the indoor temperature, indoor relative humi
Fig. 13 shows the situation where no adaptation on the PMV-
based controller is taken into account. This highlights that the
main advantage of this controller is the possibility of
considering a global model for thermal comfort, regardless
dity and PMV when different personal parameters are adopted.

Table 2
Case study II—variations on metabolic rates and clothing index
State Icl (clo) M (met)
I 0.66 1.20
II 0.45 0.80
Table 1
Energy consumption for the 5 days simulation period and quadratic sum of the
PMV for the controllers without energy consumption minimization
Solution Energy consumption (kWh)P
PMV2
1 222.47 1:6378� 103
2 192.72 1:1625� 102
3 110.78 –
4 174.77 10.6897
5 98.67 –
R.Z. Freire et al. / Energy and Buildings 40 (2008) 1353–13651364
the changes of individual parameters and take advantage of
such information when available.
5. Conclusions
The indoor thermal comfort control problem in a single-zone
building equipped with an HVAC system has been analyzed.
Five MBPC algorithms to optimize room air conditions focused
on thermal comfort and/or energy savings by using an only-
one-actuator system associated to heating/cooling equipment
have been presented.
Some of the proposed algorithms were based on defining
thermal comfort by a comfort zone within the psychrometric
chart and some by using the PMV index. They were also
classified between those that consider only thermal comfort
optimization and those that additionally provide energy
savings. All control strategies that have been presented reached
their goals in order to provide better indoor thermal comfort
conditions to the occupants.
The importance given to the temperature set-points in this
work is related to its highly correlation to the thermal comfort
sensation. The PMV-based controllers are well adapted in
situations where at least a rough estimator of the occupants
activity can be obtained.
Simulation results of two case studies, by using the Curitiba
weather data file, have shown that the control algorithms
presented in this paper can simultaneously promote thermal
comfort and energy consumption reduction maintaining 100%
of the time in the comfort zone. Due to the ability of the PMV
controller to adapt to the individual parameters, it has been
shown that it can provide a better global performance in terms
of both thermal comfort control and energy consumption.
Acknowledgments
The authors thank CAPES (Coordenacao de Aper-
feicoamento de Pessoal de Nııvel Superior) of the Secretariat
of Education of Brazil and FINEP (Financiadora de Estudos e
Projetos) and CNPq (Conselho Nacional de Desenvolvimento
Cientııfico e Tecnologico) both of the Secretariat of Science
and Technology of Brazil for support of this work.
References
[1] P.O. Fanger, Thermal Comfort, McGraw-Hill Inc., New York, USA, 1970.
[2] A.P. Gagge, A.P. Fobelets, L.G. Berlund, A standard predictive index of
human response to the thermal environment, ASHRAE Transactions 92
(1986) 709–731.
[3] C. Smith, A Transient Three-dimensional Model of the Human Thermal
System, Ph.D. Thesis, Department of Mechanical Engineering, Kansas
State University, Manhattan, KS, USA, 1991.
[4] ASHRAE, Handbook of Fundamentals, American Society of Heating,
Refrigerating and Air Conditioning Engineers, Atlanta, GA, 2001.
[5] B.W. Jones, Capabilities and limitations of thermal models for use in
thermal comfort standards, Energy and Buildings 1 (34) (2002) 653–659.
[6] C.M. Chu, T.L. Jong, Y.W. Huang, A study of thermal comfort control
using least enthalpy estimator on hvac systems, in: Proceedings of the
IEEE American Control Conference (ACC’05), Portland, OR, USA,
(2005), pp. 3665–3670.
[7] EIA, Energy Information Administration, www.eia.doe.gov, 2004.
[8] T. Salsbury, A survey of control technologies in the building automation
industry, in: Proceedings of the 16th IFAC World Congress, Prague, Czech
Republic, (2005), pp. 331–341.
[9] J.F. Karlsson, B. Moshfegh, Energy demand and indoor climate in a low
energy building—changed controle strategies and boundary conditions,
Energy and Buildings (38) (2006) 315–326.
[10] D. Kolokotsa, D. Tsiavos, G.S. Stavrakakis, K. Lalaitzakis, E. Antoni-
dakis, Advanced fuzzy logic controllers design and evaluation for build-
ings occupants thermal-visual comfort and indor air quality satisfaction,
Energy and Buildings 33 (2001) 531–543.
[11] M.M. Gouda, S. Danaher, C.P. Underwood, Thermal comfort based fuzzy
logic controller, Building Services Engineering Research and Technology
22 (4) (2001) 237–253.
[12] J. Liang, R. Du, Thermal comfort control based on neural network for hvac
application, in: Proceedings of the IEEE Conference on Control Applica-
tions (CCA’05), Toronto, Canada, (2005), pp. 819–824.
[13] M. Hamdi, G. Lachiver, A fuzzy control system based on the human
sensation of thermal comfort, in: Proceedings of IEEE International
Conference on Fuzzy Systems, USA, (1998), pp. 487–492.
[14] K. Yonezawa, F. Yamada, Y. Wada, Y. Hanada, Comfort air-conditioning
control for building energy-saving, in: Proceedings of the Industrial
Electronics Society—IECON. 26th Annual Conference of the IEEE,
vol. 3, Nagoya, Japan, (2000), pp. 1737–1742.
[15] N. Nassif, S. Kajl, R. Sabourin, Two-objective online optimization of
supervisory control strategy, in: Proceedings of the Eighth Building
Simulation Conference (IBPSA’03), vol. 1, Eindhoven, Netherlands,
(2003), pp. 927–934.
[16] R.N. Lea, E. Dohmann, W. Prebilsky, Y. Jani, An HVAC fuzzy logic zone
control system and performance results, in: Proceedings of the 5th IEEE
International Conference on Fuzzy Systems, vol. 3, IEEE, New Orleans,
LA, USA, (1996), pp. 2175–2180.
[17] M.M. Gouda, Fuzzy ventilation control for zone temperature and relative
humidity, in: Proceedings of the IEEE American Control Conference
(ACC’05), Portland, OR, USA, (2005), pp. 507–512.
[18] G.H.C. Oliveira, H.X. Araujo, L.S. Coelho, N. Mendes, Using fuzzy logic
in heating control systems, in: Proceedings of the 6th ASME-JSME
Thermal Engineering Joint Conference, vol. 1, Hawaii, USA, (2003),
pp. 1–6.
[19] G. Palmieri, G. Fiengo, A hierarchical control strategy for energy opti-
mization, in: Proceedings of the IFAC on Energy Saving Control in Plants
and Buildings (ESC’06), 2006, pp. 111–116.
[20] R.Z. Freire, G.H.C. Oliveira, N. Mendes, Thermal comfort based pre-
dictive controllers for building heating systems, in: Proceedings of the
16th IFAC World Congress, Prague, Czech Republic, 2005.
[21] D.W. Clarke (Ed.), Advances in Model Based Predictive Control, Oxford
University Press, UK, 1994.

R.Z. Freire et al. / Energy and Buildings 40 (2008) 1353–1365 1365
[22] E.F. Camacho, C. Bordns, Model Predictive Control in Process Industry,
Springer-Verlag, 1995.
[23] R.Z. Freire, G.H.C. Oliveira, N. Mendes, Development of single-zone
predictive equations using linear regression for advanced controllers
synthesis, in: Proceedings of the 9th Building Simulation Conference
(IBPSA’05), vol. 1, Montreal, Canada, 2005.
[24] R.Z. Freire, G.H.C. Oliveira, N. Mendes, Non-linear predictive controllers
for thermal comfort optimization and energy saving, in: Proceedings of the
IFAC on Energy Saving Control in Plants and Buildings (ESC’06), 2006,
pp. 87–92.
[25] ASHRAE, Handbook of HVAC Applications, American Society of Heat-
ing, Refrigerating and Air Conditioning Engineers, Atlanta, GA, USA,
2003.
[26] J.M. Sousa, R. Babuska, H.B. Verbruggen, Fuzzy predictive control
applied to an air-conditioning system, Control Engineering Practice 5
(10) (1997) 1395–1406.
[27] S.J. Qin, T.A. Badgwell, A survey of industrial model predictive control
technology, Control Engineering Practice (11) (2003) 733–764.
[28] M. Terziyska, Y. Todorov, M. Petrov, Adaptive surpervisory tuning of
nonlinear model predictive controller for a heat exchanger, in: Proceed-
ings of the IFAC on Energy Saving Control in Plants and Buildings
(ESC’06), 2006, pp. 93–98.
[29] A.W. Ordys, D.W. Clarke, A state-space description for GPC controllers,
International Journal of Systems Science 24 (9) (1993) 1727–1744.
[30] IEA (International Energy Agency), Annex 41—Whole Building Heat,
Air and Moisture Response MOIST-ENG, Technical report, Modelling,
Belgium, 2003.
[31] N. Mendes, R.C.L.F. Oliveira, G.H. Santos, Energy efficiency and thermal
comfort analysis using the powerdomus hygrothermal simulation tool, in:
Proceedings of the 9th Building Simulation Conference (IBPSA’05), vol.
1, Montreal, Canada, (2005), pp. 9–16.
[32] L. Ljung, System Identification: Theory for the User, 2nd edition,
Prenctice-Hall Inc., 1999.
[33] R. Z. Freire, Advanced Control Strategies Applied to HVAC Systems for
Thermal Comfort Optimization, Master’s Thesis, PPGEPS/CCET/PUCPR,
Pontifical Catholic University of Parana, Brazil, 2006 (in portuguese).