Designing for thermal comfort near a glazed exterior wall
10
© 2009 Earthscan Ltd. ISSN:0003-0628 (print), 1758-9622 (online) doi:10.3763/asre.2009.0024 www.earthscan.co.uk/journals/asre Architectural Science Review Volume 52.2, pp 89-98 Ventilation Research on Australian Residential Construction Mark B. Luther School of Architecture and Building, Waterfront Campus, Deakin University, 1 Gheringhap Street, Geelong, Victoria 3217, Australia Tel: (03) 5227 8300; Fax: (03) 5227 8303; Email: [email protected] Abstract: is paper applies established and new testing methods to discover the ventilation performance of various residential building envelope constructions in Australia. Under the definition of ‘ventilation performance’ we imply the building envelope leakage (or infiltration) of the living space air change rates, the volumetric flow rates and the pathways of air flow between subfloor, living and roof spaces. All of the methods applied and discussed here are on-site, evidence-based performance of actual structures as tested by the Mobile Architecture and Built Environment Laboratory and Air Barrier Technologies. e testing processes primarily involve the Tracer Gas Decay Method (TGDM) and the fan pressurisation method (FPM a.k.a ‘blower door’). All the measurements are performed with respect to the external wind speed and direction as well as the typical weather parameters. is paper discusses the differences and similarities of both testing methods as well as several other testing procedures that can inform the researcher on air leakage pathways. Findings of a simultaneous TGDM and FPM air leakage rate comparison are also encountered in this paper. One of the most informative testing methods, is the application of three different tracer gasses introduced into different spaces (subfloor, living and roof) to discover pathways of air flow within residential construction. Keywords: Air leakage, Building ventilation, Infiltration, Tan pressurisation testing, Tracer-gas testing A Background to Ventilation and Air Leakage Research in Buildings e International Energy Agency (IEA, 1996) Annex 26, Energy Efficient Ventilation of Large Enclosure, declared building ventilation as the single most influencing component in the future of building energy consumption. is statement was made on the basis that buildings in the future would undoubtedly have solved the problems of thermal insulation, effective construction and optimised building control services. Australian building codes have acknowledged the value of thermal insulation in the building envelope improving energy consumption. In recent years, overseas standards and research recognise that the sealing of air leaks in houses (tightening) is the most cost effective method of achieving direct energy savings. ese practices and testing methods have yet to be taken into account within Australian building codes. Several reasons for researching the ‘air-tightness’ in buildings include: • Reducing energy costs through the reduction of unpredicted infiltrated and exfiltrated air leakages. • Reducing energy demand for heating and cooling unconditioned air entry and replaced leaked air. • Establishing better predictability for unknown air leakage quantities in energy load calculations. • Reduced size of mechanical equipment. • Eliminating interference with the mechanical (HVAC) system control. • Reducing moisture deposition within the building envelope. • Better health performance through limiting external pollutants. • IAQ (Indoor Air Quality) control through reducing the permeability (m 3 /hr/m 2 ) of a particular building envelope system. • Reducing external noise nuisance. • Improved thermal comfort through fewer (cold) draughts. • Better construction details through location and quantification of air leakage. • Better control of the actual pressurisation differentials between building interior and exterior spaces. Overseas legislation recognises building envelope performance as one of the most cost effective methods in reducing energy consumption. While the energy savings of sealed buildings can be quickly translated into CO 2 and other Greenhouse Gas reductions, Australia might acknowledge other environmental benefits of air-tight houses such as ‘shelter-in- place’ bushfire relief or ‘a place of refuge’ for asthma attacks, provided by weatherisation. e health aspects of a controlled
Transcript of Designing for thermal comfort near a glazed exterior wall

© 2009 Earthscan Ltd. ISSN:0003-0628 (print), 1758-9622 (online)doi:10.3763/asre.2009.0024 www.earthscan.co.uk/journals/asre
Architectural Science Review Volume 52.2, pp 89-98
Ventilation Research on Australian Residential Construction
Mark B. Luther
School of Architecture and Building, Waterfront Campus, Deakin University, 1 Gheringhap Street, Geelong, Victoria 3217, Australia
Tel: (03) 5227 8300; Fax: (03) 5227 8303; Email: [email protected]
Abstract: This paper applies established and new testing methods to discover the ventilation performance of various residential building envelope constructions in Australia. Under the definition of ‘ventilation performance’ we imply the building envelope leakage (or infiltration) of the living space air change rates, the volumetric flow rates and the pathways of air flow between subfloor, living and roof spaces. All of the methods applied and discussed here are on-site, evidence-based performance of actual structures as tested by the Mobile Architecture and Built Environment Laboratory and Air Barrier Technologies.The testing processes primarily involve the Tracer Gas Decay Method (TGDM) and the fan pressurisation method (FPM a.k.a ‘blower door’). All the measurements are performed with respect to the external wind speed and direction as well as the typical weather parameters. This paper discusses the differences and similarities of both testing methods as well as several other testing procedures that can inform the researcher on air leakage pathways. Findings of a simultaneous TGDM and FPM air leakage rate comparison are also encountered in this paper. One of the most informative testing methods, is the application of three different tracer gasses introduced into different spaces (subfloor, living and roof ) to discover pathways of air flow within residential construction.
Keywords: Air leakage, Building ventilation, Infiltration, Tan pressurisation testing, Tracer-gas testing
A Background to Ventilation and Air Leakage Research in Buildings
The International Energy Agency (IEA, 1996) Annex 26, Energy Efficient Ventilation of Large Enclosure, declared building ventilation as the single most influencing component in the future of building energy consumption. This statement was made on the basis that buildings in the future would undoubtedly have solved the problems of thermal insulation, effective construction and optimised building control services. Australian building codes have acknowledged the value of thermal insulation in the building envelope improving energy consumption. In recent years, overseas standards and research recognise that the sealing of air leaks in houses (tightening) is the most cost effective method of achieving direct energy savings. These practices and testing methods have yet to be taken into account within Australian building codes.
Several reasons for researching the ‘air-tightness’ in buildings include:
• Reducing energy costs through the reduction of unpredicted infiltrated and exfiltrated air leakages.
• Reducing energy demand for heating and cooling unconditioned air entry and replaced leaked air.
• Establishing better predictability for unknown air leakage quantities in energy load calculations.
• Reduced size of mechanical equipment.• Eliminating interference with the mechanical (HVAC)
system control.• Reducing moisture deposition within the building
envelope.• Better health performance through limiting external
pollutants. • IAQ (Indoor Air Quality) control through reducing the
permeability (m3/hr/m2) of a particular building envelope system.
• Reducing external noise nuisance.• Improved thermal comfort through fewer (cold)
draughts.• Better construction details through location and
quantification of air leakage.• Better control of the actual pressurisation differentials
between building interior and exterior spaces.Overseas legislation recognises building envelope
performance as one of the most cost effective methods in reducing energy consumption. While the energy savings of sealed buildings can be quickly translated into CO2 and other Greenhouse Gas reductions, Australia might acknowledge other environmental benefits of air-tight houses such as ‘shelter-in-place’ bushfire relief or ‘a place of refuge’ for asthma attacks, provided by weatherisation. The health aspects of a controlled

Architectural Science Review Volume 52, Number 2, 200990
clean and sealed environment have been shown to be of benefit in achieving reductions in asthmatic attacks and allergenic reactions in children (Committee on Environmental Health, 2004). This is thought to be due in part to their ability to seek refuge in a controlled (appropriately filtered) environment.
The study of airflow within buildings pertains to developing an understanding of the mechanics of ventilation (Liddament, 1996). Ideally, the information required for such would be the:
• External air flow rate (m3/s) into a building (ventilation and infiltration).
• Air change rate effectiveness within a particular space (room) of a building.
• Maximum and minimum infiltration rates (m3/s) into a building.
• Qualitative air movement (flow visualization pattern) for a space.
• Quantitative air movement in a space (flow velocity, direction, turbulence, etc.).
• Non-mechanically assisted air change rate – infiltration – ACH.
• Mechanically assisted air change rate – ventilation – ACH.
• Location and quantification of air leakages.• The average pressurisation of the building (positive or
negative).Ventilation is defined as the ‘wanted and known’ quantity
of air coming into a building and generally applies to the quantity supplied by mechanical ventilation. However, ventilation air quantities under natural conditions, such as entering through windows, are quite complex to measure. Air leakage, on the other hand, is defined as infiltration or the unknown and unwanted quantity of air entering the building (ASHRAE). Designers should not necessarily fixate on making buildings ‘air-tight’, because even if gaps were completely sealed, buildings have doors and openings, which allow large volumes of air changes at the occupants’ discretion. The idea instead is to quantify leakage, reduce excessive leakage and control leakage by managing air pressure with the HVAC system (Ask, 2003).
There are two different but internationally accepted testing methods for determining air leakage (infiltration) rates in
Note: figures are pasted into tables to structure them into their anticipated format. However, they
can be extracted, saved and pasted as a MSWord ‘picture’ format and taken out of their tables.
Figure 1 Fan pressurisation unit. Figure 2 Pressure vs. Flow rate of a house.
Figure 3: Floor plan and section including the instrumentation of a Point Cook house.
Table 1: Air change rate results and calculations.
Figure 1: Door pressure blower. (Source Luther)
Note: figures are pasted into tables to structure them into their anticipated format. However, they
can be extracted, saved and pasted as a MSWord ‘picture’ format and taken out of their tables.
Figure 1 Fan pressurisation unit. Figure 2 Pressure vs. Flow rate of a house.
Figure 3: Floor plan and section including the instrumentation of a Point Cook house.
Table 1: Air change rate results and calculations.
Figure 2: Pressure compared to flow rate in a test house.

91Mark B. Luther Ventilation Research
buildings: the fan pressurisation method (FPM), for air-tightness, and the tracer gas dilution method (TGDM), for air change rates.
In the case of the FPM method (a.k.a. ‘blower door’) the building is either pressurised or depressurised through a fan system that fits within an external door opening (see Figure 1). The unit is equipped with a calibrated pressure gauge, which is associated with a computer program to calculate the air leakage rate per hour (ACH), and the building envelope permeability (m3/hr/m2). Permeability is the calculation of leakage (m3/hr) per m2 of envelope. The testing method is performed according to a standard that requires the leakage to be observed at several pressure levels. The standard reported leakage is at 50Pa (pressure) where the air change rate of the building volume and/or envelope is reported. Recently, it has been of interest to know what the leakage under normal outdoor conditions might be (i.e., 2.5Pa or 4.0Pa). These results are for non-windy external periods and more closely represent ‘natural’ infiltration conditions.
In the case of TGDM it provides an accurate measure of the air exchange rate within a particular building volume (ASHRAE, 1997, Measuring Air-Change Effectiveness). This air change rate (ACH) can be observed under various conditions, such as the mechanical system operation, natural ventilation or the closed building (infiltration) condition. There are three different tracer-gas testing techniques to determine either an airflow rate or an air change rate: the concentration decay method, the constant injection method and the constant concentration method. These are described in detail in Liddament, 1996 and Luther, 2007, Air Leakage in Buildings: Review of International Literature and Standards. The research in this paper utilises the ‘concentration decay method which is the most common in leakage testing. In this case, the tracer is dispersed through an air distribution system (supply ducting) or through small secondary fans within the test space. Once a desired quantity is released and a balanced mixing level occurs throughout the space, the gas is turned off. Following a short period of adjustment, the ‘decay’ of the tracer gas is measured over 30-45 minute periods, yielding the air change rate result for the operational conditions of the test.
Standards of TestingAt present, there is no institutionalised scientific program
on air leakage performance for Australian construction. Results of preliminary testing by the Mobile Architecture & Built Environment Laboratory (MABEL) and Air Barrier Technologies Pty. Ltd., provide evidence that Australian buildings are often, two to three times ‘leakier’ than European or Northern American buildings. This suggests a tremendous opportunity for energy savings in Australia since not only is air leaked from buildings but also heat. This paper discusses the application of both methods as investigated on residential case studies. An interest in comparing the two methods of air leakage testing is also explored.
The CIBSE TM23 Standard, (2002) (from the UK) is the most commonly and accepted fan pressurisation testing standard. There are many other FPM developed standards such as the ASTM E779, (2004) and ASTM 1827 which all
appear to target the same result. For reference these standards are reviewed by the author in ‘Air Leakage in Buildings – Review of International Literature and Standards’ (Luther, 2007).
Case Studies on Air LeakageThe method of testing has been examined through a
number of cases studies across differing climates and locations in Australia, Melbourne, Brisbane and Tasmania. The houses tested where build by notable builders in these locations.
The first study utilising both the FPM and TGDM took place in two houses located in Melbourne. Figure 3 illustrates the plan, section and instrumentation location for these houses. The blower door test results were different for each of the houses. One such result is graphed in Figure 3, which contains two curves. The upper curve represents the flow pressure in the blower door apparatus. This Flow Pressure graph indicates the calibration of the orifice plate meter that is used to calculate the flow rate, which is dependent on the volume and leakiness of the house. The second (lower curve) is the relationship between the pressurisation (Pa) and the air leakage (m3/sec).
TGDM testing is conducted after the FPM method and takes several hours. The intention is to observe the leakage (infiltration condition) of this house without mechanical ventilation and under natural conditions. One of the purposes of conducting these air leakage tests in Australia is to investigate whether we have similar findings and resulting leakage correlations as in other countries. One such example is the ‘normalised’ (2.5 Pa) pressure equation as provided by Sherman, (1998). Equation 1 (Sherman, 1998) states that a test result of FPM at 50Pa can be factored by 20 to yield a natural leakage air change rate (ACHNL).ACH50 /20 = ACHNL (1)
The research question is whether this equation applies to Australian residential construction. Another more recent use is with the fire brigade who anticipate non-evacuation (shelter-in-place) strategies based upon a predicted air leakage rate developed elsewhere in the world. Therefore, unless we research our own building stock, we will be reliant upon ‘others’ representing it for us.
The air change rates for both the FPM and the TGDM can be observed for the two test houses in Table 1. Note that a calculated ACH at 2.5 Pa from the FPM pressurisation graph is provided. A measured ACH is also provided by the TGDM. The ‘shaded area’ indicates the factor which would be required to obtain the tested air change rate from the FPM result. It is obvious that the result is far from the factor of 20 as provided in Equation 1. However, a much larger factor (in some cases closer to 20) would be required to convert the measured ACH50 to the ACHTracer Gas result. A larger testing sample would be required here to draw results that are more conclusive.
Recognising Air Leakage LocationsSeveral interesting pieces of information are gathered from the
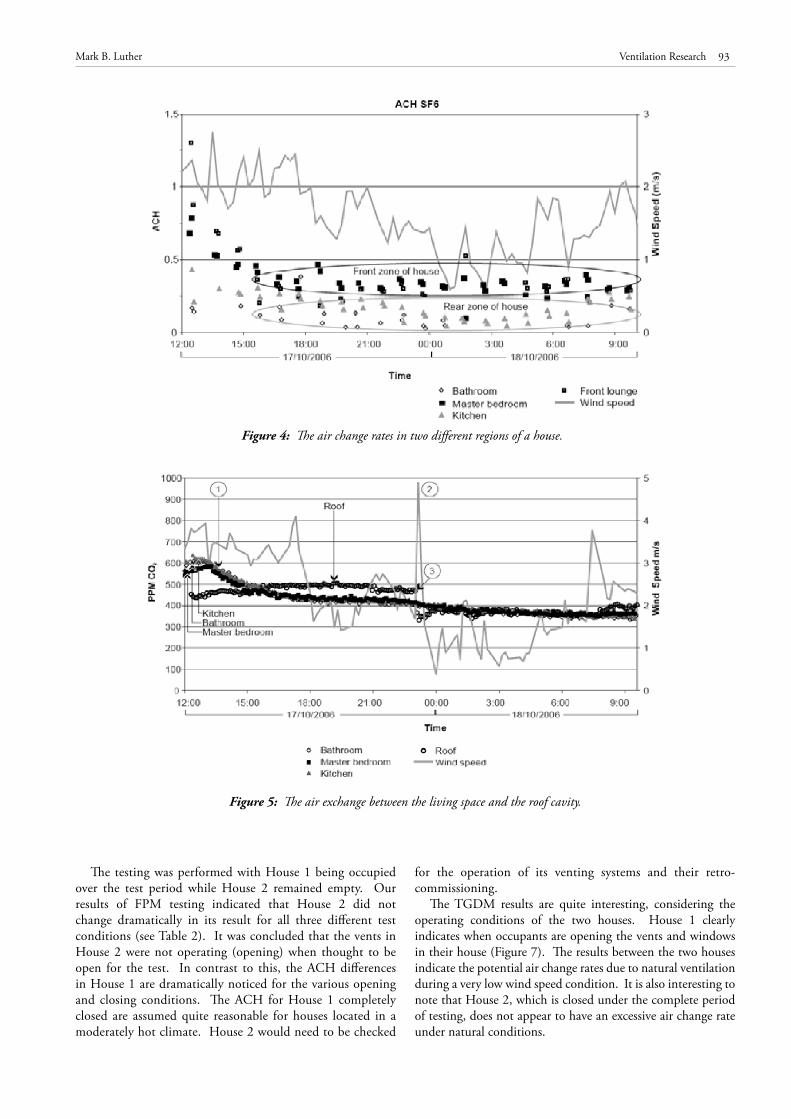
tracer gas studies. Figure 4 shows the results of air change rates for two regions (of the house floor plan not shown). This case clearly illustrates that wind pressure differences on a building (the

Architectural Science Review Volume 52, Number 2, 200992
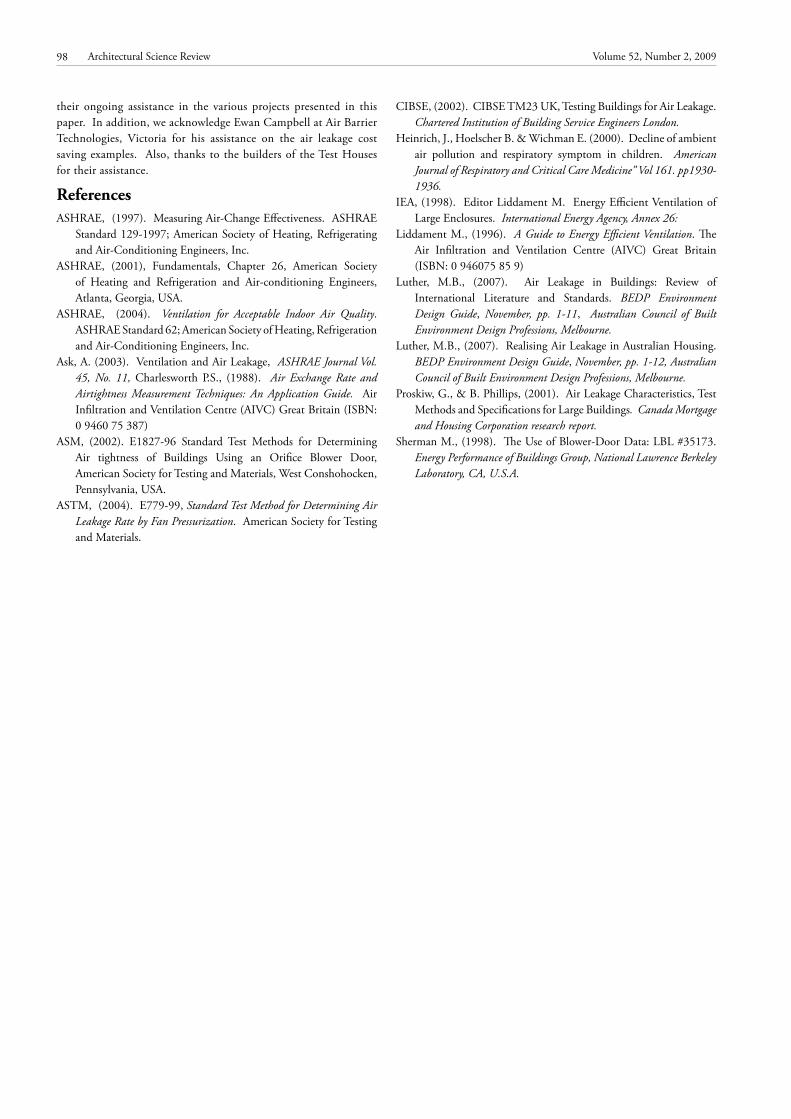
windward vs. the leeward side) can produce variable air change rates within the space. Another interesting aspect indicating the effects of where and when leakage takes place is observed in Figure 5 where the roof cavity air changes are observed. In this case the CO2 level from the occupants is measured in the living space as well as the roof cavity. The visitation of the researchers and visitors of the house provide the ‘tracer’ of CO2. Initially the measured CO2 in the house is greater than the roof cavity due to the visitation. After several hours, it is realised that the CO2 has migrated through to the roof cavity due to the multiple penetrations of down lights. Note that the wind speed is also charted on the graph. At a particular moment when the wind speed has dramatically increased for a moment (point 2) the CO2 is flushed from the roof and both the roof cavity and the living space become equally concentrated.
Realising Varying Air Leakage Due to Operational Differences
In the second case study in Queensland, near Brisbane, two houses were investigated. These houses are designed to accommodate the climate and are responsive to various natural conditioning principles. The roof is of a cathedral type and the cavity between the sarking and two roof cowl turbines vent the metal roof. The builder wanted to obtain air change rates and ventilation results of various operating scenarios within the structure. The floor plans of both houses are provided in Figure 6, again indicating the instrument location as well as the dosing and sampling of the TGDM. Note that the ‘Blower Door’ is not indicated on the plan and is located in the main entry door of the house.
Note: figures are pasted into tables to structure them into their anticipated format. However, they
can be extracted, saved and pasted as a MSWord ‘picture’ format and taken out of their tables.
Figure 1 Fan pressurisation unit. Figure 2 Pressure vs. Flow rate of a house.
Figure 3: Floor plan and section including the instrumentation of a Point Cook house.
Table 1: Air change rate results and calculations.
Figure 3: Floor plans and section of a test house in Melbourne showing the instrumentation.
Table 1: Air change rate results and calculations.
Note: figures are pasted into tables to structure them into their anticipated format. However, they
can be extracted, saved and pasted as a MSWord ‘picture’ format and taken out of their tables.
Figure 1 Fan pressurisation unit. Figure 2 Pressure vs. Flow rate of a house.
Figure 3: Floor plan and section including the instrumentation of a Point Cook house.
Table 1: Air change rate results and calculations.
93Mark B. Luther Ventilation Research
The testing was performed with House 1 being occupied over the test period while House 2 remained empty. Our results of FPM testing indicated that House 2 did not change dramatically in its result for all three different test conditions (see Table 2). It was concluded that the vents in House 2 were not operating (opening) when thought to be open for the test. In contrast to this, the ACH differences in House 1 are dramatically noticed for the various opening and closing conditions. The ACH for House 1 completely closed are assumed quite reasonable for houses located in a moderately hot climate. House 2 would need to be checked
for the operation of its venting systems and their retro-commissioning.
The TGDM results are quite interesting, considering the operating conditions of the two houses. House 1 clearly indicates when occupants are opening the vents and windows in their house (Figure 7). The results between the two houses indicate the potential air change rates due to natural ventilation during a very low wind speed condition. It is also interesting to note that House 2, which is closed under the complete period of testing, does not appear to have an excessive air change rate under natural conditions.
Figure 4: The air change rates in two different regions of a house.
Figure 5: The air exchange between the living space and the roof cavity.
Figure 4: The air change rates in two different regions of a house.
Figure 5: The air exchange between the living space and the roof cavity.
Figure 4: The air change rates in two different regions of a house.
Figure 5: The air exchange between the living space and the roof cavity.

Architectural Science Review Volume 52, Number 2, 200994
Comparing Air Leakages within Different Construction Detailing
The third, and last case study, considers the FPM and TGDM of three well rated houses (4-5 Star under First Rate) in Hobart, Tasmania. Figure 8 is the ‘typical’ floor plan for all three houses and again illustrates the instrumentation and where it is located. These houses consider different floor construction as well as window types. House 1 is a concrete slab on grade construction with double glazed windows, while Houses 2 and 3 are of
raised wooden floor (sub-floor cavity) construction. House 2 (5-Star) has double glazed windows while House 3 (4-Star) is single glazed. The floor is not insulated. The FPM results are provided for all three houses in Table 3. These air leakage results are representative of the expectations of the rating scheme. Note that there is a reporting of both air change rate (m3/hr) as well as the permeability (m3/hr/m2) of the building envelope. Although House 2 indicates a somewhat greater leakage while holding a 5-Star rating, this is to be expected, due to its raised and exposed Figure 6: The SALA homes floor plans with instrumentation location.
Table 2: Various fan pressurisation testing on the SALA homes.
34 The Green (House-1) 19 The Green (House-2)
Test ACH@ 4Pa ACH@ 50Pa ACH@ 4Pa ACH@ 50Pa
All vents closed 2.0 8.3 2.60 11.6
Roof vents open (only) 3.45 13.5 2.65 11.9
Roof and fridge vents open 3.60 15.6 2.7 13.1
Figure 7: The air change rates of the tracer gas method in both SALA homes (with and without ventilation).
Figure 6: The SALA homes floor plans with instrumentation location.
Table 2: Various fan pressurisation testing on the SALA homes.
34 The Green (House-1) 19 The Green (House-2)
Test ACH@ 4Pa ACH@ 50Pa ACH@ 4Pa ACH@ 50Pa
All vents closed 2.0 8.3 2.60 11.6
Roof vents open (only) 3.45 13.5 2.65 11.9
Roof and fridge vents open 3.60 15.6 2.7 13.1
Figure 7: The air change rates of the tracer gas method in both SALA homes (with and without ventilation).
Figure 6: Floor plans of a test house in Brisbane showing the instrumentation.
Table 2: Various Fan Pressurisation Testing on the Brisbane Test House.

95Mark B. Luther Ventilation Research
sub-floor. It should be noticed that House 1 is within the limits of ‘best practice’ according to the UK TM23 Standard.
Comparing the Two Different Testing Methods to Each Other
It was decided during the testing period to try to compare the results of a FPM air change rate with that of the TGDM results. In order to provide simultaneous results a method was devised to dose the space heavily with the tracer allowing it to disperse without the operation of the FPM. Once a uniformly dosed and balanced volume with the tracer was obtained, the FPM was quickly turned on to a fixed specific pressure level while the tracer gas decay was measured over time. This resulted in both the FPM leakage rate as well as the TGDM rate being simultaneously available. This testing method was applied to 4, 8 and 20Pa fixed pressure levels. These results are provided in Table 4 and it can be seen that the results of the two very different testing methods are remarkably in agreement with one another.
Recognising Air Leakage Pathways Between Building ‘Zones’
Lastly, an observation of the air leakage between the sub-floor, the living space and the roof cavity were observed. This testing
was aimed at qualitatively discovering interstitial leakages among the areas as well as inspecting the construction detailing. The chart in Figure 9 illustrates the acetone (ppm) concentration in House 2 and 3 after being dosed into the sub-floor only.
It is noticed that the tracer in House 2 quickly makes its way (after dosing) directly into the roof space as well as the lounge (living) area. This is due to the construction detailing in the brick veneer cavity and the floor plate. The wall cavity is very leaky and open to the sub-floor cavity in both houses. However, House 3 (4-Star Rated) has about a fifth of the leakage to the lounge space when compared to House 2 (5-Star Rated). This illustrates the differences between a rating and actual performance. The construction detailing of House 3 is tighter at the floor sill plate than House 2.
Predicting the Costs of LeakageOne of the unknown associated issues with building air
leakage is the prediction of cost savings to a client (Luther, 2007 Realising Air Leakage in Australian Housing). This of course is dependent on several factors which include the mechanical conditioning equipment type, the type of house construction (air leakage), the fuel source used, as well as the climate. An example of predicted savings as provided by Air Barrier Technologies Pty. Ltd. includes the calculations of applying
Figure 6: The SALA homes floor plans with instrumentation location.
Table 2: Various fan pressurisation testing on the SALA homes.
34 The Green (House-1) 19 The Green (House-2)
Test ACH@ 4Pa ACH@ 50Pa ACH@ 4Pa ACH@ 50Pa
All vents closed 2.0 8.3 2.60 11.6
Roof vents open (only) 3.45 13.5 2.65 11.9
Roof and fridge vents open 3.60 15.6 2.7 13.1
Figure 7: The air change rates of the tracer gas method in both SALA homes (with and without ventilation).
Figure 8: The typical floor plan and instrumentation of the Hobart houses.
Table 3: Fan pressurisation results of the Hobart houses.
Unit one Unit two Unit three Best practice*
Flow @ 50 Pa (m3/hr) 1492 1663 2115 N/A
Airchanges@50Pa 7.25 8.08 10.27 7.0
Permeability@50Pa (m3/hr/m
2) 5.42 6.04 7.67 5
*As per CIBSE TM23 standard for naturally ventilated domestic dwellings.
Table 4: The results of two testing methods under a constant pressure.
Pressure
(Internal/External pressure difference)Testing method
4 Pa 8 Pa 20 Pa
FPM air changes / hr 1.32 ACH 2.12 3.94
TGDM air changes / hr 1.25 ACH 1.85 4.4
% variation 5% 12% 11%
Figure 7: The air change rates of the tracer gas method in both the test houses in Brisbane (with and without ventilation).
Table 3: Fan pressurisation results of the Hobart houses.

Architectural Science Review Volume 52, Number 2, 200996
a proprietary code ‘EC-128’ (software developed in Canada) and the assumptions for the calculation of a year’s savings to a Melbourne house are as follows:
• 230 m2 house floor area within a Melbourne climate• House volume: 552 m3
• The method applies 1175 (base of 18ºC) HDD (heating degree days only)
• The fuel source is electricity at $0.16 kWh• Initial ACHnatural: 1.5 (air change rate / hr)• After retrofit ACHnatural: 0.5 (air change rate / hr)
This house requires 1.4 kW/hr on average annually to heat the excess infiltration air of 1.0 ACH. Note that this annual average is representative of variable external air changes in wind speed and temperature throughout the year. The yearly energy requirement for this extra conditioning of air is 12,264 kWh or 44 GJ. These results of reducing a house by 1.0 ACH
Figure 8: The typical floor plan and instrumentation of the Hobart houses.
Table 3: Fan pressurisation results of the Hobart houses.
Unit one Unit two Unit three Best practice*
Flow @ 50 Pa (m3/hr) 1492 1663 2115 N/A
Airchanges@50Pa 7.25 8.08 10.27 7.0
Permeability@50Pa (m3/hr/m
2) 5.42 6.04 7.67 5
*As per CIBSE TM23 standard for naturally ventilated domestic dwellings.
Table 4: The results of two testing methods under a constant pressure.
Pressure
(Internal/External pressure difference)Testing method
4 Pa 8 Pa 20 Pa
FPM air changes / hr 1.32 ACH 2.12 3.94
TGDM air changes / hr 1.25 ACH 1.85 4.4
% variation 5% 12% 11%
down to 0.5 ACH have a dramatic effect on energy savings:• An electric heat pump with a COP (Coefficient of
Performance) of 3 would use 4088 kWh/yr, implying a savings of $654 @ $0.16/kWh
• Gas heating with a COP of 0.9 would use 39600 MJ/yr costing $475 @ $0.012/MJ
• CO2 emissions (that could be saved) would be 5.4 tonnes with electricity or 2.06 tonnes with gas (in Victoria)
The ASHRAE 62 Standard considers the amount of fresh air exchange required for a particular dwelling, based on its volume and occupants. For the above example with 4 occupants, the required air change rate for ventilation would be around 0.25 ACH. It is believed that houses in Australia do not require such extreme air tightness and that there is only marginal benefit of savings as compared to the initial 1.0 ACH reduction achieved in the above example.
Figure 8: The typical floor plan and instrumentation of the Hobart houses.
Figure 8: The typical floor plan and instrumentation of the Hobart houses.
Table 3: Fan pressurisation results of the Hobart houses.
Unit one Unit two Unit three Best practice*
Flow @ 50 Pa (m3/hr) 1492 1663 2115 N/A
Airchanges@50Pa 7.25 8.08 10.27 7.0
Permeability@50Pa (m3/hr/m
2) 5.42 6.04 7.67 5
*As per CIBSE TM23 standard for naturally ventilated domestic dwellings.
Table 4: The results of two testing methods under a constant pressure.
Pressure
(Internal/External pressure difference)Testing method
4 Pa 8 Pa 20 Pa
FPM air changes / hr 1.32 ACH 2.12 3.94
TGDM air changes / hr 1.25 ACH 1.85 4.4
% variation 5% 12% 11%
Table 4: The results of two testing methods under a constant pressure.

97Mark B. Luther Ventilation Research
Another case study using the ASHRAE 62 Standard, for a relatively tight house, is provided next applying the tightness limits according to the standard. The assumptions made here are as follows:
Melbourne HHD = 1175 (base of 18ºC) note: cooling degree days not included
House floor area = 270m2
House volume= 656 m3
Initial ACHnatural = 0.7Desired ACHnatural = 0.35Excess infiltration = 228 m3/hrAccording to the ASHRAE 62 calculation, as based on the
required L/s (litres per second) of ventilation air per person, the unwanted (excess infiltration) would be 228 m3/hr. The energy put into this excess infiltration based on HDD (only) is 13.87 kWh per day based on an annual average HDD-18 of 1175. This equates to a yearly total of 5063 kWh excess conditioning of air, concluding that there is room for improvement to even a relatively tight house as experienced in measurements taken by Air Barrier Technologies:
• An electric heat pump with a COP (Coefficient of Performance) of 3 would use 1687 kWh/year costing A$270 @ $0.16/kWh
• Gas heating with a COP of 0.9 would use 20250 MJ/year costing A$243 @ $0.012/MJ
• CO2 emissions would be 2.2 tonnes with electricity or 1.1 tonnes with gas
As stated earlier in this paper, there are many other reasons, including increased occupant comfort as well as interstitial condensation prevention of the envelope construction, to be
considered when tightening buildings. For the example, the achievement of a 0.35 ACH rate in a house may in fact require the addition of an air to air heat exchanger in order to regulate and provide the exact amount of fresh air required and to allow for periods of exhaust air such as through bathroom fans.
ConclusionThis paper presented the investigation of several methods
on ventilation, air leakage and air exchange in various houses as well as types of construction throughout Australia.. The findings quantified the amount of air leakage utilising two test methods: the Fan Pressurisation Method (FPM) and the Tracer Gas Decay Method (TGDM) as well as providing qualitative approaches to air leakage within the building itself. Not all the results of ventilation testing, such as the air change rates between the sarking and a metal roof sheet, could be reported in this paper. The intention here was to indicate to the reader the huge amount of research potential for ventilation testing of houses in Australia. The findings here are only a sample of the housing and construction types in Australia. Further research is required to develop a better understanding of a construction type (weatherboard, brick veneer, etc.) and its leakage rate as well as where leakages occur and how we can improve our detailing and construction quality.
AcknowledgementsI would like to thank my research team, the technician
Richard Boldys and occupational hygienist Steve Atkinson, for
Figure 9: A comparative testing of air leakage within the lounge and roof cavity of house 2 and 3.Figure 9: A comparative testing of air leakage within the lounge and roof cavity of house 2 and 3.
Architectural Science Review Volume 52, Number 2, 200998
their ongoing assistance in the various projects presented in this paper. In addition, we acknowledge Ewan Campbell at Air Barrier Technologies, Victoria for his assistance on the air leakage cost saving examples. Also, thanks to the builders of the Test Houses for their assistance.
ReferencesASHRAE, (1997). Measuring Air-Change Effectiveness. ASHRAE
Standard 129-1997; American Society of Heating, Refrigerating and Air-Conditioning Engineers, Inc.
ASHRAE, (2001), Fundamentals, Chapter 26, American Society of Heating and Refrigeration and Air-conditioning Engineers, Atlanta, Georgia, USA.
ASHRAE, (2004). Ventilation for Acceptable Indoor Air Quality. ASHRAE Standard 62; American Society of Heating, Refrigeration and Air-Conditioning Engineers, Inc.
Ask, A. (2003). Ventilation and Air Leakage, ASHRAE Journal Vol. 45, No. 11, Charlesworth P.S., (1988). Air Exchange Rate and Airtightness Measurement Techniques: An Application Guide. Air Infiltration and Ventilation Centre (AIVC) Great Britain (ISBN: 0 9460 75 387)
ASM, (2002). E1827-96 Standard Test Methods for Determining Air tightness of Buildings Using an Orifice Blower Door, American Society for Testing and Materials, West Conshohocken, Pennsylvania, USA.
ASTM, (2004). E779-99, Standard Test Method for Determining Air Leakage Rate by Fan Pressurization. American Society for Testing and Materials.
CIBSE, (2002). CIBSE TM23 UK, Testing Buildings for Air Leakage. Chartered Institution of Building Service Engineers London.
Heinrich, J., Hoelscher B. & Wichman E. (2000). Decline of ambient air pollution and respiratory symptom in children. American Journal of Respiratory and Critical Care Medicine” Vol 161. pp1930-1936.
IEA, (1998). Editor Liddament M. Energy Efficient Ventilation of Large Enclosures. International Energy Agency, Annex 26:
Liddament M., (1996). A Guide to Energy Efficient Ventilation. The Air Infiltration and Ventilation Centre (AIVC) Great Britain (ISBN: 0 946075 85 9)
Luther, M.B., (2007). Air Leakage in Buildings: Review of International Literature and Standards. BEDP Environment Design Guide, November, pp. 1-11, Australian Council of Built Environment Design Professions, Melbourne.
Luther, M.B., (2007). Realising Air Leakage in Australian Housing. BEDP Environment Design Guide, November, pp. 1-12, Australian Council of Built Environment Design Professions, Melbourne.
Proskiw, G., & B. Phillips, (2001). Air Leakage Characteristics, Test Methods and Specifications for Large Buildings. Canada Mortgage and Housing Corporation research report.
Sherman M., (1998). The Use of Blower-Door Data: LBL #35173. Energy Performance of Buildings Group, National Lawrence Berkeley Laboratory, CA, U.S.A.