Evaluation of thermal comfort using combined CFD and experimentation study in a test room equipped...
11
Evaluation of thermal comfort using combined CFD and experimentation study in a test room equipped with a cooling ceiling Tiberiu Catalina a, * , Joseph Virgone b, c , Frederic Kuznik a a CETHIL, Thermal Science Research Center of Lyon, UMR5008, CNRS, INSA-Lyon, 20 Avenue Albert Einstein, 69621 Villeurbanne Cedex, France b Universite ´ Lyon 1, IUT A ge´nie Civil, 43 Bd. Du 11 Novembre, 69622 Villeurbanne Cedex, France c DGCB, URA CNRS 1652, ENTPE, rue Maurice Audin, 69518 Vaulx-en-Velin Cedex, France article info Article history: Received 25 April 2008 Received in revised form 17 November 2008 Accepted 20 November 2008 Keywords: Cooling ceiling Full-scale experimental study CFD simulations Thermal comfort abstract This paper reports a full-scale experimental campaign and a computational fluid dynamics (CFD) study of a radiant cooling ceiling installed in a test room, under controlled conditions. This research aims to use the results obtained from the two studies to analyze the indoor thermal comfort using the predicted mean vote (PMV). During the whole experimental tests the indoor humidity was kept at a level where the condensation risk was minimized and no condensation was detected on the chilled surface of the ceiling. Detailed experimental measurements on the air temperature distribution, surface temperature and globe temperature were realized for different cases where the cooling ceiling temperature varied from 16.9 to 18.9 C. The boundary conditions necessary for the CFD study were obtained from the experimental data measurements. The results of the simulations were first validated with the data from the experiments and then the air velocity fields were investigated. It was found that in the ankle/feet zone the air velocity could pass 0.2 m/s but for the rest of the zones it took values less than 0.1 m/s. The obtained experimental results for different chilled ceiling temperatures showed that with a cooling ceiling the vertical temperature gradient is less than 1 C/m, which corresponds to the standard recommendations. A comparison between globe temperature and the indoor air temperature showed a maximum difference of 0.8 C being noticed. This paper also presents the radiosity method that was used to calculate the mean radiant temperature for different positions along different axes. The method was based on the calculation of the view factors and on the surface temperatures obtained from the experiments. PMV plots showed that the thermal comfort is achieved and is uniformly distributed within the test room. Ó 2008 Elsevier Ltd. All rights reserved. 1. Introduction The majority of air-conditioning devices function using the principle of pulsated air, where the hot air of the room is partly recycled, cooled and returned into the room. The increase of the thermal loads in the buildings, mainly due to the arrival of office computers and lighting requirements, causes the installation of air- conditioning systems necessary to neutralize these loads and to create a good indoor thermal comfort. Heating, ventilating and air- conditioning (HVAC) systems, which consume large quantities of energy, have become a necessity for almost all the buildings [1] to provide a comfortable indoor environment. Currently, the evacuation of these quantities of latent and sensible heats is done mainly with air treated, introduced by air diffusers. To maintain comfort under these conditions, a greater volume of cooled air must be provided to the working area. Many complaints about air-conditioning systems have been claimed, especially in summer by female occupants [2]. Disadvantages such as noise, cold-drafts, vertical air temperature gradient demand the research of other cooling systems which can create better indoor conditions and in the same time to be energy efficiently. The use of water to cool the surfaces of the buildings is conse- quently a tempting alternative solution. It is even more appealing as water cooling requires much lower flow rates and higher temperatures of the water, so an energy consumption reduction could be achieved [3,4]. The chilled ceiling radiant panels are room cooling systems for placement in the ceiling zone, their cooling surfaces being connected with closed circuit heat conducting pipework containing flowing chilled water. The main difference between cooling ceilings and air- conditioning systems is the mechanism of heat transfer. Classic air- conditioning systems are based only on the convection, while cooled ceilings employ a combination of radiation and convection. * Corresponding author. Tel.: þ33 4 72 43 84 68; fax: þ33 4 72 43 85 22. E-mail address: [email protected] (T. Catalina). Contents lists available at ScienceDirect Building and Environment journal homepage: www.elsevier.com/locate/buildenv ARTICLE IN PRESS 0360-1323/$ – see front matter Ó 2008 Elsevier Ltd. All rights reserved. doi:10.1016/j.buildenv.2008.11.015 Building and Environment xxx (2009) 1–11 Please cite this article in press as: Catalina T et al., Evaluation of thermal comfort using combined CFD and experimentation study in a test room..., Building and Environment (2009), doi:10.1016/j.buildenv.2008.11.015
-
Upload
independent -
Category
Documents
-
view
0 -
download
0
Transcript of Evaluation of thermal comfort using combined CFD and experimentation study in a test room equipped...

lable at ScienceDirect
ARTICLE IN PRESS
Building and Environment xxx (2009) 1–11
Contents lists avai
Building and Environment
journal homepage: www.elsevier .com/locate/bui ldenv
Evaluation of thermal comfort using combined CFD and experimentationstudy in a test room equipped with a cooling ceiling
Tiberiu Catalina a,*, Joseph Virgone b,c, Frederic Kuznik a
a CETHIL, Thermal Science Research Center of Lyon, UMR5008, CNRS, INSA-Lyon, 20 Avenue Albert Einstein, 69621 Villeurbanne Cedex, Franceb Universite Lyon 1, IUT A genie Civil, 43 Bd. Du 11 Novembre, 69622 Villeurbanne Cedex, Francec DGCB, URA CNRS 1652, ENTPE, rue Maurice Audin, 69518 Vaulx-en-Velin Cedex, France
a r t i c l e i n f o
Article history:Received 25 April 2008Received in revised form17 November 2008Accepted 20 November 2008
Keywords:Cooling ceilingFull-scale experimental studyCFD simulationsThermal comfort
* Corresponding author. Tel.: þ33 4 72 43 84 68; faE-mail address: [email protected] (T. Ca
0360-1323/$ – see front matter � 2008 Elsevier Ltd.doi:10.1016/j.buildenv.2008.11.015
Please cite this article in press as: Catalinaroom..., Building and Environment (2009), d
a b s t r a c t
This paper reports a full-scale experimental campaign and a computational fluid dynamics (CFD) study ofa radiant cooling ceiling installed in a test room, under controlled conditions. This research aims to usethe results obtained from the two studies to analyze the indoor thermal comfort using the predictedmean vote (PMV). During the whole experimental tests the indoor humidity was kept at a level wherethe condensation risk was minimized and no condensation was detected on the chilled surface of theceiling. Detailed experimental measurements on the air temperature distribution, surface temperatureand globe temperature were realized for different cases where the cooling ceiling temperature variedfrom 16.9 to 18.9 �C. The boundary conditions necessary for the CFD study were obtained from theexperimental data measurements. The results of the simulations were first validated with the data fromthe experiments and then the air velocity fields were investigated. It was found that in the ankle/feetzone the air velocity could pass 0.2 m/s but for the rest of the zones it took values less than 0.1 m/s. Theobtained experimental results for different chilled ceiling temperatures showed that with a coolingceiling the vertical temperature gradient is less than 1 �C/m, which corresponds to the standardrecommendations. A comparison between globe temperature and the indoor air temperature showeda maximum difference of 0.8 �C being noticed. This paper also presents the radiosity method that wasused to calculate the mean radiant temperature for different positions along different axes. The methodwas based on the calculation of the view factors and on the surface temperatures obtained from theexperiments. PMV plots showed that the thermal comfort is achieved and is uniformly distributed withinthe test room.
� 2008 Elsevier Ltd. All rights reserved.
1. Introduction
The majority of air-conditioning devices function using theprinciple of pulsated air, where the hot air of the room is partlyrecycled, cooled and returned into the room. The increase of thethermal loads in the buildings, mainly due to the arrival of officecomputers and lighting requirements, causes the installation of air-conditioning systems necessary to neutralize these loads and tocreate a good indoor thermal comfort. Heating, ventilating and air-conditioning (HVAC) systems, which consume large quantities ofenergy, have become a necessity for almost all the buildings [1] toprovide a comfortable indoor environment.
Currently, the evacuation of these quantities of latent andsensible heats is done mainly with air treated, introduced by airdiffusers. To maintain comfort under these conditions, a greater
x: þ33 4 72 43 85 22.talina).
All rights reserved.
T et al., Evaluation of thermaoi:10.1016/j.buildenv.2008.11
volume of cooled air must be provided to the working area. Manycomplaints about air-conditioning systems have been claimed,especially in summer by female occupants [2]. Disadvantages suchas noise, cold-drafts, vertical air temperature gradient demand theresearch of other cooling systems which can create better indoorconditions and in the same time to be energy efficiently.
The use of water to cool the surfaces of the buildings is conse-quently a tempting alternative solution. It is even more appealingas water cooling requires much lower flow rates and highertemperatures of the water, so an energy consumption reductioncould be achieved [3,4]. The chilled ceiling radiant panels are roomcooling systems for placement in the ceiling zone, their coolingsurfaces being connected with closed circuit heat conductingpipework containing flowing chilled water.
The main difference between cooling ceilings and air-conditioning systems is the mechanism of heat transfer. Classic air-conditioning systems are based only on the convection, whilecooled ceilings employ a combination of radiation and convection.
l comfort using combined CFD and experimentation study in a test.015

Nomenclature
d distance to the wall [m]F0j diffuse view factorfm,f2 damping functionsg acceleration due to gravity [m s�2]k turbulent kinetic energy [m2 s�2]Icl clothing insulation [clo]Pr Prandtl numberRe Reynolds numberM metabolism [met]MRT mean radiant temperature [�C]PMV predicted mean votePPD predicted percentage of dissatisfied [%]
T mean temperature [�C]Tsj surface temperature [�C]U mean velocity magnitude [m s�1]ui0 velocity fluctuation component [m s�1]
x,y,z coordinate [m]
Greek lettersb coefficient of thermal expansion [K�1]m dynamic viscosity [Pas]n kinematic viscosity [m2 s�1]3 dissipation rate of k [m2 s�3]r mass density [kg m�3]s turbulent time scale [s]
T. Catalina et al. / Building and Environment xxx (2009) 1–112
ARTICLE IN PRESS
With cold ceilings, the transfer of radiant heat occurs by a clearemission of electromagnetic waves from the hot occupants andtheir environments to the radiant ceiling. The hot air arriving incontact with the cooled surface is cooled below the averagetemperature of the room and therefore falls down the zone ofoccupation [5]. With a cooling ceiling the temperature of water orits flow rate can be modified so that the surface temperature adaptto the desired conditions.
Ceiling radiant cooling systems can be more comfortable thanconventional air cooling systems due to small vertical temperaturegradient, few air movements and reduced local discomfort foroccupants during long stays in cooled room environments. Catalinaand Virgone [6] found after a series of simulations that the cooling
LONGITUDINAL
HORIZONTAL
3.1m
3.1m1
14
15
16
103.1m
2.5m
2.0m0.9m
3
2
2
1
4
5
7
6
15
Test cell 1
13
Fig. 1. Test cell fac
Please cite this article in press as: Catalina T et al., Evaluation of thermaroom..., Building and Environment (2009), doi:10.1016/j.buildenv.2008.11
ceilings offer good thermal comfort, the mean radiant temperaturebeing an important parameter in the comfort evaluation.
Nagano and Mochida [7] analyzed the thermal comfort of fivesubjects in an experimental test room equipped with cooling ceil-ings. Their study aim was to clarify the control conditions of ceilingradiant cooling systems for human subjects in a supine position.They concluded that the mean radiant temperature for a supinehuman body should be used in the design of ceiling radiant cooling.It was also found that some of the subjects voted the strong radiantsensation even though the temperature difference between theceiling and the room air was less than 5 �C in these experiments.
Kulpmann [8] reported an investigation of the thermal comfortin a test room equipped with a cooled ceiling surface and suppliedwith upward displacement ventilation air. The results showed that
SECTION
SECTION
3.1m
1
4
7
2
5
8
3
6
9
2
Test cell 2
10.5m
3.1m
2.4m
3.43m
2
9
8
12
11
17
18
7.5m
3.1m
1.75m
21
20
ility sections.
l comfort using combined CFD and experimentation study in a test.015

Table 1Envelope materials from interior to exterior.
Wall Material Thickness (mm)
Vertical wall Plaster 10Polystyrene 50Plaster 10Wood plate 50
Floor Concrete 200Ceiling Plaster 10
Wood plate 8Insulating material 55Wood plate 25
Glazed facade Glass 10
0.43m
0.26m
Floor
0.40m
0.10m
y4
y3
y2y1
x1x2
x3
x4
z1
z2
z3
z4
z5
z6
1.55m1.55m
2.0m
x
yz
(x1,y1)
Test facility
Measurements area
(1.55,1.55,0)
(x4,y4)
Fig. 2. Analyzed planes and measurement positions.
T. Catalina et al. / Building and Environment xxx (2009) 1–11 3
ARTICLE IN PRESS
a good value of thermal comfort was obtained and that thetemperature of the room surfaces was lower or at least equal to theair temperature in the room.
Hodder et al. [9] investigated and determined thermal comfortdesign conditions for combined chilled ceilings/displacementventilation environments. A typical office room was reproduced ina laboratory test room in which the ceiling temperatures werevaried. It was found that vertical radiant temperature asymmetryhas an insignificant effect on the overall thermal comfort of the eightsubjects who participated in this experimentation. Kulpmann [8]reported that the existing guidance [10] is valid with no modifica-tion, for thermal comfort design in such design environments.
Imanari et al. [2] compared the radiant cooling systems with air-conditioning systems in terms of thermal comfort, energyconsumption and costs. The thermal environment as well as humanresponse was tested by using a small meeting room equipped withradiant ceiling panels. It was shown in their work that the radiantceiling panel system is capable of creating smaller vertical variationof air temperature and a more comfortable environment thanconventional systems.
Simmonds [11] found that the traditional design criteria such asdry-bulb temperature and operative temperature were not alwayssufficient, mean radiant temperature having an important influ-ence on the comfort results.
Kitagawa et al. [12] investigated the effect of humidity and smallair movements on the thermal comfort of subjects in a climaticchamber equipped with radiant cooling panels. The results of theirquestionnaires showed that the most comfortable sensation votewas obtained in the conditions whose thermal sensation vote wasnot neutral but approximately �0.5.
The thermal comfort is, by definition, a subjective sensation;different people will express different preferences and it is prefer-able to use real persons to evaluate this notion. However, thisestimation method requires the use of a representative largenumber of subjects and hence can become expensive and timeconsuming. The approach used in this article study is based onexperimental data and computational fluid dynamics simulationsin order to obtain results on the parameters that influence thethermal comfort.
Table 2Thermo-physical characteristics of the test cell materials.
Density (kg m�3) Heat capacity(J kg�1 K�1)
Thermalconductivity(W m�1 K�1)
Concrete 400 919.5 0.16Wood plate 544 1640 0.136Plaster 814 1620 0.35Polystyrene 35 1210 0.04Insulating material 200 362.8 0.06Glass 2500 770 1.00
Please cite this article in press as: Catalina T et al., Evaluation of thermaroom..., Building and Environment (2009), doi:10.1016/j.buildenv.2008.11
Myhren and Holmberg [13] used computational fluid dynamics(CFD) simulations to investigate possible cold draught problems,the differences in vertical temperature gradients and air speedlevels in two office rooms equipped with different space heating
Fig. 3. Vertical distribution of air temperature for different ceiling temperatures atposition (x1,y1).
l comfort using combined CFD and experimentation study in a test.015
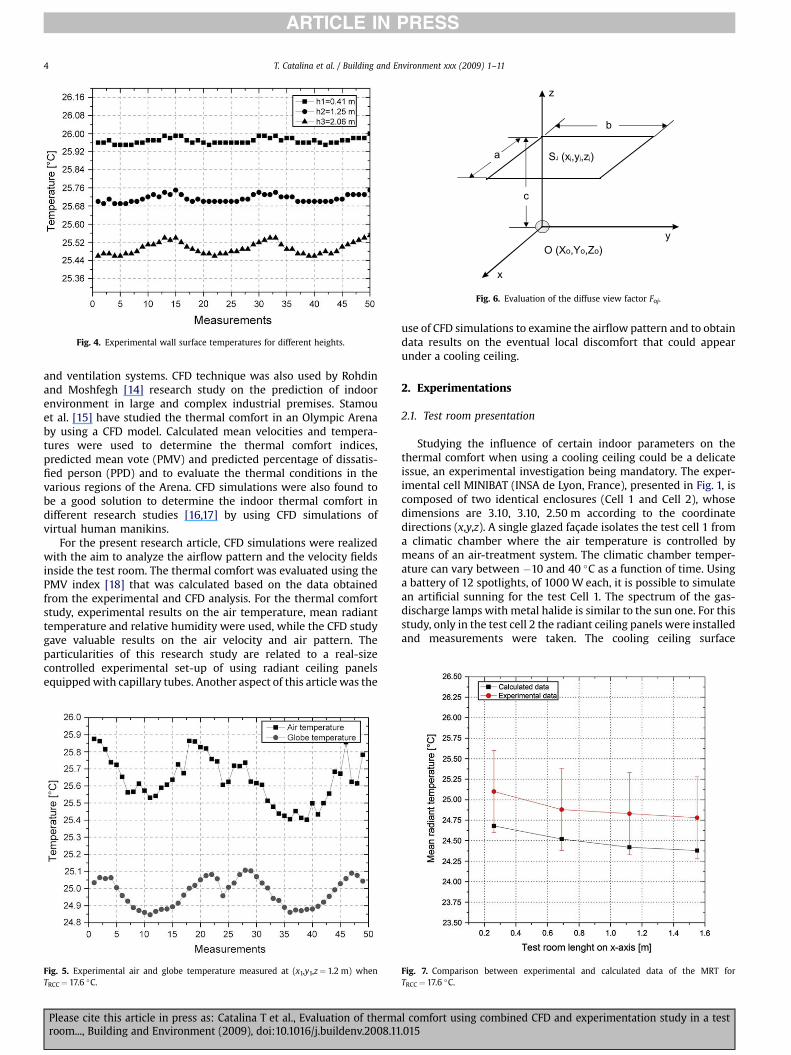
Fig. 4. Experimental wall surface temperatures for different heights.
z
x
y
b
a
c
SJ (xj,yj,zj)
O (Xo,Yo,Zo)
Fig. 6. Evaluation of the diffuse view factor Foj.
T. Catalina et al. / Building and Environment xxx (2009) 1–114
ARTICLE IN PRESS
and ventilation systems. CFD technique was also used by Rohdinand Moshfegh [14] research study on the prediction of indoorenvironment in large and complex industrial premises. Stamouet al. [15] have studied the thermal comfort in an Olympic Arenaby using a CFD model. Calculated mean velocities and tempera-tures were used to determine the thermal comfort indices,predicted mean vote (PMV) and predicted percentage of dissatis-fied person (PPD) and to evaluate the thermal conditions in thevarious regions of the Arena. CFD simulations were also found tobe a good solution to determine the indoor thermal comfort indifferent research studies [16,17] by using CFD simulations ofvirtual human manikins.
For the present research article, CFD simulations were realizedwith the aim to analyze the airflow pattern and the velocity fieldsinside the test room. The thermal comfort was evaluated using thePMV index [18] that was calculated based on the data obtainedfrom the experimental and CFD analysis. For the thermal comfortstudy, experimental results on the air temperature, mean radianttemperature and relative humidity were used, while the CFD studygave valuable results on the air velocity and air pattern. Theparticularities of this research study are related to a real-sizecontrolled experimental set-up of using radiant ceiling panelsequipped with capillary tubes. Another aspect of this article was the
Fig. 5. Experimental air and globe temperature measured at (x1,y1,z¼ 1.2 m) whenTRCC¼ 17.6 �C.
Please cite this article in press as: Catalina T et al., Evaluation of thermaroom..., Building and Environment (2009), doi:10.1016/j.buildenv.2008.11
use of CFD simulations to examine the airflow pattern and to obtaindata results on the eventual local discomfort that could appearunder a cooling ceiling.
2. Experimentations
2.1. Test room presentation
Studying the influence of certain indoor parameters on thethermal comfort when using a cooling ceiling could be a delicateissue, an experimental investigation being mandatory. The exper-imental cell MINIBAT (INSA de Lyon, France), presented in Fig. 1, iscomposed of two identical enclosures (Cell 1 and Cell 2), whosedimensions are 3.10, 3.10, 2.50 m according to the coordinatedirections (x,y,z). A single glazed façade isolates the test cell 1 froma climatic chamber where the air temperature is controlled bymeans of an air-treatment system. The climatic chamber temper-ature can vary between �10 and 40 �C as a function of time. Usinga battery of 12 spotlights, of 1000 W each, it is possible to simulatean artificial sunning for the test Cell 1. The spectrum of the gas-discharge lamps with metal halide is similar to the sun one. For thisstudy, only in the test cell 2 the radiant ceiling panels were installedand measurements were taken. The cooling ceiling surface
Fig. 7. Comparison between experimental and calculated data of the MRT forTRCC¼ 17.6 �C.
l comfort using combined CFD and experimentation study in a test.015
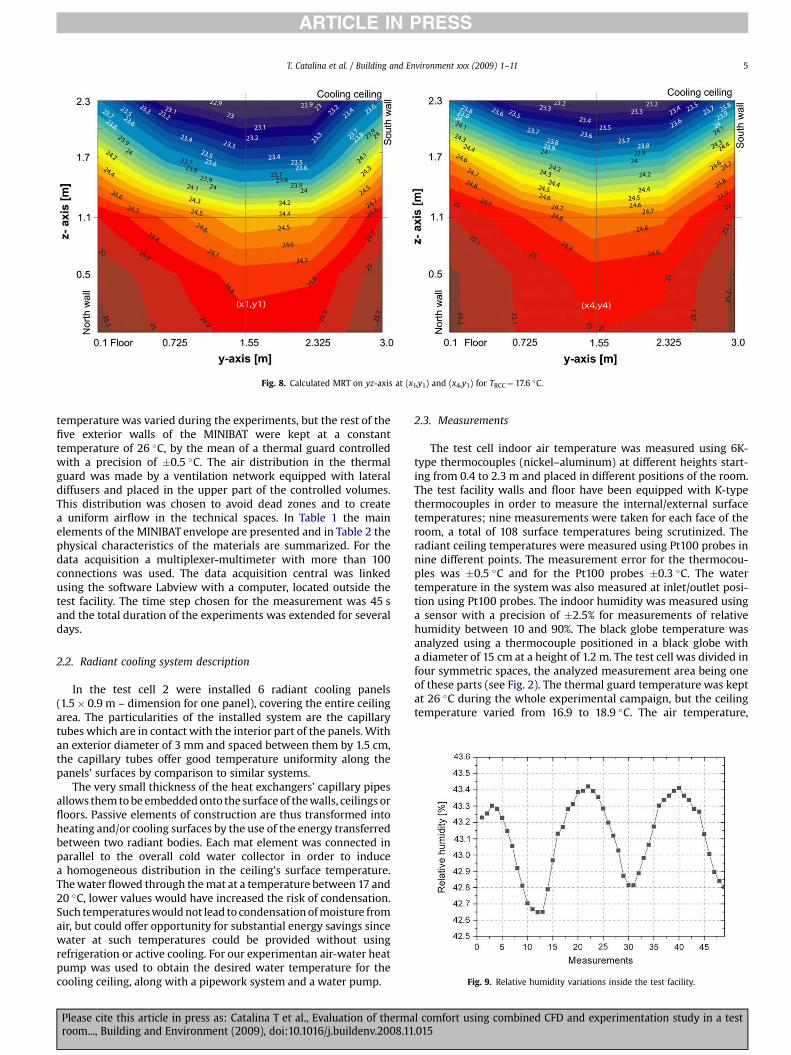
Fig. 8. Calculated MRT on yz-axis at (x1,y1) and (x4,y1) for TRCC¼ 17.6 �C.
Fig. 9. Relative humidity variations inside the test facility.
T. Catalina et al. / Building and Environment xxx (2009) 1–11 5
ARTICLE IN PRESS
temperature was varied during the experiments, but the rest of thefive exterior walls of the MINIBAT were kept at a constanttemperature of 26 �C, by the mean of a thermal guard controlledwith a precision of �0.5 �C. The air distribution in the thermalguard was made by a ventilation network equipped with lateraldiffusers and placed in the upper part of the controlled volumes.This distribution was chosen to avoid dead zones and to createa uniform airflow in the technical spaces. In Table 1 the mainelements of the MINIBAT envelope are presented and in Table 2 thephysical characteristics of the materials are summarized. For thedata acquisition a multiplexer-multimeter with more than 100connections was used. The data acquisition central was linkedusing the software Labview with a computer, located outside thetest facility. The time step chosen for the measurement was 45 sand the total duration of the experiments was extended for severaldays.
2.2. Radiant cooling system description
In the test cell 2 were installed 6 radiant cooling panels(1.5� 0.9 m – dimension for one panel), covering the entire ceilingarea. The particularities of the installed system are the capillarytubes which are in contact with the interior part of the panels. Withan exterior diameter of 3 mm and spaced between them by 1.5 cm,the capillary tubes offer good temperature uniformity along thepanels’ surfaces by comparison to similar systems.
The very small thickness of the heat exchangers’ capillary pipesallows them to be embedded onto the surface of the walls, ceilings orfloors. Passive elements of construction are thus transformed intoheating and/or cooling surfaces by the use of the energy transferredbetween two radiant bodies. Each mat element was connected inparallel to the overall cold water collector in order to inducea homogeneous distribution in the ceiling’s surface temperature.The water flowed through the mat at a temperature between 17 and20 �C, lower values would have increased the risk of condensation.Such temperatures would not lead to condensation of moisture fromair, but could offer opportunity for substantial energy savings sincewater at such temperatures could be provided without usingrefrigeration or active cooling. For our experimentan air-water heatpump was used to obtain the desired water temperature for thecooling ceiling, along with a pipework system and a water pump.
Please cite this article in press as: Catalina T et al., Evaluation of thermaroom..., Building and Environment (2009), doi:10.1016/j.buildenv.2008.11
2.3. Measurements
The test cell indoor air temperature was measured using 6K-type thermocouples (nickel–aluminum) at different heights start-ing from 0.4 to 2.3 m and placed in different positions of the room.The test facility walls and floor have been equipped with K-typethermocouples in order to measure the internal/external surfacetemperatures; nine measurements were taken for each face of theroom, a total of 108 surface temperatures being scrutinized. Theradiant ceiling temperatures were measured using Pt100 probes innine different points. The measurement error for the thermocou-ples was �0.5 �C and for the Pt100 probes �0.3 �C. The watertemperature in the system was also measured at inlet/outlet posi-tion using Pt100 probes. The indoor humidity was measured usinga sensor with a precision of �2.5% for measurements of relativehumidity between 10 and 90%. The black globe temperature wasanalyzed using a thermocouple positioned in a black globe witha diameter of 15 cm at a height of 1.2 m. The test cell was divided infour symmetric spaces, the analyzed measurement area being oneof these parts (see Fig. 2). The thermal guard temperature was keptat 26 �C during the whole experimental campaign, but the ceilingtemperature varied from 16.9 to 18.9 �C. The air temperature,
l comfort using combined CFD and experimentation study in a test.015

Table 3Coefficients of Eq. (3).
f Gf Sf Coefficients
Reynoldsfilteredvariables
1 0 Note: Sij ¼ 12
�vuivxjþ vuj
vxi
�, Uij ¼ 1
2
�vuivxjþ vuj
vxi
�ui mþ mt �vp
vxi� rg
T mPr þ
mtPrt
ST
AKN k–3
modelk mþ mt
skGk þ Gb � r3 mt ¼ rCmfmks, Cm ¼ 0:09, fm ¼
h1� exp
��Re3
14
�i2n1þ 5
Retexp
h��
Ret200
�2ioRet ¼ k2
3n, Re3 ¼�
n3�1=4
yn , s ¼ max
�k3;Ct
ffiffin3
p �Ct ¼ 1, Gk ¼ mt S2 � 2
3rkV,n� 23mt
�V,n
�2, S ¼
ffiffiffiffiffiffiffiffiffiffiffiffiffi2SijSij
q, Gb ¼ b mt
Prt
�VT,g
�3 mþ mt
s3
1s
3k
hC31
�Gk þ C33Gb
�� C32f2r3þ rgy
if2 ¼
h1� exp
��Re3
3:1
�i2n1� 0:3 exp
h��
Ret6:5
�2ioC33 ¼ tanh
�vu
�,sk ¼ 1:4, s3 ¼ 1:4, C31 ¼ 1:5, C32 ¼ 1:9, Prt ¼ 0:9
gy ¼ Cw32
k maxh�
ll3� l��
ll3
�2; 0i, l ¼ k3=2
3 , l3 ¼ Cld, Cl ¼ 2:55, Cw ¼ 0:83
T. Catalina et al. / Building and Environment xxx (2009) 1–116
ARTICLE IN PRESS
relative humidity and globe temperature measured in differentlocations of the rectangular grid of 0.43� 0.43 m are presented inFig. 2. The measurements were taken also on different heights,a total number of 96 measurements (on x,y,z-axis) being realized.The experiments were conducted under natural convectionconditions and no humidity sources were added. All the experi-ments were carried out under steady-state conditions.
Table 4Surface boundary conditions.
Surface Surface temperature (�C)
Series 1 Series 2 Series 3
North wall 25.79 25.84 26.25South wall 25.72 25.91 26.43East wall 25.48 25.71 26.12West wall 25.42 25.67 26.01Floor 24.98 25.40 25.89Cooling ceiling 16.90 17.60 18.90
2.4. Experimental results
2.4.1. Vertical air temperature profileThree experimental cases were carried out to investigate the
effect of radiant cooling ceiling temperature (TRCC) on the indoorenvironment. Fig. 3 shows the vertical distribution of air temper-ature in the center of the test room. If the temperature differencebetween the head and the feet is sufficiently large, a person canhave local warm discomfort and/or cold discomfort even thoughthe overall average is thermally neutral. Nominal vertical airtemperature gradients between 0.4 and 2.1 m heights were foundto be around 0.71–0.77 �C/m for the cooling ceiling at temperaturesof 16.9, 17.6 and 18.9 �C. The obtained experimental data are morethan satisfied, in terms when the comfort standards call fora maximum temperature difference between head and feet of 3 �C,regardless of the operative temperature.
2.4.2. Surface temperatureThe MINIBAT test cell was equipped with 108 thermocouples to
measure the surface temperature in the interior and exterior part ofthe room. Any major wall temperature fluctuation due to air-treatment system of the thermal guard wasn’t noticed. The impactof surface’s temperature on the human thermal comfort isconsiderable and a particular attention has been paid to this aspect.A 0.5 �C difference was observed between the lower and the upperpart of the walls (see Fig. 4).
2.4.3. Mean radiant temperatureEven though they are not in direct contact with the body, cold
surfaces (like radiant cooling ceiling) still greatly affect humanperception of temperature. With radiant cooling, the energybalance on the human body is different from that without thecooled ceiling in several ways. First, the heat losses from the humanbody by radiation are increased from about 35% without radiantcooling to 50% with radiant cooling [8]. Likewise, the heat lossesdue to convection decrease from about 40% without the chilledceiling to 30% with radiant cooling.
The globe temperature, which integrates the effect of airtemperature, radiation and air movement, was measured atz¼ 1.2 m for different locations of the (x,y) plane. It was found that
Please cite this article in press as: Catalina T et al., Evaluation of thermaroom..., Building and Environment (2009), doi:10.1016/j.buildenv.2008.11
the globe temperature had lower values than the air temperaturewith 0.6–0.9 �C (see Fig. 5).
Mean radiant temperature (MRT) is the most importantparameter governing human energy balance, with the strongestinfluence on thermo-physiological comfort indexes such as PMV,its meaningful scope being the thermal comfort. To evaluate theMRT for all the axes and heights we used a radiosity method.Considering a spherical point located at a spatial position ina room, the radiative balance equation can be written for thispoint. Taking into account the reciprocal relation of the viewfactor by using a linearization of the radiative exchangesbetween the spherical point and the walls and neglectingthe internal reflections, the thermal balance of the point isobtained [19]:
MRT ¼
ffiffiffiffiffiffiffiffiffiffiffiffiffiffiffiffiffiffiffiXN
j¼1
F0jT4Sj
4
vuut (1)
We suppose to have only rectangular surfaces for the differentenvelope components to consider. F0j, the diffuse view factorbetween a spherical point and a rectangular surface can be calcu-lated with Eq. (2) according to the notations of Fig. 6. In Eq. (1) thesurface temperatures (TSj) were obtained from the experimentalcampaigns.
F0j ¼1
4p
arctg
"ab
c,
ffiffiffiffiffiffiffiffiffiffiffiffiffiffiffiffiffiffiffiffiffiffiffiffiffiffiffia2 þ b2 þ c2
q#!
(2)
A comparison between the measurements taken on the meanradiant temperature and the results obtained using the radiositymethod is presented in Fig. 7. The results correspond to theposition (x1,y1,z3) to (x4,y1,z3) as presented previously in Section2.3. The results obtained using the radiosity model were in goodagreement with the data obtained from measurements,a maximum difference of 0.4 �C being noticed, value which can beexplained by the measurement errors from the thermocouplesensors. The results of MRT calculations are presented as two
l comfort using combined CFD and experimentation study in a test.015

Fig. 10. Velocity comparison for two mesh models at position x1,y1.
T. Catalina et al. / Building and Environment xxx (2009) 1–11 7
ARTICLE IN PRESS
temperature fields at position x1,y1 and x4,y1 on the y-axis. Theanalyzed cases correspond to the position in the center of the testroom and in the proximity of the wall. Fig. 8 shows the meanradiant temperature distribution calculated using Eq. (1) on thetwo analyzed cases. The effect of the radiant cooling ceiling onthe radiant temperature is more noticeable for the x1,y1 positionand is reduced when approaching the walls, due to radiant effectof the walls’ temperature.
2.4.4. Indoor humidity levelsOne of the main inconveniences of the radiant cooling ceiling is
that it is presenting a relatively high risk of condensation on the
Fig. 11. Comparison between measured and si
Please cite this article in press as: Catalina T et al., Evaluation of thermaroom..., Building and Environment (2009), doi:10.1016/j.buildenv.2008.11
chilled area. Even if the indoor humidity has a small effect on theglobal thermal comfort, for the cooling ceiling systems it is a crucialdesign parameter. Usually the dew point temperature is calculatedfor each zone by monitoring all the time the ambient air temper-ature and the relative humidity. The inlet water temperature iscontrolled individually with values higher than the dew point ofthe ambient air. Therefore, if a risk of condensation is present, thewater temperature is raised. A good solution to reduce the risk ofcondensation is to dehumidify the air but this solution will increaseconsiderably the price of the system and it cannot be used alone,a control system being necessary for perfect safety against thecondensation. For our experiment the relative humidity was kept atvalues between 42 and 43% (see Fig. 9), so the risk of condensationon the ceiling was minimized.
3. Mathematical model of airflow
During the last years, computational fluid dynamics (CFD)technology has progressed and made it possible to analyze complexsituations where HVAC systems were simulated and comparedwith real data obtained from experiments [20].
The mean airflow modelling is divided into two parts: (a)mathematical model (governing equations, turbulence model,boundary conditions, etc.) and (b) numerical solution (discretiza-tion, numerical scheme, solution convergence, etc.).
The CFD model was based on the description of the experi-mental test room. The airflow pattern and temperature distributionin the facility are governed by the conservation laws of mass,momentum and energy. The flow is assumed to be steady state,three-dimensional, incompressible and turbulent. The buoyancyeffect is invoked in the momentum equation, k and 3. The Boussi-nesq approximation hypothesis is used for the buoyant force term.The radiation heat transfer is not integrated in the CFD model dueto the constant temperature of surrounding surfaces. The numericalmodel is based on commercial CFD code called STAR-CCMþ [21].The Rayleigh-number has been calculated and its value of around1010 showed that the airflow is turbulent.
mulated air temperature at position x1,y1.
l comfort using combined CFD and experimentation study in a test.015
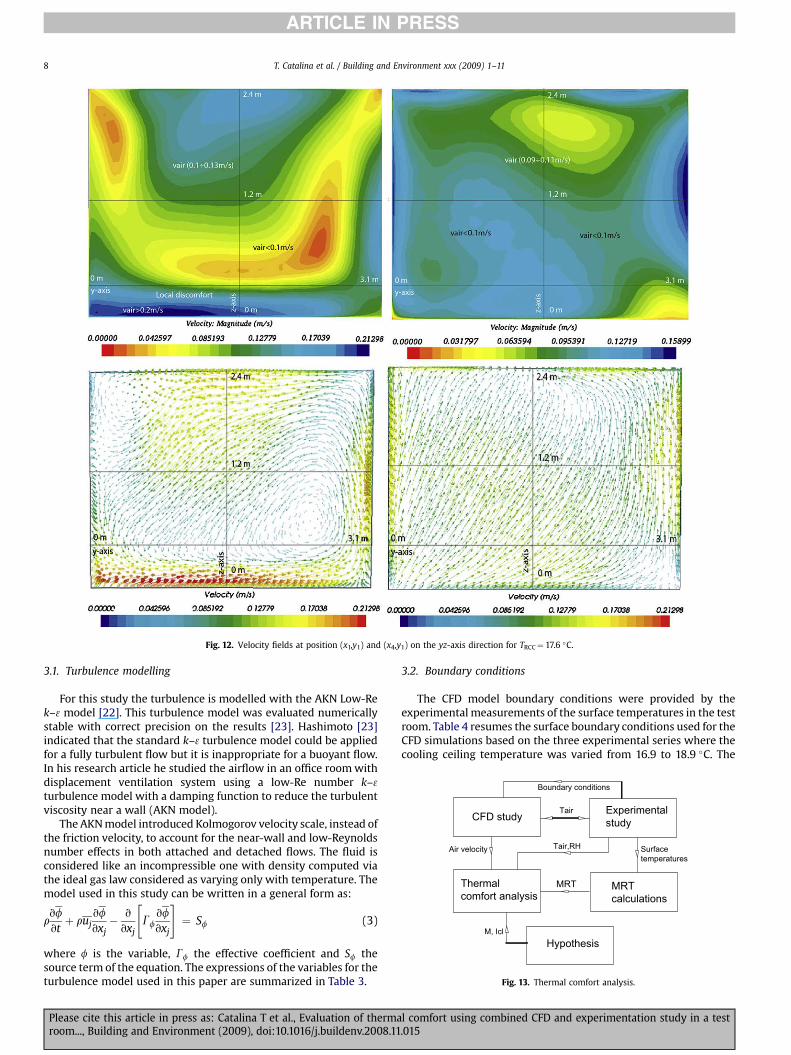
Fig. 12. Velocity fields at position (x1,y1) and (x4,y1) on the yz-axis direction for TRCC¼ 17.6 �C.
CFD study Experimental study
Thermal comfort analysis
MRTcalculations
Tair,RH
MRT
Surfacetemperatures
Air velocity
HypothesisM, Icl
Tair
Boundary conditions
Fig. 13. Thermal comfort analysis.
T. Catalina et al. / Building and Environment xxx (2009) 1–118
ARTICLE IN PRESS
3.1. Turbulence modelling
For this study the turbulence is modelled with the AKN Low-Rek–3 model [22]. This turbulence model was evaluated numericallystable with correct precision on the results [23]. Hashimoto [23]indicated that the standard k–3 turbulence model could be appliedfor a fully turbulent flow but it is inappropriate for a buoyant flow.In his research article he studied the airflow in an office room withdisplacement ventilation system using a low-Re number k–3
turbulence model with a damping function to reduce the turbulentviscosity near a wall (AKN model).
The AKN model introduced Kolmogorov velocity scale, instead ofthe friction velocity, to account for the near-wall and low-Reynoldsnumber effects in both attached and detached flows. The fluid isconsidered like an incompressible one with density computed viathe ideal gas law considered as varying only with temperature. Themodel used in this study can be written in a general form as:
rvf
vtþ ruj
vf
vxj� v
vxj
"Gf
vf
vxj
#¼ Sf (3)
where f is the variable, Gf the effective coefficient and Sf thesource term of the equation. The expressions of the variables for theturbulence model used in this paper are summarized in Table 3.
Please cite this article in press as: Catalina T et al., Evaluation of thermaroom..., Building and Environment (2009), doi:10.1016/j.buildenv.2008.11
3.2. Boundary conditions
The CFD model boundary conditions were provided by theexperimental measurements of the surface temperatures in the testroom. Table 4 resumes the surface boundary conditions used for theCFD simulations based on the three experimental series where thecooling ceiling temperature was varied from 16.9 to 18.9 �C. The
l comfort using combined CFD and experimentation study in a test.015

Fig. 14. PMV distribution at position (x1,y1) and (x4,y1) on the yz-axis direction for TRCC¼ 17.6 �C.
T. Catalina et al. / Building and Environment xxx (2009) 1–11 9
ARTICLE IN PRESS
wall boundaries have been modelled using the no-slip conditionwith constant wall temperature. The low-yþ wall treatment wasapplied for our model. The wall treatment assumes that the viscoussublayer is well resolved and thus wall laws are not needed.
3.3. Discretization
The mesh is designed using the pre-processor STAR-DESIGN [21]and the discretization of the computational domain is achieved bymeans of an unstructured mesh. In the boundary layer next to a non-slip wall, there are high gradients within a small region, so to capturethese gradients accurately it was necessary to have fine meshspacing normal to the wall. The volume mesh process consisted ofseveral steps, including surface improvement, subsurface genera-tion and then the actual interior volume meshing. The grid containspolyhedral elements, the final mesh being composed of 116,762cells. The volume range was between 3.386E�6 to 1.5351E�3 andthe minimum distance between centroids of neighbour cells was of3.374E�3. A grid dependency analysis was conducted to ensure thatthe resolution of the mesh was not influencing the results.
3.4. Numerical scheme
The solution method is based on the following main hypothesis:the diffusion terms are second-order central-differenced, and thesecond-order upwind scheme for convective terms is used toreduce the numerical diffusion. The velocity–pressure couplingmethod is the SIMPLE algorithm. The multigrid scheme allows toaccelerate the convergence as our model contains a very largenumber of control volumes [24].
3.5. CFD simulations’ results
3.5.1. Grid independence analysisEven if a convergent solution was obtained an additional step
was necessary to achieve good accuracy. Chen and Srebic [25]recommends a verification of the model results by systematicallyrefining the grid size realized generally by doubling the gridnumber and compare the two solutions. A grid independence testwas performed and the data results showed that the mesh density
Please cite this article in press as: Catalina T et al., Evaluation of thermaroom..., Building and Environment (2009), doi:10.1016/j.buildenv.2008.11
chosen was sufficient for a grid independent solution of velocityfields, no noticeable error being observed. Fig. 10 shows the velocityresults difference between the two analyzed grid mesh (1) 116,762cells and (2) 233,524 cells.
3.5.2. Comparison of the experimental data to CFD simulationsThe model validation is important to ensure adequate results
and was a necessary step before analyzing the airflow patternobtained from the CFD simulations. The validation was focused onthe comparison of air temperature for the three experimentalseries. The simulated results were analyzed and compared with theexperimental data on the position (x1,y1) along the z-axis accord-ing to the analyzed experimental configuration presented previ-ously in the article.
The analyzed data points are the most relevant in terms oftemperature distribution in the test room. In Fig. 11 the airtemperature distribution is confronted with the experimental data.The comparisons between the experimental and the numerical dataconfirm the validity of the numerical model used in the CFDsimulation; the differences between the CFD and experimentalresults could be explained by the measurement errors of �0.5 �C.Furthermore the accuracy of the results was analyzed by a sensi-tivity study of the air velocity values and air pattern flow to a changein the cooling ceiling temperature. This temperature was modifiedaccording to the measurements errors of the Pt probes used in theexperimental campaign (�0.3 �C). The conclusions of this sensi-tivity analysis showed that the airflow pattern is not modified andthe differences between the air velocities were insignificant.
3.5.3. Air velocity fieldsThe air speed could be an important parameter for the human
thermal comfort; an increased air speed will aid the evaporation ofsweat thus leading to a cooling effect, particularly if loose clothing isworn. However, if the air velocity is too high it may cause discomfortand a sensation of draughtiness. The thermal comfort cannot beameliorated by an increase of air velocity if the temperature orhumidity is too high. Mean air speed should be less than 0.15 m/s inthe occupied zone to prevent a feeling of discomfort for the mostsensitive. The CFD technique was found a valuable technique tocomplement the experimental results, allowing a detailed access to
l comfort using combined CFD and experimentation study in a test.015

Fig. 15. PMV and PPD for different values of clothing insulation and metabolism rate when TRCC¼ 17.6 �C.
T. Catalina et al. / Building and Environment xxx (2009) 1–1110
ARTICLE IN PRESS
velocity fields on different planes. In Fig.12, the flow fields at the twoanalyzed position (x1,y1) and (x4,y1) on the yz-axis are plotted for theexperimental study where the radiant cooling temperature was setat 17.6 �C. The hot air heated by the floor rises due to Archimedeseffect; once the ceiling is reached, the air is cooled and is then goesdown. It can be noticed that the air speed is higher than 0.2 m/s inthe feet and ankles’ zone and may cause problems for the occupants.Because the vertical walls’ temperatures are not strictly equal, theairflow is not symmetric in the test room. The results showed thatthe air velocity levels were still below the standard limits in most ofthe occupied zones.
4. Thermal comfort analysis
The use of standardized scales to gather ratings of thermalsensation from groups of individuals has permitted the researchersto identify the vital elements of the thermal environment and toevaluate the average response of the subjects. Thermal sensationratings given by real subjects are recommended, but these studiesare expensive and demand a large number of subjects in order toget correct results. For our study the predicted mean vote PMV andthe predicted percentage of dissatisfied PPD [13] were used toevaluate the thermal comfort. Both indices have been used withsuccess during the past decades and their valid range extends toour case of air conditioning with cooling ceiling panels.
The PMV model assumes a relation between optimal thermalconditions, using the steady-state heat balance equation for thehuman body and thermal comfort ratings from panels of subjects.The PMV is related by a 7-point thermal sensation scale of a groupof people exposed to a certain environment to the calculated resultof the basic heat balance equation. The PMV range values are within�3 to þ3, where the positive values stand for hot feeling and thenegative for cold feeling, 0 being a neutral value.
Please cite this article in press as: Catalina T et al., Evaluation of thermaroom..., Building and Environment (2009), doi:10.1016/j.buildenv.2008.11
The elements necessary to calculate the PMV are the airtemperature, the mean radiant temperature, the air velocity, therelative humidity and two subjective parameters which are thehuman metabolism rate and the clothing insulation of the person.For this study these parameters were obtained by the mean of anexperimental study, by calculations and by a CFD analysis. Fig. 13shows how the data obtained from the different studies are con-nected with the thermal comfort analysis. The main purpose of theCFD simulation was to give important information on the airflowpattern and on the air velocity fields. The experimental study wasnecessary to obtain data on relative humidity and air temperature,but also to provide the boundary conditions mandatory for the CFDanalysis. The mean radiant temperature was calculated by usinga radiosity method and had its support on the results of surfacetemperatures provided by the experimental tests.
In Fig. 14 the PMV distribution on the planes (x1,y1 and x4,y1 onthe yz-axis) are investigated. Fig. 15 presents the PMV index whenthe radiant cooling ceiling is set to 17.6 �C, for different metabolismrates and clothing insulations. The hypothesis for the analysis werethat the metabolism (M) corresponds to an office work and its valuewas 1.2 met (70 W/m2) and the clothing insulation (Icl) of 0.58 clo(0.089 m2 K/W). The effect of the radiant ceiling is more intense inthe center part of the room where the mean radiant temperature islower with an overall thermal comfort which is acceptable andwith values between �0.2 and 0.2. The two plots of PMV demon-strate that a uniform thermal comfort distribution in the room canbe obtained when using the chilled ceiling to cool the indoor air.
Based on the data obtained from the studies, the PMV/PPD werecalculated for different heights and for different levels of metabo-lism rate and clothing insulation. Even for higher levels of Icl thethermal comfort is still good, exceeding the comfort rangedescribed in ASHRAE 55 (�0.5 to 0.5) [26] only in the case wherethe metabolism rate takes higher values than 1.3 met.
l comfort using combined CFD and experimentation study in a test.015
T. Catalina et al. / Building and Environment xxx (2009) 1–11 11
ARTICLE IN PRESS
5. Conclusions
The air cooling using chilled ceiling panels was found to be aninteresting alternative to traditional air-conditioning system. Theresearch work was based on a fully experimental study which hadthe support of an extended analysis on the airflow pattern by usingthe CFD technique. The boundary conditions necessary for the CFDsimulation were taken from the experimental data and thena validation on the air temperature was realized.
The air velocity fields obtained from the CFD study showed thata local discomfort at feet/ankle zone was observed but with goodvalues of air velocity for the rest of the test room. The mean radianttemperature, a necessary element for the PMV calculations, wasevaluated using a radiosity method by calculating the view factorsin each point of the analyzed planes and with the data from theexperiment. The experimental results obtained for different chilledceiling temperature showed that with a cooling ceiling the verticaltemperature asymmetry is less than 1 �C, a value which corre-sponds to the standards’ recommendations. The globe temperaturewas measured and compared with the air temperature, a maximumdifference of 0.8 �C being observed.
The relative humidity was kept at normal values of 43% in orderto avoid the condensation that could have been produced on thecold surface of the ceiling. The thermal comfort was studied usingthe PMV index scale. The elements necessary to calculate the PMVwere taken from the two studies, CFD and experiment. The PMVdistribution plots showed that thermal comfort is achieved and isuniformly distributed no matter the position in the room for thedifferent planes in the test room. The results reported in this paperconfirm that the cooling ceiling has advantages like low vertical airgradient and that the thermal comfort is obtained even for highermetabolism rates or clothing insulation.
References
[1] ASHRAE. Thermal environmental conditions for human occupancy. ANSI-ASHRAE, Standard ASHRAE 55-1992; 1992.
[2] Imanari T, Omori T, Bogaki K. Thermal comfort and energy consumption of theradiant ceiling panel system. Comparison with the conventional all-air system.Energy and Buildings 1999;30:167–75.
[3] Stetiu C. Energy and peak power saving potential of radiant cooling system inUS commercial buildings. Energy and Buildings 1999;30:127–38.
[4] Niu J, Kooi J, Ree H. Energy saving possibilities with cooled-ceiling systems.Energy and Buildings 1995;23(2):147–58.
[5] Gan G. Towards a better indoor thermal environment ‘‘CFD analysis of theperformance of chilled ceiling systems’’, Ventilation ’94 – Fourth InternationalSymposium on Ventilation for Contaminant Control, Stockholm, Sweden, 5–9September, vol. 2; 1994, p. 551–6.
Please cite this article in press as: Catalina T et al., Evaluation of thermaroom..., Building and Environment (2009), doi:10.1016/j.buildenv.2008.11
[6] Catalina T, Virgone J. Evaluation of performances, thermal comfort andenergy consumption of a reversible radiant ceiling by capillary mat:application for the prefabricated buildings. EPIC November 2006;2006:467–72.
[7] Nagano K, Mochida T. Experiments on thermal environmental design ofceiling radiant cooling for supine human subjects. Building and Environment2004;39:267–75.
[8] Kulpmann RW. Thermal comfort and air quality in rooms with cooledceilingsdresults of scientific investigations. ASHRAE Transactions1993;99(2):488–501.
[9] Hodder SG, Loveday DL, Parsons KC, Taki AH. Thermal comfort in chilledceiling and displacement ventilation environments: vertical radiant temper-ature asymmetry effects. Energy and Buildings 1998;27:167–73.
[10] Fanger PO, Ipsen BM, Langkilde G, Olsen BW, Christensen NK, Tanabe S.Comfort limits for asymmetric thermal radiation, Energy and Buildings 8:225–36.
[11] Simmonds P. Practical applications of radiant heating and cooling to maintaincomfort conditions. ASHRAE Transactions 1996;102:659–66.
[12] Kitawaga K, Komodo N, Hayano H, Tanabe S. Effect of humidity and small airmovement on thermal comfort under a radiant cooling ceiling by subjectiveexperiments. Energy and Buildings June 1999;30(2):185–93.
[13] Myhren JA, Holmberg S. Flow patterns and thermal comfort in a room withpanel, floor and wall heating. Energy and Buildings 2008;40:524–36.
[14] Rohdin P, Moshfegh B. Numerical predictions of indoor climate in largeindustrial premises. A comparison between different k–e models supported byfield measurements. Building and Environment 2007;42:3872–82.
[15] Stamou AI, Katsiris I, Schaelin A. Evaluation of thermal comfort in GalatsiArena of the Olympics ‘‘Athens 2004’’ using a CFD model. Applied ThermalEngineering July 2008;28(10):1206–15.
[16] Nilsson HO. Thermal comfort evaluation with virtual manikin methods.Building and Environment 2007;42:4000–5.
[17] Miyanaga T, Urabe W, Nakano Y. Simplified human body model for evaluatingthermal radiant environment in a radiant cooled space. Building and Envi-ronment 2001;36:801–8.
[18] ISO, International Standard 7730. Moderate thermal environments: determi-nation of the PMV and PPD indices and specification of the conditions forthermal comfort. Geneva: International Organization for Standardization;2005.
[19] Inard C, Allard F, Depecker P. Promoclim 1991;22(3):166–74.[20] Kuznik F, Rusaouen G, Brau J. Experimental and numerical study of a full scale
ventilated enclosure: comparison of four two equations turbulence models.Building and Environment 2007;42(3):1043–53.
[21] Star CD 3.1B. User guide and methology. Computational Dynamics Limited/cd-adapco.comS, Manual; 2001.
[22] Abe K, Kondoh T, Nagano Y. A new turbulence model for predicting fluid flowand heat transfer in separating and reattaching flows – 1. Flow field calcula-tions. Int J Heat Mass Transf 1994;37:139–51.
[23] Hashimoto Y. Numerical study on airflow in an office room with a displace-ment ventilation system. Building Simulation 2005 Proceedings; 15–18August 2005, p. 381–7.
[24] Kuznik F, Rusaouen G, Brau J. A second order turbulence model for theprediction of air movement and heat transfer in a ventilated room. BuildingSimulation Journal 2008;1:72–82.
[25] Chen Q, Srebic J. A procedure for verification, validation, and reportingof indoor environment CFD analyses. HVAC & R Research 2002;8(2):201–16.
[26] ASHRAE ANSI/ASHRAE Standard 55-2004. Thermal environmental conditionsfor human occupancy. Atlanta: American Society of Heating Refrigerating andAir-Conditioning Engineers Inc.; 2004.
l comfort using combined CFD and experimentation study in a test.015