The White-Nose Syndrome Transcriptome: Activation of Anti-fungal Host Responses in Wing Tissue of...
29
RESEARCH ARTICLE The White-Nose Syndrome Transcriptome: Activation of Anti-fungal Host Responses in Wing Tissue of Hibernating Little Brown Myotis Kenneth A. Field 1 *, Joseph S. Johnson 1 , Thomas M. Lilley 1 , Sophia M. Reeder 1 , Elizabeth J. Rogers 1 , Melissa J. Behr 2 , DeeAnn M. Reeder 1 1 Department of Biology, Bucknell University, Lewisburg, Pennsylvania, United States of America, 2 Department of Pathobiological Sciences, School of Veterinary Medicine, University of Wisconsin-Madison, Madison, Wisconsin, United States of America * [email protected] Abstract White-nose syndrome (WNS) in North American bats is caused by an invasive cutaneous infection by the psychrophilic fungus Pseudogymnoascus destructans (Pd). We compared transcriptome-wide changes in gene expression using RNA-Seq on wing skin tissue from hibernating little brown myotis (Myotis lucifugus) with WNS to bats without Pd exposure. We found that WNS caused significant changes in gene expression in hibernating bats including pathways involved in inflammation, wound healing, and metabolism. Local acute inflammatory responses were initiated by fungal invasion. Gene expression was increased for inflammatory cytokines, including interleukins (IL) IL-1β, IL-6, IL-17C, IL-20, IL-23A, IL- 24, and G-CSF and chemokines, such as Ccl2 and Ccl20. This pattern of gene expression changes demonstrates that WNS is accompanied by an innate anti-fungal host response similar to that caused by cutaneous Candida albicans infections. However, despite the apparent production of appropriate chemokines, immune cells such as neutrophils and T cells do not appear to be recruited. We observed upregulation of acute inflammatory genes, including prostaglandin G/H synthase 2 (cyclooxygenase-2), that generate eicosanoids and other nociception mediators. We also observed differences in Pd gene expression that sug- gest host-pathogen interactions that might determine WNS progression. We identified sev- eral classes of potential virulence factors that are expressed in Pd during WNS, including secreted proteases that may mediate tissue invasion. These results demonstrate that hiber- nation does not prevent a local inflammatory response to Pd infection but that recruitment of leukocytes to the site of infection does not occur. The putative virulence factors may provide novel targets for treatment or prevention of WNS. These observations support a dual role for inflammation during WNS; inflammatory responses provide protection but excessive inflammation may contribute to mortality, either by affecting torpor behavior or causing dam- age upon emergence in the spring. PLOS Pathogens | DOI:10.1371/journal.ppat.1005168 October 1, 2015 1 / 29 a11111 OPEN ACCESS Citation: Field KA, Johnson JS, Lilley TM, Reeder SM, Rogers EJ, Behr MJ, et al. (2015) The White- Nose Syndrome Transcriptome: Activation of Anti- fungal Host Responses in Wing Tissue of Hibernating Little Brown Myotis. PLoS Pathog 11(10): e1005168. doi:10.1371/journal.ppat.1005168 Editor: Bruce S Klein, University of Wisconsin- Madison, UNITED STATES Received: July 17, 2015 Accepted: August 25, 2015 Published: October 1, 2015 Copyright: © 2015 Field et al. This is an open access article distributed under the terms of the Creative Commons Attribution License, which permits unrestricted use, distribution, and reproduction in any medium, provided the original author and source are credited. Data Availability Statement: All RNA-Seq files are available from the SRA database (accession number SRP055976). All metagenome files are available from the MG-RAST database (project 11709). Funding: This work was supported by the United States Fish and Wildlife Service grants F12AP01210 to DMR, F14AP00739 to DMR and KAF, and also the Woodtiger Fund to DMR and KAF and Bucknell University. The funders had no role in study design, data collection and analysis, decision to publish, or preparation of the manuscript.
Transcript of The White-Nose Syndrome Transcriptome: Activation of Anti-fungal Host Responses in Wing Tissue of...

RESEARCH ARTICLE
The White-Nose Syndrome Transcriptome:Activation of Anti-fungal Host Responses inWing Tissue of Hibernating Little BrownMyotisKenneth A. Field1*, Joseph S. Johnson1, Thomas M. Lilley1, Sophia M. Reeder1, ElizabethJ. Rogers1, Melissa J. Behr2, DeeAnn M. Reeder1
1 Department of Biology, Bucknell University, Lewisburg, Pennsylvania, United States of America,2 Department of Pathobiological Sciences, School of Veterinary Medicine, University of Wisconsin-Madison,Madison, Wisconsin, United States of America
AbstractWhite-nose syndrome (WNS) in North American bats is caused by an invasive cutaneous
infection by the psychrophilic fungus Pseudogymnoascus destructans (Pd). We compared
transcriptome-wide changes in gene expression using RNA-Seq on wing skin tissue from
hibernating little brown myotis (Myotis lucifugus) with WNS to bats without Pd exposure.
We found that WNS caused significant changes in gene expression in hibernating bats
including pathways involved in inflammation, wound healing, and metabolism. Local acute
inflammatory responses were initiated by fungal invasion. Gene expression was increased
for inflammatory cytokines, including interleukins (IL) IL-1β, IL-6, IL-17C, IL-20, IL-23A, IL-
24, and G-CSF and chemokines, such as Ccl2 and Ccl20. This pattern of gene expression
changes demonstrates that WNS is accompanied by an innate anti-fungal host response
similar to that caused by cutaneous Candida albicans infections. However, despite the
apparent production of appropriate chemokines, immune cells such as neutrophils and T
cells do not appear to be recruited. We observed upregulation of acute inflammatory genes,
including prostaglandin G/H synthase 2 (cyclooxygenase-2), that generate eicosanoids and
other nociception mediators. We also observed differences in Pd gene expression that sug-
gest host-pathogen interactions that might determine WNS progression. We identified sev-
eral classes of potential virulence factors that are expressed in Pd during WNS, including
secreted proteases that may mediate tissue invasion. These results demonstrate that hiber-
nation does not prevent a local inflammatory response to Pd infection but that recruitment of
leukocytes to the site of infection does not occur. The putative virulence factors may provide
novel targets for treatment or prevention of WNS. These observations support a dual role
for inflammation during WNS; inflammatory responses provide protection but excessive
inflammation may contribute to mortality, either by affecting torpor behavior or causing dam-
age upon emergence in the spring.
PLOS Pathogens | DOI:10.1371/journal.ppat.1005168 October 1, 2015 1 / 29
a11111
OPEN ACCESS
Citation: Field KA, Johnson JS, Lilley TM, ReederSM, Rogers EJ, Behr MJ, et al. (2015) The White-Nose Syndrome Transcriptome: Activation of Anti-fungal Host Responses in Wing Tissue of HibernatingLittle Brown Myotis. PLoS Pathog 11(10): e1005168.doi:10.1371/journal.ppat.1005168
Editor: Bruce S Klein, University of Wisconsin-Madison, UNITED STATES
Received: July 17, 2015
Accepted: August 25, 2015
Published: October 1, 2015
Copyright: © 2015 Field et al. This is an openaccess article distributed under the terms of theCreative Commons Attribution License, which permitsunrestricted use, distribution, and reproduction in anymedium, provided the original author and source arecredited.
Data Availability Statement: All RNA-Seq files areavailable from the SRA database (accession numberSRP055976). All metagenome files are available fromthe MG-RAST database (project 11709).
Funding: This work was supported by the UnitedStates Fish and Wildlife Service grants F12AP01210to DMR, F14AP00739 to DMR and KAF, and also theWoodtiger Fund to DMR and KAF and BucknellUniversity. The funders had no role in study design,data collection and analysis, decision to publish, orpreparation of the manuscript.

Author Summary
White-nose syndrome is the most devastating epizootic wildlife disease of mammals inhistory, having killed millions of hibernating bats in North America since 2007. We haveused next-generation RNA sequencing to provide a survey of the gene expression changesthat accompany this disease in the skin of bats infected with the causative fungus. Weidentified possible new mechanisms that may either provide protection or contribute tomortality, including inflammatory immune responses. Contrary to expectations thathibernation represents a period of dormancy, we found that gene expression pathwayswere responsive to the environment. We also examined which genes were expressed in thepathogen and identified several classes of genes that could contribute to the virulence ofthis disease. Gene expression changes in the host were associated with local inflammationdespite the fact that the bats were hibernating. However, we found that hibernating batswith white-nose syndrome lack some of the responses known to defend other mammalsfrom fungal infection. We propose that bats could be protected from white-nose syndromeif these responses could be established prior to hibernation or if treatments could block thevirulence factors expressed by the pathogen.
IntroductionWhite-nose syndrome (WNS) is an epizootic disease that has killed millions of bats in NorthAmerica [1, 2]. WNS is caused by the psychrophile Pseudogymnoascus destructans (Pd) (for-merly Geomyces destructans), an ascomycete fungal pathogen [3–5] that affects bats duringhibernation. Pd grows at temperatures between 2 and 18°C and can infect bats while theyhibernate [4, 6]. Pd is invasive and damages the cutaneous tissues of bats, including the wing[7], forming characteristic cupping erosions that are diagnostic of Pd infection [8]. Mortalityrates due to WNS vary by species. In the little brown myotis,Myotis lucifugus, the mortalityrate is up to 91% in affected caves [9, 10] whereas WNS resistance has been reported in the bigbrown bat, Eptesicus fuscus [11]. Bats in Europe are exposed to endemic Pd, but do not exhibitWNS mortality and appear to be resistant to the disease [12], despite cutaneous invasion by Pd[13].
Cutaneous infection by Pd causes some species of bats to arouse more frequently from tor-por [5, 14, 15]. Although hibernating mammals spend less than 1% of their time euthermic[16], they use up to 90% of their stored energy during these periods [17, 18]. Because eacharousal in little brown myotis utilizes an estimated 108 mg of stored fat [18], the increase inarousal frequency caused by WNS explains 58% of the morbidity rate associated with Pd infec-tion [14]. Other factors that are also associated WNS pathology include effects of Pd infectionon the integrity of wing tissue [7, 19], electrolyte balance and hydration [7, 20, 21], chronicrespiratory acidosis [22], oxidative stress [23], and immune function [24]. The relative impor-tance of each of these mechanisms in causing death in WNS is not clear, and the most likelymodel that has emerged is a multi-stage progression of WNS with contributions of several ofthese factors [22]. Differences in susceptibility to WNS between species in North America maybe explained in part by different responses to Pd infection such as changes in thermoregulatorybehavior. Understanding host responses to Pd infection may provide insight that could be use-ful for improving survival of affected species.
Cutaneous fungal infections in mammals are first recognized by components of the innateimmune system, including C-type lectin receptors and Toll-like receptors [25]. Conservedcomponents of the fungal cell wall activate pattern recognition receptors on phagocytes such as
Transcriptome of Bats with White-Nose Syndrome
PLOS Pathogens | DOI:10.1371/journal.ppat.1005168 October 1, 2015 2 / 29
Competing Interests: The authors have declaredthat no competing interests exist.

neutrophils, macrophages, and dendritic cells, and on epithelial cells [26]. Activation of thesecells can lead to induction of the inflammasome, the production of inflammatory cytokines,and generation of reactive oxygen species that can mediate fungal cell killing [25]. The impor-tance of the innate immune response to the initial recognition of fungal infections is demon-strated by the observation that deficiencies in these signaling pathways can lead to chronicfungal infections in humans [27, 28]. In the absence of invasion, colonization by commensalfungi can be maintained through tolerance mechanisms mediated by interactions with den-dritic cells and epithelial cells in the skin [29]. Local activation of innate immune pathways canslow the growth of invasive pathogenic fungi and promote tolerance, possibly leading to a com-mensal relationship with the fungus [30], but is not usually sufficient to clear infections. Clear-ance of infections typically requires T helper (Th) cells, as demonstrated by the susceptibility ofpatients with acquired immune deficiency syndrome, immunosuppressant therapy, or chemo-therapy to fungal infections [31]. These T cell responses can be mediated by Th17 cells [32, 33]or, in some cases, Th1 cells [34], with Th2 responses typically associated with greater suscepti-bility [35]. Th17 responses can contribute to clearance of invasive fungal infections throughthe actions of IL-17A and IL-22 [36] and the further recruitment and activation of neutrophils[37]. These T cell subsets have not been well characterized in bats, but those T-cell mediatedimmune mechanisms that have been studied appear to be conserved between bats and othermammals [38–41].
Fungal infections in animals are typically life-threatening only upon suppression of adaptiveimmune responses in the host, such as when chytrid fungus (Batrachochytrium dendrobatidis)blocks lymphocyte-mediated inflammatory responses [42]. Hibernation produces a naturalsuppression of some immune responses in mammal species where it has been studied. Duringhibernation, when the conservation of energy is critical, certain immunological mechanismsare downregulated while others remain unaffected [43–51]. Changes during hibernation caninclude depressed antibody responses [44, 52], decreased ability of T and B lymphocytes toproliferate in response to challenge [53, 54], and reduced complement activity [47]. Hiberna-tion does not affect all immune responses equally, as shown in thirteen-lined ground squirrels(Ictidomys tridecemlineatus) that have a suppressed T-independent antibody response but arecapable of mounting a T cell-dependent response during hibernation [44]. Studies of transcrip-tome-wide changes during hibernation in squirrels [55–59] have shown expression changes ingenes involved in metabolism, oxidative stress, protein folding, ischemia/hypoxia, and otherprocesses, but these studies were not examining an active immune response. Hibernation isalso known to affect the distribution of leukocytes [45, 60] and platelets [61]. However, wehave an incomplete understanding of how hibernation affects the suppression, or subsequentrecovery, of immune responses [43], or how immune physiology in bats during hibernationmay differ from that of rodents.
The cost of immune suppression during torpor is presumably outweighed by the benefits ofenergy conservation because most pathogens are not capable of proliferating at the low bodytemperatures of hibernating animals. However, the psychrophilic nature of Pd allows it toinfect bats within hibernacula [2, 4]. The brief euthermic bouts of hibernating bats are shorterthan most other hibernating mammalian species [14, 62] and it may not be possible for a batnaïve to a pathogen to mount a primary immune response in the few hours that it is euthermicthroughout the hibernation season. We have observed antibody responses to Pd in bats, butthese responses are strongest in active bats exposed to Pd after emergence from hibernation[63]. Therefore, hibernating bats may keep pathogens in check by relying on hypothermia,innate immune responses, and/or memory immune responses. The psychrophilic nature of Pdovercomes the first of these barriers to infection and the difficulty in fighting fungal pathogens
Transcriptome of Bats with White-Nose Syndrome
PLOS Pathogens | DOI:10.1371/journal.ppat.1005168 October 1, 2015 3 / 29

with innate mechanisms alone may allow Pd to proliferate and invade the cutaneous tissues ofbats.
The WNS panzootic has created an urgent need to understand if North American bat popu-lations can persist in the presence of the fungal pathogen [1, 10]. Understanding the completearray of host responses mounted by bats afflicted with WNS may help illuminate sources ofvariation in survival within and among bat species. To determine which host responses areactivated by Pd infection, we measured transcriptome-wide gene expression levels in bat wingtissue from hibernating bats affected by WNS. Gene expression was compared to bats thatwere hibernated in captivity in the absence of Pd exposure. We hypothesized that Pd infectionwould cause changes in gene expression that would reveal physiological responses duringWNS that might be either protective or pathological. By using next-generation RNA sequenc-ing to examine transcriptome-wide gene expression changes we expected to discover consistentpatterns of host responses that occur in Pd-infected tissues. Combined with changes in geneexpression within the Pd pathogen, these results have provided a survey of the host and patho-gen interactions occurring during WNS.
Results
Gene Expression Changes Revealed by Next Generation RNASequencingTo determine the host response mounted by little brown myotis to Pd during hibernation, wemeasured changes in gene expression at the whole transcriptome level. Wing tissue sampleswere obtained from hibernating little brown myotis with no known exposure to Pd and batsexhibiting physical signs of WNS, as shown in Table 1. Histopathology [8] and quantitativePCR (qPCR) for Pd [64] were used to confirm the WNS status of each bat (Table 1). Cuppingerosions diagnostic of WNS were found on all 6 bats captured in Kentucky, but on none of the5 bats from states negative for WNS at the time of capture. Low levels of neutrophilic inflam-mation were found in all 11 wing samples (Table 1; Infl), although this inflammation was notassociated with sites of Pd infection. All 6 WNS-affected bats tested positive for Pd by qPCR,although the fungal load measured on wing swabs (Table 1; qPCR) did not correlate with thenumber of cupping erosions found by histology (Table 1; WNS). As previously shown [5, 14,15], WNS-affected bats had significantly lower body condition (Table 1; SMI; p = 0.017,t = 2.9255, df = 9).
Next generation RNA sequencing (RNA-Seq) was performed using poly-A selected RNAisolated from each RNAlater-preserved wing tissue sample (S1 Table). Using expression levelsof Pd-derived transcripts, we confirmed that all 6 WNS-affected bats had abundant expressionof Pd genes. The Pd-derived transcripts were not present at significant levels in any of the 5samples from unaffected bats (S2 Table; p = 2.2x10⁻⁶, t = 21.5, df = 5.33), including the MN090sample that had tested positive for Pd by qPCR in one of the two replicates (Table 1). Becausehigh levels of differential expression of Pd transcripts would make it more difficult to detect sig-nificant changes in host gene expression, the assembly was filtered [65] to remove Pd-derivedsequences. Comparison of the filtered assembly with the original revealed that removing the Pdsequences did not significantly decrease the completeness of the assembly (S3 Table) as deter-mined by BUSCO [66]. This filtered assembly (S1 Dataset) was used to calculate differentialexpression in host genes between the unaffected andWNS-affected samples.
We compared host gene expression across all samples (S2 Dataset) using DESeq2 [67] toidentify transcript clusters that were expressed at a minimum of 2-fold difference and signifi-cant at a false discovery rate (FDR) of 0.05 (S1 Fig). We found 1804 transcript clusters thatwere expressed at higher levels, and 1925 transcript clusters expressed at lower levels, in WNS-
Transcriptome of Bats with White-Nose Syndrome
PLOS Pathogens | DOI:10.1371/journal.ppat.1005168 October 1, 2015 4 / 29

Table 1. Samples used for next generation RNA sequencing.
Sample Location Date Captured Date Sampled Sex Mass SMI1 Pd Load by qPCR2 Histology
WNS3 Infl4
MI011 Mine in Dickinson Co, MI 5-Nov-2011 22-Mar-2012 M 6.70 6.69 Negative 0 9
MN064 Mine in Saint Louis Co, MN 16-Nov-2011 22-Mar-2012 F 7.41 7.15 Negative 0 2
MN075 Mine in Saint Louis Co, MN 16-Nov-2011 22-Mar-2012 F 7.47 7.68 Negative 0 50
MN090 Mine in Saint Louis Co, MN 16-Nov-2011 22-Mar-2012 M 7.66 7.51 Neg/Pos? 0 13
IL114 Mine in LaSalle Co, IL 17-Nov-2011 22-Mar-2012 F 7.13 7.40 Negative 0 2
KY06 Cave 1 in Breckinridge Co, KY 12-Mar-2014 12-Mar-2014 F 6.04 6.17 120 000 352 25
KY07 Cave 1 in Breckinridge Co, KY 12-Mar-2014 12-Mar-2014 F 6.90 6.89 13 000 438 57
KY11 Cave 1 in Breckinridge Co, KY 12-Mar-2014 12-Mar-2014 M 5.47 6.12 169 000 288 3
KY19 Cave 2 in Breckinridge Co, KY 12-Mar-2014 12-Mar-2014 M 6.28 6.93 64 000 117 9
KY23 Cave 2 in Breckinridge Co, KY 12-Mar-2014 12-Mar-2014 F 6.58 6.89 21 000 234 10
KY39 Cave in Jackson Co, KY 13-Mar-2014 13-Mar-2014 M 6.28 6.69 120 000 197 10
1 Scaled mass index: (mass(in g))*(38.01/(forearm length(in mm))^1.4062 Wing swabs from MI, MN, and IL were measured in duplicate and determined to be positive for Pd if the cycle-threshold was less than 40. Samples from
KY were quantified in Pd genomic equivalents relative to swabs spiked with 10 000 Pd conidia.3 Cupping erosions characteristic of WNS per roll of wing tissue.4 Foci of neutrophilic inflammation per roll of wing tissue.
doi:10.1371/journal.ppat.1005168.t001
Fig 1. Hierarchical clustering of gene expression in WNS-affected and unaffected bats. Hierarchicalclustering of differentially expressed genes using Pearson correlation complete-linkage clustering. Scaleshows Pearson correlation coefficient.
doi:10.1371/journal.ppat.1005168.g001
Transcriptome of Bats with White-Nose Syndrome
PLOS Pathogens | DOI:10.1371/journal.ppat.1005168 October 1, 2015 5 / 29

affected bat tissues (S4 Table). Hierarchical clustering (Fig 1) revealed that expression of thesetranscripts from all 5 bats without WNS was similar to each other. Gene expression in wing tis-sue fromWNS-affected bats was different from unaffected bats and more similar to each other,as predicted. The normalized expression levels of the 3729 identified transcript clusters differ-entially expressed are listed in S4 Table.
Differential expression of individual gene isoforms was further analyzed using EBSeq [68],an empirical Bayesian approach to modeling gene expression. For each transcript cluster iden-tified as differentially expressed by DESeq2, we used EBSeq to determine if any of the individ-ual transcripts were differentially expressed at a posterior probability greater than 0.99 (S4Table). Of the 3729 differentially expressed transcript clusters identified by DESeq2, EBSeqidentified at least one differentially expressed transcript for 1427 (38% of total, 43% of upregu-lated genes and 33% of downregulated genes). These results indicate that differences in geneexpression are likely due to alternative splicing or other isoform differences for many of the dif-ferentially expressed genes.
To annotate the functions of these genes and identify those likely to be involved with hostresponses to Pd infection, we used the Trinotate pipeline. BLAST was used to identify 1365upregulated transcripts and 325 downregulated transcripts in WNS-affected tissues with signif-icant homology to known genes from vertebrates in the Swissprot database. Of the 2295remaining transcripts, 13 were mapped to genes from non-vertebrates in the Swissprot data-base, presumably due to environmental contamination or incomplete removal of Pd transcriptsequences. Of the 2842 trinity transcript clusters without a BLASTx match in Swissprot, 2731(96%) were found to align to sequences (e-value< 0.0001) in the little brown myotis genome.Of the aligned transcripts, 204 (7.4%) were found to correspond to previously identified non-coding RNA sequences. Of the 111 transcript clusters without a transcript that aligned to thelittle brown myotis genome or Swissprot, BLAST was used to align their transcripts to the Uni-Ref90 database. We found that 7 genes aligned to vertebrate homologs, 9 aligned to fungalhomologs, and 15 aligned to other metagenomic sequences. We were unable to identify homol-ogous sequences for any transcripts from 80 (2.1%) of the transcript clusters that were differen-tially expressed.
Expression levels for the Swissprot-identified transcript clusters with the 100 lowestadjusted p values are shown in Fig 2 (see S4 Table for all results). Some of the differentiallyexpressed genes with putative functions that were predicted to associate with host responses toa fungal pathogen are listed in Table 2. WNS caused dramatic changes in expression of genesinvolved in inflammation, immune responses, wound healing, metabolism, and oxidativestress, even though the bats were hibernating during the Pd infection. Most of these genes wereupregulated in WNS-affected tissues, while a much smaller number of identified genes withputative functions in these categories were downregulated (Tables 2 and S4).
To determine if all 6 little brown myotis with WNS exhibit similar changes in gene expres-sion, we performed clustering analysis of the differentially expressed transcripts (Fig 1). Toconfirm the significance of these patterns of gene expression, bootstrap analysis of clusteringwas performed [69]. The clustering of the unaffected samples together and the clustering of theWNS-affected samples together was verified with a confidence of 99% (Fig 3A). Principal com-ponent analysis was performed to better understand the relationships between the transcriptsexpressed in the 11 samples (Fig 3B). All 5 samples from unaffected bats were very similarbased on the first three principal components identified, which account for 71% of the variancein these transcripts. The WNS-affected bat samples have more diverse gene expression (S5Table) and PC1 (accounting for 44% of the variance) differentiates all 6 from the unaffectedbat samples. The genes represented by PC1 include those that are more highly expressed inunaffected thanWNS-affected wing tissue (Fig 2). PC2 (17% of the variance) and PC3 (10% of
Transcriptome of Bats with White-Nose Syndrome
PLOS Pathogens | DOI:10.1371/journal.ppat.1005168 October 1, 2015 6 / 29

Fig 2. Global transcriptional analysis of WNS-affected and unaffected bats by RNA-Seq.Centered log2 fold changes are shown for the 100 mostsignificant differentially expressed identified genes. Adjusted p values ranged from 3.3x10⁻⁵ to 2.8x10⁻¹⁸. The heatmap of TMM-normalized FPKM expression
Transcriptome of Bats with White-Nose Syndrome
PLOS Pathogens | DOI:10.1371/journal.ppat.1005168 October 1, 2015 7 / 29

estimates is centered and log2 scaled from a minimum of -4.8 to a maximum of 4.8. Transcripts were identified by BLAST alignment to the SwissProtdatabase.
doi:10.1371/journal.ppat.1005168.g002
Table 2. Selected genes differentially expressed inWNS-affected tissues.
Gene1 Full Name FC2 pvalue3 padj4 EB FC5 PPEE6
Inflammation
IL23A Interleukin-23 subunit alpha 32.6 4.8E-09 2.0E-06 33.6 1.9E-08
PGH2 Prostaglandin G/H synthase 2 (Cyclooxygenase-2) 30.5 1.2E-14 2.1E-11 42.3 3.2E-12
IL6 Interleukin-6 30.3 1.1E-10 9.9E-08 50.9 5.2E-09
MMP25 Matrix metalloproteinase-25 25.7 5.1E-09 2.0E-06 25.5 5.7E-06
CSF3R Granulocyte colony-stimulating factor receptor 23.7 1.7E-09 9.1E-07 31.3 6.9E-08
CCL20 C-C motif chemokine 20 22.0 1.4E-07 3.0E-05 21.1 3.3E-06
IL20 Interleukin-20 20.2 2.9E-07 5.3E-05 21.5 1.5E-06
CSF3 Granulocyte colony-stimulating factor 19.1 6.8E-08 1.8E-05 44.4 2.3E-07
IL1B Interleukin-1 beta 17.7 5.6E-08 1.5E-05 13.6 6.6E-06
IL1A Interleukin-1 alpha 15.4 4.5E-05 2.1E-03 11.4 3.1E-04
PA21 Phospholipase A2 13.8 3.7E-04 9.1E-03 NA NA
CCL2 C-C motif chemokine 2 12.3 6.5E-06 5.3E-04 16.7 2.7E-05
IL17C Interleukin-17C 10.3 6.5E-07 9.6E-05 12.7 3.0E-05
IL19 Interleukin-19 9.0 1.4E-04 4.7E-03 NA NA
IL24 Interleukin-24 7.6 3.4E-08 1.0E-05 18.9 1.3E-05
NCF2 Neutrophil cytosol factor 2 5.7 9.9E-05 3.8E-03 5.0 5.6E-04
PG12A Group XIIA secretory phospholipase A2 2.7 9.4E-07 1.3E-04 3.1 5.7E-07
S10AC Protein S100-A12 2.3 9.0E-04 1.7E-02 NA NA
Other Immune Genes
ABC3G DNA dC->dU-editing enzyme APOBEC-3G 32.4 3.9E-12 4.7E-09 54.2 4.1E-10
LIRA6 Leukocyte immunoglobulin-like receptor subfamily A member 6 23.1 1.5E-05 9.5E-04 NA NA
HPT Haptoglobin 18.9 3.3E-05 1.7E-03 72.2 3.9E-08
CD3G T-cell surface glycoprotein CD3 gamma chain 14.8 6.7E-06 5.5E-04 NA NA
CLC4D C-type lectin domain family 4 member D 12.5 7.0E-05 2.9E-03 NA NA
PTPRC Receptor-type tyrosine-protein phosphatase C 12.3 1.4E-07 3.1E-05 16.0 1.1E-04
CLC4E C-type lectin domain family 4 member E 12.3 3.6E-07 6.0E-05 NA NA
CLC7A C-type lectin domain family 7 member A 10.9 5.4E-07 8.3E-05 NA NA
CO3 Complement C3 10.1 2.7E-03 3.4E-02 64.9 8.0E-08
TLR9 Toll-like receptor 9 8.9 1.4E-06 1.7E-04 6.2 2.5E-05
S10A3 Protein S100-A3 8.4 4.8E-04 1.1E-02 NA NA
CLC6A C-type lectin domain family 6 member A 7.0 1.5E-04 5.0E-03 7.0 3.9E-03
CLC1A C-type lectin domain family 1 member A 6.5 2.4E-06 2.6E-04 NA NA
D103A Beta-defensin 103A 6.1 5.4E-06 4.7E-04 6.3 3.2E-03
CLC5A C-type lectin domain family 5 member A 5.1 3.3E-04 8.3E-03 NA NA
BIRC3 Baculoviral IAP repeat-containing protein 3 3.4 7.9E-05 3.2E-03 4.6 3.3E-04
UNG Uracil-DNA glycosylase -3.8 1.0E-03 1.8E-02 NA NA
LEG3 Galectin-3 -3.4 5.0E-08 1.4E-05 0.28 1.0E-10
Wound Healing
SPRR1 Cornifin 184.6 4.1E-17 1.0E-13 66.4 < 1E-16
LCE3C Late cornified envelope protein 3C 17.5 2.1E-09 1.1E-06 15.0 6.2E-05
FIBB Fibrinogen beta chain 15.9 1.8E-04 5.6E-03 67.2 5.2E-08
(Continued)
Transcriptome of Bats with White-Nose Syndrome
PLOS Pathogens | DOI:10.1371/journal.ppat.1005168 October 1, 2015 8 / 29

the variance) distinguish the KY19, KY23, and KY39 samples from the other two WNS-affected samples and from the unaffected samples. The rotation values of principal componentanalysis (S5 Table) reveal that inflammatory genes made the greatest contribution to PC2.Clustering analysis revealed diverse host responses among the bats infected with Pd.
Metabolic and Inflammatory Immune Pathways Associated with WNSWe next examined the functional pathways that were most affected in little brown myotisinfected with Pd. For this gene ontology analysis, DESeq2 results on transcript isoforms wereused with a higher FDR threshold of 0.1, as is typical for this type of analysis. FromWNS-affected bat tissue, 3104 upregulated transcripts were aligned with BLAST to the human Uni-prot database. Homologs for these transcripts were identified and a list of 1937 unique EnsemblIDs associated with upregulated genes was generated (S6 Table). GOrilla [70] was used to
Table 2. (Continued)
Gene1 Full Name FC2 pvalue3 padj4 EB FC5 PPEE6
FIBA Fibrinogen alpha chain 12.4 1.1E-03 1.9E-02 88.1 1.6E-08
ARGI1 Arginase-1 11.9 4.8E-04 1.1E-02 NA NA
FIBG Fibrinogen gamma chain 11.8 1.4E-03 2.2E-02 48.9 1.6E-07
EPGN Epigen 10.3 2.0E-09 1.1E-06 13.1 7.3E-06
EREG Proepiregulin 8.8 6.9E-07 1.0E-04 10.7 4.8E-04
KLK6 Kallikrein-6 8.1 3.4E-07 5.9E-05 9.1 4.2E-04
K1C17 Keratin, type I cytoskeletal 17 5.9 1.3E-05 8.7E-04 6.6 3.7E-03
P63 Tumor protein 63 3.1 2.0E-05 1.2E-03 16.9 9.8E-05
Metabolism
PLAC8 Placenta-specific gene 8 protein 37.0 1.5E-09 8.4E-07 25.9 1.3E-05
LIPP Pancreatic triacylglycerol lipase 22.3 1.0E-06 1.3E-04 19.4 2.7E-06
ANGL3 Angiopoietin-related protein 3 17.2 1.5E-04 4.9E-03 NA NA
APOC4 Apolipoprotein C-IV 16.1 7.9E-05 3.2E-03 NA NA
APOC3 Apolipoprotein C-III 15.8 1.8E-04 5.5E-03 42.5 8.7E-07
APOC2 Apolipoprotein C-II 14.5 3.7E-04 9.2E-03 45.0 6.8E-07
FFAR2 Free fatty acid receptor 2 7.7 1.8E-05 1.1E-03 7.3 9.1E-04
HCAR2 Hydroxycarboxylic acid receptor 2 4.0 6.9E-04 1.4E-02 NA NA
IP6K2 Inositol hexakisphosphate kinase 2 -5.0 3.8E-06 3.6E-04 0.19 2.2E-03
ACACA Acetyl-CoA carboxylase 1 -4.2 1.1E-03 1.9E-02 0.16 6.7E-03
Other Oxidative Stress
MMP3 Stromelysin-1 34.0 3.4E-10 2.5E-07 57.7 6.6E-08
PERT Thyroid peroxidase 3.7 2.7E-03 3.4E-02 NA NA
PRDX2 Peroxiredoxin-2 3.6 1.1E-05 7.8E-04 NA NA
HMOX1 Heme oxygenase 1 3.0 5.4E-04 1.2E-02 8.2 1.7E-03
1 BLAST hit with the lowest E-value in the Swissprot database. Only genes with E < 1E-05 were considered.2 Fold change in gene expression of the WNS-affected samples compared to the unaffected samples as determined by DESeq2. Negative values indicate
higher expression in the unaffected samples.3 Probability of differential expression determined by DESeq2.4 Adjusted probability of differential expression after Benjamini-Hochberg FDR correction.5 Posterior probability fold change in EBSeq-estimated expression of each transcript in WNS-affected tissues over unaffected tissues. NA indicates that no
isoform for that gene was differentially expressed at an FDR < 0.0016 Posterior probability estimate by EBSeq that the isoform is differentially expressed.
doi:10.1371/journal.ppat.1005168.t002
Transcriptome of Bats with White-Nose Syndrome
PLOS Pathogens | DOI:10.1371/journal.ppat.1005168 October 1, 2015 9 / 29

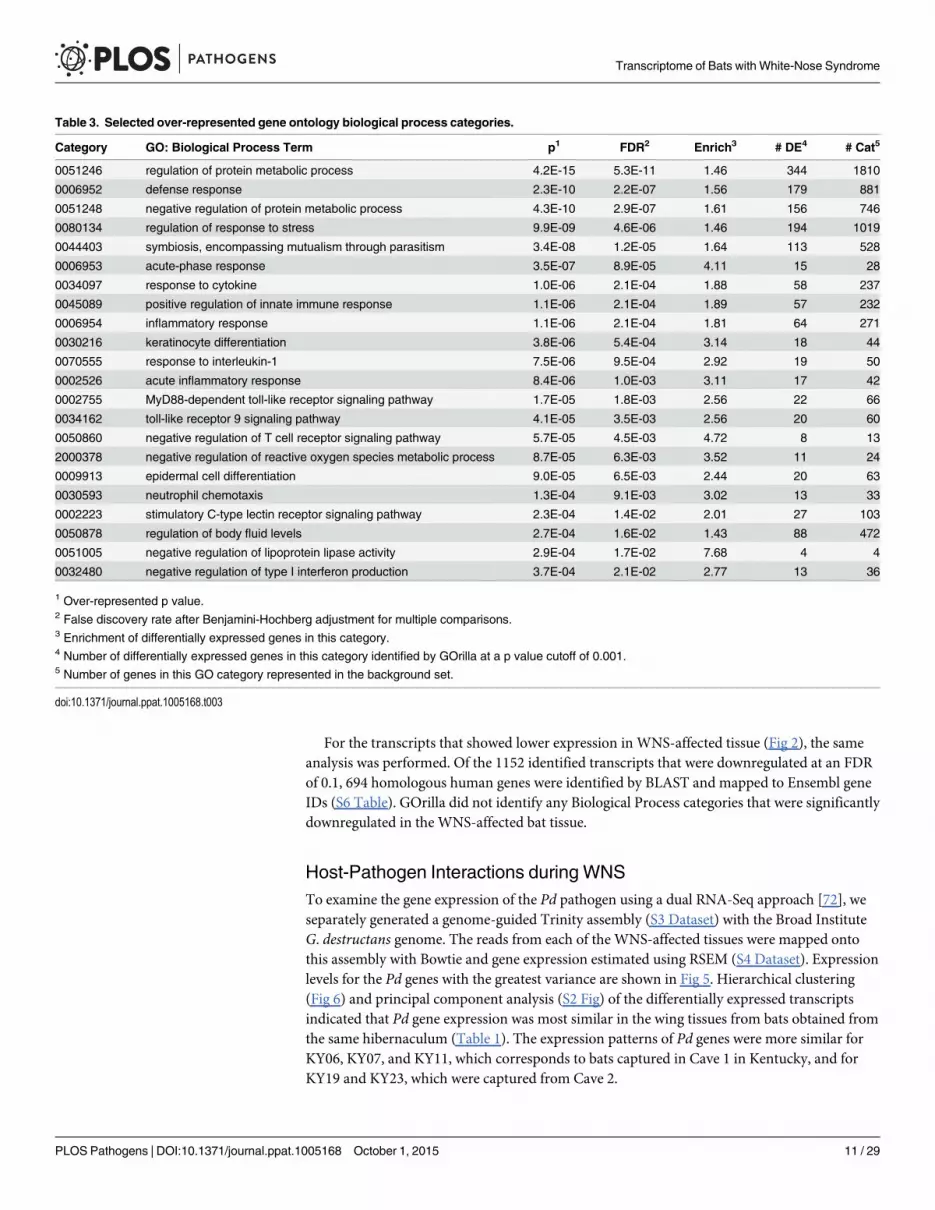
determine significantly upregulated gene ontology categories from the Uniprot GO ID data-base (Table 3 and S7 Table) and REVIGO [71] was used to visualize biological processes thatwere significantly overrepresented in the WNS-affected transcriptome (Fig 4). The functionalanalysis revealed that Pd infection increases expression of genes involved in metabolism,defense responses, and other pathways (Table 3).
Fig 3. Clustering of gene expression patterns. (A) Bootstrap analysis of regularized-log transformedcounts to assign confidence levels to sample clustering. Red values are approximately unbiased p valuesand green values are bootstrap probabilities. Red boxes indicate clusters supported at a confidence level of99%. (B) Principal component analysis of regularized-log transformed counts of differentially expressedgenes. Black spheres represent unaffected bats and white spheres represent WNS-affected bats.
doi:10.1371/journal.ppat.1005168.g003
Transcriptome of Bats with White-Nose Syndrome
PLOS Pathogens | DOI:10.1371/journal.ppat.1005168 October 1, 2015 10 / 29
For the transcripts that showed lower expression in WNS-affected tissue (Fig 2), the sameanalysis was performed. Of the 1152 identified transcripts that were downregulated at an FDRof 0.1, 694 homologous human genes were identified by BLAST and mapped to Ensembl geneIDs (S6 Table). GOrilla did not identify any Biological Process categories that were significantlydownregulated in the WNS-affected bat tissue.
Host-Pathogen Interactions during WNSTo examine the gene expression of the Pd pathogen using a dual RNA-Seq approach [72], weseparately generated a genome-guided Trinity assembly (S3 Dataset) with the Broad InstituteG. destructans genome. The reads from each of the WNS-affected tissues were mapped ontothis assembly with Bowtie and gene expression estimated using RSEM (S4 Dataset). Expressionlevels for the Pd genes with the greatest variance are shown in Fig 5. Hierarchical clustering(Fig 6) and principal component analysis (S2 Fig) of the differentially expressed transcriptsindicated that Pd gene expression was most similar in the wing tissues from bats obtained fromthe same hibernaculum (Table 1). The expression patterns of Pd genes were more similar forKY06, KY07, and KY11, which corresponds to bats captured in Cave 1 in Kentucky, and forKY19 and KY23, which were captured from Cave 2.
Table 3. Selected over-represented gene ontology biological process categories.
Category GO: Biological Process Term p1 FDR2 Enrich3 # DE4 # Cat5
0051246 regulation of protein metabolic process 4.2E-15 5.3E-11 1.46 344 1810
0006952 defense response 2.3E-10 2.2E-07 1.56 179 881
0051248 negative regulation of protein metabolic process 4.3E-10 2.9E-07 1.61 156 746
0080134 regulation of response to stress 9.9E-09 4.6E-06 1.46 194 1019
0044403 symbiosis, encompassing mutualism through parasitism 3.4E-08 1.2E-05 1.64 113 528
0006953 acute-phase response 3.5E-07 8.9E-05 4.11 15 28
0034097 response to cytokine 1.0E-06 2.1E-04 1.88 58 237
0045089 positive regulation of innate immune response 1.1E-06 2.1E-04 1.89 57 232
0006954 inflammatory response 1.1E-06 2.1E-04 1.81 64 271
0030216 keratinocyte differentiation 3.8E-06 5.4E-04 3.14 18 44
0070555 response to interleukin-1 7.5E-06 9.5E-04 2.92 19 50
0002526 acute inflammatory response 8.4E-06 1.0E-03 3.11 17 42
0002755 MyD88-dependent toll-like receptor signaling pathway 1.7E-05 1.8E-03 2.56 22 66
0034162 toll-like receptor 9 signaling pathway 4.1E-05 3.5E-03 2.56 20 60
0050860 negative regulation of T cell receptor signaling pathway 5.7E-05 4.5E-03 4.72 8 13
2000378 negative regulation of reactive oxygen species metabolic process 8.7E-05 6.3E-03 3.52 11 24
0009913 epidermal cell differentiation 9.0E-05 6.5E-03 2.44 20 63
0030593 neutrophil chemotaxis 1.3E-04 9.1E-03 3.02 13 33
0002223 stimulatory C-type lectin receptor signaling pathway 2.3E-04 1.4E-02 2.01 27 103
0050878 regulation of body fluid levels 2.7E-04 1.6E-02 1.43 88 472
0051005 negative regulation of lipoprotein lipase activity 2.9E-04 1.7E-02 7.68 4 4
0032480 negative regulation of type I interferon production 3.7E-04 2.1E-02 2.77 13 36
1 Over-represented p value.2 False discovery rate after Benjamini-Hochberg adjustment for multiple comparisons.3 Enrichment of differentially expressed genes in this category.4 Number of differentially expressed genes in this category identified by GOrilla at a p value cutoff of 0.001.5 Number of genes in this GO category represented in the background set.
doi:10.1371/journal.ppat.1005168.t003
Transcriptome of Bats with White-Nose Syndrome
PLOS Pathogens | DOI:10.1371/journal.ppat.1005168 October 1, 2015 11 / 29
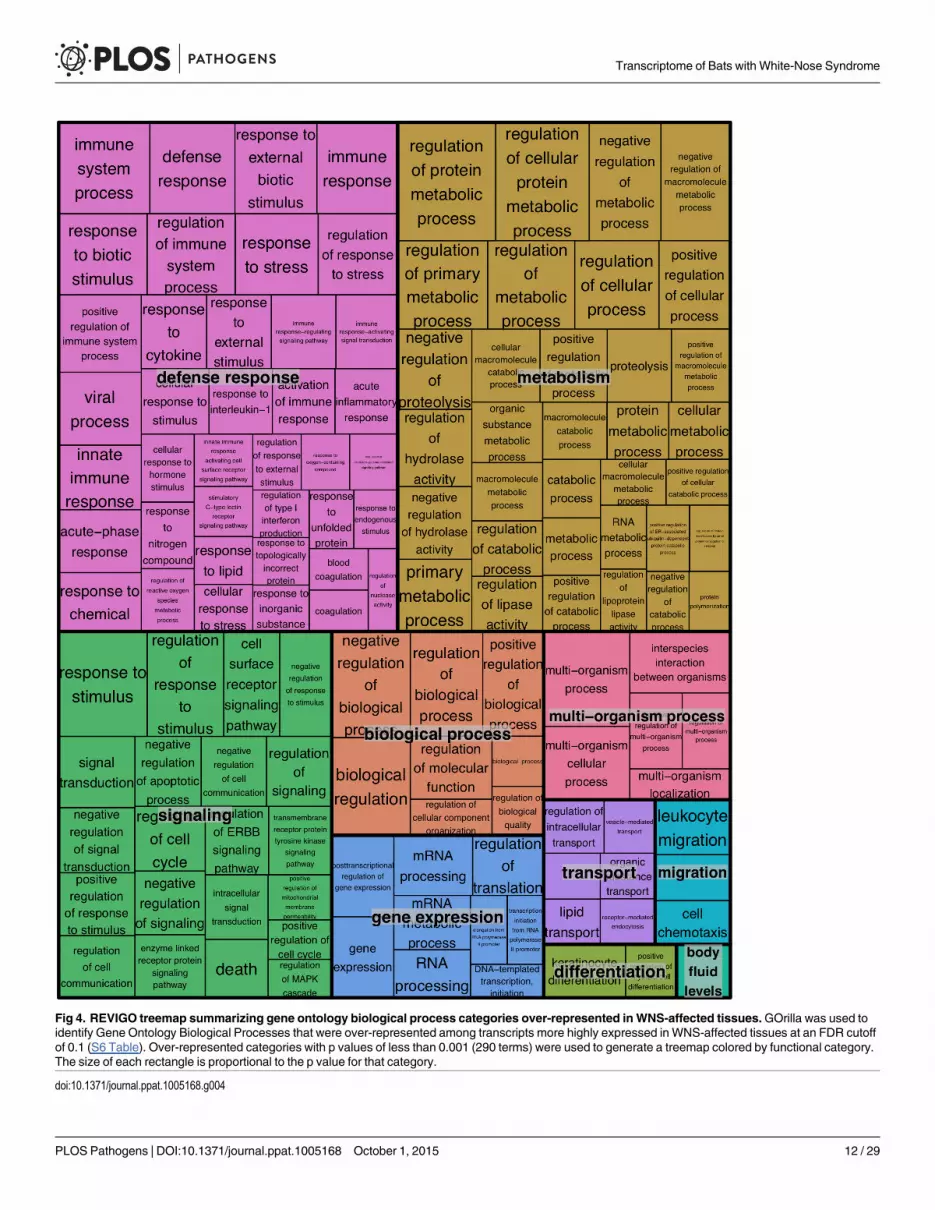
Fig 4. REVIGO treemap summarizing gene ontology biological process categories over-represented in WNS-affected tissues.GOrilla was used toidentify Gene Ontology Biological Processes that were over-represented among transcripts more highly expressed in WNS-affected tissues at an FDR cutoffof 0.1 (S6 Table). Over-represented categories with p values of less than 0.001 (290 terms) were used to generate a treemap colored by functional category.The size of each rectangle is proportional to the p value for that category.
doi:10.1371/journal.ppat.1005168.g004
Transcriptome of Bats with White-Nose Syndrome
PLOS Pathogens | DOI:10.1371/journal.ppat.1005168 October 1, 2015 12 / 29

Fig 5. Transcriptional analysis of Pd gene expression on bats with WNS.Centered log2 fold changes areshown for 100 Pd genes with the greatest variance and a minimum TMM-normalized FPKM expression of 1in all 6 samples. The heatmap is scaled from a minimum of -4.4 to a maximum of 4.4.
doi:10.1371/journal.ppat.1005168.g005
Transcriptome of Bats with White-Nose Syndrome
PLOS Pathogens | DOI:10.1371/journal.ppat.1005168 October 1, 2015 13 / 29

The possible functions of the Pd genes expressed among the WNS-affected samples wereanalyzed by sequence homology. We first examined the expression levels of a family of secretedproteases that have been proposed to be involved in Pd virulence [73, 74] and found that thesealkaline proteases were expressed by Pd in all 6 wing samples (Table 4). Destructin-2 was themost highly expressed isoform in all WNS-affected bat Pd samples.
We next examined the Pd transcript clusters for additional factors that could affect viru-lence. Alignment by BLAST to the Swissprot and Uniprot90 databases identified 12 056 tran-scripts with significant homology to known fungal genes (S8 Table). For the remaining 67 Pdtranscript clusters, Trinotate was not able to identify known functional domains or signal pep-tides present in these previously uncharacterized Pd transcripts. The results from the BLASTalignment were examined for genes known to be involved in processes that could affect Pd vir-ulence, such as secreted proteases [73–75], metal binding proteins [76], fungal cell wall remod-eling [76, 77], and other virulence factors [75, 77, 78]. This analysis identified 46 Pd genes thatcould be involved in pathogenesis (Table 5), including additional secreted proteases that couldbe involved in tissue invasion.
Fig 6. Hierarchical clustering of Pd gene expression on bats with WNS.Hierarchical clustering ofdifferentially expressed Pd genes using Pearson correlation complete-linkage clustering. Scale showsPearson correlation coefficient.
doi:10.1371/journal.ppat.1005168.g006
Table 4. Expression of destructin transcripts in Pd growing onWNS-affected bats.
Isoform UniProtMatch
Protein Name Putative Function(s) KY061 KY07 KY11 KY19 KY23 KY39
GG4320|c0_g1_i1
ALP_ACRCH Destructin-2 (Alkalineprotease-2)
Subtilisin-family alkalineprotease
1004 711.7 1038 3696 4437 1157
GG6167|c0_g1_i1
ORYZ_ASPCL Destructin-1 (Alkalineprotease-1)
Subtilisin-family alkalineprotease
516.8 107.4 720.0 779.4 192.4 128.5
GG5612|c0_g1_i1
ORYZ_NEOFI Destructin-3 Subtilisin-family alkalineprotease
8.3 19.2 23.6 231.1 26.2 12.9
1 Trimmed mean of M-values- (TMM-) normalized expression determined by RSEM in fragments per kilobase of transcript per million mapped reads
(FPKM).
doi:10.1371/journal.ppat.1005168.t004
Transcriptome of Bats with White-Nose Syndrome
PLOS Pathogens | DOI:10.1371/journal.ppat.1005168 October 1, 2015 14 / 29

Table 5. Possible virulence genes expressed in Pd growing onWNS-affected bats.
Pd Gene UniProt Match Protein Name Putative Function TMM-normalized expression by RSEM(FPKM)
KY06 KY07 KY11 KY19 KY23 KY39
GG1839|c0_g1
MSBP2_ARATH Membrane steroid-binding protein 2 Antimicrobial peptide response 63.6 146.4 30.1 24.8 65.3 48.2
GG5000|c0_g1
DUR3_YEAST Urea active transporter Antimicrobial peptidesusceptibility
65.7 79.5 107.0 51.6 19.8 14.6
GG5000|c1_g1
DUR31_SCHPO Probable urea active transporter 1 Antimicrobial peptidesusceptibility
0 79.5 0 81.1 102.1 0
GG680|c0_g1
GMDG_00178 Uncharacterized protein Drug resistance transporter 0 29.7 24.4 141.0 175.2 39.8
GG2580|c0_g1
SOL5_ALTSO Bifunctional solanapyrone synthase Phytotoxin synthesis,Pathogenesis
101.4 0 0 157.3 99.2 0
GG6092|c0_g1
SOL5_ALTSO Bifunctional solanapyrone synthase Phytotoxin synthesis,Pathogenesis
66.4 35.8 113.6 714.7 1116 352.5
GG3668|c0_g1
TOXA_COCCA Putative HC-toxin efflux carrierTOXA
Toxin transporter 20.4 0 77.5 143.8 85.0 62.7
GG3668|c1_g1
TOXA_COCCA Putative HC-toxin efflux carrierTOXA
Toxin transporter 78.6 0 74.4 122.5 40.1 0
GG432|c0_g1
TOXA_COCCA Putative HC-toxin efflux carrierTOXA
Toxin transporter 114.0 35.1 54.2 89.5 131.9 53.1
GG432|c1_g1
TOXA_COCCA Putative HC-toxin efflux carrierTOXA
Toxin transporter 42.5 49.0 20.2 66.5 132.5 0
GG680|c1_g1
TOXA_COCCA Putative HC-toxin efflux carrierTOXA
Toxin transporter 27.1 20.9 12.9 148.7 198.9 0
GG1568|c0_g1
CHI1_COCP7 Endochitinase 1 Fungal cell wall 305.2 26.9 348.1 581.9 46.0 27.2
GG2156|c0_g1
YCZ2_SCHPO Putative mannan endo-1,6-alpha-mannosidase
Fungal cell wall 32.5 6.3 7.7 57.4 214.3 113.9
GG1843|c0_g1
ENG1_SCHPO Endo-1,3(4)-beta-glucanase 1 Fungal cell wall 77.7 0 62.1 196.4 8.6 26.0
GG2744|c0_g1
BGLE_NEOFI Probable beta-glucosidase E Fungal cell wall 115.2 355.1 84.6 65.8 77.6 8.2
GG2744|c1_g1
BGLE_NEOFI Probable beta-glucosidase E Fungal cell wall 0 238.0 0 0 124.6 0
GG4455|c0_g1
AVR4_PASFU Race-specific elicitor A4 Fungal cell wall, Pathogenesis 106.3 5.1 158.0 866.6 309.2 166.0
GG2938|c0_g1
BGBP_PENMO Beta-1,3-glucan-binding protein Innate immune activation 121.2 85.2 150.4 34.5 68.4 104.5
GG2938|c0_g2
BGBP_PENMO Beta-1,3-glucan-binding protein Innate immune activation 840.1 332.2 768.8 783.6 476.6 339.3
GG6498|c0_g1
SR1A_PHYPO Spherulin-1A Manganese binding 1067 629.2 1202 217.1 373.4 6328
GG3236|c0_g1
SBNA_RALME Pd uncharacterized protein L8FZ85 Siderophore biosynthesis 68.3 205.4 60.5 48.3 192.0 0
GG4315|c0_g2
FRE3_YEAST Ferric reductase transmembranecomponent 3
Siderophore transport, Ironbinding
157.9 86.4 135.7 76.1 86.4 95.6
GG5300|c0_g1
FRE3_YEAST Ferric reductase transmembranecomponent 3
Siderophore transport, Ironbinding
2422 1441 1623 510.9 400.3 197.0
GG6235|c0_g1
SIT1_YEAST Siderophore iron transporter 1 Siderophore transporter 0 0 0 23.1 135.3 0
GG6235|c0_g2
SIT1_YEAST Siderophore iron transporter 2 Siderophore transporter 115.7 133.8 170.1 191.2 74.4 107.0
(Continued)
Transcriptome of Bats with White-Nose Syndrome
PLOS Pathogens | DOI:10.1371/journal.ppat.1005168 October 1, 2015 15 / 29

Because the tissue samples were collected from bats from 6 different hibernacula for thisstudy, it is possible that differences in host or pathogen gene expression reflect differences inthe environmental conditions present in each location, including the microbiome. In addition,the housing of the unaffected bats in captivity for 13 weeks prior to analysis could also haveaffected the microbiome. To examine the differences in the skin microbiome between the bats,we used MG-RAST to identify the lowest common ancestor of metagenomic sequences present
Table 5. (Continued)
Pd Gene UniProt Match Protein Name Putative Function TMM-normalized expression by RSEM(FPKM)
KY06 KY07 KY11 KY19 KY23 KY39
GG2118|c0_g2
ZRT1_YEAST Zinc-regulated transporter 1 Zinc transporter 1873 1637 1447 924.5 1211 501.3
GG5016|c0_g2
ZRT1_YEAST Zinc-regulated transporter 2 Zinc transporter 457.4 310.7 449.3 66.9 137.0 564.1
GG3064|c0_g1
MIRB_EMENI Siderophore iron transporter mirB Response to iron ionstarvation
547.5 169.3 220.7 136.1 425.8 259.6
GG861|c0_g1
MIRB_EMENI Siderophore iron transporter mirB Response to iron ionstarvation
656.0 410.1 712.3 913.4 1324 541.4
GG4694|c1_g1
LAC2_PODAS Laccase-2 Melanin biosynthesis 64.2 19.8 329.4 553.8 69.1 179.0
GG6611|c0_g1
UREA_ASPFU Urease Nitrogen metabolism 49.8 0 0 38.8 151.1 222.7
GG6611|c1_g1
UREA_ASPFU Urease Nitrogen metabolism 0 28.2 34.8 28.6 112.6 0
GG6611|c3_g1
UREA_ASPFU Urease Nitrogen metabolism 0 54.8 0 55.7 142.6 0
GG6612|c0_g1
UREA_ASPFU Urease Nitrogen metabolism 0 0 0 499.6 0 0
GG3518|c0_g1
ALL2_ASPFU Major allergen Asp f 2 Metallopeptidase, Fungalallergen
2789 4105 1021 3510 5373 449.6
GG2311|c0_g1
PRTA_ASPNG Aspergillopepsin-2 Aspartic endopeptidase 59.3 79.9 84.5 709.2 1149 68.8
GG2082|c0_g1
PEPA_ASPOR Aspartic protease pep1 Secreted asparticendopeptidase
64.5 31.0 45.9 95.5 370.1 0
GG2082|c0_g2
PEPA_ASPOR Aspartic protease pep1 Secreted asparticendopeptidase
0.1 0.1 0.1 189.7 5.1 0
GG4492|c0_g1
CARP_CRYPA Endothiapepsin Secreted asparticendopeptidase
648.7 460.5 311.8 406.5 423.6 216.0
GG448|c0_g1
LAP1_SCLS1 Leucine aminopeptidase 1 Secreted leucyl endopeptidase 100.7 84.0 95.7 283.3 265.6 183.0
GG788|c0_g1
SPM1_MAGO7 Subtilisin-like proteinase Spm1 Secreted serineendopeptidase
956.8 952.7 525.5 1260 1176 919.4
GG2765|c0_g1
PEPS_ASPPH Carboxypeptidase cpdS Serine carboxypeptidase 83.2 114.5 146.9 775.2 981.3 408.6
GG3562|c1_g1
SED4_ARTOC Tripeptidyl-peptidase SED4 Serine endopeptidase,Pathogenesis
715.7 366.5 690.3 1703 2009 191.9
GG2259|c0_g1
SOD6_CANAL Cell surface superoxide dismutase[Cu-Zn] 6
Superoxide metabolism,Pathogenesis
43.5 44.6 13.8 556.7 880.6 179.3
GG4408|c0_g1
CCPR2_ASPFU Putative heme-binding peroxidase Oxidative stress response, Ironbinding
1044 842.8 477.1 63.0 42.3 421.4
GG6788|c0_g1
HOG1_CRYPA Mitogen-activated protein kinaseHOG1
Virulence and conidiaformation
735.1 816.2 959.1 325.7 373.5 772.8
doi:10.1371/journal.ppat.1005168.t005
Transcriptome of Bats with White-Nose Syndrome
PLOS Pathogens | DOI:10.1371/journal.ppat.1005168 October 1, 2015 16 / 29

(S8 Table). Although there were some differences observed in the bacterial microbiomes pres-ent on the wings of the 11 bats, there were no significant changes between the WNS-affectedand unaffected samples when bacteria were identified at the class level. Several strains of Pseu-domonas fluorescens isolated from bat tissues have been identified with Pd growth inhibitingproperties [79]. MG-RAST analysis showed that Pseudomonas species are present in all 11samples (S8 Table). P. fluorescens transcripts represented 2.8±0.6% of transcripts identifiedfrom gammaproteobacteria and 0.40±0.05% of all bacteria on the wings of unaffected bats and0.37±0.07% of all bacteria on WNS-affected bats. P. fluorescens was present on all little brownmyotis sampled, but was rare and relative abundance was not statistically different betweenWNS-affected and unaffected bats (p = 0.49, t = -0.71, df = 9).
DiscussionThe comparison of host gene expression between WNS-affected and unaffected little brownmyotis clearly demonstrates that Pd infection causes physiological responses in wing tissue,where substantial fungal invasion of the skin occurs in WNS-affected bats [8]. The changes intranscript levels that we have observed indicate that host responses to fungal infection remainintact during hibernation and are similar to those observed during the initial stages of fungalinfection in euthermic mammals [32]. These host responses include acute inflammation,wound healing, and metabolic changes. Pathogen gene expression varies among bats withWNS, suggesting host-pathogen interactions that mediate pathogenesis. Together, these resultslay a foundation to determine which host and pathogen responses contribute to WNS resis-tance and susceptibility and identify targets to increase survival.
Host Response to Pd InfectionThe gene expression changes we observed in the wing tissue of WNS-affected bats are similarto those observed in other cutaneous fungal infections [80]. Cutaneous Candida albicans infec-tions in humans and mice typically initiate an immune response by activating pattern recogni-tion receptors of the C-type lectin family [81–83] and the toll-like receptor family, both ofwhich we found upregulated in WNS-affected bat wing tissue (S4 Table). These included C-type lectin domain (CLEC) family members CLEC4D (MCL), CLEC4E (MINCLE), CLEC7A(Dectin-1), CLEC6A (Dectin-2), and Toll-like receptor 9. In mice and humans, protective hostresponses to C. albicans are usually characterized by many of the same cytokines and chemo-kines [29] that we have found upgregulated in WNS-affected wing tissue, including the cyto-kines IL-1β, IL-6, G-CSF, IL-23A, and IL-17C. Little brown myotis infected with Pd areincreasing transcription of the key genes necessary for initiating a host response that providesprotection from fungal infection. This clearly demonstrates that hibernation does not preventinnate immune responses in bats infected with Pd and that, although they are not closelyrelated to rodents and primates [41], bats respond to fungal infections similarly to these othermammals.
The responses to Pd infection within bat wing tissue may be mediated by keratinocytes inthe epithelial tissue. Activation of pattern recognition receptors by fungal ligands is expected toinduce keratinocytes to produce many of the cytokines that we have found upregulated at thetranscript level in WNS-affected bat wing tissue [84]. In addition to the cytokines typicallyinvolved in C. albicans responses described above, keratinocytes are also known to express thechemokine Ccl2 and the cytokines IL-20 and IL-24 in response to pattern recognition receptoractivation [85]. Keratinocytes and fibroblasts are also known to exhibit a paracrine loop of IL-1and IL-6 activation [86] that enhances wound healing and host defense to microbial infectionand we found evidence of IL-1 and IL-6 receptor activation in the increased RNA levels for
Transcriptome of Bats with White-Nose Syndrome
PLOS Pathogens | DOI:10.1371/journal.ppat.1005168 October 1, 2015 17 / 29

transcription factor p65, NFκB, and P-selectin glycoprotein ligand 1 (S4 Table). Anotherimportant cytokine produced by epithelial cells in response to infection is IL-17C [87]. This isan atypical IL-17 family member that is expressed by epithelial cells and causes autocrineresponses in the epithelial cells that also express the IL-17RA and IL-17RE heterodimeric IL-17receptor [87]. The wing tissue transcriptomes fromWNS-affected and unaffected bats showsimilar expression levels of both IL-17RA and IL-17RE (S2 Dataset) and would, therefore, beexpected to be responsive to IL-17C. The gene ontology analysis also found evidence for func-tional enrichment of genes involved in keratinocyte differentiation, presumably due to woundhealing responses. Keratinocytes or other epithelial cells in bat wing tissue appear to haveresponded to the invasion of the epidermis by fungal hyphae.
Genes for pro-inflammatory mediators characterized the innate immune response that weobserved in the wing tissue of Pd infected bats. Under euthermic conditions this would beexpected to provide protection by the recruitment of monocytes and neutrophils, mediated byG-CSF, IL-23A, Ccl2, IL-17C and IL-6 [88], and the initiation of an adaptive Th17 or Th1response. However, under the constraints of hibernation, responses that require leukocytemigration do not appear to occur in Pd-infected bats. We do not find strong evidence ofincreased expression for genes characteristic of either innate or adaptive leukocytes, except forL-selectin, which is expressed on T cells, and CD177, which is expressed on neutrophils. Lowerthan expected levels of monocyte, neutrophil, Th1, and Th17 cell recruitment may be related tothe sequestration of leukocytes during hibernation [45]. However, we have observed neutrophilrecruitment in hibernating little brown myotis in response to another fungal infection(Table 1). In the histological examination of the current samples, we found neutrophilicinflammation in bothWNS-affected and unaffected wing tissue (Table 1). However, this inflam-mation did not occur at the sites of Pd infection. Curiously, we found a significant increase inWNS-affected tissue for transcripts for CD3γ and CD45 that could be expressed by gamma-delta T cells or other innate lymphocytes that reside in the skin [89]. It is possible that Pd is spe-cifically suppressing neutrophil and/or T cell recruitment by interfering with chemotactic sig-nals, similar to the suppression of inflammatory immune responses during chytridiomycosis inamphibians [42]. However, analysis of tissue levels of the cytokines and chemokines is necessaryto confirm the secretion of these proteins. Because neutrophils and T cells do not appear to berecruited to sites of Pd infection during hibernation, only local inflammatory mediators may beavailable and they appear to be unable to control the infection in little brown myotis.
In addition to immune responses, hibernating bats also respond to Pd infection in otherways. We found transcripts for proteins from many pathways involved in metabolism, signal-ing, gene expression, transport, migration, and differentiation that were altered in WNS-affected bats (Fig 4). We cannot exclude the possibility that some of these differences were dueto the different hibernation conditions of the two groups of bats. However, the differentialexpression of the genes in these pathways demonstrates that they are subject to regulation dur-ing hibernation and can respond to infection, tissue damage, and/or environmental changes.
Host responses to fungal infection can be influenced by changes in the pathogen, includinggene expression changes in the colonizing fungus, such as C. albicans [29]. We found signifi-cant variability in the gene expression by Pd, which is particularly interesting because all Pd inNorth America is presumed to be a clone of the same mating type [90]. The pathogen hasadopted different gene expression profiles in the 6 bat tissues (Fig 5), perhaps in response todifferences in the host environments. Correspondingly, host gene expression patterns alsoshow differences between the WNS-affected tissue samples. Of particular interest is the obser-vation that the cytokine and chemokine genes found in principal component 2 of our PCAanalysis (Fig 3B and S5 Table) are expressed at very different levels in the 6 Pd-infected sam-ples. From this study we cannot determine whether the differences in pathogen gene expression
Transcriptome of Bats with White-Nose Syndrome
PLOS Pathogens | DOI:10.1371/journal.ppat.1005168 October 1, 2015 18 / 29

are driven by differences in the host environment or vice versa. Although all 6 WNS-affectedbats had visible signs of WNS, had similar Pd burdens, and similar histopathology, it is possiblethat the differences in host or pathogen gene expression that we observed may have affectedprogression of WNS and survival.
Responses that May Contribute to WNSMortalityBecause the increased frequency of arousals from torpor appears to be a primary cause of WNSmortality [5, 14, 22], we considered possible mechanisms that could affect torpor bout length.The increased gene expression of IL-1, IL-6, and other pro-inflammatory cytokines mediates alocal acute inflammatory response to Pd. These cytokines also have systemic effects that modifybehavior and thermoregulation [91]. In addition to cytokine and chemokine transcriptincreases, we also found increased transcripts for the enzyme cyclooxygenase-2 (prostaglandinG/H synthase 2) and both secreted and cytosolic phospholipase A2 that form critical inflam-matory lipid mediators such as prostaglandin H2. The eicosanoids generated by these enzymes,along with the actions of the upregulated genes kallikrein-6 and cathepsin S, are expected togenerate pain and itching by locally activating neuronal nociceptors [92, 93]. This, in turn,could affect torpor bout length and/or behavior during periodic arousals. Indeed, we have doc-umented significantly more grooming in WNS-affected bats infected in the wild [94], althougha different study on laboratory-infected bats did not find similar behavior changes [95].Together, the upregulated genes will likely generate an inflammatory microenvironment withinthe wing that may contribute to the robust wound healing response that we observe in WNS-affected bats. However, inflammation can also play a detrimental role in some diseases [96].Further tissue damage and subsequent wound healing occurs in surviving bats upon emergencefrom hibernation [19]. These local affects of inflammation (pain and itching) as well as sys-temic effects are likely to play a key role in WNS pathology.
In addition to the gene expression changes that may contribute to acute inflammationlocally within the epithelial tissues invaded by Pd, the systemic release of febrile cytokines suchas IL-6 could affect the signals that control hibernation arousal. However, an exogenous pyro-gen, lipopolysaccharide, is not able to provoke arousals in hibernating golden-mantled groundsquirrels [97], so it may be unlikely that inflammation or febrile cytokines can directly triggerarousal in WNS-affected bats. Intracerebroventricular injection of prostaglandin E2 in golden-mantled ground squirrels induces arousal from torpor and a febrile response during anextended periodic arousal [97]. Our observation of increased expression of the enzyme thatgenerates prostaglandin H2 may provide a mechanism that explains the shortened torpor boutsin WNS-affected bats, if it can be shown that this enzyme is active in the tissue and producesenough prostaglandin H2 to act systemically.
In addition to the changes in expression of genes involved in immune responses and woundhealing, we also found significant changes in metabolic genes. We found evidence of geneexpression changes consistent with increased fat metabolism, including changes in transcriptsfor apolipoproteins, lipid transport proteins, protein metabolism, and carbohydrate metabo-lism. Of particular interest, we found increases in the expression of hydroxycarboxylic acidreceptors 2 and 3 that are known to mediate adiponectin secretion [98]. This suggests thatinfection with Pdmay directly trigger changes in lipid and carbohydrate metabolism that con-tribute to WNS pathology. These changes stand in contrast to the changes that have been seenin the brain transcriptome of hibernating horseshoe bats (Rhinolophus ferrumequinum) [99]and the brain proteome of hibernating Rickett’s big-footed bats (Myotis pilosus) [100], whichshow decreased fat metabolism during torpor. By leading to premature depletion of fat stores,these gene expression changes could contribute to WNS mortality.
Transcriptome of Bats with White-Nose Syndrome
PLOS Pathogens | DOI:10.1371/journal.ppat.1005168 October 1, 2015 19 / 29

The other changes in host gene expression that we observed are consistent with a multi-stage progression model of WNS [22]. We also found support for changes in genes involved inoxidative stress [23] and body fluid levels, which may contribute to WNS progression.Together, the pattern of gene expression changes that we find in little brown myotis with WNSsuggests that a combination of maladaptive responses may contribute to mortality. However,the number of upregulated genes involved in the acute inflammatory response suggests thatexcessive inflammation may also be a factor contributing to pathology even prior to emergencefrom hibernation when it is suspected to contribute to wing damage [101].
Implications for Future StudiesThe changes in host transcript levels that we have found are presumably caused by physiologi-cal responses of the host to infection. However, caution must be used when extending thesetranscriptional responses to functional mechanisms because the current study does not mea-sure protein or metabolite levels directly. Future studies will be necessary to determine whichof the gene expression changes observed affect which host response mechanisms.
The little brown myotis chosen for the WNS-affected samples were exhibiting WNS pathol-ogy and appeared unlikely to survive at the time of sample collection. For this reason, it is pres-ently uncertain which of the gene expression changes that we have observed are contributingto protection and which are pathological. Another factor that likely contributes to the variationin gene expression that we observed among the samples collected from free-ranging bats is thetime since the most recent arousal from torpor. Prior to collection of each wing tissue sample,bats were artificially aroused for 30 to 120 minutes. This period of arousal is similar in durationto the natural arousals during hibernation for little brown myotis [14], and presumably of suffi-cient duration for some innate immune responses to occur and for transcript levels to bealtered. One reason for this procedure was to avoid disparities between the elapsed time fromthe most recent arousal bout until tissue collection. For the WNS-affected bats we could notdetermine when the most recent natural arousal would have occurred, but it would have likelybeen more recently than in unaffected animals, as affected animals arouse from torpor morefrequently [14]. In the current study we cannot resolve whether the changes in gene expressionthat we observed occurred during the most recent arousal, during previous periodic arousals,or during torpor. Future studies will be needed to determine which of the changes in geneexpression that we observed during WNS in bats in the wild also vary in controlled captivehibernation conditions when prior arousal patterns are known. Further studies are also neededto compare the physiological responses in bats exhibiting WNS morbidity to responses in lesssusceptible bats, such as European species, North American species that are less susceptiblelike the big brown bat [11], and the remnant populations of little brown myotis that appear tohave developed tolerance or resistance to Pd [1]. Such studies should point to a path forwardfor bats in North America to persist in a landscape where Pd is endemic.
ConclusionsLittle brown myotis mount a host response to Pd infection during hibernation. Which compo-nents of this response are protective or contribute to WNS pathology remains to be resolved.The innate immune response we have observed would be expected to promote a Th17-directedadaptive immune response that could clear the infection. However, the energetic constraints ofhibernation may prevent little brown myotis from execution of the Th17- and neutrophil-mediated phases of the immune response. This may lead to excessive inflammatory responses,either during hibernation or upon emergence. The changes in host gene expression that weobserved demonstrate that during Pd infection, little brown myotis also alter other defense
Transcriptome of Bats with White-Nose Syndrome
PLOS Pathogens | DOI:10.1371/journal.ppat.1005168 October 1, 2015 20 / 29
responses, metabolic pathways, and transcription. Numerous Pd genes that may contribute tovirulence were identified and these represent potential pathogen responses to host defense.Hibernation does not prevent a host response to infection and a better understanding of thedifferences between host and pathogen responses in bats susceptible to WNS and those resis-tant may lead to ways for increasing survival.
Materials and Methods
Ethics StatementThis study was carried out on bats from non-endangered species in strict accordance with therecommendations in the Guide for the Care and Use of Laboratory Animals of the NationalInstitutes of Health. All methods were approved by the Institutional Animal Care and UseCommittee at Bucknell University (protocol DMR-016). Animals were humanely euthanizedby isoflurane anesthesia overdose followed by decapitation. In Illinois, animal collection wasconducted by state wildlife officials and a numbered permit was not required. Scientific collec-tor’s permits were obtained in Michigan (SC1448), Minnesota (201174), and Kentucky(SC1411147).
SamplesWe collected hibernating little brown myotis from cave or mine walls at the locations listed inTable 1. Bats collected from all locations are expected to be from the same genetic populationof eastern little brown myotis [102]. For bats unaffected by WNS, little brown myotis were firstswabbed on the left forearm for quantitative PCR analysis. After measurements were taken,bats were individually placed in cloth bags and hung in constant temperature thermoelectriccoolers (Koolatron PC-3) maintained at ~7°C. Water-saturated sponges were placed in the bot-tom of each cooler to maintain humidity during transportation to Bucknell University. Batswere housed for 13 weeks in a Percival (model I36VLC8) environmental chamber with condi-tions set to 4°C and 95% relative humidity. Bats were provided water throughout hibernation.Bats were aroused from hibernation for 30–120 minutes prior to euthanasia. For WNS-affectedbats, little brown myotis were collected in the field, measured, swabbed for quantitative PCR,and humanely euthanized after being aroused from hibernation for 60–120 minutes. Scaledmass index (SMI) was calculated using the formula (mass(in g))�(38.01/(forearm length(inmm))^1.406 [103]. Wing tissue was placed in formalin for histology and placed in RNAlater(Sigma-Aldrich) for gene expression analysis. RNAlater samples were stored at ambient tem-perature for up to 24 hours before long-term storage at -80°C. RNA was purified from 50 mgof wing tissue using a QIAGEN RNeasy Mini Kit. All samples used for RNA sequencing hadRNA integrity values greater than 7.0 using an Agilent Bioanalyzer.
Verification of WNS StatusWing skin tissue was removed from the bones of the arm and digits and rolled onto 2 cm paraf-fin wax logs. The logs were then fixed in 10% neutral buffered formalin for at least 24 hours.Each log was cut into 3 pieces that were processed into paraffin blocks overnight in a Tissue-Tek VIP processor (Sakura Finetek). The pieces were embedded in paraffin blocks, sectioned at3 microns, and stained with periodic acid Schiff with a hematoxylin counterstain [8]. WNSlesions (Table 1; WNS) were identified as cupping erosions with fungal hyphae and conidapresent. Inflammatory foci (Table 1; Infl) were identified as clusters of infiltrating neutrophilsand were not associated with the asymmetrical curved conidia of Pd.
Transcriptome of Bats with White-Nose Syndrome
PLOS Pathogens | DOI:10.1371/journal.ppat.1005168 October 1, 2015 21 / 29

To determine presence or absence of Pd on bats unaffected by WNS, each swab was testedtwice by quantitative PCR [64] by Jeffrey T. Foster at University of New Hampshire. A cycle-threshold less than 40 was used as a positive result. One of the 5 unaffected bats had one posi-tive and one negative test (Table 1), but histology (Table 1) and subsequent RNA sequencingdetermined this to most likely be a false positive (S2 Table; p = 2.2x10⁻⁶). For bats affected byWNS, we performed quantitative PCR to measure the Pd load, in genomic equivalents normal-ized to swabs spiked with 10 000 Pd conidia, that were detected on each bat [15].
Next Generation RNA SequencingThe Genome Sequencing and Analysis Facility at the University of Texas at Austin performedall library preparation and quality control procedures. Directional RNA libraries were preparedwith poly-A mRNA enrichment, dUTP/UDG strand-specific labeling, fragmentation, and 200base pair size selection. RNA-Seq was performed in two lanes of an Illumina HiSeq 2500 with101 base pair length reads obtained.
Transcriptome AssembliesThe paired reads from all samples were preprocessed by removing adapters and using trimmo-matic PE [104] with settings of Illumina clip:2:30:10, seed mismatches:2, palindrome thresh-old:30, clip threshold:10, leading:5, trailing:5, minlength:36. The remaining paired reads werethen combined and Trinity (v2.0.4) was used in strand-specific mode (RF) to construct a denovo assembly [105]. K-mer in silico read normalization with maximum coverage of 50resulted in 22 482 456 read pairs that were used for assembly out of 177 755 004 total. Theassembly was then filtered to remove Pd sequences using the program Deconseq [65] with theBroad Institute Geomyces destructans genome 20631–21 used to identify pathogen sequencesand with the little brown myotis genome (Myoluc2.0) used to retain host sequences. Bowtie1.0.1 [106] was used to determine the number of reads that mapped to each transcript in theassembly.
Differential ExpressionThe script align_and_estimate_abundance.pl included in the Trinity v2.0.6 distribution [105]was used to estimate expression levels for each transcript. Bowtie 1.0.1 [106] was used to mapreads (including unpaired reads after quality trimming) from each sample onto the assembly.RSEM v1.2.20 [107] was used to apply an expectation maximization algorithm to predict geneexpression counts for each transcript. Expression levels are presented after trimmed mean ofM-values (TMM) normalization in fragments per kilobase of transcript per million mappedreads (FPKM). DESeq2 v1.8.1 [67] was used to determine the probability of differential expres-sion for each Trinity transcript cluster that had a minimum RSEM-estimated count, beforenormalization, of 5 across all samples. For DESeq2 analysis, the default values for removingoutliers and filtering lowly expressed transcripts were used. An alpha value of 0.05 was usedinstead of the default of 0.1 to decrease the number of differentially expressed genes identified.Posterior probabilities of differential expression for individual transcript isoforms were esti-mated using a Bayesian approach with EBSeq v1.8.0 [68]. False discovery rate [108] was usedto control for multiple comparisons. NCBI BLAST v2.2.29+ [109] was used to identify thehighest-ranking match for each isoform in the UniProt Swissprot database (downloaded onSep 17, 2014) with an e-value cutoff of 1x10⁻⁵.
Hierarchical clustering of samples and genes was performed within R 3.1.2 using the hclustfunction with the complete linkage method. Bootstrap analysis of clustering was performed
Transcriptome of Bats with White-Nose Syndrome
PLOS Pathogens | DOI:10.1371/journal.ppat.1005168 October 1, 2015 22 / 29

using the pvclust 1.3–2 package and 1000 replications [69]. Principal component analysis wasperformed using the prcomp function and visualized with the rgl 0.93.1098 package.
Gene OntologyNCBI BLAST v2.2.29+ [109] was used with an e-value cutoff of 1x10⁻⁵ to identify homologs inthe Uniprot Swissprot human protein database (downloaded on Nov 25, 2014) for transcriptssignificantly upregulated in WNS-affected bat wing tissue with an FDR of less than 0.1 (inorder to increase the number of genes prior to subsequent analysis with higher stringencyFDR). Unique Ensembl gene IDs were identified for 1144 of the 1922 upregulated transcriptsand 481 of the 1356 downregulated transcripts. GOrilla [70] was used with a p value cutoff of0.001 to identify upregulated or downregulated biological processes by comparison to the back-ground list of 12 828 human genes identified by BLAST in the Trinity assembly. Multiple test-ing correction [108] was used with an FDR cutoff of 0.01. Results were visualized as a treemapwith REVIGO [71].
PdGene AnalysisTrinity v2.0.4 was used to generate a Pd assembly in genome-guided mode with jaccard clip-ping and using the Broad Institute G. destructans genome 20631–21. This assembly was usedto assess pathogen gene expression in the samples fromWNS-affected bats using RSEMv1.2.20 [107]. Trinotate v2 was used to annotate the Pd transcripts by using NCBI BLASTv2.2.29+ [109] and both the Swissprot and Uniref90 databases (downloaded on Sep 17, 2014).
Metagenome AnalysisReads for each sample were analyzed using MG-RAST v.3.5 [110] to identify metagenomicsequences after filtering against the B. taurus genome (the taxonomically closest genome avail-able for filtering). For assignment of organism abundance, the best hit classification was usedwith the M5NR database, maximum e-value cutoff of 1x10⁻⁵, minimum identity cutoff of 60%,and minimum alignment length cutoff of 15.
Supporting InformationS1 Fig. MA plot of gene expression using the trinity transcriptome assembly. Expressionlevels for every gene are shown by comparing RSEM-estimated counts to the fold-change inexpression between unaffected and WNS-affected bat tissues. Blue points indicate significantdifferential expression determined by DESeq2 using an FDR cutoff of 0.05. Genes that aremore highly expressed in WNS-affected tissues are found in the lower side of the graph.(TIF)
S2 Fig. Principal component analysis of Pd genes. The Trinity utility PtR was used to conductprincipal component analysis on the Pd genes with a minimum expression of 10 FPKM.(PDF)
S1 Table. Read statistics of RNA-Seq samples.(DOCX)
S2 Table. FPKM analysis of Pd-derived transcripts prior to removal.(DOCX)
S3 Table. Transcriptome assembly comparison.(DOCX)
Transcriptome of Bats with White-Nose Syndrome
PLOS Pathogens | DOI:10.1371/journal.ppat.1005168 October 1, 2015 23 / 29

S4 Table. Differentially expressed genes determined by RSEM and DESeq2 combined withEBSeq and trinotate results.(XLSX)
S5 Table. Principal component analysis rotation values.(XLSX)
S6 Table. Differentially expressed genes used for GOrilla analysis.(XLSX)
S7 Table. Gene ontology biological process categories over-represented in WNS-affectedtissues.(XLSX)
S8 Table. Pd gene expression estimated by RSEM combined with trinotate results.(XLSX)
S9 Table. MG-RAST analysis of best hit classification for bacterial genes.(XLSX)
S1 Dataset. FASTA file of de novo assembly of little brown myotis transcriptome.(ZIP)
S2 Dataset. RSEM gene expression matrices used for differential host gene expression cal-culations.(ZIP)
S3 Dataset. FASTA file of genome-guided trinity assembly of Pd transcriptome.(ZIP)
S4 Dataset. RSEM gene expression matrices for Pd transcripts.(ZIP)
AcknowledgmentsWe thank Marianne Moore, Sarah Bouboulis, Megan Vodzak, Allen Kurta, Brooke Hines, LarisaBishop-Boros, and Shayne Lumadue for assistance in collecting samples. James W. McMichaelIII provided technical assistance and performed the Pd qPCR of the WNS-affected samples. Jef-frey Foster performed Pd qPCR of the unaffected samples. Cindy Rhone, Gretchen Long, and therest of the animal care staff at Bucknell University assisted in providing excellent care for the cap-tive animals for this study. We thank Jeremy Dreese and Michael Harvey for technical supportwith performing bioinformatics analysis on the Bucknell Linux cluster. We acknowledge BrianHaas, Tiago Hori, and the rest of the trinityrnaseq-users mailing list for helpful assistance withdata analysis. We thank Scott Hunicke-Smith and the Genome Sequencing and Analysis Facilityat the University of Texas at Austin for performing library preparation and RNA sequencing.
Author ContributionsConceived and designed the experiments: KAF JSJ DMR. Performed the experiments: KAFSMR EJR MJB. Analyzed the data: KAF. Wrote the paper: KAF JSJ TML DMR.
References1. Coleman JT, Reichard JD. (2014) Bat White-Nose Syndrome in 2014: A Brief Assessment Seven
Years After Discovery of a Virulent Fungal Pathogen in North America. Outlooks on Pest Management25: 374–377.
Transcriptome of Bats with White-Nose Syndrome
PLOS Pathogens | DOI:10.1371/journal.ppat.1005168 October 1, 2015 24 / 29

2. Blehert DS. (2012) Fungal disease and the developing story of bat white-nose syndrome. PLoSPathog 8: e1002779. doi: 10.1371/journal.ppat.1002779 PMID: 22829763
3. Blehert DS, Hicks AC, Behr M, Meteyer CU, Berlowski-Zier BM, et al. (2009) Bat white-nose syn-drome: an emerging fungal pathogen? Science 323: 227–227. doi: 10.1126/science.1163874 PMID:18974316
4. Lorch JM, Meteyer CU, Behr MJ, Boyles JG, Cryan PM, et al. (2011) Experimental infection of batswithGeomyces destructans causes white-nose syndrome. Nature 480: 376–378. doi: 10.1038/nature10590 PMID: 22031324
5. Warnecke L, Turner JM, Bollinger TK, Lorch JM, Misra V, et al. (2012) Inoculation of bats with Euro-peanGeomyces destructans supports the novel pathogen hypothesis for the origin of white-nose syn-drome. Proc Natl Acad Sci U S A 109: 6999–7003. doi: 10.1073/pnas.1200374109 PMID: 22493237
6. Verant ML, Boyles JG, Waldrep Jr W, Wibbelt G, Blehert DS. (2012) Temperature-dependent growthofGeomyces destructans, the fungus that causes bat white-nose syndrome.
7. Cryan PM, Meteyer CU, Boyles JG, Blehert DS. (2010) Wing pathology of white-nose syndrome inbats suggests life-threatening disruption of physiology. BMC Biol 8: 135-7007-8-135.
8. Meteyer CU, Buckles EL, Blehert DS, Hicks AC, Green DE, et al. (2009) Histopathologic criteria toconfirm white-nose syndrome in bats. Journal of Veterinary Diagnostic Investigation 21: 411–414.PMID: 19564488
9. Turner GG, Reeder DM, Coleman JTH. (2011) A five year assessment of mortality and geographicspread of white-nose syndrome in North American bats and a look to the future. Bat Research News52: 13–27.
10. Frick WF, Puechmaille SJ, Hoyt JR, Nickel BA, Langwig KE, et al. (2015) Disease alters macroecolo-gical patterns of North American bats. Global Ecol Biogeogr 24: 741–749.
11. Frank CL, Michalski A, McDonough AA, Rahimian M, Rudd RJ, et al. (2014) The Resistance of aNorth American Bat Species (Eptesicus fuscus) to White-Nose Syndrome (WNS). PloS One 9:e113958. doi: 10.1371/journal.pone.0113958 PMID: 25437448
12. Wibbelt G, Puechmaille SJ, Ohlendorf B, Mühldorfer K, Bosch T, et al. (2013) Skin Lesions in Euro-pean Hibernating Bats Associated withGeomyces destructans, the Etiologic Agent of White-NoseSyndrome. PloS One 8: e74105. doi: 10.1371/journal.pone.0074105 PMID: 24023927
13. Bandouchova H, Bartonicka T, Berkova H, Brichta J, Cerny J, et al. (2015) Pseudogymnoascusdestructans: evidence of virulent skin invasion for bats under natural conditions, Europe. Transbound-ary and Emerging Diseases 62: 1–5. doi: 10.1111/tbed.12282 PMID: 25268034
14. Reeder DM, Frank CL, Turner GG, Meteyer CU, Kurta A, et al. (2012) Frequent arousal from hiberna-tion linked to severity of infection and mortality in bats with white-nose syndrome. PLoS One 7:e38920. doi: 10.1371/journal.pone.0038920 PMID: 22745688
15. Johnson JS, Reeder DM, McMichael JW III, Meierhofer MB, Stern DW, et al. (2014) Host, pathogen,and environmental characteristics predict white-nose syndromemortality in captive little brown myotis(Myotis lucifugus). PLoS ONE 9: e112502. doi: 10.1371/journal.pone.0112502 PMID: 25409028
16. Geiser F. (2004) Metabolic rate and body temperature reduction during hibernation and daily torpor.Annu Rev Physiol 66: 239–274. PMID: 14977403
17. Thomas DW, Cloutier D. (1992) Evaporative water loss by hibernating little brown bats,Myotis lucifu-gus. Physiol Zool: 443–456.
18. Thomas DW, Dorais M, Bergeron J. (1990) Winter energy budgets and cost of arousals for hibernatinglittle brown bats,Myotis lucifugus. J Mammal 71: 475–479.
19. Fuller NW, Reichard JD, Nabhan ML, Fellows SR, Pepin LC, et al. (2011) Free-ranging little brownmyotis (Myotis lucifugus) heal from wing damage associated with white-nose syndrome. Ecohealth8: 154–162. doi: 10.1007/s10393-011-0705-y PMID: 21922344
20. Cryan PM, Meteyer CU, Blehert DS, Lorch JM, Reeder DM, et al. (2013) Electrolyte depletion inwhite-nose syndrome bats. J Wildl Dis 49: 398–402. doi: 10.7589/2012-04-121 PMID: 23568916
21. Willis CK, Menzies AK, Boyles JG, Wojciechowski MS. (2011) Evaporative water loss is a plausibleexplanation for mortality of bats from white-nose syndrome. Integr Comp Biol 51: 364–373. doi: 10.1093/icb/icr076 PMID: 21742778
22. Verant ML, Meteyer CU, Speakman JR, Cryan PM, Lorch JM, et al. (2014) White-nose syndrome initi-ates a cascade of physiologic disturbances in the hibernating bat host. BMC Physiol 14: 10. doi: 10.1186/s12899-014-0010-4 PMID: 25487871
23. Moore MS, Reichard JD, Murtha TD, Nabhan ML, Pian RE, et al. (2013) Hibernating little brown myo-tis (Myotis lucifugus) show variable immunological responses to white-nose syndrome. PloS One 8:e58976. doi: 10.1371/journal.pone.0058976 PMID: 23527062
Transcriptome of Bats with White-Nose Syndrome
PLOS Pathogens | DOI:10.1371/journal.ppat.1005168 October 1, 2015 25 / 29
24. Moore MS, Reichard JD, Murtha TD, Zahedi B, Fallier RM, et al. (2011) Specific alterations in comple-ment protein activity of little brown myotis (Myotis lucifugus) hibernating in white-nose syndromeaffected sites. PLoS One 6: e27430. doi: 10.1371/journal.pone.0027430 PMID: 22140440
25. LeibundGut-Landmann S, Wüthrich M, Hohl TM. (2012) Immunity to fungi. Curr Opin Immunol 24:449–458. doi: 10.1016/j.coi.2012.04.007 PMID: 22613091
26. Brown GD. (2011) Innate antifungal immunity: the key role of phagocytes. Annu Rev Immunol 29: 1.doi: 10.1146/annurev-immunol-030409-101229 PMID: 20936972
27. Holland SM, DeLeo FR, Elloumi HZ, Hsu AP, Uzel G, et al. (2007) STAT3mutations in the hyper-IgEsyndrome. N Engl J Med 357: 1608–1619. PMID: 17881745
28. Liu L, Okada S, Kong X, Kreins AY, Cypowyj S, et al. (2011) Gain-of-function human STAT1 muta-tions impair IL-17 immunity and underlie chronic mucocutaneous candidiasis. J Exp Med 208: 1635–1648. doi: 10.1084/jem.20110958 PMID: 21727188
29. Gow NA, van de Veerdonk, Frank L, Brown AJ, Netea MG. (2012) Candida albicansmorphogenesisand host defence: discriminating invasion from colonization. Nature Reviews Microbiology 10: 112–122.
30. Netea MG, Brown GD, Kullberg BJ, Gow NA. (2008) An integrated model of the recognition of Can-dida albicans by the innate immune system. Nature Reviews Microbiology 6: 67–78. PMID:18079743
31. Romani L. (2011) Immunity to fungal infections. Nat Rev Immunol 11: 275–288. doi: 10.1038/nri2939PMID: 21394104
32. Hernández-Santos N, Gaffen SL. (2012) Th17 cells in immunity to Candida albicans. Cell Host &Microbe 11: 425–435.
33. Kagami S, Rizzo HL, Kurtz SE, Miller LS, Blauvelt A. (2010) IL-23 and IL-17A, but not IL-12 and IL-22,are required for optimal skin host defense againstCandida albicans. J Immunol 185: 5453–5462. doi:10.4049/jimmunol.1001153 PMID: 20921529
34. Smeekens SP, Ng A, Kumar V, Johnson MD, Plantinga TS, et al. (2013) Functional genomics identi-fies type I interferon pathway as central for host defense againstCandida albicans. Nature Communi-cations 4: 1342. doi: 10.1038/ncomms2343 PMID: 23299892
35. Blanco JL, Garcia ME. (2008) Immune response to fungal infections. Vet Immunol Immunopathol125: 47–70. doi: 10.1016/j.vetimm.2008.04.020 PMID: 18565595
36. De Luca A, Zelante T, D'Angelo C, Zagarella S, Fallarino F, et al. (2010) IL-22 defines a novel immunepathway of antifungal resistance. Mucosal Immunology.
37. Conti HR, Shen F, Nayyar N, Stocum E, Sun JN, et al. (2009) Th17 cells and IL-17 receptor signalingare essential for mucosal host defense against oral candidiasis. J Exp Med 206: 299–311. doi: 10.1084/jem.20081463 PMID: 19204111
38. Brook CE, Dobson AP. (2015) Bats as ‘special’reservoirs for emerging zoonotic pathogens. TrendsMicrobiol 23: 172–180. doi: 10.1016/j.tim.2014.12.004 PMID: 25572882
39. Cogswell-Hawkinson AC, McGlaughlin ME, Calisher CH, Adams R, Schountz T. (2011) Molecularand phylogenetic characterization of cytokine genes from Seba’s short-tailed bat (Carollia perspicil-lata). Open Immunology Journal 4: 31–39.
40. Iha K, Omatsu T, Watanabe S, Ueda N, Taniguchi S, et al. (2009) Molecular cloning and sequencingof the cDNAs encoding the bat interleukin (IL)-2, IL-4, IL-6, IL-10, IL-12p40, and tumor necrosis factor-alpha. Journal of Veterinary Medical Science 71: 1691–1695. PMID: 20046044
41. Zhang G, Cowled C, Shi Z, Huang Z, Bishop-Lilly KA, et al. (2013) Comparative analysis of batgenomes provides insight into the evolution of flight and immunity. Science 339: 456–460. doi: 10.1126/science.1230835 PMID: 23258410
42. Fites JS, Ramsey JP, HoldenWM, Collier SP, Sutherland DM, et al. (2013) The invasive chytrid fun-gus of amphibians paralyzes lymphocyte responses. Science 342: 366–369. doi: 10.1126/science.1243316 PMID: 24136969
43. Bouma HR, Carey HV, Kroese FG. (2010a) Hibernation: the immune system at rest? J Leukoc Biol88: 619–624.
44. Bouma HR, Henning RH, Kroese FG, Carey HV. (2012) Hibernation is associated with depression ofT-cell independent humoral immune responses in the 13-lined ground squirrel. Dev Comp Immunol.
45. Bouma HR, Strijkstra AM, Boerema AS, Deelman LE, Epema AH, et al. (2010b) Blood cell dynamicsduring hibernation in the European Ground Squirrel. Vet Immunol Immunopathol 136: 319–323.
46. Kurtz CC, Carey HV. (2007) Seasonal changes in the intestinal immune system of hibernating groundsquirrels. Dev Comp Immunol 31: 415–428. PMID: 16930701
Transcriptome of Bats with White-Nose Syndrome
PLOS Pathogens | DOI:10.1371/journal.ppat.1005168 October 1, 2015 26 / 29

47. Maniero GD. (2002) Classical pathway serum complement activity throughout various stages of theannual cycle of a mammalian hibernator, the golden-mantled ground squirrel, Spermophilus lateralis.Dev Comp Immunol 26: 563–574. PMID: 12031416
48. Maniero GD. (2005) Ground squirrel splenic macrophages bind lipopolysaccharide over a wide rangeof temperatures at all phases of their annual hibernation cycle. Comp Immunol Microbiol Infect Dis28: 297–309. PMID: 16182368
49. Jaroslow BN, Serrell BA. (1972) Differential sensitivity to hibernation of early and late events in devel-opment of the immune response. J Exp Zool 181: 111–116. PMID: 4556623
50. Larsen B. (1971) Antibody formation in hedgehogs. II. Hibernating animals. Comp Biochem Physiol AComp Physiol 38: 571–580. PMID: 4396827
51. Manasek FJ, Adelstein SJ, Lyman CP. (1965) The effects of hibernation on the in vitro synthesis ofDNA by hamster lymphoid tissue. J Cell Physiol 65: 319–324. PMID: 5891143
52. Cahill JE, Lewert RM, Jaroslow BN. (1967) Effect of hibernation on course of infection and immuneresponse inCitellus tridecemlineatus infected with Nippostrongylus brasiliensis. J Parasitol 53: 110–115. PMID: 6017221
53. Sieckmann DG, Jaffe H, Golech S, Cai D, Hallenbeck JM, et al. (2014) Anti-lymphoproliferative activ-ity of alpha-2-macroglobulin in the plasma of hibernating 13-lined ground squirrels and woodchucks.Vet Immunol Immunopathol 161: 1–11. doi: 10.1016/j.vetimm.2014.05.006 PMID: 25113962
54. Maniero GD. (2000) The influence of temperature and season on mitogen-induced proliferation ofground squirrel lymphocytes. In: Heldmaier G, Klingenspor M, editors. Life in the Cold. New York:Springer. pp. 493–503.
55. Hampton M, Melvin RG, Kendall AH, Kirkpatrick BR, Peterson N, et al. (2011) Deep sequencing thetranscriptome reveals seasonal adaptive mechanisms in a hibernating mammal. PloS One 6:e27021. doi: 10.1371/journal.pone.0027021 PMID: 22046435
56. Hampton M, Melvin RG, AndrewsMT. (2013) Transcriptomic analysis of brown adipose tissue acrossthe physiological extremes of natural hibernation. PloS One 8: e85157. doi: 10.1371/journal.pone.0085157 PMID: 24386461
57. Yan J, Burman A, Nichols C, Alila L, Showe LC, et al. (2006) Detection of differential gene expressionin brown adipose tissue of hibernating arctic ground squirrels with mouse microarrays. Physiol Geno-mics 25: 346–353. PMID: 16464973
58. Schwartz C, Hampton M, AndrewsMT. (2013) Seasonal and regional differences in gene expressionin the brain of a hibernating mammal. PloS One 8: e58427. doi: 10.1371/journal.pone.0058427PMID: 23526982
59. Williams DR, Epperson LE, Li W, Hughes MA, Taylor R, et al. (2005) Seasonally hibernating pheno-type assessed through transcript screening. Physiol Genomics 24: 13–22. PMID: 16249311
60. Bouma HR, Kroese FG, Kok JW, Talaei F, Boerema AS, et al. (2011) Low body temperature governsthe decline of circulating lymphocytes during hibernation through sphingosine-1-phosphate. Proc NatlAcad Sci U S A 108: 2052–2057. doi: 10.1073/pnas.1008823108 PMID: 21245336
61. de Vrij EL, Vogelaar PC, Goris M, Houwertjes MC, Herwig A, et al. (2014) Platelet dynamics duringnatural and pharmacologically induced torpor and forced hypothermia. PloS One 9: e93218. doi: 10.1371/journal.pone.0093218 PMID: 24722364
62. Melvin RG, Andrews MT. (2009) Torpor induction in mammals: recent discoveries fueling new ideas.Trends in Endocrinology & Metabolism 20: 490–498.
63. Johnson JS, Reeder DM, Lilley TM, Czirják GÁ, Voigt CC, et al. (2015) Antibodies to Pseudogym-noascus destructans are not sufficient for protection against white-nose syndrome. Ecology and Evo-lution 5: 2203–2214. doi: 10.1002/ece3.1502 PMID: 26078857
64. Muller LK, Lorch JM, Lindner DL, O’Connor M, Gargas A, et al. (2013) Bat white-nose syndrome: areal-time TaqMan polymerase chain reaction test targeting the intergenic spacer region ofGeomycesdestructans. Mycologia 105: 253–259. doi: 10.3852/12-242 PMID: 22962349
65. Schmieder R, Edwards R. (2011) Fast identification and removal of sequence contamination fromgenomic and metagenomic datasets. PloS One 6: e17288. doi: 10.1371/journal.pone.0017288PMID: 21408061
66. Simao FA, Waterhouse RM, Ioannidis P, Kriventseva EV, Zdobnov EM. (2015) BUSCO: assessinggenome assembly and annotation completeness with single-copy orthologs. Bioinformatics.
67. Love MI, Huber W, Anders S. (2014) Moderated estimation of fold change and dispersion for RNA-seq data with DESeq2. Genome Biol 15: 550. PMID: 25516281
68. Leng N, Dawson JA, Thomson JA, Ruotti V, Rissman AI, et al. (2013) EBSeq: an empirical Bayes hier-archical model for inference in RNA-seq experiments. Bioinformatics 29: 1035–1043. doi: 10.1093/bioinformatics/btt087 PMID: 23428641
Transcriptome of Bats with White-Nose Syndrome
PLOS Pathogens | DOI:10.1371/journal.ppat.1005168 October 1, 2015 27 / 29

69. Suzuki R, Shimodaira H. (2006) Pvclust: an R package for assessing the uncertainty in hierarchicalclustering. Bioinformatics 22: 1540–1542. PMID: 16595560
70. Eden E, Navon R, Steinfeld I, Lipson D, Yakhini Z. (2009) GOrilla: a tool for discovery and visualiza-tion of enriched GO terms in ranked gene lists. BMC Bioinformatics 10: 48. doi: 10.1186/1471-2105-10-48 PMID: 19192299
71. Supek F, Bošnjak M, Škunca N, Šmuc T. (2011) REVIGO summarizes and visualizes long lists ofgene ontology terms. PloS One 6: e21800. doi: 10.1371/journal.pone.0021800 PMID: 21789182
72. Westermann AJ, Gorski SA, Vogel J. (2012) Dual RNA-seq of pathogen and host. Nature ReviewsMicrobiology 10: 618–630. doi: 10.1038/nrmicro2852 PMID: 22890146
73. Pannkuk EL, Risch TS, Savary BJ. (2015) Isolation and identification of an extracellular subtilisin-likeserine protease secreted by the bat pathogen Pseudogymnoascus destructans. PLoS One 10:e0120508. doi: 10.1371/journal.pone.0120508 PMID: 25785714
74. O'Donoghue AJ, Knudsen GM, Beekman C, Perry JA, Johnson AD, et al. (2015) Destructin-1 is a col-lagen-degrading endopeptidase secreted by Pseudogymnoascus destructans, the causative agent ofwhite-nose syndrome. Proc Natl Acad Sci U S A 112: 7478–7483. doi: 10.1073/pnas.1507082112PMID: 25944934
75. Smyth C, Schlesinger S, Overton B, Butchkoski C. (2013) The alternative host hypothesis and poten-tial virulence genes inGeomyces destructans. Bat Res News 54: 17–24.
76. Whittington A, Gow NA, Hube B. (2014) From commensal to pathogen:Candida albicans. In: Anony-mous Human Fungal Pathogens.: Springer. pp. 3–18.
77. Casadevall A, Steenbergen JN, Nosanchuk JD. (2003) ‘Ready made’virulence and ‘dual use’viru-lence factors in pathogenic environmental fungi—theCryptococcus neoformans paradigm. Curr OpinMicrobiol 6: 332–337. PMID: 12941400
78. Swidergall M, Ernst JF. (2014) Interplay betweenCandida albicans and the antimicrobial peptidearmory. Eukaryot Cell 13: 950–957. doi: 10.1128/EC.00093-14 PMID: 24951441
79. Hoyt JR, Cheng TL, Langwig KE, Hee MM, Frick WF, et al. (2015) Bacteria isolated from bats inhibitthe growth of Pseudogymnoascus destructans, the causative agent of white-nose syndrome. PLoSONE 10: e0121329. doi: 10.1371/journal.pone.0121329 PMID: 25853558
80. Rizzetto L, Kuka M, De Filippo C, Cambi A, Netea MG, et al. (2010) Differential IL-17 production andmannan recognition contribute to fungal pathogenicity and commensalism. J Immunol 184: 4258–4268. doi: 10.4049/jimmunol.0902972 PMID: 20228201
81. Reid DM, Gow NA, Brown GD. (2009) Pattern recognition: recent insights from Dectin-1. Curr OpinImmunol 21: 30–37. doi: 10.1016/j.coi.2009.01.003 PMID: 19223162
82. Yamasaki S, Matsumoto M, Takeuchi O, Matsuzawa T, Ishikawa E, et al. (2009) C-type lectin Mincleis an activating receptor for pathogenic fungus, Malassezia. Proc Natl Acad Sci U S A 106: 1897–1902. doi: 10.1073/pnas.0805177106 PMID: 19171887
83. Zhu L, Zhao X, Jiang C, You Y, Chen X, et al. (2013) C-type lectin receptors Dectin-3 and Dectin-2form a heterodimeric pattern-recognition receptor for host defense against fungal infection. Immunity39: 324–334. doi: 10.1016/j.immuni.2013.05.017 PMID: 23911656
84. Bernard F, Morel F, Camus M, Pedretti N, Barrault C, et al. (2012) Keratinocytes under fire of proin-flammatory cytokines: bona fide innate immune cells involved in the physiopathology of chronic atopicdermatitis and psoriasis. J Allergy 2012.
85. Kunz S, Wolk K, Witte E, Witte K, DoeckeW, et al. (2006) Interleukin (IL)-19, IL-20 and IL-24 are pro-duced by and act on keratinocytes and are distinct from classical ILs. Exp Dermatol 15: 991–1004.PMID: 17083366
86. Werner S, Krieg T, Smola H. (2007) Keratinocyte–fibroblast interactions in wound healing. J InvestDermatol 127: 998–1008. PMID: 17435785
87. Ramirez-Carrozzi V, Sambandam A, Luis E, Lin Z, Jeet S, et al. (2011) IL-17C regulates the innateimmune function of epithelial cells in an autocrine manner. Nat Immunol 12: 1159–1166. doi: 10.1038/ni.2156 PMID: 21993848
88. Taylor PR, Roy S, Leal SM Jr, Sun Y, Howell SJ, et al. (2014) Activation of neutrophils by autocrine IL-17A-IL-17RC interactions during fungal infection is regulated by IL-6, IL-23, ROR [gamma] t and dec-tin-2. Nat Immunol 15: 143–151. doi: 10.1038/ni.2797 PMID: 24362892
89. Heath WR, Carbone FR. (2013) The skin-resident and migratory immune system in steady state andmemory: innate lymphocytes, dendritic cells and T cells. Nat Immunol 14: 978–985. doi: 10.1038/ni.2680 PMID: 24048119
90. Palmer JM, Kubatova A, Novakova A, Minnis AM, Kolarik M, et al. (2014) Molecular characterizationof a heterothallic mating system in Pseudogymnoascus destructans, the fungus causing white-nosesyndrome of bats. G3 (Bethesda) 4: 1755–1763.
Transcriptome of Bats with White-Nose Syndrome
PLOS Pathogens | DOI:10.1371/journal.ppat.1005168 October 1, 2015 28 / 29

91. Harden LM, du Plessis I, Poole S, Laburn HP. (2008) Interleukin (IL)-6 and IL-1β act synergisticallywithin the brain to induce sickness behavior and fever in rats. Brain Behav Immun 22: 838–849. doi:10.1016/j.bbi.2007.12.006 PMID: 18255258
92. Moalem G, Tracey DJ. (2006) Immune and inflammatory mechanisms in neuropathic pain. Brain ResRev 51: 240–264. PMID: 16388853
93. Couture R, Harrisson M, Vianna RM, Cloutier F. (2001) Kinin receptors in pain and inflammation. EurJ Pharmacol 429: 161–176. PMID: 11698039
94. Brownlee-Bouboulis SA, Reeder DM. (2013) White-nose syndrome-affected little brown myotis (Myo-tis lucifugus) increase grooming and other active behaviors during arousals from hibernation. J WildlDis 49: 850–859. doi: 10.7589/2012-10-242 PMID: 24502712
95. Wilcox A, Warnecke L, Turner JM, McGuire LP, Jameson JW, et al. (2014) Behaviour of hibernatinglittle brown bats experimentally inoculated with the pathogen that causes white-nose syndrome. AnimBehav 88: 157–164.
96. Tobin DM, Ramakrishnan L. (2013) TB: the Yin and Yang of lipid mediators. Current Opinion in Phar-macology 13: 641–645. doi: 10.1016/j.coph.2013.06.007 PMID: 23849093
97. Prendergast BJ, Freeman DA, Zucker I, Nelson RJ. (2002) Periodic arousal from hibernation is neces-sary for initiation of immune responses in ground squirrels. Am J Physiol Regul Integr Comp Physiol282: R1054–62. PMID: 11893609
98. Plaisance EP, Lukasova M, Offermanns S, Zhang Y, Cao G, et al. (2009) Niacin stimulates adiponec-tin secretion through the GPR109A receptor. Am J Physiol Endocrinol Metab 296: E549–58. doi: 10.1152/ajpendo.91004.2008 PMID: 19141678
99. Lei M, Dong D, Mu S, Pan Y, Zhang S. (2014) Comparison of brain transcriptome of the greater horse-shoe bats (Rhinolophus ferrumequinum) in active and torpid episodes. PloS One 9: e107746. doi: 10.1371/journal.pone.0107746 PMID: 25251558
100. Zhang Y, Pan Y, Yin Q, Yang T, Dong D, et al. (2014) Critical roles of mitochondria in brain activities oftorpidMyotis ricketti bats revealed by a proteomic approach. Journal of Proteomics 105: 266–284.doi: 10.1016/j.jprot.2014.01.006 PMID: 24434588
101. Meteyer CU, Barber D, Mandl JN. (2012) Pathology in euthermic bats with white nose syndrome sug-gests a natural manifestation of immune reconstitution inflammatory syndrome. Virulence 3.
102. Vonhof MJ, Russell AL, Miller-Butterworth CM. (2015) Range-Wide Genetic Analysis of Little BrownBat (Myotis lucifugus) Populations: Estimating the Risk of Spread of White-Nose Syndrome. PloSOne 10: e0128713. doi: 10.1371/journal.pone.0128713 PMID: 26154307
103. Peig J, Green AJ. (2009) New perspectives for estimating body condition frommass/length data: thescaled mass index as an alternative method. Oikos 118: 1883–1891.
104. Bolger AM, Lohse M, Usadel B. (2014) Trimmomatic: a flexible trimmer for Illumina sequence data.Bioinformatics 30: 2114–2120. doi: 10.1093/bioinformatics/btu170 PMID: 24695404
105. Haas BJ, Papanicolaou A, Yassour M, Grabherr M, Blood PD, et al. (2013) De novo transcriptsequence reconstruction from RNA-seq using the Trinity platform for reference generation and analy-sis. Nature Protocols 8: 1494–1512. doi: 10.1038/nprot.2013.084 PMID: 23845962
106. Langmead B, Trapnell C, Pop M, Salzberg SL. (2009) Ultrafast and memory-efficient alignment ofshort DNA sequences to the human genome. Genome Biol 10: R25. doi: 10.1186/gb-2009-10-3-r25PMID: 19261174
107. Li B, Dewey CN. (2011) RSEM: accurate transcript quantification from RNA-Seq data with or without areference genome. BMC Bioinformatics 12: 323-2105-12-323.
108. Benjamini Y, Hochberg Y. (1995) Controlling the false discovery rate: a practical and powerfulapproach to multiple testing. Journal of the Royal Statistical Society.Series B (Methodological): 289–300.
109. McGinnis S, Madden TL. (2004) BLAST: at the core of a powerful and diverse set of sequence analy-sis tools. Nucleic Acids Res 32: W20–5. PMID: 15215342
110. Meyer F, Paarmann D, D'Souza M, Olson R, Glass EM, et al. (2008) The metagenomics RAST server—a public resource for the automatic phylogenetic and functional analysis of metagenomes. BMCBioinformatics 9: 386-2105-9-386.
Transcriptome of Bats with White-Nose Syndrome
PLOS Pathogens | DOI:10.1371/journal.ppat.1005168 October 1, 2015 29 / 29