
Classification of Agarwood Oil Using an Electronic Nose
11
Sensors 2010, 10, 4675-4685; doi:10.3390/s100504675 sensors ISSN 1424-8220 www.mdpi.com/journal/sensors Article Classification of Agarwood Oil Using an Electronic Nose Wahyu Hidayat *, Ali Yeon Md. Shakaff, Mohd Noor Ahmad and Abdul Hamid Adom Sensor Technology and Applications Research Cluster, Universiti Malaysia Perlis (UniMAP), 01000 Kangar, Perlis, Malaysia; E-Mails: [email protected] (A.Y.M.S.); [email protected] (M.N.A.); [email protected] (A.H.A.) * Author to whom correspondence should be addressed; E-Mail: [email protected]; Tel.: +60-4-9798897; Fax: +60-4-9775302. Received: 1 March 2010; in revised form: 14 April 2010 / Accepted: 19 April 2010 / Published: 6 May 2010 Abstract: Presently, the quality assurance of agarwood oil is performed by sensory panels which has significant drawbacks in terms of objectivity and repeatability. In this paper, it is shown how an electronic nose (e-nose) may be successfully utilised for the classification of agarwood oil. Hierarchical Cluster Analysis (HCA) and Principal Component Analysis (PCA), were used to classify different types of oil. The HCA produced a dendrogram showing the separation of e-nose data into three different groups of oils. The PCA scatter plot revealed a distinct separation between the three groups. An Artificial Neural Network (ANN) was used for a better prediction of unknown samples. Keywords: agarwood oil; e-nose; HCA; PCA; ANN; dimensionality reduction 1. Introduction Agarwood is the well-known name for a resinous heartwood from ‘wounded/infected’ Aquilaria trees, a tropical forest product which has a high value in international trading. There are increasing demands for agarwood-based products for use in medicine, perfume, and incense. Agarwood is traded in the form of product derivatives such as wood chips, powder, and oil. The wholesale price for high quality agarwood oils is around US$30,000–US$50,000 per liter [1], depending on the oil quality, which is based upon the fragrance strength and longevity, resin content, geographical origin, and oil purity [2]. OPEN ACCESS
-
Upload
independent -
Category
Documents
-
view
0 -
download
0
Transcript of Classification of Agarwood Oil Using an Electronic Nose
Sensors 2010, 10, 4675-4685; doi:10.3390/s100504675
sensors ISSN 1424-8220
www.mdpi.com/journal/sensors
Article
Classification of Agarwood Oil Using an Electronic Nose
Wahyu Hidayat *, Ali Yeon Md. Shakaff, Mohd Noor Ahmad and Abdul Hamid Adom
Sensor Technology and Applications Research Cluster, Universiti Malaysia Perlis (UniMAP),
01000 Kangar, Perlis, Malaysia; E-Mails: [email protected] (A.Y.M.S.);
[email protected] (M.N.A.); [email protected] (A.H.A.)
* Author to whom correspondence should be addressed; E-Mail: [email protected];
Tel.: +60-4-9798897; Fax: +60-4-9775302.
Received: 1 March 2010; in revised form: 14 April 2010 / Accepted: 19 April 2010 /
Published: 6 May 2010
Abstract: Presently, the quality assurance of agarwood oil is performed by sensory panels
which has significant drawbacks in terms of objectivity and repeatability. In this paper, it is
shown how an electronic nose (e-nose) may be successfully utilised for the classification of
agarwood oil. Hierarchical Cluster Analysis (HCA) and Principal Component Analysis
(PCA), were used to classify different types of oil. The HCA produced a dendrogram
showing the separation of e-nose data into three different groups of oils. The PCA scatter
plot revealed a distinct separation between the three groups. An Artificial Neural Network
(ANN) was used for a better prediction of unknown samples.
Keywords: agarwood oil; e-nose; HCA; PCA; ANN; dimensionality reduction
1. Introduction
Agarwood is the well-known name for a resinous heartwood from ‘wounded/infected’ Aquilaria
trees, a tropical forest product which has a high value in international trading. There are increasing
demands for agarwood-based products for use in medicine, perfume, and incense. Agarwood is traded
in the form of product derivatives such as wood chips, powder, and oil. The wholesale price for high
quality agarwood oils is around US$30,000–US$50,000 per liter [1], depending on the oil quality,
which is based upon the fragrance strength and longevity, resin content, geographical origin, and
oil purity [2].
OPEN ACCESS

Sensors 2010, 10
4676
Traditionally, agarwood grading has been performed by trained human graders (sensory panels).
However, the method has disadvantages in terms of objectivity and repeatability [3]. In addition, a
human nose cannot tolerate a high number of samples because it fatigues rapidly with increasing
number of samples. In this paper, it is shown how an electronic nose (e-nose) may be used to resolve
these issues. A commercial e-nose, the Cyranose 320 (Smith Detection, USA) was used to collect the
smell (fragrance) data (herein termed as ‘smellprint’) which was then processed on a personal
computer using different pattern recognition methods: Hierarchical Cluster Analysis (HCA), Principal
Component Analysis (PCA) and Artificial Neural Network (ANN).
2. Experimental
An experiment aimed to produce a data set with robust consistency was conducted using a
Cyranose 320 (see Figure 1). The important features of the Cyranose 320 are provided in Table 1 [4].
The acquired raw data was then processed and interpreted into meaningful information. The samples
were obtained from three groups of agarwood oils originating from Laos, Johor (Malaysia) and
Terengganu (Malaysia), which were labelled as G12, G22, and G32, respectively. Two µL samples
from each locality was diluted using 500 mL glycerol as a solvent. The samples were placed in
a 40 mL stoppered vial connected to a Cyranose 320 via an inert tubing and heated to 60 °C in a heater
block. Each experiment was run for 30 min.
Figure 1. The Cyranose 320 [4].
Table 1. Important features of the Cyranose 320 [4].
Sensors 32 polymer carbon black composites
Operating Temperature 0 to 40 °C (32 to 104 °F)
Response Time 10 sec
Sampling Pump Low: 50 mL/min, Medium: 120 mL/min,
High: 180 mL/min.
Communication RS–232 @ 9,600 to 57,600 bps
Algorithms PCA, KNN, K-means, CDA
Sensors 2010, 10
4677
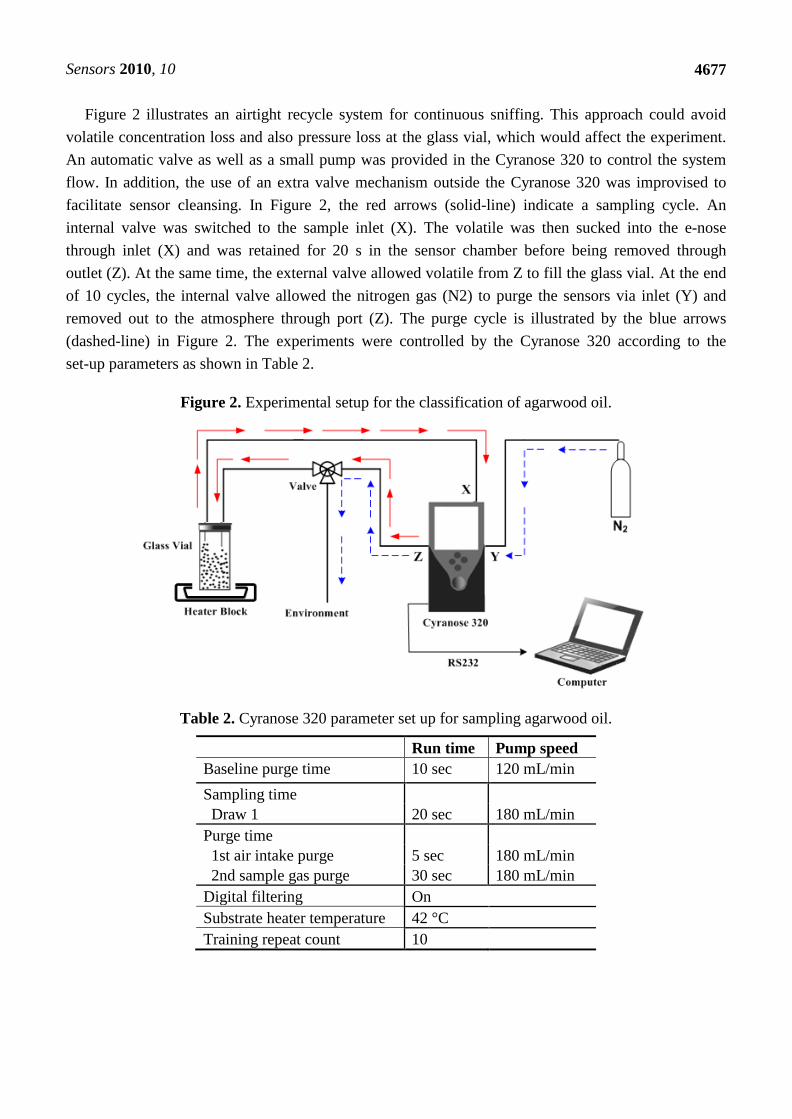
Figure 2 illustrates an airtight recycle system for continuous sniffing. This approach could avoid
volatile concentration loss and also pressure loss at the glass vial, which would affect the experiment.
An automatic valve as well as a small pump was provided in the Cyranose 320 to control the system
flow. In addition, the use of an extra valve mechanism outside the Cyranose 320 was improvised to
facilitate sensor cleansing. In Figure 2, the red arrows (solid-line) indicate a sampling cycle. An
internal valve was switched to the sample inlet (X). The volatile was then sucked into the e-nose
through inlet (X) and was retained for 20 s in the sensor chamber before being removed through
outlet (Z). At the same time, the external valve allowed volatile from Z to fill the glass vial. At the end
of 10 cycles, the internal valve allowed the nitrogen gas (N2) to purge the sensors via inlet (Y) and
removed out to the atmosphere through port (Z). The purge cycle is illustrated by the blue arrows
(dashed-line) in Figure 2. The experiments were controlled by the Cyranose 320 according to the
set-up parameters as shown in Table 2.
Figure 2. Experimental setup for the classification of agarwood oil.
Table 2. Cyranose 320 parameter set up for sampling agarwood oil.
Run time Pump speed
Baseline purge time 10 sec 120 mL/min
Sampling time
Draw 1 20 sec 180 mL/min
Purge time
1st air intake purge 5 sec 180 mL/min
2nd sample gas purge 30 sec 180 mL/min
Digital filtering On
Substrate heater temperature 42 °C
Training repeat count 10

Sensors 2010, 10
4678
3. Results and Discussion
3.1. Smellprint
The agarwood oil volatiles are adsorbed on the sensor’s surfaces and cause a change in its
resistance. The response of the sensor is defined by using fractional baseline manipulation [5]:
(1)
where Rs is the resistance change of sensor s, Rs,n is the output resistance and Rs,0 is the baseline
output. The subscript index s is the sensor number used in the Cyranose (s = 1…32) and n is an index
for the number of data (n = 1…N).
As an example, Figure 3 shows responses from seven sensors of the Cyranose 320. The data was
taken from one sampling cycle of a G12 experiment. The figure also illustrates the base line purge
time, sampling time and purge time.
Figure 3. Measurements taken from seven of the sensors for one sampling cycle.
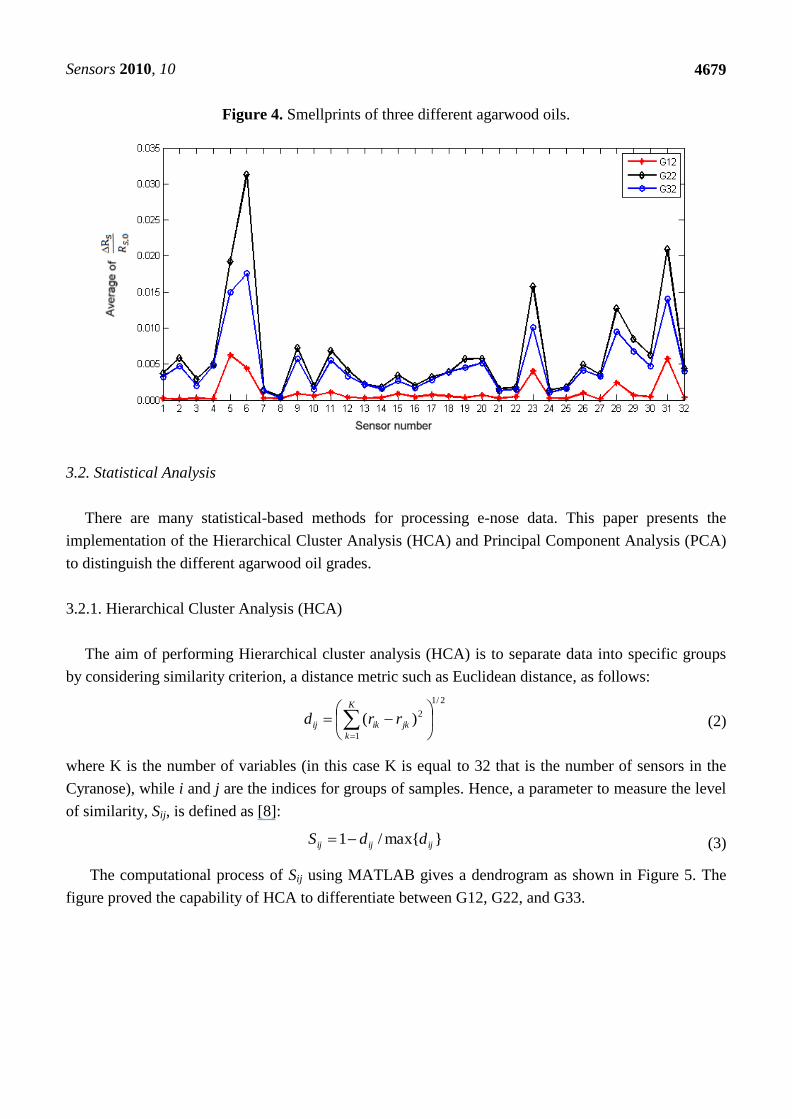
The average of values evaluated by Equation (1) is plotted as shown in Figure 4, and corresponds to
the smellprints of the three different agarwood oils. Sensors with high responses are analyzed by
comparing their peaks and profiles [6]. Sensor numbers 6, 31, 5, 23, and 28 (in the order of
diminishing responses) have higher responses compared to the rest when exposed to the volatiles of the
different grade of oils. However, the analysis of smellprints becomes more difficult when there is an
increase in the number of samples having overlapping profiles. This issue can be solved using
graphical methods based on statistical theories [7], and this was adopted and presented in the
next section.
Sensors 2010, 10
4679
Figure 4. Smellprints of three different agarwood oils.
3.2. Statistical Analysis
There are many statistical-based methods for processing e-nose data. This paper presents the
implementation of the Hierarchical Cluster Analysis (HCA) and Principal Component Analysis (PCA)
to distinguish the different agarwood oil grades.
3.2.1. Hierarchical Cluster Analysis (HCA)
The aim of performing Hierarchical cluster analysis (HCA) is to separate data into specific groups
by considering similarity criterion, a distance metric such as Euclidean distance, as follows:
2/1
1
2)(
K
k
jkikij rrd (2)
where K is the number of variables (in this case K is equal to 32 that is the number of sensors in the
Cyranose), while i and j are the indices for groups of samples. Hence, a parameter to measure the level
of similarity, Sij, is defined as [8]:
}max{/1 ijijij ddS (3)
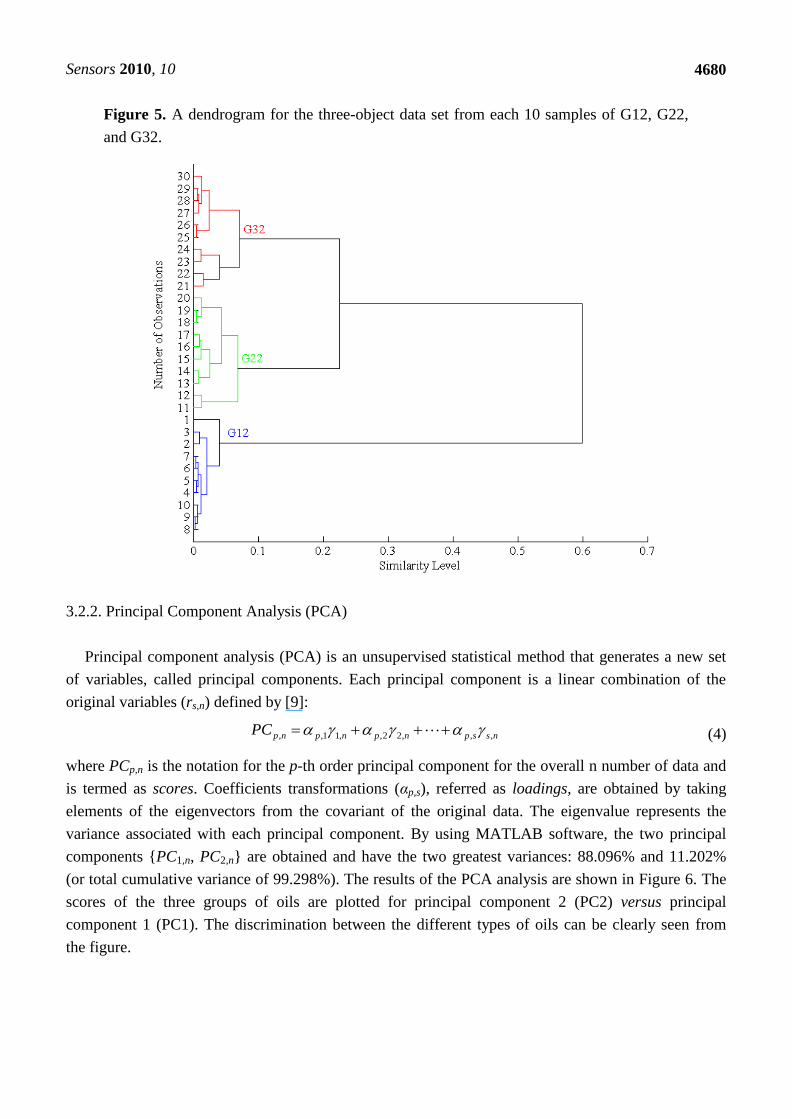
The computational process of Sij using MATLAB gives a dendrogram as shown in Figure 5. The
figure proved the capability of HCA to differentiate between G12, G22, and G33.
Sensors 2010, 10
4680
Figure 5. A dendrogram for the three-object data set from each 10 samples of G12, G22,
and G32.
3.2.2. Principal Component Analysis (PCA)
Principal component analysis (PCA) is an unsupervised statistical method that generates a new set
of variables, called principal components. Each principal component is a linear combination of the
original variables (rs,n) defined by [9]:
nsspnpnpnpPC ,,,22,,11,, (4)
where PCp,n is the notation for the p-th order principal component for the overall n number of data and
is termed as scores. Coefficients transformations (αp,s), referred as loadings, are obtained by taking
elements of the eigenvectors from the covariant of the original data. The eigenvalue represents the
variance associated with each principal component. By using MATLAB software, the two principal
components {PC1,n, PC2,n} are obtained and have the two greatest variances: 88.096% and 11.202%
(or total cumulative variance of 99.298%). The results of the PCA analysis are shown in Figure 6. The
scores of the three groups of oils are plotted for principal component 2 (PC2) versus principal
component 1 (PC1). The discrimination between the different types of oils can be clearly seen from
the figure.

Sensors 2010, 10
4681
Figure 6. Principal components score plot proves the capability of e-nose to classify the
different types of oils G12, G22, and G32.
3.3. Artificial Neural Network (ANN)
3.3.1. Result from 32 Sensors as Input
The previous two statistical approaches, HCA and PCA, successfully showed their capabilities to
distinguish different types of agarwood oils. Both are typically used for exploratory data analysis to see
how the multivariate data is clustered and to assess the linear separability of the odour classes.
However, in cases where prediction is required (e.g., when implementing an automated classifier), the
ANN is the more appropriate tool [7]. This section presents the use of ANN as an alternative choice to
solve the classification problem in this work.
In this experiment, the backpropagation ANN with the Levenberg-Marquardt training algorithm was
applied. The training used all the 32 sensors as inputs, 20 neurons in the single hidden layer, and three
neurons at the output layer. The activation functions used are sigmoid and identity functions at the
hidden and output layer, respectively. Figure 7 illustrates the structure of the ANN and how the input
and output data were organised and indexed.
Sensors 2010, 10
4682
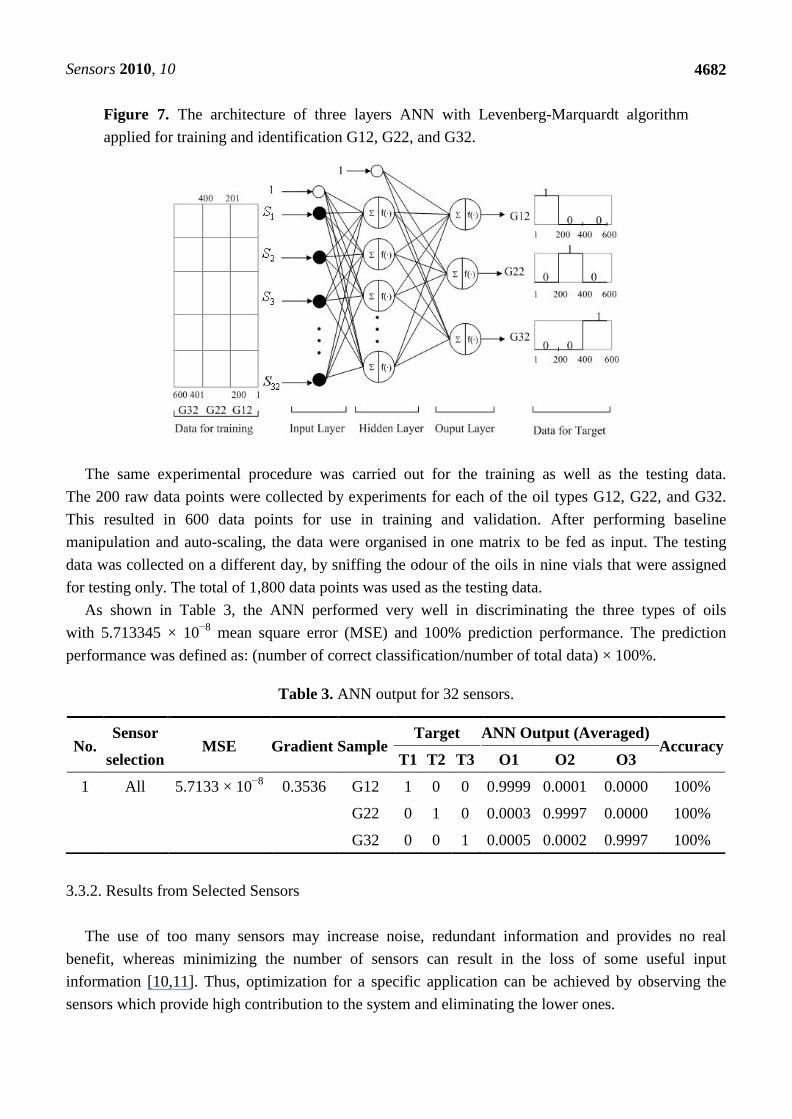
Figure 7. The architecture of three layers ANN with Levenberg-Marquardt algorithm
applied for training and identification G12, G22, and G32.
The same experimental procedure was carried out for the training as well as the testing data.
The 200 raw data points were collected by experiments for each of the oil types G12, G22, and G32.
This resulted in 600 data points for use in training and validation. After performing baseline
manipulation and auto-scaling, the data were organised in one matrix to be fed as input. The testing
data was collected on a different day, by sniffing the odour of the oils in nine vials that were assigned
for testing only. The total of 1,800 data points was used as the testing data.
As shown in Table 3, the ANN performed very well in discriminating the three types of oils
with 5.713345 × 10⁻⁸
mean square error (MSE) and 100% prediction performance. The prediction
performance was defined as: (number of correct classification/number of total data) × 100%.
Table 3. ANN output for 32 sensors.
3.3.2. Results from Selected Sensors
The use of too many sensors may increase noise, redundant information and provides no real
benefit, whereas minimizing the number of sensors can result in the loss of some useful input
information [10,11]. Thus, optimization for a specific application can be achieved by observing the
sensors which provide high contribution to the system and eliminating the lower ones.
No. Sensor
MSE Gradient Sample Target ANN Output (Averaged)
Accuracy selection T1 T2 T3 O1 O2 O3
1 All 5.7133 × 10⁻⁸
0.3536 G12 1 0 0 0.9999 0.0001 0.0000 100%
G22 0 1 0 0.0003 0.9997 0.0000 100%
G32 0 0 1 0.0005 0.0002 0.9997 100%
Sensors 2010, 10
4683
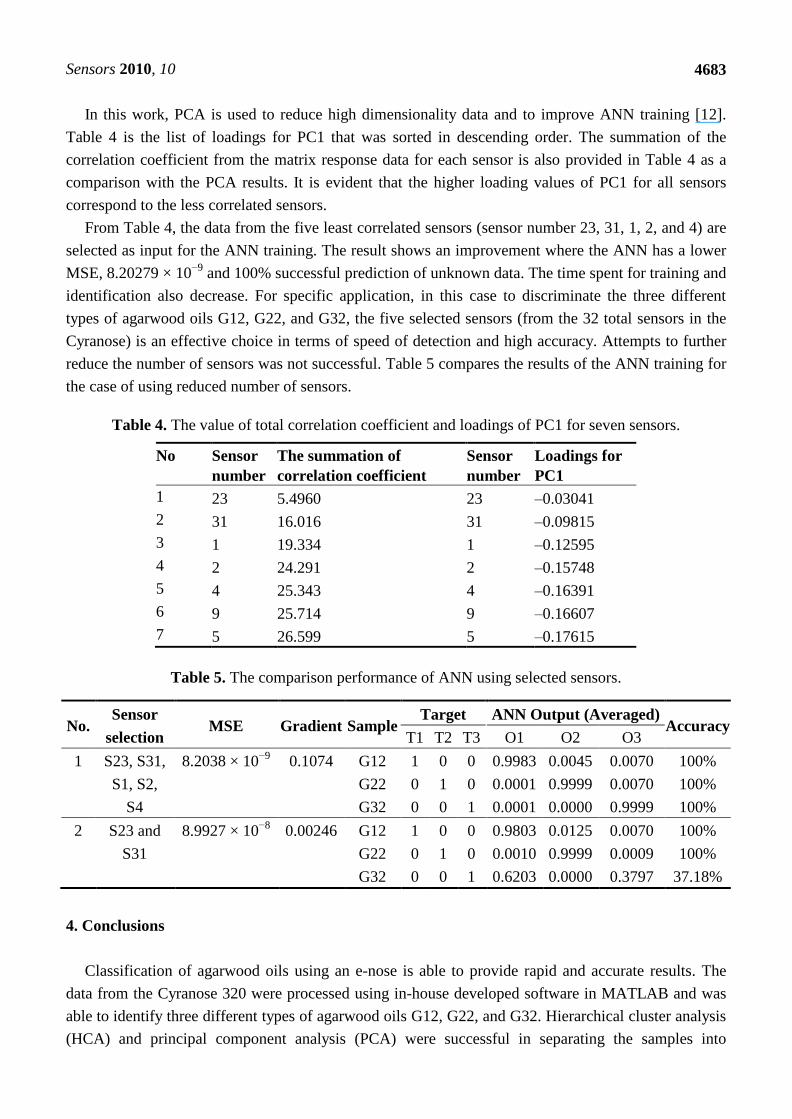
In this work, PCA is used to reduce high dimensionality data and to improve ANN training [12].
Table 4 is the list of loadings for PC1 that was sorted in descending order. The summation of the
correlation coefficient from the matrix response data for each sensor is also provided in Table 4 as a
comparison with the PCA results. It is evident that the higher loading values of PC1 for all sensors
correspond to the less correlated sensors.
From Table 4, the data from the five least correlated sensors (sensor number 23, 31, 1, 2, and 4) are
selected as input for the ANN training. The result shows an improvement where the ANN has a lower
MSE, 8.20279 × 10⁻⁹
and 100% successful prediction of unknown data. The time spent for training and
identification also decrease. For specific application, in this case to discriminate the three different
types of agarwood oils G12, G22, and G32, the five selected sensors (from the 32 total sensors in the
Cyranose) is an effective choice in terms of speed of detection and high accuracy. Attempts to further
reduce the number of sensors was not successful. Table 5 compares the results of the ANN training for
the case of using reduced number of sensors.
Table 4. The value of total correlation coefficient and loadings of PC1 for seven sensors.
No Sensor
number
The summation of
correlation coefficient
Sensor
number
Loadings for
PC1
1 23 5.4960 23 –0.03041
2 31 16.016 31 –0.09815
3 1 19.334 1 –0.12595
4 2 24.291 2 –0.15748
5 4 25.343 4 –0.16391
6 9 25.714 9 –0.16607
7 5 26.599 5 –0.17615
Table 5. The comparison performance of ANN using selected sensors.
4. Conclusions
Classification of agarwood oils using an e-nose is able to provide rapid and accurate results. The
data from the Cyranose 320 were processed using in-house developed software in MATLAB and was
able to identify three different types of agarwood oils G12, G22, and G32. Hierarchical cluster analysis
(HCA) and principal component analysis (PCA) were successful in separating the samples into
No. Sensor
MSE Gradient Sample Target ANN Output (Averaged)
Accuracy selection T1 T2 T3 O1 O2 O3
1 S23, S31, 8.2038 × 10⁻⁹
0.1074 G12 1 0 0 0.9983 0.0045 0.0070 100%
S1, S2, G22 0 1 0 0.0001 0.9999 0.0070 100%
S4 G32 0 0 1 0.0001 0.0000 0.9999 100%
2 S23 and 8.9927 × 10⁻⁸
0.00246 G12 1 0 0 0.9803 0.0125 0.0070 100%
S31 G22 0 1 0 0.0010 0.9999 0.0009 100%
G32 0 0 1 0.6203 0.0000 0.3797 37.18%

Sensors 2010, 10
4684
different groups or clusters. ANN was also successfully applied to predict unknown agarwood samples.
The optimum number of sensors for this application has been determined by PCA analysis, which
subsequently minimize the number of ANN input variables. The current research in our laboratories is
to verify the purity and grading of the oil based on quantitative analysis using
the e-nose.
Acknowledgements
The authors gratefully acknowledge the financial support from the Ministry of Science, Technology
and Environment, Malaysia through Grant No. 9005-00007. Also, to Universiti Malaysia Perlis for the
financial assistance given to Wahyu Hidayat. The authors wish to thank Nor Azah M.A from Forest
Research Institute Malaysia, M.R Awang from Malaysian Institute for Nuclear Technology Research
and M.R Kamarudin for their collaboration, supply of samples, assistance and useful discussions.
References
1. Persoon, G.A. Growing ‘the wood of the Gods’: Agarwood production in Southeast Asia. In
Smallholder Tree Growing for Rural 245 Development and Environmental Services;
Snelder, D.J., Lasco, R.D., Eds.; Springer: Dordrecht, The Netherlands, 2008; pp. 245–262.
2. Barden, A.; Anak, N.A.; Mulliken, T.; Song, M. Hearth of the Matter: Agarwood Use and Trade
and CITES Implementation for Aquilaria Malaccensis; Traffic Network Report 1998–2000;
TRAFFIC International: Cambridge, UK, 2000; pp. 1–51.
3. Keller, P.E. Mimicking biology: applications of cognitive systems to electronic noses.
In Proceedings of IEEE International Symposium on Intelligent Control/Intelligent Systems and
Semiotics, Cambridge, MA, USA, September 1999.
4. Cyranose 320 User Manual; Smith Detection: Pasadena, CA, USA, 2004.
5. Gardner, J.W.; Bartlett, P.N. Electronic Noses: Principles and Applications; Oxford University
Press: New York, NY, USA, 1999.
6. Luo, D.; Hosseini, H.G.; Stewart, J.R. Application of ANN with extracted parameters from an
electronic nose in cigarette brand identification. Sens. Actuat. B: Chem. 2004, 99, 253–257.
7. Scott, S.M.; James, D.; Ali, Z. Review: Data analysis for electronic nose systems. Microchim.
Acta. 2007, 156, 183–207.
8. Hines, E.L.; Iobet, E.L.; Gardner, J.W. Electronic noses: a review of signal processing techniques.
In Proceedings of IEEE Circuits Device System, Salte Lake City, UT, USA, December 1999;
Volume 146, No. 6.
9. Jolliffe, I.T. Principal Component Analysis, 2nd ed.; Springer-Verlag: New York, NY, USA,
2002.
10. Penza, M.; Cassano, G. Application of principal component analysis and artificial neural networks
to recognize the individual VOCs of methanol/2-propanol in a binary mixture by SAW
multi-sensor array. Sens. Actuat. B: Chem. 2003, 89, 269–284.

Sensors 2010, 10
4685
11. Gardner, J.W.; Boilot, P.; Hines, E.L. Enhancing electronic nose performance by sensor selection
using a new integer-based genetic algorithm approach. Sens. Actuat. B: Chem. 2005, 106,
114–121.
12. Dutta, R.; Das, A.; Stocks, N.G.; Morgan, D. Stochastic resonance-based electronic nose: A novel
way to classify bacteria. Sens. Actuat. B: Chem. 2006, 115, 17–27.
© 2010 by the authors; licensee MDPI, Basel, Switzerland. This article is an open-access article
distributed under the terms and conditions of the Creative Commons Attribution license
(http://creativecommons.org/licenses/by/3.0/).