The universal ratio of boron to chlorinity for the North Pacific and North Atlantic oceans
11
The universal ratio of boron to chlorinity for the North Pacific and North Atlantic oceans Kitack Lee a, * , Tae-Wook Kim a , Robert H. Byrne b , Frank J. Millero c , Richard A. Feely d , Yong-Ming Liu a a School of Environmental Science and Engineering, Pohang University of Science and Technology, Pohang 790-784, Republic of Korea b College of Marine Science, University of South Florida, St. Petersburg, FL 33701, USA c Rosenstiel School of Marine and Atmospheric Science, University of Miami, FL 33149, USA d Pacific Marine Environmental Laboratory/National Oceanic and Atmospheric Administration, Seattle, WA 98115-6349, USA Received 14 August 2009; accepted in revised form 15 December 2009; available online 4 January 2010 Abstract We report seawater boron concentration (mg kg 1 ) and chlorinity (&) values measured in seawater samples (n = 139) col- lected at various depths in the North Pacific and North Atlantic oceans and the East/Japan Sea (located in the western temperate North Pacific). Our results indicate that variations in seawater boron concentration are strongly coupled to variations in chlo- rinity (and salinity), yielding a mean boron to chlorinity ratio of 0.2414 ± 0.0009 mg kg 1 & 1 (boron to salinity ratio = 0.1336 ± 0.0005 mg kg 1 & 1 ). This ratio was surprisingly universal throughout the water column in the three marine basins and across widely different ocean surface regimes, but differs from the generally accepted ratio of 0.232 ± 0.005 mg kg 1 & 1 determined by Uppstro ¨ m (1974), which was based on only 20 measurements at four sites in the tropical Paci- fic Ocean. In converting total alkalinity to carbonate alkalinity (and vice versa) for thermodynamic calculations, the difference between these two ratios leads to a difference of 5 lmol kg 1 in estimates for ocean surface waters, where the contribution of borate to total alkalinity is typically greatest. We suggest the use of the new boron to chlorinity ratio for predicting seawater boron concentrations using chlorinity (or salinity) data. Ó 2009 Elsevier Ltd. All rights reserved. 1. INTRODUCTION The hydrogen ion concentration in seawater is regulated by a buffering mechanism involving various weak acids including bicarbonate, carbonate, borate, silicate, phos- phate, arsenate, and possibly uncharacterized dissolved organic matter (Dickson, 1981, 1992; Wolf-Gladrow et al., 2007; Kim and Lee, 2009). Most studies conducted to date on the buffering capacity of seawater have focused on the carbonate system, which accounts for more than 90% of the total buffering capacity of seawater. Less atten- tion has been paid to other minor buffering factors, of which boron (B) is the most significant. The B buffering capacity is particularly important in upper level waters with higher pH values (Holme ´n, 2000). At concentrations of 4–5 mg kg 1 (Culkin, 1965) B is one of the major dissolved components in seawater. The B concentration (mg kg 1 ) in seawater has long been thought to be strongly correlated with chlorinity (Cl, &) and salinity (S, &). However, other processes (e.g. forma- tion of sea salt aerosols, ocean biology, river discharges, and atmospheric deposition) are also known to influence the seawater B concentration, although it is not clear whether these factors affect the B level to a measurable de- gree without changing chlorinity. Boron in seawater exists predominantly in the form of boric acid, B(OH) 3 , approxi- mately 20% of which is ionized to borate ions, B(OH) 4 , at the pH of seawater (Dickson, 1990; Roy et al., 1993). The equilibrium reaction between the two B species contributes 0016-7037/$ - see front matter Ó 2009 Elsevier Ltd. All rights reserved. doi:10.1016/j.gca.2009.12.027 * Corresponding author. E-mail address: [email protected] (K. Lee). www.elsevier.com/locate/gca Available online at www.sciencedirect.com Geochimica et Cosmochimica Acta 74 (2010) 1801–1811
Transcript of The universal ratio of boron to chlorinity for the North Pacific and North Atlantic oceans
Available online at www.sciencedirect.com
www.elsevier.com/locate/gca
Geochimica et Cosmochimica Acta 74 (2010) 1801–1811
The universal ratio of boron to chlorinity for theNorth Pacific and North Atlantic oceans
Kitack Lee a,*, Tae-Wook Kim a, Robert H. Byrne b, Frank J. Millero c,Richard A. Feely d, Yong-Ming Liu a
a School of Environmental Science and Engineering, Pohang University of Science and Technology, Pohang 790-784, Republic of Koreab College of Marine Science, University of South Florida, St. Petersburg, FL 33701, USA
c Rosenstiel School of Marine and Atmospheric Science, University of Miami, FL 33149, USAd Pacific Marine Environmental Laboratory/National Oceanic and Atmospheric Administration, Seattle, WA 98115-6349, USA
Received 14 August 2009; accepted in revised form 15 December 2009; available online 4 January 2010
Abstract
We report seawater boron concentration (mg kg�1) and chlorinity (&) values measured in seawater samples (n = 139) col-lected at various depths in the North Pacific and North Atlantic oceans and the East/Japan Sea (located in the western temperateNorth Pacific). Our results indicate that variations in seawater boron concentration are strongly coupled to variations in chlo-rinity (and salinity), yielding a mean boron to chlorinity ratio of 0.2414 ± 0.0009 mg kg�1 &�1 (boron to salinityratio = 0.1336 ± 0.0005 mg kg�1 &�1). This ratio was surprisingly universal throughout the water column in the three marinebasins and across widely different ocean surface regimes, but differs from the generally accepted ratio of 0.232 ±0.005 mg kg�1 &�1 determined by Uppstrom (1974), which was based on only 20 measurements at four sites in the tropical Paci-fic Ocean. In converting total alkalinity to carbonate alkalinity (and vice versa) for thermodynamic calculations, the differencebetween these two ratios leads to a difference of 5 lmol kg�1 in estimates for ocean surface waters, where the contribution ofborate to total alkalinity is typically greatest. We suggest the use of the new boron to chlorinity ratio for predicting seawater boronconcentrations using chlorinity (or salinity) data.� 2009 Elsevier Ltd. All rights reserved.
1. INTRODUCTION
The hydrogen ion concentration in seawater is regulatedby a buffering mechanism involving various weak acidsincluding bicarbonate, carbonate, borate, silicate, phos-phate, arsenate, and possibly uncharacterized dissolvedorganic matter (Dickson, 1981, 1992; Wolf-Gladrowet al., 2007; Kim and Lee, 2009). Most studies conductedto date on the buffering capacity of seawater have focusedon the carbonate system, which accounts for more than90% of the total buffering capacity of seawater. Less atten-tion has been paid to other minor buffering factors, ofwhich boron (B) is the most significant. The B buffering
0016-7037/$ - see front matter � 2009 Elsevier Ltd. All rights reserved.
doi:10.1016/j.gca.2009.12.027
* Corresponding author.E-mail address: [email protected] (K. Lee).
capacity is particularly important in upper level waters withhigher pH values (Holmen, 2000).
At concentrations of 4–5 mg kg�1 (Culkin, 1965) B isone of the major dissolved components in seawater. TheB concentration (mg kg�1) in seawater has long beenthought to be strongly correlated with chlorinity (Cl, &)and salinity (S, &). However, other processes (e.g. forma-tion of sea salt aerosols, ocean biology, river discharges,and atmospheric deposition) are also known to influencethe seawater B concentration, although it is not clearwhether these factors affect the B level to a measurable de-gree without changing chlorinity. Boron in seawater existspredominantly in the form of boric acid, B(OH)3, approxi-mately 20% of which is ionized to borate ions, B(OH)4
�, atthe pH of seawater (Dickson, 1990; Roy et al., 1993). Theequilibrium reaction between the two B species contributes

1802 K. Lee et al. / Geochimica et Cosmochimica Acta 74 (2010) 1801–1811
to the buffering of pH and seawater alkalinity (AT). In par-ticular, borate is the third most important contributor toAT after bicarbonate and carbonate (Dickson, 1981, 1992;Wolf-Gladrow et al., 2007).
To estimate the borate contribution to AT accurate seawa-ter B concentration data and accurate dissociation constantsfor boric acid in seawater are needed. To estimate B concen-trations in seawater, a B (mg kg�1) to chlorinity (&) ratio of0.232 (Uppstrom, 1974) has been widely used for more thanthree decades. However, this ratio could be erroneous be-cause it was based on only 20 measurements made on PacificOcean samples, and the B measurement protocol (Uppstrom,1968) used in analysis of these samples was questionable (Liuand Lee, 2009). Accurate B concentration data are also crit-ical in reconstructing paleo-ocean pH using the B/Ca ratio(e.g. Yu et al., 2007; Foster, 2008) of marine organisms buriedin sediments. The B/Cl ratio of 0.232 was also used in earlierstudies addressing this topic.
In the study reported here we used a new protocol formeasuring the B concentration (Liu and Lee, 2009) in anal-ysis of a large number of surface and deep seawater samples(n = 139) collected from the North Atlantic and North Pa-cific oceans, and the East/Japan Sea. We evaluated theinfluence of oceanic and atmospheric processes on seawaterB concentration (and thereby the B/Cl ratio), and assessedthe accuracy of the B/Cl ratio of Uppstrom (1974). Thegoal of the study was to assess whether differences in theB/Cl ratio occur among regions or with depth, and to de-rive a B/Cl ratio that most accurately represents the distri-bution of B in the global oceans. Finally, we assessedwhether use of the new B/Cl ratio could affect the accuracyof calculated carbonate parameters in seawater thermody-namic calculations involving AT.
2. BORON ANALYTICAL METHOD, AND SOURCES
OF SAMPLES AND CO2 DATA
Modifications to the established curcumin method ofUppstrom (1968) for measurement of seawater B concen-tration were derived from comprehensive laboratory teststhat assessed the stability of the curcumin–acetic acid re-agent, and the effect of temperature, reaction duration,interference by sea salts and water, and evaporation duringthe dehydration process on the reaction between boric acidand curcumin (documented in Liu and Lee, 2009). The
Fig. 1. Sampling locations for surface (open circles) and deep waters (oththe European Station for Time-series in the Ocean, Canary Islands (ESTStudy (BATS; 31�400N, 64�100W; diamond), the Hawaiian Ocean Time Slocations in the East/Japan Sea (EJS; 41�020N, 132�330E and 41�500N, 13color mentioned in this figure the reader is referred to the web version o
suggested modifications yielded considerably more preciseand accurate results than other methods, providing greaterconfidence in seawater B concentration and B/Cl ratiomeasurements.
We applied the improved analytical protocol (Liu and Lee,2009) to 139 seawater samples collected over a 2-year period(2006–2008) from various depths from the North Atlanticand North Pacific oceans and the East/Japan Sea (Fig. 1).Of the 139 samples, 98 were derived from vertical profiles atfive sites across the three marine basins. Samples from each sitewere approximately evenly spaced over the sampling depth(Table 1). We also collected 41 surface seawater samples inNovember 2008 from across the subtropical North PacificOcean (open circles in Fig. 1). The concentrations of oxygen(lmol kg�1, data not shown) and chl-a (mg m�3) were alsomeasured continuously using an automatic probe (Ocean Se-ven 315 On-Line Module; Idronaut, Italy).
All the seawater samples were stored in sealed B-free poly-ethylene bottles and analyzed in the laboratory within4 months of collection. We found no evidence of contamina-tion during storage (Liu and Lee, 2009). The salinity of theseawater samples was determined using a salinometer (Model8410A, Portasal) with an analytical accuracy of ±0.003 and aprecision of ±0.0003. The corresponding chlorinity valueswere then calculated using the S to Cl ratio of 1.80655 (Coxet al., 1967) and the measured S values. To ensure the preci-sion of our measurements we regularly included a referenceseawater sample in analyses. The reference sample, collectedoff the Scripps Institute of Oceanography, La Jolla (Califor-nia, USA), had certified values of AT and total inorganic car-bon (CT). The measured B concentration in the referencesamples remained constant over the 2-year period of sampleanalyses (Liu and Lee, 2009).
The CO2 data used in our carbonate thermodynamiccalculations (see Section 3.3) were obtained from fieldcampaigns conducted by the National Oceanic and Atmo-spheric Administration/Ocean–Atmosphere Carbon Ex-change Study in the world oceans (Lamb et al., 1992,1997; Castle et al., 1998; Peltola et al., 1998). This CO2
dataset is distinct from others in that it includes values offour CO2 parameters (AT, CT, pH and fugacity of CO2)from throughout the water column. Samples were analyzedfor CT at 20 �C and for AT and pH at 25 �C, with the excep-tion of the North Atlantic Ocean study (designated here asA16), where pH was measured at 20 �C. Detailed proce-
er symbols). Seawater samples from various depths were taken fromOC; 29�100N, 15�300W; cross), the Bermuda Atlantic Time Serieseries Study (HOT; 22�450N, 158�000W, red square), and from two
4�000E; blue and green triangle, respectively). (For interpretation off the article.)

Table 1Mean values for the B to Cl ratio (mg kg�1 &�1) at three Time-series locations (ESTOC, BATS and HOT), two sites in the East/Japan Seaand North Pacific surface water.
Station (sampling date) Location Depth range (m) B/Cl (mg kg�1 &�1) Nf
ESTOCa (Nov 2006) 29�100N, 15�300W 0–3500 0.2416 ± 0.0009 23BATSb (Aug 2006) 31�400N, 64�100W 0–500 0.2411 ± 0.0010 15HOTc (Aug 2008) 22�450N, 158�000W 0–4800 0.2416 ± 0.0009 25East/Japan Sea-1d (May 2007) 41�020N, 132�330E 0–3420 0.2414 ± 0.0010 18East/Japan Sea-2 (May 2007) 41�500N, 134�000E 0–3540 0.2416 ± 0.0010 17Pacific Surface (Nov 2008) 34�N–22�N; 127�W–118�E Surface 0.2412 ± 0.0013 41Mean ± SD – – 0.2414 ± 0.0009 139Uppstrome (Feb and Apr 1973) 20�060N, 165�450W
20�120N, 165�540W18�220N, 141�150W14�500S, 177�230E
150–10001800–440080–40004–1400
0.232 ± 0.005 20
a European Station for Time-series in the Ocean, Canary Islands, in the eastern North Atlantic.b Bermuda Atlantic Time Series Study in the western North Atlantic Ocean.c Hawaiian Ocean-Time Series Study in the North Pacific Ocean.d East/Japan Sea located in the western temperate North Pacific Ocean.e Data taken from the paper by Uppstrom (1974).f Number of samples.
Fig. 2. Vertical distribution of B/Cl ratios (mg kg�1&�1) at five
locations (ESTOC, BATS, HOT, EJS-1, EJS-2). Horizontal blackand red bars indicate the oxygen minimum depth (OMD) at theHOT (red) and ESTOC (black) stations. The dashed line on the leftindicates the B/Cl ratio of Uppstrom (1974), and each of thecolored lines on the right represents a best fit of measurements foreach sampling site.
The ocean B/Cl ratio 1803
dures for analyses of AT, CT and pH are described in Dick-son et al. (2007), and the results of assessment of the inter-nal consistency of these CO2 datasets are reported in Leeet al. (2000). For thermodynamic calculations using thesame datasets we only compared measured AT with AT cal-culated from pH and CT.
3. RESULTS AND DISCUSSION
3.1. The B/Cl ratio at different depths
Our results show that the B concentration co-variedstrongly with Cl (and S) levels at various depths in the watercolumn, regardless of geographic location (Table 1). Onaverage the B/Cl ratio with depth at each of five locationsvaried within ±0.001 mg kg�1 &�1 from the mean ratio(Table 1; Fig. 2); this variability is only twice the analyticalprecision of the B measurement. The tight coupling betweenB and Cl values contrasts with the measurements of Up-pstrom (1974) on 20 samples from various water columndepths (surface to 4400 m) at four tropical Pacific Oceansites, which yielded B/Cl ratios of 0.224–0.243. This vari-ability is an order of magnitude greater than the precisionof 0.9–1.6% reported for B concentration measurement overthe range 0.5–8 mg kg�1 (Uppstrom, 1968). Assuming thatthe marked vertical variability in the B/Cl ratio reportedby Uppstrom (1974) is not an analytical artifact, there mustbe some as-yet undefined process that causes the B/Cl ratioto deviate from a constant value. Several studies indicatedthat the ratio is slightly higher in the oxygen minimum layerthan in waters below or above, possibly because of release ofuncomplexed B during the degradation of a soluble organicborate complex (Igelsrud et al., 1938). Our results do notsupport this nonconservative trend of B concentration inthe oxygen minimum layer (Fig. 2).
Results from the vastly different ocean regimes of theNorth Atlantic and North Pacific oceans and East/JapanSea, consistently point to a B/Cl ratio of 0.2415
mg kg�1 &�1, and it is notable that all measurements fallwithin ±0.001 of this ratio (Appendix A). The mean ratiofor each of the five locations is also indistinguishable (Table1), varying by less than ±0.001. This represents the typicalmagnitude of vertical variability at each location.
3.2. The B/Cl ratio in the upper ocean
Past measurements of the B/Cl ratio in seawater fromvarious upper ocean environments have yielded values
1804 K. Lee et al. / Geochimica et Cosmochimica Acta 74 (2010) 1801–1811
ranging from 0.222 to 0.255 (e.g. see Culkin, 1965). Suchlarge geographic variability in the B/Cl ratio suggests corre-sponding variability in contributions from atmosphericdeposition, river discharges, and incorporation into bio-genic carbonate minerals and soft tissues (e.g. see Parkand Schlesinger, 2002). Part of the variability in the B/Clratio may be because of differences in measurement tech-niques, although this is difficult to establish. However, thevariation in the B/Cl ratio among past studies is in contrastwith the stable ratio observed at the five sampling sites inthe three marine basins found in the present study.
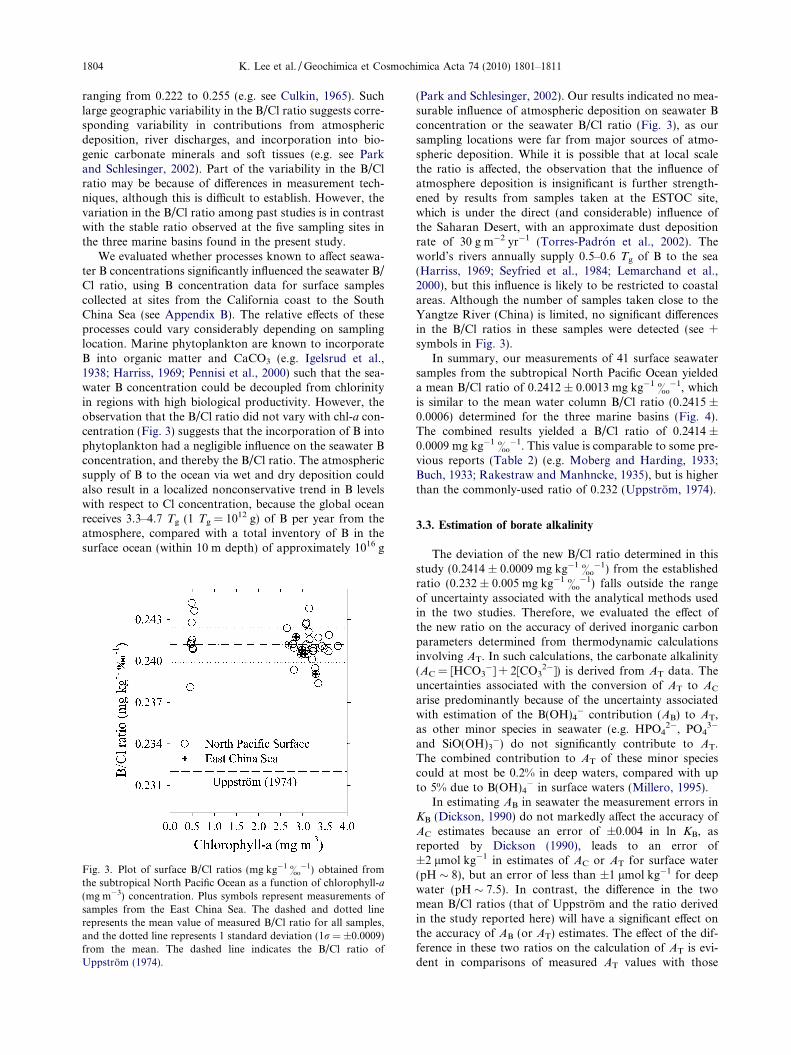
We evaluated whether processes known to affect seawa-ter B concentrations significantly influenced the seawater B/Cl ratio, using B concentration data for surface samplescollected at sites from the California coast to the SouthChina Sea (see Appendix B). The relative effects of theseprocesses could vary considerably depending on samplinglocation. Marine phytoplankton are known to incorporateB into organic matter and CaCO3 (e.g. Igelsrud et al.,1938; Harriss, 1969; Pennisi et al., 2000) such that the sea-water B concentration could be decoupled from chlorinityin regions with high biological productivity. However, theobservation that the B/Cl ratio did not vary with chl-a con-centration (Fig. 3) suggests that the incorporation of B intophytoplankton had a negligible influence on the seawater Bconcentration, and thereby the B/Cl ratio. The atmosphericsupply of B to the ocean via wet and dry deposition couldalso result in a localized nonconservative trend in B levelswith respect to Cl concentration, because the global oceanreceives 3.3–4.7 Tg (1 Tg = 1012 g) of B per year from theatmosphere, compared with a total inventory of B in thesurface ocean (within 10 m depth) of approximately 1016 g
Fig. 3. Plot of surface B/Cl ratios (mg kg�1 &�1) obtained fromthe subtropical North Pacific Ocean as a function of chlorophyll-a(mg m�3) concentration. Plus symbols represent measurements ofsamples from the East China Sea. The dashed and dotted linerepresents the mean value of measured B/Cl ratio for all samples,and the dotted line represents 1 standard deviation (1r = ±0.0009)from the mean. The dashed line indicates the B/Cl ratio ofUppstrom (1974).
(Park and Schlesinger, 2002). Our results indicated no mea-surable influence of atmospheric deposition on seawater Bconcentration or the seawater B/Cl ratio (Fig. 3), as oursampling locations were far from major sources of atmo-spheric deposition. While it is possible that at local scalethe ratio is affected, the observation that the influence ofatmosphere deposition is insignificant is further strength-ened by results from samples taken at the ESTOC site,which is under the direct (and considerable) influence ofthe Saharan Desert, with an approximate dust depositionrate of 30 g m�2 yr�1 (Torres-Padron et al., 2002). Theworld’s rivers annually supply 0.5–0.6 Tg of B to the sea(Harriss, 1969; Seyfried et al., 1984; Lemarchand et al.,2000), but this influence is likely to be restricted to coastalareas. Although the number of samples taken close to theYangtze River (China) is limited, no significant differencesin the B/Cl ratios in these samples were detected (see +symbols in Fig. 3).
In summary, our measurements of 41 surface seawatersamples from the subtropical North Pacific Ocean yieldeda mean B/Cl ratio of 0.2412 ± 0.0013 mg kg�1 &�1, whichis similar to the mean water column B/Cl ratio (0.2415 ±0.0006) determined for the three marine basins (Fig. 4).The combined results yielded a B/Cl ratio of 0.2414 ±0.0009 mg kg�1
&�1. This value is comparable to some pre-
vious reports (Table 2) (e.g. Moberg and Harding, 1933;Buch, 1933; Rakestraw and Manhncke, 1935), but is higherthan the commonly-used ratio of 0.232 (Uppstrom, 1974).
3.3. Estimation of borate alkalinity
The deviation of the new B/Cl ratio determined in thisstudy (0.2414 ± 0.0009 mg kg�1 &�1) from the establishedratio (0.232 ± 0.005 mg kg�1 &�1) falls outside the rangeof uncertainty associated with the analytical methods usedin the two studies. Therefore, we evaluated the effect ofthe new ratio on the accuracy of derived inorganic carbonparameters determined from thermodynamic calculationsinvolving AT. In such calculations, the carbonate alkalinity(AC = [HCO3
�] + 2[CO32�]) is derived from AT data. The
uncertainties associated with the conversion of AT to AC
arise predominantly because of the uncertainty associatedwith estimation of the B(OH)4
� contribution (AB) to AT,as other minor species in seawater (e.g. HPO4
2�, PO43�
and SiO(OH)3�) do not significantly contribute to AT.
The combined contribution to AT of these minor speciescould at most be 0.2% in deep waters, compared with upto 5% due to B(OH)4
� in surface waters (Millero, 1995).In estimating AB in seawater the measurement errors in
KB (Dickson, 1990) do not markedly affect the accuracy ofAC estimates because an error of ±0.004 in ln KB, asreported by Dickson (1990), leads to an error of±2 lmol kg�1 in estimates of AC or AT for surface water(pH � 8), but an error of less than ±1 lmol kg�1 for deepwater (pH � 7.5). In contrast, the difference in the twomean B/Cl ratios (that of Uppstrom and the ratio derivedin the study reported here) will have a significant effect onthe accuracy of AB (or AT) estimates. The effect of the dif-ference in these two ratios on the calculation of AT is evi-dent in comparisons of measured AT values with those
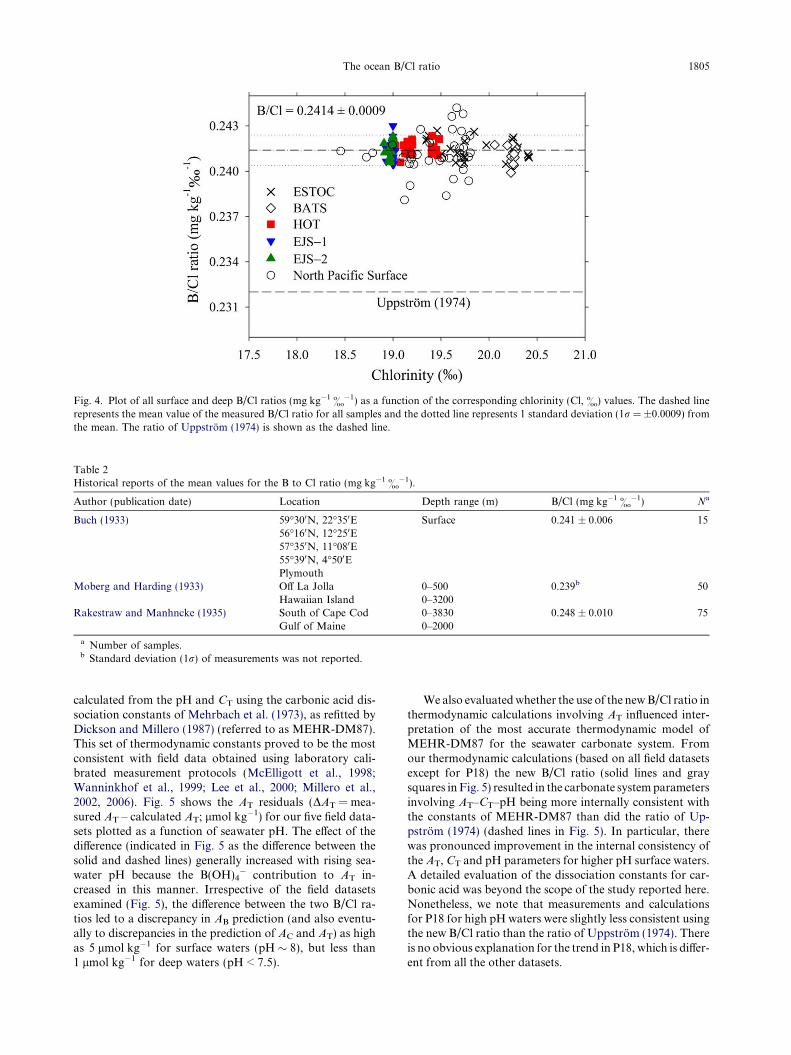
Fig. 4. Plot of all surface and deep B/Cl ratios (mg kg�1 &�1) as a function of the corresponding chlorinity (Cl, &) values. The dashed linerepresents the mean value of the measured B/Cl ratio for all samples and the dotted line represents 1 standard deviation (1r = ±0.0009) fromthe mean. The ratio of Uppstrom (1974) is shown as the dashed line.
Table 2Historical reports of the mean values for the B to Cl ratio (mg kg�1 &�1).
Author (publication date) Location Depth range (m) B/Cl (mg kg�1&�1) Na
Buch (1933) 59�300N, 22�350E56�160N, 12�250E57�350N, 11�080E55�390N, 4�500EPlymouth
Surface 0.241 ± 0.006 15
Moberg and Harding (1933) Off La JollaHawaiian Island
0–5000–3200
0.239b 50
Rakestraw and Manhncke (1935) South of Cape CodGulf of Maine
0–38300–2000
0.248 ± 0.010 75
a Number of samples.b Standard deviation (1r) of measurements was not reported.
The ocean B/Cl ratio 1805
calculated from the pH and CT using the carbonic acid dis-sociation constants of Mehrbach et al. (1973), as refitted byDickson and Millero (1987) (referred to as MEHR-DM87).This set of thermodynamic constants proved to be the mostconsistent with field data obtained using laboratory cali-brated measurement protocols (McElligott et al., 1998;Wanninkhof et al., 1999; Lee et al., 2000; Millero et al.,2002, 2006). Fig. 5 shows the AT residuals (DAT = mea-sured AT – calculated AT; lmol kg�1) for our five field data-sets plotted as a function of seawater pH. The effect of thedifference (indicated in Fig. 5 as the difference between thesolid and dashed lines) generally increased with rising sea-water pH because the B(OH)4
� contribution to AT in-creased in this manner. Irrespective of the field datasetsexamined (Fig. 5), the difference between the two B/Cl ra-tios led to a discrepancy in AB prediction (and also eventu-ally to discrepancies in the prediction of AC and AT) as highas 5 lmol kg�1 for surface waters (pH � 8), but less than1 lmol kg�1 for deep waters (pH < 7.5).
We also evaluated whether the use of the new B/Cl ratio inthermodynamic calculations involving AT influenced inter-pretation of the most accurate thermodynamic model ofMEHR-DM87 for the seawater carbonate system. Fromour thermodynamic calculations (based on all field datasetsexcept for P18) the new B/Cl ratio (solid lines and graysquares in Fig. 5) resulted in the carbonate system parametersinvolving AT–CT–pH being more internally consistent withthe constants of MEHR-DM87 than did the ratio of Up-pstrom (1974) (dashed lines in Fig. 5). In particular, therewas pronounced improvement in the internal consistency ofthe AT, CT and pH parameters for higher pH surface waters.A detailed evaluation of the dissociation constants for car-bonic acid was beyond the scope of the study reported here.Nonetheless, we note that measurements and calculationsfor P18 for high pH waters were slightly less consistent usingthe new B/Cl ratio than the ratio of Uppstrom (1974). Thereis no obvious explanation for the trend in P18, which is differ-ent from all the other datasets.

Fig. 5. Comparison of field measurements (P15, along 170�W and 67�S-Equator; A16, along 20�W and 5�S–63�N; EqPAC, 15�S–10�N and77�W–140�W; P18, along 103�W and 67�S–23�N; I08, along 80�E and 43�S–10�N) of total alkalinity (AT) with those calculated from pH–CT
using the constants of Mehrbach et al. (1973), as refitted by Dickson and Millero (1987). In these calculations AT values were converted fromcarbonate alkalinity using either 0.2414 mg kg�1 &�1 (this study; shown as solid lines and gray squares) or 0.232 mg kg�1 &�1 (Uppstrom,1974; shown as dashed lines) for the B/Cl ratio. The dotted lines indicate zero AT residuals.
1806 K. Lee et al. / Geochimica et Cosmochimica Acta 74 (2010) 1801–1811
One important implication of the use of the ratio of Up-pstrom (1974) in thermodynamic calculations is that, rela-tive to the new B/Cl ratio, it may underestimate surfacepCO2 by several microatmospheres from pairs of carbonsystem parameters involving AT, in which case the CO2 fluxestimates across the air–sea interface would be in error. Aconsistent depiction of carbonate thermodynamic models
and measured carbonate parameters is also central to deter-mining the saturation state of seawater with respect to car-bonate minerals, and the fossil fuel CO2 concentration inthe oceans (Lee et al., 2000).
The importance of accurate seawater B concentrationdata has recently been recognized, as the surface paleo-ocean pH is reconstructed using the B/Ca ratio (e.g. Yu
The ocean B/Cl ratio 1807
et al., 2007; Foster, 2008) in the CaCO3 of foraminifera bur-ied in core-top sediments. In these calculations, the new B/Cl ratio yielded a pH value 0.012 U higher than did the ra-tio of Uppstrom (1974). This systematic error is not insig-nificant, compared with an overall pH uncertainty of0.047 U associated with this method (Yu et al., 2007) andglacial-to-interglacial surface pH variations of 0.15 U.
4. CONCLUSION
Based on an improved measurement protocol, the analysisof B presented here is the most comprehensive to date in sev-eral aspects including 2 years of consistent application andassessment of the analysis protocol, the total number of sam-ples analyzed, and the wide geographic locations from whichsamples were collected. Our results indicated a mean B/Cl ra-tio of 0.2414 ± 0.0009 mg kg�1 &�1, regardless of samplingsite or water depth. The consistency of the ratio indicates thatthe impacts of known processes on the ocean B/Cl ratio (e.g.ocean biology, atmospheric deposition, and river discharges)are not sufficiently significant to modify the ratio.
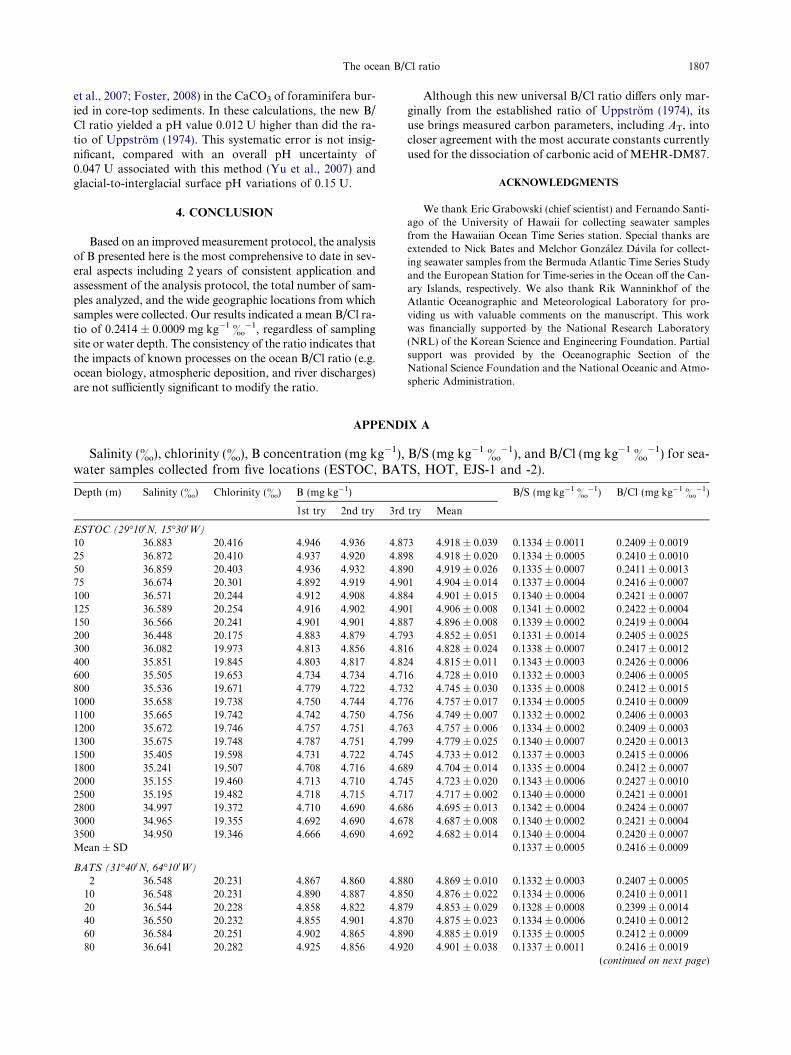
APPEND
Salinity (&), chlorinity (&), B concentration (mg kg�1),water samples collected from five locations (ESTOC, BAT
Depth (m) Salinity (&) Chlorinity (&) B (mg kg�1)
1st try 2nd try 3rd
ESTOC (29�100N, 15�300W)
10 36.883 20.416 4.946 4.936 4.8725 36.872 20.410 4.937 4.920 4.8950 36.859 20.403 4.936 4.932 4.8975 36.674 20.301 4.892 4.919 4.90100 36.571 20.244 4.912 4.908 4.88125 36.589 20.254 4.916 4.902 4.90150 36.566 20.241 4.901 4.901 4.88200 36.448 20.175 4.883 4.879 4.79300 36.082 19.973 4.813 4.856 4.81400 35.851 19.845 4.803 4.817 4.82600 35.505 19.653 4.734 4.734 4.71800 35.536 19.671 4.779 4.722 4.731000 35.658 19.738 4.750 4.744 4.771100 35.665 19.742 4.742 4.750 4.751200 35.672 19.746 4.757 4.751 4.761300 35.675 19.748 4.787 4.751 4.791500 35.405 19.598 4.731 4.722 4.741800 35.241 19.507 4.708 4.716 4.682000 35.155 19.460 4.713 4.710 4.742500 35.195 19.482 4.718 4.715 4.712800 34.997 19.372 4.710 4.690 4.683000 34.965 19.355 4.692 4.690 4.673500 34.950 19.346 4.666 4.690 4.69Mean ± SD
BATS (31�400N, 64�100W)
2 36.548 20.231 4.867 4.860 4.8810 36.548 20.231 4.890 4.887 4.8520 36.544 20.228 4.858 4.822 4.8740 36.550 20.232 4.855 4.901 4.8760 36.584 20.251 4.902 4.865 4.8980 36.641 20.282 4.925 4.856 4.92
Although this new universal B/Cl ratio differs only mar-ginally from the established ratio of Uppstrom (1974), itsuse brings measured carbon parameters, including AT, intocloser agreement with the most accurate constants currentlyused for the dissociation of carbonic acid of MEHR-DM87.
ACKNOWLEDGMENTS
We thank Eric Grabowski (chief scientist) and Fernando Santi-ago of the University of Hawaii for collecting seawater samplesfrom the Hawaiian Ocean Time Series station. Special thanks areextended to Nick Bates and Melchor Gonzalez Davila for collect-ing seawater samples from the Bermuda Atlantic Time Series Studyand the European Station for Time-series in the Ocean off the Can-ary Islands, respectively. We also thank Rik Wanninkhof of theAtlantic Oceanographic and Meteorological Laboratory for pro-viding us with valuable comments on the manuscript. This workwas financially supported by the National Research Laboratory(NRL) of the Korean Science and Engineering Foundation. Partialsupport was provided by the Oceanographic Section of theNational Science Foundation and the National Oceanic and Atmo-spheric Administration.
IX A
B/S (mg kg�1 &�1), and B/Cl (mg kg�1 &�1) for sea-S, HOT, EJS-1 and -2).
B/S (mg kg�1 &�1) B/Cl (mg kg�1 &�1)
try Mean
3 4.918 ± 0.039 0.1334 ± 0.0011 0.2409 ± 0.00198 4.918 ± 0.020 0.1334 ± 0.0005 0.2410 ± 0.00100 4.919 ± 0.026 0.1335 ± 0.0007 0.2411 ± 0.00131 4.904 ± 0.014 0.1337 ± 0.0004 0.2416 ± 0.00074 4.901 ± 0.015 0.1340 ± 0.0004 0.2421 ± 0.00071 4.906 ± 0.008 0.1341 ± 0.0002 0.2422 ± 0.00047 4.896 ± 0.008 0.1339 ± 0.0002 0.2419 ± 0.00043 4.852 ± 0.051 0.1331 ± 0.0014 0.2405 ± 0.00256 4.828 ± 0.024 0.1338 ± 0.0007 0.2417 ± 0.00124 4.815 ± 0.011 0.1343 ± 0.0003 0.2426 ± 0.00066 4.728 ± 0.010 0.1332 ± 0.0003 0.2406 ± 0.00052 4.745 ± 0.030 0.1335 ± 0.0008 0.2412 ± 0.00156 4.757 ± 0.017 0.1334 ± 0.0005 0.2410 ± 0.00096 4.749 ± 0.007 0.1332 ± 0.0002 0.2406 ± 0.00033 4.757 ± 0.006 0.1334 ± 0.0002 0.2409 ± 0.00039 4.779 ± 0.025 0.1340 ± 0.0007 0.2420 ± 0.00135 4.733 ± 0.012 0.1337 ± 0.0003 0.2415 ± 0.00069 4.704 ± 0.014 0.1335 ± 0.0004 0.2412 ± 0.00075 4.723 ± 0.020 0.1343 ± 0.0006 0.2427 ± 0.00107 4.717 ± 0.002 0.1340 ± 0.0000 0.2421 ± 0.00016 4.695 ± 0.013 0.1342 ± 0.0004 0.2424 ± 0.00078 4.687 ± 0.008 0.1340 ± 0.0002 0.2421 ± 0.00042 4.682 ± 0.014 0.1340 ± 0.0004 0.2420 ± 0.0007
0.1337 ± 0.0005 0.2416 ± 0.0009
0 4.869 ± 0.010 0.1332 ± 0.0003 0.2407 ± 0.00050 4.876 ± 0.022 0.1334 ± 0.0006 0.2410 ± 0.00119 4.853 ± 0.029 0.1328 ± 0.0008 0.2399 ± 0.00140 4.875 ± 0.023 0.1334 ± 0.0006 0.2410 ± 0.00120 4.885 ± 0.019 0.1335 ± 0.0005 0.2412 ± 0.00090 4.901 ± 0.038 0.1337 ± 0.0011 0.2416 ± 0.0019
(continued on next page)

Appendix A (continued)
Depth (m) Salinity (&) Chlorinity (&) B (mg kg�1) B/S (mg kg�1 &�1) B/Cl (mg kg�1 &�1)
1st try 2nd try 3rd try Mean
100 36.631 20.277 4.906 4.897 4.892 4.898 ± 0.007 0.1337 ± 0.0002 0.2416 ± 0.0004120 36.622 20.272 4.914 4.878 4.884 4.892 ± 0.020 0.1336 ± 0.0005 0.2413 ± 0.0010140 36.614 20.267 4.900 4.885 4.863 4.883 ± 0.019 0.1334 ± 0.0005 0.2409 ± 0.0009160 36.601 20.260 4.896 4.842 4.874 4.870 ± 0.027 0.1331 ± 0.0007 0.2404 ± 0.0013200 36.602 20.261 4.898 4.884 4.876 4.886 ± 0.011 0.1335 ± 0.0003 0.2411 ± 0.0005250 36.589 20.253 4.883 4.875 4.853 4.870 ± 0.015 0.1331 ± 0.0004 0.2405 ± 0.0008300 36.570 20.243 4.878 4.903 4.902 4.895 ± 0.014 0.1338 ± 0.0004 0.2418 ± 0.0007400 36.476 20.191 4.877 4.856 4.909 4.880 ± 0.027 0.1338 ± 0.0007 0.2417 ± 0.0013500 36.238 20.059 4.831 4.844 4.872 4.849 ± 0.021 0.1338 ± 0.0006 0.2417 ± 0.0010
Mean ± SD 0.1335 ± 0.0006 0.2411 ± 0.0010
HOT (22�450N, 158�000W)
5 35.051 19.402 4.637 4.707 4.693 4.679 ± 0.037 0.1335 ± 0.0011 0.2412 ± 0.001925 35.052 19.403 4.709 4.676 4.678 4.687 ± 0.019 0.1337 ± 0.0005 0.2416 ± 0.001045 35.060 19.407 4.704 4.695 4.710 4.703 ± 0.008 0.1341 ± 0.0002 0.2423 ± 0.000475 35.091 19.424 4.676 4.687 4.716 4.693 ± 0.021 0.1337 ± 0.0006 0.2416 ± 0.0011
100 35.142 19.453 4.682 4.690 4.717 4.696 ± 0.018 0.1336 ± 0.0005 0.2414 ± 0.0009125 35.184 19.476 4.724 4.711 4.713 4.716 ± 0.007 0.1340 ± 0.0002 0.2421 ± 0.0004150 35.192 19.480 4.730 4.704 4.716 4.717 ± 0.013 0.1340 ± 0.0004 0.2421 ± 0.0006175 35.171 19.469 4.670 4.700 4.709 4.693 ± 0.021 0.1334 ± 0.0006 0.2410 ± 0.0011200 35.122 19.441 4.705 4.666 4.697 4.689 ± 0.020 0.1335 ± 0.0006 0.2412 ± 0.0010500 34.370 19.025 4.600 4.570 4.619 4.596 ± 0.025 0.1337 ± 0.0007 0.2416 ± 0.0013700 34.369 19.025 4.614 4.581 4.600 4.598 ± 0.016 0.1338 ± 0.0005 0.2417 ± 0.0009
1000 34.467 19.079 4.563 4.603 4.605 4.590 ± 0.023 0.1332 ± 0.0007 0.2406 ± 0.00121200 34.522 19.109 4.630 4.599 4.628 4.619 ± 0.017 0.1338 ± 0.0005 0.2417 ± 0.00091400 34.551 19.125 4.589 4.623 4.628 4.613 ± 0.021 0.1335 ± 0.0006 0.2412 ± 0.00111600 34.571 19.136 4.627 4.618 4.633 4.626 ± 0.008 0.1338 ± 0.0002 0.2417 ± 0.00041800 34.594 19.149 4.618 4.624 4.659 4.634 ± 0.022 0.1339 ± 0.0006 0.2420 ± 0.00112000 34.609 19.158 4.619 4.604 4.636 4.620 ± 0.016 0.1335 ± 0.0005 0.2411 ± 0.00092200 34.622 19.165 4.610 4.634 4.645 4.630 ± 0.018 0.1337 ± 0.0005 0.2416 ± 0.00092600 34.653 19.182 4.624 4.640 4.621 4.628 ± 0.010 0.1336 ± 0.0003 0.2413 ± 0.00053000 34.666 19.189 4.594 4.647 4.641 4.627 ± 0.029 0.1335 ± 0.0008 0.2411 ± 0.00153400 34.673 19.193 4.646 4.591 4.646 4.628 ± 0.032 0.1335 ± 0.0009 0.2411 ± 0.00173800 34.691 19.203 4.634 4.651 4.642 4.642 ± 0.009 0.1338 ± 0.0002 0.2418 ± 0.00054200 34.689 19.202 4.653 4.644 4.644 4.647 ± 0.006 0.1340 ± 0.0002 0.2420 ± 0.00034500 34.683 19.198 4.650 4.636 4.659 4.648 ± 0.012 0.1340 ± 0.0003 0.2421 ± 0.00064800 34.682 19.198 4.663 4.630 4.634 4.642 ± 0.018 0.1339 ± 0.0005 0.2418 ± 0.0009Mean ± SD 0.1337 ± 0.0005 0.2416 ± 0.0009
EJS-1 (41�020N, 132�330E)
2 34.191 18.926 4.552 4.569 4.593 4.571 ± 0.021 0.1337 ± 0.0006 0.2415 ± 0.001110 34.221 18.943 4.586 4.556 4.573 4.572 ± 0.015 0.1336 ± 0.0004 0.2413 ± 0.000820 34.196 18.929 4.530 4.581 4.555 4.556 ± 0.025 0.1332 ± 0.0007 0.2407 ± 0.001330 34.243 18.955 4.590 4.580 4.576 4.582 ± 0.007 0.1338 ± 0.0002 0.2417 ± 0.000450 34.287 18.979 4.582 4.599 4.579 4.586 ± 0.011 0.1338 ± 0.0003 0.2416 ± 0.000675 34.307 18.990 4.584 4.601 4.596 4.594 ± 0.009 0.1339 ± 0.0003 0.2419 ± 0.0005
100 34.333 19.005 4.587 4.551 4.571 4.569 ± 0.018 0.1331 ± 0.0005 0.2404 ± 0.0010150 34.363 19.021 4.609 4.597 4.567 4.591 ± 0.022 0.1336 ± 0.0006 0.2414 ± 0.0011200 34.317 18.996 4.582 4.531 4.591 4.568 ± 0.033 0.1331 ± 0.0010 0.2405 ± 0.0017300 34.325 19.000 4.572 4.556 4.583 4.570 ± 0.014 0.1331 ± 0.0004 0.2405 ± 0.0007500 34.324 19.000 4.597 4.576 4.678 4.617 ± 0.053 0.1345 ± 0.0016 0.2430 ± 0.0028750 34.326 19.001 4.600 4.612 4.578 4.597 ± 0.017 0.1339 ± 0.0005 0.2419 ± 0.0009
1000 34.327 19.001 4.578 4.568 4.577 4.574 ± 0.006 0.1333 ± 0.0002 0.2407 ± 0.00031500 34.320 18.998 4.570 4.610 4.630 4.603 ± 0.031 0.1341 ± 0.0009 0.2423 ± 0.00162000 34.324 19.000 4.588 4.567 4.611 4.589 ± 0.022 0.1337 ± 0.0006 0.2415 ± 0.00122500 34.325 19.000 4.572 4.589 4.589 4.583 ± 0.010 0.1335 ± 0.0003 0.2412 ± 0.00053000 34.329 19.003 4.599 4.582 4.604 4.595 ± 0.012 0.1338 ± 0.0003 0.2418 ± 0.00063419 34.329 19.003 4.594 4.581 4.560 4.578 ± 0.017 0.1334 ± 0.0005 0.2409 ± 0.0009Mean ± SD 0.1336 ± 0.0006 0.2414 ± 0.0010
EJS-2 (41�500N, 134�000E)
3.5 34.156 18.907 4.564 4.572 4.582 4.573 ± 0.009 0.1339 ± 0.0003 0.2419 ± 0.000510 34.167 18.913 4.544 4.534 4.609 4.562 ± 0.041 0.1335 ± 0.0012 0.2412 ± 0.0022
1808 K. Lee et al. / Geochimica et Cosmochimica Acta 74 (2010) 1801–1811
Appendix A (continued)
Depth (m) Salinity (&) Chlorinity (&) B (mg kg�1) B/S (mg kg�1 &�1) B/Cl (mg kg�1 &�1)
1st try 2nd try 3rd try Mean
20 34.226 18.946 4.577 4.562 4.577 4.572 ± 0.009 0.1336 ± 0.0003 0.2413 ± 0.000530 34.244 18.955 4.566 4.566 4.553 4.562 ± 0.007 0.1332 ± 0.0002 0.2407 ± 0.000451 34.269 18.969 4.558 4.543 4.589 4.564 ± 0.023 0.1332 ± 0.0007 0.2406 ± 0.001276 34.271 18.970 4.590 4.536 4.574 4.567 ± 0.028 0.1332 ± 0.0008 0.2407 ± 0.0015100 34.273 18.972 4.553 4.597 4.564 4.571 ± 0.023 0.1334 ± 0.0007 0.2409 ± 0.0012200 34.294 18.983 4.583 4.596 4.563 4.580 ± 0.017 0.1336 ± 0.0005 0.2413 ± 0.0009300 34.309 18.991 4.572 4.590 4.613 4.592 ± 0.021 0.1338 ± 0.0006 0.2418 ± 0.0011500 34.324 19.000 4.606 4.594 4.608 4.603 ± 0.008 0.1341 ± 0.0002 0.2422 ± 0.0004750 34.327 19.001 4.593 4.604 4.595 4.597 ± 0.006 0.1339 ± 0.0002 0.2419 ± 0.00031000 34.325 19.000 4.604 4.611 4.589 4.601 ± 0.011 0.1340 ± 0.0003 0.2422 ± 0.00061500 34.323 18.999 4.635 4.600 4.577 4.604 ± 0.029 0.1341 ± 0.0008 0.2423 ± 0.00152000 34.323 18.999 4.615 4.605 4.572 4.597 ± 0.023 0.1339 ± 0.0007 0.2420 ± 0.00122500 34.323 18.999 4.628 4.590 4.591 4.603 ± 0.022 0.1341 ± 0.0006 0.2423 ± 0.00113000 34.323 18.999 4.606 4.605 4.590 4.600 ± 0.009 0.1340 ± 0.0003 0.2421 ± 0.00053538 34.323 18.999 4.607 4.579 4.623 4.603 ± 0.022 0.1341 ± 0.0006 0.2423 ± 0.0012Mean ± SD 0.1338 ± 0.0005 0.2416 ± 0.0010
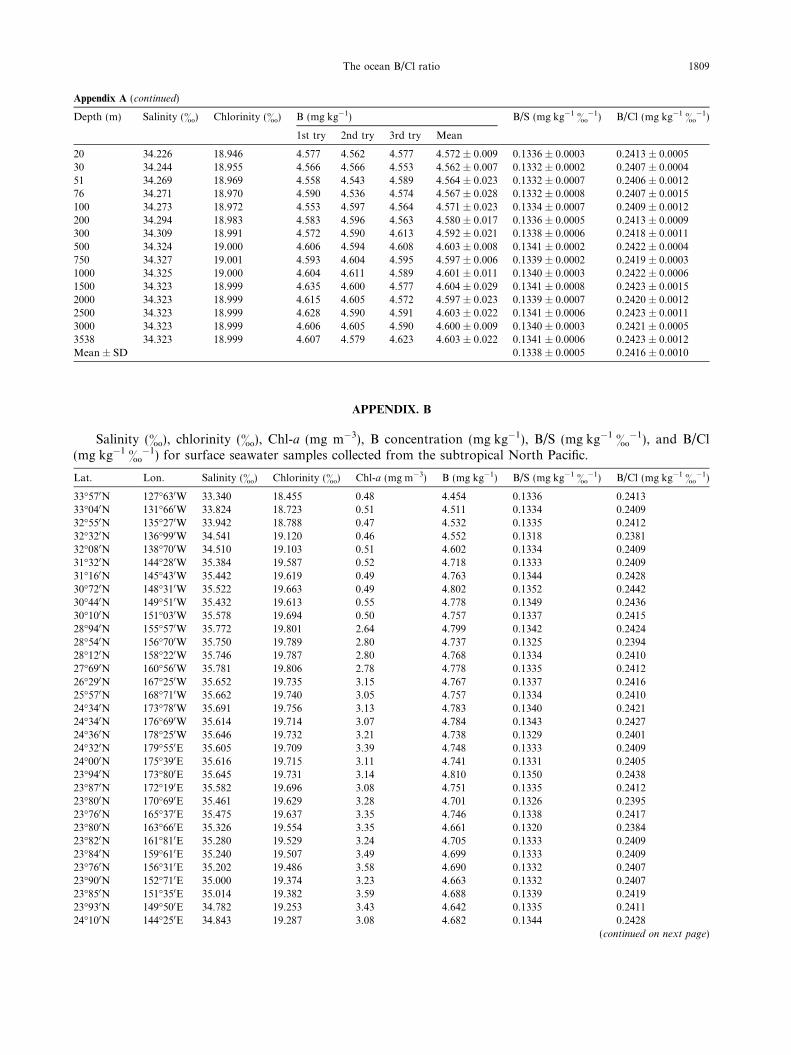
APPENDIX. B
Salinity (&), chlorinity (&), Chl-a (mg m�3), B concentration (mg kg�1), B/S (mg kg�1 &�1), and B/Cl(mg kg�1
&�1) for surface seawater samples collected from the subtropical North Pacific.
Lat. Lon. Salinity (&) Chlorinity (&) Chl-a (mg m�3) B (mg kg�1) B/S (mg kg�1 &�1) B/Cl (mg kg�1 &�1)
33�570N 127�630W 33.340 18.455 0.48 4.454 0.1336 0.241333�040N 131�660W 33.824 18.723 0.51 4.511 0.1334 0.240932�550N 135�270W 33.942 18.788 0.47 4.532 0.1335 0.241232�320N 136�990W 34.541 19.120 0.46 4.552 0.1318 0.238132�080N 138�700W 34.510 19.103 0.51 4.602 0.1334 0.240931�320N 144�280W 35.384 19.587 0.52 4.718 0.1333 0.240931�160N 145�430W 35.442 19.619 0.49 4.763 0.1344 0.242830�720N 148�310W 35.522 19.663 0.49 4.802 0.1352 0.244230�440N 149�510W 35.432 19.613 0.55 4.778 0.1349 0.243630�100N 151�030W 35.578 19.694 0.50 4.757 0.1337 0.241528�940N 155�570W 35.772 19.801 2.64 4.799 0.1342 0.242428�540N 156�700W 35.750 19.789 2.80 4.737 0.1325 0.239428�120N 158�220W 35.746 19.787 2.80 4.768 0.1334 0.241027�690N 160�560W 35.781 19.806 2.78 4.778 0.1335 0.241226�290N 167�250W 35.652 19.735 3.15 4.767 0.1337 0.241625�570N 168�710W 35.662 19.740 3.05 4.757 0.1334 0.241024�340N 173�780W 35.691 19.756 3.13 4.783 0.1340 0.242124�340N 176�690W 35.614 19.714 3.07 4.784 0.1343 0.242724�360N 178�250W 35.646 19.732 3.21 4.738 0.1329 0.240124�320N 179�550E 35.605 19.709 3.39 4.748 0.1333 0.240924�000N 175�390E 35.616 19.715 3.11 4.741 0.1331 0.240523�940N 173�800E 35.645 19.731 3.14 4.810 0.1350 0.243823�870N 172�190E 35.582 19.696 3.08 4.751 0.1335 0.241223�800N 170�690E 35.461 19.629 3.28 4.701 0.1326 0.239523�760N 165�370E 35.475 19.637 3.35 4.746 0.1338 0.241723�800N 163�660E 35.326 19.554 3.35 4.661 0.1320 0.238423�820N 161�810E 35.280 19.529 3.24 4.705 0.1333 0.240923�840N 159�610E 35.240 19.507 3.49 4.699 0.1333 0.240923�760N 156�310E 35.202 19.486 3.58 4.690 0.1332 0.240723�900N 152�710E 35.000 19.374 3.23 4.663 0.1332 0.240723�850N 151�350E 35.014 19.382 3.59 4.688 0.1339 0.241923�930N 149�500E 34.782 19.253 3.43 4.642 0.1335 0.241124�100N 144�250E 34.843 19.287 3.08 4.682 0.1344 0.2428
(continued on next page)
The ocean B/Cl ratio 1809
Appendix B (continued)
Lat. Lon. Salinity (&) Chlorinity (&) Chl-a (mg m�3) B (mg kg�1) B/S (mg kg�1 &�1) B/Cl (mg kg�1 &�1)
23�990N 142�430E 34.684 19.199 3.79 4.629 0.1334 0.241123�550N 134�550E 34.670 19.191 2.68 4.629 0.1335 0.241223�370N 132�750E 34.717 19.217 2.96 4.621 0.1331 0.240523�100N 130�230E 34.633 19.171 3.06 4.610 0.1331 0.240522�180N 123�720E 34.670 19.191 2.98 4.621 0.1333 0.240821�970N 122�440E 34.646 19.178 3.29 4.584 0.1323 0.239022�730N 119�940E 34.314 18.994 2.85 4.592 0.1338 0.241723�790N 118�120E 29.241 16.186 – 3.919 0.1340 0.2421Mean ± SD 0.1335 ± 0.0007 0.2412 ± 0.0013
1810 K. Lee et al. / Geochimica et Cosmochimica Acta 74 (2010) 1801–1811
REFERENCES
Buch K. (1933) On boric acid in the sea and its influence on thecarbonic acid equilibrium. J. Cons. Int. Explor. Mer. 8, 309–325.
Castle R. D., Wanninkhof R. H., Bullister J. L., Doney S. C.,Feely R. A., Huss B. E., Johns E., Millero F. J., Lee K.,Frazel D., Wisegarver D., Greeley D., Menzia F., LambM., Berberian G. and Moore L. D. (1998) Chemical andhydrographic profiles and underway measurements from theNorth Atlantic during July and August of 1993. 82 pp.NOAA data report ERL AOML-32 (NTIS: PB98-131865).NOAA/AOML, Miami, FL.
Cox R. A., Culkin F. and Riley J. P. (1967) The electricalconductivity/chlorinity relationship in natural sea water. Deep-
Sea Res. I 14, 203–220.
Culkin F. (1965) The major constituents of seawater. In Chemical
Oceanography (eds. J. P. Riley and G. Skirrow). Academic
Press, New York, pp. 121–161.
Dickson A. G. (1981) An exact definition of total alkalinity and aprocedure for the estimation of alkalinity and total inorganiccarbon from titration data. Deep-Sea Res. I 28, 609–623.
Dickson A. G. (1990) Thermodynamics of the dissociation of boricacid in synthetic seawater from 273.15 to 318.15 K. Deep-Sea
Res. I 37, 755–766.
Dickson A. G. (1992) The development of the alkalinity concept inmarine chemistry. Mar. Chem. 40, 49–63.
Dickson A. G. and Millero F. J. (1987) A comparison of theequilibrium constants for the dissociation of carbon acid inseawater media. Deep-Sea Res. I 34, 1733–1743.
Dickson A. G., Sabine C. L. and Christian J. R. (Eds.) (2007)Guide to Best Practices for Ocean CO2 Measurements. NorthPacific Marine Science Organization, Sidney, British Columbia.191 pp.
Foster G. L. (2008) Seawater pH, pCO2 and [CO32�] variations in
the Caribbean Sea over the last 130 kyr: a boron isotope and B/Ca study of plankton foraminifera. Earth Planet. Sci. Lett. 271,
254–266.
Harriss R. C. (1969) Boron regulation in the oceans. Nature 223,
290–291.
Holmen K. (2000) The global carbon cycle. In Earth System
Science from Biogeochemical Cycles to Global Changes (eds. M.C. Jacobson, R. J. Charlson, H. Rodhe and G. H. Orians).Academic Press, San Diego, Calif., pp. 282–321.
Igelsrud I., Thompson T. G. and Zwichker B. M. (1938) The boroncontent of sea water and of marine organisms. Am. J. Sci. 35,
47–63.
Kim H.-C. and Lee K. (2009) Significant contribution of dissolvedorganic matter to seawater alkalinity. Geophys. Res. Lett. 36,
L20603. doi:10.1029/2009GL040271.
Lamb M. F., Feely R. A., Lantry T. and Wanninkhof R. (1992)The NOAA Spring Equatorial Pacific expedition: total carbonmeasurements by coulometry; preliminary results. EOS 73, 287.
Lamb M. F., Bullister J. F., Feely R. A., Johnson G. C.,Wisegarver D. P., Taft B., Wanninkhof R., McTaggart K. E.,Krogslund K. A., Mordy C. W., Hargreaves K., Greeley D.,Lantry T., Chen H., Huss B. E., Millero F. J., Byrne R. H.,Hansell D. A., Chavez F. P., Quay P. D., Guenther P. R.,Zhang J. -Z., Gardner G. W., Richardson M. J. and Peng T. -H. (1997) Chemical and hydrograph measurements in theeastern Pacific during the CGC94 expedition (WOCE sectionP18). 235 pp. NOAA Data Report ERL PMEL-61a (NTIS:PB97-158075). NOAA/PMEL, Seattle, WA.
Lee K., Millero F. J., Byrne R. H., Feely R. A. and Wanninkhof R.(2000) The recommended dissociation constants for carbonicacid in seawater. Geophys. Res. Lett. 27, 229–232.
Lemarchand D., Gaillardet J., Lewin E. and Allegre C. J. (2000)The influence of rivers on marine boron isotopes and implica-tions for reconstructing past ocean pH. Nature 408, 951–954.
Liu Y. M. and Lee K. (2009) Modifications of the curcuminmethod enabling precise and accurate measurement of seawaterboron concentration. Mar. Chem. 115, 110–117.
McElligott S., Byrne R. H., Lee K., Wannikhof R., Millero F. J.and Feely R. A. (1998) Discrete water column measurements ofCO2 fugacity and pHt in seawater: a comparison of directmeasurements and thermodynamic calculations. Mar. Chem.
60, 63–73.
Mehrbach C., Culberson C. H., Hawley J. E. and Pytkowicz R. M.(1973) Measurement of the apparent dissociation constants ofcarbonic acid in seawater at atmospheric pressure. Limnol.
Oceanogr. 18, 897–907.
Millero F. J. (1995) Thermodynamics of the carbon dioxide systemin the oceans. Geochim. Cosmochim. Acta 59, 661–677.
Millero F. J., Pierrot D., Lee K., Wanninkhof R., Feely R. A.,Sabine C. L. and Key R. M. (2002) Dissociation constants forcarbonic acid determined from field measurements. Deep-Sea
Res. I 49, 1705–1723.
Millero F. J., Graham T., Huang F., Bustos H. and Pierrot D.(2006) Dissociation constants for carbonic acid in seawater as afunction of temperature and salinity. Mar. Chem. 100, 80–94.
Moberg E. G. and Harding M. W. (1933) The boron content of seawater. Science 77, 510.
Park H. and Schlesinger W. H. (2002) Global biogeochemical cycleof boron. Global Biogeochem. Cycles 16, 1072. doi:10.1029/
2001GB001766.
Peltola E., Wanninkhof R., Molinari R., Huss B. E., Feely R. A.,Bullister J., Zhang J.-Z, Chavez F., Dickson A., Ffield A.,Hansell D., Millero F., Quay P., Castle R., Thomas G., RoddyR., Landry T., Roberts M., Chen H., Greeley D., Lee K.,Roche M., Goen J. A., Millero F., Buck K., Kelly M., MenziaF., Huston A., Waterhouse T., Becker S. and Mordy C. (1998)Chemical and hydrographic measurements during the IndianOcean I8 repeat cruise (IR8N) in September and October 1995.176 pp. NOAA Data Report ERL AOML-34 (NTIS: PB99-126948). NOAA/AOML, Miami, FL.

The ocean B/Cl ratio 1811
Pennisi M., Leeman W. P., Tonarini S., Pennisi A. and Nabelek P.(2000) Boron, Sr, O, and H isotope geochemistry of ground-waters from Mt. Etna (Sicily)-hydrologic implications. Geo-
chim. Cosmochim. Acta 64, 961–974.
Rakestraw N. W. and Manhncke H. E. (1935) Boron content of seawater of the North Atlantic coast. Ind. Eng. Chem. Anal. Ed. 7,
425.
Roy R. N., Roy L. N., Lawson M., Vogel K. M., Moore C. P.,Davis W. and Millero F. J. (1993) Thermodynamics of thedissociation of boric acid in seawater at S = 35 from 0 to 55 �C.Mar. Chem. 44, 243–248.
Seyfried W. E., Janecky D. R. and Mottl M. J. (1984) Alteration ofthe oceanic crust: implications for geochemical cycles of lithiumand boron. Geochim. Cosmochim. Acta 48, 557–569.
Torres-Padron M. E., Gelado-Caballero M. D., Collado-SanchezC., Siruela-Matos V. F., Cardona-Castellano P. J. and Her-nandez-Brito J. J. (2002) Variability of dust inputs to theCANIGO zone. Deep-Sea Res. II 49, 3455–3465.
Uppstrom L. R. (1968) A modified method for determination ofboron with curcumin and a simplified water eliminationprocedure. Anal. Chim. Acta 43, 475–486.
Uppstrom L. R. (1974) The boron/chlorinity ratio of deep-seawater from the Pacific Ocean. Deep-Sea Res. I 21, 161–162.
Wanninkhof R., Lewis E., Feely R. A. and Millero F. J. (1999) Theoptimal carbonate dissociation constants for determining sur-face water pCO2 from alkalinity and total inorganic carbon.Mar. Chem. 65, 291–301.
Wolf-Gladrow D. A., Zeebe R. E., Klaas C., Kortzinger A. andDickson A. G. (2007) Total alkalinity: the explicit conservativeexpression and its application to biogeochemical processes.Mar. Chem. 106, 287–300.
Yu J., Elderfield H. and Hoenisch B. (2007) B/Ca in planktonicforaminifera as a proxy for surface seawater pH. Paleoceanog-
raphy 22, PA2.
Associate editor: David J. Burdige