Expansion of subarctic water masses in the North Atlantic and Pacific oceans and implications for...
12
Expansion of subarctic water masses in the North Atlantic and Pacific oceans and implications for mid-Pleistocene ice sheet growth Erin L. McClymont, 1,2 Antoni Rosell-Mele ´, 3,4 Gerald H. Haug, 5 and Jerry M. Lloyd 1 Received 11 March 2008; revised 9 September 2008; accepted 13 October 2008; published 17 December 2008. [1] Past surface ocean circulation changes associated with the mid-Pleistocene transition, 0.9–0.6 Ma, were reconstructed in the northern North Atlantic (ODP 983) and the northwest Pacific (ODP 882), using proxies for subarctic/subpolar water mass distributions (%C 37:4 alkenone) and sea surface temperature (U 37 K ). Both sites experienced a secular expansion of subarctic waters from 1.15 Ma, spanning both glacial and interglacial intervals. After 0.9 Ma, low %C 37:4 at Site 983 records a northward retreat of subarctic waters during interglacials in the Atlantic, while continued high glacial %C 37:4 indicate extensive subarctic waters during glacial maxima associated with the development of the larger late Pleistocene ice sheets. In contrast, a secular decline in %C 37:4 occurred at Site 882 from 0.9 to 0.5 Ma, marking a more gradual retreat of subarctic conditions in the Pacific. It is proposed that the expansion of subarctic waters between 1.15 and 0.9 Ma exerted negative feedbacks to the moisture supply to the ice sheet source regions and may account for the apparent delayed ice sheet response to atmosphere-ocean circulation changes associated with the mid-Pleistocene transition that began as early as 1.2 Ma. Citation: McClymont, E. L., A. Rosell-Mele ´, G. H. Haug, and J. M. Lloyd (2008), Expansion of subarctic water masses in the North Atlantic and Pacific oceans and implications for mid-Pleistocene ice sheet growth, Paleoceanography , 23, PA4214, doi:10.1029/2008PA001622. 1. Introduction [2] The early to middle Pleistocene was marked by a series of climatic, environmental and faunal changes that resulted in a major transition for the global climate system and the evolution of many modern biotic assemblages [Head and Gibbard, 2005]. A shift toward a cooler climate, and the development of larger Northern Hemisphere ice sheets at 0.9 Ma, was accompanied by an increase in the duration and intensity of the glacial cycles from 41 ka to 100 ka by 0.6 Ma: the ‘‘mid-Pleistocene climate transition’’ or MPT [Imbrie et al., 1993; Mudelsee and Schulz, 1997]. In the tropics and subtropics, the MPT was marked by intensification of the Trade winds [Durham et al., 2001; Liu and Herbert, 2004; Marlow et al., 2000], Walker circulation [McClymont and Rosell-Mele ´ , 2005; Medina-Elizalde and Lea, 2005], Asian monsoon [Heslop et al., 2002; Xiao and An, 1999], and increasing continental aridity [de Menocal, 1995; Schefuß et al., 2003]. The high latitudes also under- went transformations during the MPT, as indicated by changes in ice sheet size [Clark and Pollard, 1998], the thermohaline circulation [Oppo et al., 1995; Raymo et al., 1990; Schmieder et al., 2000], and variations to the position of the frontal systems associated with the Antarctic Circum- polar Current [Becquey and Gersonde, 2002; Diekmann and Kuhn, 2002; McClymont et al., 2005]. The early and middle Pleistocene is also a key interval for biotic change, with faunal turnovers, extinctions and migrations found in both marine and terrestrial archives [e.g., Azzaroli, 1995; de Menocal, 2004; Head and Gibbard, 2005; Kawagata et al., 2005; O’Neill et al., 2007; Opdyke, 1995; Sikes, 1999], that may be linked to the climate events of the MPT. [3] The drivers of the MPT are still undetermined. The transition has been attributed to an apparent change in the sensitivity of global climate to eccentricity forcing and/or the development of an internal regulatory mechanism at the 100 ka frequency. The greater inertia of larger Northern Hemisphere ice sheets after 0.9 Ma has been proposed to account for the longer and asymmetric glacial-interglacial (G-IG) cycles [e.g., Berger and Jansen, 1994; Clark and Pollard, 1998; Imbrie et al., 1993; Mudelsee and Schulz, 1997]. However, before any apparent variation in the volume of the Northern Hemisphere ice sheets, a shift from 41 ka to 100 ka periodicity was apparent in the variability of some climate system components. For instance, an ‘‘early’’ emergence of the 100 ka period has been identified in a planktonic d 18 O record from the West Pacific Warm Pool from 1.2 Ma [Berger et al., 1993]. This occurred at the same time that a ‘‘premature’’ 100 ka cycle in benthic d 18 O and thermohaline circulation strength was recorded in the South Atlantic [Schmieder et al., 2000]. [4] Ice sheet growth depends upon factors that determine the balance between accumulation and ablation. Although temperature is an important influence, there must also be PALEOCEANOGRAPHY, VOL. 23, PA4214, doi:10.1029/2008PA001622, 2008 Click Here for Full Articl e 1 Department of Geography, University of Durham, Durham, UK. 2 Now at School of Geography, Politics, and Sociology, Newcastle University, Newcastle upon Tyne, UK. 3 Institucio ´ Catalana de Recerca i Estudis Avanc ¸ats, Barcelona, Catalonia, Spain. 4 Institut de Cie `ncia i Tecnologia Ambientals, Universitat Auto `noma de Barcelona, Bellaterra, Catalonia, Spain. 5 Geological Institute, Department of Earth Sciences, ETH Zu ¨rich, Zu ¨rich, Switzerland. Copyright 2008 by the American Geophysical Union. 0883-8305/08/2008PA001622$12.00 PA4214 1 of 12
Transcript of Expansion of subarctic water masses in the North Atlantic and Pacific oceans and implications for...

Expansion of subarctic water masses in the North Atlantic and
Pacific oceans and implications for mid-Pleistocene ice sheet growth
Erin L. McClymont,1,2 Antoni Rosell-Mele,3,4 Gerald H. Haug,5 and Jerry M. Lloyd1
Received 11 March 2008; revised 9 September 2008; accepted 13 October 2008; published 17 December 2008.
[1] Past surface ocean circulation changes associated with the mid-Pleistocene transition, 0.9–0.6 Ma, werereconstructed in the northern North Atlantic (ODP 983) and the northwest Pacific (ODP 882), using proxies forsubarctic/subpolar water mass distributions (%C37:4 alkenone) and sea surface temperature (U37
K ). Both sitesexperienced a secular expansion of subarctic waters from �1.15 Ma, spanning both glacial and interglacialintervals. After 0.9 Ma, low %C37:4 at Site 983 records a northward retreat of subarctic waters duringinterglacials in the Atlantic, while continued high glacial %C37:4 indicate extensive subarctic waters duringglacial maxima associated with the development of the larger late Pleistocene ice sheets. In contrast, a seculardecline in %C37:4 occurred at Site 882 from 0.9 to 0.5 Ma, marking a more gradual retreat of subarcticconditions in the Pacific. It is proposed that the expansion of subarctic waters between 1.15 and 0.9 Ma exertednegative feedbacks to the moisture supply to the ice sheet source regions and may account for the apparentdelayed ice sheet response to atmosphere-ocean circulation changes associated with the mid-Pleistocenetransition that began as early as 1.2 Ma.
Citation: McClymont, E. L., A. Rosell-Mele, G. H. Haug, and J. M. Lloyd (2008), Expansion of subarctic water masses in
the North Atlantic and Pacific oceans and implications for mid-Pleistocene ice sheet growth, Paleoceanography, 23, PA4214,
doi:10.1029/2008PA001622.
1. Introduction
[2] The early to middle Pleistocene was marked by aseries of climatic, environmental and faunal changes thatresulted in a major transition for the global climate systemand the evolution of many modern biotic assemblages[Head and Gibbard, 2005]. A shift toward a cooler climate,and the development of larger Northern Hemisphere icesheets at �0.9 Ma, was accompanied by an increase in theduration and intensity of the glacial cycles from 41 ka to100 ka by 0.6 Ma: the ‘‘mid-Pleistocene climate transition’’or MPT [Imbrie et al., 1993; Mudelsee and Schulz, 1997].In the tropics and subtropics, the MPT was marked byintensification of the Trade winds [Durham et al., 2001; Liuand Herbert, 2004;Marlow et al., 2000], Walker circulation[McClymont and Rosell-Mele, 2005; Medina-Elizalde andLea, 2005], Asian monsoon [Heslop et al., 2002; Xiao andAn, 1999], and increasing continental aridity [de Menocal,1995; Schefuß et al., 2003]. The high latitudes also under-went transformations during the MPT, as indicated bychanges in ice sheet size [Clark and Pollard, 1998], thethermohaline circulation [Oppo et al., 1995; Raymo et al.,
1990; Schmieder et al., 2000], and variations to the positionof the frontal systems associated with the Antarctic Circum-polar Current [Becquey and Gersonde, 2002; Diekmann andKuhn, 2002; McClymont et al., 2005]. The early and middlePleistocene is also a key interval for biotic change, withfaunal turnovers, extinctions and migrations found in bothmarine and terrestrial archives [e.g., Azzaroli, 1995; deMenocal, 2004; Head and Gibbard, 2005; Kawagata etal., 2005; O’Neill et al., 2007; Opdyke, 1995; Sikes, 1999],that may be linked to the climate events of the MPT.[3] The drivers of the MPT are still undetermined. The
transition has been attributed to an apparent change in thesensitivity of global climate to eccentricity forcing and/orthe development of an internal regulatory mechanism at the100 ka frequency. The greater inertia of larger NorthernHemisphere ice sheets after 0.9 Ma has been proposed toaccount for the longer and asymmetric glacial-interglacial(G-IG) cycles [e.g., Berger and Jansen, 1994; Clark andPollard, 1998; Imbrie et al., 1993; Mudelsee and Schulz,1997]. However, before any apparent variation in thevolume of the Northern Hemisphere ice sheets, a shift from41 ka to 100 ka periodicity was apparent in the variability ofsome climate system components. For instance, an ‘‘early’’emergence of the 100 ka period has been identified in aplanktonic d18O record from the West Pacific Warm Poolfrom 1.2 Ma [Berger et al., 1993]. This occurred at the sametime that a ‘‘premature’’ 100 ka cycle in benthic d18O andthermohaline circulation strength was recorded in the SouthAtlantic [Schmieder et al., 2000].[4] Ice sheet growth depends upon factors that determine
the balance between accumulation and ablation. Althoughtemperature is an important influence, there must also be
PALEOCEANOGRAPHY, VOL. 23, PA4214, doi:10.1029/2008PA001622, 2008ClickHere
for
FullArticle
1Department of Geography, University of Durham, Durham, UK.2Now at School of Geography, Politics, and Sociology, Newcastle
University, Newcastle upon Tyne, UK.3Institucio Catalana de Recerca i Estudis Avancats, Barcelona,
Catalonia, Spain.4Institut de Ciencia i Tecnologia Ambientals, Universitat Autonoma de
Barcelona, Bellaterra, Catalonia, Spain.5Geological Institute, Department of Earth Sciences, ETH Zurich,
Zurich, Switzerland.
Copyright 2008 by the American Geophysical Union.0883-8305/08/2008PA001622$12.00
PA4214 1 of 12

sufficient precipitation to create a positive mass balance inthe ice sheet source regions. The North Atlantic and PacificOceans are important sources of heat and water vaportransport to Europe and boreal America, i.e., to the NorthernHemisphere ice sheet source regions [Koster et al., 1986].On the basis of the modeling results, it has been proposedthat more extensive sea ice cover during the mid-Pleistocenecould account for the regulation and emergence of the100 ka cycles, described as a ‘‘sea ice switch’’ mechanism[Gildor and Tziperman, 2001; Tziperman and Gildor,2003]. In fact, relatively restricted Atlantic sea ice covermay have been important for maintaining moisture suppliesto the Northern Hemisphere ice sheets during glacial incep-tions [e.g., McManus et al., 2002; Ruddiman and McIntyre,1979; Ruddiman et al., 1980], and the persistence of warmersurface waters into autumn in the North Pacific as a result ofincreased stratification has been linked to the intensification ofNorthern Hemisphere glaciation at 2.7Ma [Haug et al., 2005].[5] Here, we investigate surface ocean circulation in the
northern Atlantic and Pacific Oceans across the MPT. Wepresent results from two Ocean Drilling Program (ODP)sites covering the time interval 1.5–0.5 Ma (Figure 1):North Atlantic Site 983 and northwest Pacific Site 882.Although the Arctic Front that divides Atlantic and Arcticwaters presently lies to the north of Site 983, it is known tohave migrated southward during glacials of the Pleistocenebringing much cooler waters and potentially also sea ice tothe site [e.g., Bard et al., 1987; Rosell-Mele et al., 1998;Wright and Flower, 2002]. In contrast, sea ice does notappear to have reached Site 882 over the Pliocene andPleistocene; rather, glacials are associated with increasingpolar stratification [Haug et al., 2005, 1999; Jaccard et al.,2005]. We monitor the extent of cool and fresh arctic andpolar waters using the concentration of the tetra-unsaturatedalkenone, C37:4 [Bendle and Rosell-Mele, 2004; Bendle etal., 2005; Rosell-Mele, 1998; Rosell-Mele et al., 1994]. Seasurface temperatures (SSTs) are reconstructed using thealkenone-derived U37
K index [Brassell et al., 1986; Mulleret al., 1998; Rosell-Mele et al., 1995b]. Comparison betweenthese results and existing records for global ice volumechange allows us to investigate links between high-latitudesurface ocean circulation and the Northern Hemisphere icesheets across the MPT.
2. Methods
2.1. Site Locations
[6] Site 983C (60�240N, 23�380W) was drilled at a waterdepth of 1985 m on the Bjorn-Gardar Drift in the northernNorth Atlantic as part of ODP Leg 162 [Jansen et al.,1996]. Surface waters at the site are presently influenced byan extension of the North Atlantic Current, the IrmingerCurrent, which flows westward toward East Greenland[Hansen and Østerhus, 2000]. Lying south of the ArcticFront, seasonal SSTs range between 8 and 11�C, around anannual mean value of �9�C [Conkright et al., 2002]. Thesediments have relatively low organic carbon (<0.48%) andcarbonate (<40%) contents, being dominated instead byfine-grained terrigenous particles advected by the overflowof Norwegian Sea Overflow Water (NSOW) across the
Greenland-Scotland Ridge and driving high sedimentationrates (>16 cm ka�1). Variable contributions from icebergrafting also occur [Jansen et al., 1996].[7] Site 882 (50�210N, 167�350E, 3244 m water depth)
was drilled on the Detroit Seamount in the northwest Pacificas part of ODP Leg 145 [Rea et al., 1993]. A continuousrecord spanning the Plio-Pleistocene was obtained by splic-ing Holes 882A and 882B [Tiedemann and Haug, 1995].The site is located to the north of the modern SubarcticFront, that lies between 40 and 50�N [Yuan and Talley,1996], and below the relatively cool southward flowingOyashio Current, that meets the warmer Kuroshio Current at�40�N. A permanent halocline in the region of the sitereduces exchange between the surface and deep ocean[Tabata, 1975], and as a result causes a large annual SSTrange, from 1 to 12�C [Conkright et al., 2002]. Pleistocenesediments from Site 882 are composed of a diatom ooze andclayey diatom ooze [Rea et al., 1993]. Diatom concentra-tions range from 50 to 100%. Carbonate is generally absentalthough in some intervals can represent up to 40 wt. % ofthe sediment [Haug et al., 1995; Rea et al., 1993]. For theinterval of study here, sedimentation rates range from 1.5 to8 cm ka�1 [Tiedemann and Haug, 1995], lower than at Site983 but still suitable for the identification of orbital-scaleoscillations.
2.2. Age Models
[8] A sampling interval of 5 ka was selected at both sites.At Site 983 the benthic d18O stratigraphy was used as theage model [Channell and Kleiven, 2000; Raymo et al.,2004]. Poor preservation of carbonate in many intervalsprevented the application of an isotopic age model toSite 882 [Haug et al., 1995]. Magnetostratigraphy andsubsequent tuning of GRAPE density oscillations to theprecession band of the 65�N summer insolation providedan astronomically calibrated stratigraphy [Rea et al.,1993; Tiedemann and Haug, 1995]. Both age models suf-fered correlation problems between 1.2 and 1.3 Ma, becauseof anomalous magnetic susceptibility values (Site 882[Tiedemann and Haug, 1995]) and poor carbonate preser-vation (Site 983 [Raymo et al., 2004]). We acknowledge thatdifferences in the accuracy and precision between these agemodels limits the detailed comparison of leads and lagsbetween the two sites, i.e., at orbital and shorter timescales.However, the records do allow us to compare and contrastlong-term (>G-IG) trends in surface ocean properties asso-ciated with the MPT.
2.3. Alkenone Analyses
[9] Alkenones were obtained using repeated sonication offreeze-dried and homogenized sediments using dichlorome-thane and methanol (3:1, v/v). All extracts were derivatizedusing bis(trimethylsilyl)triflouroacetamide (Sigma Aldrich)prior to instrumental analysis. Samples from Site 983 werequantified using a Fisons 8000 gas chromatograph fittedwith a flame ionization detector (GC-FID) following theprocedures described in detail by McClymont and Rosell-Mele [2005]. A selection of samples from Site 983 andall of the Site 882 samples were analyzed using gaschromatography-chemical ionization mass spectrometry
PA4214 MCCLYMONT ET AL: MID-PLEISTOCENE POLAR/ARCTIC WATERS
2 of 12
PA4214

(GC-CI-MS), which is more sensitive than GC-FID [Rosell-Mele et al., 1995a].[10] The relative abundance of the C37:4 alkenone is
expressed as a percentage of total C37 alkenones, %C37:4
[Rosell-Mele et al., 2002]. The U37K and U37
K0indices were
calculated according to the relative concentrations of thedi-, tri- and tetra-unsaturated C37 alkenones [Brassell et al.,1986; Prahl and Wakeham, 1987]:
UK37 ¼ C37:2 � C37:4½ �= C37:2 þ C37:3 þ C37:4½ �
UK0
37 ¼ C37:2½ �= C37:2 þ C37:3½ �
[11] SSTs were calculated using the global calibration forU37K
0[Muller et al., 1998] that is calibrated against mean
annual SSTs at the ocean surface, and the North Atlanticcore top calibration for U37
K [Rosell-Mele et al., 1995b]calibrated using summer SSTs.
3. Results and Discussion
3.1. Evaluation of the Alkenone Proxy Records
[12] Modern calibration exercises have demonstrated thathigh %C37:4 values in both particulate organic matter andsurface sediments are associated with low-temperature andlow-salinity surface water masses of the Arctic and PolarWater domains [Bendle and Rosell-Mele, 2004; Bendle etal., 2005; Harada et al., 2006; Sicre et al., 2002]. Thus,%C37:4 in sediments exceeds 5% below Arctic AtlanticWaters (north of the Arctic Front, delineated using the35 p.s.u. isoline), with very high concentrations at over28–30% in Polar Atlantic Waters (north of the Polar Front,34.2 p.s.u. isocline) [Bendle et al., 2005]. However, themultivariate control over %C37:4 by salinity and temperatureprevents the application of %C37:4 to quantify past SSS orSSTs [Bendle et al., 2005]. High concentrations of C37:4 areassociated with the cooler and fresher water masses found inthe Pacific subarctic [Harada et al., 2006]. The correlationbetween %C37:4 and SSS in the Pacific subarctic was strong(R2 = 0.76), although the relationship was insignificant for%C37:4 versus SST (R2 = 0.17; [Bendle et al., 2005; Haradaet al., 2006]). A calibration exercise for %C37:4 comparableto those undertaken in the Atlantic using surface sediments
has not been performed in the northern Pacific; thus, we donot apply the %C37:4 proxy as a method of quantifying pastSSS or SST. At both sites examined here, we apply %C37:4
to reconstruct the past presence of cool and fresh arctic(Atlantic) and subarctic (Pacific) water masses at the sites ofinterest.[13] The MPT is a time of biotic as well as climatic
evolution, and thus it needs to be considered whether long-term trends in the %C37:4 signature reflect evolutionarychange in the alkenone-synthesizing Haptophyte algae ratherthan a biochemical response to surface oceanography. AsEmiliania huxleyi did not evolve until the late Pleistocene[Thierstein et al., 1977], alternative species must be respon-sible for alkenone production at the MPT, and seem likely toinclude members of the Geophyrocapsa genus that followthe modern U37
K0-SST relationship [Marlowe et al., 1990] and
that dominate the mid-Pleistocene sediments from Site 983(E. L. McClymont, unpublished data, 2004). This issue hasbeen tackled before either for the late Pleistocene or theMPT in the southeast Atlantic. In all instances evolutionarychanges in coccolith assemblages had no apparent impactupon the distributions of alkenones, and by inference theresponse of the alkenone indices to SST [McClymont et al.,2005, and references therein]. In their investigation of the%C37:4 proxy, Bendle et al. [2005] argued that E. huxleyiremained the prime candidate for the synthesis of alkenonesand for the %C37:4 response to water mass properties, givenpositive correlations between alkenone concentrations andE. huxleyi abundance, and the fact that the only alternativecalcifying coccolithophore in the region, Coccolithus pela-gicus, does not synthesize alkenones. Thus, the decline ofC. pelagicus between 1.65 and 1.0 Ma at Site 982 [Baumannand Huber, 1999], even if it were replicated at Site 983, couldnot account for any observed %C37:4 trends. Moreover, nosignificant change to total coccolith accumulation ratesacross the MPT were observed at Site 982 [Baumannand Huber, 1999], nor in a low-resolution investigationat Site 983 (E. L. McClymont, unpublished data, 2004).[14] This issue can be investigated further if one applies a
suite of indices recording the relative abundances of the C37
and C38 alkenones at Site 983 following the methodology ofMcClymont et al. [2005]. Unfortunately, C38 alkenoneswere not measured in Site 882 sediments. These indiceshave an empirical basis in the same manner as the U37
K -SST
Figure 1. Location map for Sites 882 (northwest Pacific) and 983 (North Atlantic). Sea surface salinitycontours shown in gray, from Conkright et al. [2002].
PA4214 MCCLYMONT ET AL: MID-PLEISTOCENE POLAR/ARCTIC WATERS
3 of 12
PA4214

relationship [Conte et al., 2001; Prahl et al., 1988; Rosell-Mele et al., 1995b], and are thought to reflect the provenanceof the alkenones from diverse species or coccolithophoridbiogeographic provinces. Figure 2 demonstrates that theK37/K38 [Prahl et al., 1988] and U37
K0/U38
K indices [Rosell-Mele et al., 1994] fall within a restricted range throughout theinterval of study, and that no shifts in values are observed thatcould account for any glacial-interglacial nor longer-termtrends in %C37:4, U37
K or U37K0
at Site 983. Thus, the distribu-tions of alkenones suggests that the alkenone producersacross the MPT interval had a biochemical response tooceanographic conditions analogous to that of modern spe-cies, and therefore that the observed changes in %C37:4, U37
K
and U37K0
reflect oceanographic trends.[15] In most oceanographic settings, the C37:4 alkenone is
absent and SSTs are reconstructed using the simplified formof the alkenone index, U37
K0[Prahl and Wakeham, 1987].
However, this index has been problematic to correlate toSSTs at high latitudes of the Northern Hemisphere, insettings where the C37:4 alkenone is in high concentration[Bendle and Rosell-Mele, 2004; Rosell-Mele, 1998; Rosell-Mele et al., 1995b]. In fact, in the northern North Atlantic,the U37
K index has shown a more robust temperature depen-dence than U37
K0except in Arctic or polar water domains,
when both indices appear to cease to be SST dependent[Bendle and Rosell-Mele, 2004; Rosell-Mele, 1998]. Inrecognition of these uncertainties, we focus upon the U37
K -derived SSTs, generated using the North Atlantic core topcalibration to summer SSTs [Rosell-Mele et al., 1995b]. ForSite 983, we also show results from U37
K0for comparison,
using the global mean annual SST calibration [Muller et al.,1998]. We acknowledge that under conditions of high%C37:4 the U37
K and U37K0
indices are used most effectivelyin combination with %C37:4 to qualitatively trace thedominant overlying water mass domain, rather than toquantify SST.
3.2. Site 983 (North Atlantic)
[16] Records of alkenone indices (%C37:4 and U37K ) from
Site 983 are shown in Figures 3b and 3c. Site 983 is ideallypositioned to register changes in the position of the ArcticFront and thus the extent of the Arctic water mass in theNorth Atlantic. This has been demonstrated in previousexaminations of Site 983 sediments and of its closestneighbor, Site 984, using diatoms and foraminifera respec-tively [Koc et al., 1999; Wright and Flower, 2002]. Thesensitive location of Site 983 may account for the highdegree of variability in SSTs and %C37:4 within glacial/interglacial stages. Alkenone concentrations (sum of C37
molecules) ranged between 30 ng g�1 to 1.5 mg g�1, with anaverage concentration of �350 ng g�1. Both records revealconsiderable variability within glacial and interglacial inter-vals, although glacials are largely marked by high concen-trations of C37:4 and low SSTs. As shown for the last glacialperiod in the North Atlantic, the %C37:4 record in the site isbound to contain a suborbital variability linked to theoccurrence of Heinrich events [Bard et al., 2000; Rosell-Mele, 1998]. Together with the sampling resolution acrossthe 1 My interval of study limiting significant signaldetection, and the noisy nature of the short-term signalsgiven the sensitivity of this site to rapid changes in surfacecurrent locations, such processes would explain the lack of aclear glacial to interglacial variability in the records.[17] The %C37:4 at Site 983 ranges between zero, partic-
ularly during interglacial maxima, and a maximum of 24%at �1.0 Ma. On Figure 3, the line denoting C37:4 concen-trations of 5% is used to delineate Atlantic waters from theArctic and Polar water masses on the basis of moderncalibrations as discussed above [Bendle and Rosell-Mele,2004; Rosell-Mele et al., 1998]. Between �1.15–0.86 Ma(marine oxygen isotope stage (MIS) 34–21), concentrationsof C37:4 rarely fall below 5% even during interglacials,which we interpret as evidence for the dominance of polar/arctic waters at the core site during this interval. This trendoccurs despite no notable shift in the benthic d18O recordfrom Site 983 (Figure 3a). After 0.9 Ma, %C37:4 returned tolow or undetectable concentrations during interglacials, butin contrast to the early part of the record, concentrations ofC37:4 continued to reach 10–15% during colder intervals.One exception to this trend is the high C37:4 concentrationsduring the later stages of MIS 21, when d18O indicatesrelatively warm and/or low ice volume conditions. How-ever, high abundances of the polar water foraminiferNeogloboquadrina pachyderma (s.) (Figure 4) [Wrightand Flower, 2002], support the inference made fromthe %C37:4 data that cooler and fresher waters prevailedat Site 983 at this time.[18] The range of reconstructed SSTs using U37
K at Site 983is consistent with reconstructed winter and summer SSTs atthe last glacial maximum (around 1–4�C) [Pflaumann et al.,2003] and with the modern annual SST range at the site (8–11�C) [Conkright et al., 2002]. SSTs using U37
K0are higher
than those from U37K . This is a consequence of the inclusion
in U37K of the C37:4 alkenone. There is no clear secular trend
in SSTs from either proxy across the interval of study, andclear glacial-interglacial oscillations are not well definedbecause of considerable suborbital variability and the rela-
Figure 2. Alkenone distributions at Site 983 between 0.5and 1.5 Ma. Glacial stages are marked by the vertical grayshading. (a) Ratio of total concentration of C37 alkenones tototal concentration of C38 alkenones (K37/K38; Prahl et al.[1988]). (b) Ratio of the U37
K0index of SST to the U38
K
index. The U38K index is defined as [C38:2Me] + [C38:2Et]/
[C38:2Me] + [C38:2Et] + [C38:3Me] + [C38:3Et] [Rosell-Meleet al., 1994].
PA4214 MCCLYMONT ET AL: MID-PLEISTOCENE POLAR/ARCTIC WATERS
4 of 12
PA4214

tively low sampling resolution. Given that SSTs from U37K
are not independent from the %C37:4 record, the relativelycool interglacials between 1.15 and 0.86 Ma (MIS 34–21)do in part reflect the sustained high %C37:4 values at thistime (Figure 3). However, such interdependence is notnecessarily problematic, as this combination of high%C37:4 and low U37
K values is consistent with the presenceof arctic and polar water masses at Site 983 on the basis ofmodern observations. The alternative, to use U37
K0as a
record of past SSTs, is hampered by the relatively poorcorrelations between these variables at low temperaturesand with high %C37:4 in modern calibrations (discussedabove).
[19] The high sedimentation rates of Site 983 result fromthe advection of fine-grained terrigenous particles by bottomcurrents originating in the Nordic Seas. Conversely, there issome evidence for the removal of the fine carbonate fractionon the Gardar and Hatton Drifts under stronger NSOW flow[Wang and McCave, 1990]. Thus, the accumulation ofalkenones and other marine organic matter on the Gardardrift could reflect a combination of both production in theoverlying ocean and addition as well as removal of finesediment fractions by the bottom currents. We have notaddressed this issue in the current paper, and have inter-preted our records as representing autochthonous signals.The NSOW flow speed has varied at orbital scales, but we
Figure 3. (a) Benthic d18O record from Site 983, smoothed to 3 ka as described by Raymo et al. [2004].Glacial stages are marked by the vertical yellow shading, and selected marine isotope stages discussed inthe text are marked. The MPT as defined by Mudelsee and Schulz [1997], on the basis of variations toglobal ice volume, spans MIS 21–16. (b) Relative abundance of the C37:4 alkenone (%C37:4) from Site983, North Atlantic. Black line shows running mean at 10 point (�50 ka). The long-term increase in%C37:4 is highlighted by the arrow. C37:4 = 5% is indicated by the horizontal dashed line. (c) Dark grayseries: U37
K -derived SSTs from Site 983, North Atlantic. Running mean at 10 point (�50 ka, black line).Light gray: U37
K0time series for comparison, shown on U37
K scale. (d) Relative abundance of the C37:4
alkenone (%C37:4) from Site 882, northwest Pacific. Running mean at 10 point (�50 ka) and annotationas for Figure 3b. (e) U37
K -derived SSTs from Site 882, northwest Pacific. Running mean at 10 point(�50 ka, black line).
PA4214 MCCLYMONT ET AL: MID-PLEISTOCENE POLAR/ARCTIC WATERS
5 of 12
PA4214

argue that its variability cannot account for the seculartrends in %C37:4 that are observed at this site and the offsetsin the trends with the d18O foraminiferal record. Themaximum temporal offset between organic and carbonatematerials of 1–5 ka on the Bjorn-Gardar drift (J. Holtvoeth,personal communication, 2007) does not explain a shifttoward higher %C37:4 values that is sustained beyond orbitalvariations. Nor is there evidence that the mean strength ofNSOW changed from 1.15 Ma, alongside the increase in%C37:4. The mid-Pleistocene record of Wang and McCave[1990] extended back to �1 Ma, and thus does not recordthe response of NSOW strength to the onset of the MPT.Glacial NADW may become weaker after 1.2 Ma [Grogeret al., 2003; Oppo et al., 1995], although the most pro-nounced reduction in glacial NADW strength has beenreported from 0.95 Ma [Groger et al., 2003; Kleiven etal., 2003; Schmieder et al., 2000]. In light of the availableevidence, we propose that changes to bottom currentstrength and the corresponding sediment advection orreworking processes can therefore not account for thelong-term trends in %C37:4 identified here as associatedwith the MPT.
3.3. Site 882 (Northwest Pacific)
[20] Absolute alkenone concentrations were not quanti-fied in this site, because as they were below the detectionlimit of the GC-FID in most intervals, GC-CIMS was usedinstead, which does not allow their absolute quantification.The %C37:4 results from Site 882 are shown in Figures 3dand 3e. Concentrations of C37:4 range between < 1% and amaximum of 29% at 1.0 Ma. Lowest %C37:4 are found priorto 1.35 Ma (MIS 43). In general, %C37:4 minima tend tooccur during cold isotopic stages or when SSTs are low, butthe correlation is less clear than at Site 983 and may in partreflect the difference in age model determination. One of the
most striking results from Site 882 results is the secularincrease in C37:4 concentrations after �1.2 Ma, whichreached a maximum at 1.0 Ma before values fell progres-sively until 0.5 Ma. Relatively high %C37:4 values arerecorded for a short interval centered on �1.3 Ma; we notethat this falls within the 100 ka window of relatively weakage control and so its absolute age may vary. The SST timeseries is not marked by any strong cooling/warming eventsthroughout the interval of study, and clear glacial-interglacialvariability is not reflected in the record, probably owing tothe low sampling resolution. A progressive decline towardcooler mean SSTs can be detected (Figure 3e). From a Plio-Pleistocene perspective, the increase in C37:4 from 1.2 Ma issignificant for the longer-term history of Site 882, giventhat this marks the first time that %C37:4 exceeded 10% forthe 6 Ma record at this site [Haug, 1996].
3.4. Position of the Arctic Front During the MPT
[21] Both sites record an interval of prolonged highconcentrations of C37:4 between 1.2 and 0.9 Ma andsynchronous maximum concentrations at 1.0 Ma. We inter-pret the high concentrations of %C37:4 at Sites 983 and 882as evidence for the presence of relatively cool and freshsurface waters. Thus the %C37:4 trends in Figure 3 reflect anequatorward expansion of arctic/polar water masses in theAtlantic and Pacific Oceans from 1.15 Ma that spanned bothglacials and interglacials. For the North Atlantic, this inter-pretation is supported (Figure 4) by the correlation betweenthe peaks in %C37:4 at Site 983 to the intervals dominated bythe polar planktonic foraminifer N. pachyderma (s.) atSite 984, for the time interval over which these two recordsoverlap (1.0–0.6 Ma) [Wright and Flower, 2002]. Thedifference in age models, the high degree of variability in%C37:4 and SST within both glacial and interglacial stages,and the potential for advection-induced temporal offsets atSite 983, limit our ability to investigate leads and lags
Figure 4. Comparison between alkenone and foraminifer indicators of water mass positions in theNorth Atlantic between 1.1 and 0.5 Ma. (a) Relative abundance of the C37:4 alkenone (%C37:4) from Site983, North Atlantic. Shading marks %C37:4 > 5%, as in Figure 3. (b) Percentage of the Arctic Frontindicator species Neogloboquadrina pachyderma (s) from Site 984 between 0.9–0.5 Ma. Data and notedinterpretation of Arctic Front position relative to the core site is from Wright and Flower [2002].
PA4214 MCCLYMONT ET AL: MID-PLEISTOCENE POLAR/ARCTIC WATERS
6 of 12
PA4214

between sites. We therefore choose to focus here upondiscussion of the similar long-term trends in %C37:4 thatcharacterize the two sites.[22] Although the maxima in %C37:4 at 1.0 Ma are easy to
identify at both sites, the onset of the increasing C37:4
concentrations is less clear to define. Figure 3 places thesecular increase in C37:4 at both sites at between 1.15 and1.2 Ma, although %C37:4 was not sustained above 5% untilcirca 1.1 Ma at Site 983. After 1.0 Ma, the mean %C37:4 atboth sites declined. At Site 983 this was particularly markedduring warm stages, suggesting that the Arctic Frontreturned to a more northerly position than experiencedduring the 1.15–1.0 Ma interval. This likely reflects arenewed influence of warm Atlantic waters to the siteduring periods of low ice volume. In contrast, the %C37:4
maxima continued to remain relatively high (>10%), indi-cating that the relatively extensive arctic/polar water massesthat developed between 1.2 and 0.9 Ma were maintainedafter 0.9 Ma in the North Atlantic during cooler stages. Site983 thus appears to have been the subject of greatervariability in surface ocean properties after 0.9 Ma than inthe interval preceding 1.2 Ma. In the northwest Pacific, thesecular retreat of subarctic waters after 0.9 Ma is reflected infalling %C37:4 during both glacials and interglacials. Valuesremain higher than those prior to 1.3 Ma, and thus the extentof cooler and fresh surface water masses in the northwestPacific also remained relatively large even after the maxi-mum at 1.0 Ma. The pronounced variability in %C37:4 after0.9 Ma that is observed at Site 983 is not replicated at Site882, the latter recording a more gradual return to low mean%C37:4 values.[23] The results presented here thus indicate two signifi-
cant changes to the distribution of water masses in the NorthAtlantic and northwest Pacific associated with the MPT:(1) between 1.2–0.9 Ma, a secular shift toward moreexpansive subarctic/subpolar water masses and (2) from0.9 Ma, a partial retreat of subarctic/subpolar water masses.At Site 983 maxima in %C37:4 continue to exceed thosewhich occurred before 1.2 Ma, suggesting that the maxi-mum extent of the arctic/polar water masses on orbitaltimescales was greater after the MPT. As our time seriesdo not continue from 0.5 Ma to the present day, we cannotconclusively demonstrate that the retreat of the subarctic/subpolar water masses after 0.9 Ma was a permanent one ateither site. We have noted above that our %C37:4 record atSite 983 is closely aligned with the N. pachyderma (s.)record from Site 984 [Wright and Flower, 2002]. The latterstudy demonstrated that a relatively southern position of theArctic Front in the North Atlantic was maintained between1.0 and 0.6 Ma, after which the interglacial position of theArctic Front achieved the southwest to northeast alignmentthat is found at the present day. Furthermore, an increasingcontribution of biogenic carbonate to Site 985 from 0.65 Mamarks incursions of warm, Atlantic waters to the NorwegianSea [Baumann and Huber, 1999]. The Wright and Flower[2002] record does not extend back prior to 1.0 Ma, but ourdata in Figure 3 would suggest that the secular migration ofthe Arctic Front southward began from 1.2 Ma, as part ofthe MPT. This proposal is further supported by the NordicSeas foraminiferal record of Helmke et al. [2003a], who
identified an intensification of glacial conditions after1.2 Ma. At Site 985, inputs of biogenic carbonate were rarebetween 1.1 and 0.65 Ma, marking occasional inputs ofAtlantic waters to the Norwegian Sea during minima in icevolume [Baumann and Huber, 1999]. It is also interesting tonote that the adaptation of N. pachyderma (s). to the coldpolar water environment developed from 1.1 Ma [Baumannand Huber, 1999; Henrich et al., 2002; Meggers andBaumann, 1997], as reflected in a net increase in shell sizeover the last 1.3 Ma. Cooler and more arid conditions inEurope around 1.0 Ma are also reflected in records of bioticchange, including the shift toward cold climate adaptedmammalian fauna associated with the end-Villafranchianevent [Azzaroli, 1995] and the development of colder floralassemblages [e.g., Bertini, 2003] from 1.2 Ma onward.[24] In the northwest Pacific, the partial reduction in
%C37:4 cannot be explained by incursions from a warmcurrent as seen in the Atlantic, because of its position withinthe subarctic water mass and isolation from the SubarcticFront. The C37:4 time series indicates a partial retreat orincreased salinity of the subarctic water masses after 1.0 Ma,although still within a cool and fresh subarctic environment.The cause of this change to surface conditions is unclear.Ice-rafted detritus (IRD) accumulation rates at Site 882 donot change across the MPT, precluding this process as anexplanation for altered freshwater inputs [St. John andKrissek, 1999]. Although insolation at 65�N peaks duringMIS 25, circa 0.94 Ma [Berger and Loutre, 1991] becauseof high eccentricity, the rising limb of %C37:4 occurs duringthe previous eccentricity peak, suggesting that North Pacificwater mass distribution is not controlled by insolation. Atpresent, the distinctive salinity maximum of the subarcticgyre is linked to the excess precipitation that results fromthe strong Aleutian low-pressure system and the resultingwinter storms and reduced cloud cover [Sancetta andSilvestri, 1986]. A weaker East Asian winter monsoonbetween MIS 22–16 is consistent with weaker Aleutianlow-pressure and Siberian high-pressure systems [Heslop etal., 2002], but occurs after the decline in %C37:4 and thuscannot be considered as a forcing mechanism. Modernteleconnections also suggest that the precipitation-bearingwesterlies might be reduced under a strengthening ofWalker circulation [Alexander et al., 2002], the latterobserved across the MPT [McClymont and Rosell-Mele,2005]. However, the complex extratropical response toENSO variability within our present climate system limitsacceptance of this mechanism. Analysis of diatom assemb-lages across the North Pacific has shown that between 1.0and 0.8 Ma, in parallel with the reduction in %C37:4 shownin Figure 3, the western Pacific experienced enhancedclimate variability [Sancetta and Silvestri, 1986]. Thisvariability included periodic migrations of the SubarcticFront over several degrees of latitude and an enhancedvariability in the subarctic Pacific between intervals ofstronger and weaker seasonal contrasts [Sancetta and Sil-vestri, 1986]. We propose here that this increased variabilitymost likely accounts for the partial decrease in %C37:4 after1.0 Ma, as the cool and fresh conditions were no longersustained. Sancetta and Silvestri [1986] attributed thisvariability to east-west shifts between the Siberian high-
PA4214 MCCLYMONT ET AL: MID-PLEISTOCENE POLAR/ARCTIC WATERS
7 of 12
PA4214

pressure and Aleutian low-pressure cells, but the cause isunclear.
3.5. Implications for Ice Sheet Growth
[25] The development of cooler and fresher high-latitudesurface oceans in the North Atlantic and Pacific Oceans isnot mirrored by a similar expansion of the NorthernHemisphere ice sheets. There is evidence, nevertheless,for advance of the Scandinavian ice sheet at around1.1 Ma [Sejrup et al., 2000] and significant increases inIRD in the North Atlantic and Nordic Seas after 1.0 Ma[Fronval and Jansen, 1996; Ruddiman et al., 1986]. Meanglobal ice volume, however, underwent a later stepwiseincrease during the intense glacial cooling of MIS 22(0.9 Ma), the proposed onset of the MPT [Mudelsee andSchulz, 1997]. This suggests that there was a delayedoverall response in the Northern Hemisphere ice sheets tocooling observed elsewhere in the climate system associatedwith the MPT. The results presented in Figure 3 thusdemonstrate that knowledge of high-latitude climatechanges cannot be determined through the benthic d18Orecord alone, the latter signal giving a ‘‘late’’ date for theonset of the MPT at �0.9 Ma.[26] We propose that the apparent delayed response in the
Northern Hemisphere ice sheets is the consequence ofchanges in the supply of water vapor to boreal NorthAmerica and Europe prior to 0.9 Ma, caused, at least inpart, by the described equatorward expansion of arctic watermasses. In the modern North Atlantic, arctic and polar watermass domains are associated with at least seasonal sea icecover [Swift, 1986]. Figure 3 thus suggests that a shifttoward more extensive sea ice cover occurred in the NorthAtlantic prior to 0.9 Ma, and that glacial sea ice covercontinued to be relatively extensive until at least 0.6 Ma.Similarly, more extensive sea ice cover is suggested by anincreasing presence of reddish sediments in the WestNorwegian Sea between 1.2 and 0.9 Ma [Helmke et al.,2003b]. By comparing benthic d13C values in a suite ofnorthern North Atlantic sites Raymo et al. [2004] identifiedmore variable vertical d13C gradients prior to 0.6 Ma, whichthey attributed to more extensive sea ice cover. In contrast tothe records presented here, however, Raymo et al. [2004]found that the d13C profiles were similar back to 1.8 Ma,earlier than the 1.2 Ma expansion that our %C37:4 resultsindicate. More expansive sea ice cover would have beendetrimental to ice sheet growth by limiting evaporation,increasing the surface ocean albedo, and deflecting stormtracks southward away from ice sheet source regions [Smithet al., 2003; Tziperman and Gildor, 2003].[27] In the northwest Pacific we also detect a cooler and
fresher surface ocean at Site 882 from 1.2 Ma (Figure 3).Here, the signal provided by %C37:4 records a slightlydifferent scenario because of the oceanographic regimebelow which Site 882 was drilled. The stable and stratifiedwater column that characterizes the region at the present dayhad already developed in association with the onset ofNorthern Hemisphere glaciation, circa 2.7 Ma [Haug etal., 2005]. Unlike the North Atlantic site, Site 882 sitswithin subarctic waters and is not affected by latitudinalmigrations of frontal systems over the site. Rather, the
%C37:4 results record changes to temperature and salinitythat likely reflect variability in radiative heating, precipita-tion and mixing of the dominant hydrographic features[Endoh et al., 2004]. Even during glacial maxima of thelate Pleistocene, Site 882 was likely located to the south ofthe perennial zone of sea ice [Jaccard et al., 2005], and,given the lack of a modern %C37:4 calibration in the Pacific,we cannot link the high concentrations of %C37:4 to thepresence of sea ice at Site 882. Thus, Figure 3 indicates thatthe MPT was associated with cooling and freshening of thesurface ocean within the stratified northwest Pacific. Else-where in the North Pacific, evidence for more extensivesubarctic conditions can be found from 1.2 Ma. In thenorthwest, increased ice rafting at 1.0 Ma occurred to thesouth of Site 882, but not at Site 882 itself [St. John andKrissek, 1999]. This has been linked to a more southerlyposition of the subarctic front and thus the zone of icebergmelting and deposition [Sancetta and Silvestri, 1986; St.John and Krissek, 1999]. In contrast, the most significantmid-Pleistocene change in the northeast Pacific is a markedincrease in ice rafting from 0.9 Ma, attributed to the Alaskansignature of the expansion of Northern Hemisphere glacia-tion [Sancetta and Silvestri, 1986].[28] The modest poleward retreat of the arctic/polar water
masses in the North Atlantic and Pacific Oceans after1.0 Ma, as detailed by the decrease in %C37:4 (Figure 3),would have removed or reduced the constrictions to icesheet growth described above. Evidence to support thishypothesis include a shift toward an increased mean globalice volume [Mudelsee and Schulz, 1997], increasing sever-ity of Scandinavian glaciations [Henrich and Baumann,1994] and increased ice rafting from Alaskan and Greenlandsources [Sancetta and Silvestri, 1986].
3.6. Implications for the MPT
[29] The expansion of cooler and fresher surface waters inboth the North Atlantic and Pacific oceans from 1.2 Maoccurs alongside many other climate changes associatedwith the MPT. Specifically, these high northern latitudechanges occur when intensification of the tropical andsubtropical upwelling systems and increasing continentalaridity have indicated more intense atmospheric circulationafter 1.2 Ma [de Menocal, 1995; Durham et al., 2001;Heslop et al., 2002; Liu and Herbert, 2004; Marlow et al.,2000; McClymont and Rosell-Mele, 2005; Medina-Elizaldeand Lea, 2005; Xiao and An, 1999]. The changing atmo-spheric circulation has been linked to an increasing merid-ional temperature gradient driven by circulation changes inthe Southern Hemisphere, specifically by the equatorwardmigration of the Antarctic circumpolar current after 1.8 Ma[McClymont and Rosell-Mele, 2005; McClymont et al.,2005], and/or increased sea ice cover in the Southern Oceanand its effects on the temperature of the upwelling waters[Lee and Poulsen, 2006]. We show here that the highlatitudes of the Northern Hemisphere also underwent acooling and freshening, which would have acted to increasefurther the meridional temperature gradient and drive moreintense atmospheric circulation. These processes also oughtto have encouraged ice sheet growth via increased moisturetransport to the high latitudes [Raymo and Niscancioglu,
PA4214 MCCLYMONT ET AL: MID-PLEISTOCENE POLAR/ARCTIC WATERS
8 of 12
PA4214
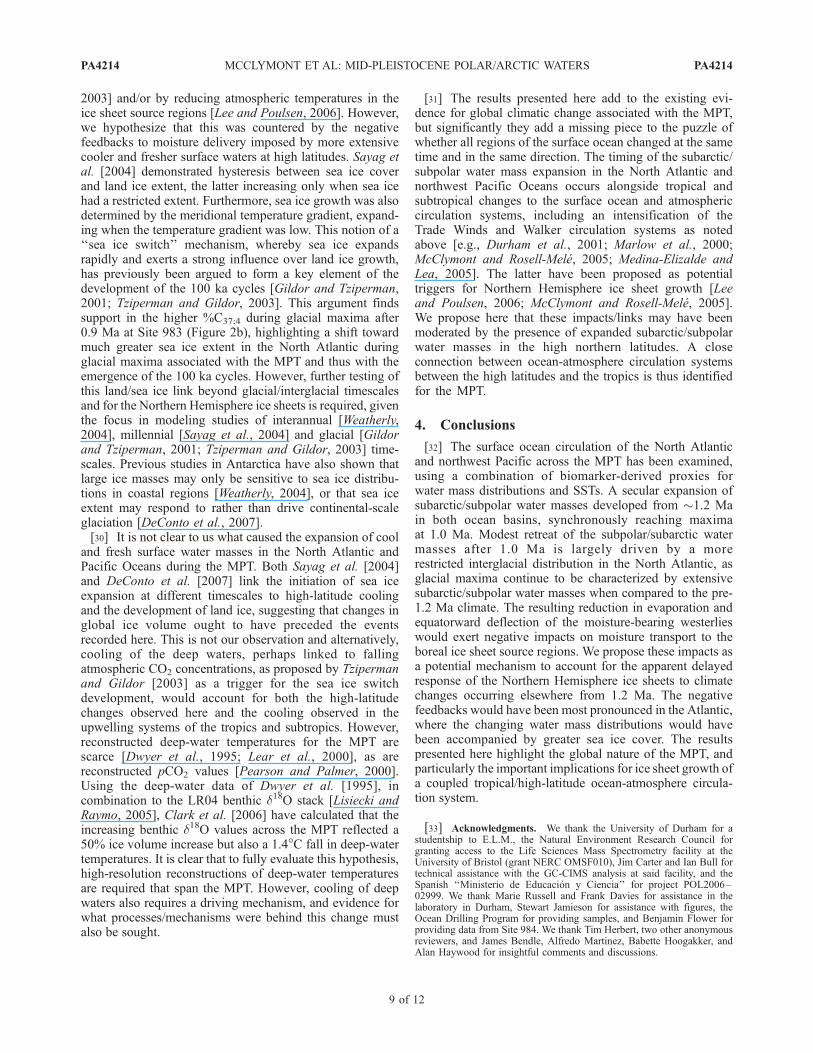
2003] and/or by reducing atmospheric temperatures in theice sheet source regions [Lee and Poulsen, 2006]. However,we hypothesize that this was countered by the negativefeedbacks to moisture delivery imposed by more extensivecooler and fresher surface waters at high latitudes. Sayag etal. [2004] demonstrated hysteresis between sea ice coverand land ice extent, the latter increasing only when sea icehad a restricted extent. Furthermore, sea ice growth was alsodetermined by the meridional temperature gradient, expand-ing when the temperature gradient was low. This notion of a‘‘sea ice switch’’ mechanism, whereby sea ice expandsrapidly and exerts a strong influence over land ice growth,has previously been argued to form a key element of thedevelopment of the 100 ka cycles [Gildor and Tziperman,2001; Tziperman and Gildor, 2003]. This argument findssupport in the higher %C37:4 during glacial maxima after0.9 Ma at Site 983 (Figure 2b), highlighting a shift towardmuch greater sea ice extent in the North Atlantic duringglacial maxima associated with the MPT and thus with theemergence of the 100 ka cycles. However, further testing ofthis land/sea ice link beyond glacial/interglacial timescalesand for the Northern Hemisphere ice sheets is required, giventhe focus in modeling studies of interannual [Weatherly,2004], millennial [Sayag et al., 2004] and glacial [Gildorand Tziperman, 2001; Tziperman and Gildor, 2003] time-scales. Previous studies in Antarctica have also shown thatlarge ice masses may only be sensitive to sea ice distribu-tions in coastal regions [Weatherly, 2004], or that sea iceextent may respond to rather than drive continental-scaleglaciation [DeConto et al., 2007].[30] It is not clear to us what caused the expansion of cool
and fresh surface water masses in the North Atlantic andPacific Oceans during the MPT. Both Sayag et al. [2004]and DeConto et al. [2007] link the initiation of sea iceexpansion at different timescales to high-latitude coolingand the development of land ice, suggesting that changes inglobal ice volume ought to have preceded the eventsrecorded here. This is not our observation and alternatively,cooling of the deep waters, perhaps linked to fallingatmospheric CO2 concentrations, as proposed by Tzipermanand Gildor [2003] as a trigger for the sea ice switchdevelopment, would account for both the high-latitudechanges observed here and the cooling observed in theupwelling systems of the tropics and subtropics. However,reconstructed deep-water temperatures for the MPT arescarce [Dwyer et al., 1995; Lear et al., 2000], as arereconstructed pCO2 values [Pearson and Palmer, 2000].Using the deep-water data of Dwyer et al. [1995], incombination to the LR04 benthic d18O stack [Lisiecki andRaymo, 2005], Clark et al. [2006] have calculated that theincreasing benthic d18O values across the MPT reflected a50% ice volume increase but also a 1.4�C fall in deep-watertemperatures. It is clear that to fully evaluate this hypothesis,high-resolution reconstructions of deep-water temperaturesare required that span the MPT. However, cooling of deepwaters also requires a driving mechanism, and evidence forwhat processes/mechanisms were behind this change mustalso be sought.
[31] The results presented here add to the existing evi-dence for global climatic change associated with the MPT,but significantly they add a missing piece to the puzzle ofwhether all regions of the surface ocean changed at the sametime and in the same direction. The timing of the subarctic/subpolar water mass expansion in the North Atlantic andnorthwest Pacific Oceans occurs alongside tropical andsubtropical changes to the surface ocean and atmosphericcirculation systems, including an intensification of theTrade Winds and Walker circulation systems as notedabove [e.g., Durham et al., 2001; Marlow et al., 2000;McClymont and Rosell-Mele, 2005; Medina-Elizalde andLea, 2005]. The latter have been proposed as potentialtriggers for Northern Hemisphere ice sheet growth [Leeand Poulsen, 2006; McClymont and Rosell-Mele, 2005].We propose here that these impacts/links may have beenmoderated by the presence of expanded subarctic/subpolarwater masses in the high northern latitudes. A closeconnection between ocean-atmosphere circulation systemsbetween the high latitudes and the tropics is thus identifiedfor the MPT.
4. Conclusions
[32] The surface ocean circulation of the North Atlanticand northwest Pacific across the MPT has been examined,using a combination of biomarker-derived proxies forwater mass distributions and SSTs. A secular expansion ofsubarctic/subpolar water masses developed from �1.2 Main both ocean basins, synchronously reaching maximaat 1.0 Ma. Modest retreat of the subpolar/subarctic watermasses after 1.0 Ma is largely driven by a morerestricted interglacial distribution in the North Atlantic, asglacial maxima continue to be characterized by extensivesubarctic/subpolar water masses when compared to the pre-1.2 Ma climate. The resulting reduction in evaporation andequatorward deflection of the moisture-bearing westerlieswould exert negative impacts on moisture transport to theboreal ice sheet source regions. We propose these impacts asa potential mechanism to account for the apparent delayedresponse of the Northern Hemisphere ice sheets to climatechanges occurring elsewhere from 1.2 Ma. The negativefeedbacks would have been most pronounced in the Atlantic,where the changing water mass distributions would havebeen accompanied by greater sea ice cover. The resultspresented here highlight the global nature of the MPT, andparticularly the important implications for ice sheet growth ofa coupled tropical/high-latitude ocean-atmosphere circula-tion system.
[33] Acknowledgments. We thank the University of Durham for astudentship to E.L.M., the Natural Environment Research Council forgranting access to the Life Sciences Mass Spectrometry facility at theUniversity of Bristol (grant NERC OMSF010), Jim Carter and Ian Bull fortechnical assistance with the GC-CIMS analysis at said facility, and theSpanish ‘‘Ministerio de Educacion y Ciencia’’ for project POL2006–02999. We thank Marie Russell and Frank Davies for assistance in thelaboratory in Durham, Stewart Jamieson for assistance with figures, theOcean Drilling Program for providing samples, and Benjamin Flower forproviding data from Site 984. We thank Tim Herbert, two other anonymousreviewers, and James Bendle, Alfredo Martinez, Babette Hoogakker, andAlan Haywood for insightful comments and discussions.
PA4214 MCCLYMONT ET AL: MID-PLEISTOCENE POLAR/ARCTIC WATERS
9 of 12
PA4214

ReferencesAlexander, M. A., et al. (2002), The atmosphericbridge: The influence of ENSO teleconnectionson air-sea interaction over the global oceans,J. Clim., 15, 2205–2231, doi:10.1175/1520-0442(2002)015<2205:TABTIO>2.0.CO;2.
Azzaroli, A. (1995), The ‘Elephant-Equus’ and the‘End-Villafranchian’ events in Eurasia, in Paleo-climate andEvolution:WithEmphasis onHumanOrigins, edited by E. S. Vrba et al., pp. 311–318, Yale Univ. Press, New Haven, Conn.
Bard, E., et al. (1987), Retreat velocity of theNorth Atlantic polar front during the last de-glaciation determined by 14C accelerator massspectrometry, Nature , 328 , 791 – 794,doi:10.1038/328791a0.
Bard, E., et al. (2000), Hydrological impact ofHeinrich events in the subtropical northeastAt lan t i c , Sc ience , 289 , 1321 – 1324,doi:10.1126/science.289.5483.1321.
Baumann, K.-H., and R. Huber (1999), Sea-sur-face gradients between the North Atlantic andthe Norwegian Sea during the last 3.1 m.y.:Comparison of Sites 982 and 985, Proc.Ocean Drill. Program Sci. Results, 162,179 – 190, doi:110.2973/odp.proc.sr.2162.2014.1999.
Becquey, S., and R. Gersonde (2002), Past hy-drographic and climate changes in the Sub-antarctic Zone of the South Atlantic — ThePleistocene record from ODP Site 1090,Palaeogeogr. Palaeoclimatol. Palaeoecol.,182, 221–239, doi:10.1016/S0031-0182(01)00497-7.
Bendle, J., and A. Rosell-Mele (2004), Distribu-tions of U37
K and U37K0
in the surface watersand sediments of the Nordic Seas: Implica-tions for paleoceanography, Geochem.Geophys. Geosyst., 5, Q11013, doi:10.1029/2004GC000741.
Bendle, J. A., A. Rosell-Mele, and P. Ziveri(2005), Variability of unusual distributions ofalkenones in the surface waters of the Nordicseas, Paleoceanography, 20 , PA2001,doi:10.1029/2004PA001025.
Berger, W. H., and E. Jansen (1994), Mid-Pleistocene climate shift — The Nansen con-nection, in The Polar Oceans and Their Role inShaping the Global Environment, Geophys.Monogr. Ser., vol. 84, edited by O. M.Johannessen et al., pp. 295 – 311, AGU,Washington, D. C.
Berger, A., and M. F. Loutre (1991), Insolationvalues for the climate of the last 10 millionyears, Quat. Sci . Rev. , 10 , 297 – 317,doi:10.1016/0277-3791(91)90033-Q.
Berger, W. H., et al. (1993), Quaternary oxygenisotope record of pelagic foraminifers: Site806, Ontong Java Plateau, Proc. Ocean Drill.Program Sci. Results, 130, 381–395.
Bertini, A. (2003), Early to middle Pleistocenechanges of the Italian flora and vegetation inthe light of a chronostratigraphic framework,Quaternario, 16, 19–36.
Brassell, S. C., et al. (1986), Molecular strati-graphy: A new tool for climatic assessment,Nature, 320, 129–133.
Channell, J. E. T., and H. F. Kleiven (2000),Geomagnetic palaeointensities and astrochro-nological ages for the Matuyama-Brunhesboundary and the boundaries of the JaramilloSubchron: Palaeomagnetic and oxygen iso-tope records from ODP Site 983, Philos.Trans. R. Soc. London, Ser. A, 358, 1027–1047, doi:10.1098/rsta.2000.0572.
Clark, P. U., and D. Pollard (1998), Origin of themiddle Pleistocene transition by ice sheet ero-
sion of regolith, Paleoceanography, 13, 1–9,doi:10.1029/97PA02660.
Clark, P. U., et al. (2006), The middle Pleisto-cene transition: Characteristics, mechanisms,and implications for long-term changes in at-mospheric pCO2, Quat. Sci. Rev., 25, 3150–3184, doi:10.1016/j.quascirev.2006.07.008.
Conkright, M. E., R. A. Locarnini, H. E. Garcia,T. O’Brien, T. P. Boyer, C. Stephens, and J. I.Antonov (2002), Objective analyses, data sta-tistics, and figures [CD-ROM], in WorldOcean Atlas 2001, Internal Rep. 17, 17 pp.,Natl. Oceanogr. Data Cent., Silver Spring,Md.
Conte, M. H., et al. (2001), The alkenone tem-perature signal in western North Atlantic sur-face waters, Geochim. Cosmochim. Acta, 65,4275 – 4287, doi:10.1016/S0016-7037(01)00718-9.
DeConto, R., D. Pollard, and D. Harwood(2007), Sea ice feedback and Cenozoic evolu-tion of Antarctic climate and ice sheets, Pa-leoceanography, 22, PA3214, doi:10.1029/2006PA001350.
de Menocal, P.B. (1995), Plio-Pleistocene Afri-c an c l ima t e , Sc i ence , 270 , 53 – 59 ,doi:10.1126/science.270.5233.53.
de Menocal, P. B. (2004), African climatechange and faunal evolution during the Plio-cene-Pleistocene, Earth Planet. Sci. Lett., 220,3–24, doi:10.1016/S0012-821X(04)00003-2.
Diekmann, B., and G. Kuhn (2002), Sedimen-tary record of the mid-Pleistocene climatetransition in the southeastern South Atlantic(ODP Site 1090), Palaeogeogr. Palaeoclima-tol. Palaeoecol., 182, 241–258, doi:10.1016/S0031-0182(01)00498-9.
Durham, E. L., et al. (2001), Reconstructing theclimatic history of the western coast of Africaover the past 1.5 m.y.: A comparison of proxyrecords from the Congo Basin and the WalvisRidge and the search for the mid-Pleistocenerevolution, Proc. Ocean Drill. Program Sci.Results, 175, 1–46.
Dwyer, G. S., et al. (1995), North Atlantic Deep-water temperature change during late Pleisto-cene and late Quaternary climatic cycles,Science, 270, 1347 – 1351, doi:10.1126/science.270.5240.1347.
Endoh, T., et al. (2004), Thermohaline structurein the subarctic North Pacific simulated in ageneral circulation model, J. Phys. Oceanogr.,34, 360–371, doi:10.1175/1520-0485(2004)034<0360:TSITSN>2.0.CO;2.
Fronval, T., and E. Jansen (1996), Late Neogenepaleoclimates and paleoceanography in theIceland-Norwegian Sea: Evidence from theIceland and Vøring plateaus, Proc. OceanDrill. Program Sci. Results, 151, 455–468.
Gildor, H., and E. Tziperman (2001), A sea iceclimate switch mechanism for the 100-kyr gla-cial cycles, J. Geophys. Res., 106, 9117–9133, doi:10.1029/1999JC000120.
Groger, M., et al. (2003), Variability of silt grainsize and planktonic foraminiferal preservationin Plio/Pleistocene sediments from the westernequatorial Atlantic and Caribbean, Mar. Geol.,201 , 307 – 320 , do i : 10 .1016 /S0025 -3227(03)00264-0.
Hansen, B., and S. Østerhus (2000), NorthAtlantic–Nordic Seas exchanges, Prog. Ocea-nogr., 45, 109 – 208, doi:10.1016/S0079-6611(99)00052-X.
Harada, N., et al. (2006), Characteristics of al-kenone distributions in suspended and sinkingparticles in the northwestern North Pacific,
Geochim. Cosmochim. Acta, 70, 2045–2062,doi:10.1016/j.gca.2006.01.024.
Haug, G. H. (1996), Paleoceanography and se-dimentation history in the Northwest Pacificduring the last 6 Mio years (ODP Site 882),Ph.D. thesis, 142 pp., Geol.-Palaontol. Inst.und Mus., Christian-Albrechts-Univ., Kiel,Germany.
Haug, G. H., et al. (1995), Evolution of north-west Pacific sedimentation patterns since 6 Ma(Site 882), Proc. Ocean Drill. Program Sci.Results, 145, 293–314.
Haug, G. H., et al. (1999), Onset of permanentstratification in the subarctic Pacific Ocean,Nature, 401, 779–782, doi:10.1038/44550.
Haug, G. H., et al. (2005), North Pacific season-ality and the glaciation of North America2.7 million years ago, Nature, 433, 821 –825, doi:10.1038/nature03332.
Head, M. J., , and P. L. Gibbard (Eds.) (2005),Early middle Pleistocene transitions: Theland-ocean evidence, Geol. Soc. Spec. Publ.,247, 1–262.
Helmke, J. P., et al. (2003a), Development ofglacial and interglacial conditions in the Nor-dic seas between 1.5 and 0.35 Ma, Quat. Sci.Rev., 22, 1717– 1728, doi:10.1016/S0277-3791(03)00126-4.
Helmke, J. P., et al. (2003b), Evidence for a mid-Pleistocene shift of ice-drift pattern in the Nor-dic Seas, J. Quat. Sci. , 18 , 183 – 191,doi:10.1002/jqs.735.
Henrich, R., and K.-H. Baumann (1994), Evolu-tion of the Norwegian Current and the Scan-dinavian ice sheets during the past 2.6 m.y.:Evidence from ODP Leg 104 biogenic carbo-nate and terrigenous records, Palaeogeogr.Palaeoclimatol. Palaeoecol., 108, 75 – 94,doi:10.1016/0031-0182(94)90023-X.
Henrich, R., et al. (2002), Carbonate preserva-tion records of the past 3 Myr in the Norwe-gian-Greenland Sea and the northern NorthAtlantic: Implications for the history ofNADW production, Mar. Geol., 184, 17–39,doi:10.1016/S0025-3227(01)00279-1.
Heslop, D., et al. (2002), Timing and structure ofthe mid-Pleistocene transition: Records fromthe loess deposits of northern China, Palaeo-geogr. Palaeoclimatol. Palaeoecol., 185, 133–143, doi:10.1016/S0031-0182(02)00282-1.
Imbrie, J., et al. (1993), On the structure andorigin of major glacial cycles 2. The100,000-year cycle, Paleoceanography, 8,699–736, doi:10.1029/93PA02751.
Jaccard, S. L., et al. (2005), Glacial/interglacialchanges in subarctic North Pacific stratification,Science, 308, 1003–1006, doi:10.1126/science.1108696.
Jansen, E., et al. (1996), Site 983, Proc. OceanDrill. Program Initial Rep., 162, 139–167.
Kawagata, S., et al. (2005), Mid-Pleistocene ex-tinction of deep-sea foraminifera in the NorthAtlantic Gateway (ODP Sites 980 and 982),Palaeogeogr. Palaeoclimatol. Palaeoecol.,221, 267 – 291, doi:10.1016/j.palaeo.2005.03.001.
Kleiven, H. F., E. Jansen, W. B. Curry, D. A.Hodell, and K. Venz (2003), Atlantic Ocean ther-mohaline circulation changes on orbital to subor-bital timescales during the mid-Pleistocene,Paleoceanography, 18(1), 1008, doi:10.1029/2001PA000629.
Koc, N., et al. (1999), High-resolution Pleistocenediatom stratigraphy of Site 983 and correlationswith isotope stratigraphy, Proc. Ocean Drill.Program Sci. Results, 162, 51–62.
PA4214 MCCLYMONT ET AL: MID-PLEISTOCENE POLAR/ARCTIC WATERS
10 of 12
PA4214

Koster, R. D., J. Jouzel, R. Suozzo, G. Russell,W. Broecker, D. Rind, and P. Eagleson (1986),Global sources of local precipitation as deter-mined by the NASA/GISS GCM, Geophys.Res. Lett. , 13 , 121 – 124, doi:10.1029/GL013i002p00121.
Lear, C. H., et al. (2000), Cenozoic deep-seatemperatures and global ice volumes fromMg/Ca in benthic foraminiferal calcite,Science , 287 , 269 – 272, doi:10.1126/science.287.5451.269.
Lee, S.-Y., and C. J. Poulsen (2006), Sea icecontrol of Plio-Pleistocene tropical Pacific cli-mate evolution, Earth Planet. Sci. Lett., 248,238–247, doi:10.1016/j.epsl.2006.05.030.
Lisiecki, L. E., and M. E. Raymo (2005), APliocene-Pleistocene stack of 57 globallydistributed benthic d18O records, Paleocea-nography, 20 , PA1003, doi:10.1029/2004PA001071.
Liu, Z., and T. D. Herbert (2004), High-latitudeinfluence on the eastern equatorial Pacific cli-mate in the early Pleistocene epoch, Nature,427, 720–723, doi:10.1038/nature02338.
Marlow, J. R., et al. (2000), Upwelling intensi-fication as part of the Pliocene-Pleistoceneclimate transition, Science, 290, 2288–2291.
Marlowe, I. T., et al. (1990), Long-chain alke-nones and alkyl alkenoates and the fossil coc-colith record of marine sediments, Chem.Geol., 88, 349 – 375, doi:10.1016/0009-2541(90)90098-R.
McClymont, E. L., and A. Rosell-Mele (2005),Links between the onset of modern WalkerCirculation and the mid-Pleistocene climatetransition, Geology, 33, 389–392, doi:10.1130/G21292.1.
McClymont, E. L., et al. (2005), Alkenone andcoccolith records of the mid-Pleistocene inthe south-east Atlantic: Implications for theU37K0
index and South African climate, Quat.Sci. Rev., 24, 1559 – 1572, doi:10.1016/j.quascirev.2004.06.024.
McManus, J. F., et al. (2002), Thermohaline cir-culation and prolonged interglacial warmth inthe North Atlantic, Quat. Res., 58, 17–21,doi:10.1006/qres.2002.2367.
Medina-Elizalde, M., and D. W. Lea (2005), TheMid-Pleistocene transition in the tropical Pa-cific, Science, 310, 1009–1012, doi:10.1126/science.1115933.
Meggers, H., and K.-H. Baumann (1997), LatePliocene/Pleistocene calcareous plankton andpaleoceanography of the North Atlantic, inContributions to theMicropaleontology and Pa-leoceanography of the Northern North Atlantic,edited by H. C. Hass andM. A. Kaminski, Spec.Publ. 5, pp. 39–50, Grzybowski Found.,Cracow.
Mudelsee, M., and M. Schulz (1997), The Mid-Pleistocene climate transition: Onset of 100 kacycle lags ice volume build-up by 280 ka,Earth Planet. Sci. Lett., 151, 117 – 123,doi:10.1016/S0012-821X(97)00114-3.
Muller, P. J., et al. (1998), Calibration of thealkenone paleotemperature index U37
K0based
on core-tops from the eastern South Atlanticand the global ocean (60�N–60�S), Geochim.Cosmoch im . Ac t a , 62 , 1 757 – 1772 ,doi:10.1016/S0016-7037(98)00097-0.
O’Neill, T. A., et al. (2007), Pleistocene ex-tinctions of deep-sea benthic foraminifera:The South Atlantic record, Palaeontology,50, 1073 – 1102, doi:10.1111/j.1475-4983.2007.00702.x.
Opdyke, N. D. (1995),Mammalianmigration andclimate over the last seven million years, inPaleoclimate and Evolution: With Emphasis
on Human Origins, edited by E. S. Vrbaet al., pp. 109–114, Yale Univ. Press, NewHaven, Conn.
Oppo, D. W., M. E. Raymo, G. P. Lohmann,A. C. Mix, J. D. Wright, and W. L. Prell(1995), A d13C record of Upper North AtlanticDeep Water during the past 2.6 million years,Pa l e o c e a n o g r a p h y , 1 0 , 3 7 3 – 3 9 4 ,doi:10.1029/95PA00332.
Pearson, P. N., and M. R. Palmer (2000), Atmo-spheric carbon dioxide concentrations over thepast 60 million years, Nature, 406, 695–699,doi:10.1038/35021000.
Pflaumann, U., et al. (2003), Glacial NorthAtlantic: Sea-surface conditions reconstructedby GLAMAP 2000, Paleoceanography, 18(3),1065, doi:10.1029/2002PA000774.
Prahl, F. G., and S. G. Wakeham (1987), Calibra-tion of unsaturation patterns in long-chainketone compositions for palaeotemperatureassessment, Nature, 330, 367–369, doi:10.1038/330367a0.
Prahl, F. G., et al. (1988), Further evaluation oflong-chain alkenones as indicators of paleo-ceanographic conditions, Geochim. Cosmo-chim. Acta, 52, 2303 – 2310, doi:10.1016/0016-7037(88)90132-9.
Raymo, M. E., and K. Niscancioglu (2003), The41 kyr world: Milankovitch’s other unsolvedmystery, Paleoceanography, 18(1), 1011,doi:10.1029/2002PA000791.
Raymo, M. E., et al. (1990), Evolution of Atlan-tic-Pacific d13C gradients over the last 2.5 m.y,Earth Planet. Sci. Lett., 97, 353 – 368,doi:10.1016/0012-821X(90)90051-X.
Raymo, M. E., D. W. Oppo, B. P. Flower, D. A.Hodell, J. F. McManus, K. A. Venz, K. F.Kleiven, and K. McIntyre (2004), Stabilityof North Atlantic water masses in face of pro-nounced climate variability during the Pleisto-cene, Paleoceanography, 19 , PA2008,doi:10.1029/2003PA000921.
Rea, D. K., et al. (1993), Proceedings of theOcean Drilling Program, Initial Reports,vol. 145, Ocean Drill. Program, CollegeStation, Tex.
Rosell-Mele, A. (1998), Interhemispheric apprai-sal of the value of alkenone indices as tempera-ture and salinity proxies in high-latitudelocations, Paleoceanography, 13, 694–703,doi:10.1029/98PA02355.
Rosell-Mele, A., et al. (1994), Distributions oflong-chain alkenones and alkyl alkenoates inmarine surface sediments from the North EastAtlantic, Org. Geochem., 22, 501 – 509,doi:10.1016/0146-6380(94)90122-8.
Rosell-Mele, A., et al. (1995a), Determination ofthe U37
K index in geological samples, Anal.Chem. , 67 , 1283 – 1289, doi:10.1021/ac00103a021.
Rosell-Mele, A., et al. (1995b), Atlantic core-topcalibration of the U37
K index as a sea-surfacepalaeotemperature indicator, Geochim. Cos-mochim. Acta, 59, 3099–3107, doi:10.1016/0016-7037(95)00199-A.
Rosell-Mele, A., et al. (1998), Variability of theArctic front during the last climatic cycle: Ap-plication of a novel molecular proxy, TerraNova , 10 , 86 – 89, doi:10.1046/j.1365-3121.1998.00172.x.
Rosell-Mele, A., et al. (2002), Appraisal of amolecular approach to infer variations in sur-face ocean freshwater inputs into the NorthAtlantic during the last glacial, Global Planet.Change, 34, 143–152, doi:10.1016/S0921-8181(02)00111-X.
Ruddiman, W. F., and A. McIntyre (1979),Warmth of the subpolar North Atlantic Ocean
during Northern Hemisphere ice-sheet growth,Science , 204 , 173 – 175, doi:10.1126/science.204.4389.173.
Ruddiman, W. F., et al. (1980), Ocean evidencefor the mechanism of rapid Northern Hemi-sphere glaciation, Quat. Res., 13, 33 – 64,doi:10.1016/0033-5894(80)90081-2.
Ruddiman, W. F., et al. (1986), Paleoenviron-mental results from North Atlantic Sites 607and 609, Deep Sea Drill. Program InitialRep., 94, 855–878.
Sancetta, C., and S. Silvestri (1986), Pliocene-Pleistocene evolution of the North Pacificocean-atmosphere system, interpreted fromfossil diatoms, Paleoceanography, 1, 163–180, doi:10.1029/PA001i002p00163.
Sayag, R., E. Tziperman, and M. Ghil (2004),Rapid switch-like sea ice growth and landice – sea ice hysteresis, Paleoceanography,19, PA1021, doi:10.1029/2003PA000946.
Schefuß, E., et al. (2003), African vegetationcontrolled by tropical sea surface temperaturesin the mid-Pleistocene period, Nature, 422,416–421.
Schmieder, F., et al. (2000), The Mid-Pleistoceneclimate transition as documented in the deepSouth Atlantic Ocean: Initiation, interim state,and terminal event, Earth Planet. Sci. Lett.,179, 539–549, doi:10.1016/S0012-821X(00)00143-6.
Sejrup, H. P., et al. (2000), Quaternary glacia-tions in southern Fennoscandia: Evidencefrom southwestern Norway and the northernNorth Sea region, Quat. Sci. Rev., 19, 667–685, doi:10.1016/S0277-3791(99)00016-5.
Sicre, M. A., et al. (2002), Alkenone distribu-tions in the North Atlantic and Nordic sea sur-face waters, Geochem. Geophys. Geosyst.,3(2), 1013, doi:10.1029/2001GC000159.
Sikes, N. E. (1999), Plio-Pleistocene floralcontext and habitat preferences of sympatrichominid species in East Africa, in African Bio-geography, Climate Change, and Human Evo-lution, edited by T. G. Bromage and F. Schrenk,pp. 301–315, Oxford Univ. Press, New York.
Smith, L. M., et al. (2003), Sensitivity of theNorthern Hemisphere climate system to ex-treme changes in Holocene Arctic sea-ice,Quat. Sci. Rev., 22, 645–658, doi:10.1016/S0277-3791(02)00166-X.
St. John, K. E. K., and L. A. Krissek (1999),Regional patterns of Pleistocene ice-rafteddebris flux in the North Pacific, Paleoceano-g raphy, 14 , 653 – 662 , do i :10 .1029 /1999PA900030.
Swift, J. (1986), The Arctic waters, in The NordicSeas, edited by B. G. Hurdle, pp. 129–151,Springer, New York.
Tabata, S. (1975), The general circulation of thePacific Ocean and a brief account of the ocea-nographic structure of the North PacificOcean. Part I, circulation and volume trans-ports, Atmosphere, 13, 134–168.
Thierstein, H. R., et al. (1977), Global synchro-neity of late Quaternary coccolith datum levels:Validation by oxygen isotopes, Geology, 5,400 – 404, doi:10.1130/0091-7613(1977)5<400:GSOLQC>2.0.CO;2.
Tiedemann, R., and G. H. Haug (1995), Astro-nomical calibration of cycle stratigraphy forSite 882 in the northwest Pacific, Proc. OceanDrill. Program Sci. Res., 145, 283–292.
Tziperman, E., and H. Gildor (2003), On themid-Pleistocene transition to 100-ky glacialcycles and the asymmetry between glaciationand deglaciation times, Paleoceanography,18(1), 1001, doi:10.1029/2001PA000627.
PA4214 MCCLYMONT ET AL: MID-PLEISTOCENE POLAR/ARCTIC WATERS
11 of 12
PA4214

Wang, H., and I. N. McCave (1990), Distin-guishing climatic and current effects in mid-Pleistocene sediments of Hatton and GardarDrifts, NE Atlantic, J. Geol. Soc., 147, 373–383, doi:10.1144/gsjgs.147.2.0373.
Weatherly, J. W. (2004), Sensitivity of Antarcticprecipitation to sea ice concentrations in ageneral circulation model, J. Clim., 17,3214 – 3223, doi:10.1175/1520-0442(2004)017<3214:SOAPTS>2.0.CO;2.
Wright, A. K., and B. P. Flower (2002), Surfaceand deep ocean circulation in the subpolar
North Atlantic during the mid-Pleistocene re-volution, Paleoceanography, 17(4), 1068,doi:10.1029/2002PA000782.
Xiao, J., and Z. An (1999), Three large shifts inEast Asian monsoon circulation indicated byloess-paleosol sequences in China and lateCenozoic deposits in Japan, Palaeogeogr. Pa-laeoclimatol. Palaeoecol., 154, 179 – 189,doi:10.1016/S0031-0182(99)00110-8.
Yuan, X., and L. D. Talley (1996), The subarcticfrontal zone in the North Pacific: Characteris-tics of frontal structure from climatological
data and synoptic surveys, J. Geophys. Res.,101, 16,491–416,508.
�������������������������G. H. Haug, Geological Institute, Department
of Earth Sciences, ETH Zurich, Universitats-strasse 22, CH-8092 Zurich, Switzerland.J. M. Lloyd, Department of Geography,
University of Durham, Durham DH1 3LE, UK.E. L. McClymont, School of Geography,
Politics, and Sociology, Newcastle University,Newcastle upon Tyne NE1 7RU, UK.([email protected])A. Rosell-Mele, Institut de Ciencia i Tecnolo-
gia Ambientals, Universitat Autonoma de Barce-lona, E-08193 Bellaterra, Catalonia, Spain.
PA4214 MCCLYMONT ET AL: MID-PLEISTOCENE POLAR/ARCTIC WATERS
12 of 12
PA4214