
Acoustic ecology of marine mammals in polar oceans Ilse Van ...
337
Acoustic ecology of marine mammals in polar oceans Ilse Van Opzeeland 619 2010 ALFRED-WEGENER-INSTITUT FÜR POLAR- UND MEERESFORSCHUNG in der Helmholtz-Gemeinschaft D-27570 BREMERHAVEN Bundesrepublik Deutschland ISSN 1866-3192
-
Upload
khangminh22 -
Category
Documents
-
view
1 -
download
0
Transcript of Acoustic ecology of marine mammals in polar oceans Ilse Van ...

Acoustic ecology of marine mammals in polar oceans Ilse Van Opzeeland
619 2010
ALFRED-WEGENER-INSTITUT FÜR POLAR- UND MEERESFORSCHUNG in der Helmholtz-Gemeinschaft D-27570 BREMERHAVEN Bundesrepublik Deutschland
ISSN 1866-3192

Hinweis Die Berichte zur Polar- und Meeresforschung werden vom Alfred-Wegener-Institut für Polar-und Meeresforschung in Bremerhaven* in unregelmäßiger Abfolge herausgegeben. Sie enthalten Beschreibungen und Ergebnisse der vom Institut (AWI) oder mit seiner Unterstützung durchgeführten Forschungsarbeiten in den Polargebieten und in den Meeren. Es werden veröffentlicht:
— Expeditionsberichte (inkl. Stationslisten und Routenkarten)
— Expeditionsergebnisse (inkl. Dissertationen)
— wissenschaftliche Ergebnisse der Antarktis-Stationen und anderer Forschungs-Stationen des AWI
— Berichte wissenschaftlicher Tagungen
Die Beiträge geben nicht notwendigerweise die Auffassung des Instituts wieder.
Notice The Reports on Polar and Marine Research are issued by the Alfred Wegener Institute for Polar and Marine Research in Bremerhaven*, Federal Republic of Germany. They appear in irregular intervals.
They contain descriptions and results of investigations in polar regions and in the seas either conducted by the Institute (AWI) or with its support.
The following items are published:
— expedition reports (incl. station lists and route maps)
— expedition results (incl. Ph.D. theses)
— scientific results of the Antarctic stations and of other AWI research stations
— reports on scientific meetings
The papers contained in the Reports do not necessarily reflect the opinion of the Institute.
The „Berichte zur Polar- und Meeresforschung” continue the former „Berichte zur Polarforschung”
* Anschrift / Address Alfred-Wegener-Institut für Polar- und Meeresforschung D-27570 Bremerhaven Germany www.awi.de
Editor in charge: Dr. Horst Bornemann Assistant editor: Birgit Chiaventone
Die "Berichte zur Polar- und Meeresforschung" (ISSN 1866-3192) werden ab 2008 aus-schließlich als Open-Access-Publikation herausgegeben (URL: http://epic.awi.de). Since 2008 the "Reports on Polar and Marine Research" (ISSN 1866-3192) are only available as web based open-access-publications (URL: http://epic.awi.de)
Acoustic ecologyof marine mammals
in polar oceansIlse Van Opzeeland
Please cite or link this publication using the identifierhdl:10013/epic.36260 or http:/hdl.handle.net/10013/epic.36260
ISSN 1866-3192

All things make music
with their lives.
John Muir
Witte morgen waarin de sporen van
wat vannacht is gebeurd.
Wit woud dat vannacht een huis
is geweest, maar nu.
Het is morgen geworden, er is
gekomen, geweest, gegaan.
Het sneeuwt door dak en muren naar
binnen, er zal niets zijn gebeurd.
Rutger Kopland
Impressum: Ilse Catharina Van Opzeeland Alfred-Wegener Institute for Polar and Marine Research Am Handelshafen 26 27568 Bremerhaven, Germany
Ilse Catharina Van Opzeeland Gryteselven 8690 Hattfjelldal, Norway Email: [email protected] Die vorliegende Arbeit ist die inhaltlich unveränderte Fassung einer Dissertation, die im Juli 2010 dem Fachbereich Biologie der Universität Bremen zur Erlangung des akademischen Grades Doktor der Naturwissenschaften (Dr. rer. nat.) vorgelegt wurde.

Summary (Zusammenfassung, Samenvatting) 3
1. Preface 12
2. Synopsis 13
1. Motivation: Why study marine mammals in polar oceans? 13
2. Polar oceans 16
2.1 The Southern Ocean 16
2.2 The Arctic Ocean 18
3. Polar oceans as a habitat for marine mammals 20
3.1 Pinnipeds 21
3.2 Cetaceans 22
4. The importance of sound for marine mammals 25
4.1 Sound reception 25
4.2 Sound production 27
4.3 Anthropogenic noise sources and their impact on marine mammals 28
5. Acoustics as a research tool in polar oceans 33
5.1. PALAOA 36
6. Acoustic ecology 44
6.1 Individuality of pup calls in two ice-breeding pinniped species 50
6.2 Underwater vocal behaviour of Antarctic pinnipeds 51
6.3. Vocal behaviour of cetaceans recorded by PALAOA 54
6.4 Fish and increasing underwater noise levels 57
7. A broader perspective: the role of marine mammals in marine ecosystems 58
7.1 Bottom-up effects 58
7.2 Top-down effects 61
8. Outlook 63
8.1. Spatial extension 63
8.2. Temporal extension 65
9. Final note 68
10. References synopsis 69
1

3. Publications
I Insights into the acoustic behaviour of polar pinnipeds – current
knowledge and emerging techniques of study 80
II Management and research applications of real-time and archival
passive acoustic sensors over varying temporal and spatial scales 110
III Acoustic ecology of Antarctic pinnipeds 127
IV Multi-year patterns in the acoustic behavior of Antarctic pinnipeds 153
V Leopard seal (Hydrurga leptonyx) vocalizations from three Antarctic
locations 186
VI Geographic variation in vocalizations of pups and mother-pup
behavior of harp seals (Pagophilus groenlandicus) 210
VII Individual variation in pup vocalizations and absence of behavioural
signs of maternal vocal discrimination in Weddell seals
(Leptonychotes weddellii) 223
VIII Seasonal patterns in Antarctic blue whale (Balaenoptera musculus
intermedia) vocalizations and the bio-duck signal 250
IX Calling in the cold: pervasive acoustic presence of humpback whales
(Megaptera novaeangliae) in Antarctic coastal waters 279
IX.a Supplement to paper 9: Vocal repertoire of humpback whales near the
Eckström Ice Shelf 298
X A noisy spring: the impact of globally rising underwater sound levels
on fish 320
4. Acknowledgements 331
2

Summary
In polar habitats, research on marine mammals – including studies of the possible
ecological consequences of anthropogenic impact – is hampered by adverse climate
conditions restricting human access to these regions. Marine mammals are known to
produce sound in various behavioural contexts, rendering (hydro-)acoustic recording
techniques, which are quasi-omnidirectional and independent of light and weather
conditions, an apt tool for year round monitoring of marine mammal presence and
behaviour in polar habitats. Acoustic behaviour is shaped by the species-specific
behavioural ecology, as well as by abiotic, biotic and anthropogenic factors of the
animal’s living environment, a concept known as acoustic ecology. Acoustic ecology
thereby describes the interaction between an animal and its environment as mediated
through sound. An understanding of the acoustic ecology is important when interpreting
acoustic data, as the acoustic ecology of a species determines if physical presence results
in acoustic presence, on which temporal scale acoustic activity occurs and over which
spatial scales acoustic presence can be detected.
This thesis comprises ten manuscripts/papers, which are based on acoustic data collected
in the Southern and Arctic Oceans. All provide examples of how aspects of the acoustic
ecology of the species shape acoustic behaviour. In addition, the majority of
manuscripts/papers also illustrate how acoustic monitoring can provide information of
physical presence of marine mammals in areas where prolonged visual observations are
not possible.
The first two papers (I and II) provide an overview of acoustic monitoring techniques,
describing their use on various spatial and temporal scales and discussing the suitability
of various techniques for use and deployment in polar oceans.
Two further papers (VI and VII) investigate mother-pup interactions and the individuality
of pup calls in one Arctic and one Antarctic phocid species (harp, Pagophilus
groenlandicus and Weddell seal, Leptonychotes weddellii, respectively). For ice-breeding
pinnipeds, differences in ice habitat are likely to lead to inter-specific differences in
mother-pup behaviour, but might also explain behavioural differences between
3

populations of the same species. In harp seals, anthropogenic factors (hunting pressure)
might explain the differences observed between two study populations.
To explore temporal patterns in underwater acoustic behaviour of marine mammals in the
Southern Ocean, near-continuous, multi-year acoustic data from the PerenniAL Acoustic
Observatory in the Antarctic Ocean (PALAOA, 70°31’S 8°13’W, Ekström Ice Shelf), an
ice shelf based, energetically autonomous recording station were analysed in papers III,
IV,V,VIII, and IX.
Papers (III, IV and V) explore acoustic behaviour on various temporal scales in four
Antarctic pinniped species: Weddell, leopard (Hydrurga leptonyx), Ross (Ommatophoca
rossii) and crabeater seal (Lobodon carcinophaga) and interprets the findings in the
context of species-specific acoustic ecology; Weddell seals were acoustically present year
round, which likely relates to their behavioural ecology, i.e., territorial mating strategy
and potential advantages to males remaining in underwater territories almost year round.
Ross seals were never visually observed in the coastal area off PALAOA. Acoustic
monitoring nevertheless showed that they are physically present from December to
February. Leopard seal calls were recorded intermittently year round in three years,
reflecting that some (potentially juvenile) leopard seals remain in coastal areas during
austral winter.
Furthermore, the PALAOA data showed that humpback whales (Megaptera
novaeangliae) were present during nine months of the year, reflecting the potential
importance of coastal areas, such as the area off PALAOA, for animals wintering on the
feeding grounds (manuscript VIII). Similarly, Antarctic blue whale (Balaenoptera
musculus intermedia) calls were present year round, potentially reflecting that this
species also relies on coastal areas with open water during austral winter (manuscript IX).
In addition, seasonal patterns in acoustic presence an unknown sound source, the bio-
duck, were used to pose new hypotheses on the potential source of this signal.
The last paper (X) discusses the impact of anthropogenic noise on fish based on
comparative evidence from other species. The comparative approach of this study reflects
the idea that for animal taxa relying on sound for critical aspects of their behaviour, man-
made noise likely forms an important aspect of acoustic ecology.
4

Acoustic ecology forms the overarching concept that braces these publications. Given the
relatively sparse literature on this concept with respect to marine mammals, this synopsis
includes a first detailed conceptual description of acoustic ecology for polar habitats.
Particular emphasis thereby is given to the specific environmental conditions in polar
habitats and the looming threats of climatic change and other anthropogenic influences.
5

Zusammenfassung
Das akustische Verhalten mariner Säuger ist Teil ihres natürlichen, artspezifischen
Verhaltensrepertoires. Es wird durch biotische und abiotische Umweltfaktoren geprägt
und kann auch durch anthropogene Faktoren beeinflusst werden. Die wissenschaftliche
Untersuchung dieser Aspekte ist Gegenstand der akustischen Ökologie. Sie umfasst den
Gesamtkomplex der über Schall erfolgenden Wechselwirkungen zwischen Tier und
Umwelt und ist grundlegende Voraussetzung für die Interpretation akustischer Daten in
einem artspezifischen Kontext. Aus ihrer Kenntnis lässt sich ableiten, ob sich die
physikalische Präsenz einer Meeressäugerart in akustischer Präsenz widerspiegelt, auf
welchen Zeitskalen akustische Aktivitäten stattfinden und über welche Entfernungen
hinweg akustische Signaturen detektierbar sind.
Diese Dissertation umfasst zehn Publikationen (bzw. Manuskripte), die auf akustischen
Daten aus dem Südpolarmeer und den arktischen Meeresregionen basieren. Sie alle
stellen Beispiele dafür dar, wie einzelne Aspekte der akustischen Ökologie das akustische
Verhalten der jeweiligen Art beeinflussen. Darüber hinaus illustrieren die meisten
Manuskripte wie in Regionen, in denen längerfristige visuelle Beobachtungen nicht
möglich sind, Informationen zum Vorkommen von marinen Säugern mittels akustischer
Langzeitmessungen gewonnen werden können.
Die ersten beiden Publikationen (I und II) geben eine Übersicht über den Stand der
Technik akustischer Datenerhebungsmethoden, beschreiben deren Einsatzmöglichkeiten
auf unterschiedlichen Raum- und Zeitskalen, und diskutieren ihre Eignung für den
Einsatz in polaren Meeren.
Zwei weitere Publikationen (VI und VII) untersuchen die Mutter-Jungtier Beziehung und
die Individualität der Rufe von Jungtieren an jeweils einer arktischen und einer
antarktischen Hundsrobbenart (Sattelrobbe, Pagophilus groenlandicus und
Weddellrobbe, Leptonychotes weddellii). Die Ergebnisse des Vergleichs der Rufe beider
Eisrobbenarten deuten darauf hin, dass sich artspezifische Unterschiede in den
Vokalisationsmustern von Robbenmüttern und ihren Jungtieren ebenso wie Unterschiede
in den akustischen Signaturen lokaler Populationen der gleichen Art auf variierende
abiotische Faktoren wie Eis oder auch auf anthropogene Faktoren zurückführen lassen.
6

So könnte im Falle von Sattelrobben die Bejagung eine Erklärung für die beobachteten
Unterschiede zwischen den zwei untersuchten Populationen darstellen.
Zur Untersuchung von zeitlichen Mustern im Vokalisationsverhalten mariner Säuger im
Südpolarmeer wurden mehrjährige, quasi-kontinuierliche akustische
Unterwasseraufnahmen der autonomen Horchstation PALAOA (PerenniAL Acoustic
Observatory in the Antarctic Ocean, 70°31’S 8°13’W, Atka-Bucht, Ekström Schelfeis)
analysiert (Publikationen III, IV, V, VIII und IX). In diese Studien gehen
Aufzeichnungen des Observatoriums aus den Jahren 2006 bis 2009 ein.
Die Publikationen III, IV und V untersuchen auf unterschiedlichsten Zeitskalen das
akustische Verhalten der vier antarktischen Eisrobbenarten Weddellrobbe (Leptonychotes
weddellii), Seeleopard (Hydrurga leptonyx), Rossrobbe (Ommatophoca rossii) und
Krabbenfresser (Lobodon carcinophaga), und interpretieren die Ergebnisse im jeweiligen
artspezifischen akustisch-ökologischen Kontext. Weddellrobben sind in den akustischen
Aufzeichnungen des Observatoriums ganzjährig präsent. Diese akustische Präsenz
spiegelt sehr wahrscheinlich das territoriale Paarungsverhalten der männlichen Tiere
wieder. Es wird vermutet, dass ein ganzjähriges Verbleiben im Bereich des
Unterwasserterritoriums Vorteile bei der Partnerfindung mit sich bringt.
Bislang gab es keine Belege für Sichtungen von Rossrobben in der dem Observatorium
vorgelagerten Meereisregion um die Akta-Bucht. Die akustischen Aufnahmen zeigen
jedoch, dass sie sich dort regelmäßig von Dezember bis Februar einfinden. Rufe von
Seeleoparden wurden in den drei Jahren mit Unterbrechungen jeweils ganzjährig
aufgenommen, was darauf hindeutet, dass einige (möglicherweise juvenile) Seeleoparden
während des Südwinters in den Küstenregionen der Antarktis verbleiben.
Des Weiteren wiesen die PALAOA Daten die Präsenz von Buckelwalen (Megaptera
novaeangliae) während neun Monaten eines Jahres nach. Dies wird als Hinweis auf die
mögliche Bedeutung der Küstenregionen für die Überwinterung interpretiert (Manuskript
VIII). Gleichermaßen konnten akustische Signaturen von Antarktischen Blauwalen
(Balaenoptera musculus intermedia) ganzjährig erfasst werden, was eine Nutzung
küstennaher Polynjas auch während des Südwinters nahelegt (Manuskript IX). Zusätzlich
wurden anhand des Jahresganges eines bestimmten akustischen Signals, das bislang
7

generisch als “bio-duck” bezeichnet wird und noch keiner Tierart zugeordnet werden
konnte, neue Hypothesen zu den möglichen Quellen dieses Signals aufgestellt.
Die letzte Publikation (X) diskutiert den Einfluss von anthropogenem Lärm auf Fische
durch einen Vergleich mit entsprechenden Erkenntnissen von anderen Tierarten. Ein
solch vergleichender Ansatz basiert auf der Annahme, dass anthropogener Lärm für alle
Tierarten, die für kritische Aspekte ihres Verhaltens auf Schall angewiesen sind, einen
gleichermaßen bedeutsamen Aspekt ihrer akustischen Ökologie bildet.
Der dieser Dissertation zugrunde liegende Arbeitsansatz stützt sich auf das Modell der
akustischen Ökologie, die das verbindende Element der Publikationen dieser
Doktorarbeit darstellt. Bislang wurde dieses Modell jedoch kaum auf marine Säuger in
polaren Regionen angewandt. Die Synopse dieser Dissertation stellt die erste umfassende
konzeptionelle Beschreibung der akustischen Ökologie antarktischer mariner Säuger dar,
in der die spezifischen Umweltbedingungen der polaren Regionen ebenso wie die
drohenden Gefahren des Klimawandels und weiterer anthropogener Einflüsse besondere
Beachtung finden.
8

Samenvatting
Onderzoek naar mariene zeezoogdieren in poolgebieden – zoals studies naar de
ecologische consequenties van antropogene invloeden – wordt belemmerd door de
vijandige klimatologische omstandigheden die menselijke toegang tot deze gebieden
beperken. Mariene zeezoogdieren produceren geluid in verschillende gedragscontexten,
waardoor akoestische opname-technieken, die quasi-omnidirectioneel en onafhankelijk
van licht en weersomstandigheden zijn, een geschikte methode bieden om de
aanwezigheid en het gedrag van mariene zeezoogdieren in poolgebieden het hele jaar
door te monitoren. Akoestisch gedrag van mariene zeezoogdieren wordt gevormd door de
soort-specifieke gedragsecologie, maar ook door abiotische, biotische en antropogene
factoren uit de leefomgeving van het dier, een concept dat bekend staat als akoestische
ecologie. Akoestische ecologie beschrijft de interactie tussen een dier en zijn omgeving
gemedieerd door geluid. Inzicht in de akoestische ecologie is belangrijk voor de
interpretatie van akoestische gegevens, omdat de akoestische ecologie van een soort
bepaalt of fysieke aanwezigheid van een dier ook resulteert in akoestische aanwezigheid,
maar ook op welke tijdschaal een dier akoestisch actief is en over welke ruimtelijke
schaal akoestische aanwezigheid van een dier kan worden gedetecteerd.
Deze dissertatie omvat tien manuscripten, die gebaseerd zijn op gegevens verzameld in
de Zuidelijke en Arktische Oceanen. Allemaal verschaffen ze voorbeelden hoe aspecten
van de soort-specifieke akoestische ecologie het akoestisch gedrag van een soort
vormgeven. Daarnaast laat het meerendeel van de manuscripten zien hoe door middel van
akoestisch monitoren informatie over de fysieke aanwezigheid van mariene
zeezoogdieren kan worden verschaft in gebieden waar langdurige (visuele) observatie
niet mogelijk is. De eerste twee manuscripten (I en II) bieden een overzicht van
verschillende akoestische opname-technieken en beschrijven hoe deze op verschillende
tijd en ruimte schalen in pool-oceanen kunnen worden ingezet.
Manuscripten VI en VII beschrijven het onderzoek naar moeder-pup interacties en de
individualiteit van pup vocalisaties in een Arctische en Antarctische zeehondensoort uit
de familie Phocidae (respectievelijk, de zadelrob, Pagophilus groenlandicus en de
Weddell zeehond, Leptonychotes weddellii). Voor zeehondensoorten die ijs gebruiken als
9

platform voor geboorte en zorg voor pups, verklaren verschillen in ijs habitat
vermoedelijk de verschillen in het gedrag van moeder en pup, maar mogelijk ook de
verschillen tussen populaties van dezelfde soort. Voor zadelrobben speelt mogelijk de
jacht (antropogene factor) ook een rol in de verschillen die werden gevonden in gedrag
tussen de beide studiepopulaties.
In manuscripten III, IV, V, VIII en IX werden de tijdspatronen in onderwater vocalisaties
van mariene zeezoogdieren in de Zuidelijke Oceaan onderzocht middels semi-continue,
meer-jarige akoestische opnamen van PALAOA, een energetisch zelf-voorzienend
akoestisch observatorium op de Ekström Ice Shelf (70°31’S 8°13’W). Manuscripten III,
IV en V onderzoeken het akoestisch gedrag over verschillende tijdsschalen van vier
Antarctische zeehondsoorten: de Weddell zeehond, het zeeluipaard (Hydrurga leptonyx),
de Rosszeehond (Ommatophoca rossii) en de krabbenrob (Lobodon carcinophaga). De
bevindingen werden geinterpreteerd in de context van de soort-specifieke akoestische
ecologie; Weddell zeehonden waren het hele jaar akoestisch aanwezig, hetgeen
vermoedelijk is gerelateerd aan de gedragsecologie van deze soort. Weddell zeehonden
hebben een territoriaal paarsysteem, waarbij het mogelijk voordelig is voor mannelijke
dieren om het hele jaar in hun onderwater territorium aanwezig te blijven. Hoewel
Rosszeehonden nooit werden waargenomen in het kustgebied nabij PALAOA, blijkt uit
akoestische gegevens dat ze fysiek aanwezig zijn van December tot Februari. Zeeluipaard
vocalisaties waren met tussenpozen het gehele jaar aanwezig in PALAOA opnamen (over
drie jaar), hetgeen laat zien dat enkele (mogelijke juveniele) zeeluipaarden in de
kustgebieden blijven gedurende de winter.
Verder tonen de PALAOA opnamen de aanwezigheid van bultrug walvissen (Megaptera
novaeangliae) gedurende negen maanden van het jaar. Dit is mogelijk een indicatie voor
het belang van kustgebieden, zoals het gebied nabij PALAOA, voor bultruggen die
overwinteren in de Antarctische fourageergebieden (manuscript VIII). Vocalisaties van
Antarctische blauwe vinvissen (Balaenoptera musculus intermedia) waren eveneens het
gehele jaar aanwezig in de opnamen, wat er mogelijk op duidt dat de kustgebieden met
open water ook van belang zijn voor deze soort (manuscript IX). Daarnaast werd de
seizoensperiodiek in de aanwezigheid van een onbekend geluidssignaal, de ‘bio-duck’,
10

gebruikt om nieuwe hypothesen te formuleren met betrekking tot de mogelijke bron van
dit signaal.
In het laatste manuscript worden de invloeden van antropogeen onderwater geluid op
vissen bediscussieerd gebaseerd op de bevindingen van vergelijkend onderzoek aan
andere diersoorten. Deze vergelijkende benadering weerspiegelt het idee dat voor
diergroepen die voor veel aspecten van hun gedrag afhankelijk zijn van geluid, menselijk
lawaai vermoedelijk een belangrijk aspect vormt van de soort-specifieke akoestische
ecologie.
Akoestische ecologie vormt het omvattende concept van deze verschillende manuscripten
en publicaties. Gegeven de schaarse hoeveelheid literatuur over dit concept met
betrekking tot mariene zeezoogdieren, is in de synopse ook een gedetailleerde
conceptuele beschrijving van akoestische ecologie opgenomen. Bijzondere nadruk ligt
daarbij op de specifieke omgevingsfactoren van poolgebieden en de dreiging van
klimaatverandering en andere antropogene invloeden.
11

1. Preface
The data for the work in the Antarctic presented in this thesis were collected adhering to
the SCAR Code of Conduct. All necessary permits were obtained from the
Umweltbundesamt (UBA, Germany) for construction and maintenance of the PALAOA
acoustic observatory and to carry out the playback experiments on Weddell seals. For the
data collected in the Arctic, a scientific permit was issued under the Marine Mammal
Regulations (MMR, part of the Fisheries Act, USA) and the project was approved by the
DFO (Canada) animal care committee.
This thesis is a cumulative work, consisting of 3 published, and 1 accepted paper(s) and 4
manuscripts that are still in preparation (2) or submitted (2) for publication (referred to as
papers and manuscripts, respectively in the synopsis). Papers and manuscripts are
presented as independent pieces of work (chapter 3 of the thesis). Among these papers,
there is in some cases substantial cross-referencing and repetition of descriptions (e.g.
with respect to the details on data collection by PALAOA), which is inevitable given the
thesis format.
In the synopsis, I provide a motivation and background to the work presented in this
thesis, as well as an overarching framework on acoustic ecology, how the findings can be
interpreted in the context of acoustic ecology and the role of acoustic ecology in the
interpretation of acoustic data in general. Furthermore, I present an outlook of questions
emerging from the work presented in this thesis and future plans to address these.
12

2. Synopsis
1. Motivation: why study marine mammals in polar oceans?
The accumulating evidence of human impacts on marine mammals, such as commercial
and subsistence hunting, environmental contaminants, overfishing, habitat destruction,
climate change, marine debris and underwater noise, have raised the need for a better
understanding of how these processes relate to consequences on individual and
population levels. Such an understanding is urgently needed for the development of
conservation and mitigation measures to manage and protect marine mammals and their
habitats (e.g., Reynolds et al., 2009). Marine mammals can serve as sentinel species for
aquatic ecosystem health (Bossart, 2006; Moore, 2008). Given their long life spans, high
trophic level in the ecosystem and high fat stores that can serve as depots for
anthropogenic toxins, their physical condition is a valuable indicator of many human-
induced changes in the marine environment. Furthermore, environmental changes
resulting in behavioural responses may directly be reflected in spatio-temporal changes in
marine mammal distribution patterns.
Figure 1. Global map of cumulative human impacts based on an ecosystem-specific, multi-scale spatial
model. Analyses included 17 global data sets of anthropogenic drivers (e.g., different types of fishing,
presence of oil rigs, shipping traffic). Figure reproduced from Halpern et al., 2008.
13

Figure 1 shows a map of estimated spatial variation in human impacts (e.g., shipping,
fishing, pollution) on marine ecosystems, reflecting that no area is unaffected by human
influence, although areas of relatively low impact are associated particularly with high
latitudes (Halpern et al., 2008).
The threats for many marine mammal species in high latitude waters are nevertheless
likely to be no less severe than those in temperate and tropical regions: the current gaps in
knowledge on animals in their seasonal or permanent polar habitats, significantly
impedes our understanding of possible consequences of human-induced changes. In polar
areas, climatic conditions (seasonally) restrict human access; thereby complicating data
collection aimed at investigating how marine mammal distribution relates to
environmental factors and might be affected by e.g. climate-induced changes in ice
conditions.
In particular polar species, such as ice-breeding seals, narwhals and beluga whales, are
thought to be vulnerable to climate-induced perturbations affecting their permanent
habitat (Tynan & DeMaster, 1997; Siniff et al., 2008). Nevertheless, given the
importance of polar waters as a feeding area for many seasonally present marine mammal
species, the effect of human-induced changes to this habitat can affect marine mammal
populations beyond the period they spend in polar oceans. Noting that climate-induced
changes are believed to occur in polar regions at faster rates than elsewhere (e.g., Clarke
et al., 2007), it is vital to accurately describe and understand the state and diversity of
polar ecosystems in general, to reliably assess the extent of future changes and to
carefully evaluate the possible consequences for their inhabitants.
In the Arctic, recent computer projections of the National Snow and Ice Data Center have
indicated that the receding Arctic sea-ice will leave more and more areas partially or
largely ice-free year-round within the near future (Johannessen et al., 1999; Overpeck et
al., 2005). The ice-free areas open opportunities to re-route commercial vessel traffic
between the Pacific and Atlantic Ocean to take advantage of the open Northwest and
Northeast Passages. Alongside the ecological implications of changes in ice conditions
for marine mammals with ice-associated habitats (e.g. Tynan & DeMaster, 1997), an
14

increase in shipping activity and the year-round presence of vessels in these areas will
lead to increased noise levels, possibly additionally affecting marine mammals that
inhabit this area permanently or seasonally.
In the following sections, I provide a brief introduction to polar regions and polar marine
mammals. Thereafter I discuss why newly emerging acoustic recording techniques are
specifically suitable as a tool to collect data from these regions, the role of acoustic
ecology and how knowledge based on acoustic observations can contribute to further our
understanding of marine mammals in their polar habitats.
15

2. Polar oceans
The earth’s polar oceans comprise the Southern Ocean, with the Antarctic Convergence
being recognized as its natural northern boundary (CCMLAR, 1980), and the Arctic
Ocean, i.e., the ocean located within the Arctic Circle occupying the region around the
North Pole (Fig 2). Although the two polar oceans are strikingly similar in many aspects
of their overall ecology, dominated by cold conditions and the presence of sea-ice, both at
the same time strongly differ in atmospheric, oceanographic and biological features.
Figure 2. Maps of the earth’s polar oceans. Left: the Southern Ocean, with the Antarctic Convergence
(white dotted line, schematic representation of mean position of Antarctic Convergence) as its northern
boundary; right: the Arctic Ocean and the Arctic Circle (white dotted line).
2.1 The Southern Ocean
The Antarctic consists of a continent forming ~10% of the earth’s land surface. The
continent is surrounded by a dynamic, open ocean and an unusually deep continental
shelf, a side-effect of the weight of the ice sheet covering the continent (Knox, 2007).
Apart from the northern part of the Antarctic Peninsula, most of the Antarctic continent
lies south of the Antarctic Circle (66° 33’44 S), south of which continuous daylight
prevails during austral summer, and continuous darkness during austral winter. The
natural northern boundary of the Southern Ocean is formed by the Antarctic Convergence
(or Polar Front), which forms a sharp temperature boundary between northern temperate
waters and southern polar waters (Fig 2). The Southern Ocean’s sea ice canopy offers
16

substantial seasonal habitat heterogeneity, reaching up to 20x106 km2 during winter and
receding to less than 4x10⁶ km2 in austral summer (Knox 2007; Fig 3). Furthermore, the
seasonal cycle of formation and melt of the circumantarctic sea ice is in itself of high
significance to the Antarctic marine ecosystem, particularly for krill.
Austral summer Austral winter
Figure 3. Maps of the sea ice concentration in the Southern Ocean. Left: Example of a day with minimal
sea ice extent (31 January 2009); Right: Example of a day with maximal sea ice extent (11 August 2009).
Maps provided by www.seaice.de (Spreen et al., 2008).
Krill, holding a central position in the Antarctic food web, provides the food base for a
wide range of fish, squid, birds and marine mammals. Although many aspects of the
relationship between krill abundance and sea ice are still under discussion (see Siegel,
2005 for a review), it is generally believed that ice-edge algal blooms form an important
and predictable food source for krill, while under-ice biota provide krill protection from
predators and a food source during austral winter and spring (Knox, 2007). Given its
important role as the food base for many marine mammal species, krill is thought to be
one of the important drivers behind marine mammal distribution.
17

2.2 The Arctic Ocean
The Arctic Ocean is characterized by extensive shallow shelf seas surrounding a largely
land-locked ocean, influenced by seasonal air and freshwater fluxes from the surrounding
continents. The Arctic Ocean has a permanent cover of slowly circulating multi-year ice
floes surrounded by a zone of seasonal pack ice and a zone of land-fast ice (e.g.,
Stonehouse, 1989; Fig 4). Sea ice coverage in the far North is relatively stable, with sea
ice melt occurring primarily at the periphery. Consequently, a large part of the Arctic sea
ice consists of multi-year ice. However, this situation may change rapidly within the next
decades, as the Arctic sea ice recently showed substantial decreases in both extent and
thickness in response to global warming (IPCC, 2007). In winter, maximum sea ice cover
is 13.9x10⁶ km2, while in summer 6.2x10⁶ km2 of the Arctic Ocean is ice-covered
(Johannessen et al., 1999).
Boreal summer Boreal winter
Figure 4. Maps of the sea ice concentration in the Arctic. Left: Example of a day with minimal sea ice
extent (1 September 2009); Right: Example of a day with maximal sea ice extent (16 March 2009). Maps
provided by www.seaice.de (Spreen et al., 2008).
18

Although the planktonic base of the food supply of marine predators such as fish, birds,
pinnipeds and cetaceans is broadly similar across all latitudes, the key prey organisms
differ between polar oceans. In the North, benthos and fish form the most important prey
for marine mammals (e.g., Smetacek & Nicol, 2005). Arctic cod (Boreogadus saida) is
one of the pivotal fish species in the Arctic marine ecosystem occurring mainly in
marginal ice zones (Andriashev, 1970; Ainley & DeMaster, 1990). The ice-edge habitat
is critical for Arctic cod since the level of recruitment depends on the availability of the
crustacean species on which cod larvae feed that in turn depend on ice-edge algal blooms
(Drolet et al., 1991). In addition, benthic communities in coastal areas form an additional
important food resource utilized by birds and marine mammals (Dayton et al., 1994)
19

3. Polar oceans as a habitat for marine mammals
The highly productive polar waters attract many marine mammal species. Depending on
the costs and benefits of movement, pinnipeds and cetaceans migrate between tropical or
temperate marine regions and polar oceans, follow the seasonal waxing and waning of
sea-ice or remain in their polar habitat year round. The pinniped species covered in this
thesis live year round in close association with ice (Arctic: harp seal, Pagophilus
groenlandicus; Antarctic: Weddell seal, Leptonychotes weddellii; leopard seal, Hydrurga
leptonyx; Ross seal, Ommatophoca rossii; crabeater seal, Lobodon carcinophaga, Fig 5).
The cetacean species covered in the chapters of this thesis are humpback (Megaptera
novaeangliae) and Antarctic blue whales (Balaenoptera musculus intermedia) (Fig 6),
which undertake seasonal migrations between feeding grounds in cold productive polar
waters and breeding areas in tropical or temperate waters. Although some species
covered in this thesis are thus only seasonal inhabitants of polar oceans, all species are
considered true Arctic or Antarctic species, given that they depend either directly or
indirectly on polar oceans for critical portions of their life histories (Boyd, 2002).
Figure 5. The five pinniped species covered in this thesis, a) the Antarctic Weddell seal (Leptonychotes
weddellii), b) the Antarctic leopard seal (Hydrurga leptonyx), c) the Antarctic Ross seal (Ommatophoca
rossii), d) the Antarctic crabeater seal (Lobodon carcinophaga), and e) the Arctic harp seal (Pagophilus
groenlandicus). Pictures a, d and e by I. Van Opzeeland. Pictures b and c by J. Plötz.
a) b) c)
d) e)
20

Figure 6. The two cetacean species covered in this thesis, a) the Southern Hemisphere humpback whale
(Megaptera novaeangliae), picture by I. Van Opzeeland and b) the Antarctic blue whale (Balaenoptera
musculus intermedia), picture by NOAA.
3.1 Pinnipeds
Dispersal of pinnipeds into polar areas is thought to have commenced with the evolution
of large body size in ancestral pinnipeds (Costa, 1993). In Costa’s (1993) model, early
pinnipeds exhibited a primitive form of otariid breeding patterns, with females requiring
numerous short-duration foraging trips to sustain lactation. The evolution towards a
larger body size enabled females to separate foraging from lactation as females had
increased maternal reserves to rely on. This temporal separation of foraging and breeding
is thought to finally have enabled these basal phocids to inhabit and reproduce in
seasonally less-productive areas, in relative absence of resource competitors. Upon
reaching higher latitudes, development of a shortened lactation period would have pre-
adapted these early phocids to breeding on unstable substrates, such as ice (Costa, 1993).
Apart from a number of physiological adaptations for life in ice-dominated environments,
such as sharp and strong claws for locomotion on the ice, the lanugo fur of pups and thick
subcutaneous blubber layers, polar pinnipeds also developed remarkable behavioural
adaptations to life in their habitat. In temperate regions, the onset of parturition in
terrestrial breeding pinnipeds is to a large extent determined by ambient temperature
(Boyd, 1991). Polar pinnipeds, however, depend on ice for breeding. Consequently,
parturition occurs in late winter and early spring, when snow accumulation is at a
maximum and the ice is most extensive and stable, minimizing pup mortality as a result
of ice breakup (Pierotti & Pierotti, 1980). As the period of optimal ice and foraging
a) b)
21

conditions is relatively short, pupping is generally synchronous within ice-breeding
pinniped populations compared to pinnipeds breeding on land. Given that the lactation
period is generally relatively short in phocids, lasting one to six weeks, depending on
species, precociality of young is necessary so that pups can forage and defend themselves
independently at an early age. The number of offspring produced per reproductive cycle
in pinnipeds is typically limited to one, which is likely a consequence of the greater
parental investment necessary to produce precocial young.
In some ice-breeding pinniped species, such as harp and Ross seals, spatial and temporal
disparity in resources (i.e., mates and/or food) leads to migratory movements between
different areas of their home range, although the spatial scale of movement generally
does not extend beyond the polar ocean (e.g., Ridgway & Harrison, 1981). However, the
scale and pattern of movement of many migratory species can differ between individuals,
depending on sex, age and reproductive status (Ridgway & Harrison, 1981; Dingle &
Drake, 2007). Other species are more stationary and remain in the breeding area year
round (e.g., Green & Burton 1988; Rouget et al., 2007; paper III and IV), which might
have beneficial consequences for mating success in territorial species such as Weddell
seals (paper III).
Within the ice habitats of polar pinnipeds, there exists considerable variation which
appears to influence behavioural patterns and the timing of behaviour (Trillmich 1996;
Lydersen & Kovacs 1999). Variability in the temporal and structural stability of the haul-
out platform, risk of predation, availability of food within the breeding habitat and access
to the water are factors that are thought to have resulted in the evolution of e.g., different
mating systems (papers I and III) and maternal strategies (paper I, VI and manuscript
VII) with each ice-breeding species filling its own niche within the polar ocean habitat.
3.2 Cetaceans
Only few cetacean species that occur in polar waters are exclusive to these regions. The
narwahl (Monodon monoceros), bowhead (Balaena mysticetus) and beluga whale
(Delphinapterus leucas) are strictly Arctic in their distribution, whereas exclusively polar
22

species are absent in the Southern Hemisphere. The difference between both polar oceans
in the evolution of cold water forms of marine mammals is thought to relate to
bathymetric differences: the relatively closed basin of the Arctic Ocean hinders marine
mammal movement to warmer waters, whereas the unconfined northern boundary of the
Southern Ocean allows relatively unconstrained meridional migration (Davies, 1963).
Cetaceans benefit from polar habitats through the association between prey availability
and ice rather than from the direct needs of ice for breeding or resting like pinnipeds.
Breeding in these cetacean species takes place at lower latitudes in temperate or tropical
waters (Corkeron & Conner, 1999).
Evolution of cetacean presence in polar oceans is thought to be related to the gradual
retreat of cold productive waters from lower to higher latitudinal regions in the
interglacial (i.e., warmer) periods (Stern, 2002). During the last glacial maximum
(~20.000 years ago), the glacial ice sheet extended to much lower latitudes compared to
the present situation. When the ice sheet retreated towards the poles in the interglacial
period, the availability of sunlight for photosynthesis in cold water regions became more
variable between seasons, leading to seasonal peaks in cold water primary productivity.
Whale distribution is thought to have followed this retreat of cold productive water
towards the poles, which has also been suggested one of the driving forces behind the
bipolar (or anti-tropical) distribution of some cetacean species (i.e., north-south species
pairs e.g., Berardius spp, Eubalaena spp, Davies, 1963; Fordyce, 2002).
While odonocetes are generally more variable in their distribution patterns and migratory
behavior, all baleen whale species, except bowhead (Balaena mysticetus) and Bryde’s
whales (Balaenoptera edeni)1, undertake seasonal migrations between feeding grounds in
cold productive polar waters and their breeding areas in relatively unproductive tropical
or temperate waters. Corkeron & Conner (1999) revisited several hypotheses as to why
baleen whales undertake these long-distance migrations to return to tropical or temperate
waters for breeding. They concluded that the most likely hypotheses driving baleen whale
migration are those related to calf growth and survival, i.e., the benefits of the absence of
killer whales in the wintering areas and the presence of calm water. However, there is
1 Bowhead and Brydes whales remain in polar and tropical waters, respectively.
23

substantial evidence for various baleen whale species that not all individuals of a
population undertake the annual migration and that part of the population is present on
the feeding grounds in winter, presumably to avoid the energetic demands of migration
(manuscript VIII and IX).
Much of the current knowledge on cetaceans is based on directed and incidental takes or
stranded animals. These offered the possibility to collect a suit of morphological and
physiological data, although the potential of information that could be obtained from such
material is often not maximally exploited (e.g., Corkeron, 2009a). Large gaps still exist in
what is known on cetacean stock structures and behavioural patterns, such as migration,
and breeding strategies. Such information is essential to understand population status of
marine mammals and the factors that threaten their persistence and/or population
recovery over time. Commercial whaling severely depleted whale stocks, with many
whale populations reduced to less than 10% of their original abundance (e.g., Best, 1993).
Humpback whales were in many cases the first species taken and frequently hunted to
commercial extinction (Clapham et al., 1999). Humpback whales in the Southern
Hemisphere were target of illegal Soviet catches in the 1960s: while 2710 humpback
whales were reported to have been landed, the actual total was more than 48 000
(Yablokov et al., 1994). Overall, it is not unlikely that many humpback whale
populations were reduced by more than 90% of their initial population sizes (Clapham et
al., 1999). Blue and fin whale populations in the Southern Hemisphere also were
reduced to a fraction of their original abundance with over 350,000 and 700,000 whales
killed, respectively (Clapham & Baker, 2002). Blue whales are now thought to number
approximately 1% of their pre-exploitation abundance, increasing at an annual rate of
7.3% (though the confidence interval on this rate of increase is wide, 1.4-11.6%, Branch
et al., 2007). Even less is known about fin whales, with no recently accepted abundance
estimates, and no currently accepted estimates of trends in abundance (NMFS, 2006).
24
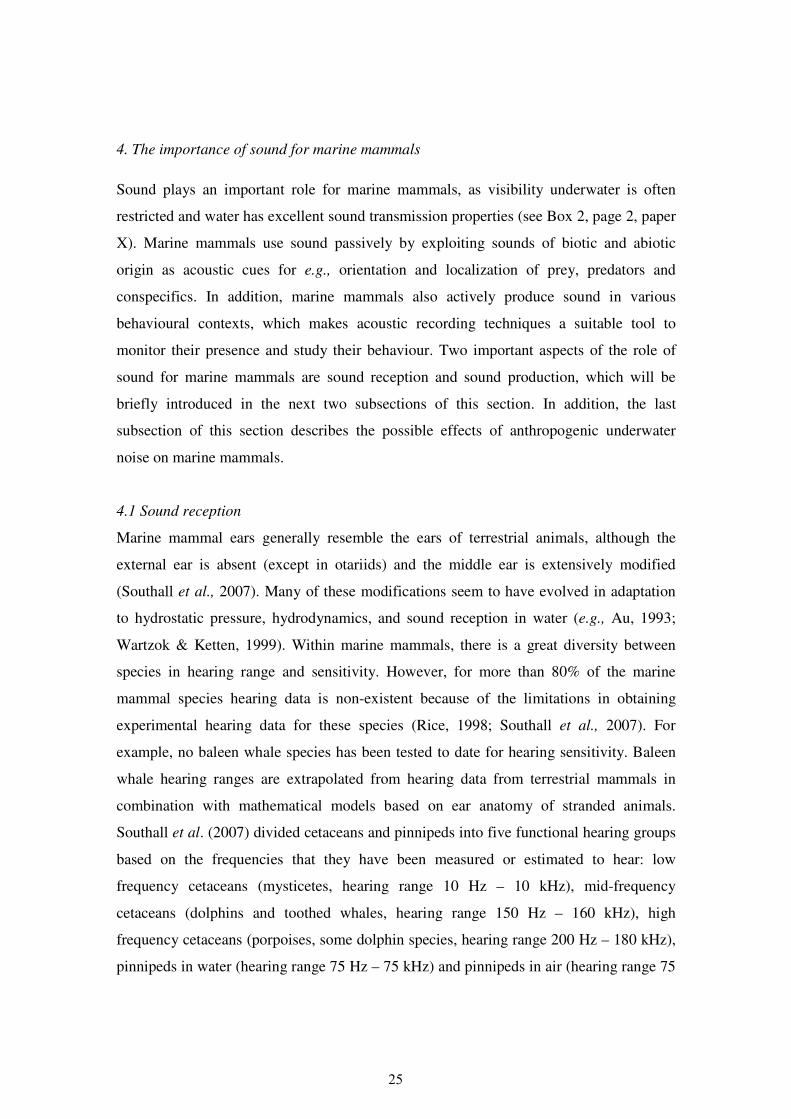
4. The importance of sound for marine mammals
Sound plays an important role for marine mammals, as visibility underwater is often
restricted and water has excellent sound transmission properties (see Box 2, page 2, paper
X). Marine mammals use sound passively by exploiting sounds of biotic and abiotic
origin as acoustic cues for e.g., orientation and localization of prey, predators and
conspecifics. In addition, marine mammals also actively produce sound in various
behavioural contexts, which makes acoustic recording techniques a suitable tool to
monitor their presence and study their behaviour. Two important aspects of the role of
sound for marine mammals are sound reception and sound production, which will be
briefly introduced in the next two subsections of this section. In addition, the last
subsection of this section describes the possible effects of anthropogenic underwater
noise on marine mammals.
4.1 Sound reception
Marine mammal ears generally resemble the ears of terrestrial animals, although the
external ear is absent (except in otariids) and the middle ear is extensively modified
(Southall et al., 2007). Many of these modifications seem to have evolved in adaptation
to hydrostatic pressure, hydrodynamics, and sound reception in water (e.g., Au, 1993;
Wartzok & Ketten, 1999). Within marine mammals, there is a great diversity between
species in hearing range and sensitivity. However, for more than 80% of the marine
mammal species hearing data is non-existent because of the limitations in obtaining
experimental hearing data for these species (Rice, 1998; Southall et al., 2007). For
example, no baleen whale species has been tested to date for hearing sensitivity. Baleen
whale hearing ranges are extrapolated from hearing data from terrestrial mammals in
combination with mathematical models based on ear anatomy of stranded animals.
Southall et al. (2007) divided cetaceans and pinnipeds into five functional hearing groups
based on the frequencies that they have been measured or estimated to hear: low
frequency cetaceans (mysticetes, hearing range 10 Hz – 10 kHz), mid-frequency
cetaceans (dolphins and toothed whales, hearing range 150 Hz – 160 kHz), high
frequency cetaceans (porpoises, some dolphin species, hearing range 200 Hz – 180 kHz),
pinnipeds in water (hearing range 75 Hz – 75 kHz) and pinnipeds in air (hearing range 75
25

Hz – 30 kHz). The highest hearing sensitivities are usually in the animal’s own sound
production frequency range (Southall et al., 2007).
The distance over which sound is detected by a receiver, the bioacoustic space, consists
of multiple spatial scales over which sound can convey information to a receiver (Clark et
al., 2009). Examples of different bioacoustic space types are the range over which a
listening animal detects sounds from a calling conspecific (communication space) and the
range over which an animal can detect signals from other species (produced by e.g., prey
or predators) or abiotic sources such as oceanographic features (but see Table 1 for
summary of different bioacoustic space types).
Sound Source Receiver
Self Conspecific Other species Abiotic source
Self Echolocation (navigation, food finding)
Communication Predator, Food finding
Navigation, Food finding
Conspecific Communication Eavesdropping, Bi-static navigation Bi-static food finding
NA Bi-static navigation
Other species Detection by predator
Bi-static food finding Eavesdropping NA
The size of a bioacoustic space is determined by physical factors such as local
background noise levels and propagation properties of the medium in which the animal
communicates (i.e., water depth, sea-floor substrate), but also by receiver characteristics,
such as hearing sensitivity. The calling animal (passively and to some extend actively,
e.g., Brumm & Slabbekoorn 2005) determines the range over which signals can be
detected by the source level, directivity and frequency band (i.e., low frequency sounds
transmit over larger distances than high frequency sounds) of the sounds produced. Size
and shape of any bioacoustic space can vary in space and time, depending on species and
Table 1. Table providing an overview of the different types of acoustic spaces. NA: not applicable.
Reprinted from Clark et al. 2009.
26

the factors mentioned above. Knowledge on the acoustic characteristics of
communication signals can therefore reveal many aspects of behavioural ecology and the
physical environment in which animals live and communicate.
4.2 Sound production
Along with many other marine animals, marine mammals use sound in social contexts,
for orientation, prey detection and to respond to the presence of predators. A
comprehensive summary that illustrates the many kinds of sounds with variable physical
properties that are produced by marine mammals is provided by Richardson et al. (1995).
Mysticete cetacean species (baleen whales) range and can communicate over micro (< 1
km2) to synoptic (>2000 km2, Orlanski, 1975) scales (Moore et al., 2006). In some baleen
whale species, low frequency calls are also thought to play a role in orientation (Clark &
Ellison, 2004). Odontocete species (toothed whales, dolphins and porpoises) tend to
range and communicate over micro- to mesoscale areas (1 - 2000 km2, e.g. Tyack, 2000),
producing sounds over a wider frequency range (e.g. Richardson et al., 1995). Sounds
within the human hearing range of these species are mostly social sounds (e.g., whistles
and pulsed calls), whereas high frequency clicks are used for echolocation. Pinnipeds
produce sounds both in air and in water. Their sounds also cover a wide range of
frequencies and play a role in mother-pup recognition, male-male competition, and for
males to attract females during the breeding season (Insley et al., 2003; Van Parijs, 2003;
paper I). Pinnipeds are bound to land or ice for breeding and moulting; therefore, access
to land or ice is a fixture of their life histories. Acoustic behaviour in pinnipeds ranges
from local (<1 km) to mesoscales with communication occurring both in air and in the
water near haul-out sites on transit routes and foraging grounds (paper II). Given that
marine animals communicate acoustically across such widely differing spatial scales,
inter-specific differences in communication scales have to be taken into account in both
the study design and interpretation of the data (paper II), as will also be further discussed
in paragraph 5.
27

4.3 Anthropogenic noise sources and their impact on marine mammals
Anthropogenic noise can affect marine mammals in various ways (Fig 7), depending on
factors such as the behavioural context in which an animal is exposed to the sound, the
hearing sensitivity of the receiving animal, the received sound exposure level and the
duration and duty cycle of the sound source (see for reviews Richardson et al., 1995;
NRC, 2003; Nowacek et al., 2007; Southall et al., 2007). Nevertheless, much of the
mechanisms behind the effects of noise on marine mammals is still not understood, which
is also illustrated by the body of literature in which no apparent effect is reported (e.g.,
Richardson et al., 1995; Southall et al., 2007). Here I only included studies describing
an effect as this section merely serves to illustrate the range of impacts man-made noise
can have on marine mammals.
Figure 7. Schematic representation of noise zones and severity of potential consequences for marine
mammals. Concentric circles (left) indicate zones of possible direct influence of sound on individual
animals. Color bar (right) indicates range of potential consequences of acoustic exposure. White arrows
symbolize the relation between direct influences to potential consequences, each standing for specific risk
scenarios. The arrow from behavioral response to ‘Death’ specifically refers to scenarios discussed for
beaked whale response to mid-frequency sonar (see section 4.3.5). Consequences of sound exposure
depend on factors, such as exposure duration and additional abetting factors (e.g., ocean temperature, health
state of the exposed individual). Figure by O. Boebel.
28

4.3.1. Masking
The effects of masking of sounds (Fig 7) are mainly determined by the type of sound that
is masked (e.g., sounds produced by predators, prey) and the duration of the period that
sounds are masked. Croll et al. (2002) suggested that the increased low frequency noise
levels in the ocean, as a result of the increase in commercial shipping (Payne & Webb,
1971; McDonald et al., 2006), may mask low frequency vocalizations and affect
encounter rates between male and female fin whales, thereby potentially disrupting
breeding behaviour. Fin whale (Balaenoptera physalus) males are thought to use low
frequency reproductive advertisement displays to attract females over long distances (i.e.,
~100-200 km, Cummings & Thompson, 1971) for the purpose of mating (Croll et al.,
2002). A reduced communication range in combination with the typical separation of
individuals during the breeding season, with possibly even larger inter-individual
distances compared to pre-whaling population sizes, could impact populations that are
still recovering from past overexploitation, such as blue and fin whales. In addition,
masking might also affect the likelihood of detecting prey and potential predators
(Richardson et al., 1995).
4.3.2 Behavioural responses
Behavioural responses to anthropogenic sound sources are – with one notable exception
discussed in section 4.3.5 – thought to be transient in nature and are therefore generally
regarded as among the least severe in their impact, although impact severity is strongly
dependent on behavioural context during which exposure occurs (e.g., Southall et al.,
2007). Studies have reported animals to modify their vocal behaviour in response to the
presence of noise sources. Beluga whales (Delphinapterus leucas), manatees (Trichechus
manatus) and Northern right whales (Eubalaena glacialis) were found to increase vocal
effort in response to elevated ambient noise conditions, known as the Lombard effect in
humans (Scheifele et al., 2005; Miksis-Olds & Tyack, 2009; Parks et al., 2010). Miller et
al. (2000) found that humpback whales lengthen their song in the presence of low-
frequency active sonar, presumably to compensate for acoustic interference. Pacific
humpback dolphins (Sousa chinensis) were found to increase the number of whistles in
response to the passage of boats, suggesting that noise from transiting vessels affects
29

dolphin group cohesion (Van Parijs & Corkeron, 2001). Blue whales were found to call
more during periods within a seismic survey, possibly reflecting a similar effect as found
in Pacific humpback dolphins (Di Iorio & Clark, 2009). Reduced call rates or complete
cessation of vocalizations in response to the presence of anthropogenic sound have also
been documented for various species (e.g., Watkins & Schevill, 1975; Bowles et al.,
1994; Rendell & Gordon, 1999). Other behavioural reactions to human-made sound
include avoidance reactions and deflections from migratory routes in response to
industrial sounds (Malme et al., 1983; Richardson et al., 1985, but see Southall et al.,
2007 for a complete overview of behavioural responses).
4.3.3. Temporal threshold shifts (TTS)
In some cases, exposure to human-made sound can result in threshold shifts in hearing
sensitivity that are temporal and reversible in nature (Fig 7). Depending on the severity of
temporal hearing loss, the animal’s ability to communicate with conspecifics, detect prey
and potential predators is temporarily compromised (see Southall et al., 2007 for a
summarizing discussion).
4.3.4. Permanent threshold shifts (PTS)
When the sound source to which animals are exposed is sufficiently loud, this can result
in a permanent threshold shift in hearing sensitivity. Permanent threshold shifts are
considered an auditory injury and affect fitness and survival of the impacted individual
permanently, impairing its ability to communicate with conspecifics, detect prey and
potential predators (Southall et al., 2007).
4.3.5. Injury and death
Over the last decades a number of beaked whale (family Ziphiidae) mass strandings
coincided with naval active sonar exercises (see Cox et al., 2006 for a review). This has
raised concerns that certain sounds from naval mid-frequency sonars could directly or
indirectly result in death of beaked whales and several mechanisms by which exposure to
mid-frequency sonar may lead to strandings have been proposed (e.g., Cox et al., 2006;
Rommel et al., 2006). One of the hypotheses is that mid-frequency sonars generate an
30

avoidance reaction involving repetitive shallow dives in an attempt to maximize the
horizontal distance travelled away from the sound source (Zimmer & Tyack, 2007).
Marine mammals have several adaptations to counter the effects of decompression
sickness (DCS), such as alveolar collapse during deep dives which limits lung and blood
gas exchange to shallow dive depths (Scholander, 1940). Zimmer and Tyack (2007)
proposed that the gas-bubble lesions observed in many stranded beaked whales (e.g.
Jepson et al., 2003), may have been caused by the fact that these shallow avoidance dives
do not exceed the depth of alveolar collapse, leading to DCS-like symptoms. The strength
of the beaked whale avoidance reaction to mid-frequency sonar has been attributed to the
similarity of the sonar sound to the calls of killer whales, the primary predator of beaked
whales (Zimmer & Tyack, 2007). Although beaked whales appear particularly vulnerable
to these noise sources, other species have also stranded following naval sonar exercises
(see Weilgart, 2007).
4.3.6. Research needs: chronic noise exposure
There is a clear need for more information to better understand the effects of
anthropogenic sound sources and how these affect marine mammal populations (NRC,
2003; 2005; ESF, 2008). Studies on the effects of noise on marine mammals have since
long mainly focussed on injury and changes in behaviour as a result of short-term
exposure to man-made sound (i.e., sonar, seismic sources). However, the potential
chronic impacts of rising noise levels in the ocean, such as the long-term effect of
masking of vocalizations, is now also becoming topic of investigation (e.g., Hatch et al.,
2008; Clark et al., 2009). Nevertheless, unravelling the many aspects of the impact of
long-term chronic noise exposure on marine mammals and the marine ecosystem (i.e.,
prey species) is not straightforward. One of the key recommendations of reports on the
impact of noise on marine mammals emphasizes the need to establish ‘noise budgets’, an
accounting of the relative contributions of various sources to the total (local) noise field,
for areas in the ocean (NRC, 2003). Information on noise budgets can be used to identify
and characterize spatial and temporal patterns of noise sources and will aid in the
development of models to predict how the presence of specific noise sources affects the
various bioacoustic spaces of animals, e.g., species-specific communication ranges (e.g.,
31

Clark et al., 2009). Such knowledge is a prerequisite for development of management
strategies to protect the acoustic environment of marine habitats.
32

5. Acoustics as a research tool in polar oceans
Historically, visual surveying from ships, shore-stations, and aircraft is the standard
method for taking a census of marine mammals (e.g., Eberhardt et al., 1979; Wilson et
al., 1996). When sighting data is collected systematically with surveys conducted along
line transects, estimates on the total number of animals in a population can be obtained
from the number of animals detected during the survey (e.g., Anderson, 1979;
Calambokidis & Barlow, 2004). Visual observations depend on favourable weather and
light conditions and the presence of a team of observers on-site. Observer fatigue and the
limited human visual field render a continuous effort and omnidirectional data collection
difficult. In polar areas, weather conditions can be particularly adverse year round with
heavy storms and fog. Outside the summer period, favourable sighting conditions are
further restricted by limited daylight hours. In contrast to visual observation, acoustic
recorders can be operated autonomously, are quasi-omnidirectional and independent of
light and weather conditions, providing the option of studying animals at night and under
conditions where visual observation is not possible (Table 2). Nevertheless, passive
acoustic monitoring depends on marine mammals to produce sound; a precondition that
cannot be taken for granted in all cases and something that should be taken into account
in the interpretation of acoustic data (see also section 6).
Acoustic techniques only recently entered the range of easily accessible research tools, as
significant advances in audio and computer technology now allow the acquisition and
handling of large acoustic data sets. Acoustic techniques have become increasingly
important as a tool for remote sensing the behaviour of various marine mammal species
(e.g., Stafford et al., 1998; McDonald & Fox, 1999; Janik, 2000; Johnson & Tyack, 2003;
Mellinger et al., 2007). Passive acoustic recording techniques can be used to monitor
responses of marine mammals to environmental change on various time and spatial
scales. By coupling environmental data to recordings, it is possible to combine on-site
measurements of acoustic activity with biological or oceanographic features (Stafford et
al., 2009). In addition, passive acoustic monitoring can be used to study anthropogenic
impacts on marine mammals such as the presence of underwater noise sources (Di Iorio
33

Factor of influence Visual observations Acoustic observations
Sensitivity to light,
weather, ice conditions Yes No
Cue Surface (e.g., blow, foot print, body part
Underwater (e.g.,calls, clicks)
Detection range < 3 km > 10 km
Directionality Directional Quasi-omnidirectioal
Personnel Intensive Extensive
Potential for bias Subjective Objective, Repeatable, Comparable
Identification of
individuals and groups Yes Difficult
Counts of absolute
number of animals in
groups observed
Yes No - Acoustic absence does not always mean physical absence
Potential to recount
same individual Yes Yes
Table 2. Comparison of visual and acoustic observation. After Erbe 2000.
& Clark, 2009). Acoustic recordings can be used to identify stocks on the basis of
regional dialects, providing information on movement and association patterns of animals
e.g., between different populations or areas (e.g., Noad et al., 2000; McDonald et al.,
2006). Furthermore, to monitor population recovery, acoustic data can be used for
relative abundance estimations based on call density measurements at multiple
geographic locations (McDonald & Fox, 1999; Marques et al., 2009). Relative abundance
estimates can be compared across different recording locations over multiple years to
provide a measure of population growth, trends in distribution and seasonal presence over
time (e.g., Stafford et al., 2009).
34

In the end, the research question or purpose determines which instrumentation features,
such as the possibility of recording over longer time spans, the need for a vessel or on-
site operators, or the access to real-time data, are required to collect the appropriate
acoustic data. Paper II discusses how passive acoustic recording techniques can be
applied over a range of spatial and temporal scales and provides examples of research and
management applications. Figure 8a provides an overview of various types of acoustic
instrumentation and compares spatial and temporal scales of observation. With the
exception of acoustic tags (i.e., small acoustic recorders that are temporarily attached to
marine mammals), acoustic techniques can generally be concluded to collect data over
larger temporal and spatial scales compared to visual surveys. When positional accuracy
in relation to the number of individuals that can be monitored is compared, visual
surveys, acoustic tags, ship-towed hydrophone arrays and arrays of 3 autonomous
hydrophones provide much more accurate data on position and on a substantially larger
number of individuals compared to other (e.g., cables hydrophone arrays or a single
autonomous hydrophone) monitoring techniques (Fig 8b).
a) b)
Figure 8. a) Approximate temporal and spatial scales over which acoustic data are collected using an
acoustic recording tag on a single individual, an autonomous hydrophone, a vessel towed array or a
bottom-mounted cabled hydrophone array, in comparison with the temporal and spatial scales of visual
surveys. b) Approximate range of accuracy and number of individuals covered using an acoustic
recording tag on an individual animal, a single autonomous hydrophone, a vessel towed array composed
of 3 or more hydrophones, and 2 or more cabled hydrophone arrays. Figures by D.K. Mellinger,
reprinted from paper II.
35

Nevertheless, not all acoustic techniques are equally well suited for collecting data in
polar areas, as the specific physical conditions of polar environments complicate the use
of certain acoustic instrumentation types. Paper I presents an overview of new and
emerging passive acoustic recording techniques and discusses their suitability for use in
polar environments. For example, ship-towed hydrophone arrays can be used in ice-
covered areas, but high noise levels generated by icebreaker vessels towing the array
mask the majority of animal vocalizations (Leaper & Scheidat, 1998). Autonomous
acoustic recording devices can be used in polar environments, but only in areas deeper
than 400 m so that drifting icebergs cannot cause damage to moored instruments. The
presence of ice also complicates the use of acoustic tags when these come off under the
ice or in areas that are not easily accessible, hampering retrieval of the tag. Cabled
recording stations have the advantage that they can record continuously and over broad
frequency bandwidths, allowing real-time monitoring and - in the case of a hydrophone
array - localization of marine mammals, while having few restrictions to data storage,
data access and power supply. However, in polar environments, acoustic monitoring
using a network of hydrophones connected by cables to shore-based stations would
require substantial cable length, increasing the chances of damage due to ice movements
and cable melt-in. One exception represents the PerenniAL Acoustic Observatory in the
Antarctic Ocean (PALAOA), which features the advantages of a cabled system using an
ice shelf based, energetically autonomous recording station, but uses a wireless local area
network to transfer acoustic data to the nearby German Antarctic Neumayer Station III.
5.1. PALAOA
PALAOA is located at 70°31’S 8°13’W (Fig 9), on the Ekström Ice Shelf, located on the
eastern Weddell Sea coast (Boebel et al., 2006; Kindermann et al., 2008; Klinck, 2008).
The ice shelf here has a thickness of about 100 m, with about 160 m of water between the
base of the ice shelf and the ocean bottom (Fig 10).
Acoustic recordings are made continuously year-round with two hydrophones suspended
to about 80 m below the ice shelf. The hydrophones were lowered on their cables through
two boreholes (separated by 300 m) and connected to the energetically autonomous
PALAOA station (see Kindermann et al., 2008 for more detailed information).
36

DronningMaud Land
Neumayer
South Pole
DronningMaud Land
Neumayer
South Pole
1000 m
2000 m2500 m
4500 m
a)
b)
c)DronningMaud Land
Neumayer
South Pole
DronningMaud Land
Neumayer
South Pole
Figure 9. a) Bathymetry map showing the location of PALAOA on the Eckström Ice Shelf (white star) and
the location of the German Antarctic Neumayer Station II (black star). Inset image: map of Antarctica
showing the location of Neumayer Station II (black star). b) aerial picture of PALAOA on the ice shelf
taken from the East (within Atka Bay), c) the PALAOA station on the ice shelf. Pictures: picture b by AWI
Logistics Department, picture c by L. Kindermann.
Figure 10. Schematic representation of the PALAOA array, with PALAOA station in the middle and four
hydrophones extending from it. Since January 2006, only the central and the western hydrophone are
operational. The central hydrophone location is equipped with a CTD sensor which simultaneously collects
oceanographic data. Hydrophones were deployed through boreholes through the approximately 100m thick
ice shelf and suspend approximately 80 m under the ice shelf. The distance between PALAOA and
Neumayer Station II is ~15km (~21km to Neumayer Station III). Figure from Klinck 2008.
37

After conversion from analogue to digital signals, PALAOA uses a wireless local area
network link to transmit acoustic data as a stream from PALAOA to the German
Antarctic Neumayer Station III (Neumayer Station II until March 2009). At Neumayer
Station, the stream is segmented into MP3 files of 1 minute duration, saved locally and
transported to Bremerhaven, Germany, twice a year (Fig 11). High quality data can be
buffered on request at PALAOA and Neumayer Station and downloaded through an FTP
link for detailed analysis. For immediate processing, the audio is compressed and
transmitted in near-real time from Neumayer Station to Bremerhaven via a satellite link.
In Bremerhaven, the audio stream is also made publicly accessible
(www.awi.de/acoustics).
Ne
um
ayer S
tatio
n
PC @
Neumayer BaseHigh quality data via FTP
High quality data via disk exchange
Livestream
24 kBit OGG-Vorbis
All Files
2x per
year
AWI
WLAN link
mp3 stereo stream (32kHz/16bit)
PA
LA
OA
Sta
tio
n
Germany
Internet Radio
http://icecast.awi.de
Long-term storage of data
PANGAEA
ship
sate
llite
Reson VP2000
amplifier/filter
Reson TC4032/4033
hydrophones
BARIX
Instreamer
PC &
MOTU Traveler
USB
hard disk
High
quality
data
(192kHz/
24bit)
World
Figure 11. Data handling of acoustic data from PALAOA to Bremerhaven. Within PALAOA (blue
background), acoustic recordings are streamed as 16 Bit, 32 kHz mp3 files and transferred to Neumayer
Station through a WLAN link. High quality (i.e., 24 bit 192 kHz) data can be stored locally on USB hard
discs and transferred to Neumayer Station (grey background) through disc exchange or can be downloaded
from PALAOA through FTP. At Neumayer Station, acoustic recordings are cut into 1-min files,
compressed into ogg-vorbis, and transmitted in near-real time to Bremerhaven (green background) via
satellite link. High quality data tapes are shipped to Bremerhaven. In Bremerhaven, real time data are
stored and made publicly accessible via the internet (pink background) in near real time, while high quality
acoustic data are archived in PANGAEA (Publishing Network for Geoscientific and Environmental Data).
38

To date (July 2010), PALAOA has overall covered almost a full year (99.7%) over the
complete period that the observatory has been operational. Per year, PALAOA has
covered 45, 65, 72 and 91% (in minutes recorded) of the year for 2006, 2007, 2008 and
2009, respectively. As to 2010, PALAOA has so far not had any major outages and
covered 49% of the year (Fig 12).
PALAOA yearly coverage 2006 – 2010
To
tal re
cord
ing
tim
e p
er
yea
r (d
ays)
Figure 12. Overview of the yearly amount of time that PALAOA was operational over 2006-
2010. Total recording time in days per year. Black bars indicate coverage for each year and in
2010 coverage until 16 July 2010 (46% relative to entire 2010, 93% relative to 16 July 2010).
Blue bar represents an optimistic estimation of the PALAOA coverage over the whole of 2010.
Figure by L. Kindermann.
5.1.1 PALAOA’s spatial scale
The spatial scale over which PALAOA can record marine mammal vocalizations is
largely dependent on the acoustic characteristics of calls; high frequency pinniped
vocalizations are likely to be recorded only from animals vocalizing within a few tens of
kilometers offshore of PALAOA, with leopard and Ross seal vocalizations propagating
39

over larger distances than Weddell seal vocalizations2. Low frequency humpback whale
calls were estimated to be detected within a range of 200 km off PALAOA (paper VIII).
Sirovic et al. (2007) reported similar ranges for blue whale calls, which have been
detected up to 200 km from acoustic bottom recorders deployed at ~3000m depth. A
comparison of on- and off-shelf acoustic ranges for low-frequency air-gun signals shows
no significant difference for these two depth regimes (Boebel et al., 2009), suggesting
that the acoustic ranges of blue whale calls reported by Sirovic et al. (2007) likely also
apply to the PALAOA recordings from the shelf.
Given that PALAOA records with two spatially separated hydrophones, recordings can
be used to determine the direction of a sound source. The determination of the position of
a sound source, however, would require the deployment of additional autonomous
recorders. In the outlook more detailed information is provided on such a planned spatial
extension of the PALAOA recordings.
5.1.2 PALAOA’s time scale
PALAOA has been recording since December 2005 (~4.5 years by now, Fig 12) with an
expected additional life-span of another 1-3 years, primarily depending on stability of the
ice shelf on which the observatory is located. This time frame allows investigation of
research questions regarding processes at time scales ranging from seconds (e.g., call
characteristics) to interannual patterns in vocal behaviour (see also paper II).
The systematic mapping of the biological sound sources present in the PALAOA
recordings and their temporal variation on different time scales was one of the primary
goals of this PhD project and required a two-step process. First, by systematically hand-
browsing one year of sub-sampled PALAOA recordings, information on the presence and
monthly variation of vocal behaviour of various marine mammal species was obtained.
For pinnipeds, PALAOA recordings from 20063 were sub-sampled (paper III), whereas
2 Measurements of the range over which PALAOA records pinniped calls are yet not available, but will be subject of experiments during the forthcoming field season. 3 The PALAOA data from 2006 were used for this analysis because at the time when this PhD project started, in June 2007, the PALAOA data from 2006 was the only data set covering a complete year.
40

for low frequency baleen whale vocalizations, data from 2008 and 20094 were used
(manuscript VIII.a and IX, respectively, Fig 13). This baseline knowledge on vocal
behaviour was necessary to develop automated detection algorithms, which were then
used to explore annual variability in vocal behaviour (manuscript IV and VIII).
0
10
20
30
40
50
60
70
80
90
100
Uptim
e [%
of m
onth
]
Jan 2006
Feb 20
06
Mar 20
06
Apr 200
6
May 20
06
Jun 2006
Aug 200
6
Sep 200
6
Oct 200
6
Dec 200
6
Jan 2007
Feb 20
07
Mar 20
07
Apr 200
7
Jun 2007
Jul 2007
Aug 200
7
Sep 200
7
Oct 200
7
Nov 200
7
Dec 200
7
Jan 2008
Feb 20
08
Mar 20
08
Apr 200
8
May 20
08
Jun 2008
Jul 2008
Aug 200
8
Sep 200
8
Oct 200
8
Nov 200
8
Dec 200
8
Jan 2009
Feb 20
09
Mar 20
09
Apr 200
9
May 20
09
Jun 2009
Jul 2009
Aug 200
9
Sep 200
9
Oct 200
9
Nov 200
9
Dec J A J O J A J O J A J O J A J O
100
50
0
2006 2007 2008 2009
CO
VE
RA
GE
(%
OF
MO
NT
H)
Automated analysis
Automated analysis
Manual analysis
Manual analysis
Pinnipeds
Humpback whale
Overview of PALAOA data analyses
Blue whale & bio-duck
Figure 13. Monthly coverage of PALAOA data from 2006-2009 and overview of PALAOA data analyses
of which the results are presented in this thesis. For pinnipeds, analyses comprised manual analysis over
2006 and automated analysis of PALAOA data from 2006, 2007, 2008 and the first two months of 2009.
For humpback whales, automated detection analysis was performed on data from 2008. For blue whales
and the bio-duck signal, analysis comprised manual analysis of 2009 data.
Alongside the investigation of acoustic behaviour on various time scales, PALAOA’s
perennial data set offers the unique opportunity to investigate the representativeness of
sub-sampling strategies for manual acoustic analyses and autonomous acoustic recorders.
Autonomous acoustic recorders can be set to a sub-sampling strategy that maximizes the
chance of detecting the focal species while minimizing energetic and data storage
requirements. Using sub-sampling strategies can significantly extend the operational
4 Analyses of the PALAOA data focusing on the low frequency part of the spectrum (<100Hz) were performed in 2010, which allowed selecting a year with minimum recording gaps, i.e., 2009, during which 91% of the year was covered.
41

period of a recorder, which is also beneficial in terms of reducing the logistic effort of
recorder retrieval (particularly in polar environments). Alternatively (or in addition),
information on vocal repertoire can be used for automated detection algorithms
incorporated in the firmware of the recording device to automatically start recording
when specific calls or sounds are detected, while otherwise in remaining in sleep mode.
This can save up to 1/2 - 2/3 of operation power (M. Motz, pers. comm.).
The findings presented in this thesis, as based on analyses of PALAOA data, provide
baseline information on vocal behaviour of marine mammals in the high Antarctic. The
current PALAOA recordings represent a relatively undisturbed5 Antarctic soundscape.
On a short time scale, it is possible to use the PALAOA data and baseline knowledge on
the local soundscape to investigate impact of the presence of ships, occasional
geophysical seismic activity and loud natural sound events such as iceberg collisions in
the vicinity of the observatory. On a larger time scale, comparison of PALAOA data to
future recordings from the same region enables investigation of how e.g., climate-induced
changes have influenced the local soundscape. Even if the recordings are interrupted for
decades, future studies will be able to use the PALAOA data as a baseline reference to
evaluate changes over long time spans.
The ecological scale on which a species interacts with its environment is a chief
determinant in assessing which time scales are appropriate for investigation. Ecological
scale is determined by the species’ intrinsic life history characteristics and can vary in
time from years to centuries in marine mammals (Moore, 2009). Frankham and Brook
(2004) argued that to address conservation issues, e.g., to investigate population recovery
of large baleen whale species that were subject to whaling, observations at generational
time scales are generally most appropriate. Although the PALAOA data set in itself is not
suitable to address questions on generational time scales, when combined with other data
sets it provides an important piece of the puzzle (see Outlook, section 8.1 – the SORP
project).
5 With the exception of whaling; the large scale reduction of whale stocks is likely to have had substantial consequences for the soundscape in the Southern Ocean.
42

In conclusion, the PALAOA recordings allow the description of the vocal behaviour of
marine mammals in a high Antarctic habitat on various time scales, which can be used to
optimize sampling strategies for analysis and acoustic recorders, to develop automated
detection algorithms. Furthermore, it allows studying the effects of short term human-
induced changes in the local soundscape and comparison of the local soundscape over
longer (e.g., decadal) time scales to investigate the impact of changes in the ecosystem.
Lastly, the PALAOA data also provide a first insight into the functioning of an ‘acoustic
ecosystem’ in a - from the human perspective - remote region like the Antarctic. This
aspect will be further discussed in the next section.
43

6. Acoustic ecology
Acoustic ecology describes the interaction between an animal and its environment as
mediated through sound. Figure 14 represents the various factors that can influence
acoustic behaviour of polar marine mammals6. Together, these factors form the acoustic
ecology of a species. The behavioural ecology of a species influences vocal behaviour
(arrow A). Behavioural ecology entails the evolutionary and ecological basis for animal
behaviour and the role of behaviour in the adaptation of an animal to its living
environment. Examples of behavioural ecological factors that can influence vocal
behaviour are mating strategy, distribution patterns (e.g., migratory behaviour and home
range) and breeding system (e.g., maternal strategies, length of the lactation period). In
turn, behavioural ecology is influenced by abiotic and biotic factors from the
environment (arrow B and C). The presence of prey and predators can for example affect
marine mammal distribution patterns (arrow C), whereas ice conditions influence mating
strategy (arrow B, e.g., Van Parijs, et al. 2004; paper I). Biotic factors can influence
acoustic behaviour for example when the presence of predators leads to reduced vocal
activity (e.g., Jefferson et al., 1991) or when specific feeding calls are produced during
foraging (e.g., D’Vincent et al., 1985; arrow D). Abiotic factors can influence vocal
behaviour directly, for example when changes in local soundscape7 result in changes in
the source level of animal vocalizations (arrow E). Abiotic factors are also of influence
on biotic factors (arrow F), e.g., when ice conditions determine prey distribution. Finally,
anthropogenic factors such as climate-driven changes and anthropogenic underwater
noise can impact ice conditions and local soundscapes (arrow G and H), respectively,
thereby having the potential to indirectly influence acoustic behaviour. Anthropogenic
factors can also directly influence the behavioural ecology of a species (arrow I), for
6 Although the figure presents examples of abiotic factors specific to marine mammals in polar oceans (e.g.,‘ice conditions’), the basic figure in principle applies to all animals relying on sound for critical aspects of their behaviour. 7 Many elements producing the sounds within a soundscape are biotic in origin (e.g., sounds produced by conspecifics, prey); nevertheless, I list soundscape as abiotic factor given its effect on e.g., vocal behaviour (or any of the other factors) which is mediated through the sound (i.e., physics) of the source, rather than the source’s physical presence. Listing soundscape as abiotic factor also enables inclusion of abiotic sound sources (e.g., glacier calving, iceberg collisions) which also form important aspects of the soundscape in large parts of polar oceans.
44

example by affecting behaviour or distribution patterns through hunt (e.g., Branch et al.,
2007; Wirsing et al., 2008).
Variation in acoustic behaviour e.g., in temporal patterns of vocal activity, vocal
repertoire size and composition, reflects inter-specific differences in the factors that shape
this relationship. In analogy to ecology, each species might be thought of as filling its
own acoustic ecological niche, shaped by internal and external factors and interactions
between both. Without an understanding of the factors and processes that determine and
influence the acoustic repertoire of a species, call patterning, individual and group calling
behaviour as well as seasonal and regional variation in call usage, no coherent research or
management question can be addressed using acoustic tools (paper II). It is the acoustic
ecology of a species that determines if physical presence also results in acoustic presence,
on what temporal scale acoustic activity takes place and over which spatial scales
acoustic presence can be detected. A solid understanding of the acoustic ecology of
marine mammals is also likely to contribute to further insights into the mechanism by
which anthropogenic noise sources impact various aspects of the lives of marine
mammals. Passive acoustic monitoring is only really useful when the results are
interpreted in the context of the acoustic ecology of the animals and in a regionally and
seasonally appropriate context (paper II).
As mentioned previously in section 5, acoustic monitoring of marine mammals relies on
animals producing sounds. Acoustic data is therefore in many cases almost per definition
‘presence-only’ data. Nevertheless, once the understanding of the acoustic ecology of a
species is sufficient, it is also possible to draw conclusions on absence of animals based
on acoustic data. In the PALAOA data, year-round acoustic presence of Weddell seals,
blue and humpback whales provides evidence for year-round physical presence of these
species in the area off PALAOA (paper III and manuscripts IV, VIII, IX). A sudden
absence of their calls over a certain period could therefore, but still not necessarily has
to8, indicate their physical absence. By contrast, the exclusively seasonal acoustic
8 Given that there is still much to be learned on the acoustic ecology of these species.
45

Anthropogenic
factorsClimate change
Underwater noise
Anthropogenic
factorsClimate change
Underwater noise
Anthropogenic
factorsClimate change
Underwater noise
II
Figure 14. Schematic representation of the acoustic ecology of polar marine mammals, showing the
interactions between behavioural ecology, biotic and abiotic factors as well as anthropogenic factors shaping
acoustic behavior.
presence of Ross seals in austral summer demonstrates their seasonal presence, but does
not necessarily imply their absence in austral winter. This could either imply their
migration out of the coastal region or that they only vocalize during the mating season
while remaining present but silent for the remainder of the year, in analogy to e.g.,
harbour seals (Phoca vitulina, Van Parijs et al., 1997). For pinnipeds, ‘out-of-season’
acoustic presence (e.g., manuscript IV, and crabeater seal calls in the PALAOA
recordings in April, I. Van Opzeeland pers. obs.) might indicate that animals do
(occasionally) vocalize outside the mating season and that acoustic absence can be
46

interpreted as an indicator for physical absence. Nevertheless, it is important to maintain
caution when interpreting acoustic absence in terms of physical absence of animals, in
particular when little in known on the factors that shape and determine acoustic
behaviour. Figure 15 shows that acoustic observations can be used to assess physical
presence of a species when its sounds are recorded, while whether or not physical
presence of a species results in acoustic presence is mediated by its acoustic ecology.
Acoustic observations
Acoustic observations
Physical
presence
Physical
presence
Acoustic
presence
Acoustic
presence
3c3c 4c4c 6a6a 7a
1a1a
Behavioral ecology
Mating system
Distribution
Behavioral ecology
Mating system
Distribution
Acoustic behaviorCall rates
Temporal variability
Acoustic behaviorCall rates
Temporal variability
Anthropogenic factors
Climate change
Underwater noise
Anthropogenic factors
Climate change
Underwater noise
8888
4b4b
3b3b
3a3a
4a4a
6b6b
55 7b7b
22
1b1b
Biotic factorsPrey
Predators
Biotic factorsPrey
Predators
Abiotic factorsSoundscape
Ice conditions
Abiotic factorsSoundscape
Ice conditions
Figure 15. Schematic representation of interrelation between physical and acoustic presence. Numbers
correspond to numbers in the first column of Table 3, which lists the main findings/hypotheses of each
paper presented in this thesis.
47
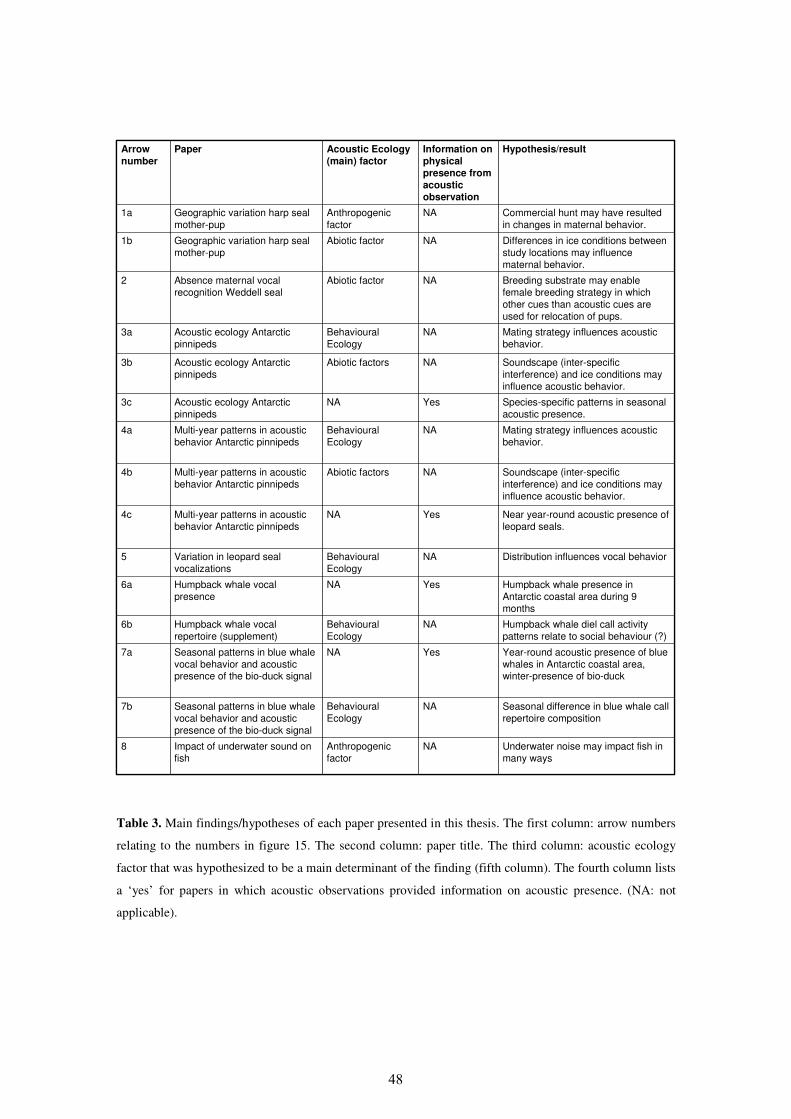
Table 3. Main findings/hypotheses of each paper presented in this thesis. The first column: arrow numbers
relating to the numbers in figure 15. The second column: paper title. The third column: acoustic ecology
factor that was hypothesized to be a main determinant of the finding (fifth column). The fourth column lists
a ‘yes’ for papers in which acoustic observations provided information on acoustic presence. (NA: not
applicable).
Humpback whale diel call activity
patterns relate to social behaviour (?)
NABehavioural
Ecology
Humpback whale vocal
repertoire (supplement)
6b
Year-round acoustic presence of blue
whales in Antarctic coastal area, winter-presence of bio-duck
YesNASeasonal patterns in blue whale
vocal behavior and acoustic presence of the bio-duck signal
7a
Differences in ice conditions between
study locations may influence
maternal behavior.
NAAbiotic factorGeographic variation harp seal
mother-pup
1b
Soundscape (inter-specific
interference) and ice conditions may
influence acoustic behavior.
NAAbiotic factorsAcoustic ecology Antarctic
pinnipeds
3b
Mating strategy influences acoustic
behavior.
NABehavioural
Ecology
Acoustic ecology Antarctic
pinnipeds
3a
Species-specific patterns in seasonal
acoustic presence.
YesNAAcoustic ecology Antarctic
pinnipeds
3c
Mating strategy influences acoustic
behavior.
NABehavioural
Ecology
Multi-year patterns in acoustic
behavior Antarctic pinnipeds
4a
Soundscape (inter-specific
interference) and ice conditions may
influence acoustic behavior.
NAAbiotic factorsMulti-year patterns in acoustic
behavior Antarctic pinnipeds
4b
Near year-round acoustic presence of
leopard seals.
YesNAMulti-year patterns in acoustic
behavior Antarctic pinnipeds
4c
NA
NA
Yes
NA
NA
NA
Information on physical presence from acoustic observation
Distribution influences vocal behaviorBehavioural
Ecology
Variation in leopard seal
vocalizations
5
Humpback whale presence in
Antarctic coastal area during 9
months
NAHumpback whale vocal
presence
6a
Seasonal difference in blue whale call
repertoire composition
Behavioural
Ecology
Seasonal patterns in blue whale
vocal behavior and acoustic
presence of the bio-duck signal
7b
Underwater noise may impact fish in
many ways
Anthropogenic
factor
Impact of underwater sound on
fish
8
2
1a
Arrow number
Breeding substrate may enable
female breeding strategy in which
other cues than acoustic cues are
used for relocation of pups.
Abiotic factorAbsence maternal vocal
recognition Weddell seal
Commercial hunt may have resulted
in changes in maternal behavior.
Anthropogenic
factor
Geographic variation harp seal
mother-pup
Hypothesis/resultAcoustic Ecology (main) factor
Paper
48

Acoustic ecology (or soundscape ecology) studies started in the late 1960s with R.
Murray Schafer’s World Soundscape Project. This project recorded and archived natural,
village and city soundscapes from all over the world to preserve and draw attention to
specific sound marks and dying sounds, ranging from foghorns to human accents and
dialects. It also served to draw attention to (and find solutions for) noise pollution and the
strained relationship between the human community and its sonic environment. The term
‘soundscape’ reflects the idea that the listener is part of a dynamic system of information
exchange, in analogy to being part of a landscape. As also pointed out in the schematic
representation of acoustic ecology discussed in the previous section, the soundscape
concept recognizes that when an individual enters an environment it has an immediate
interaction with the sounds within the environment (Truax, 2001). Acoustic ecology has
since the World Soundscape Project developed into a broad multi-disciplinary research
and art field, comprising ‘phonographers’ (exploring the world through sound),
environmental music composers, bioacousticians and environmental health researchers
and many other disciplines. In bioacoustics, a more holistic approach of the study of
animal sound and the sound environment in which animals live is relatively recent (e.g.,
Slabbekoorn & Bouton 2008; Barber et al., 2009; Clark et al., 2009), although concerns
on the potential effects of human-induced changes to the sound environment were
expressed during early studies (e.g., Payne & Webb 1971). Thus, given that acoustic
ecology is an emerging field particularly within marine mammal research, the results
presented in the following papers, represent first steps exploring the acoustic ecology of
marine mammals in polar habitats, providing baseline information while simultaneously
opening up new research questions.
Acoustic ecology forms a central theme in this thesis, explaining how various factors
shape vocal behaviour, but also functioning as a mediator determining the relation
between physical and acoustic presence. The following sections provide a summary
description of the papers presented in this thesis and an interpretation of the findings in
the context of acoustic ecology.
49

6.1 Individuality of in-air pup calls in two ice-breeding pinniped species (paper VI and
manuscript VII)
These two papers investigate the individuality of in-air pup vocalizations and their
putative role in mother-pup reunions in two ice-breeding phocid species, the Arctic harp
seal and the Antarctic Weddell seal. The lactation period lasts 2 and 6 weeks for harp and
Weddell seals, respectively. During the lactation period, both harp and Weddell seal
females leave their pup alone for periods of up to several hours to forage under the ice to
sustain lactation (Reijnders et al., 1990; Lydersen & Kovacs, 1999). Given that both
species form breeding aggregations on the ice, consisting of tens (Weddell seal) to
hundreds (harp seal) of animals, some mechanism for mother-pup recognition is required
during the lactation period to avoid confusion over pup identity when the female returns
from her foraging trip. While in otariid species vocalizations generally play an important
role in mother-pup reunions (Insley et al., 2003), mother-pup recognition in phocids
seems more variable and dependent on breeding strategy and stability of the ice type used
for breeding, although only a limited number of species has been investigated to date
(paper I). In paper VI, pup vocal and mother-pup behaviour were compared between the
Northeast (Greenland Sea) and Northwest (Front) Atlantic harp seal populations. The
level of pup call individuality and mother-pup behaviour was found to differ between
populations. Mothers attended their pups on the ice more in the Front population
compared to the Greenland Sea population, which might be explained by population
differences in behavioural adaptation in response to commercial hunt. Given that the
Greenland Sea population was reduced to a smaller proportion of its initial population
size than the Front population, females in the Greenland Sea population might have
evolved a behavioural tendency to maximize their time in the water, in response to
hunting pressure (arrow 1a9, Figure 16). Furthermore, differences in sea ice extent
between years during which data were collected in the two areas might also have affected
the behaviour of female harp seals with pups (arrow 1b, Figure 16). Possibly, differences
in maternal behaviour either relating to ice conditions or commercial hunt indirectly
affect pup vocal behaviour, for example when females spent less time on the ice with
9 In this case the anthropogenic factor influencing behavioural ecology is hunting pressure, which would be expected to work directly on behavioural ecology (i.e., maternal strategies).
50

their pup. Multi-year data are needed to investigate if differences in pup vocal behaviour
and mother-pup behaviour are merely due to interannual variability (i.e., due to
exceptional ice conditions during the season when this study was conducted) or are a
more persistent difference in behaviour between these harp seal populations.
In Weddell seals, pup call individuality was investigated and playback experiments were
conducted (manuscript VII). During the playback experiments, pup calls were played
back to Weddell seal mothers to investigate if they responded differently to playbacks of
own and alien pup calls. The level of call individuality differed between pups. Females
were found not to respond differently to playbacks of own and other pup calls. A possible
explanation might be the stationary nature of fast ice as a breeding substrate, reducing the
importance for individual pups to be vocally distinctive, as the mother-pup pair can rely
more on spatial cues for relocation (arrow 2, Figure 15). In addition, olfactory cues might
be used for final confirmation of identity. Alternatively, the finding might be explained
by vocal recognition not having been fully developed at the time during which this study
was conducted, i.e., when most pups were approximately two weeks old. Weddell seal
females only start to forage under the ice after the first two weeks post-partum, so that
there might be no need for vocal recognition (or response to pup calls by females) prior to
the period that females start undertaking foraging trips.
Comparing both studies illustrates how similarities in the behavioural ecology of polar
species, such as ice as a breeding substrate and the need for females to forage during the
lactation period, have led to a largely parallel evolution of mother-pup behaviour in these
(quasi-) antipodal species. Nevertheless, it also illustrates how differences within the ice
habitat (i.e., the stability and ice type, arrows 1b and 2, Figure 15) are likely to be of
influence on (vocal) behaviour, leading to inter-specific differences as well as differences
between populations of the same species.
6.2 Underwater vocal behaviour of Antarctic pinnipeds (Paper III and manuscripts IV, V)
These manuscripts and paper investigate aspects of the adult underwater vocal behaviour
of the four Antarctic pinniped species, Weddell, leopard, Ross and crabeater seals. Paper
51

III is based on one year of hand-browsed PALAOA data and provides a first baseline
description of temporal patterns in the vocal behaviour of Antarctic pinnipeds. Inter-
specific variation in vocal behaviour is discussed in an acoustic ecological context,
relating to species-specific behavioural ecology and interactions with abiotic and biotic
factors from the environment. One of the most intriguing results of this paper is the
distinct seasonality in the acoustic presence of each species and the sequential pattern in
the timing of peak vocal activity of each species; Weddell seals calls were present year
round, except in February (the month during which ice cover is lowest in Atka Bay),
leopard seals were present from October to January, Ross seals from December to
February and crabeater seals from August to January. In aquatic mating pinnipeds, calls
are produced in a mating context (Van Parijs, 2003). In most species, the timing of the
peak in call activity therefore reflects the period when mating takes place. The near year
round acoustic presence of Weddell seals possibly reflects that males occupy underwater
territories throughout winter (arrow 3a, Figure 15). In the other three species, vocal
activity shows a strong seasonal peak, reflecting that vocal displays related to mating are
likely to be strongly seasonal in these species and that timing of mating might be related
to abiotic and biotic factors (arrow 3b, Figure 15).
Apart from detailed information on temporal patterns of acoustic behaviour of the four
Antarctic pinnipeds, this paper also provided the first information on (acoustic) presence
of these species in the area; Ross seals have never been visually observed in the area off
PALAOA (arrow 3c).
Paper III provided the basis for manuscript IV, in which vocal behaviour of three10 of
these species is further investigated over 3+ years of PALAOA data (2006, 2007, 2008
and the first two 3 months of 2009). This paper shows that the overall pattern of seasonal
acoustic activity of each species re-occurred over four austral summer seasons (arrow 4a,
Figure 15). However, Weddell seal call activity was more variable between years as
compared to the other species. Given that Weddell seals rely on leads in their fast ice
10 Paper IV used automated detection to analyse vocal behaviour over multiple years for Weddell, leopard and Ross seals. Based on the broadband character of crabeater seal vocalizations, these calls could not reliably be detected with the automated detection method used in this paper. Automated detection of the calls of this species will require development of other detection techniques which was beyond the scope of this thesis, but will form part of future analyses.
52

habitat for breathing, the inter-annual difference in the number of detected calls possibly
reflects variability in local ice conditions between years (arrow 4b, Figure 15).
Furthermore, leopard seal call activity was found to decrease rapidly with the onset of
Ross seal call activity in all years. These findings are in accordance with our previous
hypothesis (paper III) that temporal segregation of acoustic activity between species
might be related to inter-specific acoustic interference. The ‘acoustic plenitude’ of Ross
seals during the period that they are acoustically present (i.e., the breadth of the
frequency band and the temporal density of calls) might reduce the bioacoustic space of
other species. Given the importance of underwater calling for mating, but also the
energetic costs to produce calls, other species might time acoustic activity to prevent
overlap with Ross seals.
In contrast to the manual analysis of the 2006 data (paper III), leopard seal calls were
found present during winter of all years by the automated analysis (though only few in
2006, see discussion in manuscript IV). Some of the calls detected in the winter period
were juvenile leopard seal calls. These findings suggest that juvenile leopard seals
possibly remain in Antarctic coastal waters year round (arrow 4c, Figure 15). Manuscript
IV is still in preparation. Further work will involve time-series analysis to explore annual
patterns in call activity in relation to ice cover in greater detail (see manuscript IV for
more details).
Manuscript V investigates the variation in the acoustic characteristics of one leopard seal
call type (‘high double trill’, call type L3) between three Antarctic locations: Drescher
Inlet, Atka Bay and Davis Sea. Previous genetic studies have shown that there is
sufficient exchange of individuals between leopard seal breeding groups to prevent
development of a genetic population structure (Davis et al., 2008). The results of
manuscript V show that overall there is little variation in the acoustic characteristics of
call type L3 across the three recording locations, although acoustic parameters (i.e., pulse
repetition rate and call bandwidth) of calls from Drescher Inlet differed slightly from
calls recorded at the other two locations. The overall similarity in acoustic characteristics
of call type L3 seems to mirror the homogeneity of the genetic data, suggesting that there
is exchange of individuals between breeding groups (arrow 5, Figure 15). This leaves it
53

likely that subtle differences in leopard seal vocalizations are attributable to other factors
(such as differences in local group composition when recordings were made) than
geographic isolation of populations.
Together these manuscripts and paper provide insight into the internal and external
factors that are likely to influence and shape the vocal behaviour of these four ice-
breeding pinnipeds. Manuscripts IV and V thereby exemplify how further temporal and
spatial extension of the acoustic data set enable investigation of hypotheses put forward
in paper III. Behavioural ecological factors such as mating strategy are likely to be
among the most important factors that shape vocal behaviour to optimize communication
of breeding status or fitness to potential mating partners and/or competitors (3a, 4a, 5
Figure 15). Depending on the intended range of communication, the local soundscape
(abiotic factor) might for species such as leopard and Ross seals be a further determinant
of the timing of vocal activity (3b, 4b Figure 15). This aspect can be further investigated
by comparing the timing of vocal activity to local signal-to-noise ratios or noise budgets
over multiple years. Ice conditions are another relevant abiotic factor, the role of which
has not been fully explored, yet. In this context, spatial expansion of recording sites will
enable investigation of the role of ice in relation to pinniped vocal behaviour in near- and
off-shore areas. Finally, paper III and manuscript IV provided insight on seasonal
patterns in the physical presence of species in the area off PALAOA (3c, 4c, Figure 15).
6.3. Vocal behavior of cetaceans recorded by PALAOA (manuscripts VIII and IX)
In manuscript VIII, the occurrence of a specific humpback whale call type (‘moan’) over
one year of PALAOA data was investigated. Humpback whale calls were present over
nine months of the year, including 4 months during austral winter. Humpback whales are
therefore likely to remain on the feeding grounds throughout austral winter and - in
contrast to previous beliefs - enter ice-covered areas. The findings of this study suggest
that humpback whale feeding grounds might extend further south towards the Antarctic
continental shelf than previously assumed. This reflects the potential importance of
coastal areas for humpback whales by providing food year-round and areas of open water
where animals can surface to breathe.
54

This paper exemplifies how acoustic observations can be used to obtain information on
physical presence of a species during periods and in an area where prolonged visual
observations are not possible (arrow 6a, Fig 15).
With respect to acoustic ecology and the question how various factors shape acoustic
behaviour, the supplementary material to this paper (manuscript VIII.a) allows the
following additional consideration; To date only little is known on the context in which
sounds are produced by humpback whales on the Southern Hemisphere feeding grounds.
We can therefore only speculate on the function of calls. In the Northern Hemisphere, a
large part of the sounds produced by humpback whales on the feeding grounds is related
to coordinated foraging behaviour during which small prey are concentrated
(Ingebrigtsen, 1929; Jurasz & Jurasz, 1979; D’Vincent et al., 1985; Thompson et al.,
1986). Humpback whale foraging dives are known to reach up to 150 m depth (Dolphin
et al., 1995). Zooplankton exhibits diel vertical migration, ranging in depth between 50
and >300 m, depending on species and season (Cisewski et al., 2010). In our study, diel
call patterns are, when interpreted in a feeding context, somewhat contradictive; the
decrease in overall humpback whale vocal activity in March and April coincides with the
time at which zooplankton concentrations are at shallow depths. Feeding at shallow depth
would be expected to have energetic benefits since transit time to shallower food
resources is reduced (e.g., Baumgartner et al., 2003). Our finding of decreased call
activity when most prey is at shallow depth might therefore reflect that calls are produced
in a social rather than a feeding context (in that case, vocal behaviour could be mediated
by social factors i.e., behavioural ecology, arrow 6b, Figure 15). The supplementary
material on humpback whale vocal behaviour presented in this thesis is in an early phase
of preparation and will be extended with analyses of data from other years to investigate
if this pattern persists across years.
Manuscript IX presents preliminary results on seasonal patterns in the usage of four call
types by Antarctic blue whales (Balaenoptera musculus intermedia) and acoustic
presence of the bio-duck signal. For blue whales, one year of PALAOA data (2009) was
manually analyzed. Three Antarctic blue whale call types were present throughout the
55

year (arrow 7a, Figure 15), among which the ‘Antarctic blue whale call’, which is usually
referred to as blue whale song when produced in regular sequences. Although this will be
subject of further analysis, song was present in all months (except June when only one
day of data was available) and in some cases also consisted of sequences of other call
types than the ‘Antarctic blue whale call’. One call type (S) occurred from January to
June, reflecting that this call type might be produced in specific behavioral contexts
(arrow 7b, Figure 15). Blue whales in Northern Hemisphere waters produce a call type
similar to S, which possibly functions to maintain contact between foraging dives
(Oleson et al., 2007).
The bio-duck has been recorded at various locations in the Southern Ocean, but the origin
of the signal remains unknown. Knowledge on the temporal patterns of occurrence of this
signal might provide information on the source (arrow 7a, Figure 15). Analysis of
acoustic presence of the bio-duck signal was based on PALAOA data from two years
(2006 and 2009). In 2006, the signal was present from April until October (no data for
November), while in 2009 it was present from May until December. The bio-duck signal
has previously been suggested to be produced by minke whales (Balaenoptera
bonaerensis). Their association with ice-covered areas, year-round presence in Antarctic
waters as well as parallels between the bio-duck signal and the sounds produced by
minke whales in Northern Hemisphere waters, are in support of this suggestion. Further
work involves analyses of diel patterns in acoustic presence of blue whale call types and
the bio-duck signal as well as further investigation of temporal patterns and structure of
blue whale song in this data set.
Manuscripts VIII and IX clearly illustrate the importance of acoustic techniques as a
monitoring tool in polar areas; both studies confirmed presence of cetaceans over a time
span and in a period in which it would not have been possible to collect visual data
(arrows 6a and 7a, Fig 15). Both studies also illustrate the seasonal differences in the
calls that are detected by PALAOA. Whether this is due to a difference in the range over
which different call types are detected (as is likely the case for humpback whale moans
and high calls, manuscript VIII) or if these reflect actual differences in vocal repertoire
composition (Antarctic blue whales, manuscript IX), it is important to take such
56

information into account when using automated detection algorithms to investigate
acoustic presence over multiple years.
The bio-duck signal provides an interesting example of how acoustic observations
provide further information on the possible source of the sound through temporal patterns
in acoustic activity and hypotheses on the acoustic ecology of the source (e.g., in this case
the possible relation of the bio-duck signal to months with ice-cover). Hopefully, further
analyses of the PALAOA data (e.g., diel patterns in acoustic presence, estimations of
source level) provide further information that contributes to solve this mystery.
6.4 Fish and increasing underwater noise levels
Although paper X is beyond the realm of polar marine mammal research, it clearly
illustrates how anthropogenic factors have the potential to interfere with acoustic
behaviour, emphasizing the role of anthropogenic factors in the acoustic ecology of
aquatic animals (arrows 8, Figure 15). The paper calls attention to the existing large gaps
in our knowledge on the effects of man-made underwater noise on fish. The comparative
approach of this study reflects the idea that for animal taxa relying on sound for critical
aspects of their behaviour, man-made noise likely forms an important aspect of acoustic
ecology. The main conclusion of this paper is that there is very little known on the effects
of noise on fish, but that it is highly likely that underwater noise affects many aspects of
the lives of fish. Although the immediate effects of short duration high intensity
underwater sound on aquatic animals can have dramatic physiological consequences for
nearby individuals (Fig 7), chronic noise exposure affects the acoustic ecology of a
species, thereby affecting animals over much larger spatial and temporal scales, possibly
affecting aquatic animals on population scales. The schematic representation of acoustic
ecology (Fig 14) illustrates how anthropogenic noise can indirectly impact acoustic
behaviour through changes in the local soundscape. Anthropogenic noise can however
also affect distribution (behavioural ecology) as well as the distribution and behaviour of
prey and predator species (biotic factors). The suit of factors through which chronic
anthropogenic underwater noise can affect acoustic behaviour and behavioural ecology
illustrates the complexity of the issue as well as the potential severity of its impact.
57

7. A broader perspective: the role of marine mammals in marine ecosystems
Previous sections have illustrated the potential of acoustic recording techniques as a
unique research tool for marine mammals in polar oceans and interpreted acoustic data in
the framework of acoustic ecology. Improving our understanding of marine mammals in
polar habitats is essential from the perspective of species protection and conservation and
from an ecosystem-based point of view. It is widely assumed that marine ecosystems are
controlled by bottom-up processes: the supply of nutrients by sources of physical forcing
such as currents, waves and upwelling and the conversion to organic matter by
phytoplankton photosynthesis (e.g., Smetacek & Nicol, 2005). Nevertheless, the role of
marine mammals in (polar) marine ecosystems should not be underestimated. In a review,
Bowen (1997) summarized the varying ways in which marine mammals influence their
environment, recognizing that marine mammals can have both top-down (e.g., marine
mammal predator influencing prey behaviour and life history) and bottom-up effects
(e.g., their role in nutrient storage and recycling).
7.1 Bottom-up effects
7.1.1. Defecation
Depending on habitat type and species-specific feeding ecology, marine mammals
contribute to the recycling and renewal of nutrients (Kanwisher & Ridgway, 1983;
Lavery et al., 2010; Fig 16). Much research effort with respect to nutrient recycling has
recently been aimed at the Southern Ocean ecosystem and iron fertilization. In contrast to
the Arctic Ocean, the Southern Ocean marine ecosystem is iron-limited due to e.g., lack
of river run-off, atmospheric, and sediment iron-input (the latter relating to the deeper
continental shelf and hence relative absence of sediment as iron source, Tremblay &
Smith, 2007). Iron is essential for phytoplankton, as it plays a role in electron transfer
processes that form part of photosynthesis (e.g., Nicol et al., 2010). Krill feed on
phytoplankton, store iron in their body tissue, but also excrete iron-rich faeces. Marine
mammals and other diving marine vertebrates particularly require iron in their diet
because of their elevated haemoglobin and myoglobin levels which are necessary for
binding oxygen. Baleen whales and most of the Antarctic seal species feed on krill and
contribute to the recycling of nutrients by defecating near the surface (which is related to
58

the fact that they shut down non-crucial body functions during diving). In addition,
marine mammal species that feed at depth and defecate in the euphotic zone, such as
sperm whales, increase the standing stock of nutrients in the euphotic zone (Lavery et al.,
2010). Given that whales generally concentrate in areas of high productivity, defecation
might create a positive feedback loop in which whales act as ‘gardeners’, promoting local
primary productivity, thereby again ensuring the availability of prey in these areas.
Furthermore, by enhancing new primary productivity, whales are thought to act as a
carbon sink and have been estimated to remove significant amounts of CO2 from the
atmosphere (Lavery et al., 2010).
The large scale removal of whales from the Southern Ocean during industrial whaling is
thought to have had far-reaching impacts on the ecosystem by reducing nutrient input and
recycling (e.g., Butman et al., 1996; Lavery et al., 2010). Such alterations are likely to
have reduced carbon export to the deep ocean and affected food web structure e.g., in that
larger whale populations would have enhanced primary productivity which in turn would
have supported larger krill populations (Nicol et al., 2010).
7.1.2. Whale falls
Another way in which marine mammals contribute to the input and recycling of nutrients
is after their death, through their sinking carcasses which provide benthic communities
with nutrients (Butman et al., 1996, Fig 16). Whale falls are thought to have a specific
impact on biodiversity in that they provide isolated and distinct resource-rich patches
supporting various organisms and communities. Butman et al. (1996) suggested that
reduction in large baleen whale populations during 19th-century commercial whaling
might therefore not only have had consequences for krill populations, but potentially also
at the level of benthic habitat heterogeneity (and thereby biodiversity) that whale falls
create.
59

Top-down influences
Bottom-up influences
Nutrient recycling
Carcasses
Consumption
Soundscapemodification
Predator-prey interactions
Habitat modification
Defecation
Figure 16. Various roles of marine mammals in the ecosystem: bottom-up influences (habitat modification
and nutrient recycling) and top-down influences (consumption, soundscape modification, predator-prey
interactions).
7.1.3. Habitat modification
Walruses (Odobenus rosmarus) and grey whales (Eschrichtius robustus) modify their
habitat, for example while bottom-feeding, which offers opportunities to various
invertebrate species to settle and/or feed on debris (Bowen, 1997). In some marine
mammal species these modifications work to the advantage of the animal, for example
when habitat modifications result in higher prey densities, e.g. when marine mammals
create clearings suitable for larvae of prey species to settle or remove accumulated mud
60

from the sea bottom which contributes to prey population health (Katona & Whitehead,
1988).
7.2 Top-down effects
7.2.1. Consumption
By consuming prey, marine mammals have a top-down effect on the marine ecosystem
(Fig 16). This effect can be divided into aspects that concern the amount of biomass that
flows through the marine mammal component of the marine ecosystem, but also the
effect of consumption on community structure. Estimations of the amount of biomass that
is consumed by marine mammals and the impact of consumption on food stocks is still
the topic of on-going debates, especially when it concerns prey species of commercial
interest, e.g., cod (Gadus morhua) and capelin (Mallotus villosus) in the Arctic (e.g.,
Lavigne, 1996). Corkeron (2009b) pointed out that Norway’s current policy on marine
mammal management (involving culling of marine mammals) is partly based on model
results indicating that more harp seals and northern minke whales equate to less cod and
herring (Clupea harengus), while more complex fish-fisheries-climate interactions
leading to collapses of fish stocks are a much more plausible.
The effect of consumption on community structure is illustrated by the uncontrolled
‘experiment’ that resulted from the overexploitation of large baleen whales in the
Southern Ocean during the 20th century. Given that the largest species were “harvested”
first, cetacean biomass declined from an estimated 45 million to 9 million tonnes in this
period (Laws, 1985). The amount of krill that was released from cetacean predation is
thought to have been partly redistributed to minke whales, crabeater seals, Antarctic fur
seals (Arctocephalus gazella) and various penguin species which have all increased in
numbers (but see discussion in section 7.1.1. on the effects of whaling on prey
populations). The complexity of the changes in interactions in the Southern Ocean food
web is further illustrated by the fact that the increase in king penguin numbers might have
resulted from the increase in krill-feeding squid which in turn is thought to have become
more abundant as a result of the decrease in sperm whales (Laws, 1985). Hence, this once
again illustrates how the reduction in the number of large whales is likely to have led to
61

large scale changes in the community structure and ecosystem functioning of the
Southern Ocean.
7.2.2. Soundscape modification
Modification of the biotic component of the soundscape, e.g., through the presence of
calls or echo-location clicks, can also be regarded as a top-down effect of marine
mammals on the (acoustic) ecosystem. Nevertheless, acoustic presence may not solely
affect the biotic soundscape, but also have actual ecological effects when calls cause
marine mammal hotspots to be recognized by other individuals, attracting or repelling
other species or conspecifics from such areas (Katona & Whitehead, 1988).
7.2.3. Predator-prey interactions
The co-evolution of predator and prey in many cases results in adaptations in the
behaviour of prey to avoid predation and can therefore also be regarded as a modifying
(top-down) effect that marine mammals have on their environment. Some prey species
adapt their predator avoidance tactic to the type of predator by which they are attacked.
For example, herring and krill can minimize the risk of predation by seabirds, seals and
larger fish by forming tight schools, while when attacked by bulk-feeders, scattering is a
more successful strategy (Bowen, 1997). Harbour seals were found to respond strongly
(by moving away from the surface) to the calls of mammal-eating killer whales (Orcinus
orca) and unfamiliar fish-eating killer whales, but not to the familiar calls of local fish-
eating killer whale populations (Deecke et al., 2002).
62

8. Outlook
Much of the work forthcoming from this thesis will be followed up by temporal and
spatial extension of the scales on which data are collected. This will allow a more
thorough investigation of various aspects of the acoustic ecology of polar marine
mammals. Expanding the spatial scale enables comparison of the PALAOA data with
other regions and marine ecosystems (e.g., coastal versus offshore). This thesis has
provided first insights into some aspects of the acoustic ecology of species occurring in
the area near PALAOA, but the spatial scale of this ‘acoustic ecosystem’ is still unclear.
The coastal ecosystem and ice conditions off PALAOA might provide a rather specific
habitat, promoting high marine mammal species diversity and many specific (acoustic)
interactions that do not occur in offshore areas. If this is the case, comparison of data
from various recording locations might also shed light on the habitat characteristics that
distinguish a coastal habitat from offshore habitat.
8.1. Spatial extension
An example of how the spatial scale of our research will be extended is the HAFOS
project, which will commence this austral summer 2010/11. The HAFOS project involves
deployment of 9 autonomous acoustic recorders in the Weddell Sea (Fig 17). The
recorders will be deployed over 2-3 cruises and will be left to record for up to 3 years.
Data from these recorders will, along with simultaneously collected oceanographic data,
contribute to our understanding of acoustic ecology by facilitating a comparison of
offshore data from the Weddell Sea and the PALAOA data from a coastal area, and
providing information on the detection ranges of baleen whale sounds and whale
movement patterns, also in relation to ice and prey.
63

Figure 17. Deployment locations of acoustic recorders within the HAFOS project in the Weddell Sea.
Black dots indicate existing moorings on which acoustic recorders will be attached. Stars indicate
additional moorings planned for deployment within the next 3 years.
On a smaller scale, the PALAOA-S (PALAOA-Satellite, satellite station of PALAOA)
recording units also render a spatial extension of the PALAOA data set (Fig 18) possible.
The PALAOA-S units are portable autonomous acoustic recorders designed to collect
continuous sound records up to 2 weeks. The PALAOA-S system consisted of an
insulated metal box with two solar panels. The box contains a solar charger, 12V battery,
solid state recorder, GPS and an acoustic encoder for the GPS-signal, which recorded on
the second audio channel of the recorder. A hydrophone is connected to the solid state
recorder through a long (50-100 m) cable. The metal box is placed on the ice (ice floe or
fast ice) and the hydrophone is deployed through a drilled hole in the ice surface, through
existing leads or seal breathing holes in the ice. Deployment of PALAOA-S recording
units is planned within Atka Bay (east to south-east of PALAOA) during this austral
summer 2010/11 to estimate the recording range of PALAOA. Autonomous recorders
will be distributed on the fast ice at various distances from PALAOA. Synchronization of
PALAOA and PALAOA-S recordings enables comparison of the sounds recorded on all
or only a subset of these recorders, from which the detection range of various sounds can
be determined. Insight into the call type-specific detection range of the sounds of the four
pinniped species provides information on inter-specific differences in communication
64

range. In addition, these PALAOA/PALAOA-S data sets permit localization and tracking
of vocalizing marine mammals, which in the case of pinnipeds allows investigation of
pinniped mating strategies (e.g., use of underwater territories).
Figure 18. PALAOA-S recording unit recording on the fast ice in Atka Bay. The hydrophone is deployed
through a lead in the fast ice (December 2008). Picture by I. Van Opzeeland.
Another aspect that can be addressed by spatial expansion of our data base, are estimates
of relative abundance of marine mammals. Currently, our research group is involved in
collaboration with various research institutes under the Southern Ocean Research
Partnership (SORP), which will investigate acoustic trends in abundance, distribution and
seasonal presence of blue and fin whales in the Southern Ocean. PALAOA forms one of
the acoustic data sets that will be included in this project.
8.2. Temporal extension
A temporal extension of the data presented in this thesis will involve further analyses of
PALAOA data from other years, for example the automated detection of humpback
65

whale calls from 2006-2010. It is our hope that PALAOA will continue to record for a
few more years. Nevertheless, the major impact of the collision of ice-berg (B-15K, H.
Gernandt, 2010) on 11 February 2010 (Fig 19d) with the ice shelf tongue on which the
observatory is located caused large cracks in the ice shelf tongue, rendering calving of
this segment of the ice shelf possible. A possibility for succession of PALAOA by
PALAOA II is yet undecided.
A change of the temporal scale at which the analysis of our existing PALAOA data set is
performed, provides another possibility to further investigate acoustic interactions. Figure
20 shows four spectrograms (from PALAOA data), each comprising 24 hours, which
illustrates how various biotic and abiotic events temporarily dominate the soundscape.
Such long-term spectra and spectrograms (i.e., spectrograms over days or weeks of data),
reveal the frequency distribution of acoustic energy instead of the individual
vocalizations, and allow assessing the acoustic contributions of biotic and abiotic acoustic
sound sources, such as glacier calving events and iceberg collisions (Fig 20d), to the local
noise budget and their respective interaction.
66

24 hours
10
100
1000
10
100
1000
10
100
1000
10
100
1000
10
100
1000
10
100
1000
10
100
1000
10
100
1000
1 min1 min
1 min1 min
1 min1 min
leopard Weddell
Ross
Weddell
1 min1 min
a)
b)
c)
d)
Figure 19. Four long-term spectrograms, each representing 24 hours of PALAOA recordings (hours
indicated at the bottom of spectrograms), a) Day spectrogram (26 Dec 2009) with Ross seal vocal activity.
The yellow band consists of calls shown in the inset image, b) leopard and Weddell seal calls on 14 Dec
2009, with an example of calls of both species in the inset image, c) Weddell seal vocal activity on 14 Nov
2009. The inset image shows an example of the trill and the falling chirp, d) the collision between ice berg
B-15K and the PALAOA ice shelf tongue on 11 Feb 2010. Inset image corresponds to the point in time
indicated by the white line.
67

9. Final note
Although conservation is not the main topic of my thesis, it has nevertheless formed a
recurring theme in many sections, reflecting the critical status of various marine mammal
species and populations. Scientific research is invaluable in providing the necessary
information on which conservation measures protecting habitats and ecosystems can
build. Nevertheless, “conservation will be ineffective unless and until it acknowledges
human impacts of all types and degrees, assumes a ‘big picture’ ecosystem perspective,
and requires that all stakeholders acknowledge their responsibility and contribute to
solutions. Deficiency of scientific information may therefore not be the primary problem
with current or future conservation. Rather the primary issues have to do with human
values and whether we, the human species, will be able to accept ourselves as only one
element of a larger natural world, recognize and mitigate our impacts, impose a higher
level of precaution with regard to other species, and strive to conserve the ecosystems
upon which those species – and we – depend.” (quote from Reynolds et al., 2009, but see
also Meadows et al., 1972).
68

10. References synopsis
Ainley DG & DeMaster DP (1990) The upper trophic levels in polar marine ecosystems.
In: Polar Oceanography, Part B: Chemistry, biology and geology. Smith WO (Ed). San
Diego: Academic Press. Pp 599-630.
Anderson DR, Laake JL, Crain BR, Burnham KP (1979) Guidelines for line transect
sampling of biological populations. Journal of Wildlife Management 43: 70-78.
Andriashev AP (1970) Cryopelagic fishes of the Arctic and Antarctic and their
significance in polar ecosystems. In: Antarctic Ecology, Vol 1. Holdgate MW (Ed)
London and New York: Academic Press. Pp 297-304.
Au WWL (1993) The sonar of dolphins. New York: Springer Verlag.
Barber JR, Crooks KR, Fristrup KM (2009) The costs of chronic noise exposure for
terrestrial organisms. Trends in Ecology and Evolution 25: 180-189.
Baumgartner MF, Cole TVN, Campbell RG, Teegarden GJ, Durbin EG (2003)
Association between North Atlantic right whales and their prey, Calanus finmarchicus,
over diel and tidal time scales. Marine Ecology Progress Series 264: 155-166.
Best PB (1993) Increase rates in severely depleted stocks of baleen whales. ICES Journal
of Marine Science 50: 169-186.
Boebel O, Breitzke M, Burkhardt E, Bornemann H (2009) Strategic assessment of the
risk posed to marine mammals by the use of airguns in the Antarctic Treaty area,
Information Paper IP 51 , Agenda Item: CEP 8c, Antarctic Treaty Consultative Meeting
XXXII, Baltimore, USA , 273 pp.
Boebel O, Kindermann L, Klinck H, Bornemann H, Plötz J, Steinhage D, Riedel S,
Burkhardt E (2006) Real-time underwater sounds from the Southern Ocean. Eos
Transactions, American Geophysical Union 87: 361-362.
Bossart GP (2006) Marine mammals as sentinel species for oceans and human health.
Oceanography 19: 134-137.
Bowen WD (1997) Role of marine mammals in aquatic ecosystems. Marine Ecology
Progress Series 158: 267-274.
Bowles AE, Smoltea M, Würsig B, DeMaster DP, Palka D (1994) Relative abundance
and behavior of marine mammals exposed to transmission from the Heard Island
feasibility test. Journal of the Acoustical Society of America 96: 2469-2480.
69

Boyd IL (1991) Environmental and physiological factors controlling the reproductive
cycles of pinnipeds. Canadian Journal of Zoology 69: 1135-1148.
Boyd IL (2002) Antarctic marine mammals. In: Encyclopedia of Marine Mammals, 1st
ed. Perrin WF, Würsig B, Thewissen JGM (Eds). New York: Academic Press. Pp 30-36.
Branch TA, Stafford KM, Palacios DM, Allison C, Bannister JL, Burton CLK, Cabrera
E, Carlson CA, Galletti Vernazzani B, Gill PC, et al. (2007) Past and present distribution,
densities and movements of blue whales Balaenoptera musculus in the Southern
Hemisphere and northern Indian Ocean. Mammal Review 37: 116-175.
Brumm H, Slabbekoorn H (2005) Acoustic communication in noise. Advances in the
Study of Behavior 35: 151-209.
Butman CA, Carlton JT, Palumbi SR (1996) Whales don’t fall like snow: Reply to
Jelmert. Conservation Biology 10: 655-656.
Calambokidis J, Barlow J (2004) Abundance of blue and humpback whales in the eastern
North Pacific estimated by capture-recapture and line-transect methods. Marine Mammal
Science 20: 63-85.
Cisewski B, Strass VH, Rhein M, Krägefsky S (2010) Seasonal variation of diel vertical
migration of zooplankton from ADCP backscatter time series data in the Lazarev Sea,
Antarctica. Deep-Sea Research 57: 78-94.
Convention for the Conservation of Antarctic Marine Living Resources (CCMLAR)
(1980) Article 1(4). http://www.ats.aq/documents/ats/ccamlr_e.pdf.
Clapham & Baker, 2002 Modern whaling. In: Encyclopedia of Marine Mammals, 1st ed.
Perrin WF, Würsig B, Thewissen JGM (Eds). New York: Academic Press.
Clapham PJ, Young SB, Brownell RL Jr (1999) Baleen whales: conservation issues and
the status of the most endangered populations. Mammal Review 29: 35-60.
Clark CW, Ellison WT (2004) Potential use of low-frequency sound by baleen whales for
probing the environment: Evidence from models and empircal measurements. In:
Echolocation in bats and dolphins, JA Thomas, CF Moss, M Vater (Eds.). Chigaco:
University of Chicago Press. Pp 564-581.
Clark CW, Ellison WT, Southall BL, Hatch L, Van Parijs SM, Frankel A, Ponirakis D
(2009) Acoustic masking in marine ecosystems: intuitions, analysis, and implication.
Marine Ecology Progress Series 395: 201-222.
70

Clarke A, Murphy EJ, Meredith MP, King JC, Peck LS, Barnes DKA, Smith RC (2007)
Climate change and the marine ecosystem of the western Antarctic Peninsula.
Philosophical Transactions of the Royal Society B 29: 149-166.
Corkeron PJ (2009a) Reconsidering the science of scientific whaling. Marine Ecology
Progress Series 375: 305-309.
Corkeron PJ (2009b) Marine mammals’ influence on ecosystem processes affecting
fisheries in the Barents Sea is trivial. Biology Letters 5: 204-206.
Corkeron PJ, Conner RC (1999) Why do baleen whales migrate? Marine Mammal
Science 15: 1228-1245.
Costa DP (1993) The relationship between reproductive and foraging energetics and the
evolution of the Pinnipedia. Symposium of the Zoological Society of London 66: 293-
314.
Cox TM, Ragen TJ, Read AJ, Vos E, Baird RW, Balcomb K, Barlow J, Caldwell J,
Cranford T, Crum L, et al. (2006) Understanding the impacts of anthropogenic sound on
beaked whales. Journal of Cetacean Research and Management 7: 177-187.
Croll DA, Clark CW, Acevedo A, Tershy B, Flores S, Gedamke J, Urban J (2002) Only
male fin whales sing loud songs. Nature 417: 809.
Cummings WC, Thompson PO (1971) Underwater sounds from the blue whale,
Balaenoptera musculus. The Journal of the Acoustical Society of America 50: 1193–
1198.
Davies JL (1963) The antitropical factor in cetacean speciation. Evolution 17: 107-116.
Davis CS, Stirling I, Strobeck C, Coltmann DW (2008) Population structure of ice-
breeding seals. Molecular Ecology 17: 3078-3094.
Dayton PK, Morbida BJ, Bacon F (1994) Polar marine communities. American Zoologist
34: 90-99.
Deecke VB, Slater PJB, Ford JKB (2002) Selective habituation shapes acoustic predator
recognition in harbour seals. Nature 420: 171-173.
Di Iorio L, Clark CW (2010) Exposure to seismic survey alters blue whale acoustic
communication. Biology Letters 6: 51-54.
Dingle H, Drake VA (2007) What is migration? BioScience 57: 113-121.
71

Drolet R, Fortier L, Ponton D, Gilbert M (1991) Production of fish larvae and their prey
in subarctic southeastern Hudson Bay. Marine Ecology Progress Series 77: 105-118.
D’Vincent CG, Nilson RM, Hanna RE (1985) Vocalization and coordinated feeding
behavior of the humpback whale in Southeastern Alaska. Scientific Reports of the
Whales Research Institute, Tokyo 36: 41-47.
Eberhardt LL, Chapman DG, Gilbert JR (1979) A review of marine mammal census
methods. Wildlife Monographs 63: 3-46.
Erbe C (2000) Census of marine mammals. SCOR Whaling Group 118: New
Technologies for observing marine life. November 9 - 11, 2000, Sidney, BC.
European Science Foundation (ESF) (2008) The effects of anthropogenic sound on
marine mammals. A draft research strategy. Marine Board – ESF Position Paper.
Fordyce RE (2002) Cetacean evolution. In: Encyclopedia of Marine Mammals, 1st ed.
Perrin WF, Würsig B, Thewissen JGM (Eds). New York: Academic Press. Pp 214-221.
Frankham R, Brook BW (2004) The importance of time scale in conservation biology
and ecology. Annales Zoologici Fennici 41: 459-463.
Green K, Burton HR (1988) Annual and diurnal variation in the underwater vocalizations
of Weddell seals. Polar Biology 8: 161-164.
Halpern BS, Walbridge S, Selkoe KA, Kappel CV, Micheli F, D’Agrosa C, Bruno JF,
Casey KS, Ebert C, Fox HE, et al. (2008) A global map of human impact on marine
ecosystems. Science 319: 948-952.
Hatch L, Clark C, Merrick R, Van Parijs S, Ponirakis D, Schwehr K, Thompson M,
Wiley D (2008) Characterizing the relative contributions of large vessels to total ocean
noise fields: a case study using the Gerry E. Studds Stellwagen Bank National Marine
Sanctuary. Environmental Management 42: 735-752.
Ingebrigtsen A (1929) Whales caught in the North Atlantic and other seas. Report of the
International Council for the Exploration of the Sea 56: 3-26.
Insley SJ, Phillips AV, Charrier I (2003) A review of social recognition in pinnipeds.
Aquatic Mammals 29: 181-201.
IPCC (2007) Climate Change 2007: Impacts, Adaptation and Vulnerability. Contribution
of Working Group II to the Fourth Assessment Report of the Intergovernmental Panel on
72

Climate Change, eds Parrel ML, Canziani OF, Palutikof JP, van de Linden PJ, Hanson
CE. Cambridge, UK: Cambridge University Press.
Janik VM (2000) Food-related bray calls in wild bottlenose dolphins (Tursiops
truncatus). Proceedings of the Royal Society London: Biological Sciences 267: 923-927.
Jefferson TA, Stacey PJ, Baird RW (1991) A review of killer whale interactions with
other marine mammals: predation to co-existence. Mammal Review 21: 151-180.
Jepson PD, Arbelo M, Deaville R, Patterson IAP, Castro P, Baker JP, Degollada E, Ross
HM, Herraez P, Pocknell AM, et al. (2003) Gas-bubble lesions in stranded animals: Was
sonar responsible for a spate of whale deaths after an Atlantic military exercise? Nature
425: 575-576.
Johannessen OM, Shalina EV, Miles MW (1999) Satellite evidence for an Arctic sea ice
cover in transformation. Science 286: 1937-1939.
Johnson MP, Tyack PL (2003) A digital acoustic recording tag for measuring the
response of wild marine mammals to sound. IEEE Journal of Oceanic Engineering 28: 3-
12.
Jurasz CM, Jurasz VP (1979) Feeding modes of the humpback whale, Megaptera
novaeangliae, in southeast Alaska. Scientific Reports of the Whales Research Institute,
Tokyo 36: 41-47.
Kanwisher JW, Ridgway SH (1983) The physiological ecology of whales and porpoises.
Scientific American 248: 110-120.
Katona S, Whitehead H (1988) Are cetacea ecologically important? Oceanography and
Marine Biology: An Annual Review 26: 553-568.
Kindermann L, Boebel O, Bornemann H, Burkhardt E, Klinck H, Van Opzeeland IC,
Plötz J, Seibert AM (2008) A Perennial Acoustic Observatory in the Antarctic Ocean,
Computational bioacoustics for assessing biodiversity. Bundesamt für Naturschutz
Skripten 234: 15-28.
Klinck H (2008) Automated passive acoustic detection, localization and identification of
leopard seals. PhD dissertation, University of Trier, Germany. Reports on Polar and
Marine Research, 582. 155 Pp.
Knox GA (2007) Biology of the Southern Ocean. 2nd ed. Cambridge: Cambrige
University Press. 444 Pp.
73

Lavery TJ, Roudnew B, Gill P, Seymour J, Seuront L, Johnson G, Mitchell JG, Smetacek
V (2010) Iron defecation by sperm whales stimulates carbon export in the Southern
Ocean. Proceeding of the Royal Society B (published online, July 2010).
Laws RM (1985) The ecology of the Southern Ocean. American Scientist 73: 26-40.
Leaper R, Scheidat M (1998). An acoustic survey for cetaceans in the Southern Ocean
Sanctuary conducted from the German government research vessel Polarstern. Report to
the International Whaling Commission 48: 431-437.
Lydersen C, Kovacs KM (1999) Behaviour and energetics of ice-breeding, North Atlantic
phocid seals during the lactation period. Marine Ecology Progress Series 187: 265-281.
Malme CI, Miles PR, Clark CW, Tyack P, Bird JE (1984) Investigations of the potential
effects of underwater noise from petroleum industry activities on migrating gray whale
behavior. BBN Report No. 5366; NTIS PB86-17174. Report from Bolt Beranek and
Newman Inc. for US Minerals Management Service, Anchorage, AK.
Marques TA, Thomas L, Ward J, DiMarzio N, Tyack PL (2009) Estimating cetacean
population density using fixed passive acoustic sensors: An example with Blainville’s
beaked whales. The Journal of the Acoustical Society of America 125: 1982-1993.
McDonald MA, Fox CG (1999) Passive acoustic methods applied to fin whale population
density estimation. The Journal of the Acoustical Society of America 105: 2643-2651.
McDonald MA, Hildebrand JA, Wiggins SM (2006) Increases in deep ocean ambient
noise in the Northeast Pacific west of San Nicolas Island, California. Journal of the
Acoustical Society of America 120: 711-718.
Meadows DH, Meadows DL, Randers R, Behrens W. (1972) The limits to growth. New
York: Universe Books. 205 Pp.
Mellinger DK, Stafford KM, Moore SE, Dziak RP, Matsumoto H (2007) An overview of
fixed passive acoustic observation methods for cetaceans. Oceanography 20: 36-45.
Miksis-Olds JL, Tyack PL (2009). Manatee (Trichechus manatus) vocalization usage in
relation to environmental noise levels. Journal of the Acoustical Society of America 125:
1806-1815.
Miller PJO, Biassoni N, Samuels A, Tyack PL (2000) Whale songs lengthen in response
to sonar. Nature 405: 903.
74

Moore SE (2009) Climate Change. In: Encyclopedia of Marine Mammals, 2nd ed. Perrin
WF, Würsig B, Thewissen JGM (Eds). New York: Academic Press.
Moore SE (2008) Marine mammals as ecosystem sentinels. Journal of Mammalogy 89:
534-540.
Moore SE, Stafford KM, Mellinger DK, Hildebrand JA (2006) Listening for large whales
in the offshore waters of Alaska. Bioscience 56: 49-55.
Nicol S, Bowie A, Jarman S, Lannuzel D, Meiners KM, Van Der Merwe P (2010)
Southern Ocean iron fertilization by baleen whales and Antarctic krill. Fish and Fisheries
11: 203-209.
NMFS (National Marine Fisheries Service) (2006) Draft recovery plan for the fin whale
(Balaenoptera physalus). National Marine Fisheries Service, Silver Spring, MD.
Noad MJ, Cato DH, Bryden MM, Jenner MN, Jenner KCS (2000) Cultural revolution in
whale songs. Nature 408:537.
Nowacek DP, Thorne LH, Johnston DW, Tyack PL (2007). Responses of cetaceans to
anthropogenic noise. Mammal Review 37: 81-115.
NRC (National Research Council) (2003) Ocean noise and marine mammals. Ocean
Study Board. Washington: National Academy Press.
NRC (National Research Council) (2005) Marine mammal populations and ocean noise:
determining when noise causes biologically significant effects. Washington: National
Academy Press.
Oleson EM, Wiggins SM, Hildebrand JA (2007) Temporal separation of blue whale call
types on a southern California feeding ground. Animal Behaviour 74: 881-894.
Orlanski I (1975) A rational subdivision of scales for atmospheric processes. Bulletin of
the American Meteorological Society 56:527–530.
Overpeck JT, Sturm M, Francis JA, Perovich DK, Serreze MC, Benner R, Carmack EC,
Chapin FS, Gerlach SC, Hamilton LC, et al. (2005) Arctic System on Trajectory to New,
Seasonally Ice-Free State. Eos Transactions, American Geophysical Union 86: 309-316.
Parks SE, Johnson M, Nowacek D, Tyack PL (2010) Individual right whales call louder
in increased environmental noise. Biology Letters (published online, July 2010).
Payne R, Webb D (1971) Orientation by means of long range acoustic signalling in
baleen whales. Annals of the New York Academy of Science 188: 110-141.
75

Pierotti R, Pierotti D (1980) Effects of cold climate on the evolution of pinniped breeding
systems. Evolution 34: 494-507.
Reijnders PJH, Plötz J, Zegers J, Gräfe M (1990) Breeding biology of Weddell seals
(Leptonychotes weddellii) at Drescher Inlet, Riiser Larsen Ice Shelf, Antarctica. Polar
Biology 10: 301-306.
Rendell LE, Gordon JCD (1999) Vocal response of long-finned pilot whales
(Globicephala melas) to military sonar in the Ligurian Sea. Marine Mammal Science
15(1): 198-204.
Reynolds JE, Marsh H, Ragen TJ (2009) Marine mammal conservation. Endangered
Species Research 7: 23-28.
Rice DW (1998) Marine mammals of the world; systematics and distribution. KS
Lawrence (Ed). Society for Marine Mammalogy. 231 Pp.
Richardson WJ, Fraker MA, Würsig B, Wells RS (1985) Behaviour of bowhead whales,
Balaena mysticetus, summering in the Beaufort Sea: Reactions to industrial activities.
Biological Conservation 32: 195-230.
Richardson WJ, Greene CR Jr, Malme CI, Thomson DH (1995) Marine mammals and
noise. London: Academic Press. 576 Pp.
Ridgway RJ, Harrison FRS (1981) Handbook of Marine Mammals, Vol 2: Seals.
London: Academic Press. 359 Pp.
Rommel SA, Costidis AM, Fernandez A, Jepson PD, Pabst DA, McLellan WA, Houser
DS, Cranford TW, van Helden AL, Allen DM, Barros NB (2006) Elements of beaked
whale anatomy and diving physiology, and some hypothetical causes of sonar-related
stranding. Journal of Cetacean Research and Management 7: 189-209.
Rouget PA, Terhune JM, Burton HR (2007) Weddell seal underwater calling rates during
the winter and spring near Mawson station, Antarctica. Marine Mammal Science 23: 508-
523.
Scheifele PM, Andrews S, Cooper RA, Darre M, Musick FE, Max L (2005) Indication of
a Lombard vocal response in the St Lawrence River beluga. The Journal of the
Acoustical Society of America 117: 1486-1492.
Scholander, P.F. 1940. Experimental investigations on the respiratory function in diving
mammals and birds. Hvalradets Skrifter 22:1-131.
76

Siegel V (2005) Distribution and population dynamics of Euphausia superba: summary
of recent findings. Polar Biology 29: 1-22.
Siniff DB, Garrot RA, Rotella JJ, Fraser WR, Ainley DG (2008) Projecting the effects of
environmental change on Antarctic seals. Antarctic Science 20: 425-435.
Sirovic A, Hildebrand JA, Wiggins SA (2007) Blue and fin whale call source levels and
propagation range in the Southern Ocean. The Journal of the Acoustical Society of
America 122: 1208-1215.
Slabbekoorn H, Bouton N (2008) Soundscape orientation: A new field in need of sound
investigation. Animal Behaviour 76: e5–e8.
Smetacek V, Nicol S (2005) Polar ocean ecosystems in a changing world. Nature 437:
362-368.
Southall BL, Bowles AE, Ellison WT, Finneran JJ, Gentry RL, Greene Jr CR, Kastak D,
Ketten DR, Miller JH, Nachtigall PE, Richardson WJ, Thomas JA, Tyack PL (2007)
Marine mammal noise exposure criteria: Initial scientific recommendations. Aquatic
Mammals 33: 411-521.
Spreen G, Kaleschke L, Heygster G (2008) Sea ice remote sensing using AMSR-E 89
GHz channels. Journal of Geophysical Research 113: C02S03.
Stafford KM, Citta JJ, Moore SE, Daher MA, George JE (2009) Environmental correlates
of blue and fin whale call detections in the North Pacific Ocean from 1997 to 2002.
Marine Ecology Progress Series 395:37-53.
Stafford KM, Fox CG, Clark DS (1998) Long-range acoustic detection and localization
of blue whale calls in the northeast Pacific using military hydrophone arrays. The Journal
of the Acoustical Society of America 104: 3616-3625.
Stern SJ (2002) Migration and movement patterns. In: Encyclopedia of Marine
Mammals, 1st ed. Perrin WF, Würsig B, Thewissen JGM. New York: Academic Press. Pp
742-748.
Stonehouse B (1989) Polar environments. In: Polar Ecology. New York: Chapman and
Hall. 222 Pp.
Thompson PO, Cummings WC, Ha SJ (1986) Sounds, source levels, and associated
behavior of humpback whales, southeast Alaska. Journal of the Acoustical Society of
America 80: 735-740.
77

Tremblay JE, Smith WO (2007) Primary production and nutrient dynamics in polynyas.
In: Polynyas, windows to the world, Smith WO, Barber DG (Eds). Amsterdam: Elsevier.
Pp 239-263.
Trillmich F (1996) Parental investment in pinnipeds. Advances in the Study of Behaviour
25: 533-577.
Truax, Barry (2001) Acoustic Communication 2nd ed. Westport, CT: Greenwood Press.
Tyack PL (2000) Functional aspects of cetacean communication. In: Mann J, Connor RC,
Tyack PL, Whitehead H (Eds) Cetacean societies: field studies of dolphins and whales.
Chicago: University of Chicago Press. Pp 270–307.
Tynan CT, DeMaster DP (1997) Observations and predictions of Arctic climate change:
potential effects on marine mammals. Arctic 50: 308-322.
Van Parijs SM (2003) Aquatic mating in pinnipeds: a review. Aquatic Mammals 29: 214-
226.
Van Parijs SM, Corkeron PJB (2001) Boat traffic affects the acoustic behaviour of
Pacific humpback dolphins, Sousa chinensis. Journal of the Biological Association of the
UK 81: 533-538.
Van Parijs SM, Lydersen C, Kovacs KM (2004) Effects of ice cover on the behavioural
patterns of aquatic mating male bearded seals. Animal Behaviour 68: 89-96.
Van Parijs SM, Thompson PM, Tollit DJ, Mackay A (1997) Distribution and activity of
male harbour seals during the mating season. Animal Behaviour 54: 35-43.
Wartzok D, Ketten DR (1999) Marine mammal sensory systems. In: JE Reynolds II &
SA Rommel (Eds.), Biology of marine mammals. Washington, DC: Smithsonian
Institution Press. Pp 117-175.
Watkins WA, Schevill WE (1975) Sperm whales (Physeter catodon) react to pingers.
Deep-Sea Research I 22: 123-129.
Weilgart LS (2007) The impacts of anthropogenic ocean noise on cetaceans and
implications for management. Canadian Journal of Zoology 85: 1091-1116.
Wilson DE, Russel Cole F, Nichols JD, Rudran R, Foster MS (Eds) (1996) Measuring
and Monitoring Biological Diversity, Standard Methods for Mammals. Washington DC:
Smithsonian Institution Press.
78

Wirsing AJ, Heithaus MR, Frid A, Dill LM (2008) Seascapes of fear: evaluating
sublethal predator effects experienced and generated by marine mammals. Marine
Mammal Science 24: 1-15.
Yablokov AV, Zemsky VA, Mikhalev YA, Tormosov VV, Berzin AA (1994) Data on
Soviet whaling in the Antarctic in 1947-1972 (Population aspects). Russian Journal of
Ecology 29: 43-48.
Zimmer WMX, Tyack PL (2007) Repetitive shallow dives pose decompression risk in
deep-diving beaked whales. Marine Mammal Science 23: 888-925.
79

Publication I
Insights into the acoustic behaviour of polar pinnipeds – current
knowledge and emerging techniques of study
80

In: Animal Behavior: New Research ISBN: 978-1-60456-782-3
Editors: E. A. Weber, L. H. Krause © 2008 Nova Science Publishers, Inc.
Chapter 6
INSIGHTS INTO THE ACOUSTIC BEHAVIOUR OF
POLAR PINNNIPEDS – CURRENT KNOWLEDGE AND
EMERGING TECHNIQUES OF STUDY
Ilse Van Opzeeland, Lars Kindermann, Olaf Boebel and Sofie Van Parijs
Alfred Wegener Institute, Bremerhaven, Germany
ABSTRACT
This chapter will provide a review of the acoustic behaviour of polar pinnipeds. It
will also present a detailed update of new and emerging passive acoustic technologies
and how these can further the study of behaviour for polar marine mammals.
Both Arctic and Antarctic pinnipeds are known to exhibit a range of adaptations
which enable them to survive and reproduce in an ice-dominated environment. However,
large gaps still exist in our understanding of the fundamental ecology of these species, as
investigations are severely hampered by the animals’ inaccessibility. Improving our
understanding of ice-breeding species and the effects that changes in habitat might have
on their behaviour is vital, as current climatic trends are rapidly altering the polar
environments.
For pinnipeds, acoustic communication is known to play an important role in various
aspects of their behaviour. Mother-pup reunions and the establishment of underwater
territories during the mating season are examples which, for the majority of species, are
known to be mediated by vocal signalling. Acoustic measurements therefore provide an
essential tool to study ice-breeding pinnipeds as recordings can be used to remotely
monitor sounds, track animal movements and determine seasonal changes in movements
and distribution. Recent advances in recording technologies, now allow the acquisition of
continuous long-term acoustic data sets, even from the remotest of polar regions.
To date, a range of different types of passive acoustic instruments are used, the
choice of which depends largely on the purpose of the study. These instruments in
addition to computer-based methods that have been developed for automated detection,
No part of this digital document may be reproduced, stored in a retrieval system or transmitted in any form or
by any means. The publisher has taken reasonable care in the preparation of this digital document, but makes no
expressed or implied warranty of any kind and assumes no responsibility for any errors or omissions. No
liability is assumed for incidental or consequential damages in connection with or arising out of information
contained herein. This digital document is sold with the clear understanding that the publisher is not engaged in
rendering legal, medical or any other professional services.
81

Ilse Van Opzeeland, Lars Kindermann, Olaf Boebel et al. 134
classification and localization of marine mammal sounds will be discussed. The
autonomous PerenniAL Acoustic Observatory in the Antarctic Ocean (PALAOA) is
presented here as one example of such recording systems.
INTRODUCTION Dispersal of pinnipeds into polar areas is thought to have begun with the evolution of
large body size in the ancestral pinnipeds (Costa 1993). In Costa’s (1993) model, early
pinnipeds exhibited a primitive form of otariid breeding patterns with females requiring
numerous short duration foraging trips to sustain lactation. The evolution of large body size
enabled females to separate foraging from lactation as females had increased maternal
reserves to rely on. This separation of foraging and breeding is thought to finally have
enabled these basal phocids to inhabit and reproduce in less-productive areas such as the
Atlantic, in relative absence of resource competitors. Upon reaching higher latitudes, the
shortened lactation period would have pre-adapted these early phocids to breeding on
unstable substrates, such as ice (Costa 1993). The establishment of ice-breeding along with
development of a mainly aquatic life style has influenced many aspects of pinniped behaviour
in high latitude habitats e.g. the timing of reproduction, duration of lactation period and the
development of different mating strategies. Although ice-breeding pinnipeds share many
similarities in behavioural patterns, there is also considerable variance in the social and
physical conditions of their breeding habitat (e.g. Lydersen & Kovacs 1999). To date
however, clear gaps still exist in what is known about the behaviour of polar pinnipeds. This
is due to the fact that behavioural studies in polar pinniped species are severely hampered
since many of the behavioural patterns are likely to take place in offshore waters or in remote
pack-ice areas, logistically limiting the possibilities of study. All of the ice-breeding pinniped
species are however, known to produce underwater vocalizations, the monitoring of which
has proved to be a valuable tool to study many aspects of pinniped behaviour (e.g. Thomas &
DeMaster 1982; Rogers et al. 1996; Van Parijs et al. 1997; Perry & Terhune 1999; Van Parijs
et al. 2003; Van Parijs et al. 2004; Terhune & Dell’Apa 2006; Rouget et al. 2007). This
review aims to provide an overview of the existing information and current gaps in
knowledge on the acoustic behaviour of ice-breeding pinnipeds. Additionally, we summarize
recent developments in recording technologies, which now enable acquisition of long-term
acoustic data sets in remote areas and evaluate how these techniques may contribute to the
improvement of our fundamental understanding of the behaviour of polar pinnipeds.
POLAR HABITATS The Southern Ocean surrounds the Antarctic continent. The northern boundary of the
Southern Ocean is formed by the Antarctic Convergence or the southern polar frontal zone,
which forms a sharp temperature boundary between northern temperate waters and southern
polar waters. The polar front is an important factor in the distribution of marine mammals, as
it defines the southern extent of tropical and temperate species. There are four species of ice-
breeding seals in the Antarctic, all of which occupy different niches in the sea ice habitat:
82

Insights into the Acoustic Behaviour of Polar Pinnnipeds 135
leopard (Leptonyx hydrurga), crabeater (Lobodon carcinophagus), Ross (Ommatophoca rossii) and Weddell seal (Leptonychotes weddellii). The Antarctic sea-ice habitat differs
substantially from that in the Arctic. The Antarctic sea-ice offers seasonal habitat
hetereogeneity, as most of it melts in austral summer (Dayton et al. 1994). The Arctic sea ice
is less dynamic and never melts except at the periphery. However, this may change rapidly
within the next decades as the Arctic sea-ice shows substantial decreases in both extent and
thickness in response to global warming. The Arctic region is less well defined by
environmental characteristics, consisting of the Arctic Ocean with in the center a permanent
cover of slowly circulating ice floes surrounded by a zone of seasonal pack-ice and a zone of
land fast-ice (e.g. Stonehouse 1989). Polynias, predictable areas of open water within ice-
covered seas, are of particular importance in Arctic habitats as they represent areas with high
nutrient levels and enhanced productivity (Comiso & Gordon 1987; Dayton et al. 1994). Of
all the Arctic pinniped species, only three have a continuous circumpolar distribution (ringed
(Phoca hispida) and bearded seal (Erignathus barbatus) and walrus (Odobenus rosmarus)
e.g. Stirling et al. 1983). However, several other species associate with the ice seasonally and
are dependent on it as a breeding substrate. The Arctic pinniped species covered in this
review are: ringed, bearded, harp (Phoca groenlandica), hooded (Cystophora cristata), grey
(Halichoerus grypus), ribbon (Phoca fasciata), Caspian (Phoca caspica), Baikal (Phoca siberica), Largha (Phoca largha), harbour seal (Phoca vitulina) and walrus.
Seasonal or year-round association with ice offers pinnipeds a number of advantages,
such as abundant food supply that is readily accessible under the ice in relative absence of
competitors and terrestrial predators, a solid substrate to moult, rest, give birth and nurse
pups. Dependent on the ice type, ice may also provide shelter in ridges and crevices as well as
a milder micro-climate as there is generally less wind and wave action within ice packs
(Riedman 1990).
PINNIPED ADAPTATIONS FOR L IFE ON I CE
Apart from a number of physiological adaptations for life in ice-dominated environments,
such as sharp and strong claws for locomotion on the ice, the lanugo fur of pups which
maintains body heat and thick subcutaneous blubber layers to restrict heat loss in adult seals
(e.g. Lydersen & Kovacs 1999), polar pinnipeds also developed behavioural adaptations to
life in their habitat. In temperate regions, the onset of parturition in terrestrial breeding
pinnipeds is to a large extent determined by ambient temperature. Polar pinnipeds, however,
depend on ice for breeding. Consequently, parturition does not occur in late spring and early
summer, but rather in the late winter and early spring, when snow accumulation is at a
maximum and temperatures are well below freezing (Pierotti & Pierotti 1980). This is the
time of year when the ice is most extensive and stable and pup mortality as a result of ice
breakup is minimized (Pierotti & Pierotti 1980). As this period of optimal ice conditions is
relatively short, pupping is generally synchronous within ice-breeding pinniped populations
compared to pinnipeds breeding on land. Grey seals provide a unique illustration in this
respect as some grey seal populations breed on ice, whereas others breed on land. The grey
seal populations that breed on ice have much more condensed lactation and birthing periods
than the populations that breed on land, which is thought to be a response to the higher risk of
83

Ilse Van Opzeeland, Lars Kindermann, Olaf Boebel et al. 136
premature separation of mother and pup on ice (Pierotti & Pierotti 1980; Haller et al. 1996).
Nevertheless, within the ice habitats of polar pinnipeds there also exists considerable
variation which appears to be of influence on behavioural patterns and the timing of
behaviour as well (Trillmich 1996; Lydersen & Kovacs 1999). Variability in e.g. the temporal
and structural stability of the platform, risk of predation, availability of food within the
breeding habitats and access to the water are factors that have been suggested to have resulted
in the evolution of different maternal strategies and consequently in differences in
development of mother-pup acoustic communication in ice-breeding phocids (Insley 1992;
Trillmich 1996; Lydersen & Kovacs 1999). In the light of current trends in climate change,
knowledge on small scale local adaptations of behaviour in ice-breeding pinnipeds is of great
importance in order to understand changes in abundance, distribution and behaviour. In the
following section we provide an overview of the current state of knowledge on the role of in-
air acoustic cues in polar pinniped mother-pup pairs and relate this to maternal strategies and
breeding habitat characteristics.
ACOUSTIC BEHAVI OUR OF POLAR PINNIPED MOTHER -PUP PAIRS
In all pinniped species studied to date, pups have been found to vocalize in a similar
fashion when interacting with the mother (e.g. Perry & Renouf 1988; McCulloch et al. 1999;
Van Opzeeland & Van Parijs 2004; Collins et al. 2006). Individual stereotypy in calls is an
important aspect of vocal recognition, as it enables individuals to distinguish between one and
another, although individual vocal stereotypy does not necessarily indicate individual
recognition (Insley 1992; Insley et al. 2003). Vocal signalling has been shown to play an
important role in successful otariid mother-pup reunions upon the female’s return from
regular foraging trips (Trillmich 1981; Gisiner & Schusterman 1991; Insley 2001; Charrier et
al. 2002). In phocids, however, the role of vocal signals in the recognition process, has been
found to be more variable and has to date only been investigated in few species (see Table 1;
Renouf 1984; Insley 1992; Job et al. 1995; McCulloch et al. 1999; McCulloch & Boness
2000; Van Opzeeland & Van Parijs 2004; Collins et al. 2005; 2006). Within ice-breeding
phocids, evidence for individual stereotypy in pup calls has been found in the three colonial
breeding species: Weddell seals (Collins et al. 2005; 2006), grey seals (McCulloch et al.
1999; McCulloch & Boness 2000) and harp seals (Van Opzeeland & Van Parijs 2004).
However, the patterns in pup call individual stereotypy reported in these species are markedly
different and are likely to reflect the complex interactions between e.g. the degree of
coloniality, the likelihood and predictability of separations due to maternal foraging or ice
break-up and the ontogeny of acoustic behaviour in ice-breeding pinnipeds (McCulloch &
Bonness 2000; Insley et al. 2003; Van Opzeeland & Van Parijs 2004). In Weddell seals,
females form breeding aggregations in fast ice areas where ice cracks provide access to the
water. Compared to other phocid species, the lactation period in Weddell seals is relatively
long, lasting 6-7 weeks (Laws 1981; 1984). During the first two weeks post-partum, females
attend their pup on the ice continuously. However, during the second half of the nursing
period, females spend increasingly more time in the water (Tedman & Bryden 1979; Hindell
et al. 2002; Sato et al. 2003). Pups also start entering the water around this time, although the
age at which pups first enter the water varies and is thought to depend on differences in local
84

Insights into the Acoustic Behaviour of Polar Pinnnipeds 137
ice conditions and colony density (Tedman & Bryden 1979). Weddell seal pups vocalize and
their vocalizations have been found to be moderately individually distinctive (Collins 2006).
Unlike many other phocid mothers, Weddell seal females vocalize frequently to their pups
(Kaufman et al. 1975; Collins et al. 2005). Female in-air calls have also been investigated in
this species and have been found to exhibit individual stereotypy, although vocalizations are
not unique (Collins et al. 2005). The critical amount of distinct information in both female
and pup calls combined with an individual’s visual and olfactory cues is likely to allow
mother-pup pairs to recognize each other (Collins et al. 2005; 2006).
In grey seals, vocal behaviour of mother-pup pairs has to date only been studied in land-
breeding populations. This has led to the finding of some remarkable differences between
land-breeding colonies, which have been related to the ice-breeding ancestry of the species
(McCulloch et al. 1999; McCulloch & Boness 2000). Through playback experiments,
McCulloch et al. (1999; McCulloch & Boness 2000) were able to show that in the Sable
Island colony, grey seal females discriminate between the vocalizations of their own and
unfamiliar pups, whereas this ability appeared absent in the Isle of May grey seal colony. It
was suggested that the female’s ability to recognize the vocalizations of their own pup in the
Sable Island colony could be a vestige of the ice-breeding ancestry of that colony, where it
might have evolved in response to the higher risks of mother-pup separations (Pierotti &
Pierotti 1980; McCulloch & Boness 2000). Acoustic behaviour of grey seal mother-pup pairs
has, however, to date not been studied in any of the ice-breeding grey seal populations. As
grey seals breed both on fast-ice and pack-ice, comparisons between these populations might
provide interesting insights into the impact of breeding substrate stability on mother-pup
acoustic behaviour.
Harp seal females form large breeding aggregations on seasonal Arctic pack-ice. During
the 12 day lactation period, females forage a few hours per day (Lydersen & Kovacs 1993;
Kovacs 1987; 1995), leaving their pup alone on the ice. Pups are relatively sedentary, rarely
leaving the ice flow or entering the water. Harp seal pups vocalize in air during the lactation
period, their vocalizations being structurally complex and variable (Miller & Murray 1995).
Pup vocalizations were found to exhibit a relatively low percentage of individual variation
(Van Opzeeland & Van Parijs 2004; Van Opzeeland et al. in prep). In the Greenland Sea
population, vocalizations of female pups however, were found to be significantly more
individually stereotyped within individuals than males, biasing maternal recognition towards
female pups. However, in the Canadian Front harp seal population, no significant difference
in pup vocal individuality between the sexes was found (Van Opzeeland et al. in prep). These
differences in vocal individuality between the sexes may reflect different selection pressures
working on female and male harp seals (Van Opzeeland & Van Parijs 2004). Alternatively,
these population differences may be related to small scale local adaptations to i.e. site-specific
ice conditions (Van Opzeeland et al. in prep). Clearly, further study is needed to investigate
what is driving these differences in harp seal pup vocal behaviour.
85

Tab
le 1
. Rev
iew
of c
urre
nt k
now
ledg
e on
pola
r pi
nnip
eds
conc
erni
ng w
helpi
ng h
abita
t, gr
egar
ious
ness
, dur
atio
n of
the
lact
atio
n pe
riod,
fe
mal
e fo
ragi
ng d
urin
g la
ctat
ion
and
the
type
of i
nidiv
idua
listic
voc
aliz
atio
n an
d re
cogn
ition
test
ed
Sp
ecie
s
Whe
lpin
g ha
bita
t G
rega
riou
s D
urat
ion
of
lact
atio
n (d
ays)
F
emal
es a
t sea
du
ring
la
ctat
ion
Indi
vidu
alis
tic
voca
lizat
ion
test
ed
Typ
e of
rec
ogni
tion
test
ed
Har
p s
eal
Pac
k-i
ce
Yes
1
2
Yes
P
up
cal
ls
No
ne
Gre
y s
eal
Pac
k-i
ce,
fast
ice
and
lan
d
No, N
o,
Yes
12-1
7
Yes
P
up
cal
ls
Pup
by m
oth
er
Har
bo
ur
seal
P
ack-i
ce a
nd
lan
d
Yes
, Y
es
24-4
2
Yes
P
up
cal
ls
Pup
by m
oth
er
Hooded
sea
l P
ack-i
ce
No
3-4
N
o
Non
e N
on
e
Bea
rded
sea
l P
ack-i
ce
No
2
4
Yes
N
on
e N
on
e
Rin
ged
sea
l F
ast-
ice
No
3
9-4
1
Yes
N
on
e N
on
e
Lar
gh
a se
al
Pac
k-i
ce
No
1
4-2
1
No d
ata
Non
e N
on
e
Cas
pia
n s
eal
Fas
t-ic
e N
o
20-2
5
No d
ata
Non
e N
on
e
Bai
kal
sea
l F
ast-
ice
No
6
0-7
5
Yes
N
on
e N
on
e
Rib
bo
n s
eal
Pac
k-i
ce
No
2
1-2
8
No d
ata
Non
e N
on
e
Wal
rus
Arctic
Pac
k-i
ce,
Fas
t-ic
e Y
es
~730
Yes
P
up
cal
ls
Pup
by m
oth
er
Wed
del
l se
al
Fas
t-ic
e Y
es
33-5
3
Yes
M
oth
er +
Pup
cal
ls
Non
e
Cra
bea
ter
seal
P
ack-i
ce
No
17-2
8
No
N
on
e N
on
e
Leo
par
d s
eal
Pac
k-i
ce
No
~3
0
No d
ata
Non
e N
on
e
Ross
sea
l
Antarctic
Pac
k-i
ce
No
~
30
N
o d
ata
Non
e N
on
e
86

Tab
le 2
. Ove
rvie
w o
f pas
sive
aco
ustic
tech
niqu
es th
at a
re c
urre
ntly u
sed
to s
tudy
mar
ine
mam
mal
s and
thei
r su
itabi
lity
to s
tudy
pol
ar
pinn
iped
s (p
artia
lly b
ased
on
info
rmat
ion
deriv
ed fr
om V
an P
arijs
et a
l. 20
07)
T
echn
ique
D
urat
ion
depl
oym
ent
(nea
r) r
eal-
time
data
Ves
sel r
equi
rem
ents
D
ata
stor
age
capa
city
Su
itabl
e fo
r us
e on
pi
nnip
eds
in p
olar
ar
eas
Ava
ilabl
e ty
pes
Sh
ip-t
ow
ed a
rray
s H
ou
rs t
o w
eeks
YE
S
Ded
icat
ed s
hip
tim
e E
ssen
tial
ly
un
lim
ited
Dep
end
ent
on
ice
cond
itio
ns
Eco
logic
Ltd
., M
AP
S,
man
y m
ore
Aco
ust
ic t
ags
Hou
rs t
o d
ays
NO
D
eplo
ym
ent
and
retr
iev
al
A f
ew g
igab
yte
s Y
ES
B
pro
be,
DT
AG
Mo
ore
d
auto
no
mo
us
hydro
ph
on
es
(bott
om
, dee
p-s
ea
mo
ori
ng,
ice
bas
ed)
up t
o s
ever
al
yea
rs (
dep
enden
t
on s
amp
lin
g
reg
ime)
NO
Y
earl
y o
r b
i-yea
rly
dep
loym
ent
and
retr
iev
al (
bu
t
dep
end
ent
on
sam
pli
ng
reg
ime)
Gig
a- t
o
tera
byte
s
YE
S (
iceb
erg
shif
ting
in d
eep
er
wat
ers)
Pop
up
, H
AR
P, A
RP
,
AU
RA
L-M
2, E
AR
S
Gli
der
s an
d
und
erw
ater
veh
icle
s
Wee
ks
to m
on
ths
YE
S
Dep
loym
ent
and
retr
iev
al
Gig
abyte
s Y
ES
S
eaG
lid
er, W
HO
I
Rad
io-l
ink
ed
sonob
uo
ys
Hou
rs t
o m
on
ths
YE
S
Ded
icat
ed s
hip
/air
tim
e
Ess
enti
ally
un
lim
ted
YE
S
Mil
itar
y s
urp
lus,
DIF
AR
Cab
led s
yst
ems
Yea
rs t
o d
ecad
es
YE
S
One-
tim
e
dep
loym
ent;
mai
nte
nan
ce
Ess
enti
ally
um
lim
ited
NO
S
OS
US
, A
LO
HA
,
NE
PT
UN
E,
AU
TE
C,
CT
BT
O
Au
tono
mo
us
list
enin
g s
tati
on
s
Yea
rs t
o d
ecad
es
YE
S
One-
tim
e
dep
loym
ent;
mai
nte
nan
ce
Ess
enti
ally
un
lim
ited
YE
S
PA
LA
OA
87

Ilse Van Opzeeland, Lars Kindermann, Olaf Boebel et al. 140
Although most harbour seal populations form dispersed breeding colonies on land, few
also give birth on ice (Streveler 1979; Calambokidis et al. 1987). Research on these
populations is limited and to date no study has addressed mother-pup behaviour in ice-
breeding harbour seals. In land-breeding harbour seals, pups often accompany their mothers
on foraging trips from birth (Wilson 1974). Pups vocalize both in-air and in water and
although airborne and underwater vocalizations were found to differ, pup calls were
individually stereotyped (Renouf 1984; Perry & Renouf 1988). However, to what extent these
findings can be extrapolated to ice-breeding harbour seals is unknown.
For solitary ice-breeding pinnipeds the selective pressures favouring development of
individually stereotyped vocalizations may be less strong as there is little confusion possible
over maternal investment. Crabeater and hooded seals are solitary pack-ice breeders and have
short lactation periods, during which females remain with their pup on the ice throughout the
nursing period (Siniff et al. 1979; Riedman 1990). Consequently, there is little opportunity for
mother-pup pairs to become separated. Hooded seal pups emit snorts, grunts or brief low-
frequency moans while attended by their mothers. Ballard & Kovacs (1995) concluded that
these vocalizations are unlikely to be used by a female to identify her pup as these sounds
contain little frequency or amplitude modulation which in many other species have been
found to bear the individually distinctive cues (e.g. Phillips & Stirling 2000; Charrier et al.
2002). In crabeater seals, nothing is known on the role of vocal behaviour in mother-pup
interactions, although vocalizing has been reported to occur when the pair is separated (Siniff
et al. 1979). In bearded and ringed seals, both pup and female are known to forage throughout
the lactation period (Hammill et al. 1991; Lydersen & Hammill 1993; Hammill et al. 1994;
Kelly & Wartzok 1996; Krafft et al. 2000). Vocal cues might therefore serve a function to
coordinate and synchronize mother-pup behaviour during the lactation period. However, to
date the role of acoustics in mother-pup interactions in these species has not been
investigated.
In the other pack-ice breeding pinnipeds, Ross, leopard, Largha, Caspian, Baikal and
ribbon seals, knowledge on the species’ general biology is to a large extend still lacking and
nothing is known on acoustic behaviour in mother-pup pairs.
Walruses also breed on pack-ice, forming dense aggregations in spring. Calves enter the
water immediately after birth and are nursed for at least one year both on the ice and in the
water (Riedman 1990; Kastelein 2002). However, most calves associate with their mothers in
groups of adult females for longer periods and are weaned after three years (Kastelein 2002).
Walrus female-offspring acoustic recognition has been suggested by observation to be well
developed in walruses (Kibal’chich & Lisitsina 1979; Miller & Boness 1983; Miller 1985;
Kastelein et al. 1995) and was recently also experimentally demonstrated. Walrus calf
vocalizations were found to be highly stereotyped and females were found to respond more
strongly to playbacks of vocalizations of their own calf than to the calls of an alien calf
(Charrier pers. comm.).
88

Insights into the Acoustic Behaviour of Polar Pinnnipeds 141
ACOUSTIC BEHAVIOUR AND MATING STRATEGIES IN POLAR PINNIPEDS
The transition from ancestral terrestrial parturition to giving birth on ice is also thought to
have had major consequences for the evolution of mating strategies in ice-breeding pinniped
species (e.g. Bartholomew 1970; Pierotti & Pierotti 1980; LeBoeuf 1986; Van Parijs 2003).
On land, the relative rarity of suitable pupping and haul-out areas causes the formation of
very dense female breeding aggregations, enabling males to defend harems or compete with
other males for a place within a female breeding group (Bartholomew 1970). However, ice
habitats generally offer large areas suitable for parturition and haul-out and consequently
many ice-breeding pinnipeds aggregate in loose colonies or breed in a solitary fashion (e.g.
Stirling 1975; LeBoeuf 1986; Lydersen & Kovacs 1999). This, along with the fact that
females in many ice-breeding pinnipeds forage to sustain lactation, causes female movements
to be both spatially and temporally less predictable for males compared to land-breeding
females (Van Parijs 2003). As a consequence, ice-breeding pinniped females cannot be
economically monopolized by males when they become receptive and male reproductive
strategies must aim to attract females for the purpose of mating (Van Parijs 2003). All ice-
breeding pinnipeds mate aquatically and underwater vocalizations and stereotypical dive
displays are known to form an important part of male-male competition and male
advertisement to females in aquatic mating species (see Van Parijs 2003 for a review). The
available evidence appears to indicate the existence of different mating systems within
aquatic mating species (Kovacs 1990; Rogers et al. 1996; Van Parijs et al. 1997; 2001; 2003;
Harcourt et al. 2007; in press). However, due to the difficulties of studying ice-breeding
pinnipeds, too few species have been studied to date to compare the relative impact of habitat
and female behaviour on male mating tactics. Here we summarize what is currently known on
acoustic behaviour related to mating behaviour in ice-breeding pinnipeds.
In colonial breeding species such as Weddell and harp seals, communication generally
occurs over relatively short distances as both males and females form seasonal aggregations.
Signals are not constrained by propagation needs and consequently many different sound
types as well as subtle variations in sounds are used in communication. Accordingly, the
vocal repertoires of colonial breeding species are generally broad and consist of a wide
variety of sounds that serve local advertisement displays in order to defend territories and to
attract mates (Rogers 2003). Male Weddell seals typically defend underwater territories
around or near tide cracks used by females, perform short shallow display dives and have a
large underwater vocal repertoire, including the male-specific long descending “trill”
(Kooyman 1981; Thomas & Kuechle 1982; Bartsch et al. 1992; Oetelaar et al. 2003; Harcourt
et al. in press). Vocal activity increases strongly during the breeding season (Green & Burton
1988; Rouget et al. 2007) and trill vocalizations are likely used underwater by males for the
purpose of territorial defence, advertisement, dominance and warning signals (Thomas &
Kuechle 1982; Thomas & Stirling 1983; Thomas et al. 1983). Although female movements
are somewhat predictable as females use tide cracks in the ice to access the water, females
have access to all parts of the water column and male monopolization of females may be
difficult (Hindell et al. 2002; Sato et al. 2003; Harcourt et al. 2007; in press). It has been
suggested that in systems where males cannot monopolize females, male-male competition
may play a less important role (e.g. Harcourt et al. 2007). Male territories under the ice may
89

Ilse Van Opzeeland, LarsKindermann, Olaf Boebel et al. 142
instead primarily serve to maximize exposure of the territory holder to females passing
through. Male vocal and dive displays may be used by females to assess quality of a potential
mating partner and consequently female choice may have a significant role in mating success.
However, male Weddell seal mating tactics have also been found to exhibit plasticity
(Harcourt et al. in press) and more detailed investigation of underwater behaviour of male and
female Weddell seals is needed to test this hypothesis.
Similar to Weddell seals, harp seals also have a large vocal repertoire consisting of a
wide variety of sounds that suit local communication purposes (Møhl et al. 1975; Terhune &
Ronald 1986; Terhune 1994; Serrano 2001; Rogers 2003). Harp seal vocal activity increases
in both sexes during the breeding season, suggesting that females also may have an important
role in mating behaviour (Watkins & Schevill 1979; Serrano & Miller 2000; Serrano 2001).
Harp seal females aggregate in colonies and use leads between shifting pack-ice floes to
access the water to forage during lactation. Males therefore have access to clusters of females.
Merdsøy et al. (1978) reported large male harp seal groups travelling through the breeding
herd early in the breeding season. Agonistic interactions between males increased towards the
time that pups were weaned and males and females were seen hauled out on the ice (Merdsøy
et al. 1978). Males have been observed snorting and bubble blowing at holes used by females
(Merdsøy et al. 1978; Kovacs 1995). However, to date it is unknown how vocal behaviour
relates to harp seal male and female mating behaviour.
Ringed seals also exhibit a relatively rich vocal repertoire, which is thought to serve the
purpose of male local display (Stirling 1973; Kunnasranta et al. 1996; Rogers 2003).
Although ringed seals do not breed in colonies, they often form small aggregations on fast-
ice. Females are believed to maintain birth lair complexes which are included in an area
occupied by a territorial male (Smith & Hammill 1981). Interestingly, Weddell, harp and
ringed seals have been found to vocalize year round, with peaks in vocal activity during the
breeding season (Green & Burton 1988; Kunnasranta et al. 1996; Serrano 2001; Rouget et al.
2007). Apart from the sole purpose of vocal display during the mating season, vocal
behaviour has in these species been suggested to also serve other purposes such as social
communicative function during migration or pursuit of prey (Kunnasranta et al. 1996; Serrano
& Miller 2000; Rouget et al. 2007). However, only few studies have investigated the vocal
behaviour of these species outside the breeding season (Serrano & Miller 2000; Serrano 2001;
Rouget et al. 2007)
In contrast to the rich vocal repertoire of Weddell, harp and ringed seals, a number of
polar pinnipeds produce single or series of relatively short broadband pulsed sounds, which
have been suggested to mainly function in agonistic interactions (Rogers 2003; Hayes et al.
2004). Land-breeding harbour seals perform short dives and produce underwater roar
vocalizations in underwater display areas (Hanggi & Schusterman 1994; Van Parijs et al.
1997; Hayes et al. 2004). Male mating strategies were found to be closely linked to habitat
type and resulting changes in female behaviour, distribution and density (Van Parijs et al.
1999; 2000). In ice-breeding harbour seals, females have been reported to strongly depend on
the limited availability of suitable haul-out ice (Calambokidis et al. 1987; Mathews & Kelly
1996). Similar to land-breeding harbour seals, this may enable males to concentrate and
display in areas that are frequented by females. However, the underwater vocal behaviour in
ice-breeding harbour seals has not been studied and it is not known if males in these
populations also hold underwater territories. Grey seals also breed both on ice and on land
and have a similarly simple vocal repertoire consisting of short gutteral sounds, growls and
90

Insights into the Acoustic Behaviour of Polar Pinnnipeds 143
clicks (Schusterman et al. 1970; Asselin et al. 1993). Breeding habitat has in this species been
shown to be of great influence on mating behaviour (Anderson & Harwood 1985). Whereas
males in land-breeding grey seals defend harems, males in ice-breeding grey seals are unable
to monopolize females that are widely dispersed on the ice. Males are usually seen attending
one female and her pup on the ice, forming triads (Riedman 1990). Another difference
between ice-breeding and land-breeding grey seals is the fact that ice-breeding grey seal
males and females regularly enter the water during the breeding season, whereas this is rarely
seen in land-breeding populations (Asselin et al. 1993). The underwater vocal repertoire of
grey seals has also been found to differ between land- and ice-breeding populations (Asselin
et al. 1993). Underwater vocal display may therefore form an important part of ice-breeding
grey seal male mating behaviour.
For crabeater seals, only one short broadband call type has been documented and vocal
activity is thought to be restricted to the breeding season (Stirling & Siniff 1979; Rogers
2003). Crabeater seals form triads and occur in low densities in pack-ice areas. Males attend
one female and her pup on the ice and defend the female against intrusions by other adult
crabeater seal males until the female becomes receptive (Siniff et al. 1979). The relatively
simple acoustic display of crabeater seal males is thought to function primarily in short-range
male-male competition in guarding the female, as loud complex vocalizations would have the
potential to attract other distant males to the pre-oestrus female (Rogers 2003).
Male hooded seals have a small in-air and underwater acoustic repertoire, involving five
call types, most of which were found to be used in close-range communication in agonistic or
sexual contexts during the reproductive period (Ballard & Kovacs 1995). Similar to crabeater
seals, hooded seals form triads on the ice. However, hooded seal females are generall less
widely dispersed compared to crabeater seals (e.g. Sergeant 1974; Siniff et al. 1979; Boness
et al. 1988). Males may therefore move more easily between females resulting in some degree
of polygyny (Boness et al.1988; Kovacs 1990). In addition, observations of some males
attending a female continuously on the ice, whereas others were more mobile and attended
several females for shorter periods of time, are suggestive of the use of alternative mating
strategies by hooded seal males (Kovacs 1990). Visual displays involving the hood and
septum form an important part of male hooded seal behaviour as male displays to a large part
take place on the ice (Kovacs 1990; Ballard & Kovacs 1995).
In walruses, males of Atlantic and Pacific populations have been found to use different
mating tactics. In the Atlantic walrus, large mature males were observed to attend and
monopolize groups of potentially reproductive females for extended periods (Sjare & Stirling
1996). Male distribution in this population was mainly determined by ice-cracks and polynias
that provided easy access to open water (Sjare & Stirling 1996). Pacific walruses breed on
drifting pack-ice with a rapidly changing distribution of open water and much higher breeding
population densities (Fay et al. 1984). The highly unstable environment combined with higher
densities of potentially reproductive females is thought to make it more advantageous for
Pacific walrus males to display in small areas for brief periods than to continuously attend
and defend one herd (Sjare & Stirling 1996). Male walruses vocalize extensively in the
vicinity of females and calves, emitting short repetitious pulses which have been suggested to
exhibit individual stereotypy (Stirling et al. 1987).
In solitary pack-ice or fast-ice breeders, individuals need to broadcast their sounds over
long distances to advertise their position to potential mates and rival males (Van Parijs 2003;
Rogers 2003). These species generally have a medium size repertoire and vocalizations tend
91

Ilse Van Opzeeland, LarsKindermann, Olaf Boebel et al. 144
to be stereotyped signals to increase the likelihood that they are received by the intended
recipient (Rogers 2003). Only limited recordings have been made of ribbon seal
vocalizations. Watkins and Ray (1977) recorded ribbon seal high amplitude downward
sweeps and puffing sounds towards the end of the breeding season. The sounds are thought to
be produced by males, as only males were found to have well-developed air sacs, which may
aid in the production of loud underwater sounds (Stirling & Thomas 2003). However, to date
nothing is known on the role of vocal behaviour in ribbon seal mating behaviour. No study
has investigated the behaviour of Caspian and Baikal seals and no vocalizations have been
recorded.
Leopard seal male and females are widely dispersed at the start of the mating season as
females give birth, nurse and wean their pups alone on the pack-ice. Communication must
occur over long distances and both females and males have been found to produce loud
broadcast calls during the breeding season (Rogers et al. 1996; Rogers & Bryden 1997). Lone
males are known to vocalize for many hours each day, which may serve as an indicator of
male fitness as these displays require the male to be in good body condition (Rogers 2003;
2007). Females are thought to produce broadcast calls to advertise their sexual receptivity to
distant males (Rogers et al. 1996). The use of long-distance broadcast calls has also been
suggested to occur in bearded and Ross seals (Rogers et al. 1996). Little is known on Ross
seal mating behaviour as the species occurs in low densities in heavy pack-ice areas.
Vocalizations have only been recorded in December through January, which suggests that
these vocalizations are related to the mating season (Watkins & Ray 1985; Stacey et al. 2006;
Seibert 2007). Ross seal vocalizations have been described as ‘siren calls’ (Watkins & Ray
1985) and are loud and semi-continuous, which makes them suitable to communicate over
long distances (Rogers 2003).
Male bearded seals use loud trilling vocalizations which have been found to carry over
large distances to advertise their breeding condition to females (Cleator et al. 1989; Van
Parijs et al. 2003). Females are dispersed, but their movements are largely restricted to areas
with suitable haul-out ice (Burns 1981). During the breeding season, male bearded seals have
been found to vocalize in higher densities in areas where oestrus females are found regularly
(Van Parijs et al. 2001; 2003). In Svalbard, bearded seals males have been found to use
alternative mating tactics, where some males ‘roam’, displaying over large areas, whereas
others are territorial and display over smaller areas (Van Parijs et al. 2003). Territorial males
had longer trills than roaming males, which may be used by females as an indicator of male
quality (Van Parijs et al. 2003). In addition, male mating success was shown to be dependent
on variation in breeding habitat as increased ice cover was found to restrict the number of
roaming males, whereas territorial males were present during all ice conditions (Van Parijs et
al. 2004). In the light of current climatic trends, changes in ice-associated habitat may
therefore alter the long-term mating success of individual male bearded seals. Although
predictions on the potential effects of climate change on polar pinnipeds mainly concern
regional or seasonal shifts in prey availability and changes in timing and patterns of migration
(Tynan & DeMaster 1997; Friedlaender et al. 2007), small scale behavioural changes should
not be ignored as important indicators of change. Acoustic techniques are a useful tool to
study pinniped behaviour and may therefore also provide important insights in the potential
effects of climate change on polar pinnipeds.
92

Insights into the Acoustic Behaviour of Polar Pinnnipeds 145
POLAR PINNIPEDS AND ANTHROPOGENIC NOISE
Rapidly increasing anthropogenic noise levels in the ocean and the impact of this noise
on marine mammals have become a growing concern over the last years. With respect to
polar habitats, ice breaker vessels and shipping traffic form the predominant anthropogenic
noise sources to which ice-breeding pinnipeds are exposed. Recent computer projections of
the National Snow and Ice Data Center have indicated that the receding Arctic sea-ice will
leave more and more areas partially or largely ice-free year-round within the near future.
Consequently, this opens opportunities to re-route commercial vessel traffic to and from Asia
to take advantage of the open Northwest Passage. The increased shipping activity and the
year-round presence of vessels in these areas will lead to substantially increased noise levels.
These changes are likely to have consequences for polar pinnipeds that aggregate to mate and
give birth to pups in traditional areas within these regions. Evidence of the potential impact of
vessel sounds on pinniped behaviour and acoustic communication is generally meager
(Richardson et al. 1995). In harp seals, calling rates were found to decrease after vessels came
within 2km of the whelping area (Terhune et al. 1979). It was uncertain if calling rates
decreased because animals stopped vocalizing or because they left the area. Further study is
clearly needed and should include the acoustic monitoring of the areas of anticipated
increases in vessel activity and the acoustic behaviour of ice-breeding pinnipeds within these
regions.
In the next section we provide an overview of new and emerging passive acoustic
technologies that can be used to further the study of polar pinnipeds.
ACOUSTIC DATA COLLECTION
Acoustic techniques only recently entered the range of easily accessible research tools, as
significant advances in audio and computer technology now allow the acquisition and
handling of large acoustic data sets. As a consequence, acoustic techniques have become
increasingly important as a tool for remote sensing behaviour of various marine mammal
species (e.g. Stafford et al. 1998; McDonald & Fox 1999; Janik 2000; Johnson & Tyack
2003; Mellinger et al. 2007). Compared to visual observation, acoustic recordings are quasi-
omnidirectional and independent of light and weather conditions, providing the option of
detecting and studying animals at night and under conditions where visual observation are not
possible (see Erbe 2000 for a comparative discussion of acoustic and visual censuses). In
particular for species in offshore or remote polar areas, newly developed acoustic techniques
allow investigation of these animals in their natural habitat for extended time periods.
However, not all techniques are equally well suited for collecting data in polar areas, as ice
cover and harsh weather conditions can frequently limit deployment. In addition,
instrumentation features such as the possibility of recording over longer time spans, the need
for a vessel or on-site operators and access to real time data, determine which type of acoustic
instrumentation is most suitable for specific research purposes. A comprehensive review of
acoustic observation methods can be found in Mellinger et al. (2007). Here we provide a brief
overview of the types of passive acoustic techniques that are currently used to study marine
93

Ilse Van Opzeeland, LarsKindermann, Olaf Boebel et al. 146
mammals. However, given the scope of this review, devices and techniques will be discussed
in the light of their suitability for studying pinnipeds in polar environments.
ACOUSTIC INSTRUMENTATION
Ship-towed hydrophone arrays allowing coverage of relatively large areas, are in most
cases relatively cost-efficient and can be combined with visual surveys (e.g. Spikes & Clark
1996; Norris et al. 1999). Towed systems can be deployed in offshore or remote areas, but
often require dedicated ship time and personnel. The time-spans during which towed arrays
are deployed are therefore generally relatively short (i.e. hours to weeks). Successful use in
polar environments is largely dependent on ice conditions as heavy ice cover may limit access
by ships and may damage recording gear. The use of towed arrays in ice-covered areas has
nevertheless been shown to be feasible (e.g. Kindermann et al. 2006). Of greater concern are
the high noise levels generated by icebreaker vessels which are likely to mask the majority of
animal vocalizations, particularly in the mid (< 10kHz) to low (< 1kHz) frequency ranges.
However, if the array consists of 10 or more tightly spaced hydrophones, beamforming
techniques can be used to significantly improve signal-to-noise-ratios (e.g. Mellinger et al.
2007).
Acoustic tags (e.g. DTAG, Bioacoustic Probe) are miniature acoustic recorders that can
be attached to marine animals to collect data on the acoustic stimuli emitted and experienced
by the tagged subject (e.g. Johnson & Tyack 2003). Additionally, these devices are also
capable of sampling various environmental variables as well as physiological and behavioural
data (Fletcher et al. 1996; Madsen et al. 2002). The use of acoustic tags can provide
particularly useful information about an individual’s behaviour in relation to its vocalizations
and sounds from its environment. This technique is also used as a tool to determine correction
factors for marine mammal surveys such as the amount of time animals are vocalizing (e.g.
Erbe, 2000). However, when animals are in close groups it can be difficult to separate
whether the vocalization is produced by the tagged individual or one nearby. Furthermore,
acoustic tags can only sample data over periods of hours to days. In contrast to satellite
telemetry tags which transmit data back to a receiving station, acoustic tags need to be
retrieved before data can be analysed, which might be a difficulty if tags come off in areas
that are not easily accessed (i.e. ice covered regions). In addition, as is the case with all
tagging studies, the influence of both the tagging event and the presence of the tag on the
individual need to be ascertained before major conclusions are drawn from such data.
Autonomous recording devices consist of a hydrophone and a battery-powered data
recording system. These instruments are either free-drifting (surface recording units, e.g.
Hayes et al. 2000; Collison & Dosso 2003), moored on the sea floor or attached to deep-sea
moorings (e.g. Calupca et al. 2000; Newcomb et al. 2002, Wiggins 2003). Alternatively, these
devices can be ice-based with hydrophones deployed through holes in the ice (Klinck 2008).
Ice-based autonomous recording devices also offer the possibility for in-air recording of
vocalizing animals that are hauled out on the ice (e.g. Collins et al. 2005; 2006). These
devices are battery-powered and record and store acoustic data internally. Dependent on data
storage capacity of the device, recording bandwidth and sampling regime, recordings can be
obtained over extended periods of time, in some cases up to several years (e.g. Wiggins 2003;
94

Insights into the Acoustic Behaviour of Polar Pinnnipeds 147
Sirovic et al. 2003; Moore et al. 2006). In addition, by deploying several synchronized
devices in an array, large areas can be acoustically monitored and movements of animals
within these areas can be tracked. However, only archival data collection is possible and
consequently, data analysis can only occur after a certain period of time when devices have
been recovered. Autonomous recording devices have the advantage that they can be deployed
in a wide variety of areas, including polar environments (e.g. Wiggens 2003; Moore et al.
2006). Nevertheless, in ice-covered areas, deployment may be restricted to areas with greater
water depths (i.e. >250m in Antarctic regions) as in shallow waters, drifting icebergs often
cause damage to moored instruments.
An emerging passive acoustic technique involves the use of autonomous underwater vehicles and gliders, which originally were developed for oceanographic research (e.g.
Eriksen et al. 2001; Sherman et al. 2001). More recently these devices have been used for
various research purposes and have been successfully deployed in ice-covered areas (e.g.
Brierley et al. 2002; Owens 2006). Gliders move vertically and horizontally and can be
remotely controlled at regular time intervals through an intrinsic two-way communication
system, which also allows stored data to be transmitted back to the lab for immediate
analysis. However, the type of bi-directional satellite transmitters that are currently used in
gliders allow transmission of limited amounts of data only (see also the discussion on satellite
transmission below). Furthermore, gliders require significant resources to build and maintain.
In cases where they are deployed for acoustic recording purposes, devices need to be
recovered after weeks or months to retrieve data. With respect to polar areas, gliders could
nevertheless provide a tool for remotely controlled acoustic sampling of (periodically)
inaccessible areas. Bioacoustic research using these devices is nevertheless still limited
(Baumgartner et al. 2006; Fucile et al. 2006).
Free-drifting radio-linked sonobuoys enable short term real time acoustic monitoring as
they transmit acoustic recordings as a radio signal and are often deployed from vessels or
aircraft. In order to transmit recordings in good quality, radio signals require a receiver to be
in relative proximity of the recording device, which makes these systems suitable for use
during ship-based surveys where visual and acoustic observations are combined (e.g. Clark et
al. 1994; Rankin et al. 2005). Some drifting radio-linked sonobuoy types also allow
localization by giving a compass bearing to the sound source (DIFAR buoys, e.g. Greene et
al. 2004). The duration of the period over which these devices transmit acoustic recordings
and the cost of devices strongly depends on the type that is used. With respect to polar areas,
successful use of these devices will largely depend on ice coverage as shifting ice may cause
damage or block transmission of the radio signal. In heavy ice-covered areas, radio-linked
sonobuoys can be fixed on the ice surface while the hydrophone is deployed through a
borehole or crack in the ice (e.g. Clark et al. 1996).
Cabled passive acoustic recording stations can be operated continuously in offshore
areas without limitations on data storage capacity and power supply. In addition, cabled
recording stations allow near-real time monitoring which enables the linking of acoustic
recordings to visual observations. However, the majority of cabled arrays in offshore areas
require significant resources and are predominately operated by government institutions. An
example of such a station is the US Navy sound surveillance system (SOSUS array), which
consists of a network of hydrophones covering the deep offshore waters throughout the
Atlantic and Pacific oceans. Due to the military purposes of these systems, access to the
acoustic data is often restricted, only off-line available and the recording bandwidth of these
95

Ilse Van Opzeeland, LarsKindermann, Olaf Boebel et al. 148
systems is often limited to lower frequencies. These systems have nevertheless been used
successfully to study baleen whales and other species calling at low frequencies (e.g. Clark
1995; Clark & Charif 1998; Moore et al. 1998; Stafford et al 1998; 1999).
In recent years, however, a growing number of non-military cabled acoustic observatories
are operated in coastal areas (e.g. ALOHA, Petitt et al. 2002; NEPTUNE, Barnes et al. 2007;
AUTEC). These systems record continuously over broad frequency bandwidths, allow real
time monitoring and localization of marine mammals and have no restrictions to data storage,
data access and power supply. These characteristics would make cabled systems ideal if they
could be used for data acquisition in remote polar environments. However, monitoring of
polar regions with a network of hydrophones connected by cables to shore-based stations
requires extreme cable length which would imply extensive deployment and maintenance
costs. In addition, ice movements and cable melt-in can cause damage to long cables in polar
environments. The use of cables can nevertheless be overcome by satellite or iridium phone
mediated transfer of acoustic data directly from recordings units to receiver stations where
data are analysed. As mentioned previously, the type of transmitter systems that are suitable
to be integrated in recording units limit satellite data transmission rates, rendering them too
low to allow continuous broadband acoustic data to be transmitted. This can be surmounted
by only transmitting acoustic snippets or events (e.g. click detectors, TPODs; e.g. Tregenza
1999), which requires pre-processing of the signal within the buoy to detect and select events
that are transmitted.
Transmission of continuous broadband acoustic data instead of snippets is possible if data
transmission is mediated by a station with enlarged satellite receivers. Acoustic data from the
recording unit can be transmitted to the satellite-linked station using a radio signal or a
wireless local area network (WLAN) link, provided that the area is relatively flat and the
satellite-linked station and the recording unit are not too far apart. The satellite-linked station
can then be used to transmit acoustic data to receiver stations over large distances (an
example of such a system will be discussed in the next section). Real time data transmission
of autonomous recording units has the additional advantage that data does not necessarily
have to be stored locally and that analyses can be performed near-real time (e.g. Simard et al.
2006).
In addition to data transfer, cables also serve to secure the continuous power supply of
cabled systems. A system with satellite- and radio-linked data transmission is devoid of this
option and therefore either dependent on batteries that need regular exchange or requires
autonomous power supply. With respect to polar areas, autonomous power supply secures
continuous powering of the station also when the area is periodically inaccessible.
PALAOA The PerenniAL Acoustic Observatory in the Antarctic Ocean (PALAOA) is an example
of a stationary autonomous listening station that records sound continuously year-round and
provides online access to the real time data (see http://www.awi.de/acoustics). The PALAOA
observatory is located at 70°31’S 8°13’W, on the Ekström Ice Shelf, Eastern Weddell Sea, at
1 km distance from the ice shelf edge (Figure 1). The main sensor was designed as a 520m
baseline tetrahedral hydrophone array deployed through boreholes underneath the 100m thick
96

Insights into the Acoustic Behaviour of Polar Pinnnipeds 149
floating Antarctic ice shelf (Boebel et al. 2006; Klinck 2008b)1. It is energetically self-
sustained by utilizing solar and wind energy. A CTD probe is mounted to collect
oceanographic readings while sea ice conditions of the adjacent ocean are monitored with a
webcam. A 13km WLAN link connects the station to the German Antarctic Neumayer Base,
which is manned year-round and has a leased satellite internet connection. Development
efforts focused on the one hand on the real time transmission of a highly compressed live
stream (24kbit/ogg-vorbis-coded) via a satellite link to the Alfred Wegener Institute for Polar
and Marine Research (AWI) in Bremerhaven, Germany for immediate processing. On the
other hand, acoustic data of very high quality (up to 4 channels, 192 kHz/24Bit
uncompressed) is buffered on request at PALAOA and Neumayer Base respectively and can
be downloaded for detailed analysis. PALAOA has been operational since December 2005
and has collected a total of 10000 hours audio so far (by January 2008). Recordings contain
vocalizations of four Antarctic pinniped species (crabeater, Weddell, Ross and leopard seals)
and a variety of cetacean vocalizations. In addition, the recordings contain sounds of abiotic
origin, such as iceberg calvings and collisions. Current analyses aim to explore temporal and
spatial distribution patterns of vocalizing individuals of the different species. Additionally,
the PALAOA recordings are used to gauge the local ocean noise budget and monitor the
impact of human activities on marine mammal behaviour. PALAOA provides an example of
a state-of-the art system which allows data to be obtained for long term monitoring of
acoustic underwater sounds in the Antarctic which has never been attempted previously.
SOFTWARE T ECHNOLOGIES
As the data storage capacity of acoustic recording instruments has increased substantially
over the last years, recordings can be made over longer time spans. In many cases these long
term acoustic datasets require the use of automated detection and classification techniques, as
manual detection and analysis becomes too time-consuming. A wide variety of software
technologies are available to perform automated detection and classification (e.g. open
source: Mellinger 2001; Figueroa 2006) and a number of different detection methods have
been developed (e.g. see Mellinger et al. 2007 for a summary of methods). However, not all
techniques are equally well fitted for different species, research goals and recording types.
Species-specific vocal characteristics are one factor to consider when deciding for a specific
software tool for analyses. Techniques involving matched filters or spectrogram correlation
are most suitable to investigate species with stereotyped vocalizations, whereas more variable
vocal patterns (e.g. dolphin whistles) are best detected using energy summation in specified
frequency bands (e.g. Oswald et al. 2004). Also, the rarity of a species’ vocalizations may
determine the optimal configuration of the detector to achieve a trade-off between missed
calls (false negatives) and incorrect detections (false positives). In species that are not very
vocal or occur infrequently, the importance of detecting as many target vocalizations as
possible may overcome the effort of an additional check of the detector’s output (either
manually or by using subsequent automated classifiers). Similarly, the purpose of the
detection will also determine which is the optimal detector type and sensitivity (see Mellinger
et al. 2007 for a discussion). A final factor to consider is the type of recordings. As has been
1 Since mid 2006 the failure of two hydrophones has reduced the array to a two-channel system
97

Ilse Van Opzeeland, LarsKindermann, Olaf Boebel et al. 150
mentioned earlier, multi-channel recordings can significantly improve signal-to-noise-ratios
through beamforming and allow source localisation
Within marine mammal acoustic research, automated detection has to date almost
exclusively been used to scan large data volumes for cetacean vocalizations (e.g. Stafford
1995; Mellinger & Clark 2000; Gillespie 2004; Lopatka et al. 2005; 2006). This likely
reflects the fact that long term acoustic observations are much more embedded within
cetacean research as compared to studies of pinniped behaviour. However, many of the basic
research questions that still need to be addressed for a number of polar pinniped species
require acoustic observation over longer time spans and consequently the use of automated
detection techniques. Klinck et al. (2008; in press) recently applied various automated
detection techniques to long term recordings of pinniped vocalizations and found, for
example, that Hidden Markov Models, which are also used for human speech recognition
(e.g. Juang & Rabiner 1991) perform well for leopard seal vocalizations. Nevertheless, as
mentioned earlier, species-specific vocal behaviour and research goals will ultimately
determine the suitability of an automated detection technique.
Figure 1. IKONOS-2 satellite image from March 2004, with locations of the Neumayer Base and
PALAOA. Top inset: Antarctica with the location of PALAOA indicated by a red dot. Bottom inset:
PALAOA Station.
98

Insights into the Acoustic Behaviour of Polar Pinnnipeds 151
CONCLUSIONS AND FUTURE RESEARCH DIRECTIONS
Little is known about the acoustics of most ice-breeding pinnipeds. Clearly, the
inaccessible nature of their habitat plays an important role in explaining this short coming and
has greatly influenced the extent to which these species have been studied. To date mother-
pup vocal recognition has not been experimentally tested in any of the ice-breeding species,
except for the walrus. Attempting to address these short comings would significantly increase
our understanding of ice breeding species requirements in terms of offspring recognition.
Investigations of vocal individuality of mother and pup calls show markedly different patterns
for each species, which likely reflects the complexity of interactions that shape their vocal
behaviour.
With respect to mating strategies, there is a distinction between the species that have been
investigated in some detail, such as the bearded, Weddell seal and the walrus and those about
which we known very little. Future investigations of well known species’ mating systems
require more small scale research focussing on individual differences and plasticity in male
mating tactics. Additionally, the role of females and female choice also needs to be taken into
account. For little known species an attempt at understanding the broader scale role of
underwater vocalisations should be the initial focus. Recent changes in acoustic
instrumentation technologies and their availability in terms of reduced costs should greatly
facilitate the study of little known polar species. Although reseachers have primarily used
novel acoustic instrumentation and software technologies for studying cetaceans, the majority
of these devices and techniques provide vast opportunities for the study of polar pinnipeds.
It is critical to improve our understanding of both recognition processes and reproductive
strategies of polar pinnipeds given current trends in climate driven changes which are altering
their ice-dominated environments at hereto unprecedented rates. Ice-associated seals, which
rely on suitable ice substrate for e.g. resting, pupping and moulting, are particularly
vulnerable to climatic change. Similarly, changing conditions in the ocean basin such as
increasing background noise, in terms of anthropogenic sounds, are becoming of heightened
concern for polar environments. Among other techniques, acoustic techniques should be
recognized as an extremely versatile and useful technology for future studies of pinniped
ecology.
ACKNOWLEDGEMENTS We thank Holger Klinck and Robert Huisman for providing constructive comments on
this manuscript.
REFERENCES
Anderson, S. S. & Harwood, J. 1985. Time budgets and topography: how energy reserves and
terrain determine the breeding behaviour of grey seals. Animal Behaviour, 33, 1343-
1348.
99

Ilse Van Opzeeland, LarsKindermann, Olaf Boebel et al. 152
Asselin, S., Hammill, M. O. & Barrette, C. 1993. Underwater vocalizations of ice-breeding
grey seals. Canadian Journal of Zoology, 71, 2211-2219.
AUTEC. The Atlantic Undersea Test and Evaluation Centre. Retrieved (2008, January) from
http://www.npt.nuwc.navy.mil/autec/home.htm.
Ballard, K. A. & Kovacs, K. M. 1995. The acoustic repertoire of hooded seals (Cystophora cristata). Canadian Journal of Zoology, 73, 1362-1374.
Barnes, C. R., Best, M. M. R., Bornhold, B. D., Juniper, S. K., Pirenne, B. & Phibbs, P. 2007.
The NEPTUNE Project - a cabled ocean observatory in the NE Pacific: Overview,
challenges and scientific objectives for the installation and operation of Stage I in
Canadian Waters. Symposium on Underwater Technology and Workshop on Scientific Use of Submarine Cables and Related Technologies. Tokyo, Japan: IEEE Press,
Piscataway, NJ.
Bartsh, S. S., Johnston, S. D. & Siniff, D. B. 1992. Territorial behaviour and breeding
frequency of male Weddell seals (Leptonychotes weddelli) in relation to age, size and
concentrations of serum testosterone and cortisol. Canadian Journal of Fisheries and Aquatic Sciences, 70, 680-692.
Batholomew, G. A. 1970. A model for the evolution of pinniped polygyny. Evolution, 24,
546-559.
Baumgarner, M. F., Fratantoni, D. M. & Clark, C. W. 2006. Investigating baleen whale
ecology with simultaneous oceanographic and acoustic observations from autonomous
underwater vehicles. Eos Transactions, American Geophysical Union, 87(36), Ocean
Sciences Meeting Supplement. Honolulu, Hawaii. February 20-24, 2006. Abstract
OS24E-05.
Boebel, O., Kindermann, L., Klinck, H., Bornemann, H., Ploetz, J., Steinhage, D., Riedel, S.
& Burkhardt, E. 2006. Real-time underwater sounds from the Southern Ocean. Eos Transactions, American Geophysical Union, 87, 361-362.
Boness, D. J., Bowen, W. D. & Oftedal, O. T. 1988. Evidence of polygyny from spatial
patterns in hooded seals (Cystophora cristata). Canadian Journal of Zoology, 66, 703-
706.
Brierley, A. S., Fernandes, P. G., Brandon, M. A., Armstrong, F., Millard, N. W., McPhail, S.
D., Stevenson, P., Pebody, P., Perrett, J. R., Squires, M., Bone, D. G. & Griffiths, G.
2002. Antarctic krill under sea ice: elevated abundance in a narrow band just south of ice
edge. Science, 295, 1890-1892.
Burns, J. J. 1981. Bearded seal, Erignathus barbatus (Erxleben 1777). In: Handbook of Marine Mammals (Ed. by Harrison, S. H. R. R. J.), pp. 145-170. London: Academic
Press.
Calambokidis, J., Taylor, B. L., Carter, S. D., Steiger, G. H., Dawson, P. K. & Antrim, L. D.
1987. Distribution and haul-out behaviour of harbour seals in Glacier Bay, Alaska.
Canadian Journal of Zoology, 65, 1391-1396.
Calupca, T. A., Fristrup, K. M. & Clark, C. W. 2000. A compact digital recording system for
autonomous bioacoustic monitoring. The Journal of the Acoustical Society of America,
37, 13-22.
Charrier, I., Mathevon, N. & Jouventin, P. 2002. How does a fur seal mother recognize the
voice of her pup? An experimental study of Arctocephalus tropicalis. Journal of Experimental Biology, 205, 613-622.
100

Insights into the Acoustic Behaviour of Polar Pinnnipeds 153
Clark, C. W. & Charif, R. A. 1998. Acoustic monitoring of large whales to the west of Britain
and Ireland using bottom mounted hydrophone arrays, October 1996-September 1997.
Joint Nature Conservancy Report No. 281.
Clark, C. W. 1995. Application of U.S. Navy underwater hydrophone arrays for scientific
research on whales. Scientific Report, International Whaling Commission, 44, 210-213.
Clark, C. W., Charif, R., Mitchell, S. & Colby, J. 1996. Distribution and behaviour of
bowhead bhale, Balaena myticetus, based on analysis of acoustic data collected during
the 1993 spring migration off Point Barrow, Alaska. Report of the International Whaling Commission, 46, 541-552.
Clark, D. S., Flattery, J., Gisiner, R., Griffith, L., Schilling, J., Sledzinski, T. & Trueblood, R.
1994. Acoustic localization of whales in real time over large areas. The Journal of the Acoustical Society of America, 96, 3250.
Cleator, H., Stirling, I. & Smith, T. G. 1989. Underwater vocalizations of the bearded seal
(Erignathus barbatus). Canadian Journal of Zoology, 67, 1900-1910.
Collins, K. T., Rogers, T. L., Terhune, J. M., McGreevy, P. D., Wheatley, K. E. & Harcourt,
R. G. 2005. Individual variation f in-air female 'pup contact' calls in Weddell seals,
Leptonychotes weddellii. Behaviour, 142, 167-189.
Collins, K. T., Terhune, J. M., Rogers, T. L., Wheatley, K. E. & Harcourt, R. G. 2006. Vocal
individuality of in-air Weddell seal (Leptonychotes weddellii) pup 'primary' calls. Marine Mammal Science, 22, 933-951.
Collison, N. E. & Dosso, S. E. 2003. Acoustic tracking of a freely-drifting sonobuoy field:
experimental results. IEEE Journal of Oceanic Engineering, 28, 554-561.
Comiso, J. C. & Gordon, A. L. 1987. Recurring polynyas over the Cosmonaut Sea and the
Maud Rise. Journal of Geophysical Research, 92, 2819-2833.
Costa, D. P. 1993. The relationship between reproductive and foraging energetics and the
evolution of the Pinnipedia. Symposium of the Zoological Society of London, 66, 293-
314.
Dayton, P. K., Morbida, B. J. & Bacon, F. 1994. Polar marine communities. American Zoologist, 34, 90-99.
Erbe, C. 2000. Census of marine mammals. SCOR Whaling Group 118: New Technologies
for observing marine life. November 9 - 11, 2000, Sidney, BC.
Eriksen, C. C., Osse, T. J., Light, R. D., Wen, T., Lehman, T. W., Sabin, P. L., Ballard, J. W.
& Chiodi, A. M. 2001. Seaglider: a long-range autonomous underwater vehicle for
oceanographic research. IEEE Journal of Oceanic Engineering, 26, 424-436.
Fay, F. H., Ray, G. C. & Kibal'chich, A. A. 1984. Time and location of mating and associated
behavior of the Pacific walrus, Odobenus rosmarus divergens Illiger. NOAA Technical Report NMFS, 12, 89-99.
Figueroa, H. 2006. XBAT: Extensible Bioacoustic Tool. Retrieved (2008, January) from
http://xbat.org.
Fletcher, S., Le Boeuf, B. J., Costa, D. P., Tyack, P. L. & Blackwell, S. B. 1996. Onboard
acoustic recording from diving northern elephant seals. The Journal of the Acoustical Society of America, 100, 2531-2539.
Friedlaender, A. S., Johnston, D. W., Fink, S. L. & Lavigne, D. M. 2007. Variation in ice
cover on the east coast of Canada, February-March, 1969-2006: implications for harp and
hooded seals. International Fund for Animal Welfare Technical Report.
101

Ilse Van Opzeeland, LarsKindermann, Olaf Boebel et al. 154
Fucile, P. D., Singer, R. C., Baumgartner, M. F. & K., B. 2006. A self contained recorder for
acoustic observations from AUV's. MTS/IEEE Oceans '06. Boston, MA.
Gillespie, D. 2004. Detection and classification of right whale calls using an edge detector
operating on a smoothed spectrogram. Canadian Acoustics, 32, 39-47.
Gisiner, R. & Schusterman, R. J. 1991. California sea lion pups play an active role in
reunions with their mothers. Animal Behaviour, 41, 364-366.
Green, K. & Burton, H. R. 1988. Annual and diurnal dariations in the underwater
vocalizations of Weddell seals. Polar Biology, 8, 161-164.
Greene, C. R., Jr, McLennan, M. W., Norman, R. G., McDonald, T. L., Jakubczak, R. S. &
Richardson, W. J. 2004. Directional frequency and recording (DIFAR) sensors in
seafloor recorders to locate calling bowhead whales during their fall migration. The Journal of the Acoustical Society of America, 116, 799-813.
Haller, M. A., Kovacs, K. M. & Hammill, M. O. 1996. Maternal behaviour and energy
investment by grey seals breeding on land-fast ice. Canadian Journal of Zoology, 74,
1531-1541.
Hammill, M. O., Kovacs, K. M. & Lydersen, C. 1994. Local movements by nursing bearded
seal (Erignathus barbatus) pups in Kongsfjorden, Svalbard. Polar Biology, 14, 569-570.
Hammill, M. O., Lydersen, C., Ryg, M. & Smith, T. G. 1991. Lactation in the ringed seal
(Phoca hispida). Canadian Journal of Fisheries and Aquatic Sciences, 48, 2471-2476.
Hanggi, E. B. & Schusterman, R. J. 1994. Underwater acoustic displays and individual
variation in male harbour seals, Phoca vitulina. Animal Behaviour, 48, 1275-1283.
Harcourt, R. G., Kingston, J. J., Cameron, M. F., Waas, J. R. & Hindell, M. A. 2007.
Paternity analysis shows experience, not age, enhances mating success in an aquatically
mating pinniped the Weddell seal (Leptonychotes weddellii). Behavioural Ecology and Sociobiology, 61, 643-652.
Harcourt, R. G., Kingston, J. J., Waas, J. R. & Hindell, M. A. in press. Foraging while
breeding: alternative mating strategies by male Weddell seals? Aquatic Conservation: Marine and Freshwater Ecosystems.
Hayes, S. A., Kumar, A., Costa, D. P., Mellinger, D. K., Harvey, J. T., Southall, B. L. & Le
Boeuf, B. J. 2004. Evaluating the function of the male harbour seal roar through playback
experiments. Animal Behaviour, 67, 1133-1139.
Hayes, S. A., Mellinger, D. K., Croll, D. A., Costa, D. P. & Borsani, J. F. 2000. An
inexpensive passive acoustic system for recording and localizing wild animal sounds. The Journal of the Acoustical Society of America, 107, 3552-3555.
Hindell, M. A., Harcourt, R. G., Waas, J. R. & Thompson, D. 2002. Fine-scale three-
dimensional spatial use by diving, lactationg female Weddell seals, Leptonychotes weddellii. Marine Ecology Progress Series, 242, 275-284.
Insley, S. J. 1992. Mother-offspring separation and acoustic stereotypy: a comparison of call
morphology in two species of pinnipeds. Behaviour, 120, 103-122.
Insley, S. J. 2001. Mother-offspring vocal recognition in northern fur seals is mutual but
asymetrical. Animal Behaviour, 61, 129-137.
Insley, S. J., Phillips, A. V. & Charrier, I. 2003. A review of social recognition in pinnipeds.
Aquatic Mammals, 29, 181-201.
Janik, V. M. 2000. Food-related bray calls in wild bottlenose dolphins (Tursiops truncatus). Proceedings of the Royal Society London: Biological Sciences, 267, 923-927.
102

Insights into the Acoustic Behaviour of Polar Pinnnipeds 155
Job, D. A., Boness, D. J. & Francis, J. M. 1995. Individual variation in nursing vocalizations
of Hawaiian monk seal pups, Monachus schauinsulandi (Phocidae, Pinnipedia) and lack
of maternal recognition. Canadian Journal of Zoology, 73, 975-983.
Johnson, M. P. & Tyack, P. L. 2003. A digital acoustic recording tag for measuring the
response of wild marine mammals to sound. IEEE Journal of Oceanic Engineering, 28,
3-12.
Juang, B. H. & Rabiner, L. R. 1991. Hidden Markov Models for speech recognition.
Technometrics, 33, 251-272.
Kastelein, R. A. 2002. Walrus. In: Encyclopedia of Marine Mammals (Ed. by Perrin, W.
F., Wursig, B. & Thewissen, J. G. M.), pp. 1294-1300. London: Academic Press.
Kastelein, R. A., Postma, J. & Verboom, W. C. 1995. Airborne vocalizations of Pacific
walrus pups (Odobenus rosmarus divergens). In: Sensory systems of Aquatic Mammals
(Ed. by Kastelein, R. A., Thomas, J. A. & Nachtigall, P. E.), pp. 265-285. Woerden, The
Netherlands: De Spil Publishers.
Kaufman, G. W., Siniff, D. B. & Reichle, R. 1975. Colony behaviour of Weddell seals,
Leptonychotes weddellii, at Hutton Cliffs, Antarctica. Rapports et Proces-Verbaux des Reunions, Conseil International pour L'Exploration scientifique de la Mer, 169, 228-246.
Kelly, B. P. & Wartzok, D. 1996. Ringed seal diving behavior in the breeding season.
Canadian Journal of Zoology, 74, 1547-1555.
Kibal'chich, A. A. & Lisitsina, T. Y. 1979. Some acoustical signals of calves of the Pacific
walrus (in Russian). Zoologicheskii zhurnal, 58, 1247-1249.
Kindermann, L., Klinck, H. & Boebel, O. 2006. Automated detection of marine mammals in
the vicinity of RV Polarstern. Berichte zur Polar- und Meeresforschung, 533, 68-76.
Klinck, H. 2008. Automated detection, localization and identification of leopard seals. Phd
thesis. University of Trier, Germany.
Klinck, H., Kindermann, L. & Boebel, O. in press. Detection of leopard seal (Hydrurga
leptonyx) vocalizations using the Envelope Spectrogram technique (tEST) in
combination with a Hidden Markov Model. Canadian Acoustics. Kooyman, G. L. 1981. Weddell seal: Consummate diver. New York: Cambridge University
Press.
Kovacs, K. M. 1987. Maternal behaviour and early ontogeny of harp seals, Phoca groenlandica. Animal Behaviour, 35, 844-855.
Kovacs, K. M. 1990. Mating strategies in male hooded seals (Cystophore cristata). Canadian Journal of Fisheries and Aquatic Sciences, 68, 2499-2502.
Kovacs, K. M. 1995. Mother-pup reunions in harp seals, Phoca groenlandica: cues for the
relocation of pups. Canadian Journal of Zoology, 73, 843-849.
Krafft, B. A., Lydersen, C., Kovacs, K. M., Gjertz, I. & Haug, T. 2000. Diving behaviour of
lactating bearded seals (Erignathus barbatus) in the Svalbard area. Canadian Journal of Zoology, 78, 1408-1418.
Kunnasranta, W., Hyvarinen, H. & Sorjonen, J. 1996. Underwater vocalizations of Ladoga
ringed seals (Phoca hispida Ladogensis Nordq) in summertime. Marine Mammal Science, 12, 611-618.
Laws, R. M. 1981. Biology of Antarctic seals. Science Progress, 67, 377-397.
Laws, R. M. 1984. Seals. In: Antarctic Ecology (Ed. by Laws, R. M.), pp. 621-715. London:
Academic Press.
Le Boeuf, B. J. 1986. Sexual strategies of seals and walruses. New Scientist, 1491, 36-39.
103

Ilse Van Opzeeland, LarsKindermann, Olaf Boebel et al. 156
Lopatka, M., Adam, O., Laplanche, C., Zarzycki, J. & Motsch, J. F. 2005. An attractive
alternative for sperm whale click detection using the wavelet transform in comparison to
the Fourier spectrogram. Aquatic Mammals, 31, 463-467.
Lopatka, M., Adam, O., Laplanche, C., Motsch, J.-F. & Zarzycki, J. 2006. Sperm whale
click analysis using a recursive time-variant lattice filter. Applied Acoustics, 67, 1118.
Lydersen, C. & Hammill, M. O. 1993. Activity, milk intake and energy consumption in free-
living ringed seal (Phoca hispida) pups. Journal of Comparative Physiology B, 163, 433-
438.
Lydersen, C. & Kovacs, K. M. 1993. Diving behaviour of lactating harp seal, Phoca groenlandica, females from the Gulf of St Lawrence, Canada. Animal Behaviour, 46,
1213-1221.
Lydersen, C. & Kovacs, K. M. 1999. Behaviour and energetics of ice-breeding, North
Atlantic phocid seals during the lactation period. Marine Ecology Progress Series, 187,
265-281.
Madsen, P. T., Payne, R., Kristiansen, N. U., Wahlberg, M., Kerr, I. & Mohl, B. 2002. Sperm
whale sound production studied with ultrasound time/depth-recording tags. Journal of Experimental Biology, 205, 1899-1906.
Mathews, E. A. & Kelly, B. P. 1996. Extreme temporal variation in harbor seal (Phoca vitulina Richardsi) numbers in Glacier Bay, a glacial fjord in Southeast Alaska. Marine Mammal Science, 12, 483-489.
McCulloch, S. & Boness, D. J. 2000. Mother-pup vocal recognition in the grey seal
(Halichoerus grypus) of Sable Island, Nova Scotia, Canada. Journal of Zoology London, 251, 449-455.
McCulloch, S., Pomeroy, P. P. & Slater, P. J. B. 1999. Individually distinctive pup
vocalizations fail to prevent allo-suckling in grey seals. Canadian Journal of Zoology, 77,
716-723.
McDonald, M. A. & Fox, C. G. 1999. Passive acoustic methods applied to fin whale
population density estimation. The Journal of the Acoustical Society of America, 105,
2643-2651.
Mellinger, D. K. 2001. Ishmael 1.0 User's guide. NOAA Technical Memorandum OAR
PMEL-120, available from NOA/PMEL/OERD, 2115 SE OSU Drive, Newport, OR
97365-5258.
Mellinger, D. K. & Clark, C. W. 2000. Recognizing transient low-frequency whale sounds by
spectrogram correlation. The Journal of the Acoustical Society of America, 107, 3518-
3529.
Mellinger, D. K., Stafford, K. M., Moore, S. E., Dziak, R. P. & Matsumoto, H. 2007. An
overview of fixed passive acoustic observation methods for cetaceans. Oceanography, 20, 36-45.
Merdsøy, B. R., Curtsinger, W. R. & Renouf, D. 1978. Preliminary underwater observations
of the breeding behavior of the harp seal (Pagophilus groenlandicus). Journal of Mammology, 59, 181-185.
Miller, E. H. & Boness, D. J. 1983. Summer behavior of Atlantic walruses, Odobenus rosmarus rosmarus (L.), at Coats Island, N.W.T. (Canada). Zeitschrift fuer Saeugetierkunde, 48, 298-313.
Miller, E. H. & Murray, A. V. 1995. Structure, complexity and organization of vocalizations
in harp seal (Phoca groenlandica) pups. In: Sensory systems of Aquatic Mammals (Ed. by
104

Insights into the Acoustic Behaviour of Polar Pinnnipeds 157
Kastelein, R. A., Thomas, J. A. & Nachtigall, P. E.), pp. 237-264. Woerden, The
Netherlands: De Spil Publishers,
Miller, E. H. 1985. Airborne acoustic communication in Walrus, Odobenus rosmarus.
National Geographic Research, 1, 124-145.
Møhl, B., Terhune, J. M. & Ronald, K. 1975. Underwater calls of the harp seal, Pagophilus groenlandicus. Rapports et Proces-Verbaux des Reunions, Conseil International pour L'Exploration scientifique de la Mer, 169, 533-543.
Moore, S. E., Stafford, K. M., Dalheim, M. E., Fox, C. G., Braham, H. W., Polovina, J. J. &
Bain, D. E. 1998. Seasonal variation in fin whale call reception at five SOSUS sites in the
North Pacific. Marine Mammal Science, 14, 617-626.
Moore, S. E., Stafford, K. M., Mellinger, D. K. & Hildebrand, J. A. 2006. Listening for large
whales in the offshore waters of Alaska. Bioscience, 56, 49-55.
Newcomb, J., Fisher, R., Field, R., Turgut, A., Ioup, G., Rayborn, G., Kuczaj, S., Caruthers,
J., Goodman, R. & Sidorovskaia, N. 2002. Near-bottom hydrophone measurements of
ambient noise and sperm whale vocalizations in the northern Gulf of Mexico. The Journal of the Acoustical Society of America, 111, 2371.
Norris, T. F., McDonald, M. A. & Barlow, J. 1999. Acoustic detections of singing humpback
whales (Megaptera novaeangliae) in the east North Pacific during their northbound
migration. The Journal of the Acoustical Society of America, 106, 506-514.
Oetelaar, M. L., Terhune, J. M. & Burton, H. R. 2003. Can the sex of a Weddell seal
(Leptonychotes weddellii) be identified by its surface call? Aquatic Mammals, 29, 261-
267.
Oswald, J. N., Rankin, S. & Barlow, J. 2004. The effect of recording and analysis bandwidth
on acoustic identification of delphinid species. Journal of the Acoustical Society of America, 116, 3178-3185.
Owens, W. B. 2006. Development and field testing of autonomous profiling floats across the
Arctic ocean. Eos Transactions, American Geophysical Union, 87(36), Ocean Sciences
Meeting Supplement. Honolulu, Hawaii. February 20-24, 2006. Abstract OS25N-12.
Perry, E. A. & Renouf, D. 1988. Further studies of the role of harbour seal (Phoca vitulina) pup vocalizations in preventing separation of mother-pup pairs. Canadian Journal of Zoology, 66, 934-938.
Perry, E. A. & Terhune, J. M. 1999. Variation of harp seal underwater vocalizations among
three breeding locations. Journal of Zoology London, 249, 181-186.
Pettit, R., Harris, D., Wooding, B., Bailey, J., Jolly, J., Hobart, E., Chave, A., Duennebier, F.,
Butler, R., Bowen, A. & Yoerger, D. 2002. The Hawaii-2 Observatory. IEEE Journal of Oceanic Engineering, 27, 245-253.
Phillips, A. V. & Stirling, I. 2000. Vocal individuality in mother and pup South American fur
seals, Arctocephalus australis. Marine Mammal Science, 16, 592-616.
Pierotti, R. & Pierotti, D. 1980. Effects of cold climate on the evolution of pinniped breeding
systems. Evolution, 34, 494-507.
Rankin, S., Ljungblad, D., Clark, C. & Kato, H. 2005. Vocalisations of Antarctic blue whales,
Balaenoptera musculus intermedia, recorded during the 2001/2002 and 2002/2003
IWC/SOWER circumpolar cruises, Area V, Antarctica. Journal of Cetacean Research and Management, 7, 13-20.
Renouf, D. 1984. The vocalization of the harbour seal pup and its role in the maintenance of
contact with the mother. Journal of Zoology London, 202, 583-590.
105
Ilse Van Opzeeland, LarsKindermann, Olaf Boebel et al. 158
Richardson, W. J., Greene, C. R., Jr, Malme, C. I. & Thomson, D. H. 1995. Marine mammals
and noise. London: Academic Press.
Riedman, M. 1990. The pinnipeds. Seals, sea lions and walruses. Oxford: University of
California Press.
Rogers, T. L. & Bryden, M. M. 1997. Density and haul-out behavior of leopard seals
(Hydrurga leptonyx) in Prydz Bay, Antarctica. Marine Mammal Science, 13, 293-302.
Rogers, T. L. 2003. Factors influencing the acoustic behaviour of male phocid seals. Aquatic Mammals, 29, 247-260.
Rogers, T. L. 2007. Age-related differences in the acoustic characteristics of male leopard
seals, Hydrurga leptonyx. The Journal of the Acoustical Society of America, 122, 596-
605.
Rogers, T. L., Cato, D. H. & Bryden, M. M. 1996. Behavioral significance of underwater
vocalizations of captive leopard seals, Hydrurga letonyx. Marine Mammal Science, 12,
414-427.
Rouget, P. A., Terhune, J. M. & Burton, H. R. 2007. Weddell seal underwater calling rates
during the winter and spring near Mawson station, Antarctica. Marine Mammal Science,
23, 508-523.
Sato, K., Mitani, Y., Kusagaya, H. & Naito, Y. 2003. Synchronous shallow dives by Weddell
seal mother-pup pairs during lactation. Marine Mammal Science, 19, 384-395.
Schusterman, R. J. 1970. Vocal displays underwater by the grey seal, harbour seal and the
Steller seal lion. Psychonomic Science, 18, 303-305.
Seibert, A. 2007. The Ross seal and its underwater vocalizations. MSc thesis. University of
Munich, Germany.
Sergeant, D. E. 1974. A rediscovered whelping population of hooded seals, Cystophora cristata, and its possible relationship to other populations. Polarforschung, 44, 1-7.
Serrano, A. & Miller, E. H. 2000. How vocal are harp seals (Pagophilus groenlandicus)? A
captive study of seasonal and diel patterns. Aquatic Mammals, 26, 253-259.
Serrano, A. 2001. New underwater and aerial vocalizations of captive harp seals (Pagophilus groenlandicus). Canadian Journal of Fisheries and Aquatic Sciences, 79, 75-81.
Sherman, J., Davis, R. E., Owens, W. B. & Valdes, J. 2001. The autonomous underwater
glider 'Spray'. IEEE Journal of Oceanic Engineering, 26, 437-446.
Simard, Y., Park, C., Bahoura, M., Rouat, J., Sirois, M., Mouy, X., Seebaruth, D., Roy, N. &
Lepage, R. 2006. Development and experimentation of a satellite buoy network for real-
time acoustic localisation of whales in the St Lawrence MTS/IEEE Oceans '06. Boston,
MA.
Siniff, D. B., Stirling, I., Bengston, J. L. & Reichle, R. A. 1979. Social and reproductive
behavior of crabeater seals during the austral spring. Canadian Journal of Zoology, 57,
2243-2255.
Sirovic, A., Hildebrand, J. A., Wiggins, S. M., Moore, S. E., McDonald, M. A. & Thiele, D.
2003. Seasonality of blue and fin whale calls west of the Antarctic Peninsula. Oceans 2003 Proceedings, 2, 818.
Sjare, B. & Stirling, I. 1996. The breeding behavior of Atlantic walruses, Odobenus rosmarus rosmarus, in the Canadian High Arctic. Canadian Journal of Zoology, 74, 897-911.
Smith, T. G. & Hammill, M. O. 1981. Ecology of the ringed seal, Phoca hispida, in its fast-
ice breeding habitat. Canadian Journal of Zoology, 59, 966-981.
106

Insights into the Acoustic Behaviour of Polar Pinnnipeds 159
Spikes, C. H. & Clark, C. W. 1996. Whales 95 - Revolutionizing marine mammal monitoring
technology. Sea Technology, 37, 49-56.
Stacey, R. M. 2006. Airborne and underwater vocalizations of the Antarctic Ross seal
(Ommatophoca rossii). MSc thesis. Western Illinois University, Macomb, Illinois
Stafford, K. M. 1995. Characterization of blue whale calls from the northeast Pacific and
development of a matched filter to locate blue whales on U.S. Navy SOSUS arrays. MSc
thesis Oregon State University, Corvallis, Oregon.
Stafford, K. M., Fox, C. G. & Clark, D. S. 1998. Long-range acoustic detection and
localization of blue whale calls in the northeast Pacific using military hydrophone arrays.
The Journal of the Acoustical Society of America, 104, 3616-3625.
Stafford, K. M., Nieukirk, S. L. & Fox, C. G. 1999. Low-frequency whale sounds recorded on
hydrophones moored in the eastern tropical Pacific. The Journal of the Acoustical Society of America, 106, 3687-3698.
Stirling, I. & Siniff, D. B. 1979. Underwater vocalizations of leopard seals (Hydrurga leptonyx) and crabeater seals (Lobodon carcinophagus) near the South Shetland Islands,
Antarctica. Canadian Journal of Zoology, 57, 1244-1248.
Stirling, I. & Thomas, J. A. 2003. Relations between underwater vocalisations and mating
systems in phocid seals. Aquatic Mammals, 29, 227-246.
Stirling, I. 1973. Vocalization of the ringed seal (Phoca hispida). Journal of the Fisheries Research Board of Canada, 30, 1592-1594.
Stirling, I. 1975. Factors affecting the evolution of social behaviour in the pinnipedia.
Rapports et Proces-Verbaux des Reunions, Conseil International pour L'Exploration scientifique de la Mer, 169, 205-212.
Stirling, I., Calvert, W. & Cleator, H. 1983. Underwater vocalizations as a tool for studying
the distribution and relative abundance of wintering pinnipeds in the high Arctic. Arctic,
36, 262-274.
Stirling, I., Calvert, W. & Spencer, C. 1987. Evidence of stereotyped underwater
vocalizations of male Atlantic walruses, Odobenus rosmarus rosmarus. Canadian Journal of Zoology, 65, 2311-2321.
Stonehouse, B. 1989. Polar environments. In: Polar Ecology. New York: Chapman and Hall.
Streveler, G. P. 1979. Distribution, population ecology, and impact susceptibility of the
harbor seal in Glacier Bay, Alaska. Final report to the U.S. National Park Service.
Juneau, AK.
Tedman, R. A. & Bryden, M. M. 1979. Cow-pup behaviour of the Weddell seal,
Leptonychotes weddellii (Pinnipedia), in McMurdo Sound, Antarctica. Australian Wildlife Research, 6, 19-37.
Terhune, J.M. 1994. Geographical variation of harp seal underwater vocalizations. Canadian Journal of Zoology, 72, 892-897.
Terhune, J. M. & Dell'Apa, A. 2006. Stereotyped calling patterns of a male Weddell seal
(Leptonychotes weddellii). Aquatic Mammals, 32, 175-181.
Terhune, J. M. & Ronald, K. 1986. Distant and near-range functions of harp seal underwater
calls. Canadian Journal of Fisheries and Aquatic Sciences, 64, 1065-1070.
Terhune, J. M., Stewart, R. E. A. & Ronald, K. 1979. Influence of vessel noises on
underwater vocal activity of harp seals. Canadian Journal of Zoology, 57, 1337-1338.
107

Ilse Van Opzeeland, LarsKindermann, Olaf Boebel et al. 160
Thomas, J. A. & DeMaster, D. P. 1982. An acoustic technique for determinig diurnal
activities in leopard (Hydrurga leptonyx) and crabeater (Lobodon carcinophagus) seal.
Canadian Journal of Zoology, 60, 2028-2031.
Thomas, J. A. & Kuechle, V. B. 1982. Quantitative analysis of Weddell seal (Leptonychotes weddelli) underwater vocalizations at McMurdo Sound, Antarctica. The Journal of the Acoustical Society of America, 72, 1730-1738.
Thomas, J. A. & Stirling, I. 1983. Geographic variation in the underwater vocalizations of
Weddel seals (Leptonychotes weddelli) from Palmer Peninsula and McMurdo Sound,
Antarctica. Canadian Journal of Zoology, 61.
Thomas, J. A., Zinnel, K. C. & Ferm, L. M. 1983. Analysis of Weddell seal (Leptonychotes weddelli) vocalizations using underwater playbacks. Canadian Journal of Zoology, 61,
1448-1456.
Tregenza, N. J. C. 1999. A new tool for cetacean research - a fully submersible click detector.
In: European Research on Cetaceans 13. (Ed. by P.G.H. Evans, J. Cruz and J.A. Raga).
Proceedings of the 13th Annual ECS Conference, Valencia, Spain, 5-8 April 1999.
Trillmich, F. 1981. Mutual mother-pup recognition in Galapagos fur seals and sea lions: cues
used and functional significance. Behaviour, 78, 21-42.
Trillmich, F. 1996. Parental investment in pinnipeds. Advances in the Study of Behaviour, 25,
533-577.
Tynan, C. T. & DeMaster, D. P. 1997. Observations and predictions of Arctic climate change:
potential effects on marine mammals. Arctic, 50, 308-322.
Van Opzeeland, I. C. & Van Parijs, S. M. 2004. Individuality in harp seal (Phoca
groenlandica) pup vocalizations. Animal Behaviour, 68, 1115-1123.
Van Opzeeland, I.C., Corkeron, P.J., Risch, D., Stenson, G.B. & Van Parijs. In prep.
Variation in harp seal, Phoca groenlandica, pup vocalisations and behaviour between
whelping patches in the Greenland Sea and Newfoundland, Canada.
Van Parijs, S. M. 2003. Aquatic mating in pinnipeds: a review. Aquatic Mammals, 29, 214-
226.
Van Parijs, S. M., Hastie, G. D. & Thompson, P. M. 1999. Geographical variation in temporal
and spatial vocalization patterns of male harbour seals in the mating season. Animal Behaviour, 58, 1231-1239.
Van Parijs, S. M., Hastie, G. D. & Thompson, P. M. 2000. Individual and geographical
variation in display behaviour of male harbour seals in Scotland. Animal Behaviour, 59,
559-568.
Van Parijs, S. M., Kovacs, K.M. & Lydersen, C. 2001. Spatial and temporal distribution of
vocalising male bearded seals-implications for male mating strategies. Behaviour, 138,
905-922.
Van Parijs, S. M., Lydersen, C. & Kovacs, K. M. 2004. Effects of ice cover on the
behavioural patterns of aquatic mating male bearded seals. Animal Behaviour, 68, 89-96.
Van Parijs, S. M., Lydersen, C., Kovacs, K.M. 2003. Vocalizations and movements suggest
alternative mating tactics in male bearded seals. Animal Behaviour, 65, 273-283.
Van Parijs, S. M., Thompson, P. M., Tollit, D. J. & Mackay, A. 1997. Distribution and
activity of male harbour seals during the mating season. Animal Behaviour, 54, 35-43.
Van Parijs, S.M., Southall, B. & Workshop Co-chairs. 2007. Report of the 2006 NOAA
National Passive Acoustics Workshop: Developing a Strategic Program Plan fro NOAA’s
Passive Acoustics Ocean Observing System (PAOOS), Woods Hole, Massachusetts, 11-
108

Insights into the Acoustic Behaviour of Polar Pinnnipeds 161
13 April 2006. U.S. Dep. Commerce, NOAA Technical Memorandum. NMFS-F/SPO-81,
64p.
Watkins, W. A. & Ray, G. C. 1977. Underwater sounds from ribbon seal, Phoca (histriophoca) fasciata. Fisheries Bulletin, 75, 450-453.
Watkins, W. A. & Ray, G. C. 1985. In-air and underwater sounds of the Ross seal,
Ommatophoca rossi. The Journal of the Acoustical Society of America, 77, 1598-1600.
Watkins, W. A. & Schevill, W. E. 1979. Distinctive characteristics of underwater calls of the
harp seal, Phoca groenlandica, during the breeding season. The Journal of the Acoustical Society of America, 66, 983-988.
Wiggins, S. M. 2003. Autonomous acoustic recording packages (ARPs) for long-term
monitoring of whale sounds. Marine Technology Society Journal, 37, 13-22.
Wilson, S. 1974. Juvenile play of the common seal, Phoca vitulina vitulina, with comparative
notes on the grey seal, Halichoerus grypus. Behaviour, 48, 37-60.
109

Publication II
Management and research applications of real-time and archival
passive acoustic sensors over varying temporal and spatial scales
110

MARINE ECOLOGY PROGRESS SERIES
Mar Ecol Prog Ser
Vol. 395: 21–36, 2009
doi: 10.3354/meps08123Published December 3
INTRODUCTION
The task of scientists, managers and mitigators alike
is to use the right set of tools at the right spatial scale
for the issue that needs addressing. To do this effi-
ciently and effectively is no easy task, yet it is essential.
Spatial scaling has long been an acknowledged driver
defining research questions within the atmospheric
and earth sciences. However, it is a more recent con-
cept for ecologists, the value of which is increasingly
becoming understood (Wiens 1989). Accurately des-
cribing and understanding the processes that deter-
© Inter-Research 2009 · www.int-res.com*Email: [email protected]
Management and research applications ofreal-time and archival passive acoustic sensors
over varying temporal and spatial scales
Sofie M. Van Parijs1,*, Chris W. Clark2, Renata S. Sousa-Lima2, 3, Susan E. Parks4,
Shannon Rankin5, Denise Risch1, 6, Ilse C. Van Opzeeland7
1Northeast Fisheries Science Center, 166 Water Street, Woods Hole, Massachusetts 02543, USA2Bioacoustics Research Program, Cornell Lab. of Ornithology, Sapsucker Woods Road, Ithaca, New York 14850, USA
3Instituto Baleia Jubarte, Rua Barão do Rio Branco, 26, Caravelas, BA 45900-000, Brazil4The Pennsylvania State University, Applied Research Laboratory, PO Box 30, State College, Pennsylvania 16804-0030, USA
5Southwest Fisheries Science Center, 3333 N. Torrey Pines Court, La Jolla, California 92037, USA6Integrated Statistics, 9 Sumner Road, Woods Hole, Massachusetts 02543, USA
7Alfred Wegener Institute for Polar and Marine Research, Department of Ocean Acoustics, Am Alten Hafen 26,
27568 Bremerhaven, Germany
ABSTRACT: Defining the appropriate scale over which to conduct a study in the marine environment
is critical to achieving appropriate scientific, management, mitigation and conservation objectives.
This paper focuses on applications of passive acoustic technologies over a range of spatial and
temporal scales. It is divided into sections dealing with archival and real-time passive acoustic sensor
applications. Each section assesses the principles behind using the respective technology and pro-
vides recent examples of research and management applications for marine mammals and fish. The
section on archival sensors highlights the need for continued development of automated acoustic
detectors to assess large data sets. Case studies are presented of detectors developed for determining
seasonal occurrence and distribution of haddock sounds and humpback whale vocalizations. Also
presented are studies of other applications using archival sensors: tracking singing humpback
whales in Brazil, using vocalizations to assess the reproductive strategies of Arctic bearded seals and
assessing regional variability in call patterns for North Atlantic right whales. The section on real-time
passive acoustic sensors focuses on real-time buoys and towed arrays. Case studies presented include
a real-time buoy system used for monitoring endangered North Atlantic right whales and a station-
ary autonomous array providing real-time access to Antarctic acoustic data. The value of using towed
arrays for real-time applications is also assessed, and a case study is provided on the use of towed
arrays to improve abundance estimates of North Pacific cetaceans and to better understand vocaliza-
tion behaviors.
KEY WORDS: Passive acoustics · Mesoscale · Archival arrays · Real-time buoys · Towed arrays ·
Localization · Automated detection · Marine mammals · Fish
Resale or republication not permitted without written consent of the publisher
Contribution to the Theme Section ‘Acoustics in marine ecology’OPENPEN ACCESSCCESS
111

Mar Ecol Prog Ser 395: 21–36, 2009
mine the distribution of organisms is a fundamental
problem in ecology, with important conservation and
management implications (Redfern et al. 2006). The
terms ‘synoptic’ or large-scale, ‘meso’ or medium-scale
and ‘micro’ or small-scale have most frequently been
used in meteorology and oceanography, where
descriptors of weather systems need to be provided at
local, regional, continental and global scales (e.g.
Capet et al. 2008). This terminology is also valuable
when searching for meaningful spatial descriptors of
the marine environment, particularly in relation to the
movement patterns of biological entities that live
within it. The terminology itself is somewhat arbitrary
and needs to be taken in the context of each specific
situation. Here we define synoptic scales for regional
marine areas of >2000 km2, mesoscale as areas
between 1 and ~2000 km2 in size and microscales as
areas <1 km2 (Orlanski 1975).
Marine animals live their lives and communicate
acoustically across widely differing spatial scales.
Large whales range and can communicate over micro-
to synoptic scales (Moore et al. 2006), while smaller
whales and dolphins tend to range and communicate
over micro- to mesoscale areas (e.g. Tyack 2000).
Pinnipeds are bound to land for breeding and moult-
ing; therefore, access to land or ice is a fixture of their
life histories. Acoustic behavior in pinnipeds has been
shown to range from local (<1 km) to mesoscales with
communication occurring both in air and in the water
near haul-out sites on transit routes and foraging
grounds (e.g. Insley et al. 2003, Van Parijs 2003). Siren-
ian vocalizations tend to be more localized than those
of cetaceans and pinnipeds. Although movements of
manatees may exceed 820 km (Reid et al. 1991), their
communication range is short, with sounds limited to
distress calls or to identify, locate or maintain proximity
between mothers and calves (Sousa-Lima et al. 2002a,
2008). Dugongs may use their vocalizations at slight-
ly longer distances while patrolling their territory
(Anderson & Barclay 1995). Fish routinely produce
sounds for long periods of time, allowing for seasonal
and diurnal tracking of large shoals, and communicate
over ranges of a few hundred meters up to 8 km (e.g.
Saucier & Baltz 1993, Mann & Lobel 1995, Luczkovich
et al. 1999, 2008, McCauley & Cato 2000).
Most marine management and conservation areas,
zones, parks or sanctuaries tend to be micro- or meso-
scale in size. Management areas rarely encompass the
entire range of the biota and are generally targeted
towards areas where important biological activities
occur. Similarly, scientific studies are typically practi-
cal only at micro- or mesoscales, because studies
conducted on ocean-basin scales remain logistically
and financially prohibitive to most institutions (see
Mellinger et al. 2007). These relatively small scalar
approaches mean that little is still understood about
how marine animals use the synoptic scale and how
significant this scale is in terms of their management
and conservation.
Passive acoustic monitoring (PAM) encompasses a
functional suite of tools that can answer scientific ques-
tions and influence management and/or mitigation
applications over all spatial scales. The tools that are
available to acquire and analyze passive acoustic data
have undergone a revolutionary change over the last
decade, and have substantially increased our ability to
collect acoustic information and use it as a functional
management tool. Recent reviews of the passive
acoustic technologies currently available concentrate
both on cetaceans (Mellinger et al. 2007), pinnipeds
(Van Opzeeland et al. 2008) and fish (Gannon 2008,
Luczkovich et al. 2008). The present study focuses on
the value of using bottom-mounted buoys, towed
arrays and real-time acoustic sensors for both scientific
and management applications with respect to acousti-
cally active marine animals over a wide range of spa-
tial scales. We divide this article into 2 sections based
on available passive acoustic sensors: archival and
real-time. Each section discusses the applications of
these technologies and provides case studies related to
the application. To date, the majority of applications of
these technologies have focused on cetacean research,
management and/or mitigation. However, the value of
using similar applications for pinnipeds, sirenians and
fish has yet to be fully realized. In the present study we
provide case studies of applications for most taxa.
ARCHIVAL PASSIVE ACOUSTIC SENSORS
Mellinger et al. (2007) and Van Opzeeland et al. (2008)
provide reviews of the types of archival marine acoustic
recording units (ARUs) that are currently available for
both science and management purposes. ARUs vary
widely in type, from stationary units consisting of single
or multiple hydrophones, a single hydrophone deployed
on an individual animal, to multiple sensors on towed or
bottom-mounted hydrophone arrays. Therefore, the
spatial scale and breadth of coverage of acoustically
active marine animals varies widely, depending on the
type of sensor that is used (Fig. 1a).
As the technical capabilities of such units have
improved and costs have decreased, it has become
increasingly feasible to deploy multiple recorders in
the form of acoustic arrays (≥3 ARUs). This, in turn, has
enabled an increase in the accuracy of the data
collected and the number of individuals surveyed
(Fig. 1b). Collecting passive acoustic data on multiple
channels makes it possible to detect, localize and track
vocalizing fish and marine mammals. To do so accu-
22
112

Van Parijs et al.: Archival and real-time passive acoustic sensors
rately requires precise time synchronization of all the
channels and can be logistically difficult when using
separate sensors as opposed to systems such as towed
arrays that simultaneously log multi-channel data.
However, if done properly, acoustic arrays can im-
prove understanding of species distributions and den-
sities over varying temporal and spatial scales. Such
arrays have been routinely used to study cetaceans
(e.g. Moore et al. 2006, Mellinger et al. 2007). More re-
cently, their utility has also been shown for investigat-
ing long-term behavioral strategies in pinnipeds (e.g.
Van Parijs 2003, Van Opzeeland et al. 2008).
However, the data collected by ARUs can
easily run into multiple terabytes in size. Thus
the first step to accessing data from both
archival and real-time ARUs is to find the
sounds of interest. It is logistically impossible
to hand browse these types of data sets.
Therefore, there is an increased need for suit-
able acoustic detection and recognition soft-
ware to deal with this problem. Several
valuable tools already exist to do this (e.g.
Ishmael: Mellinger & Clark 2006, www.pmel.
noaa.gov/vents/acoustics/whales/ishmael;
Pamguard: Urazghildiiev & Clark 2006, www.
pamguard.org; XBAT: Figueroa 2006, www.
xbat.org); however, it is vital to realize that a
solid understanding of the acoustic behavioral
ecology of each species is imperative to using
these tools appropriately. Without an under-
standing of a species’ acoustic repertoire, call
patterning, individual and group calling be-
havior as well as seasonal and regional
variation in call usage, no clear or coherent re-
search or management question can be ad-
dressed.
In the following we provide examples over a
range of spatial scales of how archival acoustic
sensors can be used to study the behavioral
ecology of vocal marine animals. Our aim is to
provide an understanding of the tools and
methodologies that are currently available to
address a range of ecological questions directed
towards improving marine animal manage-
ment, mitigation and conservation strategies.
Regional differences in North Atlantic right
whale acoustic patterns and call types
throughout the northwestern Atlantic Ocean
Collecting acoustic data over large spatial
and temporal scales is becoming increasingly
commonplace. The value of increased data
collection over larger scales is indisputable in
terms of understanding and managing populations
more effectively. However, marine animal behavior
varies considerably between seasons and over
geographical areas. Therefore, it is no surprise that
their acoustic behavior is equally variable, driven by
varying life history parameters and experiences at
the individual, population and species level. When
using acoustics to implement management and
mitigation strategies for a species it is imperative to
understand their call repertoire and whether this
varies regionally.
23
1 yr
10 yr
autonomous hydrophone
cabled hydrophone array
1 10 100 1000
1 d
1 wk
1 mo
Distance scale (km)
towed hydrophone arrayTim
e s
cale
acoustic recording tag
visual survey
a
1
0.1
Po
sitio
nal accu
racy (km
)
0.01
≥ 3 autonomous
hydrophones
acousticrecording tag
1 10 100 1000
100
10
1
Number of individuals surveyed
10000
≥ 2 cabled
hydrophone arrays
1 autonomous hydrophone
1 cabled hydrophone array
towed hydrophone array
visual survey
b
Fig. 1. (a) Approximate temporal and spatial scales over which data
are collected using an acoustic recording tag on a single individual, an
autonomous hydrophone, a vessel towed array and a bottom-mounted
cabled hydrophone array. These acoustic techniques are compared
with the temporal and spatial scope of visual surveys. (b) Approximate
range of accuracy and number of individuals covered using an acoustic
recording tag on an individual animal, an autonomous hydrophone, a
vessel towed array composed of ≥3 hydrophones and ≥2 bottom-
mounted cabled hydrophone arrays. Figures were provided courtesy of
D. K. Mellinger
113

Mar Ecol Prog Ser 395: 21–36, 2009
In the case of the endangered North Atlantic right
whale Eubalaena glacialis, acoustic monitoring can be
a valuable tool for both management and conservation.
Ship strike is one of the main anthropogenic causes of
mortality in this species (e.g. Silber & Bettridge 2006),
and reducing the likelihood of strikes in high vessel
traffic areas is of primary concern. Low reproductive
rates are also a major factor limiting their recovery,
although calf production has increased during the past
6 yr (Kraus et al. 2005). Identification and protection of
the mating grounds for this species may also be an
important step toward their conservation. However,
the location of the majority of the population during
the breeding season (presumed to peak in October–
December) remains unknown (Weinrich et al. 2000,
IWC 2001, Kraus & Hatch 2001). Passive acoustic
monitoring can monitor areas of high risk and inves-
tigate remote inaccessible areas for the presence of
right whales.
The upcall, or contact call, is typically the call type
used for diagnostic detection of right whale species
(Wade et al. 2006, Clark et al. 2007). This call is highly
stereotypic making it ideal for species recognition.
Studies of the behavioral function of sounds in the right
whale repertoire have identified 2 additional classes of
sounds, tonal calls and gunshot sounds, related to
social and/or mating activity (Parks & Tyack 2005) and
potential male reproductive signals (Parks et al. 2005).
In order to develop an effective management or moni-
toring scheme and search large quantities of acoustic
data for the presence of a given species, it is important
to understand whether to use a single call type or a
combination of several call types. To make this deci-
sion a good understanding of regional patterns and call
type usage in the target species is needed.
In the present North Atlantic right whale study, bot-
tom-mounted ARUs were deployed in 3 known right
whale habitat areas (Cape Cod Bay, Massachusetts;
the Great South Channel, approximately 50 nautical
miles offshore from Massachusetts; and the Bay of
Fundy; see habitat descriptions in Kraus & Kenney
1991, Brown et al. 1995) to determine whether regional
differences existed in the vocal behavior of the whales.
The first 2 habitats have been shown to be frequented
by large numbers of right whales during the spring,
and the latter is primarily used in summer months.
Data were collected during a short period within each
of these peak periods (8 d in Cape Cod Bay between
1 March and 10 April 2004, 5 d in the Great South
Channel between 12 and 17 May 2004 and 8 d in the
Bay of Fundy between 7 and 24 August 2004). The
Cape Cod Bay array consisted of 4 units, while the
Great South Channel and Bay of Fundy arrays con-
sisted of 5 units each. ARUs were spaced 3 to 5 nauti-
cal miles apart to allow for maximal acoustic survey
area with the ability to localize vocalizations within the
array itself. Sampling rate was between 2 and 8 kHz.
The recordings were inspected for right whale calls
using XBAT and labeled as upcalls, other tonal calls or
gunshot sounds. Analyses of the call types across the
3 habitat areas show a clear difference in the calling
behavior of right whales in the spring versus the
summer habitat areas (Fig. 2). Gunshots accounted for
a significantly larger proportion of total detected
sounds in the Bay of Fundy than in either Cape Cod
Bay or the Great South Channel (ANOVA, F2, 19 = 54.9,
p < 0.0001). These results suggest that the social inter-
actions of right whales change through the seasons,
with an increase in gunshot sounds, thought to be
related to reproduction, later in the year. The present
study demonstrates the utility of using upcalls as a tool
for monitoring the presence of right whales and
managing ship strike throughout most regions of the
western Atlantic. However, it also suggests that other
call types, such as gunshots, may be more effective for
indicating right whale presence in some regions, such
as their foraging and breeding grounds. This then also
begs the question as to how each of these call types is
used on the calving grounds. To date, this research has
not been undertaken but should be done to validate
any management or mitigation strategy for this region.
Overlap of call types between species is another
concern when using acoustics for single-species
management and mitigation. In the case of the North
24
0
200
400
600
800
1000
1200
1400
1600
CCB GSC BOF
Region
Call
co
un
t
Gunshot
Tonal
Upcall
Fig. 2. Archival sea bed acoustic recording units (ARUs) were
deployed in 3 North Atlantic right whale habitat areas off the
northeast coast of the USA: Cape Cod Bay (CCB), the Great
South Channel (GSC) and the Bay of Fundy (BOF). Bars rep-
resent the median (±SE) of daily call counts broken down by
3 call types (gunshot, tonal and upcall) for each habitat area
114

Van Parijs et al.: Archival and real-time passive acoustic sensors
Atlantic right whale, humpback whales are capable of
producing upcalls that closely resemble those of right
whales. How significant this overlap really is and
whether there is potential for differentiation should be
explored further.
Acoustic detection of haddock and humpback whale
sounds: understanding seasonal distribution and
occurrence
The next step to manage, mitigate and/or conserve a
species regionally is to understand its seasonal distrib-
ution and occurrence. In order to do this, automated
detectors targeting specific call types are needed.
The Gerry E. Studds Stellwagen Bank National
Marine Sanctuary, situated in Massachusetts Bay on
the northeast coast of the USA, is the research venue of
an ambitious multi-year passive acoustic project aimed
at developing a suite of tools to monitor and map ocean
underwater noise over a mesoscale region (for more
project details see Hatch & Fristrup 2009, this Theme
Section). Ten archival ARUs were deployed in 2006
and will remain operational until late 20101. By late
2010, more than 400 000 h of acoustic data will have
been collected. Given recent technological advances,
it is now fairly simple to collect a lot of continuous data
over a long time scale. The tools with which to analyze
this data are, however, not yet routine or well known.
Among the primary tools that are becoming widely
used are automated detectors. The present study pro-
vides an example of how these tools can be used.
As part of the present study, automated acoustic
detection software (‘detectors’) is being developed to
search for specific biological sounds produced by
baleen whales and various fish species. Acoustic
detectors were built using the automated data tem-
plate detector tool available in XBAT (www.xbat.org,
H. Figueroa). XBAT is an extensible sound analysis
application which uses MATLAB as a platform for
developing sound analysis tools. ‘It is open-source,
licensed under the General Public License. Users can
access and visualize sounds, browse and search for
salient events, and annotate and measure events.
Developers can quickly create easy-to-use extensions
with a powerful plug-in architecture’. The automated
detectors operate using spectrogram cross-correlation
of an example event (the template) and the sound file.
Several templates can be arranged in presets.
In the present study, multi-species detectors were
built for all large whale and fish species in the sanc-
tuary. Here we describe the process of building detec-
tors for 2 of these species. The first application was
enumeration of haddock Melanogrammus aeglefinus
spawning sounds. The objective in this case was to
develop a detector to evaluate the seasonal occurrence
and distribution of spawning haddock over multiple
years within the study area. Stellwagen Bank Sanctu-
ary forms one of the two primary spawning sites for
haddock in the Gulf of Maine (Colton 1972). Thus this
area plays an important role in the life-cycle of this
species. Passive acoustics can help to gain a better
understanding of haddock distribution and general
reproductive behavior in this area, in order to better
inform conservation and management of this species.
Haddock produce repetitive knocking sounds
directly linked to their spawning behavior (Hawkins et
al. 1967, Hawkins & Amorim 2000, Casaretto & Haw-
kins 2002). While these sounds are well described from
laboratory experiments, little is known of sound pro-
duction in wild haddock. These sounds comprise
3 types of calls: single, double and multiple knocks
(Fig. 3a). All 3 call types were added to a preset. This
preset was run against 10 randomly selected days of
manually browsed data to estimate its accuracy at
detecting spawning sounds. Multiple presets were
constructed using different templates until the most
accurate one was developed. The mixed call type
preset was able to enumerate haddock knocks with an
accuracy of 47%, while the accuracy of different
templates was 75, 82, and 41%, respectively, for single,
double and multiple knock calls.
This case study illustrates that the data template detec-
tor can be highly effective in enumerating sound events.
The comparatively low accuracy of the template for mul-
tiple knock calls was due to a variable repetition rate of
single pulses in different versions of this call type. It is
therefore easy to perceive that the more stereotypic a
vocalization, the better a detector based on cross-corre-
lation will perform. As such, more variable sound types
require different detection approaches. For example,
rather than enumerating every single vocalization one
might instead search for sound events.
Individual male humpback whales Megaptera
novaeangliae produce long repetitive song sequences
when attracting females and during male–male com-
petition (e.g. Payne & McVay 1971, Winn & Winn 1978,
Tyack 1981). Humpback whale song is gender-specific
and has been shown to change over time scales of a
year to several decades (e.g. Noad et al. 2000, Darling
& Sousa-Lima 2005). Improving our understanding of
song and how it is used seasonally, in the breeding and
feeding grounds as well as along migration routes, will
increase our comprehension of how this species uses
25
1All ARUs mentioned in this and subsequent studies were de-
veloped by the Bioacoustics Research Program of the Cornell
Laboratory of Ornithology (BRP, www.birds.cornell.edu/brp/
hardware/autonomous-recording-units)
115

Mar Ecol Prog Ser 395: 21–36, 200926
116

Van Parijs et al.: Archival and real-time passive acoustic sensors
each region as well as how its song evolves both
temporally and spatially. Given the variability and
length of humpback singing cycles, enumeration of
each call type is difficult. However, it is possible to
build acoustic detectors that identify song events. In
this case, a single call type present in all humpback
whale song in the study area during 2006 was selected
to build a data preset (Fig. 3b). The resulting preset,
based on 5 templates, proved highly effective in
detecting hours with humpback whale song through-
out 1 yr of acoustic data (89% accuracy; based on com-
parison to 4 randomly selected days of hand-browsed
data). In the present study, the presence of song within
a given hour enabled the determination of song occur-
rence and distribution over a 12 mo period. Although
different from enumeration, this approach is valuable
for understanding patterns of sound production. In the
case of humpbacks, however, it is important to revisit
the efficacy of the detector every year, given that
alterations in song may occur. Obviously, it is vital to
understand the acoustic behavior of a species since this
not only affects the effective operation of a detector but
will determine the types of biological and management
issues than can be addressed using passive acoustic
data. Tools such as the data template detector or
existing energy and contour detectors in XBAT and
other platforms, which are easy and flexible to use,
appear to be the way forward in developing tools and
applications for processing acoustic data from multiple
species.
Tracking behavioral changes in individual hump-
back whales and evaluating anthropogenic effects
Acoustic localization is a valuable tool for helping to
understand the acoustic behavior of an individual or
groups of animals. Once baseline individual and/or
group behavior is understood, this tool can also be
used to assess potential anthropogenic impacts on a
species. A multiple year mesoscale study (Sousa-Lima
2007) was conducted at the Abrolhos National Marine
Park located in the northeast portion of the Abrolhos
Bank off the coast of Brazil (16° 40’ to 19° 30’ S). In this
study an array of 4 bottom-mounted ARUs was used to
detect (using similar XBAT sound event detectors as
for the study described in the previous section), locate
and track multiple singing male humpback whales, as
well as to evaluate their behavioral responses to pass-
ing tourist boats. Singing whales were located using a
custom built localization extension for XBAT (Source
Locator version 2.2, K. A. Cortopassi & K. M. Fristrup
unpubl. data). This tool estimates the location of a
given signal by calculating the cross-correlation func-
tions between different channels and searching for the
best location estimate within a gridded search area.
Temporal and spatial changes in the distribution of
singing male humpback whales were determined by
plotting estimated signal bearings and locations, thus
building acoustic tracks of individual whales.
Tracked singers (Fig. 4) were enumerated at multi-
ple points in time to determine whether the numbers of
singers changed during periods of variable boat traffic
(Sousa-Lima & Clark 2008). Singers were also acousti-
cally tracked to evaluate whether their movements and
vocal behavior changed during the approach of a boat
(Sousa-Lima et al. 2002b, Sousa-Lima & Clark 2009).
This study revealed that the scale of the disturbance
created by boat traffic to the acoustic environment of
humpback whales in the Abrolhos Park is much
broader than previously thought. Bottom-mounted
arrays are relatively unobtrusive to the animals, and
data can be collected over larger spatial and temporal
scales. This allows multiple focal individuals to be
observed for extended periods of time before, during
and after exposure to anthropogenic disturbances.
Understanding reproductive strategies and life
history parameters by locating individual bearded
seals over decades
PAM is most frequently thought of in terms of ceta-
cean management and mitigation. However, pinnipeds
have never seemed to be suitable candidates for PAM.
This case study demonstrates how PAM can be used to
provide detailed and long term insights into the repro-
ductive strategies and life history of a pinniped spe-
cies. The detail is so fine-scale that small-scale
changes due to changing environmental conditions are
also able to be detected.
Studies of pinniped reproductive strategies have
largely concentrated on species which remain ashore
during the entire breeding season. However, the Odo-
benidae and at least 15 of the 18 phocid species mate
aquatically (Van Parijs 2003). The use of archival
acoustic arrays has significantly advanced our under-
standing of the reproductive ecology of aquatic mating
pinnipeds such as the harbor seal Phoca vitulina (e.g.
Van Parijs et al. 2000), the bearded seal Erignathus bar-
27
Fig. 3. Example of acoustic detections using the data tem-
plate detector in XBAT for (a) haddock pulsed calls and (b)
humpback whale song notes. Lower sections of both exam-
ples show the cross-correlation functions. Dotted horizontal
line at 0.4 indicates the detection threshold. Every correla-
tion peak above threshold is saved in the detection log.
Spectrograms were created with Hanning window. Fast
Fourier transform algorithm size: (a) 512, (b) 1024; overlap:
(a) 97%, (b) 90%
117

Mar Ecol Prog Ser 395: 21–36, 2009
batus (e.g. Van Parijs et al. 2003, 2004) and Weddell
seal Leptonychotes weddellii (e.g. Harcourt et al. 2007).
Archival arrays of 3 to 5 buoys were used to record
the trill vocalizations of male bearded seals at
2 Arctic sites, one in the Svalbard archipelago over
2 consecutive years, and one near Barrow, Alaska, over
a 16 yr period. Males show stereotypical dive and vocal
displays, with clear individual variation (Van Parijs et
al. 2003). In Svalbard, acoustic localization provided
at-sea locations for 17 males based on variation in trill
parameters. Kernel home range analyses showed that
12 individuals displayed at fixed locations (95% ker-
nels = 0.27 to 1.93 km2), while 5 other males displayed
over considerably larger areas (95% kernels = 5.31 to
12.5 km2) (Fig. 5, Van Parijs et al. 2003). Movement
patterns of males suggest that those with small areas
patrolled aquatic territories, while those that used
larger areas appeared to roam. These data thus pro-
vide evidence of alternative mating tactics in this spe-
cies. In Alaska, acoustic localizations provided at-sea
locations for 100 males based on variations in trill para-
meters, with 6 males being present over the entire
16 yr period (Van Parijs & Clark 2006). The acoustic
data indicate that male mating tactics tend to show
long-term stability in vocal characteristics, site fidelity
and periods of tenure that cover a significant propor-
tion of a male’s adult life span. Ice cover was found to
restrict the number of roaming males, whereas territo-
rial males were present during all ice conditions, sug-
gesting that varying ice conditions affect individual
male strategies and reproductive success (Van Parijs et
al. 2004).
Therefore, PAM can provide detailed and long-term
information on pinniped species in key areas such as
their mating grounds. This information can be so de-
tailed that changes can be detected in individual area
usage and behavior as a result of both intraspecific
competition and varying environmental conditions.
REAL-TIME PASSIVE ACOUSTIC SENSORS
To date, discussions of real-time passive acoustic
sensors have focused on cabled sea floor mounted
hydrophones used mainly by government agencies in
particular navies, such as the Sound Surveillance
System of the US Navy (SOSUS), which provides real-
time information. Mellinger et al. (2007) highlight the
benefits of these systems in continuously providing
near-real-time data, as well as in having hydrophones
in pelagic areas where marine mammal surveys are
rare. However, data access and recording bandwidth
are usually severely restricted. In recent years, non-
military real-time systems have markedly improved
and are rapidly becoming a standard technology for
use in both research and management. These non-
military applications primarily consist of surface buoys
or towed arrays; the former tend to consist of single
28
Fig. 4. A synchronized array consisting of 4 archival acoustic recording units was deployed in Abrolhos Park, Brazil. Humpback
whale song was localized using XBAT software and the bearings of individuals were plotted. This figure represents plots from a
24 h sequence and shows the bearings of humpback whale sounds demonstrating how they can be used to make up tracks of
multiple singers (distinguished by color)
118

Van Parijs et al.: Archival and real-time passive acoustic sensors
units deployed remotely, while the latter depend on
vessels for deployment. An increasing number of non-
military acoustic observatories are now operational in
coastal areas (e.g. the ALOHA Ocean Observatory
Network, Petitt et al. 2002, Barnes et al. 2007). These
systems (1) allow real-time monitoring and localization
of marine animals; (2) record continuously over broad
frequency bandwidths; and (3) have no restrictions on
data storage, data access or power supply. Surface
buoy and towed array applications are discussed in the
following sections, and an example is presented of a
non-military acoustic observatory.
Real-time surface buoy applications
Real-time surface buoys are acoustic record-
ing packages anchored to the sea floor but
which are connected to floats at the surface
which transmit acoustic data via VHF, satellite
or mobile phone signals (Fig. 6). The signals
sent from these buoys can be transmitted to
multiple recipients. The term near real-time is
sometimes used in relation to these systems
since certain logistical delays are involved in
data processing. However, this tool is increas-
ingly approaching real-time functionality.
While real-time buoys are useful tools for re-
search applications, they are increasingly be-
coming invaluable for implementing manage-
ment and mitigation strategies. The latter often
require action to be taken in as close to real-
time as possible for protection measures to be
effective. For example, marine mammals can al-
ter their distributions and movements daily,
seasonally and annually. Often for management
measures to be most effective, reliable real-time
information on species distributions is needed.
Examples of using real-time data from buoys for
mitigation and management purposes include
the Gulf of St. Lawrence, where real-time buoy
information is being used to mitigate ship
strikes of blue whales Balaenoptera musculus
and fin whales Balaenoptera physalus (Simard
et al. 2006), and along the northeast coast of the
USA, where buoy data are being used to
mitigate ship strikes of North Atlantic right
whales (see following section).
Real-time acoustic monitoring of North
Atlantic right whales
Ship strike mortality remains one of the two
primary causes of anthropogenic mortality im-
peding the lack of recovery of the endangered North
Atlantic right whale (e.g. Silber & Bettridge 2006). Ship
strikes can be reduced by either separating vessels
from whales or by decreasing the speed of the vessels
(e.g. Vanderlaan & Taggart 2007). In 1999, NOAA’s
National Marine Fisheries Service (NMFS) and the US
Coast Guard (USCG) established a reporting system
that alerts mariners to the location of right whales
throughout the East Coast of the US. When vessels
greater than 300 gross tons enter these areas they must
report to the USCG to receive current sighting infor-
mation about right whales (Ward-Geiger et al. 2005).
To extend the warning system to smaller vessels, the
USCG developed another system, called the Auto-
29
Fig. 5. Kernel home range plots of 50 to 95% isopleths, represented by
the different colour shades, for the trill locations, as calculated using 3
archival acoustic hydrophones, of (a) 12 individual territorial male
bearded seals with small areas and (b) 5 roaming males with large
areas in Svalbard, Norway 78° 55’ N, 11° 56’ E (reproduced from
Van Parijs et al. 2004)
119

Mar Ecol Prog Ser 395: 21–36, 2009
mated Identification System. In addition, the Northeast
US Right Whale Sighting Advisory System (SAS) was
created in 1996 to monitor right whale populations
within the northeast waters of the United States (http://
rwhalesightings.nefsc.noaa.gov/). The SAS provides
sighting information from aerial and shipboard surveys
to commercial ships and mariners. The positions and
maps of right whale sightings are distributed through
various means: faxes and verbal updates to commer-
cial vessels, 24 h radio broadcasts and online postings
to several web pages. Due to logistical and weather
constraints, however, it is estimated that only 33% of
all whales are detected on a given day.
To improve the detection of right whales, Cornell
University’s Bioacoustics Research Program (BRP)
developed a real-time passive acoustic buoy system
that recognizes right whale upcalls using an auto-
mated detection program and relays these detections
to the BRP (Fig. 7). Detections are then checked for
accuracy, uploaded onto a web server and directly
forwarded to the SAS and other parties for manage-
ment and mitigation purposes (www.listenforwhales.
org). The real-time buoy system continuously updates
the presence of this species, and is a benchmark ex-
ample of using passive acoustics for conservation
purposes.
30
Fig. 6. Schematic diagram of an auto-buoy communications and server system that accepts and unwraps incoming data packets
from multiple buoys via multiple cell phones and provides these data to a web server (see Fig. 7) that can be viewed over the inter-
net. The auto-buoy hard ware was developed by Woods Hole Oceanographic Institute (WHOI), and contains electronics developed
by the Bioacoustics Research Program at the Cornell University Laboratory of Ornithology (BRP), a global positioning system
(GPS), a VHF telemetry receiver, an HTI hydrophone and an alkaline battery pack. Short sound clips of North Atlantic right whale
up-call detections, with accompanying buoy information data such as buoy ID, location and voltage, are sent through GPS to an
iridium satellite and via radio signal using a code division multiple channel access method (CDMA). The data then either pass
through a modem pool or a multithreaded transmission control protocol (TCP) server. The data is subdivided into 2 categories sep-
arating sound clip data from the other data streams. These are then stored on a central data base and loaded onto a web server
120

Van Parijs et al.: Archival and real-time passive acoustic sensors
Real-time PAM of Antarctic pinnipeds and other
marine animals
Real-time passive acoustic arrays can provide valu-
able long-term acoustic monitoring data in remote
areas such as the Arctic and Antarctic. The Perennial
Acoustic Observatory in the Antarctic Ocean
(PALAOA) is an example of a stationary autonomous
listening station that continuously records underwater
sound year-round. The PALAOA observatory is lo-
cated at 70° 31’ S, 8° 13’ W, on the Ekström Ice Shelf,
eastern Weddell Sea, 1 km from the ice shelf edge and
15 km from Neumayer Base (the German Antarctic
research station). PALAOA consists of a 520 m baseline
tetrahedral hydrophone array2 deployed through bore-
holes underneath the 100 m-thick floating Antarctic
ice shelf (Boebel et al. 2006, Klinck 2008). The observa-
tory is energetically self-sustained utilizing solar and
wind energy, and has operated since December 2005.
The PALAOA system enables real-time acquisition of
data which are subsequently transferred via live feed
from the Neumayer Base to the Alfred Wegener
Institute in Germany (www.awi.de/en/research/new_
technologies/marine_observing_systems/ocean_
acoustics/palaoa/palaoa_livestream). A main reason
for incorporating real-time data transfer in
the PALAOA system was to allow autono-
mous and continuous recording over long time
spans without any limitation on onsite data
storage (Boebel et al. 2006, Klinck 2008, Van
Opzeeland et al. 2008).
The PALAOA recordings contain a variety
of cetacean vocalizations, as well as vocaliza-
tions of 4 Antarctic pinniped species: Weddell
Leptonychotes weddellii, Ross Ommatophoca
rossii, crabeater Lobodon carcinophaga and
leopard seals Hydrurga leptonyx (Fig. 8). The
latter 3 species breed on pack-ice, and many
aspects of the basic ecology of these species
are still largely unknown due to the inacces-
sibility of their habitat. All 4 species exhibit
species-specific vocal repertoires and have
distinct patterns in their vocalization activity.
Fig. 8 illustrates the call activity of all 4 species
during 4 d in December 2006. Weddell seal
call activity declined towards the end of Dec-
ember, which is near the end of the Weddell
seal mating season (e.g. Bartsh et al. 1992,
Harcourt et al. 1998, 2000). In contrast, Ross
seal vocal activity started and increased
throughout December. Crabeater seal call
activity was very low, with calls only present in early
December; higher call rates have been documented
during October and November (Thomas & DeMaster
1982). Although Thomas & DeMaster (1982) reported
that the peak underwater vocalization period for leop-
ard seals coincided with that of crabeater seals, the
PALAOA recordings show a relatively constant call
rate in December for leopard seals. Acoustic analyses
of PALAOA recordings over longer time spans are
underway and will provide further insights into the
acoustic behavior and ecology of all 4 pinniped
species. The PALAOA recordings will also be used to
develop an ocean noise budget and to monitor the
effects of anthropogenic sounds (e.g. ice breakers, sci-
entific sound sources) on marine mammal calling
behavior.
Towed array applications
Real-time detection of cetaceans using passive
acoustics is increasingly recognized as a potential tool
for the mitigation of human impacts on the marine
environment (Barlow & Gisiner 2006, Castellote 2007,
Potter et al. 2007, Weir & Dolman 2007). The successful
31
Fig. 7. Screen shot of the real-time auto buoy system that is operational
off the northeast coast of the USA aimed at increasing the efficiency of
the alerting system directed towards mariners entering into the area
with the intention of reducing vessel speeds and thereby preventing ship
strikes (see www.listenforwhales.org). Note that in this screen shot there
are no offline buoys, indicating that at this point in time all buoys are
functional and actively listening for North Atlantic right whale up-calls
2Since mid-2006 the failure of 2 hydrophones has
reduced the array to a 2-channel system
121

Mar Ecol Prog Ser 395: 21–36, 200932
Fig. 9. Study area for 7 shipboard visual and acoustic cetacean surveys with tracklines of acoustic monitoring using a towed
hydrophone array. Total distance surveyed for all tracklines combined is 46 370 km
0
4
8
12
16
20
0:00 6:00 12:00 18:00
Time (UTC)
0:00 6:00 12:00 18:00
Time (UTC)
0:00 6:00 12:00 18:00
Time (UTC)
11 December 2006
Avera
ge n
o. o
f calls
per
min
ute
Avera
ge n
o. o
f calls
per
min
ute
Avera
ge n
o. o
f calls
per
min
ute
Avera
ge n
o. o
f calls
per
min
ute
0
5
10
15
20
0
5
10
15
20
0:00 6:00 12:00 18:00
Time (UTC)
0
5
10
15
20
Weddell Leopard Crabeater Ross
16 December 2006
26 December 2006 31 December 2006
Fig. 8. Preliminary analyses of 4 days of real-time passive acoustic recordings made using the Perennial Acoustic Observatory in
the Antarctic Ocean in December 2006. Results show different patterns of temporal variation in vocal activity of Weddell,
leopard, crabeater and Ross seals. Average number of calls per minute is based on 10 min counts for each hour
122
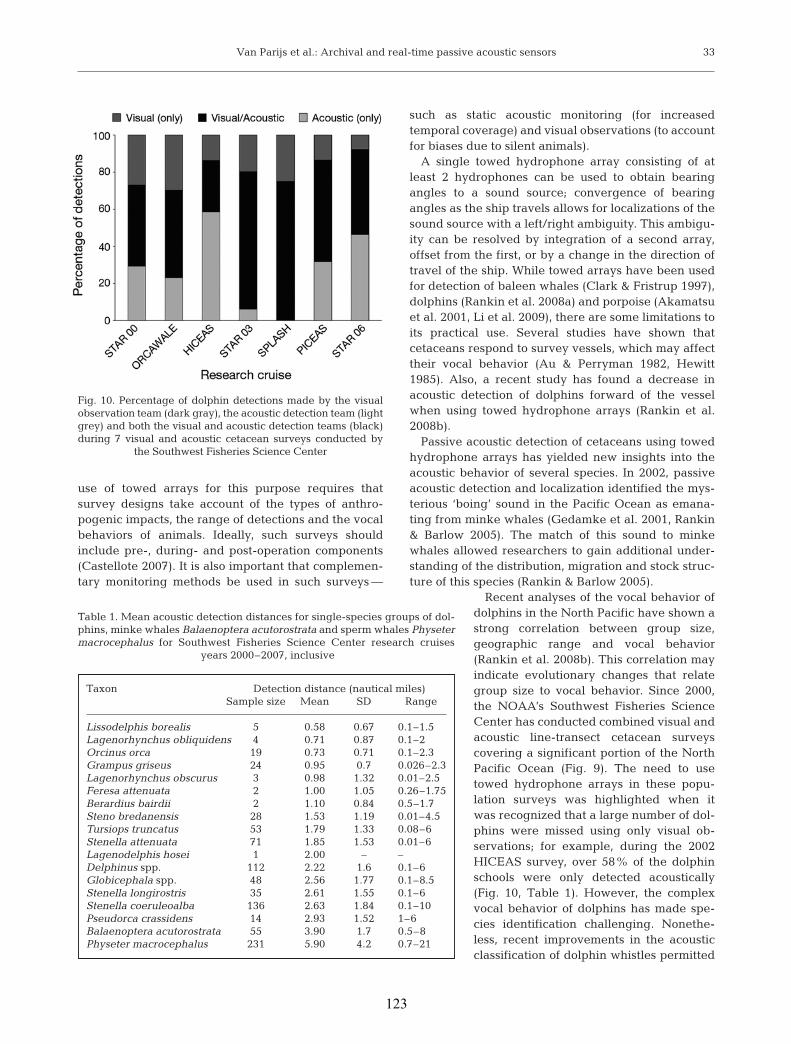
Van Parijs et al.: Archival and real-time passive acoustic sensors
use of towed arrays for this purpose requires that
survey designs take account of the types of anthro-
pogenic impacts, the range of detections and the vocal
behaviors of animals. Ideally, such surveys should
include pre-, during- and post-operation components
(Castellote 2007). It is also important that complemen-
tary monitoring methods be used in such surveys —
such as static acoustic monitoring (for increased
temporal coverage) and visual observations (to account
for biases due to silent animals).
A single towed hydrophone array consisting of at
least 2 hydrophones can be used to obtain bearing
angles to a sound source; convergence of bearing
angles as the ship travels allows for localizations of the
sound source with a left/right ambiguity. This ambigu-
ity can be resolved by integration of a second array,
offset from the first, or by a change in the direction of
travel of the ship. While towed arrays have been used
for detection of baleen whales (Clark & Fristrup 1997),
dolphins (Rankin et al. 2008a) and porpoise (Akamatsu
et al. 2001, Li et al. 2009), there are some limitations to
its practical use. Several studies have shown that
cetaceans respond to survey vessels, which may affect
their vocal behavior (Au & Perryman 1982, Hewitt
1985). Also, a recent study has found a decrease in
acoustic detection of dolphins forward of the vessel
when using towed hydrophone arrays (Rankin et al.
2008b).
Passive acoustic detection of cetaceans using towed
hydrophone arrays has yielded new insights into the
acoustic behavior of several species. In 2002, passive
acoustic detection and localization identified the mys-
terious ‘boing’ sound in the Pacific Ocean as emana-
ting from minke whales (Gedamke et al. 2001, Rankin
& Barlow 2005). The match of this sound to minke
whales allowed researchers to gain additional under-
standing of the distribution, migration and stock struc-
ture of this species (Rankin & Barlow 2005).
Recent analyses of the vocal behavior of
dolphins in the North Pacific have shown a
strong correlation between group size,
geographic range and vocal behavior
(Rankin et al. 2008b). This correlation may
indicate evolutionary changes that relate
group size to vocal behavior. Since 2000,
the NOAA’s Southwest Fisheries Science
Center has conducted combined visual and
acoustic line-transect cetacean surveys
covering a significant portion of the North
Pacific Ocean (Fig. 9). The need to use
towed hydrophone arrays in these popu-
lation surveys was highlighted when it
was recognized that a large number of dol-
phins were missed using only visual ob-
servations; for example, during the 2002
HICEAS survey, over 58% of the dolphin
schools were only detected acoustically
(Fig. 10, Table 1). However, the complex
vocal behavior of dolphins has made spe-
cies identification challenging. Nonethe-
less, recent improvements in the acoustic
classification of dolphin whistles permitted
33
Fig. 10. Percentage of dolphin detections made by the visual
observation team (dark gray), the acoustic detection team (light
grey) and both the visual and acoustic detection teams (black)
during 7 visual and acoustic cetacean surveys conducted by
the Southwest Fisheries Science Center
Table 1. Mean acoustic detection distances for single-species groups of dol-
phins, minke whales Balaenoptera acutorostrata and sperm whales Physeter
macrocephalus for Southwest Fisheries Science Center research cruises
years 2000–2007, inclusive
Taxon Detection distance (nautical miles)
Sample size Mean SD Range
Lissodelphis borealis 5 0.58 0.67 0.1–1.5
Lagenorhynchus obliquidens 4 0.71 0.87 0.1–2
Orcinus orca 19 0.73 0.71 0.1–2.3
Grampus griseus 24 0.95 0.7 0.026–2.3
Lagenorhynchus obscurus 3 0.98 1.32 0.01–2.5
Feresa attenuata 2 1.00 1.05 0.26–1.75
Berardius bairdii 2 1.10 0.84 0.5–1.7
Steno bredanensis 28 1.53 1.19 0.01–4.5
Tursiops truncatus 53 1.79 1.33 0.08–6
Stenella attenuata 71 1.85 1.53 0.01–6
Lagenodelphis hosei 1 2.00 – –
Delphinus spp. 112 2.22 1.6 0.1–6
Globicephala spp. 48 2.56 1.77 0.1–8.5
Stenella longirostris 35 2.61 1.55 0.1–6
Stenella coeruleoalba 136 2.63 1.84 0.1–10
Pseudorca crassidens 14 2.93 1.52 1–6
Balaenoptera acutorostrata 55 3.90 1.7 0.5–8
Physeter macrocephalus 231 5.90 4.2 0.7–21
123

Mar Ecol Prog Ser 395: 21–36, 2009
the acoustic detection and localization of false killer
whales Pseudorca crassidens during a recent survey
dedicated to this species (Barlow & Rankin 2007,
Oswald et al. 2007b). Future improvements in acoustic
species classification will allow for continued integra-
tion of towed hydrophone arrays in shipboard surveys.
Not all species are difficult to identify based on their
vocalizations. Because sperm whale vocalizations are
easily identifiable and accurate group size estimates
can also be obtained under most conditions, the use of
towed hydrophone arrays has improved the estimation
of total abundance for this species (Barlow & Taylor
2005). For species that are difficult to detect using tra-
ditional visual observation methods (such as minke
whales), passive acoustics may be the only reasonable
approach for population estimation (Rankin & Barlow
2005, Rankin et al. 2007b). Overall, the use of towed
hydrophone arrays combined with visual observations
has generated a large number of descriptions of vocal-
izations of various species which otherwise would not
have been possible (Oswald et al. 2007a, Rankin et al.
2007a).
OUTLOOK
Passive acoustic technologies have been revolution-
ized during the last decade, in terms of both hardware
and software. Archival and real-time passive acoustic
arrays are now among the lowest cost approaches for
mesoscale monitoring of marine areas and can be used
to monitor vocal marine life in areas difficult to survey
by traditional visual methods. Fixed autonomous pas-
sive acoustic arrays sample continuously for prolonged
periods of time, allowing assessment of seasonal
changes in distribution and acoustic behavior of indi-
viduals without introducing into the environment the
types of disturbances generated by the presence of
survey vessels or aircrafts. Unlike more traditional vi-
sual methods, passive acoustic technologies can survey
in darkness and remain active during adverse weather
conditions. Further, the ability to retrieve and redeploy
archival ARUs provides a level of flexibility in data ac-
quisition that is not available with other fixed long-
term monitoring systems. Units can be deployed for
short periods (days to weeks) or longer periods
(months to years) with variable sampling rates. Real-
time acoustic buoys, capable of relaying information
almost instantaneously to a wide range of stakehold-
ers, have recently shown their potential for enabling
responsive management and mitigation of marine ani-
mals at the mesoscale level. Although these techniques
have primarily been used with cetaceans, the potential
now exists for studying many other marine animals
such as pinnipeds, sirenians and fishes. However,
there are still major hardware and software hurdles to
overcome. Similarly, acoustic information can easily be
misleading and interpreted incorrectly. PAM is only re-
ally useful when taken in the context of the acoustic
behavioral ecology of the animals and applied in a re-
gional and seasonally appropriate context. In order to
improve PAM, more information is needed on individ-
ual, group, population and species sound level usage.
Acknowledgements. We thank B. Southall, D. Nowacek and
H. Browman for the insight and innovation which made this
theme section on passive acoustics possible. An immense
number of people contributed to making the case studies in
this manuscript happen. However, the hardware and software
that were predominately used in these case studies was
developed at the Bioacoustics Research Program at Cornell
University, without which passive acoustics would not be
what it is today. The hardware and software for the towed
array studies are the result of a collaborative effort between J.
Barlow, J. Oswald, D. K. Mellinger and S. Rankin. Funding for
these case studies was received from Abrolhos National
Marine Park, Animal Behavior Society, Brazilian Government
(CAPES PhD Fellowship to R.S.S.L.), Brazilian Navy, Canon
National Parks Science Scholars Program, Cornell University
Lab of Ornithology, European Union Marie Curie Postdoc-
toral, Instituto Baleia Jubarte, Petróleo Brasileiro S.A.
(PETROBRAS), Massachusetts Department of Marine Fish-
eries, NOAA National Marine Fisheries Service (NEFSC &
SEFSC), Norwegian National Research Council, Norwegian
Polar Institute, Ny- Alesund Large Scale Facility for Arctic
Environmental Research and University Studies on Svalbard,
US Navy and Alfred Wegener Institute for Polar and Marine
Research. We also thank the 3 reviewers who struggled
through a much rougher version of this manuscript and who
we hope will find the end result a significant improvement as
a result of their input.
LITERATURE CITED
Akamatsu T, Wang D, Wang K, Wei Z (2001) Comparison
between visual and passive acoustic detection of finless
porpoise in the Yangtze River, China. J Acoust Soc Am
109:1723–1727
Anderson PK, Barclay RMR (1995) Dugong acoustic signals:
physical characteristics, individual differences, and beha-
vioral correlates. J Mammal 76:1226–1237
Au D, Perryman W (1982) Movement and speed of dolphin
schools responding to an approaching ship. Fish Bull 80:
371–379
Barlow J, Gisiner R (2006) Mitigating, monitoring and assess-
ing the effects of anthropogenic sound on beaked whales.
J Cetacean Res Manag 7:239–249
Barlow J, Rankin S (2007) False killer whale abundance and
density: preliminary estimates for the PICEAS study area
south of Hawaii and new estimates for the US EEZ around
Hawaii. SWFSC Admin Report LJ-07–02
Barlow J, Taylor BL (2005) Estimates of sperm whale
abundance in the northeastern temperate Pacific from a
combined acoustic and visual survey. Mar Mamm Sci 21:
429–445
Barnes CR, Best MMR, Bornhold BD, Juniper SK, Pirenne B,
Phibbs P (2007) The NEPTUNE Project — a cabled ocean
observatory in the NE Pacific: overview, challenges and
scientific objectives for the installation and operation of
34
➤➤
➤
➤
124

Van Parijs et al.: Archival and real-time passive acoustic sensors
Stage I in Canadian waters. Symposium on Underwater
Technology and Workshop on Scientific Use of Submarine
Cables and Related Technologies, Tokyo, Japan. IEEE
Press, Piscataway, NJ
Bartsh SS, Johnston SD, Siniff DB (1992) Territorial behavior
and breeding frequency of male Weddell seals (Leptony-
chotes weddellii) in relation to age, size, and concentra-
tion of serum testosterone and cortisol. Can J Zool 70:
680–692
Boebel O, Kindermann L, Klinck H, Bornemann H and others
(2006) Real-time underwater sounds from the Southern
Ocean. Eos Trans Am Geophys Union 87:361–362
Brown MW, Allen JM, Kraus SD (1995) The designation of
seasonal right whale conservation zones in the waters of
Atlantic Canada. In: Shackell NL, Willison MJH (eds)
Marine protected areas and sustainable fisheries. Pro-
ceedings of a symposium on marine protected areas and
sustainable fisheries conducted at the Second Interna-
tional Conference on Science and the Management of Pro-
tected Areas. Science and Management of Protected
Areas Association, Wolfville, NS
Capet X, Mcwilliams JC, Mokemaker MJ, Shchepetkin AF
(2008) Mesoscale to submesoscale transition in the Cali-
fornia current system. Part I: flow structure, eddy flux, and
observational tests. J Phys Oceanogr 38:29–43
Casaretto L, Hawkins AD (2002) Spawning behaviour and the
acoustic repertoire of haddock. Bioacoustics 12:250–252
Castellote M (2007) General review of protocols and guidelines
for minimizing acoustic disturbance to marine mammals
from seismic surveys. J Int Wildl Law Policy 10:273–288
Clark CW, Fristrup KM (1997) Whales 95: a combined visual
and acoustic survey of blue and fin whales off southern
California. Rep Int Whaling Comm 47:583–600
Clark CW, Gillespie D, Nowacek DP, Parks SE (2007) Listen-
ing to their world: acoustics for monitoring and protecting
right whales in an urbanized ocean. In: Kraus SD, Rolland
RM (eds) The urban whale: North Atlantic right whales at
the crossroads. Harvard University Press, Cambridge,
MA, p 333–357
Colton JB Jr (1972) Temperature trends and the distribution of
groundfish in continental shelf waters, Nova Scotia to
Long Island. Fish Bull 70:637–658
Darling JD, Sousa-Lima RS (2005) Songs indicate interaction
between humpback whale (Megaptera novaeangliae)
populations in the Western and Eastern South Atlantic
Ocean. Mar Mamm Sci 21:557–566
Figueroa H (2006) Extensible BioAcoustic Tool (XBAT). Avail-
able at: http://xbat.org/home.html
Gannon DP (2008) Passive acoustic techniques in fisheries
science: a review and prospectus. Trans Am Fish Soc 137:
638–656
Gedamke J, Costa DP, Dunstan A (2001) Localization and
visual verification of a complex minke whale vocalization.
J Acoust Soc Am 109:3038–3047
Harcourt RG, Hindell MA, Waas JR (1998) Under ice move-
ments and territory use in free-ranging Weddell seals
during the breeding season. N Z Nat Sci 23:72–73
Harcourt RG, Hindell MA, Bell DG, Waas JR (2000) Three-
dimensional dive profiles of free-ranging Weddell seals.
Polar Biol 23:479–487
Harcourt RG, Kingston JJ, Waas JR, Hindell MA (2007) For-
aging while breeding: Alternative mating strategies by
male Weddell seals? Aquat Conserv 17:68–78
Hatch LT, Fristrup KM (2009) No barrier at the boundaries:
implementing regional frameworks for noise management
in protected natural areas. Mar Ecol Prog Ser 395:223–244
Hawkins AD, Amorim MCP (2000) Spawning sounds of male
haddock, Melanogrammus aeglefinus. Environ Biol Fishes
59:29–41
Hawkins AD, Chapman KJ, Symonds DJ (1967) Spawning of
haddock in captivity. Nature 215:923–925
Hewitt R (1985) Reactions of dolphins to a survey vessel:
effects on census data. Fish Bull 83:187–194
Insley SJ, Phillips AV, Charrier I (2003) A review of social
recognition in pinnipeds. Aquat Mamm 29:181–201
IWC (International Whaling Commission) (2001) Report of the
workshop on status and trends of western North Atlantic
right whales. J Cetacean Res Manag Spec Issue 2:1–87
Klinck H (2008) Automated detection, localization and identi-
fication of leopard seals. PhD thesis, University of Trier
Kraus SD, Hatch JJ (2001) Mating strategies in the North
Atlantic right whale (Eubalaena glacialis). J Cetacean Res
Manag Spec Issue 2:237–244
Kraus SD, Kenney RD (1991) Information on right whales
(Eubalaena glacialis) in three proposed critical habitats in
United States waters of the western North Atlantic Ocean.
Publication No. PB91–194431, National Technical Infor-
mation Services, Washington, DC
Kraus SD, Brown MW, Caswell H, Clark CW and others
(2005) North Atlantic right whales in crisis. Science 309:
561–562
Li S, Akamatsu T, Wang D, Wang A (2009) Localization and
tracking of phonating finless porpoises using towed stereo
acoustic data-loggers. J Acoust Soc Am 126:468–475
Luczkovich JJ, Sprague MW, Johnson SE, Pullinger RC (1999)
Delimiting spawning areas of weakfish, Cynoscion
regalis (Family Sciaenidae) in Pamlico Sound, North
Carolina using passive hydroacousticsurveys. Bioacous-
tics 10:143–160
Luczkovich J, Mann D, Rountree R (2008) Passive acoustics as
a tool in fisheries science. Trans Am Fish Soc 137:533–541
Mann DA, Lobel PS (1995) Passive acoustic detection of
sounds produced by the damselfish, Dascyllus albisella
(Pomacentridae). Bioacoustics 6:199–213
McCauley RD, Cato DH (2000) Patterns of fish calling in a
nearshore environment in the Great Barrier Reef. Philos
Trans R Soc Lond B 355:1289–1293
Mellinger DK, Clark CW (2006) MobySound: a reference
archive for studying automatic recognition of marine
mammal sounds. Appl Acoust 67:1226–1242
Mellinger DK, Stafford KM, Moore SE, Dziak RP, Matsumoto
H (2007) An overview of fixed passive acoustic observa-
tion methods for cetaceans. Oceanography 20:36–45
Moore SE, Stafford KM, Mellinger DK, Hildebrand JA (2006)
Listening for large whales in the offshore waters of
Alaska. BioScience 56:49–55
Noad MJ, Cato DH, Bryden MM, Jenner MN, Jenner KCS
(2000) Cultural revolution in whale songs. Nature 408:537
Orlanski I (1975) A rational subdivision of scales for atmos-
pheric processes. Bull Am Meteorol Soc 56:527–530
Oswald JN, Rankin S, Barlow J (2007a) First description of
whistles of Pacific Fraser’s dolphins Lagenodelphis hosei.
Bioacoustics 16:99–111
Oswald JN, Rankin S, Barlow J, Lammers MO (2007b) A tool
for real time acoustic species identification of delphinid
whistles. J Acoust Soc Am 122:587–595
Parks SE, Tyack PL (2005) Sound production by North
Atlantic right whales (Eubalaena glacialis) in surface
active groups. J Acoust Soc Am 117:3297–3306
Parks SE, Hamilton PK, Kraus SD, Tyack PL (2005) The
gunshot sound produced by male North Atlantic right
whales (Eubalaena glacialis) and its potential function in
reproductive advertisement. Mar Mamm Sci 21:458–475
Payne RS, McVay S (1971) Songs of humpback whales.
35
➤
➤
➤
➤
➤
➤➤
➤
➤
➤
➤➤
➤
➤➤
➤
➤
➤
➤
➤➤
➤➤
➤➤
➤
➤➤
➤
➤
125

Mar Ecol Prog Ser 395: 21–36, 2009
Science 173:585–597
Petitt R, Harris D, Wooding B, Bailey J and others (2002) The
Hawaii-2 Observatory. IEEE J Oceanic Eng 27:245–253
Potter JR, Thillet M, Douglas C, Chitre MA, Doborzynski Z,
Seekings PJ (2007) Visual and passive acoustic marine
mammal observations and high-frequency seismic source
characteristics recorded during a seismic survey. IEEE J
Oceanic Eng 32:469–483
Rankin S, Barlow J (2005) Source of the North Pacific ‘boing’
sound attributed to minke whales. J Acoust Soc Am 118:
3346–3351
Rankin S, Oswald JN, Barlow J, Lammers M (2007a) Patterned
burst-pulse vocalizations of the northern right whale
dolphin, Lissodelphis borealis. J Acoust Soc Am 121:
1213–1218
Rankin S, Norris TF, Smultea MA, Oedekoven C, Zoidis AM,
Silva E, Rivers J (2007b) A visual sighting and acoustic
detections of minke whales, Balaenoptera acutorostrata
(Cetacea: Balaenopteridae), in nearshore Hawaiian
waters. Pac Sci 61:395–398
Rankin S, Barlow J, Oswald J (2008a) An assessment of the
accuracy and precision of localization of a stationary
sound source using a 2-element towed hydrophone array.
NOAA Tech Memo NOAA-TM-NMFS-SWFSC-416
Rankin S, Oswald JN, Barlow J (2008b) Acoustic behavior of
dolphins in the Pacific Ocean: implications for using
passive acoustic methods for population studies. Can
Acoust 36:88–92
Redfern JV, Ferguson MC, Becker EA, Hyrenbach KD and
others (2006) Techniques for cetacean habitat modeling.
Mar Ecol Prog Ser 310:271–295
Reid JP, Rathbun GB, Wilcox JR (1991) Distribution patterns
of individually identifiable West Indian manatees (Trich-
echus manatus) in Florida. Mar Mamm Sci 7:180–190
Saucier MH, Baltz DM (1993) Spawning site selection by spot-
ted seatrout, Cynoscion nebulosus, and black drum, Pogo-
nias cromis, in Louisiana. Environ Biol Fishes 36:257–272
Silber GK, Bettridge S (2006) United States’ actions to reduce
the threat of ship collisions with north Atlantic right
whales. Paper IWC/58/CC8 presented at the IWC Scien-
tific Committee, St. Kitts
Simard Y, Bahoura M, Park CW, Rouat J and others (2006)
Development and experimentation of a satellite buoy net-
work for real-time acoustic localization of whales in the St.
Lawrence. Proc OCEANS ’06 MTS/IEEE Sep 18–21, 2009,
Boston, MA
Sousa-Lima RS (2007) Acoustic ecology of humpback whales
(Megaptera novaeangliae) in the Abrolhos National
Marine Park, Brazil. PhD dissertation, Cornell University,
Ithaca, NY
Sousa-Lima RS, Clark CW (2008) Modeling the effect of boat
traffic on singing activity of humpback whales (Megaptera
novaeangliae) in the Abrolhos National Marine Park,
Brazil. Can Acoust 36:174–181
Sousa-Lima RS, Clark CW (2009) Whale sound recording
technology as a tool for assessing the effects of boat noise
in a Brazilian Marine Park. Park Sci 26:59–63
Sousa-Lima RS, Paglia AP, da Fonseca GAB (2002a) Signature
information and individual recognition in the isolation
calls of Amazonian manatees, Trichechus inunguis (Mam-
malia: Sirenia). Anim Behav 63:301–310
Sousa-Lima RS, Morete ME, Fortes RC, Freitas AC, Engel MH
(2002b) Impact of boats on the vocal behavior of hump-
back whales off Brazil. J Acoust Soc Am 112:2430–2431
Sousa-Lima RS, Paglia AP, da Fonseca GAB (2008) Gender,
age, and identity in the isolation calls of Antillean mana-
tees (Trichechus manatus manatus). Aquat Mamm 34:
109–122
Thomas JA, DeMaster DP (1982) An acoustic technique for
determinig diurnal activities in leopard (Hydrurga lep-
tonyx) and crabeater (Lobodon carcinophagus) seal. Can J
Zool 60:2028–2031
Tyack PL (1981) Interactions between singing Hawaiian
humpback whales and conspecifics nearby. Behav Ecol
Sociobiol 8:105–166
Tyack PL (2000) Functional aspects of cetacean communica-
tion. In: Mann J, Connor RC, Tyack PL, Whitehead H (eds)
Cetacean societies: field studies of dolphins and whales.
University of Chicago Press, Chicago, IL, p 270–307
Urazghildiiev IR, Clark CW (2006) Acoustic detection of
North Atlantic right whale contact calls using the gene-
ralized likelihood ratio test. J Acoust Soc Am 120:
1956–1963
Vanderlaan ASM, Taggart CT (2007) Vessel collisions with
whales: the probability of lethal injury based on vessel
speed. Mar Mamm Sci 23:144–156
Van Opzeeland IC, Kindermann L, Boebel O, Van Parijs SM
(2008) Insights into the acoustic behaviour of polar pin-
nipeds: current knowledge and emerging techniques of
study. In Weber EA, Krause LH (eds) Animal behaviour:
new research. Nova Science Publishers, New York,
p 133–161
Van Parijs SM (2003) Aquatic mating in pinnipeds: a review.
Aquat Mamm 29:214–226
Van Parijs SM, Clark CW (2006) Long term mating tactics in
an aquatic mating pinniped: the bearded seal, Erignathus
barbatus. Anim Behav 72:1269–1277
Van Parijs SM, Janik VM, Thompson PM (2000) Display area
size, tenure length and site fidelity in the aquatically mat-
ing male harbour seal. Can J Zool 78:2209–2217
Van Parijs SM, Lydersen C, Kovacs KM (2003) Vocalizations
and movements suggest alternative mating tactics in male
bearded seals. Anim Behav 65:273–283
Van Parijs SM, Lydersen C, Kovacs KM (2004) The effects of
ice cover on the behaviour of aquatic mating male
bearded seals. Anim Behav 68:89–96
Wade P, Heide-Jørgensen M, Shelden K, Barlow J and others
(2006) Acoustic detection and satellite-tracking leads to
discovery of rare concentration of endangered North
Pacific right whales. Biol Lett 2:417–419
Ward-Geiger LI, Silber GK, Baumstark RD, Pulfer TL (2005)
Characterization of ship traffic in right whale critical habi-
tat. Coast Manag 33:263–278
Weinrich MT, Kenney RD, Hamilton PK (2000) Right whales
(Eubalaena glacialis) on Jeffreys Ledge: A habitat of
unrecognized importance? Mar Mamm Sci 16:326–337
Weir CR, Dolman SJ (2007) Comparative review of the
regional marine mammal mitigation guidelines imple-
mented during industrial seismic surveys, and guidance
towards a worldwide standard. J Int Wildl Law Policy 10:
1–27
Wiens JA (1989) Spatial scaling in ecology. Funct Ecol 3:
385–397
Winn HE, Winn LK (1978) The song of the humpback whale
Megaptera novaeangliae in the West Indies. Mar Biol 47:
97–114
36
Submitted: June 3, 2008; Accepted: May 21, 2009 Proofs received from author(s): July 28, 2009
➤
➤
➤➤
➤➤
➤
➤
➤
➤
➤
➤
➤
➤
➤➤
➤
➤
➤
➤
➤
➤
➤
➤
➤
➤
➤
126

Publication III
Acoustic ecology of Antarctic pinnipeds
127

MARINE ECOLOGY PROGRESS SERIES
Mar Ecol Prog Ser
Vol. 414: 267–291, 2010
doi: 10.3354/meps08683Published September 13
INTRODUCTION
In many species acoustic communication plays an
important role during the breeding season and serves
a function in male–male competition and/or mate
attraction (e.g. Ryan 1988, Heller & Von Helversen
2004, Catchpole & Slater 2008). Vocal repertoire size
during the breeding season varies considerably be-
tween species and is presumed to be primarily a prod-
uct of interspecific differences in factors that drive
sexual selection (e.g. Searcy & Andersson 1986, Read
& Weary 1992). In some species, the occurrence and
composition of the vocal repertoire varies over the
course of a breeding season, reflecting different stages
in the breeding cycle (e.g. Emerson 1992, Roy et al.
1995, Slabbekoorn 2004). For example, female
Bornean frog Rana blythi mating vocalizations occur
exclusively when females have mature eggs and are
involved in courtship (Emerson 1992, Roy et al. 1995).
Several species of birds possess 2 acoustically distinct
categories of song type that are specialized for use in
intersexual and intrasexual communication (e.g.
Staicer et al. 1996, Trillo & Vehrencamp 2005). In
banded wrens Thryothorus pleurostictus songs pro-
duced by males during the dawn chorus play a role
in aggressive male–male interactions, whereas songs
© Inter-Research 2010 · www.int-res.com*Email: [email protected]
Acoustic ecology of Antarctic pinnipeds
Ilse Van Opzeeland1,*, Sofie Van Parijs2, Horst Bornemann1, Stephan Frickenhaus1,
Lars Kindermann1, Holger Klinck3, Joachim Plötz1, Olaf Boebel1
1Alfred Wegener Institute for Polar and Marine Research, Am alten Hafen 26, 27568 Bremerhaven, Germany2Northeast Fisheries Science Center, NOAA, 166 Water Street, Woods Hole, Massachusetts 02543, USA
3Cooperative Institute for Marine Resources Studies, Oregon State University, Hatfield Marine Science Center,
2030 SE Marine Science Drive, Newport, Oregon 97365, USA
ABSTRACT: In aquatic-mating pinnipeds, acoustic communication plays an important role in male
competition and mate attraction. Vocal repertoire size and composition during the breeding season
varies between species and is presumed to be a product of interspecific differences in sexual selec-
tion. In this study, we examine seasonal and diel patterns in acoustic repertoire size, composition and
call activity of 4 Antarctic pinniped species: Weddell seal Leptonychotes weddellii, leopard seal
Hydrurga leptonyx, Ross seal Ommatophoca rossii and crabeater seal Lobodon carcinophaga. An
11 mo (Jan 2006 – Jan 2007, no recordings Jul and Nov 2006) near-continuous dataset was collected
from the Perennial Acoustic Observatory in the Antarctic Ocean (PALAOA) located on the Ekström
Iceshelf. The Weddell seal vocal repertoire consisted of 14 call types. Calls were present throughout
the year except in February (11 mo), while repertoire composition varied considerably between
months. The leopard seal vocal repertoire consisted of 7 call types. Calls were present between Octo-
ber and January (4 mo). All call types were used in a uniform manner throughout the entire call
period. The Ross seal vocal repertoire consisted of 5 call types. Ross seal vocalizations were present
from December until February (3 mo). Repertoire composition varied little between months. Crab-
eater seals produced one vocalization type, present from August to December (5 mo). Vocalizations
in these species are likely produced in a breeding context. Inter-specific differences in behavioral
ecology and interactions with abiotic and biotic environmental factors shape vocal behavior resulting
in each species filling its own acoustic ecological niche.
KEY WORDS: Weddell seal · Leptonychotes weddellii · Leopard seal · Hydrurga leptonyx · Ross seal ·
Ommatophoca rossii · Crabeater seal · Lobodon carcinophaga · Vocal repertoire · Vocal activity ·
Aquatic mating · Acoustic ecology
Resale or republication not permitted without written consent of the publisher
OPENPEN ACCESSCCESS
128

Mar Ecol Prog Ser 414: 267–291, 2010
used during the rest of the day differ in type and struc-
ture from the songs produced during the dawn chorus
and presumably function solely to advertise the pres-
ence and location of a male to a mate (Trillo & Vehren-
camp 2005).
In pinnipeds, the role of vocal behavior during the
breeding season differs between land-breeding and
aquatic-mating species. On land, the relative rarity of
areas suitable for pupping and haul-out leads to the
formation of dense female breeding aggregations,
which enables males to defend harems and compete
with other males for a place within the female breed-
ing group (e.g. Bartholomew 1970). All land-breeding
pinnipeds produce in-air vocalizations for the purpose
of mother–pup recognition and male–male competi-
tion (e.g. Fernández-Juricic et al. 1999, Insley et al.
2003, Tripovich et al. 2008).
In aquatic-mating pinnipeds, females are much more
dispersed during the breeding season, causing female
movements to be both spatially and temporally less
predictable (Van Parijs 2003). As a consequence,
females can be less efficiently monopolized by males
and therefore males must aim to attract females for
the purpose of mating (e.g. Stirling & Thomas 2003,
Harcourt et al. 2007). For those species of aquatic-
mating pinnipeds where data are available, males are
known to retain under water display areas using vocal
and dive displays which are thought to function in
male–male competition and/or male advertisement to
females (see Van Parijs 2003 for a review). In some spe-
cies, such as harp Pagophilus groenlandicus, Weddell
Leptonychotes weddellii and ringed seals Phoca his-
pida, females are also known to produce underwater
vocalizations (e.g. Kunnasranta et al. 1996, Serrano
2001, Oetelaar et al. 2003). However, in most aquatic-
mating pinniped species only males produce vocaliza-
tions associated with mating behavior (see Van Opzee-
land et al. 2008 for a review).
The underwater vocal repertoire of aquatic-mating
pinnipeds has been described for the majority of spe-
cies and varies considerably in size between species
(Stirling & Thomas 2003). In a comparative review,
Rogers (2003) examined the role of various behavioral
and ecological factors on the size of the acoustic reper-
toire in aquatic-mating seals. Several factors such as
the degree of sexual size dimorphism, stability of the
pupping substrate, breeding colony density and the
degree to which female distribution is predictable to
males were shown to influence the size of the vocal
repertoire. Based on the acoustic characteristics of the
calls, the repertoire size and the function of vocal
behavior, Rogers (2003) discriminates 3 groups of
vocalization strategies in aquatic-mating seals. (1) The
first group comprises hooded Cystophora cristata, grey
Halichoerus grypus and crabeater seals Lobodon car-
cinophaga. The repertoire of these species is small and
consists of short and broadband calls that are thought
to be produced by males and have a function in ago-
nistic interaction between males over relatively short
distances. (2) Bearded Erignathus barbatus, ribbon
Histriophoca fasciata, leopard Hydrurga leptonyx and
Ross seals Ommatophoca rossii use stereotyped nar-
rowband calls which are thought to function as signals
to rival males and/or potential mates over long dis-
tances. These species have a moderately sized vocal
repertoire. (3) The third group, consisting of harp, har-
bour Phoca vitulina, Weddell and ringed seals, has the
largest vocal repertoire of the 3 groups, consisting of
varied types of sounds that are thought to function in
short-range mate attraction and/or territory defense.
As underwater acoustic behavior is in most cases
assumed to have a dual function (i.e. male–male com-
petition and mate attraction; e.g. Van Parijs 2003), the
proportional usage of different call types could be
expected to vary on a seasonal or daily scale reflecting
different social contexts in which vocalizations are
used. In addition, annual recordings can provide
unique insights into how calling behavior is related to
other behavioral and ecological variables. Van Parijs et
al. (2004) showed that between-year fluctuations in ice
cover affect ‘territorial’ and ‘roaming’ male bearded
seals differently. Roaming males were not heard in
years with increased ice cover, whereas territorial
males were present during all ice conditions. In harp
seals, vocalizations differ structurally during different
parts of the year, suggesting that vocal behavior also
plays an important role outside the breeding season,
such as during herd migration (Serrano & Miller 2000).
Nevertheless, as many aquatic-mating pinnipeds are
ice-breeding species and occur at high latitudes,
acoustic measurements are often only possible during
restricted time periods (e.g. Thomas & DeMaster 1982,
Cleator et al. 1989). In addition, studies on polar spe-
cies that include recordings over multiple years are
rare because of the logistic difficulties and costs of
obtaining repeated recordings.
The PerenniAL Acoustic Observatory in the Antarc-
tic Ocean (PALAOA) is a stationary listening station at
70° 31’ S, 8° 13’ W (Fig. 1), on the Eckström Iceshelf
near the eastern Weddell Sea coast. The PALAOA sta-
tion is autonomous and allows continuous long-term
acquisition of acoustic data. Recordings contain vocal-
izations of 4 Antarctic pinniped species: Weddell, leo-
pard, Ross and crabeater seals. All 4 species differ sub-
stantially in their foraging and behavioral ecology as
well as the ice type used for breeding and haul-out.
Ecological differences between species as well as inter-
specific interactions might be reflected in acoustic
behavior. Information on the presence of a certain spe-
cies, mediated through their calls, might for example
268
129

Van Opzeeland et al.: Acoustic ecology of Antarctic pinnipeds
be used by and affect behavior of other seal species,
e.g. in the case of a predator–prey relationship such
as between leopard and crabeater seals.
As acoustic data are collected continuously, the
PALAOA data offer the unique opportunity to investi-
gate the calling behavior of these species to explore
how acoustic behavior relates to breeding behavior,
ecological variables and inter-specific interactions.
Improving our knowledge on the fundamental ecology
of Antarctic ice-breeding pinnipeds is vital as recent
studies have shown that the climate driven changes
and anthropogenic alteration of food webs are likely to
affect these species (e.g. Learmonth et al. 2006, Cotté
& Guinet 2007, Murphy et al. 2007). Long term acoustic
datasets, such as the PALAOA database, require the
use of automated detection and classification techni-
ques as manual analysis becomes too time-consuming.
However, elementary knowledge of the species-
specific vocal repertoire and temporal patterns of call
type usage is a fundamental requirement needed in
order to build a comprehensive understanding of the
acoustic behavioral ecology of the species in this area.
This study provides a baseline description of the
acoustic repertoire of all 4 ice-breeding
Antarctic pinniped species — Weddell,
Ross, leopard and crabeater seals —
using an 11 mo data set obtained from
the autonomous PALAOA station. Sea-
sonal and diel patterns in the acoustic
repertoire are examined from the per-
spective of multi-species call type vari-
ability on a monthly basis.
METHODS
Acoustic data. Underwater acoustic
recordings were obtained from the
autonomous PALAOA station. Record-
ings are made continuously year-round
with 2 hydrophones deployed under-
neath the 100 m thick floating Antarc-
tic ice shelf through boreholes spaced
300 m apart (Boebel et al. 2006, Klinck
2008). Water depth below the floating
ice shelf is approximately 160 m. Both
hydrophones are at a depth of 80 m
below the floating ice shelf. The setup
consists of a RESON TC4032 hydro-
phone (5 Hz to 120 kHz, sens. –170 dB
re 1 V µPa–1) connected to a RESON
VP2000 amplifier (30 dB gain) and
bandpass filter (10 Hz to 100 kHz), and
a RESON TC4033 hydrophone (1 Hz to
160 kHz, sens. –203 dB re 1 V µPa–1)
connected to 2 RESON VP2000 amplifiers and band-
pass filters. Both hydrophones are galvanically isolated
through a Behringer HD400 isolation transformer to
avoid picking up electromagnetic interference. The
signals are digitized at 48 kHz/16 bit and encoded to a
192 kbit s–1 MP3 stream by a BARIX Instreamer device.
The effective bandwidth of the recordings is 10 Hz to
15 kHz, dynamic range 60 dB to 150 dB re 1 µPa. This
stream is transmitted from PALAOA to the German
Antarctic Neumayer Station II (15 km) through wire-
less LAN. At Neumayer Station II, the stream is seg-
mented into MP3 files of 1 min duration and saved
locally. In addition, the audio is compressed to a
24 kbit s–1 OGG-Vorbis stream and transmitted in
near-real time from Neumayer to Bremerhaven (Ger-
many) via a 128 kbit s–1 satellite link, from where it is
made publicly accessible (www.awi.de/acoustics; see
also Kindermann et al. 2008). For this study only the
MP3 data were used.
Weddell, Ross, leopard and crabeater seals are
known to be present in this region. Every year Weddell
seals form breeding groups in austral spring on the
fast-ice in Atka Bay, near the PALAOA station (Plötz
269
Fig. 1. IKONOS-2 satellite image from March 2004, showing the locations of the
German Antarctic station Neumayer Base II and the PALAOA hydroacoustic ob-
servatory (70°31’S, 8°13’W). Inset image top right: Antarctica with the location of
Neumayer Base II (Q)
130
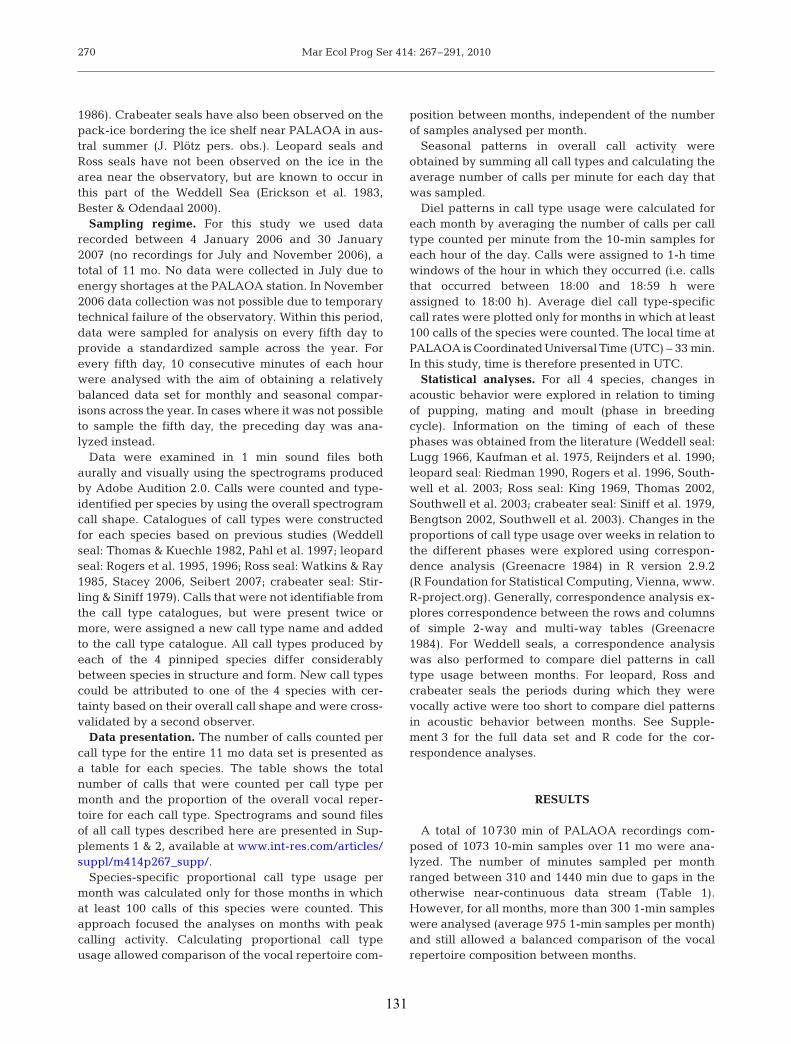
Mar Ecol Prog Ser 414: 267–291, 2010
1986). Crabeater seals have also been observed on the
pack-ice bordering the ice shelf near PALAOA in aus-
tral summer (J. Plötz pers. obs.). Leopard seals and
Ross seals have not been observed on the ice in the
area near the observatory, but are known to occur in
this part of the Weddell Sea (Erickson et al. 1983,
Bester & Odendaal 2000).
Sampling regime. For this study we used data
recorded between 4 January 2006 and 30 January
2007 (no recordings for July and November 2006), a
total of 11 mo. No data were collected in July due to
energy shortages at the PALAOA station. In November
2006 data collection was not possible due to temporary
technical failure of the observatory. Within this period,
data were sampled for analysis on every fifth day to
provide a standardized sample across the year. For
every fifth day, 10 consecutive minutes of each hour
were analysed with the aim of obtaining a relatively
balanced data set for monthly and seasonal compar-
isons across the year. In cases where it was not possible
to sample the fifth day, the preceding day was ana-
lyzed instead.
Data were examined in 1 min sound files both
aurally and visually using the spectrograms produced
by Adobe Audition 2.0. Calls were counted and type-
identified per species by using the overall spectrogram
call shape. Catalogues of call types were constructed
for each species based on previous studies (Weddell
seal: Thomas & Kuechle 1982, Pahl et al. 1997; leopard
seal: Rogers et al. 1995, 1996; Ross seal: Watkins & Ray
1985, Stacey 2006, Seibert 2007; crabeater seal: Stir-
ling & Siniff 1979). Calls that were not identifiable from
the call type catalogues, but were present twice or
more, were assigned a new call type name and added
to the call type catalogue. All call types produced by
each of the 4 pinniped species differ considerably
between species in structure and form. New call types
could be attributed to one of the 4 species with cer-
tainty based on their overall call shape and were cross-
validated by a second observer.
Data presentation. The number of calls counted per
call type for the entire 11 mo data set is presented as
a table for each species. The table shows the total
number of calls that were counted per call type per
month and the proportion of the overall vocal reper-
toire for each call type. Spectrograms and sound files
of all call types described here are presented in Sup-
plements 1 & 2, available at www.int-res.com/articles/
suppl/m414p267_supp/.
Species-specific proportional call type usage per
month was calculated only for those months in which
at least 100 calls of this species were counted. This
approach focused the analyses on months with peak
calling activity. Calculating proportional call type
usage allowed comparison of the vocal repertoire com-
position between months, independent of the number
of samples analysed per month.
Seasonal patterns in overall call activity were
obtained by summing all call types and calculating the
average number of calls per minute for each day that
was sampled.
Diel patterns in call type usage were calculated for
each month by averaging the number of calls per call
type counted per minute from the 10-min samples for
each hour of the day. Calls were assigned to 1-h time
windows of the hour in which they occurred (i.e. calls
that occurred between 18:00 and 18:59 h were
assigned to 18:00 h). Average diel call type-specific
call rates were plotted only for months in which at least
100 calls of the species were counted. The local time at
PALAOA is Coordinated Universal Time (UTC) – 33 min.
In this study, time is therefore presented in UTC.
Statistical analyses. For all 4 species, changes in
acoustic behavior were explored in relation to timing
of pupping, mating and moult (phase in breeding
cycle). Information on the timing of each of these
phases was obtained from the literature (Weddell seal:
Lugg 1966, Kaufman et al. 1975, Reijnders et al. 1990;
leopard seal: Riedman 1990, Rogers et al. 1996, South-
well et al. 2003; Ross seal: King 1969, Thomas 2002,
Southwell et al. 2003; crabeater seal: Siniff et al. 1979,
Bengtson 2002, Southwell et al. 2003). Changes in the
proportions of call type usage over weeks in relation to
the different phases were explored using correspon-
dence analysis (Greenacre 1984) in R version 2.9.2
(R Foundation for Statistical Computing, Vienna, www.
R-project.org). Generally, correspondence analysis ex-
plores correspondence between the rows and columns
of simple 2-way and multi-way tables (Greenacre
1984). For Weddell seals, a correspondence analysis
was also performed to compare diel patterns in call
type usage between months. For leopard, Ross and
crabeater seals the periods during which they were
vocally active were too short to compare diel patterns
in acoustic behavior between months. See Supple-
ment 3 for the full data set and R code for the cor-
respondence analyses.
RESULTS
A total of 10730 min of PALAOA recordings com-
posed of 1073 10-min samples over 11 mo were ana-
lyzed. The number of minutes sampled per month
ranged between 310 and 1440 min due to gaps in the
otherwise near-continuous data stream (Table 1).
However, for all months, more than 300 1-min samples
were analysed (average 975 1-min samples per month)
and still allowed a balanced comparison of the vocal
repertoire composition between months.
270
131

Van Opzeeland et al.: Acoustic ecology of Antarctic pinnipeds
Overall call activity
Weddell seal call activity increased gradually from
March to June showing a peak on 1 June 2006 (15 calls
min–1, Fig. 2). Over all days on which Weddell seal
vocalizations were present and data was available, the
average call rate was 5 ± 4.27 calls min–1 (mean ± aver-
age deviation) per minute. Leopard seal call activity
showed a peak on 16 December 2006 (9 calls min–1)
and decreased again towards January 2007. The aver-
age call activity over all days that leopard seal calls
were present is 3 ± 3.13 calls min–1. Ross seal call activ-
ity increased sharply within the first part of January in
both years to a peak on 10 January 2007 (35 calls
min–1). Average call activity over all days that Ross seal
calls were present over January 2006, December 2006
and January 2007 was 11 ± 8.36 calls min–1. Crabeater
call activity showed a peak on 18 October 2006 (4 calls
min–1) and averaged 1 ± 1.00 calls min–1 over all days
that crabeater vocalizations were present from August
to December 2006. Data from November 2007 from
Klinck et al. (2010) show that crabeater call activity is
highest during the first half of November, with a peak
of 6.5 calls min–1 on 4 November 2007.
Peaks in Weddell, leopard and Ross call activity
showed a typical sequential pattern; decreased Wed-
dell seal vocal activity was followed by an increase in
leopard seal vocal activity and decreased leopard seal
vocal activity was followed by an increase in Ross seal
vocal activity. While the sequential pattern seemed
present in both January 2006 and 2007, Weddell, leop-
ard and Ross seal call activity was higher in January
2007, compared to call activity in January 2006.
Overall call repertoire
Weddell seals
For the Weddell seal a total of 41 421 calls was
counted over the study period. The vocal repertoire
consisted of 14 different call types (Fig. S1 in Supple-
ment 1, Table 1). Over the study period, 6 call types
(W1, W2, W5, W6, W8, W13) each contributed more
than 10% to the total number of Weddell seal calls,
while the other 8 call types (W3, W4, W7, W9, W10,
W11, W12, W14) occurred less frequently, ranging
between 0.3 to 5% of the total number of calls.
Call type W4 has not been described previously,
whereas the other call types have been described in
numerous previous studies (Thomas & Kuechle 1982,
Pahl et al. 1997, Moors & Terhune 2004, Terhune
& Dell’Apa 2006). Call type W4 was associated with
Weddell seals based on its acoustic similarity to call
type W2 and W3 and similar pattern of occurrence.
Leopard seals
A total of 13 687 calls was counted for leopard seals.
The leopard seal vocal repertoire consisted of 7 differ-
ent call types (Fig. S2 in Supplement 1, Table 2). Call
type L6 contributed more than 60% to the total number
of calls. The other call types occurred less frequently,
ranging between 3 and 10% of the total number of
calls. All leopard seal call types recorded by PALAOA
have been described previously (Stirling & Siniff 1979,
Rogers et al. 1995, 1996). Stirling & Siniff (1979) and
271
Call Description Pro-
type portion of
all calls (%)
W1 Trill 3 0 3 146 1500 608 574 1329 2042 1949 12 8166 20
W2 Falling chirps long 4 0 2 171 888 397 463 909 1321 1054 30 5239 13
W3 Falling chirps short 1 0 5 88 437 133 148 302 395 122 11 1642 4
W4 High-high-low sequence 0 0 0 56 287 72 54 183 113 2 3 770 2
W5 Single chirp high 1 0 0 176 1356 373 519 999 1062 614 6 5133 12
W6 Single chirp low 0 0 0 84 899 417 417 927 1561 1205 4 5514 13
W7 Chirp sequence 0 0 0 30 528 169 82 223 214 48 6 1300 3
W8 Oomp 0 0 0 0 43 162 751 1480 1765 658 0 5247 13
W9 Falling tone 0 0 0 80 516 110 152 182 273 36 13 1362 3
W10 Falling tone short 0 0 2 43 396 104 27 386 580 331 0 2059 5
W11 Rising tone 0 0 0 16 51 24 18 60 85 11 2 267 1
W12 Flat tone 0 0 0 9 41 25 11 11 22 19 0 138 0.3
W13 Warble 0 0 0 115 974 500 515 620 931 614 1 4270 10
W14 Pulse sequence 0 0 0 0 77 14 11 36 36 109 0 314 1
All calls 9 0 12 1014 8381 3108 3932 7647 10431 6799 88 41421 100
Table 1. Leptonychotes weddellii. Total number of Weddell seal calls per call type (W1–W14 with phonetic description) counted
per month between January 2006 and January 2007. n = number of 1-min samples obtained
Jan
06(n
= 1
020)
Feb
06(n
= 3
40)
Mar
06
(n =
136
0)A
pr 0
6(n
= 1
050)
May
06
(n =
124
0)Ju
n 06
(n =
310
)A
ug 0
6(n
= 3
50)
Sep
06(n
= 8
40)
Oct
06
(n =
134
0)D
ec 0
6(n
= 1
440)
Jan
07(n
= 1
440)
Tot
al(n
= 1
0730
)
132
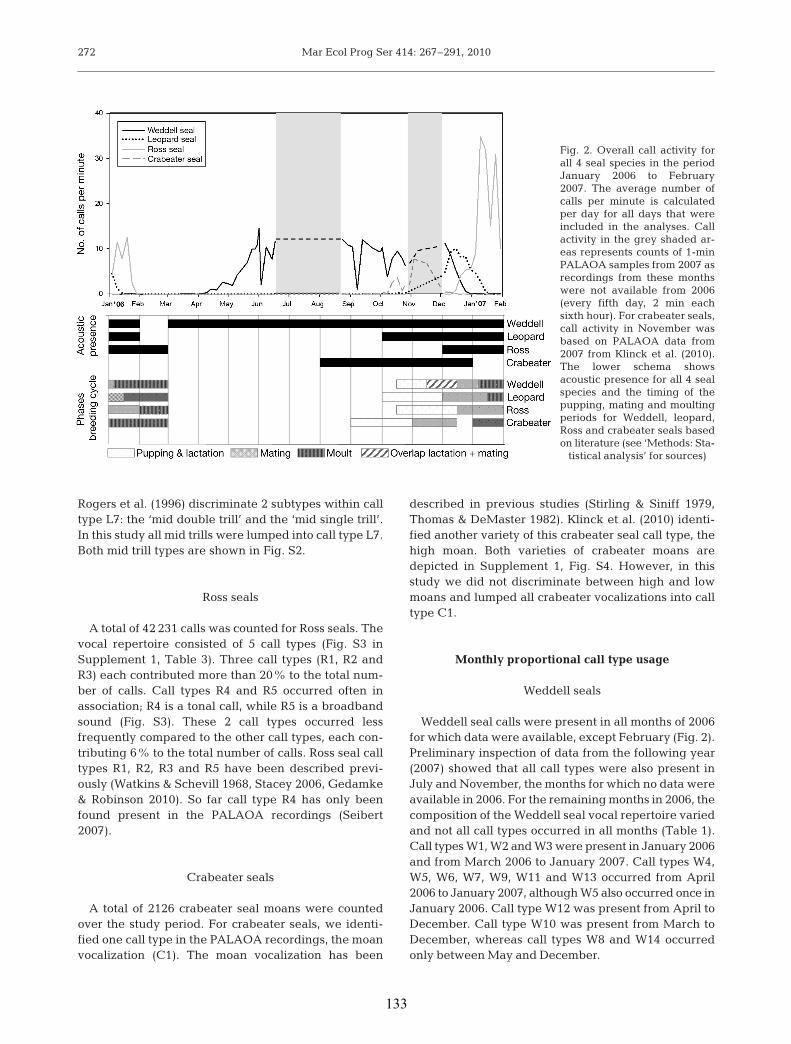
Mar Ecol Prog Ser 414: 267–291, 2010
Rogers et al. (1996) discriminate 2 subtypes within call
type L7: the ‘mid double trill’ and the ‘mid single trill’.
In this study all mid trills were lumped into call type L7.
Both mid trill types are shown in Fig. S2.
Ross seals
A total of 42 231 calls was counted for Ross seals. The
vocal repertoire consisted of 5 call types (Fig. S3 in
Supplement 1, Table 3). Three call types (R1, R2 and
R3) each contributed more than 20% to the total num-
ber of calls. Call types R4 and R5 occurred often in
association; R4 is a tonal call, while R5 is a broadband
sound (Fig. S3). These 2 call types occurred less
frequently compared to the other call types, each con-
tributing 6% to the total number of calls. Ross seal call
types R1, R2, R3 and R5 have been described previ-
ously (Watkins & Schevill 1968, Stacey 2006, Gedamke
& Robinson 2010). So far call type R4 has only been
found present in the PALAOA recordings (Seibert
2007).
Crabeater seals
A total of 2126 crabeater seal moans were counted
over the study period. For crabeater seals, we identi-
fied one call type in the PALAOA recordings, the moan
vocalization (C1). The moan vocalization has been
described in previous studies (Stirling & Siniff 1979,
Thomas & DeMaster 1982). Klinck et al. (2010) identi-
fied another variety of this crabeater seal call type, the
high moan. Both varieties of crabeater moans are
depicted in Supplement 1, Fig. S4. However, in this
study we did not discriminate between high and low
moans and lumped all crabeater vocalizations into call
type C1.
Monthly proportional call type usage
Weddell seals
Weddell seal calls were present in all months of 2006
for which data were available, except February (Fig. 2).
Preliminary inspection of data from the following year
(2007) showed that all call types were also present in
July and November, the months for which no data were
available in 2006. For the remaining months in 2006, the
composition of the Weddell seal vocal repertoire varied
and not all call types occurred in all months (Table 1).
Call types W1, W2 and W3 were present in January 2006
and from March 2006 to January 2007. Call types W4,
W5, W6, W7, W9, W11 and W13 occurred from April
2006 to January 2007, although W5 also occurred once in
January 2006. Call type W12 was present from April to
December. Call type W10 was present from March to
December, whereas call types W8 and W14 occurred
only between May and December.
272
Fig. 2. Overall call activity for
all 4 seal species in the period
January 2006 to February
2007. The average number of
calls per minute is calculated
per day for all days that were
included in the analyses. Call
activity in the grey shaded ar-
eas represents counts of 1-min
PALAOA samples from 2007 as
recordings from these months
were not available from 2006
(every fifth day, 2 min each
sixth hour). For crabeater seals,
call activity in November was
based on PALAOA data from
2007 from Klinck et al. (2010).
The lower schema shows
acoustic presence for all 4 seal
species and the timing of the
pupping, mating and moulting
periods for Weddell, leopard,
Ross and crabeater seals based
on literature (see ‘Methods: Sta-
tistical analysis’ for sources)
133

Van Opzeeland et al.: Acoustic ecology of Antarctic pinnipeds
Proportional call type usage per month was calcu-
lated from April to December (Fig. 3). In April, call
types W2 and W5 formed the largest part of the vocal
repertoire, followed by W1 and W13. In May and June
W1 was the most predominant call type, followed by
W5 and W13, respectively. W8 was the most predomi-
nant call type in August and September, followed by
W1 in both months. In October and December, propor-
tional usage was highest for call type W1, followed by
W8 and W6, respectively.
When the proportional composition of the repertoire
was compared between months, the proportional usage
of call types W1, W7, W10, W11, W12 and W14 was rel-
atively constant from April to December. Proportional
usage of call types W2 and W3 decreased towards De-
cember, although the proportional usage of call type W2
increased again to 16% in December. Call types W4, W5
and W9 decreased in proportional usage from April to
December. W13 showed a gradual decrease in propor-
tional usage from June towards the pupping and mating
period (October to December), whereas the proportional
usage of W6 increased towards December. W8 showed a
gradual increase in usage towards a peak in September
(19%), after which proportional usage decreased again.
Furthermore, call types W4, W6, W7, W9, W11, and W13
were present in the recordings from January 2007,
whereas these call types were not present in the January
2006 recordings (Table 1).
Fig. 4a shows the dissimilarity of Weddell seal reper-
toire composition based on a correspondence analysis
of weekly call-type profiles. Call types W14 and W8
were clearly separated from the rest. The ordination in
weeks (Fig. 4b) shows 3 groups of consecutive weeks
(ellipses): winter (Weeks 16 to 24, W), spring (Weeks 34
to 43, Sp), and beginning of summer (S). In addition,
the weekly call repertoire composition was separated
through correspondence analysis according to the dif-
ferent phases, showing similarity in call repertoire
composition between the mating phase (Ma) and the
Lactation and Mating phase (LM) (Fig. 5a). Repertoire
composition during the moult phase (Mo) was sepa-
rated by the first discriminant axis, while Ma and LM
were separated by the second discriminant axis (y-
axis). The contribution of the call types (Fig. 5b)
showed that call type W14 characterized the Ma and
LM period, whereas Mo was characterized by an
increased usage of W11 and reduction in usage of call
type W12.
273
Call Description Pro-
type portion of
all calls (%)
L1 Low ascending trill 27 0 0 0 0 0 0 0 1 601 54 683 5
L2 Low descending trill 38 0 0 0 0 0 0 0 3 587 84 712 5
L3 High double trill 39 0 0 0 0 0 0 0 5 1004 118 1166 9
L4 Hoot 19 0 0 0 0 0 0 0 0 360 35 414 3
L5 Hoot single trill 47 0 0 0 0 0 0 0 7 1253 129 1436 10
L6 Low double trill 425 0 0 0 0 0 0 0 64 6578 1420 8487 62
L7 Mid trill 31 0 0 0 0 0 0 0 6 692 60 789 6
All calls 626 0 0 0 0 0 0 0 86 11075 1900 13687 100
Table 2. Hydrurga leptonyx. Total number of leopard seal calls per call type (L1–L7) counted per month between January 2006 and
January 2007. n = number of 1-min samples obtained
Call Description Pro-
type portion of
all calls (%)
R1 High siren call 2149 7 0 0 0 0 0 0 0 564 9001 11721 28
R2 Mid siren call 1539 0 0 0 0 0 0 0 0 833 6477 8849 21
R3 Low siren call 2060 0 0 0 0 0 0 0 0 2259 12479 16798 40
R4 Tonal element 634 0 0 0 0 0 0 0 0 25 1692 2351 6
R5 Broadband 520 0 0 0 0 0 0 0 0 73 1919 2512 6
element
All calls 6902 7 0 0 0 0 0 0 0 3754 31568 42231 100
Table 3. Ommatophoca rossi. Total number of Ross seal calls per call type (R1–R5) counted per month between January 2006
and January 2007. n = number of 1-min samples obtained
Jan
06(n
= 1
020)
Feb
06(n
= 3
40)
Mar
06
(n =
136
0)A
pr 0
6(n
= 1
050)
May
06
(n =
124
0)Ju
n 06
(n =
310
)A
ug 0
6(n
= 3
50)
Sep
06(n
= 8
40)
Oct
06
(n =
134
0)D
ec 0
6(n
= 1
440)
Jan
07(n
= 1
440)
Tot
al(n
= 1
0730
)
Jan
06(n
= 1
020)
Feb
06(n
= 3
40)
Mar
06
(n =
136
0)A
pr 0
6(n
= 1
050)
May
06
(n =
124
0)Ju
n 06
(n =
310
)A
ug 0
6(n
= 3
50)
Sep
06(n
= 8
40)
Oct
06
(n =
134
0)D
ec 0
6(n
= 1
440)
Jan
07(n
= 1
440)
Tot
al(n
= 1
0730
)
134

Mar Ecol Prog Ser 414: 267–291, 2010
Leopard seals
Leopard seal calls occur between October and Janu-
ary (Table 2). Preliminary inspection of PALAOA data
from the following year showed that all leopard seal
call types were present in November 2007, which was
the month for which no data were available in 2006.
Call types L1, L2, L3, L5, L6 and L7 occurred from
October to January, whereas L4 occurred in January
and December, but did not occur in October. Pro-
portional call type usage per month was calculated
for January 2006, December 2006 and January 2007
(Fig. 6). Call type L6 was the most predominant call
type in all 3 months. The proportional composition of
the repertoire was relatively similar between Decem-
ber and January and did not differ largely between
January 2006 and January 2007.
The correspondence analysis showed that leopard
seal call repertoire composition differed between the
pupping and lactation phase (PL) and moult phase
(Mo) and were separated on the second discriminant
axis (y-axis, Fig. S5a in Supplement 4). PL and Mo
were characterized by a decrease in usage of call type
L2 and L4, respectively (Fig. S5b).
Ross seals
Ross seal calls occurred between December and
February (Table 3). The first Ross seal calls were
recorded on December 16, 2006. Preliminary inspec-
tion of PALAOA data from the following year showed
that no Ross seal calls were present in November 2007
(Seibert 2007), suggesting that Ross seal vocal activity
274
Fig. 3. Leptonychotes weddellii. Weddell seal pro-
portional call type (W1–W14) usage per month for
months in which at least 100 Weddell seal calls
were recorded
135

Van Opzeeland et al.: Acoustic ecology of Antarctic pinnipeds
starts in December. Of all call types, only R1 occurred
in February. Proportional call type usage per month
was calculated for January 2006, December 2006 and
January 2007 (Fig. 7). Call type R1 was the most pre-
dominant call type in January 2006, followed by call
type R3. In December 2006 and January 2007, call type
R3 had the highest proportional usage, followed by R2
and R1, respectively. Call types R4 and R5 occurred in
similar, relatively small proportions (<10%) and were
used most often in January. All call types showed a
similar pattern in proportional usage in January 2006
and 2007, although call type R3 formed a larger part of
the vocal repertoire in January 2007 compared to Jan-
uary 2006.
Ross seal calls were only recorded during the mating
phase and therefore discrimination of call repertoire
composition according to phase was not possible. The
correspondence analysis showed that call repertoire
composition varied little over the period that Ross
seal calls were recorded (Fig. S6a in Supplement 4).
The structure of call type usage showed that the
first week during which Ross seal calls were recorded
was characterized by increased usage of call type R3
(Fig. S6b).
Crabeater seals
Crabeater seal C1 calls were present between
August and December 2006 (Fig. 2). Data from the
following year showed that crabeater calls were also
present and that call activity actually peaked in No-
275
Fig. 4. 2D-Correspondence analysis call-type counts per week for Weddell seals. (a) Mapping of call-types, showing W8 and W14
as distinct from the rest. (b) Ordination of the weeks (format WW YYMM). Clusters of consecutive weeks are visualized by ellipses,
corresponding to the seasons (W: winter; Sp: spring; S: summer)
Fig. 5. Discriminating correspon-
dence analysis of Weddell seal
call-type profiles by weeks. (a)
Plot of first 2 discriminant scores,
with groups captured in ellipses.
Mo: Moult; Ma: mating; LM: over-
lap of lactation and mating; PL:
pupping and lactation; O: other
weeks. (b) Plot of structure of call
types: call type W14 dominates
separation on the second discrim-
inant (y-axis); call type W12 dom-
inates the separation on the first
discriminant (x-axis)
136

Mar Ecol Prog Ser 414: 267–291, 2010
vember 2007. For 2006, the number of calls recorded
by PALAOA was highest in October (Fig. 8).
Diel patterns in call type usage
Weddell seal
To determine the Weddell seal diel pattern in call
type usage, only call types that contributed more than
10% to the vocal repertoire were used (Call types W1,
W2, W5, W6, W8 and W13). This approach excludes all
call types that were rarely used when call type usage is
compared on a diel scale. For all call types, the average
number of calls per hour in April 2006 showed little
variation over the day, with only a small peak occur-
ring around 18:00 h UTC (Fig. 9a). In May, W1 was the
most predominant call type. Overall the number of
calls was highest around 7:00 and 16:00 h UTC, where-
as there was only little calling activity between 10:00
and 14:00 h UTC. Due to a temporary energy shortage
at the PALAOA station, no data were collected
between 7:00 and 11:00, between 18:00 and 20:00 and
between 22:00 and 23:00 h UTC in June 2006. Despite
these gaps, the diel calling pattern in June resembled
the 2-peak pattern in May 2006, but with call type W1
showing a sharp peak of 2 ± 0.64 calls min–1 (mean ±
average deviation) around 16:00 h UTC. In August and
September 2006 W8 was the most predominant call
type, with an average of 2 ± 0.77 and 2 ± 0.45 calls
min–1 h–1 respectively. In August, the overall Weddell
seal call activity showed peaks between 4:00 and
7:00 h UTC and 18:00 and 20:00 h UTC. In September
the bimodal pattern in vocal activity was still visible
(Fig. 9b). In October and December 2006 W1 was the
most frequent call type, with an average of 2 ± 0.21 and
1 ± 0.22 calls min–1 h–1 respectively. In these 2 months,
the average number of calls min–1 h–1 showed little
variation over the day. When Weddell seal call usage
patterns were compared for single days within each
month, these generally reflected the average monthly
pattern.
The biphasic pattern in Weddell seal diel call activity
in May (Fig. 9a) can be partly resolved by a correspon-
dence analysis. Fig. 10a shows the dissimilarity of W5,
W8 and W9 from the other call types. The ordination of
hours is shown in Fig. 10b and allows identification of
the quiet phase between 10:00 and 12:00 h (first dis-
criminant axis, x-axis). Vocal repertoire composition
during the remaining time is grouped in 2 periods:
morning+afternoon (upper part, 05:00 to 18:00 h) and
evening+night (lower part, 19:00 to 04:00 h).
Leopard seal
Fig. 11 shows the diel calling pattern in January
2006, with 2 distinct peaks in L6 calling activity around
276
Fig. 6. Hydrurga leptonyx. Leopard seal proportional call type (L1–L7) usage per month for months during which at least 100
leopard seal calls were recorded
Fig. 7. Ommatophoca rossi. Ross seal proportional call type (R1–R5) usage per month for months in which at least 100 Ross seal
calls were recorded
137

Van Opzeeland et al.: Acoustic ecology of Antarctic pinnipeds
8:00 (1 ± 0.98 calls min–1, mean ± average deviation)
and 20:00 h UTC (1 ± 1.13 calls min–1). The call rates of
the other call types also increased slightly during these
hours, however, call rates were much lower compared
to call type L6. In December, the number of L6 calls
increased to 5 ± 0.33 calls min–1 h–1 and remained con-
stant throughout the day. Call rates of the other call
types also increased compared to January 2006 and
2007 and remained fairly constant throughout the day,
ranging from 0.3 to 0.9 calls min–1 h–1. The average
number of L6 calls was 1 ± 0.25 calls min–1 h–1 in Janu-
ary 2007, and 0.4 ± 0.22 calls min–1 h–1 in January 2006.
In contrast to the 2-peak pattern in call activity in Jan-
uary 2006, calling activity showed a 1-peak pattern in
January 2007 with the peak occurring around mid-
night. Leopard seal call usage for single days within
277
Fig. 8. Lobodon carcinophaga. Number of crabeater seal calls
(type C1) recorded for all months in which crabeater calls
were recorded, August to December 2006
Fig. 9. Leptonychotes weddellii. Diel pattern of Weddell seal
call type usage for call types W1, W2, W5, W6, W8, W13
for months in which at least 100 Weddell seal calls were
recorded. Grey areas indicate discontinuities in the data
stream. Time is presented in Coordinated Universal Time
(UTC); local time at PALAOA is UTC – 33 min
138

Mar Ecol Prog Ser 414: 267–291, 2010
each month showed relatively comparable patterns and
reflected the monthly average patterns in call type
usage and activity.
Ross seal
The diel calling pattern in January 2006 shows an
increase in the number of calls for all call types
between 12:00 and 19:00 h UTC (Fig. 12). R1 was the
predominant call type in January 2006, with 2 ± 0.82
(mean ± average deviation) R1 calls min–1 h–1 in that
month. In December, call rates increased during the
second half of the day, with R3 being the most domi-
nant call type in that month (2 ± 0.69 calls min–1 h–1). In
January 2007, R3 was also the predominant call type
(9 ± 0.97 calls min–1 h–1). Overall call rates in January
2007 were higher compared to January 2006 (7 ± 1.84
and 22 ± 2.28 calls min–1 h–1 for January 2006 and 2007
respectively). In January 2007, call rates were rela-
tively constant over the day, with a short period of
decreased call activity around 6:00 h UTC. However,
when Ross seal call activity was compared between
single days within a month, patterns in call activity
varied considerably between days in January 2006 and
January 2007. In addition, call types R1 and R3 were
the most predominant call types when single days in
January 2006 and January 2007 were compared
(Fig. 13). In December the pattern in Ross seal call
activity showed a more consistent pattern when single
days were compared, with a period of low call activity
occurring between 00:00 and 9:00 h UTC. Call type R3
was the most predominant call type on all days in
December.
Crabeater seal
In October 2006, crabeater seal calling activity
increased sharply between 16:00 and 19:00 h UTC and
remained around 4 calls min–1 h–1 until 23:00 h UTC
(Fig. 14). The average number of calls in October was
1 ± 0.94 (mean ± average deviation) calls min–1 h–1.
Fig. 12b shows considerable variability in the call
activity pattern when comparing 2 separate days in
October. In December 2006, the average number of
calls in December was 0.1 ± 0.1 calls min–1 h–1. The diel
calling pattern showed 2 small peaks; one around
02:00 and one around 20:00 h UTC. This pattern is con-
sistent with the pattern observed for separated days in
December (Fig. 15).
DISCUSSION
The results of this study show that Weddell, leop-
ard, Ross and crabeater seals exhibit substantial inter-
specific variation in acoustic behavior, i.e. in temporal
patterns of vocal activity, vocal repertoire size and
composition. Variation in acoustic behavior can reflect
inter-specific differences in the acoustic ecology of the
species, the relationship between the organism and
the environment mediated through sound. In analogy
to ecology, each species might be thought of as filling
its own acoustic ecological niche, shaped by internal
and external factors and interactions between both
(Fig. 16; Van Opzeeland 2010). Vocalizations are pro-
duced in a breeding context and consequently differ-
ences in behavioral ecology between species, such as
distribution and mating system, are likely to shape
278
Fig. 10. 2D-correspondence analysis of hourly call-type counts of Weddell seals in May 2006. (a) Mapping of call types, showing
W5, W8 and W9 as distinct from the rest. (b) Ordination of the hour bins, showing strong separation of the call patterns during
10:00–11:59 h and 12:00–13:59 h from the rest. Repertoire for the remaining time is grouped in two: lower part: evening and night
(19:00–04:00 h); upper part: morning and afternoon (05:00–18:00 h)
139

Van Opzeeland et al.: Acoustic ecology of Antarctic pinnipeds
vocal behavior. In addition, interactions with abiotic
environmental factors, such as ice and the local
soundscape, as well as biotic environmental factors,
such as the distribution of prey and predators can also
directly influence acoustic behavior. Interactions
between abiotic factors and behavioral ecology (i.e.
the influence of ice on mating strategy; Van Parijs et
al. 2003) as well as between biotic factors and behav-
ioral ecology (i.e. the effect of prey availability on dis-
tribution) can indirectly affect vocal behavior. Finally,
anthropogenic factors such as climate driven changes
and underwater noise can indirectly influence
acoustic behavior, e.g. by affecting ice conditions and
the local soundscape, respectively, and are therefore
also a potentially important aspect of the acoustic
ecology of Antarctic pinnipeds.
The results are discussed with respect to species-
specific use of the acoustic environment based on the
interactions shown in Fig. 16, recognizing that this is a
non-exhaustive list while many of the factors men-
tioned are likely to act in concert and are of differing
importance to each species.
279
Fig. 11. Hydrurga leptonyx. Diel pattern of leopard seal call
type usage (call types L1–L7) for months in which at least
100 leopard seal calls were recorded. Time is presented
in Coordinated Universal Time (UTC); local time at PALAOA
is UTC – 33 min
Fig. 12. Ommatophoca rossi. Diel pattern of Ross seal call type
usage (call types R1–R5) for months in which at least 100
Ross seal calls were recorded. Time is presented in Coordi-
nated Universal Time (UTC); local time at PALAOA is
UTC – 33 min
140

Mar Ecol Prog Ser 414: 267–291, 2010
Behavioral ecology
Mating system
Vocal repertoire size and acoustic presence. Vocal
repertoire size is largely determined by the function of
vocal behavior and the distance between the vocalizing
individual and the targeted audience (Rogers 2003).
The large size of the Weddell seal vocal repertoire, the
relative complexity and the subtle variations between
call types reflect that calls might be used in inter- and
intrasexual communication over short distances and are
therefore not constrained by signal propagation needs.
Weddell seal vocalizations have been suggested to
serve a function for males in maintaining underwater
territories below the Antarctic fast-ice (e.g. Bartsch et
al. 1992, Stirling & Thomas 2003, Rouget et al. 2007).
Nevertheless, as females move freely in this 3-dimen-
sional underwater environment, males are unable to
monopolize females and underwater territories might
rather function as a display of male fitness for females
and other males. This study showed that vocalizations
280
Fig. 13. Ommatophoca rossi. Diel pattern of Ross seal call activity on single days, chosen based on the variability in diel patterns,
i.e. to illustrate the variation in vocal activity between days within the same month. Time is presented in Coordinated Universal
Time (UTC); local time at PALAOA is UTC – 33 min
141

Van Opzeeland et al.: Acoustic ecology of Antarctic pinnipeds
were recorded almost year-round, suggesting that
a number of animals remain in the breeding area
throughout the year. Males that occupy territories year-
round might have an advantage over non-territorial
males or males that move away in winter, in that they
are already resident when females arrive at the breed-
ing area (Harcourt et al. 2007, 2008). Their familiarity
with the under-ice environment and neighbouring ter-
ritorial males may reduce the cost of defending the
breeding territory, which may eventually improve their
mating success. The high Weddell seal vocal activity in
winter and spring therefore suggests that males are ac-
tively engaged in acoustic displays in the breeding area
for most of the year, and that the establishment and
defense of underwater territories actually begins in
winter, which is earlier than was previously assumed.
On the other hand, leopard and Ross seals are pack-
ice breeders that migrate to and beyond the outer
281
Fig. 14. Lobodon carcinophaga. Average diel pattern of crabeater seal call (type C1) usage for months in which at least 100 crab-
eater calls were recorded. Time is presented in Coordinated Universal Time (UTC); local time at PALAOA is UTC – 33 min
Fig. 15. Lobodon carcinophaga. Diel pattern of crabeater seal call activity on single days, chosen based on the variability in diel
patterns, i.e. to illustrate the variation in vocal activity between days within the same month. Time is presented in Coordinated
Universal Time (UTC); local time at PALAOA is UTC – 33 min
142

Mar Ecol Prog Ser 414: 267–291, 2010
fringes of the Antarctic sea-ice in austral winter and
move back into the inner pack-ice to breed in austral
summer (Siniff & Stone 1985, Blix & Nordøy 2007).
Females in these species are widely dispersed during
the breeding season and calls are thought to function
to attract mating partners over long distances. The
medium-sized vocal repertoire of both species with
highly stereotyped vocalizations may increase detect-
ability of calls in spite of unfavorable propagation con-
ditions and masking by background noise (Rogers
2003). In leopard seals, calls are produced by both
sexes; females produce broadcast calls during the
breeding season to signal their sexual receptivity,
while leopard seal males call in search of mates
(Rogers et al. 1995, 1996). Rogers & Cato (2002) sug-
gested that in leopard seals, information related to
the individual may be encoded in the vocalization
sequences, rather than in the acoustic characteristics of
call types, given that sequences may be less affected
by signal degradation when communicating over long
distances. In addition, the narrow frequency band-
width of leopard seal calls and their long calling peri-
ods may also increase the chance that receivers recog-
nize calls under poor signal-to-noise ratios.
For Ross seals, very little is known on mating behav-
ior. Mating has been suggested to occur in December
(King 1969) or around October–November immedi-
ately following pupping at the outer edge of the pack-
ice zone (Thomas et al. 1980, Bengtson & Stewart 1997,
Blix & Nordøy 2007). Based on the seasonal peak in
Ross seal acoustic activity, we suggest that Ross seal
mating in the Atka Bay region takes place relatively
near the ice shelf region between December and Janu-
ary. Studies on several other aquatic mating pinnipeds
have shown that seasonal peaks in vocal activity coin-
cide with the period in which mating occurs (harbour
seal: Van Parijs et al. 1999; leopard seal: Rogers et al.
1996; hooded seal: Ballard & Kovacs 1995; bearded
seal: Van Parijs et al. 2001; grey seal: Asselin et al.
1993). Assuming that Ross seal mating occurs primarily
in January, when the peak in vocal activity occurs, this
also sheds new light on previous observations of
changes in male Ross seal dive patterns in January
(Southwell 2005, Blix & Nordøy 2007). Southwell
(2005) noted that the male Ross seal dive pattern
changed from longer presumably foraging dives in
December to predominantly short dives with a modal
duration of 1 to 2 min in January. These male Ross seal
dive patterns in January are reminiscent of descrip-
tions of typical male dive display behavior of other
phocid species during the mating season (Van Parijs et
al. 1997, 2003).
Crabeater seals only produce the moan (C1, com-
prising both the high and low moan variety; Klinck et
al. 2010) in the PALAOA recordings. Crabeater seals
breed on pack-ice and are serially monogamous (Siniff
et al. 1979). The relatively simple acoustic display of
crabeater seals consisting of short broadband calls is
thought to function primarily in short-range under-
water male–male competition (Shaughnessy & Kerry
1989, Rogers 2003). Crabeater seal males, in contrast
to Weddell, leopard and Ross seal males, are able to
monopolize females and haul out on ice floes to guard
a female with her pup against intruder males until the
pup is weaned and the female enters estrus. Once the
pup is weaned and the female leaves the ice, the male
is assumed to mate with the female. Rogers (2003)
hypothesized that in crabeater seals a loud well-
developed vocal display would likely attract males to
the female that the male is defending, whereas the
acoustic characteristics of the moan limit the signal to
be received only by rival males in the vicinity. A recent
study identified 4 additional crabeater seal call types
which were recorded from a single animal of unknown
sex and age in February 2007 (McCreery & Thomas
2009). The acoustic characteristics of these newly de-
scribed crabeater seal call types and the month in
which they were recorded, suggest that these calls
serve as short-range communication and are not nec-
essarily produced in a breeding context, comparable to
the short-range call types that have been recorded
from captive leopard seals (Rogers et al. 1996). The
short-range call types described by McCreery &
Thomas (2009) were not present in the PALAOA
recordings analysed in this study. This suggests that
282
Fig. 16. Schematic representation of the acoustic ecology of
Antarctic pinnipeds, showing how behavioral ecology, biotic
factors and abiotic factors might interact to influence acoustic
behavior of Antarctic pinnipeds
143
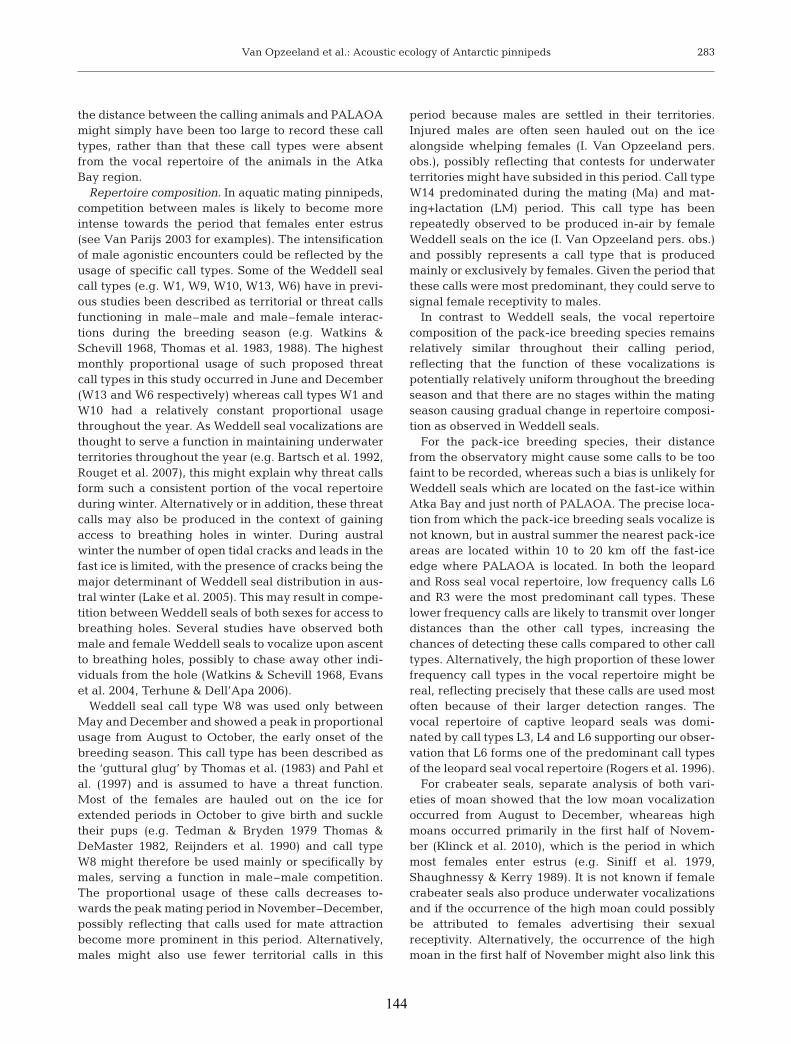
Van Opzeeland et al.: Acoustic ecology of Antarctic pinnipeds
the distance between the calling animals and PALAOA
might simply have been too large to record these call
types, rather than that these call types were absent
from the vocal repertoire of the animals in the Atka
Bay region.
Repertoire composition. In aquatic mating pinnipeds,
competition between males is likely to become more
intense towards the period that females enter estrus
(see Van Parijs 2003 for examples). The intensification
of male agonistic encounters could be reflected by the
usage of specific call types. Some of the Weddell seal
call types (e.g. W1, W9, W10, W13, W6) have in previ-
ous studies been described as territorial or threat calls
functioning in male–male and male–female interac-
tions during the breeding season (e.g. Watkins &
Schevill 1968, Thomas et al. 1983, 1988). The highest
monthly proportional usage of such proposed threat
call types in this study occurred in June and December
(W13 and W6 respectively) whereas call types W1 and
W10 had a relatively constant proportional usage
throughout the year. As Weddell seal vocalizations are
thought to serve a function in maintaining underwater
territories throughout the year (e.g. Bartsch et al. 1992,
Rouget et al. 2007), this might explain why threat calls
form such a consistent portion of the vocal repertoire
during winter. Alternatively or in addition, these threat
calls may also be produced in the context of gaining
access to breathing holes in winter. During austral
winter the number of open tidal cracks and leads in the
fast ice is limited, with the presence of cracks being the
major determinant of Weddell seal distribution in aus-
tral winter (Lake et al. 2005). This may result in compe-
tition between Weddell seals of both sexes for access to
breathing holes. Several studies have observed both
male and female Weddell seals to vocalize upon ascent
to breathing holes, possibly to chase away other indi-
viduals from the hole (Watkins & Schevill 1968, Evans
et al. 2004, Terhune & Dell’Apa 2006).
Weddell seal call type W8 was used only between
May and December and showed a peak in proportional
usage from August to October, the early onset of the
breeding season. This call type has been described as
the ‘guttural glug’ by Thomas et al. (1983) and Pahl et
al. (1997) and is assumed to have a threat function.
Most of the females are hauled out on the ice for
extended periods in October to give birth and suckle
their pups (e.g. Tedman & Bryden 1979 Thomas &
DeMaster 1982, Reijnders et al. 1990) and call type
W8 might therefore be used mainly or specifically by
males, serving a function in male–male competition.
The proportional usage of these calls decreases to-
wards the peak mating period in November–December,
possibly reflecting that calls used for mate attraction
become more prominent in this period. Alternatively,
males might also use fewer territorial calls in this
period because males are settled in their territories.
Injured males are often seen hauled out on the ice
alongside whelping females (I. Van Opzeeland pers.
obs.), possibly reflecting that contests for underwater
territories might have subsided in this period. Call type
W14 predominated during the mating (Ma) and mat-
ing+lactation (LM) period. This call type has been
repeatedly observed to be produced in-air by female
Weddell seals on the ice (I. Van Opzeeland pers. obs.)
and possibly represents a call type that is produced
mainly or exclusively by females. Given the period that
these calls were most predominant, they could serve to
signal female receptivity to males.
In contrast to Weddell seals, the vocal repertoire
composition of the pack-ice breeding species remains
relatively similar throughout their calling period,
reflecting that the function of these vocalizations is
potentially relatively uniform throughout the breeding
season and that there are no stages within the mating
season causing gradual change in repertoire composi-
tion as observed in Weddell seals.
For the pack-ice breeding species, their distance
from the observatory might cause some calls to be too
faint to be recorded, whereas such a bias is unlikely for
Weddell seals which are located on the fast-ice within
Atka Bay and just north of PALAOA. The precise loca-
tion from which the pack-ice breeding seals vocalize is
not known, but in austral summer the nearest pack-ice
areas are located within 10 to 20 km off the fast-ice
edge where PALAOA is located. In both the leopard
and Ross seal vocal repertoire, low frequency calls L6
and R3 were the most predominant call types. These
lower frequency calls are likely to transmit over longer
distances than the other call types, increasing the
chances of detecting these calls compared to other call
types. Alternatively, the high proportion of these lower
frequency call types in the vocal repertoire might be
real, reflecting precisely that these calls are used most
often because of their larger detection ranges. The
vocal repertoire of captive leopard seals was domi-
nated by call types L3, L4 and L6 supporting our obser-
vation that L6 forms one of the predominant call types
of the leopard seal vocal repertoire (Rogers et al. 1996).
For crabeater seals, separate analysis of both vari-
eties of moan showed that the low moan vocalization
occurred from August to December, wheareas high
moans occurred primarily in the first half of Novem-
ber (Klinck et al. 2010), which is the period in which
most females enter estrus (e.g. Siniff et al. 1979,
Shaughnessy & Kerry 1989). It is not known if female
crabeater seals also produce underwater vocalizations
and if the occurrence of the high moan could possibly
be attributed to females advertising their sexual
receptivity. Alternatively, the occurrence of the high
moan in the first half of November might also link this
283
144

Mar Ecol Prog Ser 414: 267–291, 2010
call type to male crabeater seals in periods when
intra-sexual competition for access to estrus females is
strongest.
Diel call activity patterns. Weddell seal diel call activ-
ity patterns differed substantially between months and
were in accordance with the patterns in call activity de-
scribed by Rouget et al. (2007) who monitored Weddell
seal underwater vocal activity from July to November.
The low vocal activity during winter daytime hours is
unlikely to be explained by haul-out behavior, as seals
are rarely observed on the ice in this period (e.g. Sato et
al. 2003, Rouget et al. 2007). Weddell seals are known
to depend on visual cues for underwater orientation,
hunting and location of breathing holes (Kooyman
1975, Wartzok et al. 1992, Burns et al. 1999, Davis et al.
1999). This led Rouget et al. (2007) to suggest that the
daytime periods with low vocal activity in July–August
could potentially be explained by the limited number of
light hours in that period which seals might utilize for
vision-dependent activities during which they vocalize
less. However, we also observed this bimodal pattern in
vocal activity in May and June when global radiation is
low and the light–dark cycle is virtually absent at the
site where this study was conducted (Koenig-Langlo &
Herber 1996). This suggests that Weddell seals use an
alternative cue to entrain their circadian rhythm in the
period of constant darkness in winter. Bornemann et al.
(1998) found a correlation between tidal rhythmicity
and semi-circadian rhythm of Weddell seal underwater
activity in summer; they suggested that in summer tidal
movement might affect abundance and distribution of
prey and that Weddell seals use the tide as a time cue to
optimize foraging efficiency. However, Testa (1994)
showed that Weddell seal dive depths in midwinter
darkness lacked the diel pattern of autumn and spring
dives. This leaves it unlikely that low vocal activity dur-
ing winter daytime hours could be explained by Wed-
dell seal foraging activity during which they would vo-
calize less or in deeper waters beyond recording range
(e.g. Rouget et al. 2007). Alternatively, the observed
diel rhythm in Weddell seal vocal activity might be en-
trained by social factors. Animals across various taxa in-
habiting environments that lack time cues are known to
socially and mutually synchronize circadian rhythms
(e.g. Crowley & Bovet 1980, Marimuthu et al. 1981,
Aschoff et al. 1983). Similarly, Weddell seals might use
the vocalizations of conspecifics to synchronize their
own vocal activity. In addition, all 6 call types that
occurred frequently enough to be included in the diel
pattern analyses have been described previously and
are thought to have a territorial and/or threat function
(Watkins & Schevill 1968, Thomas et al. 1983). Social
synchronization of vocal activity might aid to maximize
the effectiveness of signals used in male–male compe-
tition and female attraction. Towards September the
diel rhythm becomes less pronounced, which might be
explained by the fact that male–male competition be-
comes more intense and vocal interactions occur more
continuously. Adult males, territorial males in parti-
cular, are known to rarely haul out from early October
through mid December and spend most of the breeding
season under the fast ice (Harcourt et al. 2007).
Similar to Weddell seals, leopard and Ross seals both
exhibited continuous call activity in the months in
which mating takes place which might on the one
hand reflect the absence of factors constraining or
influencing vocal activity and on the other hand the
increased competition for mating partners promoting
continuous vocal activity. These findings are in ac-
cordance with previous studies that found that most
Ross seals haul out around solar midday in December,
while haul-out patterns in January were more variable
(Southwell et al. 2003, 2008).
For leopard seals, the continuous call activity ob-
served in December could possibly be explained by a
difference in male and female call strategies. Rogers et
al. (1995) observed leopard seals in captivity and noted
that the female called constantly for many days when
she was sexually receptive, whereas males called
throughout December and January. For males it might
be more advantageous to advertise their presence over
longer periods during the breeding season, which
might introduce a trade-off between the hourly call
rate and the total period over which a male can
energetically afford to be vocally active. Males might
therefore vocalize mainly during the hours that most
females are in the water, whereas females might vocal-
ize more continuously throughout the short period in
December that they are in estrus. Given that previous
studies found a clear diel pattern in leopard seal vocal
activity in December (Thomas & DeMaster 1982,
Rogers & Bryden 1997), a possible explanation for the
observed difference might be the ratio of male and
female callers at the different recording locations.
In addition, local ecological factors might also affect
vocal behavior differently between recording loca-
tions. Van Parijs et al. (1999) found that harbour seal
males adapted their temporal and spatial behavior to
the periods when most females were in the water. Site-
specific differences in ecological constraints on haul-
out behavior of female harbour seals were therefore
reflected in local variation in male display behavior.
The absence of environmental factors such as prey
availability constraining or influencing vocal activity at
Atka Bay might therefore result in the continuous leop-
ard seal vocal activity in December, whereas environ-
mental factors might affect the vocal activity patterns
in other areas differently.
In crabeater seals, the intensification of male–
male competition might have a contrary effect on call
284
145

Van Opzeeland et al.: Acoustic ecology of Antarctic pinnipeds
activity compared to the other species. Competition
between males for access to receptive females might
force males to remain hauled out for extended periods
during the day to defend the female against intruders.
In November, periods of vocal activity might therefore
be more restricted to the night and early morning
hours, which is in accordance with the pattern in vocal
activity observed in other studies (Thomas & DeMaster
1982, Klinck et al. 2010). The difference in call activity
pattern in October and December might reflect that
crabeater seal vocal behavior develops into a typical
2-peak pattern from start to peak mating season,
resulting from such intensification in male–male com-
petition.
Distribution
In contrast to leopard, Ross and crabeater seals,
Weddell seals are relatively stationary, remaining in
fast-ice areas where the presence of cracks and
breathing holes determine their distribution (e.g. Stir-
ling 1969, Lake et al. 2005). The species’ sedentary
nature is likely to explain the existence of geographi-
cal variation in vocal behavior on various spatial scales
(Abgrall et al. 2003, Thomas & Stirling 1983). Trills and
calls thought to have a function in territorial defense
such as call type W6, were present at all sites, while all
sites also had unique call types that were not shared
with other breeding populations. This study identified
14 Weddell seal call types, 13 of which have been de-
scribed previously. Nevertheless, the differences be-
tween call type representation, description and classi-
fication methods provided in a number of previous
studies complicate the comparison of call types be-
tween study sites. In most cases call types recorded in
this study exhibited subtle differences in acoustic
structure compared to the call types recorded at other
breeding populations, such as e.g. the different types
of descending chirp sequences that have been de-
scribed (Terhune et al. 1994, Moors & Terhune 2004,
Hayes & Terhune 2007). However, none of these de-
scriptions included the presence of a short ascending
whistle, which in this study always preceded call type
W2 and in some cases also W3, albeit in a less stereo-
typed form. Pahl et al. (1997) described this ascending
whistle as a separate call type (call type DC202).
Despite these differences, overall similarity in call
characteristics and structure showed that all call types,
with the exception of W4, could be classified into
previously described call types. Call type W4 (Fig. S1)
represents a strongly stereotyped chirp sequence that
differed from the chirp sequences recorded at other
sites. In contrast to the similar looking call types W2
and W3, call type W4 consists of 3 falling chirp seg-
ments followed by a low chirp. Call type W4 might
therefore represent a site- or region-specific call for
Atka Bay that is not used in other Weddell seal popula-
tions.
Leopard, Ross and crabeater seals move over much
larger spatial scales, which might also be reflected in
the absence of large differences in vocal repertoire
composition. In accordance to our findings, previous
studies report leopard seal call types L6 (‘low double
trill’) and L3 (‘high double trill’) to be the most common
call types (e.g. Stirling & Siniff 1979, Rogers & Cato
2002). However, call repertoire composition varies
between different locations (e.g. Thomas & Golladay
1995, Rogers 2007). Most of the call types in the
PALAOA recordings have also been recorded at Prydz
Bay, except for call type L4 (‘hoot’), which has only
been recorded in captivity (Rogers et al. 1996). Rogers
(2007) noted that call type L5 (‘hoot with single trill’)
was only recorded at 2 opposing locations of the
Antarctic continent, Prydz Bay and the South Shetland
Islands, and not at any of the sites in between. How-
ever, we found call type L5 also to be present in the
PALAOA recordings, which may suggest that there is
movement of animals between the South Shetlands,
Prydz Bay and Atka Bay. Differences between local
vocal repertoires can be used to make inferences about
potential movement and exchange patterns between
populations (e.g. Perry & Terhune 1999, Cerchio et al.
2001). In leopard seals, this is particularly exciting as
genetic studies have shown that there is sufficient
gene flow between breeding groups to prevent devel-
opment of population structure (Davis et al. 2008).
Nevertheless, it has been suggested that the fact that
there is geographic variation in vocal repertoires—
despite the low genetic variability between animals
from different regions—could indicate that some ani-
mals show site fidelity and that moving (potentially
juvenile) leopard seals adapt their vocal repertoire to
that of local breeding groups (Davis et al. 2008).
In our analyses, we did not discriminate between the
‘mid double trill’ and ‘mid single trill’ (Stirling & Siniff
1979, Rogers et al. 1996) and lumped all mid trills into
call type L7 (Fig. S2). However, Klinck (2008) found
that both mid trill types were present in the leopard
seal vocal repertoire recorded at Atka Bay. The ‘mid
double trill’ has so far only been recorded from animals
in the South Shetlands (Rogers 2007), which could
be an indication that there is movement of animals
between the South Shetlands and Atka Bay, but not
directly between Prydz Bay and the South Shetlands.
However, further investigation is needed to gain
insights into the relationship between leopard seal
local vocal repertoires and movement patterns.
For Ross seals, 4 of 5 call types in the PALAOA
recordings have been described previously (Watkins &
285
146

Mar Ecol Prog Ser 414: 267–291, 2010
Ray 1985, Stacey 2006) while one was only present in
the PALAOA recordings (Seibert 2007). Although
Watkins & Ray (1985) and Stacey (2006) used different
methods to categorize call types, their descriptions
confirm that at least R1, R2 and R3 have also been
recorded at other locations. Stacey (2006) also distin-
guishes a call type that looks similar to call type R5 in
this study (‘underwater call type B’). We found call
type R5 to be almost always associated with R4, which
is also reflected in the similar proportional usage of
these call types within the repertoire. However, both
call types also occurred independently, which is why
we have assigned separate call type names. The ab-
sence of call type R4 in previous descriptions of the
Ross seal repertoire could indicate that R4 is a region-
specific call and that Ross seal call repertoires differ
between areas.
Biotic factors
Prey availability
In many species, past experience with spatially and
temporally predictable food sources might cause ani-
mals to return to and concentrate in these areas during
periods that resources are abundant (Krebs & Davies
1993). The timing of the leopard seal mating period,
following the weaning of pups after which both
females and pups require extra food resources, might
have evolved to coincide with the period when the sea
ice breaks back towards the colonies and penguin
fledglings and seal weanlings are compelled to leave
the ice (Klinck 2008). Most leopard seal calls were
recorded in December which coincides with the period
in which mating occurs. In this period the presence of
the emperor penguin Aptenodytes forsteri colony as
well as the crabeater and Weddell seal breeding
colonies in and around Atka Bay likely provide an
attractive feeding spot for leopard seals. Given that
leopard seals are solitary animals outside the breeding
season, the presence of food sources that are reliably
present in Atka Bay every year might also function to
attract leopard seals to the breeding area and increase
the likelihood of finding a mating partner. In addition
to their own calls, the sounds from the penguin and
seal colonies might also function as ‘acoustic beacons’
where many animals concentrate to mate and forage.
Presence of predators
For crabeater seals, the likelihood of encountering
predators might be a factor influencing the timing of
vocal activity. Vocalizing crabeater seals might provide
location cues to leopard seals and might consequently
increase their predation risk. Gilbert & Erickson (1977)
suggested that crabeater seals might represent a more
important leopard seal food source than krill or pen-
guins. The peak in crabeater vocal activity in our data
set occurred in October. The peak in crabeater call
activity in November occurred when only few leopard
seal calls were present in the recordings, suggesting
that leopard seals might not yet be abundantly present
at Atka Bay in this period. However, most crabeater
seal body wounding by leopard seals has been sug-
gested to occur between weaning and attaining matu-
rity (Siniff & Bengtson 1977). If this reflects the main
age class that is targeted by leopard seals, the majority
of leopard seals might time their arrival in late Novem-
ber/ early December to coincide with the period when
most crabeater seal pups are weaned.
The presence of leopard seals, in turn, might be re-
stricted to the period that orcas Orcinus orca are absent.
Although the extent remains unknown, Siniff & Bengt-
son (1977) found evidence for leopard seal predation by
orcas. Preliminary analysis of the PALAOA data show
that in subsequent years, orca echolocation clicks and
vocalizations are present in the January recordings
when leopard seal vocal activity decreases rapidly.
However, further analyses of annual patterns in ceta-
cean vocal behavior are underway and will provide
further insight into such inter-specific relationships.
Abiotic factors
Soundscape: inter-specific acoustic niche partitioning
The observed differences between species in timing
of acoustic behavior might reduce acoustic interfer-
ence between calling individuals (i.e. jamming of sig-
nals) and increase the efficiency of signal propagation
(e.g. Sueur 2002). Partitioning of the acoustic environ-
ment or sequencing of acoustic activity, either based
on time, space or frequency bandwidth of signals,
is referred to as acoustic niche forming (Latimer &
Broughton 1984, Mossbridge & Thomas 1999, Sueur
2002, Brumm 2006, Boquimpani-Freitas et al. 2007)
and has been observed to occur both intra-specifically
and inter-specifically in orthopterans, amphibians and
birds (e.g. Ficken & Hailma 1974, Gerhardt 1994).
Harp seals are thought to overcome masking by calls of
conspecifics by using frequency and temporal separa-
tion of call types (Serrano & Terhune 2002). Moss-
bridge & Thomas (1999) suggested that orcas modulate
the frequency of their vocalizations as an adaptation to
the presence of leopard seals during periods that both
species exploit the same region. Particularly for spe-
cies that rely on signal propagation over long distances
286
147

Van Opzeeland et al.: Acoustic ecology of Antarctic pinnipeds
to find a mating partner, such as leopard and Ross
seals, acoustic niche forming might significantly re-
duce interspecific acoustic interference. Leopard and
Ross seal calls dominate the soundscape during rela-
tively short distinct periods in December and January
respectively and might temporarily ‘block’ the acoustic
space of other species. Such ‘blocking’ of acoustic
space might occur through the relatively high ampli-
tude of leopard seal calls (Rogers 2003) as well as the
broad frequency bandwidth that is covered by Ross
seal vocalizations, and might contribute to prevent
inter-specific acoustic interference. Weddell and crab-
eater seals on the other hand, communicate over much
shorter distances and might therefore not depend so
much on efficient signal propagation. Complete sepa-
ration of the period during which a species is vocally
active might on the other hand not be possible because
of other abiotic and biotic factors, such as the availabil-
ity of prey, suitable ice and thermoregulation (haul out)
which might further restrict the breadth of the acoustic
niche of each species.
Ice conditions
The observed differences in the number of calls in
January 2006 and January 2007 for Weddell, leopard
and Ross seals suggests that a lower number of animals
was present in the area around the observatory in 2006
compared to 2007. Despite the difference in the num-
ber of samples that were analysed in January 2006 and
2007, in both years samples were not biased towards
certain times of day during which vocal activity was
higher and such a sampling bias cannot therefore have
influenced the results. Although Weddell, leopard and
Ross seals depend on different ice types for breeding,
they all rely on the large-scale reliability of sea-ice
development. Previous studies found that inter-annual
variability in sea-ice extent and composition affects
behavior of ice-breeding pinnipeds: Siniff et al. (2008)
observed fewer adult Weddell seals at the breeding
area in McMurdo Sound in a year when ice closed off
cracks that had reliably been open in previous years.
In bearded seals, the number of displaying males was
found to be restricted by between-year fluctuations in
ice cover (Van Parijs et al. 2004). Not only differences
in ice conditions between years might affect pinniped
acoustic behavior, but seasonal availability of ice suit-
able for haul-out and pupping might also affect vocal
behavior. The absence of Weddell seal vocalizations in
the PALAOA recordings throughout February might
reflect a short period during which seals might have
moved (either actively or drifting passively on ice floes)
out of Atka Bay to areas where suitable ice for haul-out
was still present. Weddell seals aggregate along pre-
dictable annual tidal cracks in the fast ice close to the
ice shelf edge of Atka Bay (J. Plötz pers. obs.). Seasonal
fast-ice breakup in this area usually occurs in Febru-
ary, after which the ice sheet builds up again in March
and April (G. König-Langlo pers. comm). Green &
Burton (1988) also observed a very low number of
Weddell seal calls in Long Fjord near Davis station
(68° S, 78° E) between February and early April, fol-
lowed by a period with a distinct lack of Weddell seal
vocal activity in May and June during which no seals
were sighted in the area. They suggested that the lim-
ited amount of ice available for seals to haul out on in
addition to the potentially depleted food stocks in the
pupping area might have caused seals to move out of
the fjord. Alternatively, if calls play a role in Weddell
seal territorial disputes throughout the year, as dis-
cussed previously, vocal activity might be linked ex-
clusively to the presence of fast-ice being a prerequi-
site for the existence of underwater territories. In this
case, seasonal fast-ice break-up in February would
dissolve the underwater territorial system which might
be reflected in the absence of Weddell seal vocali-
zations in this month.
Implications of a changing environment for Antarctic
pinnipeds
All 4 species rely on different sea-ice habitats for
most or at least critical portions of their life history and
the effects of climate change are therefore likely to
have differing impacts on each species. In Weddell
seals, population dynamics have been linked to clima-
tological cycles, mediated through changes in sea-ice
extent and concentration (Testa et al. 1991, Siniff et al.
2008). Pup incidence was lower in years when sea-ice
was more extensive, possibly related to decreased
foraging success through the reduced amount of open
water available for primary production ultimately affect-
ing fish availability (Hadley et al. 2007). In crabeater
seals, ice extent might also have an indirect impact
given that sea-ice extent affects recruitment and abun-
dance of krill, their primary prey (Siniff et al. 2008).
Moreover, for pupping, crabeater seal females select
ice floes based on floe size and physical characteristics
(i.e. surface relief; Siniff et al. 1979) which offer pro-
tection from predation by leopard seals and orcas.
Changes affecting the availability and duration of
availability of such sea-ice types might also directly
affect crabeater seal populations, e.g. through reduced
reproductive success when floes melt before lactation
is complete. Siniff et al. (2008) suggested that leopard
and Ross seals might be less sensitive to changes in
sea-ice given the fact that they are not philopatric with
respect to breeding areas. However, this study and
287
148

Mar Ecol Prog Ser 414: 267–291, 2010
preliminary analyses of PALAOA data from following
years show that calls of leopard and Ross seals reoccur
each year and coincide with the mating period.
Although information from Atka Bay on site-fidelity at
an individual level is lacking, the PALAOA data sug-
gest that at least on a species level animals return to
the same breeding areas each year and might there-
fore be more philopatric than previously thought. Con-
sequently, for these species local changes in ice condi-
tions might also result in loss of site-specific breeding
locations. Such changes might in turn also have conse-
quences for other species, for example through shifts in
timing of mating and the resulting changes in acoustic
space. Acoustic techniques form an important tool to
monitor such reponses to human-induced changes in
environmental conditions (Laiolo 2010), particularly in
remote areas such as the Antarctic.
Compared to other areas in the world, the Antarctic
is still a relatively pristine area with respect to anthro-
pogenic impact (Halpern et al. 2008). However, as in
many other marine ecosystems, anthropogenic impact
such as noise caused by e.g. vessels or seismic explo-
ration can influence marine mammals in various ways
(see Southall et al. 2007 for a review). Changes in the
local soundscape as a result of anthropogenic activities
can alter vocal behavior of species in affected areas or
affect prey distribution (Southall et al. 2007) and are
therefore also of potential influence on the acoustic
ecology of Antarctic pinnipeds. To understand these
impacts, knowledge on how species use acoustic space
and the factors that shape acoustic behavior is indis-
pensable.
Further investigation involves multi-year compar-
isons of vocal behavior of Antarctic pinnipeds and inte-
gration of the acoustic data in habitat models to con-
trast environmental attributes associated with seasonal
occurrence and call rates. These approaches will con-
tribute to improve our understanding of the fundamen-
tal ecology and acoustic ecology of Antarctic pinnipeds.
Acknowledgements. S. Riedel, D. Steinhage, A. Ziffer and the
overwintering teams 2005 and 2006 (Alfred Wegener Institute
for Polar and Marine Research, Bremerhaven, Germany),
H. Schubert (Reederei F. Laeisz GmbH, Rostock, Germany),
R. Verhoeven, J. Hoffmann and C. Müller (FIELAX Services
for Marine Science and Technology mbH, Bremerhaven, Ger-
many) all played crucial roles in setting up and/or maintain-
ing PALAOA. The PALAOA project was partly funded by the
Bremerhavener Gesellschaft für Innovationsförderung und
Stadtentwicklung (BIS). We thank 4 anonymous referees for
their constructive comments on our manuscript.
LITERATURE CITED
Abgrall P, Terhune JM, Burton H (2003) Variation of Weddell
seal (Leptonychotes weddellii) underwater vocalizations
over mesogeographic ranges. Aquat Mamm 29:268–277
Aschoff J, Von Goetz C, Honma KI (1983) Restricted feeding
in rats: effects of varying feeding cycles. Z Tierpsychol 63:
91–111
Asselin S, Hammill MO, Barrette C (1993) Underwater vo-
calizations of ice-breeding grey seals. Can J Zool 71:
2211–2219
Ballard KA, Kovacs KM (1995) The acoustic repertoire of
hooded seals (Cystophora cristata). Can J Zool 73:
1362–1374
Bartholomew GA (1970) A model for the evolution of pinniped
polygyny. Evolution 24:546–559
Bartsch SS, Johnston SD, Siniff DB (1992) Territorial behavior
and breeding frequency of male Weddell seals (Leptony-
chotes weddellii) in relation to age, size and concentra-
tions of serum testosterone and cortisol. Can J Zool 70:
680–692
Bengtson JL (2002) Crabeater seal (Lobodon carcinophaga)
In: Perrin WF, Wursig B, Thewissen JGM (eds) Encyclope-
dia of marine mammals. Academic Press, San Diego, CA,
p 302–304
Bengtson JL, Stewart BS (1997) Diving patterns of a Ross seal
(Ommatophoca rossii) near the eastern coast of the
Antarctic Peninsula. Polar Biol 18:214–218
Bester MN, Odendaal PN (2000) Abundance and distribution
of Antarctic pack-ice seals in the Weddell Sea. In: Davison
W, Howard-Williams C (eds) Antarctic ecosystems: models
for wider ecological understanding. Caxton Press, Christ-
church, p 59–63
Blix AS, Nordøy ES (2007) Ross seal (Ommatophoca rossii)
annual distribution, diving behaviour, breeding and
moulting, off Queen Maud Land, Antarctica. Polar Biol 30:
1449–1458
Boebel O, Kindermann L, Klinck H, Bornemann H and others
(2006) Real-time underwater sounds from the Southern
Ocean. Eos Trans AGU 87:361–362
Boquimpani-Freitas L, Marra RV, Van Sluys M, Rocha CFD
(2007) Temporal niche of acoustic activity in anurans:
interspecific and seasonal variation in a neotropical as-
semblage from south-eastern Brazil. Amphib-reptil 28:
269–276
Bornemann H, Mohr E, Plötz J, Krause G (1998) The tide as a
zeitgeber for Weddell seals. Polar Biol 20:396–403
Brumm H (2006) Signalling through acoustic windows:
nightingales avoid interspecific competition by short-term
adjustment of song timing. J Comp Physiol A 192:
1279–1285
Burns JM, Castellini MA, Testa JW (1999) Movements and
diving behavior of weaned Weddell seal (Leptonychotes
weddellii) pups. Polar Biol 21:23–36
Catchpole CK, Slater PJB (2008) Bird song: biological themes
and variations, 2nd edn. Cambridge University Press,
Cambridge
Cerchio S, Jacobsen JK, Norris TF (2001) Temporal and
geographical variation in songs of humpback whales,
Megaptera novaeangliae: synchronous change in Hawai-
ian and Mexican breeding assemblages. Anim Behav 62:
313–329
Cleator H, Stirling I, Smith TG (1989) Underwater vocaliza-
tions of the bearded seal (Erignathus barbatus). Can J Zool
67:1900–1910
Cotté C, Guinet C (2007) Historical whaling records reveal
major regional retreat of Antarctic sea ice. Deep-Sea Res I
54:243–252
Crowley M, Bovet J (1980) Social synchronization of circadian
rhythms in deer mice (Peromyscus maniculatus). Behav
Ecol Sociobiol 7:99–105
Davis RW, Fuiman LA, Williams TM, Collier SO and others
288
➤
➤
➤
➤
➤
➤
➤
➤
➤
➤
➤
➤
➤
149

Van Opzeeland et al.: Acoustic ecology of Antarctic pinnipeds
(1999) Hunting behavior of a marine mammal beneath the
Antarctic fast ice. Science 283:993–996
Davis CS, Stirling I, Strobeck C, Coltmann DW (2008)
Population structure of ice-breeding seals. Mol Ecol 17:
3078–3094
Emerson SB (1992) Courtship and nest-building behavior of a
Bornean frog, Rana blythi. Copeia 1992:1123–1127
Erickson AW, Hanson MB, Kehoe DM (1983) Population
densities of seals and whales observed during the 1983
circumnavigation of Antarctica by the USCGC Polar Star.
Antarct J US 18:163–166
Evans WE, Thomas JA, Davis RW (2004) Vocalizations from
Weddell seals (Leptonychotes weddellii) during diving
and foraging. In: Thomas J, Moss C, Vader M (eds) Echo-
location in bats and dolphins. University of Chicago Press,
Chicago, IL, p 541–547
Fernandez-Juricic E, Campagna C, Enriquez V (1999) Vocal
communication and individual variation in breeding South
American sea lions. Behaviour 136:495–517
Ficken RW, Hailma JP (1974) Temporal pattern shifts to avoid
acoustic interference in singing birds. Science 183:762–763
Gedamke J, Robinson SM (2010) Acoustic survey for marine
mammal occurrence and distribution off East Antarctica
(30–80° E) in January–February 2006. Deep-Sea Res II 57:
968–981
Gerhardt HG (1994) The evolution of vocalization in frogs and
toads. Annu Rev Ecol Syst 25:293–324
Gilbert JR, Erickson AW (1977) Distribution and abundance of
seals in the pack ice of the Pacific sector of the Southern
Ocean. In: Llano GA (ed) Adaptations within Antarctic
ecosystems. Smithsonian Institution, Washington, DC,
p 703–740
Green K, Burton HR (1988) Annual and diurnal variation in
the underwater vocalizations of Weddell seals. Polar Biol
8:161–164
Greenacre MJ (1984) Theory and applications of correspon-
dence analysis. Academic Press, London
Hadley GL, Rotella JJ, Garrott RA (2007) Evaluation of repro-
ductive costs for Weddell seals in Erebus Bay, Antarctica.
J Anim Ecol 76:448–458
Halpern BS, Walbridge S, Selkoe KA, Kappel CV and others
(2008) A global map of human impact on marine eco-
systems. Science 319:948–952
Harcourt RG, Kingston JJ, Cameron MF, Waas JR, Hindell
MA (2007) Paternity analysis shows experience, not age,
enhances mating success in an aquatically mating pin-
niped the Weddell seal (Leptonychotes weddellii). Behav
Ecol Sociobiol 61:643–652
Harcourt RG, Kingston JJ, Waas JR, Hindell MA (2008) For-
aging while breeding: alternative mating strategies by
male Weddell seals? Aquat Conserv Mar Freshw Ecosyst
17:68–78
Hayes VJ, Terhune JM (2007) Underwater call sequences of
Weddell seals (Leptonychotes weddellii) at the Vestvold
Hills, Antarctica. Aquat Mamm 33:305–314
Heller KG, Von Helversen D (2004) Acoustic communication
in phaneropterid bushcrickets: species-specific delay of
female stridulatory response and matching male sensory
time window. Behav Ecol Sociobiol 18:189–198
Insley SJ, Phillips AV, Charrier I (2003) A review of social
recognition in pinnipeds. Aquat Mamm 29:181–201
Kaufman GW, Siniff DB, Reichle R (1975) Colony behavior of
Weddell seals, Leptonychotes weddellii, at Hutton Cliffs,
Antarctica. Rapp P-V Réun Cons Int Expl Mer 169:228–246
Kindermann L, Boebel O, Bornemann H, Burkhardt E and
others (2008) A Perennial Acoustic Observatory in the
Antarctic Ocean, Computational bioacoustics for assess-
ing biodiversity. Bundesamt Naturschutz Skr 234:15–28
King JE (1969) Some aspects of the anatomy of the Ross seal,
Ommatophoca rossii (Pinnipedia: Phocidae). British Ant-
arctic Survey Scientific Reports No. 63, London
Klinck H (2008) Automated passive acoustic detection, local-
ization and identification of leopard seals. PhD disserta-
tion, University of Trier
Klinck H, Mellinger DK, Klinck K, Hager J, Kindermann L,
Boebel O (2010) Underwater calls of the crabeater seal
(Lobodon carcinophaga). J Acoustic Soc Am 128:474–479
Koenig-Langlo G, Herber A (1996) The meteorological data
of the Neumayer Station (Antarctica) for 1992, 1993, and
1994. Reports on Polar and Marine Research 187, Alfred
Wegener Institute, Bremerhaven
Kooyman GL (1975) A comparison between day and night
diving in the Weddell seal. J Mammal 56:563–574
Krebs JR, Davies NB (1993) An introduction to behavioral
ecology, 3rd edn. Blackwell Science, Oxford
Kunnasranta W, Hyvarinen H, Sorjonen J (1996) Underwater
vocalizations of Ladoga ringed seals (Phoca hispida lado-
gensis Nordq) in summertime. Mar Mamm Sci 12:611–618
Laiolo P (2010) The emerging significance of bioacoustics in
animal species conservation. Biol Conserv 143:1635–1645
Lake S, Wotherspoon S, Burton H (2005) Spatial utilisation of
fast-ice by Weddell seals Leptonychotes weddellii during
winter. Ecography 28:295–306
Latimer W, Broughton WB (1984) Acoustic interference in
bush crickets; a factor in the evolution of singing insects?
J Nat Hist 18:599–616
Learmonth JA, Macleod CD, Santos MB, Pierce GJ, Crick
HQP, Robinson RA (2006) Potential effects of climate
change on marine mammals. Oceanogr Mar Biol Annu
Rev 44:431–464
Lugg DJ (1966) Annual cycle of the Weddell seal in the Vest-
fold Hills, Antarctica. J Mammal 47:317–322
Marimuthu G, Rajan S, Chandrashekaran MK (1981) Social
entrainment in the flight activity of the microchiropteran
bat Hipposideros speoris. Behav Ecol Sociobiol 8:147–150
McCreery L, Thomas JA (2009) Acoustic analysis of under-
water vocalizations from crabeater seals (Lobodon car-
cinophaga): not so monotonous. Aquat Mamm 35:490–501
Moors HB, Terhune JM (2004) Repetition patterns in Weddell
seal (Leptonychotes weddellii) underwater multiple ele-
ment calls. J Acoust Soc Am 116:1261–1270
Mossbridge JA, Thomas JA (1999) An acoustic niche for Ant-
arctic killer whale and leopard seal sounds. Mar Mamm
Sci 15:1351–1357
Murphy EJ, Watkins JL, Trathan PN, Reid K and others (2007)
Spatial and temporal operation of the Scotia Sea ecosys-
tem: a review of large-scale links in a krill centered food
web. Philos Trans R Soc Lond B Biol Sci 362:113–148
Oetelaar ML, Terhune JM, Burton HR (2003) Can the sex of
a Weddell seal (Leptonychotes weddellii) be identified by
its surface call? Aquat Mamm 29:261–267
Pahl BC, Terhune JM, Burton HR (1997) Repertoire and geo-
graphic variation in underwater vocalizations of Weddell
seals (Leptonychotes weddellii, Pinnipedia: Phocidae) at
the Vestfold Hills, Antarctica. Aust J Zool 45:171–187
Perry EA, Terhune JM (1999) Variation in harp seal (Pago-
philus groenlandicus) underwater vocalizations among
three breeding locations. J Zool 45:171–178
Plötz J (1986) Summer diet of Weddell seals (Leptonychotes
weddellii) in the Eastern and Southern Weddell Sea,
Antarctica. Polar Biol 6:97–102
Read AF, Weary DM (1992) The evolution of bird song: com-
parative analyses. Philos Trans R Soc Lond B Biol Sci 338:
165–187
289
➤
➤
➤
➤
➤➤
➤➤
➤
➤
➤
➤
➤
➤
➤
➤
➤➤
➤
➤
➤
150
Mar Ecol Prog Ser 414: 267–291, 2010
Reijnders PJH, Plötz J, Zegers J, Gräfe M (1990) Breeding
biology of Weddell seals (Leptonychotes weddellii) at
Drescher Inlet, Riiser Larsen Ice Shelf, Antarctica. Polar
Biol 10:301–306
Riedman M (1990) The pinnipeds. Seals, sea lions and wal-
ruses. University of California Press, Berkeley, CA
Rogers TL (2003) Factors influencing the acoustic behaviour
of male phocid seals. Aquat Mamm 29:247–260
Rogers TL (2007) Age-related differences in the acoustic
characteristics of male leopard seals, Hydrurga leptonyx.
J Acoust Soc Am 122:596–605
Rogers TL, Bryden MM (1997) Density and haul-out behav-
iour of leopard seals (Hydrurga leptonyx) in Prydz Bay,
Antarctica. Mar Mamm Sci 13:293–302
Rogers TL, Cato DH (2002) Individual variation in the acoustic
behaviour of the adult male leopard seal, Hydrurga lep-
tonyx. Behaviour 139:1267–1286
Rogers TL, Cato DH, Bryden MM (1995) Underwater vocal
repertoire of the leopard seal (Hydrurga leptonyx) in
Prydz Bay, Antarctica. In: Kastelein RA, Thomas JA,
Nachtigall PE (eds) Sensory systems of aquatic mammals.
De Spil Publishers, Woerden, p 223–236
Rogers TL, Cato DH, Bryden MM (1996) Behavioral signifi-
cance of underwater vocalizations of captive leopard
seals, Hydrurga leptonyx. Mar Mamm Sci 12:414–427
Rouget PA, Terhune JM, Burton HR (2007) Weddell seal un-
derwater calling rates during the winter and spring near
Mawson Station, Antarctica. Mar Mamm Sci 23:508–523
Roy D, Borah B, Sarma A (1995) Analysis and significance of
female reciprocal call in frogs. Curr Sci 69:265–270
Ryan MJ (1988) Constraints and patterns in the evolution of
anuran acoustic communication. In: Fritzsch B, Ryan M,
Wilczynski W, Hetherington T, Walkowiak W (eds) The
evolution of the amphibian auditory system. John Wiley
& Sons, New York, NY, p 637–677
Sato K, Yasutaka T, Kudoh S, Naito Y (2003) Meteorological
factors affecting the number of Weddell seals hauling out
on the ice during the molting season at Syowa Station,
East Antarctica. Polar Biosci 16:98–103
Searcy WA, Andersson M (1986) Sexual selection and the
evolution of bird song. Annu Rev Ecol Syst 17:507–533
Seibert AM (2007) The Ross seal and its underwater vocaliza-
tions. MSc thesis, University of Munich
Serrano A (2001) New underwater and aerial vocalizations of
captive harp seals (Pagophilus groenlandicus). Can J Fish
Aquat Sci 79:75–81
Serrano A, Miller EH (2000) How vocal are harp seals
(Pagophilus groenlandicus)? A captive study of seasonal
and diel patterns. Aquat Mamm 26:253–259
Serrano A, Terhune JM (2002) Antimasking aspects of harp
seal (Pagophilus groenlandicus) underwater vocalizations.
J Acoust Soc Am 112:3083–3090
Shaughnessy PD, Kerry KR (1989) Crabeater seals, Lobodon
carcinophagus, during the breeding season: observations
on five groups near Enderby Land, Antarctica. Mar Mamm
Sci 5:68–77
Siniff DB, Bengtson JL (1977) Observations and hypotheses
concerning the interactions among crabeater seals and
leopard seals and killer whales. J Mammal 58:414–416
Siniff DB, Stone S (1985) The role of the leopard seal in the
trophodynamics of the Antarctic marine ecosystem. In:
Siegfried WR, Condy PR, Laws RM (eds) Antarctic nutrient
cycles and food webs. Springer Verlag, Berlin, p 498–515
Siniff DB, Stirling I, Bengtson JL, Reichle RA (1979) Social and
reproductive behavior of crabeater seals (Lobodon
carcinophagus) during the austral spring. Can J Zool 57:
2243–2255
Siniff DB, Garrot RA, Rotella JJ, Fraser WR, Ainley DG (2008)
Projecting the effects of environmental change on Ant-
arctic seals. Antarct Sci 20:425–435
Slabbekoorn H (2004) Singing in the wild: the ecology of bird-
song. In: Marler P, Slabbekoorn H (eds) Nature’s music:
the science of birdsong. Academic Press/Elsevier, San
Diego, CA, p 178–205
Southall BL, Bowles AE, Ellison WT, Finneran JJ and others
(2007) Marine mammal noise exposure criteria: initial sci-
entific recommendations. Aquat Mamm 33:411–414
Southwell C (2005) Diving behaviour of two Ross seals off east
Antarctica. Wildl Res 32:63–65
Southwell C, Kerry K, Ensor P, Woehler EJ, Rogers T (2003)
The timing of pupping by pack-ice seals in East-Antarctica.
Polar Biol 26:648–652
Southwell CJ, Paxton CGM, Borchers DL, Boveng PL, Nordøy
ES, Blix AS, De La Mare WK (2008) Estimating population
status under conditions of uncertainty: the Ross seal in
East Antarctica. Antarct Sci 20:123–133
Stacey RM (2006) Airborne and underwater vocalizations of
the Antarctic Ross seal (Ommatophoca rossii). MSc thesis,
Western Illinois University, Moline, IL
Staicer CA, Spector DA, Horn AG (1996) The dawn chorus
and other diel patterns of acoustic signalling. In:
Kroodsma DE, Miller EH (eds) Ecology and evolution of
acoustic communication in birds. Cornell University Press,
Ithaca, NY, p 426–453
Stirling I (1969) Ecology of the Weddell seal in McMurdo
Sound, Antarctica. Ecology 50:573–586
Stirling I, Siniff DB (1979) Underwater vocalizations of
leopard seals (Hydrurga leptonyx) and crabeater seals
(Lobodon carcinophagus) near the South Shetland Islands,
Antarctica. Can J Zool 57:1244–1248
Stirling I, Thomas JA (2003) Relationships between under-
water vocalizations and mating systems in phocid seals.
Aquat Mamm 29:227–246
Sueur J (2002) Cicada acoustic communication: potential
sound partitioning in a multi-species community from
Mexico (Hemiptera: Cicadomorpha: Cicadidae). Biol J
Linn Soc 75:379–394
Tedman RA, Bryden MM (1979) Cow-pup behaviour of the
Weddell seal, Leptonychotes weddellii (Pinnipedia), in
McMurdo Sound, Antarctica. Aust Wildl Res 6:19–37
Terhune JM, Dell’Apa A (2006) Stereotyped calling patterns
of a male Weddell seal (Leptonychotes weddellii). Aquat
Mamm 32:175–181
Terhune JM, Burton H, Green K (1994) Weddell seal in-air
call sequences made with closed mouth. Polar Biol 14:
117–122
Testa W (1994) Over-winter movements and diving behavior
of female Weddell seals (Leptonychotes weddellii) in
the Southwestern Ross Sea, Antarctica. Can J Zool 72:
1700–1710
Testa JW, Oehlert G, Ainley DJ, Bengtson JL, Siniff DB, Laws
RM, Rounsevell D (1991) Temporal variability in Antarctic
marine ecosystems: periodic fluctuations in the phocid
seals. Can J Fish Aquat Sci 48:631–639
Thomas JA (2002) Ross seal, Ommatophoca rossii. In: Perrin
WF, Wursig B, Thewissen JGM (eds) Encyclopedia of
marine mammals. Academic Press, San Diego, CA,
p 1053–1055
Thomas JA, DeMaster DP (1982) An acoustic technique for
determining diurnal activities in leopard (Hydrurga lep-
tonyx) and crabeater (Lobodon carcinophagus) seal. Can
J Zool 60:2028–2031
Thomas JA, Golladay CL (1995) Geographic variation in leo-
pard seal (Hydrurga leptonyx) underwater vocalizations.
290
➤
➤
➤
➤
➤
➤
➤
➤
➤➤
➤
➤
➤
➤
➤
➤
➤
➤
➤
➤
➤
➤
➤
➤
➤
➤
➤
151

Van Opzeeland et al.: Acoustic ecology of Antarctic pinnipeds
In: Kastelein RA, Thomas JA, Nachtigall PE (eds) Sen-
sory systems of aquatic mammals. De Spil Publishers,
Woerden, p 201–222
Thomas JA, Kuechle VB (1982) Quantitative analysis of
Weddell seal (Leptonychotes weddelli) underwater vocal-
izations at McMurdo Sound, Antarctica. J Acoust Soc Am
72:1730–1738
Thomas JA, Stirling I (1983) Geographic variation in the
underwater vocalizations of Weddell seals (Leptonychotes
weddelli) from Palmer Peninsula and McMurdo Sound,
Antarctica. Can J Zool 61:2203–2212
Thomas J, DeMaster D, Stone S, Andriashek D (1980) Obser-
vations of a newborn Ross seal pup (Ommatophoca rossii)
near the Antarctic peninsula. Can J Zool 58:2156–2158
Thomas JA, Zinnel KC, Ferm LM (1983) Analysis of Weddell
seal (Leptonychotes weddellii) vocalizations using under-
water playbacks. Can J Zool 61:1448–1456
Thomas JA, Puddicombe RA, George M, Lewis D (1988) Vari-
ations in underwater vocalisations of Weddell seals (Lep-
tonychotes weddellii) at the Vestvold Hills as a measure
of breeding population discreteness. Hydrobiologia 165:
279–284
Trillo PA, Vehrencamp SL (2005) Song types and their struc-
tural features are associated with specific contexts in the
banded wren. Anim Behav 70:921–935
Tripovich JS, Charrier I, Rogers TL, Canfield R, Arnould JPY
(2008) Acoustic features involved in neighbour–stranger
vocal recognition in male Australian fur seals. Behav
Processes 79:74–80
Van Opzeeland IC (2010) Acoustic ecology of marine mam-
mals in polar oceans. PhD thesis, University of Bremen
Van Opzeeland IC, Kindermann L, Boebel O, Van Parijs SM
(2008) Insights into the acoustic behaviour of polar pin-
nipeds—current knowledge and emerging techniques of
study. In: Weber EA, Krause LH (eds) Animal behaviour—
new research. Nova Science Publishers, Hauppage, NY,
p 133–161
Van Parijs SM (2003) Aquatic mating in pinnipeds: a review.
Aquat Mamm 29:214–226
Van Parijs SM, Thompson PM, Tollit DJ, Mackay A (1997)
Distribution and activity of male harbour seals during the
mating season. Anim Behav 54:35–43
Van Parijs SM, Hastie GD, Thompson PM (1999) Geographi-
cal variation in temporal and spatial vocalization patterns
of male harbour seals in the mating season. Anim Behav
58:1231–1239
Van Parijs SM, Kovacs KM, Lydersen C (2001) Spatial and
temporal distribution of vocalising male bearded seals—
implications for male mating strategies. Behaviour 138:
905–922
Van Parijs SM, Lydersen C, Kovacs KM (2003) Vocalizations
and movements suggest alternative mating tactics in male
bearded seals. Anim Behav 65:273–283
Van Parijs SM, Lydersen C, Kovacs KM (2004) Effects of ice
cover on the behavioural patterns of aquatic mating male
bearded seals. Anim Behav 68:89–96
Wartzok D, Elsner R, Stone H, Kelly BP, Davis RW (1992)
Under-ice movements and the sensory basis of hole find-
ing by ringed and Weddell seals. Can J Zool 70:
1712–1721
Watkins WA, Ray GC (1985) In-air and underwater sounds of
the Ross seal, Ommatophoca rossi. J Acoust Soc Am 77:
1598–1600
Watkins WA, Schevill WE (1968) Underwater playback of
their own sounds to Leptonychotes (Weddell seals).
J Mammal 49:287–296
291
Editorial responsibility: Hans Heinrich Janssen,
Oldendorf/Luhe, Germany
Submitted: July 27, 2009; Accepted: May 31, 2010
Proofs received from author(s): August 27, 2010
➤➤
➤
➤
➤
➤
➤➤
➤➤
➤
➤➤
➤➤
➤
➤
➤
➤
➤
➤
152

Publication IV
Multi-year patterns in the acoustic behavior of Antarctic pinnipeds
153

MULTI-YEAR PATTERNS IN THE ACOUSTIC BEHAVIOR OF ANTARCTIC
PINNIPEDS
Authors: Ilse Van Opzeeland1, Sofie Van Parijs2, Lars Kindermann1, Olaf Boebel1
1 Alfred Wegener Institute for Polar and Marine Research, Am Handelshafen 26, 27570
Bremerhaven, Germany 2 Northeast Fisheries Science Center, NOAA, 166 Water Street, Woods Hole, MA 02543
USA
Manuscript in preparation
154

ABSTRACT
In this study we investigate seasonal patterns in vocal activity of three Antarctic pinniped
species, Weddell seal (Leptonychotes weddellii), leopard seal (Hydrurga leptonyx) and
Ross seal (Ommatophoca rossii) over three years and two months (2006-2009) of near-
continuous acoustic data from the PerenniAL Acoustic Observatory in the Antarctic
Ocean (PALAOA), 70°31’S, 8°13’W on the Eckström Iceshelf. For each species, one call
type was selected to represent acoustic presence and used for development of automated
detectors. Weddell seals calls were detected from April to December, while the number
of calls varied between years, possibly reflecting a relation to local ice conditions in Atka
Bay. Leopard seal calls were detected intermittently throughout the year, which might
reflect that some (potentially juvenile) leopard seals remain in near-shore areas during
austral winter. In all years, leopard seal call activity decreased rapidly with increasing
Ross seal acoustic activity in December, possibly reflecting that leopard seals actively
reduce call activity when Ross seals start to dominate the local soundscape. Peaks in Ross
seal call activity corresponded to the coincidence of short duration changes in ice cover
concentration, suggesting a relation between vocal activity and the presence of pack-ice
in the area off PALAOA. This manuscript is still in preparation. Further analyses will
involve 1) analysis to relate call detections to actual call rates and extract diel call
patterns from automatically detected calls, 2) more detailed investigation with respect to
the spatial scale of ice cover data from the area off PALAOA and its representativeness
of specific pinniped ice habitats, 3) statistical analyses of the automated call detections to
explore annual patterns involving time series analysis, 4) more detailed investigation of
the temporal pattern of the occurrence of leopard seal call type variants (juvenile calls).
155

INTRODUCTION
In species that use vocalizations for intersexual display or intra-sexual competition, the
timing, location and duration of acoustic behavior is expected to maximize the chances of
obtaining a mate while minimizing the costs of display, both in terms of energy and
predation risk (Krebs & Davies 1993; Bradbury & Vehrencamp 1998). To achieve this,
animals often use, or in some cases depend on, biotic and/or abiotic cues from the
environment. This results in temporally dynamic vocal behavior, linked directly or
indirectly (e.g. through prey availability) to cycli in environmental factors such as light
conditions and temperature (e.g. Blankenhorn 1972; Stafford et al. 2005). To cope with
fluctuations in their living environment, vocal behavior often exhibits a certain level of
plasticity e.g., in the acoustic characteristics of communication signals or the timing of
acoustic behavior (e.g. Miller et al. 2000; Fuller et al. 2007). For example, male song rate
in pied flycatchers (Ficedula hypoleuca) during the breeding season is dependent on food
resources and temperature (Gottlander 1987). In tawny owls (Strix aluco), rain fall
substantially reduces territorial night-time call activity, presumably in response to the
reduction in communication space caused by the increased ambient noise levels during
rain (Lengagne & Slater 2002). The relationship between environmental fluctuations and
temporal variation in vocal behavior can be used to gain insight into the factors that shape
acoustic behavior and are therefore of specific relevance to the organism. Information on
factors of influence can in turn be used to better understand the function of vocal
behavior and the acoustic ecology of a species; the relationship between the organism and
the environment mediated through sound.
Temporal variation in vocal behavior can be studied at various scales. However, in most
cases cyclical patterns and fluctuations in acoustic behavior in response to environmental
factors are best studied using multi-year data. These allow direct comparison of patterns
on various temporal scales while avoiding temporal inter-dependency (e.g. seasonal
variation in diel call activity). In this study, we investigate hypotheses on the acoustic
ecology of Antarctic pinnipeds that have been proposed in a previous study (Van
Opzeeland et al. 2010), using semi-continuous acoustic data from 3+ years.
156

In our previous study, several mechanisms were discussed as to which factors
shape the timing of vocal behavior of four Antarctic pinniped species, Weddell seal
(Leptonychotes weddellii), leopard seal (Hydrurga leptonyx), Ross seal (Ommatophoca
rossii) and crabeater seal (Lobodon carcinophaga). All four species are aquatic mating
and are thought to use vocalizations in male-male competition and/or male advertisement
to females. Nevertheless, the mating system of each species differs substantially; Weddell
seal males are thought to maintain underwater territories below the Antarctic fast-ice,
whereas leopard seals are solitary with both males and females using calls to attract
mating partners over long distances. Crabeater seal males guard females on the ice and
are thought to use their calls for short-range underwater male-male competition. To date,
only little is known on the mating system of Ross seals (but see Van Opzeeland et al.
2010). Given the difference in function of calls between all species, those species using
calls to communicate over larger distances, such as leopard and Ross seals, were
hypothesized to be more sensitive to acoustic interference by other species compared to
those with shorter communication ranges. Leopard and Ross seals could therefore be
expected to time their vocal activity during periods with little acoustic interference from
other pinniped species. Furthermore, all species differ in the ice types used for breeding;
while Weddell seals breed exclusively on fast-ice, leopard, Ross and crabeater seals all
use different types of pack-ice for breeding (Siniff et al. 2008). Annual fluctuations in the
availability and quality of each ice-type have been shown to affect pinniped behavior and
vocal behavior (Van Parijs et al. 2004; Siniff et al. 2008) and might be expected to affect
each species differently (Van Opzeeland et al. 2010).
The questions we address in this study are:
1) How stable is the seasonal pattern in acoustic presence for all species when
compared over multiple years?
2) Is there an interaction between local ice conditions and vocal behavior of
Antarctic pinnipeds?
3) Is there evidence for inter-specific interactions based on the species-specific
timing of acoustic activity?
157

METHODS
Acoustic data
The PerenniAL Acoustic Observatory in the Antarctic Ocean (PALAOA) is located at
70°31’S, 8°13’W on the Eckström Iceshelf, eastern Weddell Sea coast, Antarctica (Fig 1,
Boebel et al. 2006; Klinck 2008). Recordings are made continuously year-round with two
hydrophones deployed underneath the 100 m thick floating Antarctic ice shelf through
bore-holes with an in-between distance of 300 m (see Kindermann et al. 2008 for further
technical details). The effective bandwidth of the PALAOA recordings is 10 Hz to 15
kHz, dynamic range 60 dB to 150 dB re 1 µPa.
Signals are digitized at 48 kHz/16 bit and encoded to a 192 kBit MP3 stream by a
BARIX Instreamer device. For this study data from January 2006 until February 2009
were used. Figure 2 shows the total recording time in days of PALAOA from 2006 to
2009. No recordings for July and November 2006 and May 2007 are available due to
either technical failure or energy shortages at the observatory.
Detector development
Based on previous manual analyses of vocal repertoire composition and temporal
variation in call type usage (Van Opzeeland et al. 2010), one call type for each species
was selected to be automatically detected. To represent acoustic presence of the species
throughout the year, only call types that composed a significant portion of the vocal
repertoire showing relatively little temporal variation in usage were selected. In addition,
call types were required to be sufficiently stereotyped or at least exhibit stereotyped parts
to allow for automated detection. Pinniped calls were detected using the ‘data template
detector’ in XBAT (Bioacoustics Research Program, Cornell Lab of Ornithology,
www.xbat.org). The data template detector scans the recorded sound and compares it to
selected spectrogram sections (‘templates’), which are sections of sounds known to be
produced by the target species. Acoustic similarity between the template and the acoustic
events in the recording is quantified through spectrogram cross-correlation. Events for
which the correlation value exceeds a specified threshold are detected and stored in ‘logs’
in XBAT.
158

Two to three different detectors each consisting of a different set of templates
were created for each species. Using the ‘Explain’ function in XBAT, which shows
correlation value between the template and the acoustic events in the recording, one
detector was selected based on its specifity for target calls. To evaluate at which
threshold settings the detector performed best, detector output at different threshold
settings was compared to manual analysis of the same data. The manual counts were also
performed in XBAT by manually detecting and selecting all target calls occuring on three
randomly selected days and saving them in a manual log. Manual logs were created blind
from detector output, i.e. without knowledge on which calls the detector would detect or
miss. The days for which manual logs were created were randomly selected from three
months between which vocal activity of each species was known to vary substantially
based on previous analyses (i.e. one day in a month with peak vocal activity, one day in a
month with little to no vocal activity; Van Opzeeland et al. 2010). For each species,
manual logs were compared to the output of detector runs with detection thresholds from
0.05 to 0.55, in steps of 0.10. The purpose of automated detection in this study was to
provide a reliable measure of acoustic presence for each species. The evaluation of
detector performance therefore based on presence and absence of calls on an hourly basis,
i.e. a match between manual and detector log was counted as 1, irrespective of the
number of matches occurring within the same hour. False positive (FPR, FP/FP+TN) and
true positive rates (TPR, TP/TP+FN) of the detector were calculated for all threshold
settings and combined in a receiver operating characteristic (ROC) curve. For months
during which calls were present in each hour, graphs show TPR at different threshold
settings, whereas for months during which calls were absent in each hour, graphs show
FPR at different threshold settings. This approach enabled the evaluation of which
threshold optimized the TPR while minimizing FPR.
Detectors were developed for three species, Weddell, leopard and Ross seal. Calls of the
fourth Antarctic pinniped species, the crabeater seal, were found to exhibit too few
stereotyped features to use the template detection method and were therefore not analysed
in this study.
159

Weddell seals
For Weddell seals, call type W2 was one of the most frequently used call types,
composing 13% of the vocal repertoire. The manual analysis showed that call type W2
was a good indicator of Weddell seal vocal presence and showed least variation in usage
between months (Fig 3). Call type W2 consists of a falling chirp sequence that is always
precedented by an upsweeping whistle (Fig 4). The frequency and duration of the chirp
sequence varies between call types, while the whistle part is very stereotyped and season-
independent in its acoustic characteristics. Three different detectors were developed, each
consisting of several data templates of different parts of the whistle. For the evaluation of
the performance of each detector, one day for each month was randomly selected for
January (low vocal activity), June (high vocal activity period in mid-winter) and
November (high vocal activity and peak mating season). Figure 5 shows the performance
of each detector at different threshold settings. For the detections runs a threshold of 0.4
was selected (spectrogram parameters: FFT size 4048 points, window size = 30s, max
freq = 5000 Hz, window length = 1, window function = Hanning).
Leopard seals
For leopard seals, call type L6 is the call type that is most frequently used (62% of the
vocal repertoire, Fig 6). The relative rarity of the other call types and the stereotyped
nature of call type L6 made this call type the best representative of leopard seal acoustic
presence. Call type L6 (‘low double trill’) consists of two nearly identical call parts,
separated by a short pause (Fig 7). In many cases, the first call part of L6 is precedented
by a short narrow-band tone. Data templates were created from parts of the two identical
call parts as well as from the narrowband start tone. Three different detectors were
developed and evaluated based on randomly selected days in January (moderate vocal
activity), June (no vocal activity) and December (peak vocal activity). Based on detector
evaluation (Fig 8), a threshold of 0.5 was selected for detector runs (spectrogram
parameters: FFT size 4048 points, window size = 30s, max freq = 2000 Hz, window
length = 1, window function = Hanning).
160

Ross seals
Call type R3 composed a stable 40% of the Ross seal vocal repertoire over the period that
Ross seals were vocally present (Van Opzeeland et al. 2010, Fig 9). Call type R3 is a
tonal V-shaped call, which in some cases is precedented or followed by an additional up-
or down-sweep, respectively (Fig 10). Nevertheless, the V-shaped part is stereotyped in
shape and always present. Three different detectors were developed and evaluated based
on randomly selected days in January (peak vocal activity), June (no vocal activity) and
December (moderate vocal activity). For the multi-year detection runs, a threshold of 0.5
was selected (Fig 11, spectrogram parameters: FFT size 4048 points, window size = 30s,
max freq = 2000 Hz, window length = 1, window function = Hanning).
Local ice cover
The percentage of ice cover was calculated for the area within a 40 km radius off
PALAOA from ENVISAT ice cover data with a 6.25 x 6.25 km resolution (Spreen et al.
2008). The 40 km radius was chosen based on preliminary estimations of the range over
which pinniped calls are recorded by PALAOA.
To relate pinniped acoustic behavior to changes in local ice cover in a way that these are
comparable between years, a measure for the time point of break-up of the fast-ice within
a 40 km radius off PALAOA was sought. The timing of break-up was defined as the
point in time at which the local ice concentration decreased below 80% followed by a
minimum period of one month during which ice cover remains below 80%. This
definition was partly based on field experience and perusal of satellite pictures of the
area.
RESULTS
Annual pattern in call detections
Weddell seal calls were detected from April to December in 2006, from June to
December in 2007 and from April to December in 2008 (Fig 12a). The number of calls
that was detected was substantially lower in 2007 compared to the other years, with an
average of 6 calls per recording hour for 2006 and 2008 and an average of 2 calls per
161

recording hour in 2007. Most calls were detected in December 2006 (average of 12 calls
per recording hour). Peak numbers of detected calls per recording hour occurred on 4
December 2006 (44 calls per recording hour) and 2 June 2008 (24 calls per recording
hour). In 2007, the maximum number of calls per recording hour detected per day was 8
occurring on 11 and 23 November 2007 and 3, 4 and 7 December 2007.
Leopard seal calls were detected over eight months, in January and February and from
May to Dec in 2006 (Fig 12b). In 2007, calls were detected over all months except March
and August, totalling nine months, whereas in 2008 calls were present over 11 months
(all months except February). Calls were detected outside the period during which they
were expected to be present based on the manual analysis of the 2006 PALAOA data. To
be sure that these calls were actual leopard seal calls all detections outside the period
from October-January were manually reviewed. Although occassional false detections
occurred (and were removed from the log), the majority of detections were actual leopard
seal L6 calls. Based on overall call shape (Rogers 2007) these are likely juvenile calls
(Fig 13). The average number of calls per recording hour did not differ much between
years with 42 calls per recording hour detected in 2006, and 49 calls per recording hour
in 2007 and 2008). Most calls were detected in December in all years, with an average of
265, 334 and 333 calls detected per recording hour for December 2006, 2007 and 2008
respectively. Peak numbers of detected calls per recording hour occurred on 12
December 2006 (583 calls per recording hour), 26 December 2007 (533 calls per
recording hour) and 21 December 2008 (599 calls per recording hour). The number of
calls detected during austral winter (April to September) was generally low, ranging from
1 to 14 calls per recording hour (average 0.59, 0.16 and 0.96 calls per recording hour for
2006, 2007 and 2008 respectively).
Ross seal calls were detected in January and December in all three years and in February
in 2007 and 2008 (Fig 12c). The number of detected calls per recording hour over these
three months varied substantially between months with 6 calls per recording hour in 2006
and 25 and 15 calls per recording hour in 2007 and 2008 respectively. The timing of the
onset of Ross seal vocal activity is strikingly similar between years (17, 19 and 24
162

December in 2006, 2007 and 2008, respectively, noting that in 2008 the presence of a
ship near PALAOA on 17 December might have affected the number of Ross seal call
detections). In all four years, most calls were detected in January, with peaks occurring
on 10 January 2006, 12 January 2007, 5 January 2008 and 19 January 2009 (58, 274, 138
and 183 calls per recording hour for 2006, 2007, 2008 and 2009, respectively).
Annual calling patterns and ice cover
Figure 14 shows the normalized number of calls detected per species and the ice
concentration within a radius of 40 km off PALAOA for the entire period over which
recordings were analyzed. The black dots mark the timing of ice break-up according our
definition. The blue bars in the graph indicate the period from peak number of Weddell
seal calls detected to the point where no calls were detected. In 2007 and 2008, this
period coincides with ice break-up, whereas in 2009, ice break-up occurs well before the
occurrence of the peak in vocal activity. Similary, the peak in the number of leopard seal
call detections coincided with ice break-up in 2007 and 2008, whereas in 2009, the peak
in call activity occurs around the same time as in other years and seems independent of
the early occurrence of ice break-up. Ross seal call activity typically showed two peaks in
all years (green dotted lines). In 2006, 2007 and 2009, peak call activity occurred after ice
concentrations had increased again, presumably as a result of pack-ice drifting into the
area. In 2008, the first peak in Ross call activity occurred earlier compared to other years
and preceeded the temporal increase in ice cover.
Interspecific interactions
The timing of the first peak in Ross seal vocal activity coincides in all years with a
dramatic decrease in the number of leopard seal call detections (Fig 14, red dotted lines).
DISCUSSION
Automated detection methods such as the template detection method used in this study,
allow detailed and objective analyses of large acoustic data sets. In this study we used
one call type as acoustic representative for each pinniped species and optimized detector
163

performance to provide reliable information on the acoustic presence of each species on
an hourly basis. This detector characteristic along with the fact that only one call type of
each species is detected makes it difficult to translate the number of detections to actual
call rates. Nevertheless, further analyses of the output of our detectors will explore how
detection rates relate to actual call activity. Furthermore, patterns in hourly presence and
absence of each pinniped species will also be investigated in more detail.
Annual pattern in call detections
Weddell seals
Our manual analysis showed that calls were present in all months of the year, except in
February, whereas the automated analysis detected Weddell seal calls from April to
December. In January and March calls were relatively faint and few in number (Van
Opzeeland et al. 2010), which might explain why the data template detector did not
detect any calls in these months. The near year-round presence of Weddell seal calls
likely reflects their territorial mating strategy; males that occupy territories year-round
might have an advantage over non-territorial males or males that move away in winter, in
that they are already resident when females arrive at the breeding area. The fact that in all
years many calls were detected in austral winter might reflect that males are actively
engaged in acoustic displays in the breeding area for most of the year.
Overall, the number of detected Weddell seal calls was substantially lower in
2007 compared to the other years. Changes in local signal-to-noise ratios might influence
the number of calls detected (see discussion leopard seal below). However, the number of
detections was lower throughout the whole of 2007, whereas the number of calls detected
for the other two species did not show similar differences between years. Manual perusal
of the recordings from 2007 also suggests that the lower number of detections is unlikely
related to differences in detector performance, but rather reflects an actual lower number
of calls in this year. Environmental conditions of specific relevance to Weddell seals
might therefore somehow have differed between years, resulting in either fewer animals
present in Atka Bay or a change in the location of colonies, causing fewer calls to be
recorded by PALAOA. Weddell seal colonies are located in the vicinity of fast-ice leads
164

or cracks in the ice around icebergs within Atka Bay and just north of PALAOA.
Changes in the position or number of icebergs can therefore affect the location where
Weddell seal colonies form and thereby affect the number of animals within the
recording range of PALAOA. Possibly, the sudded drop in ice cover in April 2007 (Fig
13) affected the settlement of Weddell seal colonies in Atka Bay in that year. While a
more detailed investigation of local ice conditions in Atka Bay might provide some
further information on interannual differences in ice cover and iceberg positions, data on
Weddell seal colony sizes and locations are currently lacking. Future work involving
localization of calling animals, will contribute to further our understanding of the relation
between ice conditions and Weddell seal vocal behavior.
Leopard seals
Most leopard seal calls were detected during the leopard seal breeding season (October –
January, Van Opzeeland et al. 2010), with a relatively stable number of detections in
each year. The sudden decreases in leopard seal call detections in mid December 2007
and 2008 are likely explained by the presence of a ship in the area off PALAOA.
Previous analysis showed that the template detector fails to detect leopard seal calls in the
presence of ship noise, while an analyst can still reliably detect them under these noise
conditions (Boebel & Van Opzeeland, unpublished data). Calls are therefore likely
present, but fail to be detected by the template detector during the days that the ship is
present. This will be subject of further study.
The detection of leopard seal calls outside the breeding season contrasted to the
manual analysis of the 2006 PALAOA data (Van Opzeeland et al. 2010). The leopard
seal calls that were automatically detected outside the breeding season were clearly
recognizable as leopard seal calls and it is therefore highly unlikely that they were missed
in the files that were manually analysed. Instead, the sampling regime that was used
during manual analysis in combination to the relative rarity of leopard seal calls in this
period is likely the reason why these calls were not present in any of the files that were
manually analysed.
165

Interestingly, the leopard seal L6 call detector also detected incomplete L6 calls,
which have been previously described by Rogers (2007) as juvenile variants of adult
broadcast call types. These calls are thought to be produced by juveniles practicing adult
vocalization types (Rogers 2007). Variants of call type L6 were mainly detected in
September (but also in June and October) during distinct bouts of a few hours most often
occuring at the end of the day. In most cases, L6 variants were present along with normal
L6 calls. Rogers (2007) showed that juvenile leopard seals are often capable of producing
both the variants and the adult version of call types. It is therefore difficult to draw
conclusions on group composition, i.e. if both adult and juveniles or only juveniles were
present outside the breeding season. However, temporal patterns of occurrence and the
presence of other call type variants will be topic of further analyses of the data.
The presence of juvenile and adult leopard seal calls in austral winter suggests
that leopard seal migratory behavior might be more variable than previously assumed.
The majority of studies has found leopard seals to migrate north with the expansion of the
pack-ice around April (e.g. Walker et al. 1998; Forcada & Robinson 2006; Nordøy &
Blix 2009). Juvenile leopard seals often migrate even further north and the proportion of
immature seals increases with decreasing latitude (e.g. Rounsevell & Pemberton 1994;
Rogers et al. 2005). However, Rogers et al. (2005) found that tagged adult leopard seals
did not reflect the usual northward migration and remained in relatively near-shore areas
throughout austral winter. They suggested that it might be primarily younger animals that
migrate north, while adult leopard seals are more sedentary. The presence of juvenile
vocalizations in the PALAOA recordings nevertheless suggests that juveniles also remain
in near-shore areas and that juvenile dispersal is not restricted to northern waters.
Juvenile dispersal is often related to competition for resources (i.e. mates or food;
Dobson 1982) and might therefore also be site-dependent. Krill is thought to be an
important food source for leopard seals in winter (Øritsland 1977). The winter presence
of humpback whales (Megaptera novaeangliae) in the area off PALAOA (Van
Opzeeland et al. in prep) might reflect that there are sufficient food resources for animals
to winter in this area.
166

Ross seals
Ross seal vocal presence was restricted to December, January and February, with most
calls detected in January in all years. The strong seasonal pattern in acoustic presence
might reflect either that the physical presence of Ross seals in the area off PALAOA is
restricted to these months or that vocal activity only occurs in this period. To our
knowledge there are no studies that have recorded Ross seal vocalizations outside these
months (studies that have recorded Ross seal calls, other than PALAOA, are summarized
in Stacey 2007), which might reflect that Ross seals only vocalize during the breeding
season. Strongly seasonal vocal activity also occurs in harbor seals (Phoca vitulina), with
males vocalizing only during the 40-day mating season (Van Parijs et al. 1999).
Annual calling patterns and ice cover
In contrast to our expectations, the number of Weddell seal call detections seemed
relatively independent of the timing of ice-break-up. Weddell seals breed on fast-ice and
the transition of their stable breeding substrate to mobile pack-ice floes was expected to
compromise the possibility for males to maintain underwater territories (Van Opzeeland
et al. 2010). We therefore expected Weddell seal to be more reliant on ice-conditions and
time their peak vocal activity in November (corresponding to the peak mating season,
Van Opzeeland et al. 2010) accordingly. Given that ice coverage was calculated for a 40
km range off PALAOA, it cannot be excluded that ice cover shows strong local
differences and that it is mainly the area north of Atka Bay where large scale transitions
in ice type take place. As pointed out previously, further analyses of the data will
investigate the relation between the number of Weddell seal call detections and local ice
cover (i.e., only Atka Bay) in more detail.
In leopard seals, the timing of vocal activity did not correspond to any specific
feature in ice conditions, but rather seemed to correspond to a fixed time window
between October and February. This apparent independence of ice conditions might be
explained by a similar mismatch between the area over which mean ice cover was
calculated and the area occupied by leopard seals as discussed in the context of Weddell
seals. Alternatively, leopard seals might time their vocal behavior based on other
167

environmental factors than ice. Leopard seals depend on ice during the period that
females give birth to pups and suckle them on the ice. Mating in leopard seals is thought
to not immediately follow the weaning of pups and has been suggested to be postponed,
possibly by as much as a month (Siniff & Stone 1985). Calls are produced in a mating
context during which both sexes vocalize underwater to attract mating partners over
relatively long distances (Rogers et al. 1996). Ice conditions might therefore not be as
important for leopard seals during the mating season. Instead, as hypothesized in our
previous study, leopard seals might time their vocal activity to coincide with the presence
of food sources such as penguin chicks and pinniped weanlings, the presence of which
might depend less on the ice conditions within a 40 km range off PALAOA.
The number of Ross seal call detections was substantially lower in 2006
compared to the other years. A previous study showed Ross seal call activity in
December 2005 to be much lower than in December 2006 (Seibert et al. 2007), reflecting
that actual call activity was generally lower in the 2005-2006 season compared to other
years. Much remains to be speculated with respect to Ross seal behavior, as so little is
known on the biology of this species. The coincidence of the peaks in the number of Ross
seals call detections and the short duration peaks in ice cover, suggest a relationship
between vocal activity and the presence of pack-ice in the area off PALAOA. Possibly,
Ross seals arrive (either actively swimming or passively drifting on floes) with the pack-
ice in January. The substantially lower ice coverage in January 2006 might reflect that
less pack-ice is present in the area in that year, resulting in a lower number of animals
present.
Interspecific acoustic interactions
Interspecific acoustic interactions are likely to be of specific importance for the species
that use their calls to communicate over long distances and rely mainly on vocalizations
to find a mating partner, such as the leopard seal. In our previous study, we hypothesized
that the temporal segregation in pinniped acoustic activity that we observed might have
resulted from interspecific acoustic interference. The results of the automated detection of
Ross and leopard seal calls seem to confirm our hypothesis and are in accordance with
168

our manual analysis, showing that leopard seal call activity decrease rapidly with
increasing Ross seal call activity. Manual inspection of the detector output confirmed that
leopard seal call activity decreased as soon as Ross seal vocalizations became abundant,
excluding the possibility that performance of the leopard seal L6 detector was influenced
by the presence of Ross seal calls. Although the point in time in January at which no
leopard seal calls were detected differs between years, it coincided in all years with the
first peak in the number of Ross seal call detections. The ‘acoustic plenitude’ (i.e., the
breadth of the frequency band covered and the temporal density of calls) of Ross seals in
the soundscape of Atka Bay is likely to leave little communication space for leopard
seals. Given the high energetic costs of producing broadcast calls (Rogers 2003), it might
be more advantageous for leopard seals to reduce call activity when Ross seals start to
dominate the local soundscape.
Outlook
This manuscript is still in preparation. Further analyses are foreseen and will involve 1)
analysis to relate call detections to actual call rates and if possible extract diel call
patterns from the automatically detected calls, 2) more detailed investigation with respect
to the spatial scale of ice cover data from the area off PALAOA and its
representativeness of specific pinniped ice habitats, 3) statistical analyses of the
automated call detections to explore annual patterns involving time series analysis, 4)
more detailed investigation of the temporal pattern of the occurrence of leopard seal call
type variants (juvenile calls).
ACKNOWLEDGEMENTS
S. Riedel, D. Steinhage, A. Ziffer and the overwintering teams 2005 and 2006 (Alfred
Wegener Institute for Polar and Marine Research, Bremerhaven, Germany), H. Schubert,
(Reederei F. Laeisz GmbH, Rostock, Germany), R. Verhoeven, J. Hoffmann and C.
Müller (FIELAX Services for Marine Science and Technology mbH, Bremerhaven,
Germany), all played a crucial role in setting up and/or maintaining PALAOA. The
169
PALAOA project was partly funded by the Bremerhavener Gesellschaft für
Innovationsförderung und Stadtentwicklung (BIS).
REFERENCES
Blankenhorn HJ (1972) Meteorological variables affecting onset and duration of calling
in Hyla arborea and Bufo calamita. Oecologia 9: 223-234.
Boebel O, Kindermann L, Klinck H, Bornemann H, Plötz J, Steinhage D, Riedel S,
Burkhardt E (2006) Real-time underwater sounds from the Southern Ocean. Eos
Transactions, American Geophysical Union 87: 361-362
Bradbury JW, Vehrencamp SL (1998) Principles of Animal Communication. Sinauer,
Dobson FS (1982) Competition for mates and predominant juvenile male dispersal in
mammals. Animal Behaviour 30: 1183-1192
Forcada J, Robinson SL (2006) Population abundance, structure and turnover estimates
for leopard seals during winter dispersal combining tagging and photo-identification.
Polar Biology 29: 1052-1062
Fuller RA, Warren PH, Gaston KJ (2007) Daytime noise predicts nocturnal singing in
urban robins. Biology Letters 3: 368-370
Gottlander K (1987) Variation in the song rate of the male pied flycatcher Ficedula
hypoleuca: causes and consequences. Animal Behaviour 35: 1037-1043
Kindermann L, Boebel O, Bornemann H, Burkhardt E, Klinck H, Van Opzeeland IC,
Plötz J, Seibert AM (2008) A Perennial Acoustic Observatory in the Antarctic Ocean,
Computational bioacoustics for assessing biodiversity. Bundesamt für Naturschutz
Skripten 234: 15-28
Klinck H (2008) Automated passive acoustic detection, localization and identification of
leopard seals. PhD dissertation, University of Trier, Germany. Reports on Polar and
Marine Research, 582, 155 pp
Krebs JR, Davies NB (1993) An introduction to behavioral ecology. 3rd edition.
Blackwell Science, Oxford, UK
170

Lengagne T, Slater PJB (2002) The effects of rain on acoustic communication: tawny
owls have good reason for calling less in wet weather. Proceedings of the Royal Society
of London B 269: 2121-2125
Miller PJO, Biassoni N, Samuels A, Tyack PL (2000) Whale songs lengthen in response
to sonar. Nature 405; 903
Nordøy ES, Blix AS (2009) Movements and dive behaviour of two leopard seals
(Hydrurga leptonyx) off Queen Maud Land, Antarctica. Polar Biology 32: 263-270
Øritsland T (1977) Food consumption of seals in the Antarctic pack ice. In: Llano GA
(ed) Adaptations within Antarctic Ecosystems. Gulf Publishing Co., Houston, pp 749-768
Rogers TL (2003) Factors influencing the acoustic behaviour of male phocid seals.
Aquatic Mammals 29: 247-260
Rogers TL (2007) Age-differences in the acoustic characteristics of male leopard seals,
Hydrurga leptonyx. Journal of the Acoustical Society of America 122: 596-606
Rogers TL, Cato DH, Bryden MM (1996) Behavioral significance of underwater
vocalizations of captive leopard seals, Hydrurga leptonyx. Marine Mammal Science 12:
414-427
Rogers TL, Hogg CJ, Irvine A (2005) Spatial movement of adult leopard seals (Hydrurga
leptonyx) in Prydz Bay, Eastern Antarctica. Polar Biology 28: 456-463
Rounsevell D, Pemberton D (1994) The status and seasonal occurrence of leopard seals,
Hydrurga leptonyx, in Tasmanian waters. Australian Mammalogy 17: 97-102
Seibert, A.-M., Klinck, H., Kindermann, L., Bornemann, H., Van Opzeeland, I., Plötz, J.,
Boebel, O. (2007). Characteristics of underwater calls of the Ross seal. 17th Biennial
Conference on the Biology of Marine Mammals, 29 November - 3 December 2007, Cape
Town, South Africa
Siniff DB, Garrot RA, Rotella JJ, Fraser WR, Ainley DG (2008) Projecting the effects of
environmental change on Antarctic seals. Antarctic Science 20: 425-435
Siniff DB, Stone S (1985) The role of the leopard seal in the trophodynamics of the
Antarctic marine ecosystem. In: Siegfried WR, Condy PR, Laws RM (eds) Antarctic
nutrient cycles and food webs. Springer Verlag, Berlin, Germany, p 498-515
Spreen G, Kaleschke L, Heygster G (2008) Sea ice remote sensing using AMSR-E 89
GHz channels. Journal of Geophysical Research 113: C02S03.
171

Stacey RM (2006) Airborne and underwater vocalizations of the Antarctic Ross seal
(Ommatophoca rossii). MSc Thesis, Western Illinois University, Moline, Illinois
Stafford KM, Moore SE, Fox CG (2005) Diel variation in blue whale calls recorded in
the eastern tropical Pacific. Animal Behaviour 69: 951-958
Sunderland, Massachusetts.
Van Opzeeland IC, Van Parijs SM, Bornemann H, Frickenhaus S, Kindermann L, Klinck
H, Ploetz J, Boebel O (2010) Acoustic ecology of Antarctic pinnipeds. Marine Ecology
Progress Series, 414: 267-291.
Van Opzeeland IC, Van Parijs SM, Kindermann L, Burkhardt E, Boebel O Calling in the
cold: pervasive acoustic presence of humpback whales (Megaptera novaeangliae) in
Antarctic coastal waters. Submitted to Proc Roy Soc B, June 2010
Van Parijs SM, Hastie GD, Thompson PM (1999) Geographical variation in temporal and
spatial vocalization patterns of male harbour seals in the mating season. Animal
Behaviour 58: 1231-1239
Van Parijs SM, Lydersen C, Kovacs KM (2004) Effects of ice cover on the behavioural
patterns of aquatic mating male bearded seals. Animal Behaviour 68: 89-96
Walker TR, Boyd IL, McCafferty DJ, Huin N, Taylor RI, Reid K (1998) Seasonal
occurrence and diet of leopard seals (Hydrurga leptonyx) at Bird Island, South Georgia.
Antarctic Science 10: 75-81
172

FIGURE LEGENDS
Figure 1. Bathymetry map showing the location of PALAOA (white star) and location of
the German Neumayer Station II (black star). Inset image: map of Antarctica showing the
location of Neumayer Station (black star).
Figure 2. PALAOA yearly coverage, showing the total recording time in days for each
year from 2006 to 2009.
Figure 3. Occurrence of Weddell seal call types based on manual counts of calls over one
year of PALAOA data from 2006 (Van Opzeeland et al. 2010). For each month the
number of calls counted per call type is indicated. Call type W2 was one of the most
reliable call types to represent Weddell seal acoustic presence over all months. No data
were available for July and November 2006 due to temporary failure of the observatory.
Figure 4. Spectrogram of Weddell seal call type W2 with the stereotyped whistle part
(zoom image) that was used for automated detection of this call type.
Figure 5. Performance of Weddell seal W2-call detector at different thresholds for one
day for January (low vocal activity), June (high vocal activity period in mid-winter) and
November (high vocal activity and peak mating season).
Figure 6. Occurrence of leopard seal call types based on manual counts of calls over one
year of PALAOA data from 2006 (Van Opzeeland et al. 2010). For each month the
number of calls counted per call type is indicated. Call type L6 was the most reliable call
types to represent leopard seal acoustic presence over all months. No data were available
for July and November 2006 due to temporary failure of the observatory.
Figure 7. Spectrogram of leopard seal call type L6. Parts of the start part of the call as
well as parts of the two symmetrical call parts were used for automated detection of this
call type.
173

Figure 8. Performance of leopard seal L6-call detector at different thresholds for one day
for January (medium vocal activity), June (no vocal activity) and December (peak vocal
activity and peak mating season).
Figure 9. Occurrence of Ross seal call types based on manual counts of calls over one
year of PALAOA data from 2006 (Van Opzeeland et al. 2010). For each month the
number of calls counted per call type is indicated. Call type R3 was the most reliable call
types to represent Ross seal acoustic presence over all months. No data were available for
July and November 2006 due to temporary failure of the observatory.
Figure 10. Spectrogram of Ross seal call type R3.
Figure 11. Performance of Ross seal R3-call detector at different thresholds for one day
for January (peak vocal activity), June (no vocal activity) and December (moderate vocal
activity).
Figure 12. Number of detections (real numbers) per recording hour for a) Weddell
(blue), b) leopard (red) and c) Ross seals (green) from January 2006 to March 2009.
Acoustic presence (AP) is indicated by the upper colored bar (bar present = calls have
been detected). The grey bar (PAL) indicates the recording status of PALAOA (bar
present = observatory is recording).
Figure 13. Spectrogram of a leopard seal calls: a) LDT recorded on 13 June 2007, b)
possible juvenile variant of ascending trill, recorded on 14 June 2007.
Figure 14. Number of detections per recording hour in relation to percentage ice cover for
the area 40 km off PALAOA. Upper plot shows the normalized number of call detections
for all three species from January 2006 to March 2009. The lower graph shows
percentage ice cover for the area within a 40km range off PALAOA from January 2006
to March 2009. Black dots indicate the timing of ice break-up: the point in time at which
the local ice concentration decreased below 80% followed by a minimum period of one
174

month during which ice cover remains below 80%. Blue bars indicate period from peak
number of Weddell seal calls detected to no calls were detected. Red dotted line indicates
first day after leopard seal calling period on which no leopard seal calls were detected.
Green dotted lines indicate the timing of the two peaks in the number of Ross seal calls
detected.
Figure 15. Twentyfour-hour spectrogram of PALAOA recordings from 26 December
2009, illustrating how Ross seals temporarily dominate the soundscape at PALAOA.
Inset image: 1-minute spectrogram of Ross seal calls, which cover a broad frequency
range (~100 – 4000 Hz) and occur frequently in time.
175

FIGURES
Dronning
Maud Land
Neumayer
South Pole
Dronning
Maud Land
Neumayer
South Pole
Fig 1
176

PALAOA Yearly Coverage
Tota
l re
cord
ing
tim
e p
er
yea
r [d
ays]
Fig 2.
177

Fig
3.
Wed
dell
seal
-To
tal
nu
mb
er
of
call
s p
er
call
typ
e (
man
ual
co
un
ts 2
006 d
ata
)
0
50
0
10
00
15
00
20
00
25
00
Jan-0
6F
eb
-06
Mar-
06
Ap
r-0
6M
ay-0
6Jun-0
6Jul-0
6A
ug
-06
Se
p-0
6O
ct-
06
No
v-0
6D
ec-0
6Jan-0
7F
eb
-07
Number of calls counted
W1
W2
W3
W4
W5
W6
W7
W8
W9
W1
0
W1
1
W1
2
W1
3
W1
4N
O D
AT
AN
O D
AT
A
178
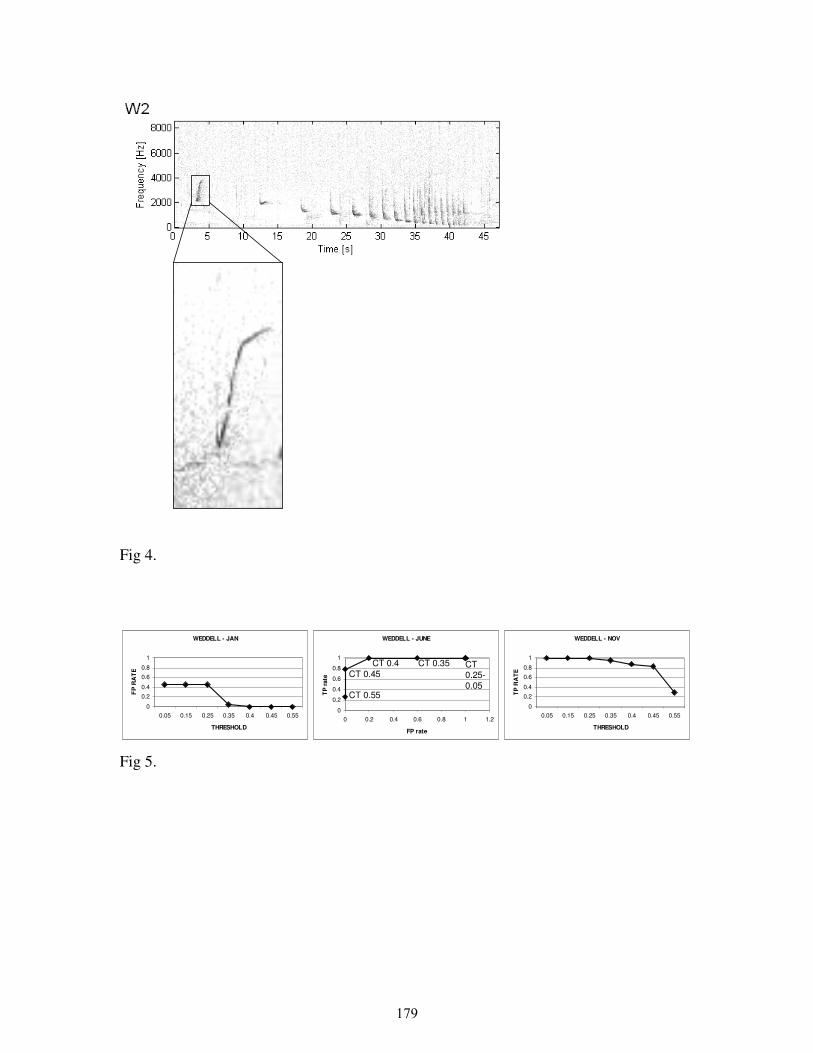
Fig 4.
WEDDELL - NOV
0
0.2
0.4
0.6
0.8
1
0.05 0.15 0.25 0.35 0.4 0.45 0.55
THRESHOLD
TP
RA
TE
WEDDELL - JAN
0
0.2
0.4
0.6
0.8
1
0.05 0.15 0.25 0.35 0.4 0.45 0.55
THRESHOLD
FP
RA
TE
WEDDELL - JUNE
0
0.2
0.4
0.6
0.8
1
0 0.2 0.4 0.6 0.8 1 1.2
FP rate
TP
rate
CT 0.55
CT 0.45
CT 0.4 CT 0.35 CT 0.25-
0.05
Fig 5.
179
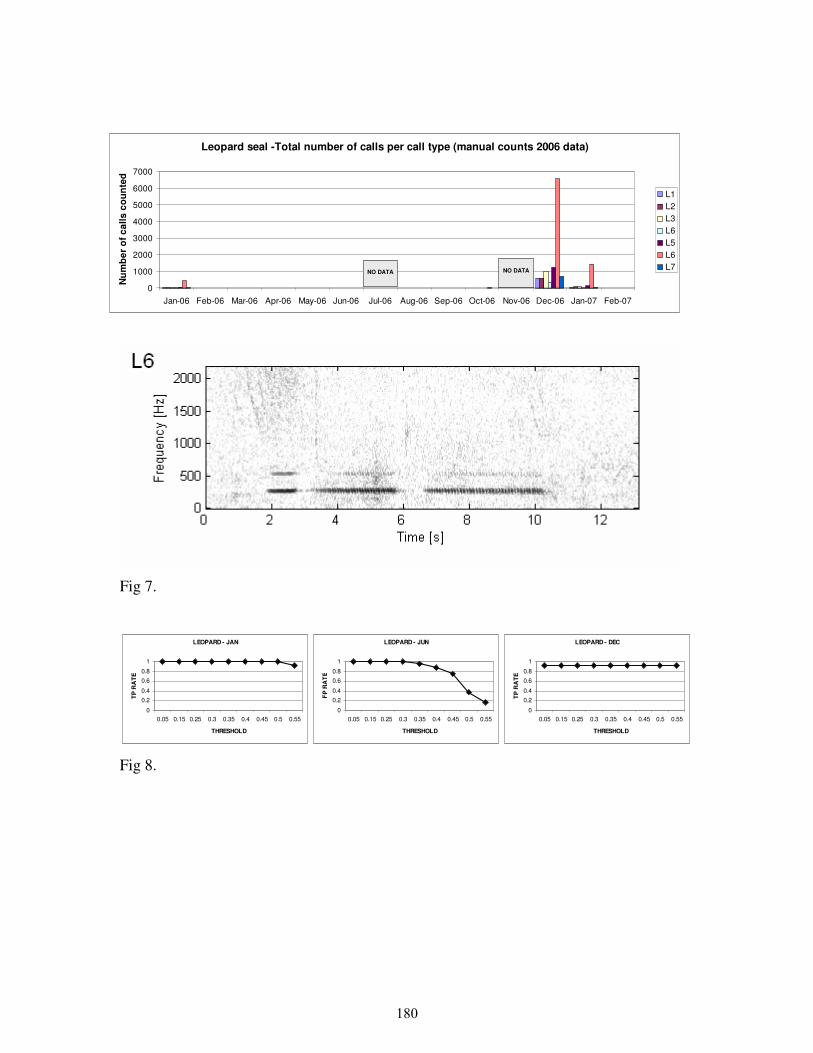
Fig 6.
Fig 7.
LEOPARD - JAN
0
0.2
0.4
0.6
0.8
1
0.05 0.15 0.25 0.3 0.35 0.4 0.45 0.5 0.55
THRESHOLD
TP
RA
TE
LEOPARD - JUN
0
0.2
0.4
0.6
0.8
1
0.05 0.15 0.25 0.3 0.35 0.4 0.45 0.5 0.55
THRESHOLD
FP
RA
TE
LEOPARD - DEC
0
0.2
0.4
0.6
0.8
1
0.05 0.15 0.25 0.3 0.35 0.4 0.45 0.5 0.55
THRESHOLD
TP
RA
TE
Fig 8.
Leopard seal -Total number of calls per call type (manual counts 2006 data)
0
1000
2000
3000
4000
5000
6000
7000
Jan-06 Feb-06 Mar-06 Apr-06 May-06 Jun-06 Jul-06 Aug-06 Sep-06 Oct-06 Nov-06 Dec-06 Jan-07 Feb-07
Nu
mb
er
of
ca
lls
co
un
ted
L1
L2
L3
L6
L5
L6
L7NO DATANO DATA
180

Fig 9.
Fig 10.
ROSS - JAN
0
0.2
0.4
0.6
0.8
1
0 0.1 0.2 0.3 0.4 0.5 0.6
THRESHOLD
TP
rate
ROSS - JUN
0
0.2
0.4
0.6
0.8
1
0 0.1 0.2 0.3 0.4 0.5 0.6
THRESHOLD
FP
rate
ROSS - DEC
0
0.2
0.4
0.6
0.8
1
0 0.1 0.2 0.3 0.4 0.5 0.6
THRESHOLD
FP
rate
Fig 11.
Ross seal - Total number of calls per call type (manual counts 2006 data)
0
2000
4000
6000
8000
10000
12000
14000
Jan-06 Feb-06 Mar-06 Apr-06 May-06 Jun-06 Jul-06 Aug-06 Sep-06 Oct-06 Nov-06 Dec-06 Jan-07 Feb-07
Nu
mb
er
of
ca
lls
co
un
ted
R4
R5
R3
R2
R1
NO DATANO DATA
181

AP
AP
PAL
AP
PAL
PAL
Weddell seal
Leopard seal
Ross seal
a
b
c
Fig 12a-c.
182

a)
b)
Fig 13.
183

% Ice coverage
Fig
14.
184

10
10
0
10
00
10
10
0
10
00
1 m
in1 m
in
Ro
ss
a)
24 h
ou
rs
Frequency (Hz)
Fig
15.
185

Publication V
Leopard seal (Hydrurga leptonyx) vocalizations from three Antarctic
locations
186

LEOPARD SEAL (HYDRURGA LEPTONYX) VOCALIZATIONS FROM THREE
ANTARCTIC LOCATIONS
Authors: Kreiss, C.M.1, Van Opzeeland, I.C.1, Klinck, H.2, Bornemann, H.1, Kindermann, L.1,
Figueroa, H. 3, Rogers, T.L.4, Plötz, J.1, Boebel, O1.
1 Alfred Wegener Institute, Am Handelshafen 12, 27570 Bremerhaven, Germany 2 Oregon State University, cooperative Institute for Marine Resources Studies, Hatfield
Marine Science Center , 2030 Marine Science Drive, Newport, Or 97365, USA 3 Bioacoustics Research Program, Cornell Lab of Ornithology, 159 Sapsucker Woods Road,
Ithaca, NY 14850 USA 4 Evolution and Ecology Research Center, School of Biological, Earth and Environmental
Sciences, University of New South Wales, Sydney, NSW 2052, Australia
Manuscript in preparation
187
ABSTRACT
Leopard seals (Hydrurga leptonyx) are known to produce underwater vocalizations during the
breeding season in austral summer. This study investigated whether the acoustic
characteristics o leopard seal high double trills (HDT) differed between three Antarctic
locations (DI - Drescher Inlet (72°52’S – 19°26’W), AB - Atka Bay (70°31’S 8°13’W) and
DS - Davis Sea (65°S 90°E)). The results showed some identifiable differences between DI
versus AB and DS, although most acoustic parameters of HDTs did not differ largely between
the three recording locations. HDTs recorded at DI had lower pulse repetition rates and
narrower bandwidths compared to HDTs recorded at AB and DS. Principal Component
Analysis showed a separation for HDTs originating from DI from HDTs recorded at AB and
DS. Calls from AB and DS were less separable and showed partly overlapping clusters.
Previous studies suggested that there is sufficient exchange of individuals between leopard
seal breeding groups to prevent the development of genetic population structure. Our results
support genetic studies and demonstrate a high level of similarity in leopard seal vocalizations
between recording locations. Subtle site variation in calls from different recording locations
might be attributed to differences in local social or environmental factors.
KEYWORDS
leopard seal, Hydrurga leptonyx, underwater vocalization, high double trill, geographic
variation
188

INTRODUCTION
Geographic variation in vocal patterns can be found within a wide variety of taxa and may
occur for several reasons including genetic variation, founder effects, social learning, or as an
adaptation to environmental conditions (e.g., Hunter & Krebs 1979, Catchpole & Slater 1995,
Van Parijs et al. 2003). In non-migratory species or species that show site fidelity, geographic
variation in vocal behaviour in some cases reflects distinct breeding populations or
subpopulations (e.g., Nelson et al. 2001, Stafford et al. 2001, Abgrall et al. 2003).
Several pinniped species exhibit geographic variation in their vocal behaviour, which in most
species has been attributed to reproductive isolation of populations (e.g., Le Boeuf & Peterson
1969, Thomas & Stirling 1983, Perry & Terhune 1999, Van Parijs et al. 2003, Risch et al.
2006, Terhune et al. 2008). Perry and Terhune (1999) compared harp seal (Pagophilus
groenlandicus) underwater vocalizations between three North Atlantic breeding locations
(‘Gulf’, ‘Front’ and Jan Mayen) and found the call repertoire and proportional call type usage
in Gulf and Front to differ in a similar manner from the more distant Jan Mayen breeding
group. These findings are supported by tagging studies, which showed that the Gulf and Front
herd interbreed and are reproductively isolated from the Jan Mayen herd. In Weddell seals,
both the call repertoire and the acoustic characteristics of call types were found to differ on a
mesogeographic (600-2000 km) and macrogeographic level (>2000 km), suggesting that
breeding groups were unlikely to mix over these distances (Abgrall et al. 2003; Thomas &
Stirling 1983). However, on a microgeographic scale (150 km) no consistent differences
existed in call repertoire and call characteristics between breeding groups (Pahl et al. 1997).
These findings were also supported by tagging data, indicating that animals exhibited
pronounced breeding site fidelity and were only likely to move between nearby breeding
groups (Stirling 1974, Pahl et al. 1997, Cameron et al. 2007).
For leopard seals, knowledge of breeding populations, their mixing and distribution is
only sparse. Slip et al. (1994) and Davis et al. (2008) found the genetic diversity in leopard
seals sampled at six circumpolar locations to be low, suggesting that there is at least sufficient
gene flow between breeding groups to prevent the development of genetic differentiation
between populations. Nevertheless, Thomas and Golladay (1995) compared leopard seal
underwater vocalizations between McMurdo Sound and Palmer Peninsula (ca. 5000 km
distance), and found significant differences in call repertoire and call characteristics. They
suggested that repertoires are likely to vary slightly between adjacent areas, and be more
distinctive between distant regions, reflecting the low probability of encounter between
189
geographically separated breeding groups. Hence, insights into the patterns of geographic
variation of vocal behavior could potentially reveal more about the discreteness of leopard
seal groups and the pattern of mixing between populations or breeding groups. In this study
we therefore compare leopard seal vocal behavior between three Antarctic locations: Atka
Bay, Drescher Inlet and Davis Sea (Fig. 1). These study sites allow comparisons on two
different spatial scales. Atka Bay and Drescher Inlet have an along-shelf-ice distance of
approximately 500 km, whereas the distance between Atka Bay and Davis Sea is about 4300
km. Drescher Inlet and Davis Sea have an along-ice-shelf distance of 4800 km.
To date, leopard seals are known to produce at least 13 different underwater
vocalization types, which have been recorded during the breeding season from November to
January (Stirling & Siniff 1979, Rogers et al. 1996, Thomas & Golladay 1995). The leopard
seal call repertoire consists of short-distance “local calls” as well as long-distance “broadcast
calls” (Rogers et al. 1996). Broadcast call types that have been recorded from free-ranging
leopard seals at various recording sites are: the high, medium and low double trill, medium
single trill, hoot and hoot with single trill, as well as the low ascending and descending trill
(Stirling and Siniff 1979, Thomas and Golladay 1995, Rogers et al. 1996, Klinck 2008). The
relatively similar vocal repertoire composition of leopard seals throughout their calling period,
suggests that the function of their broadcast calls is relatively uniform (Rogers et al. 1996,
Van Opzeeland et al. 2010), allowing selection of one broadcast call type to represent leopard
seal vocal behavior. We selected one call type, the high double trill (HDT), to investigate
geographic variation in leopard seal vocal behavior as based on the following reasons: 1) the
HDT was found to occur at all leopard seal breeding sites (Stirling & Siniff 1979, Thomas &
Golladay 1995, Rogers et al. 1996, Klinck 2008), 2) this call type can be used as a
representative of overall leopard seal calling activity over the period in which leopard seals
are acoustically present (Van Opzeeland et al. 2010), 3) in contrast to the low double trill,
which forms a larger portion of the vocal repertoire than the HDT, the acoustic characteristics
of the HDT allow reliable detection of this call type, even at higher background noise levels
(Klinck 2008).
METHODS
Data collection
Atka Bay (PALAOA) data
190
Underwater recordings from Atka Bay (AB) were obtained from the PerenniAL Acoustic
Observatory in the Antarctic Ocean (PALAOA). PALAOA is an autonomous listening station
located at 70°31’S, 8°13W on the Ekström Ice Shelf, 15 km north of the German Antarctic
station Neumayer II (Fig 1). The Eckström iceshelf is a floating ice shelf which spreads into a
typical finger-like structure (Boebel et al., 2006). The North Pier, on which the observatory is
located, is surrounded by the ocean on the north-west, north and east side. AB is located at the
east to south-east side of the observatory. The depth of the seafloor inside AB ranges from
275 m in the inner section of the bay to 100 – 200 m near the shelf-ice edge and 900 m at the
mouth of the bay (Wegner 1981). AB is covered with fast-ice from March to January.
Recordings are made with a RESON TC4032 and a TC4033 hydrophone at a distance of 300
m from each other. The hydrophones are deployed through boreholes underneath the 100 m
thick floating Eckström Ice Shelf, 80 m below the ice shelf (Boebel et al. 2006, Klinck 2008).
The stereo-signal is amplified and digitized by a BARIX Instreamer at 16 Bit/48 kHz and
transmitted wirelessly as a 192 kBits/s MP3 stream to the Neumayer Base, where it is stored
on hard disk (see Kindermann et al. 2008 for more details). Effective bandwidth of the
recordings is 10 Hz to 16 kHz, dynamic range 60 dB to 150 dB re 1 �Pa.
Drescher Inlet (DIPS) data
During the Drescher Inlet Pilot Study (DIPS) acoustic recordings were made from 17
December 2003 to 2 January 2004 in the Drescher Inlet (DI) located at 72°50'S, 19°02'W (Fig.
1). DI is a 25 km long and up to 2 km wide crack in the Riiser Larsen Ice Shelf. The sea bed
under the ice shelf extends over 100 km to the nearest grounding line of Dronning Maud Land
(Schenke et al. 1998). According to bathymetric surveys of RV "Polarstern" (Graffe &
Niederjasper 1997), the depth of the seafloor inside the inlet ranges from 430 m in the inner
section to 380 m over a central 6-km-wide bank, and to 520 m at the inlet mouth. The depth
outside the inlet gradually increases, reaching the 600 m isobath about 2 km distant from the
inlet mouth. The fast-ice environment is characterised and strongly influenced by the seasonal
ice break-up, particularly during late summer.
The recording setup was placed on solid sea ice at distance of about 6 km from the sea ice
edge. Three RESON TC4032 hydrophones were deployed through boreholes in a 100 m
baseline triangle at 100 m water depth. The system recorded three channels with a National
Instruments DAQPad 6052E at 48 kHz/16 bit to wav files on a computer using the Ishmael
software (Mellinger 2001). Effective bandwidth of the recordings is 10 Hz to 24 kHz.
191

Davis Sea data
Acoustic data from Davis Sea (DS, Fig. 1) were collected during an acoustic survey of the RV
Aurora Australis V4. Recordings were made on 13 - 14 December 1997 on six locations
between 62°S, 93°E and 63°S, 90°E. Water depth at these locations ranged from 3600 – 4000
m and ice cover at these locations varied between 4 – 8 / 10ths.
Recordings were made remotely using a sonobuoy (Sparton Electronics AN/SSQ-57A:
frequency response 10 Hz - 20 kHz). Hydrophones were lowered to a depth of 18 m below the
water surface. Signals with a custom-built receiver and recorded onto a Sony Digital Audio
Tape recorder (TCD-D8: frequency response 10 Hz - 22 kHz).
Data analysis
Previous analysis of the PALAOA data showed a peak in leopard seal calling activity towards
the end of December (Van Opzeeland et al., 2010) which has also been reported by previous
studies (Thomas and DeMaster 1982, Rogers et al., 1996). Therefore, only acoustic
recordings made in December were included in our analyses. For AB, recordings from 21 - 27
December 2006 were included (156 hours), for Drescher Inlet the recordings from 21 - 25
December 2003 (86 hours) and for DS the recordings made on 13 - 14 December 1997 (12
hours). Due to maintenance activities within the PALAOA observatory only one hydrophone
(TC4032) was active in this period.
For each location 150 HDTs (Fig 2a) with a band-limited (1.5 - 4.5 kHz) signal-to-
noise ratio > 15 dB, were selected for further analyses. In total 63 acoustic parameters were
measured for all 450 HDT samples and investigated for geographic differences. Using
OSPREY, noise-robust MATLAB™-based analysis software, 29 acoustic parameters were
extracted from each of the two parts of the HDT calls. In brief, a spectrogram of the acoustic
data is computed and displayed, and an analyst designates a time/frequency box around a call
of interest, the annotation box. OSPREY then calculates a smaller feature box from which the
acoustic parameters are automatically extracted and written to a logfile. For this analysis the
following spectrogram parameters were used: frame size and FFT size 4096 samples (0.085
s), overlap 50% (0.043 s), and Hamming window, for a spectrum filter bandwidth of 47.6 Hz.
A detailed description of how OSPREY determines the feature box as well as a detailed
description of all 29 parameters and how they are calculated are given by Mellinger and
Bradbury (2007).
192

The remaining 5 acoustic parameters describe the temporal evolution of the pulse repetition
rate (PRR). The PRR is the rate of amplitude modulation of the signal, which appears as
sidebands of the carrier frequency in the spectrogram (Klinck et al. 2008). Parameters of the
PRR measured were (Fig. 2b): PRR start frequency of call part 1 (30), PRR maximum
frequency of call part 1 (31), PRR envelope and frequency of call part 1 (32), PRR envelope
start frequency of call part 2 (33), PRR envelope end frequency of call part 2 (34). For a more
detailed description of how the PRR parameters were measured, see Klinck et al., 2008.
To visualize the distribution of each acoustic parameter, we used the Matlab Statistics toolbox
to produce estimates of probability density functions (PDFs) of all parameters independently
for each geographic location. First, the parameter space (min to max) was linearly interpolated
to 100 steps separately for each location. Second, probability density functions were
calculated using the Matlab™ function „ksdensity“, employing a normal kernel distribution of
optimized width (default settings, see Matlab™ function description). Figure 3 exemplifies
the results for the parameters call duration, bandwidth, pulse repetition rate and signal-to-
noise-ratio of call part 1. By screening the full set of parameter PDFs, relevant parameters
were then selected for further analysis by Principal Component Analysis (PCA) on the basis
of the visual separability of the three locations within each plot.
RESULTS
The mean duration of call part 1 was 1.10 ± 0.53 s for DS and 1.22 ± 0.61 s for AB, while the
recordings from DI showed an intermediate median duration of 1.17 ± 0.48 s (Table 1). Call
part 2 showed a corresponding pattern in mean duration for the three study sites, but had
generally shorter durations compared to call part 1.
Kernel density estimations for the durations of leopard seal HDTs at the three study sites
show partially overlapping distributions for call part 1 (Fig 3a). The curves are positively
skewed, showing a peak for short call durations and an elongated tail towards longer call
durations.
For lower and upper frequencies of the HDT, calls from DI had substantially higher
values for lower frequencies and lower values in upper frequencies compared to the other two
sites. The mean lower frequency of call part 1 for DI was approximately 100 Hz higher
compared to AB and 80 Hz higher compared to DS (Table 1). The means for upper
193

frequencies of call part 1 were approximately 600 Hz lower for high double trills recorded at
DI compared to DS and more then 100 Hz lower as for HDTs recorded at AB. The resulting
mean bandwidth of the calls at DI was substantially narrower than those of HDTs recorded at
AB and DS (Table 1). Interestingly, the kernel density estimations showed bimodal
distributions of the mean bandwidth of call part 1 for AB and DS, overlapping partly with DI
(Fig. 3b). The results for call part 2 showed a corresponding pattern for the means of lower
and upper frequencies between the three locations, though with smaller differences between
locations than call part 1.
All PRR values measured for HDTs recorded at DI were lower than PRR values of
calls recorded at AB and DS, respectively (Table 1). The distributions of the five pulse
repetition rate parameters clearly separated DI from AB and DS calls. Calls from DI generally
tended towards lower PRR which was most distinctive in the PRR start (parameter 30) of call
part 1 (Fig 3c). PRR values measured for call part 2 showed a similar trend as call part 1,
although differences between DI and the other two locations were less pronounced.
Signal-to-noise-ratios were lowest at DI compared to the other study sites (Fig. 3d, Table 1).
To explore if calls could be separated according to recording location, we performed a
Principal Component Analysis (PCA). As described previously, only a subset of relevant
acoustic parameters was included in the PCA, being all five PRR parameters, the lower and
upper frequency and the duration of call part 1 and 2. The first two principal components of
the PCA explained 67 % of the variance (Table 2) and revealed a clear separation of the HDTs
originating from DI from those recorded at the other two study sites (Fig. 4). Component 1
represents mainly the contribution of the PRR parameters, whereas component 2 reflects the
importance of the upper frequency of both call parts as well as the duration of call part 1 in
distinguishing locations (Table 1).
DISCUSSION
1. Variation between recording sites
The results of our study demonstrate some identifiable differences in leopard seal HDTs
recorded at different sites; interestingly more difference was observed between the closest
194

sites (DI versus AB, 500 km apart) and the least, between the most disparate sites (AB and
DS, 4300 km). The bandwidth and pulse repetition rates of calls recorded at DI differed from
calls recorded at AB and DS, whereas calls recorded at the latter two locations were not
clearly separable according to recording site. However, overall the observed pattern reflects a
remarkable similarity in the acoustic characteristics of leopard seal HDTs across the three
recording locations. While other species, such as harp and Weddell seals, exhibit considerable
variation in their vocal behavior between breeding groups on varying spatial scales (e.g. Perry
and Terhune 1999, Abgrall et al. 2003), our measurements show that leopard seal HDTs
exhibit substantial acoustic similarity up to spatial scales larger than 4000 km. This leaves it
likely that there is exchange or at least contact between individuals from the three different
recording locations and that subtle site differences are attributable to other factors than
geographic isolation of populations. Our findings correspond to the study by Davis et al.,
(2008) who found no genetic differentiation between leopard seal populations across the
Antarctic and suggested that there is sufficient gene flow between breeding groups to prevent
development of population structure. Information on movement patterns from tagged leopard
seals also not excludes exchange or contact between individuals from different breeding
locations, although the range of movement varies largely between individuals (Rogers et al.
2005; Nordøy & Blix 2009).
Below we further discuss various aspects that might explain the observed differences in call
characteristics between DI versus AB and DS, recognizing that these might also act in
concert.
1.1. Differences in local group composition
In our study there was no information on the number of individuals sampled so that a
relatively small subset of individuals may have been used to describe the total population
variation for each location. However, adult male leopard seals within a region show little
difference between acoustic characteristics for specific calls and this includes the HDT call
(Rogers and Cato 2002). There was also no information on the sex or age class of callers,
consequently it is not known to what extent differences in group composition between the
three localities may have influenced the results; the HDT is known to be produced by both
sexes and by juvenile and adult leopard seals, with substantial differences in the acoustic
characteristics of HDTs produced by different age classes (Rogers et al. 1996, Rogers 2007).
In our data, HDT bandwidth of calls recorded at AB and DS has a bimodal distribution,
possibly reflecting two ‘types’ of HDTs produced by different age classes and/or sexes. In
195

addition, the absence of this bimodal pattern and partial overlap of distributions of AB and DS
with DI suggests calls are more homogeneous at the latter location. It cannot be excluded that
the differences in leopard seal call repertoire and call characteristics between Palmer
Peninsula and McMurdo Sound reported by Thomas and Golladay (1995) can be attributed to
differences in local group composition, given that in their study no information on the
individuals that produced the calls was collected.
The lack of information on the age and sex of the individuals that produced the HDTs in our
study is an aspect of our data which we share with many other studies investigating the
underwater vocalizations of marine mammals (e.g., Perry & Terhune 1999; Stafford et al.
2001; Abgrall et al. 2003; Rossi-Santos & Podos 2006; May-Collado & Wartzok 2008).
Although in many cases such information can simply not be collected, awareness of this
potential bias can overcome overinterpretation of site variation in vocalizations. Particularly
in territorial species (i.e., species that defend geographic underwater areas against rival
individuals), acoustic sampling should be conducted with caution, e.g., by recording at several
locations to ensure that calls of a sufficiently large number of individuals are sampled.
1.2. Local environmental conditions
Recordings from DI had smallest signal-to-noise-ratio of all three sites. Leopard seals use
their calls to attract mating partners over relatively long distances (Rogers et al., 1996) and
might therefore adapt their calls in response to local ambient noise conditions to increase
calling range. Calls recorded at DI had a substantially narrower bandwidth compared to the
other two study sites. Narrowing the bandwidth of a call and concentrating the acoustic energy
of the call in a part of the spectrum with little environmental noise is a strategy in various
animal taxa to increase the range of communication in noisy environments (Ryan and
Brenowitz 1985, Morton 1975, Bertelli and Tubaro 2002). Pulse repetition rate also differed
between DI vs AB and DS which might reflect a similar adaptation to local ambient noise
conditions. Several studies have found pulse repetition rate to be the acoustic variable that
differs between groups or populations of animals in a wide range of species, although the
reason for these differences remains unclear (Nevo et al. 1987; Rotenberry et al. 1996; Rankin
& Barlow 2005). In this case the vocal characteristics of leopard seals recorded at DI could
reflect either a short-term adaptation (i.e., vocal plasticity in response to environmental
conditions) or a learned vocal characteristic.
196

2. Call duration
The results for HDT duration at all three study sites showed similar distributions for the
majority of HDTs. However, at all sites the skewed distribution of the duration of call part 1
revealed that while few call parts were shorter in duration than the mode, a significant
proportion of the first call part had longer durations. Rogers (2003) noted that leopard seal
vocalizations are potentially energetically very costly calls for the animals to produce and
might therefore function to signal fitness to potential mating partners or a competitive
response to other vocalizing individuals. Weddell seals have also been found to lengthen
many of their underwater calls in response to overlapping vocalizations of conspecifics,
thereby increasing the detectability of their calls and potentially indicating fitness of the
calling individual (Terhune et al. 1994). Lengthening of calls in leopard seals may serve a
similar function, although the number of calls with increased duration might be more
restricted by the high energetic costs associated with the production of these calls.
3. Conclusion
In conclusion, our study has demonstrated that leopard seal HDTs exhibit large scale
similarity across recording locations and that acoustic similarity is not related to geographic
distance. We suggest that differences in local social factors, such as differences in group
composition or local abiotic factors might explain the observed differences between recording
locations.
ACKNOWLEDGEMENTS
The installation and operation of PALAOA would not have been possible without continuous
support of AWI logistics, FIELAX and the overwintering teams. Recordings from the Davis
Sea, thanks to the crew and staff of the Australian Antarctic Division that assisted with the
acoustic surveys from the Aurora Australis special mention to the ship’s captains, Murray Elis
and Peter Pearson who were extremely helpful in ensuring the ship didn’t drive backwards,
over sonobuoys, at the time of the survey.
REFERENCES
Abgrall, P., J.M. Terhune and H. Burton. 2003. Variation of Weddell seal (Leptonychotes
197

weddellii) underwater vocalizations over mesogeographic ranges. Aquatic Mammals 29:268-
277.
Bertelli, S. and P.L. Tubaro. 2002. Body mass and habitat correlates of song structure in a
primitive group of birds. Biological Journal of the Linnean Society 77:423-430.
Boebel, O., L. Kindermann, H. Klinck, H. Bornemann, J. Plötz, D. Steinhage, S. Riedel and E.
Burkhardt. 2006. Acoustic Observatory Provides Real-Time Underwater Sounds from the
Antarctic Ocean. EOS 87:361-372.
Bradbury, J.W., K.A. Cortopassi and J.R. Clemmons. 2001. Geographical variation in the
contact calls of orange-fronted Parakeets. The Auk 118:958-972.
Cameron, M.F., D.B. Siniff, K.M. Proffitt, R.A. Garrot. 2007. Site fidelity of Weddell seals:
the effects of sex and age. Antarctic Science 19:149-155.
Catchpole, C.K. and P.J.B. Slater. 1995. Bird song: Biological Themes and Variations.
Cambridge University Press, Cambridge, UK.
Davis, C.S., I. Stirling, C. Strobeck and D.W. Coltmann. 2008. Population structure of ice-
breeding seals. Molecular Ecology 17:3078-3094.
Graffe, D. and F. Niederjasper. 1997. Meeresbodenkartierungen mit dem Hydrosweep-
System. Pages 37-44 in W. Jokat and H. Oerter, eds. Die Expeditionen Antarktis XII mit FS
Polarstern 1995. Reports on Polar Research Series 219.
Hunter, M.L. and J.R. Krebs. 1979. Geographical variation in the song of the great tit (Parus
major) in relation to ecological factors. Journal of Animal Ecology 48:759-785.
Kindermann, L., O. Boebel, H. Bornemann, E. Burkhardt, H. Klinck, I. C. Van Opzeeland, J.
Plötz and A.-M. Seibert. 2008. A Perennial Acoustic Observatory in the Antarctic Ocean.
Pages 15-28 in K.-H. Frommolt, ed. Bundesamt für Naturschutz (BfN-Skripten 234), Bonn.
Klinck, H. 2008. Automated passive acoustic detection, localization and identification of
leopard seals: from hydro-acoustic technology to leopard seal ecology. Reports on Polar and
Marine Research 582:154 pp.
Klinck, H., L. Kindermann and O. Boebel. 2008. Detection of Leopard seal (Hydrurga
leptonyx) vocalizations using the Envelope Spectrogram Technique (tEST) in combination
with a Hidden Markov Model. Canadian Acoustics 36 (1):118-124.
LeBoeuf, B.J. and R.S. Peterson. 1969. Dialects in elephant seals. Science 166:1654-1656.
May-Collado, L.J. and Wartzok, D. 2008. a comparison of bottlenose doplhin whisltes in the
Atlantic Ocean: factors promoting whislte variation. Journal of Mammalogy 89: 1229-1240.
198

Mellinger, D.K., Bradbury, J.W. 2007. Acoustic measurement of marine mammal sounds in
noisy environments. Proceedings of the Second Conference on Underwater Acoustic
Measurements: Technologies and Results, Heraklion, Greece, 25-29 June 2007.
Mellinger, D.K., 2001. Ishmael 1.0 User’s Guide. NOAA Technical Memorandum OAR
PMEL-120, available from NOAA/PMEL/OERD, 2115 SE OSU Drive, Newport, OR
97365-5258.
Morton, E.S. 1975. Ecological Sources of Selection on avian Sounds. American Naturalist
109 (965):17-34.
Nelson, D.A., H. Khanna, and P. Marler. 2001. Learning by instruction or selection:
Implications for patterns of geographic variation in bird song. Behaviour 138:1137-1160.
Nevo, E., Heth, G., Beiles, A., Frankenberg, E. 1987. Geographic dialects in blind mole rats:
role of vocal communication in active speciation. Proceedings of the National Academie of
Sciences of the United States of America 84: 3312-3315
Nordøy, E.S., A.S. Blix. 2009. Movements and dive behaviour of two leopard seals
(Hydrurga leptonyx) off Queen Maud Land, Antartica. Polar Biology 32(2):263-270.
Pahl, B.C., J.M. Terhune and H.R. Burton. 1997. Repertoire and Geographic Variation in
Underwater Vocalizations of Weddell Seals (Leptonychotes weddellii, Pinnipedia: Phocidae)
at the Vestfold Hills, Antarctica. Australian Journal of Zoology 45:171-187.
Perry, E.A and J.M. Terhune. 1999. Variation in harp seal (Pagophilus groenlandicus)
underwater vocalizations among three breeding locations. Journal of Zoology 45:171-178.
Risch, D., C.W. Clark, P.J. Cokeron, A. Elepfandt, K.M. Kovacs, C. Lydersen, I. Stirling and
S.M. Parijs. 2007. Vocalizations of male bearded seals, Erignathus barbatus: classification
and geographical variation. Animal Behaviour 73:747-762.
Rogers, T.L., D.H. Cato and M.M. Bryden. 1996. Behavioural significance of underwater
vocalizations of captive leopard seals, Hydrurga leptonyx. Marine Mammal Science 12:414-
427.
Rogers, T.L. 2003. Factors influencing the acoustic behaviour of male phocid seals. Aquatic
Mammals 29:247-260.
Rogers, T.L., C.J. Hogg and A. Irvine. 2005. Spatial movement of adult leopard seals
(Hydrurga leptonyx) in Prydz Bay, Eastern Antarctica. Polar Biology 28:456-463.
Rogers, T.L. 2007. Age-related differences in the acoustic characteristics of male leopard
seals, Hydrurga leptonyx. Journal of the Acoustical Society of America 122:596-605.
Rossi-Santos, M.R., J. Podos. 2006. Latitudinal variation in whistle structure of the estuarine
dolphin Sotalia guianesis. Behaviour 143:347-364.
199

Rankin, S., J. Barlow. 2005. Source of the North Pacofoc “boing” sound attributed to minke
whales. The Journal of the Acoustical Society of America 118:3346-3351.
Rotenberry, J. T., M. Zuk, L. W. Simmons, and C. Hayes. 1996. Phonotactic parasitoids and
cricket song structure: an evaluation of alternative hypotheses. Evolutionary Ecology 10:233-
243.
Ryan, M.J. and E.A. Brenowitz. 1985. The role of bodysize, phylogeny and ambient noise in
the evolution of bird song. American Naturalist 126:87-100.
Schenke HW, S. Diijkstra , F. Niederjasper, H. Hinze, B. Hoppmann and T. Schöne. 1998.
The new bathymetric charts of the Weddell Sea: AWI BCWS. Pages 371-380 in S.S. Jacobs
and R.F, eds. Ocean, ice, and atmosphere: interactions at the Antarctic continental margin
American Geophysical Union, Antarctic Research Series 75.
Slip, D.J., K. Green, H.R. Burton, P.J. Mitchell and M. Adams. 1994. Allozyme variation in
the leopard seal, Hydrurga leptonyx. Journal of the Australian Mammal Society 17:1-5.
Stafford, K.M., S.L. Nieukirk and C.G. Fox. 2001. Geographic and seasonal variation of blue
whale calls in the North Pacific. Journal of Cetacean Research and Management 3:65-76.
Stirling, I. 1974. Movements of Weddell seals in McMurdo Sound Antarctica. Australian
Journal of Zoology 22:39-43.
Stirling, I. and D.B. Siniff. 1979. Underwater vocalizations of leopard seals (Hydrurga
leptonyx) and crabeater seals (Lobondon carcinophagus) near the South Shetland Islands,
Antarctica. Canadian Journal of Zoology 57: 1244-1248.
Terhune, J.M., N.C. Grandmaitre, H.R. Burton and K. Green. 1994. Weddell seals lengthen
many underwater calls in response to conspecific vocalizations. Bioacoustics 11:211-222.
Thomas, J.A. and D.P. DeMaster. 1982. An acoustic technique for determinig diurnal
activities in leopard (Hydrurga leptonyx) and crabeater (Lobondon carcinophagus) seal.
Canadian Journal of Zoology 60:2028-2031.
Thomas, J.A. and C.L. Golladay. 1995. Geographic variation in leopard seal (Hydrurga
leptonyx) underwater vocalizations. Pages 201-222 in R.A. Kastelein, J.A. Thomas, P.E.
Nachtigall, eds. Sensory Systems of Aquatic Mammals. De Spil Publishers, Woerden,
Netherlands.
Thomas, J.A. and I. Stirling. 1983. Geographic variation in the underwater vocalizations of
Weddell seals (Leptonychotes weddellii) from Palmer Peninsula and McMurdo Sound,
Van Opzeeland, I.C., Van Parijs, S.M., Bornemann, H., Frickenhaus, S., Kindermann, L.,
Klinck, H., Ploetz, J., Boebel, O. 2010. Acoustic ecology of Antarctic pinnipeds. Marine
Ecology Progress Series 414: 267-291.
200

Van Parijs, S.M., P.J. Corkeron, J. Harvey, S.A. Hayes, D.K. Mellinger, P.A. Rouget, P.M.
Thompson, M. Wahlberg and K.M. Kovacs. 2003. Patterns in the vocalizations of male
harbour seals. Journal of the Acoustical Society of America 113: 3403-3410.
201

TA
BL
ES
Tab
le 1
. Des
crip
tive
sta
tist
ics
of t
he a
cous
tic
para
met
ers
mea
sure
d fo
r le
opar
d se
al h
igh
doub
le t
rill
s (H
DT
) re
cord
ed a
t A
B, D
I an
d D
S (
n=15
0
for
each
loc
atio
n).
A
B
DI
DS
Pa
ram
ete
r
Mea
n
av.
Devia
tion
M
ean
a
v. D
evia
tio
n
Mea
n
av.
Devia
tion
Low
er f
requ
ency
par
t 1 [
Hz]
28
07.0
8 41
.58
2919
.11
34.9
2 28
36.8
9 33
.85
Upp
er f
requ
ency
par
t 1 [
Hz]
33
91.9
9 26
4.15
32
64.6
2 74
.70
3889
.36
301.
26
Ban
dwid
th p
art 1
[Hz]
58
4.91
25
2.95
34
5.51
88
.76
1052
.47
291.
21
Low
er f
requ
ency
par
t 2 [
Hz]
27
41.7
35
.0
2849
.7
42.5
27
94.4
30
.5
Upp
er f
requ
ency
par
t 2 [
Hz]
32
20.9
19
6.9
3192
.0
75.8
35
57.1
32
4.5
Dur
atio
n pa
rt 1
[s]
1.
22
0.61
1.
17
0.48
1.
10
0.53
Dur
atio
n pa
rt 2
[s]
1.
03
0.2
0
1.01
0.
23
0.93
0.
25
Sig
nal-
to-n
oise
-rat
io p
art 1
[H
z]
17.8
1.
2 11
.4
0.9
13.1
1.
1
PR
R s
tart
par
t 1 [
Hz]
70
.92
0.98
63
.84
1.43
72
.15
1.38
PR
R m
ax. p
art 1
[H
z]
74.9
3 0.
65
68.5
5 0.
89
76.0
0 1.
40
PR
R e
nd p
art 1
[H
z]
70.5
3 1.
63
62.8
2 1.
66
72.0
4 2.
12
PR
R s
tart
par
t 2 [
Hz]
64
.45
2.66
57
.21
2.01
63
.68
2.75
PR
R e
nd p
art 2
[H
z]
72.2
5 0.
88
66.6
8 1.
40
70.3
7 1.
40
202

Table 2. Component loadings from Principal Component Analysis parameters measured for
HDTs recorded at AB, DI and DS (n=150 for each location).
HDT parameter PC1 [49%] PC2 [18%] PC3 [11%]
PRR start part 1 0.40 -0.01 0.14
PRR max part 1 0.40 0.00 0.17
PRR end part 1 0.40 0.13 -0.08
PRR start part 2 0.37 0.00 -0.32
PRR end part 2 0.36 -0.20 -0.06
Lower frequency part 1 -0.32 0.32 0.02
Upper frequency part 1 0.20 0.49 0.33
Duration part 1 -0.07 -0.40 0.56
Lower frequency part 2 -0.28 0.35 -0.11
Upper frequency part 2 0.14 0.53 0.38
Duration part 2 -0.10 -0.21 0.50
203

FIGURE LEGENDS
Figure 1: Map of Antarctica showing the three study sites: DI = Drescher Inlet; AB = Atka
Bay; DS = Davis Sea.
Figure 2 a) Spectrogram of the high double trill b) Spectrogram showing the high double trill
modulation frequencies: 11= PRR start frequency call part 1; 12 = PRR maximum frequency
call part 1; 13 =PRR end frequency call part 1; 14 = PRR start frequency call part 2; 15 =
PRR end frequency call part 2.
Figures 3: Kernel density estimations for a) duration, b) bandwidth, c) pulse repetition rate
and d) signal-to-noise-ratio of call part 1 of high double trills recorded at AB (green), DI (red)
and DS (blue).
Figure 4: Scatterplot of the first two principal components of a PCA applied on all pulse
repetition rate parameters, upper and lower frequency and duration of both call parts extracted
from 450 HDTs recorded at DI (red), AB (blue) and DS (green).
204

FIGURES
Fig. 1
205

a)
b)
Fig. 2a & b
206

0 0.5 1 1.5 2 2.5 3 3.50
0.1
0.2
0.3
0.4
0.5
0.6
0.7
0.8
0.9
1
call part duration [s]
rela
tive
occu
rre
nce
a)
0 200 400 600 800 1000 1200 1400 1600 18000
0.5
1
1.5
2
2.5
3
3.5x 10
−3
bandwidth [Hz]
rela
tive
occu
rre
nce
b)
207

55 60 65 70 75 800
0.05
0.1
0.15
0.2
0.25
0.3
0.35
pulse repetition rate [Hz]
rela
tive
occu
rre
nce
Atka Bay
Drescher Inlet
Davis Sea
c)
8 10 12 14 16 18 20 220
0.05
0.1
0.15
0.2
0.25
0.3
0.35
signal−to−noise−ratio [dB]
rela
tive
occu
rre
nce
d)
Fig 3 a-d
208

−0.6 −0.4 −0.2 0 0.2 0.4 0.6−0.6
−0.4
−0.2
0
0.2
0.4
0.6
Atka Bay
Davis Sea
Component 1
Drescher Inlet
Com
ponent 2
Fig. 4
209

Publication VI
Geographic variation in vocalizations of pups and mother-pup
behavior of harp seals (Pagophilus groenlandicus)
210

AQUATIC BIOLOGY
Aquat Biol
Vol. 6: 109–120, 2009
doi: 10.3354/ab00170Published online July 15, 2009
INTRODUCTION
Geographic variation in behavioral traits offers op-
portunities to make inferences about selective pres-
sures that may influence behavior and the degree of
differentiation among populations. Geographic varia-
tion in behavioral traits is common to a variety of taxa
and has been described in various behavioral contexts
ranging from dietary preferences in garter snakes
Thamnophis elegans to migratory routes in blackcaps
Sylvia atricapilla and antipredator behavior in ground
squirrels Spermophilus beecheyi (see Foster 1999 for a
review). Research efforts into geographic variation in
behavioral traits have, however, largely focused on
variation in behavior of adults within populations. Less
is known about differences in the behavior of young
and juveniles.
In pinnipeds, geographic variation in behavioral
traits such as mother–offspring interactions and male
display behavior has been documented in a number of
species (Terhune 1994, McCulloch & Boness 2000, Van
Parijs et al. 2000). Several studies have also reported
geographic variation in the vocalizations of pinniped
species. In harbour seals Phoca vitulina, variation in
© Inter-Research 2009 · www.int-res.com*Email: [email protected]
Geographic variation in vocalizations of pups
and mother-pup behavior of harp seals
Pagophilus groenlandicus
I. C. Van Opzeeland1,*, P. J. Corkeron2, D. Risch3, G. Stenson4, S. M. Van Parijs2, 3
1Ocean Acoustics Lab, Alfred Wegener Institute, Am alten Hafen 26, 27568 Bremerhaven, Germany2Bioacoustics Research Program, Cornell Lab of Ornithology, 159 Sapsucker Woods Road, Ithaca, New York 14850, USA
3Northeast Fisheries Science Center, NOAA, 166 Water Street, Woods Hole, Massachusetts 02543, USA4Dept. of Fisheries and Oceans, Northwest Atlantic Fisheries Center, PO Box 5667, St. John’s, Newfoundland A1C 5X1, Canada
ABSTRACT: All harp seal populations form breeding aggregations on the Arctic pack ice. However,
pack ice conditions vary spatially and temporally among these aggregations with variation in envi-
ronmental and oceanographic conditions, which may affect the behavioral interactions between
mothers and their newborn pups. We investigated the variation in mother-pup behavior between
harp seal breeding aggregations in the NE (Greenland Sea) and NW Atlantic coastal shelf region
(Front). Acoustic cues provided by the pups are thought to be important in facilitating reunions with
their mothers. Consequently, we measured variation in vocal parameters among seals to investigate
geographic differences in pup vocalizations. Classification trees showed a distinctive split between
Front and Greenland Sea pup vocalizations. There were no clear differences between male and
female pups at the Front, where 42% of male and 38% of female pup calls could be attributed to a
given individual. This contrasts with the Greenland Sea, where 55% of vocalizations of female pups
were attributed to individuals compared with only 8% for males. Analyses of behavioral observations
of mother-pup pairs made in the afternoon and evening showed that pups in the Greenland Sea suck-
led more and were more alert than pups in the Front. Further, mother-pup attendance patterns dif-
fered between sites. Mothers at the Front attended their pups 85.1% of the time, whereas mothers in
the Greenland Sea attended their pups 52.2% of the time. These substantial differences between
sites might be related to evolutionary changes in behavior resulting from commercial hunting or vari-
able environmental conditions.
KEY WORDS: Harp seal · Pagophilus groenlandicus · Pup vocalizations · Mother-pup behavior ·
Geographic variation · Climate change
Resale or republication not permitted without written consent of the publisher
Contribution to the Theme Section ‘Implications of large-scale iron fertilization of the oceans’OPENPEN ACCESSCCESS
211

Aquat Biol 6: 109–120, 2009
vocal behavior occurs between genetically isolated
populations. However, site-specific vocalizations are
also present between genetically mixed groups, sug-
gesting site-specific selection for changes in certain
vocal parameters that may be driven by local ecology
or climate or both (Van Parijs et al. 2000, 2003, 2004).
In many pinniped species vocal behavior is impor-
tant in female recognition of offspring during the lacta-
tion period (Insley et al. 2003). Insley (1992) suggested
that although many pinniped species exhibit individu-
ally stereotyped vocalizations, the degree to which
selection has favoured development of a vocal recogni-
tion system may vary with the reproductive environ-
ment of different species. Female grey seals in 2 repro-
ductively isolated populations were found to respond
differently to playbacks of vocalizations of their own
pups (McCulloch & Boness 2000). Females on Sable
Island, Nova Scotia, were found to discriminate be-
tween calls of their own and non-filial pups, while on
the Isle of May, females failed to recognize the calls of
their own pup (McCulloch et al. 1999). The fact that
allo-suckling (i.e. non-offspring nursing) was more fre-
quently observed in pups on the Isle of May than on
Sable Island may also indicate differences in pup
behavior between the 2 colonies.
In ice-breeding seals, females form dispersed aggre-
gations on the ice during the breeding season (Lyder-
sen & Kovacs 1999, Van Parijs et al. 2001). In most
species, females may have to forage to sustain late lac-
tation, leaving their pup alone on the ice (e.g. Testa et
al. 1989, Lydersen & Kovacs 1999). The relocation pro-
cess is often complicated by hourly or daily movements
of the ice, causing pups to drift away from where they
were when their mothers left. However, the stability of
the breeding substrate used can differ substantially
between different species and sites, ranging from
large stable ice floes with breathing holes through
which females return to their young, to small mobile
ice floes or pack ice, the location and size of which is
often heavily influenced by currents and weather con-
ditions (Terhune et al. 1979, Lydersen & Kovacs 1993).
To date, little is known about which, and how, factors
such as the role of ice conditions influence mother-pup
reunions in most ice-breeding seals.
Harp seals Pagophilus groenlandicus are ice-breed-
ing seals and the most abundant pinnipeds in the
North Atlantic. There are 3 populations: (1) the White
Sea/Barents Sea population, (2) the NW Atlantic popu-
lation, subdivided into a Gulf of St Lawrence (‘Gulf’)
component and a coastal shelf component off NE New-
foundland and/or southern Labrador (‘Front’), and (3)
the Greenland Sea (NE Atlantic) population, which
breeds on the pack ice between eastern Greenland
and Jan Mayen (Sergeant 1991). Several studies have
found genetic separation between NE and NW
Atlantic harp seals (Meisfjord & Sundt 1996, Perry et
al. 2000).
All harp seal populations form large breeding aggre-
gations on the ice. The whelping period varies some-
what between populations, but is strongly synchronous
within populations, with the majority of pups in an
aggregation born within a very short (3 to 4 d) period.
Nursing lasts around 10 to 12 d (Sergeant 1991). Dur-
ing this period females spend a few hours each day in
the water, leaving their pups alone on the ice. Along-
side visual, olfactory and spatial cues, acoustic cues
provided by the pup are likely to play an important
role in the relocation process. Ice conditions, such as
the rate of ice drift, the type of ice that is used for
breeding and ice concentration, vary annually and be-
tween the different breeding locations of populations
(Wilkinson & Wadhams 2005, Friedlaender et al. 2007).
The breeding substrate in the Gulf of St. Lawrence
consists of large stable ice planes with breathing holes.
It is thought that this substrate enables the female to
predominantly use spatial cues during the relocation of
her pup (Kovacs 1995). In contrast to the situation in
the Gulf, the ice pack encountered off Newfoundland
(Front) is usually made up of small mobile seasonal
(first-year) ice floes (G. Stenson pers. obs.). In the NE
Atlantic, the ice pack encountered in the Greenland
Sea mainly consists of perennial (multi-year) ice floes.
Each of these ice types has distinctive physical (e.g.
thickness, albedo and roughness) and biological char-
acteristics (Snack-Schiel 2003).
Our aims in this study were to investigate (1)
whether vocal characteristics of harp seal pups vary
geographically, and (2) whether behaviors of mothers
and their pups differ between the breeding areas in
the Front and the Greenland Sea.
MATERIALS AND METHODS
Data collection. We recorded vocalizations and be-
havior of suckling harp seal pups and female atten-
dance patterns during 2 study periods at 4 breeding
sites, 2 in the Greenland Sea and 2 off southern
Labrador-northeast coast of Newfoundland (Front).
Because of the difference in timing of whelping in the
2 areas, the study in the Greenland Sea was carried out
from 18 to 30 March 2002 and the study in the Front
was conducted from 10 to 22 March 2004 to ensure that
pups of similar age were present.
Data collection for the Greenland Sea and the Front
were carried out in conjunction with harp seal abun-
dance surveys run by the Institute of Marine Research
in Norway and the Department of Fisheries and Oceans
in Canada (see Haug et al. 2006 and Stenson et al. 2005
for descriptions of the surveys). Once breeding aggre-
110
212

Van Opzeeland et al.: Geographic variation in harp seal pup vocalizations
gations were located, data collection on mothers and
pups was carried out from ice-strengthened vessels ei-
ther directly or as a base for helicopters.
The breeding aggregations in the Greenland Sea
were situated in the pack ice areas northeast of Jan
Mayen, centred around 72° 14’ N, 12° 43’ W (Patch
GS-A) and 72° 10’ N, 13° 10’ W (Patch GS-B, Fig. 1).
These correspond to patches A and B in Haug et al.
(2006). At the Front, the patches were situated off the
coast of southern Labrador around 50° 46’ N, 55° 19’ W
(F-A) and 51° 28’ N, 55° 07’ W (F-B, Fig. 1). These were
referred to as the Cartwright and Belle Isle concentra-
tions, respectively, by Stenson et al. (2005). The esti-
mate of the number of pups in patch GS-A was 4700
and in patch GS-B was 82 600 (Haug et al. 2006); the
estimate in patch F-A was 368 705 and in patch F-B
was 272 074 pups (Stenson et al. 2005).
Pup vocalizations. We chose groups of pups to
record based on safe access by helicopter or vessel to
ice floes where several pups were within walking dis-
tance. The helicopter landed within a few meters of the
nearest mother-pup pair. Landings and lift-offs were as
short as possible in order to minimize disturbance.
Helicopter landings frequently caused the nearest
pups to start vocalizing, while mothers sometimes left
the ice. However, mothers and pups were usually re-
united within minutes of the helicopter taking off. In
the case that females and their pups were noticeably
disturbed by the helicopter landing and take off, we
concentrated on recording pups that showed no distur-
bance or waited until behavior of disturbed animals
had returned to normal before recording. In the
Greenland Sea herd we caught all pups that we re-
corded and tagged them with a Dalton roto-tag in the
webbing of the right rear flipper. This tag has been
developed for long-term identification of domestic
sheep and goats. Studies on a variety of species have
shown that piercing caused by the insertion of the roto-
tag heals quickly, with no apparent detrimental effect
on the behavior of the individuals or apparent change
in behavior of other individuals towards tagged indi-
viduals (Testa & Rothery 1992). In harp seals, the
wound caused by insertion of the roto-tag caused little
to no bleeding and had healed cleanly in all pups that
were revisited on subsequent days. During the tagging
and recording procedures, mothers left their pups and
watched from a distance either from another flow or
from the water. For all pups tagged during this study,
reunion between mother and pup occurred within
minutes after the observers left the pup. At the Front,
study areas were marked with dye and visited only
once to make acoustic recordings of individual pups.
Within each study area recordings were made of 5 to
10 ind. and the recorder was therefore able to visually
identify which pups had been recorded.
We determined the sex and approximate age (based
on pelage-specific developmental stages; see Table 2
in Kovacs 1987) of each pup in both areas.
We used an MD 421-II microphone (Sennheiser; sensi-
tivity 170 dB, frequency bandwidth 36 Hz to 17 kHz ±
3 dB) connected to a TCD-D8 digital audiotape recorder
(Sony; frequency response 5 Hz to 22 kHz) to record pup
vocalizations. The microphone was
held 0.1 to 0.3 m from the vocalizing
pup. Recordings were made for about
5 min for each pup and included
51 calls, on average, for each pup in
both areas. The responses to our pres-
ence varied among pups, but overall
they showed little or no reaction when
we approached closely to record. Re-
cording techniques were similar at
each site to minimize variation in pup
response to the recordings. The re-
cordings were re-sampled (sampling
frequency 22 kHz, dynamic range
170 dB; the highest frequencies within
pup vocalizations were below 11 kHz)
and spectrographic analyses (fast
Fourier transformations — time reso-
lution: 10 ms; frequency resolution:
102 Hz; FFT size: 512) were conducted
using the sound analysis program
Raven 1.2 (Bioacoustics Research Pro-
gram, Cornell Lab of Ornithology).
Calls for which one or more of the vari-
111
30°W 50°N
30°W60°W 50°N 70°N
70°N
60°
60°W50°N
40°
CanadaGreenland
Iceland
Jan Mayen
Newfoundland
1
2
2
GS-A
GS-B
1
F-A
F-B
Fig. 1. Pagophilus groenlandicus. Study sites where vocalizations and behav-
ioral observations of harp seal mother-pup pairs were made: the Front (1) and
the Atlantic Greenland Sea (2). The insets show the whelping patches for the
Front (F-A and F-B) and the Greenland Sea (GS-A and GS-B) where the data
were collected
213

Aquat Biol 6: 109–120, 2009
ables could not be measured were omitted from the
analyses.
Using overall call shape, each signal was assigned a
signal type (i.e. tonal call, pulsed call or a combination
of the 2; see Miller & Murray 1995, Fig. 2 in Van Opzee-
land & Van Parijs 2004). Tonal calls typically had a har-
monic structure. Pulsed calls were characterized by a
pulsed signal, lacking harmonic structure. As several
acoustic variables could not be measured from the
pulsed and combination vocalizations, these signal
types were not included in subsequent analyses. There-
fore we only used tonal calls in these analyses. Our
recordings were consistent with the observations of Ko-
vacs (1987), that tonal vocalizations were primarily as-
sociated with nursing, whereas pulsed signals were
clearly related to situations in which pups felt threat-
ened by the presence of the recorder or other seals
nearby and were not considered to be pure mother at-
traction calls. Individuals with fewer than 15 recorded
tonal vocalizations were excluded from analyses.
For the Front, we measured 10 vocal parameters for
each tonal call (Fig. 2): (1) call duration (DURN); (2 to
4) three harmonics of greatest amplitude (PF1 to PF3);
(5) the number of harmonics (HARM);
(6) the maximum frequency of the lower
harmonic (SH1); (7) the maximum fre-
quency of the second harmonic (EH1);
(8) the duration of the ascending part of
the call (DURASC); (9) the duration of
the plateau part (DURPLAT); and (10)
the duration of the descending part of
the call (DURDESC). In an earlier study
on harp seal pup vocal behavior (Van
Opzeeland & Van Parijs 2004), these
parameters were measured for a subset
of the data from the Greenland Sea (10
randomly selected individuals: N = 5
males and 5 females) to explore which
parameters were important in individual
variation. Seven vocal parameters (1 to
7) were highlighted as important.
Therefore for the Greenland Sea data
set, further analysis of the whole data
set of tonal calls was carried out on only
7 of the vocal parameters (see Van
Opzeeland & Van Parijs 2004 for more
details).
Because of wind noise during record-
ings made at the Front we could not
make good counts for HARM values in
many cases. Consequently, we removed
this parameter (i.e. HARM) from the
Front data set. We included 9 vocal para-
meters in further analyses of the Front
data.
We assessed variation in vocal parameters among
pups using classification trees (CART). The data did
not follow a normal distribution and were therefore
log-transformed. Analyses were carried out in R (R
Development Core Team 2007, version 2.5.1, www.
R-project.org), running under MS Windows; and the
RPART library (v.3.1-36, Therneau & Atkinson 2004)
for CARTs. As opposed to other multivariate tech-
niques such as discriminant analyses and principal
component analyses, CART analyses provide a useful
technique for exploring multivariate nonparametric
data. Furthermore, CART analyses produce a result
that is readily visually accessible (see Risch et al. 2007
for a detailed explanation of this analysis). We used
9 vocal parameters for analyses of Front data except
when comparing them with data from the Greenland
Sea, when we used only the 7 vocal parameters ob-
tained from both areas in the comparative analyses.
Mother-pup behavior. Visual observations of
mother-pup behavior were made from the ship drifting
within the whelping aggregations using 7 × 50 binocu-
lars (Zeiss) over 10 d in the Front and 13 d in the
Greenland Sea. Behavioral observations in both areas
112
Fig. 2. Pagophilus groenlandicus.
The 10 vocal parameters mea-
sured. (a) Spectrogram: call dura-
tion (DURN), and duration of as-
cending (DURASC), plateau
(DURPLAT) and descending
(DURDESC) call parts. (b) En-
larged section of the spectrogram.
EH1, SH1: maximum frequency of
2nd and lower harmonics, respec-
tively. (c) Power spectrum: the 3
harmonics of greatest amplitude
(PF1–PF3)
214

Van Opzeeland et al.: Geographic variation in harp seal pup vocalizations
were made when no persons were on the ice. We re-
corded behaviors of pups and female attendance pat-
terns in 30 min blocks using scan sampling of mother-
pup pairs at 30 s intervals (according to the methods
used by Kovacs 1987 in the Gulf of St. Lawrence). Be-
cause of the relatively large distance between the ob-
server and the mother-pup pairs we were not able to
determine the sex of the pups observed from the ship.
We defined female attendance as the
time spent by the female on the ice in the
same area as her pup, regardless of her
behavioral state (Kovacs 1987). There is a
diurnal pattern to these attendance pat-
terns with attendance increasing in the
late afternoon and evening (Kovacs
1987). In the Greenland Sea behavior
was recorded between 16:00 and 19:30 h.
A few observations were also made be-
fore 16:00 h, but there were too few to in-
clude in the analyses. At the Front we
made observations between 07:00 and
17:00 h. Because of latitudinal differ-
ences between the 2 study sites (Fig 1),
time prior to local sunset differed be-
tween the 2 sites. Therefore, analyzing
the data between 16:00 and 17:00 h,
when data collection overlapped be-
tween the 2 sites, would not completely
preclude some time-of-day effect.
Therefore, we restricted the analyses to
data collected after 16:00 h.
We observed 3 to 6 mother-pup pairs si-
multaneously; the developmental stage of
each pup and behavioral state was deter-
mined for each seal under observation on
each scan. Behavioral states were defined
according to Kovacs 1987 (Table 1). Al-
though Kovacs (1987) identified 18 be-
haviors, we did not observe all of the be-
haviors in either the Greenland Sea or the
Front. Four of the behaviors (sexual, low
threat, high threat, and fighting) were not
observed in either study area. Four others
(presentation, check pup, foreign social,
and pup agonistic) were seen only in the
Greenland Sea. Behavioral states for
which there were <2 observations were
eliminated from the set. Eight units of be-
havior (idle, comfort movements, nursing,
nosing, locomotion, swimming, explo-
ration, and alert) were observed often
enough for analyses.
In line with Kovacs (1987), we se-
lected pups opportunistically during
scanning sessions, without reference to
maternal presence or absence. Each observation ses-
sion lasted 30 min, after which a new set of mother-pup
pairs was selected and a new session started. Because
the research vessel was drifting through the ice pack,
30 min was a conservative limit during which all pairs
clearly remained within visual range. No pairs were
sampled for more than 1 session. A linear model tested
for the effects of site, pup stage and site–stage inter-
113
Behavioral state Criteria
Idle Resting motionless in a prone position on the ice(eyes open or closed)
Comfort movements In a prone position performing low intensity activi-ties, including weight shifting, stretching, etc., andin the case of pups, ‘wriggling’ without changinglocation, and shivering for young pups
Nursing Female lying quiescent on her side, nipplesexposed, pup in oral contact with the nipples (timespent moving between nipples was included aspart of the nursing sequence)
Presentation Female postures such that the nipples are accessi-ble to the pup, often accompanied by gentlemotions of the female’s foreflipper that was furthestfrom the surface
Nosing Non-nursing physical contact between a motherand her pup, consisting of naso-nasal or naso-bodycontact
Check pup Female makes visual contact with her pup, turningher head if necessary
Foreign social Non-agonistic, non-sexual physical contact outsidethe mother-pup pair
Sexual Attempted mounting or copulatory behavior
Low threat Female on ventum with head elevated from the ice,neck extended, mouth open and vibrissae erect,often accompanied by low growling vocalizations
High threat Female on ventum with entire upper body elevatedfrom the ice, nose held vertically, vibrissae helderect, often accompanied by a ‘warbling’ vocaliza-tion and rapid clawing of the ice with a foreflipper
Fighting Female makes physical contact with another adultanimal, biting, clawing or pushing
Attack pup Female biting or clawing a pup
Pup agonistic Pup growling accompanied by a variety of ‘alert’body positions or lunging directed toward anotheranimal
Locomotion Changing topographical location on the ice
Swimming Time spent by a pup in the water, whether or not itappeared to change location
Exploration Pup investigating or manipulating an object oranother pup, using its vibrissae, nose, mouth orforeflippers
Play Repeated, exaggerated, jerky or ‘wriggling’ bodymovements, often accompanied by loud growlingdirected toward ice or skyward
Alert Head and upper body elevated from the ice sur-face, eyes open, animal frequently on ventrum withforeflippers gripping the ice
Table 1. Pagophilus groenlandicus. Behavioral criteria used to define behavioral
states recorded during scanning sessions (from Kovacs 1987, their Table 1)
215

Aquat Biol 6: 109–120, 2009
action. We tested whether the suite of behaviors dis-
played by pups varied by site, pup stage class, and the
interaction between these. We did this using the matrix
of behavior with pups as rows, behaviors as columns.
Behavioral matrices were compared using the function
Adonis in vegan R-package (v. 1.8-8, Oksanen et al.
2007), running what is functionally a nonparametric
MANOVA (Anderson 2001). This technique partitions
sums of squares of a multivariate data set, thus allow-
ing hypothesis testing. It differs from MANOVA (but
is similar to AMOVA, Excoffier et al. 1992) in using
the outer product matrix of the response matrix
(MANOVA uses the inner product matrix). By doing
so, semi-metric or metric distance matrices can be
tested (Anderson 2001, Oksanen et al. 2007). Signifi-
cance testing is achieved through permutations of raw
data (Oksanen et al. 2007).
The matrix was row-standardized so that the analy-
sis was of the proportions of different units of behavior
exhibited by individual seal pups. As the data were
proportions of unbalanced count data, we used Horn’s
modification of Morisita’s index (Oksanen et al. 2007)
to generate a distance matrix from the standardized
behavioral matrix. Testing of the linear model was
based on 1000 permutations.
In addition, we tested whether there was a site effect
on female attendance. As the data were binomial (fe-
males present or absent) and over-dispersed (mean
39.9, variance 512.98), we ran a quasi-binomial gener-
alized linear model (Venables & Ripley 2002) with lo-
gistic link function. This analysis was carried out using
R (v.2.5.1) and the MASS library (v.7.2-36, Venables &
Ripley 2002). Where significance was tested for, we ac-
cepted an α value of 0.05 as significant.
RESULTS
Vocal behavior of pups
After quality selection of the Front data set, 984 calls
from 25 pups (12 males, 13 females) were suitable for
further analyses (Tables 2 & 3).
An initial 33-node classification tree was pruned
with cross-validation. The 1-SE rule (i.e. the smallest
tree for which the cross-validated relative error rate is
within 1 SE of the minimum; De’ath & Fabricius 2000)
suggested that the appropriate descriptive tree was
one with 11 nodes (Fig. 3). The analysis correctly clas-
sified 32% (315 out of 984) of calls according to indi-
vidual for the Front data set (Fig. 3). The first major
split was based on PF1. The next 2 splits occurred at
SH1 and at other values of PF1, followed by splits
based on DURN and SH1. Of the 13 female pups, 38%
were classified correctly according to individual. For
the 12 males, 42% were correctly classified. For the
Greenland Sea data set, 43% of calls were correctly
classified according to individual. The first major split
was based on PF3 and separated male and female
pups. Of the 42 female pups, 55% were classified cor-
rectly according to individual, whereas 8% of 49 male
pups were correctly classified.
114
Vocal parameters Sex N Mean ± SD CV (%)
DURN F 512 833.3 ± 282.9 34
M 472 907.1 ± 333.3 37
PF1 F 512 1.4 ± 0.6 40
M 472 1.2 ± 0.4 36
PF2 F 512 1.8 ± 0.8 43
M 472 1.7± 0.6 38
PF3 F 512 2.5 ± 1.2 47
M 472 2.5 ± 1.0 39
SH1 F 512 859.2± 181.3 21
M 472 876.2 ± 154.5 18
EH1 F 512 1680.1 ± 333.5 20
M 472 1707.3 ± 290.6 17
DURASC F 382 0.2 ± 0.1 47
M 347 0.2 ± 0.1 56
DURPLAT F 401 0.7 ± 0.3 40
M 372 0.7 ± 0.3 43
DURDESC F 336 0.1 ± 0.1 64
M 294 0.1 ±0.1 58
Table 2. Pagophilus groenlandicus. Descriptive statistics of the
9 mother–pup call parameters measured for 12 male (M) and
13 female (F) harp seal pups recorded in the Front. DURN: du-
ration (ms); PF1–PF3: 1st, 2nd and 3rd peak frequency (kHz);
SH1, EH1: maximum frequency of the lower and 2nd har-
monic, respectively (Hz); duration of ascending (DURASC),
plateau (DURPLAT) and descending (DURDESC) call parts,
respectively (ms)
Vocal parameters Sex N Mean ± SD CV (%)
DURN F 1173 871.2 ± 276.2 32
M 1188 855.8 ± 595.7 70
PF1 F 1173 1.2 ± 0.4 32
M 1188 1.1 ± 0.4 32
PF2 F 1173 2.1 ± 0.6 31
M 1188 1.9 ± 0.8 40
PF3 F 1173 3.1 ± 0.7 23
M 1188 2.8 ± 1.1 39
HARM F 1173 10.9 ± 6.1 56
M 1188 11.8 ± 7.0 60
SH1 F 1173 1042.7 ± 282.1 27
M 1188 1016.4 ± 274.6 27
EH1 F 1173 1675.5 ± 451.9 27
M 1188 1586.5 ± 454.5 29
Table 3. Pagophilus groenlandicus. Descriptive statistics of
the vocalizations of 49 male (M) and 42 female (F) harp seal
pups recorded in the Greenland Sea (from Van Opzeeland &
Van Parijs 2004). HARM: number of harmonics; all other
abbreviations as in Table 2
216

Van Opzeeland et al.: Geographic variation in harp seal pup vocalizations
In order to compare pup vocal behavior between the
Greenland Sea and the Front, a CART was run, using
site as response variable. With no misclassifications,
100% of the variation in pup calls was explained in the
first split, demonstrating a clear difference between
pup vocal characteristics and site. DURN was found to
be the vocal parameter driving the split between pup
calls recorded in the Greenland Sea and pup calls
recorded in the Front. Pups from the Greenland Sea
had calls that were longer in duration (greater than
1.2 s) compared with Front pups. Table 4 summarizes
the results of the CARTs for individual and sex differ-
ences within vocalizations recorded in the Greenland
Sea and the Front.
Mother-pup behavior
A total of 46 h of scan samples were collected and a
total of 91 mother-pup pairs were observed in the
Greenland Sea (N = 4941 observations). In the Front,
85 h of scan samples were collected and a total of 180
pairs (N = 10 657 observations) were observed. After
discarding data collected before 16:00 h, there were
data on 136 pups (58 Front, 78 Greenland Sea).
Kovacs’s (1987) units of behavior were used (Table 1).
As data were collected on only 2 Stage 4 pups at either
site, these were concatenated with Stage 3 pups into a
Stage 3+ category. There was a significant Site effect,
but no effect of Stage or Site × Stage interaction
(Table 5).
Review of the raw data (Fig. 4) suggested that pups
in the Front spent more time idle, whereas Greenland
Sea pups suckled more and were more alert than
pups at the Front. We tested whether there was a site
effect on female attendance using a quasi-binomial
generalized linear model (GLM) with log link (Ven-
ables & Ripley 2002). This demonstrated a significant
effect of site on female attendance. Females in the
Greenland Sea were less likely to be present on the
ice with their pups than those at the Front (Table 6).
In late afternoon and evening, females in the Green-
land Sea were with their pups around half the time
(average time in attendance = 52.2 ± 38.69%, mean ±
SD). At the Front, females were in attendance most of
the time (85.1 ± 28.69%).
115
PF1>=3.05
PF1>=3.14
PF1>=3.29
PF1>=3.35 EH1>=3.15
EH1>=3.26
PF2>=3.36
DURN>=0.09
DURN<0.12
SH1<2.75
G
(39%)
G
(53%)H
(44%)J
(93%)
N
(38%)
M
(79%)F
(34%)
H
(21%)
X
(31%)
E
(31%)
C
(53%)
S
(77%)
SH1<2.75
Fig. 3. Pagophilus groenlandicus. An 11-node classification
tree showing how vocalizations from 25 harp seal pups
recorded in the Canadian Front split, based on log-trans-
formed data of 12 measured vocal parameters: call duration
(DURN), 3 harmonics of greatest amplitude (PF1–PF3), the
maximum frequency of the lower and 2nd harmonic (SH1,
EH1, respectively). Letters at the bottom of the tree represent
individual pups. Percentages indicate the percentage of calls
that were classified correctly according to individual for the
individual pups. Twelve of the 25 ind. were extracted by this
analysis, explaining 52% of the total variation. The vertical
depth of each split explains the proportion of total variation
explained by that split. Splits early in the tree (i.e. near the top
of the page) account for more variability in the data than those
lower down in the tree
No. of No. of First major Pups correctly No. of Females Misclassified No. of Males Misclassified
ind. calls CART split identified female correctly female calls male correctly male calls
(%) pups identified (%) pups identified (%)
(%) (%)
Greenland 91 4075 3rd peak 43 42 55 14 47 8 86
Sea frequency
(PF3)
Front 25 984 1st peak 32 13 38 66 12 42 34
frequency
(PF1)
Table 4. Pagophilus groenlandicus. Results of the classification trees (CARTs) exploring individual and sex differences within
harp seal pup vocalizations recorded in the Atlantic Greenland Sea and the Front
217

Aquat Biol 6: 109–120, 2009
DISCUSSION
Pup vocal behavior
We investigated the vocal behavior of
harp seal pups in the Front by exploring
a range of acoustic parameters, most of
which have been shown to be important
for recognition between mothers and
pups in other pinnipeds (Insley 1992,
Charrier et al. 2002, Insley et al. 2003).
There was low variation (~40%) among
pups at the Front, perhaps owing to
confounding factors, such as age and
sex. Nonetheless, we think that this low
variation suggests that vocal recognition may not be
the sole means of recognition between mother and pup
harp seal pairs in the Front. Other studies of the Cana-
dian harp seal population in the Gulf of St. Lawrence
reached similar conclusions and suggested that olfac-
tion and the use of spatial memory were likely impor-
tant cues for the relocation and recognition of pups by
females (Terhune et al. 1979, Kovacs 1987, 1995).
Our analyses of vocal behavior of harp seal pups
from the Greenland Sea showed a significantly higher
116
df SS MS FModel R2 p
Site 1 2.952 2.952 27.044 0.167 <0.001
PupStage 2 0.603 0.301 2.762 0.034 0.113
Site × PupStage 2 0.040 0.020 0.185 0.002 0.993
Residuals 130 14.191 0.109 0.798
Total 135 17.786 1.000
Table 5. Pagophilus groenlandicus. Nonparametric MANOVA (Anderson 2001)
testing for effects of site (Greenland Sea or Newfoundland) and harp seal pup
stage (1, 2, 3+, see ‘Material and methods’ for details of staging) and site–stage
interaction. Eight units of behavior — idle, comfort movements, nursing, nosing,
locomotion, swimming, exploration, and alert — were included in the analysis.
Note that the F-values are pseudo-F values (see Anderson 2001 for details)
rather than Fisher’s F-ratio
Estimate SE t p
Intercept 1.7771 0.2936 6.052 1.35 × 10⁻⁸**
Site (Greenland –1.5225 0.3454 –4.408 2.12 × 10⁻⁵**
Sea compared to Front)
Table 6. Pagophilus groenlandicus. Quasi-binomial general-
ized linear model testing the effect of site (Greenland Sea,
Front) on pup attendance by female harp seals. **Significant
at p < 0.05
Fig. 4. Pagophilus groenlandicus. Mean ± SD for the 8 observed behaviors: idle (IDLE), comfort movements (CMFT), nursing
(NRSE), nosing (NOSE), exploration (EXPL), locomotion (LOCO), swimming (SWIM) and alert (ALRT), for harp seal pups at the
Front (FR, n = 58) and the Greenland Sea (GS, n = 78)
218

Van Opzeeland et al.: Geographic variation in harp seal pup vocalizations
proportion of correctly classified vocalizations for
female pups than for male pups, suggesting that vocal-
izations of female pups are considerably more distinct
than those of male pups (Van Opzeeland & Van Parijs
2004). Similar analyses of harp seal pup vocal behavior
in the Front, however, showed no significant differ-
ences between the proportion of correctly classified
vocalizations for female and male pups. For the Green-
land Sea it was suggested that female harp seal pup
individuality may serve a function during later devel-
opmental age classes (Van Opzeeland & Van Parijs
2004). Adult female harp seals are evidently faithful to
particular locations (Sergeant 1991, Perry et al. 2000),
which may lead to selection for distinctive vocaliza-
tions among related females. However, unless females
exhibit population level differences in their behavior
patterns, this hypothesis would not explain the similar
proportions of correctly classified vocalizations ob-
served between males and female pups at the Front.
The duration of vocalizations of pups was the
acoustic parameter that separated calls of pups accord-
ing to location. Pup calls recorded in the Greenland
Sea were longer than calls recorded in the Front. Sev-
eral studies have suggested that lengthening of calls
may be a response to reduce overlap with conspecific
calls, which may occur in dense aggregations of ani-
mals (Watkins & Schevill 1968, Terhune et al. 1994).
However, the sizes of the Greenland Sea breeding
patches were smaller compared to the Front breeding
patches (4700 and 82 600 pups in the Greenland Sea
vs. 368 705 and 272 074 pups in the Front). Although
we do not have detailed breeding patch density esti-
mations, we do not think that a difference in density of
the 2 harp seal breeding aggregations can explain the
observed differences in durations of calls of pups.
Perry & Terhune (1999) reported variation in under-
water vocalizations of adult harp seals among different
breeding locations. Vocalizations obtained from the
Gulf and Front components did not differ from each
other, but did differ from the underwater vocalizations
from the Greenland Sea herd (Perry & Terhune 1999).
Similarly, we found evidence for geographic variation
in vocal behavior of harp seal pups, perhaps owing to
several factors though the reasons for these differences
are not clear.
Mother-pup behavior
Female attendance differed significantly between
the 2 sites; the age of the pup was not a significant fac-
tor to explain these differences. In the Greenland Sea,
mothers attended pups for fewer hours in the afternoon
and evening, and nursed their pups for longer periods,
compared to mothers in the Front. There are several
possible explanations for what may be driving the
behavioral and acoustic differences between these
populations, some of which may act in combination.
Females may have adjusted their behavior in re-
sponse to hunting by humans to maximize their time in
the water. We do not think that the risk of predation by
polar bears can explain these differences, as very few
bears evidently travel out as far as the northern Green-
land ice, compared with significant polar bear presence
at the Front (Wiig et al. 2003). However, harp seals have
been harvested commercially since the 1700s, with the
Canadian hunt starting earlier than the Greenland Sea
hunt (Haug et al. 2006, Skaug et al 2007). Although the
current hunt in the Greenland Sea is almost 2 orders of
magnitude smaller than the Canadian hunt, the Green-
land Sea population has been reduced to a smaller pro-
portion of its initial population size than the Canadian
population (Hammill & Stenson 2007, Skaug et al. 2007)
and current pup production in the Greenland Sea is ap-
proximately an order of magnitude smaller than that in
Canadian waters (Haug et al. 2006). Harvesting might
have evolutionary consequences depending on the in-
tensity of the hunt and the age classes targeted (Colt-
man 2008, Wirsing et al. 2008).
Geographic location and density might also affect
maternal behavior as there was a large difference in
the sizes of the Greenland Sea and Front breeding
patches. Previous studies report varying effects of pop-
ulation density on maternal behavior (e.g. Boness et al.
1998, Bradshaw et al. 2000). However, more data, in-
cluding detailed density estimations, behavioral ob-
servations on mothers and estimates of pup condition,
are necessary to investigate the potential effect of
whelping patch density on harp seal mother-pup be-
havior.
Some phocids might adjust their diving behavior and
the timing of foraging in response to prey availability
and movements (Kooyman 1975, Burns et al. 2008).
Female harp seals leave their pups during the lactation
period to forage under the ice. Therefore, site-specific
differences in temporal patterns of prey behavior may
also influence female attendance patterns.
Environmental conditions such as ice thickness,
weather (i.e. wind speed, air temperature), or both,
fluctuate substantially among sites and years. Weather
conditions have been suggested to influence haul out
patterns of females with pups in several ice-breeding
seal species (Finley 1979, Thomas & DeMaster 1983).
The observed differences in mother-pup behavior
could therefore be related to geographic differences in
environmental conditions.
Recent climatic variations have resulted in changes
in the dynamics of ice and thaw, increasing the unpre-
dictability of ice cover in all Arctic areas (Tynan &
DeMaster 1997, Serreze et al. 2003). Serreze et al.
117
219

Aquat Biol 6: 109–120, 2009
(2003) reported a record minimum Arctic sea ice extent
in 2002, the year during which the behavioral and
acoustic data were collected in the Greenland Sea. In
addition, several studies suggest that the largest de-
creases in sea ice extent as a result of climate change
occur in areas with multi-year ice (e.g. Serreze et al.
2003, Nghiem et al. 2007). To examine whether the ice
extent and composition in 2002 in the Greenland Sea
differed from other years, we used data from the Cen-
ter for Satellite Exploitation and Research (CERSAT,
http://cersat.ifremer.fr) database to plot the backscat-
ter coefficients and sea ice concentration for March for
both study areas over a period of 6 yr. Sea ice concen-
tration indicates the sea ice extent (areas with <15%
ice concentration represent open water). The back-
scatter coefficient provides information on the sea-ice
age: low backscatter coefficients indicate pure first-
year ice, whereas high backscatter coefficients indi-
cate pure multi-year ice that has survived the melt
period and is less saline than first-year ice. Intermedi-
ate coefficient values represent mixed ice types. When
we compared backscatter and sea-ice concentration
data from March 2000 to 2006 for both areas, the plots
did not show a clear difference in ice type composition
within areas over this 6 yr period; multi-year ice was
consistently the predominant ice type in the Greenland
Sea, whereas the Front was made up of first-year ice
(Fig. 5). Sea ice concentration data also did not show
clear differences between years within both areas.
Nevertheless, when the ice extent within areas where
whelping patches were located were compared be-
tween years, the ice extent in the Front area was low in
2004 compared to the other years, whereas it remained
fairly constant over 2000 to 2006 in the Greenland Sea
whelping patch area (Fig. 5). Friedlaender et al. (2007)
reported the sea ice cover in the Front to have been
below average ice cover in the period 1996 to 2006 and
suggested that lack of solid ice may result in reduced
reproductive success of adult harp and hooded seal
females, increased pup mortality and changes in food
availability. The observed differences in harp seal
mother-pup behavior between the 2 sites could there-
fore be a result of the low sea ice extent in 2004 in the
Front area, suggesting that the observed differences
are a mere year-effect and potentially differ from years
with average sea ice cover extent. However, as sea ice
118
Fig. 5. Backscatter plot based on satellite imaging data from the CERSAT database showing March ice composition and extent for
both study areas. High backscatter coefficients (white) indicate pure perennial (multi-year) ice, whereas low backscatter coeffi-
cients (black) indicate pure seasonal (first-year) ice. Black line (visible in some panels): boundary of 15% ice concentration;
GS: Greenland Sea
220

Van Opzeeland et al.: Geographic variation in harp seal pup vocalizations
extent has been below average for several years in this
area (Friedlaender et al. 2007), differences in harp seal
mother-pup behavior in the Front area may also reflect
the effects of persistent changes in ice extent. In
bearded seals, it has been shown that fluctuations in
ice cover can affect the number of displaying males
and their display behavior (Van Parijs et al. 2004). It is
plausible that changing ice conditions also influence
female behavior.
A number of plausible hypotheses exist that may ex-
plain the behavioral and acoustic variability observed
in female harp seals and their pups within this study.
However, the one conclusion that can be drawn from
this study is that there is still little understanding with
regards to the behavioral ecology of these populations
and the drivers behind the decision-making processes
for this species. The results of this study indicate that in
addition to the traditional methods of studying popula-
tion dynamics and ecology, behavioral studies can pro-
vide further insights into differentiation of populations
and the potential effects of changing environments on
populations. Given drastic climatic changes facing the
Arctic, the current lack of data is likely to impede us in
understanding the effects of habitat loss on harp seal
populations world wide.
Acknowledgements. We thank T. Haug for providing us the
opportunity to carry out our field work in the Greenland Sea
during the 2002 harp seal cruise. C. Duck, D. McKinnon, D.
Wakeham, L. Lindblom, P. Abgrall, S. Tucker and I. Sten-
house helped with aspects of the field work. L. Rabenstein
kindly helped with handling the CERSAT ice data. We did not
need permits or licenses to collect behavioral or acoustic data
in the Greenland Sea. For data collection in the Front, a scien-
tific permit issued under the Marine Mammal Regulations
(MMR, part of the Fisheries Act) was obtained and the project
was approved by the DFO animal care committee. Funding
was provided by the Amundsen Center for Arctic Research
and the Faculty of Science of the University of Groningen.
LITERATURE CITED
Anderson MJ (2001) A new method for non-parametric multi-
variate analysis of variance. Austral Ecol 26:32–46
Boness DJ, Craig MP, Honigman L, Austin S (1998) Fostering
behavior and the effect of female density in Hawaiian
monk seals, Monachus schauinslandi. J Mammal 79:
1060–1069
Bradshaw CJA, Davis LS, Lalas C, Harcourt RG (2000) Geo-
graphic and temporal variation in the condition of pups of
the New Zealand fur seal (Arctocephalus forsteri): evi-
dence for density dependence and differences in the
marine environment. J Zool 252:41–51
Burns JM, Hindell MA, Bradshaw CJA, Costa DP (2008) Fine-
scale habitat selection of crabeater seals as determined by
diving behavior. Deep Sea Res II 55:500–514
Charrier I, Mathevon N, Jouventin P (2002) How does a fur
seal mother recognize the voice of her pup? An experi-
mental study of Arctocephalus tropicalis. J Exp Biol 205:
603–612
Coltman DW (2008) Molecular ecological approaches to
studying the evolutionary impact of selective harvesting in
wildlife. Mol Ecol 17:221–235
De’ath G, Fabricius KE (2000) Classification and regression
trees: a powerful yet simple technique for ecological data
analysis. Ecology 81:3178–3192
Excoffier L, Smouse PE, Quattro JM (1992) Analysis of molec-
ular variance inferred from metric distances among DNA
haplotypes: application to human mitochondrial DNA
restriction data. Genetics 131:479–491
Finley KJ (1979) Haul-out behaviour and densities of ringed
seals (Phoca hispida) in the Barrow Strait area, N.W.T. Can
J Zool 57:1985–1997
Foster SA (1999) The geography of behaviour: an evolution-
ary perspective. Trends Ecol Evol 14:190–195
Friedlaender AS, Johnston DW, Fink SL, Lavigne DM (2007)
Variation in ice cover on the East Coast of Canada, Febru-
ary-March, 1969–2006: implications for harp and hooded
seals. Intl Fund Animal Welfare Tech Rep 2007-1
Hammill MO, Stenson GB (2007) Application of the precau-
tionary approach and conservation reference points to
management of Atlantic seals. ICES J Mar Sci 64:702–706
Haug T, Stenson GB, Corkeron PJ, Nilssen KT (2006) Estima-
tion of harp seal (Pagophilus groenlandicus) pup produc-
tion in the North Atlantic completed: results from surveys
in the Greenland Sea in 2002. ICES J Mar Sci 63:95–104
Insley SJ (1992) Mother-offspring separation and acoustic
stereotypy: a comparison of call morphology in two spe-
cies of pinnipeds. Behaviour 120:103–122
Insley SJ, Phillips AV, Charrier I (2003) A review of social
recognition in pinnipeds. Aquat Mamm 29:181–201
Kooyman GL (1975) A comparison between day and night
diving in the Weddell seal. J Mammal 56:563–574
Kovacs KM (1987) Maternal behaviour and early behavioural
ontogeny of harp seals, Phoca groenlandica. Anim Behav
35:844–855
Kovacs KM (1995) Mother-pup reunions in harp seals, Phoca
groenlandica: cues for the relocation of pups. Can J Zool
73:843–849
Lydersen C, Kovacs KM (1993) Diving behaviour of lactating
harp seal, Phoca groenlandica, females from the Gulf of St
Lawrence, Canada. Anim Behav 46:1213–1221
Lydersen C, Kovacs KM (1999) Behaviour and energetics of
ice-breeding, North Atlantic phocid seals during the lacta-
tion period. Mar Ecol Prog Ser 187:265–281
McCulloch S, Boness DJ (2000) Mother-pup vocal recognition
in the grey seal (Halichoerus grypus) of Sable Island,
Nova Scotia. Can J Zool 251:449–455
McCulloch S, Pomeroy P, Slater PJB (1999) Individually dis-
tinctive pup vocalizations fail to prevent allo-suckling in
grey seals. Can J Zool 77:716–723
Meisfjord J, Sundt RC (1996) Genetic variation between pop-
ulations of the harp seal, Phoca groenlandica. ICES J Mar
Sci 53:89–95
Miller EH, Murray AV (1995) Structure, complexity and orga-
nization of vocalizations in harp seal (Phoca groenlandica)
pups. In: Kastelein RA, Thomas JA, Nachtigall PE (eds)
Sensory systems of aquatic mammals. De Spil, Woerden,
p 237–264
Nghiem SV, Rigor IG, Perovich DK, Clemente-Colon P,
Weatherly JW, Neumann G (2007) Rapid reduction of Arc-
tic perennial sea ice. Geophys Res Lett 34:L19504, doi:10.
1029/2007GL031138
Oksanen J, Kindt R, Legendre P, O’Hara B, Henry M, Stevens
H (2007) The vegan package, R package 1.8-8. http://cran.
r-project.org
Perry EA, Terhune JM (1999) Variation of harp seal (Pago-
119
➤
➤
➤
➤
➤
➤➤
➤
➤
➤➤
➤
➤
➤
➤
➤
➤
➤
➤
➤
➤
➤
➤
➤
221

Aquat Biol 6: 109–120, 2009
philus groenlandica) underwater vocalizations among
three breeding locations. J Zool 249:181–186
Perry EA, Stenson GB, Bartlett SE, Davidson WS, Carr SM
(2000) DNA sequence analysis identifies genetically dis-
tinguishable populations of harp seals (Pagophilus groen-
landicus) in the NW and NE Atlantic. Mar Biol 137:53–58
Risch D, Clark CW, Corkeron PJ, Elepfandt A and others
(2007) Vocalizations of male bearded seals, Erignathus
barbatus: classification and geographical variation. Anim
Behav 73:747–762
Sergeant DE (1991) Harp seals, man and ice. Canadian Special
Publication of Fisheries and Aquatic Sciences 114:1–153
Serreze MC, Maslanik JA, Scambos TA, Fetterer F and others
(2003) A record minimum arctic sea ice extent and area in
2002. Geophys Res Lett 30:1110, doi:10.1029/2002GL016406
Skaug HJ, Frimannslund L, Øien NI (2007) Historical popula-
tion assessment of Barents Sea harp seals (Pagophilus
groenlandicus). ICES J Mar Sci 64:1356–1365
Snack-Schiel SB (2003) The macrobiology of sea ice. In:
Thomas DN, Dieckmann GS (eds) Sea ice: an introduction
to its physics, chemistry, biology and geology. Blackwell,
Oxford, p 240–267
Stenson GB, Hammill MO, Lawson J, Gosselin JF, Haug T
(2005) Pup production of harp seals (Pagophilus groen-
landicus), in the NW Atlantic. Canadian Science Advisory
Secretariat. Res Doc 2005/037. Available at: http://www.
dfo-mpo.gc.ca/csas/
Terhune JM (1994) Geographical variation of harp seal
underwater vocalizations. Can J Zool 72:892–897
Terhune JM, Terhune ME, Ronald K (1979) Location and
recognition of pups by adult female harp seals. Appl Anim
Ethol 5:375–380
Terhune JM, Grandmaitre NC, Burton HR, Green K (1994)
Weddell seals lengthen many underwater calls in response
to conspecific vocalizations. Bioacoustics 5:223–226
Testa JW, Rothery P (1992) Effectiveness of various cattle
ear tags as markers for Weddell seals. Mar Mamm Sci 8:
344–353
Testa JW, Hill SEB, Siniff DB (1989) Diving behavior and
maternal investment in Weddell seals (Leptonychotes
weddellii). Mar Mamm Sci 5:399–405
Therneau TM, Atkinson B (2004) rpart: recursive partioning.
R Package Version 3.1-20. S-PLUS 6.x (available at http:
//www.mayoresearch.mayo.edu/mayo/research/biostat/
splusfunctions.cfm)
Thomas JA, DeMaster DP (1983) Diel haul-out patterns of
Weddell seal (Leptonychotes weddelli) females and their
pups. Can J Zool 61:1148–1456
Tynan CT, DeMaster DP (1997) Observations and predictions
of Arctic climate change: potential effects on marine mam-
mals. Arctic 50:308–322
Van Opzeeland IC, Van Parijs SM (2004) Individuality in harp
seal, Phoca groenlandica, pup vocalizations. Anim Behav
68:1115–1123
Van Parijs SM, Hastie GD, Thompson PM (2000) Individual
and geographic variation in the vocal behaviour of the
harbour seal. Anim Behav 59:559–568
Van Parijs SM, Kovacs KM, Lydersen C (2001) Spatial and
temporal distribution of vocalising male bearded seals —
implications for male mating strategies. Behaviour 138:
905–922
Van Parijs SM, Lydersen C, Kovacs KM (2003) Vocalizations
and movements suggest alternative mating tactics in male
bearded seals. Anim Behav 65:273–283
Van Parijs SM, Lydersen C, Kovacs KM (2004) Effects of ice
cover on the behavioural patterns of aquatic-mating male
bearded seals. Anim Behav 68:89–96
Venables WN, Ripley BD (2002) Modern applied statistics
with S, 4th edn. Springer Verlag, New York
Watkins WA, Schevill WE (1968) Underwater playback of their
own sounds to Leptonychotes (Weddell seals). J Mammal
49:287–296
Wiig Ø, Born EW, Pedersen LT (2003) Movements of female
polar bears (Ursus maritimus) in the East Greenland pack
ice. Polar Biol 26:509–516
Wilkinson JP, Wadhams P (2005) A method of detecting
change in ice conditions of the central Greenland Sea by
the whelping patches of harp seals. J Clim 18:1216–1226
Wirsing AJ, Heithaus MR, Frid A, Dill LM (2008) Seascapes of
fear: evaluating sublethal predator effects experienced
and generated by marine mammals. Mar Mamm Sci 24:
1–15
120
Editorial responsibility: Brent Stewart,
San Diego, California, USA
Submitted: August 27, 2008; Accepted: June 9, 2009
Proofs received from author(s): July 13, 2009
➤
➤
➤
➤
➤
➤
➤
➤
➤
➤➤
➤
➤
➤
➤
➤
➤
➤
222

Publication VII
Individual variation in pup vocalizations and absence of behavioural
signs of maternal vocal discrimination in Weddell seals
(Leptonychotes weddellii)
223

INDIVIDUAL VARIATION IN PUP VOCALIZATIONS AND ABSENCE OF
BEHAVIORAL SIGNS OF MATERNAL VOCAL RECOGNITION IN WEDDELL
SEALS (LEPTONYCHOTES WEDDELLII)
Authors: Ilse C. Van Opzeeland1, Sofie M. Van Parijs2, Cornelia M. Kreiss1 & Olaf
Boebel1
1 Alfred Wegener Institute for Polar and Marine Research, Ocean Acoustics Lab, Am
Handelshafen 12, 27570 Bremerhaven, Germany 2 Northeast Fisheries Science Center, NOAA, 166 Water Street, Woods Hole, MA 02543
USA
Submitted to Marine Mammal Science (June 2010)
224

ABSTRACT
Individually stereotyped vocalizations often play an important role in relocation of
offspring in gregarious breeders. In phocids, females often alternate between foraging at
sea and attending their pup. Pup calls have been found to be individually distinctive in
various phocid species. However, experimental evidence for maternal recognition is rare.
In this study we recorded Weddell seal (Leptonychotes weddellii) pup vocalizations of 27
individuals at two whelping patches in Atka Bay, Antarctica. We explored individual
vocal variation based on eight vocal parameters. Fifty-eight percent of all calls were
correctly classified according to individual. For males (n=12) and females (n=9),
respectively, 75% and 78% were correctly identified based on their vocal parameters. To
investigate whether females respond differently to calls of familiar versus unfamiliar
pups, we conducted playback experiments with 21 mothers. Maternal behavior did not
differ between playbacks of own, familiar and unfamiliar pup calls. Our results suggest
Weddell seal pup calls may not need to be individually distinctive because mothers in this
colony rely primarily on spatial and/or olfactorial cues to relocate their pup. However, it
cannot be excluded that differing environmental factors between colonies affects pup
acoustic behavior and the role of acoustic cues in the relocation process.
KEYWORDS: maternal vocal recognition, vocal individuality, pup calls, playback
experiments, Weddell seal, Leptonychotes weddelli
225

INTRODUCTION
In pinnipeds, the majority of species congregate to form breeding aggregations during the
pupping season. Typically, otariids form large terrestrial breeding colonies. Lactation can
last several months and females alternate between nursing their pup and foraging periods
at sea, during which the pup can be alone for 3-15 days (e.g., Trillmich, 1996). In many
otariid species, vocal signalling has been shown to play an important role in successful
mother-pup reunions (Insley et al., 2003). In phocids, breeding systems are more variable
and the lactation period is shorter (Lydersen & Kovacs, 1999). Some species are solitary
breeders, such as hooded (Cystophora cristata) and crabeater (Lobodon carcinophaga)
seals, and attend their pup continuously throughout the lactation period so that there is
little opportunity for the pair to become separated (see Van Opzeeland et al., 2008 for a
review). However, the majority of phocid species breed gregariously and mothers leave
their pup alone on the ice during short periods to forage at sea in order to sustain
lactation. Although aggreagtions on ice are generally less dense than on land, hourly or
daily movements of the ice, causing the pup to drift away from the herd, can complicate
the relocation process. Phocid mothers are thought to use spatial and olfactory, but also
vocal cues in the relocation and identification process of pups (Insley et al., 2003).
Individually distinctive vocalizations, a prerequisite for vocal recognition, have
been found in various phocid species: harbor (Phoca vitulina), harp (Pagophilus
groenlandicus), monk (Monachus schauinslandi), northern elephant (Mirounga
angustirostris), Weddell (Leptonychotes weddellii) and grey seal (Halichoerus grypus)
pups (Renouf, 1984; Job et al., 1995; McCulloch et al., 1999; Van Opzeeland & Van
Parijs, 2004; Collins et al., 2006). However, the presence of individually distinctive vocal
cues does not necessarily imply that there is vocal recognition (e.g. Job et al. 1995).
To date, experimental evidence through playback recordings investigating maternal vocal
recognition in phocid mother-pup pairs is available for only three species: grey, Hawaiian
monk and northern elephant seals (Petrinovich, 1974; Job et al. 1995; McCulloch &
Boness, 2000). Northern elephant seal mothers were found to respond more to the
226

playback of their own pup vocalizations than to the playback of vocalizations of an
unfamiliar pup (Petrinovich, 1974). In Hawaiian monk seals, Job et al. (1995) found no
evidence for vocal recognition of own pup calls by mothers, in spite of the fact that pup
calls exhibited significant individual variation. In grey seals, individual recognition
varied between sites, with mothers able to recognize their own pups calls at one colony
(McCulloch & Boness, 2000), whereas this ability appeared absent at another grey seal
colony (McCulloch et al., 1999).
In this study we investigate if there is individual vocal recognition of the pup by
Weddell seal mothers through playback experiments. Weddell seals form moderate-sized
breeding colonies in fast-ice areas where ice cracks provide access to the water (Tedman
& Bryden, 1979). The lactation period lasts 5-7 weeks (Reijnders et al., 1990). Females
rarely leave their pup during the first two weeks post-partum (Tedman & Bryden, 1979).
After this initial period, they start to leave the ice regularly, presumably to forage to
sustain lactation (Hindell et al., 2002). Pups also enter the water during this period.
Mother-pup pairs perform synchronous shallow dives, which are thought to serve towards
the development of pup diving and swimming skills (Sato et al., 2003). Weddell seal
mothers and pups are known to vocalize while on the ice and the vocalizations of both
female and pup have been shown to be moderately individually distinctive (Collins et al.,
2005; 2006). Based on behavioral observations of Weddell seal mother-pup pairs, it has
been suggested that mother-pup vocal recognition might facilitate mother-pup reunions
(Collins et al., 2005; 2006).
The objectives of this study were to 1) examine whether Weddell seal pup calls
are individually distinctive in the Atka Bay breeding colony 2) determine whether female
behavioral responses differ between playbacks of their own pups calls, familiar pup calls
(calls from a pup from the same colony) and unfamiliar pup calls (calls from a pup from
another distant colony).
227

METHODS
Recording pup calls
This study was carried out during the Weddell seal pupping season from 14 - 21
December 2008. All necessary permits to work on the ice within the Weddell seal
colonies in Atka Bay were obtained (UBA permit nr 94003-3/221). Vocalizations of
suckling individual Weddell seal pups were recorded in two Weddell seal whelping
patches located on the fast-ice within Atka Bay (patch I 70°34’S 08°04’W, patch II
70°36’S 08°03’W, Fig 1). These two whelping patches were chosen based on the
relatively large number of animals that were present at both sites (approximate estimate
of the number of animals in patch I 30 animals, in patch II 20 animals) as well as ice
conditions permitting access on foot to mother-pup pairs. During the period that the
experiments were conducted, we did not observe any movements of individuals between
these two colonies.
Pups were caught and restrained in a canvas catching bag and tagged with Dalton
rototags through the webbing of their left hind flipper. The sex of all pups that were
tagged was determined. The piercing tip of the rototag was blunted prior to tagging to
prevent the sharp tip from damaging the flipper during movement. To apply the tag, the
webbing of the flipper was pierced with a scalpel. The tag (4x1 cm) was inserted into the
left hind flipper of the seal pup with a custom-made rototag applicator. Rototags have
been developed for long-term identification of domestic sheep and goats and are able to
rotate a full 360° out of trouble. Studies have shown that piercing caused by the insertion
of a rototag heals quickly, with no apparent detrimental effect on the behavior or apparent
change in the behavior of others towards tagged individuals (Testa & Rothery, 1992). In
all tagged Weddell seal pups, the wound caused by piercing the flipper caused little
bleeding and had healed cleanly in all pups that were revisited on subsequent days.
During the tagging procedure, mothers watched from a distance either on the ice or from
the water. For all pups tagged during this study, reunion between mother-pup pairs
occurred within minutes after the tagging procedure.
228

For the recordings, priority was given to easily accessible and vocalizing
individuals. Recordings were made both prior to and after tagging. Recordings were
made with a Sennheiser microphone (K6P Powering module with a ME64 microphone
head: frequency response: 40 Hz – 20 kHz ± 2.5 dB) connected to an M-Audio
Microtrack II solid state recorder (frequency response: 20 Hz – 20 kHz ± 0.5 dB). Calls
were recorded in wav format (sampling rate of 44.1 kHz, 16 bit) onto 32 Gb flash
memory cards. A microphone basket windshield and fur cover was used to reduce the
background noise on the recordings caused by wind. The microphone was held 0.1-0.3 m
from the vocalizing pup. Individuals showed varying responses to our presence, but
overall showed little or no reaction when approached closely during recordings.
Recording sessions were terminated if the pup started to nurse, the female became
aggressive towards the recordist or the pair moved away from the recordist. For each pup,
the mean duration of a recording was 6.5 min during which a mean of 19 calls was
recorded for each individual.
A spectrographic analysis of the calls was conducted in Raven Pro 1.3
(Bioacoustics research Program, Cornell Lab of Ornithology). Pups produced only tonal
calls (Fig 2a-c). Based on the vocal parameters that have been found to encode pinniped
vocal individuality in previous studies (e.g.,, Charrier et al., 2002; Van Opzeeland & Van
Parijs, 2004; Collins et al., 2006), ten vocal parameters were measured from the Weddell
seal pup calls: (1) total duration of the call (TOTDUR), (2) start frequency of the call
(SFRQ), (3) end frequency of the call (EFRQ), (4-6) maximum frequency of the first,
second and third harmonic (MAXF1,2,3), (7) frequency of greatest amplitude measured
over the whole call (PFW), (8-10) first, second and third frequency of greatest amplitude
measured over the middle 0.25 s of the call (PF1,2,3). PF2 and 3 were reliably
measurable for only a small number of individuals and were therefore not included in
further analyses. Only calls for which all eight vocal parameters could be measured were
included in the analyses. Pups with fewer than 10 vocalizations were excluded from the
dataset.
229

Playback experiment
Playback experiments took place between 10:00 -16:00, the period during which most
pairs are known to haul out on the ice (Lake et al., 1997). To allow for reliable
identification of the mother-pup pair, mothers were bleach-marked (Glynt Platinum
Blond, 6% H2O2) with individually distinctive signs at least one day before the
experiments were carried out. Only pairs of which both the pup was tagged and the
female was bleach-marked were included in the playback experiments. The exact ages of
the pups included in the playback experiments were not known as pups were already born
when we started our experiments. (In contrast to harp and grey seals (Stewart & Lavigne,
1980), the age of Weddell seal pups cannot be reliably estimated based on moulting
pattern) Based on knowledge of the period in which most births occur in Atka Bay and
the size and behavior of the pups, all pups included in the playback experiments were
estimated between 5 and 12 days old. During this study, only one pup was observed
entering the water.
Playback experiments took place one or two days after the pup calls had been
recorded. We found that removing the pup during the playback experiment caused a
strong disturbance reaction and searching response in mothers. Therefore, we left the pair
as undisturbed as possible during the playback experiment. Pups were lying within one
body length of their mother during all playback trials.
We defined eight behavioral states for Weddell seal mothers (Table 1). Mothers
were subjected to 3 playbacks, each comprising a playback, lasting approximately 30
seconds, and a 2-min observation following the onset of the playback (trial period).
Before the onset of the tests, female behavior was recorded for 2 minutes to obtain a pre-
trial period baseline score (Fig 3). We chose 2-min observation periods since test
experiments showed that responses to the playback occurred shortly after the playback,
also corresponding to the observation period of playback studies on other phocid species
(e.g. McCulloch & Boness 2000). We waited until the mother’s behavior was calm
(motionless and silent) before starting a new trial, which usually lasted 1-2 minutes. The
interval between playbacks was deliberately chosen to be relatively short to minimize
230

possible changes in conditions between the pair (i.e., female starting to nurse her pup)
and in the colony (e.g., movement of neighbouring mother-pup pairs).
The tree different playbacks to which females were subjected were: 1) a playback
of the mother’s own pup vocalizations (own pup call), 2) a playback of calls from a pup
from the same colony (familiar pup call) and 3) a playback of calls from a pup from the
other colony (unfamiliar pup call). Seven mothers received their own pup’s call first, 7
mothers received familiar pup calls first and 8 mothers received the unfamiliar pup calls
first. Playbacks consisted of sequences of 6 calls with natural silences between the calls,
lasting approximately 30 seconds per call sequence. Calls were played at natural sound
pressure levels through a Minivox loudspeaker (frequency range 100 Hz - 15 kHz)
connected to the M-audio II solid-state recorder through a 10-m cable. The loudspeaker
was placed within a 6-m range from the focal mother before beginning the observations
for the pre-trial control period. The positioning of the loudspeaker sometimes caused
some disturbance to the female. In these cases, we waited until behavior of the focal
mother turned quiet again before starting the experiment. The playback experiment was
performed blind, i.e.,, the observer did not know whether the call sequence that was
played back was the female’s own pup or a familiar or unfamiliar pup. Each mother was
tested only once with each of the 3 given playback types.
Statistical analyses
Variation in vocal parameters across individuals was investigated using classification tree
analyses (CART, Venables & Ripley, 1999; De’ath & Fabricius, 2000). Both the
classification tree analyses and the statistical analyses of the playback experiment were
carried out in R (The R Foundation for Statistical Computing, 2009, version 2.9.2.,
www.R-project.org), running under MS Windows and the RPART library (v.3.1-36,
Therneau & Atkinson, 2004) for CARTs.
For the analysis of the playback experiment, we introduced behavioral scores to
test for the difference in female response to own, familiar and unfamiliar pup calls.
231

Behavioral scores were defined as the difference in mean between pre-trial and trial total
number of behavioral changes (i.e.,, transitions from 0 to 1 and 1 to 0 in the behavioral
count data). To prevent pseudoreplication when comparing each trial to the same pre-
trial (since there was only one pre-trial observation period for each playback session), we
pooled all pre-trial observations of all females and randomly drew pre-trial observations
to compare to each trial. We used a Kruskal-Wallis test to test whether the behavioral
scores of females differed between pre-trials and trials. Subsequently, we used an Exact-
Wilcoxon-Signed-Rank test to pair-wise test for behavior-specific differences between
pre-trials and trials.
RESULTS
Vocal behavior of Weddell seal pups
Recordings were made from 27 individuals. After excluding individuals for which less
than 10 calls were recorded, 21 individuals were suitable for use in the classification tree
analysis. Table 2 lists descriptive statistics for female and male pups for all eight vocal
parameters. A total of 336 pup calls were included in the CART analysis. Of these 21
individuals, 12 were male (IDs C,D,E,F,H,I,J,K,Q,R,S,T) and 9 were female (IDs
A,B,G,L,M,N,O,P,U).
The initial 3425-node classification tree with individual as response variable was
pruned with cross-validation. The 1-SE rule (i.e.,, the smallest tree for which the cross-
validated relative error rate is within 1-SE of the minimum; De’ath & Fabricius, 2000)
suggested that the appropriate descriptive tree was one with 19 nodes (Fig 3). The
classification tree analysis correctly classified 58% of all calls (194 of 336 calls)
according to individual. The first major split was based on the MAXF3, while the next
two splits occurred at MAXF1 and other values of MAXF3. Of 12 males, 75% were
correctly classified based on their vocal parameters. For the 9 females, 78% was correctly
classified based on their vocal parameters.
232

Playback experiments
Playback experiments were conducted on 22 Weddell seal mothers. One female was
excluded from further analyses because her pup vocalized repeatedly during trials.
Twenty-one mothers were included in the statistical analyses. Behavioral scores
including all eight female behavioral states were found not to differ when pre-trials and
trials were compared (Fig 4, Kruskal-Wallis H: 17.02, df 15, P=0.32).
To compare behavior-specific differences between pre-trials and trials, we only included
behavioral states for which there were more than 10 observations, these were: “head
raise” (n=153), “check pup” (n=102) and “vocalize” (n=73). We found no significant
differences when female behavioral scores between pre-trials and trials were compared
for each of these three behavioral states (Fig 5a-c).
DISCUSSION
This study showed that Weddell seal pup calls are individually distinctive, which
corresponds to the findings of Collins et al. (2006) that 52% of pup calls were correctly
classified according to individual. Despite the apparent similarity to the percentage of
correctly classified calls in this study (58%), both are based on completely different
classification methods (discriminant function analysis vs classification trees) and are
therefore not directly comparable. Collins et al. (2006) were able to obtain precise
estimates of pup ages and found that the number of calls that was correctly classified
according to individual was higher in older pups (>14 days) compared to younger pups.
They concluded that pups develop more individually distinctive calls after the first two
weeks post-partum when both the female and the pup start to periodically leave the ice to
forage and vocal recognition might become more important for successful mother-pup
reunions. However, our results showed that in some cases, calls of pups younger than 14
days also exhibit substantial individual stereotypy. The percentage of calls correctly
classified varied substantially between individuals; for some individuals, no calls could
be correctly classified, whereas for others, percentages varied between 33 and 100%.
These differences were independent of pup sex. Pup age estimates in this study were less
233

precise compared to the age estimates by Collins et al. (2006) and were based on size and
behavior of pups as well as on experience from previous years with respect to the period
in which most births occur in Atka Bay (J. Ploetz pers comm). Repeated visits to the
colonies observed that by the third week of December most pups on the ice were fully
moulted and alone, and presumably had been weaned. This observation confirmed our
estimate that pups were 1-2 weeks old when this study was conducted. Our results
suggest that the level of individual stereotypy in pup calls differs between individuals and
is not necessarily linked to age or sex of the pup. Differences in pup individual call
stereotypy might reflect an absence of the need for individual pups to be vocally
distinctive as mothers in this colony might rely primarily on other cues (i.e. spatial and/or
olfactorial) to relocate their pup. However, differing environmental factors between
colonies such as local ice conditions or breeding colony density can affect pup acoustic
behavior and the role of acoustic cues for successful mother-pup reunions (McCulloch &
Boness, 2000; Van Opzeeland et al., 2009).
In previous playback experiments with otariids, pups were temporarily removed
from their mothers and placed out of sight from the female to evoke a stronger response
to pup call playbacks (e.g., Charrier et al., 2002). However, since this caused a strong
disturbance reaction in Weddell seal mothers, we did not separate mother-pup pairs
during playback trials. Except for one pair, which was not included in the analyses, pups
did not vocalize and generally were idle during the experiment, lying within one body
length of their mother. One of the most prominent behavioral reactions of females to
playbacks (irrespective of the identity of the pup of which calls were played back) that
we observed was to briefly check their pup. Given that female behavioral scores for this
behavior did not differ between playbacks of own and non-filial pup calls, it is unlikely
that the presence of the pup during the playback experiments affected female response to
the playbacks. These observations are also in accordance with previous playback
experiments on a phocid species which found strong female behavioral reactions to
playback of pup calls while the pup remained with its mother (McCulloch & Boness,
2000).
234

Female Weddell seals did not respond differently to playbacks of their own,
familiar or unfamiliar pup calls. One possible interpretation of our findings is that the
female is unable to discriminate between her own pup calls and calls of non-filial pups.
This could imply that pup calls do not exhibit sufficient individual call stereotypy for the
mother to vocally recognize her own pup. Overall, Weddell seal pup call classification
rates (this study and Collins et al., 2006) are well within the range of classification rates
that signify vocal individuality reported in other studies (e.g., Phillips & Stirling, 2000;
Van Opzeeland & Van Parijs, 2004). However, our CART analyses also showed that for
some individuals no calls could be correctly classified according to individual. The
variability in individual stereotypy of pup calls might reflect that vocal cues might not be
the primary cue on which the pair relies for recognition. Naso-naso contact between
mother-pup pairs was often observed during this study and has previously been suggested
to be the final method of mother-pup recognition (Kaufman et al., 1975). Given the
relative stability of the breeding substrate in Atka Bay, Weddell seal mother-pup pairs
might adapt their behavior to minimize the chances of separation using olfactory cues as
confirmation of identity. Observations suggest that Weddell seal mother-pup pairs
primarily remain in relatively close spatial association (Tedman & Bryden, 1979), even
during the period that both mother and pup start to leave the ice to forage, (Sato et al.,
2003), although females are also known to perform solo dives (Sato et al., 2002). In
addition, Weddell seal colonies are generally not very dense (minimum approximate
inter-pair distance 4 m, pers obs. I. Van Opzeeland; Kaufman et al., 1975) and mothers
have been observed to avoid other seals during the first two to three weeks (Kaufman et
al., 1975). The potential importance of olfactory cues in mother-pup recognition is also
reflected in the observations of Kaufman et al. (1975) that “females often left their pups
to make nose to nose contact with bleating pups and pups often left their mothers to make
nose to nose contact with bawling females”. In our study, females vocalized relatively
often in response to playbacks of pup calls, irrespective of the identity of the pup of
which calls were played back (although there was a non-significant tendency for females
to call more often in response to own pup calls). In Weddell seals, calls may therefore
function for both female and pup to induce individuals in the vicinity of the caller to
235
respond, which may be used as directional cue (Kaufman et al., 1975) while olfactory
cues provide the final confirmation of identity.
Playback experiments with mothers were only conducted during the first two
weeks of the lactation period. It can therefore not be excluded that vocal individuality and
vocal recognition develop gradually during later phases of the lactation period, when the
pair enters the water more frequently and the behavior of the pair becomes less
synchronized. Females might well have recognized the call of their own pup against non-
filial pup calls, but responded to them similarly given that there is no immediate need for
a vocal recognition system during the initial period when the pair is on the ice together
almost continuously. A similar development of vocal recognition during the lactation
period towards the female’s first foraging trip has been observed to occur in subantarctic
fur seals (Arctocephalus tropicalis, Charrier et al., 2001). Further study is needed to
investigate the ontogeny of vocal individuality in Weddell seal pup calls as well as the
role of vocal cues for mother-pup recognition in later phases of the lactation period.
ACKNOWLEDGEMENTS
We thank Stephan Frickenhaus, Joachim Ploetz, Horst Bornemann, Daniel Zitterbart,
Lars Kindermann, Elke Burkhardt, Antje Funcke, the Neumayer overwintering team
2008-2009 and the AWI Logistics department.
REFERENCES
Charrier, I., Mathevon, N. and Jouventin P. 2001. Mother’s voice recognition by seal
pups. Nature 412: 873.
Charrier, I., Mathevon, N. and Jouventin P. 2002. How does a fur seal mother recognize
the voice of her own pup? An experimental study of Arctocephalus tropicalis. Journal of
Experimental Biology 205: 603-612.
236

Collins, K.T., Rogers, T.L., Terhune, J.M., McGreevy, P.D., Wheatley, K.E. and
Harcourt, R.G. 2005. Individual variation in-air female 'pup contact' calls in Weddell
seals, Leptonychotes weddellii. Behaviour 142: 167-189.
Collins, K.T., Terhune, J.M., Rogers, T.L., Wheatley, K.E. and Harcourt, R.G. 2006.
Vocal individuality of in-air Weddell seal (Leptonychotes weddellii) pup 'primary' calls.
Marine Mammal Science 22: 933-951.
De’ath, G. and Fabricius, K.E. 2000. Classification and regression trees: a powerful yet
simple technique for ecological data analysis. Ecology 81: 3178-3192.
Hindell, M.A., Harcourt, R., Waas, J.R. and Thompson, D. 2002. Fine-scale three-
dimensional spatial use by diving lactating female Weddell seals Leptonychotes
weddellii. Marine Ecology Progress Series 242: 275-284.
Insley, S.J., Phillips, A.V. and Charrier, I. 2003. A review of social recognition in
pinnipeds. Aquatic Mammals 29: 181-201.
Job, D.A., Boness, D.J. and Francis, J.M. 1995. Individual variation in nursing
vocalizations of Hawaiian monk seal pups, Monachus schauinsulandi (Phocidae,
Pinnipedia) and lack of maternal recognition. Canadian Journal of Zoology 73: 975-983.
Kaufman, G.W., Siniff, D.B. and Reichle, R. 1975. Colony behavior of Weddell seals,
Leptonychotes weddellii, at Hutton cliffs, Antarctica. Rapports et Proces-verbaux des
Reunions Conseil International l’Exploration de la Mer 169: 228-246.
Lake, S.E., Burton, H.R. and Hindell, M.A. 1997. Influence of time of day and month on
Weddell seal haul-out patterns at the Vestvold Hills, Antarctica. Polar biology 18: 319-
324.
Lydersen, C. and Kovacs, K.M. 1999. Behaviour and energetics of ice-breeding, North
Atlantic phocid seals during the lactation period. Marine Ecology Progress Series 187:
265-281.
McCulloch, S. and Boness, D.J. 2000. Mother-pup vocal recognition in the grey seal
(Halichoerus grypus) of Sable Island, Nova Scotia, Canada. Journal of Zoology London
251: 449-455.
237

McCulloch, S., Pomeroy, P.P. and Slater, P.J.B. 1999. Individually distinctive pup
vocalizations fail to prevent allo-suckling in grey seals. Canadian Journal of Zoology 77:
716-723.
Petrinovich, I. 1974. Individual recognition of pup vocalizations by northern elephant
seal mothers. Zeitschrift fuer Tierpsychologie 34: 308-312.
Phillips, A.V. and Stirling, I. 2000. Vocal individuality in mother and pup South
American fur seals, Arctocephalus australis. Marine Mammal Science 16: 592-616.
Reijnders, P.J.H., Ploetz, J., Zegers, J. & Graefe, M. 1990. Breeding biology of Weddell
seals (Leptonychotes weddellii) at Drescher Inlet, Riiser Larsen Ice Shelf, Antarctica.
Polar Biology 10: 301-306.
Renouf, D. 1984. The vocalization of the harbour seal pup and its role in the maintenance
of contact with the mother. Journal of Zoology London 202: 583-590.
Sato, K., Mitani, Y., Cameron, M.F., Siniff, D.B., Watanabe, Y. and Naito, Y. 2002.
Deep foraging dives in realtion to the energy depletion of Weddell seal (Leptonychotes
weddellii) mothers during lactation. Polar Biology 25: 696-702.
Sato, K., Mitani, Y., Kusagaya, H. and Naito, Y. 2003. Synchronous shallow dives by
Weddell seal mother-pup pairs during lactation. Marine Mammal Science 19: 384-395.
Stewart, R.E.A. and Lavigne, D.M. 1980. Neonatal growth in Northwest Atlantic harp
seals, Pagophiuls groenlandicus. Journal of Mammology 61: 670-680.
Tedman, R.A. and Bryden, M.M. 1979. Cow-pup behaviour of the Weddell seal,
Leptonychotes weddellii (Pinnipedia), in McMurdo Sound, Antarctica. Australian
Wildlife Research 6: 19-37.
Testa, J.W. and Rothery, P. 1992. Effectiveness of various cattle ear tags as markers for
Weddell seals. Marine Mammal Science 8: 344-353.
Therneau, T.M. and Atkinson B. 2004. Rpart: recursive partitioning. R Package Version
3.1-20. S-PLUS 6.x (available at
http//www.mayoresearch.mayo.edu/mayo/research/biostat/splusfunctions.cfm).
Trillmich, F. 1996. Parental investment in pinnipeds. Advances in the Study of Behaviour
25: 533-577.
238

Van Opzeeland, I.C., Kindermann, L. and Boebel, O. 2008. Insights into the acoustic
behaviour of polar pinnipeds – current knowledge and emerging techniques of study.
Pages 133-161 in E.A.Weber and L.H. Krause, eds .Animal Behaviour – New Research.
Nova Science Publishers Inc, Hauppage, NY.
Van Opzeeland, I.C., Corkeron, P.J.C., Risch, D., Stenson, G.B. and Van Parijs, S.M.
2009. Geographic variation in vocalizations of pups and mother-pup behavior of harp
seals Pagophilus groenlandicus. Aquatic Biology 6: 109-120.
Van Opzeeland, I.C. and Van Parijs, S.M. 2004. Individuality in harp seal (Phoca
groenlandica) pup vocalizations. Animal Behaviour 68: 1115-1123.
Venables, W.N. and Ripley, B.D. 1999. Modern Applied Statistics with S-plus. 3rd edn.,
Springer Verlag, New York.
239

TABLES
Table 1. Behavioral criteria used to define behavioral states during playback experiments.
Behavioral state Criteria
No response Female is resting motionless in a prone
position on the ice (eyes open or closed)
Head raise Head and/or upper body of the female
elevated from the ice surface, eyes open
Check pup Female makes visual contact with her pup,
turning head if necessary
Vocalize Female produces vocal sound(s)
Move away from speaker Female changes topographical position on
the ice and moves away from the playback
speaker
Approach speaker Female changes topographical position on
the ice and moves towards the playback
speaker
Move towards pup Female changes topographical position on
the ice and moves towards her own pup
Presentation Female postures so that the nipples are
accessible to the pup
240

Table 2. Descriptive statistics of the eight vocal parameters that were measured for 12
male (M) and 9 female (F) Weddell seal pups in Atka Bay: TOTDUR: total call duration
(ms), SFRQ: start frequency of the call (Hz), EFRQ: end frequency of the call (Hz),
MAXF1-MAXF3: maximum frequency of the first, second and third harmonic (Hz),
PFW: frequency with peak energy measured over the whole call (Hz), PF1: frequency
with peak energy measured over the center 0.25s of the call (Hz)
Vocal parameters Sex N Mean ± Sd
TOTDUR M 172 0.55 ± 0.25
TOTDUR F 164 0.62 ± 0.28
SFRQ M 172 232.84 ± 67.62
SFRQ F 164 244.55 ± 68.59
EFRQ M 172 172.03 ± 68.68
EFRQ F 164 164.93 ± 60.67
MAXF1 M 172 413.36 ± 72.59
MAXF1 F 164 368.92 ± 71.38
MAXF2 M 172 752.43 ± 138.05
MAXF2 F 164 669.23 ± 134.79
MAXF3 M 172 1093.02 ± 201.61
MAXF3 F 164 964.40 ± 203.84
PFW M 172 467.69 ± 181.11
PFW F 164 450.90 ± 268.60
PF1 M 172 480.73 ± 186.78
PF1 F 164 460.90 ± 268.22
241

FIGURE LEGENDS
Figure 1. Map showing the two Weddell seal breeding patch locations within Atka Bay
(AB), near the Eckström Iceshelf, patch I: 70°34’S 08°04’W and patch II: 70°36’S
08°03’W. The location of the German Antarctic station Neumayer Base II is indicated by
a black star. Inset image: Antarctica with the location of Neumayer Base (black star)
Figure 2. The eight vocal parameters measured (a) Spectrogram: call duration
(TOTDUR). Enlarged section of the spectrogram: maximum frequency of the first,
second and third harmonic (MAXF1-MAXF3) and start (SFRQ) and end frequency
(EFRQ) of the call. (b) Power spectrum: the frequency of greatest amplitude measured
over the whole call (PFW). (c) Spectrogram showing the center 0.25 s (shaded grey) and
the corresponding power spectrum: the frequency of greatest amplitude measured over
the center 0.25 s of the call (PF1)
Figure 3. Scheme of the playback procedure. Playback experiments consisted of a 2
minute baseline observation period, followed by three playbacks, each separated by a 1-2
minute pause. Females were subjected to three playbacks (in varying order): 1) a
playback of the mother’s own pup vocalizations (own pup call), 2) a playback of calls
from a pup from the same colony (familiar pup call) and 3) a playback of calls from a pup
from the other colony (unfamiliar pup call).
Figure 4. A 19-node classification tree showing how vocalizations of 21 Weddell seal
pups split with individual as response variable based on 8 vocal parameters: TOTDUR:
total call duration (ms), SFRQ: start frequency of the call (Hz), EFRQ: end frequency of
the call (Hz), MAXF1-MAXF3: maximum frequency of the first, second and third
harmonic (Hz), PFW: frequency of greatest amplitude measured over the whole call (Hz),
PF1: frequency of greatest amplitude measured over the center 0.25s of the call (Hz).
Letters at the bottom indicate individuals. Percentages indicate the percentage of calls
that was correctly classified according to individual for individual pups. Sixteen
individuals were extracted by this analysis, explaining 58% of the total variation (194 of
242

336 calls). The vertical depth of each split explains the proportion of variation explained
by that split. Splits early in the tree (i.e., near the root node) account for more variability
in the data than those lower down in the tree.
Figure 5. Boxplots showing the behavioral scores for all eight female behavioral states.
Behavioral scores were defined as the difference in mean between pre-trial and trial total
number of behavioral changes (i.e.,, transitions from 0 to 1 and 1 to 0 in the behavioral
count data) of Weddell seal mothers (n=22) in response to playback of calls of their own
pup (own), calls from a non-filial pup from the same colony (familiar) and calls from a
non-filial pup from the other colony (unfamiliar). Behavioral scores were found not to
differ when pre-trials and trials were compared (Kruskal-Wallis H: 17.02, df 15, P=0.32).
Figure 6. Boxplots showing the behavioral scores for three female behavioral states:
“head raise” (n=153), “check pup” (n=102) and “vocalize” (n=73). Behavioral scores
were defined as the difference in mean between pre-trial and trial total number of
behavioral changes (i.e.,, transitions from 0 to 1 and 1 to 0 in the behavioral count data)
of Weddell seal mothers (n=22) in response to playback of calls of their own pup (own),
calls from a non-filial pup from the same colony (familiar) and calls from a non-filial pup
from the other colony (unfamiliar). (a) “head raise”, Wilcoxon own vs familiar (V=88.8,
P=0.45), own vs unfamiliar (V=86.5, P=0.33), (b) “check pup”, Wilcoxon own vs
familiar: (V=76.5, P=0.65), own vs unfamiliar (V=86.5, P=0.49), (c) “vocalization”,
Wilcoxon own vs familiar (V=42.0, P=0.43), own vs unfamiliar (V=44.0, P=0.55).
243

FIGURES
Fig 1.
244

Fig 2 a & b
245

Fig 2 c
Pre-trial observation2 min
Playback 1 + 2 min observation Pause1-2 min
Playback 2 + 2 min observation Pause1-2 min
Playback 3 + 2 min observation
Fig 3
246

Fig 4.
247

Fig 5.
248

Fig 6 a-c.
249

Publication VIII
Seasonal patterns in Antarctic blue whale (Balaenoptera musculus
intermedia) vocalizations and the bio-duck signal
250

SEASONAL PATTERNS IN ANTARCTIC BLUE WHALE (BALAENOPTERA
MUSCULUS INTERMEDIA) VOCALIZATIONS AND THE BIO-DUCK SIGNAL
Authors: Ilse Van Opzeeland1, Sofie Van Parijs2, Lars Kindermann1, Olaf Boebel1
1 Alfred Wegener Institute for Polar and Marine Research, Am Handelshafen 26, 27570
Bremerhaven, Germany 2 Northeast Fisheries Science Center, NOAA, 166 Water Street, Woods Hole, MA 02543
USA
Manuscript in preparation
251

ABSTRACT
Here we present preliminary results on seasonal patterns in acoustic presence of Antarctic
blue whales (Balaenoptera musculus intermedia) and the bio-duck signal based on one
year (2009) of near-continuous data from the PerenniAL Acoustic Observatory in the
Antarctic Ocean (PALAOA, Eckström Ice Shelf, 70°31’S, 8°13’W). Three Antarctic blue
whale call types occurred throughout the year: call types A (‘Antarctic blue whale call’),
B and C. These calls were present as singular calls and regular sequences of calls,
suggesting that Antarctic blue whale song varies and does not always consist of call type
A. One call type (S) occurred from January to June, reflecting that this call type might be
produced in specific behavioral contexts. Blue whales in Northern Hemisphere waters
produce a call type similar to S, which possibly functions to maintain contact between
foraging dives. The bio-duck has been recorded at various locations in the Southern
Ocean, but the origin of the signal remains unknown. Knowledge on temporal patterns of
occurrence might provide information on the source. Acoustic presence of the bio-duck
signal was analysed for two years (2006 and 2009). In 2006, the signal was present from
April until October (no data for November), while in 2009 it was present from May until
December. The bio-duck signal has previously been suggested to be produced by minke
whales (Balaenoptera bonaerensis). Their association with ice-covered areas, year-round
presence in Antarctic waters as well as parallels between the bio-duck signal and the
sounds produced by minke whales in Northern Hemisphere waters, are in support of this
suggestion. Further work involves analyses of diel patterns in acoustic presence of blue
whale call types and the bio-duck signal and further investigation of blue whale song in
this data set.
252

INTRODUCTION
Blue whales
In the Southern Ocean, large baleen whale populations have been severely depleted
during 20th century commercial whaling. Blue whale populations were reduced to a
fraction of their original abundance with over 350,000 whales killed (Clapham et al.
1999). Blue whales are now thought to number approximately 1% of their pre-
exploitation abundance, increasing at an annual rate of 7.3% (although the confidence
interval on this rate of increase is wide, 1.4-11.6%, Branch et al. 2007). Passive acoustic
monitoring is an important tool for monitoring populations, particularly in polar habitats
where logistic contraints temporally and spatially restrict data collection. Relative
abundance estimates (abundance estimations based on call density measurements) can be
compared across different recording locations over many years and provide a measure of
population growth, trends in distribution and seasonal presence over time (e.g.,
McDonald & Fox 1999). However, to be able to use acoustic data to evaluate whale
behavior, habitat and population status, an understanding of the acoustic ecology (i.e. the
relationship between the animal and the environment mediated through sound) is required
(e.g. Oleson et al. 2007a; Van Opzeeland 2010). The acoustic ecology determines vocal
behavior through intrisic (the behavioral ecology of a species) and extrinsic factors
(abiotic and biotic factors in the living evironment) and interactions between both,
providing information on the factors that shape vocal behavior and are therefore of
relevance to the animal. Knowledge on acoustic ecology is important in e.g. selecting the
right time scale for acoustic monitoring and in the selection of acoustic signatures to
assess acoustic presence.
So far, previous acoustic studies have focussed on the distribution of calling whales
focussing on the occurrence of the Antarctic blue whale call type (Sirovic et al. 2004;
Stafford et al. 2004; McDonald et al. 2006), without much attention for other call types in
the vocal repertoire of Antarctic blue whales or temporal variation in the usage of
different call types. Knowledge on temporal variability in usage of the various call types
can convey information on the behavioral context in which calls are produced, but also
the reliability of the Antarctic blue whale call type in comparison to other call types as an
indicator of the acoustic presence of the species.
253
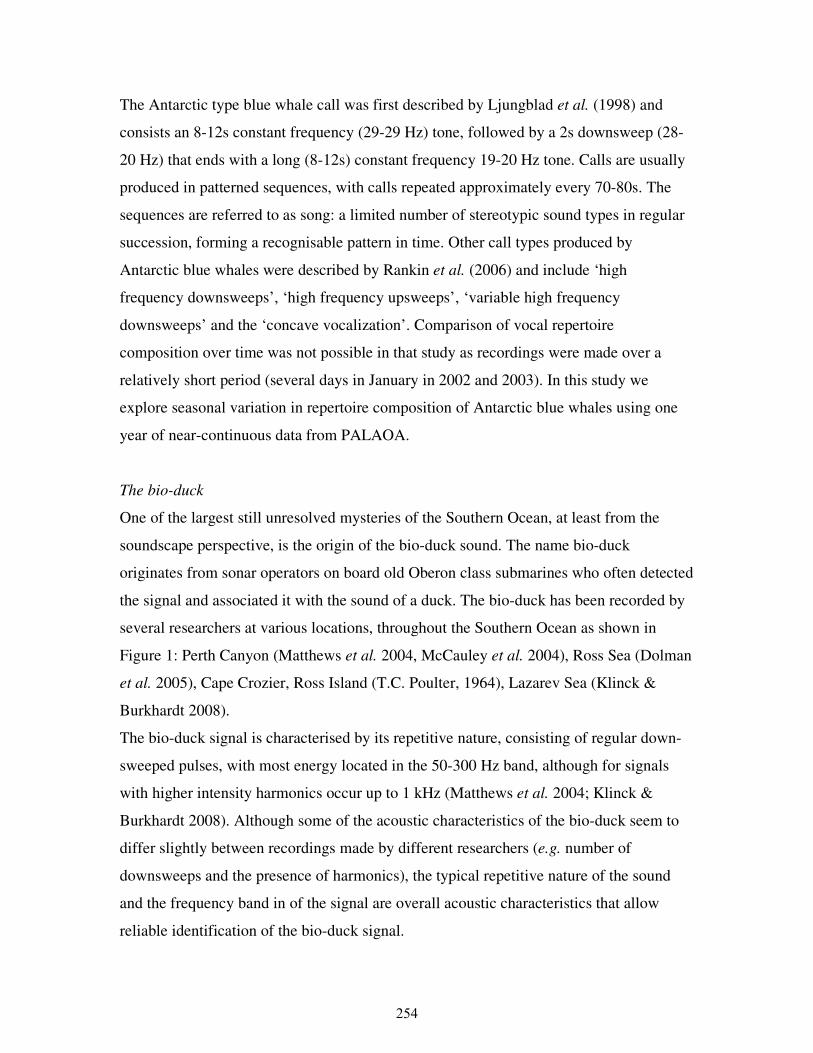
The Antarctic type blue whale call was first described by Ljungblad et al. (1998) and
consists an 8-12s constant frequency (29-29 Hz) tone, followed by a 2s downsweep (28-
20 Hz) that ends with a long (8-12s) constant frequency 19-20 Hz tone. Calls are usually
produced in patterned sequences, with calls repeated approximately every 70-80s. The
sequences are referred to as song: a limited number of stereotypic sound types in regular
succession, forming a recognisable pattern in time. Other call types produced by
Antarctic blue whales were described by Rankin et al. (2006) and include ‘high
frequency downsweeps’, ‘high frequency upsweeps’, ‘variable high frequency
downsweeps’ and the ‘concave vocalization’. Comparison of vocal repertoire
composition over time was not possible in that study as recordings were made over a
relatively short period (several days in January in 2002 and 2003). In this study we
explore seasonal variation in repertoire composition of Antarctic blue whales using one
year of near-continuous data from PALAOA.
The bio-duck
One of the largest still unresolved mysteries of the Southern Ocean, at least from the
soundscape perspective, is the origin of the bio-duck sound. The name bio-duck
originates from sonar operators on board old Oberon class submarines who often detected
the signal and associated it with the sound of a duck. The bio-duck has been recorded by
several researchers at various locations, throughout the Southern Ocean as shown in
Figure 1: Perth Canyon (Matthews et al. 2004, McCauley et al. 2004), Ross Sea (Dolman
et al. 2005), Cape Crozier, Ross Island (T.C. Poulter, 1964), Lazarev Sea (Klinck &
Burkhardt 2008).
The bio-duck signal is characterised by its repetitive nature, consisting of regular down-
sweeped pulses, with most energy located in the 50-300 Hz band, although for signals
with higher intensity harmonics occur up to 1 kHz (Matthews et al. 2004; Klinck &
Burkhardt 2008). Although some of the acoustic characteristics of the bio-duck seem to
differ slightly between recordings made by different researchers (e.g. number of
downsweeps and the presence of harmonics), the typical repetitive nature of the sound
and the frequency band in of the signal are overall acoustic characteristics that allow
reliable identification of the bio-duck signal.
254

The most common belief is that the sound is produced by minke whales (Balaenoptera
bonaerensis, e.g., Dolman et al. 2005) although fish sounds and submarine signals have
also been proposed. However, to date no study has been able to attribute the bio-duck to
any source. By combining localization of the sound and visual observations, previous
studies have identified the source of other mysterious underwater sounds, such as the
‘boing’ in the North Pacific, found to be produced by minke whales, and the ‘starwars
sounds’ near the Great Barrier Reef, attributed to dwarf minke whales (Gedamke et al.
2001; Rankin & Barlow 2005). Insight into the temporal patterns in acoustic presence of
the signal provides information on the source and is also useful in the planning of surveys
dedicated to identify the origin of the bio-duck signal. Previous studies recorded the bio-
duck signal between late July and December (e.g. Klinck & Burkhardt 2008; Dolman et
al. 2005), although only McCauley et al. 2004 recorded the signal over this entire period.
The PALAOA recordings contain the bio-duck signal and allow year-round acoustic
monitoring for the presence of the signal. Here we present data on bio-duck acoustic
presence based on 2 years of near-continuous acoustic data from PALAOA.
METHODS
Acoustic data collection and sampling regime
One year of near-continuous acoustic recordings was obtained from the PerenniAL
Acoustic Observatory in the Antarctic Ocean (PALAOA, 70°31’S, 8°13’W, Eckström Ice
Shelf, Fig 2, see Boebel et al. 2006; Kindermann et al. 2008; Klink 2008 for technical
details). For this study, PALAOA data from 2009 were used, the year with highest annual
coverage so far (operational 91% of the time). For June, 2% of the month was covered
due to energy shortage within the observatory, whereas for the other months coverage
was >90%.
Analysis of low frequency calls in the PALAOA recordings was performed visually by
inspection of five-minute spectrograms created in Spectrum Lab 2.75 and saved as image
files (1269 x 947 pixels). Images of five-minute spectrograms were sampled for analysis
on every third day to provide a standardized sample across the year. For every third day,
255

the first 3 consecutive 5-minute spectrograms of each hour (i.e., three spectrograms
representing fifteen minutes of recordings per hour) were inspected.
The analysis focused on low frequency sounds and therefore only calls occurring between
20 and 100 Hz were counted and type-identified (with the exception of the bio-duck
signal, see below). Antarctic blue whale calls were type-identified based on previous
studies (Ljungblad et al. 1998; Rankin et al., 2006). In addition, a number of low
frequency sounds presumed of biotic origin, could not be type-identified from literature
and were assigned new call type names when present twice or more.
Occurrence of the bio-duck in the spectrograms was noted as present or absent for each
5-minute spectrogram for the 2009 data. In addition, data on bio-duck presence over
2006, collected during a previous study (Van Opzeeland et al., 2010), are also presented
here. In 2006, data were sampled following a different sampling regime: data were
sampled for analysis every fifth day. For every fifth day, the first 10 consecutive minutes
of each hour were analysed. For 2006, data were examined both aurally and visually in 1-
minute sound files using the spectrograms produced by Audobe Audition 2.0.
Data presentation
Antarctic blue whale call counts were summed per call type per day to show seasonal
patterns in daily call rates of each call type. This manuscript presents preliminary results
on seasonal patterns in the occurrence of four blue whale call types and bio-duck
presence. Analyses of diel patterns in blue whale call activity, acoustic signature
description and temporal patterns of other low frequency sounds that were identified in
the PALAOA recordings are currently in progress.
Bio-duck presence per month, for both 2006 and 2009, was expressed as the number of
hours in which the bioduck was present as a fraction of the total number of hours
analysed. Bio-duck presence in a given hour was determined by the presence of bio-duck
signals in at least one of the spectrograms or sound files inspected of that hour. Analyses
of diel patterns in bio-duck acoustic presence are in progress.
256

RESULTS
Over 2009, a total of 7,806 five-minute spectrograms over 12 months were analysed.
Over all months spectrograms of 111 days were visually inspected. The number of five-
minute spectrograms included per month was 45 for June and ranged between 576 and
792 for the remaining months. For 2006, a total of 9,300 minutes of PALAOA recordings
(930 10-minute samples) over 10 months were analyzed. Over all months, 1-minute
samples of 55 days were visually inspected. The number of minutes sampled per month
in 2006 ranged between 310 and 1,440 minutes due to gaps in the otherwise near-
continuous data stream.
Blue whales
Blue whale vocalization types
The four blue whale call types in the PALAOA recordings described here are call types
A, B, C and S. These call types have previously been confirmed as Antarctic blue whale
calls by Ljungblad et al. (1998) and Rankin et al., (2006).
Call type A (Fig 3) corresponds to the Antarctic blue whale call type consisting of a 28
Hz tone followed by an inter-tone interval and a 20 Hz tone (Ljungblad et al. 1998;
Rankin et al., 2006). Given that spectrograms were cut-off at 20 Hz, no further
differentiation of call type A based on variation in call characteristics was possible and
calls consisting of only the 28 Hz component or both the 28 Hz and 19 Hz component
were pooled into call type A. The reason for cutting the spectrograms at 20 Hz is the
impact of the built-in hydrophone high-pass filter (at 10 Hz) to reduce low frequency
system and cable noise in the recordings. Rankin et al., (2006) concluded that the 28 Hz
(27.7 Hz) component is the primary consistent feature of the 3-unit vocalization which is
stable even over great distances, while the other call parts are often difficult to
discriminate when calls are faint. The 28 Hz component, in many cases with a clear
downsweeping tail (Fig 3), therefore allowed reliable identification of call type A. Call
type A occurred in patterned sequences as well as in singular calls. Temporal variation in
the occurrence of patterned and singular A calls will be explored during further analysis
of the data.
257

Call type B and C (Fig 4 & 5) correspond to the ‘high frequency upsweep’ and the
‘variable high frequency downsweep’, repectively, described by Rankin et al. (2006).
Call type B is a short-duration (~2 s) upsweep from 20 Hz to 40-60 Hz. Call type C is a
steeply downsweeped call starting at 60-80 Hz and sweeping down to 20 Hz (duration ~
1-2 s).
Call type S (Fig 6) corresponds to the ‘high frequency downsweep’ described in Rankin
et al. (2006), starting at 80 Hz, sweeping down to 30-40 Hz (duration ~3s). Variants of
call type S occurred, including the ‘complex variation of the high-frequency downsweep’
and ‘amplitude modulated downsweep’ (Rankin et al. 2006). Furthermore, the ‘short high
frequency downsweep’ distinguished by Rankin et al. (2006) as a separate call type, was
also pooled into call type S. The similarity of the ‘short high frequency downsweep’ to
faint variants of call type S made reliable classification into a separate call type not
possible.
Seasonal patterns
Blue whale call types A, B and C were detected over 12 months of the year1, whereas call
type S was only present from December to May.
The number of type A calls showed strong variation between months, in contrast to call
types B and C (Fig 7). Most type A calls occurred in February (5719 calls), while the
number of A calls varied between 119 and 3283 for the remaining months, except for
June when only few data were available (5 calls). Most type B calls were detected in
December (1105 calls), whereas the number of calls ranged between 370 and 760 for the
remaining months, except for June, when 5 type B calls were detected. The number of
type C calls ranged between 29 and 62 per month, for all months except June (1 type C
call counted).
Call type S was present during 6 months of the year (December through May) with the
number of calls counted per month ranging between 3 calls counted in May and 3086
calls counted in February.
1 For June, only one day of data was available for 2009. However, preliminary inspection of spectrograms from other years suggests that call type A, B and C are present throughout June.
258

Daily call rates (the total number of calls counted per day per call type) showed relatively
large differences within months, in many cases reflecting a two- or three-peak pattern.
Although this pattern was reflected strongest in the daily call rates of call type A, call
type B and S also exhibited distinct differences in call rates within months.
The bio-duck
Acoustic signature
Analysis and description of the bioduck acoustic signature in the PALAOA recordings is
currently in progress. Figure 8 is a five minute spectrogram with zoom of the bio-duck
signal showing the regularity of the signal.
Seasonal patterns
The pattern of bio-duck acoustic presence differed between 2006 and 2009; in 2006 the
bio-duck signal was present from April to October, whereas in 2009 it was present from
May to December (Fig 9). The number of hours in which the bio-duck signal was
detected also showed strong differences between years. In 2006, the bio-duck was present
during most hours from April to June and in October. In 2009, the bio-duck was present
during most hours from July to October. Furthermore, in August and September 2009 the
bio-duck was present during all hours.
DISCUSSION
Blue whales
Temporal variation in the blue whale call repertoire
The seasonal separation between call types A, B, C versus call type S was apparent,
suggesting that calls might be produced in different behavioral contexts. The presence of
call type A throughout the year coincides with findings of previous studies on acoustic
presence of Antarctic blue whales (Sirovic et al. 2004) as well as Northern Hemisphere
blue whales (e.g. Stafford et al. 2001). Call type A occurs as singular calls, but is often
also produced in regular sequences, referred to as song (Sirovic et al. 2004; McDonald et
259

al. 2006). Although the preliminary results presented here do not yet include a distinction
in seasonal patterns of occurrence of singular type A calls and song, the PALAOA
recordings of 2009 contain both song and singular type A calls in all months (except June
when only one day of data was available).
The function of blue whale song is still poorly understood. Male blue whales are known
to produce song (McDonald et al. 2001), but it remains unknown if females also sing.
The fact that blue whale song is also produced on the feeding grounds has been suggested
whales use calls reflecting off bathymetric structures as navigational cues (Clark &
Ellison 2004). Alternatively, song on the feeding grounds might be a continued
reproductive display, functioning as a low-cost opportunistic male advertisement to court
females, as has been suggested for humpback whales (Megaptera novaeangliae, Clark &
Clapham 2004). In humpback whales, vocal displays are thought to result in immediate
matings, given that the occurrence of aseasonal births in humpback whales suggests that
females conceive on the feeding grounds. Nevertheless, in blue whales, aseasonal births
have not been reported and mating is therefore unlikely to occur on the feeding grounds.
Oleson et al. (2007a) proposed that blue whale song on the feeding grounds might instead
be produced in a slow- type of reproductive context, serving a function in long-term
assessment and association prior to mating.
Interestingly, call type B and C were also produced year-round. In some months, call type
B and C also occurred in regularly patterned sequences, suggesting that these call types
also form part of song or a separate song type. More detailed analysis of the structure and
temporal variation in occurrence of call type B and C sequences is currently in progress.
The strong seasonal pattern in acoustic presence of call type S suggests that this call type
serves a function in seasonally-specific behavioral contexts. The presence of call type S
coincides with the period of least ice cover in the vicinity of the observatory and
potentially high prey availability in the marginal ice-edge zone close to the continent.
Call type S might therefore be produced in a feeding context. The observatory is close to
the shelf break (Fig 2), which is known to form important feeding habitat for both
260

Northern and Southern Hemisphere blue whales (e.g. Fiedler et al. 1998; Sirovic et al.
2004).
Northern Hemisphere blue whales are known to produce a call type that strongly
resembles call type S (call type D, e.g. McDonald et al. 2001; Oleson et al. 2007b).
Similar to our results, Oleson et al. (2007a) found a significant temporal segregation
between the presence of call type D and other call types. Call type D was produced from
April to November, whereas song and singular call types were produced from June to
January. They suggested that call type D might serve a function in the localization of
conspecifics and/or in maintaining group cohesion, given that frequency sweeps, in
contrast to constant tones, can provide clues for binaural localization of a sound source.
Type D calls were found to be produced by blue whales during shallow excursions
between deep foraging dives, but were not directly associated to foraging events or
cooperative feeding (Oleson et al. 2007a,b). Type D, and possibly also type S calls, might
therefore serve to attract conspecifics to the area or to maintain contact with other
individuals during foraging. The absence of call type S in austral winter in our study
might reflect that the animals are in more distant areas and that type S calls can not be
detected over larger distances. However, the signal-to-noise ratios of call type B and C in
austral winter do not seem to reflect the whales to be further from the observatory.
Alternatively, the absence of type S calls in austral winter could reflect that animals do
not feed or feed only little in austral winter or that the amount of prey is not sufficient for
wintering animals to attract conspecifics to share resources (Johnson et al. 2002). Baleen
whales wintering on the feeding grounds are thought to skip migration to save energetic
requirements of migration. However, if these animals continue feeding and how much
prey is available to them during winter is unknown. Alternatively, seasonal differences in
group composition might affect acoustic behavior and call type usage. In humpback
whales, it is thought to be predominantly females that skip migration and remain on the
feeding grounds during winter (Brown et al. 1995). If type S calls are produced by males
during austral summer by means to attract females to areas with high prey densities, for
example in the context of long-term association prior to mating, an absence of males in
austral winter might explain the absence of type S calls. Nevertheless, this interpretation
261

might be complicated by the observation that in blue whales in Northern Hemisphere
waters both sexes produce call type D (Oleson et al. 2007b).
Blue whales in ice-covered waters?
The year-round presence of blue whale calls in the PALAOA recordings implies that
whales enter ice-covered waters. Blue whales are known to associate with sea-ice
(Kasamatsu et al. 1988; Mackintosh 1965). Sirovic et al. (2004) found a negative
correlation between the blue whale calls and sea ice concentration and suggested that
whales may have left the area when the sea-ice began to form. Our results might reflect
that blue whales in the area off PALAOA might remain in the coastal polynya or other
small areas of open water forming in response to e.g. winds or iceberg movements.
Humpback whale calls were also detected in austral winter in the area off PALAOA and
small patches of open water were found to be present within a 200 km area off the
observatory in that year (Van Opzeeland et al. submitted). Automated detection of blue
whale calls in the PALAOA data over multiple years will enable analysis of how blue
whale acoustic presence relates to local ice cover.
Variation in the number of blue whale calls counted within months
The typical two or three peak pattern in each month that we observed in the number of
calls counted, possibly relates to hydrophone depth (Fig 10). One of the hydrophones of
PALAOA is equipped with a CTD sensor which measures pressure and hence is an
indicator of hydrophone depth. The local minima in the number of calls counted per day
frequently seem to match local minima in CTD pressure, which follow the well known
fortnightly modulation of tidal strength. Tidal motion of the water underneath the ice
shelf on which PALAOA is located results in variation of CTD and hydrophone depths
due to the resulting drag force on the hydrophone cable, which extends approximately
80m below the ice shelf base. Possibly, the acoustic range and thereby the number of
detectable calls varies with recording depth, e.g. due to acoustic interference processes
under the ice shelf. Alternatively, increased tidal flow results in strumming noise,
particularly at low frequencies, which might mask weaker calls from greater distances.
This correlation between hydrophone depth and noise levels in connection with a
262

decrease in number of calls detected needs further evaluation to be able to distinguish
between any possibly natural variability and fluctuations introduced by the recording
methods.
The bio-duck
Temporal variation in acoustic presence of the bio-duck: hints with respect to origin
The absence of the bio-duck signal from January until April in both years reflects that the
source is present throughout austral winter and disappears again in austral summer. All
previous bio-duck recordings have been made within this same period, although to our
knowledge no study has recorded the signal before July. McCauley et al. (2006) suggested
that the seasonal pattern of bio-duck presence in Perth Canyon (July until December) was
consistent with an animal migrating back and forth between waters off Australia and the
Antarctic, being present in the Canyon in austral winter and migrating to Antarctic waters in
austral summer. Our results nevertheless, indicate the opposite: a source that is present in
Antarctic waters only during austral winter and spring. Although some baleen whale species
are present in Antarctic waters year-round (e.g. Stafford et al. 2001; Sirovic et al. 2004; this
study), the seasonal patterns in acoustic presence and acoustic signatures of these species are
hardly reconcilable with those of the bio-duck signal, leaving it unlikely that the sound is
produced by blue, fin or humpback whales. Based on previous analyses of pinniped acoustic
signatures and temporal patterns in call usage in the PALAOA recordings (Van Opzeeland et
al. 2010), it is also highly unlikely that the bio-duck sound can be attributed to Weddell
(Leptonychotes weddellii), leopard (Hydrurga leptonyx), Ross (Ommatophoca rossii) or
crabeater seals (Lobodon carcinophaga). Nothing is known on the sounds produced by fish in
Antarctic waters and we can therefore not exclude the possibility that the bio-duck signal is
produced by fish.
Could the bio-duck be minke whale vocalizations?
To date, very little is known on the sounds produced by Antarctic minke whales, and their
circumantarctic physical abundance is in stark contrast to their virtual acoustic absence.
Available knowledge is based on a few short duration recordings of a limited number of
animals of unknown age and sex. Schevill and Watkins (1972) recorded intense downsweeps
from 130-115 Hz to 60 Hz. Leatherwood et al. (1981) also recorded this sound from
263

Antarctic minke whales along with a regular click sequences and four additional tonal
sounds. In the North Atlantic, minke whales have been found to produce regular clicks
(Beamish & Mitchell 1973), frequency modulated downsweeps (Eds-Walton 1999), gruntlike
pulses and pulse trains (Winn & Perkins 1976; Mellinger et al. 2000). These sounds have in
common with the bio-duck signals that they 1) are highly stereotyped sequence of frequency
modulated short duration pulses, 2) occur throughout winter until spring, 3) occur in bouts
lasting many hours.
Distribution patterns of Antarctic minke whales do not exclude the occurrence of the bio-
duck signal in the same period off the Antarctic coast and in Antarctic waters; sighting data
suggest a southbound movement starting in October from 10° - 20° S with most minke
whales present in Antarctic waters in January, while some remain in temperate waters or on
the feeding grounds throughout the year (Best 2007). The absence of the bio-duck signal in
the PALAOA recordings in January could reflect minke whales remain in offshore waters
until April or May, depending on feeding conditions and migrate south when the ice starts to
form. It would be interesting to evaluate if the bio-duck signal is present in recordings made
in off-shore areas between January and April.
Alternatively, the bio-duck signal might be produced only in season-specific behavioral
contexts. In this case, the presence of the bio-duck signal in the period when ice cover is most
severe suggests a link. Minke whales are known to associate with ice-covered areas and have
been observed in fast-ice and dense pack-ice areas (e.g. Ribic et al. 1991; Thiele et al. 2004).
The availability of open water where animals can breathe is nevertheless a prerequisite for
marine mammals and observations suggest that the availability of breathing holes rather than
the presence of ice restricts cetacean presence in ice-covered waters (Ribic et al. 1991; Gill &
Thiele 1997). Antarctic minke whales have been observed creating breathing holes in ice-
covered areas (Scheidat et al. 2008) which might reflect a behavioral adaptation to survive in
heavy ice-covered areas. The production of regular patterned signals and their reflection off
underwater structures such as the surface ice layer could provide navigational information to
the animal, for example on the thickness of ice cover or the presence of leads or open water.
Nevertheless, this hypothesis does not provide an explanation for the bio-duck signal
recorded in Perth Canyon.
Further analyses of the diel patterns in presence of the bio-duck signal might provide more
clues on the origin of the sound. In addition, an automated detection algorithm has been
264

developed for the bio-duck signal which will also be used to explore acoustic presence across
multiple years and relate bio-duck activity to seasonal and annual variation in ice cover.
Note
This manuscript is in an early phase of preparation and presents preliminary results and
interpretations. Analyses are still in progress and include 1) description of acoustic
signatures and temporal patterns of the other low frequency sounds that were identified
in the PALAOA recordings, 2) diel patterns in vocal activity of blue whales, the bio-duck
signal and other low frequency sounds and 3) seasonal patterns in the presence of blue
whale song and the occurrence of other song types. The blue whale and the bio-duck will
in a later stage likely form separate manuscripts.
ACKNOWLEDGEMENTS
The logistics department of the Alfred Wegener Institute for Polar and Marine Research,
Bremerhaven, Germany, Reederei F. Laeisz GmbH, Rostock, Germany, FIELAX
Services for Marine Science and Technology mbH, Bremerhaven, Germany, all played a
crucial role in setting up and/or maintaining PALAOA. The PALAOA project was partly
funded by the Bremerhavener Gesellschaft für Innovationsförderung und
Stadtentwicklung (BIS).
REFERENCES
Beamish P, Mitchell E (1973) Short pulse length audio frequency sounds recorded in the
presence of a minke whale (Balaenoptera acutorostrata). Deep-Sea Research 20: 375-
386
Best PB (2007) Whales and dolphins of the Southern African Subregion. Cape Town:
Cambridge University Press.
Boebel O, Kindermann L, Klinck H, Bornemann H, Plötz J, Steinhage D, Riedel S,
Burkhardt E (2006) Real-time underwater sounds from the Southern Ocean. Eos
Transactions, American Geophysical Union 87: 361-362
265

Branch TA, Stafford KM, Palacios DM, Allison C, Bannister JL et al. (2007) Past and
present distribution, densities and movements of blue whales Balaenoptera musculus in
the Southern Hemisphere and northern Indian Ocean. Mammal Review 37: 116-175
Brown MR, Corkeron PJ, Thale PT, Schultz KW, Bryden MM (1995) Evidence for a sex-
segregated migration in the humpback whale (Megaptera novaeangliae). Proceedings of
the Royal Society of London B 259: 229-234
Clapham PJ, Young SB, Brownell RL Jr (1999) Baleen whales: conservation issues and
the status of the most endangered populations. Mammal Review 29: 35-60
Clark CW, Clapham PJ (2004) Acoustic monitoring on a humpback whale (Megaptera
novaeangliae) feeding ground shpws continual singing into late spring. Proceedings of
the Royal Society of London B: 271: 1051-1057
Clark CW, Ellison WT (2004) Potential use of low-frequency sounds by baleen whales
for probing the environment: evidence from models and emperical measurements. In:
Echolocation in bats and dolphins. JA Thomas CF Moss, M Vater (Eds.), pp 564-582.
Chigaco: University of Chicago Press
Dolman SJ, Swift R, Asmus K, Thiele D (2005) Preliminary analysis of passive acoustic
recordings made in the Ross Sea during ANSLOPE III in 2004. SC/57/E10. Presented to
the IWC Scientific Committee.
Eds-Walton P (1999) minke whale vocalizations and concurrent behavior in the St
Lawrence estuary, Canada. Abstracts, p 52, 13th Biennial conference on the biology of
marine mammals, Maui, Hawaii.
Fiedler PC, Reilly SB, Hewitt RP, Demer D, Philbrick VA, Smith S, Armstrong W, Croll
DA, Tershy BR, Mate BR (1998) Blue whale habitat and prey in the California Channel
Islands. Deep-Sea Research II 45: 1781-1801
Gedamke J, Costa DP, Dunstan A (2001) Localization and visual verification of a
complex minke whale vocalization. The Journal of the Acoustical Society of America
109: 3038-3047
Gill PC, Thiele D (1997) A winter sighting of killer whales (Orcinus orca) in Antarctic
sea-ice. Polar biology 17: 401-404
266

Johnson DDP, Kays R, Blackwell PG, Macdonald DW (2002) does the resource
dispersion hypothesis explain group living? Trends in Ecology and Evolution 17: 563-
570
Kasamatsu F, Hembree D, Joyce G, Tsunoda L, Rowlett R, Nakano T (1988) Distribution
of cetacean sightings in the Antarctic: results obtained from the IWC/IDCR minke whale
assessment cruises, 1978/79 to 1983/84. Report of the International Whaling Commission
39, 449-473
Kindermann L, Boebel O, Bornemann H, Burkhardt E, Klinck H, Van Opzeeland IC,
Plötz J, Seibert AM (2008) A Perennial Acoustic Observatory in the Antarctic Ocean,
Computational bioacoustics for assessing biodiversity. Bundesamt für Naturschutz
Skripten 234: 15-28
Klinck H (2008) Automated passive acoustic detection, localization and identification of
leopard seals. PhD dissertation, University of Trier, Germany. Reports on Polar and
Marine Research, 582, 155 pp
Klinck H, Burkhardt E (2008) Marine mammal automated perimeter surveillance –
MAPS. Reports on Polar and Marine Research 580: 114-121
Leatherwood S, Thomas JA, Awbrey FT (1981) Minke whales off north-western Ross
Island. Antarctic Journal 16: 154-156
Ljungblad DK, Clark CW, Shimada H (1998) A comparison of sounds attributed to
pygmy blue whales (Balaenoptera musculus brevicauda) recorded south of the
Madagascar Plateau and those attributed to ‘true’ blue whales (Balaenoptera musculus)
recorded off Antarctica. Report of the International Whaling Commission 49: 439-442
Mackintosh NA (1966) The distribution of southern blue and fin whales. In: Norris KS
(Ed.), Whales, Dolphins and Porpoirses. University of California Press, Berkeley, pp
125-144
Matthews D, Macleod R, McCauley RD (2004) Bio-duck activity in the Perth Canyon.
An Automated Detection Algorithm. Proceedings of Acoustics, 3-5 November 2004,
Gold Coast, Australia
McCauley R, Bannister J, Burton C, Jenner C, Rennie S, Kent CS (2004) Western
Australian exercise area blue whale project: final summary report – milestone 6. CMST
Report R2004-29, Project 350.
267

McDonald MA, Calambokidis J, Teranishi AM, Hildebrand JA (2001) The acoustic calls
of blue whales off California with gender data. The Journal of the Acoustical Society of
America 109: 1728-1735
McDonald MA, Fox CG (1999) Passive acoustic methods applied to fin whale population
density estimation. The Journal of the Acoustical Society of America 105: 2643-2651
McDonald MA, Mesnick SL, Hildebrand JA (2006) Biogeographic characterizaation of
blue whale song worldwide: using song to identify populations. Journal of Cetacean
Research and Management 8: 55-65
Mellinger DK, Carson CD, Clark CW (2000) Characteristics of minke whale
(Balaenoptera acutorostrata) pulse trains recorded near Puerto Rico. Marine Mammal
Science 16: 739-756
Oleson EM, Calambokidis J, Burgess WC, McDonald MA, LeDuc CA, Hildebrand JA
(2007b) Behavioral context of call production by eastern North Pacific blue whales.
Marine Ecology Progress Series 330: 269-284
Oleson EM, Wiggins SM, Hildebrand JA (2007a) Temporal separation of blue whale call
types on a southern Californa feeding ground. Animal Behaviour 74: 881-894
Poulter T (1964) Recording December 26, 1964, Southern Ocean, Cape Crozier, penguin
rookery. Macaulay Library catalogue number 120342.
Rankin S and Barlow J (2005) Source of the North Pacific “boing” sound attributed to
minke whales. The Journal of the Acoustical Society of America 118: 3346-3351
Rankin S, Ljungblad D, Clark C, Kato H (2006) Vocalisations of Antarctic blue whales,
Balaenoptera musculus intermedia, recorded during the 2001/2002 and 2002/2003
IWC/SOWER circumpolar cruises, Area V, Antarctica. Journal of Cetacean Research and
Management 7: 13-20
Ribic CA, Ainley DG, Fraser WR (1991) Habitat selection by marine mammals in the
marginal ice zone. Antarctic Science 3: 181-186
Scheidat M, Bornemann H, Burkhardt E, Flores H, Friedlander A, Kock KH, Lehnert L,
Van Franeker J, Williams R (2008) Antarctic sea-ise habitat and minke whales. Annual
Science Conference in Halifax, Canada, 22-26 September 2008
Schevill WE, Watkins WA (1972) Intense low-frequency sounds from an Antarctic
minke whale, Balaenoptera acutorostrata. Breviora 388: 1-7
268

Sirovic A, Hildebrand JA, Wiggins SM, McDonald MA, Moore SE, Thiele D (2004)
Seasonality of blue and fin whale calls and the influence of sea ice in the Western
Antarctic Peninsula. Deep-Sea Research II 51: 2327-2344
Stafford KM, Bohnenstiehl DR, Tolstoy M, Chapp E, Mellinger DK, Moore SE (2004)
Antarctic-type blue whale calls recorded at low latitudes in the Indian and eastern Pacific
Oceans. Deep-Sea Research I 51: 1337-1346
Stafford KM, Nieukirk SL, Fox CG (2001) Geographic and seasonal variation of blue
whale calls in the North Pacific. Journal of Cetacean Research and Management 3: 65-76
Thiele D, Chester ET, Moore SE, Sirovic A, Hildebrand JA, Friedlaender AS (2004)
Seasonal variability in whale encounters in the Western Antarctic Peninsula. Deep-Sea
Research II 51: 2311-2325
Van Opzeeland I (2010) Acoustic ecology of marine mammals in polar oceans. Phd
thesis. University of Bremen.
Van Opzeeland I, Van Parijs S, Bornemann H, Frickenhaus S, Kindermann L, Klinck H,
Ploetz J, Boebel O (2010) Acoustic ecology of Antarctic pinnipeds. Marine Ecology
Progress Series in press.
Van Opzeeland, I, Van Parijs S, Kindermann L, Burkhardt E, Boebel O. Calling in the
cold: pervasive acoustic presence of humpback whales (Megaptera novaeangliae) in
Antarctic coastal waters. Submitted to Proceedings of the Royal Society B, June 2010.
Winn HE, Perkins PJ (1976) Distribution and sounds of the minke whale, with a review
of mysticete sounds. Cetology 19: 1-12
269

FIGURE LEGENDS
Figure 1. Recording locations of the bio-duck signal: Perth Canyon (blue star), Ross
Island, Cape Crozier (orange star), Lazarev Sea (grey star), Ekström Ice Shelf, PALAOA
(green star). During the ANSLOPE survey sonobuoys were deployed on several
occassions in the Ross Sea and further north toward New Zealand (blue dashed area), the
bio-duck signal was present on most of the sonobuoy recordings.
Figure 2. Bathymetry map showing the location of PALAOA (white star) and location of
the German Neumayer Base II (black star). Inset image: map of Antarctica showing the
location of Neumayer Base (black star).
Figure 3. Five-minute spectrogram with several examples of Antarctic blue whale call
type A. Inset image: zoom of call type A.
Figure 4. Five-minute spectrogram with several examples of Antarctic blue whale call
type B. Inset image: zoom of call type B.
Figure 5. Five-minute spectrogram with Antarctic blue whale call type C. Inset image:
zoom of call type C.
Figure 6. Five-minute spectrogram with several examples of Antarctic blue whale call
type S. Inset image: zoom of call type S.
Figure 7. Seasonal presence of four Antarctic blue whale call types over 2009. Markers
on graph lines indicate daily call rates (the total number of calls counted per call type per
day) for: call type A (black line), call type B (green line), call type C (blue line), call type
S (red line). For June only one day of data was available (1 June) due to power outages of
the observatory (grey dashed area). Upper panel: bars indicate acoustic presence on a
monthly basis for call types A,B and C (blue bar) and call type S (red bar).
270

Figure 8. Spectrogram of the bio-duck signal recorded by PALAOA: a) five-minute
spectrogram, b) one-minute fragment showing the regularity of the signal.
Figure 9. Seasonal presence of the bio-duck signal. Vertical bars indicate the number of
hours, as percentage of the total number of hours recorded, during which the bio-duck
signal was present for each month for 2006 (black bars) and 2009 (grey bars). No data
was available for July and November 2006 (grey dashed areas). For June 2009 (*), hours
with bio-duck presence is bsed on one day of data. Upper panel: bars indicate acoustic
presence of the bio-duck signal on a monthly basis for both years.
Figure 10. Seasonal variation in the number of type A calls counted per day (black line)
and average CTD depth per day (blue line). Note that the number of type A calls in this
graph should be multiplied by three for actual number of calls counted. CTD depth
ranged between 134 and 157 m. Pink bars are drawn in by hand and indicate the pressure
minima timing in hydrophone depth (i.e., when there is high flow) and show the possible
correlation to days with low call counts. For the period from mid-August until the end of
October no pink bars were drawn, as no clear peaks in CTD depth were visible.
271
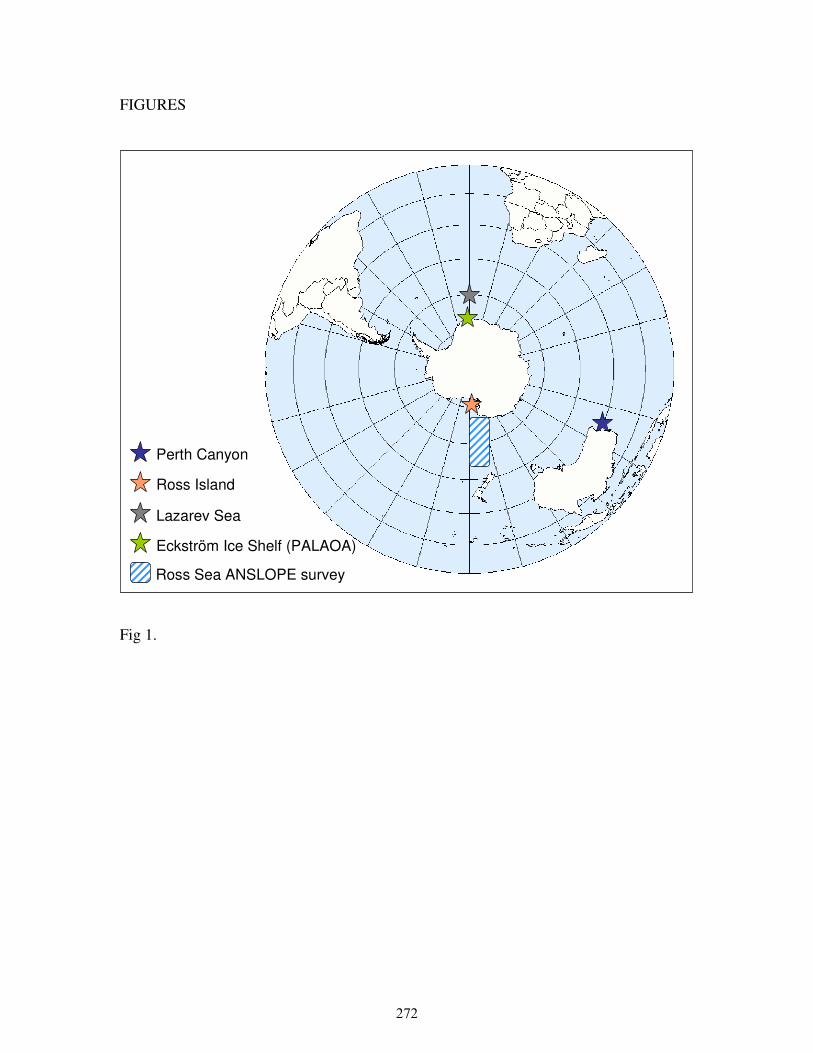
FIGURES
Perth Canyon
Ross Island
Lazarev Sea
Eckström Ice Shelf (PALAOA)
Ross Sea ANSLOPE survey
Fig 1.
272

Dronning
Maud Land
Neumayer
South Pole
Dronning
Maud Land
Neumayer
South Pole
1000 m
2000 m2500 m
4500 m
Fig 2.
Fig 3.
273

Fig 4.
Fig 5.
Fig 6.
274

No
data
Ca
ll ty
pe
AB
C
Ca
ll ty
pe
S
Ac
ou
sti
c
pre
sen
ce
Number of calls per day
Blu
e w
hale
ca
ll a
cti
vit
y 2
00
9
Fig
7.
275
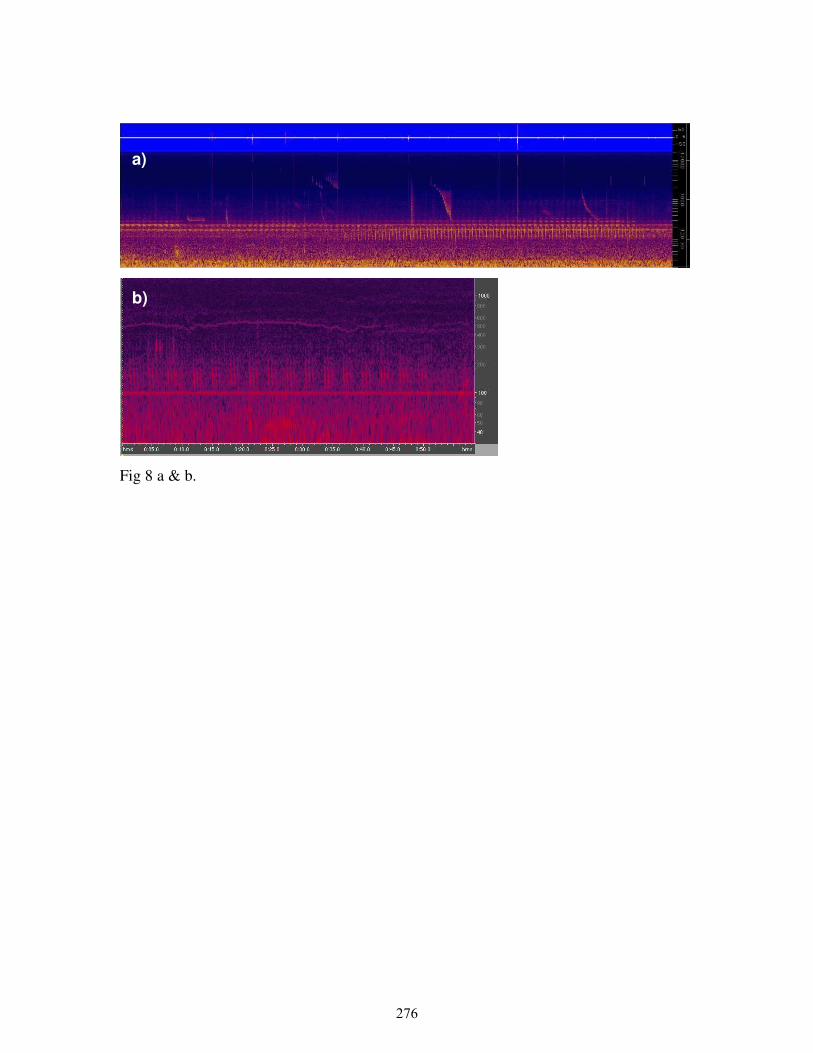
a)
b)
Fig 8 a & b.
276

Bioduck presence – 2006 and 2009
Acoustic presence
2006
2009
No data
*
Fig 9.
277

Number of type A calls counted per day (x 3)
CTD depth (m)
CT
D d
ep
th
Nu
mb
er
of
call
s c
ou
nte
d
per
da
y (
typ
e A
on
ly)
CT
D d
ep
th
Nu
mb
er
of
call
s c
ou
nte
d
per
da
y (
typ
e A
on
ly)
Fig
10.
278

Publication IX
Calling in the cold: pervasive acoustic presence of humpback whales
(Megaptera novaeangliae) in Antarctic coastal waters
279

CALLING IN THE COLD: PERVASIVE ACOUSTIC PRESENCE OF HUMPBACK
WHALES (MEGAPTERA NOVAEANGLIAE) IN ANTARCTIC COASTAL WATERS
Authors: Ilse Van Opzeeland1, Sofie Van Parijs2, Lars Kindermann1, Elke Burkhardt1,
Olaf Boebel1
1 Alfred Wegener Institute for Polar and Marine Research, Am Handelshafen 26, 27570
Bremerhaven, Germany 2 Northeast Fisheries Science Center, NOAA, 166 Water Street, Woods Hole, MA 02543
USA
Submitted to Biology Letters
July 2010
280

ABSTRACT
Humpback whales migrate between relatively unproductive breeding grounds and
productive feeding areas. However, not all individuals of a population undertake the
annual migration to the breeding grounds; instead some remain on the feeding grounds
year-round, presumably to avoid the energetic demands of migration. In the Southern
Hemisphere, ice and inclement weather conditions restrict investigations of humpback
whale presence on feeding grounds as well as the extent of their southern range. In this
study one year of near-continuous recordings from the PerenniAL Acoustic Observatory
in the Antarctic Ocean (PALAOA, Ekström Iceshelf, 70°31’S, 8°13’W) explores acoustic
presence of humpback whales in an Antarctic coastal area. Humpback whale calls were
present during nine months of 2008: January through April, June through August,
November and December. Typically, calls occurred in bouts, ranging from 2 to 17
consecutive days with February, March and April having most daily presence of calls.
Whales were within a 200 km radius off PALAOA. Calls were also present during austral
winter when ice cover within this radius was >90%. These results demonstrate that
Antarctic coastal areas are of greater importance to humpback whales than previously
assumed, presumably providing food resources year-round and open water in winter
where animals can breathe.
KEYWORDS: humpback whale, Megaptera novaeangliae, Antarctic coast, migration,
acoustic presence, ice cover
281

INTRODUCTION
Baleen whales undertake annual migrations between tropical or temperate wintering areas
where breeding takes place, and high latitude feeding grounds in summer [1]. In contrast
to migrations undertaken by terrestrial species, which are primarily driven by nutritional
resources at both locations [2,3], baleen whales migrate between relatively unproductive
breeding grounds and productive feeding areas. Corkeron and Conner [4] revisited
several hypotheses as to why baleen whales undertake these long-distance migrations and
concluded that the most likely hypotheses driving baleen whale migration are those
related to calf growth and survival, i.e., the benefits of the absence of killer whales in the
wintering areas and the presence of calm water. However, there is substantial evidence
for various baleen whale species that not all individuals of a population undertake the
annual migration and that part of the population is present on the feeding grounds in the
winter [5,6,7,8]. Off the Alaskan coast, humpback whales (Megaptera novaeangliae)
were present on the feeding grounds year-round [9]. Brown et al., [10] found that the sex-
ratio of humpback whales migrating from the feeding grounds in the Antarctic to the
breeding areas near the east-Australian coast was highly skewed towards males,
demonstrating that some females remain in the feeding area year-round.
Based on mark-recapture and historic catch data, most humpback whale feeding
grounds in the Southern Hemisphere are believed to be located around 60°S [11,12].
However, this knowledge is primarily based on data collected off-shore during the austral
summer and is limited in scope because of heavy ice conditions close to the continent as
well as limited daylight and extensive ice cover in austral winter. Consequently, the
extent of the southern range of humpback whale feeding areas is unknown. In the
Northern Hemisphere, humpback whales show a strong affinity for coastal waters [13],
which during the summer is thought to reflect the distribution of prey species [14].
Similarly, off the western Antarctic Peninsula, resource sites for humpback whales are
mainly located in near-coastal areas [15,16], raising the question as to whether humpback
whales off the Antarctic continent feed close to the ice-shelf edge. During Antarctic
winter, vast areas of the Southern Ocean are ice covered while coastal polynyas within
the ice-shelf edge region provide small areas of open water where minke whales and
282

beaked whales have been observed [6]. Humpback whales are thought to avoid entering
ice-covered areas [16], leaving the question as to where humpback whales remain on the
feeding grounds during winter unresolved. Humpback whales are highly vocal and are
known to produce sound on the breeding and feeding grounds as well as during migration
[17,18,19]. Passive acoustic recording techniques therefore offer a suitable tool for
monitoring humpback whale presence year-round in – from the human perspective –
remote areas such as the Antarctic. In this study we investigate the year-round acoustic
presence of humpback whales close to the ice-shelf edge using one year of continuous
acoustic recordings obtained from the autonomous PerenniAL Acoustic Observatory in
the Antarctic Ocean (PALAOA).
METHODS
Acoustic recordings
The PerenniAL Acoustic Observatory in the Antarctic Ocean (PALAOA) is located at
70°31’S, 8°13’W on the Eckström Iceshelf, eastern Weddell Sea coast, Antarctica (Fig
1). Recordings are made continuously year-round with two hydrophones deployed
underneath the 100 m thick floating Antarctic ice shelf through bore-holes with an in-
between distance of 300 m [20,21]. Signals are digitized at 48 kHz/16 bit and encoded to
a 192 kBit MP3 stream by a BARIX Instreamer device. The effective bandwidth of the
PALAOA recordings is 10 Hz to 15 kHz, dynamic range 60 dB to 150 dB re 1 µPa.
For this study we used recordings from 1 January through 31 December 2008.
PALAOA records continuously year-round, however occasional gaps occur due to power
outages. For recordings from January through April and October through December 2008
recordings covered at least 80% of the month. In the austral winter, from May through
August 2008, more than 30% of each month was recorded, while for September 2008
only 9% of the month was covered.
Automated call detection
Previous analyses showed that two predominant humpback whale vocalization types were
present in the PALAOA recordings: moans and high calls [22]. Both vocalization types
283

were positively assigned to humpback whales based on previous evidence [19,23].
Moans are low frequency (~100 Hz) arch-shaped calls that are sufficiently stereotyped to
allow for automated detection (Fig 2a & b). In contrast to high calls which were too
variable to be useful for our automated detection method and were not included in the
analysis in this study. Moans were automatically detected using the ‘data template
detector’ in XBAT (Bioacoustics Research Program, Cornell Lab of Ornithology,
www.xbat.org). Detections are based on acoustic similarity between a specified template
and the acoustic events in the recording, quantified through spectrogram cross-
correlation. Detections were run with one template of the moan (duration 1.1 s,
bandwidth 240 Hz, detection correlation threshold 0.42, spectrogram parameters used for
template development: FFT size 4048 points, window length = 1, window function =
Hanning). All automated detections were visually and aurally reviewed and classified as
false or true. Only verified detections were used to explore seasonal acoustic presence of
humpback whales.
Ice cover
To compare humpback whale acoustic presence to local ice cover, percentage open water
was calculated using ENVISAT ice cover data with a 6.25 x 6.25 km resolution [24].
Determination of the radius of the area off PALAOA for which percentage open water
was calculated was based on estimations of the approximate distance of calling
humpback whales recorded by PALAOA. This distance was estimated by comparing the
received levels at PALAOA of humpback whale moans and an oceanographic RAFOS
sound source with comparable acoustic propogation characteristics as humpback whale
moans. The RAFOS sound source is located 191 km north of PALAOA (Fig 1) and
produces a 80s sweep between 259 and 261 Hz at 180 dBrms re 1 µPa. The RAFOS sound
source was used to calculate the reduction in amplitude per unit distance and this was
extrapolated to humpback whale moans, assuming moan source levels were 175 dB [23].
RESULTS
Seasonal presence
284

Humpback whale moans were present during nine months of the year in 2008: January
through April, June through August and November and December. Most humpback
whale moans were detected in March and April, i.e., late austral summer. In May,
October and September, no moans were detected.
Typically, moans occurred in bouts of a few days, ranging from 2 to 17 consecutive days,
with only 13 single days (Fig 3). Of all months, February, March and April had most
daily presence of humpback whale moans.
Ice cover
Moans were estimated to be produced by humpback whales at a distance between 135
and 170 km from the observatory. Figure 4 shows the percentage of open water for the
area within a 200 km radius off PALAOA along with the days on which moans were
detected (black triangles) and PALAOA recording status (black bar indicates the
observatory was recording). Moans were present from February when open water
dominated the area around PALAOA (> 90%) to the end of April when percentage of
open water decreased to less than 30%. Further calls were detected in austral winter when
percentage of open water was below 30% and in austral summer (November)
approximately 2 weeks after seasonal sea-ice melt has started.
DISCUSSION
Humpback whale feeding grounds near the ice-shelf edge
The presence of humpback whale vocalizations in the PALAOA recordings from austral
summer suggests that humpback whale feeding grounds in IWC areas II and III extend
further south than previously assumed [12,25, Fig 5]. Tynan [26] proposed that
humpback whale southbound migration and location of primary feeding areas is linked to
the occurrence of predictably productive areas at the southern boundary of the Antarctic
Circumpolar Current. With the receding pack-ice in austral summer, whales migrate
south of the southern boundary, following the productive marginal ice-edge zone,
approaching the continent by February-March [26]. In contrast to a more or less confined
location of humpback whale feeding areas as proposed by the IWC [12], Tynan’s [26]
285

and our study suggest that feeding grounds in the Southern Hemisphere are more likely
longitudinal regions through which the animals range in a southbound direction while
foraging. Humpback whales are known to travel extensive distances on the feeding
grounds as part of their foraging strategy [16]. The location of primary feeding areas
might therefore not be static, but determined by seasonal sea-ice retreat, primary
productivity and krill (Euphasia superba) abundance. Preliminary analyses show that
humpback whale moans also occur in PALAOA recordings from previous years,
suggesting that whales return to this area annually.
Winter presence
The results of our study show that Southern Hemisphere humpback whales are also
present near the ice-shelf edge in the austral winter (Fig 5). Brown et al., [10] suggested
that females might avoid undertaking or completing the long-distance migration each
year. Size rather than age is thought to be an important factor determining sexual
maturity in humpback whale females [27] and it might therefore primarily be sexually or
physically immature females that remain on the feeding grounds all year to maximize
growth. These observations along with the relatively large number of Northern
Hemisphere humpback whale populations in which individuals have been observed on
the feeding grounds in winter [9,28,29,30,31], suggests that winter presence on the
feeding grounds might be a feature to humpback whale populations in general, and
possibly even a general characteristic of baleen whale migratory behavior [32].
The acoustic presence of humpback whales in the region off PALAOA in austral winter
(June – August) implies that these whales overwinter in this area. Straley [9] found
humpback whales present on Northern Hemisphere feeding grounds throughout winter,
although no individual whales overwintered in the feeding area and whales were more
likely to be irregular migrants departing late or arriving early on the feeding grounds. In
our study, the extent of the Antarctic ice sheet in the mid-winter period with open water
mainly occurring in coastal polynyas, excludes large scale north- or southbound
migration of whales. This suggests that whales present on the feeding grounds in winter
are more or less confined to these areas until the sea-ice recedes in austral spring.
286

Presence in ice-covered areas
The acoustic presence of humpback whales in April and in austral winter when sea ice
cover in the area around PALAOA is pervasive contradicts previous suggestions that
humpback whales avoid entering ice-covered areas [15,16,33]. Little is known about the
presence of baleen whales in ice-covered areas, mainly because of the logistic difficulties
of accessing these regions, particularly in the Antarctic. Nevertheless, observations of
several studies suggest that the availability of breathing holes in the ice, rather than the
ice itself restricts cetacean distribution to areas where polynyas or areas of open water
reliably occur [6,34]. Sirovic et al., [32] used passive acoustic techniques and found blue
whale calls present in spring when sea ice cover was still substantial. Minke whales are
known to associate with pack ice in winter and autumn [6] and have been observed
creating breathing holes in ice [35]. Large groups of various cetacean species were
observed being ‘entrapped’ in pools surrounded by vast ice-covered areas in winter
[36,37,38]. In the Antarctic, the presence of open water and the formation of polynyas are
variable and depend on catabatic and westerly winds transporting ice in northern
directions [39], whereas easterly winds parallel to the coast transport ice towards the
Antarctic continent. Furthermore, the presence of icebergs can affect the formation and
size of polynyas as these often also tend to form on the lee side of (stranded) icebergs or
glacier tongues [40]. Variability in the presence and size of areas with open water
resulting from ice movements might temporarily limit access to certain areas, possibly
explaining the temporal patchiness in the occurrence of humpback whale moans within
and between months. In addition, humpback whale movements are likely also affected by
krill distribution. In winter, krill is known to prefer under-ice habitat to open water,
concentrating near specific sea-ice features such as ridges and polynya borders for
feeding and shelter [41]. Although we do not know if humpback whales forage in the area
off PALAOA, the coastal polynya likely offers plentiful food supply to humpback whales
in winter.
Conclusions
Our results show that humpback whales may be much more plastic in their migratory
behavior than previously assumed and that many aspects of their migration are still
287

poorly understood [see also 42]. Acoustic recording techniques provide the possibility of
monitoring acoustic presence on Antarctic feeding grounds year-round, but can also be
used to gain insights to which breeding stock calling individuals belong [43,44]. Sounds
recorded by PALAOA are likely produced by animals from breeding stock B, off the
west-coast of South-Africa, which are thought to migrate to feeding areas between 20˚W
and 20˚E [45]. Nevertheless, the lack of acoustic data on appropriate spatial and temporal
scales currently impedes a comparison between vocal behavior on the breeding and
feeding grounds or along migratory routes.
Commercial whaling and illegal hunting has drastically reduced humpback whale
populations in the Southern Ocean [46]. As pointed out by Brown et al., [10], improving
knowledge on humpback whale migratory behavior is important given that incorrect
assumptions on migratory behavior can significantly affect outcomes of population
models and management decisions.
ACKNOWLEDGEMENTS
We thank Rosa Wilm, Svenja Zakrzewski and Taryn Overton for assistence with acoustic
analyses. The logistics department of the Alfred Wegener Institute for Polar and Marine
Research, Bremerhaven, Germany, Reederei F. Laeisz GmbH, Rostock, Germany and
FIELAX Services for Marine Science and Technology mbH, Bremerhaven, Germany all
played a crucial role in setting up and/or maintaining PALAOA. Special thanks to
overwinterer Max Goerler who maintained PALAOA during 2008. The PALAOA project
was partly funded by the Bremerhavener Gesellschaft für Innovationsförderung und
Stadtentwicklung (BIS).
REFERENCES
1. Kellogg, R. 1929 What is known of the migrations of some of the whalebone whales.
Smithsonian Report 1928, 467-494.
2. Baker, R.R. 1978 The evolutionary ecology of animal migration. New York: Holmes &
Meier Publishers Inc.
288
3. Newton, I. 2008 The migration ecology of birds. London: Academic Press
4. Corkeron, P.J., Conner, R.C. 1999 Why do baleen whales migrate? Marine Mammal
Science 15, 1228-1245.
5. Mackintosh, N.A., Brown, S.G. 1956 Preliminary estimates of the southern
populations of the larger baleen whales. The Norwegian Whaling Gazette 9, 469-480.
6. Ribic, C.A., Ainley, D.G., Fraser, W.R. 1991 Habitat selection by marine mammals in
the marginal ice zone. Antarctic Science 3, 181-186.
7. Stafford, K.M., Mellinger, D.K., Moore, S.E., Fox, C.G. 2007 Seasonal variability and
detection range modeling of baleen whale calls in the Gulf of Alaska, 1999-2002. Journal
of the Acoustical Society of America 122, 3378-3390.
8. Širovic, A., Hildebrand, J.A., Wiggins, S.M., Thiele, D. 2009 Blue and fin whale
acoustic presence around Antartica during 2003 and 2004. Marine Mammal Science 25,
125-136.
9. Straley, J.M. 1990 Fall and winter occurrence of humpback whales (Megaptera
novaeangliae) in Southeastern Alaska. Report of the International Whaling Commission
(special issue) 12, 319-323.
10. Brown, M.R., Corkeron, P.J., Thale, P.T., Schultz, K.W., Bryden, M.M. 1995
Evidence for a sex-segregated migration in the humpback whale (Megaptera
novaeangliae). Proceedings of the Royal Society of London B 259, 229-234.
11. Rayner, G.W. 1940 Whale marking: progress and results to December 1939.
Discovery Reports 19, 245-284.
12. International Whaling Commission 1998 Annex G - Report of the Sub-Committee on
comprehensive assessment of southern Hemisphere humpback whales. Report of the
International Whaling Commission 48, 170-182.
13. Stevick, P.T., Allen, J., Bérubé, M., Clapham, P.J., Katona, S.K., Larsen, F., Lien, J.,
Mattila, D.K., Palsbøll, P.J., Robbins, J., et al. 2003 Segregation of migration by feeding
ground origin in North Atlantic humpback whales (Megaptera novaeangliae). Journal of
Zoology London 259, 231-237.
14. Piatt, J.F., Methven, D.A., Burger, A.E. 1989 Baleen whales and their prey in a
coastal environment. Canadian Journal of Zoology 67, 1523-1530.
289
15. Thiele, D., Chester, E.T., Moore, S.E., Širovic, A., Hildebrand, J.A., Friedlaender,
A.S. 2004 Seasonal variability in whale encounters in the Western Antarctic Peninsula.
Deep-Sea Research II 51, 2311-2325.
16. Dalla-Rosa, L., Secchi, E.R., Maia, Y.G., Zerbini, A.N., Heide-Jørgensen, M.P. 2008
Movements of satellite-monitored humpback whales on their feeding ground along the
Antarctic Peninsula. Polar Biology 31, 771-781.
17. Payne, R., McVay, S. 1971 Songs of humpback whales. Science 173, 585-597.
18. D’Vincent, C.G., Nilson, R.M., Hanna, R.E. 1985 Vocalization and coordinated
feeding behavior of the humpback whale in Southeastern Alaska. Scientific Reports of the
Whales Research Institute, Tokyo 36, 41-47.
19. Dunlop, R.A., Noad, M.J. 2007 The social vocalization repertoire of east Australian
migrating humpback whales (Megaptera novaeangliae). Journal of the Acoustical Society
of America 122, 2893-2905.
20. Boebel, O., Kindermann, L., Klinck, H., Bornemann, H., Plötz, J., Steinhage, D.,
Riedel, S., Burkhardt, E. 2006 Real-time underwater sounds from the Southern Ocean.
Eos Transactions, American Geophysical Union 87, 361-362.
21. Klinck, H. 2008 Automated passive acoustic detection, localization and identification
of leopard seals. PhD dissertation, University of Trier, Germany. Reports on Polar and
Marine Research 582, 155 pp.
22. Van Opzeeland, I.C. 2010 Acoustic ecology of marine mammals in polar oceans. PhD
dissertation, University of Bremen, Germany.
23. Thompson, P.O., Cummings, W.C., Ha, S.J. 1986 Sounds, source levels, and
associated behavior of humpback whales, Southeast Alaska. Journal of the Acoustical
Society of America 80, 735-740.
24. Spreen, G., Kaleschke, L., Heygster, G. 2008 Sea ice remote sensing using AMSR-E
89 GHz channels. Journal of Geophysical Research 113, C02S03.
25. Best, P.B. 2007 Whales and dolphins of the Southern African Subregion. Cape Town:
Cambridge University Press.
26. Tynan, C.T. 1998 Ecological importance of the Southern Boundary of the Antarctic
Circumpolar Current. Nature 392, 708-710.
290

27. Lockyer, C. 1984 Review of baleen whale reproduction and implications for
management. Report of the International Whaling Commission (special issue) 6, 27-50.
28. Ingebrigtsen, A. 1929 Whales caught in the North Atlantic and other seas. Report of
the International Council for the Exploration of the Sea 56, 3-26.
29. Williamson, G.R. 1961 Winter sighting of a humpback suckling its calf on the Grand
Bank of Newfoundland. Norwegian Whaling Gazette 8, 335-341.
30. Clapham, P.J., Baraff, L.S., Carlson, C.A., Christian, M.A., Mattila, D.K., Mayo,
C.A., Murphy, M.A., Pittman, S. 1993 Seasonal occurrence and annual return of
humpback whales, Megaptera novaeangliae, in the southern Gulf of Maine. Canadian
Journal of Zoology 71, 440-443.
31. Swingle, W.M., Barco, S.G., Pitchford, T.D., McLellan, W.A., Pabst, D.A. 1993
Appearance of juvenile humpback whales feeding in the nearshore waters of Virginia.
Marine Mammal Science 9, 309-315.
32. Širovic, A., Hildebrand, J.A., Wiggins, S.M., McDonald, M.A., Moore, S.E., Thiele,
D. 2004 Seasonality of blue and fin whale calls and the influence of sea ice in the
Western Antarctic Peninsula. Deep-Sea Research II 51, 2327-2344.
33. Dawbin, W.H. 1997 Temporal segregation of humpback whales during migration in
Southern Hemisphere waters. Memoirs of the Queensland Museum 42, 105-138.
34. Gill, P.C., Thiele, D. 1997 A winter sighting of killer whales (Orcinus orca) in
Antarctic sea-ice. Polar Biology 17, 401-404.
35. Scheidat, M., Bornemann, H., Burkhardt, E., Flores, H., Friedlaender, A., Kock, K.H.,
Lehnert, L., Van Franeker, J., Williams, R. 2008 Antarctic sea ice habitat and minke
whales. Annual Science Conference in Halifax, Canada, 22-26 September 2008
36. Porsild, M.P. 1918 ‘Savsatts’, a crowding of Arctic animals at holes in the sea-ice.
Geographical Reviews 6, 215.
37. Taylor, R.J.F. 1957 An unusual record of three species of whale being restricted to
pools in the Antarctic sea ice. Proceedings of the Zoological Society of London 129, 325-
331.
38. Freeman, M.M.R. 1968 Winter observations on beluga (Delphinaterus leucas) in
Jones Sound NWT. Canadian Field Naturalist 82, 276-286.
291

39. Wendler, G., Gilmore, D., Curtis, J. 1997 On the formation of coastal polynyas in the
area of Commonwealth Bay, East Antarctica. Atmospheric Research 45, 55-75.
40. Massom, R.A., Hill, K.L., Lytle, V.I., Worby, A.P., Paget, M.J., Allison, I. 2001
Effects of regional fast-ice and icerberg distributions on the behaviour of the Mertz
Glacier polynya, East Antarctica. Annals of Glaciology 33, 391-398.
41. Marschall, H.P. 1988 The overwintering strategy of Antarctic krill under the pack-ice
of the Weddell Sea. Polar Biology 9, 129-135.
42. Valsecchi, E., Corkeron, P.J., Galli, P., Sherwin, W., Bertorelle, G. 2010 Genetic
evidence for sex-specific migratory behaviour in western South Pacific humpback
whales. Marine Ecology Progress Series 398, 275-286.
43. Darling, J.D., Sousa-Lima, R.S. 2005 Songs indicate interaction between humpback
whale (Megaptera novaeangliae) populations in the western and the eastern South
Atlantic Ocean. Marine Mammal Science 21, 557-566.
44. Dunlop, R.A., Cato, D.H., Noad, M.J. 2008 Non-song acoustic communication in
migrating humpback whales (Megaptera novaeangliae). Marine Mammal Science 24,
613-629.
45. Rosenbaum, H.C., Pomilla, C., Mendez, M., Leslie, M.S., Best, P.B., Findlay, K.P.,
Minton, G., Ersts, P.J., Collins, T., Engel, M.H., et al. 2009 Population structure of
humpback whales from their breeding grounds in the South Atlantic and Indian Oceans.
Public Library of Science 4, 1-11.
46. Clapham, P.J., Young, S.B., Brownell, R.L. Jr. 2002 Baleen whales: conservation
issues and the status of the most endangered populations. Mammal Review 29, 37-62.
47. GEBCO 2003 The GEBCO Digital Atlas published by the British Oceanographic
Data Centre on behalf of IOC and IHO.
292

FIGURE LEGENDS
Figure 1. Bathymetry map showing the location of PALAOA (white star) and location of
the German Neumayer Station II (black star). The white triangle indicates the location of
a RAFOS sound source. Inset image: map of Antarctica showing the location of
Neumayer Station (black star).
Figure 2. Spectrograms of humpback whale moans recorded by PALAOA: a) on 1 April
2008, b) on 6 July 2008.
Figure 3. Daily presence and absence, presented as 1 and 0, respectively, of humpback
whale moans for all months in 2008. Crosses indicate that no recordings were available
for that day.
Figure 4. Presence of humpback whale moans (black triangles) in relation to percentage
of open water (area graph) within a 200 km range off PALAOA for all days in 2008.
Recording status of PALAOA is indicated by the black bar below the acoustic presence
indicators (station is recording = black bar present).
Figure 5. Seasonal humpback whale distribution between 20°W and 80°E, showing the
summer (grey) and winter (white with black dots) concentrations. The white star
indicates the location of PALAOA with the 200 km range (black half circle) in which
humpback whales were acoustically present in austral summer and winter. The light grey
and the diagonally striped areas represent the larger summer and winter ranges,
respectively, as suggested in this study. Figure adapted from P. Best (2007). Reprinted
and adapted by permission of the publisher.
293

Dronning
Maud Land
Neumayer
South Pole
Dronning
Maud Land
Neumayer
South Pole
1000 m
2000 m2500 m
4500 m
Fig 1.
a b
Fig 2.
294

0
1
1 6 11 16 21 26 31
0
1
1 6 11 16 21 26 31
0
1
1 6 11 16 21 26
0
1
1 6 11 16 21 26
0
1
1 6 11 16 21 26
0
1
1 6 11 16 21 26 31
0
1
1 6 11 16 21 26
x x
x xx
x
x
x
x
x
x
x
x x
x x
x
x
x x
Jan
Feb
Apr
Mar
Jun
x x x x x x xxxxJul
x xx xx x
0
1
1 6 11 16 21 26 31
xx xx
0
1
1 6 11 16 21 26 31
x x xx xx x x xxAug
Nov
xxx xxDec
Day
x xx
0
1
1 6 11 16 21 26 31
x x x x x x x x x x x x x x xMay
0
1
1 6 11 16 21 26
0
1
1 6 11 16 21 26
Sep
Oct
x x x x x x x x x x x x x x x x x x x x x x
x
Fig 3.
295

Fig
4.
296

Fig 5.
297

Publication IX.a
Supplement to paper 9: Vocal repertoire of humpback whales near the
Eckström Ice Shelf
298

SUPPLEMENT TO ‘CALLING IN THE COLD’
VOCAL REPERTOIRE OF HUMPBACK WHALES NEAR THE ECKSTRÖM ICE
SHELF
Authors: Ilse Van Opzeeland1, Sofie Van Parijs2, Lars Kindermann1, Elke Burkhardt1,
Olaf Boebel1
1 Alfred Wegener Institute for Polar and Marine Research, Am Handelshafen 26, 27570
Bremerhaven, Germany 2 Northeast Fisheries Science Center, NOAA, 166 Water Street, Woods Hole, MA 02543
USA
Manuscript in preparation
299

INTRODUCTION
Apart from the well-known highly structured song produced by males during migration
and on the breeding grounds (Payne & McVay 1971), humpback whales also produce
‘social sounds’ (Payne 1978): separate surface-generated percussive sounds (i.e. breaches
and tail-slaps) and social vocalizations. Social sounds are produced by both males and
females (Dunlop et al. 2007), lack the complex structure of song and are the most
common sounds recorded in the feeding areas, although also produced on the breeding
grounds (e.g. Silber 1986; Thompson et al. 1986). In some populations, song has also
been recorded on some feeding grounds (McSweeney 1989; Clapham 2000; Clark &
Clapham 2004). Social sounds are thought to play a role in coordinated feeding behavior
(Jurasz & Jurasz 1979; D’Vincent et al. 1985), inter- and intra-sexual social interactions
(Tyack & Whitehead 1983; Silber 1986; Mobley et al. 1988) and during migration
(Dunlop et al. 2007; 2008). In the southern hemsphere, humpback whale vocalizations
have been recorded on the breeding grounds and during migration (Darling & Sousa-
Lima 2005; Dunlop et al. 2007; 2008). Nevertheless, to our knowledge no study has
described the humpback vocal repertoire on Antarctic feeding grounds. Aural monitoring
of the PALAOA livestream revealed a seven-day period during which many different
humpback whale vocalizations were present. Here we describe the humpback whale
vocal repertoire composition, call characteristics and diel patterns in call type usage over
this seven-day period. The analyses in their current form serve as a thesis-supplement to
the manuscript ‘Calling in the cold’, but will be extended to other years in the near future
and combined in a manuscript describing annual patterns in humpback whale vocal
behavior in the area off PALAOA.
METHODS
Humpback whale vocalization types and diel call activity
By aurally monitoring the PALAOA live stream over the whole of 2008, occurrence and
time of humpback whale acoustic activity was logged. Two classes of known humpback
whale social vocalizations were identified in the PALAOA recordings: high calls and
moan vocalizations (Thompson et al. 1986; Dunlop et al. 2007). No other call types were
300

identified. High humpback whale high call and moan activity was was logged over a
period of seven days between 24 March and 2 April 2008 (no recordings for 25, 29 and
30 March). Recordings from this seven-day period (total of 163 hours) were analysed in
detail. Manual analysis entailed type-identification and counts per call type of all
humpback whale calls within this seven-day period without subsampling the data.
1) High calls are highly variable (e.g. Dunlop et al. 2007) and were type-identified, partly
based on call catalogues from literature (Thompson et al. 1986; Dunlop et al. 2007).
However, given the variable nature of these calls, many high call types were different
from the ones reported in literature. We therefore assigned new call type names to high
calls that were not identifiable from existing call catalogues. A number of high calls
could not be type-identified with certainty because of low signal-to-noise ratios. To be
able to include these calls in the overall count of high calls, these were all type-identified
as Z (n= 370).
2) Moans were stereotyped low frequency (~100 Hz) arch-shaped calls that could be
assigned to humpback whales with certainty based on previous studies (e.g. “grumble”
Dunlop et al. 2007). Moans were also included in the manual count of humpback whale
calls during the seven-day period between 24 March and 2 April 2008.
To visualize diel call activity patterns over this seven-day period, all high call types were
combined. High calls and moan calls were counted on an hourly basis and represented in
a bar chart for each analysed day.
Acoustic characteristics of humpback whale vocalizations
For moans and all high call types that composed more than 5% of the high call vocal
repertoire, (A, B, C, E, F, G, I, M and P), five acoustic parameters were measured (Fig 1):
(1) start frequency (SF), (2) end frequency (EF), (3) minimum frequency (MINF), (4)
maximum frequency (MAXF), (5) duration (DUR). From these five parameters, two
additional parameters were calculated: (6) frequency range (MINF/MAXF) and (7)
frequency trend (SF/EF). High calls occurred in both single and double variants of the
same call type, repetitions of two single call types immediately following each other. For
double variants, acoustic parameters were only measured from the first segment of the
301

call. The choice of acoustic parameters was based on earlier work by Dunlop et al. (2007)
which showed that these parameters were suitable to separate call types statistically.
A classification tree analysis (CART) was performed in R (The R Foundation for
Statistical Computing, 2009, version 2.9.2., www.R-project.org) to explore if humpback
whale vocalizations could also be classified into the various call types based on their
acoustic parameters.
RESULTS
Repertoire composition and acoustic characteristics
Humpback whale vocalizations were type identified into 24 call types: the moan (Fig 2)
and 23 high call types. Within the seven day period that was manually analysed, moans
occurred more frequently than high calls (86% vs 14%). The 23 high call types consisted
of 21 high call types (A-Q), composite calls (CC) and high calls that could not be type-
identified (Z) (Fig 3). Most high call types, except high call type F, typically occurred in
a single and double variant indicated with 1 and 2, respectively, with the double variant
occurring more frequently for all call types except in call types A, B and C. High call
types A, B, C, E, F, G, I, M and P (Fig 4a-j) each composed more than 5% of the
humpback whale high call repertoire (single and double variants combined; Fig 4c-d
shows an example of a double and a single variant for call type C, respectively). In
addition, 11% of the high call repertoire consisted of composite calls: calls that consisted
of combinations of other call types (Fig 5). Composite calls were highly variable in the
type and number of elements that they consisted of and were not further type-identified.
In addition, a number of broadband sounds could not be identified as vocal sounds, and
appeared similar to surface percussive sounds reported by previous studies (i.e.
“presumed underwater blow”, Dunlop et al. 2007). However, since these sounds were
very similar to ice calving sounds and could not be visually confirmed to be produced by
humpback whales, these sounds were not included in the count.
Calls were not produced in patterned sequences and therefore there was no evidence of
humpback song in the recordings.
302

Acoustic parameters were measured for at least 20 calls for each call type (Table 1).
Several call types showed overall similarity to call types described by Dunlop et al.
(2007): call type P resembled the “wop” and “thwop” calls, moans resembled the
“grumble”. However, the majority of call types described in this study differed
substantially in overall structure from previous studies.
The CART showed that moans were clearly separable from all high call types based on
their maximum frequency, which was below 145 Hz for 95% of the moans (Fig 8). All
high call types except call type M and F, more than 50% of calls were correctly classified
according to call type (Table 2).
Diel call activity
Manual analysis of the seven-day period from 24 March and 2 April showed that moan
activity was highest on 1 April with an average of 5.1 moans per minute (Fig 7). Moan
activity did not show a clear diel pattern, although on the days with highest moan activity
the number of moans seemed to decrease in the evening hours; below 2 moans per min
between 17:00 – 22:00 on 1 April and 20:00 – 23:00 on 2 April. On 31 March the number
of moans per minute showed a peak around 11:00 and 23:00 hours. The number of high
calls increased gradually from 24, 26 and 27 March, while no high calls were present on
28 March. The number of high calls was highest on 31 March with an average of 2 high
calls per minute and thereafter decreased again towards an average of 0.1 high calls per
minute on 2 April. Overall, when moans and high calls were combined, call activity was
relatively constant on some days, whereas on other days call activity was clearly highest
during the day, decreasing around 18:00 hours and increasing again around 22:00 hours
(Fig 7-h).
DISCUSSION
Vocal repertoire composition and acoustic characteristics
Although the majority of high calls occurred within the seven day period that was
analysed in this study, some faint high calls were also found to occur in January and July
2008. This suggests that the use of high calls is not restricted to March and April, but that
303

high calls and moans are used throughout the year when humpback whales are present on
the feeding grounds. Lower frequency moans are likely to propagate further than high
calls. Movements in response to factors such as changes in ice cover or prey availability
may possibly cause animals to move closer to the shelf in March and April explaining
why high calls are mainly present in recordings from these months. Data from tagged
individuals in Antarctic feeding areas also show that humpback whales do not stay in the
same place for extended periods of time, but rather roam in fluid movements throughout
the feeding area (Dalla-Rosa et al. 2008). In addition, the presence of ice in this period
(see manuscript ‘Calling in the cold’) might also influence whale movements.
The double variants of high calls observed in this study, have to our knowledge not been
described by previous studies. Instead, other studies found humpback whales to regularly
produce repetitive series of calls during migration and synchronized feeding behavior
(e.g. D’Vincent et al. 1985; Cerchio & Dalheim 2001; Dunlop et al. 2007). Such vocal
behavior has been found to occur in humpback whales herding fish, but also while
herding euphasids and is therefore unlikely to be explained by the prey-type that is
herded. The double variants of high calls described in this study these differences might
therefore reflect population-specific acoustic behavior. The social vocalization repertoire
is known to contain population-specific call types (song-units) in some populations
(Dunlop et al. 2008). Population-specific acoustic characteristics may provide cues to
identify to which breeding population animals on the feeding ground belong (e.g. Darling
& Sousa-Lima 2005). Currently, 8 geographically separated southern hemisphere
humpback whale stocks with connections to feeding grounds in the Antarctic have been
recognized by the IWC (breeding stocks A-G and X; Rosenbaum et al. 2009). However,
to date information on movement patterns, migratory corridors and feeding destinations
are largely lacking. Based on previous studies (e.g. Rosenbaum et al. 2009), we assume
the sounds recorded near the PALAOA station are produced by animals from breeding
stock B, off the west-coast of South-Africa, which are thought to migrate to feeding areas
between 20˚W and 20˚E. However, mixing of different breeding stocks on the feeding
grounds has been proposed as one of the possible explanations for genetic and acoustic
similarities between breeding stocks A, B and C and feeding areas from different
304
breeding stocks may therefore overlap (Mackintosh 1942; Darling & Sousa-Lima 2005;
Rosenbaum et al. 2009; Razafindrakoto et al. 2009). Similarities in acoustic behavior on
the feeding and breeding grounds, such as the presence of double variants of high calls,
could provide information on humpback whale migratory behavior. However, too little is
known on breeding stock B and C song and social vocalization repertoire characteristics
from recent years to draw such comparisons.
Along with previous studies, this study shows that not only humpback whale song is
highly diverse, but social vocalizations are also highly variable in structure. The CART
showed that for the majority of call types most calls could be assigned to the correct call
type based on their acoustic parameters, supporting the call type categorization used in
this study. The relatively low percentage of correctly classified calls for call type F (29%)
and M (42%) may be explained by the fact that the acoustic parameters used do not
sufficiently represent the characteristics of these call types. Analyses of high call acoustic
characteristics over multiple years will provide information on the stability of call types
and their acoustic characteristics.
Diel patterns in call activity
Humpback whale vocal activity was found to decrease in the late afternoon and evening
in March and April, which possibly is related to the behavior of Antarctic krill
(Euphausia superba), their primary prey. Vertical migration of zooplankton1 in March
and April occurs within the upper 200 m of the water column and shows a distinct diel
pattern in these months with zooplankton migrating to shallower water depth around
16:00-17:00 hours (Siegel 2005; Cisewski et al. 2010). The decrease in overall call
activity coincides with the time at which zooplankton concentrations are at shallow
depth. Our findings therefore potentially reflect that calls are produced in a social context
rather than in a feeding context. Furthermore, the need and benefit of vocal behavior
during foraging will be determined by prey type: fish-feeding humpback whales are
thought vocalize during feeding to coordinate movements of group members, while North
1 Cisewski et al. (2010) suggested that the zooplankton community is likely to consist of multiple species, among which krill.
305

Atlantic right whales (Eubalaena glacialis) produce virtually no sounds while skim
feeding on copepods (pers comm. S. Van Parijs). During further analyses we will use
multi-year data from PALAOA to investigate diel call activity across years and in
relation to seasonal variation of krill vertical migration.
ACKNOWLEDGEMENTS
Rosa Wilm and Svenja Zakrzewski assisted in acoustic analyses of humpback whale
vocalizations.
REFERENCES
Cerchio S, Dahlheim M (2001) Variation in feeding vocalizations of humpback whales
(Megaptera novaeangliae) from southeast Alaska. Bioacoustics 11: 277-295
Cisewski B, Strass VH, Rhein M, Krägefsky S (2010) Seasonal variation of diel vertical
migration of zooplankton from ADCP backscatter time series data in the Lazarev Sea,
Antarctica. Deep-Sea Research 57: 78-94
Clapham PJ (2000) The humpback whale. Pages 173-198 in J Mann, R O’conner, PL
Tyack and H Whitehead, eds. Cetacean Societies. Field studies of dolphins and whales.
The University of Chigaco Press, Chicago, Illinois
Clark CW, Clapham PJ (2004) Acoustic monitoring on a umpback whale (Megaptera
novaeangliae) feeding ground shows continual singing into late spring. Proceedings of
the Royal Society of London 271: 1051-1057
D’Vincent CG, Nilson RM, Hanna RE (1985) Vocalization and coordinated feeding
behavior of the humpback whale in Southeastern Alaska. Scientific Reports of the
Whales Research Institute, Tokyo 36: 41-47
Dalla-Rosa L, Secchi ER, Maia YG, Zerbini AN, Heide-Jørgensen MP (2008)
Movements of satellite-monitored humpback whales on their feeding ground along the
Antarctic Peninsula. Polar Biology 31: 771-781
306

Darling JD, Sousa-Lima RS (2005) Songs indicate interaction between humpback whale
(Megaptera novaeangliae) populations in the western and the eastern South Atlantic
Ocean. Marine Mammal Science 21: 557-566
Dunlop RA, Cato DH, Noad MJ (2008) Non-song acoustic communication in migrating
humpback whales (Megaptera novaeangliae). Marine Mammal Science 24: 613-629
Dunlop RA, Noad MJ (2007) The social vocalization repertoire of east Australian
migrating humpback whales (Megaptera novaeangliae). Journal of the Acoustical
Society of America 122: 2893-2905
Jurasz CM, Jurasz VP (1979) Feeding modes of the humpback whale, Megaptera
novaeangliae, in southeast Alaska. Scientific Reports of the Whales Research Institute,
Tokyo 36: 41-47
Mackintosh NA (1942) The southern stocks of whalebone whales. Discovery Reports 22:
197-300
McSweeney DJ, Chu KC, Dolphin WF, Guinee LN (1989) North Pacific humpback
whale songs: a comparison of Southeast Alaskan feeding ground songs with Hawaiian
wintering ground songs. Marine Mammal Science 5: 139-148
Mobley JR Jr, Herman LM, Frankel AS ( 1988) Responses of wintering humpback
whales (Megaptera novaeangliae) to playbacks of recordings of winter and summer
vocalizations and of synthetic sound. Behavioural Ecology and Sociobiology 23: 211-223
Payne R (1978) Behavior and vocalizations of humpback whales (Megaptera sp). Pages
56-78 in KS Norris and RR Reeves, eds. Report on a workshop on problems related to
humpback whales (Megaptera novaeangliae) in Hawaii. NTIS, PB-280 794, Report no.
MMC-77/03
Payne R, McVay S (1971) Songs of humpback whales. Science 173: 585-597
Razafindrakoto Y, Cerchio S, Collins T, Rosenbaum HC, Ngouessono S (2009)
Similarity of song patterns among humpback whales from Madagascar and Gabon
indicates significant contact between South Atlantic and Southwest Indian Ocean
populations. Report of the International Whaling Commission
Rosenbaum HC, Pomilla C, Mendez M, Leslie MS, Best PB, Findlay KP, Minton G,
Ersts PJ, Collins T, Engel MH, Bonatto SL, Kotze DPGH, Meyer M, Barendse J,
Thornton M, Razafindrakoto Y, Ngouessono S, Vely M, Kiszka J (2009) Population
307
structure of humpback whales from their breeding grounds in the South Atlantic and
Indian Oceans. Public Library of Science 4: 1-11
Siegel V (2005) Distribution and population dynamics of Euphasia superba: summary of
recent findings. Polar Biology 29: 1-22
Silber GK (1986) The relationship of social vocalizations to surface behavior and
aggression in the Hawaiian humpback whale (Megaptera novaeangliae). Canadian
Journal of Zoology 64: 2075-2080
Thompson PO, Cummings WC, Ha SJ (1986) Sounds, source levels, and associated
behavior of humpback whales, southeast Alaska. Journal of the Acoustical Society of
America 80: 735-740
Tyack P, Whitehead H (1983) Male competition in large groups of wintering humpback
whales. Behaviour 83: 1-23
308

TA
BL
ES
Tab
le 1
. Des
crip
tive
sta
tist
ics
of h
igh
call
typ
es t
hat
com
pose
d m
ore
than
5%
of
the
high
cal
l vo
cal
repe
rtoi
re, (
A, B
, C, E
, F, G
, I, M
and
P).
The
ave
rage
and
sta
ndar
d de
viat
ion
(in
% o
f av
erag
e) i
f gi
ven
for
the
five
aco
usti
c pa
ram
eter
s th
at w
ere
mea
sure
d: (
1) s
tart
freq
uenc
y (S
F),
(2)
end
fre
quen
cy (
EF
), (
3) m
inim
um f
requ
ency
(M
INF
), (
4) m
axim
um f
requ
ency
(M
AX
F),
(5)
dur
atio
n (D
UR
).
Call
typ
e A
B
C
E
F
G
I
M
P
Moan
N
22
20
36
22
31
23
27
24
24
21
Para
met
er
Sta
rt F
req
[Hz]
39
6.41
(3
1%)
378.
5 (4
4%)
575.
81
(37%
) 10
70.3
6 (1
8%)
664.
48
(40%
) 54
6.39
(2
3%)
503.
41
(37%
) 41
2.83
(3
3%)
201.
83
(37%
) 95
.71
(22%
) E
nd F
req
[Hz]
39
1.64
(3
0%)
471.
5 (3
6%)
442
(35%
) 10
87.9
5 (1
7%)
789.
81
(41%
) 55
8.26
(2
4%)
276.
70
(48%
) 38
9.13
(3
4%)
200.
71
(33%
) 10
1.43
(2
7%)
Min
Fre
q [H
z]
374.
91
(29%
) 37
8.5
(44%
) 42
9.53
(3
6%)
982.
41
(18%
) 64
2.81
(3
6%)
515.
48
(23%
) 25
5.74
(3
9%)
292.
33
(41%
) 16
7.63
(4
1%)
83.4
3 (1
6%)
Max
Fre
q [H
z]
405.
86
(31%
) 47
1.5
(36%
) 57
5.81
(3
7%)
1105
.82
(18%
) 80
7.03
(4
1%)
577.
57
(23%
) 48
8.3
(38%
) 42
4.46
(3
2%)
223.
83
(30%
) 11
5.24
(2
2%)
Dur
atio
n [s
]
0.96
(5
2%)
0.75
(3
6%)
0.38
(4
1%)
0.76
(3
8%)
0.62
(3
0%)
0.56
(3
1%)
0.98
(2
9%)
1.05
(2
9%)
0.55
(3
1%)
2.25
(3
7%)
Fre
q R
ange
[r
atio
]
1.08
(8
%)
1.28
(1
3%)
1.35
(1
3%)
1.13
(1
0%)
1.25
(1
5%)
1.12
(7
%)
2.03
(3
6%)
1.5
(18%
) 1.
42
(25%
) 1.
4 (2
1%)
Fre
q T
rend
[r
atio
]
1.01
(7
%)
0.79
(1
2%)
1.31
(1
3%)
0.99
(8
%)
0.86
(1
7%)
0.99
(1
1%)
1.96
(3
3%)
1.08
(2
1%)
1.03
(3
0%)
1.0
(29%
)
309
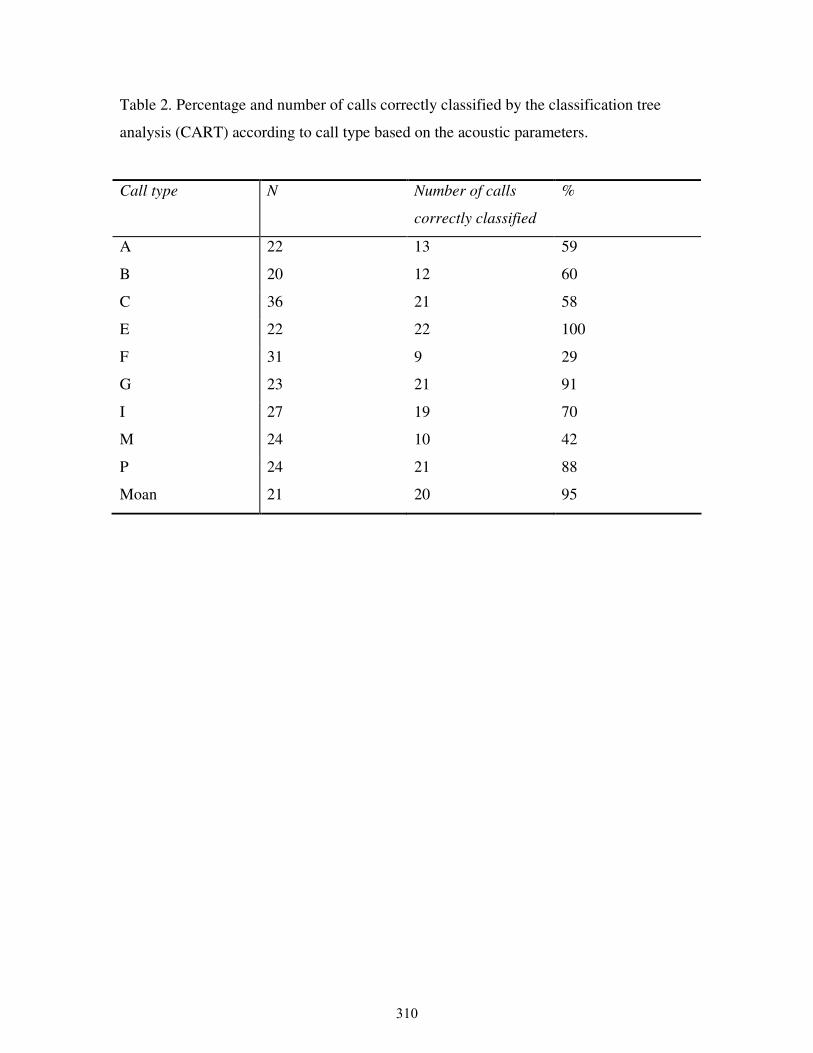
Table 2. Percentage and number of calls correctly classified by the classification tree
analysis (CART) according to call type based on the acoustic parameters.
Call type N Number of calls
correctly classified
%
A 22 13 59
B 20 12 60
C 36 21 58
E 22 22 100
F 31 9 29
G 23 21 91
I 27 19 70
M 24 10 42
P 24 21 88
Moan 21 20 95
310

FIGURE LEGENDS
Figure 1. The five acoustic parameters measured on all call types that composed more
than 5% of the vocal repertoire: (1) start frequency (SF), (2) end frequency (EF), (3)
minimum frequency (MINF), (4) maximum frequency (MAXF), (5) duration (DUR).
Figure 2. Spectrogram of a humpback whale moan vocalization.
Figure 3. Total number of calls counted per high call type for all 23 high call types
identified in this study. Letters represent call types and numbers indicate the number of
calls counted for single (e.g. A1) variety of call type or double variety (e.g. A2). Z are all
calls that could not be type-identified and CC represent all composite calls.
Figure 4. Spectrograms of all high call types that composed more than 5% of the
humpback whale vocal repertoire.
Figure 5. Spectrograms of two composite calls. Composite calls were not further type-
identified and combined into ‘composite calls’ (CC).
Figure 6. Classification tree analysis with call type as a splitting variable. Maximum
frequency (MAXFR) separated 95 % of the moans from high call types. For call types A,
B, C, E, G, I and P more than 50% of calls was correctly classified based on the measured
acoustic parameters.
Figure 7. Diel call activity for all seven days with the number of moans per hour
represented in black bars and the number of high calls (all call types combined) per hour
shown as grey bars (a-g). The last graph shows overall call activity (moans and high calls
combined) for all days (h).
311

Fig 1.
312

Moan
Fig 2.
313

Fig 3.
314

A2 B2 C2 C1
a
b
c d
E2 G2 I2 M2
e f g h
315

F P2
i
j
Fig 4 a-j.
316

CC – example 1 CC – example 2
Fig 5.
317

Fig 6.
318

a b
c d
e f
gh
Fig 7 a-h.
319

Publication X
A noisy spring: the impact of globally rising underwater sound levels
on fish
320

This article appeared in a journal published by Elsevier. The attached
copy is furnished to the author for internal non-commercial research
and education use, including for instruction at the authors institution
and sharing with colleagues.
Other uses, including reproduction and distribution, or selling or
licensing copies, or posting to personal, institutional or third party
websites are prohibited.
In most cases authors are permitted to post their version of the
article (e.g. in Word or Tex form) to their personal website or
institutional repository. Authors requiring further information
regarding Elsevier’s archiving and manuscript policies are
encouraged to visit:
http://www.elsevier.com/copyright
321

Author's personal copy
A noisy spring: the impact of globallyrising underwater sound levels on fishHans Slabbekoorn1, Niels Bouton2, Ilse van Opzeeland3, Aukje Coers4, Carel ten Cate1
and Arthur N. Popper5
1Behavioural Biology, Institute of Biology, Leiden University, Sylviusweg 72, 2333 BE Leiden, The Netherlands2Evolutionary Ecology Group, University of Antwerp, Groenenborgerlaan 171, B-2020 Antwerp, Belgium3Ocean Acoustics Lab, Alfred Wegener Institute, Am alten Hafen 26, 27568 Bremerhaven, Germany4Pelagic Regional Advisory Council, Treubstraat 17, 2288 EH Rijswijk, The Netherlands5Department of Biology and Center for Comparative and Evolutionary Biology of Hearing, University of Maryland, College Park,
MD 20742, USA
The underwater environment is filled with biotic and
abiotic sounds, many of which can be important for the
survival and reproduction of fish. Over the last century,
human activities in and near the water have increasingly
added artificial sounds to this environment. Very loud
sounds of relatively short exposure, such as those pro-
duced during pile driving, can harm nearby fish. How-
ever, more moderate underwater noises of longer
duration, such as those produced by vessels, could
potentially impact much larger areas, and involve much
larger numbers of fish. Here we call attention to the
urgent need to study the role of sound in the lives of
fish and to develop a better understanding of the eco-
logical impact of anthropogenic noise.
The myth of a silent underwater world
In 1962, Rachel Carson wrote about a ‘silent spring’ in the
context of the detrimental impact of the use of pesticides on
singing birds. Here we call attention to a ‘noisy spring’, and
the possible detrimental impact of increasing levels of
anthropogenic noise on fishes1 [1,2]. Fish populations have
come under threat for a number of well-known reasons
including fisheries [3], habitat degradation [4] and chemi-
cal pollution [5]. Human-generated underwater noise is
potentially becoming another threat to fish, just as traffic
noise has become a major concern in air with regard to
birds and other terrestrial animals [6,7]. Although humans
have engaged in all sorts of activities in, on, and near water
bodies for a long time, only recently have these activities
expanded in an increasingly noisymanner (Box 1). To date,
underwater noise pollution has primarily attracted atten-
tion in the context of marine mammals [8–10], but it is
increasingly recognized as a factor that may also have
implications for fish [11–14].
In this review we focus on the need for behavioural and
ecological studies on the impact of long-term anthropo-
genic noise on fishes. We take this approach since very
large numbers of fish are exposed to moderate but wide-
spread low-frequency noise, produced by vessels, offshore
wind farms and other coastal activities, and yet we have
the barest insight as to the nature and extent of the
behavioural impact of such sounds on fishes (Figure 1).
While data on fish behavioural responses to the increase in
ambient sound are generally not available, we can use data
derived from other vertebrates to suggest that anthropo-
genic noise may deter fish from important feeding and
reproduction areas, interrupt critical activities, or cause
stress-induced reduction in growth and reproductive
output. The concern about wide-ranging effects is further
heightened because sound is of critical importance in the
lives of many fish species. Impeding the ability of fish to
hear biologically relevant sounds might interfere with
critical functions such as acoustic communication, pred-
ator avoidance and prey detection, and use of the ‘acoustic
scene’ or ‘soundscape’ [15,16] to learn about the overall
environment. Taken together, these potential effects could
Review
Glossary
Active space: the distance from a sound-emitting animal over which the sound
is detectable and recognizable by conspecifics. The active space is influenced
by the source amplitude, receiver sensitivity, attenuation and degradation
during transmission, and interference by ambient noise.
Anthropogenic noise: any sound generated by human activities, which has the
potential to warn fish of the danger of approaching boats or risky water inlets.
It may also be detrimental to fish through deterrence, interference and masking
of biologically relevant sounds, or through physiological stress.
Auditory detection continuum: mechanistic scale of fish hearing, replacing the
traditional and oversimplified categories of generalists and specialists. The
scale ranges from fish species without a swim bladder or other air-filled body
cavities and only able to detect particle motion (e.g. sharks) to fish species with
a so-called otophysic connection between swim bladder and ear and able to
detect motion as well as sound pressure (e.g. goldfish).
Auditory masking: the perceptual interference of one sound (often concerning
a signal) by another (often referred to as noise). The masking impact occurring
at the point of the receiver typically depends on the spectral overlap between
and the amplitude ratio of the signal and the noise.
Cortisol: a corticosteroid hormone or glucocorticoid, often referred to as a
stress hormone, due to its involvement in response to stress and anxiety.
Cortisol serves to increase blood sugar levels, stores sugar in the liver as
glycogen, and also suppresses the immune system.
Inner ear: the major structure in fish for detection of sound. The inner ear is
located in the cranial cavity of fish and its basic structure is the same as the
inner ears of sharks and all terrestrial vertebrates, including humans.
Lateral line system: a sense organ used to detect movement and vibration in
fish. Lateral lines are usually visible as faint lines running lengthwise down
each side of the body and sometimes as a faint network of dots on the head.
Swim bladder: an internal gas-filled organ found in most fish species (but for
example not in sharks and rays amongst others) that contributes to the ability
to control buoyancy control and allows a fish to stay at a particular water
depth. The swim bladder can also serve as a resonating chamber and aid in
sound production and sound perception.
Corresponding author: Slabbekoorn, H.
([email protected])1 Unless otherwise specifically noted, ‘fish’ in this paper refers to bony fishes of the
Osteichthyes taxonomic subclass, the Actinopterygii (or ray-finned fishes)..
0169-5347/$ – see front matter � 2010 Elsevier Ltd. All rights reserved. doi:10.1016/j.tree.2010.04.005 Trends in Ecology and Evolution 25 (2010) 419–427 419
322

Author's personal copy
have a significant impact on survival of individuals and
populations and affect whole ecosystems.
It is important to make three points at the start of this
review. First, our emphasis is on behavioural effects of
human-generated sounds because these are likely to be
the most significant for fish. At the same time we recog-
nize that there is a great concern by many investigators,
regulators and various industries about high impact
sounds. Underwater explosions, pile driving, or seismic
surveys, can all have dramatic effects on nearby fish,
including physical damage and death. While not covered
here, these immediate effects involving relatively few
individual animals have recently been reviewed in great
detail [14].
Second, we also emphasize in this review that research-
ers of the noise impact on fish can get valuable insights
from investigations that have been concerned with similar
issues in terrestrial animals and, to a lesser extent, marine
mammals. In particular, studies on birds might provide
guidance in experimental design and in asking questions
that are the most useful in gaining a better understanding.
Considering the striking similarities in the auditory
system and perceptual abilities of all vertebrates [15], it
would also not be surprising to find congruencies in the
Box 1. Human invasion of the underwater acoustic
environment
Underwater sounds generated by human activities can be sub-
divided in two categories: sounds that are an unintentional by-
product and sounds that are used as a measurement tool. Dominant
in the first category are low-frequency noises from vessels for
container shipping, public transport, fishing and recreational
activities [1,2,67,68,88]. For example, >80% of global freight
transport takes place over water by motorized shipping, while
passenger crossing occurs on many rivers, lakes and seas, often on
noisy ferries that shuttle between harbours at frequent intervals.
Moreover, fishing vessels typically have strong and noisy motors for
towing gear. Although the global fishing fleet has not grown much
since the early 1990s it still includes about 1.2 million vessels. The
number of recreational vessels is still on the rise, with a growing
impact on coastal and in-shore waters [32,42,89]. Another signifi-
cant source of anthropogenic noise of the first category is that
associated with construction and exploitation of offshore platforms.
The first submerged oil wells were drilled in a fresh water lake in
Ohio (USA) around 1891, and five years later, the first marine oil
wells were drilled near Santa Barbara, California (USA). Today, there
are thousands of offshore oil and gas platforms worldwide. In
addition, the more recent development of exploitation of renewable
sources, such as wind, wave, tidal or current energy, also generates
noise during construction and operational phases [90–92].
The second category of human-generated sounds for various
types of underwater measurements involves both low and high
frequencies. Underwater sound is used by navies, fisheries, the oil
and gas industry, oceanographers, geologists, as well as meteorol-
ogists. The first time that sound was used by humans to locate
objects underwater was shortly after the Titanic sank in 1912. After
that, the use of mid- and later low-frequency sonar has become
widespread for navigation and localization of submarines and other
objects. In the context of fisheries, the first acoustic study concerned
the localization of spawning cod at the Lofoten Islands in 1935 [93].
Then, by 1950, fish-finding echo sounders had become an essential
aid to all commercial fishing vessels. Other acoustic measurement
applications include seismic reflection profiling using high-intensity
airguns to obtain information about the geological structures
beneath the seafloor, and acoustic thermography of ocean climate
(ATOC). The second of these was launched in the 1990 s using
relatively high-intensity sound transmission for long periods to
determine ocean temperature [9].
Figure 1. Four main domains of research to assess the potential impact of
moderate but widespread anthropogenic noise conditions on fish (see Box 4).
Box 2. Underwater sound – an overview
The basic principles of sound propagation in air and in water are the
same, but there are a number of features peculiar to underwater
acoustics [94,95]. Water is an excellent medium for sound transmis-
sion because of its high molecular density. Sound travels about five
times faster in water than in air (about 1500 vs. 300 m/s), and this
means that wavelengths are about five times longer in water than in
air (e.g. for a 100 Hz signal: 3 m in air, 15 m in water). Sound also
attenuates less over the same distance in water than in air. As a
consequence, sound travels much greater distances at higher
amplitude levels in water compared to air, thereby enabling long-
distance communication, but also a long-distance impact of noise on
aquatic animals.
Sound levels or sound pressure levels (SPL) are referred to in
decibels (dB). However, the dB is not an absolute unit with a physical
dimension, but is instead a relative measure of sound pressure with
the lower limit of human hearing corresponding to 0 dB in air.
Underwater dB-levels are different from above water dB-levels [95].
Sound pressure levels above water are referenced to 20 mPa, while
underwater they are referenced to 1 mPa. As a consequence, adding
25.5 dB to the airborne dB-level is required to get a comparable
underwater dB-level. Furthermore, related to the much higher
acoustic impedance of water compared to air, another 36 dB
correction is required, making an airborne sound pressure level of
70 dB re 20 mPa comparable to an underwater 131.5 dB re 1 mPa.
Sound pressure levels are based on root-mean-square (RMS)
measures averaged over time. They are useful for relatively long
sounds but less effective for brief sounds such as pile-driving strikes
and echolocation clicks of whales. Peak-to-peak values in the
amplitude waveform provide an alternative measure, but compar-
isons between peak-to-peak and RMS levels are difficult [96].
Recently, investigators have adopted another so-called Sound
Exposure Level (SEL), which is an alternative measure reflecting the
total acoustic energy received by an organism [13,14]. A final issue of
critical importance for understanding underwater sound as it relates
to fish is the presence of a substantial particle motion component in
the aquatic sound field, along with pressure. Since water is so dense,
particle motion is a component of the sound field at all distances and
fish are adapted to detect this component (see Box 3).
Review Trends in Ecology and Evolution Vol.25 No.7
420
323

Author's personal copy
behavioural and physiological impact of human-generated
sounds among very different vertebrate groups.
Third, it is important to stress that some fundamental
insight into underwater acoustics is critical for a proper
understanding of the problem with noise (Box 2).
For example, the world of fish has been wrongly
assumed to be quiet, as reflected by the title of Jacques
Cousteau’s 1956 movie The Silent World. The supposi-
tion that the underwater world is silent no doubt
arose because sound transmission from water to air
is poor, and because the air-adapted human ear is a
relatively poor receiver underwater. In thinking about
underwater acoustics, it is also important to realize
that aquatic animals often live in a dark or turbid
environment: even a few metres from the animal the
use of vision to gather information becomes restricted. In
contrast, sound is not restricted by low light levels or
objects in the environment, while many aquatic animals,
including all fish, have more or less advanced abilities to
hear (Box 3).
Are there noise-dependent fish distributions?
If anthropogenic noise deters fish, or if noise is bad for fish
survival and reproduction, one might predict lower fish
diversity and density at noisy places. At the moment,
however, there are few studies that indicate such negative
correlations between the presence of noise and the pre-
sence of fish. Some studies report an effect of vessel noise
on fish flight behaviour in the context of population assess-
ments and catch rates for commercially important fish
stocks. For example, horizontal and vertical movements
away from vessels have been reported for Atlantic herring
(Clupea harengus) and Atlantic cod (Gadus morhua)
[17,18], presumably in response to ship noise. Another
example concerns effects of nearby boating noise on
blue-fin tuna (Thunnus thynnus) in large oceanic pens.
In the presence of boat noise, tuna schools were less
coherent than when the noise was not present and indi-
vidual fish often swam independently towards the surface
or the bottom [19]. Fish have also been reported to flee from
seismic shooting areas as inferred from decreased catch
Box 3. Fish ears and hearing abilities
All fish studied to date are able to hear sounds [15,97,98].
They have two sensory systems for detection of water motions:
the inner ear (there is no outer or middle ear) and the lateral line
system. The ear serves to detect sound up to hundreds or even
thousands of Hz (depending on the species), whereas the lateral
line detects low-frequency sound (e.g. <100 Hz), but is generally
considered to be primarily a detector of water motion relative to
the body.
Sound can be thought of in terms of both particle motion and
pressure fluctuations. Sensory hair cells in the inner ear and lateral
line (both of which are very similar to those found in the
mammalian ear) are stimulated by mechanisms that respond to
particle motion and are responsible for converting these motions
to electrical signals that stimulate the nervous system. The lateral
line system is found along both sides of the body and typically
spreads out over the head region where it plays a dominant role in
the detection of water motion and low-frequency sound at short
distances (one or two body lengths). In contrast, the inner ear also
detects sounds of much higher frequencies and from greater
distances (probably via acoustic pressure since particle motion
declines with distance more rapidly).
Different fish species vary in absolute sensitivity and spectral range
of hearing (Figure I), which relates to an auditory detection continuum
based on presence or absence of specially evolved morphological
structures [15,97,98]. Special features that improve the pressure-to-
motion transduction from the swim bladder may involve gas-filled
cavities reaching the inner ear. There may also be a direct mechanical
connection between the swim bladder and the inner ear through a
series of bones (the Weberian apparatus) such as in a large group of
fish species (Otophysi) that includes goldfish (Carassius auratus) and
catfish. Generally speaking, fish hear best within 30–1000 Hz, while
species with special adaptations can detect sounds up to 3000–
5000 Hz. Some exceptional species are sensitive to infrasound or
ultrasound.Figure I. Hearing ranges of selected fish and mammal species, reflecting some of
the typical variety in these taxonomic groups (for reviews see Refs [10,15]). The
vertical dashed lines demarcate the human hearing range in air. Each species has
a more restricted range of peak sensitivity within the species-specific limits (not
indicated). From top-to-bottom, red horizontal bars represent: European eel, a
freshwater species spawning at sea with sensitivity to infrasound; Atlantic cod, a
marine species with ‘average’ hearing abilities; and goldfish, representing many
freshwater fishes with specially evolved hearing abilities. For mammals in blue,
we included Californian sea lion (Zalophus californianus), bottlenose dolphin
(Tursiops truncatus), and fin whale (Balaenoptera physalus). The anthropogenic
noise ranges indicate where the majority of sound sources have most of their
energy, although some human-generated sounds exceed these frequencies. At
the bottom of the figure are frequency ranges of low-frequency (USA), mid-
frequency and high-frequency sonar.
Review Trends in Ecology and Evolution Vol.25 No.7
421
324

Author's personal copy
rates for both long lines and trawler fisheries [20,21].
However, there is also a study with direct observations
on reef fish that remain close to their territories after
exposure to seismic air-gun shooting [22].
In contrast to the little we know about effects of environ-
mental sound on fish behaviour, a good deal is known about
the potential impact of anthropogenic noise on bird beha-
viour. For a long time, declines in avian diversity and
density associated with highways have been attributed
at least partly to traffic noise [23]. The idea was supported
by a study suggesting that a negative effect was dependent
on the spectral overlap between traffic noise and birdsong
[24] and by several studies showing spectral flexibility in
bird species that do well under noisy conditions [6]. How-
ever, the best evidence for a negative impact of anthropo-
genic noise on birds comes from natural areas around
extraction stations associated with the gas and oil industry
[25,26]. Some extraction stations are noisy and others
quiet, and this subdivision is independent of the above-
ground variation in avian habitat characteristics. Con-
sequently, and in contrast to traditional road-impact
studies, the decline in bird breeding density and diversity
found in these studies can be attributed solely to the
impact of noise.
Whether similar results will be found for fish is not
known, but the avian results are highly suggestive of
questions that must be asked for fish, and they even
suggest ways to explore and answer such questions. For
example, it may be possible to investigate the impact of
noise on fish diversity and density by making use of the
maritime gas and oil industry. Similar to the above water
situation with birds, there are offshore platforms that have
high underwater noise levels due to compressor noise and
human activity, while others serve as more silent satel-
lites. Alternatively, freshwater systems, often being more
accessible, can be explored experimentally by using arti-
ficial noise sources in some locations that can be compared
to quiet, control locations. While data on sound conditions
and fish behaviour at these control locations may provide
insight into the potential for soundscape orientation
[15,16], such an experimental set-up would allow for test-
ing an impact on species community and relative densities
dependent on artificial noise levels and specific noise fea-
tures. The impact of anthropogenic noise on dispersal and
passage of migratory fish can be tested in a similar way in
canal and river systems [27,28].
Consequences for fish that remain in noisy waters
Notwithstanding the lack of proper monitoring data, fish
sometimes congregate, seeking shelter or food, at places
with artificially high noise levels. Anecdotal observations
on fish under noisy bridges or near noisy vessels indicate
that adverse effects are not necessarily overt and obvious,
but they do not tell us whether fish experience any negative
consequences related to the noise. For example, several
studies in captive fish have shown an increase in secretion
of the stress hormone cortisol during exposure to white
noise or simulated boat noise [29,30, but see 31]. Other
recent studies on potential indicators of stress in captive
fish report noise-related rises in heart rate [32] and
increased motility related to several blood parameters
reflecting increased muscle metabolism [33]. Although
one must be cautious in extrapolating to free-swimming
fish that may be able to leave areas of high stress, these
findings at least suggest that anthropogenic noise could be
a stressor in natural water bodies.
Noise-dependent stress, like other environmental stres-
sors, might affect growth and reproductive processes [34],
but this has hardly been investigated. A relatively old
study, in which the acoustics of the experiments were
poorly controlled and calibrated, suggested lower egg via-
bility and reduced larval growth rates in noisy fish tanks
compared to more quiet control tanks [35]. A more recent
and better study on rainbow trout (Oncorhynchus mykiss),
exposed to realistic noise levels for fish tanks in an aqua-
culture facility [36] showed no impact on growth, survival,
or susceptibility to disease, even over nine months of
exposure [31]. However, given the very limited number
of species investigated, it is not clear whether one can
extrapolate from captive rainbow trout to other species
that may differ in hearing ability and in the extent they
depend on sound for natural activities.
In addition to an impact on growth or reproduction
related to noise-determined physiological stress, anthro-
pogenic noisemay also affect populations in amore indirect
way. Data on birds has shown that individuals that vary in
reproductive abilities, related to age, experience, or size,
may not be evenly distributed over noisy and quiet areas of
otherwise suitable habitat [37,38]. The relative absence of
more experienced and typically more productive males in
noisy territories means that habitat productivity for these
species diminished beyond the effect of a reduction in
number of territory holders. These results may be relevant
to fish since many species are territorial and have explicit
age-dependent size classes varying in productivity [39].
However, so far we lack any study looking at distribution of
size classes relative to noise levels.
Population productivity of noisy areas might not only be
affected by lower numbers or lower-quality individuals, but
might also decline due to lowered reproductive efficiency.
Data on frogs has shown, for example, that anthropogenic
noise may either increase or decrease calling activities
[40,41], with possible fitness consequences related to
increased energetic or predation costs or decreased mating
success. While there are no similar data yet for free-living
fish, a relatively old study reports on actual interruption of
spawning in roach (Rutilus rutilus) and rudd (Scardinius
erythrophthalmus) by an approaching fast-moving power-
boat [42]. Although obviously more data are required, it
should be realized that the mere presence of fish in noisy
waters does not necessarily mean that they are part of a
reproductively active population. A better insight can be
generated through studies on the impact of anthropogenic
noise on the rate and nature of reproductive behaviour and
acoustic signalling in free-living fish.
Masking of acoustic communication
A specific noise impact that could lead to lower reproduc-
tive efficiency for fish is masking of communicative sounds.
Over 800 species from 109 families are known to produce
sounds, while many more are suspected to do so [43–45].
The sounds that fish produce are, in most cases, broadband
Review Trends in Ecology and Evolution Vol.25 No.7
422
325

Author's personal copy
signals with most energy <500 Hz. Distinct variation in
spectral and temporal characteristics can be related to
species [46,47], populations [48], and gender [49]. Further-
more, graded variation in pitch and duration can be corre-
lated with size [47,50,51] or seasonal fluctuations in
motivation [52]. Such acoustic variation means that
sounds can serve as information carriers in acoustic com-
munication among fish [43,44,53]. That fish communicate
acoustically becomes evident from the contexts in which
the sounds are produced, such as during agonistic inter-
action in territorial fights, when competing for food, or
when being attacked by a predator [54–57].
However, the most common context in which fish are
known to produce sounds is in spawning aggregations
[58,59] and courtship interactions [60,61]. Although often
not explicitly demonstrated, sounds could serve in aggre-
gating reproductive groups, in which they may contribute
to synchronization of male and female gamete release [62].
At a more individual level, sounds could attract potential
mates to a specific place for courtship or egg shedding [63].
Recent experimental evidence has unequivocally shown
that sounds can modify mate choice decisions in fish.
Female haplochromine cichlids (Pundamilia nyererei) pro-
videdwith a choice between twomales,matched in size and
colour, preferred to interact with the male associated with
playback of conspecific sounds [47]. An acoustic impact on
sexual preferences was also inferred for Atlantic cod in
which the male drumming muscle mass was correlated
with mating success [64]. Although these examples
strongly suggest acoustic communication occurs in fish,
there is a substantial lack of insight into the distribution
and nature of the phenomenon across species and across
habitats (from shallow waters to the deep sea).
Clearly, however, if fish sounds serve a communicative
function in a reproductive context, problems of detection
and recognition due to the presence of anthropogenic noise
[65–67] could have fitness consequences. It should be clear
that fish have not evolved in a quiet environment, and
natural noise levels can also become loud, for example
during fish choruses [58,59]. Nevertheless, playback of
field recordings under laboratory conditions, at natural
spectral content and level, confirmed experimentally that
noise generated by a cabin-cruiser type of boat can signifi-
cantly increase detection threshold levels for conspecific
sounds in both brown meagre drums (Sciaena umbra) and
Mediterranean damselfish (Chromis chromis) [68]. Based
Figure 2. (a) Spatial distribution of sender communication space for uniformly distributed right whales listening to a 200 Hz conspecific call from a male individual in the
centre of the space in the presence of noise from a ship with a source level of 172 dB re 1 mPa. Blue dots indicate receivers for which the whales are likely to detect the sound
produced by the focal individual, while red dots indicate receivers for which the noise of the ship exceeds the signal beyond detectable levels. Left: the ship is approaching
the calling whale from the northeast causing a 6% decrease in the sender’s communication area. Right: the ship is within 2 km to the northwest of the caller causing a 97%
decrease in the sender’s communication area [87]. (b) Loss of communication range due to a rise in anthropogenic noise relative to historical conditions. Received sound
levels for 20 Hz fin whale calls are depicted against a background of natural noise levels (in blue), yielding an audible range of 1000 km, and elevated noise levels due to
anthropogenic influences (in red), leading to a reduced audible range of only 10 km. The graph is modified, with permission, after a model by Peter Tyack. He incorporated
realistic signal attenuation during propagation through the ocean in his model and assumed a 90 dB re 1 mPa noise floor for the pre-industrial ocean, currently elevated by
20 dB from shipping (which is still a conservative estimate likely to be met at many places).
Review Trends in Ecology and Evolution Vol.25 No.7
423
326

Author's personal copy
on these measurements, passing boats were inferred to
reduce detection distances under field conditions by up to
100 times.
Masking leading to a reduction in detection distance, or
the so-called active space, can lead to failure in mate
attraction. Although we lack any empirical evidence
demonstrating this for fish, data for birds and frogs can
inform our views on the potential for masking effects. Male
ovenbirds (Seiurus aurocapillus) near gas extraction
stations experienced a decline in mate attraction rates
when trying to convey their acoustic message in the pre-
sence of a noisy compressor [38]. Another consequence of
masking could be that sexual signals are still detected, but
that specific acoustic cues in the signals that are important
for mate selection get lost. In fish, allometric correlations
with acoustic features provide ample opportunity for
female mate selection that targets male size [47,50,51].
Although no data are available yet on acoustic preferences
of female fish for sounds of largemales over sounds of small
males, the phenomenon has been tested, confirmed and
shown to be noise-level dependent in frogs [69,70]. Typi-
cally, large male frogs are acoustically more attractive to
females than small ones, but this advantage seems to be
lost under noisy conditions [71]. Apparently, noisy con-
ditions can interfere with mate selection, while suboptimal
pairing could negatively affect individual reproductive
success and thereby affect whole populations.
It is not only essential to assess signal-to-noise
threshold levels for an impact of anthropogenic noise on
detection and recognition of relevant sounds. We also need
insight into the potential scale of impact of such masking
effects under natural conditions. Some calculations exist
for active space shifts due to anthropogenic noise in frogs
[72] and fish [68], and there are some especially insightful
studies for marine mammals that may conceptually well
apply to fish. For example, baleen whales (Mysticetes)
produce low frequency sounds that may travel for hun-
dreds of kilometres, and it has been suggested that these
sounds may be used for communication and orientation
[73,74]. Figure 2 illustrates at what distances such calls of
North Atlantic right whales (Eubalaena glacialis) are still
audible in the presence of anthropogenic noise from an
approaching ship (a). Data are also shown for fin whales
(Balaenoptera physalus) from historical to current ocean
noise levels (b). It is important to realize that the active
spacemay also be affected in a similar way for any sound in
the auditory scene that may serve as a general orientation
cue, for example in making settlement decisions such as
suggested to be the case in coral reef fish [75] and crab
larvae [76].
Noise-impact on predator–prey relationships
Hearing and localizing of sounds can also be advantageous
for specific purposes such as locating prey and avoiding
predators. For example, although sharks and other carti-
laginous fishes probably have relatively poor hearing sen-
sitivity compared to other fishes, they were reported to
approach irregularly pulsed broadband sounds, which
could be indicative for the presence of struggling prey
[77]. Similarly, surface-feeding fish can localize prey accu-
rately by listening to the surface waves produced when
prey fall into the water [78]. Some bottom-feeding fish such
as peacock cichlids (Aulonocara) are even able to sense the
sound of prey submerged in the sediment [79]. In other
species, broad hearing bandwidths have been correlated
with predator avoidance. For example, some herring
species (Clupeidae) of the genus Alosa are capable of
detecting ultrasound (up to 180 kHz), which could allow
detection and avoidance of echo-locating whales [80,81].
Field studies on European eel (Anguilla anguilla) and
juvenile salmonids showed that they are able to detect
and avoid infrasound (<20 Hz), which could allow them to
sense the hydrodynamic noise generated by approaching
predators [82,83]. Data are completely lacking in fish, but
based on insight from very few and very different animal
species, we believe that anthropogenic masking effects on
predator–prey relationships could be widespread.
Predators that use sound for hunting (as might occur
especially in dark or turbid environments) can be restricted
by noisy conditions through lower availability of suitable
foraging areas and a lower catching efficiency. An instruc-
tive mammalian example of this comes from a study on
greater mouse-eared bats (Myotis myotis) which use subtle
rustling sounds to locate their prey. Captive bats tended to
avoid the noisy side of a two-compartment flight room, and
also showed lower hunting efficiency when they did enter
the noisy compartment [84]. Similarly, prey that use their
ears to scan for predators can be negatively affected by
anthropogenic noise. In a study on chaffinches (Fringilla
coelebs), a species that is potential prey for cats and
raptors, foraging birds increased the amount of time that
they were upright and scanning visually for predators in
high noise conditions compared to when it was quieter and
they could listen for predators [85]. This finding was
interpreted as a compromise on food intake rate to com-
pensate for finches relying less on auditory detection of
approaching predators. In line with this interpretation, a
recent study on terrestrial hermit crabs (Coenobita clypea-
tus) reported a noise-dependent decrease in efficiency with
respect to predator detection (represented by a walking
person) [86]. These three experimental studies, while not
for fish, clearly highlight the potential concerns for the
effects of anthropogenic noise on predators as well as prey,
and the need for parallel experiments with fish.
Conclusions
It has become clear that sound can be important to fish and
that a rise in artificial noise levels underwater may have
negative consequences for individuals as well as popu-
lations. Although sonar, piling and explosions typically
attract most attention, it is reasonable to argue that the
greater impact on fish will be from less intense sounds that
are of longer duration and that can potentially affect whole
ecosystems. Thus, our goal in this review has been to
outline the potential impact of sound in four main areas
related to moderate but widespread anthropogenic noise
conditions (Box 4). The current lack of insight impedes our
ability to make predictions about the effects of anthropo-
genic noise on fish and we have argued that we could gain
such insight using data and methodology from studies on
various terrestrial animals. We believe our review strongly
suggests that the investigations neededmost include those
Review Trends in Ecology and Evolution Vol.25 No.7
424
327

Author's personal copy
of noise-dependent distribution and reproduction as well
as investigations of masking of sounds used for communi-
cation, orientation, or detection of predators and prey.
Such studies in the aquatic environment are likely to be
an order of magnitude harder than for similar studies in
air, for example due to human observers having difficulty
in seeing aquatic animals over large areas and localizing
sounds underwater. Nevertheless, we expect experimental
approaches in the laboratory and in the field to yield
critical insights. There is no doubt that this will be a
challenging and long-term enterprise, but studies on the
impact of pesticides on birds and the conservation
measures derived from these have also curbed the pro-
phesy of a ‘silent spring’ for birds. We believe the investi-
gations we have proposed could do the same for fish, and
that these provide a better alternative to waiting to see
what happens to fish in the dim future of a more and more
‘noisy spring’.
References1 Andrew, R.K. et al. (2003) Ocean ambient sound: Comparing the 1960s
with the 1990s for a receiver off the Californian coast. Acoust. Res. Lett.
Onl. 3, 65–70
2 McDonald, M.A. et al. (2006) Increases in deep ocean ambient noise in
the Northeast Pacific west of San Nicolas Island, California. J. Acoust.
Soc. Am. 120, 711–718
3 Jackson, J.B.C. et al. (2001) Historical overfishing and the recent
collapse of coastal ecosystems. Science 293, 629–638
4 Munday, P.L. (2004) Habitat loss, resource specialization, and
extinction on coral reefs. Global Change Biol. 10, 1642–1647
5 van der Oost, R. et al. (2003) Fish bioaccumulation and biomarkers in
environmental risk assessment: a review. Environ. Toxicol. Phar. 13,
57–149
6 Slabbekoorn, H. and Ripmeester, E.A.P. (2008) Birdsong and
anthropogenic noise: implications and applications for conservation.
Mol. Ecol. 17, 72–83
7 Barber, J.R. et al. (2009) The costs of chronic noise exposure for
terrestrial organisms. Trends Ecol. Evol. 25, 180–189
8 Richardson, W.J. et al. (1998) Marine Mammals and Noise, Academic
Press
9 National Research Council (NRC) (2003) Ocean Noise and Marine
Mammals, National Academy Press
10 Southall, B.L. et al. (2007) Marine mammal noise exposure criteria:
initial scientific recommendations. Aquatic Mammals 33, 412–522
11 Popper, A.N. et al. (2004) Anthropogenic sound: Effects on the behavior
and physiology of fishes. Mar. Tech. Soc. J. 37, 35–40
12 Ladich, F. (2008) Sound communication in fishes and the influence of
ambient and anthropogenic noise. Bioacoustics 17, 35–37
13 Popper, A.N. and Hastings, M.C. (2009) The effects of human-
generated sound on fish. Integr. Zool. 4, 43–52
14 Popper, A.N. andHastings, M.C. (2009) Effects of pile driving and other
anthropogenic sounds on fish: Part 1–critical literature review. J. Fish
Biol. 75, 455–489
15 Fay, R.R. and Popper, A.N. (2000) Evolution and hearing in
vertebrates: The inner ears and processing. Hear. Res. 149, 1–10
16 Slabbekoorn, H. and Bouton, N. (2008) Soundscape orientation: a new
field in need of sound investigation. Anim. Behav. 76, e5–e8
17 Vabø, R. et al. (2002) The effect of vessel avoidance of wintering
Norwegian spring-spawning herring. Fish. Res. 58, 59–77
18 Handegard, N.O. et al. (2003) Avoidance behavior in cod, Gadus
morhua, to a bottom trawling vessel. Aqua. Liv. Res. 16, 265–270
19 Sara, G. et al. (2007) Effect of boat noise on the behaviour of bluefin
tunaThunnus thynnus in theMediterranean Sea.Mar. Ecol.-Prog. Ser.
331, 243–253
20 Hirst, A.G. and Rodhouse, P.G. (2000) Impacts of geophysical seismic
surveying on fishing success. Rev. Fish Biol. Fisheries 10, 113–118
21 Slotte, A. et al. (2004) Acoustic mapping of pelagic fish distribution and
abundance in relation to a seismic shooting area off the Norwegian
west coast. Fish Res. 67, 143–150
22 Wardle, C.S. et al. (2001) Effects of seismic air guns on marine fish.
Cont. Shelf Res. 21, 1005–1027
23 Reijnen, R. and Foppen, R. (2006) Impact of road traffic on breeding
bird populations. In The Ecology of Transportation: ManagingMobility
for the Environment (Davenport, J. and Davenport, J.L., eds), pp. 255–
274, Springer-Verlag
24 Rheindt, F.E. (2003) The impact of roads on birds: does song frequency
play a role in determining susceptibility to noise pollution? J. Ornithol.
144, 295–306
25 Bayne, E.H. et al. (2008) Impacts of chronic anthropogenic noise from
energy-sector activity on abundance of songbirds in the boreal forest.
Conserv. Biol. 22, 1186–1193
26 Francis, C.D. et al. (2009) Noise pollution changes avian communities
and species interactions. Curr. Biol. 19, 1415–1419
27 Popper, A.N. and Carlson, T.J. (1998) Application of sound and other
stimuli to control fish behaviour. Trans. Am. Fish. Soc. 127, 673–707
28 Schilt, C.R. (2006) Developing fish passage and protection at
hydropower dams. Appl. Anim. Behav. Sci. 104, 295–325
29 Smith, M.E. et al. (2004) Noise-induced stress response and hearing
loss in goldfish (Carassius auratus). J. Exp. Biol. 207, 427–435
30 Wysocki, L.E. et al. (2006) Ship noise and cortisol secretion in European
freshwater fishes. Biol. Conserv. 128, 501–508
31 Wysocki, L.E. et al. (2007) Effects of aquaculture production noise on
hearing, growth and disease resistance of rainbow trout,Oncorhynchus
mykiss. Aquaculture 272, 687–697
32 Graham, A.L. and Cooke, S.J. (2008) The effects of noise disturbance
from various recreational boating activities common to inland waters
on the cardiac physiology of a freshwater fish, the largemouth bass
(Micropterus salmoides). Aquatic Conserv: Mar. Freshw. Ecosyst. 18,
1315–1324
33 Buscaino, G. et al. (2010) Impact of an acoustic stimulus on themotility
and blood parameters of European sea bass (Dicentrarchus labrax L.)
and gilthead sea bream (Sparus aurata L.). Mar. Environ. Res. 69,
136–142
Box 4. Major targets for future research
More field studies are needed on the role of sound in the life of
fishes in general, especially with respect to the use of sounds for
general orientation purposes (i.e. soundscape orientation [15,16]).
Furthermore, while data are required on the effects of very high
intensity, relatively transient sounds as well as on the effects of
lower intensity, but more long-term sounds, the greatest impact on
most fish clearly comes from the latter sources. Thus, studies of
such sounds are most urgently needed. More specifically, the kinds
of studies especially needed are those that focus on questions
related to whether fish are affected behaviourally or physiologically
by the global rise in noise levels or specific anthropogenic sounds
and how mitigating measures could help to limit such impact.
Insight showing that some species are affected by sounds but others
are not, that some sounds are detrimental but others are not, or that
noise causes trouble during some periods but not during others, are
only some examples of how proper investigations may yield
opportunities for mitigation with significant ecological implications
at relatively low cost. We therefore advocate more studies in four
main domains of research which are likely to provide critical insight
into key questions raised in this article:
� Noise-dependent fish distributions. Are there differences in how
fish are distributed in quiet and noisy environments, and how
might these distributions vary depending on sound source,
species, fish age, and other physical and biological factors?
� Reproductive consequences of noisy conditions. Is there a
negative influence of anthropogenic noise on reproductive
success, by causing physiological stress, by restricting mate
finding, or by keeping fish from preferred spawning sites?
� Masking effects on communicative sounds. Does the presence of
masking sounds of different types and intensities impact the
ability of fish to communicate acoustically or use the acoustic
‘soundscape’ to learn about the environment?
� Masking effects on predator–prey relationships. Does the pre-
sence of masking noise affect the ability of fish to find prey (get
food) or detect the presence of predators (become food)?
Review Trends in Ecology and Evolution Vol.25 No.7
425
328

Author's personal copy
34 Pickering, A.D. (1993) Growth and stress in fish production.
Aquaculture 111, 51–63
35 Banner, A. and Hyatt, M. (1973) Effects of noise on eggs and larvae of
two estuarine fishes. Trans. Am. Fish Soc. 102, 134–136
36 Bart, A.N. et al. (2001) Underwater ambient noise measurements in
aquaculture systems: a survey. Aquac. Eng. 25, 99–110
37 Reijnen, R. and Foppen, R. (1994) The effects of car traffic on breeding
bird populations inwoodland. 1. Evidence of reduced habitat quality for
willowwarblers (Phylloscopus trochilus) breeding close to a highway. J.
Appl. Ecol. 31, 85–94
38 Habib, L. et al. (2006) Chronic industrial noise affects pairing success
and age structure of ovenbirds Seiurus aurocapilla. J. Appl. Ecol. 44,
176–184
39 Savage, V.M. et al. (2004) Effects of body size and temperature on
population growth. Am. Nat. 163, 429–441
40 Sun, J.W.C. and Narins, P.A. (2005) Anthropogenic sounds
differentially affect amphibian call rate. Biol. Conserv. 121, 419–427
41 Kaiser, K. and Hammers, J.L. (2009) The effect of anthropogenic noise
on male advertisement call rate in the neotropical treefrog,
Dendropsophus triangulum. Behaviour 146, 1053–1069
42 Boussard, A. (1981) The reactions of roach (Rutilus rutilus) and rudd
(Scardinius erythrophthalmus) to noises produced by high speed
boating. In Proceedings of the 2nd British Freshwater Fisheries
Conference, pp. 188–200
43 Tavolga, W.N. (1971) Sound production and detection. In Fish
Physiology, Vol. V (Hoar, W.S. and Randall, D.J., eds), pp. 135–205,
Academic Press
44 Ladich, F. (2004) Sound production and acoustic communication. In
The Senses of Fish: Adaptations for the Reception of Natural Stimuli
(von der Emde et al., eds),pp. 210–230, Kluwer Academic Publishers &
Narosa Publishing House
45 Kasumyan, A.O. (2008) Sound and sound production in fishes. J.
Ichthyol. 11, 981–1030
46 Kihslinger, R.L. and Klimley, A.P. (2002) Species identity and the
temporal characteristics of fish acoustic signals. J. Comp. Psychol. 116,
210–214
47 Verzijden, M.N. et al. (2010) Sounds of male Lake Victoria cichlids vary
within and between species and affect female mate preferences. Behav.
Ecol. 21, 548–555
48 Parmentier, E. et al. (2005) Geographical variation in sound production
in the anemonefish Amphiprion akallopisos. Proc. Biol. Sci. 272, 1697–
1703
49 Ueng, J.P. et al. (2007) Sexual differences in the spawning sounds of the
Japanese croaker Argyrosomus japonicus (Sciaenidae). Zool. Stud. 46,
103–110
50 Myrberg, A.A. et al. (1993) The sound of bicolor damselfish
(Pomacentrus partitus) - predictors of body size and a spectral basis
for individual recognition and assessment. J. Acoust. Soc. Am. 9, 3067–
3070
51 de Jong, K. et al. (2007) Azorean rock-pool blennies produce
size-dependent calls in a courtship context. Anim. Behav. 74, 1285–
1292
52 Maruska, K.P. andMensinger, A.F. (2009) Acoustic characteristics and
variations in grunt vocalizations in the oyster toadfish Opsanus tau.
Environ. Biol. Fishes 84, 325–337
53 Myrberg, A.A. (1981) Sound communication and interception in fishes.
In Hearing and Sound Communication in Fishes (Tavolga, W.N. et al.,
eds), pp. 395–426, Springer-Verlag
54 Amorim,M.C.P. and Neves, A.S.M. (2008)Male painted gobies vocalise
to defend territories. Behaviour 145, 1065–1083
55 Myrberg, A.A. (1997) Sound production by a coral reef fish
(Pomacentrus partitus): evidence for a vocal territorial ‘‘keep-out’’
signal. Bull. Mar. Sci. 60, 1017–1025
56 Wilson, B. et al. (2004) Pacific and Atlantic herring produce burst pulse
sound. Proc. R. Soc. B-Biol. Sci. 271, s95–s97
57 Wisenden, B.D. et al. (2008) Sound the alarm: learned association of
predation risk with novel auditory stimuli by fathead minnows
(Pimephales promelas) and glowlight tetras (Hemigrammus
erythrozonus) after single simultaneous pairings with conspecific
chemical alarm cues. Environ. Biol. Fishes 81, 141–147
58 Saucier, M.H. and Baltz, D.M. (1993) Spawning site selection by
spotted seatrout, Cynoscion nebulosus, and black drum, Pogonias
cromis, in Louisiana. Environ. Biol. Fishes 36, 257–272
59 Aalbers, S.A. (2008) Seasonal, diel, and lunar spawning periodicities
and associated sound production of white seabass (Atractoscion
nobilis). Fishery Bull. 106, 143–151
60 Myrberg, A.A. et al. (1986) Sound production by males of a coral reef
fish (Pomacentrus partitus): its significance to females. Anim. Behav.
34, 913–923
61 McKibben, J.R. and Bass, A.H. (1998) Behavioral assessment of
acoustic parameters relevant to signal recognition and preference in
a vocal fish. J. Acoust. Soc. Am. 104, 3520–3533
62 Myrberg, A.A. and Lugli, M. (2006) Reproductive behavior and
acoustical interactions. In Communication in Fish (Ladich et al.,
eds), pp. 149–176, Science Publishers
63 Rollo, A. et al. (2006) Attraction and localization of round goby
(Neogobius melanostomus) to conspecific calls. Behaviour 144, 1–21
64 Rowe, S. et al. (2008) Morphological and behavioural correlates of
reproductive success in Atlantic cod Gadus morhua. Mar. Ecol.-
Prog. Ser. 354, 257–265
65 Brumm, H. and Slabbekoorn, H. (2005) Acoustic communication in
noise. Adv. Stud. Behav. 35, 151–209
66 Wysocki, L.E. and Ladich, F. (2005) Hearing in fishes under noise
conditions. JARO-J. Assoc. Res. Oto. 6, 28–36
67 Vasconcelos, R.O. et al. (2007) Effects of ship noise on the
communication signals in the Lusitanian toadfish. J. Exp. Biol. 210,
2104–2112
68 Codarin, A. et al. (2009) Effects of ambient and boat noise on hearing
and communication in three fish species living in a marine protected
area (Miramare, Italy). Mar. Pollut. Bull. 58, 1880–1887
69 Schwartz, J.J. (1993) Male calling behavior, female discrimination and
acoustic interference in the neotropical treefrog Hyla microcephala
under realistic acoustic conditions. Behav. Ecol. Sociobiol. 32, 401–414
70 Marquez, R. and Bosch, J. (1997) Female preference in complex
acoustical environments in the midwife toads Alytes obstetricans
and Alytes cisternasii. Behav. Ecol. 8, 588–594
71 Wollerman, L. andWiley, R.H. (2002) Background noise from a natural
chorus alters female discrimination of male calls in a neotropical frog.
Anim. Behav. 63, 15–22
72 Parris, K.M. et al. (2009) Frogs call at a higher pitch in traffic noise.
Ecol. Soc. 14, 25
73 Stafford, K.M. et al. (1998) Long-range acoustic detection and
localization of blue whale calls in the north-east Pacific. J. Acoust.
Soc. Am. 104, 3616–3625
74 Clark, C.W. and Ellison, W.T. (2004) Potential use of low-frequency
sound by baleen whales for probing the environment: Evidence from
models and empirical measurements. In Echolocation in Bats and
Dolphins (Thomas, J.A. et al., eds), pp. 564–581, University of
Chicago Press
75 Simpson, S.D. et al. (2005) Homeward sound. Science 308, 221
76 Stanley, J.A. et al. (2010) Induction of settlement in crab megalopae by
ambient underwater reef sound. Behav. Ecol. 21, 113–120
77 Myrberg, A.A. (2001) The acoustical biology of elasmobranchs.
Environ. Biol. Fishes 60, 31–45
78 Hoin-Radkovsky, I. et al. (1984) Determination of source distance in the
surface feeding fish Pantodon buchholzi Pantodontidae. Anim. Behav.
32, 840–851
79 Konings, A. (2001) Malawi Cichlids in their Natural Habitat, Cichlid
Press
80 Popper, A.N. et al. (2004) Response of clupeid fish to ultrasound: a
review. ICES - J. Mar. Sci. 61, 1057–1061
81 Dokseater, L. et al. (2009) Behavioral responses of herring (Clupea
harengus) to 1-2 and 6-7 kHz sonar signals and killer whale feeding
sounds. J. Acoust. Soc. Am. 125, 554–564
82 Sand, O. et al. (2000) Avoidance responses to infrasound in downstream
migrating European silver eels, Anguilla anguilla. Environ. Biol.
Fishes 57, 327–336
83 Knudsen, F.R. et al. (1997) Infrasound produces flight and avoidance
response in Pacific juvenile salmonids. J. Fish Biol. 51, 824–829
84 Schaub, A. et al. (2008) Foraging bats avoid noise. J. Exp. Biol. 211,
3174–3180
85 Quinn, J.L. et al. (2006) Noise, predation risk compensation and
vigilance in the chaffinch Fringilla coelebs. J. Avian Biol. 37, 601–608
86 Chan, AAY-H. et al. (2010) Anthropogenic noise affects risk assessment
and attention: the distracted prey hypothesis. Biol. Lett. U. K. DOI:
10.1098/rsbl.2009.1081
Review Trends in Ecology and Evolution Vol.25 No.7
426
329

Author's personal copy
87 Clark, C.W. et al. (2009) Acoustic masking in marine ecosystems:
intuitions, analysis and implications.Mar. Ecol.-Prog. Ser. 395, 201–222
88 Hatch, L. et al. (2008) Characterising the relative contributions of large
vessels to total ocean noise fields: a case study using the Gerry E
Studds Stellwagen BankNationalMarine Sanctuary.Environ.Manag.
42, 735–752
89 Amoser, S. et al. (2004) Noise emission during the first powerboat race
in an Alpine lake and potential impact on fish communities. J. Acoust.
Soc. Am. 116, 3789–3797
90 Wahlberg, M. and Westerberg, H. (2005) Hearing in fish and their
reactions to sounds from offshore windfarms.Mar. Ecol.-Prog. Ser. 288,
295–309
91 de Jong, C.A.F. et al. (2008) Underwater radiated noise due to the
piling for the Q7 Offshore Windpark. Proc. ECUA 2008 (Acoustics’08)
pp. 117–122
92 Kikuchi, R. (2010) Risk formulation for the sonic effects of offshore
wind farms on fish in the EU region. Mar. Pollut. Bull. 60, 172–177
93 Sund, O. (1935) Echo sounding in fishery research. Nature 135, 953
94 Chapman, D.M.F. and Ellis, D.D. (1998) The elusive decibel: thoughts
on sonar and marine mammals. Canadian Acoustics 26, 29–31
95 Finfer, D.C. et al. (2008) Issues relating to the use of 61.5 conversion
factor when comparing airborne and underwater anthropogenic noise
levels. Appl. Acoust. 69, 464–471
96 Madsen, R.T. (2005) Marine mammals and noise: Problems with root
mean square sound pressure levels for transients. J. Acoust. Soc. Am.
117, 3952–3957
97 Kasumyan, A.O. (2005) Structure and function of the auditory system
in fishes. J. Ichthyol. 45, S223–S270
98 Popper, A.N. and Fay, R.R. (2010) Rethinking sound detection by
fishes. Hear. Res. DOI: 10.1016/j.heares.2009.12.023
Review Trends in Ecology and Evolution Vol.25 No.7
427
330

Acknowledgements
Much of the work presented in this thesis bases on data from the PALAOA acoustic
observatory. I wish to thank Holger Klinck, the AWI logistics department, the Neumayer
overwintering teams 2005-2010, FIELAX and Reederei Laeisz for their support in setting
up and maintaining PALAOA. The XBAT software developed by Harold Figueroa
(Bioacoustics Research Program, Cornell University) provided an indispensable tool for
the automated analysis of the PALAOA data. Furthermore, I also thank Prof. Dr.
Wilhelm Hagen from the University of Bremen for support throughout my PhD.
Many thanks to Olaf Boebel and Sofie Van Parijs for their continuous trust, inspiration,
support and guidance throughout my PhD. Olaf, thanks for the many fruitful discussions
we had, it is a pleasure working with you and to be part of the AWI’s Ocean Acoustics
Lab. I learned a lot from you and hope to continue to do so in the future. Sofie, thank you
for being my ‘eagle’*, in scientific point of view, by being a supercoach teaching me so
many things in bio-acoustic research, but also in being a friend, providing support and
comfort when I most needed it.
Many thanks also to Lars Kindermann for his work and care for PALAOA, inspiring
ideas, sharing enthusiasm and seemingly inexhaustible know-how on acoustics and for
being a great colleague. Horst Bornemann was in my Phd committee and provided advice
and support in Bremerhaven, but also during the work in the field. Horst, thanks for all
your help and support, company, laughs, coffee and cake. With Joachim Ploetz I share his
passion for nature and working in the field. I enjoyed our many conversations, sharing of
ideas and the amazingly good (and ‘politically correct’) game (roe deer and wild boar) he
brought me from the Harz. Many thanks also to Elke Burkhardt for support, maintaining
a great marine mammal literature data base, and for relaxing coffee breaks. Daniel
Zitterbart and Annette Bombosch, thanks for being great fellow-Phds and support during
the last phase of my PhD. Daniel thanks also for your support and enthusiasm during the
2008/2009 field campaign. Cornelia Kreiss worked with me in the field conducting the
* How the wren became king, Aesop 620-564 BC
331

playback experiments on Weddell seal mother-pup pairs and helped deploy and maintain
the PALAOA-S recorders on the fast ice in Atka Bay. Thanks, Corni-copepodi for your
great help in the field, moral support, company in our tiny orange living-container,
delicious home-baked gluten-free cookies and for being a friend. Many thanks also to all
the other students who helped with analyses of acoustic data: Rosa Wilm, Svenja
Zakrzewski, Taryn Overton, Anna-Maria Seibert and Antje Funcke. I enjoyed your
company and enthusiasm.
I furthermore would like to thank two people who are geographically more distant, but
with whom I feel connected through work and thoughts. During my stay in Woods Hole
in spring 2009, Denise Risch shared her house, car, computer and office with me. We
already had a connection through Sofie and the harp seal work, but had never met until
spring 2009. I much enjoyed the many discussions and conversations we had, figureing
out the principles of automated sound detection, and our reflections on love and life in
general, thanks for everything, Denise.
With Peter Corkeron (NOAA Woods Hole, USA) I worked during the harp seal project
and an earlier killer whale project in Tysfjord, Norway. I enjoyed working with him a lot
and admire him for his personality and work, the latter of which also provided an
important scientific base for many aspects of this thesis. Thanks, Peter.
I thank my friends for support, laughs, visits to Bremerhaven and red wine when I needed
it the most. Chris (Trierweiler) and Esther (Bouma), we met and became friends when we
started our studies and will all finalize our PhD work this year – great timing and a good
reason for a feestje! Chris, although the Arctic and Antarctic are amazing places to work,
I’ll never forget our first fieldwork-adventure on the isle of Schier in winter which
sparked the love for (extreme..?) field work in both of us.
Manymany thanks for everything (and the design of the thesis cover!) to my parents,
Rina Van Nuland and Jan Van Opzeeland who decided to move to the Arctic (65° 32�
N, 14° 8� E) in 2007, a long way, but at least visits were great for thesis-inspiration and
Robert and I never have to miss out on white Christmases anymore. Lastly, my love and
thanks to Robert Huisman for being my muse and willow in the PhD-wind (or -storm,
especially in the finalizing phase), thanks for everything, lief.
332

Die "Berichte zur Polar- und Meeresforschung" (ISSN 1866-3192) werden beginnend mit dem Heft Nr. 569 (2008) ausschließlich elektronisch als Open-Access-Publikation herausgegeben. Ein Verzeichnis aller Hefte einschließlich der Druckausgaben (Heft 377-568) sowie der früheren "Berichte zur Polarforschung (Heft 1-376, von 1982 bis 2000) befindet sich im Internet in der Ablage des electronic Information Center des AWI (ePIC) unter der URL http://epic.awi.de. Durch Auswahl "Reports on Polar- and Marine Research" auf der rechten Seite des Fensters wird eine Liste der Publikationen in alphabetischer Reihenfolge (nach Autoren) innerhalb der absteigenden chronologischen Reihenfolge der Jahrgänge erzeugt. To generate a list of all Reports past issues, use the following URL: http://epic.awi.de and select the right frame to browse "Reports on Polar and Marine Research". A chronological list in declining order, author names alphabetical, will be produced, and pdf-icons shown for open access download. Verzeichnis der zuletzt erschienenen Hefte: Heft-Nr. 606/2010 — "The Expedition of the Research Vessel 'Polarstern' to the Antarctic in 2008 (ANT-XXIV/3)", edited by Eberhard Fahrbach and Hein de Baar Heft-Nr. 607/2010 — "The Expedition of the Research Vessel 'Polarstern' to the Arctic in 2009 (ARK-XXIV/2)", edited by Michael Klages Heft-Nr. 608/2010 — "Airborne lidar observations of tropospheric Arctic clouds", by Astrid Lampert Heft-Nr. 609/2010 — "Daten statt Sensationen - Der Weg zur internationalen Polarforschung aus einer deutschen Perspektive", by Reinhard A. Krause Heft-Nr. 610/2010 — "Biology of meso- and bathypelagic chaetognaths in the Southern Ocean", by Svenja Kruse Heft-Nr. 611/2010 — "Materialparameter zur Beschreibung des zeitabhängigen nichtlinearen Spannungs – Verformungsverhaltens von Firn in Abhängigkeit von seiner Dichte", by Karl-Heinz Bässler Heft-Nr. 612/2010 — "The Expedition of the Research Vessel 'Polarstern' to the Arctic in 2009 (ARK-XXIV/1)", edited by Gereon Budéus Heft-Nr. 613/2010 — "The Expedition of the Research Vessel 'Polarstern' to the Antarctic in 2009 (ANT-XXV/3 - LOHAFEX)", edited by Victor Smetacek and Syed Wajih A. Naqvi Heft-Nr. 614/2010 — "The Expedition of the Research Vessel 'Polarstern' to the Antarctic in 2009 (ANT-XXVI/1)", edited by Saad el Naggar and Andreas Macke Heft-Nr. 615/2010 — "The Expedition of the Research Vessel 'Polarstern' to the Arctic in 2009 (ARK-XXIV/3)", edited by Wilfried Jokat Heft-Nr. 616/2010 — "The Expedition of the Research Vessel 'Polarstern' to the Antarctic in 2009 (ANT-XXV/4)", edited by Christine Provost Heft-Nr. 617/2010 — "The Expedition of the Research Vessel 'Polarstern' to the Amundsen Sea, Antarctica, in 2010 (ANT-XXVI/3)", edited by Karsten Gohl Heft-Nr. 618/2010 — "Sozialhistorische Studie zur Polarforschung anhand von deutschen und österreich-ungarischen Polarexpeditionen zwischen 1868-1939", by Ursula Rack Heft-Nr. 619/2010 — "Acoustic ecology of marine mammals in polar oceans", by Ilse Van Opzeeland