The Three-dimensional Structure of a Superantigen-like Protein, SET3, from a Pathogenicity Island of...
8
The Three-dimensional Structure of a Superantigen-like Protein, SET3, from a Pathogenicity Island of the Staphylococcus aureus Genome* Received for publication, April 23, 2002, and in revised form, June 17, 2002 Published, JBC Papers in Press, June 24, 2002, DOI 10.1074/jbc.M203914200 Vickery L. Arcus‡, Ries Langley§, Thomas Proft§, John D. Fraser§, and Edward N. Baker‡¶ From the ‡School of Biological Sciences and §Department of Molecular Medicine, University of Auckland, Private Bag 92-019 Auckland, New Zealand The staphylococcal enterotoxin-like toxins (SETs) are a family of proteins encoded within the Staphylococcus aureus genome that were identified by their similarity to the well described bacterial superantigens. The first crystal structure of a member of the SET family, SET3, has been determined to 1.9 Å (R 0.205, R free 0.240) and reveals a fold characteristic of the superantigen family but with significant differences. The SET pro- teins are secreted at varying levels by staphylococcal isolates, and seroconversion studies of normal individ- uals indicate that they are strongly antigenic to hu- mans. Recombinant SETs do not exhibit any of the prop- erties expected of superantigens such as major histocompatibility complex class II binding or broad T- cell activation, suggesting they have an entirely differ- ent function. The fact that the whole gene family is clustered within the pathogenicity island SaIn2 of the S. aureus genome suggests that they are involved in host/ pathogen interactions. The bacterial superantigen (SAg) 1 family is a large protein family exclusive to three pathogenic species: Staphylococcus aureus, Streptococcus pyogenes, and Streptococcus equi. The former two organisms are opportunistic human pathogens, and the latter is a pathogen of horses. Members of this family of proteins have been implicated in a range of human diseases, including staphylococcal food poisoning, scarlet fever, toxic shock, rheumatoid arthritis, and secondary HIV infection (1). S. equi is the causative agent of strangles in horses (2). Supe- rantigens function by immune modulation. They cross-link ma- jor histocompatibility complex class II (MHC-II) and T-cell receptor (TCR) molecules, causing nonspecific and dispropor- tionate T-cell proliferation and cytokine release (3). This gives rise to symptoms characteristic of fever and toxic shock. As a result of their close association with serious human patholo- gies, superantigens have been the subject of intense research over the last decade during which several reviews have been published (3–5). The identification of a staphylococcal gene cluster (6) and the determination of the complete genome sequence of S. aureus (7) have revealed a family of genes with similarity to superanti- gens from S. aureus. These were first described by Williams and colleagues (6) as a cluster of five related genes in which the protein products were reported to stimulate the production of interleukin-1, interleukin-6, and tumor necrosis factor from human peripheral blood mononuclear cells. The complete ge- nome sequences for two strains of S. aureus subsequently showed that this cluster contains a total of 10 genes in one strain and 9 in the second strain, with these genes related by sequence identities of 36 – 67%. The SET gene cluster repre- sents half of a pathogenicity island, SaPIn2, shown in Fig. 1. Downstream (3) to the SET gene cluster is a set of nine lpl genes that contain lipoprotein attachment sites and are thought to code for pathogenic proteins (7). The pathogenicity island is flanked at the 5 end by a putative transposase and is also thought to be maintained in the genome by two genes, hsdS and hsdM, which are part of a three-component restric- tion-modification system. The SET genes are most closely related, by sequence, to toxic shock syndrome toxin (TSST), which is a staphylococcal super- antigen. The overall sequence identity is low, at only 26%, but there are small regions that are very well conserved as com- pared with superantigens. Thus, the SET proteins carry the SAg signature sequences. Previous structural and functional studies of superantigens have revealed the capacity of these proteins to graft a wide variety of functional modes onto a conserved fold (5, 8). For example, different superantigens var- iously bind to MHC-II molecules via their N-terminal domain (SEB, TSST) (9, 10) or via a zinc atom bound on the surface of their C-terminal domain (SMEZ-2, SPE-C) (11). They are able to cross-link MHC-II molecules at the cell surface by simulta- neous N- and C-terminal binding in the case of SEA (12) or by dimerization in the case of SPE-C (13). The superantigens also show allelic variation among strains (SMEZ-2) (14) and varying degrees of specificity for alleles of the TCR (15). The availability of genomic sequence data has transformed our knowledge of the distribution of superantigens and superanti- gen-like proteins in bacterial species. The completion of the S. pyogenes genome sequence (16) revealed six new superantigens for which structures and functions have been characterized (17). Although it is unsurprising that the staphylococcal genome would also encode a new group of superantigen-like proteins, the structural and functional variation in this family leaves many * This work was supported by a grant from the Health Research Council of New Zealand. The costs of publication of this article were defrayed in part by the payment of page charges. This article must therefore be hereby marked “advertisement” in accordance with 18 U.S.C. Section 1734 solely to indicate this fact. The atomic coordinates and structure factors (code 1m4v) have been deposited in the Protein Data Bank, Research Collaboratory for Struc- tural Bioinformatics, Rutgers University, New Brunswick, NJ (http://www.rcsb.org/). ¶ To whom correspondence should be addressed: School of Biological Sciences, University of Auckland, Private Bag 92-019, Auckland, New Zealand, Tel.: 64-9-373-7599 (ext. 4415); Fax: 64-9-373-7619; E-mail: [email protected]. 1 The abbreviations used are: SAg, superantigen; MHC-II, major histocompatibility complex class II; TCR, T-cell receptor; PBS, phos- phate-buffered saline (10 mM PO 4 3 , pH 8.0, 140 mM NaCl, 3 mM KCl); FCS, fetal calf serum; HIV, human immunodeficiency virus; SET, staphylococcal enterotoxin-like toxin; TSST, toxic shock syndrome toxin. THE JOURNAL OF BIOLOGICAL CHEMISTRY Vol. 277, No. 35, Issue of August 30, pp. 32274 –32281, 2002 © 2002 by The American Society for Biochemistry and Molecular Biology, Inc. Printed in U.S.A. This paper is available on line at http://www.jbc.org 32274
-
Upload
independent -
Category
Documents
-
view
0 -
download
0
Transcript of The Three-dimensional Structure of a Superantigen-like Protein, SET3, from a Pathogenicity Island of...
The Three-dimensional Structure of a Superantigen-likeProtein, SET3, from a Pathogenicity Island of theStaphylococcus aureus Genome*
Received for publication, April 23, 2002, and in revised form, June 17, 2002Published, JBC Papers in Press, June 24, 2002, DOI 10.1074/jbc.M203914200
Vickery L. Arcus‡, Ries Langley§, Thomas Proft§, John D. Fraser§, and Edward N. Baker‡¶
From the ‡School of Biological Sciences and §Department of Molecular Medicine, University of Auckland,Private Bag 92-019 Auckland, New Zealand
The staphylococcal enterotoxin-like toxins (SETs) area family of proteins encoded within the Staphylococcusaureus genome that were identified by their similarityto the well described bacterial superantigens. The firstcrystal structure of a member of the SET family, SET3,has been determined to 1.9 Å (R � 0.205, Rfree � 0.240)and reveals a fold characteristic of the superantigenfamily but with significant differences. The SET pro-teins are secreted at varying levels by staphylococcalisolates, and seroconversion studies of normal individ-uals indicate that they are strongly antigenic to hu-mans. Recombinant SETs do not exhibit any of the prop-erties expected of superantigens such as majorhistocompatibility complex class II binding or broad T-cell activation, suggesting they have an entirely differ-ent function. The fact that the whole gene family isclustered within the pathogenicity island SaIn2 of the S.aureus genome suggests that they are involved in host/pathogen interactions.
The bacterial superantigen (SAg)1 family is a large proteinfamily exclusive to three pathogenic species: Staphylococcusaureus, Streptococcus pyogenes, and Streptococcus equi. Theformer two organisms are opportunistic human pathogens, andthe latter is a pathogen of horses. Members of this family ofproteins have been implicated in a range of human diseases,including staphylococcal food poisoning, scarlet fever, toxicshock, rheumatoid arthritis, and secondary HIV infection (1).S. equi is the causative agent of strangles in horses (2). Supe-rantigens function by immune modulation. They cross-link ma-jor histocompatibility complex class II (MHC-II) and T-cellreceptor (TCR) molecules, causing nonspecific and dispropor-tionate T-cell proliferation and cytokine release (3). This gives
rise to symptoms characteristic of fever and toxic shock. As aresult of their close association with serious human patholo-gies, superantigens have been the subject of intense researchover the last decade during which several reviews have beenpublished (3–5).
The identification of a staphylococcal gene cluster (6) and thedetermination of the complete genome sequence of S. aureus (7)have revealed a family of genes with similarity to superanti-gens from S. aureus. These were first described by Williamsand colleagues (6) as a cluster of five related genes in which theprotein products were reported to stimulate the production ofinterleukin-1�, interleukin-6, and tumor necrosis factor � fromhuman peripheral blood mononuclear cells. The complete ge-nome sequences for two strains of S. aureus subsequentlyshowed that this cluster contains a total of 10 genes in onestrain and 9 in the second strain, with these genes related bysequence identities of 36–67%. The SET gene cluster repre-sents half of a pathogenicity island, SaPIn2, shown in Fig. 1.Downstream (3�) to the SET gene cluster is a set of nine lplgenes that contain lipoprotein attachment sites and arethought to code for pathogenic proteins (7). The pathogenicityisland is flanked at the 5� end by a putative transposase and isalso thought to be maintained in the genome by two genes,hsdS and hsdM, which are part of a three-component restric-tion-modification system.
The SET genes are most closely related, by sequence, to toxicshock syndrome toxin (TSST), which is a staphylococcal super-antigen. The overall sequence identity is low, at only 26%, butthere are small regions that are very well conserved as com-pared with superantigens. Thus, the SET proteins carry theSAg signature sequences. Previous structural and functionalstudies of superantigens have revealed the capacity of theseproteins to graft a wide variety of functional modes onto aconserved fold (5, 8). For example, different superantigens var-iously bind to MHC-II molecules via their N-terminal domain(SEB, TSST) (9, 10) or via a zinc atom bound on the surface oftheir C-terminal domain (SMEZ-2, SPE-C) (11). They are ableto cross-link MHC-II molecules at the cell surface by simulta-neous N- and C-terminal binding in the case of SEA (12) or bydimerization in the case of SPE-C (13). The superantigens alsoshow allelic variation among strains (SMEZ-2) (14) and varyingdegrees of specificity for alleles of the TCR (15).
The availability of genomic sequence data has transformed ourknowledge of the distribution of superantigens and superanti-gen-like proteins in bacterial species. The completion of the S.pyogenes genome sequence (16) revealed six new superantigensfor which structures and functions have been characterized (17).Although it is unsurprising that the staphylococcal genomewould also encode a new group of superantigen-like proteins, thestructural and functional variation in this family leaves many
* This work was supported by a grant from the Health ResearchCouncil of New Zealand. The costs of publication of this article weredefrayed in part by the payment of page charges. This article musttherefore be hereby marked “advertisement” in accordance with 18U.S.C. Section 1734 solely to indicate this fact.
The atomic coordinates and structure factors (code 1m4v) have beendeposited in the Protein Data Bank, Research Collaboratory for Struc-tural Bioinformatics, Rutgers University, New Brunswick, NJ(http://www.rcsb.org/).
¶ To whom correspondence should be addressed: School of BiologicalSciences, University of Auckland, Private Bag 92-019, Auckland, NewZealand, Tel.: 64-9-373-7599 (ext. 4415); Fax: 64-9-373-7619; E-mail:[email protected].
1 The abbreviations used are: SAg, superantigen; MHC-II, majorhistocompatibility complex class II; TCR, T-cell receptor; PBS, phos-phate-buffered saline (10 mM PO4
3�, pH 8.0, 140 mM NaCl, 3 mM KCl);FCS, fetal calf serum; HIV, human immunodeficiency virus; SET,staphylococcal enterotoxin-like toxin; TSST, toxic shock syndrometoxin.
THE JOURNAL OF BIOLOGICAL CHEMISTRY Vol. 277, No. 35, Issue of August 30, pp. 32274–32281, 2002© 2002 by The American Society for Biochemistry and Molecular Biology, Inc. Printed in U.S.A.
This paper is available on line at http://www.jbc.org32274

questions as to their activity. Here, we describe the first structureof a protein from the SET gene cluster, SET3. The structurereveals that although the superantigen fold is conserved and, byinference, is also conserved among the other SET proteins, thereis evidence that they do not function as prototypic superantigens.We also show, however, that they are likely to have a significantrole in host/pathogen interactions in humans, because serocon-version is widespread and antibody titers in human serum arehigh in the majority of tested cases.
EXPERIMENTAL PROCEDURES
SET3 Protein Expression and Purification—The set3 gene was am-plified by PCR from genomic DNA isolated from a local hospital strain(Auckland, New Zealand) of S. aureus. The gene was subcloned into theexpression vector pET32a3C and expressed in Escherichia coli (AD494)as an N-terminal thioredoxin fusion protein. The fusion protein waspurified by Ni2� affinity chromatography, cleaved using 3C protease,and subjected to Ni2� affinity chromatography again to separate SET3from thioredoxin. Pure SET3 was finally obtained by size exclusionchromatography (Superdex 75, Amersham Biosciences). Dynamic lightscattering data for the final concentrated protein solution (12 mg � ml�1
SET3) indicated a monodisperse solution of monomeric protein. Themolecular mass calculated from the hydrodynamic radius was 29 kDacompared with the calculated molecular mass of 24.16 kDa. Other SETproteins for biochemical studies were produced similarly.
125I Labeling of Proteins—SET3 (6 �g) was mixed with 0.5 mCi of 125Iin 20 �l of 5� PBS and 5 �l 1 mg � ml�1 chloramine T and incubated for1 min. 5 �l of 5 mg � ml�1 sodium metabisulfite was added to thissolution, and the volume was made up to 50 �l with PBS, 1% FCS. Thiswas then loaded onto a 1-ml G25 column pre-equilibrated with PBS, 1%FCS, and the protein was eluted in 100-�l fractions. An aliquot fromeach fraction (1 �l) was counted using a Cobra II �-counter.
Immunoprecipitation to Detect for Seroconversion—5 �l of humanserum was incubated with 105 cpm of SET3125I in a total volume of 50�l of Tris-buffered saline � azide (TSA; 10 mM Tris, pH 8.0, 140 mM
NaCl, 0.025% NaN3), 10% FCS, and 1% Hb at 37 °C for 30 min. 5 �l ofprotein A-Sepharose was added, and the sample was incubated on icefor 30 min. After washing three times in 0.5 ml of radioimmune pre-cipitation buffer (1% Triton X-100, 1% sodium deoxycholate, 1% bovinehemoglobin, 1 mM iodoacetamide), the sample was analyzed using aCobra II �-counter. A control containing no serum was used to deter-mine the background count.
Western Analysis of S. aureus Culture Supernatants—S. aureus clin-ical isolates were cultured overnight without shaking at 37 °C. Aftercentrifugation to remove the bacteria, 0.5 ml of culture supernatant wasconcentrated by precipitation with 50% trichloroacetic acid and resus-pended in 5 �l of PBS. Samples were subjected to electrophoresis by12% SDS-PAGE. The proteins were transferred to nitrocellulose usinga semidry blotter. The membrane was blocked for 1 h at room temper-ature in TTBS (0.1% Tween 20 in TBS), 5% (w/v) nonfat milk powder. A1/500 dilution of mouse anti-SET3 polyclonal serum was then incubatedwith the membrane for 1 h at room temperature in blocking buffer.After being washing in TTBS, the membrane was incubated with a1/1000 dilution of peroxidase-labeled anti-mouse IgG for 1 h at room
temperature. The membrane was then washed in TBS (Tris-bufferedsaline; 100 mM Tris, pH 7.5, 0.9% w/v NaCl) and analyzed using an ECLWestern blotting detection kit from Amersham Biosciences.
Peripheral Blood Lymphocyte Proliferation Assay—A 5-fold serialdilution (in triplicate) from 1 to 2.05 � 10�8 �g � ml�1 of each proteintested was set up in 96-well plates in a volume of 100 �l RPMI, 10%FCS/well. One row of wells was set up with no protein added as anegative control. Mononuclear cells were isolated from whole blood byFicoll separation, washed, and suspended at 106 cells/ml in RPMI, 10%FCS. 100 �l of cells were added to each well, and the plates wereincubated in 5% CO2 for 3 days. 25 �l of [3H]thymidine was added toeach well and incubated overnight. The cells were harvested onto filtermats using a Tomtec harvester, and the incorporated [3H]TdR wasanalyzed using a Trilux counter.
SET3 Crystallization—SET3 crystals were grown in hanging dropsat 18 °C by mixing 2 �l of protein solution (20 mM sodium phosphatebuffer, pH 6.0, 12 mg � ml�1 SET3) with 2 �l of precipitant solution(either 50 mM HEPES, pH 7.0, 1.5 M ammonium sulfate or 50 mM
HEPES pH 7.0, 0.9 M sodium/potassium tartrate). Hexagonal platesand blocks typically emerged after 4 days and then grew larger over aperiod of 2 weeks. X-ray diffraction measurements showed that thecrystals were hexagonal, space group P63, with unit cell dimensionsa � b � 65.1 and c � 196.7 Å. Two molecules occupy the asymmetricunit, giving a solvent content in the crystal of 45% (v/v). The crystalscould be flash-frozen for data collection by soaking in cryoprotectant(mother liquor plus 30% glycerol) immediately prior to placement in astream of cold N2 gas (110 K).
X-ray Data Collection—Native and derivative data sets for SET3were collected using CuK� radiation from a Rigaku RU-H3R x-raygenerator equipped with focusing mirrors and a Mar345 imaging platedetector. Subsequently, a high-resolution native data set was collectedusing synchrotron radiation (� � 0.8452 Å) at DESY Hamburg, beam-line BW7V. The raw data were processed using DENZO and subse-quently scaled using SCALEPACK (18). Data collection and refinementstatistics are given in Table I.
Structure Determination and Refinement—The structure of SET3was determined by multiple isomorphous replacement (MIR) usingthree heavy atom derivatives. These were prepared by soaking SET3crystals in KAu(CN)2 (5 mM), K2PtCl6 (1 mM), and Hg(CH3COO)2 (1 mM)for periods of 1–7 days. The multiple isomorphous replacement analysiswas carried out in the higher symmetry space group of P6322 (onemolecule in the asymmetric unit) using the program SOLVE (19),incorporating isomorphous and anomalous differences. Two sites werefound for the KAu(CN)2 derivative and single, identical sites were foundfor the K2PtCl6 and Hg(CH3COO)2 derivatives. The initial phases fromSOLVE were calculated to 2.8 Å and gave a figure of merit of 39% anda Z-score of 16.7. These phases were checked by refinement usingMLPHARE (27), extended to 2.3 Å, and then improved by maximumlikelihood density modification using RESOLVE (20). The programMAID (21) was used to auto-trace 65 residues, and subsequently afurther 44 residues manually were built using O (22). Side chains wereadded for 23 residues with the remainder left as alanine. A single roundof phased refinement indicated that the symmetry constraints of P6322were too high, and the space group symmetry was therefore lowered toP63 with two molecules in the asymmetric unit. The model, now com-
FIG. 1. Pathogenicity island SaPIn2. The pathogenicity island SaPIn2, from S. aureus strain N315, as defined by Kuroda et al. (7). Openreading frames are shown with arrows; where a gene has been annotated, its gene name is given. Other open reading frames are named accordingto their positions in the genome. The numbers below each set of arrows indicate the approximate genome position in kilobases. In this annotation,the gene set10 corresponds to set3 in the description of Williams et al. (6).
Three-dimensional Structure of SET3 32275
prising 218 residues, was used to determine initial phases for WARP(23), and the remainder of the two molecules was built automatically byWARP using data in the resolution range of 30 to 1.90 Å. Finally, fiveiterations of manual building and refinement using O and CNS (24)were undertaken to finish the structure determination. Refinementstatistics are given in Table I. Structural comparisons were performedusing the program MAPS (bioinfo1.mbfys.lu.se/TOP/maps.html), andcomparison trees were constructed from structure diversity scores asdescribed previously (8).
RESULTS
Quality of the Structural Model—The three-dimensionalstructure of SET3 was determined by x-ray crystallographyand refined using data to 1.90 Å resolution. The final modelcomprises residues 5–204 of both molecule 1 and molecule 2,these comprising the two molecules in the crystal asymmetricunit, together with 378 solvent molecules, modeled as water.Three or four residues (83–86 molecule A and 84–86 moleculeB) from the �4–�5 loop in the N-terminal domain have poorlydefined density in each molecule and have not been modeled;these residues are assumed to be disordered.
Overall, the fit to the electron density is excellent and thestructure conforms well with the x-ray data and with ex-pected protein geometry. The final R (Rfree) values are 0.205(0.240), and 90.6% of the 393 residues in the two independentmolecules have �/� torsion angles in the most favored regionsof the Ramachandran plot as defined by PROCHECK (CCP4,1994). Two residues in each molecule (Asp104 and Lys160 with�/� angles �142°/�115° and 48°/�122°, respectively) are ingenerously allowed regions of the plot, and one residue ineach molecule (Asp118, �/� angles 49°/�112°) occupies a dis-
allowed region. Both Asp118 and Lys60 are central residues intype II� �-turns, which accounts for their unusual �/� angles(see Fig. 2). Asp118 is part of the tight turn that links�-strands �6 and �7. However, Lys60 is part of a �-turn thatdoes not link secondary structure elements and is flanked onboth sides by loops. Asp104 lies between two tyrosine residuesin a tightly packed structure that includes one leucine andthree tyrosine residues, which may constrain Asp104 in itsunusual �/� geometry. This Asp residue is conserved in 6 of10 SET proteins. The electron density for each of these threeresidues (Asp118, Lys60, Asp104) in each SET molecule in theasymmetric unit is unequivocal and, at least in the case ofLys60 and Asp104, their consistent, nonstandard geometrypoints toward their possible significance as functional resi-dues for SET3.
Structure Description—SET3 has the classic two-domainstructure characteristic of proteins of the superantigen family(Fig. 2). Most of the N-terminal half of the molecule (residues24–97) is folded into a 5-stranded �-barrel called an OB-fold(25), and the C-terminal half, residues 98–204, into a �-graspdomain, in which a 5-stranded mixed �-sheet packs over anamphipathic �-helix that is the most sequence-conserved fea-ture of these proteins. The two domains are bridged by anN-terminal helix, residues 11–23. The two domains pack to-gether to form an irregularly shaped molecule with approxi-mate dimensions of 50 � 37 � 23 Å3.
The SET3 structure has two notable features that differen-tiate it from other SAg family proteins for which structureshave been solved to date. First, the strands �6 and �7 in the
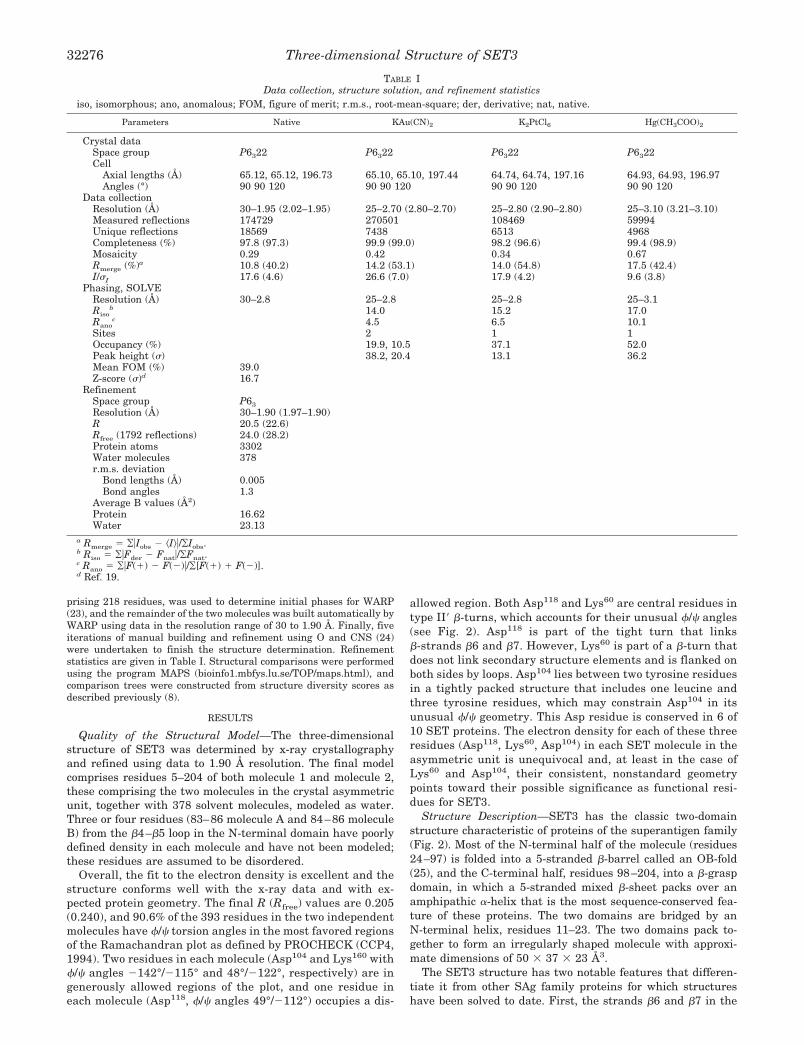
TABLE IData collection, structure solution, and refinement statistics
iso, isomorphous; ano, anomalous; FOM, figure of merit; r.m.s., root-mean-square; der, derivative; nat, native.
Parameters Native KAu(CN)2 K2PtCl6 Hg(CH3COO)2
Crystal dataSpace group P6322 P6322 P6322 P6322Cell
Axial lengths (Å) 65.12, 65.12, 196.73 65.10, 65.10, 197.44 64.74, 64.74, 197.16 64.93, 64.93, 196.97Angles (°) 90 90 120 90 90 120 90 90 120 90 90 120
Data collectionResolution (Å) 30–1.95 (2.02–1.95) 25–2.70 (2.80–2.70) 25–2.80 (2.90–2.80) 25–3.10 (3.21–3.10)Measured reflections 174729 270501 108469 59994Unique reflections 18569 7438 6513 4968Completeness (%) 97.8 (97.3) 99.9 (99.0) 98.2 (96.6) 99.4 (98.9)Mosaicity 0.29 0.42 0.34 0.67Rmerge (%)a 10.8 (40.2) 14.2 (53.1) 14.0 (54.8) 17.5 (42.4)I/�I 17.6 (4.6) 26.6 (7.0) 17.9 (4.2) 9.6 (3.8)
Phasing, SOLVEResolution (Å) 30–2.8 25–2.8 25–2.8 25–3.1Riso
b 14.0 15.2 17.0Rano
c 4.5 6.5 10.1Sites 2 1 1Occupancy (%) 19.9, 10.5 37.1 52.0Peak height (�) 38.2, 20.4 13.1 36.2Mean FOM (%) 39.0Z-score (�)d 16.7
RefinementSpace group P63Resolution (Å) 30–1.90 (1.97–1.90)R 20.5 (22.6)Rfree (1792 reflections) 24.0 (28.2)Protein atoms 3302Water molecules 378r.m.s. deviation
Bond lengths (Å) 0.005Bond angles 1.3
Average B values (Å2)Protein 16.62Water 23.13
a Rmerge � ¥�Iobs � �I��/¥Iobs.b Riso � ¥�Fder � Fnat�/¥Fnat.c Rano � ¥�F(�) � F(�)�/¥[F(�) � F(�)].d Ref. 19.
Three-dimensional Structure of SET332276

C-terminal domain are extended so that the �6–�7 loopprojects from the molecular surface (the strands flank D118,Fig. 2). In the crystal, the two independent molecules in theasymmetric unit are related by a pseudo 2-fold axis about �7,and this extended loop forms a �-sheet with the same loop ofthe second molecule. The surface area buried in the crystallo-graphic dimer interaction is small (287 Å2/monomer) and itappears that this “dimer” does not persist in solution, becausedynamic light scattering indicates a monomer. However, theformation of this dimer includes six intermolecular hydrogenbonds and constructs a large and continuous �-sheet of 10strands between the two monomers. This, in turn, presents alarge, positively charged, saddle-shaped surface (Fig. 2) thathas the potential to act as a binding surface for negativelycharged molecules such as DNA. This highlights a second strik-ing feature of the structure, in the widespread positive chargeover the protein surface. Although lysine and arginine residuesare scattered across the surface, they are concentrated at thecapping helix and outer face of the N-terminal OB-fold domainand in the saddle-shaped face formed by the association of thetwo molecules in the asymmetric unit described above. Wesuggest that these areas are likely binding sites for negativelycharged binding partners.
Comparison with Other Superantigens—Proteins from thesuperantigen family are well represented in the currentstructural data base, SET3 being the 14th such structurefrom this family to be determined. When these proteins arecompared as a whole, it is apparent that the structural core isconserved, with 76 residues occupying equivalent C� posi-tions and a root-mean-square difference of 1.15 Å (for those76 residues) but with only five residues conserved at thesequence level. SET3 and TSST form an out-group from theremainder of the SAg-like proteins such that if these twostructures are omitted from the alignment, 113 residuesshare equivalent C� positions (with a root-mean-square dif-ference of 0.95 Å for those 113 residues) and 16 residues areconserved in the sequence. These 16 residues appear to beconserved for their role in preserving the superantigen foldand, apart from glycines, are almost exclusively involved in
buried charge-charge or polar interactions between elementsof the secondary structure. Most are concentrated around theinterdomain region and appear to help maintain the closeassociation of the two domains.
FIG. 3. Structural comparison of the N-terminal “bindingface.” A structural alignment of the N-terminal binding faces of SET3,TSST, and SPE-C. TSST is shown in gray, and residues that interactwith MHC-II in the TSST�MHC-II complex are identified by small blackspheres and labeled using the single-letter amino acid codes. Residues inSET3 and SPE-C at equivalent positions are shown in the sequencealignment at the bottom of the figure. The C� trace for SET3 is shownin red and for SPE-C is shown in blue.
FIG. 2. SET3 structure. Top, stereoview of the C� backbone trace of SET3colored from the N terminus to the C ter-minus (blue to red). Selected residues arelabeled according to their single-letteramino acid code and their number in thesequence. A loop spanning five residues(83–86) is not visible in the electron den-sity for the SET3 structure and is omittedin this figure. Lower left, schematic rib-bon diagram of SET3 showing the canon-ical superantigen fold viewed along thepseudo 2-fold axis of the putative dimer.The N and C termini are labeled; the N-terminal OB-fold domain is at the top leftand bottom right of the structure. Thispanel was drawn using PyMol (www.pymol.org). Lower right, the electrostaticpotential at the protein surface lookingdown the pseudo crystallographic 2-foldaxis showing the concentrations of posi-tive charge at each end of the individualmonomers. This panel was drawn usingGRASP (26).
Three-dimensional Structure of SET3 32277
When the SET3 and TSST structures are overlaid, 127 C�positions are within 3.5 Å with a root-mean-square differenceof 1.15 Å and 37 sequence identities in this conserved core.Again, the majority of the residues that are conserved in
sequence and in structure between TSST and SET3 play clearstructural roles either by contributing to the hydrophobiccore or with their side chains forming buried charge-chargeinteractions or hydrogen bonds with main-chain atoms. The
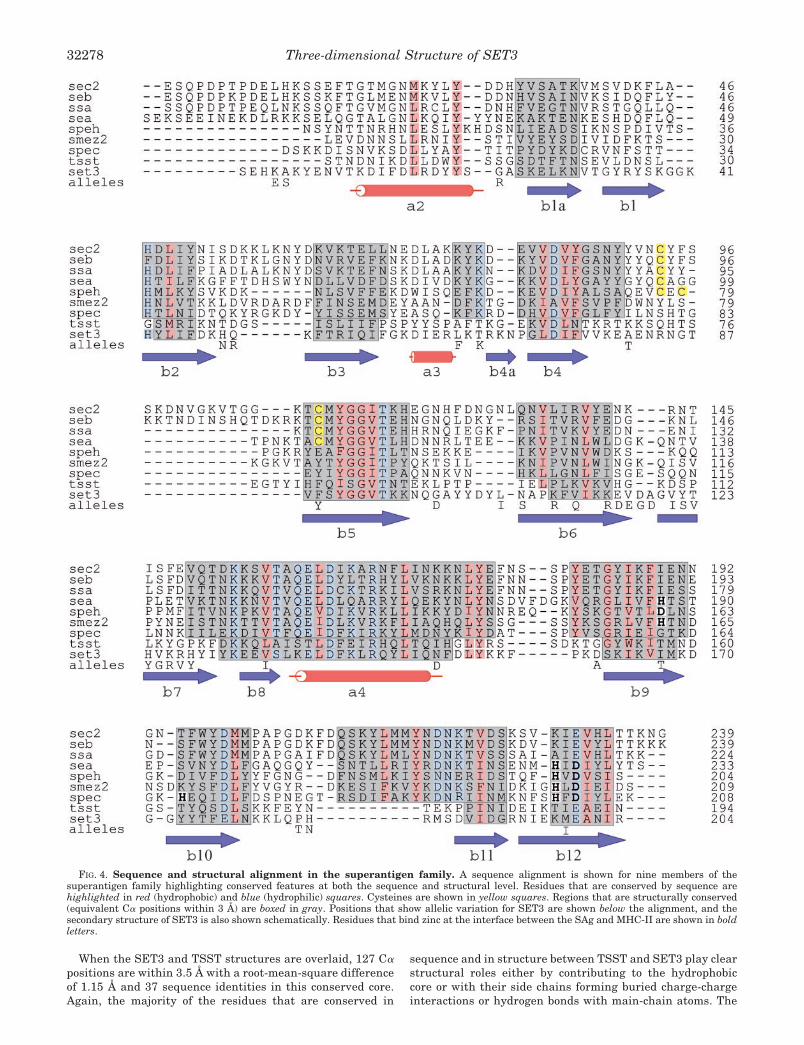
FIG. 4. Sequence and structural alignment in the superantigen family. A sequence alignment is shown for nine members of thesuperantigen family highlighting conserved features at both the sequence and structural level. Residues that are conserved by sequence arehighlighted in red (hydrophobic) and blue (hydrophilic) squares. Cysteines are shown in yellow squares. Regions that are structurally conserved(equivalent C� positions within 3 Å) are boxed in gray. Positions that show allelic variation for SET3 are shown below the alignment, and thesecondary structure of SET3 is also shown schematically. Residues that bind zinc at the interface between the SAg and MHC-II are shown in boldletters.
Three-dimensional Structure of SET332278

exceptions to this are Lys114, Lys160, and Glu200 (SET3 num-bering), all of which are on the outer face of the C-terminal�-grasp domain, and Asn150, Asp16, and Asp19, on the oppo-site face of the �-grasp domain in proximity to the N-terminalhelix. These six residues do not, however, correspond to anyequivalent residues in TSST that are involved in eitherMHC-II binding or TCR interactions (10). In this context, thestructure suggests that it is most unlikely that SET3 couldbind to either MHC-II or the TCR in a manner similar toTSST. For example, 15 residues from TSST interact withMHC-II upon binding (10) and, after structural alignment,just 2 of these residues are conserved between TSST andSET3 (see Fig. 3). Of the remaining 13 MHC-II bindingresidues, the differences between TSST and SET3 includeAsp 3Tyr, Arg 3 Ile, Leu 3 Arg, and Pro 3 Gly. Thesenonconservative changes at the binding face argue stronglyagainst any similar binding of SET3 to MHC II.
There are other significant structural differences betweenTSST and SET3. In comparison with TSST, SET3 has an elon-gated loop (residues 37–42) that connects strands �1 and �2 onthe surface of its N-terminal domain. In SET3, the N-terminal�-barrel is also capped by an �-helix (residues 58–68, linking�3 and �4) that is missing in TSST but present in all of theother superantigens and is also a general feature of the OB-fold(25, Fig. 3). The loop that leads into the C-terminal domain,residues 99–107, has a very different conformation in SET3when compared with TSST. In SET3 this loop is solvent-ex-posed and contains Asp104, which occupies a generously al-lowed region of the Ramachandran plot and may be importantfor SET3 function. As described above, SET3 also has elongated�-strands �6 and �7 at the periphery of the C-terminal �-sheet(residues 116–129).
Allelic Variation—There is preliminary evidence that SET3has allelic variants in different strains of S. aureus. Twostrains have been sequenced from isolates from GreenlaneHospital in Auckland, New Zealand, and these differ from eachother and from the two sequences described by Williams et al.(6) and Kuroda et al. (7). When these four SET3 proteins arealigned they vary at 35 positions. 17 of these positions areconcentrated on the two outer �-strands of the C-terminal�-sheet, �6 and �7, whereas the remaining 18 positions arescattered across the protein (see Fig. 4). Five of the 37 residuesare buried hydrophobic residues, and their allelic variants arealso hydrophobic, but all other residues are surface-exposed.Allelic variation has also been reported for SET1 and is sug-gested by the sequence differences between the allelic pairsSET1/11, SET2/8, SET3/10, SET4/14 and SET5/13.
Members of the SET Family of Proteins Are Not Superanti-gens—Three recombinant proteins from the SET family, SET1,SET3, and SET15, were used in a typical peripheral bloodlymphocyte stimulation assay to assess their mitogenicity. Theability to stimulate the proliferation of T-cells in a TCR V�-restricted manner is a hallmark of superantigens. TSST wasused as a positive control, and reaches maximum stimulationat 1 ng � ml�1. In all cases and at all concentrations, however,the SET proteins showed no capacity to induce T-cell prolifer-ation (see Fig. 5).
SET3 Is Secreted by All S. aureus Isolates—Polyclonal anti-bodies to the SET proteins were raised in mice. �-SET3 wasused to detect for the presence of SET3 in the culture super-natants of six S. aureus clinical isolates. These isolates wererandomly chosen from a panel of 20 clinical isolates, all ofwhich were found to be positive for the SET3 gene by PCR.Western analysis of the supernatants concentrated 50 times bytrichloroacetic acid precipitation showed that SET3 is secretedby S. aureus in all cases (see Fig. 6).
SET3 Is Recognized by the Human Immune System—Radio-actively labeled SET1 and SET3 were immunoprecipitated us-ing a panel of human sera together with protein A-Sepharose.Serum from 15 healthy individuals was incubated with radio-actively labeled SETs to detect for the presence of antibodiesagainst these proteins. All individuals showed positive serocon-version, indicating that they had all been exposed to theseproteins at some time (see Fig. 7).
DISCUSSION
The set family of genes encode a new and large family ofSAg-like proteins. As a family they are most closely related toTSST by sequence, and the 9–10 set genes lie consecutively onthe S. aureus genome (7), almost certainly as a result of geneduplications. Divergence of these genes within the genome ismarked and, as is characteristic of the whole superantigenfamily with which they share sequence similarity, is presumedto have given rise to structurally homologous proteins withdifferent but related functions.
The structure of SET3, the first protein from the SET family,and the first from the SaPIn2 pathogenicity island in the S.aureus genome, shows clearly that this, and by implication theother SET proteins, belongs to the wider superantigen super-family. The most striking feature of this superfamily is thediversity of functions (and sequences) supported by their highly
FIG. 5. T-cell proliferation. Stimulation of human T-cells with re-combinant S. aureus proteins. Peripheral blood lymphocytes isolatedfrom human blood were incubated with varying concentrations of pro-tein. Stimulation of T-cells was measured by the incorporation of[3H]thymidine as counts per minute (cpm).
FIG. 6. S. aureus supernatants. Western analysis of culture super-natants from eight S. aureus isolates (lanes 3–10) to detect for thepresence of SET3. The supernatants were concentrated 50� and runalongside 5 ng (lane 1) and 1 ng (lane 2) of recombinant SET3 by 12%SDS-PAGE. SET3 was detected with mouse anti-SET3 antiserum.
Three-dimensional Structure of SET3 32279

conserved structural framework (5, 8). Sequence conservationis limited to residues that confer structural integrity, particu-larly in and around the interdomain region, whereas the pro-tein surfaces vary considerably. Variations include changedexternal loops and metal binding sites, in addition to changesin specific surface residues, which lead to differences in theirinteractions with MHC-II and TCR molecules. These variationsaccompany a remarkably narrow genealogy, a single ancestralgene duplicating in just three known species of Staphylococcusand Streptococcus, despite the potential for further spreadthrough horizontal gene transfer.
The SET proteins mark a further functional divergence.SET1, -3, and -15 do not stimulate T-cells nor do they bind toMHC-II. Thus, they do not function as nonspecific activators ofthe immune system in the way that the prototype superanti-gens do. Structurally this is consistent with our observationthat in SET3, at least, there is no conservation of the residuesthat are involved in MHC-II or T-cell receptor binding in theother superantigen structures and sequences.
Without exception, the residues that are strictly conservedamong the SET family are structural. This gives no clue tothe function of SET3 but does point strongly to the likelihoodof differing functions for proteins within the SET family. We
have modeled seven of the SET sequences onto the SET3structure, and our hypothesis of varied function is supportedfrom inspection of the surface features of the different SETproteins. For example, SET15 has a low predicted pI of 6.5 (cf.9.6 for SET3), and this is reflected in the surface charge onthe protein, which shows a large area of negative charge onone face of the protein and a large area of positive charge onthe opposite face.
The failure to stimulate T-cell proliferation in no way ex-cludes the SET proteins from being important virulence fac-tors. They are secreted by the bacteria, both in vitro and invivo, and seroconversion is present in the majority of patientsthat we have tested so far, with high antibody titers in thesesubjects. The pathogenicity island SaPIn2 appears to be impor-tant to the organism, as it is maintained in the genome by tworestriction-modification genes in the center of the island (thethird member of the trio, the restriction enzyme, lies remotefrom the pathogenicity island). Remnants of gene duplicationand transfer may also be found in the transposase gene at the5� end of SaPIn2. This finding further supports the importanceand prevalence of these proteins as agents of host/pathogeninteractions.
The superantigen family of proteins continues to surprise.Recently, the complete genome sequences of both S. pyogenesand S. aureus have led to the identification of 28 superantigensand superantigen-like proteins. In many individual cases, al-lelic variation between strains augments this number, and thesequence variation covers the continuum from individualamino acid substitutions through �10% sequence identity be-tween members of the family. The structure of SET3 showsthat the conserved superantigen architecture can support yetfurther functional variation, and the presence of nine relatedhomologs that are adjacent in the genome suggests thatthese proteins are important to the pathogenicity ofStaphylococcus.
REFERENCES
1. Kotzin, B. L., Leung, D. Y., Kappler, J., and Marrack, P. (1993) Adv. Immunol.54, 99–166
2. Wallace, F. J., Emery, J. D., Cripps, A. W., and Husband, A. J. (1995) Vet.Immunol. Immunopathol. 48, 139–154
3. Fraser, J., Arcus, V., Kong, P., Baker, E., and Proft, T. (2000) Mol. Med. Today6, 125–132
4. Bernal, A., Proft, T., Fraser, J. D., and Posnett, D. N. (1999) J. Clin. Immunol.19, 149–157
5. Sundberg, E. J., Li, Y., and Mariuzza, R. A. (2002) Curr. Opin. Immunol. 14,36–44
6. Williams, R. J., Ward, J. M., Henderson, B., Poole, S., O’Hara, B. P., Wilson,M., and Nair, S. P. (2000) Infect. Immun. 68, 4407–4415
7. Kuroda, M., Ohta, T., Uchiyama, I., Baba, T., Yuzawa, H., Kobayashi, I., Cui,L., Oguchi, A., Aoki, K., Nagai, Y., Lian, J., Ito, T., Kanamori, M.,Matsumaru, H., Maruyama, A., Murakami, H., Hosoyama, A., Mizutani-Ui,Y., Takahashi, N. K., Sawano, T., Inoue, R., Kaito, C., Sekimizu, K.,Hirakawa, H., Kuhara, S., Goto, S., Yabuzaki, J., Kanehisa, M., Yamashita,A., Oshima, K., Furuya, K., Yoshino, C., Shiba, T., Hattori, M., Ogasawara,N., Hayashi, H., and Hiramatsu, K. (2001) Lancet 357, 1225–1240
8. Arcus, V. L., Proft, T., Sigrell, J. A., Baker, H. M., Fraser, J. D., and Baker,E. N. (2000) J. Mol. Biol. 299, 157–168
9. Jardetzky, T. S., Brown, J. H., Gorga, J. D., Stern, L. J., Urban, R. G., Chi, Y. I.,Stauffacher, C., Strominger, J. L., and Wiley, D. C. (1994) Nature 368,711–718
10. Kim, J., Urban, R. G., Strominger, J. L., and Wiley, D. C. (1994) Science 266,1870–1874
11. Li, Y., Li, H., Dimasi, N., McCormick, J. K., Martin, R., Schuck, P., Schlievert,P. M., and Mariuzza, R. A. (2001) Immunity 14, 93–104
12. Tiedemann, R. E., and Fraser, J. D. (1996) J. Immunol. 157, 3958–396613. Roussel, A., Anderson, B. F., Baker, H. M., Fraser, J. D., and Baker, E. N.
(1997) Nat. Struct. Biol. 4, 635–64314. Proft, T., Moffatt, S. L., Weller, K. D., Paterson, A., Martin, D., and Fraser,
J. D. (2000) J. Exp. Med. 191, 1765–177615. Li, H., Llera, A., and Mariuzza, R. A. (1998) Immunol. Rev. 163, 177–18616. Ferretti, J. J., McShan, W. M., Ajdic, D., Savic, D. J., Savic, G., Lyon, K.,
Primeaux, C., Sezate, S., Suvorov, A. N., Kenton, S., Lai, H. S., Lin, S. P.,Qian, Y., Jia, H. G., Najar, F. Z., Ren, Q., Zhu, H., Song, L., White, J., Yuan,X., Clifton, S. W., Roe, B. A., and McLaughlin, R. (2001) Proc. Natl. Acad.Sci. U. S. A. 98, 4658–4663
17. Proft, T., Moffatt, S. L., Berkahn, C. J., and Fraser, J. D. (1999) J. Exp. Med.189, 89–102
18. Otwinowski, Z., and Minor, W. (1997) Methods Enzymol. 276, 307–326
FIG. 7. Seroconversion. Immunoprecipitation of human sera to de-tect for antibodies specific to SET1 and SET3. A, sera from five indi-viduals incubated with 125I-SET3 were immunoprecipitated with pro-tein A-Sepharose. The levels of specific antibody were measured as apercentage of the total cpm of radioactive protein bound. B, similarly,serum from 15 individuals was surveyed for the presence of SET1 andSET3.
Three-dimensional Structure of SET332280

19. Terwilliger, T. C., and Berendzen, J. (1999) Acta Crystallogr. D. Biol. Crystal-logr. 55, 849–861
20. Terwilliger, T. C. (2001) Acta Crystallogr. Sect. D Biol. Crystallogr. 57,1755–1762
21. Levitt, D. G. (2001) Acta Crystallogr. Sect. D Biol. Crystallogr. 57,1013–1019
22. Jones, T. A., Zou, J. Y., Cowan, S. W., and Kjeldgaard, M. (1991) Acta Crys-tallogr. Sect. A 47, 110–119
23. Lamzin, V. S., and Wilson, K. S. (1997) Methods Enzymol. 277, 269–305
24. Brunger, A. T., Adams, P. D., Clore, G. M., DeLano, W. L., Gros, P., Grosse-Kunstleve, R. W., Jiang, J. S., Kuszewski, J., Nilges, M., Pannu, N. S., Read,R. J., Rice, L. M., Simonson, T., and Warren, G. L. (1998) Acta Crystallogr.Sect. D Biol. Crystallogr. 54, 905–921
25. Murzin, A. G. (1993) EMBO J. 12, 861–86726. Nicholls, A., Sharp, K., and Honig, B. (1991) Proteins Struct. Funct. Genet. 11,
281–29627. Collaborative Computing Project Number 4 (1994) Acta Crystallogr. Sect. D
Biol. Crystallogr. 50, 760–763
Three-dimensional Structure of SET3 32281