Streptococcus pneumoniae and Staphylococcus aureus Pneumonia Induce Distinct Metabolic Responses
Sensors 2011, 11, 10638-10663; doi:10.3390/s111110638
sensors ISSN 1424-8220
www.mdpi.com/journal/sensors
Article
Bio-Sensing of Cadmium(II) Ions Using Staphylococcus aureus †
Jiri Sochor 1,2,3
, Ondrej Zitka 1,2,3
, David Hynek 1,2,3
, Eva Jilkova 1, Ludmila Krejcova
1,2,3,
Libuse Trnkova 1,2,3,4,5
, Vojtech Adam 1,2,3
, Jaromir Hubalek 1,2,3,6
, Jindrich Kynicky 7,
Radimir Vrba 2 and Rene Kizek
1,2,3,5,*
1 Department of Chemistry and Biochemistry, Faculty of Agronomy, Mendel University in Brno,
Zemedelska 1, CZ-613 00 Brno, Czech Republic; E-Mails: [email protected] (J.S.);
[email protected] (O.Z.); [email protected] (D.H.); [email protected] (E.J.);
[email protected] (L.K.); [email protected] (L.T.); [email protected] (V.A.);
[email protected] (J.H.) 2 Central European Institute of Technology, Brno University of Technology, Technicka 3058/10,
CZ-616 00 Brno, Czech Republic; E-Mail: [email protected] (R.V.) 3 Lead and Cadmium Initiatives, United Nations Environment Program, Faculty of Agronomy,
Mendel University in Brno, Zemedelska 1, CZ-613 00 Brno, Czech Republic 4 Department of Chemistry, Faculty of Science, Masaryk University, Kotlarska 2, CZ-611 37 Brno,
Czech Republic 5 Research Centre for Environmental Chemistry and Ecotoxicology, Faculty of Science, Masaryk
University, Kotlarska 2, CZ-611 37 Brno, Czech Republic 6 Department of Microelectronics, Faculty of Electrical Engineering and Communication,
Brno University of Technology, Technicka 10, CZ-616 00 Brno, Czech Republic 7 Department of Geology and Pedology, Faculty of Forestry and Wood Technology,
Mendel University in Brno, Zemedelska 1, CZ-613 00 Brno, Czech Republic;
E-Mail: [email protected] (J.K.)
† Dedicated United Nations Environment Program: Lead and Cadmium Initiatives.
* Author to whom correspondence should be addressed; E-Mail: [email protected];
Tel.: +420-545-133-350; Fax: +420-545-212-044.
Received: 16 September 2011; in revised form: 31 October 2011 / Accepted: 7 November 2011 /
Published: 8 November 2011
Abstract: Cadmium, as a hazardous pollutant commonly present in the living
environment, represents an important risk to human health due to its undesirable effects
(oxidative stress, changes in activities of many enzymes, interactions with biomolecules
OPEN ACCESS

Sensors 2011, 11
10639
including DNA and RNA) and consequent potential risk, making its detection very
important. New and unique technological and biotechnological approaches for solving this
problems are intensely sought. In this study, we used the commonly occurring potential
pathogenic microorganism Staphylococcus aureus for the determination of markers which
could be used for sensing of cadmium(II) ions. We were focused on monitoring the effects
of different cadmium(II) ion concentrations (0, 1.25, 2.5, 5, 10, 15, 25 and 50 µg mL−1
) on
the growth and energetic metabolism of Staphylococcus aureus. Highly significant changes
have been detected in the metabolism of thiol compounds—specifically the protein
metallothionein (0.79–26.82 mmol/mg of protein), the enzyme glutathione S-transferase
(190–5,827 µmol/min/mg of protein), and sulfhydryl groups (9.6–274.3 µmol cysteine/mg
of protein). The ratio of reduced and oxidized glutathione indicated marked oxidative
stress. In addition, dramatic changes in urease activity, which is connected with resistance
of bacteria, were determined. Further, the effects of cadmium(II) ions on the metabolic
pathways of arginine, β-glucosidase, phosphatase, N-acetyl β-D-glucosamine, sucrose,
trehalose, mannitol, maltose, lactose, fructose and total proteins were demonstrated.
A metabolomic profile of Staphylococcus aureus under cadmium(II) ion treatment
conditions was completed seeking data about the possibility of cadmium(II) ion
accumulation in cells. The results demonstrate potential in the application of
microorganisms as modern biosensor systems based on biological components.
Keywords: biosensor; cadmium; Staphylococcus aureus; metabolic activity; metabolome;
microbiome; electrochemistry; voltammetry; Brdicka reaction; spectrophotometry; high
performance liquid chromatography with electrochemical detection
1. Introduction
Environmental pollution by xenobiotics is increasingly becoming a global issue. In connection with
the growing ecosystem contamination by xenobiotics, it is therefore increasingly important to monitor
their presence and promptly assess potential risks to humans [1]. The United Nations Environment
Programme (UNEP) aims at monitoring and removing cadmium from the environment [2]. Over the
last 15 years The Comprehensive Environmental Response, Compensation, and Liability Act (CERCLA)
has permanently listed Cd as No. 7 (out of 275 species) in its priority list of hazardous materials [3].
Cadmium’s fate in the environment is shown in Scheme 1. Cadmium in its elemental form is a soft,
silver-white metal, which occurs with other elements in the Earth’s crust with average content
of 0.13–0.2 g t−1
in the lithosphere. This element is naturally found in air, water resources and soil as
complex oxides, sulphides, and carbonates in zinc, lead, and copper ores [4]. Mining of iron and zinc
ores, the burning of fossil fuels, plastics, dyes or road transport constitute the main sources of
environmental cadmium pollution, and therefore the routes whereby it can enter the human food
chain [5]. In mining global cadmium production increased during the period from 1970 to 2004 from
about 17,000 tonnes to about 22,000 tonnes. Over the last 15 years, global consumption has remained
relatively constant, at around 20,000 tonnes. Improperly disposal of batteries is another source of

Sensors 2011, 11
10640
cadmium pollution [6]. In the atmosphere cadmium is mainly emitted to the atmosphere in particulate
form. From combustion sources, cadmium may, however, be emitted partly as elemental gaseous
cadmium, but as it is cooled, this cadmium is also quickly bound to particulate matter, so atmospheric
transport of cadmium is governed by aerosol (particle) transport mechanisms.
Scheme 1. Cadmium pollution—transport and cycle. Adapted according to UNEP Lead
and Cadmium activities.
Quite extensive data sets of cadmium concentrations in the water column exist for specific locations
in the world’s oceans and for different years over the last two to three decades. Through the literature
search performed for this review, however, no examples of modelling or other quantification of the
general horizontal transport of cadmium—or any other heavy metals—with ocean currents have been
identified. Only two examples of quantification of the exchange of heavy metals (lead and cadmium)
with ocean currents between one specific ocean, the Arctic Ocean, and neighbouring oceans was
identified. These examples suggest that ocean transport may be an important pathway. In addition, the
presence of cadmium in ammonium and phosphorus fertilizers is other important entry route of
cadmium into the soil [7,8]. The chemistry of cadmium is to a great extent controlled by pH. Cadmium
may be adsorbed on clay minerals, carbonates or hydrous oxides of iron and manganese or may be
precipitated as cadmium carbonate, hydroxide, and phosphate. Under acidic conditions cadmium
solubility increases, and very little adsorption of cadmium by soil colloids, hydrous oxides, and

Sensors 2011, 11
10641
organic matter takes place. Both toxicity and bioavailability of cadmium are influenced by soil
characteristics. Although cadmium is ranked as non-essential heavy metal, it is already toxic to plants,
animals and humans at low doses and acts as a cumulative poison [9,10]. Some cadmium compounds
are relatively water soluble, mobile in soil and bioavailable, depending on the water and soil
chemistries. It tends to bioaccumulate in organs such as the kidney and liver of vertebrates, but aquatic
invertebrates and algae can also build up relatively high concentrations. Effects on birds and mammals
are mainly due to kidney damage. In sea birds and marine mammals in particular, cadmium
accumulates to relatively high levels. Microorganisms are very prone to such accumulation, however,
this phenomenon makes it possible to use some microorganisms as a biosensor for detection of
selected substances contaminating the environment [10]. The mechanisms of metal accumulation by
microorganisms are summarized in Figure 1: (1) metal resistance of microbes is accomplished by
intra- and extracellular mechanisms; (2) metals can be excreted via efflux transport systems;
(3) sequestering compounds of the cytosol can bind and detoxify metals inside the cell; (4) the release
of chelators into the extracellular milieu leads to bound and fixed metals; (5) the structure of the cell
envelope is prone to bind large amounts of metals by sorption thus preventing influx [11]. A great
number of heavy metal resistant bacteria such as Cupriavidus metallidurans and others, is known to
possess efflux transporters that excrete toxic or overconcentrated metals [12-15].
For metal ions to have physiological or toxic effects, they must enter the bacterial cell. Microbial
uptake systems have to be tightly controlled to be able to differentiate between structurally very
similar metal ions. Microorganisms use fast and unspecific uptake systems driven by the chemiosmotic
gradient across the cytoplasmic membrane of bacteria. Membrane transport of cadmium(II) ions at
Staphylococcus aureus has been summarized in [13,16-18]. The toxicity of heavy metal ions inside the
cell may occur through the displacement of essential metals from their native binding sites or through
ligand interactions. Especially heavy metal cations with high atomic numbers, e.g., Hg(II), Cd(II) and
Ag(I), tend to bind SH groups [12,13,19]. By binding to SH groups, the heavy metal ions may inhibit
the activity and/or the functioning of sensitive enzymes. Cations can also be segregated into complex
compounds by thiol-containing molecules while on the other hand some heavy metal ions may be
reduced to less toxic oxidation states [13]. A metal compound that can be reduced should be able to
diffuse out of the cell. Most divalent heavy metal ions are accumulated within the cells by the fast and
unspecific CorA (metal transport system) Mg(II) transport system [13]. Accumulation of Cd(II) in
Gram-positive bacteria leads to the expression of the CadA resistance system (Figure 1), which is
located on plasmid p1258 and related plasmids [12,20-22]. Cation efflux is catalysed by the CadA
protein, which is a P-type adenosine triphosphatase (ATPase). ATP serves as a source of energy
for CadA-catalysed cadmium transport [17]. It has also been found that amplification of Smt
metallothionein (MT) locus increases cadmium resistance and deletion of Smt decreases resistance [23].
A biosensor is an analytical device comprising a biological recognition element (e.g., enzyme,
receptor, DNA, antibody, or microorganism) in intimate contact with an electrochemical, optical,
thermal, or acoustic signal transducer that together permit analyses of chemical properties or
quantities [24].

Sensors 2011, 11
10642
Figure 1. Overview of bacteria cadmium interaction. (A) Cd(II) ions occur in environment
(soil, water, biota); (B) Sorption of Cd(II) on the surface of bacterial wall (protein,
cyrbohydrates); (C) ion transporter (metal transporting system—MIT, which enable Cd(II)
to enter cell; (D) Efflux transporter: CadCA protein, which is a P-type ATPase; (E) Slow
efflux is catalysed by cation-diffusion facilitator CDF; (F) Intracellular sequestration: Smt
metallothionein locus on bacterial chromosome transcript and translate metallothionein,
which binds Cd(II) and, thus, protects a cells against adverse effects of these ions;
(G) cadCA cadmium resistance operon in Staphylococcus aureus on plasmid transcript and
translate CadCA (D). (G) Export of chelating compounds (organic acids), which interact
with Cd(II) ions directly in outer space to form complexes, which can not enter the cell.
Scheme was adopted and modified according to the following papers [11,13,19].
Microorganisms are suitable as biosensors thanks to their fast ―in situ‖ analysis because of rapid
bacterial cell growth and dividing, adaptability, resilience, and their metabolic activity [25-34]. In
terms of construction of biosensors, microorganisms are among the most promising biological
materials, because each cell represents an independent individual, and is therefore usually more
resistant and more durable as compared with cellular components and tissues organisms, which was
experimentally demonstrated [35]. Other advantages include the wide range of substances which cause
a response, because of convergent metabolic pathways [33,36]. Generally, bacterial biosensors most
frequently use electrochemical detectors as the amperometric [37,38], potentiometric [39], or
conductometric [40] methods or optical detectors measuring bioluminescence [41], fluorescence [42]
and/or colorimetric sensing [43]. Microbial biosensors based on the detection of changes in pressure [44]
or respiration [45] are less widely used. Microbial biosensors are well reviewed by Lei et al. [46].
Microorganisms such as biosensors are widely used in healthcare, in control of foodstuffs [47],
agriculture [36] or the environment [48]. Using such biosensors can determine a wide range of organic
compounds such [38], heavy metals [41,49] and other types of xenobiotics [36,39,43,50]. Microbial
biosensors based on genetically modified microorganisms are other well developed area [51,52].
Bioreporters belong to the most promising, whose design uses two key genes that are responsible for
Sensors 2011, 11
10643
producing a measurable signal and analyte-specific recognition and subsequent activation of reporter
genes [53]. Genes are based on contact with a chemical compound or changing physico-chemical
conditions (pH, temperature, osmotic pressure, electric potential), activated when the activation leads to
generation of a specific and easily measurable signal [54,55]. The use of bioreporters can be particularly
advantageous in the detection of contaminated sites, where mixtures of different compounds occur,
usually because bioreporters detect groups of related substances rather than individual chemicals [56].
The aim of this study was to demonstrate the principle and possibilities of metabolic signals
(changes in growth, changes in the content of cadmium(II) ions, glutathione, metallothionein, free thiol
moieties, activity of glutathione-S-transferase, total protein content, metabolism of sucrose, lactose,
fructose, mannose, trehalose, N-acytyl-D-glucosamine, mannitol, urease, phosphatase and arginine) of
Staphylococcus aureus as a biosensor to monitor cadmium(II) ions.
2. Experimental Section
2.1. Chemicals
All chemicals used (of ACS purity) were purchased from Sigma Aldrich (USA) unless noted
otherwise. Cd(NO3)2 was used in our experiments as a source of cadmium(II) ions. Acetate buffer of
pH 5 was prepared with 0.2 M acetic acid and 0.2 M sodium acetate and diluted with water and used as
a supporting electrolyte. High purity deionised water (Milli-Q Millipore 18.2 MΩ/cm, Bedford, MA,
USA) was used in the study.
2.2. Cultivation of Bacterial Strains
Staphylococcus aureus (NCTC 8511) was obtained from the Czech Collection of Microorganisms,
Faculty of Science, Masaryk University, Brno, Czech Republic. Strains were stored as a spore
suspension in 20% (v/v) glycerol at −20 °C. Prior to use in this study, the strains were thawed and the
glycerol was removed by washing with distilled water. The bacterial strain was incubated in the
presence of cultivation medium (meat peptone 5 g L−1
, NaCl 5 g L−1
, bovine extract 1.5 g L−1
, yeast
extract 1.5 g L−1
(HIMEDIA, Mumbai, India)), sterilized MiliQ water with 18 MΩ) at 600 rpm
and 37 °C in Incubator Hood TH 15 (Edmund Buhler GmbH, Hechingen, Germany). pH of the
cultivation medium was adjusted at 7.4 before sterilization. Sterilization was carried out at 121 °C
for 30 min. in sterilizer (BMT, Brno, Czech Republic). Grown bacterial culture was diluted by
cultivation medium to OD600 = 0.1 prior to use in the following experiments. The prepared
medium (10 mL) was pipetted into 25 mL flasks and cadmium(II) ions (0, 1.25, 2.5, 5, 10, 15, 25
and 50 µg mL−1
) were added.
2.3. Growth Curves
Solution containing bacteria, cultivation medium and various concentrations of cadmium(II) ions
was mixed and pipetted into plastic tubes (3 mL) (AnalytikJena, Jena, Germany). Subsequently, a
SPECORD 210 device (AnalytikJena) was used for measuring of the solution absorbance at a
wavelength of 600 nm every 30 min for 24 h. A carousel for eight samples was used. All
measurements were done in five replicates. The resulting absorbance were averaged and recalculated

Sensors 2011, 11
10644
to the control variant, which represented 100%. Cuvette area was thermostated throughout the
experiment to 37 °C (F12/ED Julabo, Seelbach, Germany). The SPECORD device was controlled by
the WinASPECT Version 2.2.7.0 program package (AnalyticJena).
2.4. Preparation of Biological Samples
2.4.1. Spectrophotometric Measurements (Metabolic Parameters, Total Protein Content, Sulfhydryl Groups
and Glutathione-S-Transferase) and Chromatographic Measurements (Reduced and Oxidized Glutathione)
The obtained cells were washed three times with phosphate buffer of pH 7. Weighed bacterial
samples (approximately 0.1 g of fresh weight) were transferred to test-tube (2 mL) (Eppendorf,
Hamburg, Germany), and liquid nitrogen was added. The samples were frozen to disrupt the cells. The
mixture was prepared using a hand-operated ULTRA-TURRAX T8 homogenizer (IKA, Konigswinter,
Germany) at 25,000 rpm for 3 min. The homogenate was transferred to a new test-tube. The mixture
was further homogenised by shaking on a Vortex-2 Genie (Scientific Industries, New York, NY, USA)
at 4 °C for 30 min. The homogenate was centrifuged (14,000 rpm) for 30 min at 4 °C using a Universal
32 R centrifuge (Hettich-Zentrifugen GmbH, Tuttlingen, Germany). Prior to analysis the supernatant
was filtered through a membrane filter (0.45 μm Nylon filter disk, Millipore, Billerica, MA, USA).
2.4.2. Electrochemical Measurement (Cadmium)
Content of cadmium(II) ions was determined in medium and in bacteria as free (without
mineralization) and bound (samples were mineralized). Medium. A sample (2 mL) in a test tube was
centrifuged at 1,500 rpm for 15 min. (Eppendorf). The obtained supernatant was pipetted and 500 µL
of the supernatant was used for the determination of Cd(II) in cultivation medium. Free cadmium(II)
ions in bacteria. The obtained cells were washed three times with phosphate buffer of pH 7. After the
last wash 0.1 M phosphate buffer (pH 7.0, 1.5 mL) was added. The prepared sample was ultrasounded
for 2 min at 40 W using a needle probe (Bandelin, Berlin, Germany). Homogenates were then vortexed
for 5 min at 400 rpm (Genie, New York, NY, USA) and then centrifuged for 15 min at 16,000 rpm
(Eppendorf) prior to electrochemical analysis. Bound cadmium(II) ions in bacteria. The obtained cells
were washed three times with phosphate buffer of pH 7. To prepare the samples microwave digestion
were used according to recently published papers [15,57,58]. Briefly, the mineralization of samples
took place in a microwave system Multiwave3000 (Anton-Paar GmbH, Graz, Austria). A sample (10 mg
of bacteria) was placed into MG5 glass vials and (i) 350 µL of nitric acid (65%, w/w) and 150 µL of
hydrogen peroxide (30%, w/w) or (ii) 700 µL of nitric acid (65%, w/w) and 300 µL of hydrogen
peroxide (30%, w/w) were added. Prepared samples were sealed and placed into a 64MG5 rotor
(Anton-Paar GmbH). The rotor with the samples was inserted into the microwave system and the
microwave digestion was carried out under the following conditions: power 50 W—10 min,
power 100 W—30 min, cooling (power 0 W)—10 min, maximum temperature 80 °C. Sample
preparation for subsequent electrochemical measurements was as follows: 100 µL mineralized sample
was pipetted into Eppendorf tubes with 900 μL acetate buffer (pH = 5.00). A blank digestion was
simultaneously carried out in the same way.

Sensors 2011, 11
10645
2.4.3. Electrochemical Measurement (Metallothionein)
The obtained cells were washed three times with phosphate buffer of pH 7. Weighed bacterial
samples (approximately 0.2 g of fresh weight) were transferred to test-tube (2 mL) (Eppendorf), and
liquid nitrogen was added. The samples were frozen to disrupt the cells. The mixture was prepared
using an ULTRA-TURRAX T8 hand-operated homogenizer (IKA) at 25,000 rpm for 3 min. The
homogenate was transferred to a new test-tube and vortexed for 15 min at 4 °C (Vortex Genie). The
supernatant was subsequently heat treated. The sample was kept at 99 °C in a thermomixer
(Eppendorf, Hamburg, Germany) for 15 min. with occasional stirring, and then cooled to 4 °C. The
denatured homogenates were centrifuged at 4 °C, 15,000 rpm for 30 min. (Eppendorf 5402). Heat
treatment effectively denatures and removes high molecular weight proteins out from samples [59-61].
2.5. Determination of Metabolic Parameters
Determination of urease and phosphatase activities, and quantification of arginine, N-acetyl
β-D-glucosamine, sucrose, trehalose, mannitol, maltose, mannose, lactose and fructose was performed
on a Multiskan EX analyser (ThermoScientific, Waltham, MA, USA). For determination of activities
and/or presence of all mentioned substances, kits purchased from the same company as analyser were
used. The kits were used for on-line monitoring of these substances in living bacteria cultivated in the
special well. Basic principles of measurements of the markers were as follows: urease: the enzyme
urease hydrolyses urea to ammonia, arginine: L-argininedihydrolase hydrolyses L-arginine; phosphatase:
phosphatase hydrolyses nitrophenylphosphate to inorganic phosphate and p-nitrophenyl, N-acetyl
β-D-glucosamine, galactose, sucrose, trehalose, mannitol, mannose, lactose, fructose: they are used as a
source of carbon and energy, during their decomposition acid reaction is formed and detected.
For measurements themselves, chemicals are pipetted in microplate wells. These plates also contained
the above prepared bacterial solutions. Incubation was done at 37 °C (Thermostat, Biosan, Latvia).
Samples were measured at a wavelength of 420 nm and 540 nm. Measurements were carried
each 30 min for 24 h. The device was controlled by the Ascent Software Version 2.6 program package
(ThermoScientific).
2.6. Determination of Total Protein Content, Sulfhydryl Groups and Glutathione-S-Transferase
Spectrophotometric measurements of total protein content, sulfhydryl groups and
glutathione-S-transferase were carried using an automated chemical analyzer BS-200 (Mindray,
Shenzhen, China). Reagents and samples were placed on cooled sample holder (4 ± 1 °C) and
automatically pipetted directly into plastic cuvettes. Incubation proceeded at 37.0 ± 0.1 °C. Mixture
was consequently stirred. The washing steps of pipetting needle with distilled water (18 mΩ) were
done in the midst of the pipetting. The instrument was operated using the BS-200 software (Mindray).
2.6.1. Determination of Total Proteins Content
Determination of total proteins content using Bradford method is described in the following
paper [62]. Briefly, reagent Coomassie Brilliant blue G-250 (0.01% Coomassie Brilliant Blue G-250,
4.7% CH3CH2OH, 8.5% H3PO4, v/v) in volume of 190 µL was pipetted into cuvette. Further, sample
Sensors 2011, 11
10646
(10 µL) was added. Mixture was incubated at 37 °C for 10 min. Absorbance was measured at 595 nm,
reagent itself was used as a blank. Obtained values of absorbance (blank, mixture after 10 min long
incubation) were used for determination of total proteins content. For calibration, bovine serum
albumin (Sigma-Aldrich) was used.
2.6.2. Determination of Sulfhydryl Groups
Ellman’s spectrophotometric method was used for determination of sulfhydryl (-SH) moieties [63].
Ellman’s reagent (277 µL, R1, 2 mM 5.5′-dithiobis(2-nitrobenzoic) acid (DTNB) in 50 mM sodium
acetate CH3COONa) was mixed with sample (45 µL). Further, reagent R2 (33 µL, 1 M trisma base:
CH3COOH) was added. Mixture was incubated at 37 °C for 10 min. Absorbance was measured
at 405 nm. Values of absorbance of reagent R1 itself (blank) and mixture after 10 min. long incubation
were used for determination of total-SH content.
2.6.3. Determination of Glutathione-S-Transferase
The method is based on glutathione-S-transferase (GST) catalysed reaction between reduced
glutathione (GSH) and GST substrate, 1-chloro-2,4-dinitrobenzene (CDNB), which has the broadest
range of isozyme detectability (e.g., alpha-, mu-, pi- and other GST isoforms). Under certain
conditions, the interaction between glutathione and CDNB is dependent on the presence of active GST.
The GST-catalysed formation of GS-DNB produces a dinitrophenylthioether, which can be detected
spectrophotometrically at 340 nm [64]. A 180 µL volume of reactants consisting of 2 mM CDNB and
PBS (1.4 mM NaH2PO4, and 4.3 mM Na2HPO4, pH 7.4) (1:19, v/v, 37 °C) was added to sample in a
plastic microtube. Further, 12.5 mM GSH (30 µL) in 0.1 M phosphate buffer (pH 7.4) was added.
A wavelength of 340 nm was used for determination of GST activity.
2.7. Determination of Metallothionein
Differential pulse voltammetry (DPV) Brdicka reaction measurements were performed with
a 747 VA Stand instrument connected to 746 VA Trace Analyzer and 695 Autosampler (Metrohm,
Zofingen, Switzerland), using a standard cell with three electrodes and cooled sample holder (4 °C)
according to protocol by Fabrik et al. [59]. A hanging mercury drop electrode (HMDE) with a drop
area of 0.4 mm2 was the working electrode. An Ag/AgCl/3M KCl electrode was the reference and
glassy carbon electrode was auxiliary electrode. GPES 4.9 supplied by software EcoChemie was
employed for smoothing and baseline corrections of the obtained data. A supernatant sample (200 µL)
was pipetted into electrochemical cell containing 1,800 µL of Brdicka supporting electrolyte and
measured using DPV. The electrolyte containing 1 mM Co(NH3)6Cl3 and 1 M ammonia buffer
(NH3(aq) + NH4Cl, pH = 9.6) was used and changed per one analysis. DPV parameters were as
follows: initial potential of −0.7 V, end potential of −1.75 V, modulation time 0.057 s, time
interval 0.2 s, step potential 2 mV, modulation amplitude −250 mV, Eads = 0 V. All experiments were
carried out at a temperature of 4 °C (Julabo F12 cooler).

Sensors 2011, 11
10647
2.8. Determination of Cadmium by Differential Pulse Voltammetry
Electrochemical analyser was used for determination of Cd(II) [25,65-67]. The analyser (757 VA
Computrace, Metrohm AG, Zofingen, Switzerland) employs a conventional three-electrode
configuration with a hanging mercury drop electrode (HMDE) working electrode: 0.4 mm2,
Ag/AgCl/3MKCl as reference electrode, and a platinum auxiliary electrode. The following setup
assembled of automated voltammetric analysis is supplied by Metrohm. An autosampler (Metrohm 813
Compact Autosampler) performs the sequential analysis of up to 18 samples in plastic test tubes. For
the addition of standard solutions and reagents, two automatic dispensers (Metrohm 765 Dosimat) are
used, while two peristaltic pumps (Metrohm 772 Pump Unit, controlled by Metrohm 731 Relay Box)
are employed for transferring the rinsing solution in the cell and for removing solutions from the
voltammetric cell. Differential pulse voltammetric measurements were carried out under the following
parameters: deoxygenating with argon 90 s; deposition potential −0.8 V; time of deposition 240 s; start
potential −0.8 V; end potential 0.15 V; pulse amplitude 0.025 V; pulse time 0.04 s; step
potential 5.035 mV; time of step potential 0.4 s.
2.9. Determination of Reduced and Oxidized Glutathione
Reduced (GSH) and oxidized (GSSG) glutathione was determined using high performance liquid
chromatography with electrochemical detection (HPLC-ED) [68]. The chromatographic system
consisted of two solvent delivery pumps operating in the range of 0.001–9.999 mL min−1
(Model 582
ESA Inc., Chelmsford, MA, USA), Zorbax eclipse AAA C18 (150 × 4.6; 3.5 µm particle size; Agilent
Technologies, Santa Clara, CA, USA) and a CoulArray electrochemical detector (Model 5600A,
ESA). The electrochemical detector includes three flow cells (Model 6210, ESA). Each cell consists of
four working carbon porous electrodes, each one with auxiliary and dry Pd/H2 reference electrodes.
Both the detector and the reaction coil/column were thermostated. The sample (20 μL) was injected
using autosampler (Model 542 HPLC, ESA). Samples were kept in the carousel at 8 °C during the
analysis. The column was thermostated at 32 °C. Mobile phase consisted of 80 mM TFA (A) and
methanol (B). The compounds of interest were separated by the following linear gradient: 0 → 1 min
(3% B), 1 → 2 min (10% B), 2 → 5 min (30% B), 5 → 6 min (98% B). Mobile phase flow rate
of 1 mL/min, working electrode potential 900 mV. Time of analysis was 20 min.
2.10. Preparation of Deionised Water and pH Measurement
Deionised water was prepared using Aqual 25 reverse osmosis equipment (Sigma Aldrich,
St. Louis, MO, USA). The deionised water was further purified by using apparatus MiliQ Direct QUV
equipped with the UV lamp. The resistance was 18 MΩ. The pH was measured using pH meter
Accurate 7110 (WTW inoLab, Weilheim, Germany).
2.11. Mathematical Treatment of Data and Estimation of Detection Limits
Mathematical analysis of the data and their graphical interpretation was realized by the Matlab
(version 7.11) software. Results are expressed as mean ± standard deviation (S.D.) unless noted
otherwise (EXCEL®
). The detection limits (3 signal/noise, S/N) and quantification limits (10 S/N)

Sensors 2011, 11
10648
were calculated according to Long and Winefordner [69], whereas N was expressed as standard
deviation of noise determined in the signal domain unless stated otherwise. Accuracy, precision and
recovery of cadmium(II) ions were evaluated with homogenates (bacterial samples) spiked with
standards. Before extraction, 100 µL cadmium(II) ions standards and 100 µL water were added to
bacterial samples. Homogenates were assayed blindly and cadmium(II) ions concentrations were
derived from the calibration curves. Accuracy was evaluated by comparing estimated concentrations
with known concentrations of heavy metals compounds. Calculation of accuracy (%Bias), precision
(%C.V.), root mean square error (RMS error) and recovery was carried out as indicated according to
Causon [70] and Bugianesi et al. [71]. Equilibrium diagrams plotted using sophisticated algorithms
(MEDUSA program) were used for the construction of a distribution diagram of different cadmium
chemical forms present in the supporting electrolyte [72,73]. The basic parameters, including
equilibrium constants that are necessary for the calculation of distribution diagrams are in the program
database. The program author is Ignasi Puigdomenech from the Inorganic Chemistry of Royal Institute
of Technology, Stockholm, Sweden. The MEDUSA program is freeware and is available on
http://www.kemi.kth.se/medusa.
3. Results and Discussion
Transport of heavy metal ions in bacterial systems is not clear and requires further research.
Bacterial sensors for detecting toxic substances including heavy metal ions belong to the areas
receiving considerable attention. The reason for the use of living organisms as a sensor is the fact that
living ―bio‖ part of detection system is possible to obtain information of the effect of toxic substance
on a cell together with obtaining the information about type of pollutant and its concentration.
3.1. Electrochemical Detection of Cadmium(II) Ions
The mercury drop electrode has been using for the determination of heavy metals since the
discovery of polarography by Prof. Heyrovsky. The method is very simple and low cost and the
technology is also easy to automate [74]. In previously published papers, it is shown that cadmium
ions can be detected well in acidic environments. Acetate buffer seems to be very suitable for this
purpose, however, nature of the electrode process is not very clear [15,65]. To detect cadmium(II)
ions, adsorptive stripping technique, in which heavy metals (cadmium) dissolve in mercury by forming
amalgams, is used. Measurements are based on a preconcentration potential of −1.1 V (vs. Ag/AgCl) at
a suitable deposition time, according to the following reaction: Cd2+
+ ne− → Cd(Hg) and reoxidizing
step these metal into the solution: Cd(Hg) → Cd2+
+ ne− [75]. Typical dependencies of peak height of
cadmium(II) ions on their concentrations measured in the presence of acetate buffer pH 4, 5 and 6 are
shown in Figure 2(A). The obtained calibration curves were linear within tested concentration interval
from 0.25 nM to 100 nM and are shown in Table 1.
Sensors 2011, 11
10649
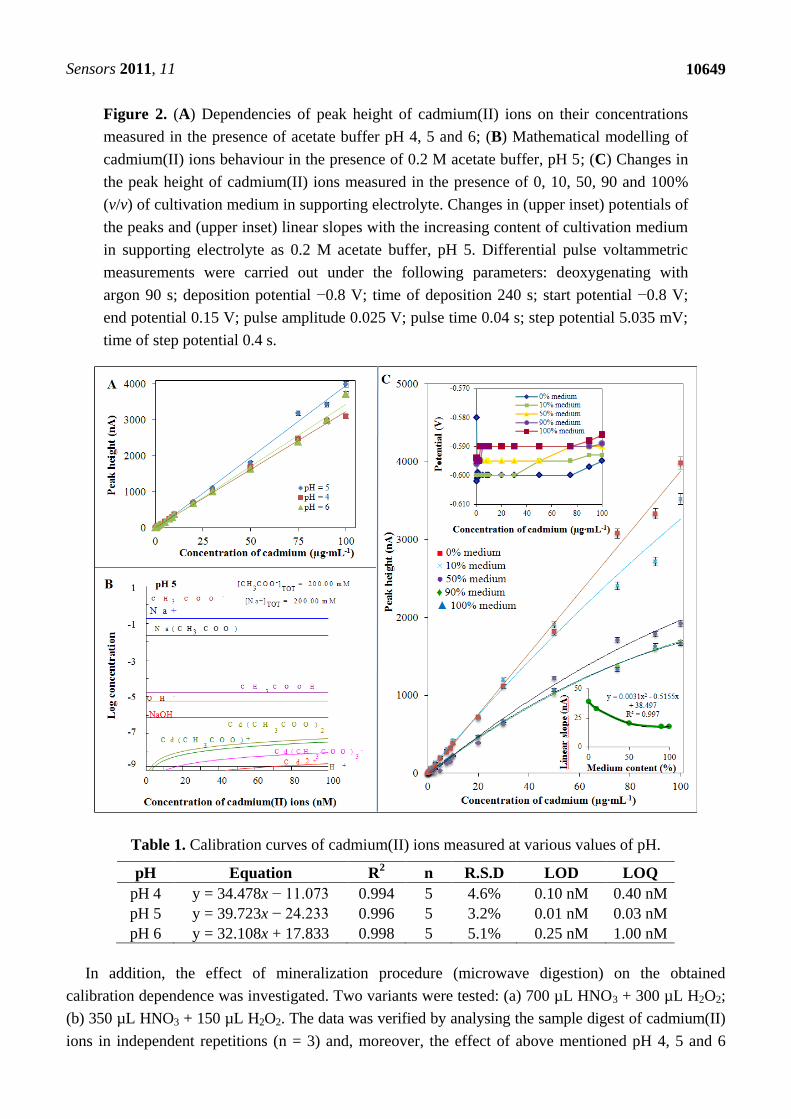
Figure 2. (A) Dependencies of peak height of cadmium(II) ions on their concentrations
measured in the presence of acetate buffer pH 4, 5 and 6; (B) Mathematical modelling of
cadmium(II) ions behaviour in the presence of 0.2 M acetate buffer, pH 5; (C) Changes in
the peak height of cadmium(II) ions measured in the presence of 0, 10, 50, 90 and 100%
(v/v) of cultivation medium in supporting electrolyte. Changes in (upper inset) potentials of
the peaks and (upper inset) linear slopes with the increasing content of cultivation medium
in supporting electrolyte as 0.2 M acetate buffer, pH 5. Differential pulse voltammetric
measurements were carried out under the following parameters: deoxygenating with
argon 90 s; deposition potential −0.8 V; time of deposition 240 s; start potential −0.8 V;
end potential 0.15 V; pulse amplitude 0.025 V; pulse time 0.04 s; step potential 5.035 mV;
time of step potential 0.4 s.
Table 1. Calibration curves of cadmium(II) ions measured at various values of pH.
pH Equation R2 n R.S.D LOD LOQ
pH 4 y = 34.478x − 11.073 0.994 5 4.6% 0.10 nM 0.40 nM
pH 5 y = 39.723x − 24.233 0.996 5 3.2% 0.01 nM 0.03 nM
pH 6 y = 32.108x + 17.833 0.998 5 5.1% 0.25 nM 1.00 nM
In addition, the effect of mineralization procedure (microwave digestion) on the obtained
calibration dependence was investigated. Two variants were tested: (a) 700 µL HNO3 + 300 µL H2O2;
(b) 350 µL HNO3 + 150 µL H2O2. The data was verified by analysing the sample digest of cadmium(II)
ions in independent repetitions (n = 3) and, moreover, the effect of above mentioned pH 4, 5 and 6
Sensors 2011, 11
10650
of acetate buffer was tested. Recoveries of cadmium(II) ions varied within the interval from 98.5
to 100.5% in the tested samples. The obtained calibration dependencies measured in samples
mineralized by both above mentioned procedures were strictly linear for (a) R2 = 0.9968 and
(b) R2 = 0.9942. There were observed marked differences in mineralization process expressed as
slopes of the calibration curves as (a) 5.8 and (b) 4.4. The difference is significant and means a
decrease of analytical signal for more than 20%. Therefore, the mineralization variant
(a) (350 µL HNO3 + 150 µL H2O2) was used in the following experiments.
The distribution of individual forms of cadmium complexes (at a concentration from 0 to 100 nM)
in the presence of 200 mM acetate buffer of pH 5 is shown in Figure 2(B). Given our objective to
study the effects of cadmium(II) ions on bacterial culture of S. aureus, it was necessary to monitor the
effects of interactions between cadmium(II) ions and the cultivation medium (its composition is
described in the Experimental Section and is a very complex matrix, hardly defined). Components of
the medium react with cadmium(II) ions very intensely, as it is shown in Figure 2(C). Interactions
between cadmium(II) ions and ions of cultivation medium was studied after 60 min. of their mixing
at 20 °C. Cadmium(II) ion peak height measured in the presence of 100% cultivation medium
decreased for more than 70% compared to cadmium(II) ions standard. Addition of medium to
supporting electrolyte led to a shift of the peak height for 10 mV to more positive potentials (in upper
inset in Figure 2(C)). The apparent interaction between the components of medium and cadmium(II)
ions was expressed by slopes of the measured dependencies (Figure 2(C)). It is obvious that the linear
model is less suitable for describing of dependencies shown in Figure 2(C). Confidence coefficients
are higher than 0.98 (Table 2). Using a polynomial mathematical models seems to be more convenient
(Table 1) due to the fact that confidence coefficients are higher than 0.99. Slopes of the dependencies
decreased with the increasing content of cultivation medium for 2 nA per 1% of the medium. Decrease
in the slope was faster within the range of the addition of medium from 1 to 50%, at higher levels of
medium there was moderate decrease in slope (see in bottom inset in Figure 2(C)). There is still not
enough attention paid to the issue of the interactions between the components of cultivation medium
and the actual concentration of compound of interest. These changes should be taken into account
when one may monitor heavy metals in the environment.
Table 2. The effect of cultivation medium additions into supporting electrolyte on
cadmium(II) ions peak height.
Sample Linear model R2 n R.S.D (%) Polynomial model R
2
Acetate buffer y = 39.049x − 20.494 0.9970 5 0.95 y = 0.0298x2 + 36.342x − 4.9257 0.9973
Add 10% medium y = 32.935x + 43.672 0.9892 5 1.35 y = −0.0505x2 + 37.517x + 17.321 0.9903
Add 50% medium y = 20.614x − 0.1286 0.9875 5 1.88 y = −0.0681x2 + 26.797x − 35.691 0.9929
Add 80% medium y = 17.546x + 36.594 0.9882 5 2.49 y = −0.0791x2 + 24.724x − 4.6941 0.9981
Add 100% medium y = 17.663x + 29.924 0.9915 5 3.10 y = −0.0702x2 + 24.04x − 6.7551 0.9993
R2 confidence coefficient, n number of independent measurements, R.S.D. relative standard deviation (%).
3.2. Detection of Cadmium(II) Ions in Bacterial Samples
The interactions between cadmium(II) ions and S. aureus are not fully understood [18]. The
resistance to cadmium connected with some plasmids and fragments called cadD and cadX regions
Sensors 2011, 11
10651
was described [76]. A phenotypic association between reduced susceptibility to zinc and methicillin
resistance in S. aureus was recently reported. The authors showed that czrC encodes zinc and cadmium
resistance in CC398 MRSA isolates, and that it is widespread in both humans and animals. Thus,
resistance to heavy metals such as zinc and cadmium may play a role in the selection of methicillin
resistance in S. aureus [77]. These facts open up new possibilities for understanding the possible
processes behind resistance of microorganisms to antibiotics. Sensor based monitoring can be
beneficial to produce better technical ways of treating bacterial infections. In this study, after the above
mentioned characterization and optimization steps, levels of cadmium(II) ions were determined in
cultivation medium obtained after treatment of S. aureus with cadmium(II) ions as described in the
Experimental section. The dependence of cadmium(II) ion content in cultivation medium is shown in
Figure 3(A). As expected, the dependence is strictly linear, but the amount of free Cd(II) ranged
between 23–30% of the total content of cadmium(II) ions added into the medium (green columns in
Figure 3(A)).
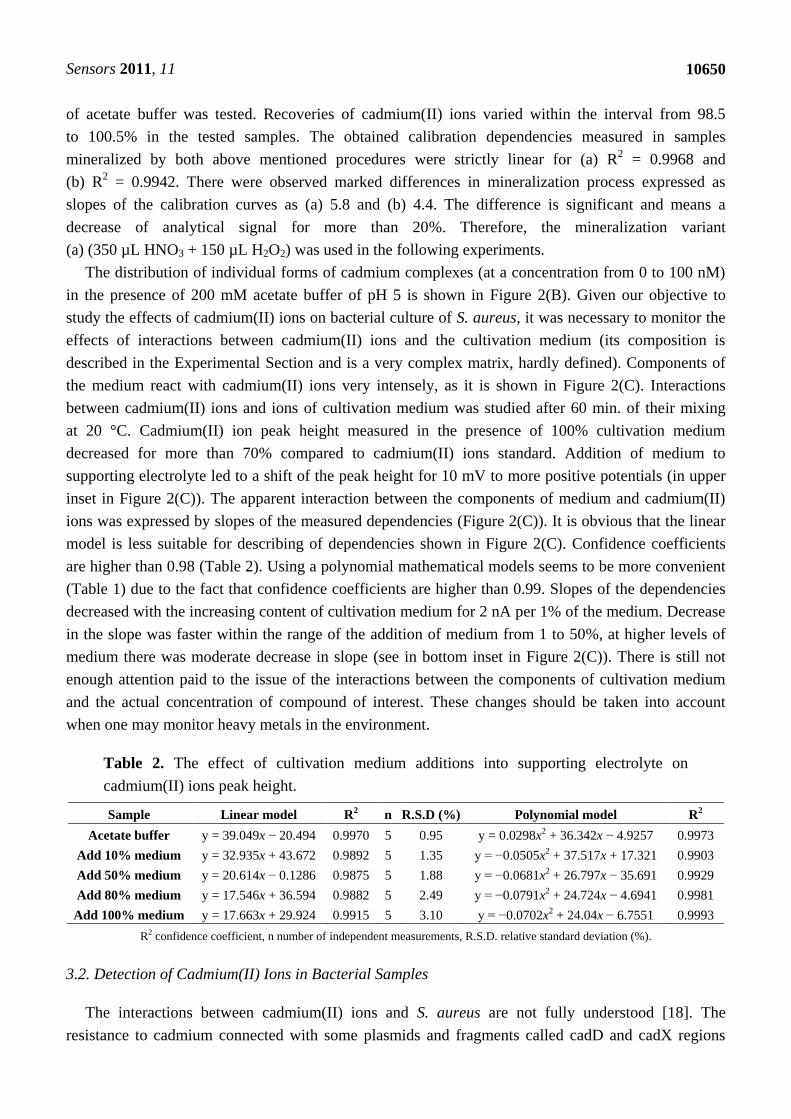
Figure 3. (A) Dependence of free Cd(II) content in cultivation medium on the applied
concentration of cadmium(II) ions; green columns represent ratio as follows—(determined
content of Cd(II)/given content of Cd(II)) × 100; (B) Free Cd(II) content in bacteria cells;
(C) Content of bound Cd(II) in bacteria cells; in inset: correlation between free and bound
Cd(II) content. Ratios between medium Cd(II) content, and bound and free Cd(II) content
in bacterial cell (D). Other experimental conditions are given in Figure 2.

Sensors 2011, 11
10652
In addition, contents of free and bound cadmium(II) ions in bacterial cells were determined.
Figure 3(B) shows the change in free Cd(II) with the increasing applied concentration. The content of
free Cd(II) increased up to dose of 250 μg Cd(II) in 25 mL of cultivation medium and, after that, the
increase in free Cd(II) content was more gradual. The content of bound Cd(II) increased linearly with
the applied concentration of Cd(II) (Figure 3(C)). The inset in Figure 3(C) shows the correlation
between bound and free Cd(II) content. The observed dependence shows the two processes, which can
be defined by the changes in the behaviour of cadmium(II) accumulation detected after exceeding of
free Cd(II) content of 20 µg·mg−1
protein. Figure 3(D) summarizes the ratios between free and bound
content of Cd(II) and content of Cd(II) in medium. The highest content Cd(II) was observed bound to
the surface of S. aureus cell wall as it was expected. Moreover, Cd(II) content in bacterial cells
decreased with the increasing applied concentration, which can be associated with triggering of a
number of defence mechanisms against uptake of cadmium(II) ions.
3.3. Growth of S. aureus Treated with Cadmium(II) Ions
Growth of bacterial cells is among the important characteristics of the interactions between bacteria
and toxic compounds. For this purpose, growth characteristics were monitored spectrophotometrically
using OD measured at 605 nm.
Figure 4. Spectrophotometric analysis of cadmium(II) ions treated Staphylococcus aureus.
(A) Dependencies of growth of bacteria on the applied concentration of cadmium(II) ions
(0, 1.25, 2.5, 5, 10, 15, 25 and 50 µg·mL−1
) monitored for 24 h. At the beginning of the
experiment bacterial culture growing for 24 h was used. From this bacterial culture,
starting culture with OD 0.1 (104 cells per mL) was prepared; (B) The growth of
cadmium(II) ions treated bacterial cells expressed as OD (absorbance measured at 605 nm)
measured at the end of the treatment; in inset: the dependence obtained within the
concentration range from 0 to 30 µg of Cd(II) per mL. Growth of the cultures was
determined fully automatically for 24 h at 37 °C without shaking of each culture (n = 3).

Sensors 2011, 11
10653
Figure 4. Cont.
At the beginning of the experiment bacterial culture growing for 24 h was used. From this bacterial
culture, starting culture with OD 0.1 (104 cells per mL) was prepared. A marked increase in growth of
S. aureus without the presence of Cd(II) was detected and this is shown in Figure 4(A).
Due to the additions of different concentrations of cadmium(II) ions, start of the exponential growth
phase and lag phase were shifted. The applied concentration of Cd(II) (50 µg·mL−1
) was significantly
inhibitory for the bacterial culture of S. aureus used in this study. In addition, we plotted the growth
expressed as OD (absorbance measured at 605 nm) measured in the end of the treatment (24 h). The
obtained dependence is shown in Figure 4(B). The resulting changes in the intensity of growth shown
in Figure 4(B) are similar to those for growth inhibition of S. aureus bacterial strain RN4220 [76].
A mathematical model for the whole tested concentration range was used to describe dependence
shown in Figure 4(B). The model had the following equation: y = 115.16e−0.106x
, R2 = 0.932. In the
concentration range from 0 to 30 µg of Cd(II) per mL, the dependence of the linear nature with the
following equation y = −2.0537x + 70.016, R2 = 0.9641 was obtained and is shown in inset
Figure 4(B). The obtained experimental data clearly shows that the bacterial culture used is very
sensitive to the applied concentration of Cd(II) at levels greater than 30 µg·mL−1
and is well suited to
assess environmental contamination by heavy metals.
Our aim was to characterize the bacterial culture used with regard to its potential application in
biosensors. Therefore, we also studied a group of biologically important molecules. Molecules
connected with thiol (–SH) metabolism were investigated first. Levels of GSH, GSSG and GSH/GSSG
were monitored using well established high-performance liquid chromatography with electrochemical
detection. Typical chromatograms of cell lysates of S. aureus treated with cadmium(II) ions are shown
in Figure 5(A). GSH was detected at a retention time (RT): 4.8 min. and GSSG at RT = 5.9 min. Both
signals were well separated and readily detectable. The amount of GSH increased with the increasing
concentration of applied cadmium(II) ions linearly up to 20 µg·mL−1
. After that the changes were more
gradual and the course of the obtained dependence well fit with the polynomial model:
y = −0.0557x2 + 5.098x − 0.4749, R
2 = 0.987 (Figure 5(B)). Similarly, GSSG levels were changed, but

Sensors 2011, 11
10654
GSSG level does not change in an organism without oxidative stress. It clearly follows from the results
obtained that there are apparent dramatic increases in GSSG levels with the increasing applied
concentration of cadmium(II) ions according to the following equation: y = −0.0081x2 + 0.9085x + 0.6926,
R2 = 0.990 (24 h long cultivation, Figure 5(C)). Monitoring of oxidative stress in S. aureus is a very
good indicator of environmental pollution with heavy metals. Moreover, GSH/GSSG ratio is also good
indicator. From the point of view of the importance of both GSH and GSSG, the ratio above 9 shows
good redox pool maintenance. Decreases of this ratio are a good indicator of oxidative stress in a cell
and, therefore, indicates also the presence of some xenobiotics. It is not surprising that a ratio lower
than 4 falls within the area of oxidative stress and lower than 2 means high oxidative stress with
membrane damage and alteration of other biological functions (Figure 5(D)).
Figure 5. (A) HPLC-ED chromatograms of cell lysates of S. aureus treated with
cadmium(II) ions measured at 900 mV. Changes in the content of (B) GSH and (C) GSSG,
and (D) GSH/GSSG ratio in cadmium(II) ion-treated S. aureus; (E) DP voltammograms of
MT isolated from treated S. aureus; (F) Dependence of MT and MT-like proteins levels on
the applied cadmium(II) ions concentration. Other experimental conditions are given in
Figure 4 and in the Experimental section.
Metallothioneins (MT) as major proteins with heavy metals detoxification functions play an
important role in protective mechanisms [65,78,79]. Typical Brdicka voltammograms of MT and
MT-like proteins determined in Staphylococcus aureus are shown Figure 5(E). The catalytic signal

Sensors 2011, 11
10655
called Cat2, which is used for quantification of proteins of interest [65,80-84], was detected at −1.55 V.
The height of this peak was enhanced with the applied concentration of cadmium(II) ions according to
the following equation: y = −0.006x2 + 0.8222x + 0.8527, R
2 = 0.987.
Total proteins content directly corresponds to the activity of individual cells. In Figure 6(A) the
dramatic decrease in total protein content at an applied concentration of cadmium(II) ions as low
as 5 µg·mL−1
is clearly indicated. This decrease can be clearly associated with alteration of bacterial
growth and, thus, with damage to some important biochemical pathways. Besides total proteins
content, glutathione is a very important detoxifying molecule and must be activated by the enzyme
called glutathione-S-transferase (GST). GST activity exhibited a behaviour similar to other thiol
compounds, which means that the activity was enhanced with the increasing applied concentration of
cadmium(II) ions according to the following equation: y = −1.5031x2 + 188.31x + 157.75, R
2 = 0.988.
The dependence is shown in Figure 6(B). Therefore, we also aimed to determine free –SH moieties.
Their concentration was also enhanced with the increasing applied concentration of cadmium(II)
according to the following equation: y = −0.0887x2 + 9.7638x + 7.4024, R
2 = 0.987. The dependence is
shown in Figure 6(C). Moreover, we attempted to correlate GST activity and concentration of free
–SH moieties, which is shown in the inset in Figure 6(C). A strong correlation between these markers
(R2 = 0.992) was found. Table 3 presents the correlation coefficients between levels of thiols. A strong
link between the content of MT, GST, GSSG and –SH moieties was revealed. Correlation analysis
revealed a strong positive correlation, because the correlation coefficients was always higher than
R2 = 0.990. This can be clearly associated with simultaneous triggering of protective mechanisms due
to the stress caused by cadmium(II) ions.
Figure 6. Spectrophotometric determination of (A) total proteins content by the Biuret
method, (B) GST activity and (C) concentration of free –SH moieties; in inset: correlation
between GST activity and free –SH moieties concentration. Other experimental conditions
are given in Figure 4 and in the Experimental section.
Sensors 2011, 11
10656
Table 3. Correlation coefficients between levels of MT, GST, GSSG and –SH moieties
determined in S. aureus treated with cadmium(II) ions.
GST –SH GSSG GSH
MT 0.994 0.994 0.992 0.911
GST x 0.992 0.993 0.907
–SH x x 0.997 0.940
GSSG x x x 0.943
p = 0.05, n = 3.
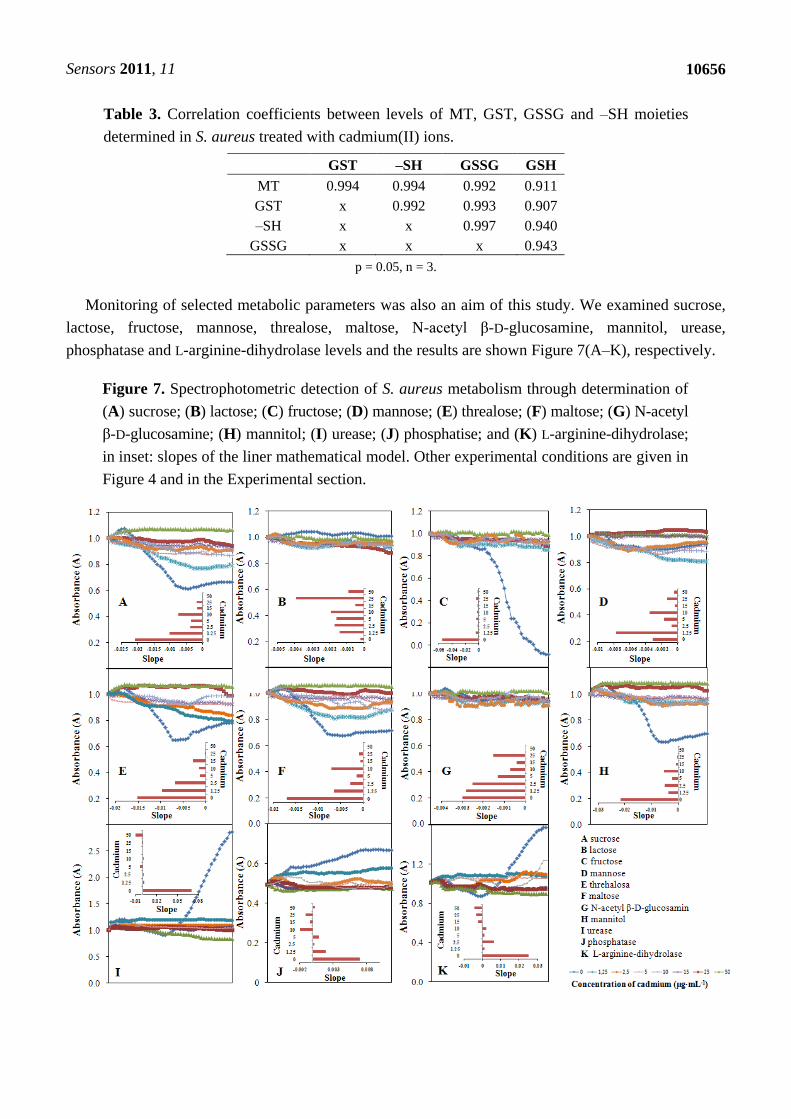
Monitoring of selected metabolic parameters was also an aim of this study. We examined sucrose,
lactose, fructose, mannose, threalose, maltose, N-acetyl β-D-glucosamine, mannitol, urease,
phosphatase and L-arginine-dihydrolase levels and the results are shown Figure 7(A–K), respectively.
Figure 7. Spectrophotometric detection of S. aureus metabolism through determination of
(A) sucrose; (B) lactose; (C) fructose; (D) mannose; (E) threalose; (F) maltose; (G) N-acetyl
β-D-glucosamine; (H) mannitol; (I) urease; (J) phosphatise; and (K) L-arginine-dihydrolase;
in inset: slopes of the liner mathematical model. Other experimental conditions are given in
Figure 4 and in the Experimental section.
Sensors 2011, 11
10657
Bacterial culture (100 µL, OD605 0.1) was pipetted into the wells of plates (STAPHYtest, Lachema).
Then, cadmium(II) ions were added in the following final concentrations (0, 1.25, 2.5, 5, 10, 15, 25
and 50 µg mL−1
). Concentration of the metabolites of interest was determined at 15 min intervals
for 24 h. Then, these dependencies were plotted and the slopes of the linear regressions are shown in
the insets in Figure 7. The main group of these parameters represent changes in sugar metabolism
(sucrose, lactose, fructose, mannose, threhalose, malthose, N-acetyl-D-glucosamine, mannitol) and
three enzymes: urease, phosphatase and L-arginine-dihydrolase. Marked differences were observed in
mannose, malthose and mannitol metabolism (Figure 7). Similarly, changes were observed in the
activity of urease. Some changes in sucrose, fructose, trehalose, phosphatase and L-arginine
dihydrolase were also measured, but these can be used for biosensing only in limited intervals. Lactose
and N-acetyl-D-glucosamine showed no significant changes and these markers are certainly not
suitable for use in sensors (Figure 7).
4. Conclusions
Metal ions that tend to accumulate in organisms is one of the greatest problems associated with
heavy metals in the environment. Heavy metals can be thus accumulate through the food chain with
the top being represented by predators. Food chain networks in sea are one of the most highly damaged
environments. Coastal fish (such as the smooth toadfish) and seabirds (such as the Atlantic puffin) are
often monitored for the presence of such contaminants. Biosensors help to monitor food safety and
quality and to detect environmental pollution. In this study, the obtained experimental data provides
basic information on the possible use of a range of biomolecules produced by a bacterial cell (S. aureus
strain) as markers of metal pollution together with the fact that S. aureus can be employed as part of a
biosensor. This paper is mainly aimed at the finding of the appropriate low molecular mass
compounds, which are produced in higher or lower concentrations in bacteria as a response to stress
caused by the presence of heavy metal ions. The results can be used for sensing of these toxic ions by
combining spectrometry and/or electrochemistry and living bacteria. These types of sensors are of
great interest because of the possibility of on-line monitoring they offer.
Acknowledgments
The financial support from the following projects IGA MENDELU 2/2011(IGA-32-A2),
INCHEMBIOL MSM0021622412 (INCH 3.2011.6.11) and CEITEC CZ.1.05/1.1.00/02.0068 is highly
acknowledged. The authors would like to express their thanks to Petr Koudelka for technical assistance.
References
1. Han, F.X.X.; Banin, A.; Su, Y.; Monts, D.L.; Plodinec, M.J.; Kingery, W.L.; Triplett, G.E.
Industrial age anthropogenic inputs of heavy metals into the pedosphere. Naturwissenschaften
2002, 89, 497-504.
2. UNEP. Lead (pb) and Cadmium (Cd) at the 26th Session of the Governing Council Nairobi 21
to 24 February 2011; Available online: http://www.unep.org/hazardoussubstances/LeadCadmium/
ScientificReviews/PreparationforGC26/tabid/6749/Default.aspx (accessed on 16 September 2011).

Sensors 2011, 11
10658
3. Agency for Toxic Substance and Disease Registry (ATSDR), US Toxicological Profile for Cadmium;
Department of Health and Humans Services, Public Health Service, Centers for Disease Control:
Atlanta, GA, USA; Available online: http://www.atsdr.cdc.gov/toxprofiles/tp5.pdf (accessed on
16 September 2011).
4. Garrett, R.G. Natural sources of metals to the environment. Hum. Ecol. Risk Assess. 2000, 6,
945-963.
5. Johansson, C.; Norman, M.; Burman, L. Road traffic emission factors for heavy metals. Atmos.
Environ. 2009, 43, 4681-4688.
6. Ohms, D.; Kohlhase, M.; Benczur-Urmossy, G.; Schadlich, G. New developments on high power
alkaline batteries for industrial applications. J. Power Sources 2002, 105, 127-133.
7. He, Q.B.; Singh, B.R. Crop uptake of cadmium from phosphorus fertilizers. 2. Relationship with
extractable soil cadmium. Water Air Soil Pollut. 1994, 74, 267-280.
8. Mazen, A.; Faheed, F.A.; Ahmed, A.F. Study of potential impacts of using sewage sludge in the
amendment of desert reclaimed soil on wheat and jews mallow plants. Braz. Arch. Biol. Technol.
2010, 53, 917-930.
9. Huff, J.; Lunn, R.M.; Waalkes, M.P.; Tomatis, L.; Infante, P.F. Cadmium-induced cancers in
animals and in humans. Int. J. Occup. Environ. Health 2007, 13, 202-212.
10. Haouem, S.; Najjar, M.F.; El Hani, A.; Sakly, R. Accumulation of cadmium and its effects on
testis function in rats given diet containing cadmium-polluted radish bulb. Exp. Toxicol. Pathol.
2008, 59, 307-311.
11. Haferburg, G.; Kothe, E. Microbes and metals: Interactions in the environment. J. Basic
Microbiol. 2007, 47, 453-467.
12. Nies, D.H. The cobalt, zinc, and cadmium efflux system CzcABC from alcaligenes-eutrophus
functions as a cation-proton antiporter in Escherichia-coli. J. Bacteriol. 1995, 177, 2707-2712.
13. Nies, D.H. Microbial heavy-metal resistance. Appl. Microbiol. Biotechnol. 1999, 51, 730-750.
14. Nies, D.H. Efflux-mediated heavy metal resistance in prokaryotes. FEMS Microbiol. Rev. 2003,
27, 313-339.
15. Majzlik, P.; Strasky, A.; Adam, V.; Nemec, M.; Trnkova, L.; Zehnalek, J.; Hubalek, J.;
Provaznik, I.; Kizek, R. Influence of zinc(II) and copper(II) ions on streptomyces bacteria
revealed by electrochemistry. Int. J. Electrochem. Sci. 2011, 6, 2171-2191.
16. Nucifora, G.; Chu, L.; Misra, T.K.; Silver, S. Cadmium resistance from Staphylococcus aureus
plasmid pi258 cada gene results from a cadmium-efflux atpase. Proc. Natl. Acad. Sci. USA 1989,
86, 3544-3548.
17. Silver, S.; Nucifora, G.; Chu, L.; Misra, T.K. Bacterial-resistance atpases—Primary pumps for
exporting toxic cations and anions. Trends Biochem. Sci. 1989, 14, 76-80.
18. Tynecka, Z.; Malm, A.; Skwarek, T. Effect of Cd2+
on growth of the cadmium-resistant and
cadmium-sensitive Staphylococcus aureus. Acta Microbiol. Polonica 1989, 38, 117-129.
19. Bruins, M.R.; Kapil, S.; Oehme, F.W. Microbial resistance to metals in the environment.
Ecotoxol. Environ. Saf. 2000, 45, 198-207.
20. Novick, R.P.; Roth, C. Plasmid-linked resistance to inorganic salts in Staphylococcus aureus.
J. Bacteriol. 1968, 95, 1335-1342.

Sensors 2011, 11
10659
21. Silver, S.; Walderhaug, M. Gene-regulation of plasmid-determined and chromosome-determined
inorganic-ion transport in bacteria. Microb. Rev. 1992, 56, 195-228.
22. Tynecka, Z.; Gos, Z.; Zajac, J. Reduced cadmium transport determined by a resistance plasmid in
Staphylococcus aureus. J. Bacteriol. 1981, 147, 305-312.
23. Turner, J.S.; Morby, A.P.; Whitton, B.A.; Gupta, A.; Robinson, N.J. Construction of Zn2+
/Cd2+
hypersensitive cyanobacterial mutants lacking a functional metallothionein locus. J. Biol. Chem.
1993, 268, 4494-4498.
24. Gronow, M. Biosensors. Trends Biochem. Sci. 1984, 9, 336-340.
25. Huska, D.; Zitka, O.; Krystofova, O.; Adam, V.; Babula, P.; Zehnalek, J.; Bartusek, K.;
Beklova, M.; Havel, L.; Kizek, R. Effects of cadmium(II) ions on early somatic embryos of
norway spruce studied by using electrochemical techniques and nuclear magnetic resonance. Int. J.
Electrochem. Sci. 2010, 5, 1535-1549.
26. Sochor, J.; Majzlik, P.; Salas, P.; Adam, V.; Trnkova, L.; Hubalek, J.; Kizek, R. A study of
availability of heavy metal ions by using various exracction procedures and electrochemical
detection. Lis. Cukrov. Repar. 2010, 126, 414-415.
27. Zitka, O.; Huska, D.; Adam, V.; Horna, A.; Beklova, M.; Svobodova, Z.; Kizek, R. Coularray
detector as a tool for estimation of acute toxicity of silver(I) ions. Int. J. Electrochem. Sci. 2010,
5, 1082-1089.
28. Daunert, S.; Barrett, G.; Feliciano, J.S.; Shetty, R.S.; Shrestha, S.; Smith-Spencer, W. Genetically
engineered whale-cell sensing systems: Coupling biological recognition with reporter genes.
Chem. Rev. 2000, 100, 2705-2738.
29. Ramanathan, S.; Ensor, M.; Daunert, S. Bacterial biosensors for monitoring toxic metals. Trends
Biotechnol. 1997, 15, 500-506.
30. Stocker, J.; Balluch, D.; Gsell, M.; Harms, H.; Feliciano, J.; Daunert, S.; Malik, K.A.;
van der Meer, J.R. Development of a set of simple bacterial biosensors for quantitative and
rapid measurements of arsenite and arsenate in potable water. Environ. Sci. Technol. 2003, 37,
4743-4750.
31. Badihi-Mossberg, M.; Buchner, V.; Rishpon, J. Electrochemical biosensors for pollutants in the
environment. Electroanalysis 2007, 19, 2015-2028.
32. Neufeld, T.; Schwartz-Mittelmann, A.; Biran, D.; Ron, E.Z.; Rishpon, J. Combined phage typing
and amperometric detection of released enzymatic activity for the specific identification and
quantification of bacteria. Anal. Chem. 2003, 75, 580-585.
33. Paitan, Y.; Biran, D.; Biran, I.; Shechter, N.; Babai, R.; Rishpon, J.; Ron, E.Z. On-line and in situ
biosensors for monitoring environmental pollution. Biotechnol. Adv. 2003, 22, 27-33.
34. Biran, I.; Babai, R.; Levcov, K.; Rishpon, J.; Ron, E.Z. Online and in situ monitoring of
environmental pollutants: Electrochemical biosensing of cadmium. Environ. Microbiol. 2000, 2,
285-290.
35. Biran, I.; Rissin, D.M.; Ron, E.Z.; Walt, D.R. Optical imaging fiber-based live bacterial cell array
biosensor. Anal. Biochem. 2003, 315, 106-113.
36. Yong, D.M.; Liu, C.; Yu, D.B.; Dong, S.J. A sensitive, rapid and inexpensive way to assay
pesticide toxicity based on electrochemical biosensor. Talanta 2011, 84, 7-12.
Sensors 2011, 11
10660
37. Akyilmaz, E.; Dinckaya, E. An amperometric microbial biosensor development based on
candida tropicalis yeast cells for sensitive determination of ethanol. Biosens. Bioelectron. 2005,
20, 1263-1269.
38. Lei, Y.; Mulchandani, P.; Chen, W.; Wang, J.; Mulchandani, A. Arthrobacter sp js443-based
whole cell amperometric biosensor for p-nitrophenol. Electroanalysis 2004, 16, 2030-2034.
39. Gaberlein, S.; Spener, F.; Zaborosch, C. Microbial and cytoplasmic membrane-based
potentiometric biosensors for direct determination of organophosphorus insecticides. Appl.
Microbiol. Biotechnol. 2000, 54, 652-658.
40. Bhatia, R.; Dilleen, J.W.; Atkinson, A.L.; Rawson, D.M. Combined physico-chemical and
biological sensing in environmental monitoring. Biosens. Bioelectron. 2003, 18, 667-674.
41. Rensing, C.; Maier, R.M. Issues underlying use of biosensors to measure metal bioavailability.
Ecotoxol. Environ. Saf. 2003, 56, 140-147.
42. Ben-Yoav, H.; Elad, T.; Shlomovits, O.; Belkin, S.; Shacham-Diamand, Y. Optical modeling of
bioluminescence in whole cell biosensors. Biosens. Bioelectron. 2009, 24, 1969-1973.
43. Xu, Z.H.; Mulchandani, A.; Chen, W. Detection of benzene, toluene, ethyl benzene, and xylenes
(btex) using toluene dioxygenase-peroxidase coupling reactions. Biotechnol. Prog. 2003, 19,
1812-1815.
44. Tzoris, A.; Fernandez-Perez, V.; Hall, E.A.H. Direct toxicity assessment with a mini portable
respirometer. Sens. Actuat. B Chem. 2005, 105, 39-49.
45. Aivasidis, A.; Melidis, P.; Georgiou, D. Use of a microbial sensor: A new approach to the
measurement of inhibitory effects on the microbial activity of activated sludge. Bioprocess.
Biosyst. Eng. 2002, 25, 29-33.
46. Lei, Y.; Chen, W.; Mulchandani, A. Microbial biosensors. Anal. Chim. Acta 2006, 568, 200-210.
47. Venugopal, V. Biosensors in fish production and quality control. Biosens. Bioelectron. 2002, 17,
147-157.
48. Krizkova, S.; Ryant, P.; Krystofova, O.; Adam, V.; Galiova, M.; Beklova, M.; Babula, P.;
Kaiser, J.; Novotny, K.; Novotny, J.; et al. Multi-instrumental analysis of tissues of sunflower
plants treated with silver(I) ions—Plants as bioindicators of environmental pollution. Sensors
2008, 8, 445-463.
49. Adam, V.; Hanustiak, P.; Krizkova, S.; Beklova, M.; Zehnalek, J.; Trnkova, L.; Horna, A.;
Sures, B.; Kizek, R. Palladium biosensor. Electroanalysis 2007, 19, 1909-1914.
50. Olaniran, A.O.; Motebejane, R.M.; Pillay, B. Bacterial biosensors for rapid and effective monitoring
of biodegradation of organic pollutants in wastewater effluents. J. Environ. Monit. 2008, 10,
889-893.
51. Busam, S.; McNabb, M.; Wackwitz, A.; Senevirathna, W.; Beggah, S.; van der Meer, J.R.;
Wells, M.; Breuer, U.; Harms, H. Artificial neural network study of whole-cell bacterial bioreporter
response determined using fluorescence flow cytometry. Anal. Chem. 2007, 79, 9107-9114.
52. Hassler, C.S.; Twiss, M.R.; McKay, R.M.L.; Bullerjahn, G.S. Optimization of iron-dependent
cyanobacterial (synechococcus, cyanophyceae) bioreporters to measure iron bioavailability.
J. Phycol. 2006, 42, 324-335.
Sensors 2011, 11
10661
53. Nivens, D.E.; McKnight, T.E.; Moser, S.A.; Osbourn, S.J.; Simpson, M.L.; Sayler, G.S.
Bioluminescent bioreporter integrated circuits: Potentially small, rugged and inexpensive
whole-cell biosensors for remote environmental monitoring. J. Appl. Microbiol. 2004, 96, 33-46.
54. Islam, S.K.; Weathers, B.; Terry, S.C.; Zhang, M.; Blalock, B.; Caylor, S.; Ripp, S.; Sayler, G.S.
Genetically-engineered whole-cell bioreporters on integrated circuits for very low-level chemical
sensing. In Proceedings of the 35th European Solid-State Device Research Conference,
ESSDERC ’05, Grenoble, France, 12–16 September 2005; Ghibaudo, G., Skotnicki, T.,
Cristoloveanu, S., Brillouet, M., Eds.; IEEE: New York, NY, USA, 2005; pp. 351-354.
55. Bolton, E.K.; Sayler, G.S.; Nivens, D.E.; Rochelle, J.M.; Ripp, S.; Simpson, M.L. Integrated
cmos photodetectors and signal processing for very low-level chemical sensing with the
bioluminescent bioreporter integrated circuit. Sens. Actuat. B Chem. 2002, 85, 179-185.
56. Trogl, J.; Kuncova, G.; Kubicova, L.; Parik, P.; Halova, J.; Demnerova, K.; Ripp, S.; Sayler, G.S.
Response of the bioluminescent bioreporter Pseudomonas fluorescens HK44 to analogs of
naphthalene and salicylic acid. Folia Microbiol. 2007, 52, 3-14.
57. Hansen, T.H.; Laursen, K.H.; Persson, D.P.; Pedas, P.; Husted, S.; Schjoerring, J.K. Micro-scaled
high-throughput digestion of plant tissue samples for multi-elemental analysis. Plant Methods
2009, 5, 12:1-12:11.
58. Hynek, D.; Prasek, J.; Pikula, J.; Adam, V.; Hajkova, P.; Krejcova, L.; Trnkova, L.; Sochor, J.;
Pohanka, M.; Hubalek, J.; et al. Electrochemical analysis of lead toxicosis in vultures. Int. J.
Electrochem. Sci. 2011, in press.
59. Fabrik, I.; Krizkova, S.; Huska, D.; Adam, V.; Hubalek, J.; Trnkova, L.; Eckschlager, T.;
Kukacka, J.; Prusa, R.; Kizek, R. Employment of electrochemical techniques for metallothionein
determination in tumour cell lines and patients with a tumor disease. Electroanalysis 2008, 20,
1521-1532.
60. Adam, V.; Baloun, J.; Fabrik, I.; Trnkova, L.; Kizek, R. An electrochemical detection of
metallothioneins at the zeptomole level in nanolitre volumes. Sensors 2008, 8, 2293-2305.
61. Erk, M.; Ivankovic, D.; Raspor, B.; Pavicic, J. Evaluation of different purification procedures for
the electrochemical quantification of mussel metallothioneins. Talanta 2002, 57, 1211-1218.
62. Bradford, M.M. A rapid and sensitive method for the quantitation of microgram quantities of
protein utilizing the principle of protein-dye binding. Anal. Biochem. 1976, 72, 248-254.
63. Ellman, G.L. Tissue sulfhydryl groups. Arch. Biochem. Biophys. 1959, 82, 70-77.
64. Park, H.; Choung, Y.K. Degradation of antibiotics (tetracycline, sulfathiazole, ampicillin) using
enzymes of glutathione S-transferase. Hum. Ecol. Risk Assess. 2007, 13, 1147-1155.
65. Adam, V.; Fabrik, I.; Kohoutkova, V.; Babula, P.; Hubalek, J.; Vrba, R.; Trnkova, L.; Kizek, R.
Automated electrochemical analyzer as a new tool for detection of thiols. Int. J. Electrochem. Sci.
2010, 5, 429-447.
66. Krystofova, O.; Trnkova, L.; Adam, V.; Zehnalek, J.; Hubalek, J.; Babula, P.; Kizek, R.
Electrochemical microsensors for the detection of cadmium(II) and lead(II) ions in plants. Sensors
2010, 10, 5308-5328.
67. Prasek, J.; Adamek, M.; Hubalek, J.; Adam, V.; Trnkova, L.; Kizek, R. New hydrodynamic
electrochemical arrangement for cadmium ions detection using thick-film chemical sensor
electrodes. Sensors 2006, 6, 1498-1512.

Sensors 2011, 11
10662
68. Diopan, V.; Stejskal, K.; Galiova, M.; Adam, V.; Kaiser, J.; Horna, A.; Novotny, K.; Liska, M.;
Havel, L.; Zehnalek, J.; et al. Determination of plant thiols by liquid chromatography coupled
with coulometric and amperometric detection in lettuce treated by lead(II) ions. Electroanalysis
2010, 22, 1248-1259.
69. Long, G.L.; Winefordner, J.D. Limit of detection. Anal. Chem. 1983, 55, A712-A724.
70. Causon, R. Validation of chromatographic methods in biomedical analysis—Viewpoint and
discussion. J. Chromatogr. B 1997, 689, 175-180.
71. Bugianesi, R.; Serafini, M.; Simone, F.; Wu, D.Y.; Meydani, S.; Ferro-Luzzi, A.; Azzini, E.;
Maiani, G. High-performance liquid chromatography with coulometric electrode array detector
for the determination of quercetin levels in cells of the immune system. Anal. Biochem. 2000,
284, 296-300.
72. Jagner, D.; Ma, F.; Wang, Y.D. Rapid calibration-free determination of lead in microliter amounts
of whole blood. Electroanalysis 1996, 8, 952-954.
73. Puigdomenech, I.; Bergstrom, U. Calculation of distribution coefficients for radionuclides in soils
and sediments. Nucl. Saf. 1995, 36, 142-154.
74. Yarnitzky, C.N. The use of recycled static mercury drop electrode for electroanalysis of heavy
metals in industrial wastes. Rev. Anal. Chem. 2000, 19, 319-329.
75. Ghoneim, M.M.; Hassanein, A.M.; Hammam, E.; Beltagi, A.M. Simultaneous determination of
Cd, Pb, Cu, Sb, Bi, Se, Zn, Mn, Ni, Co and Fe in water samples by differential pulse stripping
voltammetry at a hanging mercury drop electrode. Fresenius J. Anal. Chem. 2000, 367, 378-383.
76. Massidda, O.; Mingoia, M.; Fadda, D.; Whalen, M.B.; Montanari, M.P.; Varaldo, P.E. Analysis of
the beta-lactamase plasmid of borderline methicillin-susceptible Staphylococcus aureus: Focus
on bla complex genes and cadmium resistance determinants cadD and cadX. Plasmid 2006, 55,
114-127.
77. Cavaco, L.M.; Hasman, H.; Stegger, M.; Andersen, P.S.; Skov, R.; Fluit, A.C.; Ito, T.;
Aarestrup, F.M. Cloning and occurrence of czrc, a gene conferring cadmium and zinc resistance
in methicillin-resistant Staphylococcus aureus CC398 isolates. Antimicrob. Agents Chemother.
2010, 54, 3605-3608.
78. Eckschlager, T.; Adam, V.; Hrabeta, J.; Figova, K.; Kizek, R. Metallothioneins and cancer. Curr.
Protein Pept. Sci. 2009, 10, 360-375.
79. Ryvolova, M.; Krizkova, S.; Adam, V.; Beklova, M.; Trnkova, L.; Hubalek, J.; Kizek, R.
Analytical methods for metallothionein detection. Curr. Anal. Chem. 2011, 7, 243-261.
80. Petrlova, J.; Potesil, D.; Mikelova, R.; Blastik, O.; Adam, V.; Trnkova, L.; Jelen, F.; Prusa, R.;
Kukacka, J.; Kizek, R. Attomole voltammetric determination of metallothionein. Electrochim.
Acta 2006, 51, 5112-5119.
81. Fabrik, I.; Kukacka, J.; Baloun, J.; Sotornik, I.; Adam, V.; Prusa, R.; Vajtr, D.; Babula, P.;
Kizek, R. Electrochemical investigation of strontium-metallothionein interactions—Analysis of
serum and urine of patients with osteoporosis. Electroanalysis 2009, 21, 650-656.
82. Huska, D.; Fabrik, I.; Baloun, J.; Adam, V.; Masarik, M.; Hubalek, J.; Vasku, A.; Trnkova, L.;
Horna, A.; Zeman, L.; et al. Study of interactions between metallothionein and cisplatin by using
differential pulse voltammetry Brdicka’s reaction and quartz crystal microbalance. Sensors 2009,
9, 1355-1369.

Sensors 2011, 11
10663
83. Krizkova, S.; Blahova, P.; Nakielna, J.; Fabrik, I.; Adam, V.; Eckschlager, T.; Beklova, M.;
Svobodova, Z.; Horak, V.; Kizek, R. Comparison of metallothionein detection by using of
Brdicka reaction and enzyme-linked immunosorbent assay employing chicken yolk antibodies.
Electroanalysis 2009, 21, 2575-2583.
84. Krizkova, S.; Fabrik, I.; Adam, V.; Kukacka, J.; Prusa, R.; Trnkova, L.; Strnadel, J.; Horak, V.;
Kizek, R. Effects of reduced glutathione, surface active agents and ionic strength on the detection
of metallothioneins by using the Brdicka reaction. Electroanalysis 2009, 21, 640-644.
© 2011 by the authors; licensee MDPI, Basel, Switzerland. This article is an open access article
distributed under the terms and conditions of the Creative Commons Attribution license
(http://creativecommons.org/licenses/by/3.0/).
Copyright © 2022 FDOKUMEN


![[Meticilin resistant Staphylococcus aureus and liver abscess: a retrospective analysis of 117 patients]](https://static.fdokumen.com/doc/165x107/632546fd545c645c7f099e01/meticilin-resistant-staphylococcus-aureus-and-liver-abscess-a-retrospective-analysis.jpg)