Structural studies of the Staphylococcus aureus ribosome
150
HAL Id: tel-01403855 https://tel.archives-ouvertes.fr/tel-01403855 Submitted on 28 Nov 2016 HAL is a multi-disciplinary open access archive for the deposit and dissemination of sci- entific research documents, whether they are pub- lished or not. The documents may come from teaching and research institutions in France or abroad, or from public or private research centers. L’archive ouverte pluridisciplinaire HAL, est destinée au dépôt et à la diffusion de documents scientifiques de niveau recherche, publiés ou non, émanant des établissements d’enseignement et de recherche français ou étrangers, des laboratoires publics ou privés. Structural studies of the Staphylococcus aureus ribosome Iskander Khusainov To cite this version: Iskander Khusainov. Structural studies of the Staphylococcus aureus ribosome. Biophysics. Université de Strasbourg, 2015. English. NNT : 2015STRAJ071. tel-01403855
-
Upload
khangminh22 -
Category
Documents
-
view
3 -
download
0
Transcript of Structural studies of the Staphylococcus aureus ribosome
HAL Id: tel-01403855https://tel.archives-ouvertes.fr/tel-01403855
Submitted on 28 Nov 2016
HAL is a multi-disciplinary open accessarchive for the deposit and dissemination of sci-entific research documents, whether they are pub-lished or not. The documents may come fromteaching and research institutions in France orabroad, or from public or private research centers.
L’archive ouverte pluridisciplinaire HAL, estdestinée au dépôt et à la diffusion de documentsscientifiques de niveau recherche, publiés ou non,émanant des établissements d’enseignement et derecherche français ou étrangers, des laboratoirespublics ou privés.
Structural studies of the Staphylococcus aureusribosome
Iskander Khusainov
To cite this version:Iskander Khusainov. Structural studies of the Staphylococcus aureus ribosome. Biophysics. Universitéde Strasbourg, 2015. English. �NNT : 2015STRAJ071�. �tel-01403855�

UNIVERSITÉ DE STRASBOURG
ÉCOLE DOCTORALE des Sciences de la Vie et de la Santé
IGBMC - CNRS UMR 7104 - Inserm U 964
THÈSE présentée par :
Iskander KHUSAINOV
soutenue le : 27 Novembre 2015
pour obtenir le grade de : !"#$%&'($')*%+,-$&.,#/'($'0#&1.2!%&3
Discipline/ Spécialité : Biophysique et biologie structurale
(Biophysics and Structural biology)
Structural studies of the Staphylococcus aureus ribosome
Etudes structurales du ribosome de Staphylococcus aureus
THÈSE dirigée par :
M. YUSUPOV Marat Directeur de recherche, Université de Strasbourg Mme. YUSUPOVA Gulnara Directeur de recherche, Université de Strasbourg
RAPPORTEURS :
M. JENNER Lasse B. Associate Professor, Aarhus University (Denmark) M. MECHULAM Yves Directeur de recherche, École Polytechnique (Paris)
AUTRES MEMBRES DU JURY : M. GEISSMANN Thomas Chargé de recherches, ENS de Lyon (Lyon) M. MARZI Stefano Chargé de recherches, Université de Strasbourg

Acknowledgements
2
Acknowledgegegegements
ACKNOWLEDGEMENTS
First of all a would like to thank all jury members, Dr. Yves Mechulam, Dr. Lasse Bohl Jenner,
Dr. Thomas Geissmann and Dr. Stefano Marzi who agreed to evaluate my PhD work. I am extremely
thankful to meet them in Strasbourg and to discuss.
I would like to express my sincere gratitude to my advisors, Gula and Marat for their constant
support and patience, for their motivation, advice and confidence. I am thankful to them for giving
me the opportunity to learn many different of methods of biochemistry and structural analysis in
the laboratory. Every single day I learn something new here. Working in Marat's and Gula's
laboratories is priceless experience.
This work would not be complete without electron microscopy involvement. I express my
gratitude to our collaborator Yaser Hashem with whom we obtained the first structure of Staph
ribosome; and to Alex Myasnikov for his significant contribution in cryo-EM data collection and
helpful discussions. Special regards to Dr. Pascale Romby. It is always a pleasure to discuss with her
and to get a fresh view on the project.
I am thankful to the structural biology platform of IGBMC: Catherine, Peirre and Alastair, who
taught me a lot of techniques of biophysics and crystallization. In addition, I thank Prof. Richard
Beckett and Dr. Farida Minibayeva for patiently correcting my thesis and bringing it to its
presentable form.
Now it is a good time to thank all of my colleagues who made me feel comfortable here. First,
I want to cordially thank two people: Sergey, whose endless enthusiasm and striking erudition
inspired me to move forward from day to day; and Natasha, who helped me to not get lost in the
ribosome world during my first year. Gracias/Grazie to my eEF2 team Eduardo and Simone. These
two people present an unbelievable combination of experience, knowledge, curiosity, diligence,
belief and reasonable skepticism that make them extremely nice companions. And particular credits
to Alexey of course. Always strict, always straightforward, sometimes sarcastic but never
disingenuous, he made our synchrotron trips very special. Many thanks to our French teammates
Justine, Mélanie, David. Thanks to them, I knew more about French culture, cuisine, and most
importantly, they were always helpful with the French language and administration duties. And
many thanks to all the present and former members of our lab, Irina, Yuzuru, Marie, Daniya,
Muminjon, Jean-Paul, Raphaël, Nico, Sylvie, Lasse, Liudmila, for their support and friendly
atmosphere in the laboratory.

Acknowledgements
3
Acknowledgegegegements
Besides work in the laboratory, we had a great time outside IGBMC. First, I would like to thank
our Eastern Union team Anna and Kate. We met here during the interview and kept the friendship
over the whole PhD. I appreciate the hospitality of Ben and Damien, who showed us Strasbourg and
helped with integration into the French life during first year. I am grateful to Nico and Claire, Firas
and Irene, Marie and Gérald, Irina, Anna, Kate, Karima, Heena, Shilpy, Alexey, Vova, Grigory, Valerio,
Xavi, Ismail, Xieyang and others for the unforgettable moments and adventures that we had
together: via ferrata in Jura, opera in Dijon, ski in the Alps, board games at Alexey's place, crazy
night bike trip along the Rhine and many others. I would like to thank all the members of SPB and
personally Michel who always gave me a hand when I asked. Many thanks to my friends in Kazan -
Aidar, Igor, Sergey and Olga. It is always a pleasure to come to the hometown and meet them there.
Most importantly, I would like to thank my family. I am very grateful to my parents Rezeda
and Shamil who accepted my wish to come to France with understanding. To my aunt Farida, who
showed me the beauty of science and biology when I was child; and to my grandmother Jasmina,
who patiently listens to all my stories about synchrotrons, diffraction and gives a good advice when
I need one. I am also grateful to my brother Farid and my niece Rushaniya with whom we spent a
great time in Saint-Petersburg this year. I am very happy to have such an adorable family!
My PhD thesis has been possible only because of constant support and participation of all the
people mentioned above. I've never walked alone. Thank you very much!
Table of contents
4
Table of contents
TABLE OF CONTENTS
ACKNOWLEDGEMENTS ..................................................................................................................................... 2
TABLE OF CONTENTS ......................................................................................................................................... 4
TABLE OF FIGURES AND TABLES ....................................................................................................................... 6
SUMMARY ......................................................................................................................................................... 8
RÉSUMÉ DE THÈSE .......................................................................................................................................... 12
ABBREVIATIONS .............................................................................................................................................. 22
INTRODUCTION ............................................................................................................................................... 22
THE RIBOSOME ................................................................................................................................................ 25
Core of the ribosome ................................................................................................................................... 25
Specifications of bacterial and eukaryotic ribosome .................................................................................. 26
Protein synthesis ......................................................................................................................................... 27
Structural studies of the ribosome .............................................................................................................. 29
STAPHYLOCOCCUS AUREUS ............................................................................................................................. 34
Main characteristics of S. aureus ................................................................................................................. 34
Virulence determinants ............................................................................................................................... 35
S. aureus - superbug .................................................................................................................................... 38
Antibiotic resistance of S. aureus ................................................................................................................ 39
Mechanisms of antibiotics action and bacterial resistance. ....................................................................... 40
Current drugs used in treatment of S. aureus diseases .............................................................................. 44
S. aureus ribosome as a target for new antibiotics ..................................................................................... 49
TRANSLATION ELONGATION FACTORS ............................................................................................................ 50
Translation elongation cycle ........................................................................................................................ 50
eEF2 is a potential target for drug development ........................................................................................ 54
PROJECT OUTLINE ............................................................................................................................................ 55
RESEARCH PROJECT 1. STRUCTURE DETERMINATION OF S. AUREUS RIBOSOME........................................ 51
S. AUREUS CELL GROWTH ............................................................................................................................... 58
S. aureus strain ............................................................................................................................................ 58
Cells preparation ......................................................................................................................................... 58
RIBOSOMES PURIFICATION ............................................................................................................................. 59
Buffers ......................................................................................................................................................... 60
Lysis ............................................................................................................................................................. 60
PEG precipitation and sucrose cushion ....................................................................................................... 61
Sucrose density gradient centrifugation ..................................................................................................... 61

Table of contents
5
Table of contents
Ribosome concentration and storage ......................................................................................................... 62
RIBOSOMES CHARACTERIZATION .................................................................................................................... 63
One- and two-dimensional polyacrylamide gel electrophoresis (PAGE)..................................................... 63
Agarose gel electrophoresis ........................................................................................................................ 64
Analytical sucrose density gradient centrifugation ..................................................................................... 64
Analytical ultracentrifugation ...................................................................................................................... 67
Mass spectrometry ...................................................................................................................................... 67
CRYSTALLOGRAPHIC STUDIES OF S. AUREUS RIBOSOME................................................................................ 70
Why x-rays and why crystals?...................................................................................................................... 70
Macromolecular crystallization in theory .................................................................................................... 71
Macromolecular crystallization in practice ................................................................................................. 73
Crystallization of S. aureus ribosome .......................................................................................................... 76
Post-crystallization treatment ..................................................................................................................... 82
Post-crystallization treatment of S. aureus ribosome crystals .................................................................... 83
X-ray data collection .................................................................................................................................... 86
CRYO-EM STRUCTURE DETERMINATION OF S. AUREUS RIBOSOME ............................................................... 89
Latest improvements in cryo-EM ................................................................................................................ 89
Electron microscope organization ............................................................................................................... 90
Sample preparation and data collection ..................................................................................................... 92
Image processing for single particle cryo-EM ............................................................................................. 94
RESEARCH PROJECT 1: SUMMARY ................................................................................................................ 105
RESEARCH PROJECT 2. PURIFICATION AND CRYSTALLIZATION OF HUMAN eEF2 ...................................... 100
PURIFICATION AND CRYSTALLIZATION OF HUMAN eEF2 PROTEIN .............................................................. 107
HeLa cells preparation ............................................................................................................................... 107
Purification of native eEF2......................................................................................................................... 107
Characterization of human eEF2. .............................................................................................................. 110
Crystallization of human eEF2. .................................................................................................................. 112
Diffraction experiment .............................................................................................................................. 113
Cloning of human eEF2 .............................................................................................................................. 114
RESEARCH PROJECT 2: SUMMARY ................................................................................................................ 119
DISCUSSION ................................................................................................................................................... 121
PERSPECTIVES ............................................................................................................................................... 125
REFERENCES .................................................................................................................................................. 126

Figures and Tables
6
Figigigigures and Tables
TABLE OF FIGURES AND TABLES
FIGURES:
Figure 1. Structural organization and functional sites of the ribosome ............................................ 25 Figure 2. Composition of bacterial and eukaryotic ribosomes and the common core, based on x-ray
studies................................................................................................................................ 27 Figure 3. Schematic diagram of bacterial protein synthesis ............................................................. 28 Figure 4. Regulation network of production of virulence factors in s. aureus .................................. 36 Figure 5. RnaIII secondary structure .................................................................................................. 38 Figure 6. Antibacterial resistance mechanisms ................................................................................. 41 Figure 7. Antibiotics targeting sites during protein synthesis ........................................................... 43 Figure 8. Antibiotics susceptibility profiles of S. aureus.. .................................................................. 51 Figure 10. The structures of apo eEF2, ef-g in complex with GDP, sordarin, enterotoxin a ............. 53 Figure 11. Sucrose gradient profile of S. aureus ribosome sample ................................................... 62 Figure 12. One-dimensional and two-dimensional SDS-PAGE, agarose gel of S. aureus ribosome
sample.. ............................................................................................................................. 64 Figure 13. Characterization of S. aureus ribosomes sample by sucrose density gradient
centrifugation .................................................................................................................... 66 Figure 14. Sedimentation profile of S. aureus ribosome sample. ..................................................... 67 Figure 15. Schematic representation of diffraction experiment ....................................................... 71 Figure 16. Schematic phase diagram of protein crystallization. ....................................................... 72 Figure 17. Idealized phase diagrams showing the trajectories of three different crystallization
methods, vapour-diffusion, batch and liquid-diffusion .................................................... 75 Figure 18. Crystals of S. aureus 70S ribosome. .................................................................................. 81 Figure 19. Scheme of post-crystallization treatment ........................................................................ 85 Figure 20. Crystals cracked during post crystallization treatment. ................................................... 85 Figure 21. Diffraction patterns of different crystals .......................................................................... 88 Figure 22. Schematic representation of basic composition of an electron microscope. .................. 91 Figure 23. Scattering of the electrons by atom. ................................................................................ 91 Figure 24. Representation of the cryo-EM grid at different scales ................................................... 92 Figure 25. Electron micrograph of the vitrified S. aureus 70S ribosome sample taken on the F-30
polara microscope.. ........................................................................................................... 93 Figure 26. Processing of S. aureus ribosome cryo-EM images taken at different defocus ............... 96 Figure 27. Schematic and idealized representation of particle extraction and 3D reconstruction .. 97 Figure 28. Schematic representation of 3D classification of S. aureus ribosome dataset ................ 98 Figure 29. Resolution curve of cryo-em structure reconstruction after 3D auto-refinement and
post-processing ................................................................................................................. 99 Figure 30. Local resolution map of S. aureus ribosome .................................................................. 100 Figure 31. Cryo-em structure of S. aureus ribosome. ...................................................................... 101 Figure 32. Comparison of cryo-EM structures of B. subtilis ribosome and S. aureus ribosome ..... 102 Figure 33. Examples of the comparative analysis of secondary structure elements of the rRNAs
from different organisms. ............................................................................................... 103 Figure 34. X-ray structure of t. thermophilus ribosome fitted into S. aureus ribosome structure . 104 Figure 35. Purification of human eEF2 protein ................................................................................ 109 Figure 36. MALLS profiles of two independent experiments .......................................................... 111 Figure 37. Crystals of eEF2 protein obtained by robotic screening................................................. 113 Figure 38. Diffraction pattern of eEF2 crystals in MRC 2drop crystallization plate. ....................... 113
Figures and Tables
7
Figigigigures and Tables
Figure 39. Two strategies of eEF2 cloning experiment. .................................................................. 115 Figure 40. Agarose gel of amplified fragments of eEF2 DNA .......................................................... 116 Figure 41. Secondary structures of S. aureus and S. cerevisiae rRNA ............................................. 122
TABLES:
Table 1. Mechanisms of action and resistance mechanisms of selected ribosome-targeting antibiotics 44
Table 2. Several antimicrobial agents and their therapeutic utilization 47
Table 3. List of ribosomal proteins found in S. aureus 70S ribosome sample 68
Table 4. List of non-ribosomal proteins found in S. aureus ribosome sample 69
Table 5. Published crystal conditions for 70S ribosomes 77
Table 6. Mass spectrometry results of eEF2 protein sample 112
Table 7. Primers used for amplification of human eEF2. 114
Summary
8
Summaryryryry
SUMMARY
The high-resolution structures of ribosomes and ribosomal subunits obtained by
crystallography and electron microscopy have revolutionized the field of protein translation.
Knowledge of the precise positions of residues in the ribosome in various states has led to a deeper
understanding of the complex mechanisms of protein synthesis. Crystal structures of ribosomal
complexes with antibiotics and antifungal compounds have provided unparalleled insight into their
mechanisms of action, and they also facilitate the design of more effective drugs (Garreau de
Loubresse et al., 2014; see for review Wilson, 2014). It was discovered that most of translation
inhibitors bind to the conserved regions of the ribosomes (PTC, tRNA-binding sites, protein exit
tunnel, etc). However, the effects of the same drug on different organism can vary from species to
species. An excellent example is provided by the drug-resistant bacteria, which are tolerant to many
of commonly used antibiotics. Among them is Staphylococcus aureus (S. aureus), an aggressive
pathogen that causes numerous infections in humans. This bacterium is rather unique and thus,
requires individual approach for treatment.
S. aureus is responsible for severe nosocomial and community-acquired infections. It can
cause a variety of life-threatening diseases in humans. Deeply penetrating infections of S. aureus
include endocarditis, peritonitis, necrotizing pneumonia, bacteremia, meningitis, osteomyelitis,
septic arthritis, and infections of bones, joints and organs. Some skin conditions caused by
staphylococcal exfoliative toxins include blisters, skin loss, pimples, furuncles, impetigo, folliculitis,
abscesses, poor temperature control, fluid loss, and secondary infection. Certain strains of S. aureus
produce the superantigen TSST-1, which is responsible for toxic shock syndrome (TSS) (Murray et
al., 2002), from which mortality is very high; death can occur within two hours (Chen et al., 2007).
Another focus area in S. aureus research is its increasing resistance to antibiotics. A 2014
report by World Health Organization (WHO) reveals that antimicrobial resistance, including
antibiotic resistance is no longer a prediction for the future, it is occurring now in every region of
the world and has the potential to affect anyone, of any age, in any country. Antibiotic resistance is
now a major threat to public health. According to the report, as many as 60% of S. aureus infections
are determined to be methicillin-resistant (MRSA) in Europe. This value was 90% in the WHO Region
of Americas, 80% in African Region, 80% in Western Pacific Region. In the Eastern Mediterranean
Region 50% of S. aureus infections were reported to be methicillin-resistant, while this value was
more than 25% in some parts of South-East Asia.

Summary
9
Summaryryryry
The resistance to the ribosome binding antibiotics is provided by the small modifications
(mainly methylation) of the rRNA in the antibiotic binding sites. These modifications do not affect
the process of protein synthesis, but prevent the binding of the drug. Solving the structure of the
ribosome from S. aureus will be the first step in understanding precise mechanism of its resistance
and will facilitate the design of new antistaphylococcal compounds.
Research project 1.
The project dedicated to solving the structure of 70S ribosome of S. aureus was initiated in
2011. By that time the structures of Thermus thermophilus and Escherichia coli ribosomes had
already been solved by X-ray crystallography. However, the structure of any Gram-positive or any
pathogenic bacteria ribosome was still unidentified. It is known that some aspects of protein
synthesis differ between Gram-negative and Gram-positive bacteria. Additionally, pathogenic
bacteria have evolved complex mechanisms of translation regulation, that provide high degree of
pathogenesis and facilitate survival in stressful conditions. Moreover, many pathogenic bacteria
(including S. aureus) show extremely high resistance to ribosome-targeting antibiotics. The
structure of the ribosome from the Gram-positive multi-resistant pathogenic bacterium
Staphylococcus aureus would enable us to understand the peculiar structural features of its
translation machinery, leading to a better understanding of the specific features of how this
bacterium regulates protein synthesis, and how it can survive stress. Most importantly, the structure
of the ribosome will serve as a model system for developing new anti-staphylococcal drugs.
We first focused on the crystallographic studies of the S. aureus 70S ribosome. This involved:
preparing the cells: growing, harvesting, breaking;
developing a purification protocol for obtaining pure and stable ribosomes that are
suitable for crystallization;
crystallization and post-crystallization treatment: searching for crystallization
conditions, growing big crystals and preparation for diffraction analysis;
developing the strategy of data collection at the synchrotron;
solving the structure: processing the data and building the model.
A protocol for the efficient purification of S. aureus 70S ribosomes using a minimal amount of
cells was developed. It is based on the protocols used for the bacterium Thermus thermophilus
(Gogia et al., 1986, Yusupov et al., 2001) and the yeast Saccharomyces cerevisiae (Ben-Shem et al.,
2011). Lysis procedures, ionic conditions, magnesium and polyethylene glycol (PEG) concentrations,
sucrose gradients, etc. were optimized during the development of the purification protocol.

Summary
10
Summaryryryry
Ribosomes were shown to be pure, stable and capable of being crystallized. The size of the crystals
of S. aureus 70S ribosome was sufficient for X-ray analysis (200 × 80 × 20 µm); however the
diffraction of these crystals after post-crystallization treatment reached a maximum resolution of
17.5 Å.
As we experienced specific difficulties with the diffraction of the crystals and because of time
constraints, we used a cryo-EM technique to determine the structure of the S. aureus ribosome. The
purity of the sample and recent advances in cryo-EM field gave us a hope that we would be able to
obtain a high-resolution structure. The data were collected using the latest generation microscope
(Titan Krios, installed at the Centre de Biologie Intégrative (CBI, Illkirch, France)). After image
processing, the first structure of S. aureus 70S ribosome was obtained at 3.9 Å resolution. The
structure at this resolution allows visualization of the side chains of the ribosomal proteins, base-
paring of the nucleotides of S. aureus rRNA, and other fine details of the structure, however, does
not gives us the ability to analyse the mechanisms of binding of the antibiotics. Therefore, the
resolution will be further improved by performing several additional steps of image processing. At
the same time my colleagues continue crystallographic studies of 70S ribosome from S. aureus.
The results I have obtained during my PhD will be discussed in details in the next chapters.
Research project 2.
One of the scientific goals of our laboratory is the crystal structure determination of the
human 80S ribosome. During our development of the protocol for human 80S ribosome purification
we discovered that most of the ribosomes co-purify with translation elongation factor 2 (eEF2)
protein. The same observation was reported in the recent cryo-EM study of human 80S ribosome:
the sample of vacant 80S ribosome contained some fraction of 80S ribosome complex with eEF2
(Anger, et al., 2013). Thus, the part of my work was devoted to the determination of the crystal
structure of human eEF2.
It is well known that eEF2 is one of the major regulators of translation in eukaryotes, and it is
often involved in cell stress response and cancer. Determination of the structure of human eEF2 can
clarify some aspects of regulation and repression of protein synthesis in humans. The eEF2 protein
is known to be a target of specific protein synthesis inhibitors, and therefore the knowledge of the
structure of human eEF2 could also help to discover potential anti-cancer compounds.
The project on eEF2 started by developing a protocol to purify the native eEF2 protein using
the ribosome-free cytosolic fraction of HeLa cells. The protocol of purification was developed and
first crystals of native eEF2 protein were obtained. However, purification of native protein gave a

Summary
11
Summaryryryry
very low yield, not suitable for large scale crystallization experiments. Therefore, we switched to the
recombinant production of the protein in bacteria. The gene of human eEF2 protein was amplified
from the cDNA library of HeLa cells and first cloning experiments were performed.
The results and current state of this project will be discussed in details in the next chapters.
Résumé de thèse
12
Résumé de thèse
RÉSUMÉ DE THÈSE
La biosynthèse protéique est un processus fondamental, retrouvé au sein de toutes les
cellules, qui permet d'assurer le décodage de l'information génétique. Ce mécanisme de traduction
implique de nombreux partenaires, protéines et acides nucléiques, et nécessite une parfaite
coordination de leurs actions afin d'assurer la fidélité du transfert de l'information génétique. Le
!"#$#%&'&$(')*+,(&- ',&.( +)'/&',&'0 #,&$$-$'/&'( +/-,(!#.1'2"#./+.('/+.$')&$',&))-)&$'&(',#.$& 34'
au cours de l'évolution, celu!5,!' &$(' ,#%0#$4' /&' /&-6' $#-$5-.!(4$7' -.&' 0&(!(&' &(' -.&' 8 +./&7'
combinant des protéines et des acides nucléiques qui s'associent au cours de la traduction pour
former un ribosome fonctionnel. Dans cet état, le ribosome est capable de catalyser l'addition
séquentielle des acides aminés de la chaîne peptidique en cours de synthèse en utilisant l'ARN
%&$$+8& '92:;%<',#%%&'%+( !,&'&(')&$'2:;'/&'( +.$=& ('+%!.#+,>)4$'9++52:;(<',#%%&'$-"$( +($1'
Les deux sous-unités présentent des fonctions bien distinctes. Le déc !"#$% !$% &'()* +,"-( )%
#.).-(/0$%1 )-$)0%!")2%&'345,%$2-%"220+.%6"+%&"%6$-(-$%2 0270)(-.%-")!(2%/0$%&"%#+")!$%2 0270)(-.%
1"-"&82$% &"% +."1-( )%!$% -+")26$6-(!"-( )%6$+,$--")-% &"% * +,"-( )% !'0)$% &("(2 )% 6$6-(!(/0$%$)-+$%
chaque acide aminé. Une dizaine de facteurs protéiques se lient successivement au ribosome afin
de catalyser les différentes étapes de la traduction, à savoir: l'initiation, l'élongation, la terminaison
et le recyclage. Bien que la synthèse des protéines conservée parmi tout les domaines du vivant,
tous les organismes ont des spécificités. Soit, les bactéries Gram positives et Gram négatives ont
leurs propres spécificités concernant la régulation et l'organisation de la machinerie
traductionnelle.
Les structures à haute résolution des ribosomes et sous-unités ribosomales obtenues par
cristallographie aux rayons X et microscopie électronique ont révolutionnées le domaine de la
traduction des protéines. La connaissance des positions précises des résidus dans le ribosome dans
divers états a conduit à une meilleure compréhension des mécanismes complexes de la synthèse
des protéines. Les structures de complexes ribosomaux avec des antibiotiques et des composés
antifongiques ont fourni un aperçu sans précédent de leurs mécanismes d'action et facilitent
également la conception de médicaments plus efficaces (Garreau de Loubresse et al, 2014;. revue
Wilson, 2014). Il a été découvert que la plupart des inhibiteurs de la traduction se lient aux régions
conservées des ribosomes (centre de peptidyltransférase, les sites de liaison d'ARNt, tunnel de
2 +-($% !$% &"% 6+ -.()$9% $-1:;:% <$6$)!")-9% &$2% $**$-2% !'0)% ,=,$% ,.!(1",$)-% 20+% !$2% $26>1$2%
différentes peuvent varier. Un excellent exemple est fourni par les bactéries résistantes à de

Résumé de thèse
13
Résumé de thèse
nombreux antibiotiques couramment utilisés. Parmi celles-ci, Staphylococcus aureus (S. aureus), un
"#$)-%6"-? #>)$%/0(%6+ @ /0$%!$%#+"@$2%$-%) ,A+$02$2%()*$1-( )2%1?$B%&'? ,,$:%<$--$%A"1-.+($%
est assez unique et donc, requiert une approche individuelle pour le traitement.
S. aureus est responsable des infections nosocomiales et infections sévères et peuvent causer
0)$% @"+(.-.% !$% ,"&"!($2% 6 -$)-($&&$,$)-% , +-$&&$2% 1?$B% &'? ,,$:% <$2% ()*$1-( )2% 1 ,6+$))$)-%
l'endocardite, la péritonite, pneumonie nécrosante, la bactériémie, la méningite, l'ostéomyélite,
l'arthrite septique, et les infections des os, des articulations et des organes (Fridkin et al, 2005).
S. aureus est un pathogène majeur d'une importance croissante en raison de sa haute
résistance aux antibiotiques (Lowy, 1998). Un rapport par l'Organisation mondiale de la Santé (OMS)
révèle que la résistance aux antimicrobiens, y compris la résistance aux antibiotiques n'est plus une
prédiction pour l'avenir, elle se passe maintenant dans toutes les régions du monde et a le potentiel
de toucher tout le monde, de tout âge, dans tous les pays. La résistance aux antibiotiques est
maintenant une menace majeure pour la santé publique. Selon ce rapport, pas moins de 60% des
infections à S. aureus sont déterminées comme résistantes à la méthicilline (SARM) en Europe
(World Health Organization, 2015).
Les gènes responsables de la résistance sont souvent transmis par des éléments génétiques
mobiles tels que les plasmides et, par conséquent, populations bactériennes peuvent acquérir une
résistance très rapidement. Divers mécanismes de résistance aux antibiotiques sont indiqués sur la
Fig I. Les bactéries peuvent empêcher la pénétration de l'antibiotique dans la cellule (a), le retirer
de la cellule en utilisant une pompe d'efflux (b), de dégrader (h) ou modifier l'antibiotique (g).
Alternativement les bactéries peuvent muter (c), modifier (d) ou protéger (f) les cibles des
antibiotiques. La conception de nouveaux agents antimicrobiens est fortement requise pour le
traitement des maladies causées par S. aureus.

Résumé de thèse
14
Résumé de thèse
Fig I. Mécanismes de résistance antibactérienne (adapté de Wilson, 2014).
Pour comprendre les aspects structurels de la résistance aux antibiotiques nous avons besoin
de connaître la structure de leur cible. Par conséquent nous nous sommes concentrés sur la
structure du ribosome, qui est la principale cible des antibiotiques les plus couramment utilisés. La
résolution de la structure du ribosome de S. aureus sera la première étape vers la compréhension
du mécanisme précis de sa résistance aux antibiotiques et facilitera la conception de nouveaux
composés antistaphylococciques.
Projet de recherche 1.
Le projet dédié à la résolution de la structure du ribosome de S. aureus a été initié en 2011. À
cette époque, les structures des ribosomes de Thermus thermophilus et Escherichia coli avaient déjà
.-.% +.2 &0$2% 6"+% 1+(2-"&& #+"6?($% "0C% +"8 )2% D:% <$6$)!")-9% &"% 2-+01-0+$% !'0)% +(A 2 ,$% !$% - 0-$%
bactérie Gram positif ou tout ribosome pathogène restait manquante. Hors, il est connu que
certains aspects de la synthèse des protéines diffèrent entre les bactéries à Gram négatif et à Gram
positif. En outre, les bactéries pathogènes ont développé des mécanismes complexes de régulation
de la traduction, qui offre un rendement élevé de la pathogenèse et facilite la survie de la bactérie
dans des conditions stressantes. En outre, de nombreuses bactéries pathogènes (y compris
S. aureus) montrent une très haute résistance aux antibiotiques ciblant spécifiquement les
Résumé de thèse
15
Résumé de thèse
ribosomes. Cette résistance est souvent due à des modifications au sein du ribosome lui-même. La
structure du ribosome de la bactérie pathogène multi-résistante à Gram positif Staphylococcus
aureus révélerait les caractéristiques structurelles particulières de machinerie de traduction nous
permettant ainsi de mieux comprendre les spécificités de la régulation de la synthèse des protéines,
et de la survie de cet agent pathogène. Plus important encore, elle servira comme un système
modèle pour le développement de nouveaux médicaments contre Staphylococcus.
Nous avons d'abord mis l'accent sur les études cristallographiques du ribosome de S. aureus.
Cela a impliqué:
E%&"%6+.6"+"-( )%!$2%1$&&0&$2F%10&-0+$9%&"%+.1 &-$9%&82$ ;
E% &G.&"A +"-( )%!G0)% 6+ - 1 &$% !$% 60+(*(1"-( )% /0(% * 0+)(+"% !$2% +(A 2 ,$2% 60+$2%$-% 2-"bles,
propices à la cristallisation ;
E%&"%,(2$%"0%6 ()-%!$%1 )!(-( )2%!$%1+(2-"&&(2"-( )% 6-(,"&$2%6$+,$--")-%!' A-$)(+%!$2%1+(2-"0C%
dans grande taille et en quantité suffisante
E% &"% ,(2$% "0% 6 ()-% !$% -+"(-$,$)-2% !$% 6 2--cristallisation nécessaires pour l'analyse par
diffraction aux rayons X;
E%&'.&"A +"-( )%!$%&"%2-+"-.#($%!$%1 &&$1-$%!$%! )).$2%"0%28)1?+ -+ )H
E%&"%+.2 &0-( )%!$%&"%2-+01-0+$F%&$%-+"(-$,$)-%!$2%! )).$2%$-%!$%&"%1 )2-+01-( )%!0%, !>&$:
I'"(% !.@$& 66.% &$% 6+ - 1 &$% !$% 60+(*(1"-( )% !$2% +(A 2 ,es S. aureus efficace utilisant une
quantité minimale de cellules. Il est basé sur les protocoles utilisés pour les bactéries Thermus
thermophilus (Gogia et al., 1986, Yusupov et al., 2001) et les levures Saccharomyces cerevisiae (Ben-
Shem et al., 2011). La procédure de lyse, les conditions ioniques, des concentrations de magnésium
et de polyethylene glycol (PEG), des gradients de saccharose, etc. ont été optimisés au cours du
développement du protocole de purification. J'.chantillon purifié a été caractérisé en utilisant
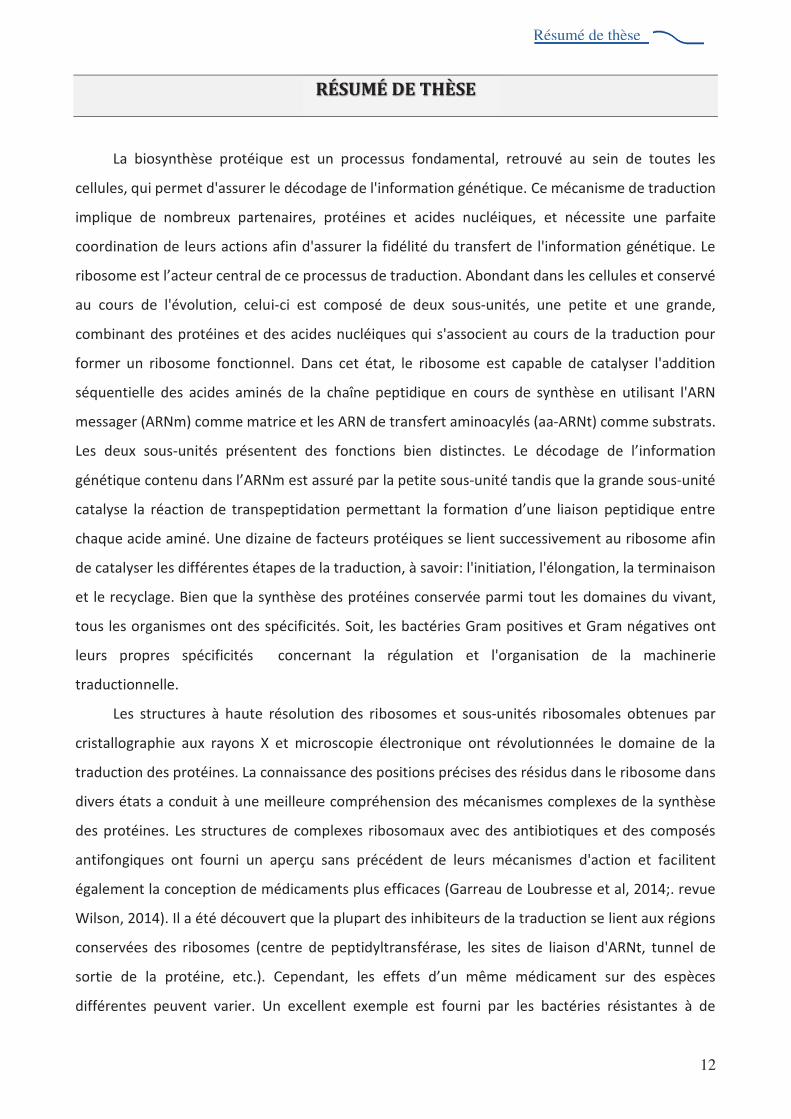
plusieurs méthodes biophysiques et biochimiques. Des gels SDS ont confirmé la pureté de
l'échantillon (Fig II, A et B); gel d'agarose a montré le caractère intact de l'ARNr (Fig II, C)
ultracentrifugation analytique a démontré que l'échantillon contenait principalement des particules
70S (Fig II, D). J'"nalyse par spectrométrie de masse a révélé l'absence de protéines ribosomiques
S1 et L9. La stabilité du ribosome sous différentes concentrations Mg2+ a été analysée par
centrifugation en gradient de saccharose. La concentration minimale de Mg2+ qui permet de garder
les sous-unités associées a été déterminée et les conditions pour la dissociation des 70S dans en
sous-unités 50S et 30S ont été trouvées.
Résumé de thèse
16
Résumé de thèse
Fig II. SDS-PAGE (électrophorèse sur gel de polyacrylamide en présence de dodécylsulfate de sodium) unidimensionnel (A) et bidimensions (B) del'échantillon du ribosome de S. aureus. Électrophorèse sur gel d'agarose des ribosomes (C): 1 - T. thermophilus 70S (5 Kg), 2 et 3 - 70S de S. aureus (15 Kg). Les bandes supérieure et inférieure correspondent à des ARNr 23S et 16S, respectivement. Profil de sédimentation de l'échantillon du ribosome de S. aureus (D).
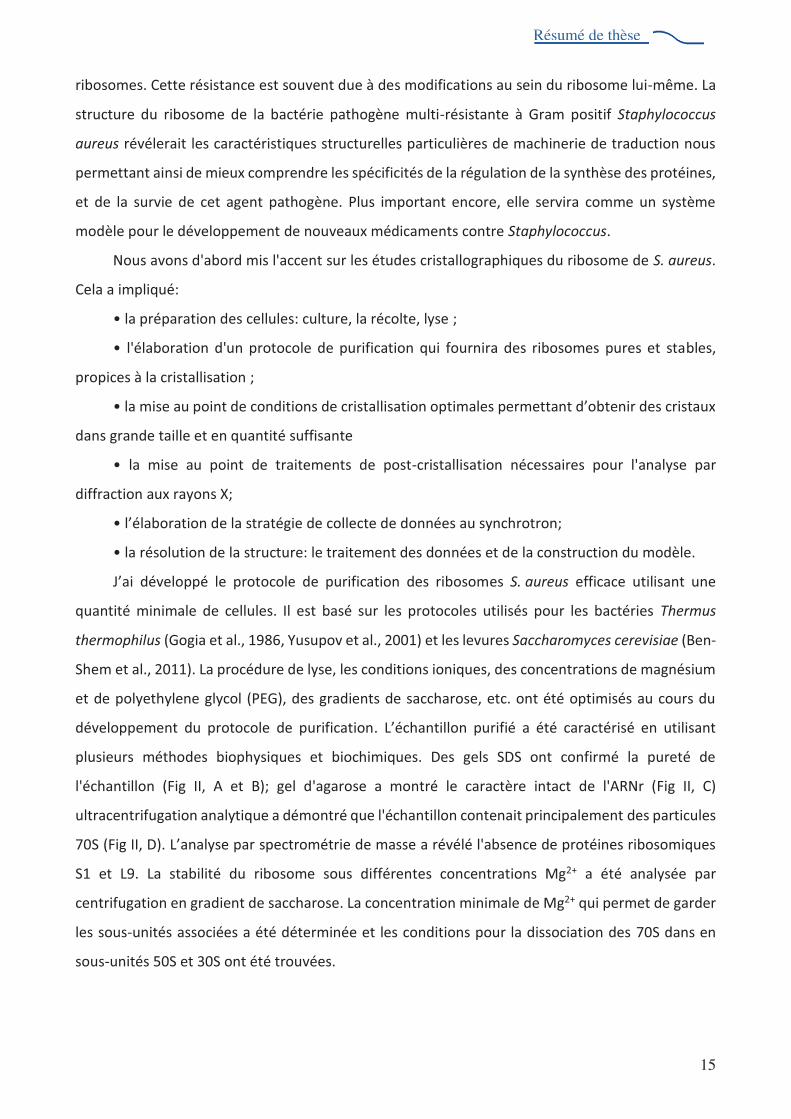
Particules cristallines initiales de ribosome 70S de S. aureus ont été obtenus en utilisant une
recherche robotique. Après plusieurs étapes d'optimisation de cristallisation, de grands cristaux
tridimensionnels ont été obtenus. Typiquement, les cristaux sont apparus de façon reproductible
dans les 7 - 10 jours et ont atteint leur taille moyenne (200 × 80 × 20 Km) après deux semaines
supplémentaires (Fig III). La taille des cristaux de ribosome de S. aureus est suffisante pour l'analyse
par diffraction aux rayons X. Les conditions de déshydratation et de cryo-refroidissement ont été
optimisées pour les cristaux obtenus. Les premières données de diffraction de cristaux du ribosome
70S de S. aureus ont été recueillies. La diffraction de ces cristaux atteint au maximum 17.5 Å, le
groupe de l'espace a été déterminée comme P42212 et la taille de l'unité asymétrique était: 450 ×
450 × 280 Å.
Résumé de thèse
17
Résumé de thèse
Fig III. Les cristaux du ribosome 70S de S. aureus.
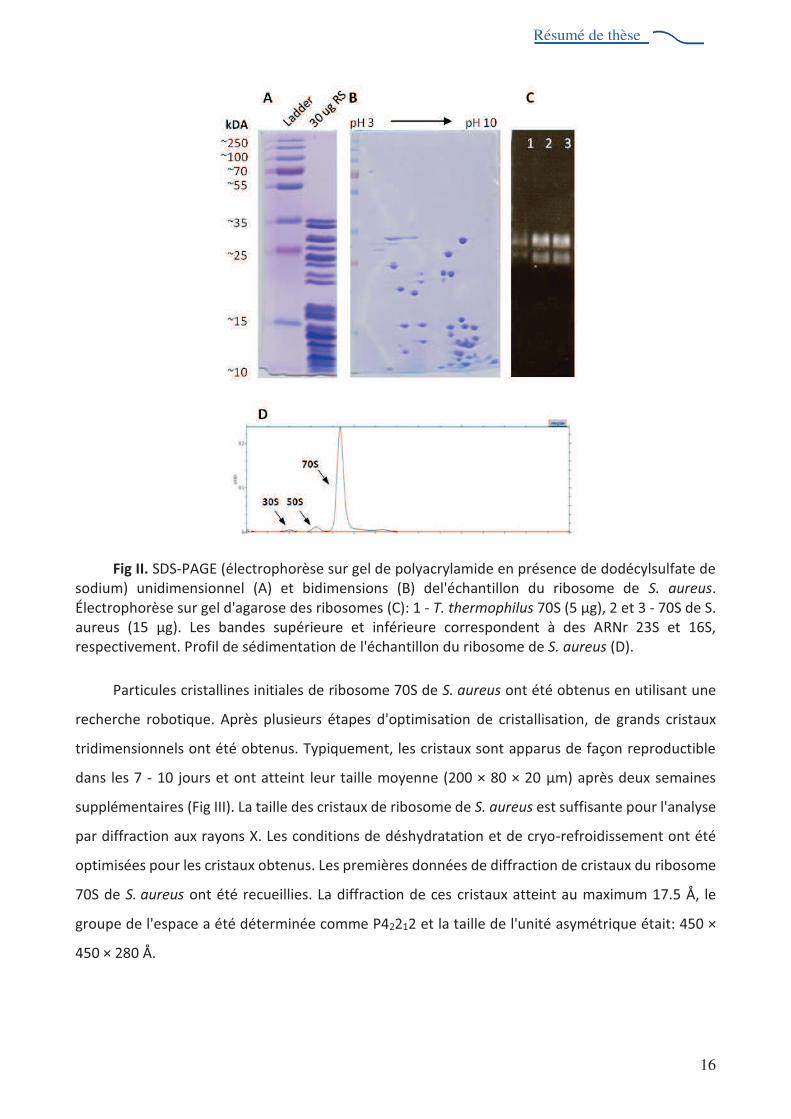
L)%+"(2 )%!$%!(**(10&-.2%"@$1%/0"&(-.%!$%&"%!(**+"1-( )%!$2%1+(2-"0C9%) 02%"@ )2%1? (2(%!'0-(&(2.%&"%
technique de cryo-microscopie electronique (cryo-ME) pour déterminer la structure du ribosome
de S. aureus. La pureté de l'échantillon et de sérieux progrès dans le domaine de la cryo-ME au cours
des dernières années a donné un espoir d'obtenir la structure à haute résolution grâce à cette
technique. Les données ont été recueillies en utilisant la dernière génération de microscope (Titan
Krios, installé au Centre de Biologie Intégrative (CBI, Illkirch, France)).
Les conditions appropriées pour la préparation de la grille cryo-ME et de la collecte de
données ont été trouvées pour l'échantillon du ribosome 70S de S. aureus (Fig IV, A). Le traitement
des images cryo-ME a été réalisé avec Scipion workflow et les algorithmes intégrés (Fig IV, B). Après
le traitement des images, la structure à une résolution de 3.9 Å a été obtenu. La structure à cette
résolution permet de voir les chaînes latérales des protéines ribosomales, la base-azotée des
)01&. -(!$2%!$%&'345+%!$%S. aureus, etc (Fig IV, C). Cette résolution donne également la possiblilité
d'analyser la liaison des antibiotiques et, en combinaison avec les connaissances biochimiques, de
développer des composés antimicrobiens efficacent contre S. aureus.
Résumé de thèse
18
Résumé de thèse
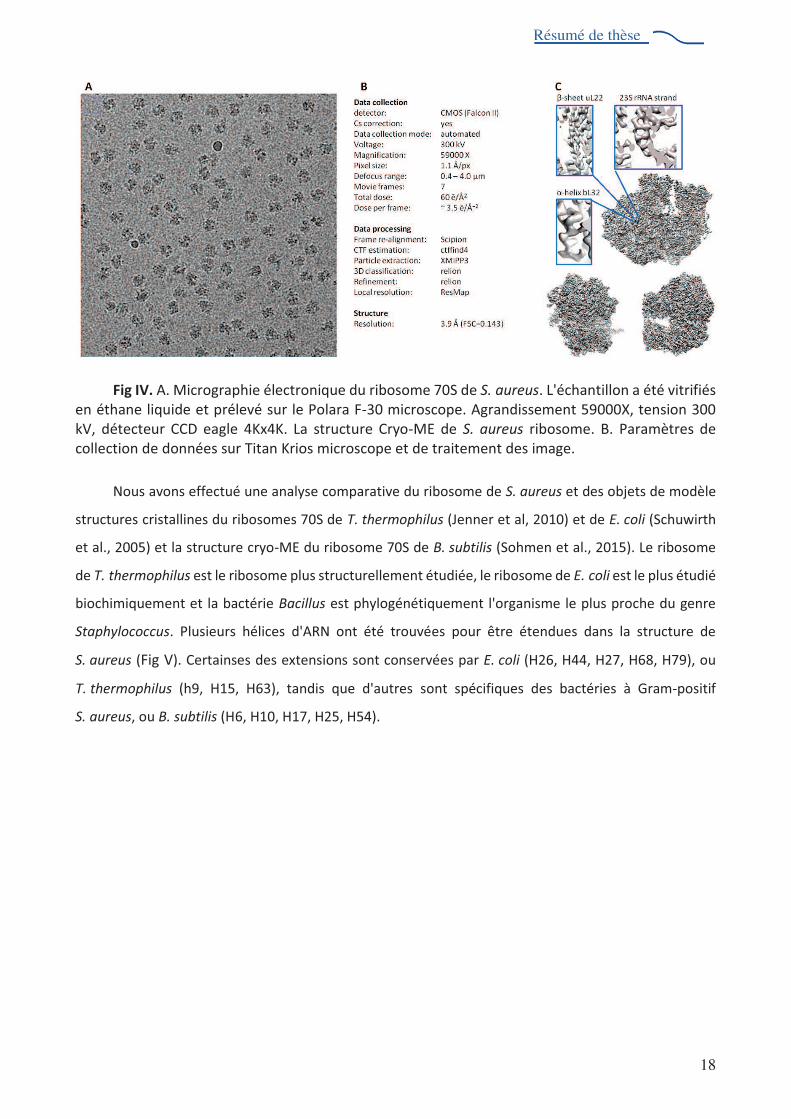
Fig IV. A. Micrographie électronique du ribosome 70S de S. aureus. L'échantillon a été vitrifiés en éthane liquide et prélevé sur le Polara F-30 microscope. Agrandissement 59000X, tension 300 kV, détecteur CCD eagle 4Kx4K. La structure Cryo-ME de S. aureus ribosome. B. Paramètres de collection de données sur Titan Krios microscope et de traitement des image.
Nous avons effectué une analyse comparative du ribosome de S. aureus et des objets de modèle
structures cristallines du ribosomes 70S de T. thermophilus (Jenner et al, 2010) et de E. coli (Schuwirth
et al., 2005) et la structure cryo-ME du ribosome 70S de B. subtilis (Sohmen et al., 2015). Le ribosome
de T. thermophilus est le ribosome plus structurellement étudiée, le ribosome de E. coli est le plus étudié
biochimiquement et la bactérie Bacillus est phylogénétiquement l'organisme le plus proche du genre
Staphylococcus. Plusieurs hélices d'ARN ont été trouvées pour être étendues dans la structure de
S. aureus (Fig V). Certainses des extensions sont conservées par E. coli (H26, H44, H27, H68, H79), ou
T. thermophilus (h9, H15, H63), tandis que d'autres sont spécifiques des bactéries à Gram-positif
S. aureus, ou B. subtilis (H6, H10, H17, H25, H54).
Résumé de thèse
19
Résumé de thèse
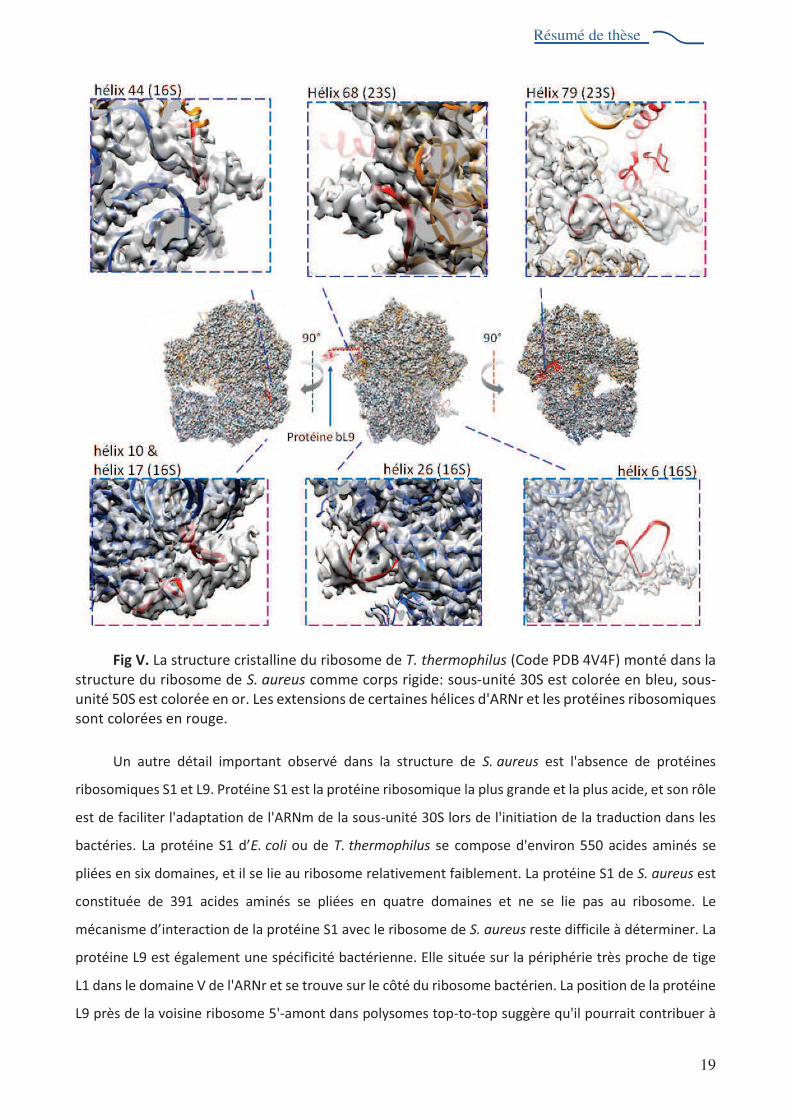
Fig V. La structure cristalline du ribosome de T. thermophilus (Code PDB 4V4F) monté dans la structure du ribosome de S. aureus comme corps rigide: sous-unité 30S est colorée en bleu, sous-unité 50S est colorée en or. Les extensions de certaines hélices d'ARNr et les protéines ribosomiques sont colorées en rouge.
Un autre détail important observé dans la structure de S. aureus est l'absence de protéines
ribosomiques S1 et L9. Protéine S1 est la protéine ribosomique la plus grande et la plus acide, et son rôle
est de faciliter l'adaptation de l'ARNm de la sous-unité 30S lors de l'initiation de la traduction dans les
bactéries. La protéine S1 !'E. coli ou de T. thermophilus se compose d'environ 550 acides aminés se
pliées en six domaines, et il se lie au ribosome relativement faiblement. La protéine S1 de S. aureus est
constituée de 391 acides aminés se pliées en quatre domaines et ne se lie pas au ribosome. Le
,.1")(2,$%!'interaction de la protéine S1 avec le ribosome de S. aureus reste difficile à déterminer. La
protéine L9 est également une spécificité bactérienne. Elle située sur la périphérie très proche de tige
L1 dans le domaine V de l'ARNr et se trouve sur le côté du ribosome bactérien. La position de la protéine
L9 près de la voisine ribosome 5'-amont dans polysomes top-to-top suggère qu'il pourrait contribuer à
Résumé de thèse
20
Résumé de thèse
la régulation inter-ribosome. (Dunkle et Cate, 2011). D'autre par-9%&"%6+ -.()$%+(A 2 ,"&$%JM%)'$2-%pas
essentiel dans E. coli ou T. thermophilus, mais elle est conservé$%!")2%!'"0-+$2 bactéries.
N 02% &$2% +.20&-"-2% A-$)02%!")2% 1$2% -+"@"0C9% *"1(&(-$+ )-% &"%!$21+(6-( )%O% &'.1?$&&$% "- ,(/0$%!0%
ribosome de S. aureus $-% 2$2% 1 ,6&$C$2% * )1-( ))$&2'% '!")2% 0)% *0-0+% 6+ 1?$:% J"% 1 ,A()"(2 )% !$2%
méthodes de cristallographie aux rayons X et de cryo-ME aidera à atteindre cet objectif. Les résultats
obtenus serviront de base pour le développement de nouveaux composés contre la bactérie pathogène
$-%$C-+=,$,$)-%+.2(2-")-$%/0'$2-%S. aureus.
Projet de recherche 2.
Une autre partie de mon travail a été consacrée à la détermination de la structure
tridimensionnelle par radio-cristallographie du facteur d'élongation humain de type 2 (eEF2). Cette
protéine a été jugée plutôt étroitement lié aux ribosomes 80S humains lors de la purification
effectuée au sein de notre laboratoire. Il est bien connu que eEF2 est le principal régulateur de la
traduction chez les eucaryotes et est souvent impliqué dans la réponse au stress cellulaire et dans
le développement du cancer (revue White-Gilbertson, 2009). La détermination de la structure de
eEF2 humaine permettrait de clarifier certains aspects de la réglulation et de la répression de la
28)-?>2$%!$2%6+ -.()$2%1?$B%&'? ,,$:%J"%6+ -.()$%$LPQ%$2-%1 ))0$%6 0+%=-+$%0)$%1(A&$%!G()?(A(-$0rs
spécifiques de la synthèse des protéines, de sorte que la structure de eEF2 humaine pourrait aussi
aider à découvrir des composés anticancéreux potentiels.
Le travail a commencé avec l'élaboration du protocole de purification de la protéine native
eEF2 utilisant comme source la fraction cytosolique libre des ribosomes des cellules HeLa. La pureté,
l'homogénéité et la stabilité de la protéine purifiée a été analysée par SDS-PAGE, diffusion
dynamique de la lumière, diffusion de la lumière multiangle, essai de décalage thermique et la
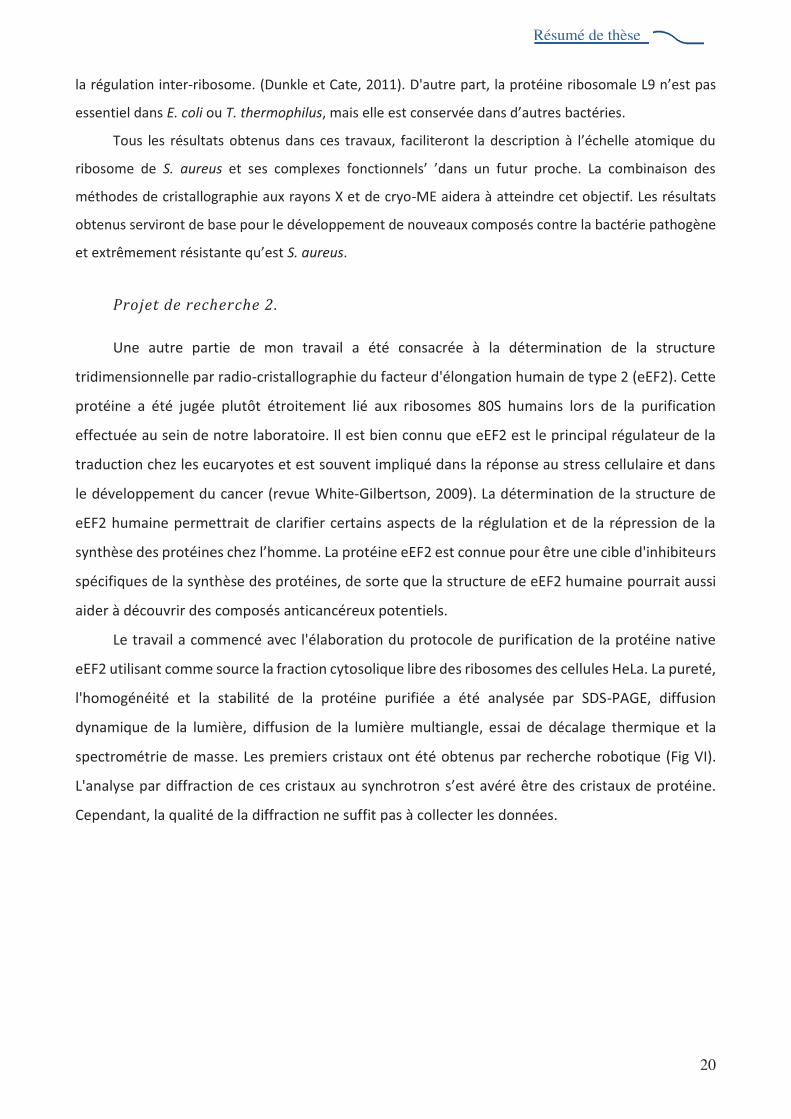
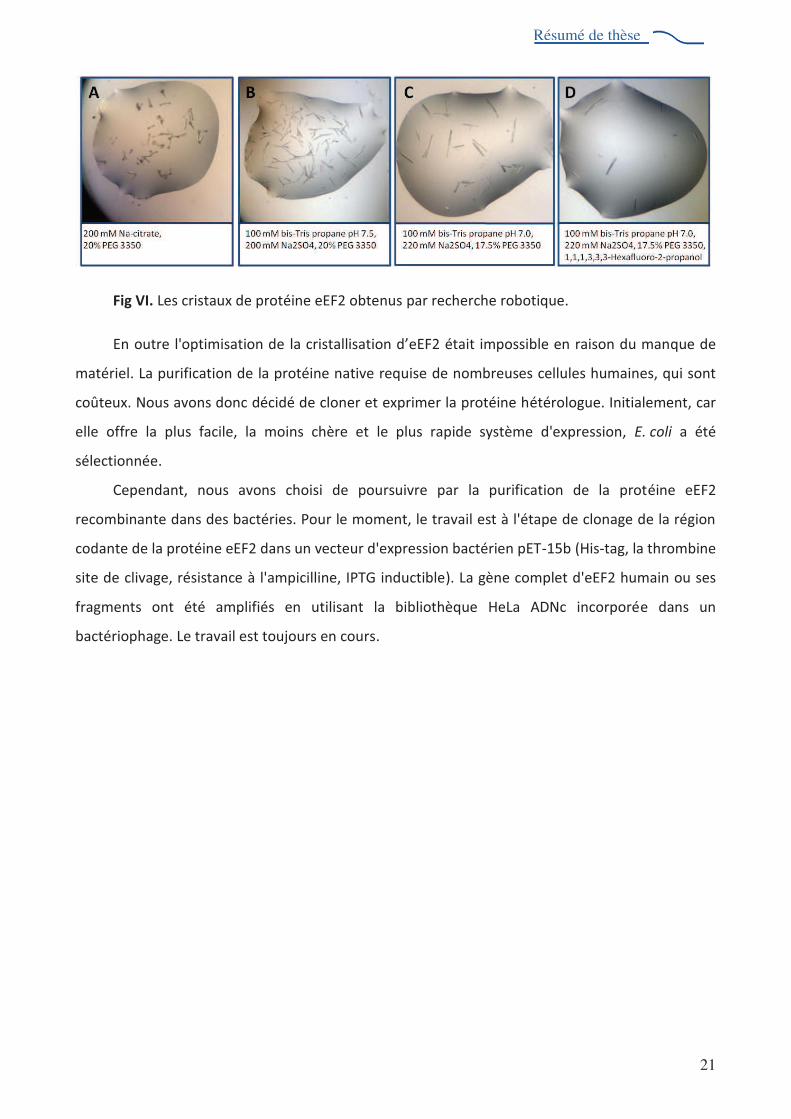
spectrométrie de masse. Les premiers cristaux ont été obtenus par recherche robotique (Fig VI).
L'analyse par diffraction de ces cristaux au synchrotron 2'$2- avéré être des cristaux de protéine.
Cependant, la qualité de la diffraction ne suffit pas à collecter les données.
Résumé de thèse
21
Résumé de thèse
Fig VI. Les cristaux de protéine eEF2 obtenus par recherche robotique.
En outre l'optimisation de &"%1+(2-"&&(2"-( )%!'eEF2 était impossible en raison du manque de
matériel. La purification de la protéine native requise de nombreuses cellules humaines, qui sont
coûteux. Nous avons donc décidé de cloner et exprimer la protéine hétérologue. Initialement, car
elle offre la plus facile, la moins chère et le plus rapide système d'expression, E. coli a été
sélectionnée.
Cependant, nous avons choisi de poursuivre par la purification de la protéine eEF2
recombinante dans des bactéries. Pour le moment, le travail est à l'étape de clonage de la région
codante de la protéine eEF2 dans un vecteur d'expression bactérien pET-15b (His-tag, la thrombine
site de clivage, résistance à l'ampicilline, IPTG inductible). La gène complet d'eEF2 humain ou ses
fragments ont été amplifiés en utilisant la bibliothèque HeLa ADNc incorporée dans un
bactériophage. Le travail est toujours en cours.
Abbreviations
22
Abbreviations
ABBREVIATIONS
Ribosome: aa-tRNA aminoacyl-tRNA A-site aminoacyl site, (A-tRNA R A-site tRNA) EF elongation factor (eEF R eukaryotic EF) E-site exit site (E-tRNA R E-site tRNA) IF initiation factor (eIF R eukaryotic IF) mRNA messenger ribonucleic acid PTC peptidyl transferase centre P-site peptidyl site, (P-tRNA R P-site tRNA) RF release factor (eRF R eukaryotic RF) RP ribosomal proteins RRF ribosome recycling factor rRNA ribosomal ribonucleic acid SD Shine-Dalgarno tRNA transfer ribonucleic acid Methods: NMR nuclear magnetic resonance Cryo-EM cryo-electron microscopy LC-MS/MS liquid chromatography coupled mass spectrometry DLS dynamic light scattering MALLS multiangle laser light scattering MALDI matrix assisted laser desorption/ionization PCR polymerase chain reaction PAGE polyacrylamide gel electrophoresis S. aureus:
B. subtilis Bacillus subtilis E. coli Escherichia coli MRSA methicillin-resistant S. aureus mrMRSA multi resistant MRSA MSSA methicillin-susceptible S. aureus nmrMRSA non-multi resistant MRSA PBPs penicillin binding proteins S. aureus Staphylococcus aureus T. thermophilus Thermus thermophilus TSS toxic shock syndrome VISA vancomycin-intermediate S. aureus VRSA vancomycin-resistant S. aureus
WHO World Health Organization SA sigma factor A SB sigma factor B Cryo-electron microscopy: CMOS complementary metal-oxide semiconductor
Abbreviations
23
Abbreviations
CTF contrast transfer function DDD direct detector device DQE detective quantum efficiency FEG field emission gun FSC Fourier shell correlation SNR signal-to-noise ratio TEM transmission electron microscopy Reagents: DMSO dimethyl solfoxide DTT dithiothreitol EDTA ethylenediaminetetraacetic acid EG ethyloene glycol GDP guanosine diphosphate GTP guanosine triphosphate LB lysogeny broth MPD 3-methyl,1, 5-pentanediol PBS phosphate-buffered saline PEG polyethylene glycol PMSF phenylmethylsulfonyl fluoride SDS sodium dodecyl sulfate

Introduction
Introduction
25
Introduction
THE RIBOSOME
Protein synthesis is performed by the ribosome in all living organisms. It is one of the most
conserved biological processes. The central dogma of molecular biology states that DNA is
transcribed into RNA and RNA is subsequently translated into proteins. Ribosome is macromolecular
machine which translates the nucleotides-based language of the mRNA into amino acid-based
language of proteins. The ribosome is a major link between genes and proteins and it is made of
nucleic acid (ribosomal RNA, or rRNA) and protein (ribosomal proteins, or RP) components.
Core of the ribosome
Structurally ribosomes in all living cells are composed of two subunits, called small ribosomal
subunit (SSU) and large ribosomal subunit (LSU). Both are composed of rRNA(s) and proteins with
average ratio of 2:1 RNA to protein (the exceptions are mitochondrial and chloroplast ribosomes
which have ratios 1:2 and 3:2 respectively (see for review Sharma and Agrawal, 2012). The ribosome
is an asymmetric macromolecular complex and each subunit has particular structural and functional
organization, thus carries out different functions in translation (Figure 1).
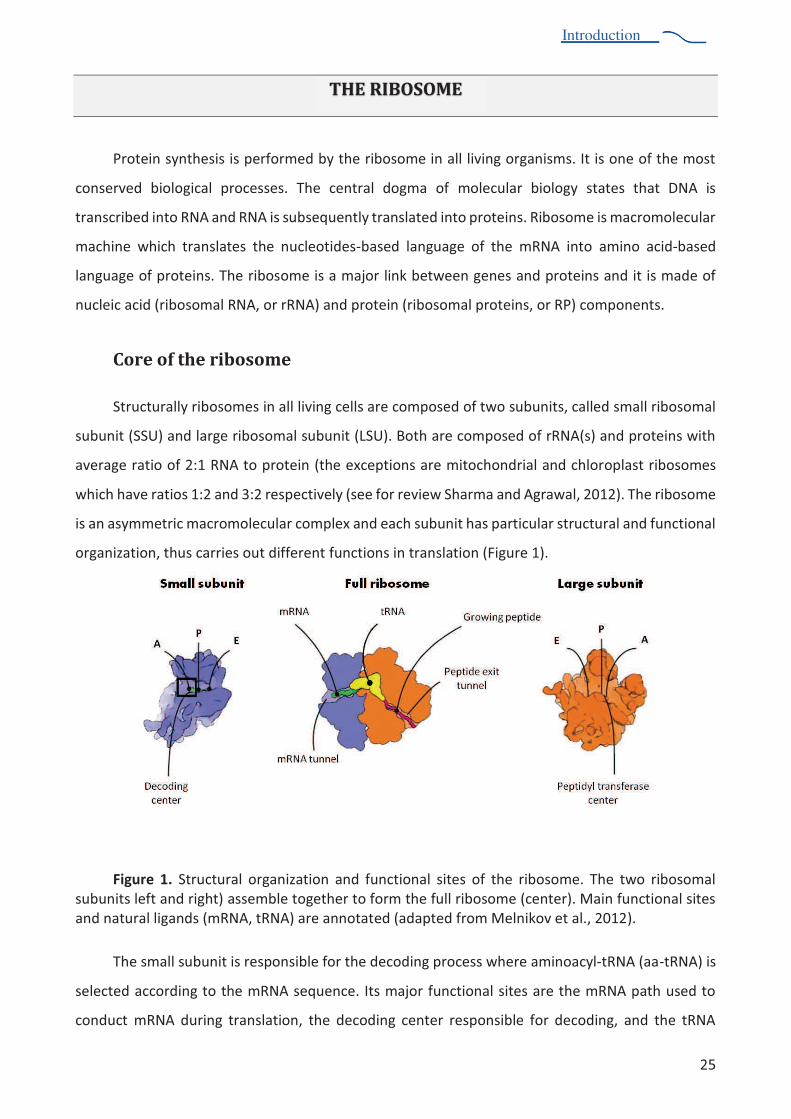
Figure 1. Structural organization and functional sites of the ribosome. The two ribosomal subunits left and right) assemble together to form the full ribosome (center). Main functional sites and natural ligands (mRNA, tRNA) are annotated (adapted from Melnikov et al., 2012).
N?$%2,"&&%20A0)(-%(2%+$26 )2(A&$%* +%-?$%!$1 !()#%6+ 1$22%T?$+$%",() "18&7-453%U""-tRNA) is
selected according to the mRNA sequence. Its major functional sites are the mRNA path used to
conduct mRNA during translation, the decoding center responsible for decoding, and the tRNA
Introduction
26
Introduction
A()!()#%2(-$2%U39%V%")!%L;:%N?$%372(-$%2$+@$2%- %A()!%",() "18&7-453%"2% it enters into the ribosome
!0+()#%6+ -$()%28)-?$2(29% -?$%V72(-$%? &!2%-453%1"++8()#%-?$%)"21$)-%6 &86$6-(!$%1?"()%U6$6-(!8&7
tRNA), and the E-site (exit) is where tRNA dissociates from the ribosome. During translation, tRNAs
are translocated from the A to -?$%V72(-$%")!%*+ ,%-?$%V%- %-?$%L72(-$:%N?$%&"+#$%20A0)(-%1"-"&8B$2%
peptide bond formation. Its major functional sites are the tRNA binding sites (A, P and E), the peptide
exit tunnel that extends through the body of the large subunit, and the peptidyl transferase centre
(PTC). The PTC is responsible for peptide bond formation and is located at the entrance to the
peptide tunnel in a conserved region on the interface that is mainly composed of rRNA. As a result
of peptide bond formation in the PTC, the nascent polypeptide chain is transferred from the
6$6-(!8&7-453%()%-?$%V7%2(-$%- %-?$%""7-453%()%-?$%372(-$9%-?02%$C-$)!()#%-?$%)"21$)-%1?"()%A8% )$%
amino acid.
Specifications of bacterial and eukaryotic ribosome
Despite the universal conservation of the core, ribosome composition varies between
domains of life, taxonomic subgroups, organelles and even within a single individual, although to a
smaller extent. Ribosomes may contain their own set of specific moieties: specific proteins,
insertions and extensions of conserved proteins and expansion segments of rRNAs.
Major differences in ribosome composition are observed between domains of life. Apart from
the core, the bacterial ribosome (E. coli or T. thermophilus) contains 21 A"1-$+("726$1(*(1%6+ -$()29%"%
few extensions of the conserved proteins and of ribosomal RNA. The eukaryotic ribosome
(S. cerevisiae;%1 )-"()2%WX%$0Y"+8 -$726$1(*(1%6+ -$()2%UZ[[%Y\";%")!%$C-$)2( )2%")!% ()2$+-( )2% ()%
most of the proteins of the core (200 kDa), and the rRNA harbors several extensions in the conserved
rRNA chains (about 800 nucleotides -?"-%"11 0)-%* +%]^[%Y\";%U_$)7`?$,%$-%"&:9%Q[aaH%b$&)(Yov et
al., 2012). Sedimentation coefficients are used to characterize and to name isolated or associated
subunits. Hence, association of the small subunit (30S in bacteria, 40S in eukaryotes) with the large
subunit (50S in bacteria, 60S in eukaryotes) results in the full ribosome R 70S in bacteria and 80S in
eukaryotes.
Introduction
27
Introduction
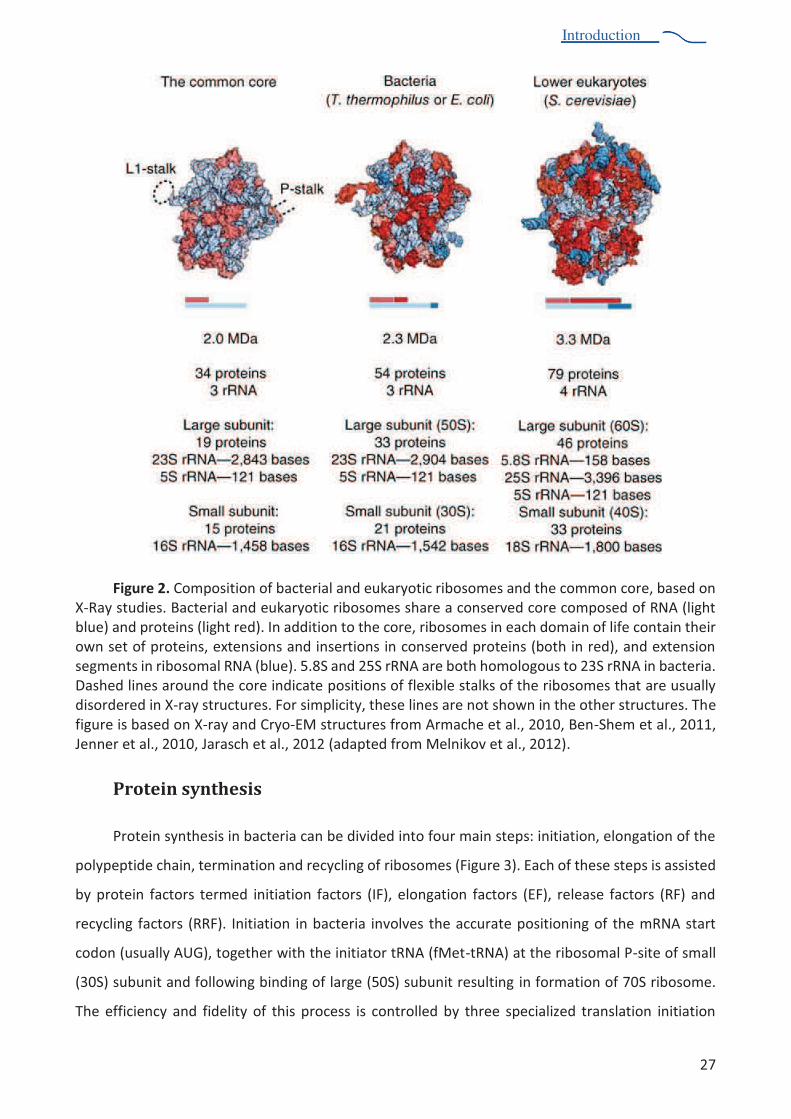
Figure 2. Composition of bacterial and eukaryotic ribosomes and the common core, based on X-Ray studies. Bacterial and eukaryotic ribosomes share a conserved core composed of RNA (light blue) and proteins (light red). In addition to the core, ribosomes in each domain of life contain their own set of proteins, extensions and insertions in conserved proteins (both in red), and extension segments in ribosomal RNA (blue). 5.8S and 25S rRNA are both homologous to 23S rRNA in bacteria. Dashed lines around the core indicate positions of flexible stalks of the ribosomes that are usually disordered in X-ray structures. For simplicity, these lines are not shown in the other structures. The figure is based on X-ray and Cryo-EM structures from Armache et al., 2010, Ben-Shem et al., 2011, Jenner et al., 2010, Jarasch et al., 2012 (adapted from Melnikov et al., 2012).
Protein synthesis
Protein synthesis in bacteria can be divided into four main steps: initiation, elongation of the
polypeptide chain, termination and recycling of ribosomes (Figure 3). Each of these steps is assisted
by protein factors termed initiation factors (IF), elongation factors (EF), release factors (RF) and
recycling factors (RRF). Initiation in bacteria involves the accurate positioning of the mRNA start
codon (usually AUG), together with the initiator tRNA (fMet-tRNA) at the ribosomal P-site of small
(30S) subunit and following binding of large (50S) subunit resulting in formation of 70S ribosome.
The efficiency and fidelity of this process is controlled by three specialized translation initiation

Introduction
28
Introduction
factors: IF1, IF2 and IF3. The elongation phase involves a cycle of four major steps. First, an
aminoacylated tRNA (aa-tRNA) is delivered to the A-site of the ribosome by elongation factor Tu (EF-
Tu) in complex with GTP.
Figure 3. Schematic diagram of bacterial protein synthesis. The main steps comprising the translation process are shown. Details regarding each step are provided in the main text. For simplicity, some intermediate stages are omitted. The mRNA is depicted as a strand running horizontally along the small (30S) subunit, with alternating white and black segments, each representing one codon. The tRNAs bind at A-, P- and E-sites. The nascent polypeptide is shown as a string of spheres. The individual structures and cartoons are not drawn to scale (adapted from Agirrezabala and Frank, 2010).
During the process of decoding, the ribosome monitors the base-pairing interaction between
the mRNA codon and the tRNA anticodon, ensuring that only tRNAs bearing the correct amino acid
are accommodated. Peptide-bond formation occurs between the amino acids attached to the tRNAs
in the A- and P-sites, resulting in transfer of the amino acid (or the polypeptide chain in later
elongation cycles) from the P-site tRNA to the aa-tRNA in the A-site. In order to accommodate the
next incoming aa-tRNA, the tRNAs are moved from the A-and P-sites to the P-and E-sites in a process
known as translocation, which is facilitated by EF-G. As the polypeptide chain elongates, it passes
through an exit tunnel in the 50S subunit before entering the cytoplasm, where protein folding

Introduction
29
Introduction
occurs. The elongation cycle continues until a stop codon is encountered. The stop codon (UAG,
UGA or UAA) recruits release factor instead of tRNA which allows the release of the newly
synthesized nascent peptide chain. Finally, the two subunits are dissociated in the recycling step
making them available for the next translation cycle. This basic mechanism of the protein synthesis
is conserved across species, but there are differences in regulation and certain steps, such as
initiation, associated with more complex organisms.
Structural studies of the ribosome
At present the methods of structural biology are at the forefront in the understanding the
molecular mechanisms of protein synthesis. Modern structural approaches are bringing
fundamental biochemical knowledge about the ribosome accumulated during last century to an
atomic level (when visualization of interactions between atoms is available). Pioneering works on
structural investigation of biological material (mainly single proteins and nucleic acids) were made
in the middle of 20th century using X-ray crystallography: structures of vitamin B12 (Hodgkin et al.,
1956), insulin (Blundell et al., 1971), penicillin (Crowfoot et al., 1949) by D. Hodgkin and coworkers;
helical structure of the DNA (Watson and Crick, 1953) by R. Franklin, J. Watson, F. Crick, M. Wilkins;
structure of protein haemoglobin (Perutz et al., 1960); and many others. Later, in 1984 the
laboratory of K. Wüthrich produced the first protein structure determined by NMR (nuclear
magnetic resonance), a spectroscopy technique (Williamson et al., 1985). The same year can be
considered as an origin of cryo-electron microscopy (cryo-EM) of biological materials, when the first
images of adenovirus embedded in a vitrified layer of water were shown (Adrian et al., 1984). The
importance of all this discoveries and their colossal impact in biology, chemistry and medicine
cannot be overestimated.
Although solving structures of proteins and nucleic acids became possible, structures of big
macromolecular complexes such as ribosome remained enigmatic. Massive, asymmetric, highly
flexible macromolecular complex composed of two types of molecules (RNA and proteins), the
ribosome was always extremely difficult object for structural analysis.
Use of NMR technique is commonly limited by the size of the molecule to analyse, typically 25
100 kDa, although sometimes NMR can be used to obtain structural information in large but
symmetric systems as big as 900 kDa (Fiaux et al., 2002). At the same time, electron microscopy is
limited for working with small objects but suitable for resolving the big ones. Hence, the first 3D
reconstructions of the ribosome were obtained using electron microscopy. In 1983 A. Spirin with
colleagues modelled the 70S ribosome from E. coli showing the main structural features of both
Introduction
30
Introduction
subunits (Vasiliev et al., 1983; see also Vasiliev et al., 1974; Lake 1976 and refs therein; Kastner et
al., 1981). During next decades, J. Frank and colleagues worked on ribosome structure
determination using cryo-electron microscopy technique. They have achieved significant progress
in that area, by reaching 11.5 Å resolution of 70S ribosome in 2000 and contributed to the
development of cryo-EM method in general (Wagenknecht et al, 1989; Stark et al., 1995; Gabashvili
et al., 2000).
In the middle of 1980s two groups started to work in the direction of X-ray crystallography,
the most developed, the most accurate and the most reliable method. However, this method is one
of the most challenging one, because the researcher need to produce highly ordered radiation
tolerant solid crystals, which requires a lot of stable homogeneous material and specific conditions.
Obviously, this becomes excessively difficult task working with the ribosome which is large,
asymmetric, flexible, and very dynamic RNA-protein complex. However, years of work and the
sharing of experience have enabled researchers to achieve this aim.
X-ray crystallography of the ribosome
X-ray crystallography is the presently the only one technique that conceivably provide the
high-resolution structural information of the ribosome.
The first crystals of the large ribosomal subunit were obtained from the thermophilic
bacterium Bacillus stearothermophilus and extreme halophilic archaeons Haloarcula marismortui.
in the Max Plank Institute (Berlin) by H. Wittmann and A. Yonath in 1982. Their pioneering work
provided the crystals of the large bacterial and archaeal 50S subunits diffracting to 18 Å resolution
(Yonath et al., 1984; Yonath et al., 1986; Shoham et al., 1986).
In 1983 new extreme thermophile Thermus thermophilus was introduced in the field of
ribosome crystallography in the group of Dr. M. Yusupov from the Institute of Protein Research,
Academy of Sciences of USSR (Puschino). In this group purification procedures of the ribosomes
were developed and reported for the first time crystallization procedures of small ribosomal 30S
subunit and full 70S ribosome (Trakhanov et al., 1987; Yusupov et al., 1987). From 1995 to 2000,
V. Ramakrishnan from Cambridge University (UK) and A. Yonath groups published the
T. thermophilus 30S structure at atomic resolution (Schluenzen et al. 2000, Wimberly et al. 2000).
In 2000, T. Steitz (Yale University, USA) with colleagues produced a 2.4 Å electron density map of
the H. marismortui 50S subunit (Ban et al., 2000).
The first crystal structure of full 70S ribosome from T. thermophilus containing bound
functional ligands such as a messenger RNA and three transfer RNAs was solved at 7.8 Å resolution
Introduction
31
Introduction
in 1999 in collaboration between M. Yusupov, G. Yusupova and H. Noller (University of California,
Santa Cruz) (Cate et al., 1999). In 2001 the resolution of this crystal form was extended to 5.5 Å,
providing for the first time detailed analysis of the interactions between the subunits and their
interactions with messenger RNA and tRNAs in the A-, P- and E-sites (Yusupov et al., 2001, Yusupova
et al, Cell, 2001). Within the next few years, a similar crystal form pushed their resolution to 3.7 Å
(Korostelev et al., 2006). The group of J. Cate (University of California, Berkeley, USA) developed
experimental protocol for E. coli 70S ribosome and reached 3.5 Å resolution (Schuwirth et al., 2005;
Zhang et al., 2009). The resolution limits were soon surpassed again with discovery of a new crystal
form of T. thermophilus which diffracted to 2.8 Å (Selmer et al., 2006). Once the procedures of
ribosome purification and crystallization became well established many of functional complexes
have been determined and provided unprecedented insights into process of protein synthesis in
bacteria. In 2009 V. Ramakrishnan, T. Steitz and A. Yonath received the Nobel Prize in chemistry for
the studies of the structure and function of the ribosome.
However, many questions remained unanswered. Genome analysis, biochemical and
biophysical characterization, electron microscopy studies of eukaryotic ribosomes have shown the
differences in protein translation between eukaryotes and bacteria, but the atomic structure of
eukaryotic ribosome remained elusive. But recently in 2010, the first structure of the full eukaryotic
ribosome from Saccharomyces. cerevisiae was solved at 4.2 Å (Ben-Shem et al., 2010) in the
laboratory of M. Yusupov (IGBMC, Strasbourg, France). In 2011 the same group reported the crystal
structure of the 80S ribosome from S. cerevisiae!including nearly all ribosomal RNA bases and
protein side chains as well as an additional protein, Stm1!at a resolution of 3.0 angstroms (Ben-
Shem et al., 2011). Structures of the large 60S and small 40S ribosomal subunits of Tetrahymena
thermophila at 3.5 Å and 3.9 Å respectively were obtained by N. Ban (ETH, Zurich, Switzerland) and
his colleagues (Klinge et al., 2011; Rabl et al., 2011). The only crystal structure of mammalian
ribosome obtained so far is rabbit 43S initiation complex solved at 11 Å resolution in the laboratory
of T. Steitz (Lomakin and Steitz, 2013). Significant advances in deciphering detailed mechanisms,
fidelity and stalling of protein synthesis using X-ray analysis were made by the laboratories of H.
Noller, M. Yusupov, J. Cate, T. Steitz, V. Ramakrishnan, who carried out many unique studies on
crystal structures of different intermediate states of translating or stalled ribosome (references
marked by *).
While X-ray crystallography has been highly informative, one of its limitations is that the result
is a static model. The translation process, however, passes through a cycle where major interactions
physically change with time. A consequence of the nature of the technique is that only interactions

Introduction
32
Introduction
that minimally alter the ribosome's structure and do not interfere with crystal packing can be
observed by modifying any known crystal form. To overcome this problem, the cryo-electron
microscopy is employed by researchers.
Cryo-electron microscopy of the ribosome
The relatively "young" but extremely ambitious technique of cryo-electron microscopy (cryo-
EM)) is currently receiving a lot of attention from structural biologists. Some would even call it "the
new era of cryo-EM" where structures at near-atomic resolution are no longer the prerogative of X-
ray crystallography or NMR spectroscopy (W. Kühlbrandt, 2014a; W. Kühlbrandt, 2014b). Indeed,
cryo-electron microscopy made a huge progress during last several years and due to technological
and computational developments is able to reach near atomic and even atomic resolution (Fisher
et al., 2015; Khatter et al., 2015; Bartesaghi et al., 2015). Notably, the ribosome played an important
role in this development. There are several major reasons why ribosomes are a convenient objects
for cryo-EM:
Size (2.5 4.3 MDa): big size and globular shape make it readily visible on cryo-EM
micrographs;
Stability: due to high RNA content it is more stable during the exposure to electrons;
Availability of crystal structures: fitting already known crystal structure into cryo-EM
density facilitates modelling of similar structures.
Cryo-electron microscopy delivers the number of strong methodological advantages to the
area of structural investigation of macromolecules. First, molecules in solution can be studied, thus
obviating the demanding and limiting step of crystallization. Another advantage is that the amount
of material and the concentration required for cryo-EM is considerably lower than that required for
crystallography. Third, it provides an opportunity to analyse different populations (even minor ones)
of the same sample allowing the trapping of intermediate states of dynamic biological processes.
The advantages outlined above overcame the limitations of X-ray crystallography and have
shed light on high resolution structures of the ribosomes from Trypanosoma brucei (Hashem et al.,
2013), Plasmodium falciparum (Wong et al., 2014), humans (Anger et al., 2013, Khatter et al., 2015).
Furthermore, it revealed the structures of mitochondrial ribosomal subunits and the full mito-
ribosome (Greber et al., 2014 and 2015; Kaushal et al., 2014; Brown et al., 2014; Amunts et al., 2014
and 2015), the chloroplast ribosome (Manuell et al., 2007), the stalled Bacillus subtilis ribosome
(Sohmen et al., 2015), the membrane bound mammalian ribosomes (Voorhees et al., 2014) and
many functional complexes that were difficult to get by X-ray crystallography (see references
Introduction
33
Introduction
marked by **).
Cryo-EM does however suffer from some strong disadvantages. First, the flexibility of the
particles on cryo-EM grid is much higher than flexibility of the particles inside the crystal. For
example, a distinctive feature of the human ribosome is the presence of human-specific long rRNA
expansion segments, which contribute to ~25% of molecular weight of the ribosome. Despite solving
structures of human ribosome at 5.0 and 3.6 Å resolution, the structure of these 1 MDa expansion
segments remains enigmatic. Another weak point is the problem of resolution. Researchers use
different methods to estimate the resolution of their structures due to the absence of a unified
approach to calculate it. Moreover, the resolution of the structure is not homogeneous. Due to the
movements of the specimen during the exposure with electrons, the resolution on the periphery
can be significantly lower than in the centre of the particle. And finally, the field of cryo-EM still lacks
the unified tools for validation of the structures. This can cause misinterpretations and errors in the
final model.
Summarizing, methods of structure determination are too different to be compared between
each other. Every technique has its limitations that must be respected. Especially working with very
big asymmetric molecular assemblies like ribosome, we need to be particularly careful with data
interpretation, since the resolution is still far below that of the real atomic resolution, which is 1.5
Å and higher (Blow, 2002).
Introduction
34
Introduction
STAPHYLOCOCCUS AUREUS
The high-resolution structures of ribosomes and ribosomal subunits obtained by
crystallography and electron microscopy have revolutionized the field of protein translation.
Knowledge of the precise positions of residues in the ribosome in various states has led to a deeper
understanding of the complex mechanisms of protein synthesis. Crystal structures of ribosomal
complexes with antibiotics and antifungal compounds and other ribosome inhibitors have provided
unparalleled insight into their mechanisms of action, and they also facilitate the design of more
effective drugs (Garreau de Loubresse et al., 2014; see for review Wilson, 2014). It was discovered
that most of translation inhibitors bind to the conserved regions of the ribosomes (PTC, tRNA-
binding sites, protein exit tunnel, etc). However, the effects of the same drug on different organism
can vary from species to species. An excellent example is provided by the drug-resistant bacteria
which are tolerant to many of commonly used antibiotics. Among them is Staphylococcus aureus
(S. aureus), a severe pathogen that causes numerous infections in humans. This bacterium is rather
unique and thus, requires individual approach for treatment. Therefore, solving the structure of the
ribosome from S. aureus will be the first step in understanding precise mechanism of its resistance
to antibiotics and will facilitate the design of new antistaphylococcal compounds.
Main characteristics of S. aureus
Staphylococci are Gram-positive bacteria, with diameters of 0.5 "#$%&'%()*%+,(-(+./-01/*%
by individual cocci, which divide in more than one plane to form grape-like clusters (Harris et al.,
2002). To date, there are at least 40 species and 11 sub-species in the genus Staphylococcus, many
of which preferentially colonize the human body. Staphylococcus aureus and Staphylococcus
epidermidis are the two most characterized and studied strains due to their medical importance.
Staphylococci are non-motile, non-spore forming facultative anaerobes that grow by aerobic
respiration or by fermentation. Pathogenic species are commonly identified by their ability to
produce coagulase, and thus clot blood. Members of Staphylococcus genus are catalase-positive and
oxidase-negative, distinguishing them from the genus streptococci, which are catalase-negative, and
have a different cell wall composition to staphylococci.
S. aureus is a major pathogen of increasing importance due to high antibiotic resistance (Lowy,
1998). The species name aureus refers to the fact that colonies often have a golden colour when
grown on solid media. The cell wall of S. aureus is a tough protective coat, about 20 40 nm thick
Introduction
35
Introduction
(Shockman and Barrett,1983). About 50% of the cell wall mass is made of peptidoglycan (Waldvogel,
1990). Another cell wall constituent is a group of phosphate-containing polymers called teichoic
acids, which contribute about 40% of cell wall mass (Knox and Wicken, 1973). Teichoic acids
contribute a negative charge to the staphylococcal cell surface and play a role in the acquisition and
localization of metal ions, particularly divalent cations, and the activities of autolytic enzymes
(Wilkinson, 1997). Peptidoglycan and teichoic acid together only account for about 90% of the
weight of the cell wall, the rest is composed of surface proteins, exoproteins and peptidoglycan
hydrolases (autolysins). Some of these components are involved in attaching the bacteria to
surfaces and are virulence determinants.
S. aureus is responsible for severe nosocomial and community-acquired infections. It can
cause a variety of self-limiting to life-threatening diseases in humans. Some skin conditions caused
by Staphylococcal exfoliative toxins include blisters, skin loss, pimples, furuncles, impetigo,
folliculitis, abscesses, poor temperature control, fluid loss, and secondary infection (Murray et al.,
2002; Le Loir et al., 2003; Einstein, 2008; Fridkin et al., 2005). Certain strains of S. aureus produce
the superantigen TSST-1, which is responsible for toxic shock syndrome (TSS) (Murray et al., 2002),
from which mortality is very high; death can occur within 2 hours (Chen et al., 2007). Deeply
penetrating S. aureus infections can be severe. Such infections include endocarditis, peritonitis,
necrotizing pneumonia, bacteremia, meningitis, osteomyelitis, septic arthritis, and infections of
bones, joints and organs (Murray et al., 2002; Einstein, 2008; Fridkin et al., 2005).
S. aureus is a successful pathogen due to a combination of nasal carriage and bacterial
immune-evasive strategies (Kluytmans et al., 1997; Cole et al., 2001). S. aureus can grow in a pH
range from 4.2 to 9.3 and in salt concentrations of up to 15% (Le Loir et al., 2003). The bacteria can
survive for up to 42 days on carcasses and organs, for up to 7 days on floors, for up to 46 hours on
glass, after exposure to 17 or 7 hours of sunlight or UV respectively, for 60 days on meat products,
for up to 7 days on coins, or from 30 min to 38 days on skin (Cimolai, 2008). It has evolved a number
of regulatory mechanisms to control the synthesis of its multiple virulence factors in response to
the host, stresses and environmental changes (Lowy, 1998).
Virulence determinants
During bacterial infections, various genes must be expressed in a temporally coordinated
manner to allow the bacterium to adapt to the environment in the host and to cause infection.
Therefore, the multiplicity of these virulence regulatory factors and the interconnected networks
that they form may be required to adapt to most environments (Figure 4). The S. aureus genome

Introduction
36
Introduction
encodes more than 100 transcriptional regulators that modulate the production of virulence factors
either directly or indirectly (Junecko et al., 2012). The best characterized global regulators are the
accessory gene regulator (agr), the staphylococcal accessory regulator (sar), S. aureus exoprotein
expression (sae), the small regulatory RNAIII and sigma factor B (2B).
Figure 4. Regulation network of production of virulence factors in S. aureus (adapted from Chevalier, 2009).
The agr up-regulates the production of many exoproteins, including TSST-1, enterotoxin B and
C (Recsei et al., 1986; Morfeldt et al., 1988), and V8 protease (sspA); Conversely, agr down-regulates
the synthesis of cell wall associated proteins, including fibronectin-binding proteins, and fibrinogen-
binding proteins during the post-exponential and stationary growth phases (Foster et al., 1990;
Lindberg et al., 1990). More recent studies identified the agr-operon (agrBCDA) to be a
multicomponent quorum sensing system that regulates production of RNAIII, a global regulator of
virulence factors production.
Cheung et al. (1992) identified a second regulatory locus called sar, that is distinct from the
agr locus. The SarA family includes 11 homologs (SarR, SarS, SarT, Rot, etc) that interact with each
other forming part of a complex regulatory network controlling virulence factors. A sarA mutant
*/+-/(3/3% .,/%/45-/3306)%67% 3/8/-(9% /465-6./0)3:% 3;+,%(3%<-:% =-:% ()*%>-hemolysin, and increases

Introduction
37
Introduction
others such as proteases (Cheung et al., 1994; Chan and Foster, 1998). Studies have also shown that
sarA is essential for agr-dependent regulation. A double mutant, agr sarA was found to have
reduced expression of exoproteins and cell wall-associated proteins compared to single agr and
sarA mutants (Cheung et al., 1992).
A further locus, sae, has been identified and shown to have a role in the production of
virulence determinants (Giraudo et al., 1994). The sae locus is essential for the transcription of
alpha-toxin, =-hemolysin and coagulase coding genes, but does not affect the expression of agr or
sarA. Several studies have demonstrated that sae also modulates the production of virulence factors
other than toxins including surface proteins and capsule biosynthesis components (Novick and Jiang,
2003; Voyich et al., 2009; Mainiero et al., 2010; Sun et al., 2010; Luong et al., 2011).
The regulation of virulence determinants may also involve sigma factors ?2@:% A,0+,% (-/%
proteins that bind to the core RNA polymerase to form the holoenzyme that binds to specific
promoters (Moran, 1993; Deora and Misra, 1996). In S. aureus .,/-/%(-/%.A6%30B'(%7(+.6-3C%2A, the
primary sigma factor responsible for the expression of housekeeping genes, whose products are
)/+/33(-D%76-%B-6A.,%?E/6-(%/.%(9#:%"FFG@H%()*%2B, the alternative sigma factor, that regulates the
/45-/3306)%67%'()D%B/)/3%0)8698/*%0)%+/99;9(-%7;)+.06)3%?E/6-(%()*%I03-(:%"FFJ@#%2B has a role in
virulence determinant production, and the stress response. At least 30 genes in S. aureus, most of
A,0+,%(-/%0)8698/*%0)%3.-/33%-/356)3/3:%,(8/%K//)%3,6A)%.6%K/%+6).-699/*%KD%2B. Amongst them,
SigB is involved in bacterial aggregation by modulating the expression of the genes encoding
clumping factor or other adhesins (Gertz et al., 2000; Horsburgh et al., 2002).
Another important virulence regulator I would like to mention is RNAIII. It is a highly abundant
and stable regulatory RNA, with a complex secondary structure (Figure 5). Some of the structural
motifs allow RNAIII to interact with Shine-Dalgarno (SD) sequence of some coding RNAs, such as rot
mRNA. RNAIII directly upregulates tran39(.06)%67%<-hemolysin and carries the coding sequence of >-
hemolysin. It also known to downregulate translation of protein A and fibrinogen-binding protein
encoded by gene SA1000 (Novick et al., 1993).

Introduction
38
Introduction
Figure 5. RNAIII secondary structure (adapted from Benito et al., 2000). Numbers refer to individual stemloops; pink nucleotides are complementary to rot mRNA or other SD sequences; blue nucleotides delineate the terminator stem loop; aqua, pre-*/9.(%+6*0)B%-/B06)H%B-//):%>-hemolysin coding region.
S. aureus - superbug
Although S. aureus carries powerful arsenal of virulence determinants, its presence does not
always indicate infection. Bacteria can be found as part of the normal skin flora and in anterior nares
of the nasal passages as a commensal (Kluytmans et al., 1997; Cole et al., 2001). It is estimated that
around 20% of individuals are long-term carriers of Staphylococcus aureus (often colonized by a
single strain of S. aureus over long time periods), about 60% are intermittent carriers (may carry
different strains over time), and approximately 20% rarely carry it (Kluytmans et.al., 1997;
VandenBergh et.al., 1999). These numbers attributed to the ability of S. aureus to evade the host
immune response including immunoglobulin A and G, lysozyme, lactoferrin and antimicrobial
peptides (Kaliner, 1991). A variety of escape mechanisms can be used: staphylokinase (Jin et al.,
2004) and membrane lipid modification (Peschel et al., 2001) against cationic antimicrobial
peptides; production of protein A that binds Fc region of immunoglobulins, thereby inactivating
them (Crossley and Archer, 1997). Furthermore, all S. aureus strains are lysozyme resistant because
they possess the peptidoglycan-specific O-acetyltransferase (Bera et al., 2005).
Besides protection from mammalian defensines, S. aureus shows extremely high level of
resistance to antibiotics and antimicrobial compounds in general. Since the time antibiotics were
introduced to masses, S. aureus has developed resistance to most of them and now staphilococcal
infections have became very difficult to treat. Antimicrobial resistance of pathogenic bacteria is a

Introduction
39
Introduction
genuine problem of the modern medicine. The therapeutic outcome of infections that result from
antibiotic resistant strains is worse than the outcome of those that result from sensitive strains
(Cosgrove et al., 2003). Once identified in a new setting, unique resistant clones rapidly spread.
Moreover, they frequently carry resistance genes to other antimicrobial agents (Lyon et al., 1984).
A 2014 report by World Health Organization (WHO) reveals that antimicrobial resistance,
including antibiotic resistance is no longer a prediction for the future, it is happening right now in
every region of the world and has the potential to affect anyone, of any age, in any country.
Antibiotic resistance is now a major threat to public health. According to the report, as many as 60%
of Staphylococcus aureus infections are determined to be methicillin-resistant (MRSA) in Europe.
This value was 90% in the WHO Region of Americas, 80% in African Region, 80% in Western Pathific
Region. 50% of S. aureus infections in Eastern Mediterranean Region and more than 25% in some
parts of South-East Asia Region were reported to be methicillin-resistant. Despite of recent progress
in suppressing the emergency of multiresistance bacteria, antimicrobial resistance is still one of the
hottest topic at the Health Assembly 2015 (World Health Organization, 2015).
Antibiotic resistance of S. aureus
The development of antibiotics enormously improved our survival from infectious diseases,
yet the rise of antimicrobial resistance is threatening to make them ineffective in the future. The
World Health Organization (WHO) estimates that antibiotics have added an average of 20 years to
the average human lifespan. But in the almost 90 years since the discovery of penicillin, many
pathogenic species have developed resistance to the most of commonly used antimicrobials. Among
them Escherichia coli, Mycobacterium tuberculosis, Neisseria gonorrhoeae, Streptococcus
pneumoniae, Staphylococcus aureus.
Notably, the Alexander Fleming observed the first antimicrobial activity of the Penicillum
fungus on the culture of S. aureus in 1928 (Fleming, 1928). After several years, in the early 1940s,
mass production of penicillin using the method devised by Howard Florey dramatically improved
the prognosis of patients with staphylococcal infection. However, as early as 1942, penicillin-
resistant staphylococci were recognized, first in hospitals and subsequently in the community
(Rammelkamp, 1942). By the late 1960s, more than 80% of both community- and hospital-acquired
staphylococcal isolates were resistant to penicillin. To date, penicillin-resistant isolates of S. aureus
have reached as much as 98% in some regions. The resistance was attributed to the activity of =-
lactamase enzyme, penicillinase. Modifications of the penicillin molecule were supposed to
overcome bacterial resistance. The first semi-synthetic penicillinase-resistant penicillin was
Introduction
40
Introduction
methicillin, which is no longer in use. Introduced in 1961 it became known as antistaphylococcal
penicillin, however, the reports of methicillin-resistant isolates appeared shortly (Jevons, 1961).
To date, methicillin-resistant Staphylococcus aureus (or MRSA) is one of the most frequent
causes of antibiotic-resistant healthcare-associated infections worldwide. The emergence of
antibiotic-resistant forms of pathogenic S. aureus (e.g. MRSA) is a worldwide problem in clinical
medicine. Disease prevention and treatment strategies must be adapted to reflect infection risk
factors and available treatment options.
Mechanisms of antibiotics action and bacterial resistance.
To overcome the problem of antimicrobial resistance both, the mechanism of drug action and
strategies of bacterial defence should be elucidated on molecular level. Most of known antibiotics
act on following major targets in bacterial cells: cell wall and components of cell wall synthesis
process; protein synthesis and nucleic acids synthesis machineries. In turn, bacterial resistance can
be mediated by a range of mechanisms: from preventing the compound to pass the cell wall barrier
to the drug degradation inside the cell (Figure 6). Different antibiotics aiming different targets,
mechanisms of their action and respectively the manner of resistance to them will be discussed
below. Particular regards will be given to compounds that interfere with bacterial protein synthesis
apparatus, more precisely the ribosome. Taking in account the vast number of antibiotics and even
countless number of their derivatives, the overview will include only some of them, most studied
and most frequently used in medicine.
Overview of antibiotic resistance mechanisms

Introduction
41
Introduction
Figure 6. Antibacterial resistance mechanisms (adapted from Wilson, 2014): a. impaired influx owing to low membrane permeability; b. active efflux of the drug from the cell; c. target modification; d. target alteration, which lowers the affinity of the drug for the target; e. overproduction of a molecule that mimics the target, which lowers the effective drug concentration so that the target remains unbound; f. the recruitment of a specialized protein factor to actively remove the drug from the target; g. modification of the drug; h. degradation of the drug.
Antibiotics interfering with cell wall synthesis
Antibacterial drugs that work by inhibiting bacterial cell wall synthesis were historically first
antibiotics introduced to masses to treat bacterial infections. They have made the major
contribution in treatment of many severe diseases caused by pathogenic bacteria and gave rise of
antibiotic era in medicine. This class of antibiotics includes =-lactams, such as the penicillins,
cephalosporins, carbapenems, and monobactams, and the glycopeptides, including vancomycin and
teicoplanin (Neu, 1992; McManus, 1997). =-lactam agents inhibit synthesis of the bacterial cell wall
by interfering with the enzymes required for the synthesis of the peptidoglycan layer. Due to the
ability to bind penicillin these enzymes were called penicillin-binding proteins (PBPs).
Predominantly, resistance to these antibiotics is driven by the activity of =-lactamase enzymes
that cleave =-lactam ring of drug molecule turning it ineffective (Bondi and Dietz, 1945).
Modification of existing drugs and development of new generation of =-lactam antibiotics led to the
evo9;.06)%67%(%)/A%B/)/-(.06)%67%=-lactamases, which have an extended substrate spectrum.
A widely used mechanism against second-generation =-lactams (methicillin, carbapenems,
etc) depends on the changes in PBPs. Mutational changes in the original enzymes, or the acquisition

Introduction
42
Introduction
of different ones, leads to inability of antibiotic to bind its target and to interfere with cell wall
synthesis.
Analogously to methicillin, resistance to glycopeptide antibiotics (vancomycin, teicoplanin)
has manifested itself largely through the expression of genes that encode proteins that reprogram
cell wall biosynthesis and thus evade the action of antibiotic (Pootoolal et al., 2002). The genes
conferring antibiotic resistance are usually part of a transposable element located on a large
plasmid, often with additional antimicrobial resistance genes (e.g., gentamicin and erythromycin)
(Poole, 2004; Jacoby and Munoz-Price, 2005).
Antibiotics interfering with nucleic acid synthesis
Antibiotics interfering with synthesis of nucleic acids are the most commonly prescribed
antibacterials in the world. However, the resistance to these antibiotics can rise extremely rapidly
(Aldred et al., 2014). The main antibiotics in this class are quinolones and fluoroquinolones, which
experienced several modifications resulting in four generation with different spectrum of
antimicrobial activity. Quinolones interfere with bacterial DNA replication process by converting
their targets, gyrase and topoisomerase IV, into toxic enzymes that fragment the bacterial
chromosome (Andriole, 2000). Another important representative of this class is rifampycin (or
rifampin), the antibiotic binds to bacterial RNA polymerase and inhibits its activity (Hartmann, 1967;
Calvori et al., 1965; McClure et al., 1978).
Bacteria can use several resistance pathways to discriminate the action of quinolons: 1) efflux
pumps (Morita et al., 1998), 2) production of gyrase binding proteins, which either decrease the
affinity of enzyme to DNA or competing for the binding site with antibiotic (Tran et al., 2005a; Tran
et al., 2005b), 3) mutations of enzyme residues critical for antibiotic binding (Hooper, 1999). The
resistance to rifampicin is mainly mediated by mutation of the antibiotic binding site on the RNA
polymerase (Goldstein, 2014).
Antibiotics interfering with protein synthesis
The majority of antibiotic classes that are used in the clinical setting and target the ribosome
have been marketed in the twenty-first century. Ribosome-binding antibiotics differ from
compounds used in many other therapeutic areas as their mechanism of action is dominated by
interactions with RNA rather than with target proteins. Therefore, ribosome-targeting antibiotics
provide an important paradigm for the study of RNA molecular recognition by small molecules.

Introduction
43
Introduction
Figure 7. Antibiotics targeting sites during protein synthesis (adapted from Agirrezabala and Frank, 2010; Wilson, 2014). Fus - fusidic acid; Ede - edeine; Ksg - kasugamycin; Pct - pactamycin; Thb - thermorubin; Avn - avilamycin; Evn - evernimycin; Ths - thiostrepton; Bls - blasticidine S; Cam - chloramphenicol; Cln - clindamycin; Lnz - linezolid; Plu - pleuromutilins; Pmn - puromycin; SA - streptogramine A; Spr - sparsomycin; Cap - capreomycin; HygB - hygromycin B; Neo - neomycin; Par - paromomycin; Spt - spectinomycin; Vio - viomycin.
Bacterial ribosome is the target of a chemically diverse group of natural secondary metabolites
that bind to specific sites within the ribonucleoprotein complex, where they interfere with protein
synthesis and ultimately inhibit microbial growth. Interest in the ribosome as a target for the
discovery of new antibacterials has been spurred over the past few years by the structure
determination of whole bacterial ribosomes, subunits, domains and antibiotic complexes thereof
(see for review Hermann, 2005; Tenson and Mankin, 2006). Three-dimensional structures of
ribosome antibiotic complexes have confirmed earlier biochemical work, revealing that the natural
products interact predominantly with the RNA components in the functional sites of the ribosome
such as tRNAs binding sites, PTC, decoding centre, peptide exit tunnel (see for review Blaha et al.,
2012; Sohmen et al., 2009; Wilson 2011). Table 1 presents an overview on the antibiotics that target
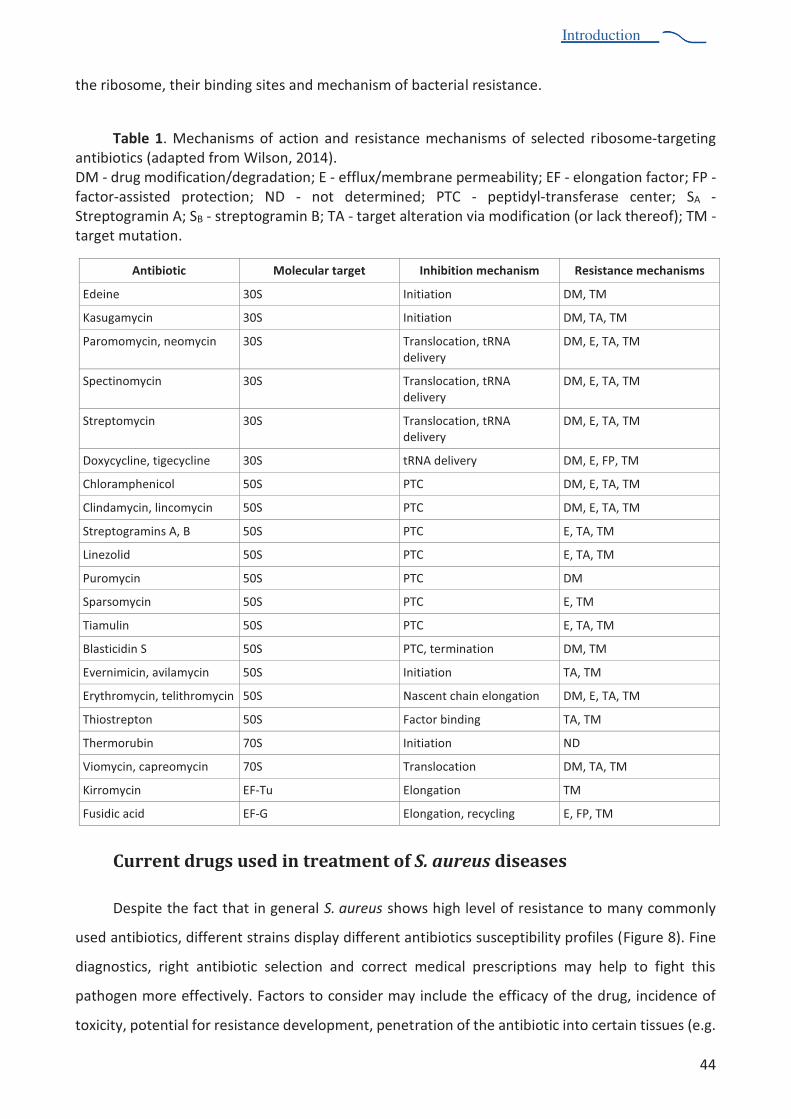
Introduction
44
Introduction
the ribosome, their binding sites and mechanism of bacterial resistance.
Table 1. Mechanisms of action and resistance mechanisms of selected ribosome-targeting antibiotics (adapted from Wilson, 2014). DM - drug modification/degradation; E - efflux/membrane permeability; EF - elongation factor; FP - factor-assisted protection; ND - not determined; PTC - peptidyl-transferase center; SA - Streptogramin A; SB - streptogramin B; TA - target alteration via modification (or lack thereof); TM - target mutation.
Antibiotic Molecular target Inhibition mechanism Resistance mechanisms
Edeine 30S Initiation DM, TM
Kasugamycin 30S Initiation DM, TA, TM
Paromomycin, neomycin 30S Translocation, tRNA delivery
DM, E, TA, TM
Spectinomycin 30S Translocation, tRNA delivery
DM, E, TA, TM
Streptomycin 30S Translocation, tRNA delivery
DM, E, TA, TM
Doxycycline, tigecycline 30S tRNA delivery DM, E, FP, TM
Chloramphenicol 50S PTC DM, E, TA, TM
Clindamycin, lincomycin 50S PTC DM, E, TA, TM
Streptogramins A, B 50S PTC E, TA, TM
Linezolid 50S PTC E, TA, TM
Puromycin 50S PTC DM
Sparsomycin 50S PTC E, TM
Tiamulin 50S PTC E, TA, TM
Blasticidin S 50S PTC, termination DM, TM
Evernimicin, avilamycin 50S Initiation TA, TM
Erythromycin, telithromycin 50S Nascent chain elongation DM, E, TA, TM
Thiostrepton 50S Factor binding TA, TM
Thermorubin 70S Initiation ND
Viomycin, capreomycin 70S Translocation DM, TA, TM
Kirromycin LMNO; Elongation TM
Fusidic acid LMNP Elongation, recycling E, FP, TM
Current drugs used in treatment of S. aureus diseases
Despite the fact that in general S. aureus shows high level of resistance to many commonly
used antibiotics, different strains display different antibiotics susceptibility profiles (Figure 8). Fine
diagnostics, right antibiotic selection and correct medical prescriptions may help to fight this
pathogen more effectively. Factors to consider may include the efficacy of the drug, incidence of
toxicity, potential for resistance development, penetration of the antibiotic into certain tissues (e.g.

Introduction
45
Introduction
bone, cerebrospinal fluid), cost, stability, and dosing convenience for home intravenous use.
O6*(D:%=-lactamase-resistant penicillins (methicillin, oxacillin, cloxacillin, and flucloxacillin) are
used as first-line treatment of MSSA. MRSA infections are commonly treated with non-=-lactam
antibiotics, such as clindamycin (a lincosamine) and co-trimoxazole (also commonly known as
trimethoprim/sulfamethoxazole). Resistance to these antibiotics has also led to the use of new,
broad-spectrum anti-gram-positive antibiotics, such as linezolid, because of its availability as an oral
drug. First-line treatment for serious invasive infections due to MRSA is currently glycopeptide
antibiotics (vancomycin and teicoplanin). There are number of problems with these antibiotics, such
as the need for intravenous administration (there is no oral preparation available), toxicity, and the
need to monitor drug levels regularly by blood tests. Based on the information described in several
comprehensive reviews (Rayner and Munckhof, 2005; Johnson and Decker, 2008; Morgan, 2011),
the main antimicrobial agents and their therapeutic use are summarized in Table 2. Several
antimicrobial agents and their therapeutic use are summarized in Table 2.
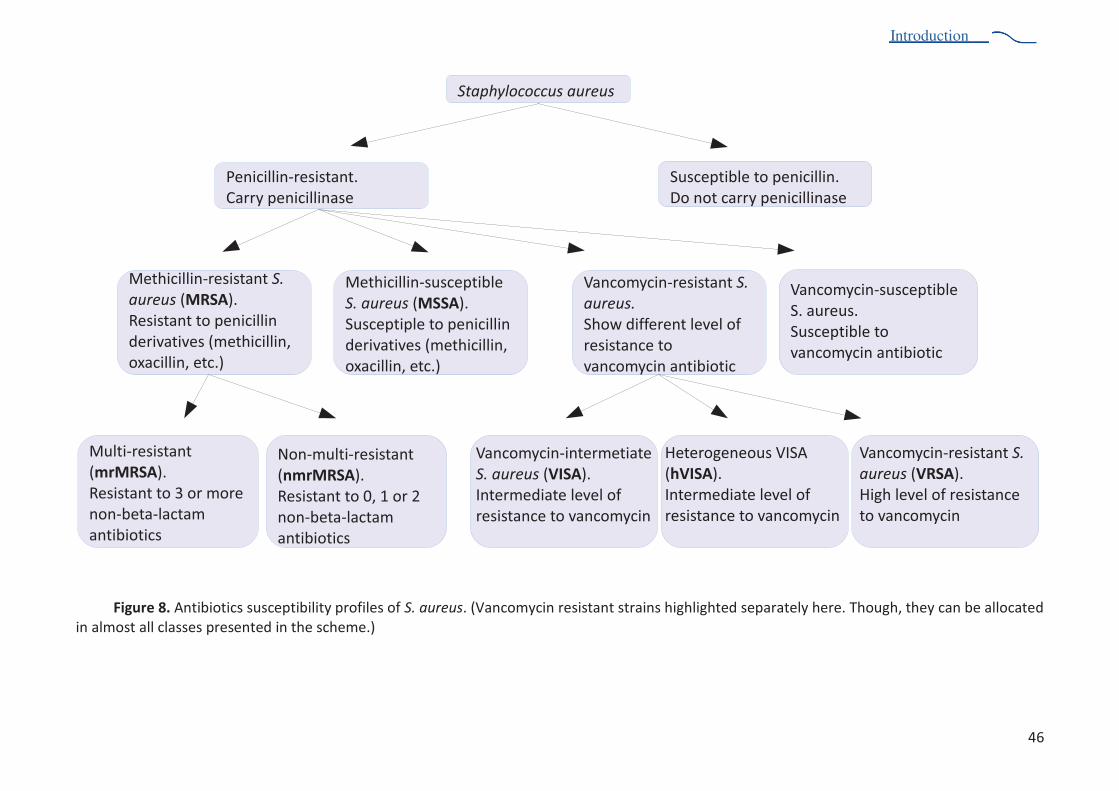
Introduction
46
Introduction
Figure 8. Antibiotics susceptibility profiles of S. aureus. (Vancomycin resistant strains highlighted separately here. Though, they can be allocated in almost all classes presented in the scheme.)
Staphylococcus aureus
Susceptible to penicillin.Do not carry penicillinase
Penicillin-resistant.Carry penicillinase
Methicillin-susceptible S. aureus (MSSA).Susceptiple to penicillin derivatives (methicillin, oxacillin, etc.)
Methicillin-resistant S.
aureus (MRSA).Resistant to penicillin derivatives (methicillin, oxacillin, etc.)
Non-multi-resistant (nmrMRSA).Resistant to 0, 1 or 2 non-beta-lactam antibiotics
Multi-resistant (mrMRSA).Resistant to 3 or more non-beta-lactam antibiotics
Vancomycin-intermetiate S. aureus (VISA).Intermediate level of resistance to vancomycin
Heterogeneous VISA (hVISA).Intermediate level of resistance to vancomycin
Vancomycin-resistant S.
aureus (VRSA).High level of resistance to vancomycin
Vancomycin-susceptible S. aureus.Susceptible to vancomycin antibiotic
Vancomycin-resistant S.
aureus.
Show different level of resistance to vancomycin antibiotic
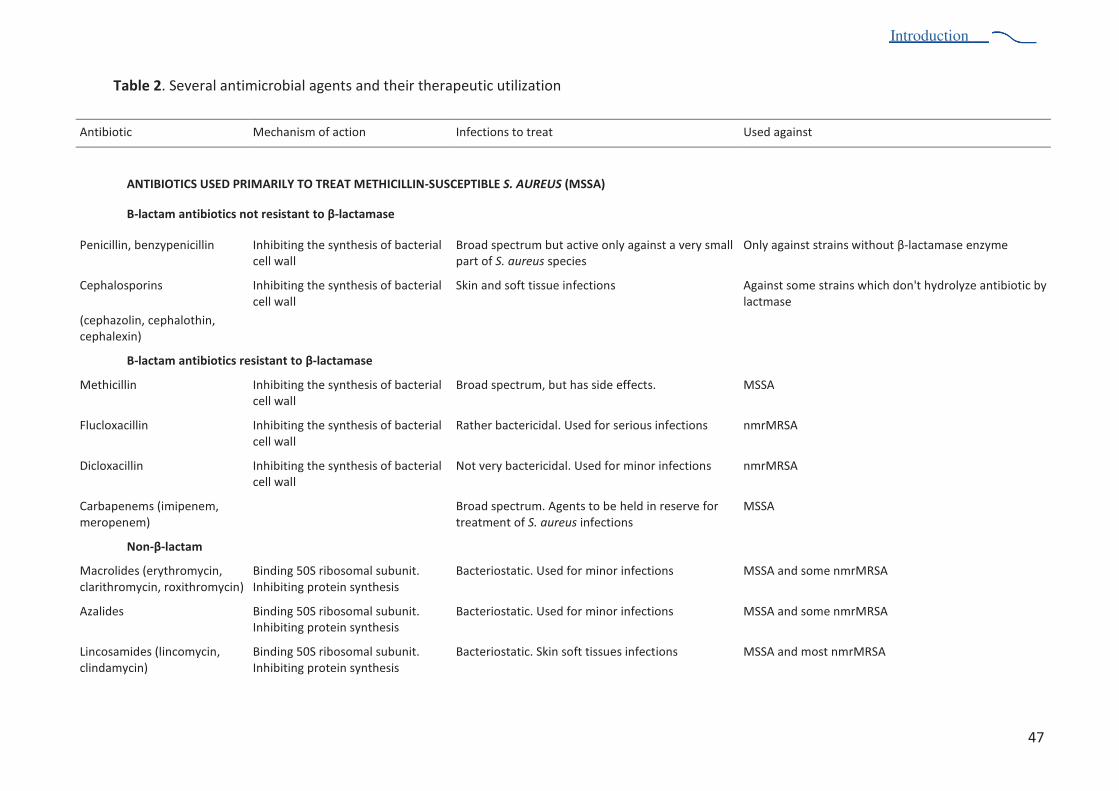
Introduction
47
Introduction
Table 2. Several antimicrobial agents and their therapeutic utilization
Antibiotic Mechanism of action Infections to treat Used against
ANTIBIOTICS USED PRIMARILY TO TREAT METHICILLIN-SUSCEPTIBLE S. AUREUS (MSSA)
-lactam antibiotics not resistant to !-lactamase
Penicillin, benzypenicillin Inhibiting the synthesis of bacterial cell wall
Broad spectrum but active only against a very small part of S. aureus species
Only against strains without -lactamase enzyme
Cephalosporins
(cephazolin, cephalothin, cephalexin)
Inhibiting the synthesis of bacterial cell wall
Skin and soft tissue infections Against some strains which don't hydrolyze antibiotic by lactmase
-lactam antibiotics resistant to !-lactamase
Methicillin Inhibiting the synthesis of bacterial cell wall
Broad spectrum, but has side effects. MSSA
Flucloxacillin Inhibiting the synthesis of bacterial cell wall
Rather bactericidal. Used for serious infections nmrMRSA
Dicloxacillin Inhibiting the synthesis of bacterial cell wall
Not very bactericidal. Used for minor infections nmrMRSA
Carbapenems (imipenem, meropenem)
Broad spectrum. Agents to be held in reserve for treatment of S. aureus infections
MSSA
Non-!-lactam
Macrolides (erythromycin, clarithromycin, roxithromycin)
Binding 50S ribosomal subunit. Inhibiting protein synthesis
Bacteriostatic. Used for minor infections MSSA and some nmrMRSA
Azalides Binding 50S ribosomal subunit. Inhibiting protein synthesis
Bacteriostatic. Used for minor infections MSSA and some nmrMRSA
Lincosamides (lincomycin, clindamycin)
Binding 50S ribosomal subunit. Inhibiting protein synthesis
Bacteriostatic. Skin soft tissues infections MSSA and most nmrMRSA
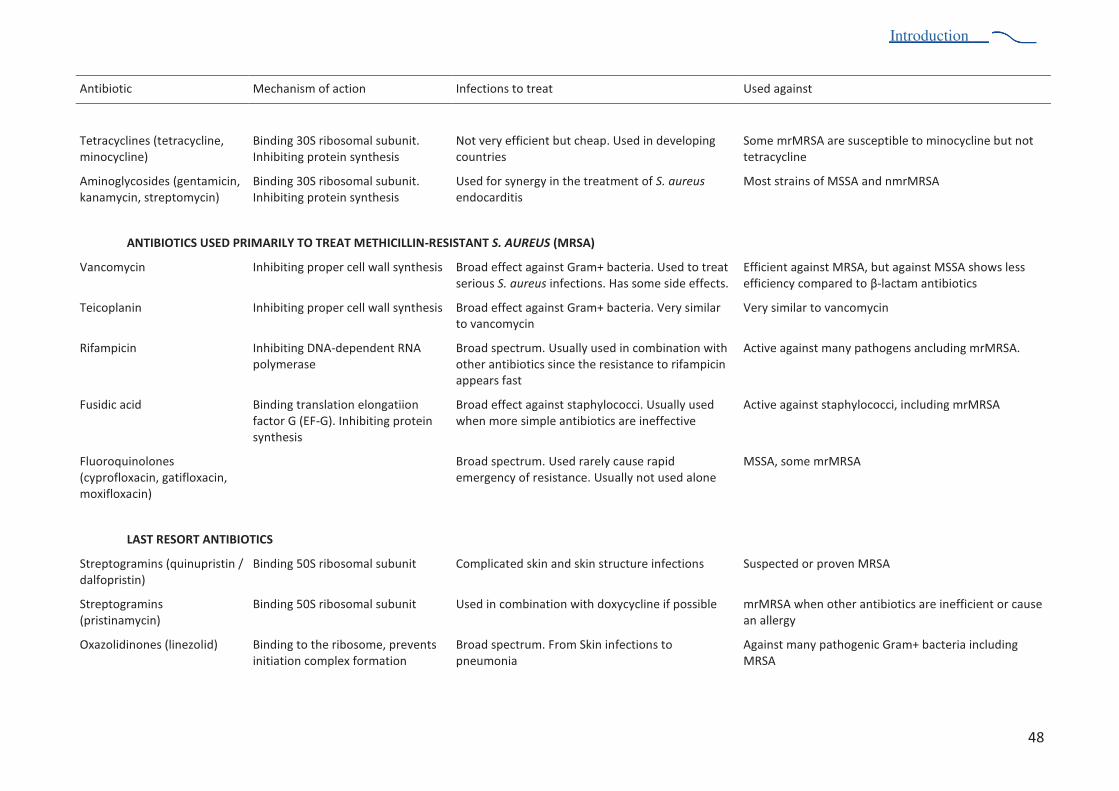
Introduction
48
Introduction
Antibiotic Mechanism of action Infections to treat Used against
Tetracyclines (tetracycline, minocycline)
Binding 30S ribosomal subunit. Inhibiting protein synthesis
Not very efficient but cheap. Used in developing countries
Some mrMRSA are susceptible to minocycline but not tetracycline
Aminoglycosides (gentamicin, kanamycin, streptomycin)
Binding 30S ribosomal subunit. Inhibiting protein synthesis
Used for synergy in the treatment of S. aureus endocarditis
Most strains of MSSA and nmrMRSA
ANTIBIOTICS USED PRIMARILY TO TREAT METHICILLIN-RESISTANT S. AUREUS (MRSA)
Vancomycin Inhibiting proper cell wall synthesis Broad effect against Gram+ bacteria. Used to treat serious S. aureus infections. Has some side effects.
Efficient against MRSA, but against MSSA shows less efficiency compared to -lactam antibiotics
Teicoplanin Inhibiting proper cell wall synthesis Broad effect against Gram+ bacteria. Very similar to vancomycin
Very similar to vancomycin
Rifampicin Inhibiting DNA-dependent RNA polymerase
Broad spectrum. Usually used in combination with other antibiotics since the resistance to rifampicin appears fast
Active against many pathogens ancluding mrMRSA.
Fusidic acid Binding translation elongatiion factor G (EF-G). Inhibiting protein synthesis
Broad effect against staphylococci. Usually used when more simple antibiotics are ineffective
Active against staphylococci, including mrMRSA
Fluoroquinolones (cyprofloxacin, gatifloxacin, moxifloxacin)
Broad spectrum. Used rarely cause rapid emergency of resistance. Usually not used alone
MSSA, some mrMRSA
LAST RESORT ANTIBIOTICS
Streptogramins (quinupristin / dalfopristin)
Binding 50S ribosomal subunit Complicated skin and skin structure infections Suspected or proven MRSA
Streptogramins (pristinamycin)
Binding 50S ribosomal subunit Used in combination with doxycycline if possible mrMRSA when other antibiotics are inefficient or cause an allergy
Oxazolidinones (linezolid) Binding to the ribosome, prevents initiation complex formation
Broad spectrum. From Skin infections to pneumonia
Against many pathogenic Gram+ bacteria including MRSA
Introduction
49
Introduction
S. aureus Ribosome as a target for new antibiotics
A rise in the antimicrobial resistance of S. aureus has forced researchers to modify existing or
find/synthesize new drugs to overcome resistance. The ribosome looks very attractive target for
new drugs. A fortiori there are already some examples of successfully introduced synthetic
antibiotics, linezolid and tedizolid, that were developed for treatment of serious infections caused
by Gram-positive bacteria that are resistant to several other antibiotics. As already mentioned,
unrevealing the structure of ribosomes from Gram-negative bacteria has led to significant progress
in understanding antibiotics' action. However, this knowledge cannot be always expanded to Gram-
positive bacteria that have differences in translation apparatus. Thus, solving the structure of
S. aureus ribosome will lead us to better understanding of the regulation of protein synthesis in
Gram-positive bacteria, their mechanisms of antibiotics resistance. Structure of S. aureus ribosome
will provide insights for design of new drugs against this pathogen.
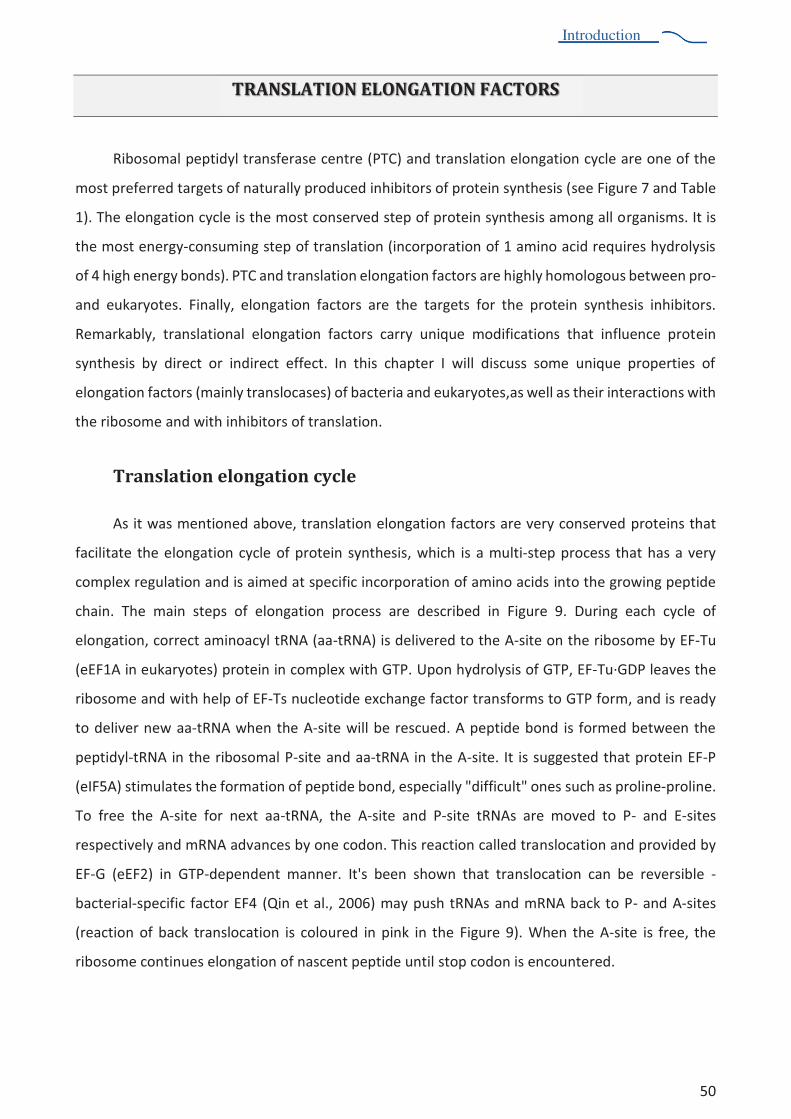
Introduction
50
Introduction
TRANSLATION ELONGATION FACTORS
Ribosomal peptidyl transferase centre (PTC) and translation elongation cycle are one of the
most preferred targets of naturally produced inhibitors of protein synthesis (see Figure 7 and Table
1). The elongation cycle is the most conserved step of protein synthesis among all organisms. It is
the most energy-consuming step of translation (incorporation of 1 amino acid requires hydrolysis
of 4 high energy bonds). PTC and translation elongation factors are highly homologous between pro-
and eukaryotes. Finally, elongation factors are the targets for the protein synthesis inhibitors.
Remarkably, translational elongation factors carry unique modifications that influence protein
synthesis by direct or indirect effect. In this chapter I will discuss some unique properties of
elongation factors (mainly translocases) of bacteria and eukaryotes,as well as their interactions with
the ribosome and with inhibitors of translation.
Translation elongation cycle
As it was mentioned above, translation elongation factors are very conserved proteins that
facilitate the elongation cycle of protein synthesis, which is a multi-step process that has a very
complex regulation and is aimed at specific incorporation of amino acids into the growing peptide
chain. The main steps of elongation process are described in Figure 9. During each cycle of
elongation, correct aminoacyl tRNA (aa-tRNA) is delivered to the A-site on the ribosome by EF-Tu
(eEF1A in eukaryotes) protein in complex with GTP. Upon hydrolysis of GTP, EF-Tu·GDP leaves the
ribosome and with help of EF-Ts nucleotide exchange factor transforms to GTP form, and is ready
to deliver new aa-tRNA when the A-site will be rescued. A peptide bond is formed between the
peptidyl-tRNA in the ribosomal P-site and aa-tRNA in the A-site. It is suggested that protein EF-P
(eIF5A) stimulates the formation of peptide bond, especially "difficult" ones such as proline-proline.
To free the A-site for next aa-tRNA, the A-site and P-site tRNAs are moved to P- and E-sites
respectively and mRNA advances by one codon. This reaction called translocation and provided by
EF-G (eEF2) in GTP-dependent manner. It's been shown that translocation can be reversible -
bacterial-specific factor EF4 (Qin et al., 2006) may push tRNAs and mRNA back to P- and A-sites
(reaction of back translocation is coloured in pink in the Figure 9). When the A-site is free, the
ribosome continues elongation of nascent peptide until stop codon is encountered.
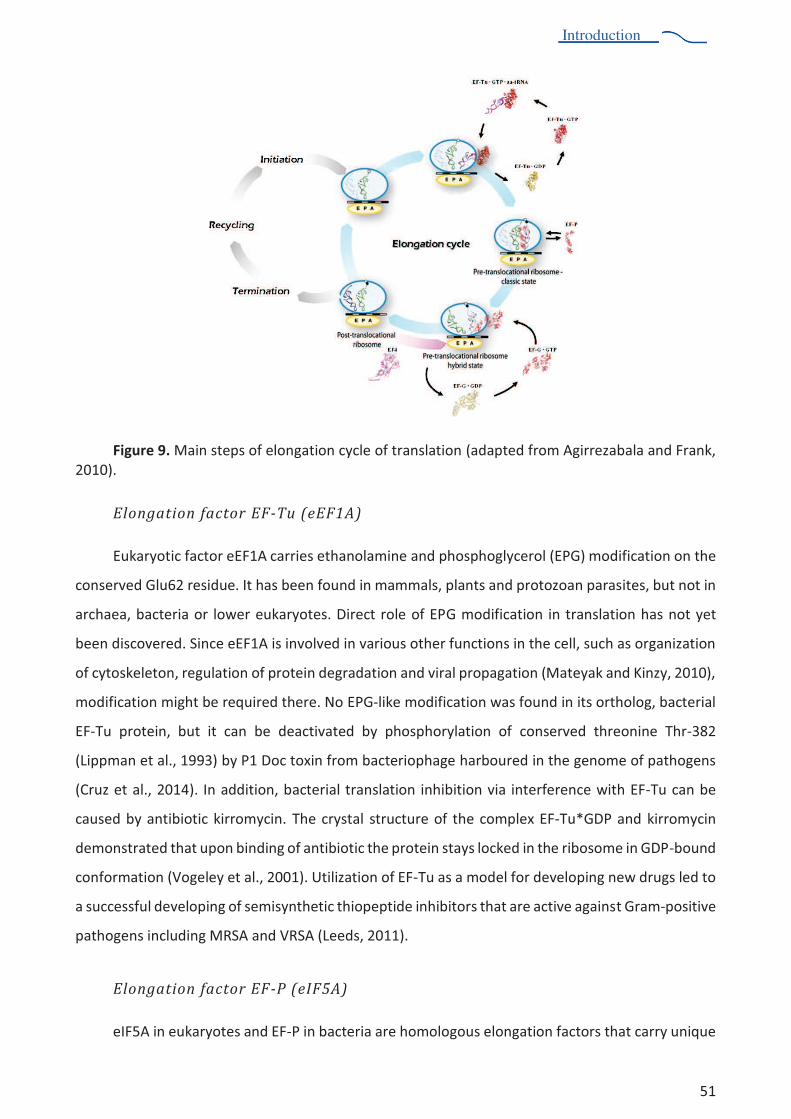
Introduction
51
Introduction
Figure 9. Main steps of elongation cycle of translation (adapted from Agirrezabala and Frank, 2010).
Elongation factor EF-Tu (eEF1A)
Eukaryotic factor eEF1A carries ethanolamine and phosphoglycerol (EPG) modification on the
conserved Glu62 residue. It has been found in mammals, plants and protozoan parasites, but not in
archaea, bacteria or lower eukaryotes. Direct role of EPG modification in translation has not yet
been discovered. Since eEF1A is involved in various other functions in the cell, such as organization
of cytoskeleton, regulation of protein degradation and viral propagation (Mateyak and Kinzy, 2010),
modification might be required there. No EPG-like modification was found in its ortholog, bacterial
EF-Tu protein, but it can be deactivated by phosphorylation of conserved threonine Thr-382
(Lippman et al., 1993) by P1 Doc toxin from bacteriophage harboured in the genome of pathogens
(Cruz et al., 2014). In addition, bacterial translation inhibition via interference with EF-Tu can be
caused by antibiotic kirromycin. The crystal structure of the complex EF-Tu*GDP and kirromycin
demonstrated that upon binding of antibiotic the protein stays locked in the ribosome in GDP-bound
conformation (Vogeley et al., 2001). Utilization of EF-Tu as a model for developing new drugs led to
a successful developing of semisynthetic thiopeptide inhibitors that are active against Gram-positive
pathogens including MRSA and VRSA (Leeds, 2011).
Elongation factor EF-P (eIF5A)
eIF5A in eukaryotes and EF-P in bacteria are homologous elongation factors that carry unique
Introduction
52
Introduction
modifications. eIF5A has hypusine modification located on a conserved lysine, Lys51 amino acid
residue whereas EF-P has an unusual lysinylation of Lys34 (Yanagisawa et al., 2010; Roy et al., 2011).
Lysinylation of EF-P suggested to enhance the ability of this protein to stimulate peptide pond
formation (Park et al., 2012), especially for polyproline synthesis (Doerfel et al., 2013; Ude et al.,
2013). Crystal structures of eIF5A and EF-P from a variety of eukaryotes, archaea and bacteria have
been solved and the proteins show significant structural similarity (Yao et al., 2003; Tong et al., 2009;
pdb code 3ER0). Structural analysis of eIF5A bound to the 80S ribosome (Melnikov et al., 2015)
showed the significance of hypusine modification in elongation of nascent peptide chain. In the
structure of bacterial ribosome with initiator tRNA and EF-P protein (Blaha et al., 2009), the authors
did not see lysinyl modification but the data suggested that its presence may facilitate the peptide
bond formation in prokaryotes.
Elongation factor EF-G (eEF2)
eEF2 is one of the main regulator of protein synthesis in eukaryotes. It serves as a mediator of
global physiologic processes and metabolic pathways of eukaryotic cells such as mTOR, cell cycle,
stress response and cancer (reviewed in Proud, 2002; White-Gilberson et al., 2009). Under particular
conditions induction of eEF2-specific kinase (eEF2K) leads to phosphorylation of threonine, Thr56 of
eEF2 protein, and in this way a cell can instantly alter protein synthesis (Ovchinnikov et al., 1990;
Price et al., 1991).
Apart several phosphorylation sites eEF2 protein carries a unique modification called
diphthamide on conserved histidine residue (His699 in yeast, His715 in human) on the tip of domain
IV. Diphthamide modification of eEF2 is well conserved in archea and eukaryotes but not eubacteria.
Its biosynthesis involves 6 enzymes (Chen and Bodley, 1988) and its absence is lethal for eukaryotic
cell (Chen and Behringer, 2004; Liu et al., 2006). On the other hand, diphtheria toxin from
Corneybacterium diphtheriae and Pseudomonas exotoxin A transfer ADP-ribose from NAD+ to the
diphthamide residue, thus blocking the activity of eEF2 and inhibiting protein synthesis (Honjo et
al., 1968; Sitikov et al., 1984; Liu et al., 2004). The exact role of diphthamide in translocation reaction
remains unknown. It was demonstrated that its deficiency leads to diminishment of translation
fidelity in yeast (Ortiz et al., 2006) and in mice (Liu et al., 2012). Using cryo-EM analysis of 80S*eEF2
complex C. Spahn and his colleagues confirmed that diphthamide might be close enough to interact
with decoding center (Spahn et al., 2004). In addition to phosphorylation and ADP-ribosylation,
binding of a small antifungal molecule called sordarin may inhibit yeast eEF2 activity. It significantly
alters the conformation of eEF2 and prevents it's dissociation from the ribosome (Figure 10 C).
Introduction
53
Introduction
Recently new antimalarial compound DDD107498 was shown to inhibit eEF2 from the Plasmodim
parasite (Baragaña et al., 2015).
Figure 10. The structures of EF-G in complex with GDP (A), apo eEF2 (B), eEF2 in complex with sordarin (sor) (C), eEF2 in complex with enterotoxin A (ETA) (D). The domains are labelled by roman numerals I!"#$%&$'(# )*+# (,$#-.#/*01234#5,$# 6*&1(2*3#*)# (,$#7&+$8#1%$7#/$7&+2923:#(,$#0*(2*3#*)#
domains III, IV and V relative to the three N-terminal domains are shown on apo eEF2 as rods colored similarly to the domain (adapted from Jørgensen et al., 2003).
Bacterial protein, EF-G, also has conserved histidine residue His583 on the tip of domain IV.
Replacement of this histidine with lysine or arginine decreases the rate of tRNA translocation at
least 100-fold (Savelsbergh et al., 2000). No specific modifications have been detected on His583,
but EF-G factor is known to be phosphorylated by the kinase from bacteriophage T7 (Robertson et
al., 1994). Phosphorylation was suggested to promote bacteriophage specific mRNA. EF-G protein
is also a well-known target for fusidic acid, antibiotic against Gram-positive bacteria that inhibits EF-
G turnover, in either GTP hydrolysis or translocation (Bodley et al., 1969; Lee-Huang et al., 1974;
Johanson et al., 1996). Fusidic acid, as kirromycin, belongs to the least antibiotics that inhibit protein
synthesis via interaction with protein rather than rRNA.
X-Ray analysis of translocases derived from bacteria (Czworkowski et al., 1994) and yeast
(Jørgensen et al., 2003) revealed relatively high homology of these two proteins. They are composed
of 5 or 6 domains where the crucial role in translation is assigned to domain G (nucleotide binding)
and domain IV (responsible for translocation reaction). The X-ray structures of EF-G in complex with
fusidic acid and dityromycin (Lin et al, 2015), eEF2 in complex with sordarin (Jørgensen et al., 2003)
Introduction
54
Introduction
and bacterial toxin (Jørgensen et al., 2005) uncovered the mechanism of protein deactivation.
Recently several delicate crystallographic experiments led us to better understanding of
translocation reaction in bacteria in atomic level (Pulk and Cate, 2013; Touringy et al., 2013; Zhou
et al., 2013; Chen et al., 2013, Lin et al., 2015). Unfortunately, to date, the only well developed
experimental model for crystallographic studies of eukaryotic translation system (S. cerevisiae 80S
ribosome, Ben-Shem et al., 2011) cannot be used to study translocation reaction since stress protein
Stm1 occupies the binding site of eEF2 protein.
eEF2 is a potential target for drug development
Elongation factors have high homology between the domains of life and very high homology
within one domain. So, the eEF2 from lower eukaryotes as yeast and higher organisms such as
human are believed to be very similar. Indeed, they have high similarity in amino acid sequence,
identical modification sites, including phosphorylation of conserved triptophane 56 (57 in human)
and diphthamidation of conserved histidine 699 (715 in human). However, they differ in ability of
binding the ligands, especially small molecules that block the activity of elongation factor. Notably,
fusidic acid binds preferably Gram-positive EF-G, sordarin affects solely eEF2 of fungi, but not higher
eukaryotes. So far, no archaea- or mammalian-specific inhibitor of elongation factor 2 has
discovered. The recent discovery of a Plasmodium specific inhibitor of eEF2 shows the need for a
more thorough investigation of this protein, including structural analysis. From practical point of
view the crystal structure of human eEF2 will clarify the reasons for selectivity of binding small
molecules. Fundamentally it may provide us new insights about the mechanism of translocation in
higher eukaryotic organisms. Structural information will be helpful for understanding more
thoroughly the role of eEF2 as a unique target for bacterial toxins and, more generally, it can provide
new hints about how translocation might take place in humans. Finally, obtaining an atomic model
of eEF2 will facilitate interpretation of cryo-EM experiments on human translocation reaction. So
far, cryo-EM is the only structural method to use, due to absence of crystallographic experimental
model for mammalian ribosome.
Introduction
55
Introduction
PROJECT OUTLINE
The project of present PhD thesis is dedicated to solving S. aureus ribosome structure and was
initiated in 2011. By that time the structures of Thermus thermophilus and Escherichia coli
ribosomes had already been solved by X-ray crystallography. However, the structure of any Gram-
positive or any pathogenic bacteria ribosome was missing. It is known that some aspects of protein
synthesis differ between Gram-negative and Gram-positive bacteria. Additionally, pathogenic
bacteria have evolved complex mechanisms of translation regulation, that provides high efficiency
of pathogenesis and facilitate survival under stressful conditions. Moreover, many pathogenic
bacteria (including Staph) show extremely high resistance to ribosome-targeting antibiotics, which
is often mediated by modifications of the ribosome. The structure of the ribosome from Gram-
positive multi-resistant pathogenic bacteria Staphylococcus aureus would reveal peculiar structural
features of translation machinery, thus will lead us to better understanding the specifications of
regulation of its protein synthesis, and pathogen survival. Most importantly, it will serve as a model
system for developing new anti-staphylococcal drugs.
Initially, the main goal of this project was to elucidate the structure of full 70S ribosome from
S. aureus using X-ray analysis as a main tool. Thus the project consisted of next tasks:
preparing the cells: growing, harvesting, breaking
developing a purification protocol that will provide pure and stable ribosomes, suitable
for crystallization
crystallization and post-crystallization treatment: searching for crystallization conditions,
growing big crystals and preparation for diffraction analysis;
developing the strategy of data collection at the synchrotron;
solving the structure: processing the data and building the model.
As a result we developed the protocols of purification of 70S ribosome from S. aureus in
amount sufficient for the search of crystallization conditions. Consequently, the crystals of 70S
ribosome from S. aureus were obtained. But as we experienced specific difficulties with the
diffraction of these crystals and because of limit of time, we used cryo-EM technique to determine
the structure of the S. aureus ribosome. The purity of the sample and serious progress in cryo-EM
field during last several years gave a hope to obtain high-resolution structure. The data were
collected using the latest generation of microscope (Titan Krios, installed at the Centre de Biologie

Introduction
56
Introduction
Intégrative (CBI, Illkirch, France)). Then, processing electron microscopy data and obtaining high
resolution cryo-EM structure took up my attention. At the same time my colleagues are continuing
crystallographic studies of 70S ribosome from S. aureus in the laboratory.
Results of my work on the determination of high resolution structure of the ribosome from S.
aureus will be discussed in next the chapters.
Another part of my work was devoted to determination of the crystal structure of human
elongation factor 2. This protein was found to be rather tightly bound to the human 80S ribosomes
during purification using protocol developed in our lab. It is well known that eEF2 is one of the major
regulator of translation in eukaryotes and is often involved in cell stress response and cancer.
Determination of structure of human eEF2 would clarify some aspects of regulation and repression
of protein synthesis in humans. eEF2 protein is known to be a target of specific protein synthesis
inhibitors, so the structure of human eEF2 could also help to discover potential anti-cancer
compounds.
Initially, the project on eEF2 started with developing the protocol of purification of native eEF2
protein using as a source the ribosome-free cytosolic fraction of HeLa cells. When protocol was
developed and first crystals were obtained, we switched to the recombinant production of the
protein in bacteria.
RESEARCH PROJECT 1:
STRUCTURE DETERMINATION OF S. AUREUS RIBOSOME

Results
58
Results
S. AUREUS CELL GROWTH
S. aureus strain
Staphylococcus aureus strain RN6390 was used in the study. It derives from clinical strain
NCTC8325 and carries mutation in the gene rbsU, the activator of sigma B factor. Thus the
production of RNAIII is increased and the ability to form biofilms is decreased in this strain (see
Figure 4). Avoiding biofilm formation is important for cells growth and harvesting.
Cells preparation
All manipulations with S. aureus cells were performed in special laboratory with safety level
2. Two litres of S. aureus culture was grown at 37 °C / 180 rpm in Brain Heart Infusion broth (BHI)
and harvested in early logarithmic phase (OD600 = 1.0), when the ribosomes are found in the highest
concentration and are generally considered to be the most active (Gourse et al., 1996). Cells were
washed two times with 10 mM Tris-HCl pH 7.5 and kept frozen at -80 °C. Freezing the material could
not be avoided due to time constrains.
Results
59
Results
RIBOSOMES PURIFICATION
In actively growing cells, ribosomes are relatively heterogeneous and have different
conformational states, activity levels and are bound to a variety of ligands. Certainly, most
ribosomes actively participate in the elongation step of translation, so they have minor
conformational divergence and bind similar ligands involved in translation. However, there are
other populations of non-translating ribosomes, which can be present as dissociated particles,
stalled or inactive ribosomes.
When the cells are transferred to unfavourable conditions, all translating ribosomes continue
the synthesis until they reach the stop codon and release newly synthesized protein. These
ribosomes do not prepare for the next cycle and keep associated as 70S particles called run-off
ribosomes. They are relatively homogeneous, although, some still have residual tRNAs, mRNA and
translation factors bound.
Due to their mass, the total ribosome pool is rather easy to separate from other cellular
components simply by several high-speed centrifugation steps. However, a sample for X-ray studies
requires very high level of purity, homogeneity and stability. Therefore, purification of a unique
population of ribosomes, capable of being crystallized, is a delicate procedure that requires a lot of
effort, care and patience.
Two crucial parameters that have to be thoroughly controlled during purification are the
concentrations of Mg2+ ions and monovalent salts. Magnesium stabilizes the ribosome and is
particularly important for the association of small and large ribosomal subunits of bacterial
ribosome. Monovalent salts at concentrations below 200 mM also contribute to the stability of
bacterial ribosome, but at concentrations above 200 mM these salts can have an opposite effect
(Spirin et al., 1971c; Stahli and Noll, 1977). Variations in the balance between magnesium and
monovalent salts often help to ameliorate the selection of ribosomal populations.
Purification of S. aureus ribosomes was based on the protocols used for bacteria Thermus
thermophilus (Gogia et al., 1986; Yusupov et al., 2001) and yeast Saccharomyces cerevisiae (Ben-
Shem et al., 2011). Lysis procedure, ionic conditions, magnesium and polyethylene glycol (PEG)
concentrations, sucrose gradients etc. were optimized during development of purification protocol.
Chemicals, plastic and kits were purchased from Sigma-Aldrich, Fluka, Merck Millipore,
Hampton Research, Macherey Nagel, Qiagen. Ultrapure Milli Q water was used to prepare all
buffers. All solutions were filtered using 0.22 m filters or autoclaved.
Results
60
Results
Buffers Numbers above the name indicate Mg2+/salt concentrations, mM.
Buffer A20/100: 20 mM Hepes-KOH pH 7.5 100 mM NH4Cl 21 mM MgOAc2 1 mM DTT
Buffer B25/500: 10 mM Hepes-KOH pH 7.5 500 mM KCl 25 mM MgOAc2 1.1 M Sucrose 0.5 mM EDTA 1 mM DTT
Buffer E10/100: 10 mM Hepes-KOH pH 7.5 100 mM KCl 10.5 mM MgOAc2 0.5 mM EDTA 1 mM DTT
Buffer G10/60: 5 mM Hepes-KOH pH 7.5 50 mM KCl 10 mM NH4Cl 10 mM MgOAc2 1 mM DTT
Lysis
Work with Staphylococcus cells have special safety requirements and should be done in a
special laboratory with safety level 2. Usually these type laboratories are limited in space, and
therefore they can accommodate only middle-sized incubators, shakers and centrifuges. This
necessitated the adaption of purification procedure to use smaller amounts of cells initially, but
nevertheless to obtain reasonable yields of ribosomes for crystallization. In the end, replacing
mechanical lysis (French press, microfluidizer) with enzymatic lysis resulted in a very high efficiency
of cell disruption. We used lysostaphin, a specific enzyme that cleaves cross-linking pentaglycin
bridges in the cell wall of Staphylococci.
Frozen cells (5 g) were re-suspended in 30 ml of buffer A20/100 containing 1 mM EDTA, 30 ul
DNAse I, 3.5 mg lysostaphin and protein inhibitors cocktail (Roche) according to recommendations
of manufacturer. After incubation at 37 °C for 45 min, suspension was transferred on ice and all
following step were performed either at +4 °C or on ice. Cell debris was removed by centrifugation
at 30000×g for 90 min.
Results
61
Results
PEG precipitation and sucrose cushion
PEG precipitation step was adapted from purification of yeast ribosomes and used to
fractionate the lysate quickly and gently in order to recover the fraction containing ribosomes.
Pelleting through the sucrose cushion containing 0.5 1 M salt is classical procedure for purification
of vacant bacterial ribosomes. High concentration of KCl is compensated with increased
concentration of Mg2+ ions. It allows the washing out remaining ligands (tRNAs, mRNA, translation
factors) and some other proteins bound to the ribosome but keep 70S particle stable. At the same
time the treatment should not be too harsh, so that the ribosomal proteins will not dissociate.
The resulting supernatant (often called S30 for supernatant after centrifugation at 30000×g)
was further subjected to a differential precipitation by PEG. PEG 20000 was added from a 30% w/v
stock (Hampton Research) to a final concentration of 2.8% w/v for the first fractionation. The
solution was centrifuged at 20000×g for 5 min. The ribosomes and light cellular components
remained in soluble fraction, while components that are heavier than the ribosome such as residual
polysomes, remaining cell debris, were precipitated. The supernatant was recovered and PEG 20000
was increased to 4.2% for the second fractionation. Under these conditions the ribosomes become
insoluble while the smaller components (small complexes, individual proteins) remain soluble. The
solution was centrifuged at 20000×g for 10 min, the ribosome pellet re-suspended to 30 ! 35 ml in
buffer A20/100 containing 1 mM EDTA, layered on 25 ml of buffer B25/500 and then centrifuged at
45000 rpm / 15 hours using Beckman Type 45 Ti rotor.
Sucrose density gradient centrifugation
This step is typical for purification of ribosomes of any kind (full ribosomes or individual
subunits), any origin (cytoplasmic, mitochondrial or chloroplast) and any organism (bacteria,
archaea or eukaryotes). The idea is to separate full ribosomes from ribosomal subunits. Due to the
different size, weight and density, 70S, 50S and 30S particles sediment with different speed through
the gradient of viscous solution such as sucrose. It is important to select the right concentration of
sucrose and maximum amount of ribosomes for good resolutions of the particles along the gradient.
It is also important to find the proper speed/time balance of centrifugation. Fractionation of
gradients further allows selective collection of only the particles of interest.
Ribosome pellet after sucrose cushion was re-suspended in buffer E10/100 till 7 mg/ml and
loaded on the sucrose density gradients. During development of the protocol, using sucrose
gradients 10 ! 30% (w/v) we found that our sample contains some particles, bigger than 70S, that
were not detectable on 5 ! 20% sucrose gradients usually used for purification of bacterial ribosome.
Later we proved that these are ribosomal particles that sediment faster than monosomes. Later we
proved that these particles are ribosomes that sediment faster than monosomes and called this
fraction 100S. The presence of 100S and 50S fractions together with 70S ribosomes made sucrose

Results
62
Results
gradient step difficult to set up. To purify only 70S ribosomes, the gradient was modified to 7 ! 30%
(w/v) and the amount of material loaded on one gradient was decreased to 3.5 mg. Sucrose
gradients 7 ! 30% were cast in 36 ml Beckman SW28 tubes using the Gradient Master machine
(BioComp). Ribosomal sample (0.5 ml) was layered on each gradient and centrifuged at 17100 rpm
/ 15.5 hours in swinging rotor Beckman SW28.
Figure 11. Sucrose gradient profile. Fractions (1 ml) were collected and absorbance was measured by Nanodrop 2000c (Thermo Scientific). The solid red line indicates pooled 70S fractions and red dashed circle indicates the peak of 100S ribosomes. One of the unique features of translational control in S. aureus is the presence of so-called 100S ribosomes in actively growing cultures (Ueta, 2009). Ribosomal dimers are referred to as 100S, and do not participate in translation. The phenomenon of ribosomal dimerization has been observed in many bacteria; however disomes were usually found during transition of cells to the stationary growth phase when the substrate is limited and the cells have to alter metabolism. The role of ribosomal dimers in actively growing cells of S. aureus remains unclear.
Ribosome concentration and storage
The appropriate fractions were pooled and MgOAc2 concentration was adjusted to 25 mM. In
order to precipitate ribosomes, PEG 20000 was added to a final concentration of 4.5% w/v.
Ribosomes were pelleted by centrifugation (20000×g / 12 min). The white pellet was gently
dissolved in buffer G to a final concentration of 20 ! 25 mg/ml; 30 µl aliquots were flash frozen in
liquid nitrogen and stored at -80 °C. Typically 10 ! 12 mg of pure ribosomes were obtained from 5
grams of cells.
Results
63
Results
RIBOSOMES CHARACTERIZATION
One- and two-dimensional polyacrylamide gel electrophoresis (PAGE)
Sample preparation for PAGE
Sample preparation for both analyses was performed according to method described by Hardy
and co-workers (Hardy et al., 1969). Ribosomes were digested for 30 min / 0 °C with 66% acetic acid
in presence of 33 mM MgOAc2. rRNA was precipitated by centrifugation at 15000×g / 30 min. The
soluble protein fraction was treated with by 80% acetone for at least 3 hours at -80 °C. Proteins
were precipitated at 15000×g / 60 min, pellet was dried by speed-vac for 30 min and dissolved in
buffer G. This preparation allowed the removal of PEG that caused diffusion of bands on 1D-PAGE
and to eliminate rRNA that would occupy all positively charged ampholytes and block any
movement of ribosomal proteins (RP) along the gel in the capillary.
One-dimensional PAGE
One-dimensional PAGE separates proteins in denaturating conditions according their
molecular weight but not charge.
There are no specifications for ribosomal proteins to run this type of gel. Therefore, the
standard Laemmli method (Laemmli, 1970) with slight modifications was used. The gel was stained
in Coomassie Brilliant Blue R-250 according to standard protocols.
The gel demonstrated the purity of the ribosomal sample and did not reveal contamination
by high molecular weight proteins such as components of the pyruvate dehydrogenase complex,
which sometimes co-purify with bacterial ribosomes.
Two-dimensional PAGE
Two-dimensional PAGE is dedicated to separation proteins by charge first with further
separation by molecular weight. Running ribosomal proteins on 2D-PAGE has several challenges.
First, the ribosome has to be denatured and any rRNA has to be removed. Second, most of RPs are
highly positively charged with isoelectric points of 9 and higher, which makes using standard
protocols unsuitable. Therefore two dimensional gel was performed using combination of protocols
described (Kaltschmidt and Wittmann, 1970; O'Farrell, 1975).
Gel for isoelectric focusing (9.2 M Urea, 2% Nonidet P-40, 4% acrylamide (28.4:1.6), 2%
ampholytes (pH range 3-10), 0.01% ammonium persulfate, 0.1% TEMED) was casted in 1 mm
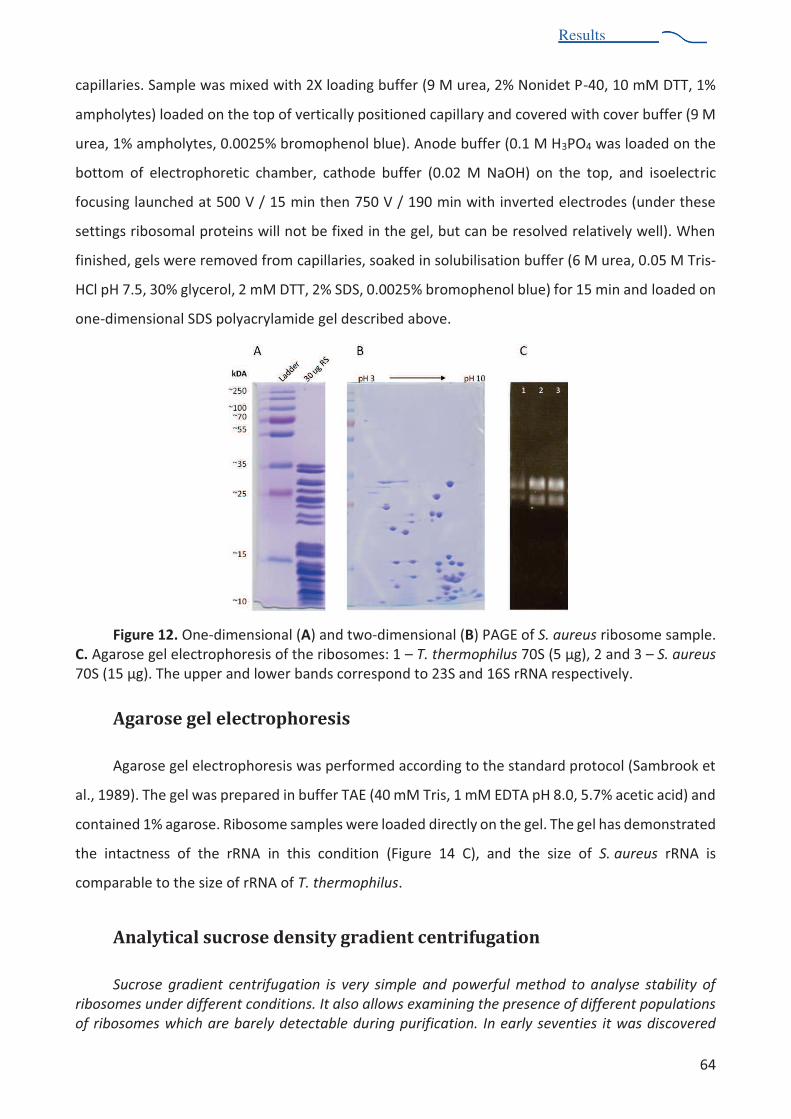
Results
64
Results
capillaries. Sample was mixed with 2X loading buffer (9 M urea, 2% Nonidet P-40, 10 mM DTT, 1%
ampholytes) loaded on the top of vertically positioned capillary and covered with cover buffer (9 M
urea, 1% ampholytes, 0.0025% bromophenol blue). Anode buffer (0.1 M H3PO4 was loaded on the
bottom of electrophoretic chamber, cathode buffer (0.02 M NaOH) on the top, and isoelectric
focusing launched at 500 V / 15 min then 750 V / 190 min with inverted electrodes (under these
settings ribosomal proteins will not be fixed in the gel, but can be resolved relatively well). When
finished, gels were removed from capillaries, soaked in solubilisation buffer (6 M urea, 0.05 M Tris-
HCl pH 7.5, 30% glycerol, 2 mM DTT, 2% SDS, 0.0025% bromophenol blue) for 15 min and loaded on
one-dimensional SDS polyacrylamide gel described above.
Figure 12. One-dimensional (A) and two-dimensional (B) PAGE of S. aureus ribosome sample. C. Agarose gel electrophoresis of the ribosomes: 1 ! T. thermophilus 70S (5 µg), 2 and 3 ! S. aureus
70S (15 µg). The upper and lower bands correspond to 23S and 16S rRNA respectively.
Agarose gel electrophoresis
Agarose gel electrophoresis was performed according to the standard protocol (Sambrook et
al., 1989). The gel was prepared in buffer TAE (40 mM Tris, 1 mM EDTA pH 8.0, 5.7% acetic acid) and
contained 1% agarose. Ribosome samples were loaded directly on the gel. The gel has demonstrated
the intactness of the rRNA in this condition (Figure 14 C), and the size of S. aureus rRNA is
comparable to the size of rRNA of T. thermophilus.
Analytical sucrose density gradient centrifugation
Sucrose gradient centrifugation is very simple and powerful method to analyse stability of
ribosomes under different conditions. It also allows examining the presence of different populations
of ribosomes which are barely detectable during purification. In early seventies it was discovered

Results
65
Results
that empty (or vacant) 70S ribosome can exist in two forms tightly associated subunit couples and
loosely associated subunit couples. Sucrose gradients at specific speeds and Mg2+/salt
concentrations revealed that tight couples stayed as 70S particles while loose couples dissociated
during centrifugation forming so-called 60S peak on the gradients (Infante and Bairlein, 1971; Spirin
et al., 1972; Hapke and Noll, 1976; Noll and Noll, 1976). The presence of loose couples may affect
crystallization of purified sample; if they appear during analytical ultracentrifugation it is
recommended to use more mild conditions during purification or to perform specific purification of
tight couples using Toyopearl-Butyl hydrophobic chromatography.
Analytical gradients have exactly the same principal as preparative ones with only difference
that they require much less material. Sucrose concentration of, time and speed of centrifugation
were optimized for analysis of purified S. aureus ribosome sample.
The stability of the ribosomes was analysed under different conditions. The following
conditions were tested: concentration of MgOAc2 (1 ! 25 mM), concentration of KCl (60 ! 200 mM),
stability at 4 °C during several weeks (Figure 13 A). Before loading on gradients samples were
dialysed in appropriate buffer with respective concentrations of interests; same concentrations
were kept in the gradients. Additionally, preparative sucrose gradients were optimized for
purification of ribosomal dimers (100S particles) and ribosomal subunits (50S and 30S particles).
Results and conditions are indicated on Figure 13 B and C respectively. Analytical sucrose gradients
were performed in the following buffers: 10 mM Hepes pH 7.5, 60 ! 200 mM KCl, 1 mM DTT, 2-25
mM MgOAc2 using Beckman rotor SW41 and centrifugation parameters of 17000 rpm / 13 h.
As a stability test we thawed the sample and kept it at 4 °C for 2 weeks in buffer G at its original
concentration (20 mg/ml). The control sample was thawed immediately before the experiment.
Ribosomes (0.3 mg) from each variant were dialysed in buffer with appropriate concentration of
MgOAc2 and KCl. Two samples had almost identical profiles on the gradients, and showed negligible
differences only at low Mg2+concentrations. Usually in the presence of 2 mM Mg2+ S. aureus
ribosomes dissociated to individual 50S and 30S subunits; 6 mM Mg2+ prevents dissociation of 70S
particles; and in the presence of 3-4 mM Mg2+ S. aureus ribosomes were found to be in transient
form between 70S and 50S+30S state (Figure 13 A).
As a part of sample characterization, we also purified 100S fraction. Fractions 5 ! 9 from
preparative gradients (Figure 11) were pooled together, dialysed in buffer E15/100, concentrated
using Centricon MWCO100 till 3.5 mg/ml and loaded on preparative sucrose gradients 7-30%. The
majority of 100S peak remained intact on the gradient (Figure 13 B).
Optimization of subunits purification using sucrose gradient centrifugation was performed in
preparative Beckman SW28 tubes. The aim of this purification was to obtain pure 30S particles. All
the crucial conditions and profile of the gradient presented in Figure 13 C. The following agarose gel
electrophoresis was used to discriminate the fractions containing only 30S particles. Fractions 14 !

Results
66
Results
16 were pooled and prepared for functional studies (data not shown).
Figure 13. Characterization of S. aureus ribosomes sample by sucrose density gradient centrifugation. A. Analytical sucrose gradients performed in different concentration of MgOAc2. Blue dashed curves correspond to freshly thawed sample, red curves to thawed sample that was further incubated on ice for two wk. Positions corresponding to the full 70S ribosome and large (50S) and small (30S) subunits are indicated on the top left curve. Conditions of centrifugation are indicated in the top right corner of the images. B. Centrifugation conditions and sucrose gradient profile of purification of 100S particles found during 70S ribosomes preparation. C. Centrifugation conditions and sucrose gradient profile (left) of purification of ribosomal subunits. Positions of 50S and 30S particles are indicated. Agarose gel (right) of the fractions 9-18 of the gradient: upper and
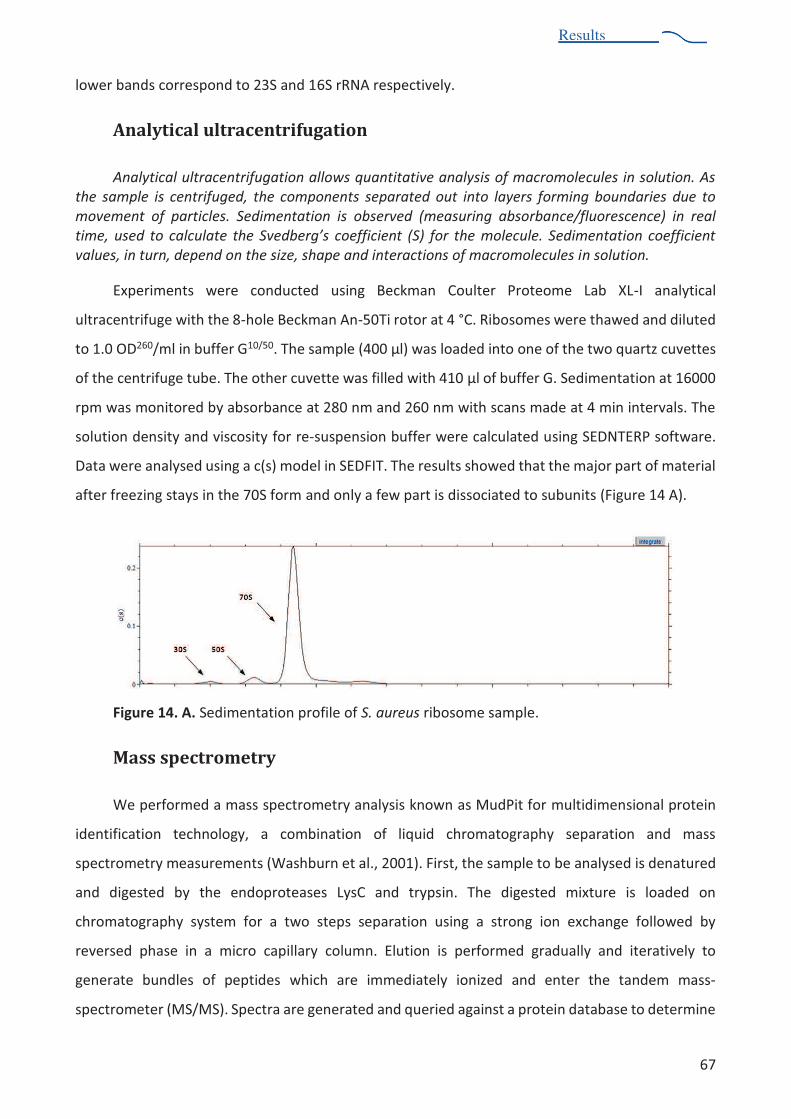
Results
67
Results
lower bands correspond to 23S and 16S rRNA respectively.
Analytical ultracentrifugation
Analytical ultracentrifugation allows quantitative analysis of macromolecules in solution. As
the sample is centrifuged, the components separated out into layers forming boundaries due to
movement of particles. Sedimentation is observed (measuring absorbance/fluorescence) in real
!"#$%& '($)& !*& +,-+'-,!$& !.$& /0$)1$234(& +*$55"+"$6!& 7/8& 5*2& !.$&#*-$+'-$9& /$)"#$6!,!"*6& +*$55"+"$6!&
values, in turn, depend on the size, shape and interactions of macromolecules in solution.
Experiments were conducted using Beckman Coulter Proteome Lab XL-I analytical
ultracentrifuge with the 8-hole Beckman An-50Ti rotor at 4 °C. Ribosomes were thawed and diluted
to 1.0 OD260/ml in buffer G10/50. The sample (400 µl) was loaded into one of the two quartz cuvettes
of the centrifuge tube. The other cuvette was filled with 410 µl of buffer G. Sedimentation at 16000
rpm was monitored by absorbance at 280 nm and 260 nm with scans made at 4 min intervals. The
solution density and viscosity for re-suspension buffer were calculated using SEDNTERP software.
Data were analysed using a c(s) model in SEDFIT. The results showed that the major part of material
after freezing stays in the 70S form and only a few part is dissociated to subunits (Figure 14 A).
Figure 14. A. Sedimentation profile of S. aureus ribosome sample.
Mass spectrometry
We performed a mass spectrometry analysis known as MudPit for multidimensional protein
identification technology, a combination of liquid chromatography separation and mass
spectrometry measurements (Washburn et al., 2001). First, the sample to be analysed is denatured
and digested by the endoproteases LysC and trypsin. The digested mixture is loaded on
chromatography system for a two steps separation using a strong ion exchange followed by
reversed phase in a micro capillary column. Elution is performed gradually and iteratively to
generate bundles of peptides which "#$% &''$(&")$*+% &,-&.$(% "-(% $-)$#% )/$% )"-($'% '"001
spectrometer (MS/MS). Spectra are generated and queried against a protein database to determine
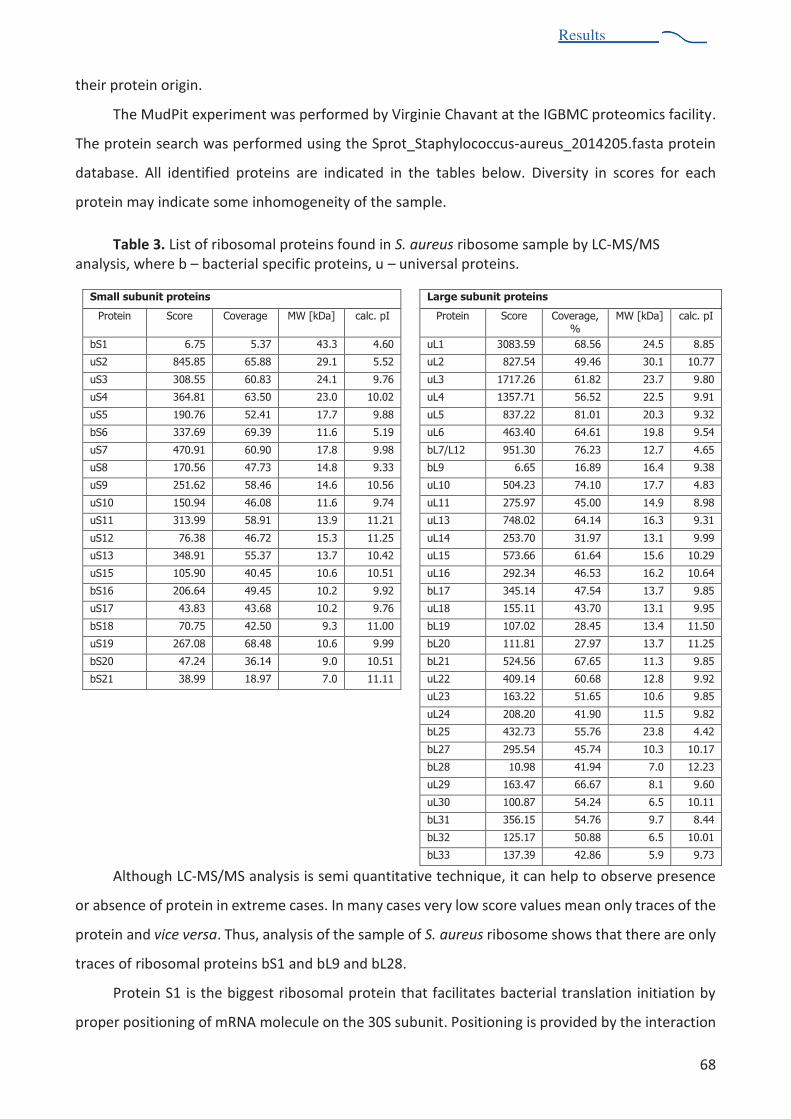
Results
68
Results
their protein origin.
The MudPit experiment was performed by Virginie Chavant at the IGBMC proteomics facility.
The protein search was performed using the Sprot_Staphylococcus-aureus_2014205.fasta protein
database. All identified proteins are indicated in the tables below. Diversity in scores for each
protein may indicate some inhomogeneity of the sample.
Table 3. List of ribosomal proteins found in S. aureus ribosome sample by LC-MS/MS analysis, where b ! bacterial specific proteins, u ! universal proteins.
Although LC-MS/MS analysis is semi quantitative technique, it can help to observe presence
or absence of protein in extreme cases. In many cases very low score values mean only traces of the
protein and vice versa. Thus, analysis of the sample of S. aureus ribosome shows that there are only
traces of ribosomal proteins bS1 and bL9 and bL28.
Protein S1 is the biggest ribosomal protein that facilitates bacterial translation initiation by
proper positioning of mRNA molecule on the 30S subunit. Positioning is provided by the interaction
Small subunit proteins Large subunit proteins
Protein Score Coverage MW [kDa] calc. pI Protein Score Coverage, %
MW [kDa] calc. pI
bS1 6.75 5.37 43.3 4.60 uL1 3083.59 68.56 24.5 8.85
uS2 845.85 65.88 29.1 5.52 uL2 827.54 49.46 30.1 10.77
uS3 308.55 60.83 24.1 9.76 uL3 1717.26 61.82 23.7 9.80
uS4 364.81 63.50 23.0 10.02 uL4 1357.71 56.52 22.5 9.91
uS5 190.76 52.41 17.7 9.88 uL5 837.22 81.01 20.3 9.32
bS6 337.69 69.39 11.6 5.19 uL6 463.40 64.61 19.8 9.54
uS7 470.91 60.90 17.8 9.98 bL7/L12 951.30 76.23 12.7 4.65
uS8 170.56 47.73 14.8 9.33 bL9 6.65 16.89 16.4 9.38
uS9 251.62 58.46 14.6 10.56 uL10 504.23 74.10 17.7 4.83
uS10 150.94 46.08 11.6 9.74 uL11 275.97 45.00 14.9 8.98
uS11 313.99 58.91 13.9 11.21 uL13 748.02 64.14 16.3 9.31
uS12 76.38 46.72 15.3 11.25 uL14 253.70 31.97 13.1 9.99
uS13 348.91 55.37 13.7 10.42 uL15 573.66 61.64 15.6 10.29
uS15 105.90 40.45 10.6 10.51 uL16 292.34 46.53 16.2 10.64
bS16 206.64 49.45 10.2 9.92 bL17 345.14 47.54 13.7 9.85
uS17 43.83 43.68 10.2 9.76 uL18 155.11 43.70 13.1 9.95
bS18 70.75 42.50 9.3 11.00 bL19 107.02 28.45 13.4 11.50
uS19 267.08 68.48 10.6 9.99 bL20 111.81 27.97 13.7 11.25
bS20 47.24 36.14 9.0 10.51 bL21 524.56 67.65 11.3 9.85
bS21 38.99 18.97 7.0 11.11 uL22 409.14 60.68 12.8 9.92
uL23 163.22 51.65 10.6 9.85
uL24 208.20 41.90 11.5 9.82
bL25 432.73 55.76 23.8 4.42
bL27 295.54 45.74 10.3 10.17
bL28 10.98 41.94 7.0 12.23
uL29 163.47 66.67 8.1 9.60
uL30 100.87 54.24 6.5 10.11
bL31 356.15 54.76 9.7 8.44
bL32 125.17 50.88 6.5 10.01
bL33 137.39 42.86 5.9 9.73
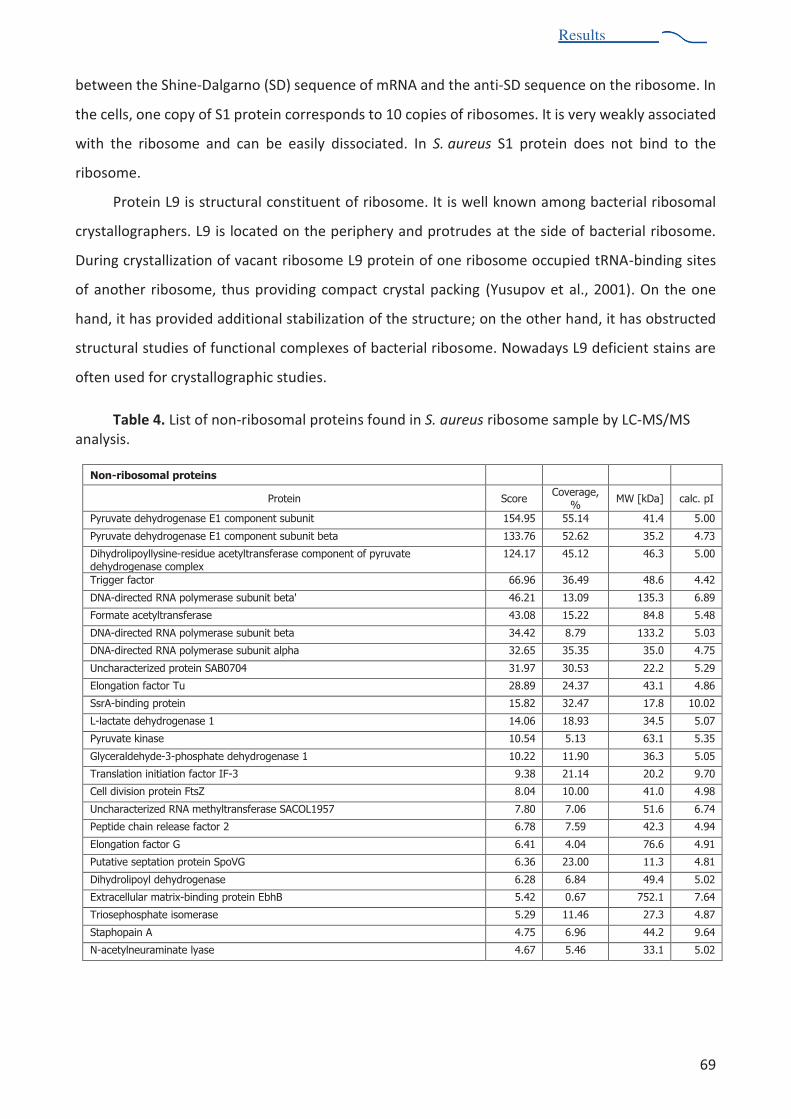
Results
69
Results
between the Shine-Dalgarno (SD) sequence of mRNA and the anti-SD sequence on the ribosome. In
the cells, one copy of S1 protein corresponds to 10 copies of ribosomes. It is very weakly associated
with the ribosome and can be easily dissociated. In S. aureus S1 protein does not bind to the
ribosome.
Protein L9 is structural constituent of ribosome. It is well known among bacterial ribosomal
crystallographers. L9 is located on the periphery and protrudes at the side of bacterial ribosome.
During crystallization of vacant ribosome L9 protein of one ribosome occupied tRNA-binding sites
of another ribosome, thus providing compact crystal packing (Yusupov et al., 2001). On the one
hand, it has provided additional stabilization of the structure; on the other hand, it has obstructed
structural studies of functional complexes of bacterial ribosome. Nowadays L9 deficient stains are
often used for crystallographic studies.
Table 4. List of non-ribosomal proteins found in S. aureus ribosome sample by LC-MS/MS analysis.
Non-ribosomal proteins
Protein Score Coverage,
% MW [kDa] calc. pI
Pyruvate dehydrogenase E1 component subunit 154.95 55.14 41.4 5.00
Pyruvate dehydrogenase E1 component subunit beta 133.76 52.62 35.2 4.73
Dihydrolipoyllysine-residue acetyltransferase component of pyruvate dehydrogenase complex
124.17 45.12 46.3 5.00
Trigger factor 66.96 36.49 48.6 4.42
DNA-directed RNA polymerase subunit beta' 46.21 13.09 135.3 6.89
Formate acetyltransferase 43.08 15.22 84.8 5.48
DNA-directed RNA polymerase subunit beta 34.42 8.79 133.2 5.03
DNA-directed RNA polymerase subunit alpha 32.65 35.35 35.0 4.75
Uncharacterized protein SAB0704 31.97 30.53 22.2 5.29
Elongation factor Tu 28.89 24.37 43.1 4.86
SsrA-binding protein 15.82 32.47 17.8 10.02
L-lactate dehydrogenase 1 14.06 18.93 34.5 5.07
Pyruvate kinase 10.54 5.13 63.1 5.35
Glyceraldehyde-3-phosphate dehydrogenase 1 10.22 11.90 36.3 5.05
Translation initiation factor IF-3 9.38 21.14 20.2 9.70
Cell division protein FtsZ 8.04 10.00 41.0 4.98
Uncharacterized RNA methyltransferase SACOL1957 7.80 7.06 51.6 6.74
Peptide chain release factor 2 6.78 7.59 42.3 4.94
Elongation factor G 6.41 4.04 76.6 4.91
Putative septation protein SpoVG 6.36 23.00 11.3 4.81
Dihydrolipoyl dehydrogenase 6.28 6.84 49.4 5.02
Extracellular matrix-binding protein EbhB 5.42 0.67 752.1 7.64
Triosephosphate isomerase 5.29 11.46 27.3 4.87
Staphopain A 4.75 6.96 44.2 9.64
N-acetylneuraminate lyase 4.67 5.46 33.1 5.02
Results
70
Results
CRYSTALLOGRAPHIC STUDIES OF S. AUREUS RIBOSOME
Why x-rays and why crystals?
Information about three-dimensional atomic structures of biological molecules help us to
understand the mechanism of their action and regulation, to visualize intermolecular interactions,
and even to design new molecules with altered activity. Atomic structure can tell you almost
everything you want to know about your material: its bond length and angles, torsion angles, non-
bonded distances.
There are several reasons why we cannot simply use powerful optical microscope and visible
light but we need x-rays to determine the atomic structure of the molecules. First, atoms are too
small to interact with visible light (390 700 nm wavelength) whereas the wavelength of x-rays is
close to 1 A (0.1 nm). Second, in contrast to visible light that can give us information about the
surface only, x-rays can penetrate the matter (inorganic or organic). This property of X-rays is
extensively used in radiology, whereas structural scientists use another property the ability of
matter (more precisely the electrons of the atoms) to scatter X-rays. These scattered rays contain
all information about the position of each atom of the molecule. However, if molecules are
randomly spread in solution, they scatter randomly, in all possible directions. If we detect these
randomly distributed signals, we will not be able to get any information from it. In order to make
the information understandable, we need to force all x-rays to scatter in the same directions. That
is why crystallographers cannot use sample in solution but rather have to crystallize it. Crystals are
essentially a solid comprised of highly ordered identical units. When passing through such an
ordered structure, photons are scattered in particular directions and registered on the detector
forming a diffraction pattern. Diffraction pattern is representation of a structure in reciprocal space
that contains the information about the directions of scattering and the intensity, but the
information about the phase is missing. The phase information can be recovered using different
methods such as anomalous scattering, isomorphous replacement, molecular replacement etc.
Diffraction pattern with exact positions of diffraction spots, their intensities and phases then can be
converted to the electron density (real space representation of protein structure) using Fourier
transform method.
Thus, obtaining crystals of the object of interest is crucial in X-ray crystallography and is always
challenging with biological molecules that are asymmetric and dynamic.
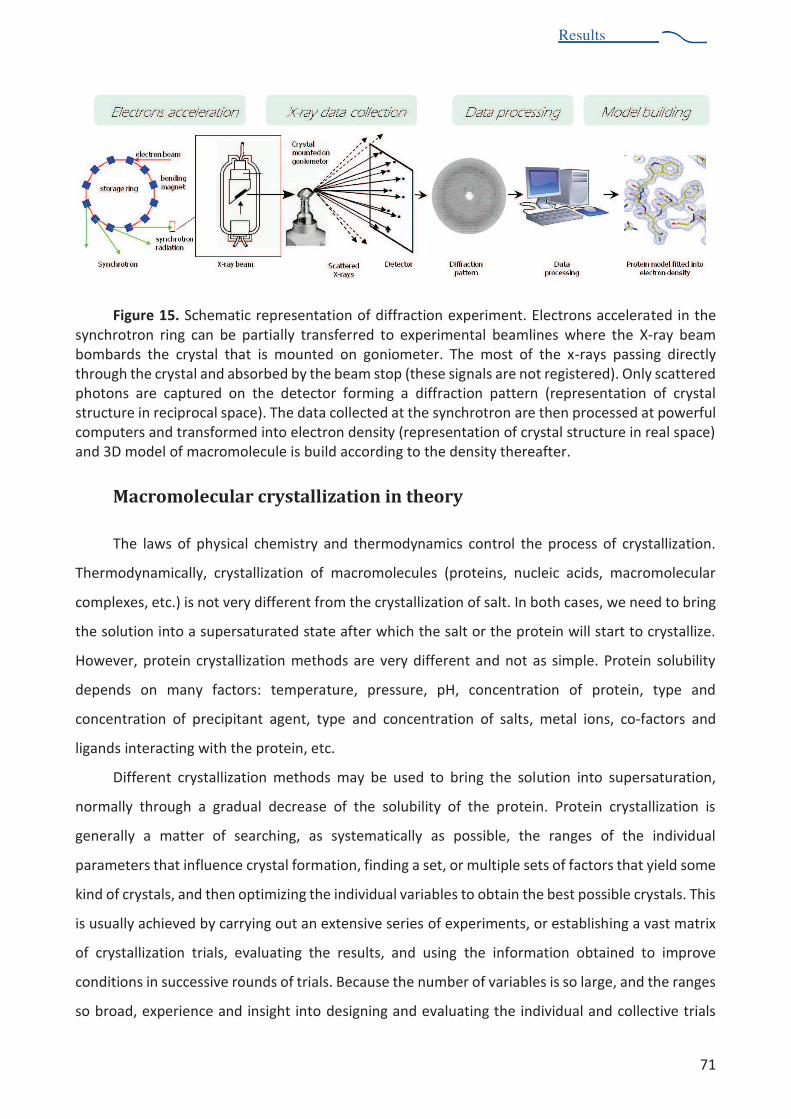
Results
71
Results
Figure 15. Schematic representation of diffraction experiment. Electrons accelerated in the synchrotron ring can be partially transferred to experimental beamlines where the X-ray beam bombards the crystal that is mounted on goniometer. The most of the x-rays passing directly through the crystal and absorbed by the beam stop (these signals are not registered). Only scattered photons are captured on the detector forming a diffraction pattern (representation of crystal structure in reciprocal space). The data collected at the synchrotron are then processed at powerful computers and transformed into electron density (representation of crystal structure in real space) and 3D model of macromolecule is build according to the density thereafter.
Macromolecular crystallization in theory
The laws of physical chemistry and thermodynamics control the process of crystallization.
Thermodynamically, crystallization of macromolecules (proteins, nucleic acids, macromolecular
complexes, etc.) is not very different from the crystallization of salt. In both cases, we need to bring
the solution into a supersaturated state after which the salt or the protein will start to crystallize.
However, protein crystallization methods are very different and not as simple. Protein solubility
depends on many factors: temperature, pressure, pH, concentration of protein, type and
concentration of precipitant agent, type and concentration of salts, metal ions, co-factors and
ligands interacting with the protein, etc.
Different crystallization methods may be used to bring the solution into supersaturation,
normally through a gradual decrease of the solubility of the protein. Protein crystallization is
generally a matter of searching, as systematically as possible, the ranges of the individual
parameters that influence crystal formation, finding a set, or multiple sets of factors that yield some
kind of crystals, and then optimizing the individual variables to obtain the best possible crystals. This
is usually achieved by carrying out an extensive series of experiments, or establishing a vast matrix
of crystallization trials, evaluating the results, and using the information obtained to improve
conditions in successive rounds of trials. Because the number of variables is so large, and the ranges
so broad, experience and insight into designing and evaluating the individual and collective trials

Results
72
Results
becomes an important consideration (McPherson, 2004).
Figure 16. Schematic phase diagram of protein crystallization.
Phase diagram
A schematic diagram of a solubility curve, illustrating how the solubility varies with the
concentration of a precipitant (e.g., polyethylene glycol (PEG) or a salt), is shown in Figure 16. When
a protein crystal is placed in a solvent which is free of protein, the crystals will begin to dissolve. If
the volume of solvent is small enough, the crystal will not dissolve completely; it will stop dissolving
when the concentration of protein in solution reaches a specific value. At this concentration, the
crystal loses protein molecules at the same rate at which protein molecules rejoin the crystal the
system is said to be at equilibrium. The concentration of proteins in the solution at equilibrium is
the solubility. The solubility of a protein varies with the solution conditions. Crystals dissolve in the
undersaturated region where the concentration is below the protein solubility and grow in the
supersaturated region (Asherie, 2004).
Crystals growth
In principle, crystals will form in any protein solution that is supersaturated i.e., when the
protein concentration exceeds the solubility. In practice, considerable supersaturation is required
to overcome the activation energy barrier which exists when forming the crystal. This barrier
represents the free energy required to create the small microscopic cluster of proteins known as
a nucleus from which the crystal will eventually grow (Kashchiev, 2000).
Since there is an energy barrier, nucleation (the process of forming a nucleus) takes time. If
the supersaturation is too small, the nucleation rate will be so slow that no crystals form in a
reasonable period of time. The corresponding area of the phase diagram is known as the
"metastable zone" (Figure 16). In the "labile" or "crystallization" zone, the supersaturation is large

Results
73
Results
enough that spontaneous nucleation is observable. If the supersaturation is too large, then
disordered structures, such as aggregates or precipitates, may form. The "precipitation zone" is
unfavorable for crystal formation, because the aggregates and precipitates form faster than the
crystals. Because these zones are related to kinetic phenomena, the boundaries between the zones
are not well defined (this in contrast to the solubility line which is an unambiguous delimitation of
the equilibrium between solution and crystal). Even though the division in zones is qualitative, the
different behaviors serve as guide when searching for the appropriate conditions to produce crystals
(Mikol et al., 1990; Saridakis et al., 2003).
Macromolecular crystallization in practice
The kinetics of equilibration, through dehydration of the protein-containing experiment drop
or through liquid diffusion, will determine the rate at which supersaturation is obtained as well as
the trajectory through the phase diagram and can often be passively controlled (Luft and DeTitta,
1997). There are three main categories of crystallization methods: vapour-diffusion, batch and
liquid-diffusion.
Vapour diffusion
Vapour diffusion crystallization techniques such as hanging drop and sitting drop methods are
the most commonly used techniques for crystallization. A small droplet containing both protein and
precipitant is dispensed onto a surface. The experiment droplet is then sealed in an airtight chamber
with a reservoir solution. The drop undergoes a dynamic equilibration with the reservoir solution
until the vapour pressure of any volatile species, typically water, over the experiment drop and the
reservoir reach a state of equilibrium. The purpose of the reservoir solution is to dehydrate the
experiment drop and to set the endpoint for the dehydration.
Microbatch
Batch experiments, in particular microbatch under oil (Chayen et al., 1992) experiments, are
conceptually simple: a protein solution is combined with a crystallization cocktail under oil; the oil
is a barrier to dehydration of the experiment drop, but also acts as an interface that can affect
crystallization. The dehydration rate can be controlled by making the oil barrier more or less water-
permeable, for example by combining paraffin (less water-permeable) and silicone-based (more
water-permeable) oils (D'Arcy et al., 1996). Microbatch experiments can be especially useful if the

Results
74
Results
temperature is not stable, as they do not suffer from the condensation in the experiment well that
can occur during vapour diffusion experiments.
Liquid diffusion
These techniques are not as widely used as the batch or vapour diffusion techniques but have
their own advantages and disadvantages. Liquid-diffusion techniques include microdialysis
(Zeppezauer et al., 1968; Lagerkvist et al., 1972; Lee & Cudney, 2004), counter-diffusion (García-
Ruiz, 2003) and free-interface diffusion (Salemme, 1972). Free-interface diffusion is generally based
on a single precipitation event, whereas counter-diffusion exploits the difference in the speed of
diffusion between protein molecules and small molecules, and is designed to generate multiple
precipitation events at different levels of supersaturation. Dialysis crystallization is another type of
liquid diffusion: protein solution is placed within a container, sealed with a semi-porous dialysis
membrane which has a molecular-weight cutoff (MWCO) that is small enough to prevent the protein
molecules from escaping but big enough for the free diffusion of the reservoir solution.
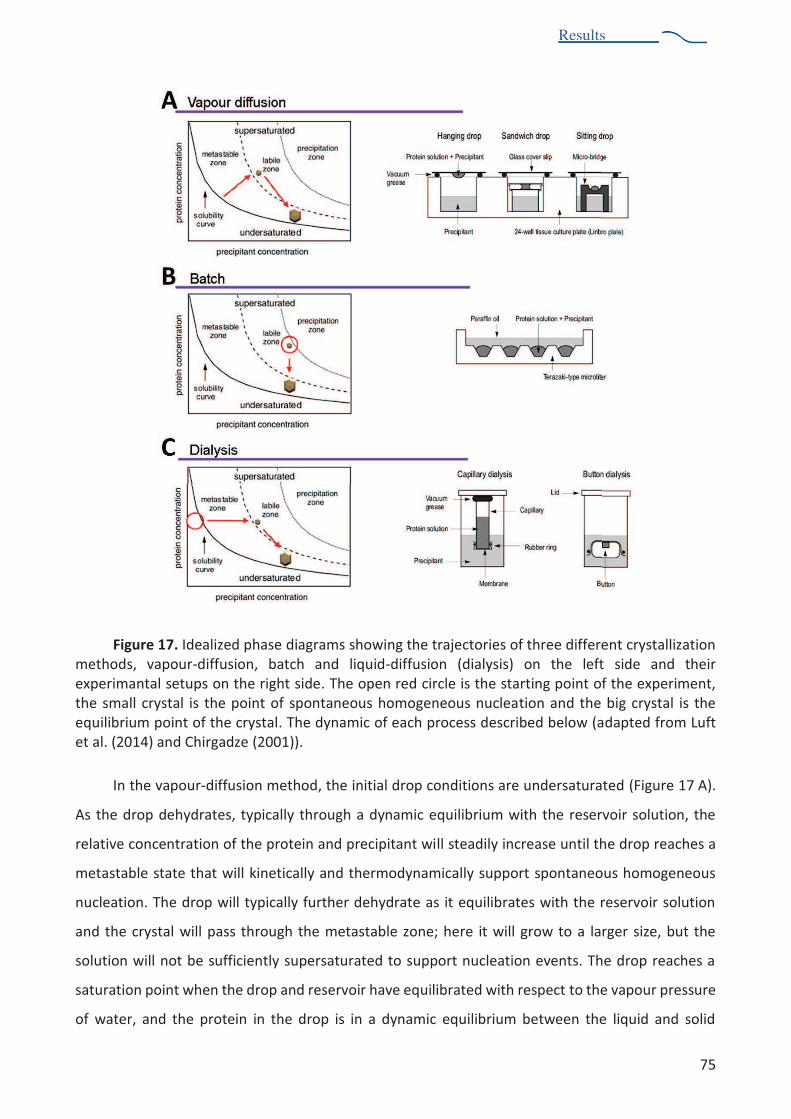
Results
75
Results
Figure 17. Idealized phase diagrams showing the trajectories of three different crystallization methods, vapour-diffusion, batch and liquid-diffusion (dialysis) on the left side and their experimantal setups on the right side. The open red circle is the starting point of the experiment, the small crystal is the point of spontaneous homogeneous nucleation and the big crystal is the equilibrium point of the crystal. The dynamic of each process described below (adapted from Luft et al. (2014) and Chirgadze (2001)).
In the vapour-diffusion method, the initial drop conditions are undersaturated (Figure 17 A).
As the drop dehydrates, typically through a dynamic equilibrium with the reservoir solution, the
relative concentration of the protein and precipitant will steadily increase until the drop reaches a
metastable state that will kinetically and thermodynamically support spontaneous homogeneous
nucleation. The drop will typically further dehydrate as it equilibrates with the reservoir solution
and the crystal will pass through the metastable zone; here it will grow to a larger size, but the
solution will not be sufficiently supersaturated to support nucleation events. The drop reaches a
saturation point when the drop and reservoir have equilibrated with respect to the vapour pressure
of water, and the protein in the drop is in a dynamic equilibrium between the liquid and solid
Results
76
Results
(crystalline) phase. For batch method (Figure 17 B), a successful experiment involves setting up at
labile supersaturation. A nucleation event takes place and protein in solution undergoes a phase
change to the solid (crystalline) form. Equilibrium is reached when the protein in the surrounding
solution reaches a state of saturation with the solid (crystal) phase. The final example shows the
dialysis method (Figure 17 C). The protein solution is held at a fixed volume. As precipitant passes
through the semi-permeable dialysis membrane, the concentration of the precipitant will continue
to increase while the protein concentration remains constant. When the solution reaches a
metastable state then the protein will form a solid phase (crystalline). At this point, the
concentration of the protein in the solution will decrease as protein transitions from a liquid to a
solid phase. Saturation is reached when the solid and liquid phases have reached a state of dynamic
equilibrium.
Crystallization of S. aureus ribosome
Challenges in crystallization of the ribosome
The main challenge in crystallographic studies of any biological molecule is finding well-
diffracting crystals. And it was obvious that macromolecular complex such as ribosome, with
molecular weight 2 300 000 Da, is much more challenging to crystallize than single proteins. For
today the ribosome is the largest asymmetric molecular assembly that have been solved
crystallographically, and the complexity of ribosome crystallography continues to increase with the
addition of translation factors and other accessory proteins. The challenge to crystallize the
ribosome consist not only in its huge molecular weight, but also in the fact that the ribosome is an
asymmetric complex, thus ordering and packing into the crystal can be very sophisticated.
Moreover, ribosomes are very dynamic in the solution meaning that they can have high
conformational heterogeneity within one crystallization drop. Heterogeneity may disturb some
crystal contacts. Ribosome is composed of two different types of molecules, RNA and proteins,
therefore it is rather tricky to find the conditions where ribosome would tend to crystallize rather
than form an amorphous precipitate. The phase diagram for the ribosome is far more complex than
for individual protein. Basically it is the result of convolution of phase diagrams of each individual
molecule comprising the full ribosome and their intermolecular interactions. Hence, ribosomes from
different organisms require unique new searches of correct crystallization conditions. Nowadays,
there are several tens of commercially available crystallization screens developed to facilitate a
comprehensive search of crystallization conditions for proteins. These screens are based on the
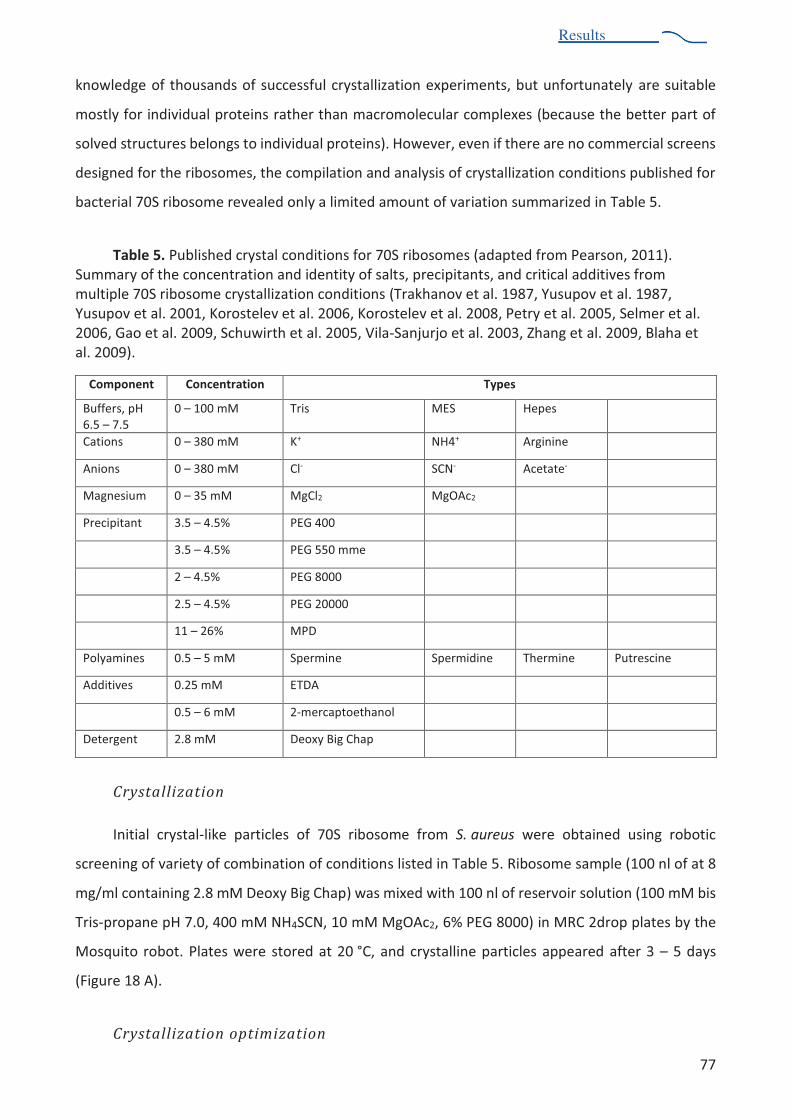
Results
77
Results
knowledge of thousands of successful crystallization experiments, but unfortunately are suitable
mostly for individual proteins rather than macromolecular complexes (because the better part of
solved structures belongs to individual proteins). However, even if there are no commercial screens
designed for the ribosomes, the compilation and analysis of crystallization conditions published for
bacterial 70S ribosome revealed only a limited amount of variation summarized in Table 5.
Table 5. Published crystal conditions for 70S ribosomes (adapted from Pearson, 2011). Summary of the concentration and identity of salts, precipitants, and critical additives from multiple 70S ribosome crystallization conditions (Trakhanov et al. 1987, Yusupov et al. 1987, Yusupov et al. 2001, Korostelev et al. 2006, Korostelev et al. 2008, Petry et al. 2005, Selmer et al. 2006, Gao et al. 2009, Schuwirth et al. 2005, Vila-Sanjurjo et al. 2003, Zhang et al. 2009, Blaha et al. 2009).
Component Concentration Types
Buffers, pH 6.5 7.5
0 100 mM Tris MES Hepes
Cations 0 380 mM K+ NH4+ Arginine
Anions 0 380 mM Cl- SCN- Acetate-
Magnesium 0 35 mM MgCl2 MgOAc2
Precipitant 3.5 4.5% PEG 400
3.5 4.5% PEG 550 mme
2 4.5% PEG 8000
2.5 4.5% PEG 20000
11 26% MPD
Polyamines 0.5 5 mM Spermine Spermidine Thermine Putrescine
Additives 0.25 mM ETDA
0.5 6 mM 2-mercaptoethanol
Detergent 2.8 mM Deoxy Big Chap
Crystallization
Initial crystal-like particles of 70S ribosome from S. aureus were obtained using robotic
screening of variety of combination of conditions listed in Table 5. Ribosome sample (100 nl of at 8
mg/ml containing 2.8 mM Deoxy Big Chap) was mixed with 100 nl of reservoir solution (100 mM bis
Tris-propane pH 7.0, 400 mM NH4SCN, 10 mM MgOAc2, 6% PEG 8000) in MRC 2drop plates by the
Mosquito robot. Plates were stored at 20 °C, and crystalline particles appeared after 3 5 days
(Figure 18 A).
Crystallization optimization
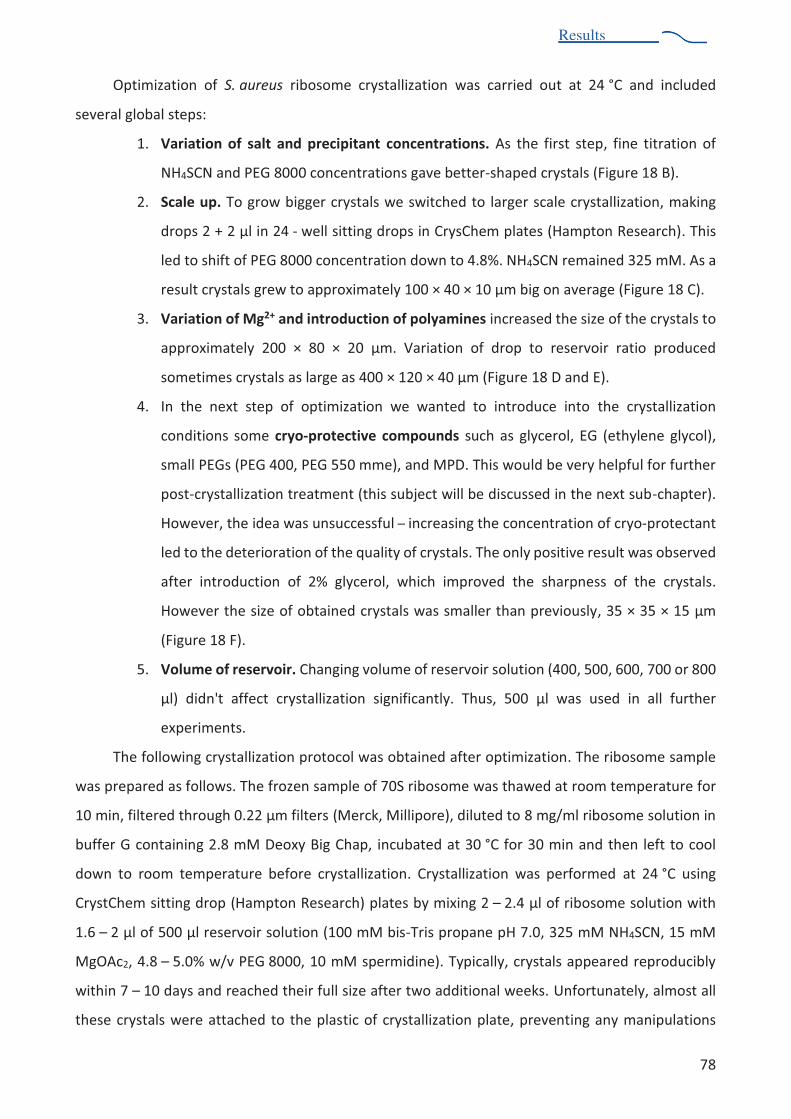
Results
78
Results
Optimization of S. aureus ribosome crystallization was carried out at 24 °C and included
several global steps:
1. Variation of salt and precipitant concentrations. As the first step, fine titration of
NH4SCN and PEG 8000 concentrations gave better-shaped crystals (Figure 18 B).
2. Scale up. To grow bigger crystals we switched to larger scale crystallization, making
drops 2 + 2 µl in 24 - well sitting drops in CrysChem plates (Hampton Research). This
led to shift of PEG 8000 concentration down to 4.8%. NH4SCN remained 325 mM. As a
result crystals grew to approximately 100 × 40 × 10 µm big on average (Figure 18 C).
3. Variation of Mg2+ and introduction of polyamines increased the size of the crystals to
approximately 200 × 80 × 20 µm. Variation of drop to reservoir ratio produced
sometimes crystals as large as 400 × 120 × 40 µm (Figure 18 D and E).
4. In the next step of optimization we wanted to introduce into the crystallization
conditions some cryo-protective compounds such as glycerol, EG (ethylene glycol),
small PEGs (PEG 400, PEG 550 mme), and MPD. This would be very helpful for further
post-crystallization treatment (this subject will be discussed in the next sub-chapter).
However, the idea was unsuccessful increasing the concentration of cryo-protectant
led to the deterioration of the quality of crystals. The only positive result was observed
after introduction of 2% glycerol, which improved the sharpness of the crystals.
However the size of obtained crystals was smaller than previously, 35 × 35 × 15 µm
(Figure 18 F).
5. Volume of reservoir. Changing volume of reservoir solution (400, 500, 600, 700 or 800
µl) didn't affect crystallization significantly. Thus, 500 µl was used in all further
experiments.
The following crystallization protocol was obtained after optimization. The ribosome sample
was prepared as follows. The frozen sample of 70S ribosome was thawed at room temperature for
10 min, filtered through 0.22 µm filters (Merck, Millipore), diluted to 8 mg/ml ribosome solution in
buffer G containing 2.8 mM Deoxy Big Chap, incubated at 30 °C for 30 min and then left to cool
down to room temperature before crystallization. Crystallization was performed at 24 °C using
CrystChem sitting drop (Hampton Research) plates by mixing 2 2.4 µl of ribosome solution with
1.6 2 µl of 500 µl reservoir solution (100 mM bis-Tris propane pH 7.0, 325 mM NH4SCN, 15 mM
MgOAc2, 4.8 5.0% w/v PEG 8000, 10 mM spermidine). Typically, crystals appeared reproducibly
within 7 10 days and reached their full size after two additional weeks. Unfortunately, almost all
these crystals were attached to the plastic of crystallization plate, preventing any manipulations

Results
79
Results
with them. In order to overcome this problem, several more optimization steps were performed,
but unfortunately without any improvement. The details of this optimization are discussed below.
6. Replacing salts and precipitants. To improve the crystal quality we have decided to
replace NH4SCN in crystallization trials to more commonly used salts, but keeping
either the SCN- anion or the NH4+ cation. We therefore tried to introduce KSCN, NH4Cl
and NH4-acetate in combination with NH4SCN or each of these salts individually. We
observed no changes in the kinetics of crystals growth, most of them were still
attached to the plastic. Moreover, when we shifted away from using the
NH4SCN ! PEG 8000 pair the shape and the size of the crystals became worse.
7. Changing geometry and plastic. Another possible way to solve the problem was to
change geometry of the crystallization plates and the surface where crystallization
drop was mixed. To do this, we used a hanging drop setup in VDX plates (Hampton
Research). In this setup the drop is mixed on the glass cover slide and kept upside down
during equilibration (Figure 17 A). Crystals were attached to the glass cover slide,
although they were big enough to use in diffraction experiments (Figure 18 G). The
second type of setup used was a sitting drop in the CombiClover plate (Rigaku
Reagents) that is made from another type of plastic. Crystals were too small for any
further analysis, as the nucleation rate was very high at this setup (Figure 18 G).
8. Changing the temperature. Crystallization at 4 °C did not results in crystals at the
conditions used. Crystals appeared at 16 °C, but they were less sharp and were also
attached to the plastic.
9. Growing in batch. Batch crystallization under the oil prevents the contact of the
crystallization drop with the surface of the plate. However, it had another negative
consequence the crystals of S. aureus ribosome appeared in the phase boundary
between the oil and the drop. Moreover, they were small and not suitable for
diffraction experiments.
10. Growing in agarose. Another technique we try to use was crystallization in agarose.
The principal is to add certain amount of agarose into the drop and keep it at an
appropriate temperature (usually 12 16 °C), so that agarose will not be completely
soluble already but also will not polymerise yet. Introduction of agarose into
crystallization conditions never produced satisfactory crystals.
11. Seeding was used as a last resort to change the kinetics of crystals growth. Seeding is
a very powerful crystallization technique that can in some cases drastically improve
Results
80
Results
the quality of crystals. We start the process of drop equilibration from metastable zone
in the phase diagram (see Figure 16). Together with our ribosome in solution we put
the seeds of crystals (usually smashed by mechanical force) of our crystallized
ribosome sample. These seeds serve as nuclei for the formation of new crystals. Since
we unaware of the exact phase diagram for S. aureus ribosome in particular
crystallization conditions, we used different initial concentrations of every compound
as initial point. Seeds were prepared by vortexing or using a seed-bead kit (Hampton
Research) or by smashing the crystal with glass bead (all done in reservoir solution
where crystal doesn't dissolve). Seeds were diluted up to 10000 times in reservoir
solution. Crystallization drops were set up in CrysChem sitting drop at 24 °C: 1.8 µl of
ribosomes were mixed with 2 µl of reservoir and 0.2 µl of seeds.
Under these conditions, seeding did not improve crystallization. All crystals were
exactly as before (Figure 18 I). Possibly, the treatment of the crystals was too harsh,
and all the nuclei were destroyed during the preparation of the seeds. Although the
technique is simple in theory, realization is always challenging. Much care, patience,
material and optimization are required to perform seeding properly. For the moment,
we have not succeeding in seeding S. aureus ribosome, although in future further
optimization may yet be successful.
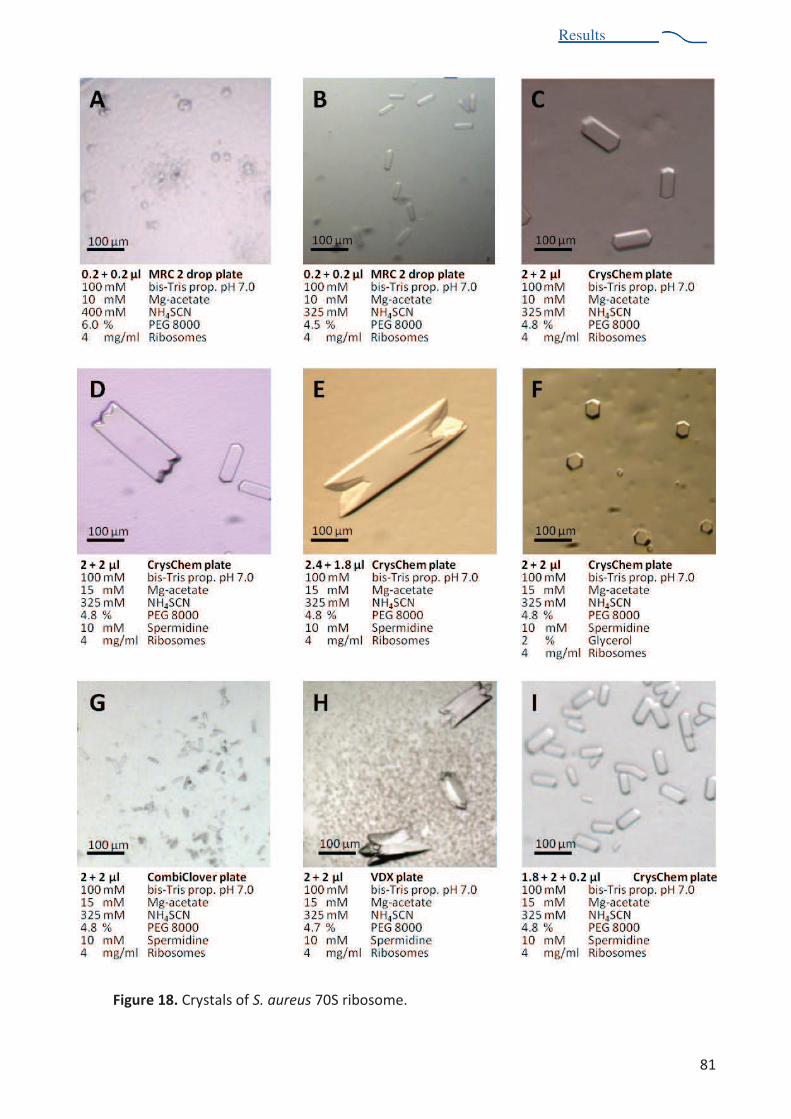
Results
81
Results
Figure 18. Crystals of S. aureus 70S ribosome.
Results
82
Results
Post-crystallization treatment
Dehydration
Crystals of macromolecules and macromolecular complexes are usually composed of
approximately 50% solvent on average, so that in many ways it represents an ordered gel with a
very few intermolecular contacts. Since these contacts provide the lattice interactions essential for
crystal maintenance, it is absolutely necessary to decrease the water content by dehydration
procedure. Usually alcohols like EG, PEG, MPD or salts like (NH4)2SO4 are used as dehydration agents.
Several classic methods exist for protein crystal dehydration which include: simple air drying,
vapour diffusion using salts, and soaking with dehydrating compounds (Heras & Martin, 2005,
Newman, 2006). The advantages of these methods are that the experiment can be performed with
very small humidity steps over long periods of time, and that the number of crystals can be modified
at the same time. Unfortunately, the outcome of the dehydration is unknown until the experiment
is finished, and there is no direct way of assessing the progress of the experiment. Although, it is the
most popular method, it is crystal- and time-consuming and can be difficult to reproduce.
To standardize the process of dehydration and increase its reproducibility, the European
Molecular Biology Laboratory (EMBL) and European Synchrotron Radiation Facility (ESRF) in
Grenoble (France) have developed a humidity control device (HC1) coupled with a synchrotron
beamline. Based on a modified cryo-stream nozzle, it produces an air stream at the sample position
and allows precise control of the relative humidity between 50 and 99% (Sanchez-Weatherby et al.,
2009).
Cryo-protection
Special care has to be taken during post-crystallization treatment to avoid damaging the
crystals (i.e., when transferring cryo-protection) and even for the freezing process itself we only use
the most robust methods of freezing directly in the gaseous N2 stream at 100 K rather than plunging
into liquid N2, ethane, or propane as is common practice in X-ray structural projects. A combination
of severe radiation decay and generally weak diffracting power limits the amount of data that can
be collected from each crystal making it necessary to merge data collected on different crystals to
obtain complete datasets which invariantly degrades the data quality.
. Several different methods for cooling macromolecular crystals have been developed. An
excellent overview is given in the review by Garman and Schneider (1997). Currently the most

Results
83
Results
common method is to fish the crystal with a polyethylene loop via surface tension and cool the
crystal either by submerging it in a liquid cryogen or placing it directly into a cold gas stream (Teng,
1990). This usually vitrifies the bulk solvent, slowing diffusion of damaging free radicals produced
by the ionizing radiation.
Another relatively recent development in cryo-cooling techniques is recovery of "lost"
diffraction by cycling crystals between a low temperature and some higher temperature.
Post-crystallization treatment of S. aureus ribosome crystals
Several strategies were used to dehydrate crystals (Figure 19).
Strategy 1
This involved soaking in a reservoir solution with increasing concentrations of dehydration
agents (in future called dehydration solutions) for different periods of time. The dehydration
solution was introduced into the drop stepwise by sequential transfer or directly into the
crystallization drop. As dehydration agents we used different PEGs (PEG 400, PEG 500 mme,PEG
6000, PEG 8000, PEG 20000), EG, glycerol, or MPD.
Scheme 1. Crystals were sequentially treated by reservoir solution containing increasing
concentrations of cryo-protectants. After different periods of time, crystals were fished using nylon
cryo loops (Hampton Research) and immediately cryo-cooled in a stream of liquid nitrogen.
Scheme 2. Crystals were sequentially treated by reservoir solution containing 5.3 10% of PEG
8000. After different periods if time, crystals were cryo-protected by increasing the glycerol
concentration up to 30% and were subsequently fished using nylon cryo loops and immediately
cryo-cooled in a stream of liquid nitrogen.
Scheme 3. Crystals were sequentially treated by reservoir solution containing 5.3 30% of PEG
8000. After different periods of time, crystals were fished using nylon cryo loops and immediately
cryo-cooled in a stream of liquid nitrogen.
Strategy 2
This involved dehydration under vapour pressure of the reservoir (Scheme 4). The
crystallization drop was diluted with 10 ul of reservoir solution. Then reservoir solution was replaced
by 600 ul of dehydration agent: EG or MPD 50 80%; reservoir solution containing 120 mM MgOAc2
or 2 M NH4SCN or 30% PEG 8000. After a certain time (4 28 h) the drop was treated by reservoir
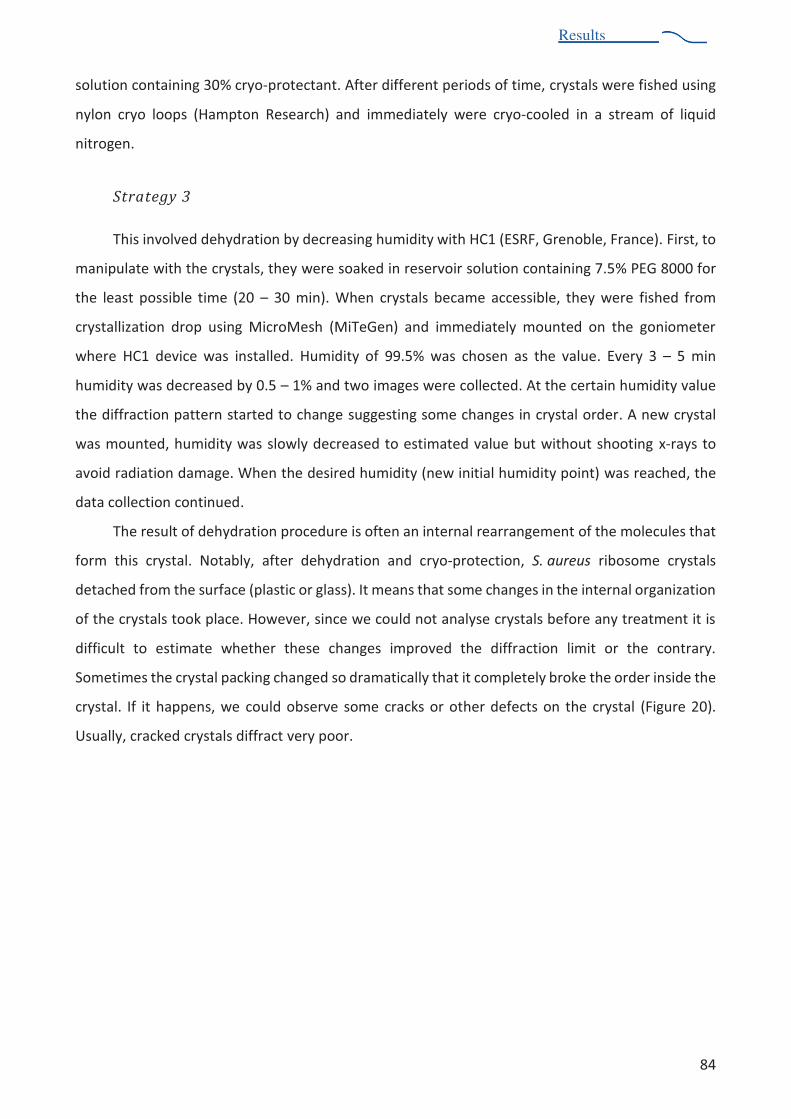
Results
84
Results
solution containing 30% cryo-protectant. After different periods of time, crystals were fished using
nylon cryo loops (Hampton Research) and immediately were cryo-cooled in a stream of liquid
nitrogen.
Strategy 3
This involved dehydration by decreasing humidity with HC1 (ESRF, Grenoble, France). First, to
manipulate with the crystals, they were soaked in reservoir solution containing 7.5% PEG 8000 for
the least possible time (20 30 min). When crystals became accessible, they were fished from
crystallization drop using MicroMesh (MiTeGen) and immediately mounted on the goniometer
where HC1 device was installed. Humidity of 99.5% was chosen as the value. Every 3 5 min
humidity was decreased by 0.5 1% and two images were collected. At the certain humidity value
the diffraction pattern started to change suggesting some changes in crystal order. A new crystal
was mounted, humidity was slowly decreased to estimated value but without shooting x-rays to
avoid radiation damage. When the desired humidity (new initial humidity point) was reached, the
data collection continued.
The result of dehydration procedure is often an internal rearrangement of the molecules that
form this crystal. Notably, after dehydration and cryo-protection, S. aureus ribosome crystals
detached from the surface (plastic or glass). It means that some changes in the internal organization
of the crystals took place. However, since we could not analyse crystals before any treatment it is
difficult to estimate whether these changes improved the diffraction limit or the contrary.
Sometimes the crystal packing changed so dramatically that it completely broke the order inside the
crystal. If it happens, we could observe some cracks or other defects on the crystal (Figure 20).
Usually, cracked crystals diffract very poor.
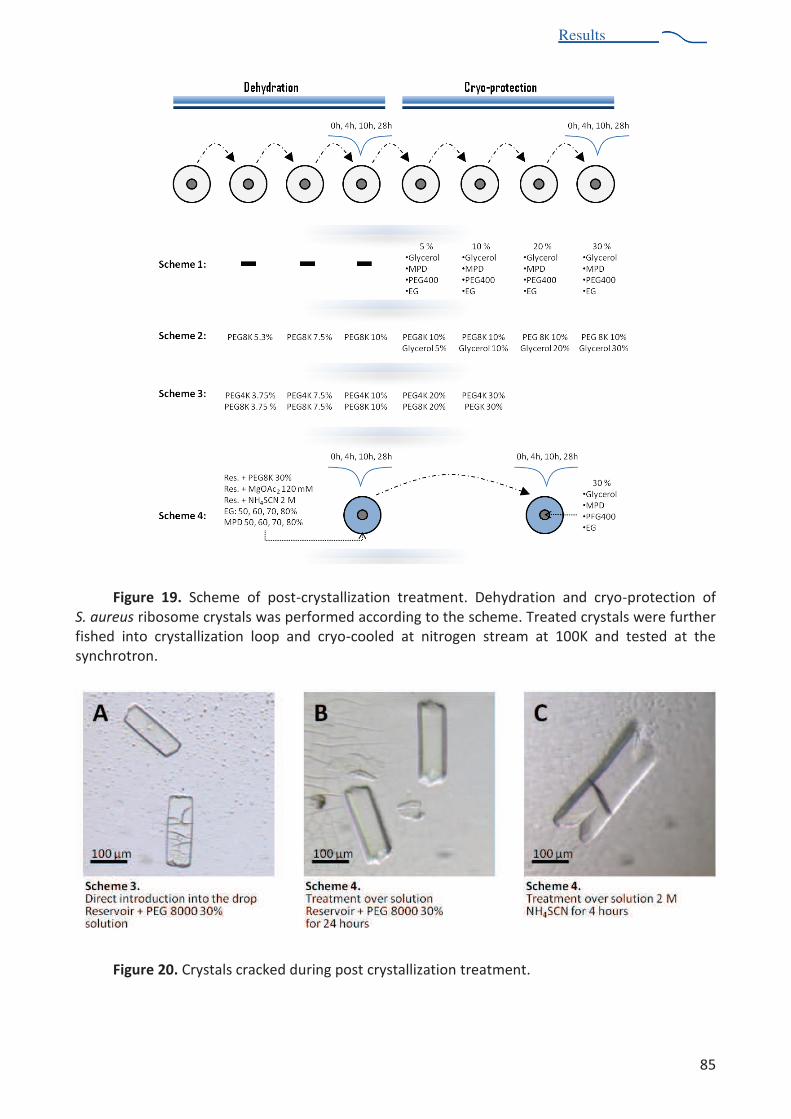
Results
85
Results
Figure 19. Scheme of post-crystallization treatment. Dehydration and cryo-protection of S. aureus ribosome crystals was performed according to the scheme. Treated crystals were further fished into crystallization loop and cryo-cooled at nitrogen stream at 100K and tested at the synchrotron.
Figure 20. Crystals cracked during post crystallization treatment.
Results
86
Results
X-ray data collection
Crystals of S. aureus 70S ribosome were tested at different synchrotrons and beamlines
including Swiss Light Sourse (SLS), Villigen, Switzerland (PXI beamline); Soliel, Massy, France
(Proxima2 beamline), European Synchrotron Radiation Facility (ESRF), Grenoble, France (ID 29
beamline).
Proper data collection from each individual crystal is one of the important parameter to obtain
high quality data and get as much information from the crystal as possible. Different synchrotrons
and beamlines require different conditions for data collection. Detector distance, beamstop
distance, beam size and intensity, exposure time, oscillation angle and other parameters were
optimized empirically according to the properties of crystals and specifications of the beamlines.
SLS
!"#$%&'$($&)*++,)(-*.&$(&SLS synchrotron was performed at the the beamline /!0&"&!12345&All
data was collected using 6-.7+,"89*(*.")*:.(-.7&',(,)(*#&/;<4=>3&2? (Dectris). In average crystals
diffracted around 30 Å resolution, reaching 20 Å in some cases. Depending on post-crystallization
treatment crystals showed different resolution and mosaicity, although, such evaluation is quite
subjective. Nevertheless, the "best" crystals were chosen to collect a full dataset. Dataset was
collected at 100K and processed using XDS. The resolution limit @$6& 69*@.& (*& A,& 0B5C& "& 0D& E.
However the space group was impossible to estimate due to deficiency of the number of reflections.
Diffraction pattern of one of the shots is shown in Figure 21 B.
ESRF
Data collection at ESRF synchrotron was performed at ID29 beamline. A Humidity Control
device (HC1) installed at the beamline was used to dehydrate crystals that were immediately shot
at 295K5& 4++& '$($& @$6& )*++,)(,'& :6-.7& 6-.7+,"89*(*.")*:.(-.7& ',(,)(*#& /;<4=>3& 2?& FG,)(#-6H5&
Dehydration by stepwise decreasing humidity did not improve diffraction. Moreover, the resolution
limit was extremely low and crystals were strongly affected by radiation damage (Figure 21 C). This
could have been caused either by the inefficiency of the dehydration technique or by shooting
crystals at room temperature. Diffraction at the initial value of humidity (99.5%) can be considered
as diffraction of crystal without dehydration. The poor level of this diffraction confirms the necessity
of post-crystallization treatment.
Results
87
Results
Soleil
Data collection at Soleil synchrotron was performed at Proxima2 beamline. All data were
collected at 100K under micro-focused X-ray beam using ADSC Q315r detector (Area Detector
System Corporation). Only dehydrated and cryo-cooled crystals were tested. Crystals were treated
according to the scheme 2 (Figure 19) with the only difference that two temperatures were used (4
and 24 °C) and 1% glycerol was introduced during all steps. In general all crystals diffracted as usual
around 30 Å reaching 20 Å in some cases. Four datasets from the best crystal were collected.
Diffraction pattern of one of the shot is shown in Figure 21 D. Data was processed by XDS and scaled
by XSCALE. Crystal belonged to the space group P42212 and contained 1 ribosome per asymmetric
unit with dimensions 450 × 450 × 280 Å. Maximum resolution reached was 21.7 Å.
From the crystallographic studies of S. aureus ribosome, we can conclude that the purified
sample was good enough to be crystallized. All but one of the compounds used (NH4SCN) are very
well know for ribosome crystallization. Crystals of S. aureus ribosome can be grown reproducibly
until they reach a reasonable size (200 × 80 × 20 µm in average) at 24 °I5&=9,%&$88,$#&-.&B&"&01&'ays
and grow till maximum size during next 2 weeks. The space group was determined as P42212 and
contained 1 ribosome per asymmetric unit with dimensions 450 × 450 × 280 Å. Crystals survived
relatively well under radiation beam, but the resolution limit was always around 25 30 Å reaching
18 20 Å in rare cases. There are several possible explanations of bad diffraction of the crystals. The
first could be the impurity of the sample. Purified sample may have some inhomogeneity that could
not be detected by biophysical methods. Ribosomes could have some conformational differences
that did not influence crystal contacts. They could therefore be freely incorporated into the crystal
without affecting crystal packing but may strongly diminish the diffraction. A second reason could
be the post-crystallization treatment. These crystals may require unique and specific dehydration
and cryo-cooling procedures that were not identified yet. In addition, crystallization conditions
themselves, particularly high temperature, may be the reason of poor diffraction. Keeping
ribosomes of mesophilic bacteria at 24 °C during 2 3 weeks may cause some structural alterations
in the molecule. All these explanations, however, are quite speculative and there may be any other
reasons for the weak diffraction that we are unaware of.
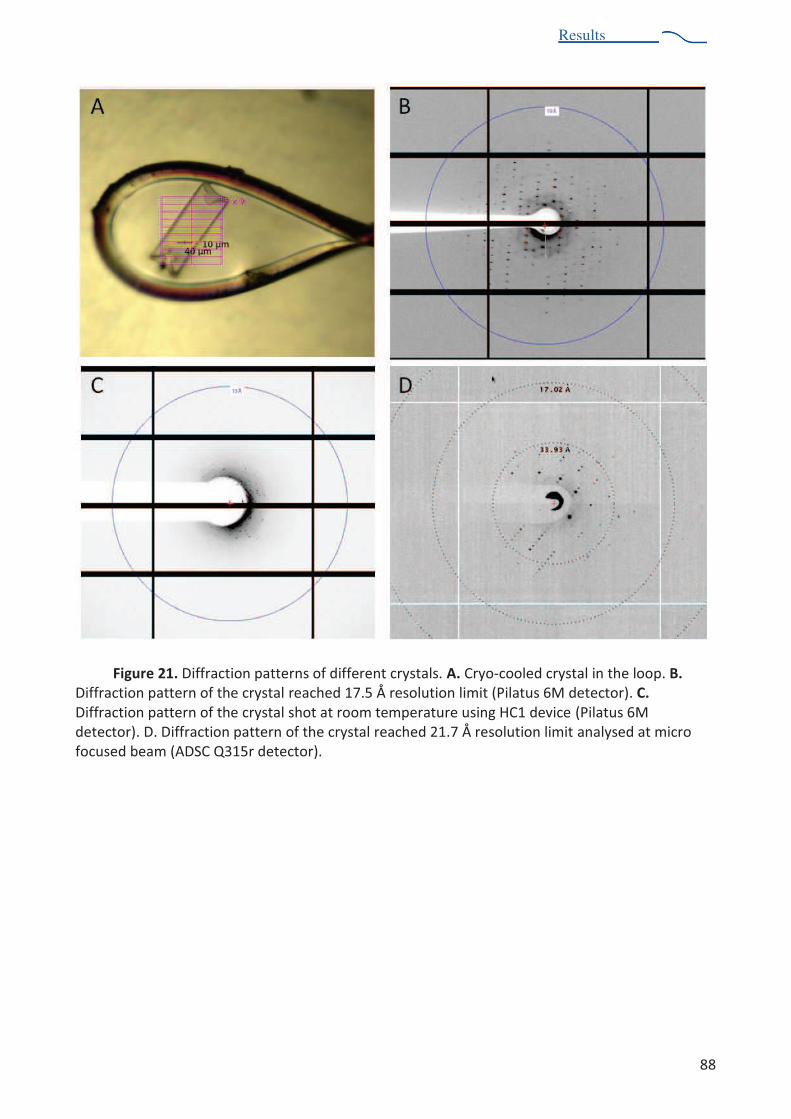
Results
88
Results
Figure 21. Diffraction patterns of different crystals. A. Cryo-cooled crystal in the loop. B. Diffraction pattern of the crystal reached 17.5 Å resolution limit (Pilatus 6M detector). C. Diffraction pattern of the crystal shot at room temperature using HC1 device (Pilatus 6M detector). D. Diffraction pattern of the crystal reached 21.7 Å resolution limit analysed at micro focused beam (ADSC Q315r detector).
Results
89
Results
CRYO-EM STRUCTURE DETERMINATION OF S. AUREUS RIBOSOME
Cryo-electron microscopy, the structural analysis of samples embedded in vitreous ice, is a
powerful approach for determining three-dimensional (3D) structures of biological specimens. Over
the past two decades, this technique has been successfully used to calculate subnanometer (<10 Å)
resolution and, in some cases, <5 Å resolution structures of big objects such as icosahedral viruses
or ribosomes. The recent development of electron microscopes with automated data collection
capabilities and robust direct electron detection cameras, as well as new powerful image processing
algorithms, has dramatically expanded the number of biological macromolecules amenable for
study using cryo-EM. In addition, these new technological and computational developments have
been seccessfully used to determine relatively high resolution 3D structures of proteins and protein
complexes with either low or no symmetry, that before were not considered promising candidates
for high-resolution cryo-EM. With these exciting new advances, cryo-EM will soon be able to
determine near-atomic resolution 3D structures (Binstein and Ohi, 2015).
Latest improvements in cryo-EM
The acceleration of the use of cryo-EM can be attributed to improvements in microscopes,
imaging technologies, and computational approaches.
Field emission gun (FEG)
Some of the greatest advances for microscopes have come from the use of higher acceleration
voltages (200 300 kV) and a FEG electron source. This increase both the temporal and spatial
coherence of the electron beam, making it possible to collect high-resolution images at the defocus
values required to visualize unstained particles in vitrified ice. Other advances in electron
microscopes include stable lens systems (Glaeser et al., 2011), improved vacuums and stable cryo-
stages that minimize sample drift.
Detectors
The remarkable progress in single-particle cryo-EM has been enabled by the development of
direct electron detector device (DDD) cameras (Faruqi and McMullan, 2011; Li et al., 2013a; Milazzo
et al., 2011). DDD cameras have a superior detective quantum efficiency (DQE), a measure of the
Results
90
Results
combined effects of the signal and noise performance of an imaging system (McMullan et al., 2009).
Underlying complementary metal-oxide semiconductor (CMOS) technology makes it possible to
collect dose-fractionated image stacks, referred to as movies, that allow computational correction
of specimen movements (Bai et al., 2013; Campbell et al., 2012; Li et al., 2013a). Together, these
features produce images of unprecedented quality, which, in turn, improves the results of digital
image processing.
Software and Computing
Along with technological developments and improved cryo-EM data collection, the need of
software development to process these data was strongly required. Conveniently for cryo-EM, large
computer clusters have become more readily available, and more powerful, over the past decade.
Thus, many sophisticated and computationally demanding algorithms for alignment and
classification of hundreds of thousands of noisy 2D projections have been developed, resulting in
greatly improved and more reliable 3D density maps (Cheng, 2015).
Much effort has been invested in simplifying and automating the collection of EM images and
the use of image processing software (reviewed in Lyumkis et al., 2010). The problematic issue with
single-particle EM, however, is that there is still no objective quality criterion that is simple and easy
to use, that would allow one to assess whether the determined density map is accurate or not. Even
the resolution of a density map remains controversial.
Electron microscope organization
Transmission electron microscopy (TEM) operates on the same principles as light microscopy,
but uses electromagnetic lenses instead of glass lenses and electrons instead of light. Electrons as
light are characterized by wave-particle duality. As particles, they interact with other particles such
as atoms and can be scattered; as a wave, they can be diffracted by atoms. The wavelength of
electrons is much shorter than the wavelength of visible light, and even shorter than the wavelength
of X-rays; that brings the promise of extremely high resolution of electron microscopy. For example,
according to the de Broglie wavelength, the wavelength of the electron accelerated to 100 kV is
0.037 Å. However, because of lens aberration, the highest resolution of modern microscopes falls
to 1 2 Å.
Electrons are also scattered by the molecules of the air, and therefore the electron microscope
column needs to be permanently kept at high vacuum. The need to maintain a vacuum makes it

Results
91
Results
necessary to introduce specimens through special airlock mechanisms. The problem posed by the
basic incompatibility between the vacuum requirements and the naturally hydrated state of
biological specimens has only recently been solved by cryo-EM. techniques (Dubochet et al., 1982):
the specimen is kept frozen, hydrated throughout the experiment, at a temperature of liquid
nitrogen or helium at which the vapour pressure of water is negligible.
Figure 22. Schematic representation of basic composition of an electron microscope.
Figure 23. Scattering of the electrons by atom. Electron as a particle can interact with other particles, such as atoms. Each atom consists of a positively charged nucleus and a negatively charged electron cloud. When the incoming electron passes close to the atom in the sample, it is influenced by the electromagnetic field of the atom and changes its direction, in other words electrons are scattered be the atom. There are two types of scattering in EM: elastic scattering and inelastic scattering. Elastically scattered electron maintains its energy and gives rise to high resolution information. Inelastic scattering involves transfer of energy to the atom, thus first damaging the sample, and second producing an undesired background term of the image. In some cases even back scattering might happen, but back-scattered electrons do not contribute to the image formation.
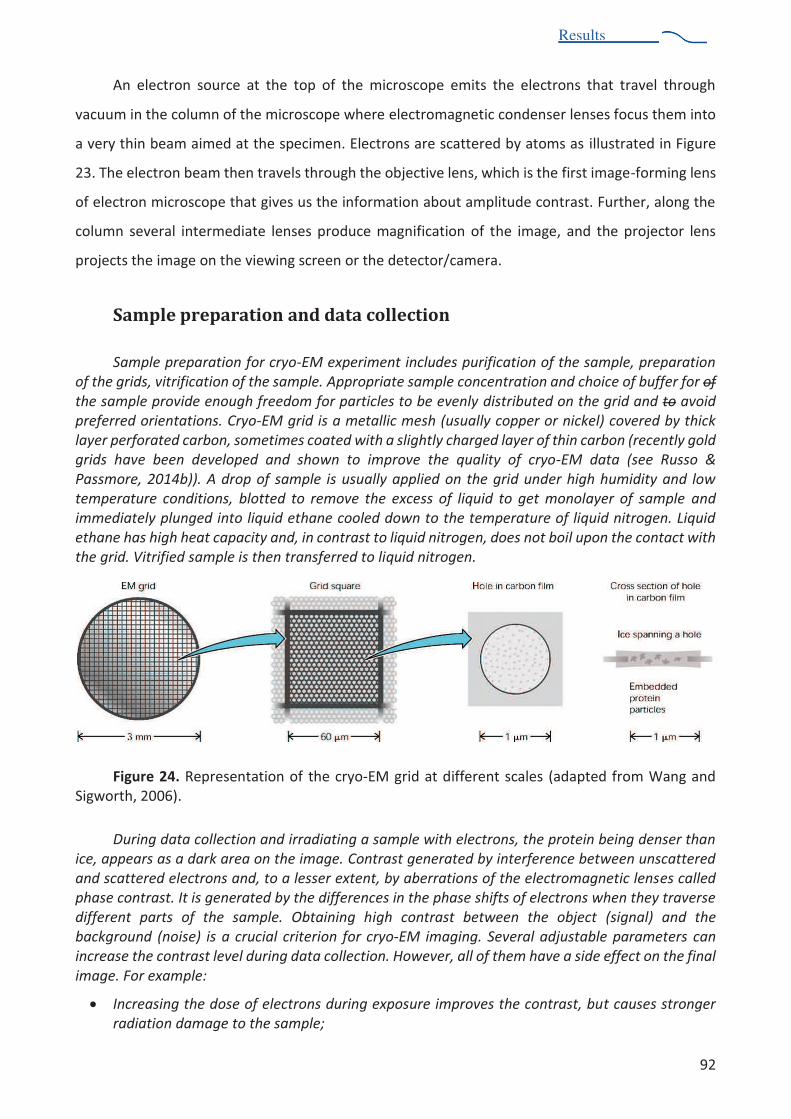
Results
92
Results
An electron source at the top of the microscope emits the electrons that travel through
vacuum in the column of the microscope where electromagnetic condenser lenses focus them into
a very thin beam aimed at the specimen. Electrons are scattered by atoms as illustrated in Figure
23. The electron beam then travels through the objective lens, which is the first image-forming lens
of electron microscope that gives us the information about amplitude contrast. Further, along the
column several intermediate lenses produce magnification of the image, and the projector lens
projects the image on the viewing screen or the detector/camera.
Sample preparation and data collection
Sample preparation for cryo-EM experiment includes purification of the sample, preparation
of the grids, vitrification of the sample. Appropriate sample concentration and choice of buffer for of
the sample provide enough freedom for particles to be evenly distributed on the grid and to avoid
preferred orientations. Cryo-EM grid is a metallic mesh (usually copper or nickel) covered by thick
layer perforated carbon, sometimes coated with a slightly charged layer of thin carbon (recently gold
grids have been developed and shown to improve the quality of cryo-EM data (see Russo &
Passmore, 2014b)). A drop of sample is usually applied on the grid under high humidity and low
temperature conditions, blotted to remove the excess of liquid to get monolayer of sample and
immediately plunged into liquid ethane cooled down to the temperature of liquid nitrogen. Liquid
ethane has high heat capacity and, in contrast to liquid nitrogen, does not boil upon the contact with
the grid. Vitrified sample is then transferred to liquid nitrogen.
Figure 24. Representation of the cryo-EM grid at different scales (adapted from Wang and Sigworth, 2006).
During data collection and irradiating a sample with electrons, the protein being denser than
ice, appears as a dark area on the image. Contrast generated by interference between unscattered
and scattered electrons and, to a lesser extent, by aberrations of the electromagnetic lenses called
phase contrast. It is generated by the differences in the phase shifts of electrons when they traverse
different parts of the sample. Obtaining high contrast between the object (signal) and the
background (noise) is a crucial criterion for cryo-EM imaging. Several adjustable parameters can
increase the contrast level during data collection. However, all of them have a side effect on the final
image. For example:
Increasing the dose of electrons during exposure improves the contrast, but causes stronger
radiation damage to the sample;
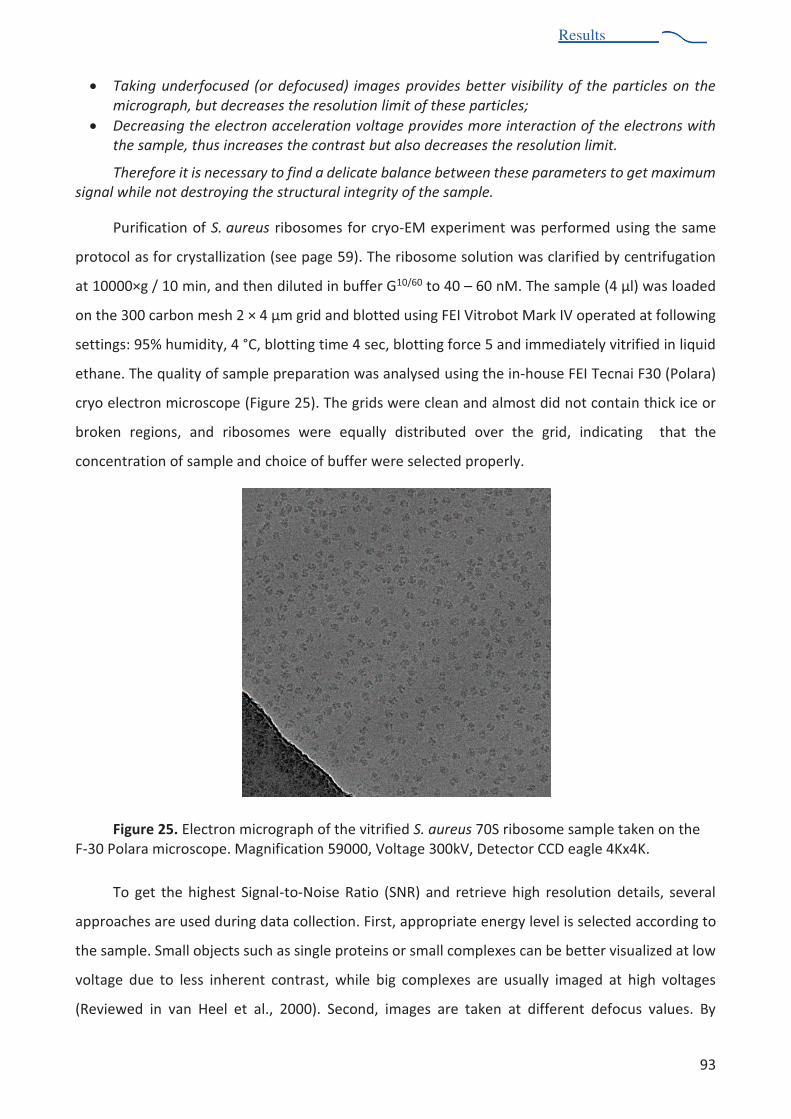
Results
93
Results
Taking underfocused (or defocused) images provides better visibility of the particles on the
micrograph, but decreases the resolution limit of these particles;
Decreasing the electron acceleration voltage provides more interaction of the electrons with
the sample, thus increases the contrast but also decreases the resolution limit.
Therefore it is necessary to find a delicate balance between these parameters to get maximum
signal while not destroying the structural integrity of the sample.
Purification of S. aureus ribosomes for cryo-EM experiment was performed using the same
protocol as for crystallization (see page 59). The ribosome solution was clarified by centrifugation
at 10000×g / 10 min, and then diluted in buffer G10/60 to 40 60 nM. The sample (4 µl) was loaded
on the 300 carbon mesh 2 × 4 µm grid and blotted using FEI Vitrobot Mark IV operated at following
settings: 95% humidity, 4 °C, blotting time 4 sec, blotting force 5 and immediately vitrified in liquid
ethane. The quality of sample preparation was analysed using the in-house FEI Tecnai F30 (Polara)
cryo electron microscope (Figure 25). The grids were clean and almost did not contain thick ice or
broken regions, and ribosomes were equally distributed over the grid, indicating that the
concentration of sample and choice of buffer were selected properly.
Figure 25. Electron micrograph of the vitrified S. aureus 70S ribosome sample taken on the F-30 Polara microscope. Magnification 59000, Voltage 300kV, Detector CCD eagle 4Kx4K.
To get the highest Signal-to-Noise Ratio (SNR) and retrieve high resolution details, several
approaches are used during data collection. First, appropriate energy level is selected according to
the sample. Small objects such as single proteins or small complexes can be better visualized at low
voltage due to less inherent contrast, while big complexes are usually imaged at high voltages
(Reviewed in van Heel et al., 2000). Second, images are taken at different defocus values. By
Results
94
Results
changing the current of the magnetic lenses, the electron beam is focused at different positions,
allowing a set of images with different contrast and resolution to be obtained.
Recently, the quality of cryo-EM imaging has been greatly improved by the ability of new
CMOS detectors to make several read-outs during an exposure. (our version). Thus, instead of taking
one image of fully irradiated sample, it is possible to get a stack of intermediate frames ("movies")
with different levels of irradiation. Intermediate frames revealed that the sample is not static and
may slightly drift and turn because of heating during the exposure. This beam-induced drift can be
compensated during image processing using specific algorithms implemented into several recently
developed cryo-EM software programs.
Data for the S. aureus ribosome were collected using the in-house spherical aberration (Cs)
corrected Titan Krios S-FEG instrument (FEI, Eindhoven, Netherlands) operated at 300 kV
acceleration voltage, at a magnification 59000X and an underfocus of !z from 0.4 to 4.0 µm. The
data were recorded using the second-generation back-thinned direct electron detector CMOS
(Falcon II) during automated data collection with EPU software (FEI, Eindhoven, Netherlands). The
camera was set up to collect 7 frames out of 17 possible, with pixel size of 1.1 Å and total exposure
dose of 60 e-/Å2 (or approximately 3.5 e-/Å2 per frame).
Image processing for single particle cryo-EM
Frame re-alignment
The collection of cryo-EM images in "movie" mode allows for the tracking of beam-induced
movement of both the vitrified ice layer and the embedded particles (Brilot et al., 2012; Campbell et
al., 2012). This movement causes blurring of the final image, limiting the ability to generate high-
resolution structures. A number of algorithms that correct for this beam-induced motion have now
been developed. These approaches align the individual dose fractionated images, either using the
entire image or the individually windowed particles, before summing the frames into a final image
(Li et al.,2013; Shigematsu and Sigworth, 2013; Rubinstein and Brubaker 2014; Sheres, 2014). This
procedure significantly improves the quality of the final data for two reasons. First, the alignment
algorithms correct the beam-induced motion, and second, the effects of radiation damage can be
reduced by carefully choosing which dose-fractionated images are included in the final summed
image (Baker, 2010; Sheres, 2014).
As the first step of image processing, the stack of 7 frames collected for each image was
aligned, beam-induced local (movement of individual particle) and global (movement of the whole
frame) drifts were compensated and frames were averaged into one micrograph. The frame re-
alignment was performed using optical flow algorithms integrated in Scipion workflow. All
subsequent image processing was performed in Scipion workflow using algorithms integrated there.

Results
95
Results
Contrast transfer function
For weakly scattering samples, the image formation process in the electron microscope is
linear, i.e., the densities in collected image are linearly proportional to the densities in the imaged
object, and this is described by the Contrast Transfer Function (CTF) (Frank, 2006; Wade, 1992). CTF
mathematically describes how aberrations in the electron microscope modify the image. To
compensate imperfections of the image, CTF of each micrograph has to be estimated.
There are several parameters required for CTF estimation. Some of them, such as wavelength
and spherical aberration coefficient are given by the settings of the microscope, whereas the others
(defocus and astigmatism) are established experimentally. Once the mathematical form of the CTF
is calculated, it is used to correct the image for the CTF effects. CTF is an oscillating function which
crosses zero several times; every zero-cross means the loss of information therefore a single image
cannot be fully corrected. Therefore, it is necessary to collect many images at different defocus
settings, as these give rise to CTFs with zeros at different spatial frequencies, and averaging them
with appropriate weights (Penczek, 2010) will result in a CTF-corrected average.
To estimate the CTF, Fourier transform of the image is calculated. Fourier transform is a sum
of all sine waves with the amplitudes and frequencies that compose that image. The sine waves with
a big wavelength (in other words low frequency waves) have large amplitude and describe low-
resolution components of the image. They contribute to the image contrast. The sine waves with
high frequencies usually have small amplitude and do not contribute to the contrast, but carry high-
resolution components of the image. Fourier transform (as a function of frequency vs amplitude)
corresponds to the amplitude spectrum of the image, as the phase components are omitted. It is
common to plot Fourier transform as a function of intensity vs frequency (intensity = amplitude2).
Such plot is known as a power spectrum, where approximated by computed CTF, amplitude
oscillations are shown as Thon rings (Mindell and Grigorieff, 2003).
Estimation and correction of CTF was performed using ctffing4 (Rohou and Grigorieff, 2015).
Characteristic parameters and some more explanations are given in Figure 26. The micrographs
where the CTF parameter was difficult to estimate were excluded from further processing (usually
these micrographs contained either crystallized ice particles or the edge of the carbon hole). The
micrographs with estimated resolution lower than 10 Å were also excluded.

Results
96
Results
Figure 26. Processing of S. aureus ribosome cryo-EM images taken at different defocus (high defocus on the left side and low defocus on the right side). Defocus values and calculated resolution limits are indicated above the image. Electron micrographs after frame re-alignment are shown in figures A and A'. The image taken far from the focus (A) has very high contrast, that makes particles very visible. However, according to the CTF estimation, most of the high-resolution information is lost in this image, but can be recovered from image taken closer to focus. Power spectra are shown in the figures B and B'. Contrary to the far-from-focus image, calculated Thon rings of close-to-focus image (B') have big radii and are a good match with the theoretically predicted ones. This means that the image contains sine waves with high spatial frequencies, in other words carries high-resolution information. Another representation of CTF estimation is shown on plots C and C'. Plot C is a frequently oscillating curve, which fades out at high spatial frequencies, where high-resolution information is located. Thus, this image contains very few signals at high resolution, moreover, any information is lost at the points where the CTF curve crosses the zero value. In turn, the CTF curve of the close-to-focus image (C') oscillates much less, has a high signal at the high spatial frequency, and therefore carries high-resolution information.
Particle picking and extraction
Once a dataset has been collected, movies have been aligned and averaged (if applicable), and
good micrographs have been selected (e.g., based on Thon rings being visible to high resolution in
all directions), a project continues with the labour-intensive process of particle picking. Particles can
be selected in a manual, semi-automated, and fully automated manner (Figure 27).
Picking of the particles of S. aureus ribosome was performed in semi-automated mode using
XMIPP (Sorzano et al., 2004) software. Around 1000 particles were picked manually and used as a
reference for automated picking. During particle extraction the particles were normalized and the

Results
97
Results
contrast was inverted, so that particles became white and the background became dark.
Figure 27. Schematic and idealized representation of particle extraction and 3D reconstruction. An example of the GroEL complex is presented. For the reason of proper visualization, the contrast is not inverted, therefore particles are dark and the background is less dark.
Particles classification
To determine a high-resolution 3D structure, only images of structurally identical molecules
should be included in the reconstruction. Numerous image processing approaches have been
developed to precisely assign orientation parameters to 2D projections and ensure projections of
only structurally homogeneous particles are included in a 3D reconstruction. The ability of cryo-EM
to classify structurally diverse datasets, sometimes termed in silico purification, makes single-
particle EM a powerful method for determining structures of many biologically essential complexes
that are difficult to crystallize because of their inherent conformational heterogeneity. However, at
this time, the image processing algorithms are still limited by the amount of structural heterogeneity
that can be tolerated. Classifying small, asymmetric, and/or extremely dynamic samples remains a
significant challenge.
A cryo-EM image is a 2D projection of a 3D object. An object, sampled from a range of angles
is then reconstructed by reprojecting these projections at the original sampling angle into the object
space (Figure 27). To provide maximum 3D information as many projections as possible should be
acquired over as wide range of angles as possible. However, sometimes molecules, especially
elongated ones, take a preferable orientation on the grid, that limits the angular coverage of the
projections. During classification 3D models are reconstructed for each class in iterative manner and
each particle is assigned to one or another class based on cross-correlation or maximum likelihood
approach.
Extracted particles of S. aureus ribosome were classified into 10 classes using Relion 1.3
(Sheres, 2012), which is based on a maximum likelihood algorithm, and require the initial (reference)
model. As a reference model we used the crystal structure of the E. coli ribosome (Schuwirth et al.,
2005, PDB code 4V4Q) low-pass filtered to 40 Å. Two stages of the 3D classification were performed

Results
98
Results
using stepwise sampling, starting from 30° angular sampling interval, 10 pix offset search range and
2 pix offset search step. Each subsequent round of classification was performed with finer sampling
and was started from the iteration of the previous step, when P-max value reached the plateau. As
the last step the following sampling was used: 1.8° angular sampling interval, 4 pix offset search
range and 1 pix offset search step. The result of the first stage of 3D classification allowed sorting
out rough heterogeneity of the sample e.g. free 50S subunits, ribosome particles containing E-site
tRNA, 70S particles with SSU in different conformations and other impurities. Classes of interest
were further re-classified using the same sampling as that used for the first stage of classification.
The final result revealed two identical classes of non-rotated ribosome with very residual P-site tRNA
(see Figure 28). These two classes together contained 109580 particles (26.6% of the full dataset).
They were subsequently merged together and subjected to further refinement.
Figure 28. Schematic representation of 3D classification of S. aureus ribosome dataset.
Refinement
After successful 3D classification, the particles from the classes of interest are subjected to
structure refinement. All single-particle EM packages use a more or less elaborate version of the
iterative 3D projection matching procedure for structure refinement. At the end of every iteration,
Fourier Shell Correlation (FSC) curve is computed using half-subsets of the projection data and the current
resolution is derived from it. FSC provides information on the level of SNR as a function of a spatial
frequency. Based on the FSC, the structure is low-pass filtered and passed to the next iteration of the
!"#$%&!$'()'*+$',$-'*$. /(*$0'112$)"/&*3",44'3,')3,5/$-particle EM is a somewhat arbitrarily chosen cut-

Results
99
Results
off level of the SNR or FSC curve. For example, the resolution can be defined as the spatial frequency at
which the FSC curve is 0.5 or as the spatial frequency at which the SNR is 1.0 (corresponding to an FSC of
0.33), the level at which the power of the signal is equal to the power of the noise (Rosenthal and
Henderson, 2003). Another common choice of threshold is 0.143 (often called gold-standard FSC), the
value selected based on relating EM results to those in X-ray crystallography (Sheres & Chen, 2012).
Refinement of the selected classes was performed using the Relion 3D auto-refine protocol.
This procedure employs gold-standard FSC calculations to estimate resolution, so that overfitting
may be avoided. Combined with a procedure to estimate the accuracy of the angular assignments,
it automatically determines when a refinement has converged. The refinement was performed
under following conditions: 15° angular sampling interval, 30 pix offset search range and 6 pix offset
search step, 3.7 pix local search from auto-sampling.
The gold-standard FSC curves inside the auto-refine procedures only use unmasked maps to
strictly prevent overfitting. However, this also means that the actual resolution is under-estimated
somewhat because a noisy solvent area. Therefore, after performing a 3D auto-refinement, the map
was sharpened, using a soft mask with 4 pix mask extensions and 4 pix soft-edge width. The
resolution of the final sharpened structure was estimated to be 3.9 Å at FSC=0.143 and 4.7 Å at FSC
= 0.5 (Figure 29).
Figure 29. Resolution curve of cryo-EM structure reconstruction after 3D auto-refinement (left) and post-processing (right). Estimated resolution after course refinement was 4.7 Å using gold-standard FSC (0.143) and 6.9 Å at FSC=0.5. After refinement using the mask resolution increased to 3.9 Å using gold-standard FSC (0.143) and 4.7 Å at FSC=0.5.
Local resolution estimation
Unlike crystal structures, cryo-EM structures have heterogeneous resolution in different
regions, the core part of the molecule is usually better resolved than the periphery. This is because
the periphery parts of the molecules are usually more flexible and also they move more during
electron exposure in respect to the core part. Estimation of the local resolution is useful tool for
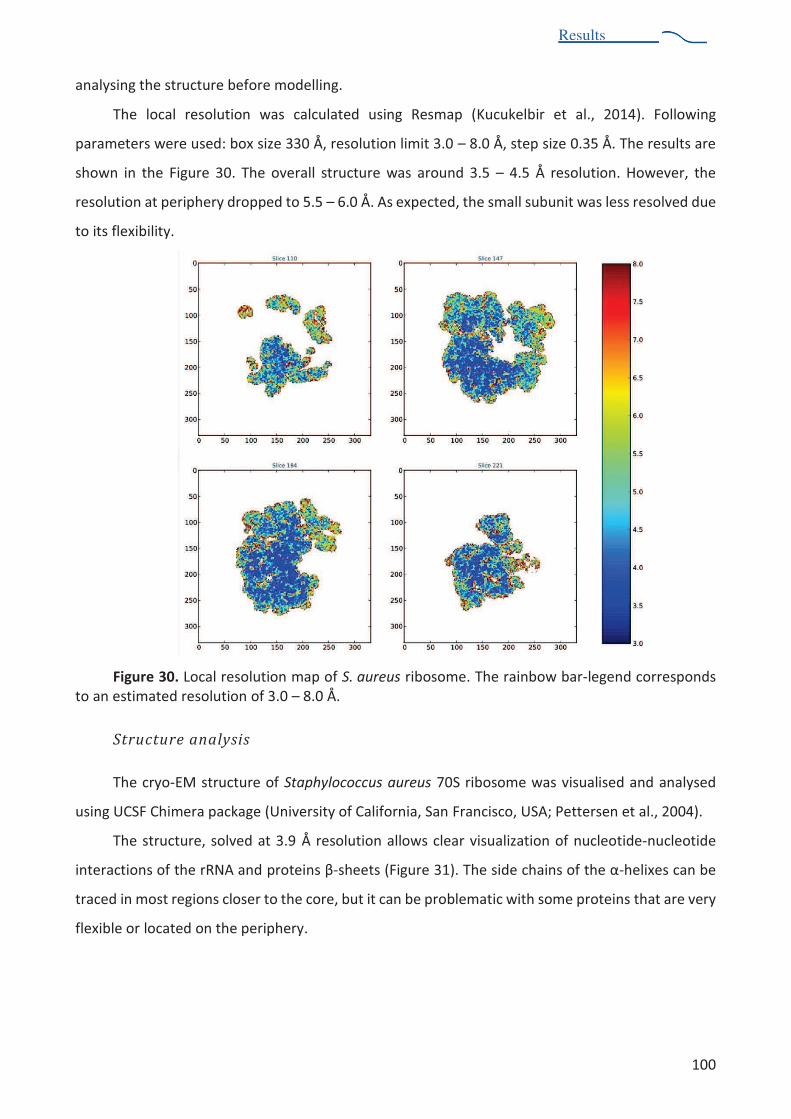
Results
100
Results
analysing the structure before modelling.
The local resolution was calculated using Resmap (Kucukelbir et al., 2014). Following
parameters were used: box size 330 Å, resolution limit 3.0 8.0 Å, step size 0.35 Å. The results are
shown in the Figure 30. The overall structure was around 3.5 4.5 Å resolution. However, the
resolution at periphery dropped to 5.5 6.0 Å. As expected, the small subunit was less resolved due
to its flexibility.
Figure 30. Local resolution map of S. aureus ribosome. The rainbow bar-legend corresponds to an estimated resolution of 3.0 8.0 Å.
Structure analysis
The cryo-EM structure of Staphylococcus aureus 70S ribosome was visualised and analysed
using UCSF Chimera package (University of California, San Francisco, USA; Pettersen et al., 2004).
The structure, solved at 3.9 Å resolution allows clear visualization of nucleotide-nucleotide
interactions of the rRNA and protei"#$%-sheets (Figure 31). &'($#)*($+',)"#$-.$/'($0-helixes can be
traced in most regions closer to the core, but it can be problematic with some proteins that are very
flexible or located on the periphery.

Results
101
Results
Figure 31. A. Cryo-EM structure of S. aureus ribosome. B. Settings of cryo-EM experiment.
We performed the comparative analysis of S. aureus ribosome using model objects: crystal
structures of T. thermophilus (Jenner et al., 2010) and E. coli (Schuwirth et al., 2005) 70S ribosomes
and cryo-EM structure of B. subtilis 70S ribosome (Sohmen et al., 2015). The T. thermophilus
ribosome is the most structurally studied ribosome, the E. coli ribosome is the most biochemically
studied and the mesophilic bacterium Bacillus is phylogenetically the closest organism to the genus
Staphylococci.
The structure of S. aureus ribosome was compared to the structure of B. subtilis ribosome, the
first Gram-positive bacterium ribosome structure solved by cryo-EM at high-resolution (3.5 3.9 Å)
in the laboratories of D. Wilson and R. Beckmann (Sohmen et al., 2015). The qualities of both maps
were very similar. Figure 32 (A and B) demonstrates part of PTC located on the intersubunit region,
particularly nucleotides 2092-2097 of the 23S rRNA.
An overall comparison revealed almost no differences in the three-dimensional organisation
of these two ribosomes. However, to study B. subtilis ribosome, the authors used a stalled model
with tRNA in the P-site and peptide chain in the protein exit tunnel. Therefore, some differences
between two ribosomes were found in the tRNA binding region, e.g. at nucleotide A2631 (A2602 in
E. coli) of the 23S rRNA, which is located in the PTC. It is known to be conformationally the most
flexible residue in PTC, however, in the presence of tRNAs, it is sandwiched between A- and P-tRNAs
CCA ends (Nissen et al., 2000). We did not observe it in the structure of vacant S. aureus 70S
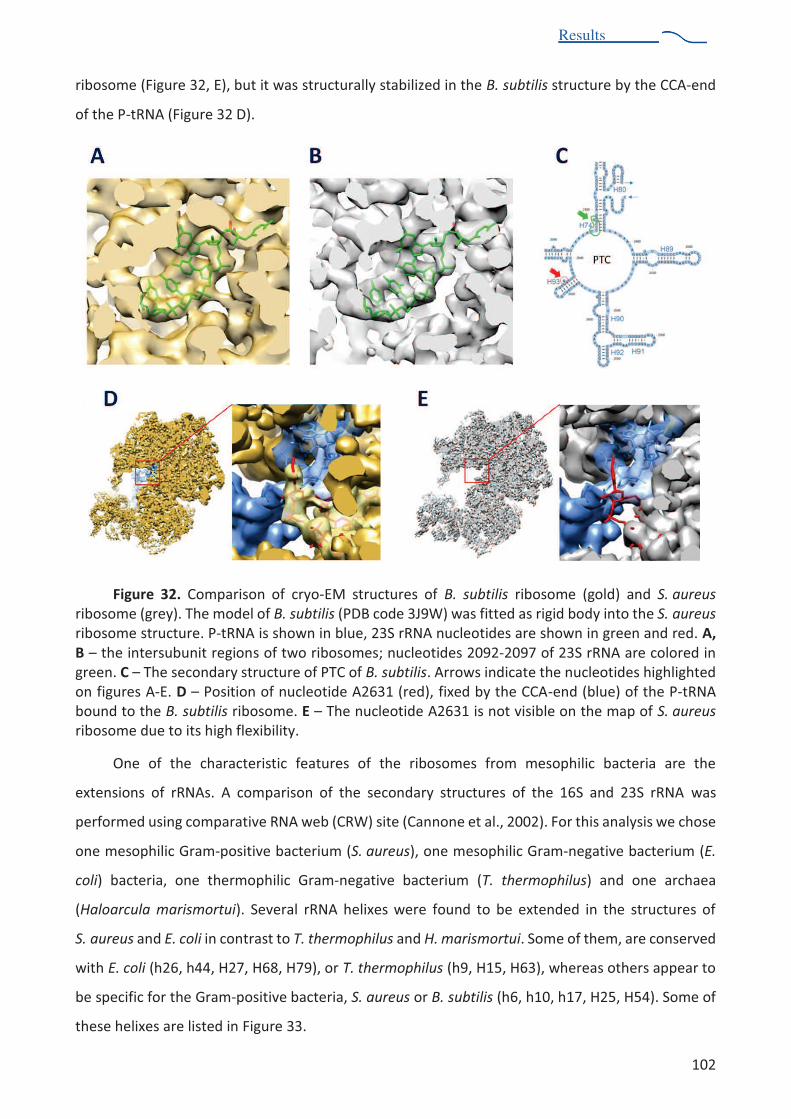
Results
102
Results
ribosome (Figure 32, E), but it was structurally stabilized in the B. subtilis structure by the CCA-end
of the P-tRNA (Figure 32 D).
Figure 32. Comparison of cryo-EM structures of B. subtilis ribosome (gold) and S. aureus
ribosome (grey). The model of B. subtilis (PDB code 3J9W) was fitted as rigid body into the S. aureus ribosome structure. P-tRNA is shown in blue, 23S rRNA nucleotides are shown in green and red. A, B the intersubunit regions of two ribosomes; nucleotides 2092-2097 of 23S rRNA are colored in green. C The secondary structure of PTC of B. subtilis. Arrows indicate the nucleotides highlighted on figures A-E. D Position of nucleotide A2631 (red), fixed by the CCA-end (blue) of the P-tRNA bound to the B. subtilis ribosome. E The nucleotide A2631 is not visible on the map of S. aureus ribosome due to its high flexibility.
One of the characteristic features of the ribosomes from mesophilic bacteria are the
extensions of rRNAs. A comparison of the secondary structures of the 16S and 23S rRNA was
performed using comparative RNA web (CRW) site (Cannone et al., 2002). For this analysis we chose
one mesophilic Gram-positive bacterium (S. aureus), one mesophilic Gram-negative bacterium (E.
coli) bacteria, one thermophilic Gram-negative bacterium (T. thermophilus) and one archaea
(Haloarcula marismortui). Several rRNA helixes were found to be extended in the structures of
S. aureus and E. coli in contrast to T. thermophilus and H. marismortui. Some of them, are conserved
with E. coli (h26, h44, H27, H68, H79), or T. thermophilus (h9, H15, H63), whereas others appear to
be specific for the Gram-positive bacteria, S. aureus or B. subtilis (h6, h10, h17, H25, H54). Some of
these helixes are listed in Figure 33.
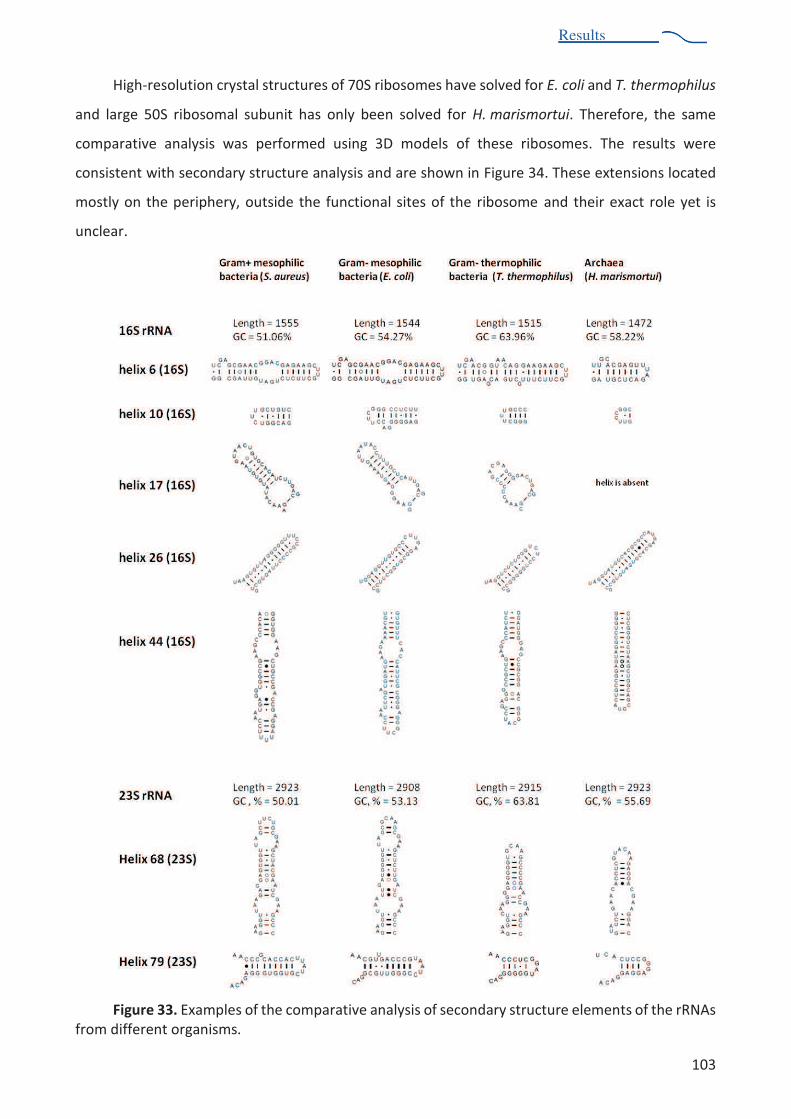
Results
103
Results
High-resolution crystal structures of 70S ribosomes have solved for E. coli and T. thermophilus
and large 50S ribosomal subunit has only been solved for H. marismortui. Therefore, the same
comparative analysis was performed using 3D models of these ribosomes. The results were
consistent with secondary structure analysis and are shown in Figure 34. These extensions located
mostly on the periphery, outside the functional sites of the ribosome and their exact role yet is
unclear.
Figure 33. Examples of the comparative analysis of secondary structure elements of the rRNAs from different organisms.

Results
104
Results
Figure 34. X-ray structure of T. thermophilus ribosome (PDB code 4V4F) fitted into S. aureus ribosome structure as rigid body: 30S subunit is colored in blue, 50S subunit is colored in gold. Extensions of some rRNA helixes and ribosomal proteins are colored red.
One more important observation made in the sample of purified S. aureus 70S ribosome is the
absence of the protein L9. The protein L9 is bacteria-specific ribosomal protein. It is located on the
periphery very close to L1 stalk in domain V of the rRNA and protrudes at the side of bacterial
ribosome. The protein is very weakly associated with the S. aureus ribosome and dissociated during
ribosome purification procedure (Table 3).
Results
105
Results
RESEARCH PROJECT 1: SUMMARY
Following results were obtained for the project of structure determination of S. aureus 70S
ribosome:
Growth of Staphylococcus aureus cells and their harvesting were adapted for purification
of ribosomes for structural studies.
The protocol of ribosome purification was established. The yield of material was sufficient
to perform extensive search of crystallization conditions.
Characterization of the ribosomes by different biochemical and biophysical methods
proved their purity, stability and homogeneity.
First crystals of S. aureus 70S ribosomes were obtained. Crystals were reproducible and
reached appropriate size to perform diffraction experiments.
The conditions of dehydration and cryo-cooling were optimized for obtained crystals.
First diffraction data of S. aureus 70S ribosome crystals were collected. However, the
resolution obtained was too low (~18 Å) for high-resolution structure determination.
The appropriate conditions for cryo-EM grid preparation and data collection were found
for S. aureus 70S ribosome sample.
After the processing of the cryo-EM images, the structure of vacant S. aureus 70S
ribosome was obtained at 3.9 Å resolution. The resolution will be further improved by
performing several additional steps of image processing.
First structure analysis revealed several features in ribosome structure unique for Gram-
positive bacteria.
.

RESEARCH PROJECT 2:
PURIFICATION AND CRYSTALLIZATION OF HUMAN eEF2

Results
107
Results
PURIFICATION AND CRYSTALLIZATION OF HUMAN EEF2 PROTEIN
One of the scientific goals of our laboratory is the crystal structure determination of the
human 80S ribosome. For structure determination of human 80S ribosome the protocol of
purification also have to be established. During our development of ribosome purifying protocols
we discovered that most of the ribosomes co-purify with eEF2 protein. The most likely explanation
for this observation is that eEF2 inactivates the ribosomes as a part of the physiological response of
HaLa cells that were used for purification. The same observation was reported in the recent cryo-
EM study of human 80S ribosome: the sample of vacant 80S ribosome contained some fraction of
80S ribosome complex with eEF2 (Anger, et al., 2013).
In general, any ribosome isolation protocol is based on the sedimentation properties and
selection between ribosomal and protein fractions, and it can be achieved during the first steps of
purification. In the preparation of the yeast 80S ribosome this selection occurs during the step of
PEG precipitation where big complexes such as ribosome can be found in the insoluble fraction and
proteins stay in the soluble fraction. Therefore, for purification of native eEF2 protein from HeLa
cells we used the soluble fraction after PEG precipitation. Using this approach, we also made a
selection between the free cytosolic eEF2 and ribosome-associated eEF2.
HeLa cells preparation
HeLa cells were grown in suspension cultures in Minimal Essential Media Spinner Modification
(S-MEM) (Sigma Aldrich) supplemented with 7% new-born calf serum, 2 mM Glutamine and 40
!"#$% !&'()#*+,'% )(% -. °C in 5% CO2 environment. These cell cultures were maintained at the
IGBMC HeLa cell facility.
Purification of native eEF2
During purification of ribosomes from 3 / 6 liters of HeLa cell culture, the ribosome-free
soluble fraction after PEG precipitation step was precipitated using (NH4)2SO4 / salt powder was
added to 80% saturation level, stirred for 1 hour and precipitated at 20000×g / 40 min. Pellet was
dissolved in buffer I (20 mM Tris-HCl pH 7.5, 20 mM KCl, 5 mM MgCl2, 0.1 mM EDTA, 1 mM DTT)
and dialysed overnight against buffer I. Sample was clarified by spinning at 20000×g / 30 min and
loaded on HiTrap Q HP 5 ml anion exchange column (GE Healthcare Life Sciences). The column was

Results
108
Results
pre-equilibrated in buffer I and the sample was eluted using 0 / 100% gradient of buffer II (20 mM
Tris-HCl pH 7.5, 500 mM KCl, 5 mM MgCl2, 0.1 mM EDTA, 1 mM DTT). Fractions containing eEF2
were pooled together, diluted with buffer I to give a KCl concentration of 30 / 40 mM and loaded
on Heparin 5 ml column (GE Healthcare Life Sciences) pre-equilibrated in buffer I. Protein was eluted
using 0 / 100% gradient of buffer II. Fractions containing eEF2 were pooled, and then by reducing
the volume to 0.3 / 0.5 ml using Amicon Ultra centrifugal filter MWCO 50 kDa (Millipore) Centricons.
These fractions were subsequently applied to a size exclusion chromatography column Superdex
200 10/300, 24 ml, pre-equilibrated with buffer III (20 mM Tris-HCl pH 7.5, 100 mM KCl, 5 mM MgCl2,
1 mM DTT). Pure protein containing fractions were pooled, concentrated using Amicon Ultra 50 kDa
by reducing them to the least possible volume. Final concentrations were around 0.6 / 0.8 mg/ml
(6.8 µM), and total amount around 30-60 µg. These yields are obviously too low for any
crystallization experiments.
Another purification was carried out on a larger scale using 900 × 108 cells. Frozen cells (235
ml of packed cell volume) were washed once in PBS buffer (137 mM NaCl, 2.7 mM KCl, 10 mM
Na2HPO4, 1.8 mM KH2PO4, and re-suspended in 940 ml of re-suspension buffer (50 mM Tric-HCl pH
7.9, 1 mM EDTA, 1 mM DTT, 0.5 mM PMSF). After 30 min on ice, cells were lysed using tissue grinder
0,(1%$223&%4&3(&$%567%!2,'!%89%(,#&3%:4%)';%;20'<%=>(&?%+&'(?,>:!)(,2'%8@99×g / 10 min supernatant
was collected, KCl was adjusted to 250 mM and MgCl2 was adjusted to 10 mM. Cell debris was
removed by centrifugation 25000×g / 60 min, and the ribosome fraction removed by centrifugation
100000×g / 160 min. The supernatant aliquoted, ammonium sulfate powder was added to give 80%
saturation, stirred for 1 hour on ice and then centrifuged at 20000×g / 40 min. Protein containing
pellet was flash frozen in liquid nitrogen and stored at -20 °C. When needed, several aliquots were
dissolved in buffer I and all further steps were identical to small-scale purification with only
difference that due to limited capacity, the HiTrap Q HP 5 ml column was loaded 3 times in a row.
Chromatography protocols, and results are summarized in Figure 35. Final yield was around 2 mg of
pure eEF2 at a concentration of 8 mg/ml that was sufficient to perform some crystallization
experiments.
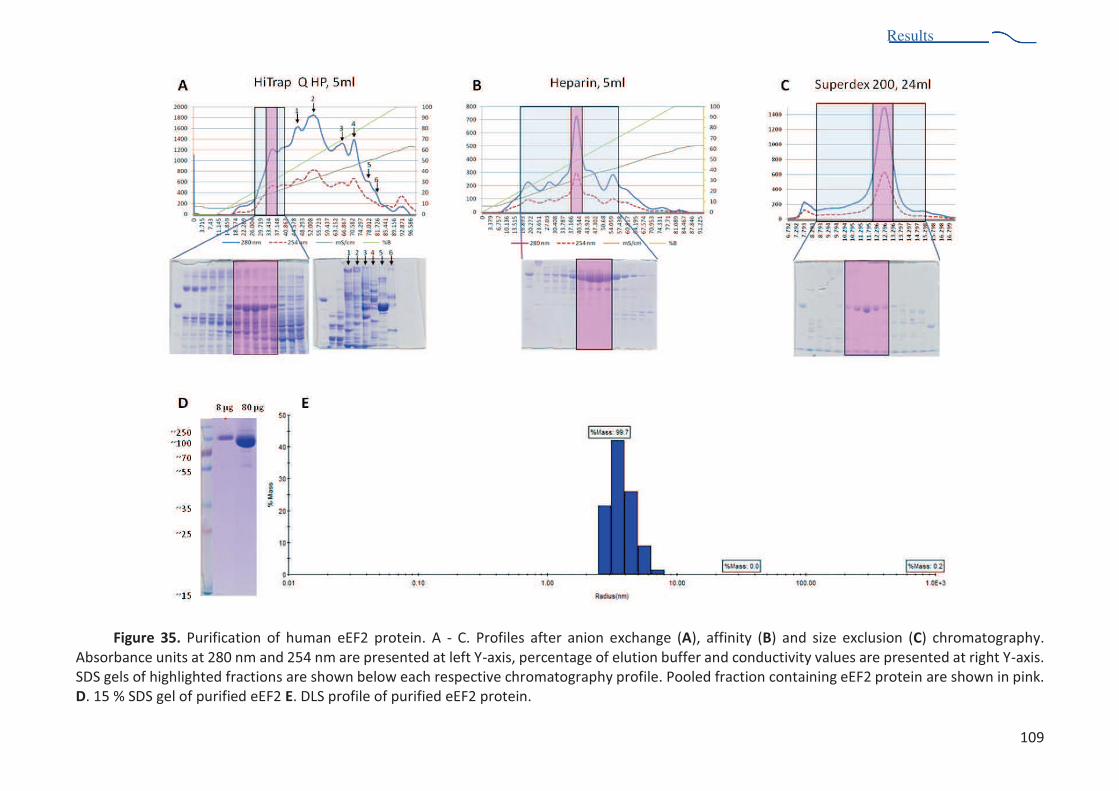
Results
109
Results
Figure 35. Purification of human eEF2 protein. A - C. Profiles after anion exchange (A), affinity (B) and size exclusion (C) chromatography. Absorbance units at 280 nm and 254 nm are presented at left Y-axis, percentage of elution buffer and conductivity values are presented at right Y-axis. SDS gels of highlighted fractions are shown below each respective chromatography profile. Pooled fraction containing eEF2 protein are shown in pink. D. 15 % SDS gel of purified eEF2 E. DLS profile of purified eEF2 protein.
Results
110
Results
Characterization of human eEF2.
SDS-PAGE
One dimentional SDS PAGE was used to evaluate the purity of the protein. Classic Tris-Glycine
buffer was used to perform the experiments (Laemmli, 1970). The optimal amount of protein to
load was 8 µg, which showed exact position of the protein compared to ladder. Overloads wells with
80 µg, revealed the presence of some impurities in the sample.
Purified eEF2 corresponded to the position around 100 kDa and the contamination and
degradation of the protein visually were very minor, less than 5% (Figure 35 D).
Dynamic light scattering (DLS)
DLS is the technique that can be used to determine the size distribution profile of proteins in
solution (Berne and Pecora, 2000). This technique is very useful for detecting the aggregation of
proteins. A light is passed through the sample, all the molecules scatter photons and scatting is
detected. Small particles (single proteins) move very fast in solution and scatter in different
directions within very short period of time, big particles (aggregates) move in solution slower and
scattering does not change quickly. Observing this difference in scattering of the level of sample we
may estimate the dispersity.
Measurements were performed using DynaPro NanoStar instrument (Wyatt Tech. Corp.) with
following parameters: acquisition time / 7 sec, Number of acquisitions / 10, temperature / 25 °C.
The data was analysed by Dynamics V7 software (Wyatt Tech. Corp.). DLS results revealed that
percentage of polydispersity was very low; 99.7% of the eEF2 protein was in monomer form, while
the remained was aggregated. The hydrodynamic radius estimated to be around 5 nm. The
molecular mass was estimated to be around 80 kDa (95.3 kDa theoretical) which is acceptable for
this method, taking in account that the DLS technique is calculating molecular weight by averaging
measurements of hydrodynamic radius of the molecules; hence for elongated proteins as eEF2 this
calculation won't be absolutely reliable. Distribution of the molecules in the solution measured by
DLS is shown in Figure 35 E.
Multi-angle laser light scattering (MALLS)
Size exclusion chromatography (SEC) column coupled with MALLS is a powerful technique to
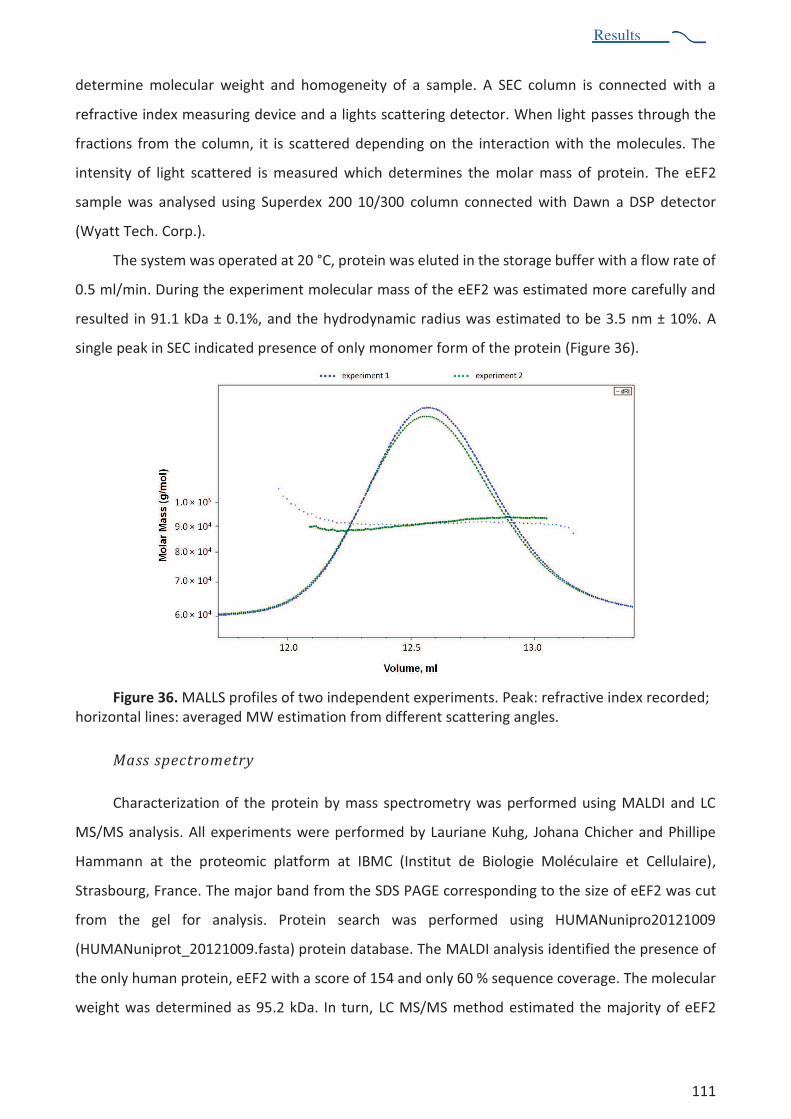
Results
111
Results
determine molecular weight and homogeneity of a sample. A SEC column is connected with a
refractive index measuring device and a lights scattering detector. When light passes through the
fractions from the column, it is scattered depending on the interaction with the molecules. The
intensity of light scattered is measured which determines the molar mass of protein. The eEF2
sample was analysed using Superdex 200 10/300 column connected with Dawn a DSP detector
(Wyatt Tech. Corp.).
The system was operated at 20 °C, protein was eluted in the storage buffer with a flow rate of
0.5 ml/min. During the experiment molecular mass of the eEF2 was estimated more carefully and
resulted in 91.1 kDa ± 0.1%, and the hydrodynamic radius was estimated to be 3.5 nm ± 10%. A
single peak in SEC indicated presence of only monomer form of the protein (Figure 36).
Figure 36. MALLS profiles of two independent experiments. Peak: refractive index recorded; horizontal lines: averaged MW estimation from different scattering angles.
Mass spectrometry
Characterization of the protein by mass spectrometry was performed using MALDI and LC
MS/MS analysis. All experiments were performed by Lauriane Kuhg, Johana Chicher and Phillipe
Hammann at the proteomic platform at IBMC (Institut de Biologie Moléculaire et Cellulaire),
Strasbourg, France. The major band from the SDS PAGE corresponding to the size of eEF2 was cut
from the gel for analysis. Protein search was performed using HUMANunipro20121009
(HUMANuniprot_20121009.fasta) protein database. The MALDI analysis identified the presence of
the only human protein, eEF2 with a score of 154 and only 60 % sequence coverage. The molecular
weight was determined as 95.2 kDa. In turn, LC MS/MS method estimated the majority of eEF2
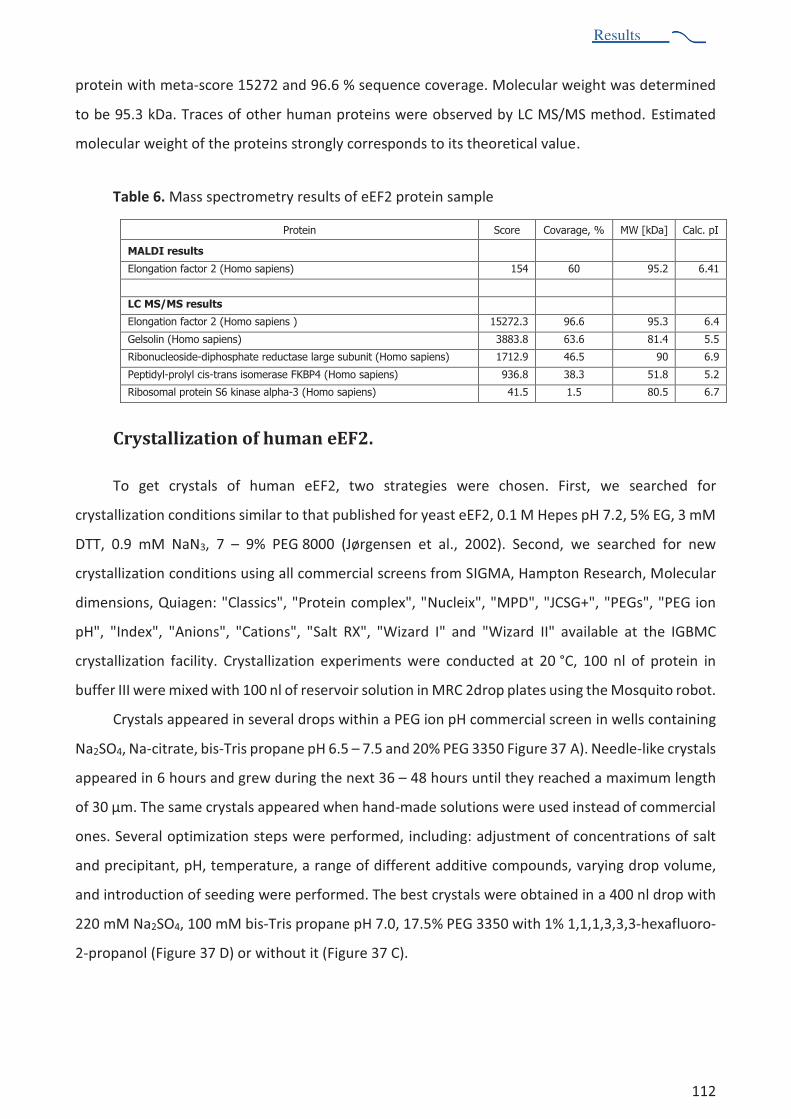
Results
112
Results
protein with meta-score 15272 and 96.6 % sequence coverage. Molecular weight was determined
to be 95.3 kDa. Traces of other human proteins were observed by LC MS/MS method. Estimated
molecular weight of the proteins strongly corresponds to its theoretical value.
Table 6. Mass spectrometry results of eEF2 protein sample
Protein Score Covarage, % MW [kDa] Calc. pI
MALDI results
Elongation factor 2 (Homo sapiens) 154 60 95.2 6.41
LC MS/MS results
Elongation factor 2 (Homo sapiens ) 15272.3 96.6 95.3 6.4
Gelsolin (Homo sapiens) 3883.8 63.6 81.4 5.5
Ribonucleoside-diphosphate reductase large subunit (Homo sapiens) 1712.9 46.5 90 6.9
Peptidyl-prolyl cis-trans isomerase FKBP4 (Homo sapiens) 936.8 38.3 51.8 5.2
Ribosomal protein S6 kinase alpha-3 (Homo sapiens) 41.5 1.5 80.5 6.7
Crystallization of human eEF2.
To get crystals of human eEF2, two strategies were chosen. First, we searched for
crystallization conditions similar to that published for yeast eEF2, 0.1 M Hepes pH 7.2, 5% EG, 3 mM
DTT, 0.9 mM NaN3, 7 / 9% PEG 8000 (Jørgensen et al., 2002). Second, we searched for new
crystallization conditions using all commercial screens from SIGMA, Hampton Research, Molecular
dimensions, Quiagen: "Classics", "Protein complex", "Nucleix", "MPD", "JCSG+", "PEGs", "PEG ion
pH", "Index", "Anions", "Cations", "Salt RX", "Wizard I" and "Wizard II" available at the IGBMC
crystallization facility. Crystallization experiments were conducted at 20 °C, 100 nl of protein in
buffer III were mixed with 100 nl of reservoir solution in MRC 2drop plates using the Mosquito robot.
Crystals appeared in several drops within a PEG ion pH commercial screen in wells containing
Na2SO4, Na-citrate, bis-Tris propane pH 6.5 / 7.5 and 20% PEG 3350 Figure 37 A). Needle-like crystals
appeared in 6 hours and grew during the next 36 / 48 hours until they reached a maximum length
of 30 µm. The same crystals appeared when hand-made solutions were used instead of commercial
ones. Several optimization steps were performed, including: adjustment of concentrations of salt
and precipitant, pH, temperature, a range of different additive compounds, varying drop volume,
and introduction of seeding were performed. The best crystals were obtained in a 400 nl drop with
220 mM Na2SO4, 100 mM bis-Tris propane pH 7.0, 17.5% PEG 3350 with 1% 1,1,1,3,3,3-hexafluoro-
2-propanol (Figure 37 D) or without it (Figure 37 C).
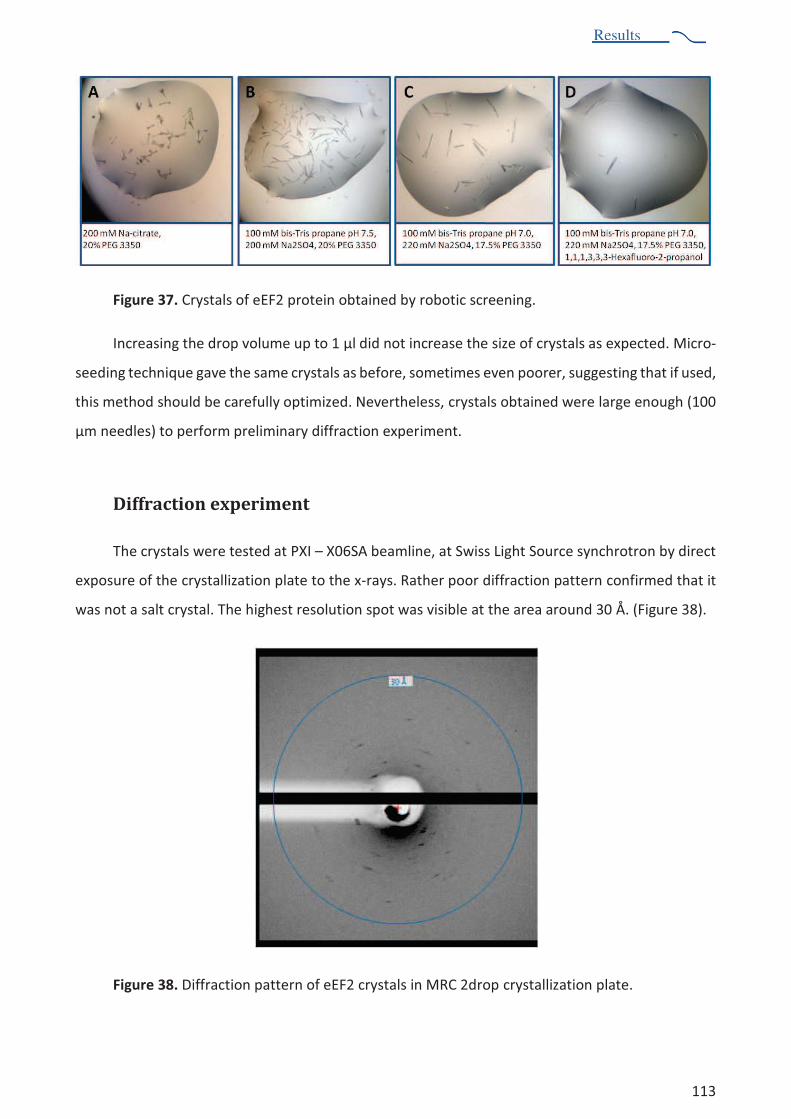
Results
113
Results
Figure 37. Crystals of eEF2 protein obtained by robotic screening.
Increasing the drop volume up to 1 µl did not increase the size of crystals as expected. Micro-
seeding technique gave the same crystals as before, sometimes even poorer, suggesting that if used,
this method should be carefully optimized. Nevertheless, crystals obtained were large enough (100
µm needles) to perform preliminary diffraction experiment.
Diffraction experiment
The crystals were tested at PXI / X06SA beamline, at Swiss Light Source synchrotron by direct
exposure of the crystallization plate to the x-rays. Rather poor diffraction pattern confirmed that it
was not a salt crystal. The highest resolution spot was visible at the area around 30 Å. (Figure 38).
Figure 38. Diffraction pattern of eEF2 crystals in MRC 2drop crystallization plate.
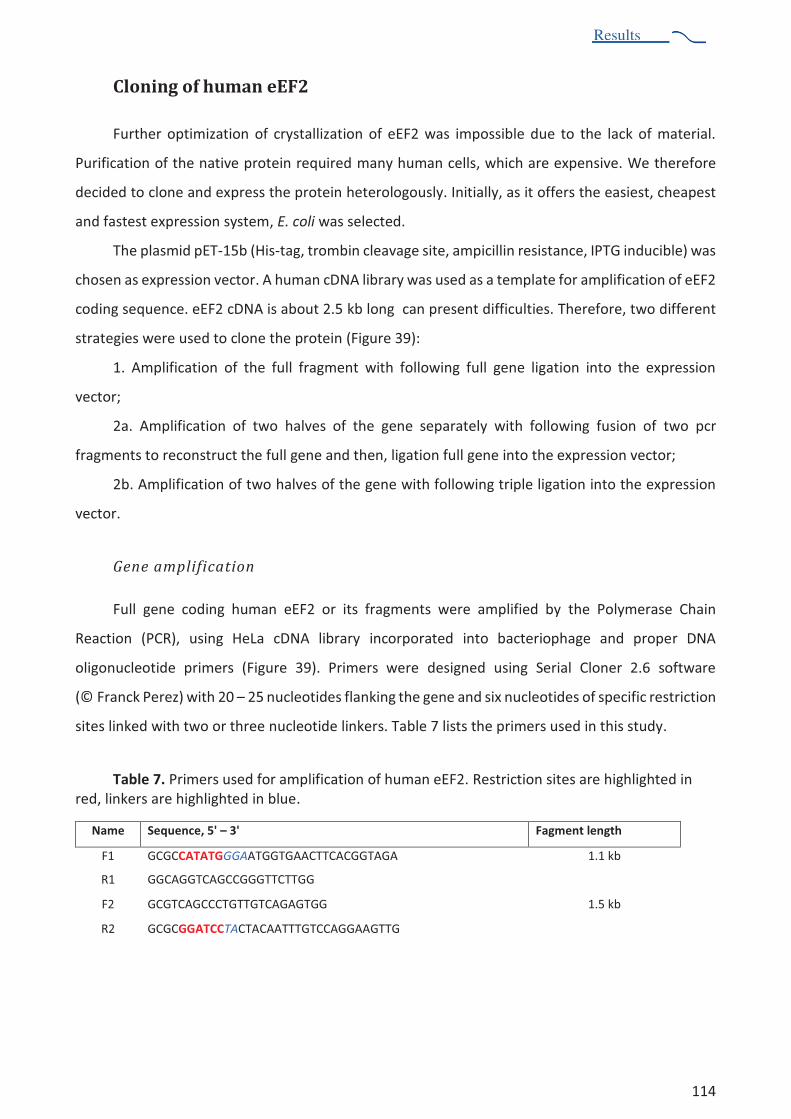
Results
114
Results
Cloning of human eEF2
Further optimization of crystallization of eEF2 was impossible due to the lack of material.
Purification of the native protein required many human cells, which are expensive. We therefore
decided to clone and express the protein heterologously. Initially, as it offers the easiest, cheapest
and fastest expression system, E. coli was selected.
The plasmid pET-15b (His-tag, trombin cleavage site, ampicillin resistance, IPTG inducible) was
chosen as expression vector. A human cDNA library was used as a template for amplification of eEF2
coding sequence. eEF2 cDNA is about 2.5 kb long can present difficulties. Therefore, two different
strategies were used to clone the protein (Figure 39):
1. Amplification of the full fragment with following full gene ligation into the expression
vector;
2a. Amplification of two halves of the gene separately with following fusion of two pcr
fragments to reconstruct the full gene and then, ligation full gene into the expression vector;
2b. Amplification of two halves of the gene with following triple ligation into the expression
vector.
Gene amplification
Full gene coding human eEF2 or its fragments were amplified by the Polymerase Chain
Reaction (PCR), using HeLa cDNA library incorporated into bacteriophage and proper DNA
oligonucleotide primers (Figure 39). Primers were designed using Serial Cloner 2.6 software
(© Franck Perez) with 20 / 25 nucleotides flanking the gene and six nucleotides of specific restriction
sites linked with two or three nucleotide linkers. Table 7 lists the primers used in this study.
Table 7. Primers used for amplification of human eEF2. Restriction sites are highlighted in red, linkers are highlighted in blue.
Name Sequence, 5' 3' Fagment length
F1 GCGCCATATGGGAATGGTGAACTTCACGGTAGA 1.1 kb
R1 GGCAGGTCAGCCGGGTTCTTGG
F2 GCGTCAGCCCTGTTGTCAGAGTGG 1.5 kb
R2 GCGCGGATCCTACTACAATTTGTCCAGGAAGTTG

Results
115
Results
Figure 39. Two strategies of eEF2 cloning experiment.
PCR reactions were prepared as follows, in a final volume of 20 l:
DNA: 1.5 l (HeLa cDNA library) Polymerase buffer: 2 l (10X) dNTP mix: 1 l (2.5 mM stock concentration) Primer forward: 1.25 l (10 M stock) Primer reverse: 1.25 l (10 M stock) Q5 High Fidelity Polymerase: 0.3 l (3.5 U/ l) Polymerase enhancer: 5 l H2O: 8 l
Reactions were carried out in a Thermocycler (Bio-Rad) using the following steps:
1. 95 °C 2:00 minutes
2. 95 °C 0:30 minutes
3. 55 °C 0:30 minutes
4. 72 °C 2:00 (3:00) minutes
5. 72 °C 10:00 minutes
The temperature of annealing (TA; step 3) was optimized according to the melting temperature
and the length of the primers. The elongation time (step 4) was optimised according to the length
amplification fragment since the High Fidelity polymerase can synthesise ~1000 nt per minute. All
35X

Results
116
Results
PCR products were analysed by using a 1% agarose gel (Figure 40 B) prepared in 1X TAE solution (40
mM Tris, 20 mM acetic acid, 1 mM EDTA pH 8.0). Amplification of the full gene of eEF2 straight from
the cDNA library failed. Only a very faint band was visible at the position corresponding to 2.6 kb,
which is the size of full gene of eEF2. Some methods of pcr optimization such as varying the time
and temperature of elongation step of PCR, varying the primer constructs, and changing the
polymerases used were tried. Unfortunately, none of them provided full-length gene amplification.
Therefore, the work was continued using two small fragments only, which could be successfully
amplified. After confirmation of the presence of PCR products with expected size, they were purified
using NucleoSpin® Gel and PCR Clean-up kit (Machery Nagel).
Figure 40. Agarose gel of amplified fragments of eEF2 DNA. A. DNA ladder #0331. B.
Amplification of eEF2 from cDNA library 1 DNA Ladder, 2 amplification of small fragment of eEF2 gene, 3 amplification of big fragment of eEF2 gene 4 amplification of full eEF2 gene. C. Result of PCR fusion reaction. 1 DNA ladder, 2 fragments amplified during fusion of gene fragments. The yellow selection points the fragments that correspond to 1.1 kb fragment, the blue - 1.5 kb fragment of eEF2 gene. The red selection points the position of the full gene.
PCR fusion
An additional PCR reaction was performed to fuse 1.1 and 1.5 kb fragments of the gene to
obtain the full-size gene. First the PCR mixture was prepared without primers and
DNA: 2 !l (1 !l of each purified fragment) Polymerase buffer: 3 !l (10X) dNTP mix: 1 !l (2.5 mM stock concentration) Q5 High Fidelity Polymerase: 0.3 !l (3.5 U/!l) Polymerase enchancer: 6 !l DMSO: 1.5 !l (100%) H2O: 14 !l

Results
117
Results
The reaction was carried out in a Thermocycler (Bio-Rad) using the following protocol:
1. 95 °C 2:00 minutes 2. 95 °C 0:30 minutes 3. 55 °C 0:30 minutes 4. 72 °C 1:30 (3:00) minutes 5. 72 °C 10:00 minutes
The first 10 cycles of reaction were run without primers, to allow the two fragments to anneal
to each other and be extended by polymerase. Later 1 !l of each primer (F1 and R2) was added to
the reaction and 25 more cycles were done with the elongation step prolonged to 3:00 min. Agarose
gel showed that sufficient amount of fragments fused to form a full-length gene (Figure 40 C).
Restriction reaction
Bands corresponding to the fragments of interest were carefully cut and DNA was extracted
using QIAEX II Gel extraction kit (Qiagen). Restriction of the fragments and the vector was performed
in the buffers recommended by manufacturers (New England Biolabs) for particular restriction
enzyme combinations. Restriction of the full gene was performed using BamHI and NdeI incubated
at 37 °C for 2 hours. For triple ligation technique fragments were additionally treated with SfiI
enzyme at 50 °C for 1.5 hours.
Phenol-chloroform extraction of restricted fragments
Upon dephosphorylation of the cleaved vector, all the fragments and vector were purified
using phenol-chloroform extraction method. An equal volume of phenol was added into restriction
reaction mixture, vortexed vigorously and centrifuged at 10000×g / 10 min. An Equal volume of
chloroform:isoamyl alcohol (24:1) mixture was added to upper layer fraction, vortexed vigorously
and centrifuged at 10000×g / 10 min. Ethanol (96%, 2.5 volumes) and 0.1 volume of 3 M sodium
acetate were added to the upper layer, incubated 20 min / 20 °C and centrifuged at 13000×g / 10
min. The pellet was washed with 70% ethanol and dissolved in a minimal volume of water.
Ligation of DNA fragments with the vector
The eEF2 gene and vector, both carrying sticky ends, were mixed in different ratios and
incubated overnight at 16 °C together with DNA-ligase buffer and enzyme. The reaction with vector
alone was used as a control for possibility of self-ligation.
Transformation of competent cells and control digestion of the plasmid .
10X (+ 25X)

Results
118
Results
The products of the ligation reactions were then used for transformation of competent E. coli
DH5" cells. For each transformation, 100 !l of cells were incubated on ice with 10 20 !l of the
cloning reaction for 5 minutes. A heat shock of 45 s at 42 °C was used for relaxing the cell membrane
and allowing the vector to enter. Cells were placed for 5 min on ice and then supplemented with 1
ml !l of 2x LB medium (2% Bacto-tryptone, 1.5% yeast extract, 2 % NaCl, pH 7.0) and incubated for
1 hr at 37 °C. All the cells were subsequently plated on LB-agar plates with the appropriate selective
antibiotic (in this specific case, ampicillin at 0.1 mg/ml) to allow for selection of recombinant clones.
The plates were incubated at 37 °C for at least 12 18 hours until single colonies became visible.
The result of transformation was quite encouraging control plates had 50 200 times less
colonies than experimental plates. It means that the level of self-ligation was relatively low. Several
randomly picked colonies were tested for the presence of the gene of interest.
Detection of the insertion of the gene
The first method we used to check for the presence of the insert was the so called colony PCR.
Single colonies were transferred to 100 !l of liquid LB medium and grew for 2 hours at 37 °C with
shaking. To check the presence of the insertion in the vector we used these cells as the DNA
template for the PCR reaction with primers F1 and R1 (Table 7). After 35 cycles of amplification, the
reaction mix was subjected to agarose gel analysis.
Another method we used to detect gene insertion was digestion with restriction enzymes.
Single colonies were transferred to 1 ml of liquid LB medium containing 0.1 mg/ml ampicillin and
grown for 14 hours at 37 °C with shaking. Plasmids were purified using NucleoSpin® Plasmid kit
(Machery Nagel), treated with SfiI enzyme alone or BamHI + NdeI enzymes together. After
incubation, the reaction mix was subjected to agarose gel analysis.
Unfortunately, none of the colonies showed the presence of the gene insertion (gels not
shown).

Results
119
Results
RESEARCH PROJECT 2: SUMMARY
Following results were obtained for the project of purification and crystallization of eEF2
protein:
The protocol of purification of native eEF2 protein from HeLa cells was established.
The purity and homogeneity of the protein was proved by different biochemical and
biophysical methods proved their purity, stability and homogeneity.
First needle-like crystals of human native eEF2 protein were obtained. Crystals were
reproducible, although required some optimization.
The diffraction analysis of these crystals at the synchrotron proved them to be protein
crystals. However, the quality of the diffraction was not enough to collect the data.
As the part of recombinant eEF2 protein production work, the coding sequence of the
eEF2 gene was successfully amplified, but not yet sub-cloned into bacterial expression
vector.

Discussion

Discussion
121
Discussion
DISCUSSION
Protein biosynthesis is a fundamental process found in every living cell, and it participates in
the decoding of genetic information. While this process in general is highly conserved, ribosome
composition and biogenesis, and the regulation of protein synthesis have evolved many adaptations
and specializations within the various domains of living organisms. For example, the Gram-positive
mesophilic pathogenic bacteria Staphylococcus aureus has specifics of translational machinery that
differ in some respects to other bacteria that are Gram-negative, thermophilic and non-pathogenic.
The ribosome of S. aureus is structurally different from the ribosome of Gram-negative
bacteria such as Escherichia coli or Thermus thermophilus. By comparative analysis of 3D structures
of these bacteria several differences were found in their rRNA organisation. Results implied the
presence of short extensions in the helixes of 16S and 23S rRNA (Figure 34). All these extensions are
located on the periphery of the ribosome, and their exact role in translation is yet unclear.
Interestingly, most of them are consistent with expansion segments of B. subtilis rRNA and, to some
extent, with the yeast ribosome (see Figure 41). From the evolutionary standpoint, it is uncertain
whether Gram-negative or Gram-positive bacteria evolved first (see for review Koch, 2003). The
divergence in secondary and tertiary structure of rRNA discussed here may support the theory that
Gram-positive bacteria appeared after Gram-negative forms. This conclusion is consistent with
classifications of the bacteria based on the sequence of the 16S rRNA coding genes (Woese, 1987).
Another important detail observed in the S. aureus ribosome structure is the absence of
ribosomal proteins S1 and L9. Protein S1 is the largest and the most acidic ribosomal protein, and
its role is to facilitate the accommodation of mRNA on the 30S subunit during the initiation of
translation in bacteria. It is present in the cell in a non-stoichiometric ratio to the ribosomes, with
approximately one protein occurring per seven ribosomes (Kurland et al., 1969). Protein S1 from
E. coli or T. thermophilus consists of around 550 amino acids folded into six domains, and it binds to
the ribosome relatively weakly. For example, S1 was not found in the crystal structures of
T. thermophilus ribosome (Yusupov et al., 2001), but was present in sub-stoichiometric ratio in the
sample of small 30S ribosomal subunit from T. thermophilus which was used for crystallization
(Trakhanov et al., 1987), thus the sample of 30S was intentionally purified from S1 prior
crystallization (Clemons et al., 2001). Protein S1 from S. aureus consists of 391 amino acids folded
into 4 domains and it does not bind to the ribosome. The mechanism of the interaction of the S1
protein with the ribosome in S. aureus remains elusive.
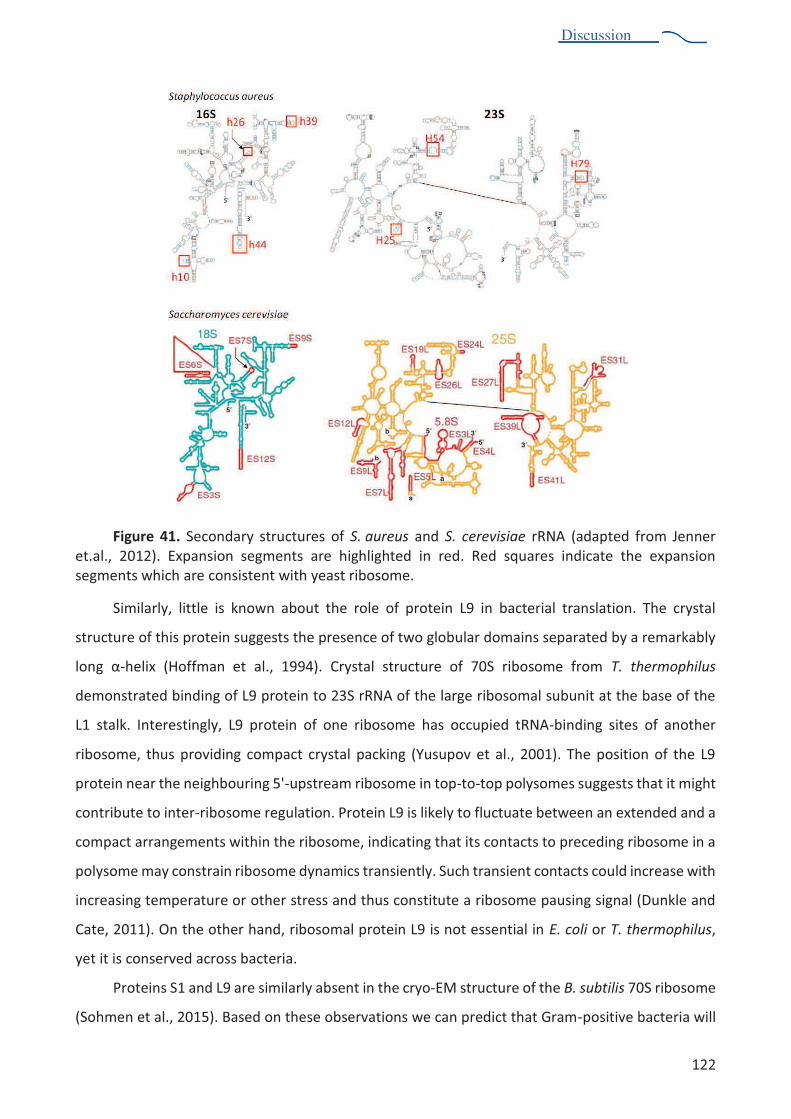
Discussion
122
Discussion
Figure 41. Secondary structures of S. aureus and S. cerevisiae rRNA (adapted from Jenner et.al., 2012). Expansion segments are highlighted in red. Red squares indicate the expansion segments which are consistent with yeast ribosome.
Similarly, little is known about the role of protein L9 in bacterial translation. The crystal
structure of this protein suggests the presence of two globular domains separated by a remarkably
#$%&' "-helix (Hoffman et al., 1994). Crystal structure of 70S ribosome from T. thermophilus
demonstrated binding of L9 protein to 23S rRNA of the large ribosomal subunit at the base of the
L1 stalk. Interestingly, L9 protein of one ribosome has occupied tRNA-binding sites of another
ribosome, thus providing compact crystal packing (Yusupov et al., 2001). The position of the L9
protein near the neighbouring 5'-upstream ribosome in top-to-top polysomes suggests that it might
contribute to inter-ribosome regulation. Protein L9 is likely to fluctuate between an extended and a
compact arrangements within the ribosome, indicating that its contacts to preceding ribosome in a
polysome may constrain ribosome dynamics transiently. Such transient contacts could increase with
increasing temperature or other stress and thus constitute a ribosome pausing signal (Dunkle and
Cate, 2011). On the other hand, ribosomal protein L9 is not essential in E. coli or T. thermophilus,
yet it is conserved across bacteria.
Proteins S1 and L9 are similarly absent in the cryo-EM structure of the B. subtilis 70S ribosome
(Sohmen et al., 2015). Based on these observations we can predict that Gram-positive bacteria will
Discussion
123
Discussion
be found to display distinctive features in the initiation steps of protein synthesis and in their
polysome organization.
The resistance of a bacterium to antimicrobial compounds is based on its specialization
(predator, mutualist, pathogen, etc). In pathogens, which often come to contact with antibacterial
compounds, certain modifications of the ribosome (predominantly methylation of nucleotides in
the antibiotic binding sites) may provide the resistance to antibiotics. Methylation is performed by
specific enzymes, the methyltransferases, and these are often encoded by mobile genetic elements
and therefore can be rapidly transferred from one cell to another. Our work on the structure of the
ribosome from S. aureus aimed to provide structural information on the modifications that
determine its resistance to most of commonly used ribosome-binding antibiotics. Current structure
obtained by cryo-EM at 3.9 Å do not permit to distinguish modifications of rRNA, therefore further
improvements in structure determination are required. Understanding the structural aspects of
resistance will provide new perspectives for modifying existing or creating the new anti-
staphylococcal compounds.
The natural environment of bacteria may influence the composition of the ribosomes, e.g. the
G+C content of the rRNA. For most mesophilic bacteria, including S. aureus it is around 50%, which
is relatively low in comparison with thermophilic organisms. The corresponding value for
T. thermophilus is 64% and for B. streathermophilus it is 60%. A high G+C stabilizes the ribosome
under extreme temperatures.
The natural habitat may also determine the ways bacteria regulate the protein synthesis.
Bacteria often have to cope with various stresses; therefore, they have evolved various mechanisms
of surviving under stress. These mechanisms include the formation of spores, dormant cells or
persistent cells. S. aureus is known to form persistent cells, which are characterized by significantly
decreased metabolic activity, energy consumption and sensitivity to antibiotics. Persistence is
accompanied by alterations in ribosomal profile of the cells. It has been observed that when bacteria
are stressed most but not all of the ribosomes form inactive dimers, also called 100S ribosomes.
These 100S particles are thought to represent a protection and/or storage state, a phenomenon
referred to as ribosome hibernation (Yoshida et al., 2002). Dimerization of ribosomes is reversible
process which occurs upon binding of a small protein called the hibernation promoting factor (HPF).
When bacteria are transferred to favourable ($%)*+*$%,-' +./'012')*,,$(*3+/,-' 3%)' +./' 45/,(6/)7'
ribosomes participate in translation. Such a defence mechanism provides a rapid response to a
change in environmental conditions (reviewed in Starosta et al., 2014).
Many bacteria have been found to form ribosome dimers, although the number of proteins
Discussion
124
Discussion
involved may vary. Some bacteria (such as E. coli, P. carotovorum, S. typhimurium and
K. pneumonia) express three different proteins: YfiA, RMF (ribosome modulation factor) and short
HPF. Cooperative binding of RMF and short HPF proteins to the ribosomes leads to their
dimerization, whereas binding of YfiA inhibits ribosome activity without dimerization. The other
group of bacteria including S. aureus, T. thermophilus, L. acidophilus carry only one protein, long
HPF. The long HPF protein combines the properties of all three proteins. It can dimerize ribosomes,
thus behaving as the combination of short HPF + RMF; or, it may block translation without
dimerization, thus behaving as the YfiA protein. There are no obvious criteria that delimit these two
groups of bacteria. Each group includes Gram-positive and Gram-negative, thermophilic and
mesophilic, pathogenic and non-pathogenic bacteria.
Recent structure of T. thermophilus 70S ribosome in complex with RMF and short HPF proteins
from E. coli visualized the binding sites of two proteins and revealed conformational
rearrangements of the head of 30S ribosomal subunit, which facilitate the dimerization of two
ribosomes; and ribosome dimers were modelled (Polikanov et al., 2012). However, the structure of
real ribosomal dimers is still missing.
Bacteria are known to form ribosome dimers upon transition to the stationary growth phase
when the nutrients are limited. Unlike other bacteria, S. aureus was shown to keep part of its
ribosomes in the dimerized form even during the exponential growth phase (Ueta et al., 2009). The
peak of 100S ribosomes observed in sucrose density gradients during purification of S. aureus
ribosomes in this study might be related to this phenomenon. Moreover, these dimers can
withstand thorough pelleting through the high salt (0.5 M KCl) sucrose cushion, indicating that they
have high stability and rigidity, and hence, they may be important in the physiology of S. aureus.
Perspectives
125
Perspspspspspectives
PERSPECTIVES
The work described in this thesis was the first step in the context of future development of
drugs against Staphylococcus aureus. Obtained structure of S. aureus ribosome is the first high-
resolution ribosome structure from pathogenic bacteria obtained using cryo-EM. The modelling step
is not performed yet, therefore it is not included in this thesis manuscript. Obtained model of
S. aureus vacant ribosome will be used later on for solving structures of this ribosome in complex
with different ligands. No structures of bacterial ribosome dimers containing long hibernation
promoting factor (HPF) are known so far. One of the goal of our laboratory is to solve the structure
of S. aureus ribosome dimers in complex with long HPF protein from S. aureus, also referred to as
hibernating ribosomes. The structure will shed light on the organization of dimers and increase our
knowledge about translation regulation in pathogenic bacteria.
All the results obtained in this work will help to describe Staphylococcus aureus ribosome and
its functional complexes at the atomic level in the nearest future. The combination of methods of
X-ray crystallography and cryo-electron microscopy will help to achieve this aim. Obtained results
will provide a foundation for the development of new compounds against this pathogenic and
extremely resistant bacterium.
References
126
References
REFERENCES
Adrian, M., Dubochet, J., Lepault, J., and McDowall, A.W. (1984). Cryo-electron microscopy of
viruses. Nature 308, 32 36.
Agirrezabala, X., and Frank, J. (2010). From DNA to proteins via the ribosome: Structural
insights into the workings of the translation machinery. Hum. Genomics 4, 226.
**Agirrezabala, X., Lei, J., Brunelle, J.L., Ortiz-Meoz, R.F., Green, R., and Frank, J. (2008).
Visualization of the Hybrid State of tRNA Binding Promoted by Spontaneous Ratcheting of the
Ribosome. Mol. Cell 32, 190 197.
**Agirrezabala, X., Liao, H.Y., Schreiner, E., Fu, J., Ortiz-Meoz, R.F., Schulten, K., Green, R., and
Frank, J. (2012). Structural characterization of mRNA-tRNA translocation intermediates. Proc. Natl.
Acad. Sci. 109, 6094 6099.
Agrawal, R.K., and Sharma, M.R. (2012). Structural aspects of mitochondrial translational
apparatus. Curr. Opin. Struct. Biol. 22, 797 803.
Aldred, K.J., Kerns, R.J., and Osheroff, N. (2014). Mechanism of quinolone action and
resistance. Biochemistry 53, 1565 1574.
**Amunts, A., Brown, A., Bai, X. -c., Llacer, J.L., Hussain, T., Emsley, P., Long, F., Murshudov,
G., Scheres, S.H.W., and Ramakrishnan, V. (2014). Structure of the yeast mitochondrial large
ribosomal subunit. Science (80-. ). 343, 1485 1489.
**Amunts, A., Brown, A., Toots, J., Scheres, S.H.W., and Ramakrishnan, V. (2015). The
structure of the human mitochondrial ribosome. Sci. 348 , 95 98.
Andriole, V.T. (2000). The quinolones (Academic Press).
Anger, A.M., Armache, J.-P., Berninghausen, O., Habeck, M., Subklewe, M., Wilson, D.N., and
Beckmann, R. (2013). Structures of the human and Drosophila 80S ribosome. Nature 497, 80 85.
Armache, J.-P., Jarasch, A., Anger, A.M., Villa, E., Becker, T., Bhushan, S., Jossinet, F., Habeck,
M., Dindar, G., Franckenberg, S., et al. (2010). Cryo-EM structure and rRNA model of a translating
eukaryotic 80S ribosome at 5.5-A resolution. Proc. Natl. Acad. Sci. U. S. A. 107, 19748 19753.
Asherie, N. (2004). Protein crystallization and phase diagrams. Methods 34, 266 272.
Bai, X.C., Fernandez, I.S., McMullan, G., and Scheres, S.H.W. (2013). Ribosome structures to
near-atomic resolution from thirty thousand cryo-EM particles. Elife 2013.
Baker, L.A., and Rubinstein, J.L. (2010). Radiation damage in electron cryomicroscopy.
Ban, N. (2000). The complete atomic structure of the large ribosomal subunit at 2.4 Å
References
127
References
resolution. Science (80-. ). 289, 905 920.
Baragaña, B., Hallyburton, I., Lee, M.C.S., Norcross, N.R., Grimaldi, R., Otto, T.D., Proto, W.R.,
Blagborough, A.M., Meister, S., and Wirjanata, G. (2015). A novel multiple-stage antimalarial agent
that inhibits protein synthesis. Nature 522, 315 320.
Bartesaghi, A., Merk, A., Banerjee, S., Matthies, D., Wu, X., Milne, J.L.S., and Subramaniam, S.
(2015). 2.2 Å resolution cryo-89' ,+56(+65/' $:' ;-galactosidase in complex with a cell-permeant
inhibitor. Sci. 348 , 1147 1151.
Becker, K., Harmsen, D., Mellmann, A., Meier, C., Schumann, P., Peters, G., and Von Eiff, C.
(2004). Development and evaluation of a quality-controlled ribosomal sequence database for 16S
ribosomal DNA-based identification of Staphylococcus species. J. Clin. Microbiol. 42, 4988 4995.
**Behrmann, E., Loerke, J., Budkevich, T.V., Yamamoto, K., Schmidt, A., Penczek, P.A., Vos,
M.R., Bürger, J., Mielke, T., Scheerer, P., et al. (2015). structural snapshots of actively translating
human ribosomes. Cell 161, 845 857.
Benito, Y., Kolb, F.A., Romby, P., Lina, G., Etienne, J., and Vandenesch, F. (2000). Probing the
structure of RNAIII, the Staphylococcus aureus agr regulatory RNA, and identification of the RNA
domain involved in repression of protein A expression. RNA 6, 668 679.
Ben-Shem, A., Garreau de Loubresse, N., Melnikov, S., Jenner, L., Yusupova, G., and Yusupov,
M. (2011). The Structure of the Eukaryotic Ribosome at 3.0 A Resolution. Science (80-. ). 334, 1524
1529.
Bera, A., Herbert, S., Jakob, A., Vollmer, W., and Götz, F. (2005). Why are pathogenic
staphylococci so lysozyme resistant? The peptidoglycan O-acetyltransferase OatA is the major
determinant for lysozyme resistance of Staphylococcus aureus. Mol. Microbiol. 55, 778 787.
Berne, B.J., and Pecora, R. (2000). Dynamic light scattering: with applications to chemistry,
biology, and physics (Courier Corporation).
Binshtein, E., and Ohi, M.D. (2015). Cryo-electron microscopy and the amazing race to atomic
resolution. biochemistry 54, 3133 3141.
*Blaha, G., Stanley, R.E., and Steitz, T.A. (2009). Formation of the first peptide bond: the
structure of EF-P bound to the 70S ribosome. Science 325, 966 970.
Blaha, G.M., Polikanov, Y.S., and Steitz, T.A. (2012). Elements of ribosomal drug resistance and
specificity. Curr. Opin. Struct. Biol. 22, 750 758.
Blow, D. (2002). Outline of crystallography for biologists (Oxford University Press).
Blundell, T.L., Cutfield, J.F., Cutfield, S.M., Dodson, E.J., Dodson, G.G., Hodgkin, D.C., Mercola,
D.A., and Vijayan, M. (1971). Atomic positions in rhombohedral 2-zinc insulin crystals. Nature 231,
References
128
References
506 511.
Bodley, J.W., Zieve, F.J., Lin, L., and Zieve, S.T. (1969). Formation of the ribosome-G factor-GDP
complex in the presence of fusidic acid. Biochem. Biophys. Res. Commun. 37, 437 443.
Bondi, A., and Dietz, C.C. (1945). Penicillin Resistant Staphylococci. Exp. Biol. Med. 60 , 55 58.
Brilot, A.F., Chen, J.Z., Cheng, A., Pan, J., Harrison, S.C., Potter, C.S., Carragher, B., Henderson,
R., and Grigorieff, N. (2012). Beam-induced motion of vitrified specimen on holey carbon film. J.
Struct. Biol. 177, 630 637.
**Brilot, A.F., Korostelev, A.A., Ermolenko, D.N., and Grigorieff, N. (2013). Structure of the
ribosome with elongation factor G trapped in the pretranslocation state. Proc. Natl. Acad. Sci. U. S.
A. 110, 20994 20999.
Brodersen, D.E., Clemons, W.M., Carter, A.P., Morgan-Warren, R.J., Wimberly, B.T., and
Ramakrishnan, V. (2000). The structural basis for the action of the antibiotics tetracycline,
pactamycin, and hygromycin B, on the 30S ribosomal subunit. Cell 103, 1143 1154.
Bronner, S., Monteil, H., and Prévost, G. (2004). Regulation of virulence determinants in
Staphylococcus aureus: Complexity and applications. FEMS Microbiol. Rev. 28, 183 200.
**Brown, A., Amunts, A., Bai, X., Sugimoto, Y., Edwards, P.C., Murshudov, G., Scheres, S.H.W.,
and Ramakrishnan, V. (2014). Structure of the large ribosomal subunit from human mitochondria.
Sci. 346, 718 722.
**Budkevich, T., Giesebrecht, J., Altman, R.B., Munro, J.B., Mielke, T., Nierhaus, K.H.,
Blanchard, S.C., and Spahn, C.M.T. (2011). Structure and dynamics of the mammalian ribosomal
pretranslocation complex. Mol. Cell 44, 214 224.
**Budkevich, T. V., Giesebrecht, J., Behrmann, E., Loerke, J., Ramrath, D.J.F., Mielke, T., Ismer,
J., Hildebrand, P.W., Tung, C.S., Nierhaus, K.H., et al. (2014). Regulation of the mammalian
elongation cycle by subunit rolling: A eukaryotic-specific ribosome rearrangement. Cell 158, 121
131.
Calvori C, Frontali L, Leoni L, T.G. (1965). Effect of rifamycin on protein synthesis. Nature 207,
417 418.
Campbell, M.G., Cheng, A., Brilot, A.F., Moeller, A., Lyumkis, D., Veesler, D., Pan, J., Harrison,
S.C., Potter, C.S., Carragher, B., et al. (2012). Movies of ice-embedded particles enhance resolution
in electron cryo-microscopy. Structure 20, 1823 1828.
<3%%$%/-'=>=>-'?6@53A3%*3%-'?>-'?(.%35/-'9>B>-'<$##/++-'=>C>-'DE?$6F3-'G>9>-'D6-'H>-'2/%&-'I>-'G*%-'
N., Madabusi, L. V, and Müller, K.M. (2002). The comparative RNA web (CRW) site: an online
database of comparative sequence and structure information for ribosomal, intron, and other RNAs.
References
129
References
BMC Bioinformatics 3, 2.
Chambers, H.F. (1997). Methicillin resistance in staphylococci: molecular and biochemical
basis and clinical implications. Clin. Microbiol. Rev. 10, 781 791.
Chan, P.F., and Foster, S.J. (1998). Role of SarA in virulence determinant production and
environmental signal transduction in Staphylococcus aureus. J. Bacteriol. 180, 6232 6241.
Chayen, N.E., Stewart, P.D.S., and Blow, D.M. (1992). Microbatch crystallization under oilJa
new technique allowing many small-volume crystallization trials. J. Cryst. Growth 122, 176 180.
Chen, C.M., and Behringer, R.R. (2004). Ovca1 regulates cell proliferation, embryonic
development, and tumorigenesis. Genes Dev. 18, 320 332.
Chen, J.Y.C., and Bodley, J.W. (1988). Biosynthesis of diphthamide in Saccharomyces
cerevisiae. Partial purification and characterization of a specific S-adenosylmethionine:elongation
factor 2 methyltransferase. J. Biol. Chem. 263, 11692 11696.
Chen, C., Tang, J., Dong, W., Wang, C., Feng, Y., Wang, J., Zheng, F., Pan, X., Liu, D., Li, M., et
al. (2007). A glimpse of streptococcal toxic shock syndrome from comparative genomics of S. suis 2
chinese isolates. PLoS One 2, e315.
Chen, Y., Feng, S., Kumar, V., Ero, R., and Gao, Y.-G. (2013). Structure of EF-G-ribosome
complex in a pretranslocation state. Nat. Struct. Mol. Biol. 20, 1077 1084.
Cheng, Y., Grigorieff, N., Penczek, P.A., and Walz, T. (2015). A primer to single-particle cryo-
electron microscopy. Cell 161, 438 449.
Cheung, A.L., Koomey, J.M., Butler, C.A., Projan, S.J., and Fischetti, V.A. (1992). Regulation of
exoprotein expression in Staphylococcus aureus by a locus (sar) distinct from agr. Proc. Natl. Acad.
Sci. U. S. A. 89, 6462 6466.
Cheung, A.L., Eberhardt, K.J., Chung, E., Yeaman, M.R., Sullam, P.M., Ramos, M., and Bayer,
A.S. (1994). Diminished virulence of a sar-lagr- mutant of Staphylococcus aureus in the rabbit model
of endocarditis. J. Clin. Invest. 94, 1815 1822.
Chevalier, C. (2009). Function and mechanism of action of RNAIII and new ncRNAs in
Staphylococcus aureus (Doctoral thesis, University of Strasbourg, Strasbourg, France). Retrieved
from: http://scd-theses.u-strasbg.fr/1714/
Cimolai, N. (2008). MRSA and the environment: Implications for comprehensive control
measures. Eur. J. Clin. Microbiol. Infect. Dis. 27, 481 493.
Clemons, W.M., Brodersen, D.E., McCutcheon, J.P., May, J.L.C., Carter, A.P., Morgan-Warren,
R.J., Wimberly, B.T., and Ramakrishnan, V. (2001). Crystal structure of the 30 S ribosomal subunit
from Thermus thermophilus: purification, crystallization and structure determination. J. Mol. Biol.
References
130
References
310, 827 843.
Cole, A.M., Tahk, S., Oren, A., Yoshioka, D., Kim, Y.H., Park, A., and Ganz, T. (2001).
Determinants of Staphylococcus aureus nasal carriage. Clin. Diagn. Lab. Immunol. 8, 1064 1069.
*Colussi, T.M., Costantino, D.A., Zhu, J., Donohue, J.P., Korostelev, A.A., Jaafar, Z.A., Plank, T.-
D.M., Noller, H.F., and Kieft, J.S. (2015). Initiation of translation in bacteria by a structured eukaryotic
IRES RNA. Nature 519, 110 113.
Cosgrove, S.E., Sakoulas, G., Perencevich, E.N., Schwaber, M.J., Karchmer, A.W., and Carmeli,
Y. (2003). Comparison of mortality associated with methicillin-resistant and methicillin-susceptible
Staphylococcus aureus bacteremia: a meta-analysis. Clin. Infect. Dis. 36, 53 59.
Crossley, K.B., Archer, G., Jefferson, K., and Fowler, V. (2009). Staphylococci in human disease
(Wiley Online Library).
Crowfoot, D., Bunn, C.W., Rogers-Low, B.W., and Turner-Jones, A. (1949). The chemistry of
penicillin. Princet. Univ. Press, New Jersey.
Cruz, J.W., Rothenbacher, F.P., Maehigashi, T., Lane, W.S., Dunham, C.M., and Woychik, N.A.
(2014). Doc toxin is a kinase that inactivates elongation factor Tu. J. Biol. Chem. 289, 7788 7798.
Czworkowski, J., Wang, J., Steitz, T.A., and Moore, P.B. (1994). The crystal structure of
elongation factor G complexed with GDP, at 2.7 A resolution. EMBO J. 13, 3661 3668.
DEK5(L-'K>-'8#A$5/-'<>-'?+*.#/-'9., and Johnston, J.E. (1996). A novel approach to crystallising
proteins under oil. J. Cryst. Growth 168, 175 180.
David, M.D., Kearns, A.M., Gossain, S., Ganner, M., and Holmes, A. (2006). Community-
associated meticillin-resistant Staphylococcus aureus: nosocomial transmission in a neonatal unit.
*Demeshkina, N., Jenner, L., Westhof, E., Yusupov, M., and Yusupova, G. (2012). A new
understanding of the decoding principle on the ribosome. Nature 484, 256 259.
Deora, R., and Misra, T.K. (1996). Characterization of the primary sigma factor of
Staphylococcus aureus. J Biol Chem 271, 21828 21834.
Deora, R., Tseng, T., and Misra, T.K. (1997). Alternative transcription factor sigmaSB of
Staphylococcus aureus: characterization and role in transcription of the global regulatory locus sar.
J. Bacteriol. 179, 6355 6359.
Dubochet, J., Lepault, J., Freeman, R., Berriman, J.A., and Homo, J.-C. (1982). Electron
microscopy of frozen water and aqueous solutions. J. Microsc. 128, 219 237.
Dunkle, J., and Cate, J.D. (2011). The packing of ribosomes in crystals and polysomes. In
Ribosomes SE - 6, M. Rodnina, W. Wintermeyer, and R. Green, eds. (Springer Vienna), pp. 65 73.
Eisenstein, B.E. (2008). Treatment challenges in the management of complicated skin and soft-
References
131
References
tissue infections. In Clinical Microbiology and Infection, pp. 17 25.
Faruqi, A.R., and McMullan, G. (2011). Electronic detectors for electron microscopy. Q. Rev.
Biophys. 44, 357 390.
**Fernández, I.S., Bai, X.-C., Hussain, T., Kelley, A.C., Lorsch, J.R., Ramakrishnan, V., and
Scheres, S.H.W. (2013). Molecular architecture of a eukaryotic translational initiation complex.
Science 342, 1240585.
**Fernández, I.S., Bai, X.C., Murshudov, G., Scheres, S.H.W., and Ramakrishnan, V. (2014).
Initiation of translation by cricket paralysis virus IRES requires its translocation in the ribosome. Cell
157, 823 831.
Fiaux, J., Bertelsen, E.B., Horwich, A.L., and Wüthrich, K. (2002). NMR analysis of a 900K GroEL
GroES complex. Nature 418, 207 211.
Fischer, N., Neumann, P., Konevega, A.L., Bock, L. V, Ficner, R., Rodnina, M. V, and Stark, H.
(2015). Structure of the E. coli ribosome-EF-Tu complex at <3 A resolution by Cs-corrected cryo-EM.
Nature 520, 567 570.
Fleming, A. (1929). On the Antibacterial Action of Cultures of a Penicillium, with Special
Reference to their Use in the Isolation of B. influenzæ. Br. J. Exp. Pathol. 10, 226 236.
2$,+/5-'M>-'NEC/*##L-'9>-'3%)'I53A#/L-'K>=>' OPQQRS>'T/%/+*(' studies of Staphylococcus aureus
virulence factors. in pathogenesis of wound and biomaterial-associated infections SE - 4, T.
Wadström, I. Eliasson, I. Holder, and Å. Ljungh, eds. (Springer London), pp. 35 46.
Frank, J. (2006). Three-dimensional electron microscopy of macromolecular assemblies:
visualization of biological molecules in their native state (Oxford University Press).
Fridkin, S.K., Hageman, J.C., Morrison, M., Sanza, L.T., Como-Sabetti, K., Jernigan, J.A.,
Harriman, K., Harrison, L.H., Lynfield, R., and Farley, M.M. (2005). Methicillin-resistant
Staphylococcus aureus disease in three communities. N. Engl. J. Med. 352, 1436 1444.
Gabashvili, I.S., Agrawal, R.K., Spahn, C.M., Grassucci, R.A., Svergun, D.I., Frank, J., and
Penczek, P. (2000). Solution structure of the E. coli 70S ribosome at 11.5 A resolution. Cell 100, 537
549.
*Gagnon, M.G., Seetharaman, S. V., Bulkley, D., and Steitz, T.A. (2012). structural basis for the
rescue of stalled ribosomes: structure of YaeJ bound to the ribosome. Science (80-. ). 335, 1370
1372.
*Gagnon, M.G., Lin, J., Bulkley, D., and Steitz, T. a. (2014). Crystal structure of elongation factor
4 bound to a clockwise ratcheted ribosome. Science (80-. ). 345, 684 687.
Gao, Y.-G., Selmer, M., Dunham, C.M., Weixlbaumer, A., Kelley, A.C., and Ramakrishnan, V.
References
132
References
(2009). The structure of the ribosome with elongation factor G trapped in the posttranslocational
state. Science 326, 694 699.
García-Ruiz, J.M. (2003). Counterdiffusion methods for macromolecular crystallization.
Methods Enzymol. 368, 130 154.
Garman, E.F., and Schneider, T.R. (1997). Macromolecular Cryocrystallography. J. Appl.
Crystallogr. 30, 211 237.
Garreau de Loubresse, N., Prokhorova, I., Holtkamp, W., Rodnina, M. V, Yusupova, G., and
Yusupov, M. (2014). Structural basis for the inhibition of the eukaryotic ribosome. Nature 513, 517
522.
**des Georges, A., Hashem, Y., Unbehaun, A., Grassucci, R.A., Taylor, D., Hellen, C.U.T.,
Pestova, T. V., and Frank, J. (2014). Structure of the mammalian ribosomal pre-termination complex
3,,$(*3+/)'U*+.'/C2PV/C2WVTD1B1>'B6(#/*('K(*),'C/,>'XY-'WXRQ 3418.
Gertz, S., Engelmann, S., Schmid, R., Ziebandt, A.K., Tischer, K., Scharf, C., Hacker, J., and
Hecker, M. (2000). Characterization of the sigma(B) regulon in Staphylococcus aureus. J. Bacteriol.
182, 6983 6991.
Ghuysen, J.M. (1994). Molecular structures of penicillin-binding proteins and beta-lactamases.
Trends Microbiol. 2, 372 380.
Giraudo, A.T., Raspanti, C.G., Calzolari, A., and Nagel, R. (1994). Characterization of a Tn551-
mutant of Staphylococcus aureus defective in the production of several exoproteins. Can. J.
Microbiol. 40, 677 681.
Giraudo, A.T., Cheung, A.L., and Nagel, R. (1997). The sae locus of Staphylococcus aureus
controls exoprotein synthesis at the transcriptional level. Arch. Microbiol. 168, 53 58.
Glaeser, R.M., Typke, D., Tiemeijer, P.C., Pulokas, J., and Cheng, A. (2011). Precise beam-tilt
alignment and collimation are required to minimize the phase error associated with coma in high-
resolution cryo-EM. J. Struct. Biol. 174, 1 10.
Gogia, Z. V, Yusupov, M.M., and Spirina, T.N. (1986). Structure of Thermus thermophilus
ribosomes. I. Method of isolation and purification of ribosomes. MOL. BIOL.(MOSCOW). 20, 519
526.
Goldstein, B.P. (2014). Resistance to rifampicin: a review. J Antibiot 67, 625 630.
Gourse, R.L., Gaal, T., Bartlett, M.S., Appleman, J.A., and Ross, W. (1996). rRNA transcription
and growth rate-dependent regulation of ribosome synthesis in Escherichia coli. Annu. Rev.
Microbiol. 50, 645 677.
Greber, B.J., Boehringer, D., Leibundgut, M., Bieri, P., Leitner, A., Schmitz, N., Aebersold, R.,
References
133
References
and Ban, N. (2014). The complete structure of the large subunit of the mammalian mitochondrial
ribosome. Nature advance on.
Greber, B.J., Bieri, P., Leibundgut, M., Leitner, A., Aebersold, R., Boehringer, D., and Ban, N.
(2015). The complete structure of the 55S mammalian mitochondrial ribosome. Sci. 348 , 303 308.
*Guo, Z., and Noller, H.F. (2012). Rotation of the head of the 30S ribosomal subunit during
mRNA translocation. Proc. Natl. Acad. Sci. U. S. A. 109, 20391 20394.
Hapke, B., and Noll, H. (1976). Structural dynamics of bacterial ribosomes: IV. Classification of
ribosomes by subunit interaction. J. Mol. Biol. 105, 97 109.
Hardy, S.J.S., Kurland, C.G., Voynow, P., and Mora, G. (1969). Ribosomal proteins of
Escherichia coli. I. Purification of the 30 S ribosomal proteins. Biochemistry 8, 2897 2905.
Harms, J., Schluenzen, F., Zarivach, R., Bashan, A., Gat, S., Agmon, I., Bartels, H., Franceschi, F.,
and Yonath, A. (2001). High resolution structure of the large ribosomal subunit from a mesophilic
eubacterium. Cell 107, 679 688.
Harris, L.G., Foster, S.J., Richards, R.G., Lambert, P., Stickler, D., and Eley, A. (2002). An
introduction to Staphylococcus aureus, and techniques for identifyingand quantifying S. aureus
adhesins in relation to adhesion to biomaterials:Review. Eur. Cells Mater. 4, 39 60.
Hartman, B.J., and Tomasz, A. (1984). Low-affinity penicillin-binding protein associated with
beta-lactam resistance in Staphylococcus aureus. J. Bacteriol. 158, 513 516.
Hartmann G, Honikel KO, Knüsel F, N.J. (1967). The specific inhibition of the DNA-directed RNA
synthesis by rifamycin. Biochim Biophys Acta 145, 843 844.
**Hashem, Y., Des Georges, A., Dhote, V., Langlois, R., Liao, H.Y., Grassucci, R.A., Hellen, C.U.T.,
Pestova, T. V., and Frank, J. (2013a). XStructure of the mammalian ribosomal 43S preinitiation
complex bound to the scanning factor DHX29. Cell 153.
**Hashem, Y., des Georges, A., Dhote, V., Langlois, R., Liao, H.Y., Grassucci, R. a, Pestova, T. V,
Hellen, C.U.T., and Frank, J. (2013b). Hepatitis-C-virus-like internal ribosome entry sites displace eIF3
to gain access to the 40S subunit. Nature 503, 539 543.
**Hashem, Y., des Georges, A., Fu, J., Buss, S.N., Jossinet, F., Jobe, A., Zhang, Q., Liao, H.Y.,
Grassucci, R. a, Bajaj, C., et al. (2013c). High-resolution cryo-electron microscopy structure of the
Trypanosoma brucei ribosome. Nature 494, 385 389.
Van Heel, M., Gowen, B., Matadeen, R., Orlova, E. V, Finn, R., Pape, T., Cohen, D., Stark, H.,
Schmidt, R., Schatz, M., et al. (2000). Single-particle electron cryo-microscopy: towards atomic
resolution. Q. Rev. Biophys. 33, 307 369.
Heras, B., and Martin, J.L. (2005). Post-crystallization treatments for improving diffraction
References
134
References
quality of protein crystals. Acta Crystallogr. Sect. D Biol. Crystallogr. 61, 1173 1180.
Hermann, T. (2005). Drugs targeting the ribosome. Curr. Opin. Struct. Biol. 15, 355 366.
Hodgkin, D.C. (1949). The X-ray analysis of the structure of penicillin. Adv. Sci. 6, 85 89.
Hodgkin DC, Kamper J, Mackay M, Pickworth J, Trueblood KN, W.J. (1956). Structure of vitamin
B12. Nature 178, 64 66.
Hoffman, D.W., Davies, C., Gerchman, S.E., Kycia, J.H., Porter, S.J., White, S.W., and
Ramakrishnan, V. (1994). Crystal structure of prokaryotic ribosomal protein L9: a bi-lobed RNA-
binding protein. EMBO J. 13, 205.
Honjo, T., Nishizuka, Y., and Hayaishi, O. (1968). Diphtheria toxin-dependent adenosine
diphosphate ribosylation of aminoacyl transferase II and inhibition of protein synthesis. J. Biol.
Chem. 243, 3553 3555.
Hooper, D.C. (1999). Mode of action of fluoroquinolones. In Drugs, pp. 6 10.
Horsburgh, M.J., Aish, J.L., White, I.J., Shaw, L., Lithgow, J.K., and Foster, S.J. (2002). ??b
modulates virulence determinant expression and stress resistance: Characterization of a functional
rsbU strain derived from Staphylococcus aureus 8325-4. J. Bacteriol. 184, 5457 5467.
**Hussain, T., Llácer, J.L., Fernández, I.S., Munoz, A., Martin-Marcos, P., Savva, C.G., Lorsch,
J.R., Hinnebusch, A.G., and Ramakrishnan, V. (2015). Structural changes enable start codon
recognition by the eukaryotic translation initiation complex. Cell 159, 597 607.
Infante, A.A., and Baierlein, R. (1971). Pressure-induced dissociation of sedimenting
ribosomes: effect on sedimentation patterns. Proc. Natl. Acad. Sci. 68, 1780 1785.
Ito, K., Fujiwara, T., Toyoda, T., and Nakamura, Y. (2002). Elongation factor G participates in
ribosome disassembly by interacting with ribosome recycling factor at their tRNA-mimicry domains.
Mol. Cell 9, 1263 1272.
Jacoby, G.A., and Munoz-Price, L.S. (2005). The new beta-lactamases. N. Engl. J. Med. 352,
380 391.
Janzon, L., and Arvidson, S. (1990). The role of the delta-lysin gene (hld) in the regulation of
virulence genes by the accessory gene regulator (agr) in Staphylococcus aureus. EMBO J. 9, 1391.
*Jenner, L., Demeshkina, N., Yusupova, G., and Yusupov, M. (2010a). Structural aspects of
messenger RNA reading frame maintenance by the ribosome. Nat. Struct. Mol. Biol. 17, 555 560.
*Jenner, L., Demeshkina, N., Yusupova, G., and Yusupov, M. (2010b). Structural
rearrangements of the ribosome at the tRNA proofreading step. Nat. Struct. Mol. Biol. 17, 1072
1078.
Jenner, L., Melnikov, S., de Loubresse, N.G., Ben-Shem, A., Iskakova, M., Urzhumtsev, A.,
References
135
References
Meskauskas, A., Dinman, J., Yusupova, G., and Yusupov, M. (2012). Crystal structure of the 80S yeast
ribosome. Curr. Opin. Struct. Biol. 22, 759 767.
Jin, T., Bokarewa, M., Foster, T., Mitchell, J., Higgins, J., and Tarkowski, A. (2004).
Staphylococcus aureus resists human defensins by production of staphylokinase, a novel bacterial
evasion mechanism. J. Immunol. 172, 1169 1176.
Johanson, U., Aevarsson, A., Liljas, A., and Hughes, D. (1996). The dynamic structure of EF-G
studied by fusidic acid resistance and internal revertants. J. Mol. Biol. 258, 420 432.
Johnson, M.D., and Decker, C.F. (2008). Antimicrobial agents in treatment of MRSA infections.
Disease-a-Month 54, 793 800.
Jorgensen, R., Carr-Schmid, A., Ortiz, P.A., Kinzy, T.G., and Andersen, G.R. (2002). Purification
and crystallization of the yeast elongation factor eEF2. Acta Crystallogr. Sect. D Biol. Crystallogr. 58,
712 715.
Jørgensen, R., Ortiz, P.A., Carr-Schmid, A., Nissen, P., Kinzy, T.G., and Andersen, G.R. (2003).
Two crystal structures demonstrate large conformational changes in the eukaryotic ribosomal
translocase. Nat. Struct. Biol. 10, 379 385.
Jørgensen, R., Merrill, A.R., Yates, S.P., Marquez, V.E., Schwan, A.L., Boesen, T., and Andersen,
G.R. (2005). Exotoxin A-eEF2 complex structure indicates ADP ribosylation by ribosome mimicry.
Nature 436, 979 984.
Junecko JM, Zielinska AK, Mrak LN, Ryan DC, Graham JW, Smeltzer MS, L.C. (2012).
Transcribing virulence in Staphylococcus aureus. World J Clin Infect Dis 2, 63 76.
Kaliner, M.A. (1991). Human nasal respiratory secretions and host defense. Am. Rev. Respir.
Dis. 144, S52 S56.
Kaltschmidt, E., and Wittmann, H.G. (1970). Ribosomal proteins. XII. Number of proteins in
small and large ribosomal subunits of Escherichia coli as determined by two-dimensional gel
electrophoresis. Proc. Natl. Acad. Sci. U. S. A. 67, 1276 1282.
Kashchiev, D. (2000). Nucleation (Butterworth-Heinemann).
Kastner, B., Stöffler-Meilicke, M., and Stöffler, G. (1981). Arrangement of the subunits in the
ribosome of Escherichia coli: demonstration by immunoelectron microscopy. Proc. Natl. Acad. Sci.
78, 6652 6656.
Kaushal, P.S., Sharma, M.R., Booth, T.M., Haque, E.M., Tung, C.-S., Sanbonmatsu, K.Y.,
Spremulli, L.L., and Agrawal, R.K. (2014). Cryo-EM structure of the small subunit of the mammalian
mitochondrial ribosome. Proc. Natl. Acad. Sci. U. S. A. 111, 7284 7289.
Kernodle, DS (2000). Mechanisms of resistance to beta-lactam antibiotics. In Gram-positive
References
136
References
pathogens, (Washington, DC, USA: American Society for Microbiology), pp. 609 620.
Khatter, H., Myasnikov, A.G., Natchiar, S.K., and Klaholz, B.P. (2015). Structure of the human
80S ribosome. Nature 520, 640 645.
Kluytmans, J., Van Belkum, A., and Verbrugh, H. (1997). Nasal carriage of Staphylococcus
aureus: Epidemiology, underlying mechanisms, and associated risks. Clin. Microbiol. Rev. 10, 505
520.
Knox, K.W., and Wicken, A.J. (1973). Immunological properties of teichoic acids. Bacteriol. Rev.
37, 215 257.
Koch, A.L. (2003). Were Gram-positive rods the first bacteria? Trends Microbiol. 11, 166 170.
*Korostelev, A.A. (2011). Structural aspects of translation termination on the ribosome. RNA
17, 1409 1421.
Korostelev, A., Trakhanov, S., Laurberg, M., and Noller, H.F. (2006). Crystal Structure of a 70S
Ribosome-tRNA Complex Reveals Functional Interactions and Rearrangements. Cell 126, 1065
1077.
Korostelev, A., Asahara, H., Lancaster, L., Laurberg, M., Hirschi, A., Zhu, J., Trakhanov, S., Scott,
W.G., and Noller, H.F. (2008). Crystal structure of a translation termination complex formed with
release factor RF2. Proc. Natl. Acad. Sci. U. S. A. 105, 19684 19689.
Kucukelbir, A., Sigworth, F.J., and Tagare, H.D. (2014). Quantifying the local resolution of cryo-
EM density maps. Nat. Methods 11, 63 65.
Kühlbrandt, W. (2014a). The Resolution Revolution. Science (80-. ). 343, 1443 1444.
Kühlbrandt, W. (2014b). Cryo-EM enters a new era. Elife 3, e03678.
Kurland, C.G., Voynow, P., Hardy, S.J.S., Randall, L., and Lutter, L. (1969). Physical and
functional heterogeneity of E. coli ribosomes. In Cold Spring Harbor Symposia on Quantitative
Biology, (Cold Spring Harbor Laboratory Press), pp. 17 24.
Laemmli, U.K. (1970). Cleavage of structural proteins during the assembly of the head of
bacteriophage T4. Nature 227, 680 685.
Lagerkvist, U., Rymo, L., Lindqvist, O., and Andersson, E. (1972). Appendix SOME PROPERTIES
OF CRYSTALS OF LYSINE TRANSFER RIBONUCLEIC ACID LIGASE FROM YEAST. J. Biol. Chem. 247,
3897 3899.
Lake, J.A. (1976). Ribosome structure determined by electron microscopy of Escherichia coli
small subunits, large subunits and monomeric ribosomes. J. Mol. Biol. 105, 131 159.
*Laurberg, M., Asahara, H., Korostelev, A., Zhu, J., Trakhanov, S., and Noller, H.F. (2008).
Structural basis for translation termination on the 70S ribosome. Nature 454, 852 857.

References
137
References
Lee, S.S.J., and Cudney, R. (2004). A modified microdialysis button for use in protein
crystallization. J. Appl. Crystallogr. 37, 504 505.
Leeds, J.A., LaMarche, M.J., Brewer, J.T., Bushell, S.M., Deng, G., Dewhurst, J.M., Dzink-Fox, J.,
Gangl, E., Jain, A., Lee, L., et al. (2011). In vitro and in vivo activities of novel, semisynthetic
thiopeptide inhibitors of bacterial elongation factor Tu. Antimicrob. Agents Chemother. 55, 5277
5283.
Lee-Huang, S., Lee, H., and Ochoa, S. (1974). Inhibition of polypeptide chain initiation in
Escherichia coli by elongation factor G. Proc. Natl. Acad. Sci. U. S. A. 71, 2928 2931.
Li, X., Mooney, P., Zheng, S., Booth, C.R., Braunfeld, M.B., Gubbens, S., Agard, D.A., and Cheng,
Y. (2013). Electron counting and beam-induced motion correction enable near-atomic-resolution
single-particle cryo-EM. Nat. Methods 10, 584 590.
Lim, D., and Strynadka, N.C.J. (2002). Structural basis for the beta-lactam resistance of PBP2a
from methicillin-resistant Staphylococcus aureus. Nat. Struct. Biol. 9, 870 876.
*Lin, J., Gagnon, M.G., Bulkley, D., and Steitz, T.A. (2015). Conformational changes of
elongation factor G on the ribosome during tRNA translocation. Cell 160, 219 227.
Lindberg, M., Jönsson, K., Müller, H.-P., Signäs, C., and Höök, M. (1990). Fibronectin Binding
Proteins from Staphylococcus aureus. In Pathogenesis of Wound and Biomaterial-Associated
Infections SE - 6, T. Wadström, I. Eliasson, I. Holder, and Å. Ljungh, eds. (Springer London), pp. 55
63.
Lippmann, C., Betzel, C., Dauter, Z., Wilson, K., and Erdmann, V.A. (1988). Crystallization and
preliminary X-ray diffraction studies of intact EF-Tu from Thermus aquaticus YT-1. FEBS Lett. 240,
139 142.
Liu, S., Milne, G.T., Kuremsky, J.G., Fink, G.R., and Leppla, S.H. (2004). Identification of the
proteins required for biosynthesis of diphthamide, the target of bacterial ADP-ribosylating toxins on
translation elongation factor 2. Mol. Cell. Biol. 24, 9487 9497.
Liu, S., Wiggins, J.F., Sreenath, T., Kulkarni, A.B., Ward, J.M., and Leppla, S.H. (2006). Dph3, a
small protein required for diphthamide biosynthesis, is essential in mouse development. Mol. Cell.
Biol. 26, 3835 3841.
Liu, S., Bachran, C., Gupta, P., Miller-Randolph, S., Wang, H., Crown, D., Zhang, Y., Wein, A.N.,
Singh, R., Fattah, R., et al. (2012). Diphthamide modification on eukaryotic elongation factor 2 is
needed to assure fidelity of mRNA translation and mouse development. Proc. Natl. Acad. Sci. 109,
13817 13822.
Le Loir, Y., Baron, F., and Gautier, M. (2003). Staphylococcus aureus and food poisoning.
References
138
References
Genet. Mol. Res. 2, 63 76.
Lowy, F.D. (1998). Medical progress - Staphylococcus aureus infections. N. Engl. J. Med. 339,
520 532.
Lowy, F.D. (2000). Is Staphylococcus aureus an intracellular pathogen? Trends Microbiol. 8,
341 343.
Luft, J.R., Newman, J., and Snell, E.H. (2014). Crystallization screening: The influence of history
on current practice. Acta Crystallogr. Sect. FStructural Biol. Commun. 70, 835 853.
Luong, T.T., Sau, K., Roux, C., Sau, S., Dunman, P.M., and Lee, C.Y. (2011). Staphylococcus
aureus ClpC divergently regulates capsule via sae and codY in strain Newman but activates capsule
via codY in strain UAMS-1 and in strain Newman with repaired saeS. J. Bacteriol. 193, 686 694.
Lyon, B.R., Iuorio, J.L., May, J.W., and Skurray, R.A. (1984). Molecular epidemiology of
multiresistant Staphylococcus aureus in Australian hospitals. J. Med. Microbiol. 17, 79 89.
Lyumkis, D., Moeller, A., Cheng, A., Herold, A., Hou, E., Irving, C., Jacovetty, E.L., Lau, P.W.,
Mulder, A.M., Pulokas, J., et al. (2010). Automation in Single-Particle Electron Microscopy.
Connecting the Pieces.
Mainiero, M., Goerke, C., Geiger, T., Gonser, C., Herbert, S., and Wolz, C. (2010). Differential
target gene activation by the Staphylococcus aureus two-component system saeRS. J. Bacteriol. 192,
613 623.
Manuell, A.L., Quispe, J., and Mayfield, S.P. (2007). Structure of the chloroplast ribosome:
Novel domains for translation regulation. PLoS Biol. 5, 1785 1797.
Mateyak, M.K., and Kinzy, T.G. (2010). eEF1A: Thinking outside the ribosome. J. Biol. Chem.
285, 21209 21213.
McClure, W.R., and Cech, C.L. (1978). On the mechanism of rifampicin inhibition of RNA
synthesis. J. Biol. Chem. 253, 8949 8956.
McManus, M.C. (1997). Mechanisms of bacterial resistance to antimicrobial agents. Am. J.
Health. Syst. Pharm. 54, 1420 1433; quiz 1444 1446.
McMullan, G., Chen, S., Henderson, R., and Faruqi, A.R. (2009a). Detective quantum efficiency
of electron area detectors in electron microscopy. Ultramicroscopy 109, 1126 1143.
McMullan, G., Clark, A.T., Turchetta, R., and Faruqi, A.R. (2009b). Enhanced imaging in low
dose electron microscopy using electron counting. Ultramicroscopy 109, 1411 1416.
McPherson, A. (2004). Introduction to protein crystallization. Methods 34, 254 265.
Melnikov, S., Ben-Shem, A., Garreau de Loubresse, N., Jenner, L., Yusupova, G., and Yusupov,
M. (2012). One core, two shells: bacterial and eukaryotic ribosomes. Nat. Struct. Mol. Biol. 19, 560
References
139
References
567.
Melnikov, S., Mailliot, J., Byung-Sik S., Rigger L., Neuner S., Dever T., Micura R., Yusupova G.
and Yusupov M. (2015). Insights into the hypusine-induced peptide-bond formation by the
eukaryotic ribosome. Nature.
Mikol, V., Hirsch, E., and Giege, R. (1990). Diagnostic of precipitant for biomacromolecule
crystallization by quasi-elastic light-scattering. J. Mol. Biol. 213, 187 195.
Milazzo, A.-C., Cheng, A., Moeller, A., Lyumkis, D., Jacovetty, E., Polukas, J., Ellisman, M.H.,
Xuong, N.-H., Carragher, B., and Potter, C.S. (2011). Initial evaluation of a direct detection device
detector for single particle cryo-electron microscopy. J. Struct. Biol. 176, 404 408.
Mindell, J.A., and Grigorieff, N. (2003). Accurate determination of local defocus and specimen
tilt in electron microscopy. J. Struct. Biol. 142, 334 347.
Moesby, L., Hansen, E.W., Christensen, J.D., Høyer, C.H., Juhl, G.L., and Olsen, H.B. (2005). Dry
and moist heat sterilisation cannot inactivate pyrogenicity of Gram positive microorganisms. Eur. J.
Pharm. Sci. 26, 318 323.
Mohan, S., Donohue, J.P., and Noller, H.F. (2014). Molecular mechanics of 30S subunit head
rotation. Proc. Natl. Acad. Sci. U. S. A. 111, 13325 13330.
Moran Jr, C.P. (1993). RNA polymerase and transcription factors. Bacillus Subtilis Other Gram-
Positive Bact. Biochem. Physiol. Mol. Genet. Am. Soc. Microbiol. Washington, DC 653 667.
Morfeldt, E., Janzou, L., Arvidson, S., and Löfdahl, S. (1988). Cloning of a chromosomal locus
(exp) which regulates the expression of several exoprotein genes in Staphylococcus aureus. MGG
Mol. Gen. Genet. 211, 435 440.
Morgan, M. (2011). Treatment of MRSA soft tissue infections: An overview. Injury 42, S11
S17.
Morita, Y., Kodama, K., Shiota, S., Mine, T., Kataoka, A., Mizushima, T., and Tsuchiya, T. (1998).
NorM, putative multidrug efflux protein, of Vibrio parahaemolyticus and its homolog in Escherichia
coli. Antimicrob. Agents Chemother. 42, 1778 1782.
**Muhs, M., Hilal, T., Mielke, T., Skabkin, M.A., Sanbonmatsu, K.Y., Pestova, T. V, and Spahn,
C.M.T. (2015). Cryo-EM of ribosomal 80S complexes with termination factors reveals the
translocated cricket paralysis virus IRES. Mol. Cell 57, 422 432.
Neely, A.N., and Maley, M.P. (2000). Survival of enterococci and staphylococci on hospital
fabrics and plastic. J. Clin. Microbiol. 38, 724 726.
Neu, H.C. (1992). The crisis in antibiotic resistance. Science 257, 1064 1073.
Newman, J. (2006). A review of techniques for maximizing diffraction from a protein crystal in

References
140
References
stilla. In Acta Crystallographica Section D: Biological Crystallography, pp. 27 31.
Nissen, P., Hansen, J., Ban, N., Moore, P.B., and Steitz, T.A. (2000). The structural basis of
ribosome activity in peptide bond synthesis. Science (80-. ). 289, 920 930.
Noll, M., and Noll, H. (1976). Structural dynamics of bacterial ribosomes: V. Magnesium-
dependent dissociation of tight couples into subunits: Measurements of dissociation constants and
exchange rates. J. Mol. Biol. 105, 111 127.
Norvick, R.P., and Jiang, D. (2003). The staphylococcal saeRS system coordinates
environmental signals agr quorum sensing. Microbiology 149, 2709 2717.
Novick, R.P., Ross, H.F., Projan, S.J., Kornblum, J., Kreiswirth, B., and Moghazeh, S. (1993).
Synthesis of staphylococcal virulence factors is controlled by a regulatory RNA molecule. EMBO J.
12, 3967 3975.
!"#$%%&''() *+,+) -./012+),345) %&67'8937:) 9;7-dimensional electrophoresis of proteins. J. Biol.
Chem. 250, 4007 4021.
!"<37%=$:() >+() $:=) ?&&() @+A+) -BCCD2+) Staphylococcus aureus capsular polysaccharides. Clin.
Microbiol. Rev. 17, 218 234.
Ortiz, P.A., Ulloque, R., Kihara, G.K., Zheng, H., and Kinzy, T.G. (2006). Translation elongation
factor 2 anticodon mimicry domain mutants affect fidelity and diphtheria toxin resistance. J. Biol.
Chem. 281, 32639 32648.
Ovchinnikov, L.P., Motuz, L.P., Natapov, P.G., Averbuch, L.J., Wettenhall, R.E.H., Szyszka, R.,
Kramer, G., and Hardesty, B. (1990). Three phosphorylation sites in elongation factor 2. FEBS Lett.
275, 209 212.
**Pallesen, J., Hashem, Y., Korkmaz, G., Koripella, R.K., Huang, C., Ehrenberg, M., Sanyal, S.,
and Frank, J. (2013). Cryo-EM visualization of the ribosome in termination complex with apo-RF3
and RF1. Elife 2013.
Park, J.H., Johansson, H.E., Aoki, H., Huang, B., Kim, H.Y., Ganoza, M.C., and Park, M.H. (2012).
Post-translational modification by beta-lysylation is required for the activity of E. coli Elongation
Factor P (EF-P). J Biol Chem 287, 2579 2590.
Pearson, M. (2011) Crystal structures of naturally inhibited ribosomes (Doctoral thesis,
University of California, Santa Cruz). Retrieved from: http://gradworks.umi.com
/34/52/3452518.html
Penczek, P.A. (2010). Image restoration in cryo-electron microscopy. Methods Enzymol. 482,
35 72.
Perutz, M.F., Rossmann, M.G., Cullis, A.N.N.F., Muirhead, H., WILL, G., and North, A.C.T.

References
141
References
(1960). Structure of Haemoglobin: A Three-Dimensional Fourier Synthesis at 5.5-[angst]. Resolution,
Obtained by X-Ray Analysis. Nature 185, 416 422.
Peschel, A., Jack, R.W., Otto, M., Collins, L. V, Staubitz, P., Nicholson, G., Kalbacher, H.,
Nieuwenhuizen, W.F., Jung, G., Tarkowski, A., et al. (2001). Staphylococcus aureus resistance to
human defensins and evasion of neutrophil killing via the novel virulence factor MprF is based on
modification of membrane lipids with l-lysine. J. Exp. Med. 193, 1067 1076.
*Petry, S., Brodersen, D.E., Murphy IV, F. V., Dunham, C.M., Selmer, M., Tarry, M.J., Kelley,
A.C., and Ramakrishnan, V. (2005). Crystal structures of the ribosome in complex with release
factors RF1 and RF2 bound to a cognate stop codon. Cell 123, 1255 1266.
Pettersen, E.F., Goddard, T.D., Huang, C.C., Couch, G.S., Greenblatt, D.M., Meng, E.C., and
Ferrin, T.E. (2004). UCSF ChimeraEA visualization system for exploratory research and analysis. J.
Comput. Chem. 25, 1605 1612.
Poehlsgaard, J., and Douthwaite, S. (2003). Macrolide antibiotic interaction and resistance on
the bacterial ribosome. Curr. Opin. Investig. Drugs 4, 140 148.
Polacek, N., and Mankin, A.S. (2005). The ribosomal peptidyl transferase center: structure,
function, evolution, inhibition. Crit. Rev. Biochem. Mol. Biol. 40, 285 311.
*Polikanov, Y.S., Blaha, G.M., and Steitz, T.A. (2012). How Hibernation Factors RMF, HPF, and
YfiA Turn Off Protein Synthesis. Science (80-. ). 336, 915 918.
*77'&()>+)-BCCD2+)<&6369$:F&)97GHH-lactam antibiotics. Cell. Mol. Life Sci. 61, 2200 2223.
Pootoolal, J., Neu, J., and Wright, G.D. (2002). Glycopeptide antibiotic resistance. Annu. Rev.
Pharmacol. Toxicol. 42, 381 408.
Price, N.T., Redpath, N.T., Severinov, K. V, Campbell, D.G., Russell, J.M., and Proud, C.G. (1991).
Identification of the phosphorylation sites in elongation factor-2 from rabbit reticulocytes. FEBS
Lett. 282, 253 258.
*Pulk, A., and Cate, J.H.D. (2013). Control of ribosomal subunit rotation by elongation factor
G. Science 340, 1235970.
Qin, Y., Polacek, N., Vesper, O., Staub, E., Einfeldt, E., Wilson, D.N., and Nierhaus, K.H. (2006).
The Highly Conserved LepA Is a Ribosomal Elongation Factor that Back-Translocates the Ribosome.
Cell 127, 721 733.
*Qu, X., Wen, J.-D., Lancaster, L., Noller, H.F., Bustamante, C., and Tinoco, I. (2011). The
ribosome uses two active mechanisms to unwind messenger RNA during translation. Nature 475,
118 121.
Ramakrishnan, V., and Moore, P.B. (2001). Atomic structures at last: The ribosome in 2000.
References
142
References
Curr. Opin. Struct. Biol. 11, 144 154.
Rammelkamp, C.H., and Maxon, T. (1942). Resistance of Staphylococcus aureus to the Action
of Penicillin. Exp. Biol. Med. 51 , 386 389.
**Ramrath, D.J.F., Lancaster, L., Sprink, T., Mielke, T., Loerke, J., Noller, H.F., and Spahn, C.M.T.
(2013). Visualization of two transfer RNAs trapped in transit during elongation factor G-mediated
translocation. Proc. Natl. Acad. Sci. U. S. A. 110, 20964 20969.
Rayner, C., and Munckhof, W.J. (2005). Antibiotics currently used in the treatment of
infections caused by Staphylococcus aureus. Intern. Med. J. 35 Suppl 2, S3 S16.
<&F6&3() *+() >%&36;3%95() I+() !"<&3''J() K+() Schlievert, P., Gruss, A., and Novick, R.P. (1986).
Regulation of exoprotein gene expression in Staphylococcus aureus by agr. MGG Mol. Gen. Genet.
202, 58 61.
Robertson, E.S., Aggison, L.A., and Nicholson, A.W. (1994). Phosphorylation of elongation
factor G and ribosomal protein S6 in bacteriophage T7-infected Escherichia coli. Mol. Microbiol. 11,
1045 1057.
Rodnina, M. V, Savelsbergh, A., Katunin, V.I., and Wintermeyer, W. (1997). Hydrolysis of GTP
by elongation factor G drives tRNA movement on the ribosome. Nature 385, 37 41.
Rohou, A., and Grigorieff, N. (2015). CTFFIND4: Fast and accurate defocus estimation from
electron micrographs. J. Struct. Biol.
Rosenthal, P.B., and Henderson, R. (2003). Optimal Determination of Particle Orientation,
Absolute Hand, and Contrast Loss in Single-particle Electron Cryomicroscopy. J. Mol. Biol. 333, 721
745.
Roy, H., Zou, S.B., Bullwinkle, T.J., Wolfe, B.S., Gilreath, M.S., Forsyth, C.J., Navarre, W.W., and
Ibba, M. (2011). The tRNA synthetase paralog PoxA modifies elongation factor-P with (R)-L-lysine.
Nat. Chem. Biol. 7, 667 669.
*Rozov, A., Demeshkina, N., Westhof, E., Yusupov, M., and Yusupova, G. (2015). Structural
insights into the translational infidelity mechanism. Nat Commun 6.
Rubinstein, J.L., and Brubaker, M.A. (2015). Alignment of cryo-EM movies of individual
particles by optimization of image translations. J. Struct. Biol.
Russo, C.J., and Passmore, L.A. (2014). Ultrastable gold substrates for electron
cryomicroscopy. Sci. 346 , 1377 1380.
Salemme, F.R. (1972). A free interface diffusion technique for the crystallization of proteins
for x-ray crystallography. Arch. Biochem. Biophys. 151, 533 539.
Sambrook, J; Frisch, E.F.M.T. (1989). Molecular Cloning: A laboratory manual. In Cold Spring

References
143
References
Harbour,.
Sanchez-Weatherby, J., Bowler, M.W., Huet, J., Gobbo, A., Felisaz, F., Lavault, B., Moya, R.,
Kadlec, J., Ravelli, R.B.G., and Cipriani, F. (2009). Improving diffraction by humidity control: A novel
device compatible with X-ray beamlines. Acta Crystallogr. Sect. D Biol. Crystallogr. 65, 1237 1246.
Saridakis, E., and Chayen, N.E. (2003). Systematic improvement of protein crystals by
determining the supersolubility curves of phase diagrams. Biophys. J. 84, 1218 1222.
Savelsbergh, A., Matassova, N.B., Rodnina, M. V, and Wintermeyer, W. (2000). Role of
domains 4 and 5 in elongation factor G functions on the ribosome. J. Mol. Biol. 300, 951 961.
Scheres, S.H. (2014). Beam-induced motion correction for sub-megadalton cryo-EM particles.
Elife 3, e03665.
Scheres, S.H.W. (2012). RELION: implementation of a Bayesian approach to cryo-EM structure
determination. J. Struct. Biol. 180, 519 530.
Scheres, S.H.W., and Chen, S. (2012). Prevention of overfitting in cryo-EM structure
determination. Nat Meth 9, 853 854.
Schluenzen, F., Tocilj, A., Zarivach, R., Harms, J., Gluehmann, M., Janell, D., Bashan, A., Bartels,
H., Agmon, I., Franceschi, F., et al. (2000). Structure of functionally activated small ribosomal subunit
at 3.3 angstroms resolution. Cell 102, 615 623.
Schlünzen, F., Pyetan, E., Fucini, P., Yonath, A., and Harms, J.M. (2004). Inhibition of peptide
bond formation by pleuromutilins: The structure of the 50S ribosomal subunit from Deinococcus
radiodurans in complex with tiamulin. Mol. Microbiol. 54, 1287 1294.
Schuwirth, B.S., Borovinskaya, M.A., Hau, C.W., Zhang, W., Vila-Sanjurjo, A., Holton, J.M., and
Cate, J.H.D. (2005). Structures of the bacterial ribosome at 3.5 A resolution. Science 310, 827 834.
Selmer, M., Dunham, C.M., Murphy, F. V, Weixlbaumer, A., Petry, S., Kelley, A.C., Weir, J.R.,
and Ramakrishnan, V. (2006). Structure of the 70S ribosome complexed with mRNA and tRNA.
Science 313, 1935 1942.
Shigematsu, H., and Sigworth, F.J. (2013). Noise models and cryo-EM drift correction with a
direct-electron camera. Ultramicroscopy 131, 61 69.
Shockman, G.D., and Barren, J.F. (1983). Structure, function, and assembly of cell walls of
gram-positive bacteria. Annu. Rev. Microbiol. 37, 501 527.
Shockman, G.D., Daneo-Moore, L., Kariyama, R., and Massidda, O. (1996). Bacterial walls,
peptidoglycan hydrolases, autolysins, and autolysis. Microb. Drug Resist. 2, 95 98.
Shoham, M., Müssig, J., Shevack, A., Arad, T., Wittmann, H.G., and Yonath, A. (1986). A new
crystal form of large ribosomal subunits from Halobacterium marismortui. FEBS Lett. 208, 321 324.

References
144
References
Sitikov, A.S., Davydova, E.K., Bezlepkina, T.A., Ovchinnikov, L.P., and Spirin, A.S. (1984).
Eukaryotic elongation factor 2 loses its non-specific affinity for RNA and leaves polyribosomes as a
result of ADP-ribosylation. FEBS Lett. 176, 406 410.
Sohmen, D., Harms, J.M., Schlünzen, F., and Wilson, D.N. (2009). of Protein Synthesis I.
Sohmen, D., Chiba, S., Shimokawa-Chiba, N., Innis, C.A., Berninghausen, O., Beckmann, R., Ito,
K., and Wilson, D.N. (2015). Structure of the Bacillus subtilis 70S ribosome reveals the basis for
species-specific stalling. Nat Commun 6.
Song, M.D., Wachi, M., Doi, M., Ishino, F., and Matsuhashi, M. (1987). Evolution of an inducible
penicillin-target protein in methicillin-resistant Staphylococcus aureus by gene fusion. FEBS Lett.
221, 167 171.
Sorzano, C.O.S., Marabini, R., Velázquez-Muriel, J., Bilbao-Castro, J.R., Scheres, S.H.W., Carazo,
J.M., and Pascual-Montano, A. (2004). XMIPP: a new generation of an open-source image processing
package for electron microscopy. J. Struct. Biol. 148, 194 204.
**Spahn, C.M.T., Gomez-Lorenzo, M.G., Grassucci, R.A., Jørgensen, R., Andersen, G.R.,
Beckmann, R., Penczek, P.A., Ballesta, J.P.G., and Frank, J. (2004a). Domain movements of
elongation factor eEF2 and the eukaryotic 80S ribosome facilitate tRNA translocation. EMBO J. 23,
1008 1019.
**Spahn, C.M.T., Jan, E., Mulder, A., Grassucci, R.A., Sarnow, P., and Frank, J. (2004b). Cryo-
EM visualization of a viral internal ribosome entry site bound to human ribosomes: The IRES
functions as an RNA-based translation factor. Cell 118, 465 475.
Spirin, A.S., Sabo, B., and Kovalenko, V.A. (1971). Dependence of dissociationEassociation of
uncharged ribosomes of Escherichia coli on the Mg 2+ concentration, ionic strength, pH and
temperature. FEBS Lett. 15, 197 200.
Spirin, A.S., Belitsina, N. V, and Lishnevskaya, E.B. (1972). On some artifacts of sucrose gradient
sedimentation of ribosomes. FEBS Lett. 24, 219 224.
Stahli, C., and Noll, H. (1977). Structural dynamics of bacterial ribosomes. Mol. Gen. Genet.
MGG 153, 159 168.
Stark, H., Mueller, F., Orlova, E. V, Schatz, M., Dube, P., Erdemir, T., Zemlin, F., Brimacombe,
R., and van Heel, M. (1995). The 70S Escherichia coli ribosome at 23 A resolution: fitting the
ribosomal RNA. Structure 3, 815 821.
Starosta, A.L., Lassak, J., Jung, K., and Wilson, D.N. (2014). The bacterial translation stress
response. FEMS Microbiol. Rev. 38, 1172 1201.
Sun, F., Li, C., Jeong, D., Sohn, C., He, C., and Bae, T. (2010). In the Staphylococcus aureus two-

References
145
References
component system sae, the response regulator SaeR Binds to a direct repeat sequence and DNA
binding requires phosphorylation by the sensor kinase SaeS. J. Bacteriol. 192, 2111 2127.
**Svidritskiy, E., Brilot, A.F., Koh, C.S., Grigorieff, N., and Korostelev, A.A. (2014). Structures of
yeast 80S ribosome-tRNA complexes in the rotated and nonrotated conformations. Structure 22,
1210 1218.
**Taylor, D., Unbehaun, A., Li, W., Das, S., Lei, J., Liao, H.Y., Grassucci, R.A., Pestova, T. V., and
Frank, J. (2012). Cryo-EM structure of the mammalian eukaryotic release factor eRF1-eRF3-
associated termination complex. Proc. Natl. Acad. Sci.
Teng, T.Y. (1990). Mounting of crystals for macromolecular crystallography in a free-standing
thin film. J. Appl. Crystallogr. 23, 387 391.
Tenson, T., and Mankin, A. (2006). Antibiotics and the ribosome. Mol Microbiol 59, 1664
1677.
Tong, Y., Park, I., Hong, B.S., Nedyalkova, L., Tempel, W., and Park, H.W. (2009). Crystal
structure of human eIF5A1: Insight into functional similarity of human eIF5A1 and eIF5A2. Proteins
Struct. Funct. Bioinforma. 75, 1040 1045.
*Tourigny, D.S., Fernández, I.S., Kelley, A.C., and Ramakrishnan, V. (2013). Elongation factor G
bound to the ribosome in an intermediate state of translocation. Science 340, 1235490.
Trakhanov, S.D., Yusupov, M.M., Agalarov, S.C., Garber, M.B., Ryazantsev, S.N., Tischenko,
S.V., and Shirokov, V.A. (1987). Crystallization of 70 S ribosomes and 30 S ribosomal subunits from
Thermus thermophilus. FEBS Lett. 220, 319 322.
Tran, J.H., Jacoby, G.A., and Hooper, D.C. (2005a). Interaction of the plasmid-encoded
quinolone resistance protein Qnr with Escherichia coli DNA gyrase. Antimicrob. Agents Chemother.
49, 118 125.
Tran, J.H., Jacoby, G.A., and Hooper, D.C. (2005b). Interaction of the plasmid-encoded
quinolone resistance protein QnrA with Escherichia coli topoisomerase IV. Antimicrob. Agents
Chemother. 49, 3050 3052.
Ueta, M., Wada, C., and Wada, A. (2010). Formation of 100S ribosomes in Staphylococcus
aureus by the hibernation promoting factor homolog SaHPF. Genes to Cells 15, 43 58.
Utsui, Y., and Yokota, T. (1985). Role of an altered penicillin-binding protein in methicillin- and
cephem-resistant Staphylococcus aureus. Antimicrob. Agents Chemother. 28, 397 403.
VandenBergh, M.F.Q., Yzerman, E.P.F., Van Belkum, A., Boelens, H.A.M., Sijmons, M., and
Verbrugh, H.A. (1999). Follow-up of Staphylococcus aureus nasal carriage after 8 years: Redefining
the persistent carrier state. J. Clin. Microbiol. 37, 3133 3140.
References
146
References
Vasiliev, V.D. (1974). Morphology of the ribosomal 30S subparticle according to electron
microscopic data. Acta Biol. Med. Ger. 33, 779.
Vasiliev, V.D., Selivanova, O.M., Baranov, V.I., and Spirin, A.S. (1983). Structural study of
translating 70 S ribosomes from Escherichia coli. I. Electron microscopy. FEBS Lett. 155, 167 172.
Vila-Sanjurjo, A., Ridgeway, W.K., Seymaner, V., Zhang, W., Santoso, S., Yu, K., and Cate, J.H.D.
(2003). X-ray crystal structures of the WT and a hyper-accurate ribosome from Escherichia coli. Proc.
Natl. Acad. Sci. U. S. A. 100, 8682 8687.
Vogeley, L., Palm, G.J., Mesters, J.R., and Hilgenfeld, R. (2001). Conformational change of
elongation factor Tu (EF-Tu) induced by antibiotic binding. Crystal structure of the complex between
EF-Tu??GDP and aurodox. J. Biol. Chem. 276, 17149 17155.
Voorhees, R.M., Fernández, I.S., Scheres, S.H.W., and Hegde, R.S. (2014). Structure of the
mammalian ribosome-Sec61 complex to 3.4 Å resolution. Cell 157, 1632 1643.
Voyich, J.M., Vuong, C., DeWald, M., Nygaard, T.K., Kocianova, S., Griffith, S., Jones, J., Iverson,
C., Sturdevant, D.E., Braughton, K.R., et al. (2009). The SaeR/S gene regulatory system is essential
for innate immune evasion by Staphylococcus aureus. J. Infect. Dis. 199, 1698 1706.
Wade, R.H. (1992). A brief look at imaging and contrast transfer. Ultramicroscopy 46, 145
156.
Wagenknecht, T., Carazo, J.M., Radermacher, M., and Frank, J. (1989). Three-dimensional
reconstruction of the ribosome from Escherichia coli. Biophys. J. 55, 455 464.
Waldvogel, F.A. (1995). Staphylococcus aureus (including toxic shock syndrome). Princ. Pract.
Infect. Dis. Churchill Livingstone, New York, NY 1754 1777.
Wang, L., and Sigworth, F.J. (2006). Cryo-EM and single particles. Physiology (Bethesda). 21,
13 18.
Washburn, M.P., Wolters, D., and Yates, J.R. (2001). Large-scale analysis of the yeast proteome
by multidimensional protein identification technology. Nat. Biotechnol. 19, 242 247.
Watson, J.D., and Crick, F.H. (1953). Molecular structure of nucleic acids. Nature 171, 737
738.
*Weixlbaumer, A., Jin, H., Neubauer, C., Voorhees, R.M., Petry, S., Kelley, A.C., and
Ramakrishnan, V. (2008). Insights into translational termination from the structure of RF2 bound to
the ribosome. Science 322, 953 956.
World Health Organization. 2015. Drug resistance. Worldwide country situation analysis:
response to antimicrobial resistance. Web. Publication date: 29 April 2015, ISBN: 978 92 4 156494
6, WHO reference number: WHO/HSE/PED/AIP/2015.1
References
147
References
Wilkinson, B.J. (1997). The staphylococci in human disease. Biology (Basel).
Williamson, M.P., Havel, T.F., and Wüthrich, K. (1985). Solution conformation of proteinase
inhibitor IIA from bull seminal plasma by 1H nuclear magnetic resonance and distance geometry. J.
Mol. Biol. 182, 295 315.
Wilson, D.N. (2011). On the specificity of antibiotics targeting the large ribosomal subunit.
Ann. N. Y. Acad. Sci. 1241, 1 16.
Wilson, D.N. (2014). Ribosome-targeting antibiotics and mechanisms of bacterial resistance.
Nat. Rev. Microbiol. 12, 35 48.
Wimberly, B.T., Brodersen, D.E., Clemons, W.M., Morgan-Warren, R.J., Carter, A.P., Vonrhein,
C., Hartsch, T., and Ramakrishnan, V. (2000). Structure of the 30S ribosomal subunit. Nature 407,
327 339.
Woese, C.R. (1987). Bacterial evolution. Microbiol. Rev. 51, 221 271.
Wolf, H., Chinali, G., and Parmeggiani, A. (1974). Kirromycin, an inhibitor of protein
biosynthesis that acts on elongation factor Tu. Proc. Natl. Acad. Sci. U. S. A. 71, 4910 4914.
**Wong, W., Bai, X., Brown, A., Fernandez, I.S., Hanssen, E., Condron, M., Tan, Y.H., Baum, J.,
and Scheres, S.H.W. (2014). Cryo-EM structure of the Plasmodium falciparum 80S ribosome bound
to the anti-protozoan drug emetine. Elife 3.
Yamaguchi, K., and Subramanian, A.R. (2000). The plastid ribosomal proteins. Identification of
all the proteins in the 50 S subunit of an organelle ribosome (chloroplast). J. Biol. Chem. 275, 28466
28482.
Yanagisawa, T., Sumida, T., Ishii, R., Takemoto, C., and Yokoyama, S. (2010). A paralog of lysyl-
tRNA synthetase aminoacylates a conserved lysine residue in translation elongation factor P. Nat.
Struct. Mol. Biol. 17, 1136 1143.
Yonath, A., Bartunik, H.D., Bartels, K.S., and Wittmann, H.G. (1984). Some X-ray diffraction
patterns from single crystals of the large ribosomal subunit from Bacillus stearothermophilus. J. Mol.
Biol. 177, 201 206.
Yonath, A., Saper, M.A., Makowski, I., Müssig, J., Piefke, J., Bartunik, H.D., Bartels, K.S., and
Wittmann, H.G. (1986). Characterization of single crystals of the large ribosomal particles from
Bacillus stearothermophilus. J. Mol. Biol. 187, 633 636.
Yoshida, H., Maki, Y., Kato, H., Fujisawa, H., Izutsu, K., Wada, C., and Wada, A. (2002). The
ribosome modulation factor (RMF) binding site on the 100S ribosome of Escherichia coli. J. Biochem.
132, 983 989.
Yusupov, M.M., Trakhanov, S.D., Barynin, V. V, Boroviagin, V.L., and Garber, M.B. (1987).

References
148
References
Crystallization of 30S subparticles from Thermus thermophilus ribosomes(Kristallizatsiia 30 S
subchastits ribosom Thermus thermophilus). In Doklady Akad Nauk (USSR), pp. 1271 1274.
Yusupov, M.M., Yusupova, G.Z., Baucom, a, Lieberman, K., Earnest, T.N., Cate, J.H., and Noller,
H.F. (2001). Crystal structure of the ribosome at 5.5 A resolution. Science 292, 883 896.
Yusupova, G.Z., Yusupov, M.M., Cate, J.H.D., and Noller, H.F. (2001). The path of messenger
RNA through the ribosome. Cell 106, 233 241.
Zeppezauer, M., Eklund, H., and Zeppezauer, E.S. (1968). Micro diffusion cells for the growth
of single protein crystals by means of equilibrium dialysis. Arch. Biochem. Biophys. 126, 564 573.
Zhang, W., Dunkle, J.A., and Cate, J.H.D. (2009). Structures of the ribosome in intermediate
states of ratcheting. Science 325, 1014 1017.
*Zhou, J., Korostelev, A., Lancaster, L., and Noller, H.F. (2012). Crystal structures of 70S
ribosomes bound to release factors RF1, RF2 and RF3. Curr. Opin. Struct. Biol. 22, 733 742.
*Zhou, J., Lancaster, L., Donohue, J.P., and Noller, H.F. (2013). Crystal structures of EF-G-
ribosome complexes trapped in intermediate states of translocation. Science 340, 1236086.
*Zhou, J., Lancaster, L., Donohue, J.P., and Noller, H.F. (2014). How the ribosome hands the A-
site tRNA to the P site during EF-G catalyzed translocation. Sci. 345 , 1188 1191.
Iskander KHUSAINOV
Structural studies of the Staphylococcus aureus ribosome
Résumé Le ribosome est une machinerie cellulaire importante impliquée dans la synthèse protéique de
toute cellule vivante. Par conséquent, le ribosome est l'une des principales cibles des antibiotiques naturels, qui sont capables de tuer les cellules bactériennes en bloquant la synthèse protéique. Toutefois, certaines bactéries sont résistantes à ces antibiotiques en raison de petites modifications au niveau de leurs ribosomes. Entre autres, Staphylococcus aureus (S. aureus) est un agent pathogène responsable de n !"#$%&$&'()*$+,( )&'-#./$&'+0$1'234 !!$5'6$&'&,#%+,%#$&'+#(&,.22()$&'78.),("( ,(9%$&'en complexe avec des ribosomes de bactéries non-résistantes, non-pathogènes, Gram négatives ont fourni un aperçu sans précédent des mécanismes d'action de ces antibiotiques. Cependant, aucune structure de ribosome de bactéries pathogènes, hautement résistantes, Gram positives telles que S. aureus )3.'$)+ #$':,:'(7$),(*(:$5
Dans cette étude, nous présentons la première structure de ribosome de S. aureus à haute résolution (3.9 Å) résolue par cryo-microscopie électronique (cryo-ME). Nous mettons en évidence plusieurs caractéristiques de l'organisation des ribosomes spécifiques des bactéries Gram-positives. Nous décrivons également le protocole de purification et de cristallisation du ribosome de S. aureus pour de futures études de cryo-ME et de cristallographie aux rayons X.
; %&' 2$&'#:&%2,.,&' ",$)%&'7.)&'+$&',#./.%<=' *.+(2(,$# ),' 2.'7$&+#(>,( )'?' 23:+0$22$'., !(9%$'7%'ribosome de S. aureus et ses complexes fonctionnels dans un futur proche. La combinaison des méthodes de cristallographie aux rayons X et de cryo-ME aidera à atteindre cet objectif. Les résultats obtenus serviront de base pour le développement de nouveaux composés contre la bactérie pathogène et extrêmement #:&(&,.),$'9%3$&,'S. aureus.
Mots clés: Staphylococcus aureus, traduction, ribosome, structure, cristallographie, cryo-ME
Summary The ribosome is a large cellular machinery that performs the protein synthesis in every living cell.
Therefore, the ribosome is one of the major targets of naturally produced antibiotics, which can kill bacterial cells by blocking protein synthesis. However, some bacteria are resistant to these antibiotics due to small modifications of their ribosomes. Among them, Staphylococcus aureus (S. aureus), a severe pathogen that causes numerous infections in humans. The crystal structures of complexes of antibiotics with ribosomes from Gram-negative non-pathogenic non-resistant bacteria have provided unparalleled insight into mechanisms of antibiotics action and promoted the development of new semi-synthetic and synthetic antibiotics. However, the structure of the ribosome from Gram-positive pathogenic and highly resistant bacteria such as S. aureus was still unidentified.
In this study we present the first high resolution structure of the ribosome from S. aureus solved at 3.9 Å by cryo-electron microscopy (cryo-EM). We demonstrate several features of the ribosome organization which are unique for Gram-positive bacteria. We also describe the protocol of purification and crystallization of S. aureus ribosome for future cryo-EM and X-ray crystallography studies.
All the results obtained in this work will help to describe S. aureus ribosome and its functional complexes at the atomic level in the nearest future. The combination of X-ray crystallography and cryo-EM methods will help to achieve this aim. The obtained results will provide a foundation for the development of new compounds against pathogenic and extremely resistant bacteria S. aureus.
Key words: Staphylococcus aureus, translation, ribosome, structure, crystallography, cryo-EM