The structure of human mitochondrial DNA variation
13
J Mol Evol (1991) 33:543-555 Journal of Molecular Evolution (~ Springer-Vcrlag New York Inc. 1991 The Structure of Human Mitochondrial DNA Variation D. Andrew Merriwether, 1 Andrew G. Clark, 2 Scott W. Ballinger, 3 Theodore G. Schurr, 3 Himla Soodyall, 4 Trefor Jenkins, 4 Stephen T. Sherry, 5 and Douglas C. Wallace 3 J University of Pittsburgh, Department of Human Genetics, School of Public Health, Pittsburgh, PA 15261, USA 2 Department of Biology and Institute of Molecular Evolutionary Genetics, Pennsylvania State University, University Park, PA 16802, USA 3 Center for Genetics and Molecular Medicine, Emory University School of Medicine, Rollins Research Center, Atlanta, GA 30322, USA 4 MRC Human Ecogenetics Research Unit, Department of Human Genetics, School of Pathology, South African Institute for Medical Research and the University of the Witwatersrand, Johannesburg, South Africa 5Department of Anthropology, Pennsylvania State University, University Park, PA 16802, USA Summary. Restriction analysis of mitochondrial DNA (mtDNA) of 3065 humans from 62 geograph- ic samples identified 149 haplotypes and 81 poly- morphic sites. These data were used to test several aspects of the evolutionary past of the human spe- cies. A dendrogram depicting the genetic relatedness of all haplotypes shows that the native African pop- ulations have the greatest diversity and, consistent with evidence from a variety of sources, suggests an African origin for our species. The data also indicate that two individuals drawn at random from the en- tire sample will differ at approximately 0.4% of their mtDNA nucleotide sites, which is somewhat higher than previous estimates. Human mtDNA also ex- hibits more interpopulation heterogeneity (Gsa- = 0.351 + 0.025) than does nuclear DNA (GsT = 0.12). Moreover, the virtual absence of intermediate levels of linkage disequilibrium between pairs of sites is consistent with the absence of genetic recombina- tion and places constraints on the rate of mutation. Tests of the selective neutrality of mtDNA varia- tion, including the Ewens--Watterson and Tajima tests, indicate a departure in the direction consistent with purifying selection, but this departure is more likely due to the rapid growth of the human popu- lation and the geographic heterogeneity of the vari- ation. The lack of a good fit to neutrality poses prob- lems for the estimation of times of coalescence from human mtDNA data. Offprint requests to: D. A. Merriwether Key words: Mitochondrial DNA -- Human evo- lution -- Population genetics -- Molecular anthro- pology Introduction A controversy over the time of coalescence of mi- tochondrial DNA (mtDNA) variation in humans began when Cann et al. (1987) suggested that all human mitochondrial genomes could be traced to a single ancestral haplotype present in Africa ap- proximately 200,000 years ago. This date was de- termined from the observed level of mtDNA re- striction site variation and an estimated rate of sequence divergence of 2--4% per million years (Brown et al. 1979; Brown 1980; Miyata et al. 1982). Although it has long been appreciated that the great- est diversity of mtDNA occurs among native Af- ricans (Johnson et al. 1983), the divergence time of 200,000 years is widely contested by paleoanthro- pologists studying archaeological data, dental and bone morphology, cultural artifacts, and blood group and other nuclear genetic markers. In addition, an- cient prehuman remains dating back to 3 million years ago have been found in Africa (Johanson et al. 1982), indicating that the time of human origin greatly predated the mtDNA coalescence time. However, uncertainties about the demographics of ancient human populations disallow the conclusion that these paleoanthropological findings are incon-
Transcript of The structure of human mitochondrial DNA variation
J Mol Evol (1991) 33:543-555 Journal of Molecular Evolution (~ Springer-Vcrlag New York Inc. 1991
The Structure of Human Mitochondrial DNA Variation
D. Andrew Merriwether, 1 Andrew G. Clark, 2 Scott W. Ballinger, 3 Theodore G. Schurr, 3 Himla Soodyall, 4 Trefor Jenkins, 4 Stephen T. Sherry, 5 and Douglas C. Wallace 3
J University of Pittsburgh, Department of Human Genetics, School of Public Health, Pittsburgh, PA 15261, USA 2 Department of Biology and Institute of Molecular Evolutionary Genetics, Pennsylvania State University, University Park, PA 16802, USA 3 Center for Genetics and Molecular Medicine, Emory University School of Medicine, Rollins Research Center, Atlanta, GA 30322, USA 4 MRC Human Ecogenetics Research Unit, Department of Human Genetics, School of Pathology, South African Institute for Medical Research and the University of the Witwatersrand, Johannesburg, South Africa 5 Department of Anthropology, Pennsylvania State University, University Park, PA 16802, USA
Summary. Restrict ion analysis o f mi tochondr ia l D N A (mtDNA) o f 3065 humans f rom 62 geograph- ic samples identified 149 haplotypes and 81 poly- morphic sites. These data were used to test several aspects o f the evolut ionary past o f the human spe- cies. A dendrogram depicting the genetic relatedness o f all haplotypes shows that the nat ive African pop- ulations have the greatest diversi ty and, consistent with evidence f rom a variety o f sources, suggests an African origin for our species. The data also indicate that two individuals drawn at r andom from the en- tire sample will differ at approximately 0.4% of their m t D N A nucleotide sites, which is somewhat higher than previous estimates. H u m a n m t D N A also ex- hibits more interpopulat ion heterogeneity (Gsa- = 0.351 + 0.025) than does nuclear D N A (GsT = 0.12). Moreover , the virtual absence o f in termediate levels o f linkage disequil ibrium between pairs o f sites is consistent with the absence o f genetic recombina- t ion and places constraints on the rate o f mutat ion. Tests o f the selective neutral i ty o f m t D N A varia- tion, including the Ewens--Watterson and Taj ima tests, indicate a departure in the direct ion consistent with purifying selection, but this departure is more likely due to the rapid growth o f the human popu- lation and the geographic heterogeneity o f the vari- ation. The lack o f a good fit to neutral i ty poses prob- lems for the est imation o f t imes o f coalescence from human m t D N A data.
Offprint requests to: D. A. Merriwether
Key words: Mitochondria l D N A -- H u m a n evo- lution -- Populat ion genetics -- Molecular anthro- pology
Introduction
A controversy over the t ime o f coalescence o f mi- tochondrial D N A (mtDNA) variat ion in humans began when Cann et al. (1987) suggested that all h u m an mi tochondr ia l genomes could be traced to a single ancestral haplotype present in Africa ap- proximate ly 200,000 years ago. This date was de- t e rmined f rom the observed level o f m t D N A re- striction site variat ion and an est imated rate o f sequence divergence o f 2--4% per million years (Brown et al. 1979; Brown 1980; Miyata et al. 1982). Although it has long been appreciated that the great- est diversi ty o f m t D N A occurs among native Af- ricans (Johnson et al. 1983), the divergence t ime o f 200,000 years is widely contested by paleoanthro- pologists studying archaeological data, dental and bone morphology, cultural artifacts, and blood group and other nuclear genetic markers. In addit ion, an- cient p rehuman remains dating back to 3 mill ion years ago have been found in Africa (Johanson et al. 1982), indicating that the t ime o f h u m a n origin greatly predated the m t D N A coalescence time. However , uncertainties about the demographics o f ancient human populat ions disallow the conclusion that these paleoanthropological findings are incon-
544
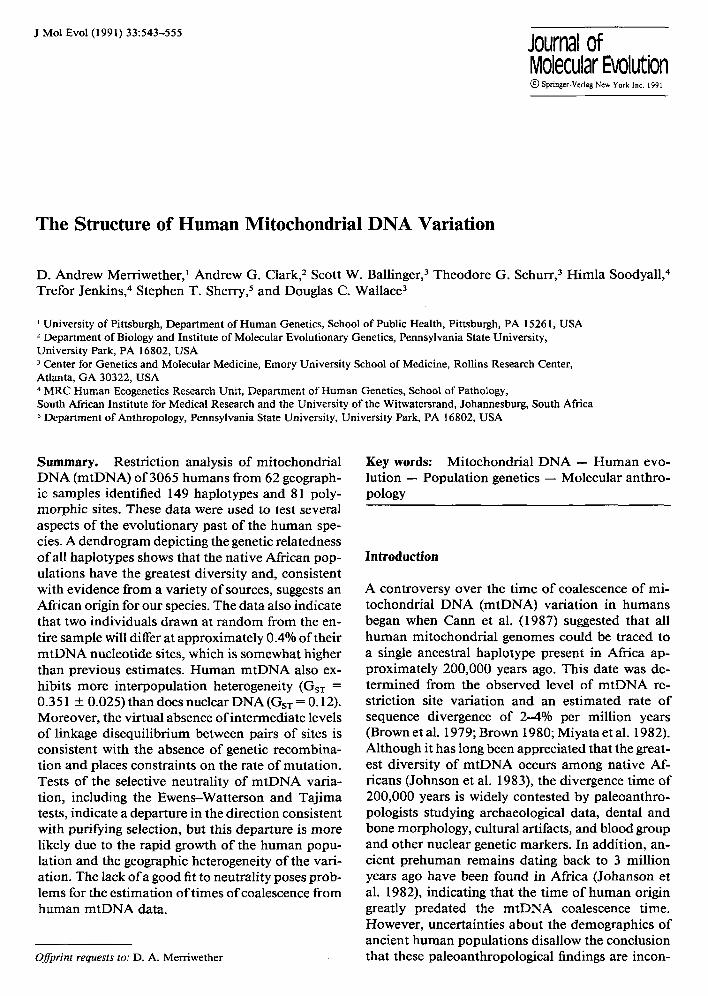
Table 1. Neutrality tests of human mtDNA restriction site variation
Ewens-Watterson test
Population n h F S C
Tajima test
s ~ D
Africans
Wolof (Senegal) 110 14 0.237 Peul (Senegal) 47 8 0.232 Tukolar (Senegal) 12 5 0.389 + Other Senegalese 17 6 0.273 San bushmen (1) 34 9 0.196 San bushmen (2) 59 10 0.215 Bantu 40 12 0.192 Zulu 30 8 0.222 Swazi 41 14 0.183 Xhosa 18 9 0.185 Tsonga 34 7 0.275 Sotho 29 10 0.153 Pedi 23 6 0.301 Tswana 15 9 0.147 Venda 30 I 1 0.173 Lemba 53 13 0.192 Hereto 54 9 0.366 Dama 43 13 0.175 Ovambo 22 7 0.343 Nama 46 9 0.318 Richtersveld "coloured" 35 9 0.338+ Johannesburg "coloured" 71 13 0.155
Caucasians
Finnish 112 10 0 .612++ Romans 95 19 0 . 3 8 7 + + + Sardinians 511 28 0 .412+++ Caucasians (US, Europe) 50 15 0 .359+++ Israeli Arabs 39 12 0 .350+++ Israeli Jews 39 9 0.291 Sicilians 90 17 0.327 + + Calabrians 60 11 0.459+ + Albanians 100 13 0 .487++ Apulians (S. Italy) 87 15 0.303+ Bergamo (N. Italy) 103 9 0.604+ English (S. Africa) 36 7 0.434 Jews (S. Africa) 55 6 0.479 Afrikaners 51 7 0.706 + + + Indians (S. Africa) 50 7 0 . 7 7 7 + + +
Asians
Japanese 74 10 0.621 + + Ainu 48 3 0.919 Koreans 78 13 0.492 + + + Aeta 37 3 0.801 Vedda 20 4 0.490 Orientals a 46 9 0.499 + + Tharu 91 13 0.348 + Malaysian Indians 16 6 0.492+ Malaysian Chinese 14 7 0.296+ Orang Asli (Malay) 32 7 0.269 Vietnamese 28 14 0.110 Taiwanese 20 9 0.285+
Kadazan (Borneo) 26 6 0.426 Rungus (Borneo) 3 2 0.556 Murnd (Borneo) 1 1 -- Bernngei (Borneo) 2 1 -- Bisaya (Borneo) 2 2 -- Mainland Malays 14 6 0.265
5 3 3+ 3 3 3 6 4
10++ 6+ 4+ 5 2 6 5 7+ 6 + + + 7 4+ 2 2 6
2 1 5 + + + 1 1 + + + 12++ 9 + + 6 + +
11++ 5 4 5 4+ 2 4+ 5 + + + 6 + +
5+ 2 8 + + + 0 2+ 4 5 5+ 5+ 3 8 6+
3+ 1 + + +
3
0.345 0.319 0.583 0.353 0.265 0.286 0.325 0.300 0.293 0.333 0.382 0.241 0.478 0.200 0.333 0.340 0.500 0.318 0.545 0.532 0.556+ 0.239
0.777++ 0.600 + + + 0.609 + + + 0.580+ + + 0.564+ + 0.385 0.544++ 0.667++ 0.690+ + 0.529+ 0.767+ 0.639 0.618 0 .8 3 7 +++ 0 .8 8 0 +++
0.784++ 0,958 0.692+ + + 0.892 0.650 0.696++ 0.527+ 0.688+ 0.500+ 0.406 0.179 0.500+
0.615 0 .6 6 7 +++
0.429
13 1.366 -1 .187 9 1.428 -0 .847 4 1.273 -0 .138 6 1.515 -0.491
11 3.039 0.407 24 5.148 0.104 12 2.113 -0 .773 10 1.761 -0 .958 28 3.324 - 1.677 12 2.111 -1 .458 I1 1.405 -1 .498 13 2.305 -1 .010 9 1.881 -0 .757
12 2.305 -1 .463 9 1.968 -0 .416
14 1.795 -1 .256 27 1.926 - 2 . 1 9 9 - - - 14 2.927 -0.281 8 1.364 -1 .243
12 2.296 -0 .463 22 3.664 -1 .053 17 3.630 0.094
11 0.881 -1 .479 31 1.557 - 2 . 2 8 0 - - - 41 1.060 - 2 . 2 3 5 - - - 13 1.621 -1 .323 12 1.371 - 1 . 6 0 0 - 10 1.449 -1.161 20 1.763 - 1 . 6 2 3 -
8 1.128 -0 .903 15 1.098 - 1 . 7 1 9 - 14 2.084 -0 .697 22 0.795 - 2 . 3 7 3 - - - 12 1.449 -1 .569 9 0.702 - 1 . 7 7 0 -
10 0.842 - 1 . 7 9 3 - 6 0.392 -1.801
21 0.756 - 2 . 4 9 9 - - - 15 0.167 - 2 . 9 3 6 - - - 22 0.922 - 2 . 4 0 2 - - - 13 0.303 - 2 . 8 5 8 - - - 14 0.684 - 3 . 0 2 6 - - - 8 0.913 -1 .382
13 1.262 -1 .385 5 0.625 - 1.929- -
10 1.839 - 1.617- 6 1.776 0.540
14 2.643 -0 .899 15 1.937 - 2 . 0 0 0 - - -
7 0.855 - 1 . 6 3 4 - 1 0.667 - 1 . 6 3 4 -
9 2.165 -0 .902

Table 1. Continued
545
Ewens-Watterson test Tajima test
Population n h F S C s /~ D
Amerindians Warao 30 1 1.000 0 1.000 11 0.000 - 3.218 Maya 37 4 0.493 0 0.676 5 1.072 -0.272 Ticuna 31 3 0.505 0 0.645 4 1.544 1.380 Pima 63 6 0.450 4 0.540 6 1.608 0.640 Papago 8 4 0.281 1 0.375 4 2.036 1.394 Hualapai 1 1 . . . . . . Other S.W. Amerindians 2 1 . . . . . .
Africans 863 73 0.084+++ 36+++ 0.140+++ 50 2.751 - 2 . 0 1 6 - Caucasians 1478 97 0.184+++ 4 8 + + + 0.298+++ 58 1.218 - 2 . 3 3 9 - - - Asians 552 74 0.171+++ 3 7 + + + 0.370+++ 61 1.330 - 2 . 3 9 6 - - - Amerindians 172 12 0.325 4 + + + 0.488 18 1.550 -1.431
All pooled 3065 218 0.082+++ 100+++ 0.201++ + 81 2.154 - 2 . 1 2 7 - - -
Symbols. n, the sample size; 0, the number of distinct haplotypes; F, the homozygosity; S, the number of singletons; C, the frequency of the most common haplotype; s, the number of segregating sites;/~, the estimate of 0 derived from infinite alleles sampling theory; D, Tajima's (1989a) test statistic. +, probability of a random value exceeding the observed values is <0.05. + +, P < 0.01; + + +, P < 0.001. Similarly, negative signs indicate significance of a one-tailed test with the observed value lower than expected ~This group consisted primarily of Chinese and Taiwanese Han and a few Japanese
s i s t en t w i th t he i n t e r p r e t a t i o n o f m t D N A d a t a b y C a n n et al . (1987). A n a l y s i s o f m t D N A c o n t r o l re- g ion s equences f r o m 83 i n d i v i d u a l s l e a d V i g i l a n t et al. (1989) to e s t i m a t e t he d e e p e s t r o o t o f the h u m a n m t D N A p h y l o g e n y d a t e d to 23 8 ,000 yea r s ago. S i m - i lar ly , H a s e g a w a a n d H o r a i (1991) a n a l y z e d the m t D N A sequence d a t a f r o m five d i f fe ren t s tud ies , and , a f te r t a k i n g i n to a c c o u n t t he v a r i a t i o n in sub- s t i t u t i o n ra t e s a m o n g si tes, t hey o b t a i n e d a t i m e for the d e e p e s t r o o t o f t h e i r d e n d r o g r a m o f 280 ,000 - 50 ,000 yea r s ago. The re fo r e , t he c o n s e n s u s coa les - cence t i m e a p p e a r s to b e a b o u t 250 ,000 y e a r s ago.
T h i s p a p e r d e s c r i b e s the a n a l y s i s o f t he la rges t set o f d a t a o f h u m a n m t D N A p o l y m o r p h i s m s as- s e m b l e d to d a t e to assess t he p o p u l a t i o n s t ruc tu re a n d p a t t e r n s o f d i v e r g e n c e o f h u m a n p o p u l a t i o n s . I n s tud ies o f m t D N A r e s t r i c t i o n s i te v a r i a t i o n , one o f two s a m p l i n g s t r a teg ies has t y p i c a l l y b e e n e m - p l o y e d . T h e first i n v o l v e s the a n a l y s i s o f t he m t - D N A s o f a s m a l l n u m b e r o f i n d i v i d u a l s w i th nu - m e r o u s r e s t r i c t i o n e n d o n u c l e a s e s to p r o d u c e a h igh r e s o l u t i o n m a p o f t he m o n o - a n d p o l y m o r p h i c s i tes p r e s e n t in a p o p u l a t i o n ( W h i t t a m et al. 1986; C a n n et al . 1987; S t o n e k i n g et al. 1990). T h e s e c o n d re- s t r ic t s a t t e n t i o n to j u s t s ix r e s t r i c t i o n e n z y m e s , a n d s a m p l e s m a n y m o r e i n d i v i d u a l s a t a l o w e r l eve l o f r e s o l u t i o n ( J o h n s o n et al. 1983; Excoff ier a n d L a n - g a n e y 1989; Excof l i e r 1990). F o r q u e s t i o n s r e l a t ing to t he i m p a c t o f d e m o g r a p h i c h i s t o r y o n h u m a n e v o l u t i o n , large, g e o g r a p h i c a l l y s t r u c t u r e d s a m p l e s a r e necessa ry . H e r e we focus on s tud ie s t h a t t o o k the s e c o n d a p p r o a c h , w h i c h uses la rger s a m p l e s izes a n d sc reens m t D N A s wi th t he s ix co re e n z y m e s to i d e n t i f y p o l y m o r p h i c r e s t r i c t i o n si tes . T h e en t i r e set
o f s a m p l e s cons i s t s o f 3065 i n d i v i d u a l s f r o m 62 p o p u l a t i o n s a m p l e s a n d is the la rges t such d a t a set a n a l y z e d to da te , b e i n g o v e r 2 0 - f o l d g rea t e r t h a n the l a rges t h i g h - r e s o l u t i o n d a t a set ( C a n n et al. 1987).
Materials and Methods
Geographic Origins of mtDNA Samples. The strategy in assem- bling the data used for this analysis was to employ all of the currently available restriction fragment length polymorphism (RFLP) information for the six enzymes HpaI, BamHI, HaelI, MspI, AvalI, and HinclI. This compilation yielded 105 restric- tion sites, 81 of which were polymorphic, and identified 218 haplotypes. Because of missing data, not all of these haplotypes were distinct, and the tree-building methods identified the 149 distinct haplotypes. Individuals were sampled from 61 popula- tions and were aggregated into four major ethnic groupings (Asian, Caucasian, African, and Amerindian). Table 1 indicates the geo- graphic origin ofaU the samples and identifies the sizes and ethnic grouping of the samples. All of the samples were verified to have different maternal grandmothers and, to that extent, represent distinct maternal lineages.
The Asian populations consist of 74 Japanese and 48 Ainu from northern Japan (Harihara et al. 1988), 78 Koreans from South Korea (Harihara et al. 1988; Ballinger et al. 1991), 37 Aeta [Negritos] (Harihara et ai. 1988), 20 Vedda from Sri Lanka (Ha- rihara et al. 1988), 91 Tharu from Nepal (Brega et al. 1986b), 46 Asians consisting mainly of Chinese and Taiwanese Han (John- son et al. 1983), 14 Malays, 14 Chinese Han, and 32 Senoi Ab- origines from peninsular Malaysia (Ballinger et al. 1991), 28 Viet- namese from South Vietnam (Ballinger et al. 1991), 20 Taiwanese Han (BaUinger et al. 1991), 26 Kadazan, 3 Rungus, 1 Murnd, 2 Brunei, and 2 Bisaya from Sabah State (Borneo), Malaysia (Bal- linger et al. 1991), and 16 Indians from the Malay peninsula (unpublished).
The Caucasian populations consist of 112 Finns (Vilkki et al. 1988), 95 Romans (Brega et al. 1986a; Santachiara Benerecetti el al. 1988), 511 Sardinians (Brega et al. 1986a; Santachiara

546
Benerecetti et al. 1988; Sartoris et al. 1988), 50 Americans and Europeans (Johnson et al. 1983), 39 Israeli Arabs and 39 Israeli Jews (Bonnr-Tamir et al. 1986), 103 Northern Italians (Sartoris et al. 1988) from the Bergamo area, 87 Apulians (De Benedictis et al. 1989a, b) from southern Italy, 60 Calabrians (TorToni et al. 1990) from southern Italy, 100 Albanians (Torroni et at., un- published) living in Calabria, southern Italy, 90 Sicilians (Semino et al. 1989), and 36 English, 55 Jews, 50 Indians, and 51 Afri- kaners from South Africa (Soodyall et al., unpublished).
The native African samples consist of I 10 Wolof, 47 Peul, 12 Tukolar, and 17 other Senegalese (Scozzari et al. 1988), 34 San bushmen from Botswana (Johnson et al. 1983), and 40 Bantu from Johannesburg, South Africa (Johnson et al. 1983). A more recent sample from South Africa included 123 Nguni speakers (30 Zulu, 41 Swazi, 18 Xhosa, and 34 Tsonga), 67 Sotho/Tswana speakers (29 Sotho, 23 Pedi, and 15 Tswana), 129 Bantu speakers (30 Venda, 53 Lemba, 54 Hereto, 22 Ovambo), 148 Khoisan speakers (43 Dama, 59 San, and 46 Nama), and 106 people of mixed race whose mtDNA was mostly of negroid origin (35 Richtersveld "coloured" from the Richtersveld area in the Cape, and 71 Johannesburg "coloured" (Soodyall et al., unpublished).
The Amerindian samples consist of 63 Pima, 8 Tohono O'od- ham (Papago), 1 Hualapai (Hopi), 1 Navajo, and 1 Pomp from southern Arizona (Wallace et al. 1985), 37 Maya from the Yu- catan peninsula of Mexico (Schurr et al. 1990), 31 Ticuna from western Brazil (Schurr et al. 1990), and 30 Warao from Venezuela (Johnson et al. 1983).
Molecular Methods. The procedures for collecting blood sam- pies, isolating the mtDNAs, and performing Southern blot hy- bridizations are described in the original papers. The complete nucleotide sequence of a human mtDNA (Anderson et al. 1981) made constructing unambiguous restriction maps possible. The resolution of the restriction maps was moderate, with 105 re- striction sites screened and a total of 81 polymorphic sites ob- served among the samples. All these samples were surveyed with at least four of the six enzymes. The Harihara et al. (1986) samples were surveyed without HaelI, the Johnson et al. (1983) and Bonnr- Tamir et al. (1986) samples without HinclI, and the Johnson et al. (1983) Warao Indian samples without HaelI or HinclI, the Sartoris et al. (1988) samples without HpaI or HinclI. The re- maining samples were surveyed with all six enzymes. Those sites corresponding to enzymes that were not screened were coded as missing data.
Descriptive Statistics. Heterozygosity per necleotide site was estimated from the restriction site data with the methods of Eng- els (1981) and Nei and Miller (1990). The Engels method pro- vides an estimate of the heterozygosity,/~ [Eq. (11), p. 6330] and the variance of H, V(/t) [Eq. (21), p. 6333] were calculated in a manner that makes no assumptions about the evolutionary past of the sample. The degree of population subdivision was quan- tified with the statistic h following the methods of Weir and Cockerham (1984) for a single haploid locus with many alleles, and with the statistic Gsr following the method of Takahata and Palumbi (1985). The statistical association among pairs of sites, or linkage disequilibrium, was calculated and reported as D', which is scaled to the minimum and maximum value that D can attain (Lewontin 1988). Because 3240 pairwise D' values were generated, these results are only reported as a histogram. Nucle- pride divergences were estimated from the number of shared and different restriction sites using the method of Nei and Miller (1990) and are expressed as the number of substitutions per nu- cleotide site. In this method, the estimators take into account the possibility of multiple substitutions and reverse mutations. Nu- cleotide divergences were estimated for all pairs of types scored for 74 or more of the polymorphic sites. This distance matrix was used to generate dendrngrams with the unweighted pair-
group method using arithmetic averages (UPGMA) cluster al- gorithm and with the neighbor-joining algorithm of Saitou and Nei (1987). Confidence in the tree topology was assessed by boot- strapping over the restriction sites. A tree whose terminal branch- es are the 62 population samples was calculated by estimating the average nucleotide divergence between individuals randomly drawn from all possible pairs of populations. In a similar way, a tree with the four major groups (Asian, Caucasian, African, and Amerindian) was constructed.
Neutrality Tests. The Ewens--Watterson test was used to test the fit of observed data to the infinite alleles model (Ewens 1972; Watterson 1977). Sampling theory of the infinite alleles model shows that the expected allele frequency distribution is fully spec- ified by the sample size (n) and the number of observed alleles (k). Given n and k, the test generates realizations of a sampling from this expected distribution. One-tailed tests were done by scoring the fraction of the simulations whose test statistic was greater than the observed number. In addition to the traditional test of homozygosity or gene identity (F), the significance of departures from expected number of singleton alleles (S) and from the frequency of the most common allele (C) was tested. The advantages of this approach were demonstrated in Clark (1987).
The neutrality test of Tajima (1989a) was also performed for each population and for various groupings of the data. The Ta- j ima test is based on the concordance between estimates of 0 = 4Nu obtained from the heterozygosity calculations and from the number of segregating sites. The former estimate depends on haplotype frequencies and is derived from the infinite alleles model. The latter estimate does not use population frequency data and is based only on the sample size and the number of segregating sites. The estimate is derived from the infinite sites model of neutral molecular evolution. The test can be applied either to nucleotide sequence data or to RFLP data. Rejection of the null hypothesis (that the data acceptably fit the predictions of the neutral theory) can be attributed to the same causes as rejection of the Ewens--Watterson test, including population het- erogeneity, lack of equilibrium, or natural selection. In addition, the Tajima test assumes that the mutation rate of all sites is equal.
Results
M e a s u r e m e n t s o f Diversity
T h e a l g o r i t h m o f N e i a n d M i l l e r ( 1 9 9 0 ) g a v e a n
e s t i m a t e o f t h e a v e r a g e n u m b e r o f n u c l e o t i d e s u b -
s t i t u t i o n s p e r s i t e as 0 . 0 0 4 3 +__ 0 . 0 0 1 0 . T h e m a t r i x
o f p a i r w i s e n u c l e o t i d e d i v e r g e n c e s w a s e s t i m a t e d
b o t h b y t h e m e t h o d o f N e i a n d M i l l e r ( 1 9 9 0 ) a n d
N e i a n d T a j i m a (1983) , a n d t h e v a l u e s w e r e f o u n d
t o b e n e a r l y i n d i s t i n g u i s h a b l e . T h e m o s t d i v e r s e p a i r
o f h a p l o t y p e s d i f f e r e d a t a n e s t i m a t e d 3 . 1 % o f t h e
n u c l e o t i d e s i tes . E n g e l s (198 I) m e a s u r e o f h e t e r o -
z y g o s i t y p e r s i t e y i e l d e d H = 0 . 0 0 4 0 +__ 0 . 0 0 0 6 . E n g -
e l ' s m e a s u r e o f m e a n h e t e r o z y g o s i t y c o r r e c t s f o r t h e
a s c e r t a i n m e n t b i a s t h a t r e s u l t s f r o m r e s t r i c t i o n s i t e
p o l y m o r p h i s m d a t a a n d i t m a k e s n o a s s u m p t i o n s
a b o u t t h e p r o c e s s e s b y w h i c h t h e v a r i a b i l i t y a r o s e
o r is m a i n t a i n e d . T h e s e e s t i m a t e s i m p l y t h a t t h e
p r o b a b i l i t y t h a t a p a r t i c u l a r n u c l e o t i d e s i te w i l l d i f -
f e r b e t w e e n t w o r a n d o m l y c h o s e n h u m a n s is a b o u t

18,
14,
12.
,1o.
I African
Amerindian
Asian
Caucasian
6-
4-
2-
0.0 0.1 0.2 0.3 0.4 0.5 0.6 0.7
Nucleot ide d ivergence (%)
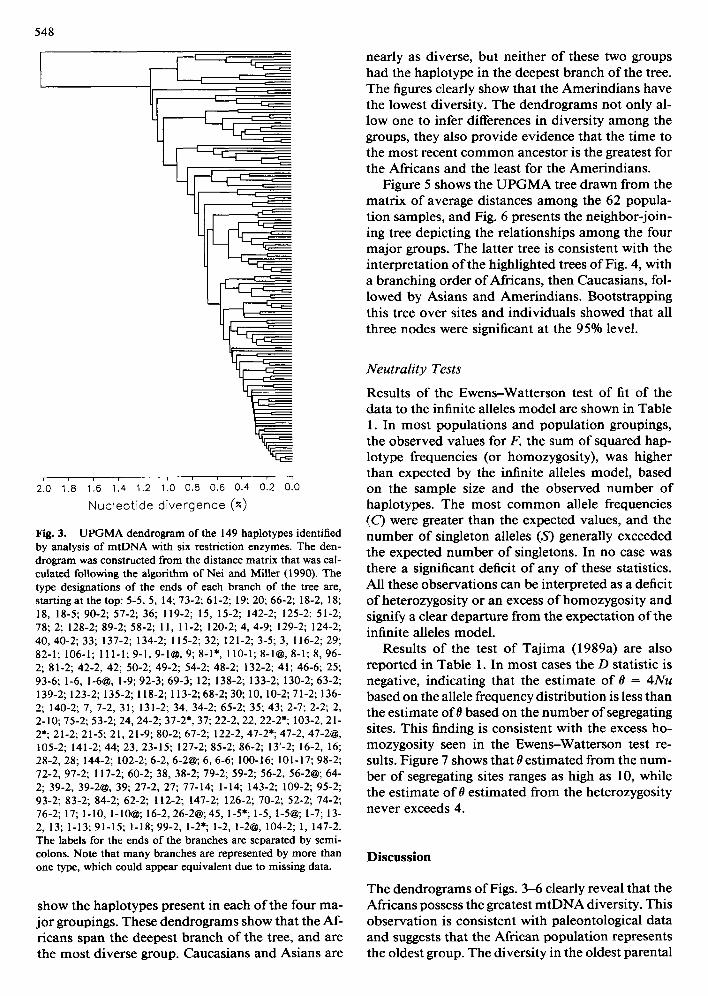
Fig. 1. Histogram of nucleotide diversity Or) within 59 of the 62 populations sampled (the two San samples were pooled and the admixed Richtersveld and "coloured" populations were ex- cluded). Note that the Africans have the most diverse popula- tions, and the Amerindians and Asians have the least diverse populations.
0.004, which is not significantly different f rom the est imate o f 0.0032 o f Cann et al. (1987). H u m a n m t D N A is thus about 10 t imes as diverse as un- translated and nondegenerate sites in human nuclear genes, and about three t imes as diverse as fourfold degenerate sites in human nuclear genes (Li and Sadler 199 i). In addit ion, the probabil i ty o f drawing two individuals having identical m t D N A restriction patterns (with respect to the enzymes examined here) was 0.08. Moreover , the probabil i ty o f identi ty var- ied widely among the four major groups, f rom 0.083 for Africans to 0.324 for Amerindians. Figure 1 shows that the different populat ions exhibit different levels o f p o l y m o r p h i s m at the nucleotide level, and
547
that the major groups also differ in mean nucleotide diversi ty (e.g., African populat ions have the highest diversity).
Population Subdivision
The Weir and Cockerham (1984) measure o f the degree o f popula t ion subdivision was 0 = 0.354 _+ 0.025. Similarly, the algori thm of Takaha ta and Pa- lumbi (1985) yielded an est imate o f GsT = 0.46 _+ 0.083. These estimates do not differ significantly f rom that o f Stoneking et al. (1990), who es t imated Gsv = 0.31 f rom their sample o f 241 individuals and 182 haplotypes.
Linkage Disequilibrium
Figure 2 shows the frequency histogram f rom the 3240 values o fD ' ; 1597 values were less than - 0 . 9 5 , 1172 values were greater than 0.95, and 319 values fell between - 0 . 0 5 and 0.05. Only 152 values were intermediate , suggesting that no or virtually no re- combina t ion has occurred in the sample. This result confirms a similar observat ion made in a study o f Amer ind ian m t D N A variat ion (Schurr et al. 1990).
Nucleotide Diversity and Dendrograms
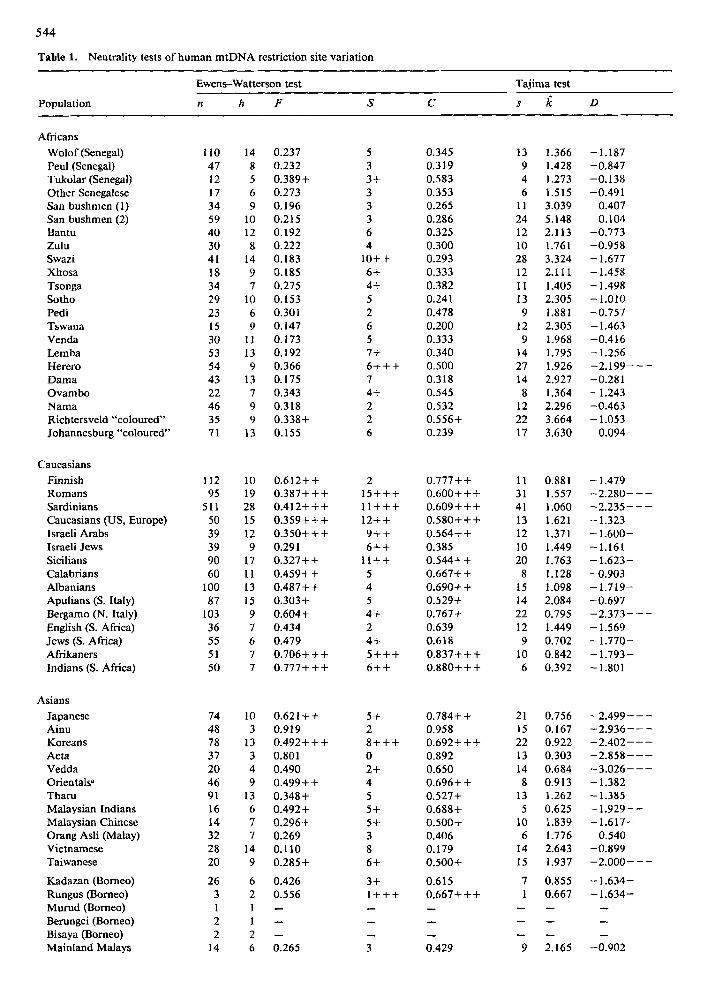
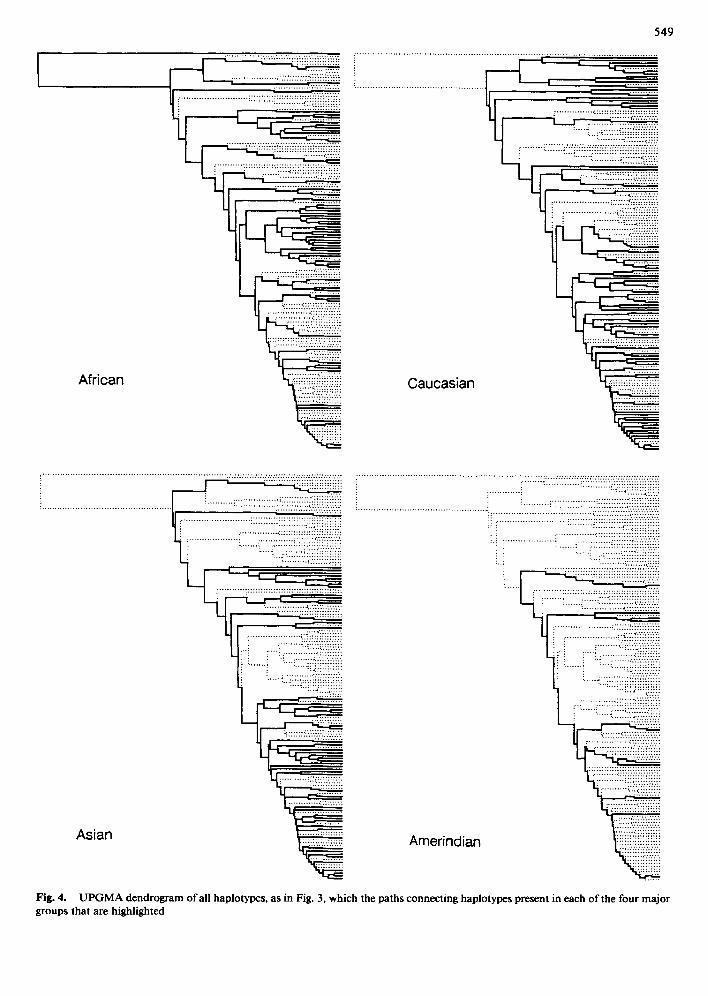
F r o m the matr ix o f pairwise est imates o f nucleotide divergence (do), a U P G M A tree having 149 hap- lotypes was const ructed (Fig. 3). The tree has several ra ther deep branches, but its most noticeable feature is the very deep branch that separates the topmos t haplotype f rom the others. A similar deep branch was found by Johnson et al. (1983) and by Cann et al. (1987), who found seven African lineages in a clade that depar ted markedly f rom the rest o f their sample. Figure 4 presents the same dendrogram as in Fig. 3 except the four panels are highlighted to
1400.
1o I
! I I
-1.0 -0 .8 -0 .6 -0 .4 -0 .2 0.0
D,
i
0.2 0.4 0.6 0.8 1.0 Fig. 2. Histogram of linkage disequilibria be- tween all pairs of polymorphic sites
548
210 1'.8 1'.6 114 1'.2 1'.0 0'.8 0'.6 0'.4 0'.2 0'.0 Nucleotide divergence (~.)
Fig. 3. UPGMA dendrogram of the 149 haplotypes identified by analysis of mtDNA with six restriction enzymes. The den- drogram was constructed from the distance matrix that was cal- culated following the algorithm of Nei and Miller (1990). The type designations of the ends of each branch of the tree are, starting at the top: 5-5, 5, 14; 73-2; 61-2; 19; 20; 66-2; 18-2, 18; 18, 18-5; 90-2; 57-2; 36; 119-2; 15, 15-2; 142-2; 125-2: 51-2; 78; 2; 128-2; 89-2; 58-2; 11, 11-2; 120-2; 4, 4-9; 129-2; 124-2; 40, 40-2; 33; 137-2; 134-2; 115-2; 32; 121-2; 3-5; 3, 116-2; 29; 82-1; 106-1; 111-1; 9-1, 9-1@, 9; 8-1", 110-1; 8-1@, 8-1; 8, 96- 2; 81-2; 42-2, 42; 50-2; 49-2; 54-2; 48-2; 132-2; 41; 46-6; 25; 93-6; 1-6, 1-6@, 1-9; 92-3; 69-3; 12; 138-2; 133-2; 130-2; 63-2; 139-2; 123-2; 135-2; 118-2; 113-2; 68-2; 30; 10, 10-2; 71-2; 136- 2; 140-2; 7, 7-2, 31; 131-2; 34, 34-2; 65-2; 35; 43; 2-7; 2-2; 2, 2-10; 75-2; 53-2; 24, 24-2; 37-2", 37; 22-2, 22, 22-2*; 103-2, 21- 2*; 21-2; 21-5; 21, 21-9; 80-2; 67-2; 122-2, 47-2*; 47-2, 47-2@, 105-2; 141-2; 44; 23, 23-15; 127-2; 85-2; 86-2; 13'-2; 16-2, 16; 28-2, 28; 144-2; 102-2; 6-2, 6-2@; 6, 6-6; 100-16; 101-17; 98-2; 72-2, 97-2; 117-2; 60-2; 38, 38-2; 79-2; 59-2; 56-2, 56-2@; 64- 2; 39-2, 39-2@, 39; 27-2, 27; 77-14; 1-14; 143-2; 109-2; 95-2; 93-2; 83-2; 84-2; 62-2; 112-2; 147-2; 126-2; 70-2; 52-2; 74-2; 76-2; 17; 1-10, 1-10@; 16-2, 26-2@;45, 1-5"; 1-5, 1-5@; 1-7; 13- 2, 13; 1-13; 91-15; 1-18; 99-2, 1-2"; 1-2, 1-2@, 104-2; 1, 147-2. The labels for the ends of the branches are separated by semi- colons. Note that many branches are represented by more than one type, which could appear equivalent due to missing data.
show the haplotypes present in each of the four ma- jor groupings. These dendrograms show that the Af- ricans span the deepest branch of the tree, and are the most diverse group. Caucasians and Asians are
nearly as diverse, but neither of these two groups had the haplotype in the deepest branch of the tree. The figures clearly show that the Amerindians have the lowest diversity. The dendrograms not only al- low one to infer differences in diversity among the groups, they also provide evidence that the time to the most recent common ancestor is the greatest for the Africans and the least for the Amerindians.
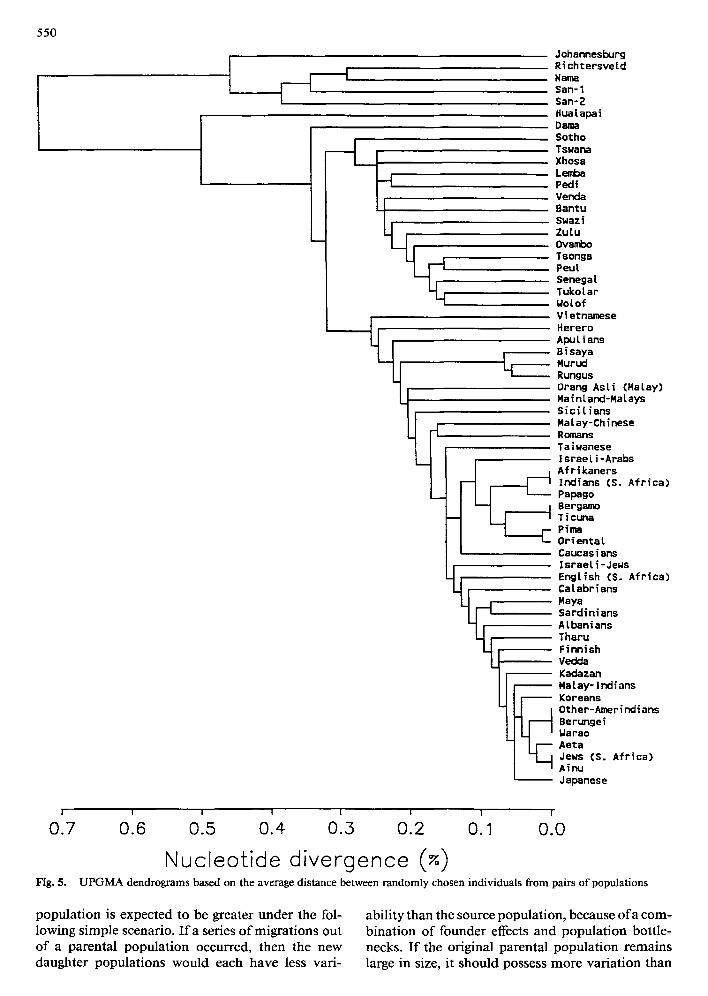
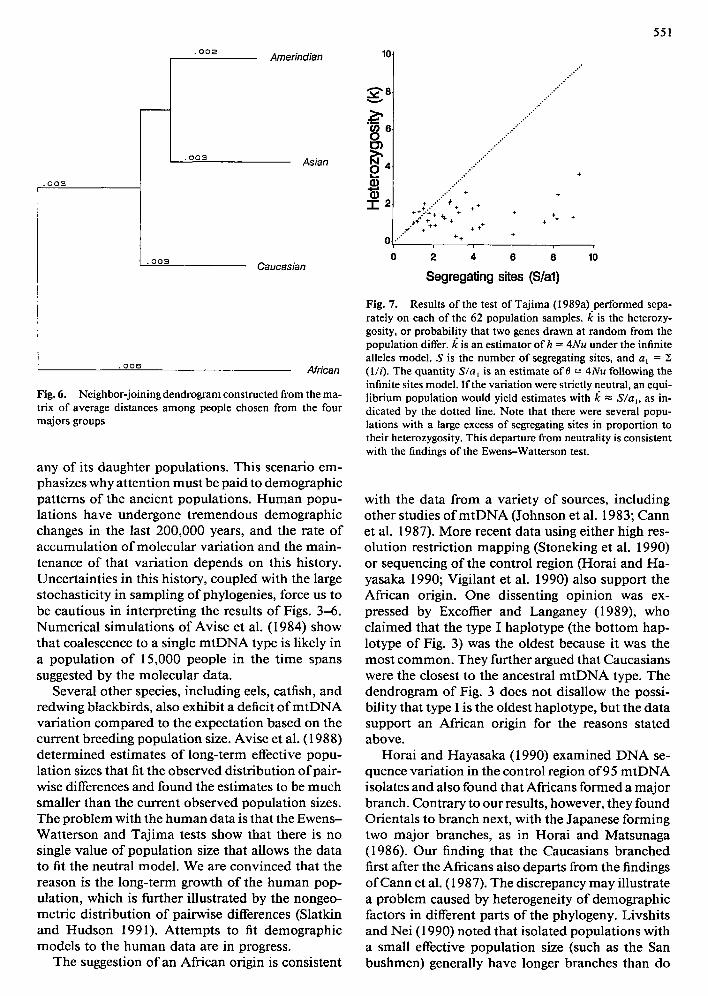
Figure 5 shows the UPGMA tree drawn from the matrix of average distances among the 62 popula- tion samples, and Fig. 6 presents the neighbor-join- ing tree depicting the relationships among the four major groups. The latter tree is consistent with the interpretation of the highlighted trees of Fig. 4, with a branching order of Africans, then Caucasians, fol- lowed by Asians and Amerindians. Bootstrapping this tree over sites and individuals showed that all three nodes were significant at the 95% level.
Neutrality Tests
Results of the Ewens--Watterson test of fit of the data to the infinite alleles model are shown in Table 1. In most populations and population groupings, the observed values for F, the sum of squared hap- lotype frequencies (or homozygosity), was higher than expected by the infinite alleles model, based on the sample size and the observed number of haplotypes. The most common allele frequencies (C) were greater than the expected values, and the number of singleton alleles (S) generally exceeded the expected number of singletons. In no case was there a significant deficit o f any of these statistics. All these observations can be interpreted as a deficit of heterozygosity or an excess of homozygosity and signify a clear departure from the expectation of the infinite alleles model.
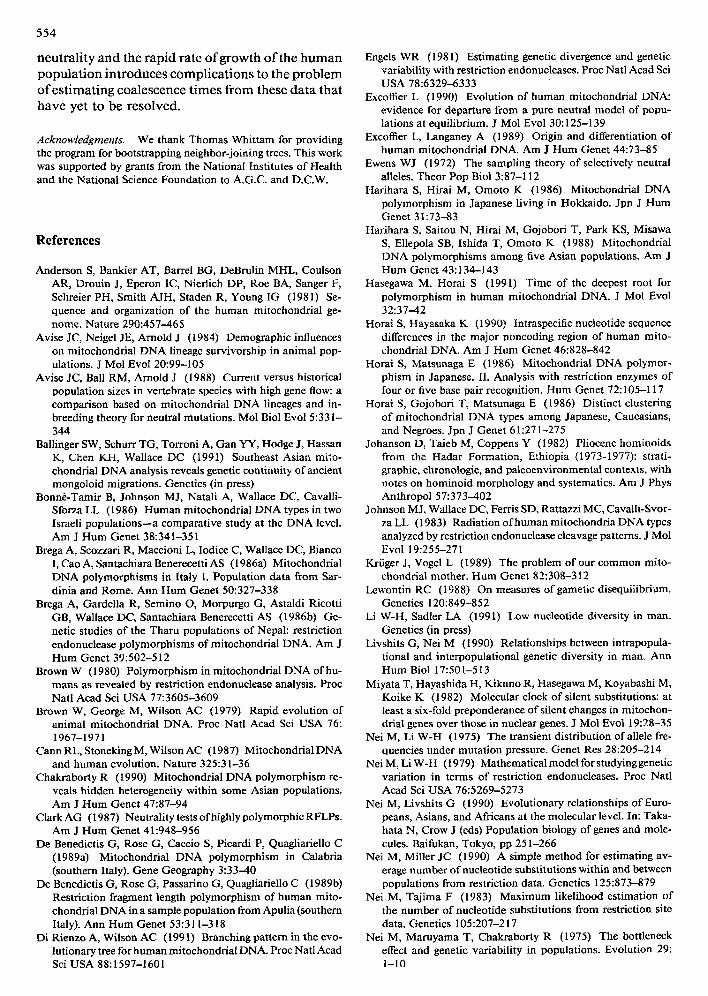
Results of the test of Tajima (1989a) are also reported in Table 1. In most cases the D statistic is negative, indicating that the estimate of 0 = 4Nu based on the allele frequency distribution is less than the estimate of 0 based on the number of segregating sites. This finding is consistent with the excess ho- mozygosity seen in the Ewens-Watterson test re- suits. Figure 7 shows that 0 estimated from the num- ber of segregating sites ranges as high as 10, while the estimate of 0 estimated from the heterozygosity never exceeds 4.
Discussion
The dendrograms of Figs. 3-6 clearly reveal that the Africans possess the greatest mtDNA diversity. This observation is consistent with paleontological data and suggests that the African population represents the oldest group. The diversity in the oldest parental
Afr ican
549
�9 I . . . . . . . . . . . .
i . . . . . . . . . . .
| | . . . . . . . . . . . . . . . . . . . . . . . . . . . .
: . . . . c . . . . . . . ; . - . . r
. . . . . . . . . . . ~ ' . ' .w : : : ~ i ~ i
. . . . . ~ . - . - . - - . . . �9 - - . -
. . . . . . . . . . . . . . . . . . . . . . . ~;:::;..f:':':':':':':':':':~
. f . . . . . . . . ~ q ~ ' 5 : : : ; : : : :
C a u c a s i a n
iii !!!! iii!!!iiiiii I
Asia n : ii i.i.i.i.:: ::.:..i i.::.::.::.::.:: A m e r in d ian iiiii!iiiii!i.i.ij.!i.i.i.i
Fig. 4. UPGMA dendrogram of all haplotypcs, as in Fig. 3, which the paths connecting haplotypes present in each of the four major groups that are highlighted
550
-q
L~m
Johannesburg Richtersvetd Nama San-1 San-2 Huatapai Dama Sotho Tswana Xhosa Lemba Pardi Verw:la Bantu Suazi Zutu Ovambo Tsonga Peut Senegal Tukolar Wotof Vietnamese Herero AWJtians Bisaya HurLed Rungus Orang Asti (MaLay) Haintand-Matays Sic iLians MaLay-Chinese Romans Taiwanese IsraeLi-Arabs Afr ikaners Indians (S. Af r ica) Papago
~ Berg~ Ticuna Pima
~ E Oriental Caucas i ans Israel i-Jews Er~tish (S. Af r ica) Catabrians Maya Sardinians ALbanians Tharu Finnish
~ V e c k ~ a
Matay-lndians 1 Koreans
Other-Amerindians gerungei Warao
- . . ~ Aeta Jews (S. Af r ica) Ainu Jal:mnese
I
0.7
Fig. 5.
i i i i | i I
0.6 0.5 0.4 0.3 0.2 0.1 0.0
Nucleotide divergence UPGMA dendrograms based on the average distance between randomly chosen individuals from pairs of populations
population is expected to be greater under the fol- lowing simple scenario. I r a series of migrations out of a parental population occurred, then the new daughter populations would each have less vari-
ability than the source population, because of a com- bination of founder effects and population bottle- necks. I f the original parental population remains large in size, it should possess more variation than
. 0 0 ~
Amerindian
, 0 0 3
�9 0 0 3 Asian
�9 0 0 3 Caucasian
�9 0 0 8 African
Fig. 6. Neighbor-joining dendrogram constructed from the ma- trix of average distances among people chosen from the four majors groups
any o f its daughter populat ions. This scenario em- phasizes why at tent ion must be paid to demographic pat terns o f the ancient populations. H u m a n popu- lations have undergone t remendous demographic changes in the last 200,000 years, and the rate o f accumulat ion o f molecular variat ion and the main- tenance o f that variat ion depends on this history. Uncertaint ies in this history, coupled with the large stochasticity in sampling o f phylogenies, force us to be cautious in interpreting the results o f Figs. 3-6. Numer ica l s imulat ions o f Avise et al. (1984) show that coalescence to a single m t D N A type is likely in a popula t ion o f 15,000 people in the t ime spans suggested by the molecular data.
Several o ther species, including eels, catfish, and redwing blackbirds, also exhibit a deficit o f m t D N A variat ion compared to the expectat ion based on the current breeding populat ion size. Avise et al. (1988) de te rmined estimates o f long-term effective popu- lation sizes that fit the observed distr ibution o f pair- wise differences and found the estimates to be much smaller than the current observed populat ion sizes. The problem with the human data is that the Ewens- Wat terson and Ta j ima tests show that there is no single value o f populat ion size that allows the data to fit the neutral model . We are convinced that the reason is the long-term growth o f the human pop- ulation, which is further illustrated by the nongeo- metr ic distr ibution o f pairwise differences (Slatkin and Hudson 1991). At tempts to fit demographic models to the human data are in progress.
The suggestion o f an African origin is consistent
551
10
V
8 e . .
..."
~O 4 Y .. '
...~
"1- 2 ++ .." *§ ++ + +. . 'u + +
~,." § 2 4 7 § 2 4 7
0 + *
0 2 4 6 fl
Segregating sites ($/al)
.~
.~ ..."
~ ..."
..." ...~
4"
§ § § +
+
10
Fig. 7, Results of the test of Tajima (1989a) performed sepa- rately on each of the 62 population samples. /~ is the heterozy- gosity, or probability that two genes drawn at random from the population differ./~ is an estimator of h = 4Nu under the infinite alleles model. S is the number of segregating sites, and at = (1/i). The quantity S/a~ is an estimate of 0 = 4Nu following the infinite sites model. Ifthe variation were strictly neutral, an equi- librium population would yield estimates with k ,.~ S/a~, as in- dicated by the dotted line. Note that there were several popu- lations with a large excess of segregating sites in proportion to their heterozygosity. This departure from neutrality is consistent with the findings of the Ewens-Watterson test.
with the data f rom a variety o f sources, including other studies o f m t D N A (Johnson et al. 1983; Cann et al. 1987). More recent data using either high res- olut ion restriction mapping (Stoneking et al. 1990) or sequencing o f the control region (Horai and Ha- yasaka 1990; Vigilant et al. 1990) also support the African origin. One dissenting opinion was ex- pressed by Excoffier and Langaney (1989), who claimed that the type I haplotype (the bo t tom hap- lotype o f Fig. 3) was the oldest because it was the most common . They further argued that Caucasians were the closest to the ancestral m t D N A type. The dendrogram of Fig. 3 does not disallow the possi- bility that type I is the oldest haplotype, but the data support an African origin for the reasons stated above.
Hora i and Hayasaka (1990) examined D N A se- quence variat ion in the control region o f 95 m t D N A isolates and also found that Africans formed a major branch. Contrary to our results, however, they found Orientals to branch next, with the Japanese forming two major branches, as in Hora i and Matsunaga (1986). Our finding that the Caucasians branched first after the Africans also departs f rom the findings o f Cann et al. (1987). The discrepancy m ay illustrate a problem caused by heterogeneity o f demographic factors in different parts o f the phylogeny. Livshits and Nei (1990) noted that isolated populat ions with a small effective popula t ion size (such as the San bushmen) generally have longer branches than do

552
groups with larger effective population sizes, but the problem of bottlenecks in parts of a phylogeny re- quires further study.
Measures of diversity of mtDNA have varied among studies in part because of differences in an- alytical methods and in part because of the differing evolutionary rates of the coding and noncoding D-loop regions of the mitochondrial genome being examined. The high resolution restriction mapping of Stoneking et al. (1990) yielded very similar es- timates of nucleotide divergence to ours, with the deepest root of their tree extending to a nucleotide divergence of about 0.6%. They also obtained a measure of population subdivision that was re- markably close to ours (Gsw = 0.31). In contrast to the Gsr value for mtDNA, the value for nuclear genes was estimated to be 0.12 (Nei and Livshits 1990). The high Gsw value for mtDNA underscores the utility of mtDNA for inferring human popula- tion structure and past migrations. In addition, it probably reflects the more rapid evolutionary rate of mtDNA, and may also indicate sex differences in migration (Takahata and Palumbi 1985).
The Ewens-Watterson test reveals an excess of the most common allele and an excess of singletons in the pooled samples as well as in most of the individual populations. This result can be viewed as an excess ofhomozygosity or a deficit of variation (heterozygosity). The Tajima test produced a qual- itatively similar result, showing an excess of segre- gating sites over what would be expected based on the level of diversity. There are four possible ex- planations for the rejection of neutrality, including natural selection, population growth or failure to attain equilibrium, population heterogeneity, and inhomogeneity in the neutral substitution rate. Pu- rifying selection is expected to be manifested in the excess of synonymous over nonsynonymous nucle- otide substitutions, and this will be examined in detail in a subsequent paper. The opportunity for purifying selection is clear, given the deleterious consequences of certain mitochondrial mutations (Wallace et al. 1988), but the data at present do not provide a strong case for selective differences among mtDNA types. Stoneking (1990) objected to Excof- fier's (1990) application of the Ewens-Watterson test to low-resolution mtDNA data, claiming that with sufficiently high resolution data, neutrality cannot be rejected. Although Excoffier (1990) overstated the case for selection, the evidence that human mtDNA variation is not in mutation-drift equilib- rium is incontrovertible. Stoneking's failure to reject neutrality with high resolution data reflects the lack of power of the Ewens-Watterson test when the al- lele frequency distribution becomes too even (as more sites are examined, more haplotypes appear unique). High resolution data provide a particularly
useful test of the distribution of counts of mis- matches (or distribution of branch lengths), and these analyses deafly demonstrate the impact of the ex- pansion of the human population on extant patterns of mtDNA variation (Di Rienzo and Wilson 1991).
Population heterogeneity is apparently another cause for departure from neutrality, as the pooled population exhibits greater departure than does the single population (Whittman et al. 1986; Chakra- borty 1990). A GST of 0.35 indicates that over one- third of the variation is interdemic, although we have no measure of the degree of heterogeneity at a more localized geographic level. Rapid population growth is almost certainly a major cause of depar- ture from neutrality in these data. We should see a large number of singletons because we expect to see a large number of new unique mutations in the rap- idly expanding populations. These unique muta- tions are typically population specific and remain rare (often appearing in only one individual). This trend is not overly surprising considering the rapid expansion of most human populations during re- corded history (Weiss 1989).
Every sample of genes must exhibit the phenom- enon of coalescence to a common ancestor, but the estimation of this time of coalescence requires that extant genetic variation be interpreted in terms of population genetic models. The implicit assump- tions of these models are that the genetic variation is neutral, and that the population is in mutat ion- drift equilibrium. Our data clearly demonstrate that mtDNA variation violates these assumptions. The observed departures from equilibrium may signifi- cantly influence the accuracy of coalescence time estimates. One possible cause for finding a common ancestor that occurred more recently than expected is rapid population growth. Nei and Li (1975) and Nei et at. (1975) discuss the genetic consequences of rapid population growth, especially in a popu- lation that has just passed through a bottleneck. When the group first passes through the bottleneck, it loses many alleles. During the subsequent popu- lation growth, the alleles that are present will un- dergo rapid drift in this small population as an allele is much more easily lost if it is possessed by only a few individuals. Any new mutations will be intro- duced at a relatively high frequency (as compared to larger populations such as the parent population) because the population size is small, thus increasing the probability that the mutation will remain in the population. The increased protection from loss of a new variant in a rapidly growing population results in a faster recovery of the number of segregating sites than of the recovery of heterozygosity. Tajima (1989b) showed that the number of segregating sites is more influenced by the current population size than is the average number ofnucleotide differences,

but that a bottleneck in the past will have a greater effect on the average number of nucleotide differ- ences than on the number of segregating sites. This finding is also consistent with the observed pattern of human mtDNA variation. Because it is clear that mtDNA diversity is not in equilibrium among hu- man populations, estimates of population age based on coalescence time need to be interpreted with cau- tion.
The Amerindians possess the shallowest root in the dendrogram indicating a recent divergence from Asian populations. Archaeological evidence sug- gests that the founding of the New World took place in the last 10-35,000+ years, and although the shal- low Amerindian root in the mtDNA tree is consis- tent with this evidence, the current data are insuf- ficient to sharpen this estimate. It has been shown (Wallace et al. 1985; Schurr et al. 1990; Torroni et al. 199 l) that the Amerindian mtDNAs represent a subset of Asian mtDNAs with the Asian haplotypes present at drastically altered frequencies. This find- ing is indicative of a founder effect where a small group split off from the parent group and founded a new population. The subset of alleles present in this founder population constitute all of the alleles in the new population. The subset of alleles present in this founder population constitute all of the alleles in the new population. Any rare alleles entering in the founder group will initially be present at much higher frequency than had existed in the parent pop- ulation. Genetic drift will fix or eliminate these al- leles in the new population, resulting in some rare alleles being present in much higher frequency than in the parent population and some common alleles from that parent population being lost in the newly founded population.
It is clear that a relatively small number of mtDNA lineages founded populations in the New World and that migrations through the Americas occurred fairly rapidly (Schurr et al. 1990). Indeed, sites at the southern tip of South America (Pell's Cave) were inhabited at least 11,000 years ago (Shutler 1983). If we take 30,000 years ago as an entry point, ancestral Amerindians had reached and inhabited all parts of the New World in just 19,000 years. We know that at the time of European contact the Amerindians in the New World numbered in the millions, as some Maya and Aztec cities com- prised up to 100,000 people. This extraordinary rate of population growth forces a conservative inter- pretation of any tests that are based on equilibrium population genetic theory.
One particular estimate that has received consid- erable attention is the estimate of the time of coa- lescence of mtDNA variation to a single common ancestor (Cann et al. 1987). The estimate of 180,000-- 360,000 years for this coalescence was recently sup-
553
ported by estimates of 238,000 years and 280,000 years based on sequence variation in the control region (Vigilant et al. 1989; Hasegawa and Horai 1991). These estimates were based on the maximum divergence seen in the sample, and an estimate of the rate of nucleotide divergence in the mtDNA molecular clock. The clock rate was estimated from variation within humans and, as Nei and Livshits (1990) point out, the stochastic error in estimating molecular clock rates is much less when based on interspecific divergence. Using the human--chim- panzee split, Nei and Livshits (1990) arrive at a somewhat greater time for the coalescence of the data of Cann et al. (1987). Perhaps a more serious problem is the rapid growth of the human popula- tion. As Kriiger and Vogel (1989) demonstrate, the expected number of maternal lineages that remain after a period of time is greatly increased when a population is growing. According to this argument, the estimate of ~200,000 years may be an under- estimate. The marked departure from the prediction of the neutral theory makes us skeptical of the ac- curacy of applying neutral clock theory for estimat- ing the time of coalescence of a sample. If we are able to estimate the rate of growth of the population of prehistoric man, better estimates of the coales- cence time might be made.
Conclusions
We have presented further evidence supporting an African origin of human mtDNAs, as first observed by Johnson et aL (1983) and Cann et al. (1987) based upon the deep African root in their mtDNA den- drograms. We also observed the same pattern re- ported by Cann et al. (1987) where Asian and Cau- casian mtDNAs appear to have diverged soon after the founding of the African mtDNA population, as is evidenced by the wide distribution of both Asian and Caucasian mtDNAs throughout the dendro- gram. In addition, we find a similar pattern of allele distribution to that reported by Whittam et al. (1986) and Excoffier (1990), which shows a deficit of di- versity relative to the number of haplotypes. The departure from neutl~lity indicated by the Ewens- Watterson and Tajima tests may identify a rapidly growing nonequilibrium population. These data suggest that multiple mitochondrial founder events have occurred in human history, including the founding of the New World (Wallace et al. 1985; Schurr et al. 1990; Torroni et al. 1991), and the founding of Australia and many island groups worldwide. The result is that the human population is not at equilibrium with respect to the gain of variation by mutation and its stochastic loss by drift. The departure from the pattern expected under strict
554
n e u t r a l i t y a n d the r ap id ra te o f g r o w t h o f the h u m a n
p o p u l a t i o n i n t r o d u c e s c o m p l i c a t i o n s to t he p r o b l e m
o f e s t i m a t i n g coa l e scence t i m e s f r o m these da t a t ha t
h a v e ye t to be r e so lved .
Acknowledgments. We thank Thomas Whittam for providing the program for bootstrapping neighbor-joining trees. This work was supported by grants from the National Institutes of Health and the National Science Foundation to A.G.C. and D.C.W.
References
Anderson S, Bankier AT, Barrel BG, DeBrnlin MHL, Coulson AR, Drouin J, Eperon IC, Nierlich DP, Roe BA, Sanger F, Schreier PH, Smith AJH, Staden R, Young IG (1981) Se- quence and organization of the human mitochondrial ge- nome. Nature 290:457--465
Avise JC, Neigel JE, Arnold J (1984) Demographic influences on mitochondrial DNA lineage survivorship in animal pop- ulations. J Mol Evol 20:99-105
Avise JC, Ball RM, Arnold J (1988) Current versus historical population sizes in vertebrate species with high gene flow: a comparison based on mitochondrial DNA lineages and in- breeding theory for neutral mutations. Mol Biol Evol 5:331- 344
Ballinger SW, Schurr TG, Torroni A, Gan YY, Hodge J, Hassan K, Chert K_r-I, Wallace DC (1991) Southeast Asian mito- chondrial DNA analysis reveals genetic continuity of ancient mongoloid migrations. Genetics (in press)
Bonn6-Tamir B, Johnson M J, Natali A, Wallace DC, Cavalli- Sforza LL (1986) Human mitoehondrial DNA types in two Israeli populations--a comparative study at the DNA level. Am J Hum Genet 38:341-351
Brega A, Scozzari R, Maccioni L, Iodiee C, Wallace DC, Bianco I, CaoA, SantachiaraBenerecettiAS (1986a) Mitochondrial DNA polymorphisms in Italy I. Population data from Sar- dinia and Rome. Ann Hum Genet 50:327-338
Brega A, Gardella R, Semino O, Morpurgo G, Astaldi Ricotti GB, Wallace DC, Santachiara Benerecetti AS (1986b) Ge- netic studies of the Tharn populations of Nepal: restriction endonuclease polymorphisms of mitochondrial DNA. Am J Hum Genet 39:502-512
BrownW (1980) PolymorphisminmitochondrialDNAofhu- mans as revealed by restriction endonuelease analysis. Proc Natl Acad Sci USA 77:3605-3609
Brown W, George M, Wilson AC (1979) Rapid evolution of animal mitochondrial DNA. Proc Nail Acad Sei USA 76: 1967-1971
CannRL, StonekingM, WiisonAC (1987) MitochondrialDNA and human evolution. Nature 325:31-36
Chakraborty R (1990) Mitoehondrial DNA polymorphism re- veals hidden heterogeneity within some Asian populations. Am J Hum Genet 47:87-94
ClarkAG (1987) NeutralitytestsofhighlypolymorphicRFLPs. Am J Hum Genet 41:948-956
De Benedictis G, Rose G, Caccio S, Picardi P, Quagliariello C (1989a) Mitochondrial DNA polymorphism in Calabria (southern Italy). Gene Geography 3:33--40
De Benedictis G, Rose G, Passarino G, Quagliariello C (1989b) Restriction fragment length polymorphism of human mito- chondrial DNA in a sample population from Apulia (southern Italy). Ann Hum Genet 53:311-318
Di Rienzo A, Wilson AC (1991) Branching pattern in the evo- lutionary tree for human mitoehondrial DNA. Proc Natl Acad Sei USA 88:1597-1601
Engels WR (1981) Estimating genetic divergence and genetic variability with restriction endonucleases. Proc Natl Acad Sci USA 78:6329-6333
Excoffier L (1990) Evolution of human mitochondrial DNA: evidence for departure from a pure neutral model of popu- lations at equilibrium. J Mol Evol 30:125-139
Excoflier L, Langaney A (1989) Origin and differentiation of human mitochondrial DNA. Am J Hum Genet 44:73-85
Ewens WJ (1972) The sampling theory of selectively neutral alleles. Theor Pop Biol 3:87-112
Harihara S, Hirai M, Omoto K (1986) Mitochondrial DNA polymorphism in Japanese living in Hokkaido. Jpn J Hum Genet 31:73-83
Harihara S, Saitou N, Hirai M, Gojobori T, Park KS, Misawa S, Ellepola SB, Ishida T, Omoto K (1988) Mitochondrial DNA polymorphisms among five Asian populations. Am J Hum Genet 43:134-143
Hasegawa M, Horai S (1991) Time of the deepest root for polymorphism in human mitochondrial DNA. J Mol Evol 32:37--42
Horai S, Hayasaka K (1990) Intraspecifie nucleotide sequence differences in the major noncoding region of human mito- chondrial DNA. Am J Hum Genet 46:828-842
Horai S, Matsunaga E (1986) Mitochondrial DNA polymor- phism in Japanese. II. Analysis with restriction enzymes of four or five base pair recognition. Hum Genet 72:105-117
Horai S, Gojobori T, Matsunaga E (1986) Distinct clustering of mitochondrial DNA types among Japanese, Caucasians, and Negroes. Jpn J Genet 61:271-275
Johanson D, Taieb M, Coppens Y (1982) Piiocene hominoids from the Hadar Formation, Ethiopia (1973-1977): strati- graphic, chronologic, and paleoenvironmental contexts, with notes on hominoid morphology and systematics. Am J Phys Anthropol 57:373-402
Johnson M J, Wallace DC, Ferris SD, Rattazzi MC, Cavalli-Svor- zaLL (1983) RadiationofhumanmitochondriaDNAtypes analyzed by restriction endonuclease cleavage patterns. J Mol Evol 19:255-271
Krfiger J, Vogel L (1989) The problem of our common mito- chondrial mother. Hum Genet 82:308-312
Lewontin RC (1988) On measures of gametic disequiIibrium. Genetics 120:849-852
Li W-H, Sadler LA (1991) Low nueleotide diversity in man. Genetics (in press)
Livshits G, Nei M (1990) Relationships between intrapopula- tional and interpopulational genetic diversity in man. Ann Hum Biol 17:501-513
Miyata T, Hayashida H, Kikuno R, Hasegawa M, Koyabashi M, Koike K (1982) Molecular clock of silent substitutions: at least a six-fold preponderance of silent changes in mitochon- drial genes over those in nuclear genes. J Mol Evol 19:28-35
Nei M, Li W-H (1975) The transient distribution of allele fre- quencies under mutation pressure. Genet Res 28:205-214
NeiM, LiW-H (1979) Mathematical model for studying genetie variation in terms of restriction endonueleases. Proc Natl Acad Sci USA 76:5269-5273
Nei M, Livshits G (1990) Evolutionary relationships of Euro- peans, Asians, and Africans at the molecular level. In: Taka- hata N, Crow J (eds) Population biology of genes and mole- cules. Baifukan, Tokyo, pp 251-266
Nei M, Miller JC (1990) A simple method for estimating av- erage number of nucleotide substitutions within and between populations from restriction data. Genetics 125:873-879
Nei M, Tajima F (1983) Maximum likelihood estimation of the number of nucleotide substitutions from restriction site data. Genetics 105:207-217
Nei M, Maruyama T, Chakraborty R (1975) The bottleneck effect and genetic variability in populations. Evolution 29: 1-10

Saitou N, Nei M (1987) The neighbor-joining method: a new method for constructing phylogenetic trees. Mol Biol Evol 4: 406-425
Santachiara Benerecetti AS, Scozzari R, Semino O, Torroni A, Brega A, Wallace DC (1988) Mitochondrial D N A polymorphisms in Italy. I1. Molecular analysis of new and rare morphs from Sardinia and Rome. Ann Hum Genet 52: 39-56
Sartoris S, Varetto O, Migone N, Cappello N, Piazza A, Ferrara GB, Ceppellini R (1988) Mitochondrial DNA polymor- phism in four Sardinian villages. Ann Hum Genet 52:327- 340
Schurr TG, Ballinger SW, Gan YY, Hodge JA, Merriwether DA, Lawrence DN, Knowler WC, Weiss KM, Wallace DC (1990) Amerindian mitochondrial DNAs have rare Asian mutations at high frequencies suggesting a limited number of founders. Am J Hum Genet 46:613-623
Scozzari R, Tortoni A, Semino O, Sirugo G, Brega A, Santa- chiaraBenerecettiAS (1988) Genetic studies on the Senegal population I. Mitochondrial DNA polymorphisms. Am J Hum Genet 43:534--544
Semino O, Tortoni A, Scozzari R, Brega A, DeBenedictis G, Santachiara Benerecetti AS (1989) Mitochondrial DNA polymorphisms in Italy. III. Population data from Sicily: a possible quantitation of maternal African ancestry. Ann Hum Genet 53:193-202
Shutler R (ed) (1983) Early man in the New World. Sage Pub- lications, Beverly Hills, CA
Slatkin M, Hudson RR (1991) Pairwise comparisons of mi- tochondrial DNA sequences in stable and exponentially grow- ing populations. Genetics (in press)
Spuhler JN (1988) Evolution ofmitochondrial DNA in mon- keys, apes, and humans. Year Book Phys Anthropol 31:15-48
StewartFM (1977) Computeralgorithmforobtainingarandom set of allele frequencies for a locus in an equilibrium popu- lation. Genetics 86:482-483
StonekingM (1990) Departure of human mitochondrial DNA variation from neutral expectations: an alternative explana- tion. J Mol Evol 31:343-346
Stoneking M, Jorde LB, Bhatia K, Wilson AC (1990) Geo- graphic variation in human mitochondrial DNA from Papua New Guinea. Genetics 124:717-733
Tajima F (1983) Evolutionary relationship of DNA sequences in finite populations. Genetics 105:437-460
555
Tajima F (1989a) Statistical method for testing the neutral mu- tation hypothesis by DNA polymorphism. Genetics 123:585- 595
Tajima F (1989b) The effect of change in population size on DNA polymorphism. Genetics 123:597-601
Takahata N, Palumbi SR (1985) Extranuclear differentiation and gene flow in the finite island model. Genetics 109:441- 457
Torroni A, Semino O, Rose G, De Benedictis G, Brancati C, Santachiara Benerecetti AS (1990) Mitochondrial DNA polymorphisms in the Albanian population of Calabria (southern Italy). Int J Anthropol 5:97-104
Torroni A, Schurr TG, Yang CC, Szathmary EJE, Williams RC, Schanfield MS, Troup GA, Knowlder WC, Lawrence DN, Weiss KM, Wallace DC (1991) Amerindian mitochondrial DNA analysis reveals pre-Clovis colonization of the New World. Genetics (in press)
Vigilant L, Pennington R, Harpending H, Kocher TD, Wilson AC (1989) Mitochondrial DNA sequences in single hairs from a southern African population. Proc Natl Acad Sci USA 86: 9350-9354
Vilkki J, Savontaus M, Nikoskelainen EK (1988) Human mi- tochondrial DNA in Finland. Hum Genet 80:317-321
Wallace DC, Garrison K, Knowler WC (1985) Dramatic found- er effects in Amerindian mitochondrial DNAs. Am J Phys Anthropol 68:149-155
Wallace DC, Singh G, Lott MT, Hodge JA, Schurr TG, Lezza AMS, Elsas LJ, Nikoskelainen EK (1988) Mitochondrial DNA mutation associated with Leber's hereditary optic neu- ropathy. Science 242:1427-1430
Watterson GA (1977) The homozygosity test of neutrality. Ge- netics 88:405-417
WeirBS (1990) Genetic data analysis. Sinauer, SunderlandMA Weir BS, Cockerham CC (1984) Estimating F-statistics for the
analysis of population structure. Evolution 38:1358-1370 Weiss KM (1989) On the number of members of the genus
Homo who have ever lived, and some evolutionary impli- cations. Hum Biol 56:637-650
Whittam TS, Clark AG, Stoneking M, Cann RL, Wilson AC (1986) Allelic variation in human mitochondrial genes based on patterns of restriction site polymorphism. Proc Natl Acad Sci USA 83:9611-9615
Received May 5, 1991/Revised June 24, 1991