Phylogeographic population diversity of Bipolaris sorokiniana ...

Biologi~alj'oumal ofthe Linnean SocteQ (1999), 66: 357-371. With 3 figures
Article ID: bijl. 1998.027 1, available online at http://www.idealibrary.com on 10 EbL c
Phylogeographic structure and mitochondria1 DNA variation in true lemmings (Lemmus) fkom the Eurasian Arctic
VADIM FEDOROV,''23* ANNA GOROPASHNAYA,' GORDON H. JARRELL3 AND KARL FREDGA'
'Department of Genetics, Uppsala Uniuersip, Box 7003, S-750 07 Uppsala, Sweden 21nstitute of Plant and Animal Ecology, Ekaterinbulg, Russia Uniuersip o f Alaska Museum, Fairbanks, USA
Received 21 April 1998; accepted f o r publication I S 3 u $ 1998
The geographic pattern of mtDNA variation in lemmings from 13 localities throughout the Eurasian Arctic was studied by using eight restriction enzymes and sequencing of the cytochrome b region. These data are used to reveal the vicariant history of h m u s , and to examine the effect of the last glaciation on mtDNA variation by comparing diversity in formerly glaciated areas to the diversity in non-glaciated areas. Phylogenetic congruence across different Arctic taxa and association between observed discontinuities, and probable Pleistocene barriers, suggest that glacial-interglacial periods were crucial in the vicariant history of h r n u s . Differences in amount of divergence (2.1-9.1 %) across different historical barriers indicate chronologically separate vicariant events during the Quaternary. Populations from a formerly glaciated area are no less variable than those in the non-glaciated area. Regardless of glaciation history, no population structure and high haplotype diversity were found within geographic regions. The lack of population structure indicates that populations with high ancestral haplotype diversity shifted their distribution during the Holocene, and that lemmings tracked a changing environment during the Quaternary without reduction of effective population size.
0 1999 The Linnran Socirt) of London
ADDITIONAL KEY WORDS:-Beringia - population structure - glaciation - gene flow - vicariant events - islands - environmental changes - Quaternary - cytochrome b gene.
CONTENTS
Introduction . . . . . . . . . . . . . . . . . . . . . . . 358 Material and methods . . . . . . . . . . . . . . . . . . . 359
Collection of specimens . . . . . . . . . . . . . . . . . 359 MtDNA analyses . . . . . . . . . . . . . . . . . . . 360 Data analyses . . . . . . . . . . . . . . . . . . . . . 361
Results . . . . . . . . . . . . . . . . . . . . . . . . 361 Phylogenetic relationships among haplotypes . . . . . . . . . . 362 MtDNA diversity . . . . . . . . . . . . . . . . . . . 363
* Corresponding author. E-mail: [email protected]
0024-4066/99/030357+15 $30.00/0 357
0 1999 The Linnean Society of London

358 V. FEDOROV E T A L
Discussion . . . . . . . . . . . . . . . . . . . . . . . 366 Phylogeography of LemmuJ . . . . . . . . . . . . . . . . 366 MtDNA diversity . . . . . . . . . . . . . . . . . . . 368
Acknowledgements . . . . . . . . . . . . . . . . . . . . 369 References . . . . . . . . . . . . . . . . . . . . . . . 369
INTRODUCTION
Arctic biota underwent dramatic changes during Quaternary glacial-interglacial periods (Chapin & Korner, 1994), and these historical processes are reflected in genes and gene pools of Arctic species. Phylogeography-the analysis of information integrating allele genealogies, allele frequencies, and geographic distribution of alleles-provides insight into the historical factors generating extant geographic patterns of genetic variation (Avise, 1994). By using a phylogeographic approach in several codistributed species, it is possible to infer some historical processes at the landscape level (Templeton & Georgiadis, 1996; Zink, 1996). Many Holarctic phylogeographic studies focus on taxa from Europe or North America (review Hewitt, 1996), but little is known about phylogeographic structure in species from the Eurasian Arctic on a continental scale.
There is a pivotal difference in glaciation history between the North American and the Eurasian parts of Arctic. While isolation in glacial refugia was significant for genetic differentiation of Arctic species in North America (Bernatchez & Dodson, 1994), and Beringia served as an important refugium (Pielou, 1991), in the Eurasian Arctic the extent of glaciation was limited (Andersen & Borns, 1997) and no glacial refugia were defined. Palaeoecological evidence indicate that Arctic species survived the Pleistocene glaciations in periglacial areas south of ice sheets in Europe and western Siberia (Kowalski, 1995) and in the non-glaciated area east of the River Lena in eastern Siberia (Sher, 199 1). Despite the lack of extant geographic barriers in the Eurasian Arctic, there is evidence for the vicariant events in the dunlin, Calidris a&na (Wenink et al,, 1996), Daphnia pulex (Weider & Hobaek, 1997), and the collared lemming, Dicrostonyx torquatus (Fedorov, Fredga & Jarrell, in press). The significance of historical isolation is strongly supported if the geographical position of phylogenetic division is concordant across different taxa (Avise, 1994). Therefore, phylogeographic studies of additional species are needed to elucidate general trends in vicariant history of the Eurasian Arctic.
Geographic congruence of phylogenetic splits across different species indicates past separation by isolating barriers, and thus provides insight into the glaciation history of landscape. Conversely, the effect of past glaciation on the level of genetic diversity on a local geographic scale is less evident. It was suggested that populations living in areas glaciated during the late Pleistocene are genetically less variable than populations in non-glaciated areas (Sage & Wolff, 1986). Hewitt (1 993) showed that repeated bottlenecking during range expansion into newly available habitats following glacial retreat, is expected to reduce genetic variation in formerly glaciated areas. Accordingly, northward latitudinal decrease in genetic variation has been observed in several taxa (cf. Merila, Bjorklund & Baker, 1997). In contrast, a high level of mtDNA diversity was reported in microtine rodents from recently glaciated northern Europe (Tegelstrom, 1987; Jaarola & Tegelstrom, 1995). Equally low mtDNA diversity was found in the Eurasian populations of the collared lemming irrespective of glaciation history (Fedorov et al., in press). The contrasting glaciation history of

PHYLOGEOGRAPHY OF LEMML'S 359
Alaska I
mchatk
Figure I . Map showing the sampling localities (a) and geographic distribution of mtDNA phylogenetic groups: W, Western group; C, Central group, and E, Eastern group. Locality numbers refer to Material and Methods and Table 1 .
western us. eastern Eurasian Arctic (Sher, 1991) makes it possible to examine the effect of glaciation on present levels of genetic diversity in different taxa by comparing intrapopulation genetic diversity between glaciated and non-glaciated regions situated at similar latitudes and within the same landscape zones.
True lemmings (Lmmus) are Arctic rodents with nearly circumpolar distribution from the Scandinavian Peninsula to Baffin Island. Although the taxonomy of Lemmus is controversial, we follow Jarrell & Fredga (1 993) in regarding hmmus from the Eurasian Arctic as three species: L. lemmus on the Scandinavian Peninsula, L. sibiricus in the Russian Arctic from the White Sea to the north eastern Siberia, and L. trimucronatus in the north eastern Siberia and North America.
Here we examine mitochondria1 DNA phylogeny and diversity in 13 lemming populations of Ommus from across the Eurasian Arctic. These data are used for two purposes. First, the phylogeny is used to examine vicariant history of Lmmus in the Palearctic and compare the geographic positions of phylogenetic splits across different Arctic species. Second, we compare mtDNA diversity between populations from glaciated and non-glaciated parts of the Eurasian Arctic to examine the effect of the last glaciation on levels of genetic variation, specifically to test the prediction that populations from formerly glaciated areas are less variable than populations from non-glaciated areas.
MATERIAL AND METHODS
Collection of specimens
' Lemmings were trapped in 13 localities (Fig. 1) during summer of 1994 on the Swedish-Russian Tundra Ecology Expedition (expedition site numbers are given in brackets; Fredga et al., 1995):
1. Kola Peninsula (1) 2. Western Yamal Peninsula (5)

360 V. FEDOROV BTAL.
TABLE 1. Number of individuals sampled (n), number of haplotypes observed (fi), haplotpe (h) and nucleotide (K) diversities and their standard errors (SE) in 1 1 populations of Lemrnus from the Palearctic.
Populations and phylogeographic groups are designated as in Figure 1
Geographic locality n J?h h SE K(%) SE(%)
Western group 2 3 4 5
Central group Mainland 7 8 9 Islands 10 11 12 Eastern group 13
6 6 7
6 6 6
7
Deglaciated area
7 1 .00 5 0.93 6 1 .OO 5 0.93
Non-glaciated area
6 1 .OO 6 1 .00 6 0.95
5 0.93 4 0.87 3 0.73
6 0.93
0.07 0.12 0.10 0.12
0.10 0.10 0.10
0.12 0.12 0.16
0.12
1.089 0.083 1.136 0.135 0.695 0.101 0.790 0.149
0.647 0.212 0.429 0.108 0.623 0.151
0.637 0.189 0.122 0.052 0.05 1 0.035
0.802 0.148
3. North-Western Taymyr Peninsula (8) 4. Northern Taymyr Peninsula (9) 5. North-Eastern Taymyr Peninsula (1 0) 6. Olenekskiy Bay (1 1) 7. Yana Delta (12) 8. North-West of Indigirka Delta (14) 9. West of Kolyma Delta (15a)
10. Kotelnyi Island (1 3b) 1 1. Fadeyevskiy Island (1 3a) 12. South-Western Wrangel Island (1 7) 13. East of Kolyma Delta (15b).
Numbers of lemmings studied at different localities are given in Table 1. One specimen was studied from Kola Peninsula (1) and three specimens were studied from Olenekskiy Bay (6). In Norway lemmings were collected from Finse in autumn 1994 and six specimens were used in the present study. Two specimens from Alaska (AF5624, and AF10906) were obtained from the Frozen Tissue Collection, University of Alaska Museum, Fairbanks. One specimen from Kamchatka was obtained from the colony at the Institute of Plant and Animal Ecology, Yekaterinburg. We removed the liver, heart, and kidney and stored them at - 7OoC until isolation of mtDNA. The specimens collected during the Tundra Expedition were deposited in the collections of the Zoological Institute in St. Petersburg, Russia.
MtDNA anahses
Mitochondria1 DNA was extracted using the phenol-chloroform method (Jaarola & Tegelstrom, 1995). Aliquots of mtDNA from the total of 81 individuals were cut separately with eight tetranucleotide restriction enzymes: DdeI, HaeIII, HinfI, HpaII,

PHYLOGEOGRAPHY OF LEMhfUS 36 1
MboI, RsaI, Sau 961, and TaqI. Restriction fragments were separated by electro- phoresis in 5 ‘10 polyacrylamide gels and visualized by silver staining (Tegelstrom, 1992). From the fragment profiles generated by each enzyme, we inferred the presence or absence of specific restriction sites. A hand-drawn minimum network of site differences among fragment profiles was constructed for each enzyme. However, the differences between fragment profiles of lemmings from three different geographic regions (Fig. 1) were so large as to obviate inferences about restriction site differences. Therefore we sequenced 9 15 bp fragment of the mitochondria1 cytochrome b gene (cyt b) in eight individuals, one from each selected locality (2, 6, 8, 9, 12, 13, Kamchatka and Alaska) to obtain sequence divergence estimates between the main phylogeographic groups. The cyt b gene was isolated via PCR using the primers: L14724B and H15915 (Irwin, Kocher & Wilson, 1991). The fragments were gel-purified (Wizard kit, Promega Gorp.) and then sequenced with the Sequenase kit (version 2.0, United States Biochemical) according to the manufacture’s specification except that the primer annealing was done with snapp- cooling technique (Palumbi et al., 1991). We applied manual sequencing, using the following internal primers: universal H 15 149 (Kocher et al., 1989), and specially designed: 5’TTC TTC GC ATTC C A (TC)TT3’; and 5’ATTTT(AG)GT(AT)TT(AG)TTTTTCCC3’, which correspond to human positions L15024, L15294, and L15486, respectively. Sequences were aligned by eye with the cyt b of Mus (Bibb et al., 1981). Sequence data have been deposited with the GenBank Data Library under Accession Nos. AJ01267 1- AJ012678.
5’GC CTC C ATATTCTT(TC)ATCTG 3’;
Data anabses
For sequencing data, estimates of divergence between haplotypes were calculated by using Kimura’s (1 980) two-parameter method, and a neighbour-joining (NJ phylogenetic tree (Saitou & Nei, 1987) was constructed from divergence estimates with the MEGA program (Kumar, Tamura & Nei, 1993).
The following analyses of phylogenetic relationships among haplotypes and mtDNA diversity within each phylogeographic group are based on restriction site data. Estimates of nucleotide divergence between haplotypes were calculated according to Nei (1987) by using the REAP computer package (McElroy et al., 1992), and NJ trees were constructed from divergence estimates with the MEGA program. We estimated haplotype diversity (h), nucleotide diversity ( 7 ~ ) within populations and geographic groups, and nucleotide divergence (daxy) between groups of haplotypes with correction for intragroup diversity (Nei, 1987) using REAP. Variances of nucleotide diversity and divergence estimates were obtained by using jack-knifing over restriction enzymes (Nei & Miller, 1990). To measure geographic subdivision of mtDNA variation we performed analysis of molecular variance (Excoffier, Smouse & Quattro, 1992), with minimum number of mutation differences matrix as input, through the program WINAMOVA (Excoffier, 1993).
RESULTS
For the cyt b sequence, a total of 915 bp was scored, among which 138 sites were variable. The cyt b sequences were unique for each of the eight individuals examined.

362 V. FEDOROV ETAL.
24 INDIGIRKA 8 C
7 W KOLYMA 9
100 30 WRANGEL 12
34 KAMCHATKA
2 E KOLYMA 13
8 ALASKA
I 0 0.01
Figure 2. Neighbour-joining, unrooted tree illustrating phylogenetic relationships among eight mtDNA haplotypes representing the three main phylogeographic groups (W, C and E) in the Palearctic Lemrnus. The tree is based on the cyt b sequence divergence estimates. Haplotypes are numbered as in Table 2. Locality numbers refer to Fig. I . Numbers to the left of the nodes are bootstrap percentages from 1000 replications.
TABLE 2. Estimates of the cyt b sequence divergence ("0, above diagonal) between selected mtDNA haplotypes in Lemmus and their standard errors (SE YO, below diagonal). Haplotypes are designated as
in Figure 2
Haplowe 12 26 24 7 2 8 34 30
12 ~ 0.7 1 5.04 4.79 11.08 10.94 4.79 5.43 26 0.29 ~ 5.30 4.79 1 1.08 10.94 4.79 4.9 1 24 0.80 0.83 ~ 0.47 12.07 11.35 1.43 1.55
7 0.78 0.78 0.24 ~ 11.50 10.79 1.43 1.55 2 1.24 1.24 1.31 1.27 ~ 2.90 11.50 11.63 8 1.24 1.24 1.26 1.22 0.60 - 11.36 11.21
34 0.78 0.78 0.42 0.42 1.27 1.26 1.31 30 0.84 0.79 0.43 0.43 1.28 1.25 0.40 ~
~
The restriction fragment variation in lemmings within the three phylogeographic groups (Fig. 1): the Western 0, the Central (C), and the Eastern (E) could be explained by gain or loss of particular restriction sites. Of the 337 sites studied in the Western group, 165 were variable; of the 309 sites in the Central group, 132 were variable; and 58 out of 256 sites studied were variable in the Eastern group. We found 32 different mtDNA haplotypes among the 35 lemmings investigated from the Western group, 30 haplotypes among the 37 lemmings from the Central group, and eight haplotypes among nine individuals from the Eastern group. None of the restriction site haplotypes were shared between the geographic localities. The binary restriction site data matrices are available from the first author on request.
Phlogenetic relationships among haploppes
The NJ tree (Fig. 2) based on the cyt b sequence divergence estimates (Table 2) indicates a major (9.1%) difference across the River Kolyma between the Central

PHYLOGEOGRAPHY OF ZEhLMliS 363
groups us. the Eastern group which includes haplotypes from both sides of the Bering Strait (Fig. 1). It is noteworthy that within the Central group, the haplotype from Kamchatka is closely related (1.3%) to the Wrangel Island haplotype (Fig. 2) despite the present geographic separation by the distribution range of the Eastern phylogeographic group east of the Kolyma (Fig. 1). Another phylogenetic split (4.3%) is across the River Lena between haplotypes from the Western and the Central phylogeographic groups.
The NJ trees (Fig. 3) based on nucleotide divergence estimates from the restriction site data show phylogenetic relationships among haplotypes within the Western and the Central phylogeographic groups. There are two tip clades significantly supported by bootstrap in the Western group and haplotypes from the western Arctic (Norway, 1 and 2) form a monophyletic group (Fig. 3 A). Apart from three clades of haplotypes from the island populations (10, 11 and 12), no significant phylogenetic clusters are defined in the Central group (Fig. 3 B). There are no significantly supported clades of haplotypes in the Eastern group (not shown), and the interpopulation divergence estimate (daxy) across the Bering Strait, between seven haplotypes from locality 13 and two haplotypes from Alaska, is 0.67% (SE = 0.15%). The maximum parsimony trees (not shown) based on the restriction site data show the same significant phylogenetic clusters within the main phylogeographic groups.
MtDNA divers$
Four localities (1 , 6, Alaska and Kamchatka) had inadequate samples and diversity analyses in the Norwegian population will be reported elsewhere. With the exception of the Wrangel Island population (1 2) intrapopulation haplotype and nucleotide diversity estimates are generally high (Table 1). The nucleotide diversity estimates in populations (2, 3, 4 and 5) from the area to the west of the Lena (Fig. 1) which was glaciated during the last ice age did not differ from the diversity estimates in populations (7, 8, 9 and 13) from non-glaciated mainland to the east of the Lena (Table 2; Wilcoxon two-sample test: U = 14; two-tailed -0.10). The nucleotide diversity estimates in the island populations (1 0, 1 1 and 12) were significantly lower (U = 22; two-tailed P= 0.05) than those in the all populations studied from the Arctic mainland.
The levels of subdivision of the mtDNA diversity between populations were estimated separately within the Western group, excluding Norway and localities 1 , 6; and within the Central group by using analysis of molecular variance, which takes into account both haplotype frequencies and number of restriction site differences among them (Table 3). Within the Western group, subdivision is significant and 2 1 O/O of the total mtDNA variation is distributed among populations. However, there is no subdivision among the Taymyr population (3, 4 and 5) in the Western group if the most geographically distant, the Yamal locality 2, is excluded (Table 3). As expected from the haplotype phylogeny in the Central group (Fig. 3 B), subdivision among all populations is high, 82% of total variation is allocated among populations. This subdivision reflects high degree of differentiation of the island populations (1 0, 1 1 and 12) and appears insignificant among the mainland populations (7, 8 and 9) if the island localities are excluded (Table 3). Similarly, interpopulation nucleotide divergence estimates (daxy), corrected for intrapopulation diversity, in- dicate no net divergence among the Taymyr populations (3, 4 and 5; Table 4) and among the mainland populations (7, 8 and 9) in the Central group (Table 5).

364 V. FEDOROV ETAL.
A
23 E TAYMYR 5
I I
ll YAMAL2 I 12
-4 n 13 W TAI
W TAYMYR 3
] NTAYMYR4
18 NTAYMYR4
'MyR3
NORWAY
0 0.01
B 13 YANA 7 L 4 INDIGIRKA 8
FADEYEVSKIY ISLAND 11
L 2 1 d L 6 INDIGIRKA 8 8 W KOLYMA 9 1' 12 YANA 7
KOTELNYI ISLAND 10
18 YANA 7 ] WKOLYMA9
INDIGIRKA 8
YANA 7
5 INDIGIRKA 8 L 10YANA7
0 0.01
Figure 3. Neighbour-joining, unrooted trees illustrating phylogenetic relationships (A) among 32 mtDNA haplotypes in hmmus from the Western group, and (B) among 30 haplotypes from the Central group. The trees are based on restriction site data. Numbers to the left of the nodes are bootstrap percentages from 500 replications. Locality numbers refer to Fig. 1.

PHYLOGEOGRAPHY OF E W M U S 365
TABLE 3. Analysis of molecular variance (AMOVA) within and among populations of k m m u s from the Eurasian Arctic. P, the significance level, is the proportion of 1000 permutation results larger than
the observed estimate @st
Variance component Variance Yo total P (more extreme Dst value)
Western Group Among populations (2-5) Within populations
Among populations (3, 4, 5) Within populations
Central Group Among populations (7-- 12) Within populations
Among populations (7, 8, 9) Within populations
2.409 9.211
-0.130 8.667
9.484 2.089
- 0.049 3.537
20.73 0.002 0.207 79.27
- 1.52 0.61 1 -0,015 101.52
8 1.95 <0.001 0.8 19 18.05
- 1.40 0.545 -0.014 101.40
TABLE 4. Estimates of mtDNA sequence divergence (daxy YO, above diagonal) between populations of Lamus from the Western group corrected for intrapopulation diversity and their standard errors
(SE YO, below diagonal). Populations are designated as in Figure 1
Population Norway + 1 2 3 4 5 6
Norway + 1 - 2.10 2.26 2.44 2.54 3.20 2 0.33 - 0.35 0.55 0.57 1.18 3 0.30 0.04 - - 0.04 0.04 0.67 4 0.38 0.1 1 0.01 - -0.04 0.55 5 0.41 0.14 0.03 0.02 - 0.35 6 0.48 0.28 0.23 0.17 0.14 -
TABLE 5. Estimates of mtDNA sequence divergence (daxy YO, above diagonal) between populations of L a m u s from the Central group corrected for intrapopulation diversity and their standard errors
(SE '10, below diagonal). Populations are designated as in Figure 1
Population 7 8 9 10 1 1 12
7 - 0.01 -0.02 0.73 0.55 2.09 8 0.01 - 0.0 1 0.86 0.60 2.19 9 0.01 0.02 - 0.73 0.63 2.04 10 0.28 0.3 1 0.30 - 1.05 2.42 11 0.21 0.2 1 0.22 0.28 - 2.66 12 0.26 0.32 0.23 0.28 0.44 -
Analysis of molecular variance and the divergence estimates show that no mtDNA variation is allocated among the populations within each region: recently glaciated Taymyr (3, 4 and 5) and non-glaciated mainland (7, 8 and 9) between Rivers Lena and Kolyma. As haplotype diversity estimates within each region are equally high, 0.99, the lack of differentiation among populations means that pairs of haplotypes from the same population have no less divergent sequences than pairs of haplotypes from separate populations within the same region. This lack of population structure allows us to compare total nucleotide diversity estimates calculated for all individuals sampled in each of these areas with contrasting glaciation history: .n = 0.864% (SE = 0.101%, n = 18) in the Taymyr populations us. .n=0.569% (SE=O.l38O/o, n = 19) in
366 V. FEDOROV ETAL.
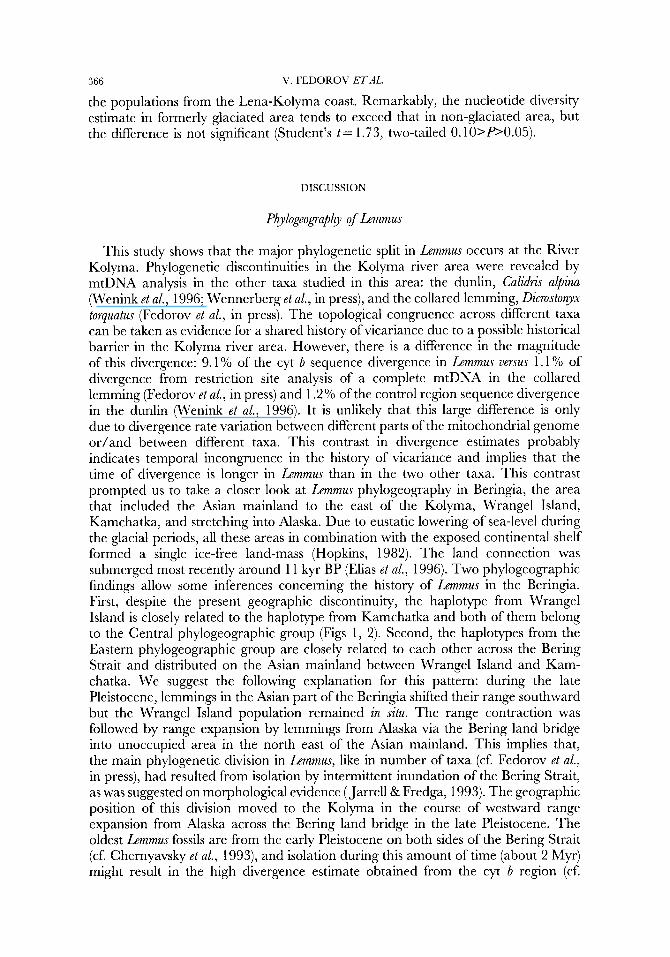
the populations from the Lena-Kolyma coast. Remarkably, the nucleotide diversity estimate in formerly glaciated area tends to exceed that in non-glaciated area, but the difference is not significant (Student's t= 1.73, two-tailed O.lO>p>O.O5).
DISCUSSION
Phylogeography of Lemmus
This study shows that the major phylogenetic split in Lernmus occurs at the River Kolyma. Phylogenetic discontinuities in the Kolyma river area were revealed by mtDNA analysis in the other taxa studied in this area: the dunlin, Calidris alpina (Wenink et al., 1996; Wennerberg et al., in press), and the collared lemming, Dicrostonyx torquatus (Fedorov et al., in press). The topological congruence across different taxa can be taken as evidence for a shared history of vicariance due to a possible historical barrier in the Kolyma river area. However, there is a difference in the magnitude of this divergence: 9.1 YO of the cyt b sequence divergence in Lemmus versus 1.1 O/O of divergence from restriction site analysis of a complete mtDNA in the collared lemming (Fedorov et al., in press) and 1.2% of the control region sequence divergence in the dunlin (Wenink et al., 1996). It is unlikely that this large difference is only due to divergence rate variation between different parts of the mitochondria1 genome or/and between different taxa. This contrast in divergence estimates probably indicates temporal incongruence in the history of vicariance and implies that the time of divergence is longer in Lemmus than in the two other taxa. This contrast prompted us to take a closer look at Lemrnus phylogeography in Beringia, the area that included the Asian mainland to the east of the Kolyma, Wrangel Island, Kamchatka, and stretching into Alaska. Due to eustatic lowering of sea-level during the glacial periods, all these areas in combination with the exposed continental shelf formed a single ice-free land-mass (Hopkins, 1982). The land connection was submerged most recently around 11 kyr BP (Elias et al., 1996). Two phylogeographic findings allow some inferences concerning the history of Lemrnus in the Beringia. First, despite the present geographic discontinuity, the haplotype from Wrangel Island is closely related to the haplotype from Kamchatka and both of them belong to the Central phylogeographic group (Figs 1, 2). Second, the haplotypes from the Eastern phylogeographic group are closely related to each other across the Bering Strait and distributed on the Asian mainland between Wrangel Island and Kam- chatka. We suggest the following explanation for this pattern: during the late Pleistocene, lemmings in the Asian part of the Beringia shifted their range southward but the Wrangel Island population remained in situ. The range contraction was followed by range expansion by lemmings from Alaska via the Bering land bridge into unoccupied area in the north east of the Asian mainland. This implies that, the main phylogenetic division in Lemmus, like in number of taxa (cf. Fedorov et al., in press), had resulted from isolation by intermittent inundation of the Bering Strait, as was suggested on morphological evidence (Jarrell & Fredga, 1993). The geographic position of this division moved to the Kolyma in the course of westward range expansion from Alaska across the Bering land bridge in the late Pleistocene. The oldest Lemrnus fossils are from the early Pleistocene on both sides of the Bering Strait (cf. Chernyavsky et al., 1993), and isolation during this amount of time (about 2 Myr) might result in the high divergence estimate obtained from the cyt b region (cf.

PHYLOGEOGRAPHY OF LEA4hfU.Y 367
Martin & Palumbi, 1993). The main split in mtDNA phylogeny is consistent with current Lemmus taxonomy (Chernyavsky et al., 1993; Jarrell & Fredga, 1993) and indicates that division between the Palearctic L. sibiricus and the essentially Nearctic L. trimucronatus is at the Kolyma.
The second major mtDNA division separating the Central and the Western phylogeographic groups was found at the Lena (Figs 1,2). A phylogenetic discontinuity in this area was also found in the collared lemming, Dicrostonyx (Fedorov et al., in press). Allozyme data from 19 loci studied in h m u s showed genetic division in the same geographic area (Fedorov et al., unpublished). Thus, both congruence across different taxa and concordance across different gene genealogies within Lemmus, support the significance of historical separation in the Lena river area. Although the extent of the Pleistocene glaciation was limited in this part of the Siberian Arctic, an ice sheet on the Verkhoyansky Mountain Ridge (Andersen & Borns, 1997), in combination with the ice sheet centered on the East Siberian shelf (Grosswald et al., 1992) might be the cause of the historical barrier at the Lena. The 4.3% of the cyt b sequence divergence across the river suggests that separation between the Western and the Central phylogeographic groups occurred prior to. the last glaciation (Weichsel, 1 15-10 kyr BP, Andersen & Borns, 1997). This deep phylogenetic division within L. sibiricus is not reflected in current taxonomy (Chernyavsky et al., 1993; Jarrell & Fredga, 1993).
Lemmings of the Western phylogeographic group are distributed over a vast area of the Eurasian Arctic, from Scandinavia to the Lena (Fig. 1). Within this group, the haplotypes from the Scandinavian Peninsula (Norway and 1) form a monophyletic clade supported significantly by the bootstrap test (Fig. 3A). The geographic gap in sampling between localities 1 and 2 does not allow us to distinguish the effects of historical factors us. isolation by distance through statistical testing. Nevertheless, the estimate of nucleotide divergence between the Scandinavian group (Norway and 1) and the population (2) from Yamal is four times larger than divergence estimate (Table 4) between the Yamal population (2) and the N. Taymyr population (4) which are separated by the same geographic distance, and the difference in divergence is statistically significant (Student’s t = 4.45; two-tailed BO.00 1). Thus, isolation by distance alone cannot explain geographical association among evolutionary-related haplotypes in Scandinavia. This implies that historical events were probably im- portant for the genetic discontinuity between the populations from Scandinavia and western Siberia. Thus, lemmings from Scandinavia represent a phylogenetic group with an unique evolutionary history, and this group has been regarded, primarily on the basis of coat color, as a distinct species, L. lemmus (cf. Jarrell & Fredga, 1993).
Analysis of molecular variance (Table 3) among populations (2, 3, 4 and 5) in the Western phylogeographic group reveals significant division between the Yamal population (2) us. the Taymyr populations (3, 4 and 5). The phylogenetic tree (Fig. 3 A) shows that the sample from Yamal is composed of lemmings with haplotypes from two different clades. This may indicate that the Yamal population (2) consists of a mixture of two previously separated mtDNA lineages. Similarly, a mixture of two distinct mtDNA lineages was found in the Yamal population of the dunlin (Wenink et al., 1996). A mtDNA discontinuity between the Yamal and the Taymyr populations of the collared lemming (Fedorov et al., in press) suggests that the glaciation barrier in this area might have caused the divergence between presently mixed mtDNA lineages in the Yamal populations of both Lemmus and the dunlin.
The phylogenetic discontinuities revealed in h m u s and the geographic con- gruence of these discontinuities across different taxa are evidence for the importance

368 V. FEDOROV ETAL.
of vicariant events in the Eurasian Arctic. The association between observed genetic discontinuities and probable Pleistocene barriers suggests that glacial-interglacial periods were crucial in the vicariant history of Arctic species, as it has been suggested for a number of taxa (Hewitt, 1996). However, differences in the amount of divergence across different historical barriers in Lemmus indicate chronologically separate vicariant events in this genus during the Quaternary.
MtDNA diversip
Inconsistent with the traditional view (Sage & Wolff, 1986), populations of the h m u s living in areas covered by ice during the last glaciation are no less variable than populations in non-glaciated areas. On the contrary, the mtDNA nucleotide diversity estimate within formerly glaciated region tends to be higher than the estimate within non-glaciated area of the Siberian mainland. This may indicate that lemmings colonized deglaciated areas without reduction of effective population size from genetically variable, periglacial populations, as has been suggested for Arctic plants (Gabrielsen et al., 1997). It follows from the phylogeography analysis in the Western group that mixing of mtDNA lineages from previously separated gene pools may have actually increased nucleotide diversity in some populations (2, 3 and 5; Table 1, Fig. 3 A) from formerly glaciated areas.
Similar to other taxa (Frankham, 1997), mtDNA nucleotide diversity estimates in the island populations of h m u s are lower than those in the mainland populations. In contrast to the mainland, haplotypes from each of the island populations represent a monophyletic group (Fig. 3B). Because these islands were isolated from the mainland by rising sea levels 11-9.5 kyr BP (estimate for the Chukchi Sea, Elias et al., 1996), we assume that isolation over the Holocene caused lower intrapopulation diversity and phylogenetic distinctiveness of the island populations.
Regardless of glaciation history, no mtDNA variation is allocated among popu- lations within each of geographic areas of a similar size on the mainland: the Taymyr Peninsula (3, 4 and 5) and the area between Rivers Lena and Kolyma (7, 8 and 9). Haplotype diversity is high, and the lack of differentiation among populations means that pairs of haplotypes from the same population have no more similar sequences than pairs of haplotypes from separate populations within the same region. There are two explanations for the lack of mtDNA population structure within two large geographic regions: intensive ongoing gene flow or/and recent invasion of the regions due to distribution shift of populations with high ancestral haplotype diversity. Ongoing gene flow alone seems to be an unlikely explanation for two reasons. First, significantly restricted mtDNA gene flow among density fluctuating populations of microtine rodents was reported by Stacy et al. (1997) over distances two orders of magnitude smaller than the distances separating these h m u s populations. Second, low but statistically significant FST values (0.049-0.069) from allozyme allele fre- quencies (Fedorov et al., unpublished) indicate restricted ongoing gene flow among the same h m u s populations within each region. We suggest that the lack of population structure in mtDNA within geographic regions with contrasting glaciation histories has primarily resulted from distribution shifts of populations with high ancestral haplotype diversity during the Holocene. This hypothesis could be tested by estimating differences in haplotype frequency-instead of haplotype phylogeny- between the populations using other mtDNA markers with moderate haplotype

PHYLOGEOGRAPHY OF ZEMMUS 369
diversity. We would then predict a significant differentiation in mtDNA haplotype frequencies among the localities. Some support, although not very firm, for this hypothesis comes from observations that lemmings have shifted their distribution range more than 300 km northward in Taymyr (Sdobnikov, 1957) since the end of the Little Ice Age in 1840 (Overpeck et al., 1997). Also, periodic range expansions have been documented in L. lemmus from Fennoscandia (Henttonen & Kaikusalo, 1993). Our results suggest that in the Siberian Arctic, lemmings tracked a changing environment during the Quaternary by shifting their distribution, as has been shown for a number of beetle species (Coope, 1994).
ACKNOWLEDGEMENTS
We are grateful to members of the Tundra Ecology Expedition for assistance during the field work, and to the Swedish Polar Research Secretariat and INTAARI for organizing the expedition. We thank Yu. P. Altukhov who made participation in the Tundra Expedition possible for V.F.; G. Hogstedt and T. Seldal for providing lemmings from Norway; and P. Pamilo for comments on the discussion. This work was financially supported by grants to K. F. and V. F. from the Royal Swedish Academy of Sciences for Research Cooperation between Sweden and the former Soviet Union, to V. F. from Sven and Lilly Lawski Foundation, and to K.F. from the Swedish Natural Science Research Council.
REFERENCES
Andersen BG, Borns HW Jr. 1997. The Ice Age World. A n Introduction to Quaternary History and Research with Emphasis on North America and Europe During the Last 2.5 Million Ears. Oslo: Scandinavian University Press.
Avise JC. 1994. Molecular Markers, Natural HistoT, and Evolution. New York: Chapman & Hall. Bernatchez L, DodsonJ. 1994. Phylogenetic relationships among palearctic and nearctic whitefish
(Coregonus sp.) populations as revealed by mitochondrial DNA variation. Canadian Journal of Fisheries and Aquatic Sciences 51: 240-251.
Bibb MJ, Van Etten RA, Wright CT, Walberg MW, Clayton DA. 1981. Sequence and gene organization of mouse mitochondrial DNA. Cell 26: 167-180.
Chapin FS, Korner C. 1994. Arctic and alpine biodiversity: patterns, causes, and ecosystem consequences. Trends in Ecolog~ and Evolution 9: 45-47.
Chernyavsky FB, Abramsom NI, Tsvetkova AA, Anbinder EM, Kurysheva LP. 1993. On the systematics and zoogeography of true lemmings of the genus Lemmus (Rodentia, Cricetidae) of Beringia. <oologicheskii Zhumal 72: 11 1-122. (in Russian).
Coope GR. 1994. The response of insects faunas to glacial - interglacial climatic fluctuations. Philosophical Transactions of the Royal Sociep of London B344: 19-26.
Elias SA, Short SK, Nelson CH, Birks HH. 1996. Life and times of the Bering land bridge. Nature
Excoffier L, Smouse PE, Quattro JM. 1992. Analysis of molecular variance inferred from metric distances among DNA haplotypes: application to human mitochondrial DNA restriction data. Genetics 131: 479-491.
382: 60-63.
Excoffier L. 1993. TVZhlMOVA, version 1.5. Geneva: Univ. of Geneva. Fedorov V, Fredga K, Jarrell GH. 1998. Mitochondria1 DNA variation and the evolutionary history
of chromosome races of collared lemmings (Dicrostoyx) in the Eurasian Arctic. Journal ofEvolutionary Biology, in press.
Frankham R. 1997. Do island populations have less genetic variation than mainland populations? Heredip 78: 31 1-327.

370 V. FEDOROV ETAL.
Fredga K, Fedorov V, Gelter H, Jarrell GH, Thulin C.-G. 1995. Genetic studies in lemmings. In: Gronlund E, Melander 0, eds. Swedish Russian Tundra Ecology-Expedition-94. A Cruise Report. Stockholm: The Swedish Polar Research Secretariat, 235-242.
Gabrielsen TM, Bachman K, Jakobsen KS, Brochmann C. 1997. Glacial survival does not matter: RAPD phylogeography of Nordic Sax8aga oppositfolia. Molecular Ecology 6: 83 1-842.
Grosswald MG, Karlen W, Shishorina Z, Bodin A. 1992. Glacial landforms and the age of deglaciation in the Tiksi area, East Siberia. Geogrujska Annaler 74(A): 295-304.
Henttonen H, Kaikusalo A. 1993. Lemming movements. In: Stenseth NC, Ims RA, eds. 'The Biology o f h m i n g s . London: Academic Press, 157-2 1 1.
Hewitt GM. 1993. Postglacial distribution and species substructure: lessons from pollen, insects and hybrid zones. In: Lees PR, Edwards D, eds. Evolutionay Patterns and Processes. London: Academic Press, 98-123.
Hewitt GM. 1996. Some genetic consequences of ice ages, and their role in divergence and speciation. Biological Journal o f the Linnean Sociep 58: 247-276.
Hopkins DM. 1982. Aspects of the paleogeography of Beringia during the late Pleistocene. In: Hopkins DM, Matthews JV Jr., Schweger CE, Young SB, eds. Paleoecology UfBeringia. New York: Academic Press, 3-28.
Irwin DM, Kocher TD, Wilson AC. 1991. Evolution of the cytochrome b gene of mammals. Journal ofMolecular Evolution 32: 128-144.
Jaarola My Tegelstrom H. 1995. Colonization history of north European field voles (Microtus agestis) revealed by mitochondrial DNA. Molecular Ecology 4: 299-3 10.
Jarrell GH, Fredga K. 1993. How many kinds of lemmings? A taxonomic overview. In: Stenseth NC, Ims RA, eds. 'The Biology o f h m i n g s . London: Academic Press, 45-57.
Kimura M. 1980. A simple method for estimating evolutionary rate of base substitution through comparative studies of nucleotide sequences. Journal ofMolecular Evolution 16: 1 1 1-1 20.
Kocher TD, Thomas WK, Meyer A, Edwards SV, Paabo S, Villablanka FX, Wilson AC. 1989. Dynamics of mitochondrial DNA evolution in mammals: amplification and sequencing with concerved primers. Proceedings ofthe National Academy o f Sciences USA 86: 6 196-6200.
Kowalski K. 1995. Lemmings (Mammalia, Rodentia) as indicator of temperature and humidity in the European Quaternary. Acta <oologica Cracoviensia 38: 85-94.
Kumar S, Tamura K, Nei M. 1993. M E G A : Molecular evolutionary genetics anaQsis, version 1.01. Pennsylvania State University.
Martin AP, Palumbi SR. 1993. Both size, metabolic rate, generation time, and the molecular clock. Proceedings o f the National Academy o f Sciences USA 90: 4087-409 1.
McElroy D, Moran P, Bermingham E, Kornfield I. 1992. REAP: An integrated environment for the manipulation and phylogenetic analysis of restriction data. Journal OfHeredig 83: 157-158.
Merila J, Bjoklund My Baker AJ. 1997. Historical demography and present day population structure of the greenfinch, Carduelis chloris - an analysis of mtDNA control-region sequences. Evolution 51: 946-956.
Nei M. 1987. Molecular evolutionary genetics. New York: Columbia University Press. Nei My Miller JC. 1990. A simple method for estimating average number of nucleotide substitutions
within and between populations from restriction data. Genetics 125: 873-879. Overpeck J, Hughen K, Hardy D, Bradley R, Case R, Douglas My Finney By Gajewski K,
Jacoby G, Jennings A, Lamoreux S, Lasca A, MacDonald G, Moore J, Retelle My Smith S, Wolfe A, Zielinski G. 1997. Arctic environmental change of the last four centuries. Science
Palumbi S, Martin A, Romano S, McMillan WO, Stice L, Grabowski G. 1991. 'The simple
Pielou EC. 1991. AJier the Ice Age: the return o f liji to glaciated North America. Chicago and London: The
Sage RD, Wolff JO. 1986. Pleistocene glaciations, fluctuating ranges, and low genetic variability in
Saitou N, Nei M. 1987. The neighbor-joining method: a new method for reconstructing phylogenetic
Sdobnikov VM. 1957. Lemmings on the Northern Taymyr. Tmdy Arctic Research Institute 205: 109-125.
278: 1251-1256.
fool's guide to PCR, version 2.0. Honolulu: University of Hawaii.
University of Chicago Press.
a large mammal (Ovis dallz). Evolution 40: 1092-1093.
trees. Molecular Biology and Evolution 4: 406-425.
(In Russian). Sher AV. 1991. Problems of the last interglacial in Arctic Siberia. Quaternay International lO(12):
215-222. Stacy JE, Jorde PE, Steen H, Ims RAY Purvis A, Jakobsen KS. 1997. Lack of concordance

PHYLOGEOGRAPHY OF LEh41,ZIb'S 37 1
between mtDNA gene flow and population density fluctuations in the bank \role. Molecular Ecololy
Tegelstrom H. 1987. Transfer of mitochondrial DNA from the northern red-backed vole (Clethrionomys mtilus) to the bank vole (C. glareolus). Journal ofMolecular Evolution 24: 218-227.
Tegelstrom H. 1992. Detection of mitochondrial DNA fragments. In: Hoelzel AR, ed. Molecular Genetic Anahsis of Populations: a Practical Approach. Oxford: IRL Press, 89-1 13.
Templeton AR, Georgiadis NJ. 1996. A landscape approach to consenation genetics: conserving evolutionary processes in the African Bovidae. In: Avise JC, Hemric JL, eds. Con.uruation Genetics: case historiesjom nature. New York: Chapman & Hall, 398-430.
Weider LJ, Hobaek A. 1997. Postglacial dispersal, glacial refugia, and clonal structure in Russian/ Siberian populations of the arctic Daphnia pulex complex. Heredip 78: 363-372.
Wenink PW, Baker AJ, Rosner HU, Tilanus MGH. 1996. Global mitochondrial DNA phylo- geography of holarctic breeding dunlins (Calidris alpina). Evolution 50: 3 18-330.
Wennerberg L, Holmgren NMA, Jonsson P-E, von Schantz T. 1998. Genetic and morphological variation in breeding dunlins Calidris alpina on the Palearctic Tundra. Ibis, in press.
Zink RM. 1996. Comparative phylogeography in north american birds. Evolution 50: 308-3 17.
6: 751-759.
Copyright © 2022 FDOKUMEN