
About JSW Energy True to
15
Transcript of About JSW Energy True to


About JSW EnergyTrue to JSW values, JSW Energy believes in the efficient utilization of all available resources. Our goal is to become a leading full-service integrated power company in the Indian powersector with a presence across the value chain.
The company was one of the earliest private entrants into the power sector after the liberalisation in the 1990’s. By managing our operations, enhancing social and economic benefits, minimizing environmental impact and employing cutting age innovation, JSW Energy has consolidated its place at the top of the ranks.
One of India’s premier integrated power companies, JSW Energy produces 3,140MW of power, with a capacity of another 8,630MW under implementation and development. We envision achieving 11,770MW in power generation. With transparent operations, stringent corporate governance norms and a clear vision JSW Energy is setting benchmarks in the power sector.
The Company’s presence extends across several Indian states and includes stakes in natural resource companies in South Africa. JSW Energy is a full-spectrum integrated power Company with presence across the power value chain.
Power generation Power transmission Mining Power Plant equipment manufacturing Power trading
The ability to leverage opportunities, technologies and competencies to set up greenfield projects rapidly and

efficiently, makes JSW unique. This allows us to aggressively mine new opportunities for growth.
The company’s strategic approach to expansion, ensuring diversityin geographic locations, fuel sources and power off-take arrangements, helps de-risk the business. During the last 4 yearsJSW Energy has enhanced the power generation capacity from 260MW to 3140MW.
Power generation: Incorporated in 1994, JSW Energy began commercial operations in 2000, with the commissioning of its first 260MW thermal power plant at Vijayanagar, Karnataka. Since then, the Company has grown rapidly in terms of both size and scope.
The Vijayanagar plant produces 860MW of power. The company have set up a 1,200MW imported coal-based thermal plant in Ratnagiri, Maharashtra. Our wholly owned subsidiary, Raj WestPower Ltd operates the 1,080MW lignite-based thermal power plant in Barmer,Rajasthan. The company has also identified projects which are under implementation and development phase in Himachal Pradesh, Chhattisgarh, Jharkhand, West Bengal, Karnataka, Maharashtra and Rajasthan.
JSW Energy is one of the most efficient power generation companies in India. Our plants are the industry benchmark for thehigh plant load factor achieved, which is a measure of efficient capacity utilisation. The Vijayanagar plant has been awarded the Best Operating Power Plant by the Ministry of Power in 2012 for the fifth consecutive year. Our competitiveness is reflected in our high rate of returns and the profitability of our commercial operations.
Mining: As an integrated power company, JSW Energy continues to enhance raw material securitisation and has acquired lignite mines in Barmer and thermal coal mines in South Africa. The Company has also formed a Joint Venture to develop a thermal coalblock in Odisha.
Power transmission: The joint venture Jaigad Power Transco Limited is an intra-state transmission system that connects the Ratnagiri power plant to the national grid.

Power Plant equipment manufacturing: The Company has entered intoa Joint Venture with Toshiba to manufactures supercritical steam turbines and generators. The company has successfully procured orders from NTPC for supply of 800MW and 660MW supercritical steam turbines and generators.
Trading: JSW Energy’s wholly owned subsidiary, JSW Power Trading Company Ltd is one of India’s leading power trading firms, with trading volumes in excess of 11,000MU.
What is fundamental analysis?
Fundamental Analysis involves examining the economic, financialand other qualitative and quantitative factors related to asecurity in order to determine its intrinsic value. It attemptsto study everything that can affect the security's value,including macroeconomic factors (like the overall economy and

industry conditions) and individually specific factors (like thefinancial condition and management of companies). Fundamentalanalysis, which is also known as quantitative analysis, involvesdelving into a company‟s financial statements (such as profit andloss account and balance sheet) in order to study variousfinancial indicators (such as revenues, earnings, liabilities,expenses and assets). Such analysis is usually carried out byanalysts, brokers and savvy investors.
Many analysts and investors focus on a single number--net income(or earnings)--to evaluate performance. When investors attempt toforecast the market value of a firm, they frequently rely onearnings. Many institutional investors, analysts and regulatorsbelieve earnings are not as relevant as they once were. Due tononrecurring events, disparities in measuring risk andmanagement's ability to disguise fundamental earnings problems,other measures beyond net income can assist in predicting futurefirm earnings.
COMPANY ANALYSIS
Analysis of the company consists of measuring its performance andascertaining the cause of this performance. When some companieshave done well irrespective of economic or industry failure, thisimplies that there are certain unique characteristics for thisparticular company that had made it a success. The identificationof these characteristics, whether quantitative or qualitative, isreferred to as company analysis. Quantitative indicators ofcompany analysis are the financial indicators and operationalefficiency indicators. Financial indicators are the profitabilityindicators and financial position indicators analyzed through theincome and balance sheet statements, respectively, of thecompany. Operational indicators are capacity utilization and costversus sales efficiency of the company, which includes themarketing edge of the company.
Besides the quantitative factors, qualitative factors of a

company also influence investment decision process of aninstitutional investor. The focus of the qualitative data, asrevealed in the annual report- as in the director‟s speech.Rather than on quantitative data.
Tools for company analysis
Company analysis involves choice of investment opportunitieswithin a specific industry that comprises of several individualcompanies. The choice of an investible company broadly depends onthe expectations about its future performance in general. Here,the business cycle that a company is undergoing is a very usefultool to assess the future performance from the company.
Company analysis ought to examine the levels of competition,demand, and other forces that affect the company‟s ability to beprofitable. Of these factors, understanding the competitiveenvironment is most important.
1. The financial statements of the company: Records thatoutline the financial activities of a business, anindividual or any other entity. Financial statements aremeant to present the financial information of the entity inquestion as clearly and concisely as possible for both theentity and for readers. Financial statements for businessesusually include: income statements, balance sheet,statements of retained earnings and cash flows, as well asother possible statements
2. Ratio analysis: A tool used by individuals to conduct a quantitative analysis of information in a company's financial statements. Ratios are calculated from current year numbers and are then compared to previous years, other companies, the industry, or even the economy to judge the performance of the company. Ratio analysis is predominately used by proponents of fundamental analysis. There are many ratios that can be calculate

from the financial statements pertaining to a company'sperformance, activity, financing and liquidity. Some commonratios include the price-earnings ratio, debt-equity ratio,earnings per share, asset turnover and working capital.
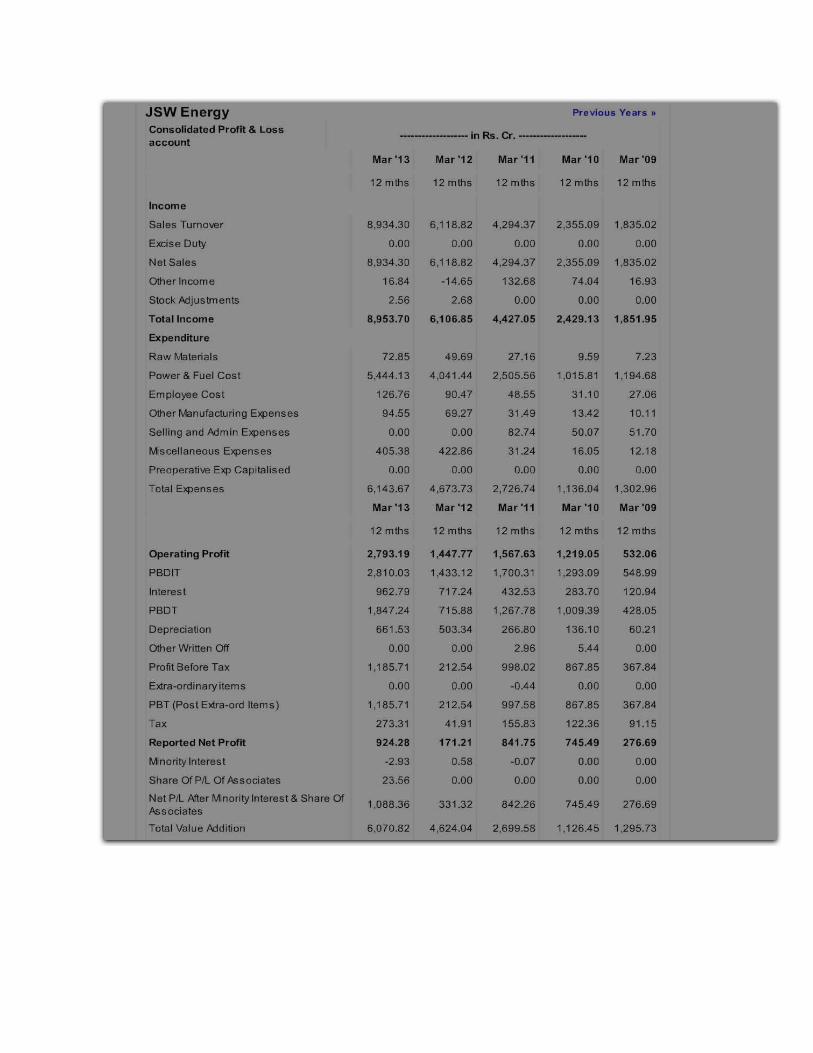
Profit and loss a/c of the JSW Energy
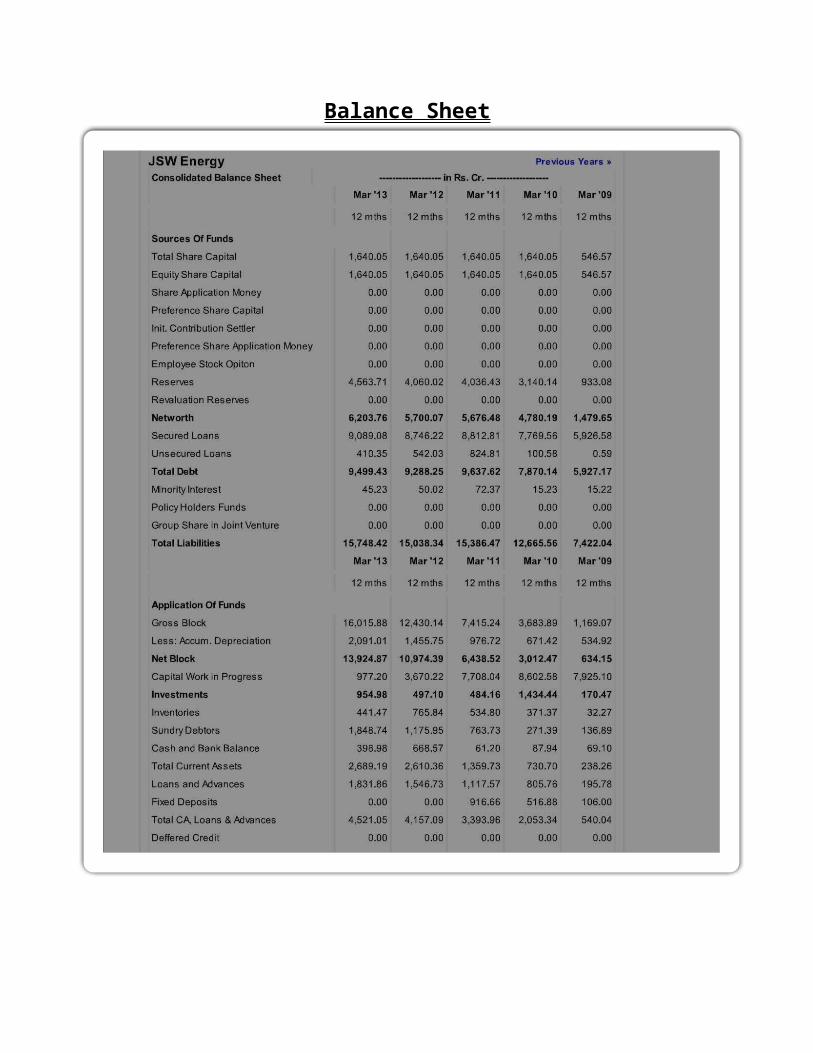
Balance Sheet

Finance fundamental analysis
1. Current Ratio = Current Assets / Current Liabilities
Year 2013 2012 2011 2010 2009Current Ratio 0.98 0.95 1.29 0.84 0.28Current ratio must be 2:1 most preferable
1 2 3 4 50
0.51
1.5 0.98 0.951.29
0.84
0.28
Current Ratio
2. Liquid Ratio = Quick Assets / Quick Liabilities
Year 2013 2012 2011 2010 2009Quick Ratio 0.88 0.80 1.08 0.69 0.27
Liquid ratio must be 2:1 most preferable
1 2 3 4 50
0.20.40.60.81
1.2 0.88 0.8
1.08
0.69
0.27
Quick Ratio

3. Debt Equity Ratio = Long term debts / Shareholders Funds
Year 2013 2012 2011 2010 2009Debt Equity Ratio
1.53 1.63 1.70 1.65 4.01
The debt to equity ratio compares the creditors fund with owner funds and 2:1 most preferable
1 2 3 4 5012345
1.53 1.63 1.7 1.65
4.01
Debt Equity Ratio
4.Stock Turnover Ratio = Cost of Goods Sold/ Average Stock
Year 2013 2012 2011 2010 2009InventoryTurnover Ratio
20.24 7.99 8.72 6.92 251.37
The stock turnover ratio compares the net sales to inventory and time

1 2 3 4 5050100150200250300
20.24 7.99 8.72 6.92
251.37
Inventory Turnover Ratio
5. Debtors Turnover Ratio = Credit Sales / Average Accounts Receivable
Year 2013 2012 2011 2010 2009Debtors Turnover Ratio
5.91 6.31 8.30 11.54 17.80
1 2 3 4 50
5
10
15
20
5.91 6.318.3
11.54
17.8Debtors Turnover Ratio
6.Fixed Assets Turnover Ratio = Sales / Fixed Assets
Year 2013 2012 2011 2010 2009Fixed Assets Turnover
0.57 0.50 0.60 0.64 1.59

Ratio
The fixed assets turnover ratio compares with the sales and fixedassets
1 2 3 4 50
0.5
1
1.5
2
0.57 0.5 0.6 0.64
1.59
Fixed Assets Turnover Ratio
7.Total Assets Turnover Ratio = Sales / Total Assets
Year 2013 2012 2011 2010 2009Total Assets Turnover Ratio
0.58 0.41 0.28 0.18 0.25
The total assets turnover ratio compares with the sales and totalassets

1 2 3 4 50
0.10.20.30.40.50.6
0.58
0.410.28
0.180.25
Total Assets Turnover Ratio
8. Interest coverage ratio= EBIT/interest
Year 2013 2012 2011 2010 2009Interest Cover 2.44 1.52 3.42 4.13 4.26
This ratio indicate how many time the operating income covers theinterest payment
1 2 3 4 5012345
2.441.52
3.424.13 4.26
Interest Cover
9. Net profit margin ratio=PAT/sales
Year 2013 2012 2011 2010 2009Net Profit Margin(%)
9.87 2.72 19.27 31.27 14.93

The profitability ratio measure the overall efficiency of the firm
1 2 3 4 5010203040
9.872.72
19.27
31.27
14.93
Net Profit Margin(%)
10. Return on Capital Employed = NPBIT / Capital Employed 100
Year 2013 2012 2011 2010 2009Return OnCapital Employed(%)
14.93 7.27 8.95 8.74 6.60
1 2 3 4 50
5
10
15
14.93
7.278.95 8.74
6.6
Return On Capital Employed(%)