Mitochondrial DNA variation in a species with two mitochondrial genomes: the case of Mytilus...
15
Molecular Ecology (2002) 11, 755–769 © 2002 Blackwell Science Ltd Blackwell Science Ltd Mitochondrial DNA variation in a species with two mitochondrial genomes: the case of Mytilus galloprovincialis from the Atlantic, the Mediterranean and the Black Sea E.D. LADOUKAKIS, *† C. SAAVEDRA, †‡ A. MAGOULAS † and E. ZOUROS *† *Department of Biology, University of Crete, †Institute of Marine Biology of Crete, Crete, Greece Abstract We have examined mitochondrial DNA (mtDNA) variation in samples of the mussel Mytilus galloprovincialis from the Black Sea, the Mediterranean and the Spanish Atlantic coast by scoring for presence or absence of cleavage at 20 restriction sites of a fragment of the COIII gene and at four restriction sites of the 16S RNA gene. This species contains two types of mtDNA genomes, one that is transmitted maternally (the F type) and one that is transmitted paternally (the M type). The M genome evolves at a higher rate than the F genome. Normally, females are homoplasmic for an F type and males are heteroplasmic for an F and an M type. Occasionally molecules from the F lineage invade the paternal transmission route, resulting in males that carry two F-type mtDNA genomes. These features of the mussel mtDNA system give rise to a new set of questions when using mtDNA variation in population studies and phylogeny. We show here that the two mtDNA types provide different information with regard to amounts of variation and genetic distances among populations. The F genome exhibits higher degrees of diversity within populations, while the M genome produces higher degrees of differentiation among populations. There is a strong differentiation between the Atlantic and the Black Sea. The Mediterranean samples have intermediate haplotype frequencies, yet are much closer to the Black Sea than to the Atlantic. We conclude that in this species gene flow among the three Seas is restricted and not enough to erase the combined effect of mutation and random drift. In one sample, that from the Black Sea, the majority of males did not contain an M mtDNA type. This suggests that a molecule of the maternal lineage has recently invaded the paternal route and has increased its frequency in the population to the point that the present pool of paternally transmitted mtDNA molecules is highly heterogeneous and cannot be used to read the population’s history. This liability of the paternal route means that in species with doubly uniparental inheritance, the maternal lineage provides more reliable information for population and phylogenetic studies. Keywords: Doubly Uniparental Inheritance, mtDNA variation, mussels Received 8 August 2001; revision received 19 December 2001; accepted 3 January 2002 Introduction Mitochondrial DNA (mtDNA) has become one of the most widely used tools in molecular phylogeny and phylogeography (Avise 2000) for reasons that are well known: ease of handling, high rate for selectively neutral mutation, uniparental inheritance and lack of recombina- tion. After more than two decades of use of mtDNA in population studies these advantages remain valid, but only as a matter of degree. With the exception of mtDNA deletions that lead to severe defects [e.g. myopathies (Chinnery & Turnbull 1998) and male sterility (Kao et al. 1998)], there is no strong evidence that animal mtDNA variants of the kind normally used in population surveys Correspondence: Dr E. Zouros, Institute of Marine Biology of Crete, P.O.B. 2214, 71 003, Iraklio, Crete, Greece. Fax: Int-30 018 0241882; E-mail: [email protected] ‡Present address: Instituto de Acuicultura de Torre la Sal, Castellon, Spain.
Transcript of Mitochondrial DNA variation in a species with two mitochondrial genomes: the case of Mytilus...

Molecular Ecology (2002) 11, 755–769
© 2002 Blackwell Science Ltd
Blackwell Science LtdMitochondrial DNA variation in a species with two mitochondrial genomes: the case of Mytilus galloprovincialis from the Atlantic, the Mediterranean and the Black Sea
E.D. LADOUKAKIS ,*† C . SAAVEDRA,†‡ A . MAGOULAS† and E . ZOUROS*†*Department of Biology, University of Crete, †Institute of Marine Biology of Crete, Crete, Greece
Abstract
We have examined mitochondrial DNA (mtDNA) variation in samples of the musselMytilus galloprovincialis from the Black Sea, the Mediterranean and the Spanish Atlantic coastby scoring for presence or absence of cleavage at 20 restriction sites of a fragment of theCOIII gene and at four restriction sites of the 16S RNA gene. This species contains two typesof mtDNA genomes, one that is transmitted maternally (the F type) and one that is transmittedpaternally (the M type). The M genome evolves at a higher rate than the F genome. Normally,females are homoplasmic for an F type and males are heteroplasmic for an F and an M type.Occasionally molecules from the F lineage invade the paternal transmission route, resultingin males that carry two F-type mtDNA genomes. These features of the mussel mtDNA systemgive rise to a new set of questions when using mtDNA variation in population studies andphylogeny. We show here that the two mtDNA types provide different information withregard to amounts of variation and genetic distances among populations. The F genomeexhibits higher degrees of diversity within populations, while the M genome produces higherdegrees of differentiation among populations. There is a strong differentiation betweenthe Atlantic and the Black Sea. The Mediterranean samples have intermediate haplotypefrequencies, yet are much closer to the Black Sea than to the Atlantic. We conclude that in thisspecies gene flow among the three Seas is restricted and not enough to erase the combinedeffect of mutation and random drift. In one sample, that from the Black Sea, the majorityof males did not contain an M mtDNA type. This suggests that a molecule of the maternallineage has recently invaded the paternal route and has increased its frequency in thepopulation to the point that the present pool of paternally transmitted mtDNA moleculesis highly heterogeneous and cannot be used to read the population’s history. This liabilityof the paternal route means that in species with doubly uniparental inheritance, the maternallineage provides more reliable information for population and phylogenetic studies.
Keywords: Doubly Uniparental Inheritance, mtDNA variation, mussels
Received 8 August 2001; revision received 19 December 2001; accepted 3 January 2002
Introduction
Mitochondrial DNA (mtDNA) has become one of themost widely used tools in molecular phylogeny and
phylogeography (Avise 2000) for reasons that are wellknown: ease of handling, high rate for selectively neutralmutation, uniparental inheritance and lack of recombina-tion. After more than two decades of use of mtDNA inpopulation studies these advantages remain valid, butonly as a matter of degree. With the exception of mtDNAdeletions that lead to severe defects [e.g. myopathies(Chinnery & Turnbull 1998) and male sterility (Kao et al.1998)], there is no strong evidence that animal mtDNAvariants of the kind normally used in population surveys
Correspondence: Dr E. Zouros, Institute of Marine Biology ofCrete, P.O.B. 2214, 71 003, Iraklio, Crete, Greece. Fax: Int-30018 0241882; E-mail: [email protected]‡Present address: Instituto de Acuicultura de Torre la Sal,Castellon, Spain.

756 M . L A D O U K A K I S E T A L .
© 2002 Blackwell Science Ltd, Molecular Ecology, 11, 755–769
are themselves targets of selection. Yet the behaviour ofthese polymorphisms may not follow the patterns ofneutral variation. In particular, these polymorphisms may beunder the influence of selective sweeps (Begun & Aquadro1992) or background selection (Charlesworth et al. 1995).Indeed patterns of mtDNA polymorphism that are notcompatible with neutrality have been reported by severalauthors (Rand 1994; review by Ballard & Kreitman 1995).Manifold differences in mtDNA mutation rate are alsoknown among groups of organisms, apparently relatedto external or internal environmental regimes (Martin &Palumbi 1993). Exceptions to strict maternal inheritance areknown in several animals, namely Drosophila (Kondo et al.1990), mice (Gyllensten et al. 1991) and anchovy (Magoulas& Zouros 1993). Finally, the controversy of whetheranimal mtDNA undergoes homologous recombination(Arctander 1999; Merriweather & Kaestle 1999; Wallis1999; Kivisild et al. 2000; Wallis 2000) seems to have beensettled in favour of its occurrence (Ladoukakis & Zouros2001a,b) and shifted to how frequently it may occur.
A major exception to the rule of uniparental transmis-sion of organelle DNA has been described by Skibinskiet al. (1994a,b) and Zouros et al. (1994a,b) in species of theblue mussel family Mytilidae. These species carry twotypes of mitochondrial genomes, one that is transmittedmaternally to offspring of both sexes and another that istransmitted paternally to male progeny only. This systemof mtDNA transmission has become known as doublyuniparental inheritance (DUI; Zouros et al. 1994b). DUI,which, in addition to blue mussels, is now known tooccur in species of the fresh water mussels Unionidae(Liu et al. 1996) and the clam Tapes philippinarum (Passamontiand Scali 2001), has certain features that set it apart fromthe standard maternal inheritance system: (i) Males areheteroplasmic for a maternal (F) and a paternal (M)genome (Skibinski et al. 1994b; Zouros et al. 1994b). Butthe heteroplasmy is not of the conventional form: somatictissues are dominated by the maternal genome and thegonad by the paternal genome (Garrido-Ramos et al.1998); (ii) the paternal genome evolves faster than thematernal genome (Hoeh et al. 1996a); (iii) occasionally,a maternally transmitted molecule may invade the pater-nal route, a phenomenon for which the term ‘masculiniza-tion of the F molecule’ has been used (Hoeh et al. 1997;Saavedra et al. 1997). This creates a heterogeneous poolof paternally transmitted molecules: those that have beenfollowing the paternal route even before the splitting of thespecies from its relatives (Rawson & Hilbish 1996; Stewartet al. 1996) and have as a result accumulated a largenumber of nucleotide differences from the maternallytransmitted molecules, and those that have recentlyentered the paternal route and have nucleotide sequencesthat resemble the F type more than the M type (Hoeh et al.1997); (iv) studies of pair-matings have shown that the sex
ratio among the offspring of a female mussel may be heavilybiased toward either the male or the female sex and that thisbias is characteristic of the female parent and independentof the male to which the female is mated (Saavedra et al.1997); (v) finally, Ladoukakis and Zouros (2001a) haveshown that homologous mtDNA recombination is com-mon in the male gonad of mussels.
Clearly, these peculiarities of the DUI system give rise to anumber of questions that are not encountered when usingmtDNA for population studies of species with standardmaternal inheritance. Are the frequencies of F haplotypessimilar in the female and the male parts of the popula-tion? Are the frequencies of F/M combinations foundamong males simple products of the population frequen-cies of F and M haplotypes? How different might be theinformation one gets from the F or the M lineage on mattersof population structure, gene flow, selection and phylogeny?
We have attempted to address these questions using theMediterranean blue mussel, Mytilus galloproviancialis as amodel. The species distribution extends from the southerncoast of England and Ireland to the French and IberianAtlantic, the Mediterranean and the Black Sea. The specieshas been reported outside its native area of distributionin California, Australia, New Zealand, Tasmania, Japan,northwards along the East China coast and South Africa(Gosling 1992). We have examined one sample from theSpanish Atlantic coast, five from the Mediterranean (Adriatic,Ionian, southern Aegean, middle Aegean and northernAegean) and one from the far northern part of the Black Sea.We have used the restriction fragment length polymorphism(RFLP) method to assay mtDNA variation in two regionsof the molecule (parts of the COIII and the 16S rRNA genes).
Materials and methods
Populations sampled
Mussel samples were taken from five localities in theeastern Mediterranean Sea, one from the Atlantic, and onefrom the Black Sea. The localities sampled in the Medi-terranean were the following: Chioggia (CHI), near Venice,Italy (north Adriatic Sea); Cefalonia Island (CEF), Greece(Ionian sea); Faros (FAR), near Heraklion, Greece (southAegean Sea); Megalo Pefko (MPE), near Athens, Greece(central Aegean Sea); and Halastra (HAL), near Thess-aloniki, Greece (north Aegean Sea). The sample form theBlack Sea (BS) came from Sebastopol (Ukraine). The samplefrom the Atlantic (ATL) comprised commercial musselsfrom Ría de Arousa (Galicia, northwest Spain).
Dissection and sexing
Mussels were opened in the laboratory, and a piece of thegonadal tissue was examined under the microscope to

D U I A N D M T D N A V A R I A T I O N 757
© 2002 Blackwell Science Ltd, Molecular Ecology, 11, 755–769
establish the sex of the animal by the presence of eggs orsperm. Individuals that showed no gametes were classifiedas ‘not sexed’ and were excluded from the analysis. Tissuesamples from gonad (attached to the mantle tissue),adductor muscle, gills and digestive gland were taken andkept at –20°C or –80°C.
Mitochondrial DNA genotyping
Each individual mussel was genotyped for the mito-chondrial genome by a polymerase chain reaction (PCR)-RFLP procedure. Total DNA was isolated by a variant ofa salt precipitation method (Zouros et al. 1992). PCR wasfirst performed on total DNA extracted from the gonadaltissue. In some selected individuals the PCR was repeatedon DNA extracted from somatic tissue (gills). Two partsof the mitochondrial genome were assayed. The first wasa fragment of 860 base pairs (bp) of the cytochromeoxidase III gene, which was amplified using the primersand the PCR conditions described by Saavedra et al. (1997)and digested with the enzymes EcoRI, BamHI, HaeIII andRsaI. Scoring of the restriction haplotype of F moleculeswas straightforward in females, owing to the fact thatfemales were homoplasmic for this molecule. Knowingwhat F haplotypes were present in the populationfrom their occurrence in females helped in reading thecomposite (F/M) restriction patterns of males. The frag-ments that corresponded to the maternal genome weredetermined first (the F haplotype), and the remaining frag-ments were assigned to the paternal molecule (the Mhaplotype), on the condition that they added to 860 bp.
The second fragment corresponded to a 527-bp part ofthe 16S rRNA gene. It was amplified with the universalprimers AR and BR (Palumbi et al. 1991), and the PCRproduct was digested simultaneously with the enzymesEcoRV, HaeIII and SpeI, according to Rawson & Hilbish(1996). In most males, the 16S rRNA primers described
annealed preferentially to the M genome, so that the Fgenome could not be detected. To detect the F type of thesemales the AR primer was replaced with the primer PR-19Rawson et al. (1996), which is specific to the F genome, andthe obtained fragment of 440 bp was digested with thesame three restriction enzymes. In some males it wasimpossible to detect either the COIII or the 16S rRNA partsof the M genome with the assays described. In these maleswe were able to recover the fragments of the 16S rRNAgene by using the primers PR17 and PR18 of Rawson &Hilbish (1996), which are specific to the M genome. The440 bp PCR product was digested with SpeI and EcoRV toconfirm that the restriction pattern agreed to known Mgenome patterns (Rawson & Hilbish 1996).
Restriction maps
The restriction map of the COIII region of the F moleculewas constructed using the sequences of Ladoukakis andZouros (2001a) and that of the COIII of the M moleculeused the sequences of Stewart et al. (1996). The restrictionmaps of the 16S rRNA genes of the F and the M moleculeswere constructed from the data of Rawson & Hilbish(1996). The restriction enzymes used allowed for thescoring of presence or absence of cleavage at 20 sites of theCOIII gene and of four sited on the 16S rRNA gene (Fig. 1).
Haplotype networks
For any pair of haplotypes of the same mtDNA region onemay count differences in restriction sites. Two haplotypesdiffering by only one site are assumed to be separated byone mutation event. This approach can be used to constructnetworks of minimum numbers of mutation events thatconnect the whole set of haplotypes. Because of homo-plasy or recurrent mutation there is no single best networkof this type nor can there be perfect additivity in the
Fig. 1 Restriction maps of two fragments of Mytilus galloprovincialis mtDNA (A) COIII, (B) 16S rRNA. Each site is indicated by the enzymeby which it is recognized. Distances (in parenthesis) are in base pairs (bp) from the left end of the amplified region.

758 M . L A D O U K A K I S E T A L .
© 2002 Blackwell Science Ltd, Molecular Ecology, 11, 755–769
number of mutation steps connecting distant haplotypes.Networks shown in Fig. 2(B) were obtained manually bytrial and error.
Data analysis
Nei distances (Tajima & Nei 1984) were used to constructneighbour-joining majority rule consensus trees for re-striction haplotypes (phylip; Felsenstein 1995) with 100bootstrap replicates. This number is sufficient given thesmall number of surveyed sites (n = 18 for variable sites)and the binary nature of the data (presence/absence ofcleavage). Haplotype frequencies were computed andused to estimate haplotype diversities with the program dain reap (McElroy et al. 1992). Differences in haplotypefrequencies in 2 × n contigency tables were tested by simpleχ2 tests of homogeneity, even if expectations in some cellswere very small (Lewontin & Felsenstein 1965). In n × mtables with both n and m larger than 2 we used the exacttest of Raymond & Rousset (1995a) [program struc asimplemented in genepop; Raymond & Rousset (1995b)].The sequential Bonferroni test (Sokal & Rohlf 1995) wasused to correct for multiple tests.
Terminology
The complexity of the doubly uniparental mitochon-drial system requires a specific terminology. We first notethat the distinction maternally transmitted vs. paternallytransmitted genomes is different from the distinction F vs.M genomes. The first refers to the parent from which thegenome was inherited, whereas the second has been usedin the literature to denote the fact that the mitochondrial
genomes of mussels form, in terms of molecular affinity,two clusters: cluster F which contains molecules foundin females and males, and cluster M which containsmolecules usually found only in males. The vast majorityof female individuals are homoplasmic for an F genome.Such females will be called typical females. Occasionally afemale individual may be heteroplasmic for an F and an Mgenome. These females will be called atypical females. Inmales the somatic tissues are predominantly homoplasmicfor an F genome and the gonad for an M genome. Suchmales will be called typical males. Quite often genomesthat belong to the F cluster are male-transmitted. These are‘recently masculinized F molecules’ (Hoeh et al. 1997) forwhich we proposed the symbol Mf (Ladoukakis & Zouros2001a). Male individuals that inherit an F molecule fromtheir female parent and an Mf from their male parent willbe characterized as atypical males. When their F and Mf
molecules are distinguishable by the assay in use, theatypical males will be scored as heteroplasmic atypicalmales, otherwise they will be scored as homoplasmicatypical males. In atypical heteroplasmic males it ispossible to identify the maternal genome (and by sub-traction the paternal genome) from the fact that it is thedominant molecule in somatic tissues.
Notation of mtDNA haplotypes
Traditionally, restriction haplotypes are scored with astring of 1 and 0 indicating presence or absence of cleavage,respectively, in the corresponding site. For example, thefirst haplotype in Table 1 would be symbolized as11000101000110010011. We have replaced this system byadopting one number for every distinct restriction
Fig. 2 (A) Neighbour-joining unrooted treeof all COIII haplotypes recovered in thestudy. Numbers indicate bootstrap valuesand branch lengths are proportional tobootstrap support. Haplotypes C1 to C12belong to F cluster, haplotypes C13 to C22 tothe M cluster. The sample in which eachtype was found is also given. (B) Networksdepicting the minimal number of mutationalsteps connecting the various haplotypes.The number of line segments between twoneighbouring haplotypes is the requirednumber of mutations for the transition fromone type to the other.

D U I A N D M T D N A V A R I A T I O N 759
© 2002 Blackwell Science Ltd, Molecular Ecology, 11, 755–769
haplotype. We, thus, refer to the above haplotype as C1.The letter ‘C’ is used to indicate that we refer to the COIIIregion. Likewise we use the letter ‘R’ to refer to the 16SrRNA region. For this region we have detected fourhaplotypes for which Rawson & Hilbish (1996) have usedthe symbols A, C, D and E. Subsequently, we use thesymbols RA, RC, RD and RE for these haplotypes. An issuearises when we want to refer to the restriction pattern of agenome at both surveyed regions. In this case we used thenotation C.R., where the dot takes the value of the specifichaplotype for the corresponding region. Thus, an mtDNAgenome that has the restriction pattern #2 at the COIIIregion and the type A at the 16S rRNA region (Table 1) willbe symbolized as C2RA. A further complication ariseswhen we want to refer to both genomes of a heteroplasmicindividual (as in the majority of male mussels). For this, wehave adopted the convention that the first genome wouldbe the maternally transmitted one followed by thepaternally transmitted, with the two genomes separated bya slash. Thus the notation C3RD/C14RE indicates that thisis a heteroplasmic individual, whose maternal genome hasthe restriction pattern #3 at the COIII region and the Dpattern at the 16S rRNA region and whose paternal
genome has the #14 pattern at the COIII region and the Epattern at the 16S rRNA region. In several animals wecould not score the paternal genome at the COIII region orat both, the COIII and the 16S rRNA regions. In these casesa dash is used to indicate the missing information. ThusC4RD/–RE indicates that the COIII region of the paternalgenome could not be scored, whereas C10RA/– indicatesthat no information could be gained for either region of thepaternal genome.
Results
Restriction maps and haplotypes
The restriction maps of the two studied regions, COIII and16S RNA, are shown in Fig. 1. Twenty-two differenthaplotypes were observed among our samples at the COIIIregion and four at the 16S rRNA region (Table 1). When theCOIII haplotypes were used to produce a phylogenetictree, they formed two distinct clusters (Fig. 2A), the F andthe M cluster. Both, the neighbour-joining (shown) and theupgma (not shown) methods produced phylogenetic treesin which F and M haplotypes formed distinct clusters.
Table 1 Restriction haplotypes for an 860-bp segment of COIII and a 527-bp fragment of 16S rRNA
A B
Enzymes R H H R H H E H B R R H R R H R R R R R H S S EVSites: 1 2 3 4 5 6 7 8 9 10 11 12 13 14 15 16 17 18 19 20 1 2 3 4
C1 1 1 0 0 0 1 0 1 0 0 0 1 1 0 0 1 0 0 1 1 RA 1 1 1 0C2 1 1 0 0 0 1 0 1 0 1 0 1 1 0 0 1 0 0 1 1 RD 1 0 1 0C3 1 1 0 0 0 1 0 1 0 1 0 1 1 0 0 1 1 0 0 1C4 1 1 0 0 0 1 0 1 0 0 0 1 1 0 0 1 1 0 1 1C5 1 1 0 0 0 1 0 1 0 1 0 1 1 0 0 1 1 0 1 1C6 1 1 0 1 0 1 0 1 0 1 0 1 1 0 0 1 1 0 0 1C7 1 1 0 0 0 1 1 1 0 0 0 1 1 0 0 1 0 0 1 1C8 1 1 0 0 0 1 1 1 0 1 0 1 1 0 0 1 0 0 1 1C9 1 1 0 0 0 1 1 1 0 1 0 1 1 0 0 1 1 0 0 1C10 1 1 0 0 0 1 1 1 0 0 0 1 1 0 0 1 1 0 1 1C11 1 1 0 0 0 1 1 1 0 1 0 1 1 0 0 1 1 0 1 1C12 1 1 0 1 0 1 1 1 0 1 0 1 1 0 0 1 1 0 0 1C13 1 1 0 0 0 1 1 1 0 1 1 1 0 0 0 0 0 1 1 0 RC 1 0 0 0C14 1 0 1 0 0 1 0 1 0 1 1 1 0 1 1 0 0 1 1 1 RE 1 0 0 1C15 1 0 1 0 0 1 0 1 0 1 1 0 0 1 1 0 0 1 1 1C16 1 0 0 0 0 0 0 1 0 1 1 0 0 1 0 0 0 1 1 1C17 1 0 0 0 0 1 0 1 0 1 1 1 0 1 1 0 0 1 1 1C18 1 0 1 0 1 1 0 1 0 1 1 1 0 1 1 0 0 1 1 1C19 1 0 1 0 0 1 0 1 0 1 1 1 0 0 1 0 0 1 1 0C20 1 0 0 0 0 0 0 1 0 1 1 0 0 0 0 0 0 1 1 0C21 1 0 1 0 0 1 0 1 1 1 1 1 0 0 1 0 0 1 1 0C22 1 0 0 0 0 0 0 1 1 1 1 0 0 0 0 0 0 1 1 0
Site numbers correspond to sites in Fig. 1 (from left to right). Above the site number appears the enzyme that recognizes the site (R = RsaI, H = HaeIII, E = EcoRI, B = BamHI, S = SpeI, EV = EcoRV). In the main body, designation 1 denotes presence of cleavage and 0 denotes absence of cleavage. Haplotypes are separated into those belonging to cluster F and those belonging to cluster M.
760 M . L A D O U K A K I S E T A L .
© 2002 Blackwell Science Ltd, Molecular Ecology, 11, 755–769
Most haplotypes of the F cluster were recovered fromfemales or ‘typical’ males (i.e. males that also contained anM type; see Terminology section in Material and Methods)and the majority of haplotypes of the M cluster fromtypical males. There were two exceptions to this rule.Haplotype C10 was recovered both from females and from‘atypical’ males, i.e. males that did not contain an M type.Molecules of this type, i.e. molecules of type F found inatypical males, represent cases of ‘masculinization’, i.e.genomes that originated in the maternal lineage and havesubsequently invaded the paternal transmission route(Hoeh et al. 1997). The second exception is haplotype C13,which clusters with the M haplotypes, but was recoveredfrom a female individual. In five restriction sites C13 has astate found only in M-type molecules and in two sites it hasa state found only in F-type molecules. There are twopossibilities for the placement of this molecule in the Mcluster: it may represent a case of ‘feminization’, i.e. a caseof a molecule that originated in the paternal lineage andhas subsequently invaded the maternal transmissionroute, or it may represent a case of recombination at theCOIII region between an F and an M molecule. The latteralternative is more likely given that the female from whichC13 was taken contains at the 16S rRNA gene a haplotypethat is typical of an F molecule (Table 2).
Figure 2(A) shows also the populations in which eachhaplotype was found. In the same figure (Fig. 2B) we
provide the most parsimonious network of mutationaldescent of haplotypes. The multiple connections of somehaplotypes with others and the circular patterns in partsof the networks indicate convergence through homoplasyor recurrent mutation. As a result, there are severalequally probable possibilities of haplotype descent. Four Fhaplotypes (C3, C4, C5 and C6) could not be placed in thenetwork in a way that would be consistent with theirrestriction differences from other haplotypes. Interest-ingly, they are also the four rarest haplotypes in the entirecollection of samples: C3, C4 and C5 were each found twiceand C6 was found once. This suggests that these haplo-types might be the products of multiple mutational hits,which will make them rare in the population and at thesame time will make it difficult to embed them within themutational network.
The first observation from comparing the phylogenetictree with the mutational networks is that the tree may notdepict accurately the mutational history of haplotypes. Forexample, C14 is placed closer to C18 than to C15 or C17,even though it is separated from both by one restriction dif-ference and also co-occurs with both in the same geograph-ical area. The second observation is that in both networksthe haplotype with the larger number of connections (C9for the F cluster and C14 for the M) is also the most com-mon haplotype in the collection of samples (Table 4). Thethird observation is that the networks of descent are in
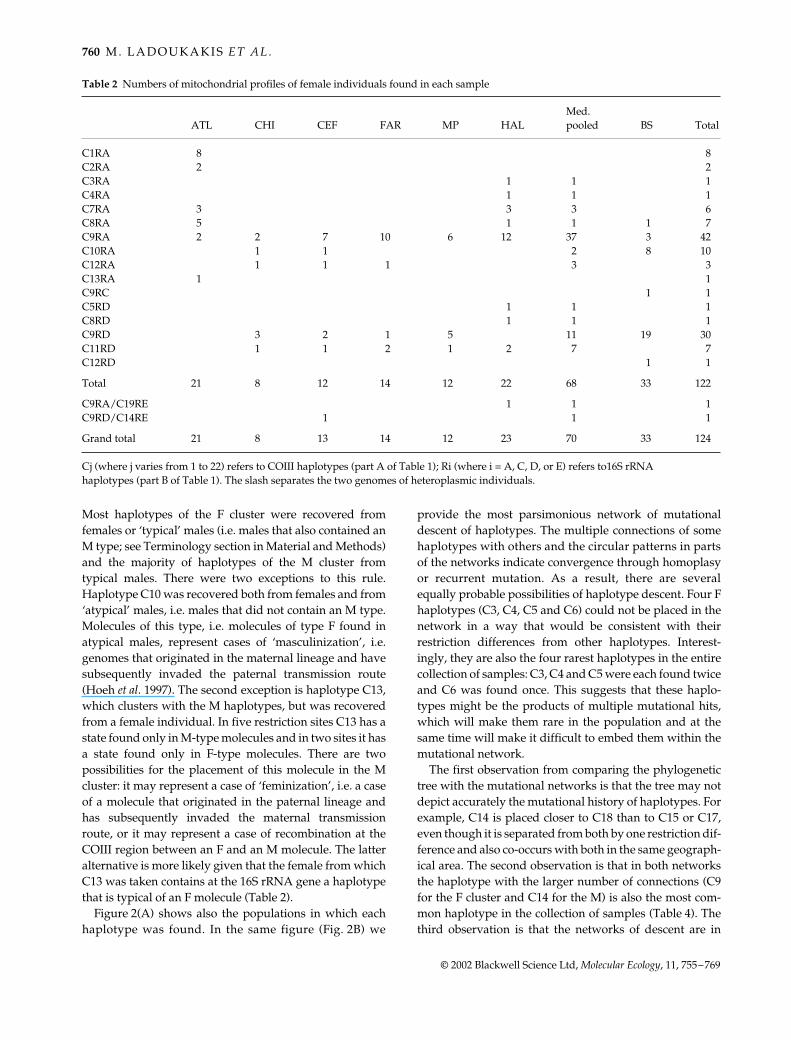
Table 2 Numbers of mitochondrial profiles of female individuals found in each sample
ATL CHI CEF FAR MP HALMed. pooled BS Total
C1RA 8 8C2RA 2 2C3RA 1 1 1C4RA 1 1 1C7RA 3 3 3 6C8RA 5 1 1 1 7C9RA 2 2 7 10 6 12 37 3 42C10RA 1 1 2 8 10C12RA 1 1 1 3 3C13RA 1 1C9RC 1 1C5RD 1 1 1C8RD 1 1 1C9RD 3 2 1 5 11 19 30C11RD 1 1 2 1 2 7 7C12RD 1 1
Total 21 8 12 14 12 22 68 33 122
C9RA/C19RE 1 1 1C9RD/C14RE 1 1 1
Grand total 21 8 13 14 12 23 70 33 124
Cj (where j varies from 1 to 22) refers to COIII haplotypes (part A of Table 1); Ri (where i = A, C, D, or E) refers to16S rRNA haplotypes (part B of Table 1). The slash separates the two genomes of heteroplasmic individuals.

D U I A N D M T D N A V A R I A T I O N 761
© 2002 Blackwell Science Ltd, Molecular Ecology, 11, 755–769
good agreement with the geographical origin of haplo-types. The high majority (89%) of all F-type molecules inthe Atlantic sample is made of C1, C2, C7 and C8 which aretightly connected in the network of descent. The sameapplies to the Black Sea sample where 97% of the F mole-cules are made of C9 (by far the most common haplotype),and of C12 and C10, which are one and two steps, respect-ively, away from C9. All eight haplotypes of the F networkwere found in the Mediterranean, in agreement with thehypothesis that there must be a certain amount of geneexchange between the Mediterranean and the other twoseas (see below). With regard to the M types, all three hapl-otypes found in the Atlantic sample (C22, C21 and C20) areinterconnected in the network. The C14 was the only hap-lotype found in the Black Sea, and it is also the most com-mon haplotype in the Mediterranean. This haplotype,together with C15, C17, C18 and C19 (all of which aretightly connected with C14), comprises 97% of the Medi-terranean collection. The fourth observation is that the Fhaplotypes are more tightly interconnected than are the Mhaplotypes. Taking all pairwise combinations of haplo-types and counting the mutation steps that separate onemember of the pair from the other (using always theshorter path), we obtain a mean distance of 2.17 mutationsfor the eight haplotypes of the F network and 4.64 for the10 haplotypes of the M network. This is strong evidence fora higher turnover rate of M types in populations of mussels(see Discussion).
Animals with typical and atypical mtDNA genotypes
The composite haplotypes (i.e. the restriction patterns forthe COIII and the 16S RNA regions) of females from allseven samples are given in Table 2. We have observed onlytwo atypical females among 124 examined (1.6%). Thesefemales contained an F and an M type and are thereforeassumed to have inherited mtDNA from both parents.They represent an exception to DUI. Heteroplasmicfemales of this kind have been observed in previousstudies, in some cases in high frequencies (Fisher &Skibinski 1990; Rawson et al. 1996).
Composite haplotypes for males are given in Table 3.Genotypes were grouped into four classes. Classes I and IIinclude typical males. In class I the paternal genome couldbe scored for both mtDNA regions. In class II the paternalgenome could be scored only for the 16S rRNA gene. Therecan be two explanations for the failure to score the paternalCOIII region in males of class II. One is that the PCR primerswe have used could not recognize the paternal COIIIsequence in these males. The second is that in these malesthe paternal genome is in low amounts. This latter hypo-thesis coupled with the observation (Saavedra, unpublished)that the used PCR primers bind preferentially to the COIIIof the F genome, would lead to the conclusion that the PCR
failed to produce a scorable COIII amount from thesemales. A previous study by Saavedra et al. (1997) supportsthis interpretation. These authors observed that one of themale parents used in laboratory crosses (male # 70) gavesons in which the COIII assay failed to produce evidence ofpresence of the paternal genome, yet the paternal COIIIproduct could be detected in the father’s gonad and sperm,thus eliminating the possibility of primer failure. Whensons from the same sibships were scored at an older age,they were found to be positive for the paternal genome onthe basis of the 16S rRNA assay (this assay was not per-formed on young males from the same shibship) and somewere also positive for the COIII assay (Saavedra et al.unpublished results).
Classes III and IV contain atypical males, i.e. males thatdid not carry a molecule that in terms of nucleotidesequence belonged to the M cluster. In class III we couldrecognize two molecules both of type F: one that was dom-inant in the somatic tissues, and should therefore be thematernal molecule, and one that was dominant in thegonad, and should thus be the paternal molecule. In classIV males appear homoplasmic for an F-type molecule.There exist several possibilities for these males: (i) Theycarried a typical M molecule, but our assay failed to detectboth the COIII and the 16S rRNA parts of these molecules.This explanation is unlikely on two grounds. First all malesin our samples were large and with ripe gonads suggestingthat age could not be a limiting factor in the detection of theM molecule. Second, even though we have noted in previ-ous studies that COIII is more difficult to detect in juvenilethan adult males no such difference was noted for the 16SrRNA region, which produces a scorable PCR productfrom young and old males that carry a typical M molecule;(ii) these males carry two molecules whose sequences maybe different, yet they produce the same restriction profile atboth scored regions; (iii) they have inherited truly identicalmolecules from each of their parents; (iv) they failed toinherit an mtDNA genome from their male parent. Atyp-ical males of either class II or IV have been observed in pre-vious studies by other authors (Fisher & Skibinski 1990;Rawson et al. 1996).
Unlike atypical females, whose rarity does not allow usto speak about differences in their geographical distribu-tion, the distribution of the four classes of males differsstrongly among samples. All Atlantic males belonged toclass I. Almost all males of class II (30 out of 32) were foundin the Mediterranean, and within the Mediterranean theywere present in all five samples. We failed to observe malesof class III or IV in the sample from the Atlantic, but thismay simply be due to the limited size of this sample. Thesporadic occurrence of males of this type in the Mediter-ranean samples is in line with what we would expect fromprevious population studies (Quesada et al. 1995). Thecomparison of the pooled Mediterranean frequency (8 out

762 M . L A D O U K A K I S E T A L .
© 2002 Blackwell Science Ltd, Molecular Ecology, 11, 755–769
Table 3 Mitochondrial genotypes of male individuals found in each sample
ATL CHI CEF FAR MP HALMed. pooled BS Total
Class IC9RA/C15RE 2 1 2 5 5C9RA/C14RE 1 6 2 6 15 15C9RA/C19RE 1 1 3 5 5C7RA/C18RE 1 1 1C1RA/C15RE 1 1 1C10RA/C14RE 2 1 3 3C10RA/C15RE 1 1 1C10RA/C18RE 1 1 1C10RA/C19RE 1 1 1C8RA/C20RE 1 1 1C8RA/C19RE 1 1 1C7RA/C19RE 1 1 1C12RA/C14RE 1 1 1C12RA/C15RE 1 1 2 2C11RA/C14RE 1 1 2 2C9RD/C14RE 4 3 4 1 1 13 6 19C9RD/C19RE 2 1 3 3C4RA/C14RE 1 1C11RD/C18RE 1 1 1C11RD/C17RE 1 1 1C10RD/C17RE 1 1 1C9RC/C14RE 1 1C11RD/C16RE 1 1 1C1RA/C22RC 2 2C2RA/C22RC 2 2C7RA/C22RC 2 2C8RA/C21RC 1 1C6RA/C20RC 1 1
Total 8 9 21 6 8 17 61 8 77
Class IIC7RA/–RE 1 1 2 2C8RA/–RE 1 1 2 2C9RA/–RE 4 2 4 10 10C10RA/–RE 1 1 2 2C12RA/–RE 1 1 1C1RD/–RE 1 1 1C3RD/–RE 1 1 1C5RD/–RE 1 1 1C9RD/–RE 4 3 1 8 2 10C10RD/–RE 1 1 1C11RD/–RE 1 1 1
Total 0 12 6 9 2 1 30 2 32
Class IIIC9RA/C10RD 7 7C9RC/C10RA 1 1C9RD/C10RD 3 3
Total 0 0 0 0 0 0 0 11 11
Class IVC10RA/– 1 1 5 6C9RD/– 2 2 1 5 4 9C10RD/– 1 1 1C11RD/– 1 1 1
Total 0 3 2 0 2 1 8 9 17
Grand Total 8 24 29 15 12 19 99 30 137
Symbolism as in Table 2. In class II no reading of the COIII haplotype of the paternal molecule was possible. In class IV only one molecule could be read.

D U I A N D M T D N A V A R I A T I O N 763
© 2002 Blackwell Science Ltd, Molecular Ecology, 11, 755–769
of 99) with that of the Atlantic (0 out of 8) is not significant(P = 0.525, by Fisher’s exact test).
In contrast to the sporadic presence of atypical males inthe Atlantic and the Mediterranean samples, the frequencyof these males in the Black Sea sample is exceptionallyhigh, comprising two-thirds of all males. Eleven of theatypical males of the Black Sea sample belong to class III,which makes it possible to identify their paternal andmaternal genomes through use of somatic tissue. In 10 ofthese males the paternal molecule has the restrictionpattern C10RD and in one it has the pattern C10RA.C10RD was not found among females, so we may con-clude that this haplotype is always paternally transmitted,even though on the basis of restriction pattern at both theCOIII and the 16S rRNA regions it belongs to the F family.This cannot be said for the C10RA pattern that was alsofound among females, typical males and atypical classIV males.
Distribution of maternal types among typical female and typical male individuals
Given that typical males contain an easily identifiablematernal genome, one can ask whether maternal genomesfound among males have the same frequency distributionas those found among females. When this test was carriedout within each sample separately, it was found to besignificant only in one Mediterranean sample (FAR:d.f. = 4, χ2 = 11.861, P = 0.018). This is not significant afterthe Bonferroni correction (5% critical value α = 0.007).Thus there is no reason to reject the null hypothesis thatmaternally transmitted genomes have an equal probabilityof being found among female or male individuals.
Another question is whether pairs of maternal andpaternal haplotypes found among males are random com-binations of the maternal and paternal haplotypes of thepopulation as a whole. The question can be answered byusing only males of class I. In class II the only scored partof the molecule, the 16S rRNA, was monomorphic and inclasses III and IV both genomes were of the F type. TheBlack Sea sample does not provide information because allmales contain the same paternal haplotype (C14RE). Forthe remaining six samples, the Raymond and Rousset testwas barely significant in two Mediterranean samples (CEF,P = 0.057; FAR, P = 0.065) and significant for the Atlanticsample (P = 0.032). Again, the latter result is not significantafter the Bonferroni correction.
Haplotype variation and geographical differentiation
The observation that within each sample F types havesimilar distributions among female and male individualsallows the pooling of F genomes from both genders to formone distribution of F-type haplotypes. Table 4 gives the
numbers of F haplotypes and M haplotypes observed ineach sample. In the same table we provide haplotypediversities. One noteworthy observation is that maternalmolecules are, with one exception, more diverse thanpaternal molecules. This difference between the two typesof genomes takes its extreme form in the BS sample, wherethere is no polymorphism for the M genome. Thisobservation suggests that effective population sizes arelarger for the F genome. We may use the method of Zouros(1979) to estimate the ratio of the two effective sizes in eachpopulation. Assuming neutrality, the expected effectivenumber of alleles (ne) in the population is given byne = Cneu + 1 (Crow & Kimura 1970). The constant C varieson whether one assumes an infinite or a step-wise model ofmutation and on whether one deals with nuclear ormitochondrial genomes. From this we can see that
Ne,F/Ne,M = (ne,F – 1)/(ne,M – 1)
where Ne,F, Ne,M, ne,F and ne,M are the effective populationsize and the effective number of alleles for the F and Mgenomes, respectively. An estimate of ne is obtained from
ne = 1/Σp i2 = 1/(1 – D)
where D is the mitotype diversity (Table 4). The ratio ofNe,F : Ne,M is given in Table 4. No statistical testing can bedone on these ratios, which are expected to have largestandard errors given the small number of genomes onwhich they were estimated, but it is clear that the effectivepopulation size for the F genome exceeds that for the Mgenome, perhaps by a factor of two or more.
The distribution of the haplotypes of the F genome(Table 4) was significantly different when all sevensamples were considered together (P = 0 to the fifthdecimal point by Raymond and Rousset’s test). All pairwisecomparisons of the Atlantic sample with the Mediterraneanand the BS samples were also highly significant and so wasthe comparison of Atlantic vs. ‘Mediterranean’, i.e. thecombined five Mediterranean samples. The comparison ofBS with the Mediterranean samples, either separately orwith their mean, produced the same result. For the fiveMediterranean samples the same tests yield P = 0.036. Acloser look at these samples reveals that the three samplesfrom the Aegean (HAL, MP, FAR) are homogeneous(HAL/MP, P = 0.208; HAL/FAR, P = 0.858; MP/FAR,P = 0.810). The Adriatic sample was different for the Ioniansample (CHI/CEF, P = 0.028) and from the two Aegeansamples (CHI/HAL, P = 0; CHI/MP, P = 0.830; CHI/FAR,P = 0.053). The Ionian sample was different from twoAegean samples (CEF/HAL, P = 0.084; CEF/MP, P =0.003; CEF/FAR, P = 0). Thus, there is an indication thatsamples from the Aegean form a more homogeneous col-lection than the Mediterranean as a whole.

764 M . L A D O U K A K I S E T A L .
© 2002 Blackwell Science Ltd, Molecular Ecology, 11, 755–769
The comparison of the distribution of M haplotypes(Table 4) shows a much stronger degree of geographicaldifferentiation. The Atlantic sample consists of four types,none of which was found in either the Mediterranean orthe Black Sea to five decimal points in each sample, so thereis complete differentiation between this sample and therest. The Black Sea sample is fixed for haplotype C14RE.All Mediterranean samples contain two or more haplo-types, but haplotype C14RE is also the most common in allof them. Tests of heterogeneity are not very informativeowing to small sample size of M genomes for mostsamples, but a comparison of the Black Sea sample withthe combined Mediterranean sample is highly significant
(P = 0 to fifth decimal point from the Raymond andRousset test).
The between sample Nei haplotype distances parallelthe results from the homogeneity tests (Tables 5 and 6). Thedistance matrix illustrates clearly the fact that populationsare more differentiated for the M than the F genome. TheM distance is higher than the F in any pairwise compari-son. The distances of the Atlantic sample for the M genomeare on average nine times as large as that for the F genome.Likewise, the mean distance of the Black Sea sample fromthe Mediterranean samples is on average seven timesas high for the M as for the F genome. The same table pro-vides distances and FST values for the three seas. For the
Table 4 Frequencies of F-type and M-type in each sample, with corresponding haplotype diversities
ATL CHI CEF FAR MP HALMed. pooled BS
F typesC1RA 10 1 1C2RA 4C3RA 1 1C4RA 1 1 1C6RA 1C7RA 5 1 1 1 4 7C8RA 6 2 1 1 1 5 1C9RA 2 7 18 15 9 24 73 10C10RA 2 6 2 1 11 14C11RA 1 1 2C12RA 4 1 1 1 7C9RC 3C1RD 1 1C3RD 1 1C5RD 1 1 2C8RD 1 1C9RD 13 11 5 8 4 41 34C10RD 2 1 3 10C11RD 1 4 3 1 3 12C12RD 1
Total 28 32 42 29 24 42 169 74Haplotype diversity 0.824 0.784 0.734 0.683 0.768 0.662 0.745 0.648
M typesC13RA 1C14RE 6 12 4 5 8 35 8C15RE 1 3 2 3 9C16RE 1 10C17RE 1 1 20C18RE 1 1 1 30C19RE 1 4 2 5 12C20RE 1 10C20RC 1C21RC 1C22RC 6
Total 9 9 22 6 8 18 63 8Haplotype diversity 0.583 0.583 0.675 0.533 0.607 0.732 0.641 0
See text for the calculation of the ratio of the effective population sizes for the two types of genomes.

D U I A N D M T D N A V A R I A T I O N 765
© 2002 Blackwell Science Ltd, Molecular Ecology, 11, 755–769
Mediterranean the given values are the means of the fivesamples from the ATL and the BS samples. Some Medi-terranean samples are marginally closer to BS than to otherMediterranean samples and it is only on posterior averagingthat the Mediterranean samples appear to be a more homo-geneous collection (average distances among Mediterraneansamples 0.0017 and 0.0146 for the F and M genomes,respectively, compared to 0.0022 and 0.0166 which arethe average distances of the five Mediterranean samplesfrom BS). The FST values produce the same qualitativeresult.
Discussion
The mere presence of two independently evolvingmitochondrial lineages within the same species raises newopportunities but also calls for special attention whenusing mtDNA variation to study population structure andphylogeny in species with DUI. Here we have attempted todemonstrate these opportunities and difficulties in themussel Mytilus galloprovincialis. A recent report of DUI in aspecies of the clam family Veneridae (Passamonti andScali 2001) suggests that DUI may be more widespreadthan expected, at least within bivalves, so that ourconclusions may have implications for a large number ofspecies.
Lack of awareness that the species under study mayhave the DUI system of mtDNA may lead to false inter-pretations of population data. For example presence in apopulation of individuals that are heteroplasmic for two highlydivergent mtDNA molecules could be the result of contactbetween two hybridizing yet sufficiently differentiatedsubspecies (Rand & Harrison 1989), or it could be the resultof DUI (Hoeh et al. 1991). An unusually high degree ofmtDNA variation among conspecific individuals from thesame population should be taken as a first sign of DUI,but it cannot by itself establish the presence of DUI. Forthis, further evidence is needed, such as gender-specificdifferences in mtDNA sequence and male-specificheteroplasmy.
Another complication comes from the observation inmussels that not all individuals in a population conform tothe rules of DUI. In this study the vast majority of femalesproduced the typical DUI pattern, i.e. they were homo-plasmic for the maternal genome. However, we haveclearly identified two females that contained a maternaland a paternal genome. These females appear to violatethe hypothesis of sex determination in mussels proposedby Saavedra et al. (1997). In an attempt to explain the tightcorrelation between maleness and presence of paternalmtDNA and the observation that in pair-matings of mus-sels the sex ratio varies widely and is under the control ofthe female parent, these authors suggested that in musselsthe female is the default sex and that maleness is inducedby a factor carried by sperm mitochondria. The mother’snuclear genotype determines whether the egg will abortthe sperm mitochondria (and therefore develop into afemale) or will retain the sperm mitochondria (and there-fore develop into a male). The two atypical females suggestthat maleness may not depend on the mere presence of asperm mitochondrial factor in the early stages of develop-ment, but on the delivery of this factor in the primordialgerm cells, a postulate made by Saavedra et al. (1997).
The majority of males in the Atlantic and the Mediterra-nean samples were also typical for a species with DUI.Atypical males (i.e. males lacking a typical M genome) inthese two seas appeared with a frequency that is typical tomost natural populations of mussels (8/107, or about 7%).In the Black Sea sample 20 of the 30 males were atypical.Eleven of these were clearly heteroplasmic for two slightlydifferent F molecules. By using pure somatic tissues wecould identify which of these molecules was inherited fromthe mother and which from the father. Given that mtDNArecombination is occurring in mussels (Ladoukakis &Zouros, 2001a), the possibility exists that the mtDNAmolecule that dominates the gonads of these males is in factof the M type, and that simply the COIII region of it hasincorporated an F-like sequence through recombinationbetween an F and an M molecule. This seems unlikelygiven that these same molecules have also an F-like
Table 5 Nei distances for pair-wise combinations of samples
ATL CHI CEF FAR MP HAL BS
ATL — 0.133 0.141 0.137 0.137 0.108 0.142CHI 1.355 — 0.002 0.002 0.002 0.004 0.002CEF 1.012 0.008 — 0.000 0.000 0.003 0.001FAR 1.118 0.017 0.014 — 0.000 0.002 0.002MP 1.318 0.009 0.015 0.041 — 0.002 0.002HAL 1.115 0.008 0.005 0.005 0.024 — 0.004BS 1.520 0.005 0.019 0.028 0.009 0.022 —
F genomes above the diagonal; M genomes below the diagonal.
Table 6 Nei distances and FST values for the three major Seas forboth types of molecules (MED is the average for the fiveMediterranean samples)
ATL/MED MED/BS ATL/BS
Nei distancesF 0.131 0.002 0.142M 1.184 0.017 1.520
FST valuesF 0.196 0.098 0.235M 0.378 0.133 0.694

766 M . L A D O U K A K I S E T A L .
© 2002 Blackwell Science Ltd, Molecular Ecology, 11, 755–769
sequence at the 16S rRNA gene, which is located at a dis-tant part of the mtDNA molecule. We conclude that thewhole paternal molecule in these 11 males is of the F type,yet in terms of function and mode of transmission thismolecule behaves as an M molecule. This is one type ofevidence used by Hoeh et al. (1996b, 1997) to propose the‘masculinization’ or ‘role reversal’ hypothesis according towhich a maternally transmitted genome may revert intoa paternally transmitted one. The other type of evidencecomes from the pair-mating study of Saavedra et al. (1997),who observed that sons from a specific male producedsons with no or abnormally small amounts of M genome.
A large fraction of atypical males in the sample from theBlack Sea were scored as homoplasmic for an F molecule(class IV, Table 3). We have examined several hypothesesabout how this class of males can be explained (seeResults). Apparent male homoplasy is compatible, indeedexpected, under the phenomenon of masculinization,which we have outlined above. This will happen when thepaternal and maternal molecules in a male individual can-not be diagnosed as different with the assay in use. Takentogether classes III and IV raise the question why theseatypical males predominate in the BS sample, while theyare rather rare in the other samples. The most likely explana-tion is that in the sampled Black Sea population there hasbeen a recent invasion of the paternal route by a maternallyinherited molecule and that this ‘recently masculinized’molecule has increased its frequency either by randomdrift or selection. Ignoring class IV, in which the paternalmolecule cannot be distinguished from the maternal one,we may recognize two types of masculinized molecules:C10RD and C10RA (class III, Table 3) of which the latterwas found only once. It is difficult to claim that thesemolecules resulted from two separate masculinizationevents, since RA differs from RD by one restriction site andcould have come about by mutation or recombination.
The question of whether the masculinized moleculeowes its high frequency to selection or random drift is ofhigh importance for the phenomenon of DUI, but we donot have at present direct evidence that bears on this issue.However, the phenomenon of replacement of M moleculesby F molecules appears to have occurred very often overevolutionary time. Such events provide the best explana-tion for the mitochondrial phylogenies between the famil-ies Mytilidae and Unionidae (Hoeh et al. 1996b), betweenthe genera Gukencia and Mytilus of Mytilidae (Hoeh et al.1996b) and between Mytilus californianus and the Mytilusedulis species complex of the genus Mytilus (Hoeh et al.1997). It was also suggested as the more likely explanationfor the introgression of F-type sequences from Mytilusedulis into the paternally transmitted molecules of Mytilustrossulus of the Baltic Sea (Quesada et al. 1999). We mayconsider the Black Sea population as a case where we havean in-progress intraspecific replacement of the M lineage
by a molecule (and its mutational and/or recombinationalderivatives) that has invaded the paternal route from thematernal route. If so, in due time the entire pool of maternalmolecules of this population will resemble the maternalpool of this and other conspecific populations. Presence of‘typical’ M molecules in this population will only dependon gene flow from other populations. The independentsegregation of maternal from paternal genomes and ofboth these two molecules from the nuclear genes makes itimpossible to decide whether the typical M moleculesfound in the Black Sea sample are indigenous to this popu-lation or have been brought in by migration. Regardlessof the usual difficulties in attributing the increase of amolecular variant to selection or drift or in assigningits presence to indigenous origin or migration, the factremains that the phenomenon of role reversal may leadto completely erroneous results when using the pool ofpaternally inherited molecules to draw conclusionsabout biogeography and phylogeny. Our awareness of thephenomenon allowed the assignment of F-like paternalmolecules to the F cluster of molecular phylogeny, so thatevolutionary distances among samples were separatelyinferred from each of these clusters. Treating all paternalmolecules of the BS sample as one (even though highlyheterogeneous) lineage would have created difficultiesat arriving in a consistent M. galloprovincialis phylogeo-graphy and would have necessitated appeals to macro-evolutionary events, such as speciation and interspecifichybridization.
Once the occurrence of DUI itself is recognized and thecomplications from the associated events of role reversalare appreciated, the analysis of population data of mtDNAvariation may proceed by examining the F-cluster and theM-cluster separately. Three related differences betweenthe two genomes are worth noting. Firstly, the connected-ness of the F haplotype mutational network is much tighterthan the M network (Fig. 2B), suggesting an overall higherturnover rate for the M genome. Secondly, the within-sample variation (and therefore the estimated effectivepopulation size) is smaller for the M genome (Table 4);and thirdly, the among-sample differentiation is larger forthe M genome (Table 6). Several authors have made theobservation that the M genome evolves faster than the F(Skibinski et al. 1994b; Hoeh et al. 1996a; Rawson & Hilbish1996; Stewart et al. 1996) and proposed explanations for it.One explanation is that the F genome has a larger effectivepopulation size by virtue of its occurrence in both sexes,whereas the M genome is restricted to males. This explana-tion ignores the fact that a mutation that occurs in an Fmolecule during its residence in a male individual will not passon to the next generation, thus males are evolutionary deadends for the F genome. But this argument assumes no freerecombination between F and M molecules, for which wehave no evidence one way or the other [the recombination

D U I A N D M T D N A V A R I A T I O N 767
© 2002 Blackwell Science Ltd, Molecular Ecology, 11, 755–769
observed by Ladoukakis and Zouros (2001a) was betweentrue F and masculinized F molecules]. Another hypothesisis that the M genome is under strong directional selectionimposed from a presumed specialized role for high spermperformance (Skibinski et al. 1994b). Such a selectionwould generate successive waves of selective sweeps(Begun & Aquadro 1992) for the entire molecule (againassuming no or minimal recombination) and wouldexplain all three differences between the two genomesmentioned above. A third hypothesis makes the contraryassumption that the M genome is under relaxed selectionowing to its limited function in the male germ line, whereasthe F genome’s role is to support the female germ line andthe soma of both males and females. The two competinghypotheses were addressed by Stewart et al. (1996) whoused data for the COIII gene from mollusc species otherthan Mytilus to identify highly constrained amino acidsites (those that did not vary among species) and less-constrained sites (those that varied). The Mytilus data werethen used to show that the faster replacement rate of the Mgenome was confined to the less-constrained sites, whereasthe rate was the same at highly constrained sites. This find-ing is compatible with the hypothesis of relaxed constraintfor the M genome, i.e. there were many more sites at whichmutation would be nearly neutral or slightly deleteriouswhen occurring in the M genome, but highly deleterious whenoccurring in the F genome. This hypothesis will explain thehigher evolutionary rate of the M molecule. It would alsoexplain the lower standing variation within a populationand the high rate of turnover and intersample differentia-tion by accumulation of mild deleterious mutations (Ohta1976) or background selection (Charlesworth et al. 1995).
The faster evolution and turn-over rate of the M lineagecombined with its liability to invasion from the F lineagefurther suggest that this lineage is not reliable for phylo-genetic and biogeography studies of species with DUI.Liu et al. (1996) have shown that among three types ofgenetic information of population differentiation (nuclearallozymes, F mtDNA lineage and M mtDNA lineage) theM lineage was the one that produced the larger degrees ofdifferentiation. This is clearly the case in our study, wherethe M genome completely differentiates the Atlanticsample from both the Mediterranean and the Black Sea.It also differentiates the Mediterranean from the BlackSea, event though this is because the Black Sea is fixed fora haplotype that is one among several present in theMediterranean (Table 4).
From the point of biogeography of Mytilus galloprovincialisour study suggests that in spite of the species’ inherentability to disperse through its planktonic larval stage, geo-graphical differentiation can accumulate. This can be seeneven within the Mediterranean, where the Adriatic, theIonian and the Aegean Seas are different from each othereven at the ‘normally’ behaving F molecule, and from the
fact that no such differences can be seen among the threeAegean samples. At a macro-geographical scale, the Atlanticis placed at one end of differentiation, on account of boththe M and the F genomes. This observation was made pre-viously (Quesada et al. 1995) for the Atlantic/Mediter-ranean comparison and is attributed to the Almeria–Oranhydrographic barrier, which is known to affect the geneflow of other species as well (Ramon & Castro 1997; Naciriet al. 1999; Zane et al. 2000). The differentiation of theMediterranean and the Black Sea is significant but muchsmaller than that between each of these seas from theAtlantic. Contrary to the Atlantic, the Black Sea samplecontained no haplotype, either F or M that was not foundin the Mediterranean. This might appear as unexpectedgiven the water straits and hydrographic barriers that mayrestrict migration between the Mediterranean and theBlack Sea. In anchovies mtDNA hyplotype variation sug-gested a predominantly one-way gene flow from the BlackSea to the Aegean (Magoulas et al. 1996), but this patternis not obvious in M. galloprovincialis from this study, asevidenced from failure to observe an increased presenceof F-type paternal molecules in the Aegean Sea. This, how-ever, might be attributed to the large geographical distanceof the examined BS sample from the corridor of commun-ication between the two seas. We note, however, that ourresults regarding the degree of population differentiationwithin the Mediterranean and the Black Sea, as well asamong the three major Seas, are based on small samplessizes. This is particularly true for the Black Sea, from wherewe were able to secure only one sample. Obviously, a moreelaborate sampling scheme is needed before we could havea good idea of the gene flow of M. galloprovincialis betweenthese three large water bodies.
Acknowledgements
We thank A. Ivanov, G. Kotoulas and T. Patarnello for help withthe collection of mussel samples and M. Dramountani, G. Goulielmos,I. Theologidis and D. Tsagarakis for help in the preparation ofthe manuscript. E.D.L. was supported by a scholarship fromBodosdkis Foundation and C.S. by a E.U. Marie Curie Fellowship.
References
Arctander P (1999) Mitochondrial recombination? Science, 284,2090–2091.
Avise JC (2000) Phylogeography. Harvard University Press, Cam-bridge MA, London UK.
Ballard JWO, Kreitman M (1995) Is mitochondrial DNA a strictlyneutral marker? Trends in Ecology and Evolution, 10, 485–488.
Begun DJ, Aquadro CF (1992) Levels of naturally occurring DNApolymorphism correlate with recombination rates in D melano-gaster. Nature, 356, 519–520.
Charlesworth D, Charlesworth B, Morgan MT (1995) The patternof neutral molecular variation under the background selectionmodel. Genetics, 141, 1619–1632.

768 M . L A D O U K A K I S E T A L .
© 2002 Blackwell Science Ltd, Molecular Ecology, 11, 755–769
Chinnery PF, Turnbull DM (1998) Mitochondrial DNA and dis-ease. Netherlands Journal of Medicine, 53, 4–6.
Crow JF, Kimura M (1970) An Introduction to Population GeneticsTheory. Harper & Row, New York.
Felsenstein J (1995) PHYLIP: Phylogenetic Inference Package, Version3.5c. University of Washington, Seattle, WA.
Gosling EM (1992) The Mussel Mytilus: Ecology, Physiology, Geneticsand Aquaculture. Elsevier, Amsterdam.
Fisher C, Skibinski DOF (1990) Sex-biased mitochondrial DNAheteroplasmy in the marine mussel, Mytilus. Proceedings of theRoyal Society of London, 242, 149–156.
Garrido-Ramos MA, Stewart DT, Sutherland B, Zouros E (1998)The distribution of male-transmitted and female-transmittedmitochondrial DNA types in somatic tissues of blue mussels:Implications for the operation of doubly uniparental inheritanceof mitochondrial DNA. Genome, 41, 818–824.
Gyllensten U, Wharton D, Josefsson A, Wilson AC (1991) Paternalinheritance of mitochondrial DNA in mice. Nature, 352, 255–257.
Hoeh WR, Blakley KH, Brown WM (1991) Heteroplasmy suggestslimited biparental inheritance of Mytilus mitochondrial DNA.Science, 251, 1488–1490.
Hoeh WR, Stewart DT, Sutherland BW, Zouros E (1996a) Cyto-chrome c oxidase sequence comparisons suggest an unusuallyhigh rate of mitochondrial DNA evolution in Mytilus (Mollusca:Bivalvia). Molecular Biology and Evolution, 13, 418–421.
Hoeh WR, Stewart DT, Sutherland BW, Zouros E (1996b) Multipleorigins of gender-associated mitochondrial DNA lineages inbivalves (Mollusca: Bivalvia). Evolution, 50, 2276–2286.
Hoeh WR, Stewart DT, Saavedra C, Sutherland BW, Zouros E (1997)Phylogenetic evidence for role-reversals of gender-associatedmitochondrial DNA in Mytilus (Bivalvia: Mytilidae). MolecularBiology and Evolution, 14, 959–967.
Kao SH, Chao HT, Wei YH (1998) Multiple deletions of mitochon-drial DNA are associated with the decline of motility andfertility of human spermatozoa. Molecular Human Reproduction,4, 657–666.
Kivisild T, Villems R (2000) Questioning evidence for recombina-tion in human mitochondrial DNA. Science, 288, 1931.
Kondo R, Satta Y, Matsuura ET, Ishiwa H, Takahata N, Chigusa SI(1990) Incomplete maternal transmission of mitochondrial DNAin Drosophila. Genetics, 126, 657–663.
Ladoukakis ED, Zouros E (2001a) Direct evidence for homologousrecombination in mussel (Mytilus galloprovincialis) mitochon-drial DNA. Molecular Biology and Evolution, 18, 1168–1175.
Ladoukakis ED, Zouros E (2001b) Recombination in Animal Mito-chondrial DNA. Evidence from published sequences. MolecularBiology and Evolution, 18, 2127–2131.
Lewontin RC, Felsenstein J (1965) The robustness of homogeneitytests in 2 X N tables. Biometric Society, 21, 19–33.
Liu H-P, Mitton JB, Wu S-K (1996) Paternal mitochondrial DNAdifferentiation far exceeds maternal mitochondrial DNA andallozyme differentiation in the freshwater mussel Anodontagrandis grandis. Evolution, 50, 952–957.
Magoulas A, Tsimenides N, Zouros E (1996) Mitochondrial DNAphylogeny and the reconstruction of the population history of aspecies: the case of the European anchovy (Engraulis encrasicolus).Molecular Biology and Evolution, 13, 178–190.
Magoulas A, Zouros E (1993) Restriction-site heteroplasmy inanchovy (Engraulis encrasicolus) indicates incidental biparentalinheritance of mitochondrial DNA. Molecular Biology and Evolu-tion, 10, 319–325.
Martin AP, Palumbi SR (1993) Body size, metabolic rate, generationtime, and the molecular clock. Proceedings of the National Academyof Sciences of the USA, 90, 4087–4091.
McElroy D, Moran P, Bermingham E, Kornfield I (1992) reap: anintegrated environment for the manipulation and phylogenicanalysis of restriction data. Journal of Heredity, 83, 157–158.
Merriweather DA, Kaestle FA (1999) Mitochondrial recombina-tion? Science, 285, 837.
Naciri M, Lemaire C, Borsa P, Bonhomme F (1999) Genetic studyof the Atlantic/Mediterranean transition in sea bass (Dicentra-rchus labrax). Journal of Heredity, 90, 591–596.
Ohta T (1976) Role of very slightly deleterious mutations in molecularevolution and polymorphism. Theoretical Population Biology, 10,254–275.
Palumbi SP, Martin AP, Romano S, McMillan WO, Stice L,Grabowski G (1991) The Simple Fool’s Guide to PCR. Departmentof Zoology, University of Hawaii, Honolulu.
Passamonti M, Scali V (2001) Gender-associated mitochondrialDNA heteroplasmy in the venerid clam Tapes philippinarum(Mollusca Bivalvia). Current Genetics, 39, 117–124.
Quesada H, Beynon CM, Skibinski DO (1995) A mitochondrialDNA discontinuity in the mussel Mytilus galloprovincialis Lmk:pleistocene vicariance biogeography and secondary intergrada-tion. Molecular Biology and Evolution, 12, 521–524.
Quesada H, Wenne R, Skibinski DO (1999) Interspecies transfer offemale mtDNA is coupled with role-reversals and departurefrom neutrality in the mussel Mytilus trossulus. Molecular Biologyand Evolution, 16, 655–665.
Ramon MM, Castro JA (1997) Genetic variation in natural stocksof Sardina pilchardus (sardines) from the western MediterraneanSea. Heredity, 78, 520–528.
Rand DM (1994) Thermal habit, metabolic rate and evolution ofmitochondrial DNA. Trends in Ecology and Evolution, 9, 125–131.
Rand DM, Harrison RG (1989) Molecular population genetics ofmitochondrial DNA size variation in crickets. Genetics, 121,551–569.
Rawson PD, Hilbish TJ (1996) Evolutionary relationships amongthe male and female mitochondrial DNA lineages in the Mytilusedulis species complex. Molecular Biology and Evolution, 12, 893–901.
Rawson PD, Secor CL, Hilbish TJ (1996) The effects of naturalhybridization on the regulation of doubly uniparental mtDNAinheritance in blue mussels (Mytilus spp.). Genetics, 144, 241–248.
Raymond MM, Rousset F (1995a) An exact test for populationdifferentiation. Evolution, 49, 1290–1283.
Raymond MM, Rousset F (1995b) GENEPOP (Version 1.2): popu-lation genetics software for exact tests and ecumenism. Journalof Heredity, 86, 248–249.
Saavedra C, Reyero MI, Zouros E (1997) Male-dependent doublyuniparental inheritance of mitochondrial DNA and female-dependent sex-ratio in the mussel Mytilus galloprovincialis.Genetics, 145, 1073–1082.
Skibinski DO, Gallagher C, Beynon CM (1994a) MitochondrialDNA inheritance. Nature, 368, 817–818.
Skibinski DO, Gallagher C, Beynon CM (1994b) Sex-limited mito-chondrial DNA transmission in the marine mussel Mytilusedulis. Genetics, 138, 801–809.
Sokal RR, Rohlf FJ (1995) Biometry E.d.3. Freeman, New York.Stewart DT, Kenchington ER, Singh RK, Zouros E (1996) Degree of
selective constraint as an explanation of the different rates ofevolution of gender-specific mitochondrial DNA lineages in themussel Mytilus. Genetics, 143, 1349–1357.

D U I A N D M T D N A V A R I A T I O N 769
© 2002 Blackwell Science Ltd, Molecular Ecology, 11, 755–769
Tajima F, Nei M (1984) Estimation of evolutionary distance betweennucleotide sequences. Molecular Biology and Evolution, 1, 269–285.
Wallis GP (1999) Do animal mitochondrial genomes recombine?Trends in Ecology and Evolution, 14, 209–210.
Wallis GP (2000) Mitochondrial recombination or coevolution ofsites? Trends in Ecology and Evolution, 15, 470.
Zane L, Ostellari L, Maccatrozzo L, et al. (2000) Genetic different-iation in a pelagic crustacean (Meganyctiphanes norvegica:Euphausiacea) from the North East Atlantic and the Mediter-ranean Sea. Mar Biology, 136, 191–199.
Zouros E (1979) Mutation rates, population sizes and amounts ofelectrophoretic variation of enzyme loci in natural populations.Genetics, 92, 623–646.
Zouros E, Freeman. KR, Ball AO, Pogson GH (1992) Directevidence for extensive paternal mitochondrial DNA inheritancein the marine mussel Mytilus. Nature, 359, 412–414.
Zouros E, Ball AO, Saavedra C, Freeman KR (1994a) MitochondrialDNA inheritance. Nature, 368, 818.
Zouros E, Oberhauser Ball A, Saavedra C, Freeman KR (1994b) Anunusual type of mitochondrial DNA inheritance in the bluemussel Mytilus. Proceedings of the National Academy of SciencesUSA, 91, 7463–7467.
This paper contains the results of the MSc. thesis of the first authorand is a product of on-going research on the mtDNA system ofMytilus. Dr. C. Saavedra was the recipient of a E.U. Marie CurieFellowship and is currently a researcher at the Instituto deAcuicultura de Torre la Sal, Spain. Dr. A. Magoulas is a researcherat the Institute of Marine Biology of Crete, Greece. Prof. E. Zourosis in the faculty of the Department of Biology of the University ofCrete and Director of the Institute of Marine Biology of Crete, Greece.