Expertise reversal for iconic representations in science visualizations
Upload
khangminh22Category
view
1download
0
Article
Reversal of Mitochondrial
TranshydrogenaseCauses Oxidative Stress in Heart FailureGraphical Abstract
Highlights
d Mitochondrial transhydrogenase (Nnt) normally regenerates
NADPH from NADH
d Pathologic workload reverses Nnt to deplete NADPH and
antioxidative capacity
d Reverse Nnt induces mitochondrial oxidative stress and
necrosis
d Defective Nnt in C57BL/6J mice ameliorates pressure
overload-induced heart failure
Nickel et al., 2015, Cell Metabolism 22, 472–484September 1, 2015 ª2015 Elsevier Inc.http://dx.doi.org/10.1016/j.cmet.2015.07.008
Authors
Alexander G. Nickel, Albrecht von
Hardenberg, Mathias Hohl, ..., Michael
Bohm, Markus Hoth, Christoph Maack
In Brief
The mitochondrial transhydrogenase
(Nnt) normally regenerates NADPH from
NADH to bolster antioxidative capacity.
Nickel et al. show that pathological
workload reverses the Nnt reaction and
depletes NADPH in the mouse heart,
which increases ROS production and
leads to maladaptive cardiac remodeling
in heart failure.

Cell Metabolism
Article
Reversal of Mitochondrial TranshydrogenaseCauses Oxidative Stress in Heart FailureAlexander G. Nickel,1 Albrecht von Hardenberg,1 Mathias Hohl,1 Joachim R. Loffler,1 Michael Kohlhaas,1 Janne Becker,1
Jan-Christian Reil,1 Andrey Kazakov,1 Julia Bonnekoh,1 Moritz Stadelmaier,1 Sarah-Lena Puhl,1 Michael Wagner,1
Ivan Bogeski,2 Sonia Cortassa,3 Reinhard Kappl,2 Bastian Pasieka,2 Michael Lafontaine,4 C. Roy D. Lancaster,4
Thomas S. Blacker,5,6 Andrew R. Hall,7 Michael R. Duchen,5 Lars Kastner,8 Peter Lipp,8 Tanja Zeller,9,10
Christian Muller,9,10 Andreas Knopp,1 Ulrich Laufs,1 Michael Bohm,1 Markus Hoth,2 and Christoph Maack1,*1Klinik fur Innere Medizin III, Universitatsklinikum des Saarlandes, 66421 Homburg, Germany2Department of Biophysics, CIPMM, School of Medicine, Saarland University, 66421 Homburg, Germany3Johns Hopkins University, Baltimore, MD 21218, USA4Department of Structural Biology, Saarland University, 66421 Homburg, Germany5Department of Cell and Developmental Biology6Department of Physics and Astronomy7The Hatter Cardiovascular InstituteUniversity College London, London WC1E 6BT, UK8Institut fur Zellbiologie, Universitat des Saarlandes, 66421 Homburg, Germany9Klinik fur Allgemeine und Interventionelle Kardiologie, Universitares Herzzentrum Hamburg, 20246 Hamburg, Germany10Deutsches Zentrum fur Herzkreislaufforschung (DZHK e.V.), Partner Site Hamburg/Lubeck/Kiel, Germany
*Correspondence: [email protected]
http://dx.doi.org/10.1016/j.cmet.2015.07.008
SUMMARY
Mitochondrial reactive oxygen species (ROS) playa central role in most aging-related diseases. ROSare produced at the respiratory chain that demandsNADH for electron transport and are eliminatedby enzymes that require NADPH. The nicotinamidenucleotide transhydrogenase (Nnt) is considered akey antioxidative enzyme based on its ability toregenerate NADPH from NADH. Here, we show thatpathological metabolic demand reverses the direc-tion of the Nnt, consuming NADPH to support NADHand ATP production, but at the cost of NADPH-linkedantioxidative capacity. In heart, reverse-mode Nnt isthe dominant source for ROS during pressure over-load. Due to a mutation of the Nnt gene, the inbredmouse strain C57BL/6J is protected from oxidativestress, heart failure, and death, making its use in car-diovascular research problematic. Targeting Nnt-mediated ROS with the tetrapeptide SS-31 rescuedmortality in pressure overload-induced heart failureand could therefore have therapeutic potential inpatients with this syndrome.
INTRODUCTION
Whilemitochondria are themajor source of cellular ATP, they can
also emerge as important generators of reactive oxygen species
(ROS) (Balaban et al., 2005; Murphy, 2009). Increasedmitochon-
drial ROS production plays an important role in aging (Schriner
et al., 2005) and many aging-related diseases, including neuro-
degenerative (Lin and Beal, 2006), metabolic (Lee et al., 2010),
472 Cell Metabolism 22, 472–484, September 1, 2015 ª2015 Elsevie
and cardiac diseases (Dai et al., 2009). Chronic heart failure
is the most frequent cause of hospitalization in persons
aged R65 years and commonly results from myocardial infarc-
tion and/or hypertension (Roger, 2013), and in both scenarios,
mitochondrial ROS contribute to deterioration of cardiac func-
tion (Dai et al., 2012; Matsushima et al., 2006). In heart, ROS
impair excitation-contraction coupling, cause arrhythmias (Wag-
ner et al., 2013), activate prohypertrophic signaling (Ago et al.,
2008), and induce apoptotic and/or necrotic cell death through
activation of the permeability transition pore (PTP) (Halestrap,
2005). Recent advances in pharmacology targeting mitochon-
drial ROS production provide novel therapeutic options in a
broad spectrum of diseases (Smith et al., 2012; Szeto, 2014)
and require a precise understanding of the regulation of mito-
chondrial ROS production in physiology and disease.
The heart is an organ with uniquely high demands of ATP.
During exercise, ATP production can increase�4-fold, requiring
efficient adaptation of respiration through ADP and Ca2+ (Bala-
ban, 2002; Cortassa et al., 2006). A physiological increase
in workload is triggered by b-adrenergic stimulation, which in-
creases ADP (through ATP hydrolysis) and at the same time,
cytosolic Ca2+ (Figure 1A). While ADP accelerates respiration
and oxidizes NADH to NAD+ by stimulating ATP production at
the F1Fo-ATP synthase, Ca2+ enters mitochondria and activates
Krebs cycle dehydrogenases to regenerate NADH. This ‘‘parallel
activation’’ of respiration maintains constant ratios of ATP/ADP
and NADH/NAD+ over a wide range of physiological workloads
(Balaban, 2002).
We discovered recently that mitochondrial Ca2+ uptake is also
important to maintain NADPH for the elimination of hydrogen
peroxide (H2O2), since all enzymes that regeneratemitochondrial
NADPH derive their substrates from the Krebs cycle (Kohlhaas
et al., 2010) (Figure 1A). In heart failure, disturbed Ca2+ and
Na+ handling hamper mitochondrial Ca2+ uptake and thus,
provoke NADH and NADPH oxidation and mitochondrial ROS
r Inc.
A B
C
D
E
F
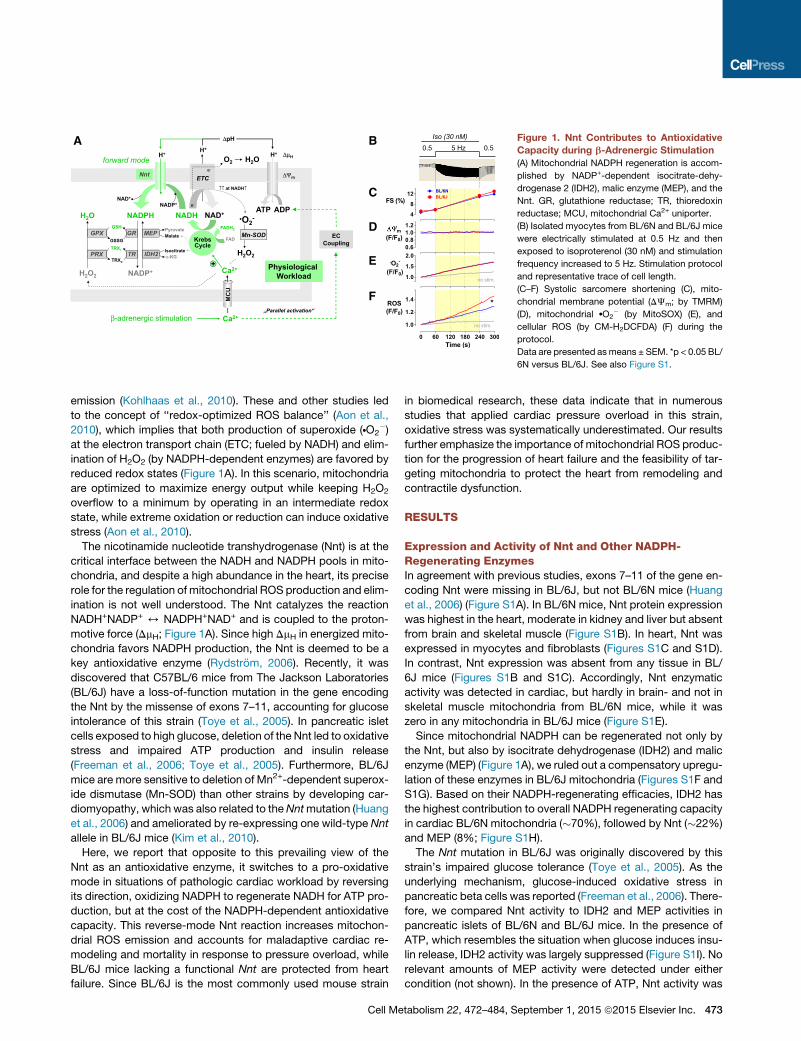
Figure 1. Nnt Contributes to Antioxidative
Capacity during b-Adrenergic Stimulation
(A) Mitochondrial NADPH regeneration is accom-
plished by NADP+-dependent isocitrate-dehy-
drogenase 2 (IDH2), malic enzyme (MEP), and the
Nnt. GR, glutathione reductase; TR, thioredoxin
reductase; MCU, mitochondrial Ca2+ uniporter.
(B) Isolated myocytes from BL/6N and BL/6J mice
were electrically stimulated at 0.5 Hz and then
exposed to isoproterenol (30 nM) and stimulation
frequency increased to 5 Hz. Stimulation protocol
and representative trace of cell length.
(C–F) Systolic sarcomere shortening (C), mito-
chondrial membrane potential (DJm; by TMRM)
(D), mitochondrial dO2� (by MitoSOX) (E), and
cellular ROS (by CM-H2DCFDA) (F) during the
protocol.
Data are presented asmeans ± SEM. *p < 0.05 BL/
6N versus BL/6J. See also Figure S1.
emission (Kohlhaas et al., 2010). These and other studies led
to the concept of ‘‘redox-optimized ROS balance’’ (Aon et al.,
2010), which implies that both production of superoxide (dO2�)
at the electron transport chain (ETC; fueled by NADH) and elim-
ination of H2O2 (by NADPH-dependent enzymes) are favored by
reduced redox states (Figure 1A). In this scenario, mitochondria
are optimized to maximize energy output while keeping H2O2
overflow to a minimum by operating in an intermediate redox
state, while extreme oxidation or reduction can induce oxidative
stress (Aon et al., 2010).
The nicotinamide nucleotide transhydrogenase (Nnt) is at the
critical interface between the NADH and NADPH pools in mito-
chondria, and despite a high abundance in the heart, its precise
role for the regulation of mitochondrial ROS production and elim-
ination is not well understood. The Nnt catalyzes the reaction
NADH+NADP+ 4 NADPH+NAD+ and is coupled to the proton-
motive force (DmH; Figure 1A). Since high DmH in energized mito-
chondria favors NADPH production, the Nnt is deemed to be a
key antioxidative enzyme (Rydstrom, 2006). Recently, it was
discovered that C57BL/6 mice from The Jackson Laboratories
(BL/6J) have a loss-of-function mutation in the gene encoding
the Nnt by the missense of exons 7–11, accounting for glucose
intolerance of this strain (Toye et al., 2005). In pancreatic islet
cells exposed to high glucose, deletion of the Nnt led to oxidative
stress and impaired ATP production and insulin release
(Freeman et al., 2006; Toye et al., 2005). Furthermore, BL/6J
mice are more sensitive to deletion of Mn2+-dependent superox-
ide dismutase (Mn-SOD) than other strains by developing car-
diomyopathy, which was also related to theNntmutation (Huang
et al., 2006) and ameliorated by re-expressing one wild-type Nnt
allele in BL/6J mice (Kim et al., 2010).
Here, we report that opposite to this prevailing view of the
Nnt as an antioxidative enzyme, it switches to a pro-oxidative
mode in situations of pathologic cardiac workload by reversing
its direction, oxidizing NADPH to regenerate NADH for ATP pro-
duction, but at the cost of the NADPH-dependent antioxidative
capacity. This reverse-mode Nnt reaction increases mitochon-
drial ROS emission and accounts for maladaptive cardiac re-
modeling and mortality in response to pressure overload, while
BL/6J mice lacking a functional Nnt are protected from heart
failure. Since BL/6J is the most commonly used mouse strain
Cell Me
in biomedical research, these data indicate that in numerous
studies that applied cardiac pressure overload in this strain,
oxidative stress was systematically underestimated. Our results
further emphasize the importance of mitochondrial ROS produc-
tion for the progression of heart failure and the feasibility of tar-
geting mitochondria to protect the heart from remodeling and
contractile dysfunction.
RESULTS
Expression and Activity of Nnt and Other NADPH-Regenerating EnzymesIn agreement with previous studies, exons 7–11 of the gene en-
coding Nnt were missing in BL/6J, but not BL/6N mice (Huang
et al., 2006) (Figure S1A). In BL/6N mice, Nnt protein expression
was highest in the heart, moderate in kidney and liver but absent
from brain and skeletal muscle (Figure S1B). In heart, Nnt was
expressed in myocytes and fibroblasts (Figures S1C and S1D).
In contrast, Nnt expression was absent from any tissue in BL/
6J mice (Figures S1B and S1C). Accordingly, Nnt enzymatic
activity was detected in cardiac, but hardly in brain- and not in
skeletal muscle mitochondria from BL/6N mice, while it was
zero in any mitochondria in BL/6J mice (Figure S1E).
Since mitochondrial NADPH can be regenerated not only by
the Nnt, but also by isocitrate dehydrogenase (IDH2) and malic
enzyme (MEP) (Figure 1A), we ruled out a compensatory upregu-
lation of these enzymes in BL/6J mitochondria (Figures S1F and
S1G). Based on their NADPH-regenerating efficacies, IDH2 has
the highest contribution to overall NADPH regenerating capacity
in cardiac BL/6N mitochondria (�70%), followed by Nnt (�22%)
and MEP (8%; Figure S1H).
The Nnt mutation in BL/6J was originally discovered by this
strain’s impaired glucose tolerance (Toye et al., 2005). As the
underlying mechanism, glucose-induced oxidative stress in
pancreatic beta cells was reported (Freeman et al., 2006). There-
fore, we compared Nnt activity to IDH2 and MEP activities in
pancreatic islets of BL/6N and BL/6J mice. In the presence of
ATP, which resembles the situation when glucose induces insu-
lin release, IDH2 activity was largely suppressed (Figure S1I). No
relevant amounts of MEP activity were detected under either
condition (not shown). In the presence of ATP, Nnt activity was
tabolism 22, 472–484, September 1, 2015 ª2015 Elsevier Inc. 473

E
A B C D
F G
H I
K L M
J
Figure 2. Ameliorated Cardiac Remodeling and Oxidative Stress in BL/6J Compared to BL/6N MiceBL/6N and BL/6J mice were exposed to TAC or sham-surgery for 6 weeks.
(A) Heart weight (HW) to tibia length ratio.
(B) Lung fluid; pulmonary congestion was defined as >0.2 ml. The percentages indicate the fraction above this threshold. *p < 0.05 (Fisher’s exact test).
(C) LV ejection fraction (LVEF) determined in isolated working hearts.
(D) LV expression of ANP mRNA.
(E) Representative histological images of fibrosis in LV myocardium.
(F) Quantification of fibrosis.
(G) Quantification of myocyte cross-sectional area in the LV.
(H) Representative 8-OHdG staining of LV nuclei as index for intracellular ROS.
(I) Quantification of 8-OHdG staining in LV cardiac myocytes.
(J) Correlation between 8-OHdG staining and fibrosis.
(legend continued on next page)
474 Cell Metabolism 22, 472–484, September 1, 2015 ª2015 Elsevier Inc.

higher than IDH2 activity and therefore the dominating enzyme
with NADPH-regenerating capacity under these conditions (Fig-
ures S1I and S1J).
Nnt Contributes to NADPH Regeneration and ROSElimination during a Physiological Workload IncreaseTo examine the functional consequences of Nnt deficiency for
mitochondrial ROS formation, isolated cardiac myocytes were
exposed to the b-adrenergic agonist isoproterenol and an
increased stimulation rate (Figure 1B). This induced similar
increases of sarcomere shortening, cytosolic and mitochondrial
Ca2+ without any differences between BL/6N and BL/6J
myocytes (Figures 1B, 1C, and S1K–S1L). Furthermore, DJm
remained stable during the protocol without differences be-
tween strains (Figure 1D). Electrical stimulation per se increased
mitochondrial ROS formation (Figures 1E and 1F). While no dif-
ferences in dO2� formation were observed between strains,
H2O2 (and presumably also other ROS due to the limited speci-
ficity of DCF to H2O2) increased in BL/6J versus BL/6Nmyocytes
during the workload transition (Figures 1E and 1F). These data
are in agreement with the concept that during a physiological
increase in workload triggered by b-adrenergic stimulation, the
Nnt contributes to NADPH regeneration to fuel H2O2-detoxifying
enzymes (Figure 1A).
Ameliorated Cardiac Remodeling in BL/6J versus BL/6NMice after Pressure OverloadSince mitochondrial ROS production plays an important role for
cardiac remodeling in response to pressure overload (Dai et al.,
2012), we speculated that the lack of Nnt in BL/6J mice should
aggravate the development of heart failure 6 weeks after trans-
verse-aortic constriction (TAC). However, TAC led to similar in-
creases in heart weight in both strains (Figure 2A), and against
our expectations, pulmonary congestion (indicating cardiac
decompensation) was more frequent in BL/6N than in BL/6J
mice (Figure 2B). Isolated working heart analyses revealed
decreased left ventricular (LV) ejection fraction (Figure 2C) and
elevated LV volume at 70 mmHg end-systolic pressure (inte-
grating systolic dysfunction with LV enlargement; Figure S2A)
in BL/6N, but not BL/6J mice after TAC. Accordingly, mRNA
expression of atrial natriuretic peptide (ANP), an index of LV
filling pressures, was substantially increased after TAC in BL/
6N and ameliorated in BL/6J mice (Figure 2D). Also, the increase
in LV fibrosis was more pronounced in BL/6N than BL/6J mice
(Figures 2E and 2F) despite similar increases in myocyte cross
sectional area (Figure 2G).
To understand the underlying mechanisms for these unex-
pected results, we analyzed nuclear staining of 8-hydroxy-
20-deoxyguanosine (8-OHdG) in LV myocardium as an indicator
of intracellular ROS formation. In sham-operated animals,
8-OHdG staining was slightly elevated in BL/6J compared to
BL/6N mice (Figures 2H and 2I). In stark contrast, TAC substan-
tially increased 8-OHdG staining in myocytes and non-myocytes
(K) Venn plot diagram indicating the numbers of genes changed after TAC versu
(L) mRNA expression of CTGF in the LV.
(M) Correlation between CTGF expression and 8-OHdG staining.
Data are presented as means ± SEM. *p < 0.05, **p < 0.01, and ***p < 0.0001 (one-
columns. See also Figure S2.
Cell Me
from BL/6N, but not BL/6J hearts (Figures 2H, 2I, and S2B). The
levels of oxidative stress correlated with the degree of fibrosis,
cardiac hypertrophy, ANP upregulation, and pulmonary conges-
tion in BL/6N mice (p < 0.01, respectively), while these correla-
tions were lost in BL/6J mice (Figure 2J and data not shown).
To gain further insight into the mechanisms of remodeling,
we performed gene array analyses. When applying a p value of
<0.05 and a threshold of at least a 2-fold change, 148 genes
were differentially regulated by TAC versus sham in BL/6N
mice, while only 33 genes were differentially regulated in BL/6J
mice (Figure 2K; Tables S1 and S2). Of these 33 genes, 26 were
also regulated in BL/6N mice (Figure 2K), indicating similar, but
clearly ameliorated TAC-induced genomic remodeling in BL/6J
mice. Accordingly, pathway analyses revealed upregulation of
cardiac hypertrophy and fibrosis pathways in BL/6N (p < 0.001,
respectively; data not shown), but not BL/6J mice after TAC.
Of the fibrotic pathways, the most consistent change in BL/6N
mice after TAC was of the gene encoding connective tissue
growth factor (CTGF), which is inducible by H2O2 (Park et al.,
2001). Real-time PCR confirmed strong upregulation of CTGF
after TAC in BL/6N, which was blunted in BL/6J mice (Figure 2L).
CTGF upregulation correlated closely with oxidative stress in
hearts from BL/6N, but not BL/6J mice (Figure 2M). In contrast,
other genes involved in fibrosis were not differentially regulated
(Figures S2C and S2D).
An Unexpected Yin-Yang Role of the Nnt for theRegulation of Mitochondrial ROSThe analyses of 8-OHdG in LV myocardium (Figures 2H and 2I)
indicate that in response to a pathological increase in cardiac
afterload, oxidative stress is more pronounced in BL/6N than in
BL/6J mice. Given that the Nnt is viewed as an antioxidative
enzyme (Rydstrom, 2006), supported by our results in cardiac
myocytes during a physiological workload transition (Figures
1A and 1F), this appeared paradoxical. Thus, we challenged
our initial hypothesis and reasoned that under different meta-
bolic conditions, the direction of the Nnt reaction may vary.
A physiological workload transition (triggered by b-adrenergic
activation) increases Ca2+ and activates the Krebs cycle,
compensating the ETC-induced oxidation of NADH (‘‘parallel
activation’’; Figure 1A) (Cortassa et al., 2006; Maack et al.,
2006). In contrast, when increasing preload in isolated cardiac
trabeculae, contractile force (and consequently ATP consump-
tion) increase via the Frank Starling mechanismwithout a parallel
increase in Ca2+ (Backx and Ter Keurs, 1993). Accordingly,
increasing preload in cardiac trabeculae oxidizes NAD(P)H
to NAD(P)+ without a compensatory Ca2+-induced regeneration
(Brandes and Bers, 1997). We therefore reasoned that the
in vitro conditions in un-stretched myocytes performing low
levels of mechanical work, but with high Ca2+-stimulated Krebs
cycle activity (Figure 1) may be opposite to the in vivo conditions
after TAC, with high mechanical workload without Ca2+-induced
‘‘parallel activation’’ of the Krebs cycle.
s sham in BL/6N and BL/6J mice, applying a p < 0.05 and >2-fold change.
way ANOVA, Tukey’s post test). Replicates (n) are displayed as numbers in the
tabolism 22, 472–484, September 1, 2015 ª2015 Elsevier Inc. 475

A B C D E
F G H I J K
Figure 3. Accelerating Respiration Induces Reverse-Mode Nnt Reaction
(A) O2 consumption in isolated cardiac mitochondria supplied with pyruvate/malate (5/5 mM) in the absence (State 4) and presence of ADP (1 mM; State 3). RCR,
respiratory control ratio.
(B) Mitochondrial dO2� formation determined by EPR.
(C) Mitochondrial emission of H2O2 determined by Amplex Ultra-Red.
(D) ADP-induced oxidation of NAD(P)H autofluorescence. AU, arbitrary units.
(E) Accelerating NADH-coupled respiration (by ADP or FCCP) induces reverse-mode Nnt, oxidizing NADPH, GSH, and TRX/PRX, and increasing H2O2 emission.
(F and G) Autofluorescence of NAD(P)H/NAD(P)+ and FADH2/FAD in isolated cardiac myocytes from BL/6N (F) and BL/6J (G) mice exposed to FCCP (5 mM),
cyanide (4 mM), and H2O2 (10 mM), respectively.
(H) Quantification of the FCCP- and H2O2-sensitive pools of NAD(P)H/NAD(P)+, calculated from data in (F) and (G).
(I) NAD(P)H plotted against DJm in response to FCCP/oligomycin.
(J) Fluorescence decay rate (tbound) of NAD(P)H reporting bound NADPH/NADH in the absence (Con; n = 5, 21 images) and presence of FCCP (5 mM; n = 3, 16
images) or cyanide (4 mM; n = 1, 8 images), respectively.
(K) NADPH/NADH during FCCP divided by NADPH/NADH during cyanide as an index for NADPH uncoupling from the NADH pool.
Data are presented as means ± SEM. **p < 0.01, ***p < 0.001 versus State 4 (paired t test). yp < 0.05, zp < 0.01 versus BL/6 (unpaired t test). xp < 0.05 (one-way
ANOVA, Tukey’s post test). See also Figure S3.
To simulate such a pathological workload transition, we
applied ADP to isolated cardiac mitochondria in the absence
of Ca2+. In agreement with the prevailing paradigm of mitochon-
drial ROS production (Balaban et al., 2005), ADP accelerated O2
consumption and lowered dO2� formation (detected by EPR spin
trap), without any differences between strains (Figures 3A and
3B). In contrast, ADP did not reduce H2O2 emission from BL/
6N mitochondria (detected by Amplex Ultra-Red assay),
whereas in BL/6J mitochondria, H2O2 emission was reduced
by a similar degree as dO2� formation (by 36%, respectively; Fig-
ures 3B and 3C). Indeed, this was opposite to the results in iso-
lated myocytes exposed to b-adrenergic stimulation (Figure 1F),
where ROS emission was higher in BL/6J than in BL/6N myo-
cytes. In contrast, in mitochondria from brain and skeletal mus-
cle of BL/6N mice, in which no Nnt activity was detected (Fig-
ure S1E), ADP lowered H2O2 emission to a similar extent asdO2
� without differences between strains (Figures S3A–S3F).
Reverse-Mode Nnt Oxidizes NADPHwhen Respiration IsAcceleratedBased on these opposing observations, we formulated the
following hypothesis: accelerating respiration with ADP oxidizes
476 Cell Metabolism 22, 472–484, September 1, 2015 ª2015 Elsevie
NADH, and if NADH is not sufficiently regenerated by the Krebs
cycle, NAD+ provides a substrate for the reverse reaction of the
Nnt, which is further facilitated by high NADPH, low NADH, and
ADP-induced dissipation of DmH (Figure 3E). This reversal of the
Nnt oxidizes NADPH to regenerate NADH,which is consumed by
the ETC. In fact, oxidation of the overall NAD(P)H/NAD(P)+ redox
pool by ADP was more pronounced in BL/6N than BL/6J mito-
chondria (Figure 3D).
To interrogate this further, wemeasuredmitochondrial NAD(P)
H/NAD(P)+ and FADH2/FAD redox states in isolated cardiac my-
ocytes and exposed them to the uncoupler FCCP, the complex
IV inhibitor cyanide and external H2O2 (Figure 3F). Similar to ADP,
FCCP accelerates respiration (by dissipating DmH) and thereby
oxidizes NADH. While cyanide completely reduced the redox
states of NAD(P)H/NAD(P)+ and FADH2/FAD, H2O2 completely
oxidized both NADPH and NADH independent of the presence
of Nnt.
In fact, FCCP led to an identical oxidation of the overall NAD(P)
H/NAD(P)+ redox pool as H2O2 in BL/6Nmyocytes (Figure 3F). In
contrast, in BL/6J myocytes, the oxidation of NAD(P)H/NAD(P)+
by FCCP was less pronounced than by H2O2 and less than by
FCCP in BL/6N myocytes (Figures 3F and 3G). The redox state
r Inc.

A B C
D E F
Figure 4. Computational Modeling Indicates
Reversal of Nnt during NADH Oxidation
(A–E) A computational two-compartment model
(Kembro et al., 2013) integrating mitochondrial
energetics with redox regulation was used to
assess the effect of transient increases in extra-
mitochondrial ADP from 5 to 20, 30, and 40 mM
ADP, respectively, on (A) mitochondrial [ADP], (B)
DJm, (C) mitochondrial [NADH], (D) Nnt activity,
and (E) mitochondrial [NADPH].
(F) Changes in [NADH] and [NADPH] together with
Nnt activity in response to a step increase from 5 to
30 mM [ADP] at higher temporal resolution.
Green/red shaded areas indicate forward/reverse-
mode Nnt activity, respectively.
of FADH2/FAD in the same cells (Figures 3F and 3G, lower traces)
served to control for the redox state of the ETC, which should
parallel the behavior of NADH (but not NADPH). These results
suggest that despite FCCP-induced oxidation of NADH, NADPH
is conserved in BL/6J mitochondria in the absence of a reverse-
mode Nnt reaction. Maintained NADPH (and H2O2 eliminating
capacity) in BL/6J mitochondria during accelerated NADH-
coupled respiration could explain why in the presence of
ADP, H2O2 was lowered by the same degree as dO2� in isolated
mitochondria (i.e., by 36%; Figures 3B and 3C). Comparison of
the absolute H2O2- and FCCP-sensitive fluorescence of the
NAD(P)H/NAD(P)+ redox pool indicates that (1) the pool sizes
per se were not different between BL/6N and BL/6J mitochon-
dria, and (2) NADPH contributes �23% and NADH �77% to
this fluorescence (Figure 3H).
Since the Nnt is coupled to DmH, a reversal of the Nnt should
also reverse the direction of proton translocation across the
inner mitochondrial membrane, thereby possibly contributing
to DJm (Figure 3E). In fact, when accelerating respiration in
isolated myocytes with FCCP, DJm dissipated slightly faster
in BL/6J than in BL/6N myocytes (Figures S3G and S3H), indi-
cating that reverse-mode Nnt might delay dissipation of DJm
by consuming NADPH. Similar results were obtained when
Nnt was inhibited acutely with a chemical inhibitor (NBD-chlo-
ride) in BL/6N myocytes (Figures S3I and S3J). Despite this
slight delay, DJm was dissipated by similar extents in myo-
cytes from BL/6N and BL/6J mice. In agreement with this,
steady-state DJm was unchanged in isolated and energized
BL/6N and BL/6J mitochondria after titration of the uncoupler
DNP, in the absence or presence of nigericin (that dissipates
DpH, but not DJm; Figures S3K and S3L), suggesting that
the overall contribution of reverse-mode Nnt to DJm is rather
small.
In isolated cardiac myocytes, for any given DJm during
FCCP-induced dissipation, the redox state of NAD(P)H/
NAD(P)+ remained more reduced in BL/6J than in BL/6N
mitochondria (Figure 3I), further supporting that Nnt-deficiency
may maintain NADPH during accelerated respiration. To test
this further, we employed fluorescence lifetime imaging
Cell Metabolism 22, 472–484, S
(FLIM), where the longer time constant
of NAD(P)H fluorescence decay (tbound)
reflects the ratio of bound NADPH to
NADH (Blacker et al., 2014). In agree-
ment with previous data on HEK cells, FCCP did not change
tbound in BL/6N myocytes (Figure 3J), since NADH and
NADPH are oxidized by FCCP to similar extents, presumably
through equilibration of both pools via the Nnt (Blacker
et al., 2014). In contrast, FCCP caused a small but significant
increase in tbound in BL/6J myocytes, indicating more pro-
nounced oxidation of NADH than NADPH (Figure 3J). Vice
versa, blocking the ETC with cyanide reduces the redox state
of NADH, and since the total pool of NADH is larger than the
NADPH pool, tbound shifts further toward the value predicted
for purely NADH (�1.5 ns; Figure 3J). This was even more
pronounced in BL/6J myocytes, where a lack of forward-
mode Nnt may hinder complete NADPH reduction. Therefore,
when dividing the estimated NADPH/NADH ratios after FCCP
by the ratios after cyanide, respectively, the greater values in
BL/6J myocytes indicate that the NADPH pool is more ‘‘un-
coupled’’ from the NADH pool (compared to BL/6N; Figure 3K),
consistent with a lack of Nnt-mediated equilibration of NADH
and NADPH pools in either direction and supporting the idea
that NADPH is relatively conserved after oxidation of NADH
by FCCP.
Furthermore, we performed computational modeling using
a two-compartment model that integrates mitochondrial ener-
getics with redox regulation (Kembro et al., 2013). Starting from
low extra-mitochondrial [ADP] of 5 mM, transient increases of
[ADP] to 20, 30, and 40 mM increased mitochondrial [ADP] (Fig-
ure 4A), dissipated DJm and oxidized NADH (Figures 4B and
4C). While at low [ADP], the Nnt operated in the forward mode,
it reversed direction during NADH oxidation, inducing NADPH
oxidation (Figures 4D and 4E). Reducing Nnt activity 10,000-
fold prevented NADPH oxidation (Figure 4E) despite similar
NADH oxidation and DJm dissipation (Figures 4B and 4C). Of
note, theNnt reverses already early after initiation ofNADHoxida-
tion, however, the impact on NADPH becomes particularly rele-
vant at strongly oxidizedNADH levels (Figure 4F). Together, these
data imply that acceleration of NADH-coupled respiration dur-
ing metabolic perturbations facilitates Nnt-mediated NADPH
oxidation, while Nnt-deficiencymaintains the NADPH pool under
these conditions.
eptember 1, 2015 ª2015 Elsevier Inc. 477

Figure 5. Increasing Afterload Induces Nnt-Mediated Oxidation of Glutathione and Peroxiredoxin
Isolated working hearts from BL/6N and BL/6J mice were held at a preload of 10 mmHg and afterload of 80 mmHg (400 bpm). Afterload was increased to
120 mmHg (AL) or maintained at 80 mmHg (Con). After 15 min, hearts were snap-frozen for biochemical analyses.
(A–D) Representative pressure-volume loops (A), concentration of reduced glutathione (GSH) (B) and oxidized glutathione (GSSG) (C), and ratio of GSH/GSSG (D),
respectively (n = 5 per group).
(E) Degree of oxidation of GSH/GSSG by AL in BL/6N and BL/6J hearts.
(F) Representative western blot determining expression of oxidized peroxiredoxin (Prx-SO3) and calsequestrin (CSQ) in BL/6N and BL/6J hearts, respectively.
(G) Quantification of Prx-SO3 relative to CSQ expression and normalized to Con in BL/6N hearts.
(H) Relative increase of Prx-SO3 in response to AL (fold change of BL/6N Con).
(I) Western -blot analysis of monomeric and dimeric peroxiredoxin III. Red. Con, reduced Control.
(J) Quantification of dimeric/monomeric peroxiredoxin III.
(K) Quantification of malondialdehyde (MDA) concentrations.
Data are presented as means ± SEM. *p < 0.05, **p < 0.01, and ***p < 0.001 (ANOVA, Tukey’s post test); yp < 0.05, zp < 0.01 (unpaired t test; all groups n = 5).
Reverse-Mode Nnt Oxidizes Glutathione andPeroxiredoxin in Response to Increased AfterloadTo test the relevance of reverse-mode Nnt on the whole organ
level, we performed experiments on isolated working hearts
exposed to a physiological pre- and afterload of 10 and
80 mmHg, respectively. Under these conditions, the redox
states of glutathione and peroxiredoxin, which are regenerated
478 Cell Metabolism 22, 472–484, September 1, 2015 ª2015 Elsevie
by NADPH (Figure 1A), were slightly more oxidized in BL/6J
versus BL/6N hearts (Figures 5C, 5D, 5F, and 5G). In contrast,
when afterload was increased from 80 to 120 mmHg for
15 min (Figure 5A), it led to stronger oxidation of glutathione
and peroxiredoxin in BL/6N versus BL/6J hearts (Figures
5B—5H). Reduced peroxiredoxin exists in a monomeric
form, while oxidation causes dimerization (Kumar et al.,
r Inc.

C57BL/6N
C57BL/6J
Sham TAC
A B C
D E F
HG
I J K
BL/6N BL/6JFigure 6. Decreased Mortality and Necrosis
in BL/6J Mice after Pressure Overload
BL/6N and BL/6J mice were exposed to a com-
bined operation of TAC or sham plus implantation
of aminipump releasing SS-31 (3mg/kg per day) or
vehicle (NaCl 0.9%) for 6 weeks (A–F) or 3 days
(G–I), respectively.
(A) Kaplan-Meier survival curves in Sham- or TAC-
treated BL/6N mice, treated with SS-31 or vehicle,
respectively.
(B) Kaplan-Meier survival of same groups as in (A),
but in BL/6J mice.
(C) Comparison of Kaplan-Meier survival curves in
TAC/vehicle-treated BL/6N and BL/6J mice.
(D) MDA concentrations in Sham- or TAC-treated
BL/6N mice, the latter treated with vehicle or
SS-31.
(E) Same as in (D), but in BL/6J mice.
(F) Comparison of the absolute increase in MDA in
BL/6N (N) and BL/6J mice (J).
(G) Histological analyses of Evans blue staining in
Sham- and TAC-treated BL/6N and BL/6J mice
(vehicle groups), respectively.
(H) Quantification of Evans Blue staining. Sh,
Sham.
(I) Caspase-3 and caspase-7 activities in the same
groups as in (H).
(J) GSH/GSSG in isolated Langendorff-perfused
BL/6N hearts exposed to H2O2.
(K) Time to 50% dissipation of DJm (TMRM) in
isolated BL/6N cardiac myocytes exposed to
100 mmol/l H2O2, in the absence (H2O2) and pres-
ence of cyclosporine A (CsA; 10 mM) or SS-31
(10 nM), respectively.
Data are presented as means ± SEM. *p < 0.05,
**p < 0.01, and ***p < 0.001 (one-way ANOVA,
Tukey’s post test). yp < 0.05 (unpaired t test). See
also Figure S4.
2009). Upon afterload elevation, the degree of dimerization of
the mitochondrial isoform peroxiredoxin III was increased in
BL/6N, but not BL/6J hearts (Figures 5I and 5J), further pin-
pointing mitochondria as the main source for oxidative stress
under these conditions. Accordingly, afterload-induced in-
creases in lipid peroxidation were more pronounced in BL/
6N than in BL/6J hearts (Figure 5K). Taken together, these
data are in good agreement with the in vivo data (Figures
2H and 2I), where ROS levels were slightly lower in sham-
operated-, but much higher in TAC-operated BL/6N versus
BL/6J mice.
Cell Metabolism 22, 472–484, S
Targeting Mitochondrial ROSProduction Reduces Necrosis andEarly Mortality in Response toIncreased Afterload In VivoTo analyze whether mitochondrial ROS
production is the key difference between
BL/6N and BL/6J mice in response to
increased afterload, we combined TAC
or sham-operation with the implantation
of osmotic minipumps releasing either
vehicle or SS-31, a tetrapeptide that re-
duces mitochondrial ROS production
(Szeto, 2014). Vehicle-treated BL/6N mice suffered �50% mor-
tality in 6weeks, whilemost BL/6Jmice survived this intervention
(Figures 6A–6C). SS-31 reduced TAC-inducedmortality in BL/6N
mice to levels of vehicle-treated BL/6J mice (Figures 6A and 6B).
Although TAC-induced increases in lipid peroxidation weremore
pronounced in BL/6N than in BL/6J mice and sensitive to SS-31
(Figures 6D–6F), no differences in cardiac hypertrophy were
observed between strains and by treatment (Figures S4A and
S4B). Despite a mortality-induced selection bias, SS-31 amelio-
ratedANP upregulation inBL/6Nmice,while the TAC-induced in-
crease inCTGFwas insensitive to SS-31 (Figures S4C and S4D).
eptember 1, 2015 ª2015 Elsevier Inc. 479

Mitochondrial ROS can trigger the opening of the permeability
transition pore (PTP), dissipate DJm, and induce apoptotic and/
or necrotic cell death (Halestrap, 2005). After only 3 days of TAC,
necrotic cell death increased in hearts of TAC-operated BL/6N,
but not BL/6J mice (Figure 6G). For any given increase in ANP
expression as an index of hemodynamic load, TAC-induced
necrosis was 4- to 5-fold more pronounced in BL/6N mice
than in BL/6J mice (not shown), and this was prevented by SS-
31 (Figure 6H). Similar, albeit less pronounced results were ob-
tained for the activities of caspase-3 and caspase-7 as inducers
of apoptosis (Figure 6I). The PTP inhibitor cyclosporin A reduced
necrosis in TAC-treated BL/6N hearts (to 1.3% ± 0.4%). How-
ever, due to a slight anti-necrotic effect of the oil-based vehicle,
this effect was not significantly different from its control (not
shown). Further experiments on isolated mitochondria revealed
that ameliorated necrosis in BL/6J mice was not related to modi-
fied properties of the PTP per se, since Ca2+ and ROS induced
similar PTP opening in both strains (Figures S4E and S4F).
To test whether the levels of oxidative stress that occur after
TAC in BL/6Nmice are sufficient to induce cardiomyocyte death,
we exposed isolated perfused BL/6N hearts to increasing
concentrations of exogenous H2O2 and observed that 100 mM
H2O2 oxidized the glutathione pool by 40% (Figure 6J), a similar
extent as after increasing afterload from 80 to 120 mmHg in
working hearts (41%; Figure 5D). Applying 100 mM H2O2 to iso-
lated BL/6N cardiomyocytes dissipated DJm by 50% after
�12 min, which was delayed by cyclosporin A and even more
by SS-31 (Figure 6K).
Re-expression of the Nnt in BL/6J Mice Re-establishesOxidative Stress in Response to Pressure OverloadTo rule out that other genomic differences between BL/6N and
BL/6J mice (Simon et al., 2013) account for differential ROS pro-
duction, we obtained BL/6J mice that harbor one allele with the
intact wild-type (wt) and one with the truncated (t) Nnt gene
(BL/6J-Nntwt/t) (Kim et al., 2010). From this strain, we gener-
ated BL/6J-Nntt/t, BL/6J-Nntwt/t, and BL/6J-Nntwt/wt mice. Re-
expression of intact Nnt in BL/6J mice increased Nnt activity to
levels observed in BL/6N mice (Figure 7A). Three days after
TAC, mRNA expression of brain natriuretic peptide (BNP), an
index of LV filling pressures, increased (Figure 7B), together
with more pronounced oxidation of peroxiredoxin and oxidative
stress (indexed by 8-OHdG) in wild-type Nnt-expressing mice
in vivo (Figures 7C–7F). For any given TAC-induced increase of
cardiomyocyte cross sectional area, the increase in ROS in vivo
was higher in BL/6J-Nntwt/wt mice compared to BL/6J-Nntt/t or
BL/6J-Nntwt/t (Figure 7G). Taken together, these data indicate
that the lower TAC-induced mitochondrial ROS emission in BL/
6J mice was primarily related to the absence of a functional Nnt.
DISCUSSION
Our study revealed that besides its canonical antioxidant func-
tion, the mitochondrial transhydrogenase (Nnt) can switch to a
pro-oxidative reverse mode that triggers NADPH oxidation dur-
ing a pathological increase of workload in cardiac mitochondria
(Figure 7H). This pro-oxidative shift provokes mitochondrial
ROS emission and induces necrotic cell death, fibrosis, cardiac
dysfunction, and death. To our knowledge, this is the first bona
480 Cell Metabolism 22, 472–484, September 1, 2015 ª2015 Elsevie
fide mechanism that explains how a pathological increase in
cardiac workload per se increases mitochondrial ROS emission
independent of neuroendocrine activation. The missense of a
functional Nnt in BL/6J mice substantially ameliorates oxidative
stress, maladaptive remodeling, and LV dysfunction and re-
duces death in response to pressure overload. This finding has
broad implications since it sheds new light on many previous
studies using this strain to analyze the consequences of other,
non-mitochondrial sources of ROS for cardiac remodeling
and the development of heart failure. Furthermore, differential
tissue-specific expression of the Nnt adds another level of
complexity to the regulation of mitochondrial ROS emission in
different tissues under variable metabolic conditions. Finally,
targeting mitochondrial ROS production with the tetrapeptide
SS-31, which is already in clinical testing, may be an efficient
therapy of heart failure.
Pathophysiological Role of Mitochondrial ROS in HeartFailureOxidative stress in the plasma and myocardium of patients with
heart failure correlates with LV dysfunction (Belch et al., 1991;
Maack et al., 2003). Besides mitochondria, other relevant ROS
sources in cardiac myocytes are NADPH oxidases, uncoupled
nitric oxide synthases, monoamine oxidase A, and xanthine
oxidase. The relative contribution of these sources to overall
myocardial ROS production during the development of heart fail-
ure, however, is unknown. A common approach to estimate the
role of a particular ROS source is to apply TAC in mice with ge-
netic modifications of proteins involved in ROS production. In
fact, most of these studies were performed on BL/6J mice (Table
S1). Our data indicate that in BL/6J mice, contribution of mito-
chondria to cellular ROS production, and maladaptive remodel-
ing in response to TAC is heavily underestimated or even absent
(Figure 2I), implying that studies using BL/6J may overestimate
the contribution of non-mitochondrial ROS sources. In contrast,
overexpressing a mitochondria-targeted catalase in BL/6N mice
protected hearts from maladaptive remodeling in response to
TAC (Dai et al., 2012). Since in our study, inhibiting mitochondrial
ROS emission with the tetrapeptide SS-31 rescued TAC-
inducedmortality in BL/6N, but not BL/6J mice, these data imply
that mitochondria are the dominant source of ROS during path-
ological elevations of afterload. In humans, chronic elevations of
afterload are a central feature of various cardiovascular dis-
eases, such as arterial hypertension, aortic stenosis or vascular
stiffness imposed by atherosclerosis and/or aging. All these age-
associated conditions are known risk factors for the develop-
ment of heart failure. A previous study observed downregulation
of Nnt activity in human failing hearts, which was associated with
oxidation of glutathione (Sheeran et al., 2010). While these
authors suggested that downregulation of Nnt activity may
contribute to oxidative stress, the data of our study rather imply
that Nnt downregulation in human heart failuremay be protective
by reducing reverse-mode Nnt-mediated mitochondrial ROS
emission.
Already 3 days after TAC, the rates of apoptosis and necrosis
were strikingly different between strains. In human heart failure,
the levels of apoptosis are increased (Olivetti et al., 1997), and
even low rates of cardiomyocyte death are sufficient to cause a
lethal dilated cardiomyopathy (Wencker et al., 2003). In human
r Inc.

Figure 7. Re-expression of Nnt in BL/6J Mice Increases Oxidative Stress In Vivo
(A) Nnt activity in BL/6N and BL/6J mice, compared with N5 BL/6J-Nntt/t mice (with two alleles of the truncated (t) Nnt gene) and mice with heterozygous
(BL/6J-Nntwt/t) and homozygous re-expression of the wild-type Nnt gene (BL/6J-Nntwt/wt). Inset: western blot analysis of Nnt and GAPDH in mouse LV as
indicated.
(B) mRNA expression of BNP in LV of BL/6J-Nntt/t, BL/6J-Nntwt/t and BL/6J-Nntwt/wt mice after sham or TAC surgery, respectively.
(C) Western blot analysis of oxidized peroxiredoxin (Prx-SO3) and GAPDH in LV of BL/6J-Nntt/t and BL/6J-Nntwt/t mice after sham or TAC surgery, respectively.
(D) Quantification of data in (C).
(E) Representative histographs of 8-OHdG staining in LV of BL/6J-Nntt/t, BL/6J-Nntwt/t, and BL/6J-Nntwt/wt mice after TAC, respectively.
(F) Quantification of data in (E).
(G) Plotting of 8-OHdG staining against myocyte cross sectional area in BL/6J-Nntt/t, BL/6J-Nntwt/t, and BL/6J-Nntwt/wt mice after TAC, respectively.
(H) Scheme of proposed mode of action of Nnt during physiological and pathological cardiac workloads.
Data are presented as means ± SEM. *p < 0.05, **p < 0.01, and ***p < 0.001 (ANOVA, Tukey’s post test).
heart failure, elevated levels of high-sensitive troponin T, amarker
for cardiomyocyte necrosis, predict an adverse clinical outcome
(Masson et al., 2012). SS-31 accumulates in mitochondria and
protects cardiolipin and other mitochondrial proteins from oxida-
tive damage, which may interrupt a feed-forward pathway of
mitochondrial dysfunction and ROS production (Dai et al.,
2013; Szeto, 2014). In our study, SS-31 prevented necrosis and
(partly) apoptosis, while CTGF upregulation appeared unaf-
fected. These data are in agreement with, and at the same time
extend, previous data in which SS-31 prevented 84% of TAC-
induced proteomic remodeling in BL/6N mitochondria (Dai
et al., 2013). Ongoing clinical studies will have to verify whether
SS-31 is of clinical use in patients with heart failure (Szeto, 2014).
Cell Me
Reverse-Mode Nnt Modifies Current Paradigm ofMitochondrial ROS ProductionThe current paradigm of mitochondrial ROS production implies
that dissipatingDJmbyaccelerating respirationwithADP (or acti-
vation of uncoupling proteins) generally reduces mitochondrial
oxidative stress (Balaban et al., 2005). In contrast, we observed
that H2O2 emission was lowered by ADP only in the absence of
an Nnt in BL/6J, but not BL/6N cardiac mitochondria. This is in
seeming contrast to other studies on which the current paradigm
is based on. For instance, in isolated rat cardiac mitochondria,
H2O2 emission decreased when respiration was accelerated by
ADP or chemical uncoupling (Korshunov et al., 1997). In that
study, however, the mitochondrial H2O2-scavenging capacity
tabolism 22, 472–484, September 1, 2015 ª2015 Elsevier Inc. 481

was eliminated by pretreatment of mitochondria with H2O2 and
aminotriazole, so that H2O2 emission was governed primarily
by dO2� production at the ETC and no longer counterbalanced
by NADPH-dependent H2O2 elimination. Furthermore, H2O2
emission from brain mitochondria wasmaximal at reduced redox
states of NAD(P)H, while chemical or ADP-induced uncoupling
of DJm lowered it (Starkov and Fiskum, 2003). However, brain
mitochondria do not express the Nnt (Figure S1B), and we
could reconcile their findings in brain mitochondria from BL/6N
mice, where ADP reduced H2O2 emission to a similar extent
as in brain mitochondria from BL/6J mice (Figure S3). Taken
together, differential Nnt expression accounts for tissue-specific
differences in the regulation of mitochondrial ROS emission
that may also explain why in contrast to results on brain mito-
chondria (Starkov and Fiskum, 2003), we previously observed
an inverse (and not positive) correlation between the redox state
of NAD(P)H and H2O2 emission in cardiac myocytes (Kohlhaas
et al., 2010).
Organ-Specific Relevance of Nnt for AntioxidativeCapacityInterestingly, under physiological (unstressed) conditions,
impaired glucose tolerance due to ROS-dependent impairment
of insulin release is so far the only known phenotype provoked
by the mutation of the Nnt in BL/6J mice (Simon et al., 2013;
Toye et al., 2005). One explanation may be that the high effi-
cacy of IDH2 to regenerate NADPH (Figures S1F and S1H)
can compensate for the loss of the Nnt at least in cardiac mito-
chondria. In contrast, in pancreatic islets from BL/6N and BL/
6J mice we observed that in the presence of physiological
levels of ATP, IDH2 activity was largely suppressed (Figures
S1I and S1J). Thus, when high glucose triggers an elevation
of ATP and insulin secretion in the pancreas, the lack of Nnt
in BL/6J may deteriorate the NADPH regenerative capacity
and induce oxidative stress to a higher extent in this organ
compared to other organs in which IDH2 can compensate for
the loss of Nnt.
LimitationsSince we did not apply knockout technology, we cannot fully
rule out that apart from Nnt expression, also other genetic dif-
ferences between BL/6N and BL/6J mice may contribute to the
differences in oxidative stress and/or maladaptive remodeling
between the strains. However, since (1) re-expression of one
or two wild-type Nnt alleles in BL/6J mice re-increased oxida-
tive stress after TAC (Figure 7), and (2) no differences in mito-
chondrial dO2� production or H2O2 emission were observed be-
tween the strains in the absence of ADP (State 4; Figures 3B
and 3C), other mechanisms than differential Nnt expression
appear unlikely to account for the differences in ROS emission
when ADP accelerates respiration at higher workloads. Another
limitation is that NADPH could not be measured directly and
separated from fluorescent NADH signals, which is technically
challenging. Nevertheless, the information gathered from
NADPH/NADH ratios determined by FLIM (Figures 3J and 3K)
during mitochondrial perturbations and data from computa-
tional modeling (Figure 4) support the concept that oxidation
of NADH at the ETC can provoke the reverse mode of the
Nnt to oxidize NADPH.
482 Cell Metabolism 22, 472–484, September 1, 2015 ª2015 Elsevie
ConclusionsWe identified a mechanism that couples a pathological increase
in metabolic demand to increased mitochondrial ROS emission
in the heart (Figure 7H). The discovery of the previously unappre-
ciated reverse-mode of the Nnt assigns this enzyme a dual role
serving either pro- or antioxidative processes depending on
the metabolic state of a cell. Considering the overarching impor-
tance of ROS production in aging and aging-related diseases,
these data provide important new insights into the mechanisms
of redox regulation under physiological and pathological condi-
tions in various tissues. Targeting mitochondrial ROS emission
is therefore a promising approach to ameliorate aging-related
diseases and in particular, heart failure.
EXPERIMENTAL PROCEDURES
Animal Experiments
Animal procedures were approved by the local animal ethics committee and
conducted in accordance with institutional guidelines. C57BL/6 mice were ob-
tained from Charles River (BL/6N, C57BL/6NCrl, strain code 027; and BL/J,
C57BL/6J, JAX Mice Stock Number 000664). N5 BL/6J-Nntwt/t mice (Kim
et al., 2010) were obtained from Jackson Laboratories and further bred at
our institution, generating BL/6J-Nntt/t, BL/6J-Nntwt/t and BL/6J-Nntwt/wtmice.
Transaortic Constriction
Transaortic constriction (TAC) was performed as described in more detail in
the Supplemental Experimental Procedures. Mice (10- to 12-week-old) under-
went TAC or sham surgery andwere followed for 6 weeks or 3 days. A literature
research was performed for other studies that performed TAC in normal or
genetically modified BL/6N and BL/6J mice (Table S1). For drug treatment,
osmotic minipumps (Alzet #2006) were implanted �20 min after TAC
and loaded with SS-31 (3 mg/kg 3 d) or vehicle (0.9% NaCl) for 6 weeks. In
3-day experiments, SS-31 was injected intraperitoneally (i.p.) (0.5 mg/ml,
0.9% NaCl) and compared to 0.9% NaCl.
Echocardiography
Echocardiography was performed as described in more detail in the Sup-
plemental Experimental Procedures section on anaesthetized mice using
a Visualsonics Vevo 770 High-Resolution in vivo Micro-Imaging System
(Visualsonics).
Isolated Working Hearts Experiments
For hemodynamics, hearts were mounted in a working heart apparatus and
analyzed with a pressure-volume catheter as described in the Supplemental
Experimental Procedures. Hearts equilibrated at 10 mmHg preload and
80 mmHg afterload at 400 bpm external pacing. Then afterload was increased
to 120 mmHg or maintained at 80 mmHg for 15 min.
Isolated Cardiac Myocytes
Cardiac myocytes were isolated by enzymatic digestion and experiments per-
formed as described in the Supplemental Experimental Procedures and Table
S2. Briefly, adult ventricular myocytes were electrically stimulated at 0.5 Hz
and then exposed to isoproterenol (30 nM) and an increase of stimulation
rate to 5 Hz for 3 min. Sarcomere shortening was detected together with either
(1) the redox state of NAD(P)H/NAD(P)+ and FADH2/FAD by autofluorescence,
(2)DJm (with tetramethylrhodaminemethyl ester; TMRM) together with [Ca2+]c(indo-1 acetoxymethyl esther; AM), (3) mitochondrial dO2
� formation (Mito-
SOX), or (4) cellular H2O2 formation (using 5-(-6)-chloromethyl-2,7-dichlor-
ohydrofluorescein di-acetate; CM-H2DCFDA). Using a patch-clamp-based
protocol with application of indo-1 salt and rhod-2 AM, [Ca2+]c was determined
together with [Ca2+]m under similar conditions (Maack et al., 2006).
Quiescent myocytes (Figures 3F and 3G) were exposed to FCCP (5 mM), cy-
anide (4 mM), and H2O2 (10 mM) and NAD(P)H/NAD(P)+ and FADH2/FAD were
determined in the same cells, respectively. DJm (TMRM) was determined
together with NAD(P)H in myocytes exposed to FCCP (5 mM) and oligomycin
(1.26 mM; Figures S3G–S3J).
r Inc.

NAD(P)H Fluorescence Lifetime Imaging Experiments
Cardiac myocytes were allowed to adhere to glass coverslips for >2 hr before
imaging. At the microscope, coverslips were maintained at 37�C in a home
built chamber and bathed in DMEM (GIBCO) containing (in mM) glucose 25,
pyruvate 1, glutamine 2, and HEPES 10. NAD(P)H fluorescence lifetime imag-
ing (FLIM) was described previously (Blacker et al., 2014) and in further detail in
the Supplemental Experimental Procedures. Five minutes prior to application
of pharmacological treatments, 10 mM blebbistatin was applied to prevent
contraction during FLIM image acquisition. Control experiments showed
that blebbistatin did not alter the FLIM parameters abound (p = 0.2, n = 3, 14
images), tfree (p = 0.2) or tbound (p = 0.1).
Isolated Mitochondria
Mitochondria were isolated from heart, brain and skeletal muscle by standard
techniques as described in the Supplemental Experimental Procedures. Mito-
chondria were supplied with pyruvate/malate as substrates (5/5 mM). Respira-
tion (Clark electrode), dO2� formation (electron paramagnetic resonance,
EPR), H2O2 emission (Amplex Ultra-Red), or NAD(P)H autofluorescence
were determined in the absence or presence of ADP (1 mM), respectively.
DJm was determined using triphenylmethylphosphonium (TPMP+).
Real-Time PCR, Gene Array, and Western Blot Analysis
Real-time PCR, gene array, and western blot analyses were performed by
standard techniques as described in more details in the Supplemental Exper-
imental Procedures. The secondary antibody against Nnt was provided by
Ting-Ting Huang (University of California, San Francisco). Gene array experi-
ments were performed using the Affymetrix GeneChip Mouse Gene 1.0 ST
Array. The gene array accession number of the data in Tables S3 and S4 is
‘‘E-MTAB-2732’’ at ArrayExpress.
Histological Analyses
Histological analyses were performed by standard techniques with details out-
lined in the Supplemental Experimental Procedures. H&E staining was used for
cardiomyocyte morphometry, picrosirius red staining for fibrosis, and 8-hy-
droxy-20-deoxyguanosine (8-OHdG) for intracellular ROS detection. Evans
blue staining (indexing necrosis) was detected after i.p. application of 100 ml
of Evans blue solution (16.7 mg/ml) 1 day before sacrifice.
Enzyme Activities
Details on enzymatic activity measurements are provided in the Supplemental
Experimental Procedures. Activities of Nnt, IDH2, and MEP were analyzed by
NADPH- or APAD-coupled spectrophotometric assays in homogenates of iso-
lated cardiac mitochondria.
GSH/GSSG Measurements
Determination of GSH and GSSG was performed as described previously
(Rahman et al., 2006) and as outlined inmore detail in the Supplemental Exper-
imental Procedures. For GSSG measurements, 3 mM of 1-methyl-2-vinylpyr-
idine was added for derivatization of reduced GSH before homogenization.
Reduced GSH was calculated as the difference between total glutathione
and GSSG.
Malondialdehyde Concentrations
Lipid peroxidation was determined using the ALDetect Lipid Peroxidation
Assay Kit (ENZO Life Science) to detect the concentrations of malondialde-
hydes (MDA) according to the manufacturer’s protocol. As a variation from
that protocol, the sample volume was reduced from 200 ml to 150 ml.
Caspase-3/7 Activity
The Caspase-Glo 3/7 Assay (Promega) was used to measure caspase-3 and
caspase-7 activities. Heart lysates (50 mg) were mixed with reaction solution
at equal volumes in a 96-well plate. Luminescence was detected after
20 min (at 37�C) and activities normalized to a standard of caspase-3.
Computational Modeling
Computational modeling of NADH, NADPH, DJm, and Nnt activity was per-
formed with the integrated model of mitochondrial energetics, redox, and
ROS metabolic networks (Kembro et al., 2013). The model parameters were
Cell Me
as in Kembro et al. (2013), except for cytoplasmic ADP that was driven by
an exogenous function. The baseline level of cytoplasmic ADP was 5 mM,
with pulses of 20, 30, and 40 mM added for 200 s as shown by the ADPm tran-
sients in Figure 4A. To simulate the absence of Nnt activity, its forward and
reverse rate constants were reduced 10,000-fold.
Statistical Analyses
Values are displayed as mean ± SEM. One-way ANOVA followed by Tukey’s
multiple comparisons test, paired, and unpaired t tests, Fisher’s exact test,
and Kaplan-Meier survival analyses were performed using GraphPad Prism
version 6.00 for Windows (GraphPad, http://www.graphpad.com).
ACCESSION NUMBERS
The accession number for the gene array reported in this paper is ArrayEx-
press E-MTAB-2732.
SUPPLEMENTAL INFORMATION
Supplemental Information includes Supplemental Experimental Procedures,
four figures, and four tables and can be found with this article online at
http://dx.doi.org/10.1016/j.cmet.2015.07.008.
AUTHOR CONTRIBUTIONS
C.M. and A.G.N. designed the study and wrote the manuscript. A.G.N., A.v.H.,
M. Hohl, J.R.L., J.B, J.-C.R., A.K., J.B., M.S., S.-L.P., M.K., M.W., I.B., B.P.,
M.L., T.S.B., A.R.H., L.K., T.Z., S.C., C. Muller, and A.K. performed the exper-
iments. C.R.D.L., I.B., R.K., M. Hoth, M.R.D., U.L., M.B., P.L., and S.C. gave
valuable scientific input and supervised data analysis and experiments.
ACKNOWLEDGMENTS
The study was supported by the Deutsche Forschungsgemeinschaft (Emmy
Noether- and Heisenberg Programm to C. Maack; SFB 894 to M. Hoth and
C. Maack; KFO 196 to C. Maack, U.L, A.K., M.B.; and SFB 1027 to M. Hoth
(project A2) and I.B. (project C4); BO3643/3-1 to I.B.), the Deutsche Gesell-
schaft fur Kardiologie (Otto Hess Stipendium to M.S.) and the Staatskanzlei
Saarland (LFFP 11/02 and 15/04) (to C.R.D.L.). U.L. and C. Maack are
supported by the Corona foundation. We thank Michelle Gulentz, Lisa Lang,
Jeanette Zimolong, and Nina Schnellbach for technical assistance and Ting-
Ting Huang (Stanford University, CA) for providing the antibody against Nnt.
Received: January 26, 2015
Revised: May 10, 2015
Accepted: July 8, 2015
Published: August 6, 2015
REFERENCES
Ago, T., Liu, T., Zhai, P., Chen, W., Li, H., Molkentin, J.D., Vatner, S.F., and
Sadoshima, J. (2008). A redox-dependent pathway for regulating class II
HDACs and cardiac hypertrophy. Cell 133, 978–993.
Aon, M.A., Cortassa, S., and O’Rourke, B. (2010). Redox-optimized ROS
balance: a unifying hypothesis. Biochim. Biophys. Acta 1797, 865–877.
Backx, P.H., and Ter Keurs, H.E. (1993). Fluorescent properties of rat cardiac
trabeculae microinjected with fura-2 salt. Am. J. Physiol. 264, H1098–H1110.
Balaban, R.S. (2002). Cardiac energy metabolism homeostasis: role of cyto-
solic calcium. J. Mol. Cell. Cardiol. 34, 1259–1271.
Balaban, R.S., Nemoto, S., and Finkel, T. (2005). Mitochondria, oxidants, and
aging. Cell 120, 483–495.
Belch, J.J., Bridges, A.B., Scott, N., and Chopra, M. (1991). Oxygen free rad-
icals and congestive heart failure. Br. Heart J. 65, 245–248.
Blacker, T.S., Mann, Z.F., Gale, J.E., Ziegler, M., Bain, A.J., Szabadkai, G., and
Duchen, M.R. (2014). Separating NADH and NADPH fluorescence in live cells
and tissues using FLIM. Nat. Commun. 5, 3936.
tabolism 22, 472–484, September 1, 2015 ª2015 Elsevier Inc. 483

Brandes, R., and Bers, D.M. (1997). Intracellular Ca2+ increases the mitochon-
drial NADH concentration during elevated work in intact cardiac muscle. Circ.
Res. 80, 82–87.
Cortassa, S., Aon, M.A., O’Rourke, B., Jacques, R., Tseng, H.J., Marban, E.,
and Winslow, R.L. (2006). A computational model integrating electrophysi-
ology, contraction, andmitochondrial bioenergetics in the ventricular myocyte.
Biophys. J. 91, 1564–1589.
Dai, D.F., Santana, L.F., Vermulst, M., Tomazela, D.M., Emond, M.J.,
MacCoss, M.J., Gollahon, K., Martin, G.M., Loeb, L.A., Ladiges, W.C., and
Rabinovitch, P.S. (2009). Overexpression of catalase targeted to mitochondria
attenuates murine cardiac aging. Circulation 119, 2789–2797.
Dai, D.F., Hsieh, E.J., Liu, Y., Chen, T., Beyer, R.P., Chin, M.T., MacCoss, M.J.,
and Rabinovitch, P.S. (2012). Mitochondrial proteome remodelling in pressure
overload-induced heart failure: the role of mitochondrial oxidative stress.
Cardiovasc. Res. 93, 79–88.
Dai, D.F., Hsieh, E.J., Chen, T., Menendez, L.G., Basisty, N.B., Tsai, L., Beyer,
R.P., Crispin, D.A., Shulman, N.J., Szeto, H.H., et al. (2013). Global proteomics
and pathway analysis of pressure-overload-induced heart failure and its atten-
uation by mitochondrial-targeted peptides. Circ Heart Fail 6, 1067–1076.
Freeman, H., Shimomura, K., Horner, E., Cox, R.D., and Ashcroft, F.M. (2006).
Nicotinamide nucleotide transhydrogenase: a key role in insulin secretion. Cell
Metab. 3, 35–45.
Halestrap, A. (2005). Biochemistry: a pore way to die. Nature 434, 578–579.
Huang, T.T., Naeemuddin, M., Elchuri, S., Yamaguchi, M., Kozy, H.M.,
Carlson, E.J., and Epstein, C.J. (2006). Genetic modifiers of the phenotype
of mice deficient in mitochondrial superoxide dismutase. Hum. Mol. Genet.
15, 1187–1194.
Kembro, J.M., Aon, M.A., Winslow, R.L., O’Rourke, B., and Cortassa, S.
(2013). Integrating mitochondrial energetics, redox and ROS metabolic
networks: a two-compartment model. Biophys. J. 104, 332–343.
Kim, A., Chen, C.H., Ursell, P., and Huang, T.T. (2010). Genetic modifier of
mitochondrial superoxide dismutase-deficient mice delays heart failure and
prolongs survival. Mamm. Genome 21, 534–542.
Kohlhaas, M., Liu, T., Knopp, A., Zeller, T., Ong, M.F., Bohm,M., O’Rourke, B.,
and Maack, C. (2010). Elevated cytosolic Na+ increases mitochondrial forma-
tion of reactive oxygen species in failing cardiac myocytes. Circulation 121,
1606–1613.
Korshunov, S.S., Skulachev, V.P., and Starkov, A.A. (1997). High protonic po-
tential actuates amechanism of production of reactive oxygen species inmito-
chondria. FEBS Lett. 416, 15–18.
Kumar, V., Kitaeff, N., Hampton, M.B., Cannell, M.B., and Winterbourn, C.C.
(2009). Reversible oxidation of mitochondrial peroxiredoxin 3 in mouse heart
subjected to ischemia and reperfusion. FEBS Lett. 583, 997–1000.
Lee, H.Y., Choi, C.S., Birkenfeld, A.L., Alves, T.C., Jornayvaz, F.R., Jurczak,
M.J., Zhang, D., Woo, D.K., Shadel, G.S., Ladiges, W., et al. (2010).
Targeted expression of catalase to mitochondria prevents age-associated
reductions in mitochondrial function and insulin resistance. Cell Metab. 12,
668–674.
Lin, M.T., and Beal, M.F. (2006). Mitochondrial dysfunction and oxidative
stress in neurodegenerative diseases. Nature 443, 787–795.
Maack, C., Kartes, T., Kilter, H., Schafers, H.J., Nickenig, G., Bohm, M., and
Laufs, U. (2003). Oxygen free radical release in human failing myocardium is
associated with increased activity of rac1-GTPase and represents a target
for statin treatment. Circulation 108, 1567–1574.
Maack, C., Cortassa, S., Aon, M.A., Ganesan, A.N., Liu, T., and O’Rourke, B.
(2006). Elevated cytosolic Na+ decreases mitochondrial Ca2+ uptake during
484 Cell Metabolism 22, 472–484, September 1, 2015 ª2015 Elsevie
excitation-contraction coupling and impairs energetic adaptation in cardiac
myocytes. Circ. Res. 99, 172–182.
Masson, S., Anand, I., Favero, C., Barlera, S., Vago, T., Bertocchi, F.,
Maggioni, A.P., Tavazzi, L., Tognoni, G., Cohn, J.N., et al. (2012). Serial mea-
surement of cardiac troponin T using a highly sensitive assay in patients with
chronic heart failure: data from 2 large randomized clinical trials. Circulation
125, 280–288.
Matsushima, S., Ide, T., Yamato, M., Matsusaka, H., Hattori, F., Ikeuchi, M.,
Kubota, T., Sunagawa, K., Hasegawa, Y., Kurihara, T., et al. (2006).
Overexpression of mitochondrial peroxiredoxin-3 prevents left ventricular
remodeling and failure after myocardial infarction in mice. Circulation 113,
1779–1786.
Murphy, M.P. (2009). How mitochondria produce reactive oxygen species.
Biochem. J. 417, 1–13.
Olivetti, G., Abbi, R., Quaini, F., Kajstura, J., Cheng, W., Nitahara, J.A., Quaini,
E., Di Loreto, C., Beltrami, C.A., Krajewski, S., et al. (1997). Apoptosis in the
failing human heart. N. Engl. J. Med. 336, 1131–1141.
Park, S.K., Kim, J., Seomun, Y., Choi, J., Kim, D.H., Han, I.O., Lee, E.H.,
Chung, S.K., and Joo, C.K. (2001). Hydrogen peroxide is a novel inducer of
connective tissue growth factor. Biochem. Biophys. Res. Commun. 284,
966–971.
Rahman, I., Kode, A., and Biswas, S.K. (2006). Assay for quantitative determi-
nation of glutathione and glutathione disulfide levels using enzymatic recycling
method. Nat. Protoc. 1, 3159–3165.
Roger, V.L. (2013). Epidemiology of heart failure. Circ. Res. 113, 646–659.
Rydstrom, J. (2006). Mitochondrial NADPH, transhydrogenase and disease.
Biochim. Biophys. Acta 1757, 721–726.
Schriner, S.E., Linford, N.J., Martin, G.M., Treuting, P., Ogburn, C.E., Emond,
M., Coskun, P.E., Ladiges, W., Wolf, N., Van Remmen, H., et al. (2005).
Extension of murine life span by overexpression of catalase targeted to mito-
chondria. Science 308, 1909–1911.
Sheeran, F.L., Rydstrom, J., Shakhparonov, M.I., Pestov, N.B., and Pepe, S.
(2010). Diminished NADPH transhydrogenase activity andmitochondrial redox
regulation in human failing myocardium. Biochim. Biophys. Acta 1797, 1138–
1148.
Simon, M.M., Greenaway, S., White, J.K., Fuchs, H., Gailus-Durner, V., Wells,
S., Sorg, T., Wong, K., Bedu, E., Cartwright, E.J., et al. (2013). A comparative
phenotypic and genomic analysis of C57BL/6J and C57BL/6N mouse strains.
Genome Biol. 14, R82.
Smith, R.A., Hartley, R.C., Cocheme, H.M., and Murphy, M.P. (2012).
Mitochondrial pharmacology. Trends Pharmacol. Sci. 33, 341–352.
Starkov, A.A., and Fiskum, G. (2003). Regulation of brain mitochondrial H2O2
production by membrane potential and NAD(P)H redox state. J. Neurochem.
86, 1101–1107.
Szeto, H.H. (2014). First-in-class cardiolipin-protective compound as a thera-
peutic agent to restore mitochondrial bioenergetics. Br. J. Pharmacol. 171,
2029–2050.
Toye, A.A., Lippiat, J.D., Proks, P., Shimomura, K., Bentley, L., Hugill, A., Mijat,
V., Goldsworthy, M., Moir, L., Haynes, A., et al. (2005). A genetic and physio-
logical study of impaired glucose homeostasis control in C57BL/6J mice.
Diabetologia 48, 675–686.
Wagner, S., Rokita, A.G., Anderson, M.E., and Maier, L.S. (2013). Redox regu-
lation of sodium and calcium handling. Antioxid. Redox Signal. 18, 1063–1077.
Wencker, D., Chandra, M., Nguyen, K., Miao, W., Garantziotis, S., Factor,
S.M., Shirani, J., Armstrong, R.C., and Kitsis, R.N. (2003). A mechanistic role
for cardiac myocyte apoptosis in heart failure. J. Clin. Invest. 111, 1497–1504.
r Inc.

Cell Metabolism, Volume 22
Supplemental Information
Reversal of Mitochondrial Transhydrogenase Causes Oxidative Stress in Heart Failure Alexander G. Nickel, Albrecht von Hardenberg, Mathias Hohl, Joachim R. Löffler, Michael Kohlhaas, Janne Becker, Jan-Christian Reil, Andrey Kazakov, Julia Bonnekoh, Moritz Stadelmaier, Sarah-Lena Puhl, Michael Wagner, Ivan Bogeski, Sonia Cortassa, Reinhard Kappl, Bastian Pasieka, Michael Lafontaine, C. Roy D. Lancaster, Thomas S. Blacker, Andrew R. Hall, Michael R. Duchen, Lars Kästner, Peter Lipp, Tanja Zeller, Christian Müller, Andreas Knopp, Ulrich Laufs, Michael Böhm, Markus Hoth, and Christoph Maack

Supplemental Information
Supplemental Data
Figure S1 (legend on following page)

Figure S1: Expression of Nnt in cardiac myocytes and fibroblasts. Related to Figure 1.
(A) PCR using primers spanning exons 7-11 produces a 1320 bp product in hearts of BL/6N mice, while in BL/6J hearts, this product is truncated to 572 by the missense of exons 7-11.
(B) Western-blot analysis of Nnt and GAPDH in different organs (as indicated) in BL/6N (N) and BL/6J mice (J), respectively. SM, skeletal muscle.
(C) Original immunoblots of Nnt, calsequestrin (CSQ) as a marker for cardiac myocytes, prolyl 4-hydroxylase (P4BH) as a marker for fibroblasts, cytochrome oxidase IV (CoxIV) as a marker for mitochondria and GAPDH as house-keeping protein. N1-N5, BL/6N hearts 1-5; J1-J2, BL/6J hearts 1-2; rat, isolated rat mitochondria; Huvec, human umbilical vein endothelial cells.
(D) Expression of Nnt in cardiac myocytes and fibroblasts related to the expression of CoxIV. (E) Mitochondrial Nnt activity in heart, brain and skeletal muscle. (F) IDH2 activity and (G) MEP activity in cardiac mitochondria, respectively. (H) Relative NADPH-regenerating efficacy of Nnt, IDH2 and MEP in cardiac mitochondria, based
on Vmax values displayed in E-G. (I) Pancreatic islets were isolated from BL/6N and BL/6J mice, and enzymatic activity of
IDH2, MEP and Nnt were determined in whole cell lysates. Enzymatic activities of IDH2 in the absence and presence of ATP (5 mM), and Nnt activities in the presence of ATP (5 mM) are shown. No activity of MEP was detected.
(J) Estimation of overall NADPH-regenerating efficiency in pancreatic islets of BL/6N and BL/6J mice, estimated from the values shown in (I), in the absence and presence of ATP, respectively.
(K) Isolated cardiac myocytes were either field-stimulated (K) or patch-clamped (L), and cytosolic Ca2+ ([Ca2+]c) and mitochondrial Ca2+ ([Ca2+]m; J) were determined with indo-1 and rhod-2 AM, respectively. The numbers of experiments are given in brackets. Systolic and diastolic [Ca2+]c under steady-state conditions at 0.5 Hz in the absence and presence of isoproterenol (30 nM), at 5 Hz plus isoproterenol and at 0.5 Hz during wash-out of isoproterenol (w/o).
(L) Diastolic [Ca2+]m in response to isoproterenol and 5 Hz challenge in patch-clamped myocytes.

Figure S2: Differential levels of oxidative stress and cardiac remodeling in BL/6N and BL/6J mice after pressure overload. Related to Figure 2.
BL/6N and BL/6J mice were exposed to TAC or sham-surgery for 6 weeks.
(A) Left ventricular volume at an end-systolic pressure of 70 mmHg (V70), determined by pressure-volume relationships in isolated working hearts of BL/6N and BL/6J after Sham- or TAC-operation, respectively. This parameter (V70) integrates end-systolic elastance (Ees) as an index of LV contractility, obtained from the end-systolic pressure-volume relationship (ESPVR), and its interception with the volume axis, indicative for LV remodeling (dilation). An increase of V70 indicates decreased contractility and LV enlargement due to remodeling.
(B) 8-OHdG staining for intracellular H2O2 formation in nuclei of non-myocytes in sham- (Sh) or TAC-operated BL/6N or BL/6J mice, respectively.
(C) mRNA expression of transforming growth factor β (TGFβ) in the four groups. (D) mRNA expression of lysyl oxidase (LOX).
Data are presented as means ±SEM. *p<0.05, **p<0.01 and ***p<0.001 (one-way ANOVA, Tukey´s post-test).
A
LO
X (
fold
)
B C D
V70 (
µl)

Figure S3 (legend on following page)

Figure S3: Decreased mitochondrial emission of H2O2 in Nnt-deficient mitochondria from brain and skeletal muscle of BL/6N and BL/6J mice. Related to Figure 3.
(A) O2 consumption in isolated brain mitochondria supplied with pyruvate (5 mM) and malate (5 mM) in the absence (State 4) and presence of ADP (1 mM; State 3). RCR, Respiratory control ratio.
(B) Same as (A), but mitochondrial O2- formation determined.
(C) Mitochondrial emission of H2O2 under the same conditions as in (A) and (B). (D) Same conditions as in (A), but in mitochondria from skeletal muscle. (E) Mitochondrial O2
- formation. (F) Mitochondrial emission of H2O2. (G) Mitochondrial membrane potential (∆Ψm; TMRM) determined in isolated cardiac myocytes of
BL/6N and BL/6J mice in response to combined application of FCCP (5 µM) and oligomycin (10 µM).
(H) Time constant (τ) for the decay of TMRM fluorescence in BL/6N and BL/6J myocytes in response to FCCP/oligomycin.
(I) Same as (G), but experiments performed in BL/6N myocytes in the absence (Con) or presence of 4-chloro-7-nitrobenzo-2-oxa-1,3-diazole (NBD chloride, NDB; 1 µM).
(J) ∆Ψm was determined by TPMP+ accumulation in isolated mitochondria before and after titration of DNP in the presence of substrates (pyruvate/malate; 5 mM each) and oligomycin (1.2 µM), respectively.
(K) Same as (J), but in the presence of nigericin (1 µM), respectively. Data are presented as means ±SEM. *p<0.05, **p<0.01 and ***p<0.0001 (one-way ANOVA, Tukey´s post-test). †p<0.05 vs. BL/6N (unpaired t-test).

Figure S4: Effects of SS-31 on cardiomyocyte hypertrophy, ANP and CTGF expression in BL/6N and BL/6J mice after TAC. Related to Figure 6.
BL/6N and BL/6J mice were exposed to a combined operation of TAC or sham plus implantation of a minipump releasing SS-31 (3 mg/kg per day) or vehicle (NaCl 0.9%) for 6 weeks.
(A) Changes in heart weight (HW) to tibia ratios in Sham- or TAC-operated and SS-31 or vehicle treated BL/6N and BL/6J mice, respectively.
(B) Cardiomyocyte hypertrophy by histological analysis of myocyte cross sectional area in groups as indicated in (A).
(C) mRNA expression of atrial natriuretic peptide (ANP) in groups as indicated in (A). (D) mRNA expression of connective tissue growth factor (CTGF) in groups as indicated in
(A). (E) Extramitochondrial Ca2+ (arbitrary units, AU) in response to subsequent Ca2+ pulses of 10
µmol/L each in BL/6N and BL/6J cardiac mitochondria, respectively. (F) Same as (E), but in the presence of H2O2 (100 µmol/L) in the absence and presence of
cyclosporin A (1 µmol/L), respectively.
Data are presented as means ±SEM. *p<0.05, **p<0.01, ***p<0.001 and ****p<0.0001 (One-way ANOVA with Tukey´s post test).

Supplementary Tables
Table S1: Studies on mice investigating the effect of pressur e overload by TAC . Related to the Experimental Procedures section (“Trans-aortic constriction, TAC”).
Target
Inter-vention
Genetic background
Result(s)
Reference
NOX2
KO
C57BL/6J
LVH ↔
(Byrne et al., 2003)
NOX2 KO C57BL/6J LVH ↔ (Maytin et al., 2004)
NOX2 KO C57BL/6J LVEF ↑, fibrosis ↓ (Grieve et al., 2006)
NOX2 p47phox
KO KO
C57BL/6J C57BL/6J
LVEF ↑, BNP ↓, ROS ↓ LVEF ↓ , survival ↓,
BNP ↑, fibrosis ↑, (NOX-independent effects)
(Patel et al., 2013)
NOX4
KO
TG OE
C57BL/6 (Jackson) FVB
LVH ↓, apoptosis ↓, fibrosis ↓, LVEF ↑ LVH ↑, apoptosis ↑, fibrosis ↑, LVEF ↓
(Kuroda et al., 2010)
NOX4 KO
TG OE
C57BL/6* LVH ↑, fibrosis ↑, capillaries ↓, LVEF ↓ LVH ↓, fibrosis ↓, capillaries ↑, LVEF ↑
(Zhang et al., 2010)
eNOS (uncoupled)
KO C57BL/6 (Jackson)
LVH ↓, fibrosis ↓, LVEF ↑
(Takimoto et al., 2005)
NO „Agonist“ (Na-nitrite)
C57BL/6J LVH ↓, fibrosis ↓, LVEF ↑
(Bhushan et al., 2014)
Xanthine oxidase (XO)
Inhibitor C57BL/6 (Jackson)
LVH ↓, MAPK-P ↓, LVEF ↑
(Xu et al., 2008)
ROS MPG (Antiox.)
C57BL/6 (probably J)
LVH ↓, ANP ↓, fibrosis ↓
(Date et al., 2002)
Mito H2O2 mCAT C57BL/6N/ FVB mixed
LVH ↓, fibrosis ↓, LVEF ↑
(Dai et al., 2012)
Mito H2O2 SS-31 C57BL/6N LVH ↓, fibrosis ↓, LVEF ↑
(Dai et al., 2013)
MAO KO
Inhibitor
129/Sv
C57BL/6 (probably J)
LVH ↓, fibrosis ↓, apoptosis ↓, LVEF ↑ LVH ↓, fibrosis ↓, apoptosis ↓, LVEF ↑
(Kaludercic et al., 2010)
NOX, NADPH oxidase; eNOS, endothelial nitric oxide synthase; MAO, monoamino oxidase A; LVH, left ventricular hypertrophy; LVEF, left ventricular ejection fraction; KO, knock-out; TG OE, transgenic overexpression; I, inhibitor; mCAT, mitochondria-targeted catalase; MPG, N-2-mercaptopropionyl.

Table S2: Solutions A-D for enzymatic digestion of cardiac myocytes. Related to the Experimental Procedures section (“Isolated cardiac myocytes”). Ingredient Solution A
(mM) Solution B (mM)
Solution C (mM)
Solution D (mM)
NaCl 1130.10 1130.10 1130.10 1130.10 KCl 46.90 46.90 46.90 46.90 KH2PO4 6.00 6.00 6.00 6.00 Na2HPO4 5.99 5.99 5.99 5.99 MgSO4-7H2O 12.20 12.20 12.20 12.20 Phenol red 0.32 0.32 0.32 0.32 NaHCO3 120.20 120.20 120.20 120.20 KHCO3 100.00 100.00 100.00 100.00 HEPES 100.00 100.00 100.00 100.00 Glucose 5.50 5.50 5.50 5.50 Taurine 30.00 30.00 30.00 30.00 BDM 10.00 10.00 10.00 10.00 Volume (ml) 250.00 20.00 9.00 28.50 Liberase TH 0.08 mg/ml Trypsin 0.14mg/ml CaCl2 12.50 µM 12.50 µM 12.50 µM FCS +1.00 ml +1.50 ml
Table S3 (Legend): Gene array analysis comparing Sham- and TAC-operated BL/6N mice. The table is a supplementary excel file (ArrayExpress accession # E-MTAB-2732). Related to the Experimental Procedures section (“Real-time PCR, gene array and Western-blot analysis”).
Table S4 (Legend): Gene array analysis comparing Sham- and TAC-operated BL/6J mice. The table is a supplementary excel file. (ArrayExpress accession # E-MTAB-2732). Related to the Experimental Procedures section (“Real-time PCR, gene array and Western-blot analysis”).

Extended Experimental Procedures Animal experiments Animals C57BL/6NCrl and C57BL/6J mice were obtained from Charles River (Sulzfeld, Germany; C57BL/6NCrl, strain code 027; and C57BL/6J, JAXTM Mice Stock Number 000664) and were housed under standard conditions. Transverse-aortic constriction BL/6N and BL/6J mice (10 weeks, BW: 20-23g) were anesthetized with ketamine/xylazine for trans-aortic constriction (TAC). After orotracheal intubation using a 20 gauge catheter, the tube was connected to a volume cycled rodent ventilator (Harvard Apparatus, Holliston, MA) on supplemental oxygen with a tidal volume of 0.2 ml and respiratory rate of 110 strokes/min. The chest cavity was accessed via the second intercostal space at the left upper sternal border through a small incision and aortic constriction was performed by tying a 7-0 nylon suture ligature against a 27 gauge needle to yield a narrowing 360 µm in diameter as a transverse aortic constriction of 65–70%. Control mice underwent a sham operation in which the nylon suture was placed, but not tied. After 6 weeks or 3 days, animals were euthanized by intraperitoneal (i. p.) injection of a mixture of Ketamine hydrochloride (100 mg/kg body weight; Pfizer, Karlsruhe, Germany) and Xylazine hydrochloride (“Rompun”, 10 mg/kg body weight; Bayer Healthcare, Berlin, Germany), and hearts were rapidly excised and processed for further experiments as indicated in the specific sections below. Drug application Chronic SS-31 (D-Arg-2’6’-dimethylTyr-Lys-Phe-NH2; Stealth Peptides, Newton, MA, USA; 3 mg/kg/day) or vehicle (0.9% NaCl) delivery for 6 weeks was facilitated using subcutaneously implanted osmotic minipumps (Alzet, model #2006, supplied by Charles River, Sulzfeld, Germany). For 3-days treatment, SS-31 (0.5 mg/ml in 0.9% NaCl, 0.2 ml) or vehicle (0.9% NaCl) was injected intraperitoneally. Cyclosporin A was applied via daily i. p. injection (25 mg/kg/day, solved in corn oil, 0.1 ml) for three days. Corn oil injected mice served as control. Echocardiography Echocardiography studies were performed using the Visualsonics Vevo® 770 High-Resolution in vivo Micro-Imaging System (Visualsonics Inc., Toronto, CAN; Scanhead: RMV707B, 15-45 MHz, cardiac mouse). Prior to examinations, mice were anesthetized (3% Isoflurane mixed with 97% O2 at a flow rate of 1 L/min). After placing the mouse in a supine position atop a pad with embedded ECG, mice were kept anesthetized by inhaling 1.0 – 1.5% Isoflurane and 98.5 - 99% O2 at a flow rate of 1 L/min using an animal nose mask. Heart rates were generally maintained at about 500 beats per minute (bpm) with these regimens. After fixing the mouse, chest hair was removed by using a hair removal cream (Nair), and a layer of preheated ultrasound gel was applied to the chest. Body temperature was monitored throughout the whole procedure by an inserted rectal probe and adjusted via the heated platform and a heat lamp to maintain the body temperature within a narrow range (37.0°C±1.5°C). Two-dimensional images (B-Mode) were

recorded in parasternal long- and short-axis projections with guided one-dimensional M-mode recordings at the midventricular level apical of the papillary muscle in both views. Standard measurements of interventricular septum (IVS), left ventricular internal diameter (LVID), and left ventricular posterior wall (LVPW) were performed in systole and diastole in parasternal long-axis projection. Left ventricular (LV) cavity size and wall thickness were measured in at least three beats from this projection and averaged. ECG and respiration gating were used to suppress imaging artifacts due to respiration and cardiac movements. Working heart preparation For working heart experiments, the aorta was cannulised with an 18-G metal cannula for a Langendorff retrograde perfusion mode (baseline, 80 mmHg perfusion pressure) with Krebs-Henseleit buffer (KHB) in a working heart apparatus (IH-SR Perfusion system type 844/1 Hugo Sachs Elektronik, March-Hugstetten, Germany) (Reil et al., 2010). After establishing coronary perfusion in the Langendorff mode, “working heart” preparation was continued by cannulising the left atrium (LA) through the pulmonary vein with a 16-G steel cannula. This cannula was connected to a preload column, which was water- jacketed and heated to 38°C, resulting in a myocardial temperature of 37°C when the heart was operating in the working mode (preload 10 mmHg, afterload 80 mmHg. Two platinum pacing electrodes embedded in polyester resin were attached to the right atrium to pace the hearts at about 400 bpm (Reil et al., 2010). LV systolic and diastolic function was recorded via a high fidelity pressure-conductance catheter (Millar 1.4 F SPR-835, Millar, Houston, Texas) inserted into the LV cavity through a small puncture in the apex made with a 22 1/4 gauge needle. The end-systolic pressure volume relationship (ESPVR) and its slope Ees (end-systolic ventricular elastance) were assessed by a sudden increase in afterload pressure from 80 to 120mmHg while preload was kept constant at 10 mmHg and a heart rate of 400 bpm. Cardiac inflow and aortic flow were recorded continuously by inline ultrasonic transit time probes and these measurements were used to calibrate volume measurement of the conductance catheter signal gain. Parallel conductance (conductance signal offset) was determined by the saline dilution method by injecting a 5 µl bolus of hypertonic (5%) saline into the left atrial cannula, causing a transient change in the conductivity of KHB in LV cavity. Experiments on isolated cardiac myocytes Isolation of cardiac myocytes Adult cardiac myocytes were isolated with an isolation protocol modified from O’Connell et al. (AfCS Research Reports; Vol. 1 No. 5 CM). BL/6N or BL/6J mice were anaesthetized with 5% Isofluran (Abbott, Germany), and 250 I.U. heparin (Braun, Germany) and 0.33 mg Carprofen (RIMADYL®; Pfizer, Germany) were injected. When the mouse was deeply narcotized, the heart was removed and the aorta cannulated in a retrograde perfusion system, with the temperature set at 37°C. Retrograde perfusion is initiated with a Ca2+ free solution A (Table S2) for 4 minutes, and then the heart is perfused with solution B containing 0.08 mg/ml Liberase TH® (Roche) for enzymatic digestion for 4 to 6 minutes. To stop digestion, both ventricles were cut off and transferred into a solution containing 50% solution A and 50% solution C (room

temperature). In this solution, the ventricles were opened and expanded, the myocytes were released by softly slewing for 5-7 minutes and then the solution was transferred in a 15 ml tube. After sedimentation for 8 minutes, the supernatant was transferred to a second 15 ml tube and centrifuged for 1 min at 180g. Both pellets were resuspended in 5 ml of solution D and combined in a 60-mm dish, where the myocytes were re-exposed to Ca2+ in 5 steps (Stock solution 10 mM CaCl2: added two times 50 µl and once 100 µl; then 100 mM CaCl2: added 30 µl and then 50 µl) every 4 minutes. Thereafter this solution was transferred to a 15 ml tube, in which the myocytes sedimented for 8 minutes. Then the supernatant was transferred to a second 15 ml tube and centrifuged for 1 min at 180g. Both pellets were resuspended in 10 ml of culture medium (M199 + 5% FCS, + 1% penicillin and streptomycin, + 10 mM HEPES). The myocytes were then used in the experiments. Measurements of [Ca 2+]m and [Ca 2+]c in isolated cardiac myocytes Recordings of [Ca2+]m together with [Ca2+]c were performed using a patch-clamp based approach as described previously (Kohlhaas et al., 2010; Kohlhaas and Maack, 2010). Briefly, myocytes were loaded with cell-permeable rhod-2 AM (for [Ca2+]m) and then patch-clamped and dialyzed with a pipette solution that contained a K+-glutamate based pipette solution (composition see Supplemental Information) containing cell-impermeable indo-1 salt to monitor [Ca2+]c. Myocytes were held at -70 mV in voltage-clamp mode and then depolarized to +10 mV for 100 ms at 0.5 Hz. After 60 s, isoproterenol (30 nmol/L) was added, and after 180 s, stimulation frequency was increased to 5 Hz (with depolarizing steps shortened to 50 ms). After 3 min, isoproterenol was washed out and stimulation frequency was set back to 0.5 Hz. Fluorescence recordings in field-stimulated cardiom yocytes Isolated cardiac myocytes were paced by electrical field stimulation using a customized IonOptix system as described previously (Kohlhaas and Maack, 2010). The autofluorescences of NAD(P)H/NAD(P)+ and FADH2/FAD were determined by alternately exciting cells at wavelengths (λexc) of 340 and 485 nm, and collecting emission at λem of 450 and 525 nm for NAD(P)H and FAD+, respectively. Calibration was performed with FCCP (5 µmol/L) and cyanide (4 mmol/L) (Kohlhaas and Maack, 2010). To detect mitochondrial superoxide (.O2
-), myocytes were loaded with MitoSOX (3.3 µmol/L) for 30 min at 37°C (λexc=380 nm, λem=580 nm). As a positive control, antimycin A (150 µmol/L) was used. [Ca2+]c was measured by incubating cells with indo-1 AM (5 µmol/L) for 20 min at 25°C (λexc=340 nm, λem=405/485 nm). To monitor ∆Ψm, myocytes were incubated with tetramethyl rhodamine methyl ester (TMRM; 100 nmol/L) for 10 min at 25°C, and fluorescence intensity (λexc=540 nm, λem=605 nm) was determined. For the experiments in Figures 4H-J, in which ∆Ψm was dissipated rapidly, TMRM fluorescence was monitored before and after application of FCCP (4 µmol/L) and oligomycin (1.26 µmol/L). Solutions used in patch-clamp and field-stimulation experiments:
• Normal Tyrode´s (perfusion) solution containing (in mM): NaCl 130, KCl 5, MgCl2 1, CaCal2 2, Na-HEPES 10, glucose 10, Na-pyruvate 2 and ascorbic acid 0.3, pH 7.4.
• Pipette solution (in mM): K-glutamate 130, KCl 19, MgCl2 0.5, Na-HEPES 15, Mg-ATP 5, pH 7.2.

Confocal measurements of ∆Ψm Myocytes were incubated wit TMRM (100 nmol/L) for 10 min before the experiment and fluorescence was assessed by time-lapse confocal microscopy based on a Nipkow-disc scan head (CSU-10, Yokogava Corp., Tokyo, Japan). Furthermore, the system consisted of an upright microscope (E600, Nikon, Tokyo, Japan) equipped with a 40x water immersion objective (NA 0.8), a 561 nm diode pumped solid state laser (85-YCA-015, Melles Griot, Carlsbad, CA, USA), a charge-coupled device camera (Orca-ER, Hamamatsu Photonics, Hamamatsu, Japan) and was controlled by VoxCellScan software (VisiTech Int., Sunderland, UK). Images were acquired every two minutes. TMRM was co-incubated with or without 10 nM of SS-31 or 1 µM of cyclosporin A. Before starting simultaneous measurement of several cells in a field of view, myocytes were exposed to 100 µmol/L H2O2. TMRM fluorescence (excitation: 561 nm; emission: 580-620 nm) was calculated using ImageJ. Fluorescence lifetime imaging (FLIM) Cardiomyocytes from BL/6N and BL/6J mice were isolated as described above, performed in accordance with the United Kingdom Animals (Scientific Procedures) Act of 1986 and in compliance with the Biological Services Management Group and the Biological Services Ethical Committee, University College London. NAD(P)H FLIM was performed on an upright LSM 510 microscope (Carl Zeiss) with a 1.0 NA 40x water-dipping objective using a 650-nm short-pass dichroic and 460±25nm emission filter. Two-photon excitation was provided by a Chameleon (Coherent) Ti:sapphire laser tuned to 720 nm, with on-sample powers kept below 10 mW. Emission events were registered by an external detector (HPM-100, Becker & Hickl) attached to a commercial time-correlated single photon counting electronics module (SPC-830, Becker & Hickl). Scanning was performed continuously for two minutes with a pixel dwell time of 1.6 µs. Initial FLIM data analysis was performed in SPCImage v3.0.8. Fluorescence events from neighbouring pixels were binned until the dimmest pixel of interest contained at least 4000 counts (typically 7x7). A biexponential decay model was fit to the data at each pixel by the iterative reconvolution method. The instrument response function of the FLIM system was obtained by measuring the fluorescence decay profile of second harmonic generation by a potassium dihydrogen phosphate (KDP) crystal at 920 nm, grown by leaving a molar solution of KDP in water on a coverslip to evaporate. Matrices of the fluorescence intensity and fluorescence decay parameters αbound, τfree and τbound were exported from SPCImage and imported into MATLAB (The Mathworks). Here, a 16-bit grayscale image was produced for each parameter matrix in which the intensity of each pixel was proportional to the parameter value at that location. ImageJ was then used to measure the grayscale intensity in the parameter images and the values obtained converted back to parameter values using the scaling factors applied in their production. Mean values of αbound, τfree, τbound and fluorescence intensity <Itotal> were collated and averaged in Microsoft Excel. Absolute concentrations of NADH and NADPH were estimated using the model developed previously (Blacker et al., 2014). These quantities were calculated from the fluorescence observables using,

[ ][ ]
( )( )ns4.4
5.1ns
NADH
NADPH
bound
bound
ττ
−−
= (1)
[ ] ( )( ) boundboundfreebound
totalbound
19.2
5.1nsNADPH
τατατ
+−
−=
Ik (2)
[ ] ( )( ) boundboundfreebound
totalbound
19.2
ns4.4NADH
τατατ
+−
−=
Ik (3)
where k is a dimensionless constant set such that [NADH] was 1 au under control conditions. Experiments on isolated mitochondria Mitochondria isolation from heart We isolated mitochondria from adult mouse hearts (10 weeks old) using an established method optimized for small tissue samples as described previously (Mela and Seitz, 1979; Wei et al., 2011). The heart was washed in ice-cold isotonic isolation solution (IS; in mM: sucrose 75, mannitol 225, HEPES 2, EGTA 1, pH 7.4) and separated from atria and non-myocardial tissue. Then the heart was transferred to a 5 ml homogenizer (Teflon pestle) and manually homogenized in two steps for 7 min each. The homogenate was centrifuged at low speed (480g, 5 min, 4°C) and the supernatant was further centrifuged (7700g, 10 min) to obtain the mitochondrial pellet and the cytosolic fraction. The pellet containing mitochondria was washed carefully twice in 1.4 ml mitochondrial suspension solution (MSS; like IS, but without EGTA) centrifuged (7700g, 5 min), and finally resuspended in 100 µl of MSS. Mitochondrial protein concentrations were determined according to the method of Lowry et al. (Lowry et al., 1951). Mitochondria isolation from brain The mouse brain was minced finely with scissors and washed twice with IS. The tissue was divided in two parts and manually homogenized in a buffer consisting of 1 ml IS and 0.16 mg/ml protease (bacterial, type XXIV) using 10 strokes with a loose-fitting glass pestle followed by a tight-fitting pestle, respectively. The homogenate was centrifuged at 2000g for 3 min at 4°C. The pellet was resuspended in 1 ml of IS and protease and centrifuged at 2000g for 3 min. The supernatant fractions from these two centrifugations were pooled and centrifuged at 12000g for 8 min. The resulting pellet, containing free mitochondria, was resuspended in 100µl of MSS. Western-blot experiments ruled out a relevant contamination of the preparation with synaptosomes (not shown). Mitochondria isolation from skeletal muscle Isolation of skeletal muscle mitochondria was performed essentially according to a previous study (Chappell and Perry, 1954). All media were ice-cold, and all procedures were performed on ice or at 4°C. Briefly, forelimb and hindlimb muscles were rapidly dissected and placed in basic medium (BM; in mM: KCl 140, HEPES 20, MgCl2 5, EGTA 1, pH 7.0). Muscle was cleared

from connective tissue and fat, placed in 500 µl of homogenizing medium (HM: BM with 1 mM ATP and 1% BSA (w/v)) containing one unit of protease (subtilisin A) and minced with scissors. Then the muscle was transferred to a 5 ml- homogenizer (Teflon pestle) and manually homogenized in two steps for 7 min each. After the first step homogenization, 1 ml of HM was added. The homogenate was fractionated by centrifugation at 800g for 10 min at 4°C. The pellet was discarded and the supernatant was centrifuged at 12000g for 10 min at 4°C. The final pellet was resuspended in 220 µl of BM. Mitochondrial respiration Mitochondrial oxygen consumption was measured polarographically at 30°C with a Clark oxygen electrode (Hansatech) covered with an ultrathin Teflon membrane in a closed chamber (Hansatech, oxygraph) of 2 ml containing (in mM) KCl 137, KH2PO4 2, EGTA 0.5, MgCl2 2.5, HEPES 20, at pH 7.2. The mitochondrial contents were 400 µg of heart mitochondria, 1 mg of brain and 1 mg of skeletal muscle mitochondria, respectively. State 4 respiration was initiated by the addition of 5 mM Na-pyruvate and 5 mM Na-malate. After 3 and 4.5 min, 1 mM ADP was added to induce maximal state 3-respiration. In addition to the conditions before application of ADP, we obtained an additional estimation of state 4 respiration by adding the F1Fo ATP-synthase inhibitor oligomycin (1.2 µM). The respiratory control ratio (RCR) was calculated as the ratio of the slope of the fastest decrease of O2 concentration under state 3 conditions by the slope of the fastest decrease of O2 concentration under state 4 conditions for 1 min, respectively. We observed no differences between state 4 respiration before application of ADP or after ADP in the presence of oligomycin and thus, the numbers of the state 4 conditions before application of ADP were used in all experiments. Electron paramagnetic resonance (EPR) for detection of superoxide EPR experiments were performed with a Bruker spectrometer (ESP300e) equipped with a standard 4102ST cavity which holds the capillary support quartz glass finger. The finger is temperature controlled and set to 37 °C. The redox activated cyclic hydroxylamine spin trap CMH (1-hydroxy-3-methoxycarbonyl-2,2,5,5-tetramethylpyrrolidine) was used in 300 µM concentration for all experiments to monitor superoxide (.O2
-) production. CMH was added shortly before the experiment. The sample was filled in a 50 µl glass capillary and immediately transferred into the capillary holder. All control experiments with single components of the assays and CMH were tested for unspecific radical production. The EPR spectra of the CM radical were measured with modulation amplitude of 0.1 mT and a microwave power of 20 mW at a time constant of 20.48 ms for 8 times and evaluated with a customized program (Medeia) which measures the peak-to-peak intensity and width of one (or several) lines of a radical visible in a time series. In the absence of line width changes and saturation effects, the intensity information can be translated to radical concentration by calculating the integral of the monitored line and considering the multiplicity of the radical signal. This value is compared to a reference sample of known concentration (100 µM Tempol) recorded under identical conditions for quantitative measures.

H2O2 emission H2O2 emission from mitochondria was measured using the H2O2-sensitive and specific fluorescent dye Amplex®UltraRed (AUR) (life technologies, Molecular Probes®). AUR reacts with H2O2 to form fluorescent product Resorufin (excitation at 535 nm, emission at 590 nm) in a 1:1 relation. The reaction is catalyzed by Horseradish Peroxidase (HRP). Assay component concentrations were 50 µM for AUR, 0.5 U/ml for HRP and 100 U/ml SOD (for conversion of O2
- to H2O2). Mitochondrial H2O2 production was measured after treatment with ADP (1 mM), FCCP (5 µM) as an uncoupler of respiratory chain, antimycin A (15 µM) in the presence of pyruvate/malate (5 mM, respectively) or mitochondria alone. Experiments were performed in 96 well plates (black/transparent) using the Tecan GENios Pro Reader with a bottom reading setting. All experiments were conducted in respiration buffer as described before with 30 µg mitochondria per well in triplicates at 37°C. H2O2 was quantified from a calibration curve obtained from known H2O2 concentrations. NAD(P)H measurements NAD(P)H was measured using a fluorescence plate reader (infinite M200Pro, Tecan). All experiments were conducted in respiration buffer as described before with 80 µg mitochondria per well in triplicates (excitation at 340 nm, emission at 450 nm) in a 200 µl reaction volume. Pyruvate/malate (5 mM, respectively), ADP (1 mM), cyanide (2.5 mM) and DNP (250µM) were added every 3 min. Background fluorescence was subtracted, and the specific fluorescence calculated as the fraction of the maximally reduced value achieved in the presence of cyanide. Determination of ∆Ψm in isolated mitochondria Determination of the mitochondrial membrane potential (∆Ψm) of isolated cardiac mitochondria was performed with a triphenylmethylphosphonium (TPMP+) selective electrode (KWIKTPP-2, purchased from WPI, Sarasota, FL) as described previously (Brown and Brand, 1985). The assay was conducted in respiration buffer as described above supplied with 5 mM pyruvate/malate in the presence or absence of 1 µM nigericin. The TPMP electrode was calibrated by successive additions of TPMP+ up to 8 µM. After addition of mitochondria (1 mg/ml) and oligomycin (1.2 µM), increasing concentrations of 2,4-dinitrophenol (DNP) were titrated. ∆Ψm was then calculated from the uptake of the lipophilic cation TPMP as described previously (Barger et al., 2003) using the following equation:
∆Ψm = ��
��× ln
���������� ���������������� ���
�.���×.���� ���×���� ×��
�
A mitochondrial TPMP+ binding correction of 0.17 µl/mg for cardiac mitochondria (Borutaite et al., 1995) was used. Permeability transition pore (PTP) assay PTP opening was determined in isolated cardiac mitochondria using a fluorescence plate reader (infinite M200Pro, Tecan) with an automated injection option. All experiments were conducted in 200 µl of buffer containing (in mM) KCl 120, mannitol 70, saccharose 25, HEPES 20, KH2PO4 5, and EGTA 0.02, with 165 µg of mitochondria per well in duplicates, respectively (excitation: 503 nm; emission: 535 nm). Mitochondria were preincubated with 5 mM K-glutamate/ 2.5 mM malate

in the absence or presence of cyclosporin A (1 µmol/L) for 15 min, respectively, and subsequently with or without 100 µM H2O2 for 10 min. 1 µM of Calcium Green 5-N (Invitrogen, Germany) was added before starting the measurement, and the assay was initiated by sequential additions of 10 µmol/L free Ca2+ every 2 minutes per well. Free Ca2+ concentrations were calculated with Maxchelator (http://maxchelator.stanford.edu/CaEGTA-TS.htm). PTP opening was indicated by Ca2+ release from mitochondria, which increases the extramitochondrial Ca2+ concentrations monitored by Calcium Green 5-N. Determination of enzyme activities All enzyme activities were measured in homogenates from isolated mitochondria and also in the cytosolic supernatant (data not shown) and performed as duplicates using a Beckman DU 730 UV-VIS spectrophotometer in a 1-ml reaction volume at room temperature. Isocitrate dehydrogenase 2 (IDH2) The activity of isocitrate dehydrogenase 2 (IDH2) was measured in a reaction mixture containing (in mM) Tris–HCl 10 (pH 8.0), NADP+ 0.2, MgCl2 5, and isocitrate 2. The reaction was initiated by the addition of 40 µg mitochondrial or cytosolic protein and the change in absorbance was monitored at 340 nm for 15 min. Malic enzyme (MEP) The activity of malic enzyme (malate dehydrogenase; MEP) was measured in a reaction mixture containing (in mM) Tris–HCl 50 (pH 7.4), NADP+ 0.2, MgCl2 5, and malate 2. The reaction was initiated by the addition of 100 µg mitochondrial or cytosolic protein and the change in absorbance was monitored at 340 nm for 15 min. Nicotinamide nucleotide transhydrogenase (Nnt) The activity of the Nnt was measured in a reaction mixture containing (in mM) Tris–HCl 50 (pH 8.0), NADPH/H+ 0.3, APAD 0.3 and 0.5% Brij-35. The reaction was initiated by the addition of 100 µg mitochondrial or cytosolic protein and the change in absorbance was monitored at 375 nm for 15 min. GSH/GSSG measurements Sample preparation Pieces of left ventricle were minced in 300 µl isolation buffer (pH 7.4), containing (in mM) K2HPO4 106.1, KH2PO4 18.7, EDTA 6.3 with an electrical homogenizer MICCRA D-1 (Art, Müllheim, Germany). For determination of oxidized glutathione (GSSG), an additional piece of left ventricle was taken and 3 mM of 1-methyl-2-vinylpyridine was added to the isolation buffer for derivatization of reduced glutathione (GSH) before homogenization. After one freeze/thaw cycle to break up mitochondria, the protein content in (whole) heart lysate was determined by the method of Lowry (Lowry et al., 1951).

Determination of glutathione levels Total glutathione was quantified as described previously (Rahman et al., 2006) in a reaction mixture (1ml) containing 0.6 mM of the sulfhydryl reagent 5,5′-dithio-bis(2-nitrobenzoic acid) (DTNB), 0.4 mM NADPH and 1.8 U glutathione reductase, with minor modifications. In particular, sulfosalicylic acid was omitted to obtain a better signal to noise-ratio (own observations). 50 and 500 µg of protein were used for measurements of total glutathione and GSSG, respectively. Reduced GSH content was calculated as the difference between total glutathione minus the values obtained for GSSG. All results were expressed as nmol/mg protein according to the rate determination of calibration curves. The GSH-dependent reduction of DTNB was monitored at 412 nm for 10 min.
Isolation of other cell types and tissues Isolation of cardiac fibroblasts The ventricles were minced with scissors in the resulting cell suspension, filtered (diameter 70 µm) and sedimented for 10 min. The supernatant was centrifuged (800 U, 1 min). The resulting pellet containing cardiomyocytes was resuspended in 200 µl standard lysis buffer (SLP, see chapter “western blot analysis”, lysis buffer plus 100µM PMSF) and frozen at -80°C. For further homogenization, cardiac myocytes were exposed to four push/pull cycles via 27 G x ¾ “syringe before western blot analysis. After centrifugation of the supernatant (1100 rpm, 10 min) the resulting pellet, mainly containing fibroblasts, was resuspended in 10 ml of medium (M199 GlutaMAXTM, 10 mM HEPES, 5% FCS, 1% Pen/Strep) and transferred to a 10 cm petri-dish, which was coated with 1% gelatine at least 1-2 h before and incubated at 37°C and 5% CO2 in a humidified atmosphere for 2h. Afterwards, non-adherent cells were removed by aspirating medium and cells were cultured with 15 ml fresh medium which was changed every two days. When dishes reached 80% confluence, cells were passaged (2.5 ml Trypsin at 70 mg/ml, 3 min at 37°C, stop by 2.5 ml medium, 1000 U, 3 min). The supernatant was discarded, the pellet resuspended in 5 ml medium and split to 1.7 ml in 3 new dishes, containing 15 ml of medium, respectively. When reaching 80% confluence, cells were split to 3 new dishes, and when again, 80% confluence were obtained, cells were pooled. Medium was aspirated, cells washed with 2 ml cooled PBS and cells scraped in 1 ml PBS. After centrifugation (3000 rpm, 5 min, 4°C), the pellet was resuspended in 50 µl SLP and rigorously vortexed for 15 min. After centrifugation (14000 rpm, 15 min, 4°C) the supernatant was kept for Western blot analysis. Isolation of pancreatic islets Pancreatic islets were isolated from mice by collagenase digestion as described previously (Hoy et al., 2002). The pancreas was removed quickly and pancreatic islets were isolated by collagenase digestion. The islets were dispersed into single cells by shaking in Ca2+-free solution, and the resulting cell suspension was plated on Petri dishes. The cells were maintained

in RPMI 1640 medium supplemented with 10% FCS 100 and 1% Pen/Strep. For enzymatic measurements, cells were minced in a 0.5 ml homogenizer with a glass pestle. Molecular biology Reverse Transcription and TaqMan-PCR RNA was prepared from mouse LV-tissues using peqGold TriFast (PeqLab, Erlangen, Germany) extraction reagent per manufacture´s protocol. For cDNA preparation, 2 µg of RNA were digested with DNAse (Peqlab, Erlangen) and then reverse transcribed using the HighCap cDNA RT Kit (Applied Biosystems, Darmstadt, Germany) according to the manufacture´s protocol. TaqMan PCR was conducted in a StepOne plus thermocycler (Applied Biosystems, Germany) using TaqMan GenEx Mastermix (Applied Biosystems, #4369016). Signals were normalized to corresponding glyceraldehyde-3-phosphate dehydrogenase (GAPDH) controls. “No template” controls were used to monitor for contaminating amplifications. The ∆Ct was used for statistical analysis and 2−∆∆Ct for data presentation. Probes used to amplify the transcripts were as follows (purchased by Applied Biosystems):
• Nppa (ANP; Mm01255747_g1) • Nppb (BNP; Mm01255770_g1) • CTGF (Mm01192932_g1) • GAPDH (Mm99999915_g1).
Gene array experiments For global gene expression analysis total RNA samples (prepared from mouse LV-tissue using Qiagen RNeasy Tissue Kit (Cat. No. 74704) following the manufacture´s protocol) were processed using the Affymetrix GeneChip Mouse Gene 1.0 ST Array. Briefly, 200 ng of total RNA was used to generate amplified and biotinylated sense-strand DNA using the Whole Transcript (WT) Expression Kit (Ambion, Darmstadt, Germany) and the Affymetrix GeneChip WT Terminal Labeling kit according the manufacturer´s protocols. Biotinylated cRNA was hybridized to a single GeneChip at 45°C for 16-18 hours. After hybridization, GeneChips were washed and stained using the GeneChip Wash and Stain Kit (Affymetrix, UK) according to the manufacturer’s Expression Wash and Stain Protocol. GeneChips were scanned using the Affymetrix GeneChip scanner. Pre-processing, quality control and differential expression analyses were performed using R/Bioconductor (Gentleman et al., 2004). Raw expression intensities were normalized, log2-transformed and summarized on gene level by robust-multiarray-average (RMA) method of the XPS package (http://bioc.ism.ac.jp/2.8/bioc/html/xps.html). Only genes with detection above background (DABG) p-value ≤ 0.01 in at least ten of 15 samples were included, leaving 17,212 genes for analyses. Differential expression for each gene was calculated using LIMMA function lmFit (Smyth, 2005). The FDR-based Benjamini-Hochberg method (Benjamini and Hochberg, 1995) was used to account for multiple testing and only genes with a corrected p-value ≤ 0.05 and an absolute fold change ≥ 2 were considered significant.

Western blot analyses Tissue was homogenized in lysis buffer (Tric-HCl 100 mM, Sodium dodecyl sulfate (SDS) 4%, glycine 20%) containing complete protease inhibitors (Roche, Germany) and phosphatase inhibitors (Roche, Germany). The homogenate was centrifuged at 16.000g for 20 min. 50 µg of protein was separated on 8-12% SDS-PAGE and electrophoretically transferred to nitrocellulose membranes (0.2 µm pore size, Schleicher and Schuell, Dassel, Germany). Membranes were blocked in Tris-buffered saline (TBS) containing 5% nonfat dry milk for 120 min at room temperature and exposed to the following primary antibodies:
• anti-Nnt (kindly provided by Ting-Ting Huang, Stanford University, CA, USA) • anti-cardiac calsequestrin (Santa Cruz; sc-28275) • anti-prolyl-4 hydroxylase (P4BH; Acris, AF110-1) • anti-Cox4 (Abcam, 20E8) • anti-Peroxiredoxin-SO3 (ABfrontier, LF-PA0004) • anti-glyceraldehyde-3-phosphate dehydrogenase (GAPDH; Millipore, MAB374).
Secondary antibodies,
• goat anti-rabbit (Sigma-Aldrich, Deisenhofen, Germany; 1:2500) • goat anti-mouse (170-6516 Bio-Rad, Germany; 1:2500) and • rabbit anti-goat (172-1034, Bio Rad, Germany; 1:5000)
were incubated for 60 min at room temperature. Proteins were visualized by enhanced chemiluminescence according to the manufacturer´s guidelines (Amersham Pharmacia Biotech, Freiburg, Germany). If necessary, membranes were stripped and re-probed under following conditions: Membrane was stripped twice for 15 minutes at 56°C using stripping buffer (62.5 mM Tris-HCl, pH 6.8; 2% SDS, 280 µl of 2-β-mercaptoethanol or a final concentration of 0.1 M 2-β-mercaptoethanol), then thoroughly washed with 1xPBS (in mM: NaCl 170, KCl 33, Na2HPO4 40 and KH2PO4 18, pH 7.2) for at least one hour and blocked again in Tris-buffered saline (TBS) containing 5% nonfat dry milk for 120 min at room temperature. Autoradiographs were quantified by imaging densitometry and analyzed by the „ImageQuant-TM“ Software (Image Quant, Molecular Dynamics, Krefeld, Germany). Data are presented as intensity optical density (IOD). There were no differences between groups in control genes and proteins. Peroxiredoxin dimerization Proteins from mouse LV myocardium were extracted using NP-40 lysis buffer (50 mM Tris-HCL pH 8.0, 137 mM NaCl, 10 % Glycerol, 1 % NP-40, 2 mM EDTA) containing 100 mM NEM (Sigma-Aldrich; E3876-5G) and complete mini protease inhibitor cocktail (Roche, Mannheim, Germany). 50 µg of homogenized proteins were separated on a non-reducing 12% SDS-PAGE and afterwards transferred to a nitrocellulose membrane (BioRad, Germany). The membrane was blocked using 5% non-fat dried milk in Tris-buffered saline with 0.1% Tween for at least 2 hours and incubated at 4°C overnight using a primary antibody directed against peroxiredoxin III (Abfrontier, LF-PA0030) and anti-glyceraldehyde-3-phosphate dehydrogenase (GAPDH; Millipore, MAB374). Bands were detected using goat-anti-rabbit or goat-anti-mouse horseradish

peroxidase using enhanced chemiluminescence reagents (Amersham Pharmacia Biotech, Freiburg, Germany) and visualized and analyzed using the Fusion SL gel documentation system (Peqlab, Germany). For the reduced control, 200 mM DTT was added to the lysis buffer (without NEM) and proteins were isolated as described.
Synaptosome detection 50 µg of proteins from mouse brain homogenate was separated on an 8% SDS-PAGE and electrophoretically transferred to nitrocellulose membranes (0.2 µm pore size, Schleicher and Schuell, Dassel, Germany). Membranes were blocked in Tris-buffered saline (TBS) containing 5% nonfat dry milk for 120 min at room temperature and exposed to the following primary antibodies:
• anti-Synapsin 1 (Santa Cruz, sc376623) • anti-Cox4 (Abcam, 20E8)
The secondary antibody
• goat anti-mouse (170-6516 Bio-Rad, Germany; 1:2500) was incubated for 60 min at room temperature. Proteins were visualized by enhanced chemiluminescence according to the manufacturer´s guidelines (Amersham Pharmacia Biotech, Freiburg, Germany) and analyzed using the Fusion SL gel documentation system (Peqlab, Germany). Tissue morphometry Cardiomyocyte size For morphometric analyses, LV tissue sections (3 µm) were examined. Mean cardiomyocyte transverse diameter was determined on photographs taken from hematoxylin and eosin (H&E) stained sections according to standard protocols at 1000x magnification using a Nikon E600 microscope (Nikon, Düsseldorf, Germany) and the Lucia G Software (version 4.81, Nikon, Germany). The transverse diameter of at least 100 cardiomyocytes was measured in more than four different random areas of the section. In each group at least 7 hearts were examined (1 section per heart). Fibrosis To examine the degree of fibrosis, picrosirius red staining was performed as described previously (Seeland et al., 2007). The samples were examined and photographed at 100x magnification with a Nikon E600 microscope. Ten fields in the middle third of the myocardium were evaluated. Analysis and quantification of total interstitial fibrillar collagen content was evaluated as fractional area of collagen content in % of myocardial tissue with the digital image software Lucia G. In each group at least 7 hearts were examined (1 section per heart). All sections were examined under a Nikon E600 microscope.

Necrotic cell death For the detection of necrosis, Evans blue was administered one day before sacrifice via i.p.-injection of 100 µl (16.7 mg/ml, solved in 0.9% NaCl) of the Evans Blue-solution the day before the mouse was sacrificed. Evans blue fluorescence was analyzed at 540 nm excitation and 605 nm emission, and fluorescent areas were quantified on frozen sections using ImageJ and related to the total area of the left ventricle. 8-hydroxy-2'-deoxyguanosine (8-OHdG) staining For pre-treatment slices with 3 µm thick deparaffinised sections were placed in Coplin jars with 0.05% citraconic anhydride solution, pH 7.4 for 1 hour at +98°C and then incubated overnight at 4°C with the first antibody, followed by the appropriate secondary antibody at 37°C for 40 minutes. Immunofluorescence studies were performed by applying polyclonal antibody against 8-OHdG (abcam, ab10802, UK), diluted 1:300 with citrate buffer to detect hydroxyl radical-induced DNA oxidation as a sensitive and stable index of oxidative stress in cells. Monoclonal antibody against α-sarcomeric actin (clone5c5, Sigma-Aldrich, USA) was used to detect cardiomyocytes. FITC- and TRITC-conjugated anti-goat IgG and anti-mouse IgM, (all Dianova, Germany) were used as secondary antibodies. To perform wash steps, 4xSSC buffer was used. Sections were counterstained with DAPI (Calbiochem, Germany) and mounted with fluorescent mounting medium (Vectashield, Vector Laboratories, Burlingame, CA, USA) for fluorescence microscopic analysis. All sections were evaluated using a Nikon E600 epifluorescence microscope (Nikon, Germany) with appropriate filters. Reactive Agents All agents were of highest grade and obtained from Sigma (Taufkirchen, Germany) unless indicated otherwise.

Supplemental References Barger, J.L., Brand, M.D., Barnes, B.M., and Boyer, B.B. (2003). Tissue-specific depression of mitochondrial proton leak and substrate oxidation in hibernating arctic ground squirrels. Am J Physiol Regul Integr Comp Physiol 284, R1306-1313. Benjamini, Y., and Hochberg, Y. (1995). Controlling the false discovery rate: a practical and powerful approach to multiple testing. J R Stat Soc 85, 289–300. Bhushan, S., Kondo, K., Polhemus, D.J., Otsuka, H., Nicholson, C., Tao, Y.X., Huang, H., Georgiopoulou, V.V., Murohara, T., Calvert, J.W., et al. (2014). Nitrite Therapy Improves Left Ventricular Function During Heart Failure via Restoration of Nitric Oxide (NO) Mediated Cytoprotective Signaling. Circ Res 114, 1281-91 Blacker, T.S., Mann, Z.F., Gale, J.E., Ziegler, M., Bain, A.J., Szabadkai, G., and Duchen, M.R. (2014). Separating NADH and NADPH fluorescence in live cells and tissues using FLIM. Nature Commun 5, 3936. Borutaite, V., Mildaziene, V., Brown, G.C., and Brand, M.D. (1995). Control and kinetic analysis of ischemia-damaged heart mitochondria: which parts of the oxidative phosphorylation system are affected by ischemia? Biochim Biophys Acta 1272, 154-158. Brown, G.C., and Brand, M.D. (1985). Thermodynamic control of electron flux through mitochondrial cytochrome bc1 complex. Biochem J 225, 399-405. Byrne, J.A., Grieve, D.J., Bendall, J.K., Li, J.M., Gove, C., Lambeth, J.D., Cave, A.C., and Shah, A.M. (2003). Contrasting roles of NADPH oxidase isoforms in pressure-overload versus angiotensin II-induced cardiac hypertrophy. Circ Res 93, 802-805. Chappell, J.B., and Perry, S.V. (1954). Biochemical and osmotic properties of skeletal muscle mitochondria. Nature 173, 1094-1095. Dai, D.F., Hsieh, E.J., Chen, T., Menendez, L.G., Basisty, N.B., Tsai, L., Beyer, R.P., Crispin, D.A., Shulman, N.J., Szeto, H.H., et al. (2013). Global proteomics and pathway analysis of pressure-overload-induced heart failure and its attenuation by mitochondrial-targeted peptides. Circ Heart Fail 6, 1067-1076. Dai, D.F., Hsieh, E.J., Liu, Y., Chen, T., Beyer, R.P., Chin, M.T., MacCoss, M.J., and Rabinovitch, P.S. (2012). Mitochondrial proteome remodelling in pressure overload-induced heart failure: the role of mitochondrial oxidative stress. Cardiovasc Res 93, 79-88. Date, M.O., Morita, T., Yamashita, N., Nishida, K., Yamaguchi, O., Higuchi, Y., Hirotani, S., Matsumura, Y., Hori, M., Tada, M., et al. (2002). The antioxidant N-2-mercaptopropionyl glycine attenuates left ventricular hypertrophy in in vivo murine pressure-overload model. J Am Coll Cardiol 39, 907-912. Gentleman, R.C., Carey, V.J., Bates, D.M., Bolstad, B., Dettling, M., Dudoit, S., Ellis, B., Gautier, L., Ge, Y., Gentry, J., et al. (2004). Bioconductor: open software development for computational biology and bioinformatics. Genome Biol 5, R80. Grieve, D.J., Byrne, J.A., Siva, A., Layland, J., Johar, S., Cave, A.C., and Shah, A.M. (2006). Involvement of the nicotinamide adenosine dinucleotide phosphate oxidase isoform Nox2 in

cardiac contractile dysfunction occurring in response to pressure overload. J Am Coll Cardiol 47, 817-826. Hoy, M., Efanov, A.M., Bertorello, A.M., Zaitsev, S.V., Olsen, H.L., Bokvist, K., Leibiger, B., Leibiger, I.B., Zwiller, J., Berggren, P.O., et al. (2002). Inositol hexakisphosphate promotes dynamin I- mediated endocytosis. Proc Natl Acad Sci U. S. A. 99, 6773-6777. Kaludercic, N., Takimoto, E., Nagayama, T., Feng, N., Lai, E.W., Bedja, D., Chen, K., Gabrielson, K.L., Blakely, R.D., Shih, J.C., et al. (2010). Monoamine oxidase A-mediated enhanced catabolism of norepinephrine contributes to adverse remodeling and pump failure in hearts with pressure overload. Circ Res 106, 193-202. Kohlhaas, M., Liu, T., Knopp, A., Zeller, T., Ong, M.F., Böhm, M., O'Rourke, B., and Maack, C. (2010). Elevated cytosolic Na+ increases mitochondrial formation of reactive oxygen species in failing cardiac myocytes. Circulation 121, 1606-1613. Kohlhaas, M., and Maack, C. (2010). Adverse bioenergetic consequences of Na+-Ca2+ exchanger-mediated Ca2+ influx in cardiac myocytes. Circulation 122, 2273-2280. Kuroda, J., Ago, T., Matsushima, S., Zhai, P., Schneider, M.D., and Sadoshima, J. (2010). NADPH oxidase 4 (Nox4) is a major source of oxidative stress in the failing heart. Proc Natl Acad Sci U. S. A. 107, 15565-15570. Lowry, O.H., Rosebrough, N.J., Farr, A.L., and Randall, R.J. (1951). Protein measurement with the Folin phenol reagent. J Biol Chem 193, 265-275. Maytin, M., Siwik, D.A., Ito, M., Xiao, L., Sawyer, D.B., Liao, R., and Colucci, W.S. (2004). Pressure overload-induced myocardial hypertrophy in mice does not require gp91phox. Circulation 109, 1168-1171. Mela, L., and Seitz, S. (1979). Isolation of mitochondria with emphasis on heart mitochondria from small amounts of tissue. Methods Enzymol 55, 39-46. Patel, V.B., Wang, Z., Fan, D., Zhabyeyev, P., Basu, R., Das, S.K., Wang, W., Desaulniers, J., Holland, S.M., Kassiri, Z., et al. (2013). Loss of p47phox subunit enhances susceptibility to biomechanical stress and heart failure because of dysregulation of cortactin and actin filaments. Circ Res 112, 1542-1556. Rahman, I., Kode, A., and Biswas, S.K. (2006). Assay for quantitative determination of glutathione and glutathione disulfide levels using enzymatic recycling method. Nat Protocols 1, 3159-3165. Reil, J.C., Hohl, M., Oberhofer, M., Kazakov, A., Kaestner, L., Mueller, P., Adam, O., Maack, C., Lipp, P., Mewis, C., et al. (2010). Cardiac Rac1 overexpression in mice creates a substrate for atrial arrhythmias characterized by structural remodelling. Cardiovasc Res 87, 485-493. Seeland, U., Selejan, S., Engelhardt, S., Muller, P., Lohse, M.J., and Bohm, M. (2007). Interstitial remodeling in beta1-adrenergic receptor transgenic mice. Basic Res Cardiol 102, 183-193. Smyth, G.K. (2005). limma: Linear Models for Microarray Data. In Bioinformatics and Computational Biology Solutions Using R and Bioconductor, R. Gentleman, V. Carey, W. Huber, R. Irizarry, and S. Dudoit, eds. (Springer New York), pp. 397-420.

Takimoto, E., Champion, H.C., Li, M., Ren, S., Rodriguez, E.R., Tavazzi, B., Lazzarino, G., Paolocci, N., Gabrielson, K.L., Wang, Y., et al. (2005). Oxidant stress from nitric oxide synthase-3 uncoupling stimulates cardiac pathologic remodeling from chronic pressure load. J Clin Invest 115, 1221-1231. Wei, A.C., Aon, M.A., O'Rourke, B., Winslow, R.L., and Cortassa, S. (2011). Mitochondrial energetics, pH regulation, and ion dynamics: a computational-experimental approach. Biophys J 100, 2894-2903. Xu, X., Hu, X., Lu, Z., Zhang, P., Zhao, L., Wessale, J.L., Bache, R.J., and Chen, Y. (2008). Xanthine oxidase inhibition with febuxostat attenuates systolic overload-induced left ventricular hypertrophy and dysfunction in mice. J Card Fail 14, 746-753. Zhang, M., Brewer, A.C., Schroder, K., Santos, C.X., Grieve, D.J., Wang, M., Anilkumar, N., Yu, B., Dong, X., Walker, S.J., et al. (2010). NADPH oxidase-4 mediates protection against chronic load-induced stress in mouse hearts by enhancing angiogenesis. Proc Natl Acad Sci U. S. A. 107, 18121-18126.
Copyright © 2022 FDOKUMEN