MATERIALS ABOUT LATVIAN FAUNA OF CARRION BEETLES (COLEOPTERA: SILPHIDAE)
Upload
independentCategory
view
5download
0
Phil. Trans. R. Soc. B (2005) 360, 1925–1933
doi:10.1098/rstb.2005.1724
DNA-based species delineation in tropical beetlesusing mitochondrial and nuclear markers
Published online 12 September 2005
Michael T. Monaghan1,2, Michael Balke1,†,
T. Ryan Gregory3 and Alfried P. Vogler1,2,*
One con
*Autho† Presenstrasse 2
1Department of Entomology, Natural History Museum, Cromwell Road, London SW7 5BD, UK2Division of Biology, Imperial College London, Silwood Park Campus, Ascot SL5 7PY, UK
3Department of Integrative Biology, University of Guelph, Guelph, Ontario, Canada N1G 2W1
DNA barcoding has been successfully implemented in the identification of previously describedspecies, and in the process has revealed several cryptic species. It has been noted that such methodscould also greatly assist in the discovery and delineation of undescribed species in poorly studiedgroups, although to date the feasibility of such an approach has not been examined explicitly. Here,we investigate the possibility of using short mitochondrial and nuclear DNA sequences to delimitputative species in groups lacking an existing taxonomic framework. We focussed on poorly knowntropical water beetles (Coleoptera: Dytiscidae, Hydrophilidae) from Madagascar and dung beetles(Scarabaeidae) in the genus Canthon from the Neotropics. Mitochondrial DNA sequence variationproved to be highly structured, with O95% of the observed variation existing between discrete sets ofvery closely related genotypes. Sequence variation in nuclear 28S rRNA among the same individualswas lower by at least an order of magnitude, but 16 different genotypes were found in water beetlesand 12 genotypes in Canthon, differing from each other by a minimum of two base pairs. Thedistribution of these 28S rRNA genotypes in individuals exactly matched the distribution of mtDNAclusters, suggesting that mtDNA patterns were not misleading because of introgression. Moreover, ina few cases where sequence information was available in GenBank for morphologically definedspecies of Canthon, these matched some of the DNA-based clusters. These findings demonstrate thatclusters of close relatives can be identified readily in the sequence variation obtained in field collectedsamples, and that these clusters are likely to correspond to either previously described or unknownspecies. The results suggest that DNA-assisted taxonomy will not require more than a short fragmentof mtDNA to provide a largely accurate picture of species boundaries in these groups. Applied on alarge scale, this DNA-based approach could greatly improve the rate of species discovery in the largeassemblages of insects that remain undescribed.
Keywords: taxonomy; large subunit ribosomal RNA; Madagascar; DNA barcoding;cox1; COI
1. INTRODUCTIONA reliable and accessible classification of species isfundamental to research in ecology, evolutionarybiology, biodiversity and conservation biology. Whileca 1.5 million species have been described to date, thisrepresents only a fraction of the actual diversity onEarth (Tudge 2000; Wilson 2003). Owing to theconstant threat of biodiversity loss, there is anincreasingly urgent need to accelerate the pace ofspecies discovery and taxonomic databasing (Godfray2002). Even the routine identification of known speciescan be difficult, often requiring highly specializedknowledge and representing a limiting factor inecological studies and biodiversity inventories. Inresponse, recent proposals have called for a moreprominent role of efficient DNA-based methods in thedelineation and identification of species (Blaxter 2004;
tribution of 18 to a Theme Issue ‘DNA barcoding of life’.
r for correspondence ([email protected]).t address: Zoologische Staatssammlung, Muenchhausen-1, 81247 Munich, Germany.
1925
Floyd et al. 2002; Hebert et al. 2003a; Tautz et al.2003). Reactions to such proposals have ranged widely,
from strongly supportive ( Janzen 2004; Proudlove &
Wood 2003; Stoeckle 2003) to vigorously opposed
(Lipscomb et al. 2003; Seberg et al. 2003; Wheeler
2004; Will & Rubinoff 2004). The use of DNA-based
methods for the delineation and discovery of new
species, and thus their broader role in taxonomy,
represents an especially contentious issue in this regard.
Unfortunately, much of this debate has remained
rhetorical, with limited empirical assessment of the
benefits and limitations of a DNA-assisted programme
of species discovery.
The objective of any method of species delinea-
tion, including DNA-based approaches, is to identify
reproductively isolated groups of organisms that
warrant classification as distinct species. It is widely
acknowledged, and reflected in the Linnaean taxo-
nomic system, that living organisms fall into largely
discrete groupings recognizable by differences in
morphology or other traits. It is then the role of
taxonomy to define and name these groupings.
q 2005 The Royal Society
1926 M. T. Monaghan and others Species delineation in tropical beetles
However, their recognition may be difficult because
diagnostic traits are lacking, or species divergencesare very small. Hence, even for cases of biologically
distinct species, their delineation will depend on thethoroughness of study and the interpretation of
complex, sometimes variable traits. Further, theaccuracy of species delineation depends on the degree
of sampling, as local variation may affect theconclusions about population separation (Davis &
Nixon 1992).To date, DNA barcoding studies have focussed on
the identification of pre-defined species (e.g. Hebertet al. 2003a, 2004b; Hogg & Hebert 2004; Vences et al.2005; Smith et al. 2005, etc.), and have yet to address
the issue of species delineation per se. However, wheremore than a single individual per species has been
sequenced, a minimum threshold of approximatelyone-tenth of the average p-distance found between
well-established species in a lineage has been inter-preted as intra-specific variation, while greater diver-
gences are thought to indicate misidentifications ofspecimens or overlooked cryptic species (Hebert et al.2004a). These cut-off values roughly correspond tomaximum intra-specific divergences in mtDNA of
1–2%, and at the upper bound of this range mayinclude several geographically defined ‘phylogroups’
(Avise & Walker 1999).The discovery of new, cryptic species from existing,
morphologically indiscriminate groups using DNA isneither controversial nor novel (Knowlton 1993), and
potential taxonomic revisions inspired by DNAbarcoding results have been typically left to experts to
resolve on the basis of morphology, behaviour andother features (Hebert et al. 2004b). It is to be expected
that a successful global DNA barcoding program
would provide a comprehensive barcoding inventoryfor a majority of described taxa in the foreseeable
future, facilitating the systematic discovery of crypticspecies. However, with 85% or more of species still
unknown to science, a much greater challenge lies inthe potential application of DNA-based methods to the
discovery and delineation of new species in poorlycharacterized taxa.
To explore the utility of DNA-based approaches tospecies recognition in poorly known groups, we
evaluated patterns of variation in both mitochondrialand nuclear genes in a broad sample of water beetles
collected from Madagascar. These samples exhibitedan unknown level of species diversity within the families
Dytiscidae and Hydrophilidae. Using the samemethods, we also examined specimens from a single
genus of Neotropical dung beetles (Canthon). Speci-mens were collected from various localities in the
Neotropics, comprising an unknown number of species
in a group that is acknowledged to present difficultiesfor morphological discrimination. The analysis shows
that sequences cluster into cohesive, well-differentiatedgroups, and identical groups are recovered by both
nuclear and mitochondrial markers. Based on multiplelines of evidence, these DNA-based clusters are taken
to represent putative species boundaries and couldassist with the assembly of a framework for the
taxonomy of poorly studied lineages.
Phil. Trans. R. Soc. B (2005)
2. METHODS(a) Field sampling, selection of specimens and DNA
sequencing
Water beetles (Dytiscidae and Hydrophilidae) were collected
at five sites in the North and central parts of Madagascar as
part of a survey of insect biodiversity in 2004 (Monaghan
et al., unpublished). Specimens were collected by sieving
through small stream pools, ponds, and packs of leaf litter,
and were sorted under a dissecting microscope (10!) into
externally distinct morphological groups. Between two and
five individuals from each group and each locality were
selected for DNA analysis, as a representative sample of the
variation of this group. This initial morphological treatment
was superficial and was intended to maximize the disparity
included in the subset of samples used for sequencing.
Specimens of Canthon were obtained using baited pitfall traps
from locations in Belize, French Guyana, Ecuador and Costa
Rica between 1997 and 2001 (Inward 2003). Additional
samples were collected from Belize in 2004 (L. Powell, MSc,
Imperial College London, 2004). They were assigned to the
genus Canthon based on a phylogenetic analysis combining
them with unpublished sequences for most major groups of
Scarabaeinae that also included five species of Canthon:
C. doesburgi, C. indigaceus, C luteicollis, C. smaragdulus and
C. viridis, plus the closely related Scybalocanthon pygidialis
(GenBank accessions: AY131633-7 for 28S, AY131814-7 for
cox1, plus AY131673 and AY131849 for Scybalocanthon).
Genomic DNA extraction was performed using Wizard SV
96-well plates (Promega, UK). For both groups, a ca 700 bp
fragment of 28S rRNA was amplified using primers FF and
DD (Inward 2003). Fragments of cox1 were amplified with
primers Pat and Jerry (Simon et al. 1994) forCanthon (800 bp)
or with LCO1490 and HCO2198 (Folmer et al. 1994) for
water beetles (660 bp). Sequencing was performed in both
directions using a BIGDYE v. 2.1 terminator reaction with the
same primers used for PCR. Sequences were analysed on an
ABI3730 automated sequencer and forward and reverse
strands were assembled in SEQUENCHER software. The 28S
fragment was length-variable and was aligned separately for
the two datasets using BLASTALIGN (Belshaw & Katzourakis
2005). Cox1 was not length-variable for either group.
(b) Tree construction
Parsimony trees were obtained with PAUP v. 4b10 (Swofford
2002), with gap characters treated as a ‘fifth character state’,
and branch length optimized under accelerated transform-
ation. Heuristic searches were performed using TBR branch
swapping and 100 replicates. We performed 1000 random
addition replicates saving only a single tree in each case.
Because the dataset contained many identical or very similar
haplotypes, a large number of trees were found, one of which
was selected arbitrarily for further analysis. To calculate
Bremer Support (Bremer 1994), constraint files for parsi-
mony searches enforcing the absence of the focal nodes were
produced with TREEROT v. 2.0a. Bremer Support values of 0
indicate unresolved nodes which would be collapsed in a strict
consensus of all shortest trees. Trees were rooted with
sequences from related Carabidae taken from GenBank in
the case of water beetles, and using a sequence from the
Canthon dataset generated here for rooting the 28S tree. The
single species of Scybalocanthon was used as the outgroup to
root the tree of Canthon.
(c) Variation in cox1
We examined cox1 variation within and among clusters of
sequences (see §3) using analysis of molecular variance
670590670591670592670593670594670602670603670604670606
670608670609670610670611670612
670627670628670630670631
670614670615670616670617
670548670549670613
670629670557670558670559670560670561670607670632
670620670626670633670635670636670637
670571670572
670640670578670579670580670581670582
670567670595670550670551670552670553670554670556
670573670574670575670576670577
670583668557 Canthon
Aphodius peruanus
5 changes
4
3
1
0
1
1
4
5
8
22
4
2
2
5
3
5
4
8
00
0
0
WB-1
670608670610
670612670609670611
670614670615670616670617670618
670602670603670604670605670606670597670598670599670600
670596670627
670628670630
670629670557670558670559670560670561670607670621670622670623670624
670633670634670626
670619670620
670601670585670586670588670589670587
670584670568670569670570670571670572
670550670551670552670554670555670556
670573670575
670574670576
670581670582
670579670580
670583670595
670565670566
670563670564670562
Scaphinotus ridingsiLeptocarabus
5 changes
1
14
1
10
10
2
10
0
0
0
0
1
0
0
1
21
3
2
1
112
0
0
0
1
WB-2
WB-3
WB-4
WB-5
WB-6
WB-7
WB-8
WB-9
WB-10WB-11
WB-12
WB-13
WB-14
WB-15
WB-1
WB-2
WB-3670548
670549670547
WB-4
WB-5WB-6
WB-9
WB-13
WB-12
WB-16
WB-14
WB-15
WB-16
WB-7
WB-18
WB-20
WB-22
WB-17
WB-19
WB-21
13
24
21
9
5
15
25
10
1110
24
21
31
22
19
22
(a) (b)
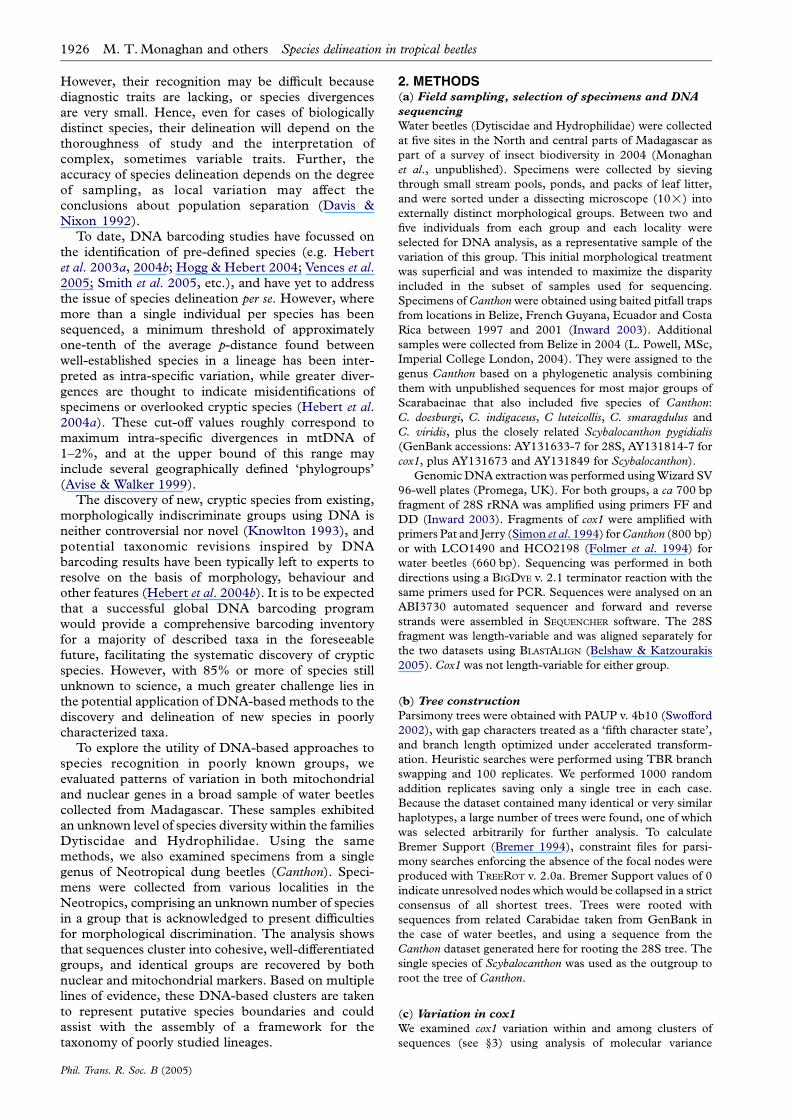
Figure 1. Parsimony trees for water beetles using 28S (a) and cox1 (b) sequences. Cluster names are given to the right of groups.Italics in 28S denote groups for which no cox1 data were available, and vice versa. Bremer Support values (see table 2) arereported above branches.
Species delineation in tropical beetles M. T. Monaghan and others 1927
(AMOVA) (Excoffier et al. 1992) of pairwise differences as
implemented in ARLEQUIN v.2.000 (Schneider et al. 2000). We
used a two-level hierarchical analysis to partition total cox1
variation into within-cluster and among-cluster covariance
components. Individuals were included into a single cox1
cluster if they exhibited identical sequences in the 28S gene
(below) or, if no 28S sequence was available for a specimen,
the cox1 sequence grouped within these clusters. The fixation
index calculated among groups (analogous to a population
genetics FST) was tested for significance using ARLEQUIN v.
2.000. Groups with only one representative cox1 sequence
(e.g. WB-6, WB-11, see figure 1) were excluded from analysis
because within-group variation could not be measured.
3. RESULTSA total of 75 and 71 individuals were included in theanalysis of water beetles and Canthon, respectively.Sequencing of 28S rRNA was successful for 63 and 62specimens, and aligned matrices contained 699 and746 characters in the respective groups. In the waterbeetle dataset, we detected 16 different 28S genotypes.Four genotypes were present in only a single individual,and the remaining occurred in groups ranging in sizefrom two to nine individuals (figure 1a). Sequencesdiffered from one another by a minimum of twonucleotides, e.g. an AC insertion separated WB-4 andWB-5 (figure 1a). DNA sequencing for cox1 revealed
Phil. Trans. R. Soc. B (2005)
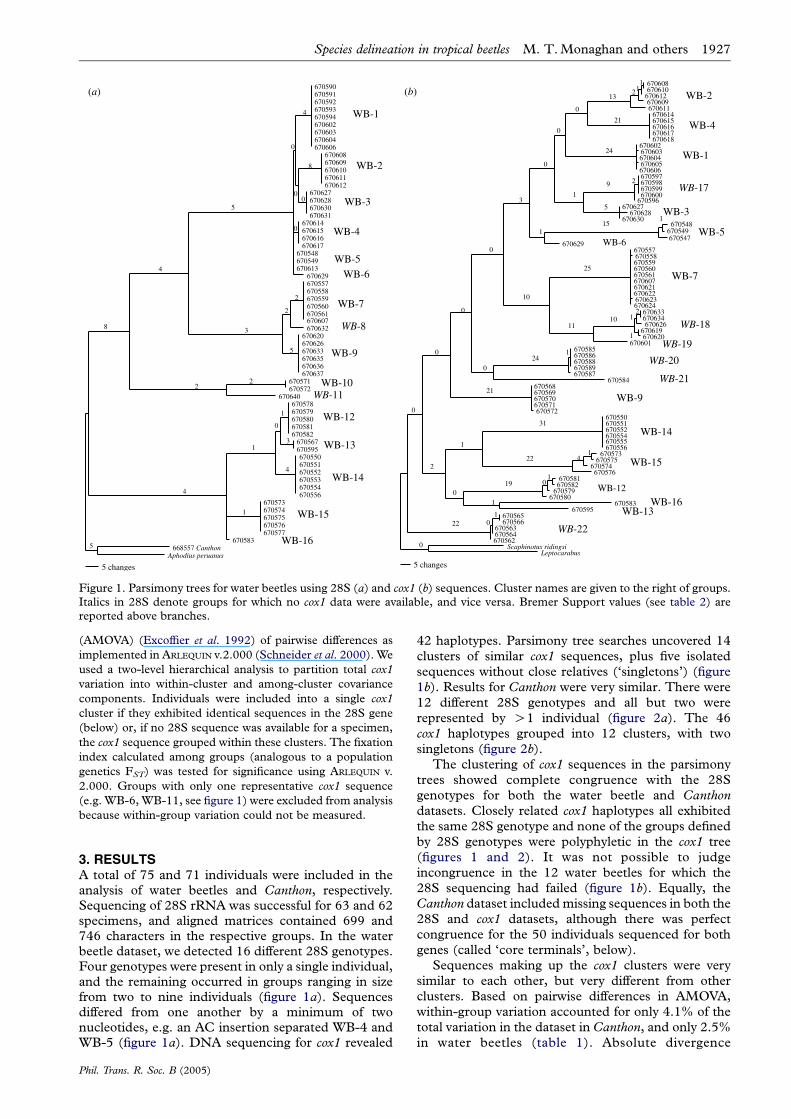
42 haplotypes. Parsimony tree searches uncovered 14clusters of similar cox1 sequences, plus five isolatedsequences without close relatives (‘singletons’) (figure1b). Results for Canthon were very similar. There were12 different 28S genotypes and all but two wererepresented by O1 individual (figure 2a). The 46cox1 haplotypes grouped into 12 clusters, with twosingletons (figure 2b).
The clustering of cox1 sequences in the parsimonytrees showed complete congruence with the 28Sgenotypes for both the water beetle and Canthondatasets. Closely related cox1 haplotypes all exhibitedthe same 28S genotype and none of the groups definedby 28S genotypes were polyphyletic in the cox1 tree(figures 1 and 2). It was not possible to judgeincongruence in the 12 water beetles for which the28S sequencing had failed (figure 1b). Equally, theCanthon dataset included missing sequences in both the28S and cox1 datasets, although there was perfectcongruence for the 50 individuals sequenced for bothgenes (called ‘core terminals’, below).
Sequences making up the cox1 clusters were verysimilar to each other, but very different from otherclusters. Based on pairwise differences in AMOVA,within-group variation accounted for only 4.1% of thetotal variation in the dataset in Canthon, and only 2.5%in water beetles (table 1). Absolute divergence
668557668585668590668593668595668692669464669465669466669467669468
668586668588668589668594668699668700669162669164669165669425669433
669132669135669144669147669275669314669320Canthon viridus
669092669113669116669276669283
669151669273669111
Canthon luteicollis669099669112669134669137
668657668658669435669436669437669452669453669454669455669456669457669458
668671669306669319
669073669078Canthon indigaceus
Scybalocanthon sp.0.5 changes
Can-1
Can-2
Can-3
Can-4
Can-5Can-6
Can-7Can-8
Can-10Can-11
Can-9
Can-12
2
1
1
1
1
1
3
1
2
4
0
1
0
30
1
0
1
1
668557668693668697668698668692
668694668695669464C01
668585669465 C01669163C01
668588668700
669425 C01668586
669162669164
669165668699
668594669433
669078Canthon indigaceus
669073669282
669135669144669147669314669132
669299669275669320
Canthon viridus669092
669276669113
669116669151
669273669111
669306669319
668660668661669435669436669452669453669454669455
669456669457669458668657668658
668671669099
669112Scybalocanthon sp.
5 changes
1
0
1
2
13
2
1
29
9
19
6
7
32
151
25
271
1
1
10
0
21
1
129
4
11
10
1
1
0
Can-3
Can-4
Can-8Can-10
Can-11
Can-6
Can-9
Can-2
Can-1
Can-12
Can-7
Can-13
21
(a) (b)
Canthon luteicollis
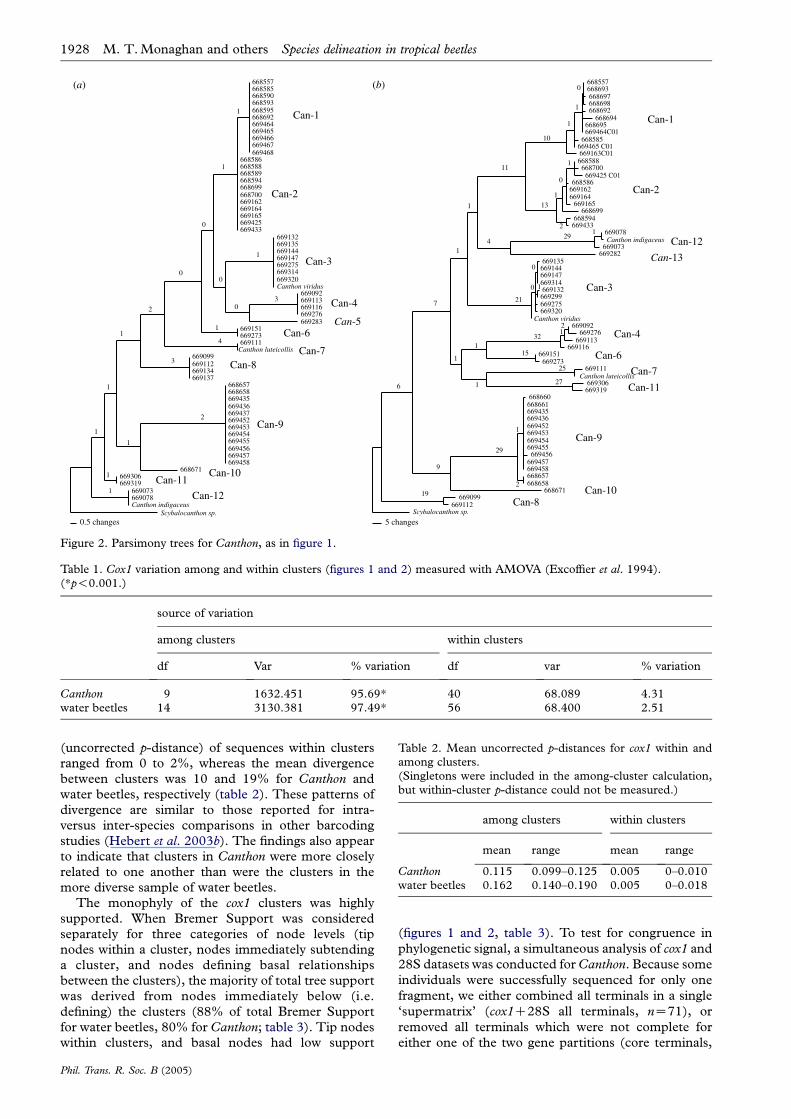
Figure 2. Parsimony trees for Canthon, as in figure 1.
Table 1. Cox1 variation among and within clusters (figures 1 and 2) measured with AMOVA (Excoffier et al. 1994).(*p!0.001.)
source of variation
among clusters within clusters
df Var % variation df var % variation
Canthon 9 1632.451 95.69* 40 68.089 4.31water beetles 14 3130.381 97.49* 56 68.400 2.51
Table 2. Mean uncorrected p-distances for cox1 within andamong clusters.(Singletons were included in the among-cluster calculation,but within-cluster p-distance could not be measured.)
among clusters within clusters
mean range mean range
Canthon 0.115 0.099–0.125 0.005 0–0.010water beetles 0.162 0.140–0.190 0.005 0–0.018
1928 M. T. Monaghan and others Species delineation in tropical beetles
(uncorrected p-distance) of sequences within clustersranged from 0 to 2%, whereas the mean divergence
between clusters was 10 and 19% for Canthon and
water beetles, respectively (table 2). These patterns of
divergence are similar to those reported for intra-
versus inter-species comparisons in other barcoding
studies (Hebert et al. 2003b). The findings also appearto indicate that clusters in Canthon were more closely
related to one another than were the clusters in the
more diverse sample of water beetles.
The monophyly of the cox1 clusters was highly
supported. When Bremer Support was considered
separately for three categories of node levels (tipnodes within a cluster, nodes immediately subtending
a cluster, and nodes defining basal relationships
between the clusters), the majority of total tree support
was derived from nodes immediately below (i.e.
defining) the clusters (88% of total Bremer Support
for water beetles, 80% for Canthon; table 3). Tip nodeswithin clusters, and basal nodes had low support
Phil. Trans. R. Soc. B (2005)
(figures 1 and 2, table 3). To test for congruence in
phylogenetic signal, a simultaneous analysis of cox1 and
28S datasets was conducted for Canthon. Because some
individuals were successfully sequenced for only one
fragment, we either combined all terminals in a single
‘supermatrix’ (cox1C28S all terminals, nZ71), or
removed all terminals which were not complete for
either one of the two gene partitions (core terminals,
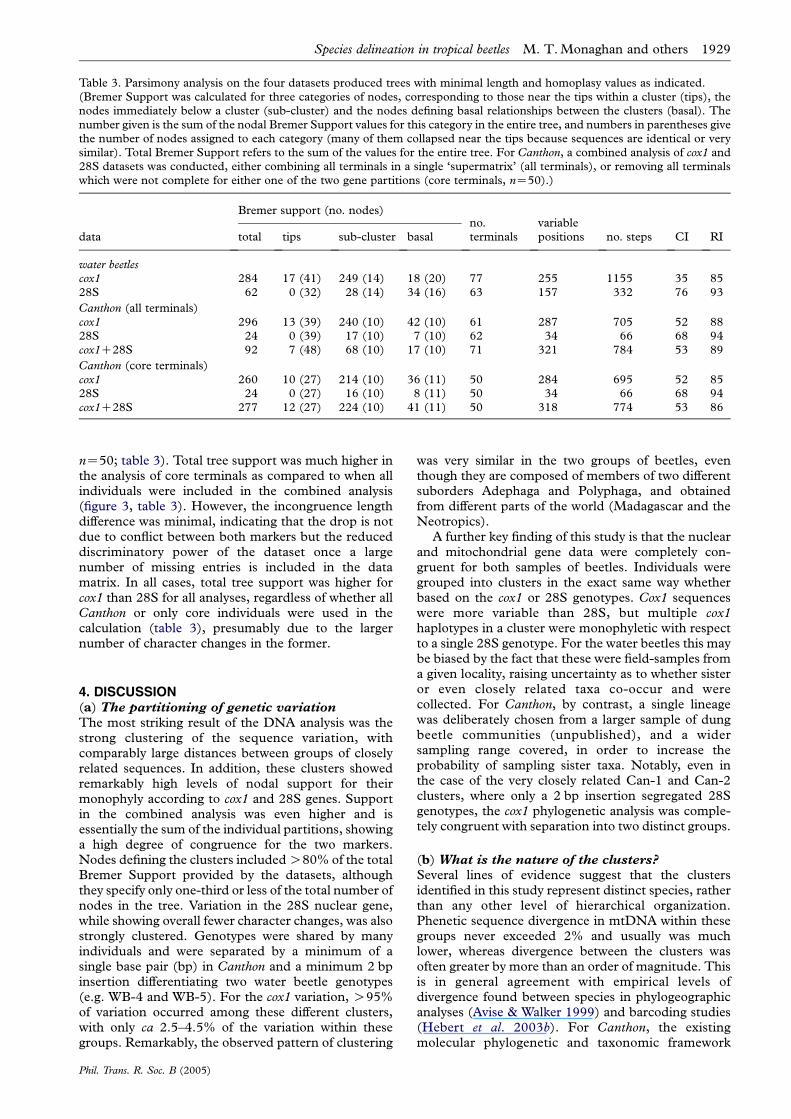
Table 3. Parsimony analysis on the four datasets produced trees with minimal length and homoplasy values as indicated.(Bremer Support was calculated for three categories of nodes, corresponding to those near the tips within a cluster (tips), thenodes immediately below a cluster (sub-cluster) and the nodes defining basal relationships between the clusters (basal). Thenumber given is the sum of the nodal Bremer Support values for this category in the entire tree, and numbers in parentheses givethe number of nodes assigned to each category (many of them collapsed near the tips because sequences are identical or verysimilar). Total Bremer Support refers to the sum of the values for the entire tree. For Canthon, a combined analysis of cox1 and28S datasets was conducted, either combining all terminals in a single ‘supermatrix’ (all terminals), or removing all terminalswhich were not complete for either one of the two gene partitions (core terminals, nZ50).)
data
Bremer support (no. nodes)no.terminals
variablepositions no. steps CI RItotal tips sub-cluster basal
water beetlescox1 284 17 (41) 249 (14) 18 (20) 77 255 1155 35 8528S 62 0 (32) 28 (14) 34 (16) 63 157 332 76 93
Canthon (all terminals)cox1 296 13 (39) 240 (10) 42 (10) 61 287 705 52 8828S 24 0 (39) 17 (10) 7 (10) 62 34 66 68 94cox1C28S 92 7 (48) 68 (10) 17 (10) 71 321 784 53 89
Canthon (core terminals)cox1 260 10 (27) 214 (10) 36 (11) 50 284 695 52 8528S 24 0 (27) 16 (10) 8 (11) 50 34 66 68 94cox1C28S 277 12 (27) 224 (10) 41 (11) 50 318 774 53 86
Species delineation in tropical beetles M. T. Monaghan and others 1929
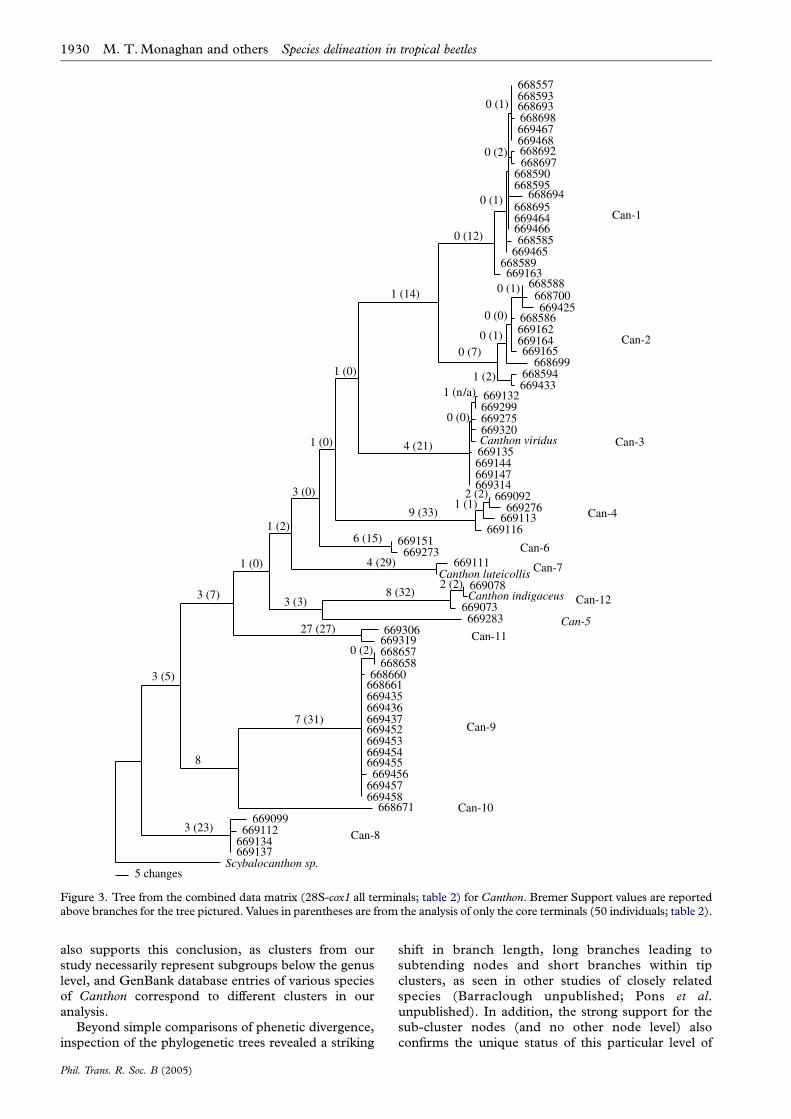
nZ50; table 3). Total tree support was much higher inthe analysis of core terminals as compared to when allindividuals were included in the combined analysis(figure 3, table 3). However, the incongruence lengthdifference was minimal, indicating that the drop is notdue to conflict between both markers but the reduceddiscriminatory power of the dataset once a largenumber of missing entries is included in the datamatrix. In all cases, total tree support was higher forcox1 than 28S for all analyses, regardless of whether allCanthon or only core individuals were used in thecalculation (table 3), presumably due to the largernumber of character changes in the former.
4. DISCUSSION(a) The partitioning of genetic variation
The most striking result of the DNA analysis was thestrong clustering of the sequence variation, withcomparably large distances between groups of closelyrelated sequences. In addition, these clusters showedremarkably high levels of nodal support for theirmonophyly according to cox1 and 28S genes. Supportin the combined analysis was even higher and isessentially the sum of the individual partitions, showinga high degree of congruence for the two markers.Nodes defining the clusters included O80% of the totalBremer Support provided by the datasets, althoughthey specify only one-third or less of the total number ofnodes in the tree. Variation in the 28S nuclear gene,while showing overall fewer character changes, was alsostrongly clustered. Genotypes were shared by manyindividuals and were separated by a minimum of asingle base pair (bp) in Canthon and a minimum 2 bpinsertion differentiating two water beetle genotypes(e.g. WB-4 and WB-5). For the cox1 variation, O95%of variation occurred among these different clusters,with only ca 2.5–4.5% of the variation within thesegroups. Remarkably, the observed pattern of clustering
Phil. Trans. R. Soc. B (2005)
was very similar in the two groups of beetles, eventhough they are composed of members of two differentsuborders Adephaga and Polyphaga, and obtainedfrom different parts of the world (Madagascar and theNeotropics).
A further key finding of this study is that the nuclearand mitochondrial gene data were completely con-gruent for both samples of beetles. Individuals weregrouped into clusters in the exact same way whetherbased on the cox1 or 28S genotypes. Cox1 sequenceswere more variable than 28S, but multiple cox1haplotypes in a cluster were monophyletic with respectto a single 28S genotype. For the water beetles this maybe biased by the fact that these were field-samples froma given locality, raising uncertainty as to whether sisteror even closely related taxa co-occur and werecollected. For Canthon, by contrast, a single lineagewas deliberately chosen from a larger sample of dungbeetle communities (unpublished), and a widersampling range covered, in order to increase theprobability of sampling sister taxa. Notably, even inthe case of the very closely related Can-1 and Can-2clusters, where only a 2 bp insertion segregated 28Sgenotypes, the cox1 phylogenetic analysis was comple-tely congruent with separation into two distinct groups.
(b) What is the nature of the clusters?
Several lines of evidence suggest that the clustersidentified in this study represent distinct species, ratherthan any other level of hierarchical organization.Phenetic sequence divergence in mtDNA within thesegroups never exceeded 2% and usually was muchlower, whereas divergence between the clusters wasoften greater by more than an order of magnitude. Thisis in general agreement with empirical levels ofdivergence found between species in phylogeographicanalyses (Avise & Walker 1999) and barcoding studies(Hebert et al. 2003b). For Canthon, the existingmolecular phylogenetic and taxonomic framework
668557668593668693668698669467669468668692
668590668595
668695669464669466668585
669465668589669163
669425668586669162669164669165
668594669433
669132669299669275669320
669135669144669147669314
669092669276
669113669116
669151669273
669111
669078
669073669283
669306669319668657668658
668660668661669435 669436669437669452669453 669454669455 669456
669457669458
668671669099
669112 669134669137
5 changes
0 (1)
0 (1)
1 (2)
0 (7)
0 (2)
7 (31)
8
3 (23)
3 (7)
3 (5)
27 (27)
1 (0)
2 (2)8 (32)
3 (3)
1 (2)
3 (0)
6 (15)
1 (0)
9 (33)
1 (0)
4 (21)
0 (12)
0 (1)
0 (2)
0 (1)
1 (14)
1 (1)2 (2)
4 (29)
0 (0)
1 (n/a)
0 (0)
Can-3
Can-4
Can-5
Can-6
Can-7
Can-8
Can-9
Can-10
Can-11
Can-12
Canthon viridus
Canthon luteicollis
Canthon indigaceus
Scybalocanthon sp.
668697
Can-1
668694
668700
Can-2
668588
668699
Figure 3. Tree from the combined data matrix (28S-cox1 all terminals; table 2) for Canthon. Bremer Support values are reportedabove branches for the tree pictured. Values in parentheses are from the analysis of only the core terminals (50 individuals; table 2).
1930 M. T. Monaghan and others Species delineation in tropical beetles
also supports this conclusion, as clusters from ourstudy necessarily represent subgroups below the genus
level, and GenBank database entries of various speciesof Canthon correspond to different clusters in our
analysis.Beyond simple comparisons of phenetic divergence,
inspection of the phylogenetic trees revealed a striking
Phil. Trans. R. Soc. B (2005)
shift in branch length, long branches leading tosubtending nodes and short branches within tip
clusters, as seen in other studies of closely relatedspecies (Barraclough unpublished; Pons et al.unpublished). In addition, the strong support for thesub-cluster nodes (and no other node level) alsoconfirms the unique status of this particular level of
Species delineation in tropical beetles M. T. Monaghan and others 1931
hierarchy in the trees. Whether or not this representsthe species boundary remains to be investigatedfurther. Ultimately, additional information, such asfield studies of the sampled populations and broadergenetic surveys including sister species, is required toconfirm that the groups defined by these nodes aredefining the species. However, the species categorydoes take up a special place in the taxonomic hierarchyas the only ‘natural’ level of organization of theclassificatory system, in contrast to the higher levels,such as genera and families (Cracraft 1983). It is ourhypothesis that the transition in branching patterns,and the shift from strong to negligible branch support,represents a genetic signature of this unique level oforganization.
(c) Methodological issues of species delineation
from sequence data
Existing approaches to species delineation fromsequence variation alone have been applied mainly tovery small organisms, such as prokaryotes or soilnematodes, in which morphological discrimination isdifficult or impossible (Floyd et al. 2002; Gregory &DeSalle 2005). In the case of nematodes, MolecularOperational Taxonomic Units (MOTUs) have beenassigned based solely on sequence divergence (Blaxter2004). While there may be no better way to classifythese organisms to date, it remains unclear how theseMOTUs correspond to evolutionarily differentiatedgroups, and how meaningful they are with respect tospecies cohesion. While the observation of large inter-and low intra-species variation promises easy identifi-cation of described species and the discovery of manycryptic species (Hebert et al. 2003b; Hebert et al.2004b), there is concern regarding variability in thethreshold values both between individual sister speciespairs and among major lineages (DeSalle et al. 2005;Moritz & Cicero 2004).
In part, the problem of quantitative species delimita-tion could be overcome by searching for diagnosticcharacter variation (Cracraft 1983), or complexcharacter combinations (DeSalle et al. 2005) to definethe species limits based on quantitative methods (Sites& Marshall 2003). These tests, which are rooted in thephylogenetic species concept, establish whether a prioripopulations can be ‘aggregated’ into a single speciesbased on the distribution of characters or tree topology.These methods may not be practical when applied tolarge-scale species discovery and barcoding studies,where the cohesion of populations is unknown andbroad sampling across species’ geographic ranges maynot be possible.
A possible alternative to aggregation methods is tointerpret branch length itself as being suggestive ofspecies boundaries, assuming that the long branchesdefining the clusters could only have arisen ifpopulations diverged longer than around Ne (effectivepopulation size) generations ago (Hudson & Coyne2002). Appropriate methods for estimating these shiftsinclude Templeton’s statistical parsimony analysis thatpartitions the variation into homoplastic (i.e. longbranches) and non-homoplastic (short branches)variation (Templeton 2001). Similarly, it may bepossible to statistically differentiate the shifts of lineage
Phil. Trans. R. Soc. B (2005)
branching from interspecific, long branches to intra-specific, short branches using maximum likelihoodmethods (Barraclough, unpublished; Pons et al. sub-mitted). A further approach could be based onpopulation genetics analyses. It is possible to interpretthe AMOVA results used to calculate intra- versusinter-cluster variation in a way analogous to F-statistics(Wright 1978). In this scenario, FSTO0.95 for bothwater beetles and Canthon datasets, meaning thatO95% of the total genetic variation in the datasetarises from differences among groups. A thresholdof !5% within-group variation seems a reasonablemeans of minimizing the chance of overlooking distincttaxa. As an example, combining Can-1 and Can-2 intoa single group (‘Can1-2’) and recalculating AMOVAstatistics results in a 15.6% value for within-groupvariation, as opposed to the 2.5% value when these twogroups are considered as separate entities (table 1).This demonstrates the stringent clustering of the data,and provides a simple procedure to identify groups thathave been grouped incorrectly.
(d) Conclusions and prospects
The aim of the present study was to investigate theefficacy of short sequence fragments for use in thediscovery, delineation and routine identification ofspecies. The analysis neither strictly constitutes a testof whether DNA can delimit pre-defined species, norwas it an analysis of Type I or Type II errors of speciesassignment (Quicke 2004). Instead, we used parsi-mony analysis to simultaneously examine a largenumber of sequences to assess patterns of variation innature, and enquired whether this conforms toexpectations of clustering at the species level of thebiological hierarchy. The results were striking:sequence variation clustered very strongly for bothnuclear and mitochondrial markers, and nodes definingthese clusters were well supported whereas tip nodes,connecting closely related individuals, were not.Whether all the clusters we identified correspond topre-existing, named species remains to be tested, andwould require the input of specialists experienced inthese taxonomic groups. Notably, comparisons withGenBank sequences indicated that at least three of theclusters identified here do indeed correspond to namedspecies of Canthon.
The analytical approach will allow these clusters tobe delineated objectively and repeatedly by anyoneusing the sequence data matrix. As a result, DNA datacan form the basis of testable taxonomic hypothesesthat could be examined with additional types of data inthe future. The benefits of this approach are manifold:it provides a rapid division into probable groups ofreproductively isolated individuals and generates moredirect links to their evolutionary past; it will facilitatethe determination of distinctive morphological features(i.e. through a focussed comparison of pre-delineatedgroups); it would allow the study of these putativespecies to proceed even while formal description ispending; it would link individuals from the samespecies collected in different localities or in differentstudies in a way that arbitrary designations (e.g.‘Canthon sp.1’) do not; and it would immediately
1932 M. T. Monaghan and others Species delineation in tropical beetles
provide the data needed for future DNA barcodingidentification.
The results of the present study are based on arelatively small number of species, but nonethelessdemonstrate the general feasibility of using DNA-basedmethods in the large-scale delineation and discovery ofnew species, even in poorly characterized groups.While more research is needed to establish the bestapproach for species delineation using DNA (e.g.through phylogenetic or coalescent methods, withphenetic barcode ‘thresholds’, or some combinationthereof), it is becoming evident that DNA methodspresent a promising new means of assessing andidentifying biological diversity in some of the mostspecies rich taxa and environments on Earth. There isreason for optimism that, if fully developed andimplemented on a broad scale, DNA-based tools suchas those examined here may provide the first opportu-nity for creating a comprehensive inventory of life.
We are grateful to Daegan Inward, Richard Davies and LizPowell for collecting Canthon dung beetles; to David Lees,Ravomiarana Ranaivosolo, Pierre Razafindraire, RogerAndriamparany and Doug Ottke for assistance with waterbeetle collection; to Ruth Wild and Miranda Elliot forlaboratory analysis; and to Silvia Fabrizi for mountingspecimens. In Madagascar, we thank York Pareik at King dela Piste and Madame Liva and Benjamin Andriamihaja atMICET (Madagascar Institut pour la Conservation desEcosystemes Tropicaux). Tim Barraclough and an anon-ymous referee provided helpful comments on the manuscript.
REFERENCESAvise, J. C. & Walker, D. E. 1999 Species realities and
numbers in sexual vertebrates: perspectives from anasexually transmitted genome. Proc. Natl Acad. Sci. 96,992–995. (doi:10.1073/pnas.96.3.992.)
Belshaw, R. & Katzourakis, A. 2005 BlastAlign: a programthat uses blast to align problematic nucleotide sequences.Bioinformatics 21, 122–123. (doi:10.1093/bioinformatics/bth459.)
Blaxter, M. L. 2004 The promise of a DNA taxonomy. Phil.Trans. R. Soc. B 359, 669–679. (doi:10.1098/rstb.2003.1447.)
Bremer, K. 1994 Branch support and tree stability. Cladistics10, 295–304. (doi:10.1111/j.1096-0031.1994.tb00179.x.)
Cracraft, J. 1983 Species concept and speciation analysis.Curr. Ornithol. 1, 159–187.
Davis, J. I. & Nixon, K. C. 1992 Populations, geneticvariation, and the delimitation of phylogenetic species.Syst. Biol. 41, 421–435.
DeSalle, R., Egan, M. G. & Siddall, M. 2005 The unholytrinity: taxonomy, species delimitation and DNA barcod-ing. Phil. Trans. R. Soc. B 360, 1905–1916. (doi:10.1098/rstb.2005.1722.)
Excoffier, L., Smouse, P. & Quattro, J. 1992 Analysis ofmolecular variance inferred from metric distances amongDNA haplotypes: application to human mitochondrialDNA restriction data. Genetics 131, 479–491.
Floyd, R., Abebe, E., Papert, A. & Blaxter, M. 2002Molecular barcodes for soil nematode identification.Mol. Ecol. 11, 839–850. (doi:10.1046/j.1365-294X.2002.01485.x.)
Folmer, O., Black, M., Hoeh, W., Lutz, R. & Vrijenhoek, R.1994 DNA primers for amplification of mitochondrialcytochrome c oxidase subunit I from diverse metazoaninvertebrates. Mol. Mar. Biol. Biotechnol. 3, 294–299.
Phil. Trans. R. Soc. B (2005)
Godfray, H. C. J. 2002 Challenges for taxonomy—thediscipline will have to reinvent itself if it is to survive andflourish. Nature 417, 17–19. (doi:10.1038/417017a.)
Gregory, T. R. & DeSalle, R. 2005 Comparative genomics inprokaryotes. In The evolution of the genome (ed. T. R.Gregory), pp. 585–675. San Diego: Elsevier.
Hebert, P. D. N., Cywinska, A., Ball, S. L. & DeWaard, J. R.2003a Biological identifications through DNA barcodes.Proc. R. Soc. B 270, 313–321. (doi:10.1098/rspb.2002.2218.)
Hebert, P. D. N., Ratnasingham, S. & DeWaard, J. R.2003b Barcoding animal life: cytochrome c oxidasesubunit 1 divergences among closely related species.Proc. R. Soc. B 270(Suppl. 1), S96–S99. (doi:10.1098/rspb.2002.2218.)
Hebert, P. D. N., Penton, E. H., Burns, J. M., Janzen, D. H. &Hallwachs, W. 2004a Ten species in one: DNA barcodingreveals cryptic species in the Neotropical skipper butterflyAstraptes fulgerator. Proc. Natl Acad. Sci. 101,14 812–14 817. (doi:10.1073/pnas.0406166101.)
Hebert, P. D. N., Stoeckle, M. Y., Zemlak, T. S. & Francis,C. M. 2004b Identification of birds through DNAbarcodes. PLOS Biol. 2, 1657–1663. (doi:10.1371/jour-nal.pbio.0020312.)
Hogg, I. D. & Hebert, P. D. N. 2004 Biological identificationof springtails (Hexapoda: Collembola) from the CanadianArctic, using mitochondrial DNA barcodes. Can. J. Zool.82, 749–754. (doi:10.1139/z04-041.)
Hudson, R. R. & Coyne, J. A. 2002 Mathematicalconsequences of the genealogical species concept. Evol-ution 56, 1557–1565.
Inward, D. G. 2003 The evolution of dung beetle assem-blages. Ph.D. thesis, Imperial College, London.
Janzen, D. H. 2004 Now is the time. Phil. Trans. R. Soc. B359, 731–732. (doi:10.1098/rstb.2003.1444.)
Knowlton, N. 1993 Sibling species in the sea. Trends Ecol.Evol. 24, 189–216.
Lipscomb, D., Platnick, N. & Wheeler, Q. 2003 Theintellectual content of taxonomy: a comment on DNAtaxonomy. Trends Ecol. Evol. 18, 65–68. (doi:10.1016/S0169-5347(02)00060-5.)
Moritz, C. & Cicero, C. 2004 DNA barcoding: promise andpitfalls. PLOS Biol. 2, 1529–1531. (doi:10.1371/journal.pbio.0020354.)
Proudlove, G. & Wood, P. J. 2003 The blind leading theblind: cryptic subterranean species and DNA taxonomy.Trends Ecol. Evol. 18, 272–273. (doi:10.1016/S0169-5347(03)00095-8.)
Quicke, D. J. L. 2004 The world of DNA barcoding andmorphology—collision or synergism and what of thefuture. Systematist 23, 8–12.
Schneider, S. D., Roessli, D. & Excoffier, L. 2000ARLEQUIN version 2.000: a software for population geneticsdata analysis. Switzerland: Genetics and Biomery Labora-tory, University of Geneva.
Seberg, O., Humphries, C. J., Knapp, S., Stevenson, D. W.,Petersen, G., Scharff, N. & Andersen, N. M. 2003Shortcuts in systematics? A commentary on DNA-basedtaxonomy. Trends Ecol. Evol. 18, 63–65. (doi:10.1016/S0169-5347(02)00059-9.)
Simon, C., Frati, F., Beckenbach, A., Crespi, B., Liu, H. &Flook, P. 1994 Evolution, weighting, and phylogeneticutility of mitochondrial gene sequences and a compilationof conserved polymerase chain reaction primers. Ann.Entomol. Soc. Am. 87, 651–701.
Sites, J. W. & Marshall, J. C. 2003 Delimiting species: aRenaissance issue in systematic biology. Trends Ecol. Evol.18, 462–470. (doi:10.1016/S0169-5347(03)00184-8.)
Smith, M. A., Fisher, B. L. & Hebert, P. D. N. 2005 DNAbarcoding for effective biodiversity assessment of a
Species delineation in tropical beetles M. T. Monaghan and others 1933
hyperdiverse arthropod group: the ants of Madagascar.
Phil. Trans. R. Soc. B 360, 1825–1834. (doi:10.1098/rstb.
2005.1714.)
Stoeckle, M. 2003 Taxonomy, DNA, and the barcode of life.
Bioscience 53, 796–797.
Swofford, D. L. 2002 PAUP *: Phylogenetic analysis using
parsimony. Version 4.0b. Sunderland, MA: Sinauer
Associates.
Tautz, D., Arctander, P., Minelli, A., Thomas, R. H. &
Vogler, A. P. 2003 A plea for DNA taxonomy. Trends
Ecol. Evol. 18, 70–74. (doi:10.1016/S0169-5347(02)
00041-1.)
Templeton, A. R. 2001 Using phylogeographic analyses
of gene trees to test species status and processes.
Mol. Ecol. 10, 779–791. (doi:10.1046/j.1365-294x.2001.
01199.x.)
Phil. Trans. R. Soc. B (2005)
Tudge, C. 2000 The variety of life. Oxford: Oxford UniversityPress.
Vences, M., Thomas, M., Bonett, R. M. & Vieites, D. R.2005 Deciphering amphibian diversity through DNAbarcoding: chances and challenges. Phil. Trans. R. Soc. B360. (doi:10.1098/rstb.2005.1717.)
Wheeler, Q. D. 2004 Taxonomic triage and the poverty ofphylogeny. Phil. Trans. R. Soc. B 359, 571–583. (doi:10.1098/rstb.2003.1452.)
Will, K. W. & Rubinoff, D. 2004 Myth of the molecule: DNAbarcodes for species cannot replace morphology foridentification and classification. Cladistics 20, 47–55.(doi:10.1111/j.1096-0031.2003.00008.x.)
Wilson, E. O. 2003 The encyclopedia of life. Trends Ecol. Evol.18, 77–80. (doi:10.1016/S0169-5347(02)00040-X.)
Wright, S. 1978 Evolution and the genetics of populations.Chicago: University of Chicago.
Copyright © 2022 FDOKUMEN