Impact of Atmospheric Intraseasonal Oscillations on the Indian Ocean Dipole during the 1990s*
88 VOLUME 17J O U R N A L O F C L I M A T E
q 2004 American Meteorological Society
The South Atlantic Convergence Zone: Intensity, Form, Persistence, and Relationshipswith Intraseasonal to Interannual Activity and Extreme Rainfall
LEILA M. V. CARVALHO
Department of Atmospheric Sciences, Institute of Astronomy, Geophysics and Atmospheric Sciences, University of Sao Paulo,Sao Paulo, Brazil
CHARLES JONES
Institute for Computational Earth System Science, University of California, Santa Barbara, Santa Barbara, California
BRANT LIEBMANN
NOAA–CIRES Climate Diagnostics Center, Boulder, Colorado
(Manuscript received 12 September 2002, in final form 7 July 2003)
ABSTRACT
The characteristics of intensity, geographical location, and persistence of the South Atlantic convergence zone(SACZ) during the austral summer are investigated. Intensity and spatial features of the SACZ are identified byperforming a factor analysis of structural properties of outgoing longwave radiation (OLR) data. The first twoleading factors explain 65% of the total variance of structural properties and characterize the SACZ accordingto intensity and location (oceanic versus continental). An index is constructed based on the magnitude of thefactor scores to identify intense (weak) and oceanic (continental) SACZ. The intense SACZ category is associatedwith negative OLR anomalies over a large area of tropical South America, extending from the western Amazonto the Atlantic Ocean. The weak SACZ category is observed with positive OLR anomalies over tropical SouthAmerica and negative OLR anomalies over southeastern South America. Oceanic and continental aspects of theSACZ are related to a midlatitude wave train pattern. The Madden–Julian oscillation (MJO) modulates intenseSACZ events with persistence longer than 3 days. Interannual variability of persistent events indicates that theratio of oceanic to continental SACZ as well as their frequency depends on the phase of El Nino–SouthernOscillation (ENSO). Occurrence of extreme rainfall in Brazil is discussed in the context of variations in theSACZ and MJO. Intense (weak) SACZ increases (decreases) the 95th daily rainfall percentile over central-eastern Brazil compared to the climatology. Oceanic (continental) SACZ increases (decreases) the 95th dailyrainfall percentile over southeastern Brazil. The MJO phase characterized by suppression of convective activityover Indonesia and enhancement over the central Pacific increases the 95th daily rainfall percentile over north-northeastern Brazil, whereas opposite features are observed for the phase of the MJO characterized by theenhancement of convection over Indonesia and suppression over the central Pacific.
1. Introduction
The South Atlantic convergence zone (SACZ) is animportant climatological feature of the austral summerin South America. The SACZ has been subjectively de-fined as an elongated convective band typically origi-nating in the Amazon basin, extending toward southeastBrazil and protruding into the southeastern subtropicalAtlantic Ocean (Kodama 1992, 1993; Satyamurti et al.1998; Carvalho et al. 2002). The SACZ and convectiveactivity in the Amazon basin are the main components
Corresponding author address: Dr. Leila M. V. Carvalho, Instituteof Astronomy, Geophysics and Atmospheric Sciences, University ofSao Paulo, R. do Matao, 1226, Cidade Universitaria, Sao Paulo, SP05508-900, Brazil.E-mail: [email protected]
of the South American monsoon system (SAMS) (Jonesand Carvalho 2002).
A striking characteristic of the precipitation regimesin South America is the wide range of time and spacescales of variability. While convection in the Amazonbasin exhibits strong diurnal and seasonal changes, in-traseasonal (10–90 days) variations are more pro-nounced over eastern tropical and subtropical SouthAmerica (Kiladis and Weickmann 1992; Liebmann etal. 1999; Nogues-Paegle and Mo 1997; Nogues-Paegleet al. 2000). Moreover, Jones and Carvalho (2002) dem-onstrated that intraseasonal variations in December–February low-level wind regimes over tropical SouthAmerica are linked to breaks and active phases ofSAMS. On the other hand, on longer time scales, in-terannual variations associated with the El Nino–South-
1 JANUARY 2004 89C A R V A L H O E T A L .
ern Oscillation (ENSO) are also detected over parts ofSouth America including the SACZ (Ropelewski andHalpert 1987; Grimm 2003; Robertson and Mechoso2000; Liebmann et al. 2001; Carvalho et al. 2002).
Although those previous studies have considerablyimproved the understanding of the relationships be-tween low-frequency modes such as the MJO (Maddenand Julian 1994) and ENSO, and convective activityover tropical South America, some key questions needto be further investigated. Past studies investigated thevariability of the SACZ using a combination of filtereddata [outgoing longwave radiation (OLR)], empiricalorthogonal function (EOF) analysis and composites toexamine the spatial variability of the signal (Liebmannet al. 1999; Lenters and Cook 1999; Nogues-Paegle andMo 1997; Nogues-Paegle et al. 2000). A drawback ofthese techniques is that a large fraction of the total var-iability of convective activity may not be incorporatedin the composite categories. For instance, it is wellknown in the meteorological forecasting community thatthe SACZ can exhibit substantial changes in its geo-graphical extension. Satellite images oftentimes showthat the SACZ can extend from the Amazon toward thesubtropical Atlantic Ocean, whereas in other situationsthe SACZ merely extends over southeast Brazil. Sim-ilarly, quite often the intense convective activity in theSACZ seems to not persist, while it may last longer inother situations. Although operational forecasters sub-jectively know these variations, some basic questionsneed to be objectively addressed: Are there distinct dif-ferences in the SACZ intensity (intense vs weak) andgeographical extension (continental vs oceanic)? Whatis the frequency distribution of the SACZ persistence?Does the MJO modulate the SACZ intensity, persis-tence, and geographical location? Are there systematicchanges in the SACZ associated with ENSO? Addi-tionally, given that the SACZ and MJO play a funda-mental role in the precipitation variability in Brazil:what are the relationships among SACZ, MJO, and theoccurrence of extreme rainfall events?
In a recent study, Carvalho et al. (2002) developeda methodology to characterize structural properties ofthe SACZ and investigated the influence of SACZ char-acteristics in modulating daily extreme rainfall over SaoPaulo state in Brazil. They showed that the SACZ in-tensity and its extent to the Atlantic Ocean determinethe spatial distribution of extremes in Sao Paulo. Thepresent paper has several objectives. We first expandthe methodology to characterize the SACZ according tointensity, location, and persistence (section 3). Intra-seasonal variations in convective activity and large-scale circulation in different SACZ categories are dis-cussed next (section 4). The statistical properties of theSACZ persistence are examined (section 5), followedby an analysis of interannual variations in SACZ cat-egories (section 6). The modulation by the MJO of theSACZ is then assessed (section 7). Last, the occurrences
of extreme rainfall in Brazil are considered in the con-text of SACZ and MJO variations (section 8).
2. Data
This study focuses on the austral summer, which isdefined here as from December to February (DJF). Inorder to characterize large-scale aspects of tropical con-vection during DJF, we use daily OLR (1979–2000) with2.58 horizontal resolution (Liebmann and Smith 1996).The large-scale atmospheric circulation is described inthis study with National Centers for Environmental Pre-diction–National Center for Atmospheric Research(NCEP–NCAR) reanalysis (Kalnay et al. 1996). Thedeparture from the seasonal cycle is obtained by sub-tracting the daily DJF ORL climatology (hereafter re-ferred to as anomalies). The seasonal cycle wassmoothed before subtracting the climatology from thedaily time series. The relationships with intraseasonalvariations are examined by computing anomalies witha Lanczos bandpass filter with cutoff periods of 10 and90 days and 151 weights (Duchon 1979; Jones et al.1998) (henceforth called intraseasonal anomalies). Adense network of stations in Brazil was used to constructdaily gridded precipitation maps. The original stationdata were obtained from ANEEL (Agencia Nacional deEnergia Eletrica) and meteorological agencies in thestates of Ceara, Sao Paulo, and Parana. South of 158S,there are about 2500 stations with an average record of16 yr (1979–98). On average, 5% of missing data ispresent in years with data. The station data were av-eraged into 28 (lat) 3 28 (lon) squares, with the as-sumption that there is sufficient station density such thatan occasional missing datum will not affect the gridpointaverage.
3. SACZ characteristics
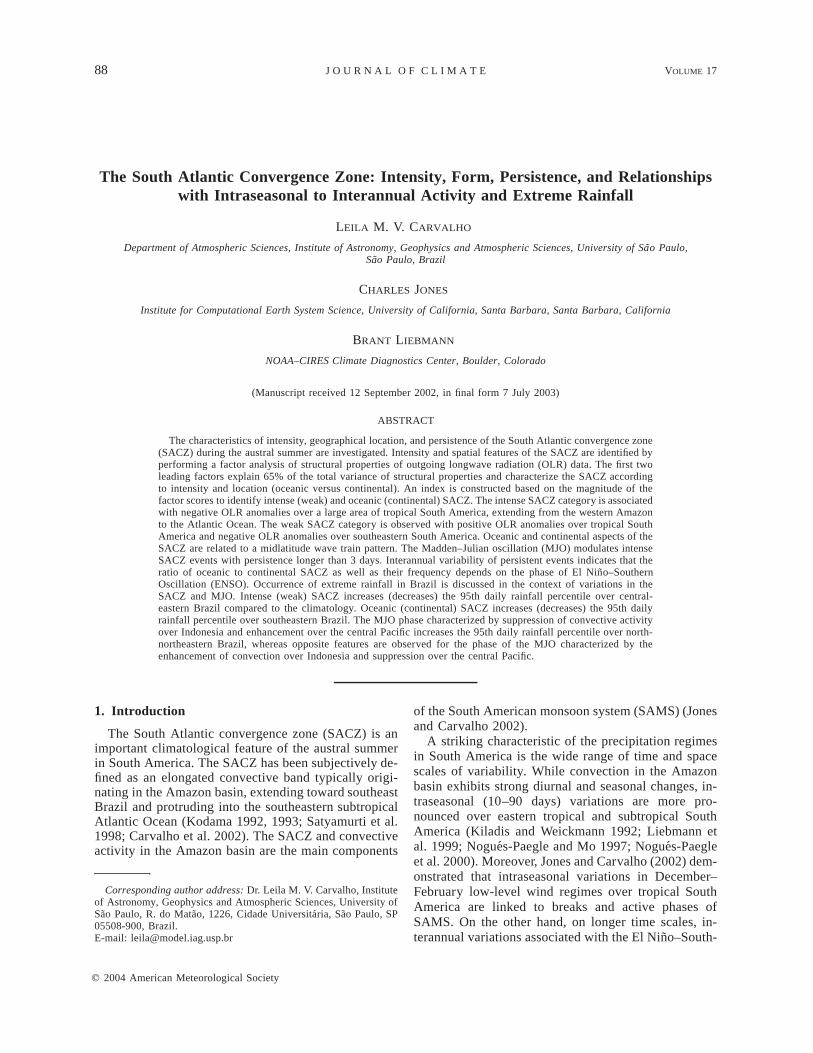
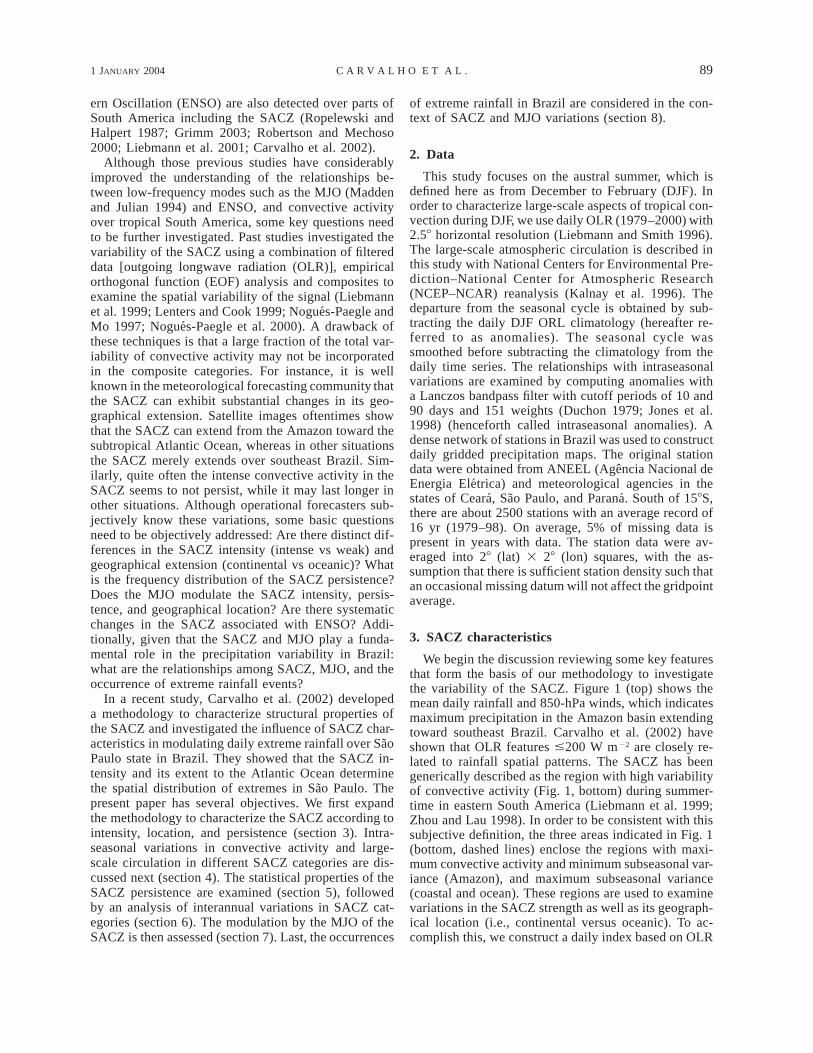
We begin the discussion reviewing some key featuresthat form the basis of our methodology to investigatethe variability of the SACZ. Figure 1 (top) shows themean daily rainfall and 850-hPa winds, which indicatesmaximum precipitation in the Amazon basin extendingtoward southeast Brazil. Carvalho et al. (2002) haveshown that OLR features #200 W m22 are closely re-lated to rainfall spatial patterns. The SACZ has beengenerically described as the region with high variabilityof convective activity (Fig. 1, bottom) during summer-time in eastern South America (Liebmann et al. 1999;Zhou and Lau 1998). In order to be consistent with thissubjective definition, the three areas indicated in Fig. 1(bottom, dashed lines) enclose the regions with maxi-mum convective activity and minimum subseasonal var-iance (Amazon), and maximum subseasonal variance(coastal and ocean). These regions are used to examinevariations in the SACZ strength as well as its geograph-ical location (i.e., continental versus oceanic). To ac-complish this, we construct a daily index based on OLR
90 VOLUME 17J O U R N A L O F C L I M A T E
FIG. 1. (a) Gridded mean daily precipitation (28 lat/lon) obtainedfrom stations over Brazil and low-level winds (850 hPa) from re-analysis during summertime (DJF). (b) DJF OLR standard deviation(W m22). Areas indicated with dotted lines are located over regionswith maximum subseasonal standard deviation (coastal and ocean),and maximum subseasonal convective activity (Amazon). See textfor more details.
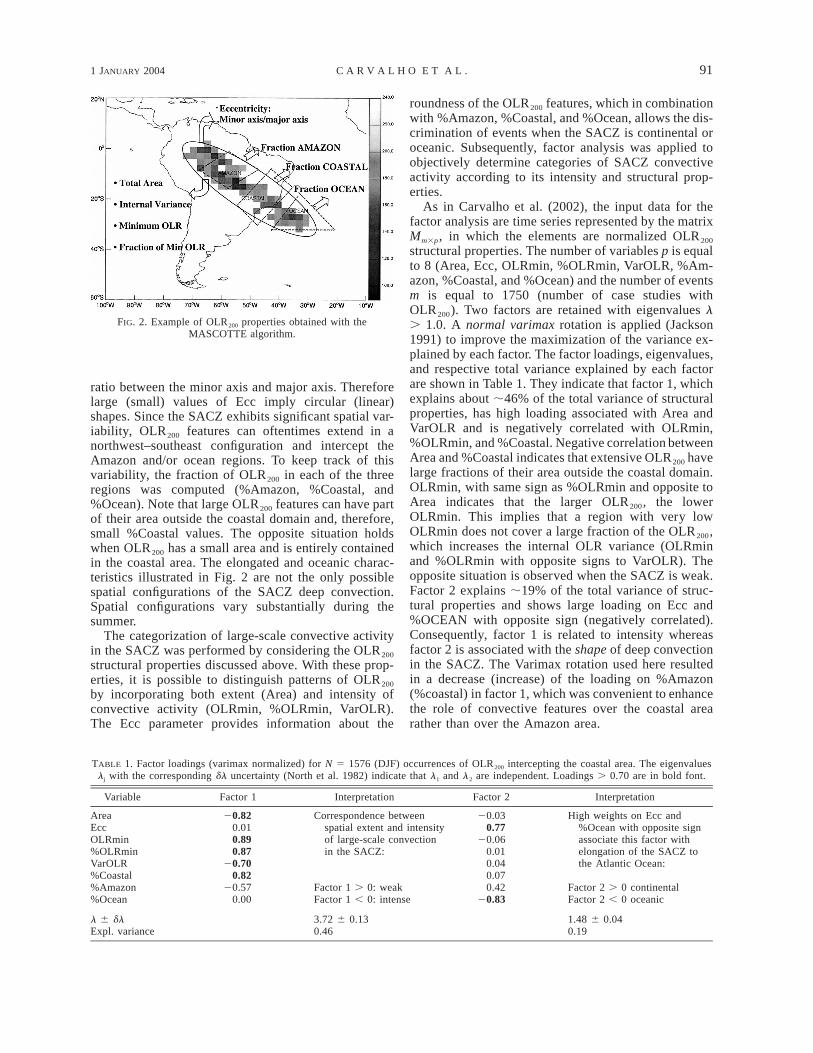
structural properties. The methodology to obtain thisindex is discussed in detail in Carvalho et al. (2002)and summarized here as follows. First, spatial and struc-tural characteristics of daily large-scale deep convectiveactivity in the SACZ are investigated by identifyingcontiguous (i.e., connected grid points) regions of OLR#200 W m22. Only those contiguous regions that in-tercept the coastal area are selected (hereafter OLR200).We identified 1750 days with OLR200 during DJF 1979–2000. Next, the maximum spatial correlation trackingtechnique (MASCOTTE) algorithm (Carvalho and
Jones 2001) is used to examine spatial and temporalcharacteristics of selected OLR200 cases. Figure 2, whichillustrates an example of an OLR200 map, shows theproperties that were determined. They are: area (Area),eccentricity (Ecc), minimum OLR (OLRmin), fractionof OLR200 with OLRmin (%OLRmin), and OLR spatialvariance (VarOLR). The parameter %OLRmin was de-fined as the ratio between the number of grid pointswith OLRmin to the number of grid points with OLR200.An ellipse is fitted to the contiguous OLR200 region andis only used to determine the eccentricity, defined as the
1 JANUARY 2004 91C A R V A L H O E T A L .
FIG. 2. Example of OLR200 properties obtained with theMASCOTTE algorithm.
TABLE 1. Factor loadings (varimax normalized) for N 5 1576 (DJF) occurrences of OLR200 intercepting the coastal area. The eigenvalueslj with the corresponding dl uncertainty (North et al. 1982) indicate that l1 and l2 are independent. Loadings . 0.70 are in bold font.
Variable Factor 1 Interpretation Factor 2 Interpretation
AreaEccOLRmin%OLRminVarOLR
20.820.010.890.87
20.70
Correspondence betweenspatial extent and intensityof large-scale convectionin the SACZ:
20.030.77
20.060.010.04
High weights on Ecc and%Ocean with opposite signassociate this factor withelongation of the SACZ tothe Atlantic Ocean:
%Coastal%Amazon%Ocean
0.8220.57
0.00Factor 1 . 0: weakFactor 1 , 0: intense
0.070.42
20.83Factor 2 . 0 continentalFactor 2 , 0 oceanic
l 6 dlExpl. variance
3.72 6 0.130.46
1.48 6 0.040.19
ratio between the minor axis and major axis. Thereforelarge (small) values of Ecc imply circular (linear)shapes. Since the SACZ exhibits significant spatial var-iability, OLR200 features can oftentimes extend in anorthwest–southeast configuration and intercept theAmazon and/or ocean regions. To keep track of thisvariability, the fraction of OLR200 in each of the threeregions was computed (%Amazon, %Coastal, and%Ocean). Note that large OLR200 features can have partof their area outside the coastal domain and, therefore,small %Coastal values. The opposite situation holdswhen OLR200 has a small area and is entirely containedin the coastal area. The elongated and oceanic charac-teristics illustrated in Fig. 2 are not the only possiblespatial configurations of the SACZ deep convection.Spatial configurations vary substantially during thesummer.
The categorization of large-scale convective activityin the SACZ was performed by considering the OLR200
structural properties discussed above. With these prop-erties, it is possible to distinguish patterns of OLR200
by incorporating both extent (Area) and intensity ofconvective activity (OLRmin, %OLRmin, VarOLR).The Ecc parameter provides information about the
roundness of the OLR200 features, which in combinationwith %Amazon, %Coastal, and %Ocean, allows the dis-crimination of events when the SACZ is continental oroceanic. Subsequently, factor analysis was applied toobjectively determine categories of SACZ convectiveactivity according to its intensity and structural prop-erties.
As in Carvalho et al. (2002), the input data for thefactor analysis are time series represented by the matrixMm3p, in which the elements are normalized OLR200
structural properties. The number of variables p is equalto 8 (Area, Ecc, OLRmin, %OLRmin, VarOLR, %Am-azon, %Coastal, and %Ocean) and the number of eventsm is equal to 1750 (number of case studies withOLR200). Two factors are retained with eigenvalues l. 1.0. A normal varimax rotation is applied (Jackson1991) to improve the maximization of the variance ex-plained by each factor. The factor loadings, eigenvalues,and respective total variance explained by each factorare shown in Table 1. They indicate that factor 1, whichexplains about ;46% of the total variance of structuralproperties, has high loading associated with Area andVarOLR and is negatively correlated with OLRmin,%OLRmin, and %Coastal. Negative correlation betweenArea and %Coastal indicates that extensive OLR200 havelarge fractions of their area outside the coastal domain.OLRmin, with same sign as %OLRmin and opposite toArea indicates that the larger OLR200, the lowerOLRmin. This implies that a region with very lowOLRmin does not cover a large fraction of the OLR200,which increases the internal OLR variance (OLRminand %OLRmin with opposite signs to VarOLR). Theopposite situation is observed when the SACZ is weak.Factor 2 explains ;19% of the total variance of struc-tural properties and shows large loading on Ecc and%OCEAN with opposite sign (negatively correlated).Consequently, factor 1 is related to intensity whereasfactor 2 is associated with the shape of deep convectionin the SACZ. The Varimax rotation used here resultedin a decrease (increase) of the loading on %Amazon(%coastal) in factor 1, which was convenient to enhancethe role of convective features over the coastal arearather than over the Amazon area.
92 VOLUME 17J O U R N A L O F C L I M A T E
Table 1 indicates that negative (positive) factor 1scores are related to SACZ with intense (weak) con-vective activity and large (small) extension. Analo-gously, positive (negative) factor 2 scores can be linkedto oceanic (continental) aspects of the OLR200. Sincethe objective of our methodology is to use these twofactors as indexes to characterize SACZ occurrences,we have defined four categories as follows: intense (fac-tor 1 # 25th percentile), weak (factor 1 $ 75th per-centile), oceanic (factor 2 # 25th percentile), and con-tinental (factor 2 $ 75th percentile). Intense and weakcategories are, therefore, defined regardless of SACZgeographic aspects, whereas oceanic and continentalcategories are determined regardless of SACZ intensity.The reason for using percentiles to find typical eventsin each category is because the factor distributions areskewed (Carvalho et al. 2002). The total number of daysin each category is equal to 438, such that the numberof events identified according to persistence ($1 day)is 193 (intense), 197 (weak), 215 (oceanic), and 242(continental). Evidently, since factor 1 and factor 2 areorthogonal, it is possible to combine both factors suchthat one can identify SACZ cases typically intense (orweak) and oceanic (or continental) (Carvalho et al.2002). However, in the present paper each category willbe examined separately as follows.
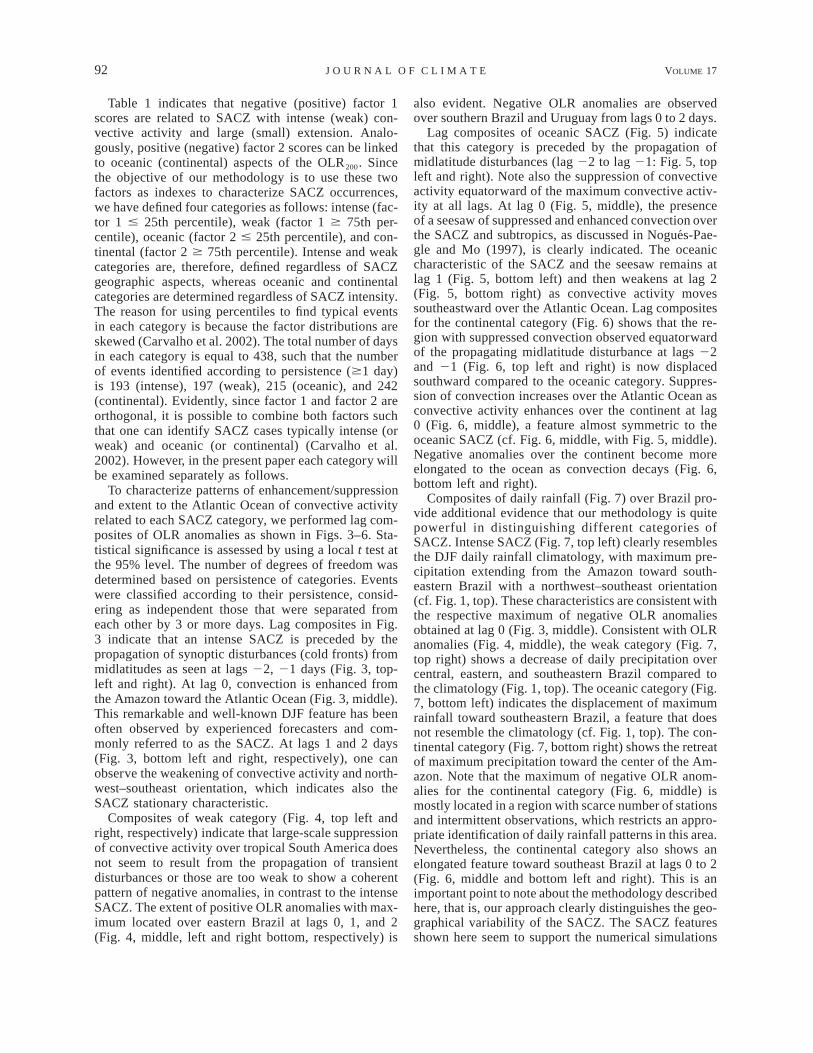
To characterize patterns of enhancement/suppressionand extent to the Atlantic Ocean of convective activityrelated to each SACZ category, we performed lag com-posites of OLR anomalies as shown in Figs. 3–6. Sta-tistical significance is assessed by using a local t test atthe 95% level. The number of degrees of freedom wasdetermined based on persistence of categories. Eventswere classified according to their persistence, consid-ering as independent those that were separated fromeach other by 3 or more days. Lag composites in Fig.3 indicate that an intense SACZ is preceded by thepropagation of synoptic disturbances (cold fronts) frommidlatitudes as seen at lags 22, 21 days (Fig. 3, top-left and right). At lag 0, convection is enhanced fromthe Amazon toward the Atlantic Ocean (Fig. 3, middle).This remarkable and well-known DJF feature has beenoften observed by experienced forecasters and com-monly referred to as the SACZ. At lags 1 and 2 days(Fig. 3, bottom left and right, respectively), one canobserve the weakening of convective activity and north-west–southeast orientation, which indicates also theSACZ stationary characteristic.
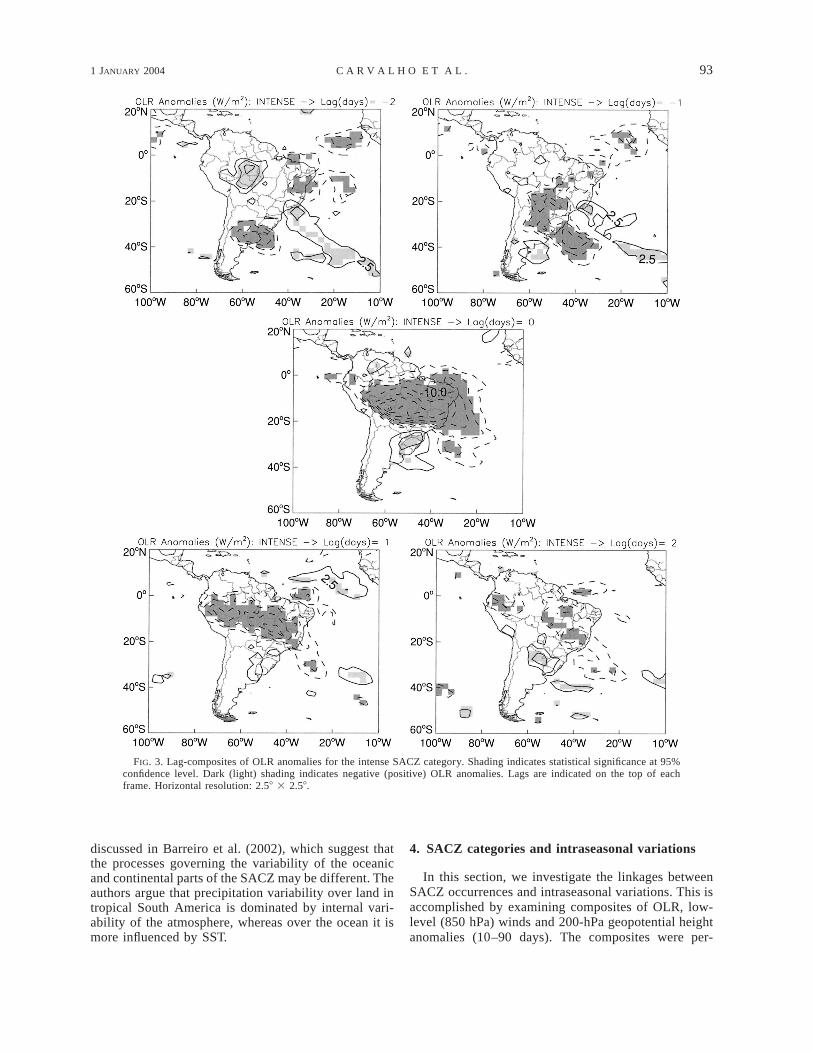
Composites of weak category (Fig. 4, top left andright, respectively) indicate that large-scale suppressionof convective activity over tropical South America doesnot seem to result from the propagation of transientdisturbances or those are too weak to show a coherentpattern of negative anomalies, in contrast to the intenseSACZ. The extent of positive OLR anomalies with max-imum located over eastern Brazil at lags 0, 1, and 2(Fig. 4, middle, left and right bottom, respectively) is
also evident. Negative OLR anomalies are observedover southern Brazil and Uruguay from lags 0 to 2 days.
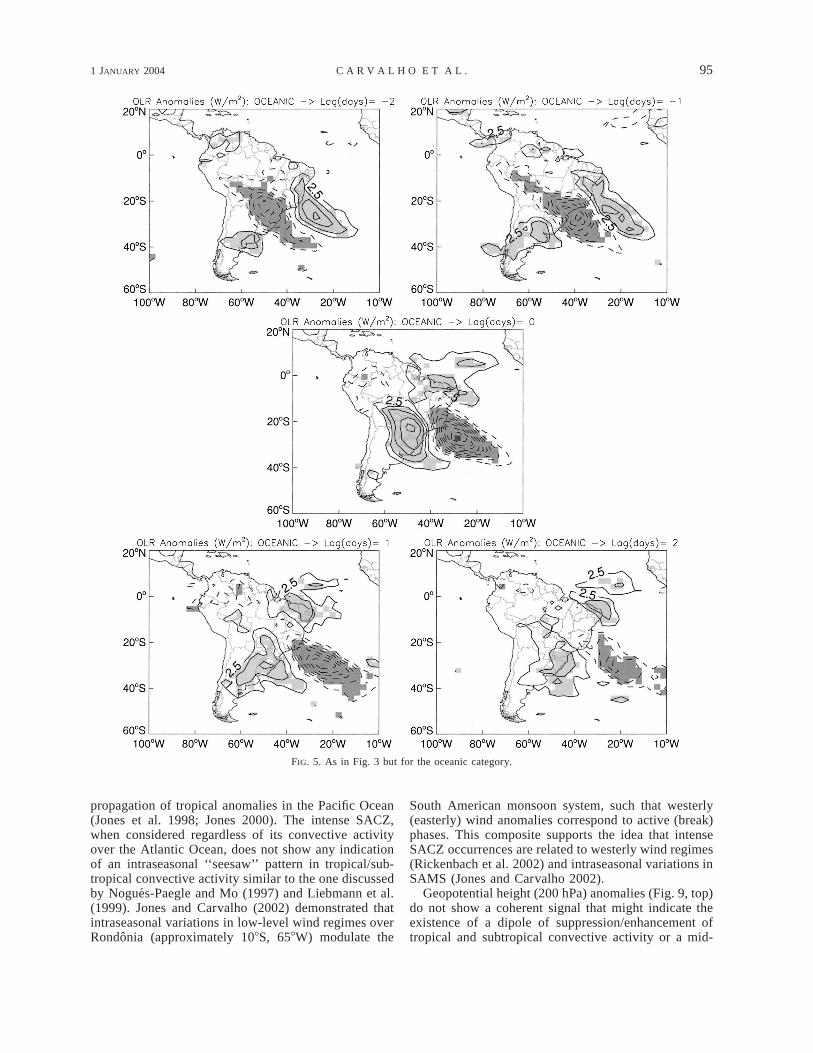
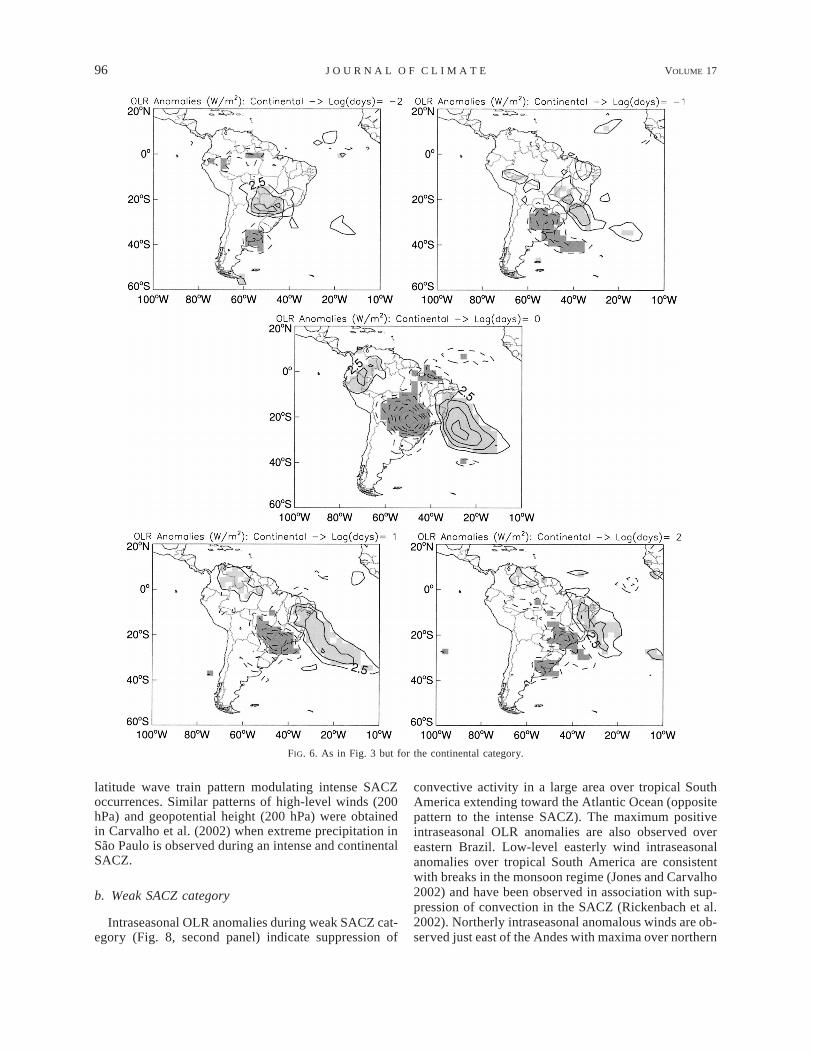
Lag composites of oceanic SACZ (Fig. 5) indicatethat this category is preceded by the propagation ofmidlatitude disturbances (lag 22 to lag 21: Fig. 5, topleft and right). Note also the suppression of convectiveactivity equatorward of the maximum convective activ-ity at all lags. At lag 0 (Fig. 5, middle), the presenceof a seesaw of suppressed and enhanced convection overthe SACZ and subtropics, as discussed in Nogues-Pae-gle and Mo (1997), is clearly indicated. The oceaniccharacteristic of the SACZ and the seesaw remains atlag 1 (Fig. 5, bottom left) and then weakens at lag 2(Fig. 5, bottom right) as convective activity movessoutheastward over the Atlantic Ocean. Lag compositesfor the continental category (Fig. 6) shows that the re-gion with suppressed convection observed equatorwardof the propagating midlatitude disturbance at lags 22and 21 (Fig. 6, top left and right) is now displacedsouthward compared to the oceanic category. Suppres-sion of convection increases over the Atlantic Ocean asconvective activity enhances over the continent at lag0 (Fig. 6, middle), a feature almost symmetric to theoceanic SACZ (cf. Fig. 6, middle, with Fig. 5, middle).Negative anomalies over the continent become moreelongated to the ocean as convection decays (Fig. 6,bottom left and right).
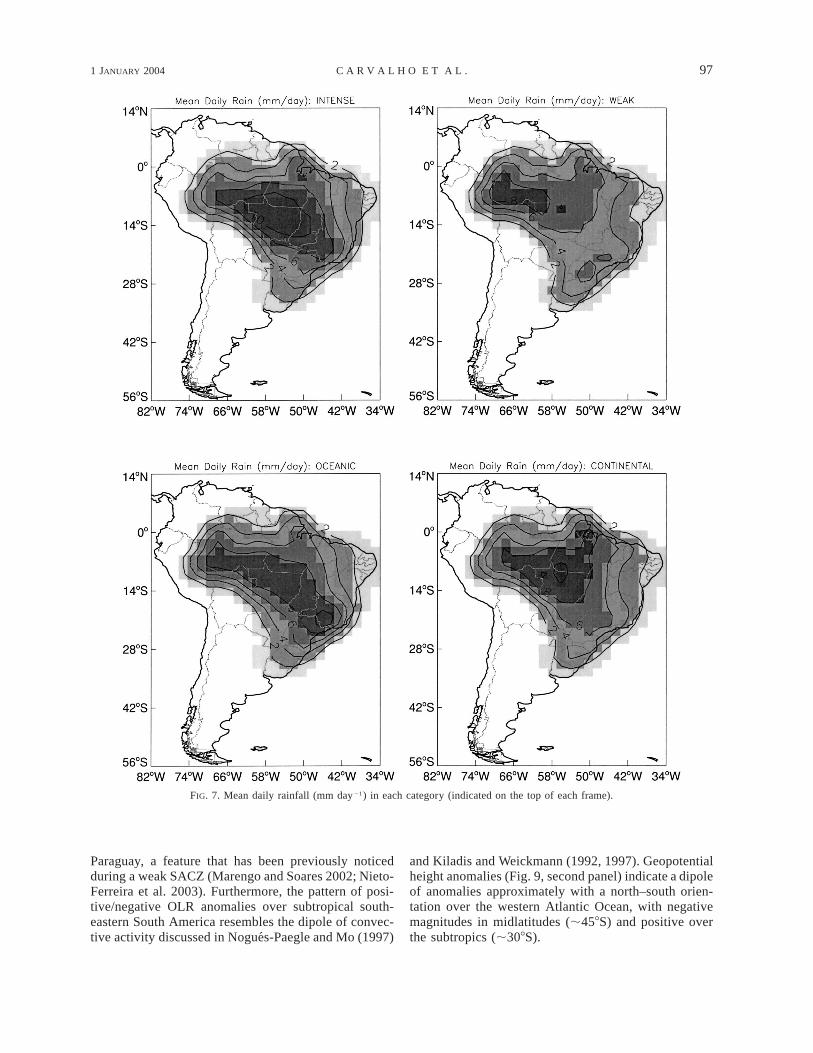
Composites of daily rainfall (Fig. 7) over Brazil pro-vide additional evidence that our methodology is quitepowerful in distinguishing different categories ofSACZ. Intense SACZ (Fig. 7, top left) clearly resemblesthe DJF daily rainfall climatology, with maximum pre-cipitation extending from the Amazon toward south-eastern Brazil with a northwest–southeast orientation(cf. Fig. 1, top). These characteristics are consistent withthe respective maximum of negative OLR anomaliesobtained at lag 0 (Fig. 3, middle). Consistent with OLRanomalies (Fig. 4, middle), the weak category (Fig. 7,top right) shows a decrease of daily precipitation overcentral, eastern, and southeastern Brazil compared tothe climatology (Fig. 1, top). The oceanic category (Fig.7, bottom left) indicates the displacement of maximumrainfall toward southeastern Brazil, a feature that doesnot resemble the climatology (cf. Fig. 1, top). The con-tinental category (Fig. 7, bottom right) shows the retreatof maximum precipitation toward the center of the Am-azon. Note that the maximum of negative OLR anom-alies for the continental category (Fig. 6, middle) ismostly located in a region with scarce number of stationsand intermittent observations, which restricts an appro-priate identification of daily rainfall patterns in this area.Nevertheless, the continental category also shows anelongated feature toward southeast Brazil at lags 0 to 2(Fig. 6, middle and bottom left and right). This is animportant point to note about the methodology describedhere, that is, our approach clearly distinguishes the geo-graphical variability of the SACZ. The SACZ featuresshown here seem to support the numerical simulations
1 JANUARY 2004 93C A R V A L H O E T A L .
FIG. 3. Lag-composites of OLR anomalies for the intense SACZ category. Shading indicates statistical significance at 95%confidence level. Dark (light) shading indicates negative (positive) OLR anomalies. Lags are indicated on the top of eachframe. Horizontal resolution: 2.58 3 2.58.
discussed in Barreiro et al. (2002), which suggest thatthe processes governing the variability of the oceanicand continental parts of the SACZ may be different. Theauthors argue that precipitation variability over land intropical South America is dominated by internal vari-ability of the atmosphere, whereas over the ocean it ismore influenced by SST.
4. SACZ categories and intraseasonal variations
In this section, we investigate the linkages betweenSACZ occurrences and intraseasonal variations. This isaccomplished by examining composites of OLR, low-level (850 hPa) winds and 200-hPa geopotential heightanomalies (10–90 days). The composites were per-
94 VOLUME 17J O U R N A L O F C L I M A T E
FIG. 4. As in Fig. 3 but for the weak category.
formed by averaging the intraseasonal anomalies on thedates of the SACZ categories discussed in the previoussection. Likewise, statistical significance is assessed byusing a local t test at the 95% level. The main char-acteristics are summarized as follows.
a. Intense SACZ category
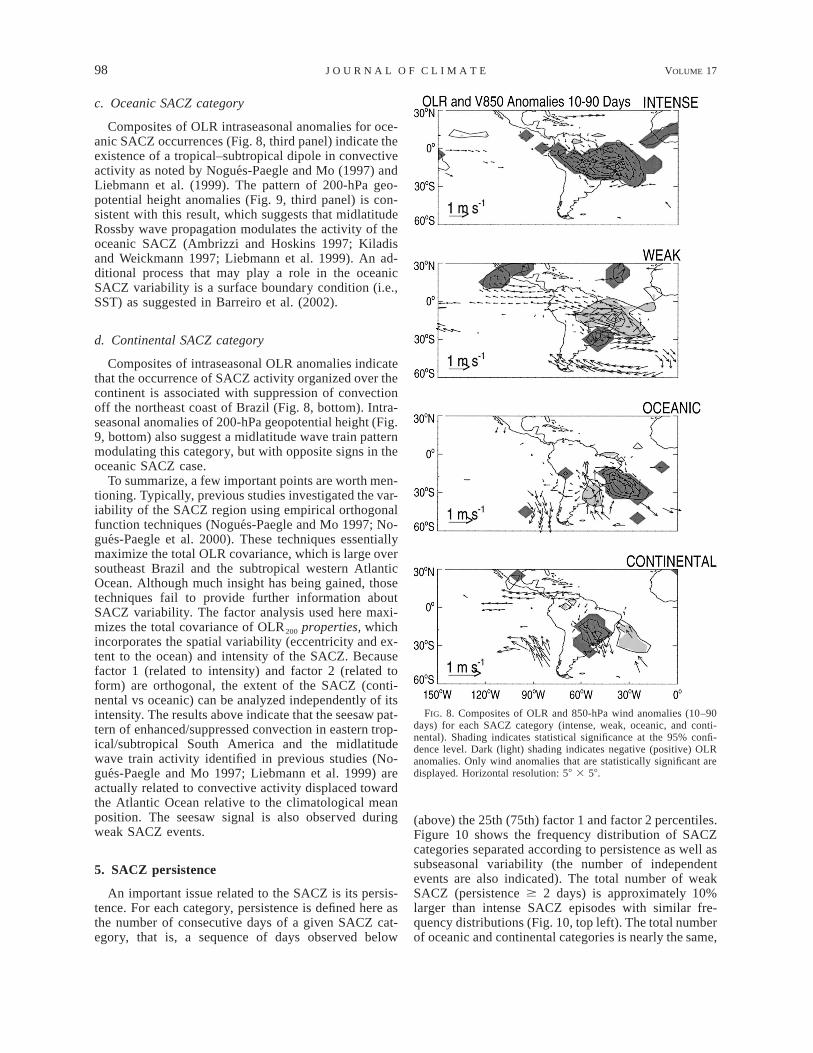
Intense SACZ category (Fig. 8, top) is related to co-herent negative OLR anomalies extending over a large
portion of tropical South America (Amazon basin to theAtlantic Ocean) with minimum values over eastern Bra-zil. Interestingly enough, the maximum in the intrasea-sonal negative anomaly is displaced toward northeastBrazil, comparatively to what is observed for the anom-alies from the climatology (cf. Fig. 3 middle with Fig.8 top) and is collocated with the maximum in the OLRstandard deviation (Fig. 1, bottom). As discussed in de-tail in section 7, the maximum in intraseasonal negativeanomaly over northeast Brazil is likely linked to the
1 JANUARY 2004 95C A R V A L H O E T A L .
FIG. 5. As in Fig. 3 but for the oceanic category.
propagation of tropical anomalies in the Pacific Ocean(Jones et al. 1998; Jones 2000). The intense SACZ,when considered regardless of its convective activityover the Atlantic Ocean, does not show any indicationof an intraseasonal ‘‘seesaw’’ pattern in tropical/sub-tropical convective activity similar to the one discussedby Nogues-Paegle and Mo (1997) and Liebmann et al.(1999). Jones and Carvalho (2002) demonstrated thatintraseasonal variations in low-level wind regimes overRondonia (approximately 108S, 658W) modulate the
South American monsoon system, such that westerly(easterly) wind anomalies correspond to active (break)phases. This composite supports the idea that intenseSACZ occurrences are related to westerly wind regimes(Rickenbach et al. 2002) and intraseasonal variations inSAMS (Jones and Carvalho 2002).
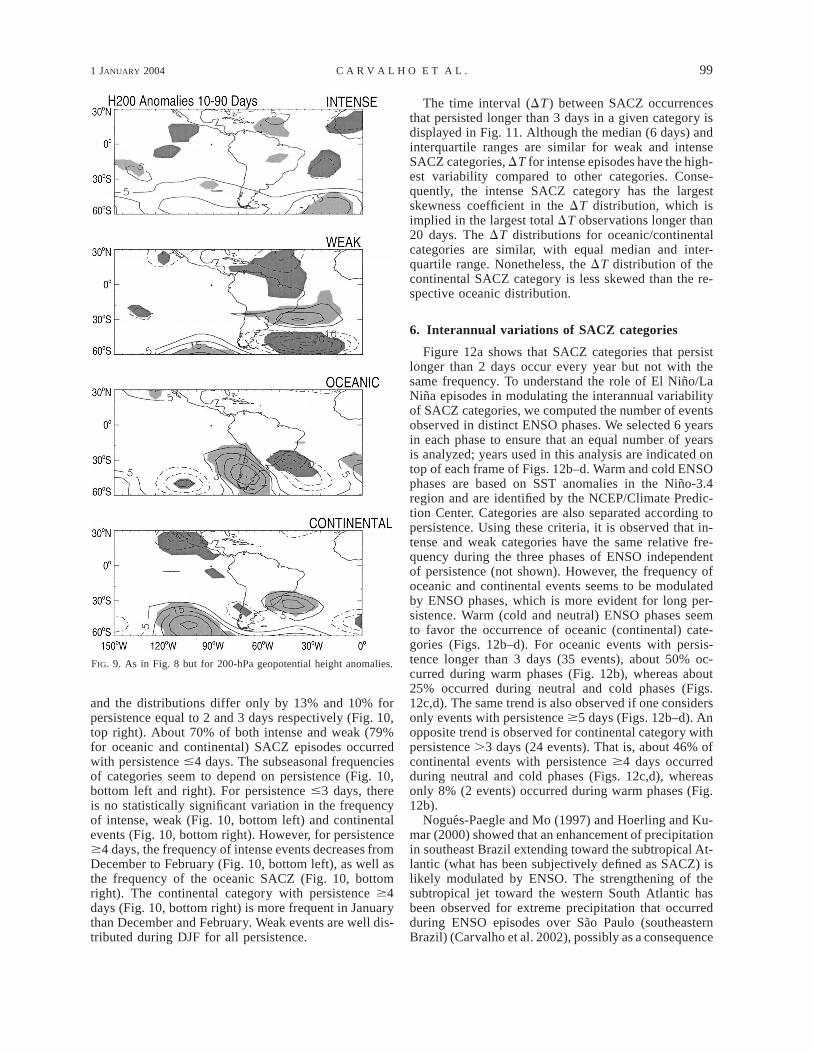
Geopotential height (200 hPa) anomalies (Fig. 9, top)do not show a coherent signal that might indicate theexistence of a dipole of suppression/enhancement oftropical and subtropical convective activity or a mid-
96 VOLUME 17J O U R N A L O F C L I M A T E
FIG. 6. As in Fig. 3 but for the continental category.
latitude wave train pattern modulating intense SACZoccurrences. Similar patterns of high-level winds (200hPa) and geopotential height (200 hPa) were obtainedin Carvalho et al. (2002) when extreme precipitation inSao Paulo is observed during an intense and continentalSACZ.
b. Weak SACZ category
Intraseasonal OLR anomalies during weak SACZ cat-egory (Fig. 8, second panel) indicate suppression of
convective activity in a large area over tropical SouthAmerica extending toward the Atlantic Ocean (oppositepattern to the intense SACZ). The maximum positiveintraseasonal OLR anomalies are also observed overeastern Brazil. Low-level easterly wind intraseasonalanomalies over tropical South America are consistentwith breaks in the monsoon regime (Jones and Carvalho2002) and have been observed in association with sup-pression of convection in the SACZ (Rickenbach et al.2002). Northerly intraseasonal anomalous winds are ob-served just east of the Andes with maxima over northern
1 JANUARY 2004 97C A R V A L H O E T A L .
FIG. 7. Mean daily rainfall (mm day21) in each category (indicated on the top of each frame).
Paraguay, a feature that has been previously noticedduring a weak SACZ (Marengo and Soares 2002; Nieto-Ferreira et al. 2003). Furthermore, the pattern of posi-tive/negative OLR anomalies over subtropical south-eastern South America resembles the dipole of convec-tive activity discussed in Nogues-Paegle and Mo (1997)
and Kiladis and Weickmann (1992, 1997). Geopotentialheight anomalies (Fig. 9, second panel) indicate a dipoleof anomalies approximately with a north–south orien-tation over the western Atlantic Ocean, with negativemagnitudes in midlatitudes (;458S) and positive overthe subtropics (;308S).
98 VOLUME 17J O U R N A L O F C L I M A T E
FIG. 8. Composites of OLR and 850-hPa wind anomalies (10–90days) for each SACZ category (intense, weak, oceanic, and conti-nental). Shading indicates statistical significance at the 95% confi-dence level. Dark (light) shading indicates negative (positive) OLRanomalies. Only wind anomalies that are statistically significant aredisplayed. Horizontal resolution: 58 3 58.
c. Oceanic SACZ category
Composites of OLR intraseasonal anomalies for oce-anic SACZ occurrences (Fig. 8, third panel) indicate theexistence of a tropical–subtropical dipole in convectiveactivity as noted by Nogues-Paegle and Mo (1997) andLiebmann et al. (1999). The pattern of 200-hPa geo-potential height anomalies (Fig. 9, third panel) is con-sistent with this result, which suggests that midlatitudeRossby wave propagation modulates the activity of theoceanic SACZ (Ambrizzi and Hoskins 1997; Kiladisand Weickmann 1997; Liebmann et al. 1999). An ad-ditional process that may play a role in the oceanicSACZ variability is a surface boundary condition (i.e.,SST) as suggested in Barreiro et al. (2002).
d. Continental SACZ category
Composites of intraseasonal OLR anomalies indicatethat the occurrence of SACZ activity organized over thecontinent is associated with suppression of convectionoff the northeast coast of Brazil (Fig. 8, bottom). Intra-seasonal anomalies of 200-hPa geopotential height (Fig.9, bottom) also suggest a midlatitude wave train patternmodulating this category, but with opposite signs in theoceanic SACZ case.
To summarize, a few important points are worth men-tioning. Typically, previous studies investigated the var-iability of the SACZ region using empirical orthogonalfunction techniques (Nogues-Paegle and Mo 1997; No-gues-Paegle et al. 2000). These techniques essentiallymaximize the total OLR covariance, which is large oversoutheast Brazil and the subtropical western AtlanticOcean. Although much insight has being gained, thosetechniques fail to provide further information aboutSACZ variability. The factor analysis used here maxi-mizes the total covariance of OLR200 properties, whichincorporates the spatial variability (eccentricity and ex-tent to the ocean) and intensity of the SACZ. Becausefactor 1 (related to intensity) and factor 2 (related toform) are orthogonal, the extent of the SACZ (conti-nental vs oceanic) can be analyzed independently of itsintensity. The results above indicate that the seesaw pat-tern of enhanced/suppressed convection in eastern trop-ical/subtropical South America and the midlatitudewave train activity identified in previous studies (No-gues-Paegle and Mo 1997; Liebmann et al. 1999) areactually related to convective activity displaced towardthe Atlantic Ocean relative to the climatological meanposition. The seesaw signal is also observed duringweak SACZ events.
5. SACZ persistence
An important issue related to the SACZ is its persis-tence. For each category, persistence is defined here asthe number of consecutive days of a given SACZ cat-egory, that is, a sequence of days observed below
(above) the 25th (75th) factor 1 and factor 2 percentiles.Figure 10 shows the frequency distribution of SACZcategories separated according to persistence as well assubseasonal variability (the number of independentevents are also indicated). The total number of weakSACZ (persistence $ 2 days) is approximately 10%larger than intense SACZ episodes with similar fre-quency distributions (Fig. 10, top left). The total numberof oceanic and continental categories is nearly the same,
1 JANUARY 2004 99C A R V A L H O E T A L .
FIG. 9. As in Fig. 8 but for 200-hPa geopotential height anomalies.
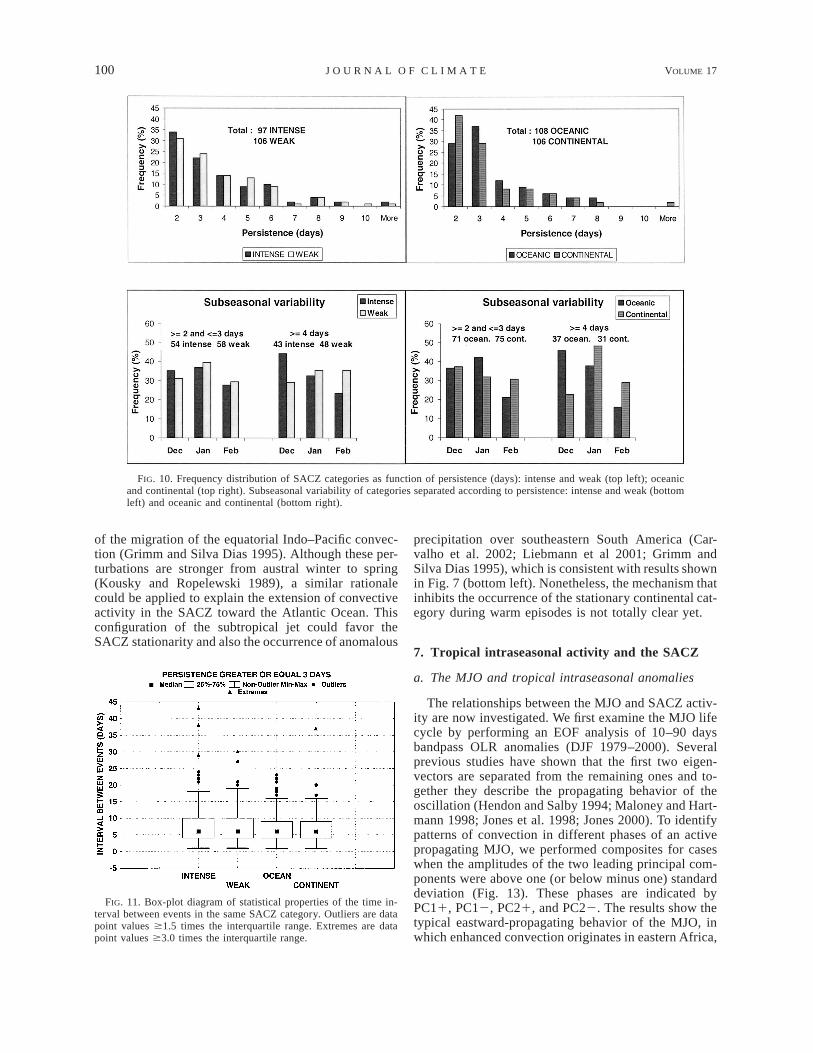
and the distributions differ only by 13% and 10% forpersistence equal to 2 and 3 days respectively (Fig. 10,top right). About 70% of both intense and weak (79%for oceanic and continental) SACZ episodes occurredwith persistence #4 days. The subseasonal frequenciesof categories seem to depend on persistence (Fig. 10,bottom left and right). For persistence #3 days, thereis no statistically significant variation in the frequencyof intense, weak (Fig. 10, bottom left) and continentalevents (Fig. 10, bottom right). However, for persistence$4 days, the frequency of intense events decreases fromDecember to February (Fig. 10, bottom left), as well asthe frequency of the oceanic SACZ (Fig. 10, bottomright). The continental category with persistence $4days (Fig. 10, bottom right) is more frequent in Januarythan December and February. Weak events are well dis-tributed during DJF for all persistence.
The time interval (DT) between SACZ occurrencesthat persisted longer than 3 days in a given category isdisplayed in Fig. 11. Although the median (6 days) andinterquartile ranges are similar for weak and intenseSACZ categories, DT for intense episodes have the high-est variability compared to other categories. Conse-quently, the intense SACZ category has the largestskewness coefficient in the DT distribution, which isimplied in the largest total DT observations longer than20 days. The DT distributions for oceanic/continentalcategories are similar, with equal median and inter-quartile range. Nonetheless, the DT distribution of thecontinental SACZ category is less skewed than the re-spective oceanic distribution.
6. Interannual variations of SACZ categories
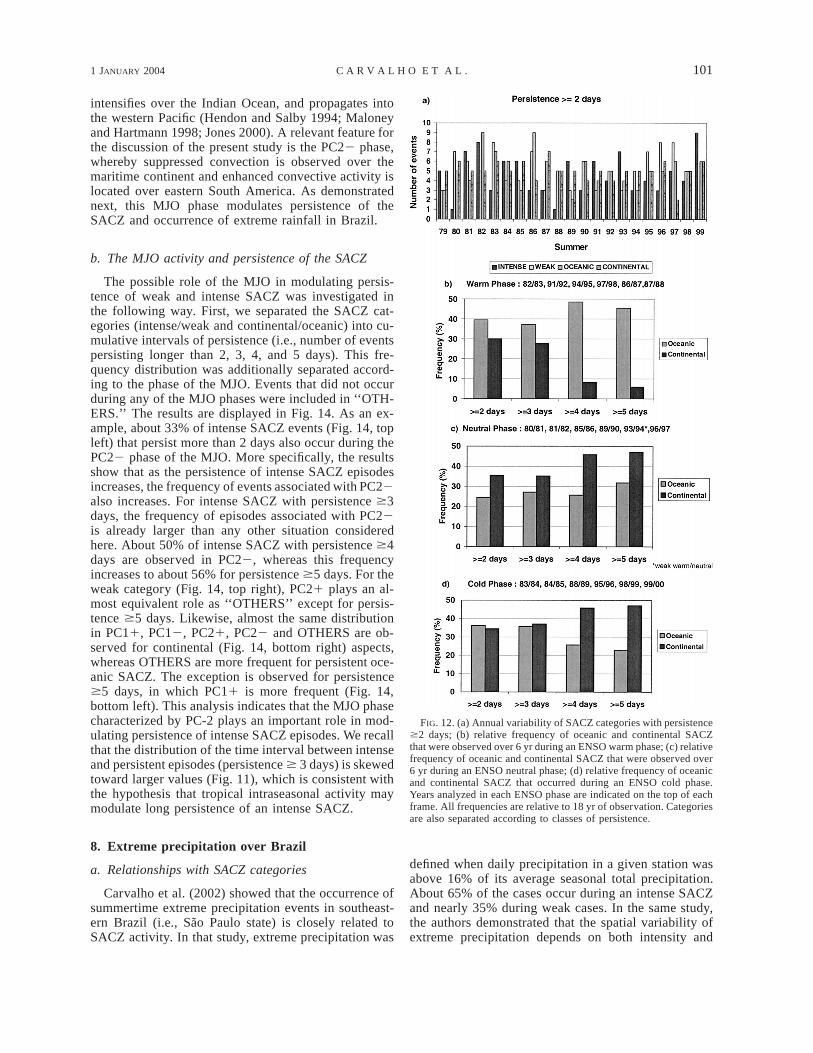
Figure 12a shows that SACZ categories that persistlonger than 2 days occur every year but not with thesame frequency. To understand the role of El Nino/LaNina episodes in modulating the interannual variabilityof SACZ categories, we computed the number of eventsobserved in distinct ENSO phases. We selected 6 yearsin each phase to ensure that an equal number of yearsis analyzed; years used in this analysis are indicated ontop of each frame of Figs. 12b–d. Warm and cold ENSOphases are based on SST anomalies in the Nino-3.4region and are identified by the NCEP/Climate Predic-tion Center. Categories are also separated according topersistence. Using these criteria, it is observed that in-tense and weak categories have the same relative fre-quency during the three phases of ENSO independentof persistence (not shown). However, the frequency ofoceanic and continental events seems to be modulatedby ENSO phases, which is more evident for long per-sistence. Warm (cold and neutral) ENSO phases seemto favor the occurrence of oceanic (continental) cate-gories (Figs. 12b–d). For oceanic events with persis-tence longer than 3 days (35 events), about 50% oc-curred during warm phases (Fig. 12b), whereas about25% occurred during neutral and cold phases (Figs.12c,d). The same trend is also observed if one considersonly events with persistence $5 days (Figs. 12b–d). Anopposite trend is observed for continental category withpersistence .3 days (24 events). That is, about 46% ofcontinental events with persistence $4 days occurredduring neutral and cold phases (Figs. 12c,d), whereasonly 8% (2 events) occurred during warm phases (Fig.12b).
Nogues-Paegle and Mo (1997) and Hoerling and Ku-mar (2000) showed that an enhancement of precipitationin southeast Brazil extending toward the subtropical At-lantic (what has been subjectively defined as SACZ) islikely modulated by ENSO. The strengthening of thesubtropical jet toward the western South Atlantic hasbeen observed for extreme precipitation that occurredduring ENSO episodes over Sao Paulo (southeasternBrazil) (Carvalho et al. 2002), possibly as a consequence
100 VOLUME 17J O U R N A L O F C L I M A T E
FIG. 10. Frequency distribution of SACZ categories as function of persistence (days): intense and weak (top left); oceanicand continental (top right). Subseasonal variability of categories separated according to persistence: intense and weak (bottomleft) and oceanic and continental (bottom right).
FIG. 11. Box-plot diagram of statistical properties of the time in-terval between events in the same SACZ category. Outliers are datapoint values $1.5 times the interquartile range. Extremes are datapoint values $3.0 times the interquartile range.
of the migration of the equatorial Indo–Pacific convec-tion (Grimm and Silva Dias 1995). Although these per-turbations are stronger from austral winter to spring(Kousky and Ropelewski 1989), a similar rationalecould be applied to explain the extension of convectiveactivity in the SACZ toward the Atlantic Ocean. Thisconfiguration of the subtropical jet could favor theSACZ stationarity and also the occurrence of anomalous
precipitation over southeastern South America (Car-valho et al. 2002; Liebmann et al 2001; Grimm andSilva Dias 1995), which is consistent with results shownin Fig. 7 (bottom left). Nonetheless, the mechanism thatinhibits the occurrence of the stationary continental cat-egory during warm episodes is not totally clear yet.
7. Tropical intraseasonal activity and the SACZ
a. The MJO and tropical intraseasonal anomalies
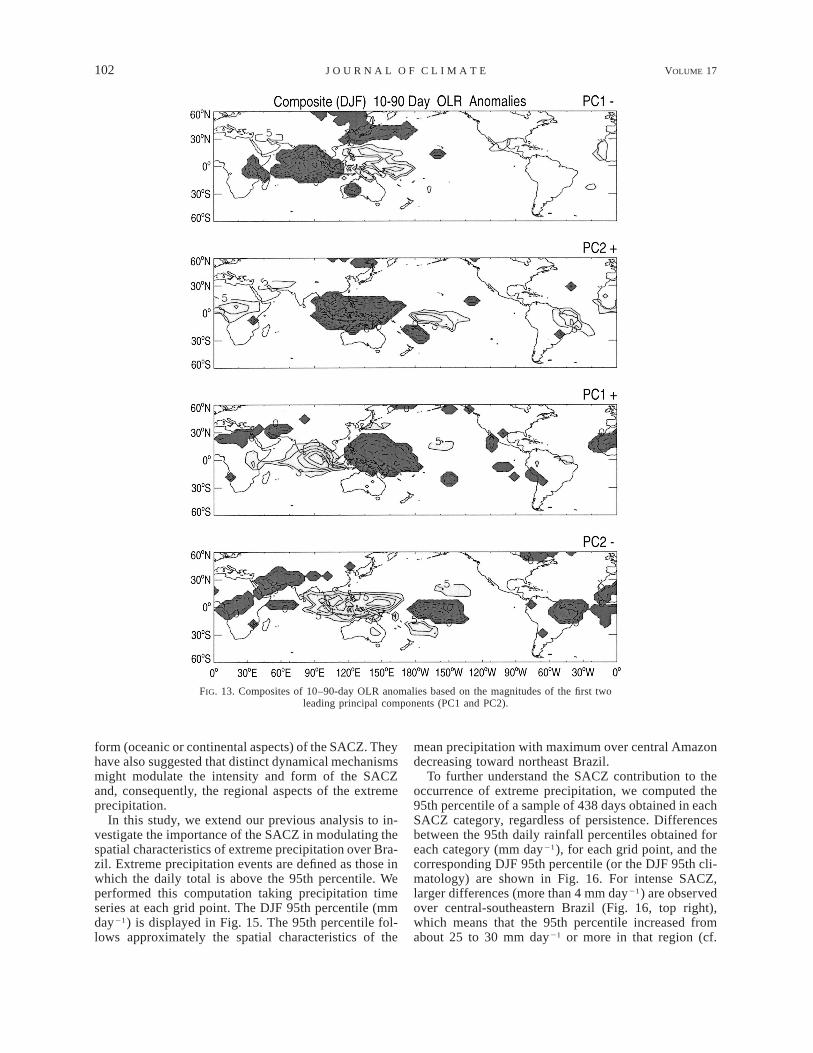
The relationships between the MJO and SACZ activ-ity are now investigated. We first examine the MJO lifecycle by performing an EOF analysis of 10–90 daysbandpass OLR anomalies (DJF 1979–2000). Severalprevious studies have shown that the first two eigen-vectors are separated from the remaining ones and to-gether they describe the propagating behavior of theoscillation (Hendon and Salby 1994; Maloney and Hart-mann 1998; Jones et al. 1998; Jones 2000). To identifypatterns of convection in different phases of an activepropagating MJO, we performed composites for caseswhen the amplitudes of the two leading principal com-ponents were above one (or below minus one) standarddeviation (Fig. 13). These phases are indicated byPC11, PC12, PC21, and PC22. The results show thetypical eastward-propagating behavior of the MJO, inwhich enhanced convection originates in eastern Africa,
1 JANUARY 2004 101C A R V A L H O E T A L .
FIG. 12. (a) Annual variability of SACZ categories with persistence$2 days; (b) relative frequency of oceanic and continental SACZthat were observed over 6 yr during an ENSO warm phase; (c) relativefrequency of oceanic and continental SACZ that were observed over6 yr during an ENSO neutral phase; (d) relative frequency of oceanicand continental SACZ that occurred during an ENSO cold phase.Years analyzed in each ENSO phase are indicated on the top of eachframe. All frequencies are relative to 18 yr of observation. Categoriesare also separated according to classes of persistence.
intensifies over the Indian Ocean, and propagates intothe western Pacific (Hendon and Salby 1994; Maloneyand Hartmann 1998; Jones 2000). A relevant feature forthe discussion of the present study is the PC22 phase,whereby suppressed convection is observed over themaritime continent and enhanced convective activity islocated over eastern South America. As demonstratednext, this MJO phase modulates persistence of theSACZ and occurrence of extreme rainfall in Brazil.
b. The MJO activity and persistence of the SACZ
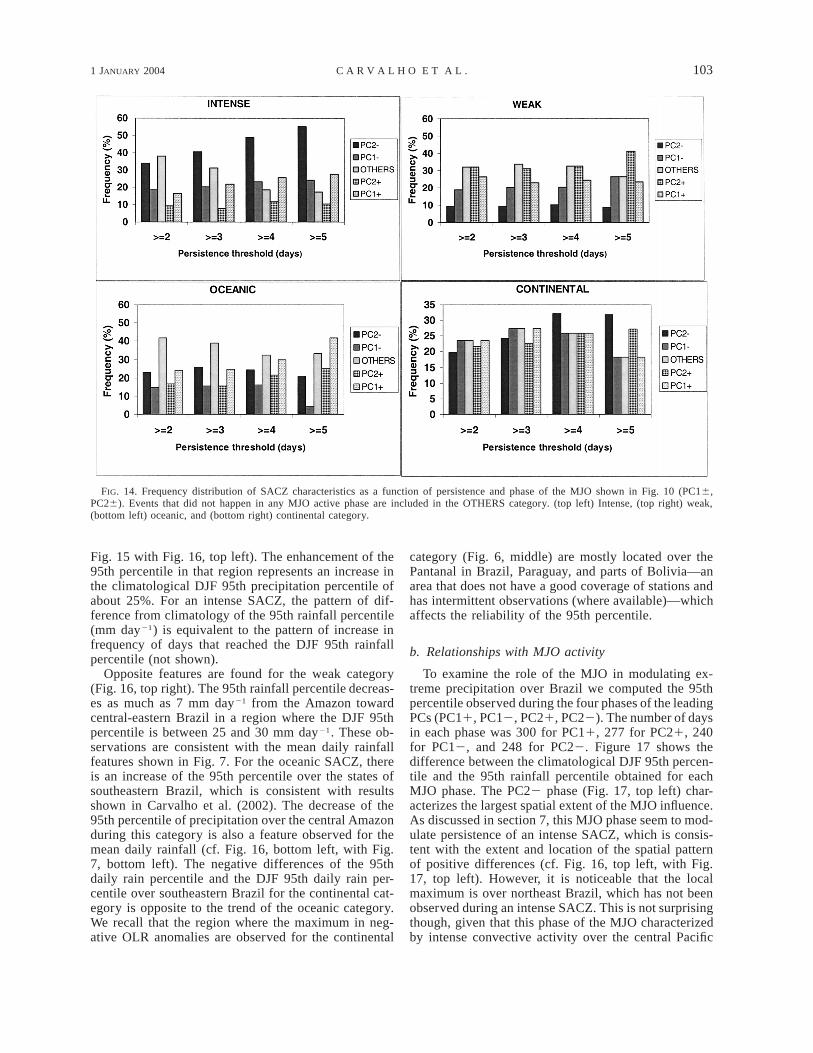
The possible role of the MJO in modulating persis-tence of weak and intense SACZ was investigated inthe following way. First, we separated the SACZ cat-egories (intense/weak and continental/oceanic) into cu-mulative intervals of persistence (i.e., number of eventspersisting longer than 2, 3, 4, and 5 days). This fre-quency distribution was additionally separated accord-ing to the phase of the MJO. Events that did not occurduring any of the MJO phases were included in ‘‘OTH-ERS.’’ The results are displayed in Fig. 14. As an ex-ample, about 33% of intense SACZ events (Fig. 14, topleft) that persist more than 2 days also occur during thePC22 phase of the MJO. More specifically, the resultsshow that as the persistence of intense SACZ episodesincreases, the frequency of events associated with PC22also increases. For intense SACZ with persistence $3days, the frequency of episodes associated with PC22is already larger than any other situation consideredhere. About 50% of intense SACZ with persistence $4days are observed in PC22, whereas this frequencyincreases to about 56% for persistence $5 days. For theweak category (Fig. 14, top right), PC21 plays an al-most equivalent role as ‘‘OTHERS’’ except for persis-tence $5 days. Likewise, almost the same distributionin PC11, PC12, PC21, PC22 and OTHERS are ob-served for continental (Fig. 14, bottom right) aspects,whereas OTHERS are more frequent for persistent oce-anic SACZ. The exception is observed for persistence$5 days, in which PC11 is more frequent (Fig. 14,bottom left). This analysis indicates that the MJO phasecharacterized by PC-2 plays an important role in mod-ulating persistence of intense SACZ episodes. We recallthat the distribution of the time interval between intenseand persistent episodes (persistence $ 3 days) is skewedtoward larger values (Fig. 11), which is consistent withthe hypothesis that tropical intraseasonal activity maymodulate long persistence of an intense SACZ.
8. Extreme precipitation over Brazil
a. Relationships with SACZ categories
Carvalho et al. (2002) showed that the occurrence ofsummertime extreme precipitation events in southeast-ern Brazil (i.e., Sao Paulo state) is closely related toSACZ activity. In that study, extreme precipitation was
defined when daily precipitation in a given station wasabove 16% of its average seasonal total precipitation.About 65% of the cases occur during an intense SACZand nearly 35% during weak cases. In the same study,the authors demonstrated that the spatial variability ofextreme precipitation depends on both intensity and
102 VOLUME 17J O U R N A L O F C L I M A T E
FIG. 13. Composites of 10–90-day OLR anomalies based on the magnitudes of the first twoleading principal components (PC1 and PC2).
form (oceanic or continental aspects) of the SACZ. Theyhave also suggested that distinct dynamical mechanismsmight modulate the intensity and form of the SACZand, consequently, the regional aspects of the extremeprecipitation.
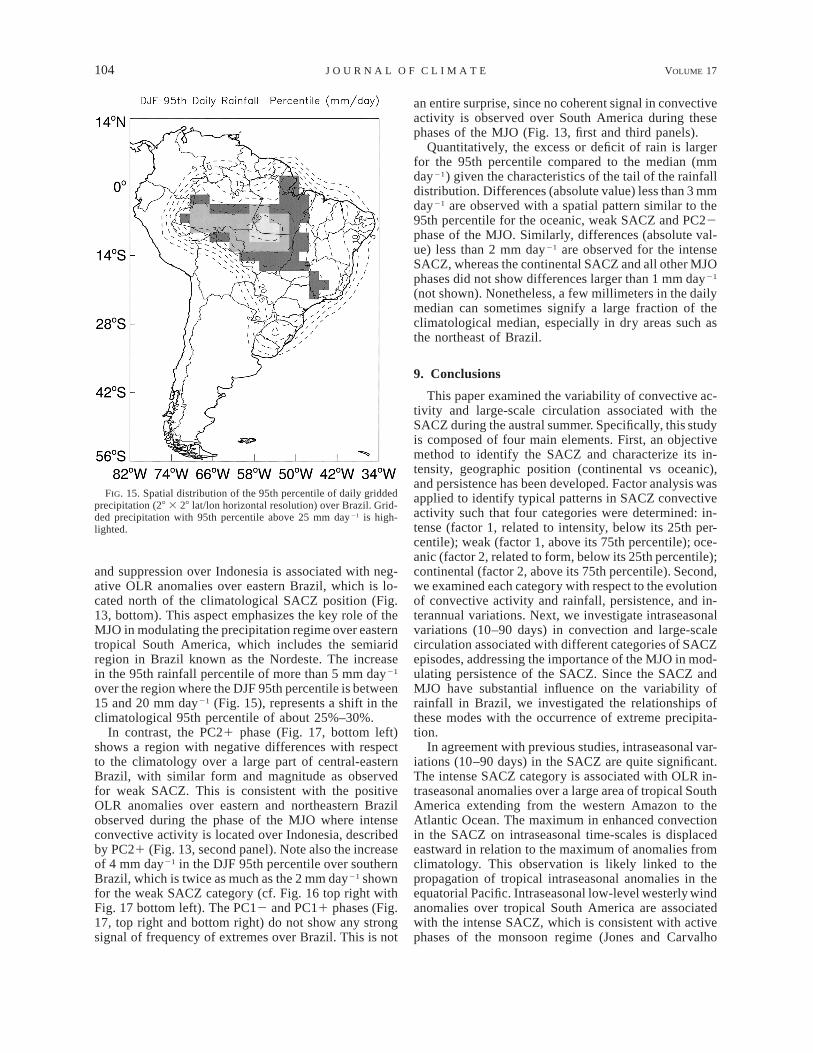
In this study, we extend our previous analysis to in-vestigate the importance of the SACZ in modulating thespatial characteristics of extreme precipitation over Bra-zil. Extreme precipitation events are defined as those inwhich the daily total is above the 95th percentile. Weperformed this computation taking precipitation timeseries at each grid point. The DJF 95th percentile (mmday21) is displayed in Fig. 15. The 95th percentile fol-lows approximately the spatial characteristics of the
mean precipitation with maximum over central Amazondecreasing toward northeast Brazil.
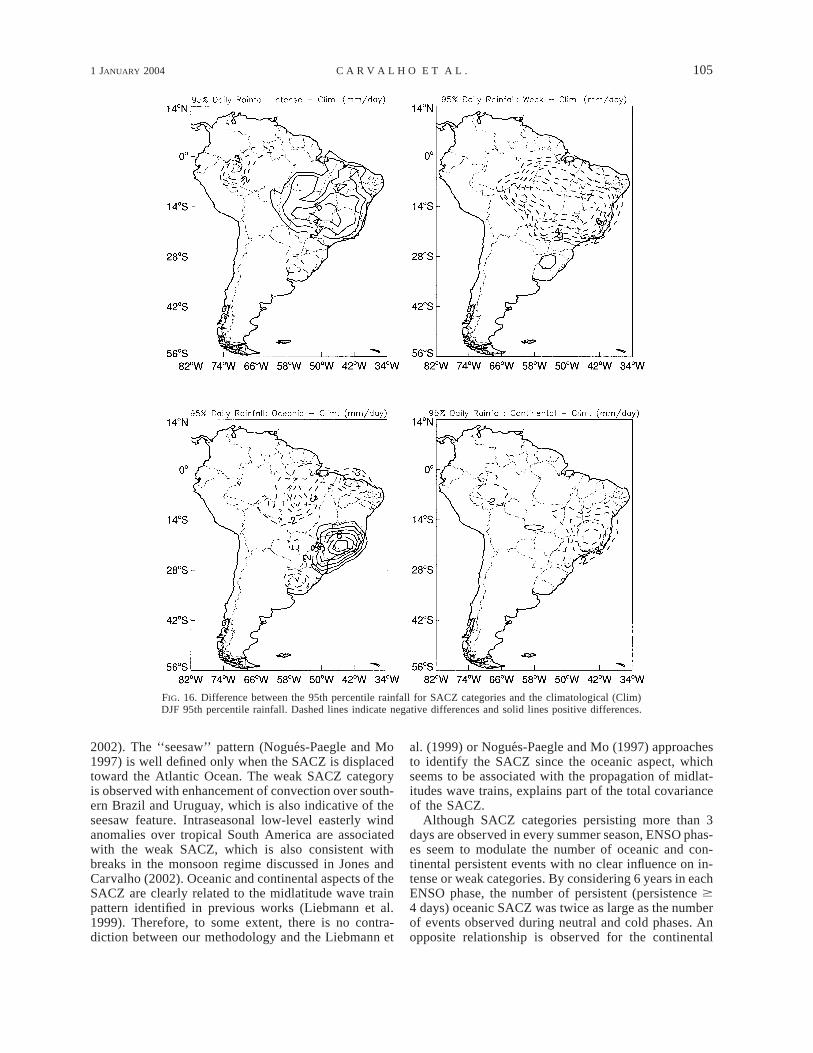
To further understand the SACZ contribution to theoccurrence of extreme precipitation, we computed the95th percentile of a sample of 438 days obtained in eachSACZ category, regardless of persistence. Differencesbetween the 95th daily rainfall percentiles obtained foreach category (mm day21), for each grid point, and thecorresponding DJF 95th percentile (or the DJF 95th cli-matology) are shown in Fig. 16. For intense SACZ,larger differences (more than 4 mm day21) are observedover central-southeastern Brazil (Fig. 16, top right),which means that the 95th percentile increased fromabout 25 to 30 mm day21 or more in that region (cf.
1 JANUARY 2004 103C A R V A L H O E T A L .
FIG. 14. Frequency distribution of SACZ characteristics as a function of persistence and phase of the MJO shown in Fig. 10 (PC16,PC26). Events that did not happen in any MJO active phase are included in the OTHERS category. (top left) Intense, (top right) weak,(bottom left) oceanic, and (bottom right) continental category.
Fig. 15 with Fig. 16, top left). The enhancement of the95th percentile in that region represents an increase inthe climatological DJF 95th precipitation percentile ofabout 25%. For an intense SACZ, the pattern of dif-ference from climatology of the 95th rainfall percentile(mm day21) is equivalent to the pattern of increase infrequency of days that reached the DJF 95th rainfallpercentile (not shown).
Opposite features are found for the weak category(Fig. 16, top right). The 95th rainfall percentile decreas-es as much as 7 mm day21 from the Amazon towardcentral-eastern Brazil in a region where the DJF 95thpercentile is between 25 and 30 mm day21. These ob-servations are consistent with the mean daily rainfallfeatures shown in Fig. 7. For the oceanic SACZ, thereis an increase of the 95th percentile over the states ofsoutheastern Brazil, which is consistent with resultsshown in Carvalho et al. (2002). The decrease of the95th percentile of precipitation over the central Amazonduring this category is also a feature observed for themean daily rainfall (cf. Fig. 16, bottom left, with Fig.7, bottom left). The negative differences of the 95thdaily rain percentile and the DJF 95th daily rain per-centile over southeastern Brazil for the continental cat-egory is opposite to the trend of the oceanic category.We recall that the region where the maximum in neg-ative OLR anomalies are observed for the continental
category (Fig. 6, middle) are mostly located over thePantanal in Brazil, Paraguay, and parts of Bolivia—anarea that does not have a good coverage of stations andhas intermittent observations (where available)—whichaffects the reliability of the 95th percentile.
b. Relationships with MJO activity
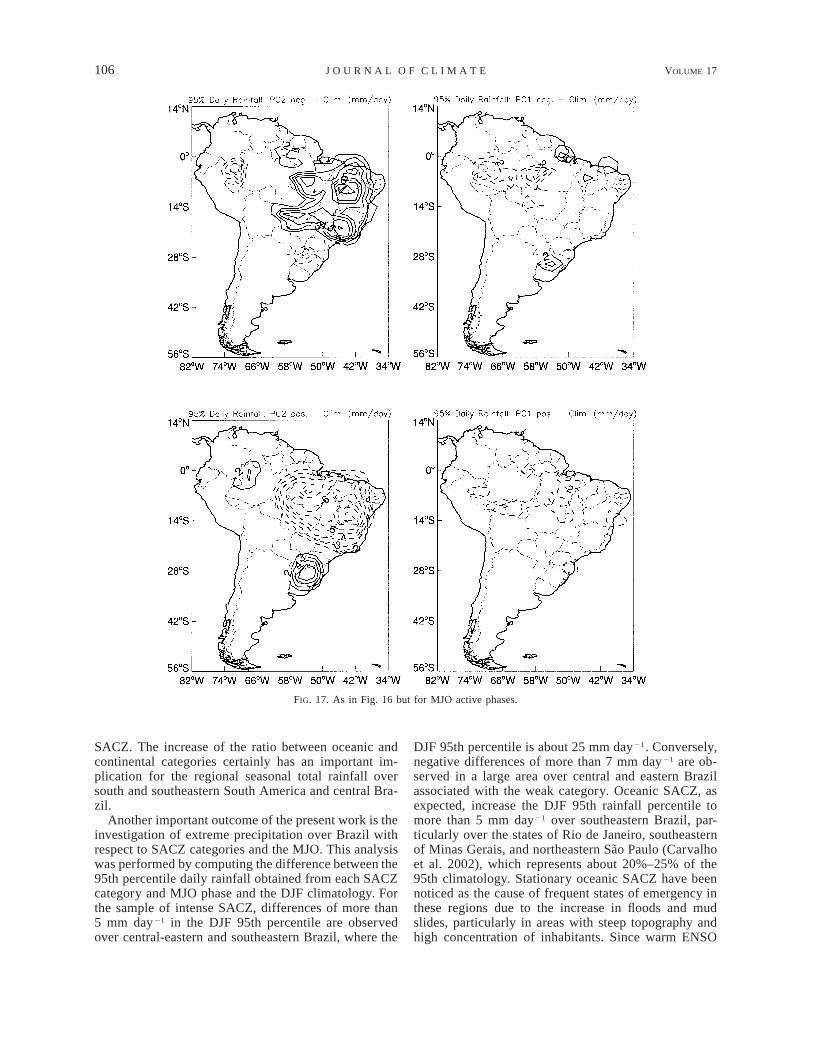
To examine the role of the MJO in modulating ex-treme precipitation over Brazil we computed the 95thpercentile observed during the four phases of the leadingPCs (PC11, PC12, PC21, PC22). The number of daysin each phase was 300 for PC11, 277 for PC21, 240for PC12, and 248 for PC22. Figure 17 shows thedifference between the climatological DJF 95th percen-tile and the 95th rainfall percentile obtained for eachMJO phase. The PC22 phase (Fig. 17, top left) char-acterizes the largest spatial extent of the MJO influence.As discussed in section 7, this MJO phase seem to mod-ulate persistence of an intense SACZ, which is consis-tent with the extent and location of the spatial patternof positive differences (cf. Fig. 16, top left, with Fig.17, top left). However, it is noticeable that the localmaximum is over northeast Brazil, which has not beenobserved during an intense SACZ. This is not surprisingthough, given that this phase of the MJO characterizedby intense convective activity over the central Pacific
104 VOLUME 17J O U R N A L O F C L I M A T E
FIG. 15. Spatial distribution of the 95th percentile of daily griddedprecipitation (28 3 28 lat/lon horizontal resolution) over Brazil. Grid-ded precipitation with 95th percentile above 25 mm day21 is high-lighted.
and suppression over Indonesia is associated with neg-ative OLR anomalies over eastern Brazil, which is lo-cated north of the climatological SACZ position (Fig.13, bottom). This aspect emphasizes the key role of theMJO in modulating the precipitation regime over easterntropical South America, which includes the semiaridregion in Brazil known as the Nordeste. The increasein the 95th rainfall percentile of more than 5 mm day21
over the region where the DJF 95th percentile is between15 and 20 mm day21 (Fig. 15), represents a shift in theclimatological 95th percentile of about 25%–30%.
In contrast, the PC21 phase (Fig. 17, bottom left)shows a region with negative differences with respectto the climatology over a large part of central-easternBrazil, with similar form and magnitude as observedfor weak SACZ. This is consistent with the positiveOLR anomalies over eastern and northeastern Brazilobserved during the phase of the MJO where intenseconvective activity is located over Indonesia, describedby PC21 (Fig. 13, second panel). Note also the increaseof 4 mm day21 in the DJF 95th percentile over southernBrazil, which is twice as much as the 2 mm day21 shownfor the weak SACZ category (cf. Fig. 16 top right withFig. 17 bottom left). The PC12 and PC11 phases (Fig.17, top right and bottom right) do not show any strongsignal of frequency of extremes over Brazil. This is not
an entire surprise, since no coherent signal in convectiveactivity is observed over South America during thesephases of the MJO (Fig. 13, first and third panels).
Quantitatively, the excess or deficit of rain is largerfor the 95th percentile compared to the median (mmday21) given the characteristics of the tail of the rainfalldistribution. Differences (absolute value) less than 3 mmday21 are observed with a spatial pattern similar to the95th percentile for the oceanic, weak SACZ and PC22phase of the MJO. Similarly, differences (absolute val-ue) less than 2 mm day21 are observed for the intenseSACZ, whereas the continental SACZ and all other MJOphases did not show differences larger than 1 mm day21
(not shown). Nonetheless, a few millimeters in the dailymedian can sometimes signify a large fraction of theclimatological median, especially in dry areas such asthe northeast of Brazil.
9. Conclusions
This paper examined the variability of convective ac-tivity and large-scale circulation associated with theSACZ during the austral summer. Specifically, this studyis composed of four main elements. First, an objectivemethod to identify the SACZ and characterize its in-tensity, geographic position (continental vs oceanic),and persistence has been developed. Factor analysis wasapplied to identify typical patterns in SACZ convectiveactivity such that four categories were determined: in-tense (factor 1, related to intensity, below its 25th per-centile); weak (factor 1, above its 75th percentile); oce-anic (factor 2, related to form, below its 25th percentile);continental (factor 2, above its 75th percentile). Second,we examined each category with respect to the evolutionof convective activity and rainfall, persistence, and in-terannual variations. Next, we investigate intraseasonalvariations (10–90 days) in convection and large-scalecirculation associated with different categories of SACZepisodes, addressing the importance of the MJO in mod-ulating persistence of the SACZ. Since the SACZ andMJO have substantial influence on the variability ofrainfall in Brazil, we investigated the relationships ofthese modes with the occurrence of extreme precipita-tion.
In agreement with previous studies, intraseasonal var-iations (10–90 days) in the SACZ are quite significant.The intense SACZ category is associated with OLR in-traseasonal anomalies over a large area of tropical SouthAmerica extending from the western Amazon to theAtlantic Ocean. The maximum in enhanced convectionin the SACZ on intraseasonal time-scales is displacedeastward in relation to the maximum of anomalies fromclimatology. This observation is likely linked to thepropagation of tropical intraseasonal anomalies in theequatorial Pacific. Intraseasonal low-level westerly windanomalies over tropical South America are associatedwith the intense SACZ, which is consistent with activephases of the monsoon regime (Jones and Carvalho
1 JANUARY 2004 105C A R V A L H O E T A L .
FIG. 16. Difference between the 95th percentile rainfall for SACZ categories and the climatological (Clim)DJF 95th percentile rainfall. Dashed lines indicate negative differences and solid lines positive differences.
2002). The ‘‘seesaw’’ pattern (Nogues-Paegle and Mo1997) is well defined only when the SACZ is displacedtoward the Atlantic Ocean. The weak SACZ categoryis observed with enhancement of convection over south-ern Brazil and Uruguay, which is also indicative of theseesaw feature. Intraseasonal low-level easterly windanomalies over tropical South America are associatedwith the weak SACZ, which is also consistent withbreaks in the monsoon regime discussed in Jones andCarvalho (2002). Oceanic and continental aspects of theSACZ are clearly related to the midlatitude wave trainpattern identified in previous works (Liebmann et al.1999). Therefore, to some extent, there is no contra-diction between our methodology and the Liebmann et
al. (1999) or Nogues-Paegle and Mo (1997) approachesto identify the SACZ since the oceanic aspect, whichseems to be associated with the propagation of midlat-itudes wave trains, explains part of the total covarianceof the SACZ.
Although SACZ categories persisting more than 3days are observed in every summer season, ENSO phas-es seem to modulate the number of oceanic and con-tinental persistent events with no clear influence on in-tense or weak categories. By considering 6 years in eachENSO phase, the number of persistent (persistence $4 days) oceanic SACZ was twice as large as the numberof events observed during neutral and cold phases. Anopposite relationship is observed for the continental
106 VOLUME 17J O U R N A L O F C L I M A T E
FIG. 17. As in Fig. 16 but for MJO active phases.
SACZ. The increase of the ratio between oceanic andcontinental categories certainly has an important im-plication for the regional seasonal total rainfall oversouth and southeastern South America and central Bra-zil.
Another important outcome of the present work is theinvestigation of extreme precipitation over Brazil withrespect to SACZ categories and the MJO. This analysiswas performed by computing the difference between the95th percentile daily rainfall obtained from each SACZcategory and MJO phase and the DJF climatology. Forthe sample of intense SACZ, differences of more than5 mm day21 in the DJF 95th percentile are observedover central-eastern and southeastern Brazil, where the
DJF 95th percentile is about 25 mm day21. Conversely,negative differences of more than 7 mm day21 are ob-served in a large area over central and eastern Brazilassociated with the weak category. Oceanic SACZ, asexpected, increase the DJF 95th rainfall percentile tomore than 5 mm day21 over southeastern Brazil, par-ticularly over the states of Rio de Janeiro, southeasternof Minas Gerais, and northeastern Sao Paulo (Carvalhoet al. 2002), which represents about 20%–25% of the95th climatology. Stationary oceanic SACZ have beennoticed as the cause of frequent states of emergency inthese regions due to the increase in floods and mudslides, particularly in areas with steep topography andhigh concentration of inhabitants. Since warm ENSO
1 JANUARY 2004 107C A R V A L H O E T A L .
episodes seem to favor the occurrence of a persistentoceanic SACZ, the correct prediction of the phenome-non brings an additional alert for the occurrence of ex-treme precipitation over southeastern Brazil, as pointedout in Liebmann et al. (2001) and Carvalho et al. (2002).The decrease of the 95th percentile daily rainfall overthe central Amazon basin seems consistent with the de-crease of daily mean precipitation when the SACZ isdisplaced towards the Atlantic Ocean. The continentalSACZ shows features very near the climatology formost regions in Brazil, except southeastern Brazil whereopposite features to the oceanic SACZ are displayed.Nonetheless, the area with maximum in negative anom-alies associated with this category is mostly located ina region with poor and/or intermittent observations, thusnot allowing further reliable interpretation of rainfallpatterns.
Significant relationships between the MJO and theoccurrence of extreme rainfall over Brazil have alsobeen found. Although it is not possible to isolate theeffects of the MJO from the SACZ because the formermodulates persistence of the latter, some peculiar as-pects of the MJO are noticeable. An increase in the 95thpercentile daily rainfall of more than 5 mm day21 isobserved over eastern tropical Brazil, where DJF cli-matology is between 15 and 20 mm day21, in the MJOphase when suppressed convection is observed over In-donesia and enhanced convection over central Pacific.Conversely, the phase of the MJO characterized by en-hanced convection over Indonesia and suppression overthe central Pacific decreases (increases) the 95th per-centile daily rainfall over eastern and southeastern(southern) Brazil. Other phases of the MJO do not seemto modulate the DJF climatology. It is clear, therefore,that monitoring the SACZ, MJO, and ENSO phases canprovide significant improvements in the forecast skillof extreme rainfall in tropical South America.
The discussions above raised an important questionabout the relationships between the broad definition ofthe SAMS regime and the SACZ. Our results indicatethat variability of the SACZ seems mutually related tothe SAMS, suggesting that mechanisms responsible forvariations in intensity of the former determine the large-scale features of the latter. Experienced weather fore-casters, in an attempt to identify the SACZ, use satelliteimages to search for extensive cloud bands from theAmazon southeastward to the Atlantic Ocean (e.g.,http://www.cptec.inpe.br/products/climanalise), whichis frequently associated with strong convective activityover the continent. Their observations inspired us todefine a more appropriate method to describe the SACZto substitute those that emphasize only the oceanic as-pect of the phenomenon. Indeed, some of those expe-rienced meteorologists and forecasters agree that theacronym SACZ should mean South American conver-gence zone rather than South Atlantic convergence zone.The reason is that, in practice, it is difficult to separatethe SACZ activity from the SAMS, unless convective
activity is preferably strong over the ocean and weakover central and western Amazon. The methodologypresented in this paper objectively identifies these cases.
Acknowledgments. The authors would like to thankthe anonymous reviewers for their interesting commentsand suggestions. Fruitful discussions with Dr. Pedro L.Silva Dias are appreciated. Datasets were obtained fromthe National Center for Atmospheric Research (NCAR),which is supported by the National Science Foundation.The rainfall data were provided by ANEEL (Brazil).The support from Dave Allured (CIRES/CDC) is greatlyacknowledged. The authors acknowledge the financialsupport of the CLIVAR PACS Program. L. M. V. Car-valho thanks the financial support from FAPESP (proc:01-13159-9) and CNPq (proc: 302203/2002-8).
REFERENCES
Ambrizzi, T., and B. J. Hoskins, 1997: Stationary Rossby-wave prop-agation in a baroclinic atmosphere. Quart. J. Roy. Meteor. Soc.,123, 919–928.
Barreiro, M., P. Chang, and R. Saravanan, 2002: Variability of theSouth Atlantic convergence zone simulated by an atmosphericgeneral circulation model. J. Climate, 15, 745–763.
Carvalho, L. M. V., and C. Jones, 2001: A satellite method to identifystructural properties of mesoscale convective systems based onmaximum spatial correlation tracking technique (MASCOTTE).J. Appl. Meteor., 40, 1683–1701.
——, C. Jones, and B. Liebmann, 2002: Extreme precipitation eventsin southeastern South America and large-scale convective pat-terns in the South Atlantic convergence zone. J. Climate, 15,2377–2394.
Duchon, C. E., 1979: Lanczos filter in one and two dimensions. J.Appl. Meteor., 18, 1016–1022.
Grimm, A. M., 2003: The El Nino impact on the summer monsoonin Brazil: Regional processes versus remote influences. J. Cli-mate, 16, 263–280.
——, and P. L. Silva Dias, 1995: Analysis of tropical–extratropicalinteractions with influence functions of a barotropic model. J.Atmos. Sci., 52, 3538–3555.
Hendon, H. H., and M. L. Salby, 1994: The life cycle of the Madden–Julian oscillation. J. Atmos. Sci., 51, 2225–2237.
Hoerling, M. P., and A. Kumar, 2000: Understanding and predictingextratropical teleconnections related to ENSO. El Nino and theSouthern Oscillation, H. F. Diaz and V. Markgraf, Eds., Cam-bridge, 59–88.
Jackson, J. E., 1991: A User’s Guide to Principal Components. Wiley,569 pp.
Jones, C., 2000: Occurrence of extreme precipitation events in Cal-ifornia and relationships with the Madden–Julian oscillation. J.Climate, 13, 3576–3587.
——, and L. M. V. Carvalho, 2002: Active and break phases in theSouth America monsoon system. J. Climate, 15, 905–914.
——, D. E. Waliser, and C. Gautier, 1998: The influence of the Mad-den–Julian oscillation on ocean surface heat fluxes and sea sur-face temperature. J. Climate, 11, 1057–1072.
Kalnay, E., and Coauthors, 1996: The NCEP/NCAR 40-Year Re-analysis Project. Bull. Amer. Meteor. Soc., 77, 437–471.
Kiladis, G. N., and K. M. Weickman, 1992: Circulation anomaliesassociated with tropical convection during northern winter. Mon.Wea. Rev., 120, 1900–1923.
——, and ——, 1997: Horizontal structure and seasonality of large-scale circulations associated with submonthly tropical convec-tion. Mon. Wea. Rev., 125, 1997–2013.
Kodama, Y. M., 1992: Large-scale common features of subtropical
108 VOLUME 17J O U R N A L O F C L I M A T E
precipitation zones (the Baiu frontal zone, the SPCZ, and theSACZ). Part I: Characteristics of subtropical frontal zones. J.Meteor. Soc. Japan., 70, 813–835.
——, 1993: Large-scale common features of subtropical convergencezones (the Baiu frontal zone, the SPCZ, and the SACZ). Part II:Conditions of the circulations for generating STCZs. J. Meteor.Soc. Japan, 71, 581–610.
Kousky, V. E., and C. F. Ropelewski, 1989: Extremes in SouthernOscillation and their relationship to precipitation anomalies withemphasis on the South American region. Rev. Bras. Meteor., 4,351–363.
Lenters, J. D., and K. H. Cook, 1999: Summertime precipitationvariability over South America: Role of the large-scale circu-lation. Mon. Wea. Rev., 127, 409–431.
Liebmann, B., and C. Smith, 1996: Description of a complete (in-terpolated) outgoing longwave radiation. Bull. Amer. Meteor.Soc., 77, 1570–1573.
——, G. N. Kiladis, J. A. Marengo, T. Ambrizzi, and J. D. Glick,1999: Submonthly convective variability over South Americaand the South Atlantic convergence zone. J. Climate, 12, 1977–1991.
——, C. Jones, and L. M. V. Carvalho, 2001: Interannual variabilityof daily extreme precipitation events in the state of Sao Paulo,Brazil. J. Climate, 14, 208–218.
Madden, R. A., and P. R. Julian, 1994: Observations of the 40–50day tropical oscillation—A review. Mon. Wea. Rev., 122, 814–837.
Maloney, E. D., and D. L. Hartmann, 1998: Frictional moisture con-vergence in a composite life cycle of the Madden–Julian oscil-lation. J. Climate, 11, 2387–2403.
Marengo, J. A., and W. R. Soares, 2002: Climatology of low-level
jet east of the Andes as derived from the NCEP reanalyses.Preprints, VAMOS/CLIVAR/WCRP Conf. on South AmericanLow-Level Jet, Santa Cruz de la Sierra, Bolivia. [Available onlineat www-cima.at.fcen.uba.ar/sallj/salljpconfpextabs.html.]
Nieto-Ferreira, R., T. Rickenbach, D. L. Herdies, and L. M. V. Car-valho, 2003: Variability of South American convective cloudsystems and tropospheric circulation during January–March1998 and 1999. Mon. Wea. Rev., 131, 961–973.
Nogues-Paegle, J., and K. C. Mo, 1997: Alternating wet and dryconditions over South America during summer. Mon. Wea. Rev.,125, 279–291.
——, L. A. Byerle, and K. C. Mo, 2000: Intraseasonal modulationof South American summer precipitation. Mon. Wea. Rev., 128,837–850.
North, G. R., T. L. Bell, and R. F. Cahalan, 1982: Sampling errorsin the estimation of empirical orthogonal functions. Mon. Wea.Rev., 110, 699–706.
Rickenbach, T., R. N. Ferreira, J. Halverson, and M. A. F. Silva Dias,2002: Modulation of convection in the southwestern Amazonbasin by extratropical stationary fronts. J. Geophys. Res., 107,8040, doi:10.1029/2000JD000263.
Robertson, A. W., and C. R. Mechoso, 2000: Interannual and inter-decadal variability of the South Atlantic convergence zone. Mon.Wea. Rev., 128, 2947–2957.
Ropelewski, C. F., and M. S. Halpert, 1987: Global and regional scaleprecipitation patterns associated with the El Nino/Southern Os-cillation. Mon. Wea. Rev., 115, 1606–1626.
Satyamurti, P., C. Nobre, and P. L. Silva Dias, 1998: South America.Meteorology of the Southern Hemisphere, D. J. Karoly and D.G. Vincent, Eds., Amer. Meteor. Soc., 119–139.
Zhou, J., and K. M. Lau, 1998: Does a monsoon climate exist overSouth America? J. Climate, 11, 1020–1040.
Copyright © 2022 FDOKUMEN