Forecast skill of the tropical intraseasonal oscillation in the NCEP GFS dynamical extended range...
20
K. -H. Seo J. -K. E. Schemm C. Jones S. Moorthi Forecast skill of the tropical intraseasonal oscillation in the NCEP GFS dynamical extended range forecasts Received: 15 November 2004 / Accepted: 10 May 2005 Ó Springer-Verlag 2005 Abstract This study examines the forecast performance of tropical intraseasonal oscillation (ISO) in recent dynamical extended range forecast (DERF) experiments conducted with the National Centers for Environmental Prediction (NCEP) Global Forecasting System (GFS) model. The present study extends earlier work by com- paring prediction skill of the northern winter ISO (Madden-Julian Oscillation) between the current and earlier experiments. Prediction skill for the northern summer ISO is also investigated. Since the boreal sum- mer ISO exhibits northward propagation as well as eastward propagation along the equator, forecast skill for both components is computed. For the 5-year period from 1 January, 1998 through 31 December, 2002, 30-day forecasts were made once a day. Compared to the previous DERF experiment, the current model has shown some improvements in forecasting the ISO during winter season so that the skillful forecasts (anomaly correlation>0.6) for upper-level zonal wind anomaly extend from the previous shorter-than 5 days out to 7 days lead-time. A similar level of skill is seen for both northward and eastward propagation components dur- ing the summer season as in the winter case. Results also show that forecasts from extreme initial states are more skillful than those from null phases for both seasons, extending the skillful range by 3–6 days. For strong ISO convection phases, the GFS model performs better during the summer season than during the winter sea- son. In summer forecasts, large-scale circulation and convection anomalies exhibit northward propagation during the peak phase. In contrast, the GFS model still has difficulties in sustaining ISO variability during the northern winter as in the previous DERF run. That is, the forecast does not maintain the observed eastward propagating signals associated with large-scale circula- tion; rather the forecast anomalies appear to be sta- tionary at their initial location and decay with time. The NCEP Coupled Forecast System produces daily opera- tional forecasts and its predication skill of the MJO will be reported in the future. 1 Introduction The intraseasonal oscillation (ISO) is one of the most prominent large-scale variabilities in the tropics and undergoes a peculiar seasonal variation, with most ac- tive oscillation during the northern winter and spring, and weaker activity during the northern summer (Slingo et al. 1999). The northern winter intraseasonal oscilla- tion, also known as the Madden-Julian oscillation (MJO), is manifested as planetary-scale eastward prop- agating circulation and convection anomalies with timescales of about 30–70 days (e.g., Madden and Julian 1994; Hendon and Salby 1994, 1996). Because strong MJO convection is sustained largely over the warm pool waters in the Eastern Hemisphere, the phase speed of large-scale winds has a geographical two-regime struc- ture. Convectively-coupled circulation in the Eastern Hemisphere propagates eastward at a rate of 5ms 1 , while the phase speed over the Western Hemisphere is 10–20 m s 1 . The MJO system is vertically westward tilted over the western Pacific, whereas it is more verti- cally aligned over the Indian Ocean (Sperber 2003). K. -H. Seo (&) J. -K. E. Schemm RSIS/Climate Prediction Center/NCEP/NOAA, 5200 Auth Rd., Camp Springs, Maryland, 20746 USA E-mail: [email protected] Fax: +1-301-7638125 C. Jones Institute for Computational Earth System Science, University of California, Santa Barbara, California, USA S. Moorthi Environmental Modeling Center/NCEP/NOAA, Camp Springs, Maryland, USA Climate Dynamics (2005) 25: 265–284 DOI 10.1007/s00382-005-0035-2
Transcript of Forecast skill of the tropical intraseasonal oscillation in the NCEP GFS dynamical extended range...

K. -H. Seo Æ J. -K. E. Schemm Æ C. Jones Æ S. Moorthi
Forecast skill of the tropical intraseasonal oscillation in the NCEP GFSdynamical extended range forecasts
Received: 15 November 2004 / Accepted: 10 May 2005� Springer-Verlag 2005
Abstract This study examines the forecast performanceof tropical intraseasonal oscillation (ISO) in recentdynamical extended range forecast (DERF) experimentsconducted with the National Centers for EnvironmentalPrediction (NCEP) Global Forecasting System (GFS)model. The present study extends earlier work by com-paring prediction skill of the northern winter ISO(Madden-Julian Oscillation) between the current andearlier experiments. Prediction skill for the northernsummer ISO is also investigated. Since the boreal sum-mer ISO exhibits northward propagation as well aseastward propagation along the equator, forecast skillfor both components is computed. For the 5-year periodfrom 1 January, 1998 through 31 December, 2002,30-day forecasts were made once a day. Compared tothe previous DERF experiment, the current model hasshown some improvements in forecasting the ISO duringwinter season so that the skillful forecasts (anomalycorrelation>0.6) for upper-level zonal wind anomalyextend from the previous shorter-than 5 days out to7 days lead-time. A similar level of skill is seen for bothnorthward and eastward propagation components dur-ing the summer season as in the winter case. Results alsoshow that forecasts from extreme initial states are moreskillful than those from null phases for both seasons,extending the skillful range by 3–6 days. For strong ISO
convection phases, the GFS model performs betterduring the summer season than during the winter sea-son. In summer forecasts, large-scale circulation andconvection anomalies exhibit northward propagationduring the peak phase. In contrast, the GFS model stillhas difficulties in sustaining ISO variability during thenorthern winter as in the previous DERF run. That is,the forecast does not maintain the observed eastwardpropagating signals associated with large-scale circula-tion; rather the forecast anomalies appear to be sta-tionary at their initial location and decay with time. TheNCEP Coupled Forecast System produces daily opera-tional forecasts and its predication skill of the MJO willbe reported in the future.
1 Introduction
The intraseasonal oscillation (ISO) is one of the mostprominent large-scale variabilities in the tropics andundergoes a peculiar seasonal variation, with most ac-tive oscillation during the northern winter and spring,and weaker activity during the northern summer (Slingoet al. 1999). The northern winter intraseasonal oscilla-tion, also known as the Madden-Julian oscillation(MJO), is manifested as planetary-scale eastward prop-agating circulation and convection anomalies withtimescales of about 30–70 days (e.g., Madden and Julian1994; Hendon and Salby 1994, 1996). Because strongMJO convection is sustained largely over the warm poolwaters in the Eastern Hemisphere, the phase speed oflarge-scale winds has a geographical two-regime struc-ture. Convectively-coupled circulation in the EasternHemisphere propagates eastward at a rate of �5 m s�1,while the phase speed over the Western Hemisphere is�10–20 m s�1. The MJO system is vertically westwardtilted over the western Pacific, whereas it is more verti-cally aligned over the Indian Ocean (Sperber 2003).
K. -H. Seo (&) Æ J. -K. E. SchemmRSIS/Climate Prediction Center/NCEP/NOAA, 5200 Auth Rd.,Camp Springs, Maryland, 20746 USAE-mail: [email protected]: +1-301-7638125
C. JonesInstitute for Computational Earth System Science, University ofCalifornia, Santa Barbara, California, USA
S. MoorthiEnvironmental Modeling Center/NCEP/NOAA, Camp Springs,Maryland, USA
Climate Dynamics (2005) 25: 265–284DOI 10.1007/s00382-005-0035-2

Meanwhile, the boreal summer ISO (BSISO) has acomplex spatial structure and propagation pattern dueto the off-equatorial thermal equator and the interactionof Asian summer monsoon (e.g., Lau and Chan 1986a;Annamalai and Slingo 2001; Hsu and Weng 2001;Kemball-Cook and Wang 2001; Lawrence and Webster2001; Jones et al. 2004a). Intraseasonally bandpassedOLR anomalies display a northward propagating modeover the Indian Ocean and northwestward moving modeover the western Pacific Ocean as well as an eastwardpropagating component along the equator. Note that inthis study we refer to the northern winter ISO as theMJO and the northern summer ISO as the BSISO totake into account the seasonality in the ISO.
The interaction between ISO convection and large-scale circulation anomalies influences extratropicalregions. The evolution and propagation of ISO con-vection have been shown to develop persistent NorthPacific circulation anomalies and extreme precipitationevents along the western United States during borealwinter (e.g., Weickmann 1983; Liebmann and Hart-mann 1984; Lau and Philips 1986b; Higgins andSchubert 1996; Mo and Higgins 1998; Jones 2000).Furthermore, the westerly wind events associated withthe eastward propagation of the ISO significantlymodify the thermocline structure in the equatorial Pa-cific Ocean via a series of downwelling oceanic Kelvinwaves (McPhaden 1999, 2004). Recently, Seo and Xue(2005) show from the analysis of global ocean dataassimilation systems at the National Centers for Envi-ronmental Prediction (NCEP) that the peaks of ISO-generated oceanic Kelvin wave activity lead ENSOmature phases by 5–11 months and the Kelvin waveactivity also tends to impact the growth and termina-tion of ENSO warm events. The Asian summer mon-soon system is also strongly influenced by the borealsummer ISO (BSISO). The intraseasonal tropical con-vection variation over the Indian Ocean and the SouthChina Sea has been found to be connected to thefluctuations of the Indian summer monsoon and therainy spells in China (Mei-yu) (Sikka and Gadgil 1980;Lau and Chan 1986a, b; Annamalai and Slingo 2001).The active and break cycle of the monsoon is signifi-cantly related to the northward propagation of theconvective anomaly from the Bay of Bengal or theIndian Ocean to the subcontinent (Krishnan et al.2000; Annamalai and Slingo 2001). Also, the BSISOoccurring in the eastern Pacific Ocean has been knownto change sea surface temperature and modulate trop-ical cyclone activity (Maloney and Hartmann 2000;Maloney and Kiehl 2002). Indeed, there is clearevidence that a proper representation of tropicalintraseasonal convective forcing helps enhanceextended-range weather forecast skill in the extratropics(Ferranti et al. 1990). Therefore, it is essential to assessthe ability of global climate models to forecast thevariations associated with the ISO.
Recent observational and modeling studies stressthe importance of air–sea interaction in the develop-
ment and propagation of the ISO (Krishnamurti et al.1988; Flatau et al. 1997; Sperber et al. 1997; Waliser etal. 1999b; Woolnough et al. 2000; Kemball-Cook andWang 2001; Kemball-Cook et al. 2002). In Kemball-Cook et al. (2002), however, even an uncoupledsimulation was able to produce an intraseasonaloscillation and thus the ISO is believed to be primarilya mode of the atmosphere. They suggest that theinteraction of the ISO and ocean is not solelyresponsible for the existence of the ISO, even if itplays an important role in its organization and inten-sification. For example, the variations of sea surfacetemperature (SST) act to help organize ‘‘horizontalmoisture convergence’’ (Waliser et al. 1999b), the pri-mary forcing term for the wave-CISK (conditionalinstability of second kind) mechanism. Even withoutthis, however, moisture convergence can also be sys-tematically induced by the interaction between ISOconvection and large-scale circulation.
Here we assess the prediction performance of theISO in the NCEP operational Global ForecastingSystem (GFS, formerly the Medium Range Forecastor MRF) model, utilizing 30-day forecast runs per-formed once a day for the 5 years from 1998 to 2002.The previous operational MRF runs for the years1987 and 1988 showed significant skill score (about10 days) for strong MJO events based on the 200-hPavelocity potential (Chen and Alpert 1990). Lau andChang (1992) also showed the similar range of pre-diction skill for the global pattern of intraseasonalvariability for the winter season of 1986/87 using theupper-level velocity potential. The recent dynamicalextended range forecast (DERF) experiment was per-formed with the 1996 NCEP reanalysis version of theMRF model for the 5-year period from 1 January,1985 to 31 December, 1989 (Schemm et al. 1996). ThisDERF experiment was intended to evaluate the fea-sibility of operational dynamic weather prediction be-yond the medium-range (i.e., about 1 week). It isfound that the skillful forecasts for the wintertimeMJO extend out to an average of 5–6 days at the levelof anomaly correlation 0.6 with 1–3 more skillful daysfor an initially extreme phase of MJO events (Hendonet al. 2000; Jones et al. 2000). The present study ex-tends the earlier work by comparing prediction skill ofthe northern winter ISO (MJO) in the current globalmodel with that of the previous DERF experiment.We also examine prediction skill for the northernsummer ISO (BSISO). As will be shown, the NCEPGFS model tends to produce more skillful predictionsduring the summer season than during the winterseason, for the forecasts initialized during active con-vection events.
2 NCEP GFS forecast runs and analysis methods
The experiments were done with the NCEP opera-tional GFS. GFS runs in the T126L28 resolution for
266 Seo et al.: Forecast skill of the tropical intraseasonal oscillation in the NCEP GFS dynamical extended range forecasts

the first 7 days and in the T62L28 resolution after-wards. Note that this particular configuration is uti-lized for NCEP ensemble forecast system. Thirty-dayforecasts were initialized each day, using the 00Zreanalysis as initial conditions for the 5-year periodfrom January 1, 1998 through December 31, 2002. Theincreased horizontal resolution is an important changein this model compared to the previous DERF model,where the horizontal spectral resolution was T62(Kalnay et al. 1996).
The current operational GFS model has undergonesubstantial changes since 1996. These include modifica-tion of physics package such as the inclusion of prog-nostic cloud water, boundary layer turbulence andconvection parameterization, a modification of theevaporation formulation for convective rain, inclusionof cumulus momentum mixing, enhanced gravity wavedrag, etc. The radiation schemes have also been modi-fied. Whereas the previous shortwave radiation (SW)parameterization was developed at the GeophysicalFluid Dynamics Laboratory, using portions of thescheme from Lacis and Hansen (1974), a newer, moreaccurate method has been developed at NCEP, based onthe work of Chou and Lee (1996). The new SW schemeincorporates climatological aerosol effects and a newsurface albedo. The longwave radiation (LW) schemedeveloped by Fels and Schwarzkopf (1975) is alsomodified with a more proper treatment of radiativeheating rates and LW cooling at the cloud top. Moredetailed information on the model can be seen at http://www.emc.ncep.noaa.gov/modelinfo.
Note that in this study, we do not intend to evaluatethe effects of individual changes for the skill of the ISO.Rather, we wish to assess the overall performance of thecurrent operational global model associated with theISO.
Similar to the previous runs, SST was damped fromits initial observed value to climatology with a 90-daye-folding time. From these forecast runs, we analyzezonal winds at 200 and 850 hPa (denoted as U200 andU850, respectively) and outgoing longwave radiation(OLR) for this study. The latter variable in the model isnot as accurate as the winds since it depends on aphysical parameterization, but it directly representslocalized ISO-related convection anomalies.
For the forecast verification, the NCEP reanalysis(Kalnay et al. 1996) and the Advanced Very High Res-olution Radiometer outgoing longwave radiation (AV-HRR OLR) on the National Oceanic and AtmosphericAdministration (NOAA) polar orbiting satellites(Liebmann and Smith 1996) are used for the same5 years. Both forecast and validation data have2.5�·2.5� spatial resolution.
Prior to calculating the anomaly correlation, we re-moved systematic model errors. This is accomplished byremoving an annual cycle from the forecast and verifi-cation data, separately. The annual cycle for both fore-cast and analysis was constructed based on 4 years ofdata excluding the year of verification. Then, the high
frequency components of the annual cycle were removedby retaining only the annual mean and first three annualharmonics. For forecast data, this procedure of obtain-ing an annual cycle is applied for each lead time rangingfrom 1 day to 30 days.
To extract intraseasonal variations associated withthe ISO, we need to apply some filtering techniques.However, conventional bandpass filtering is not appli-cable since the forecast extent is 30 days, which is lessthan the time scale of the ISO. To overcome this dif-ficulty, the beginning of the 30-day forecasts is paddedwith 30 days of the reanalysis and then the Murakamifilter (Murakami 1979) is applied. In contrast to theconventional digital filtering technique that uses theconvolution of input time series with a weightingfunction of the filter, the Murakami filter is a recursivefilter and requires only two data points in the past.This filter converges so fast that there is almost nocutoff problem. The actual calculation is composed oftwo steps. At the first step, tentative output is calcu-lated from the input data from which the mean valueand linear trend are removed. Then this output is re-versed in time and processed again to obtain the finaloutput. This procedure results in a zero phase shift atall local frequencies. To test the accuracy of this fil-tering, bandpass filtered time series of 60 day (30 dayspadded to 30 day forecast) segments of observed U200anomaly using the Murakami filter and the truebandpass filtered time series are compared. The per-centage of the total mean root-mean-square error rel-ative to the average U200 amplitude for the entire30 day lead is below 10%.
This filter is also applied to the continuous verifica-tion data. A preliminary test shows no significant changein intraseasonal signals with an increase of padding sizeto �35–50 days. However, it should be noted that thisprocedure tends to inflate forecast skill at short lead time(see also Jones et al. 2000). The analysis is done for theboreal extended winter season (1 November–31 April)and the boreal extended summer season (1 May–30October).
To identify the most dominant phases of the ISO lifecycle, we perform EOF analysis on intraseasonally fil-tered AVHRR OLR. The first two EOFs of the observedOLR anomalies together describe eastward progressionof convection anomalies during the northern winterseason, and eastward and northward propagation dur-ing the northern summer season. The first two EOFsaccount for 18% (23%) of the total variance for winter(summer, respectively) season with an approximateperiod of 45–48 days.
Strong ISO events are identified by selecting the dateswhen either of the two leading standardized principalcomponents exceeds 1.5 standard deviations during the5-year period (as in Hendon et al. 2000). According tothe sign of the principal components, the four phases ofthe life cycle of the ISO are then designated as PC1+,PC2+, PC1�, and PC2� with each succeeding phaseleading the preceding phase by a quarter cycle or about
Seo et al.: Forecast skill of the tropical intraseasonal oscillation in the NCEP GFS dynamical extended range forecasts 267

12 days. Null events are defined as the cases where bothleading principal components are simultaneously lessthan 0.5 standard deviations. Total days selected by theabove criteria are 75(55), 61(64), 57(60), 77(47), 148(48)for the winter (summer, respectively) season. Compos-ites are made based on the dates initialized for these fiveextreme phases and forecast skills are evaluated in termsof anomaly correlation and root-mean-square (RMS)error (although the latter will not be shown).
3 Systematic model errors and 200-hPa zonal windpropagation
The climatology of forecasts at each lead time is notlikely to be identical to verification climatology. Theuse of verification climatology in the calculation ofmodel anomalies at each grid point leads to systematicoverestimates or underestimates of forecast anomalyvalues. Therefore, the mean model errors should firstbe removed prior to forming composites and assessing
the prediction skill. Figure 1 shows 200-hPa zonalwinds in the reanalysis and systematic model errors(defined as forecast minus reanalysis climatology) atseveral forecast lead times for winter and summerseasons. The northern wintertime mean field (Fig. 1a)shows upper-level easterlies in the tropics in the East-ern Hemisphere and over South America. Over thePacific and Atlantic Oceans in the Western Hemi-sphere, westerly wind ducts associated with the Pacificand Atlantic wave guides are apparent. Mean modelerrors (Fig. 1b, c) represent a general weakening of thenorthern winter mean zonal winds in both the tropicsand extratropics, resulting in weaker upper-level jetsand decreased horizontal gradient of the zonal winds inthe model. The westerly bias appears over the MaritimeContinents at 3-day lead time. As lead time increases,model easterly winds weaker than the reanalysis,develop over the onset region of MJO convection. Aneasterly systematic bias develops over the eastern Pa-cific as in the previous experiments (Hendon et al.2000; Jones et al. 2000).
a
b
e
f
c g
d h
Fig. 1 a Mean 200-hPa zonal wind in the reanalysis (contourinterval 3 m s�1) and systematic model error (reanalysis minusforecast climatology) (contour interval 2 m s�1) at forecast leadtimes of (b) 3, (c) 7, and (d) 15 days for the Northern Hemisphere
winter season (1 November–30 April). e Mean 200-hPa zonal windin the reanalysis and systematic model errors at forecast lead timesof (f) 3, (g) 7, and (h) 15 days for the summer season (1 May–31October). Mean model errors are calculated using unfiltered data
268 Seo et al.: Forecast skill of the tropical intraseasonal oscillation in the NCEP GFS dynamical extended range forecasts

During the summer season (Fig. 1e), monsoonaleasterlies stronger than the wintertime easterlies appearover the equatorial warm pool regions. The westerlies ofthe Pacific and Atlantic wave guides disappear. Over theIndian monsoon region, model easterly zonal winds areweaker than the reanalysis and this weaker dynamicresponse may indicate that the model has a weak rep-resentation of the monsoon heat source. As forecast timeprogresses, the positive model bias further intensifiesand broadens.
Similarly, Figure 2 shows 850-hPa zonal winds in thereanalysis and systematic model errors at several fore-cast lead times for winter and summer seasons. In win-
ter, the equatorial westerly duct appears over the maindevelopment region of the ISO. Beside that region, meaneasterlies dominate in the tropics. There is no systematicdowngrade or discontinuity in the forecast fields asso-ciated with the equatorial westerly duct. It has beensuggested that if the low-level equatorial westerlies areweak or discontinuous, then ISO tends to show weak ordiscontinuous propagation (Waliser et al. 2003c). Dur-ing the summer season (Fig. 2e), the dipole structureover the Indian Ocean represents the mean monsoonallow-level cross-equatorial circulation with the south-easterlies in the southern Indian Ocean and the south-westerlies in the northern Indian Ocean and south Asian
a
b
c
d
e
f
g
h
Fig. 2 Same as Fig. 1 except for mean 850-hPa zonal wind with contour interval 2 m s�1
Seo et al.: Forecast skill of the tropical intraseasonal oscillation in the NCEP GFS dynamical extended range forecasts 269

monsoon region. Over those regions, the forecastwesterlies in the northern Indian Ocean and the forecasteasterlies in the southern Indian Ocean are slightlyweaker than the observations.
To assess how well the model forecasts intraseasonalvariability, total variance and intraseasonally filteredvariance are compared with verifying analysis. Figure 3shows the total variance of unfiltered 200-hPa zonalwinds and the ratio of the 30–70 day variance to thetotal variance for the reanalysis and 3-day lead forecastduring the entire season. In the reanalysis, it is seenthat the greatest total variance appears in relation toextratropical jets over the Pacific Ocean in both theNorthern and Southern Hemispheres. In the tropics thesmallest total variance is located over the MaritimeContinents. However, this region shows a ratio of thebandpass-filtered variance to the total varianceexceeding 14%. The western Indian Ocean is the regionwhere the ratio attains another maximum. The tworegions of higher ratio are the result of the Gill-typeupper-level circulation response to the tropical diabaticforcing located over the central Indian Ocean and thewestern Pacific. Other large intraseasonal variance re-gions are situated over the subtropical continents ofAmerica.
The forecast total variance shows a horizontal pat-tern similar to the reanalysis with a slight difference in itsintensity. The ratio of the intraseasonal variance to thetotal variance shows a maximum over the western In-dian Ocean, but the value is smaller than in the reanal-ysis. In particular, the ratio over the MaritimeContinents is significantly smaller than the reanalysis.This may be related to the fact that the model has a
difficulty in capturing eastward-propagating intrasea-sonal signals, as will be shown later. Such a difficultyexited in previous studies by Hendon et al. (2000) andJones et al. (2000). Figure 4 shows the equatorial ISOvariance of 200-hPa zonal winds for all years as afunction of forecast lead time. It is seen that the ISOvariance decreases approximately linearly with time. TheISO variance decreases by about 20% for the lead timeof 10 days. Again, this diminishing signal with forecast
a C
b d
Fig. 4 Intraseasonal variance of 200-hPa zonal winds averagedover the zonal band from 30�S to 30�N as a function of forecastlead time
Fig. 3 a Total variance of unfiltered 200-hPa zonal winds in thereanalysis, and (b) ratio of the 30–70 day variance to the totalvariance for 200-hPa zonal winds for whole season. Contour
intervals for total variance and ratio are 20 m2 s�2 and 0.02,respectively and the ratio greater than 0.14 is shaded. c, d Same as(a) and (b) except for the 3-day forecast
270 Seo et al.: Forecast skill of the tropical intraseasonal oscillation in the NCEP GFS dynamical extended range forecasts
a b c
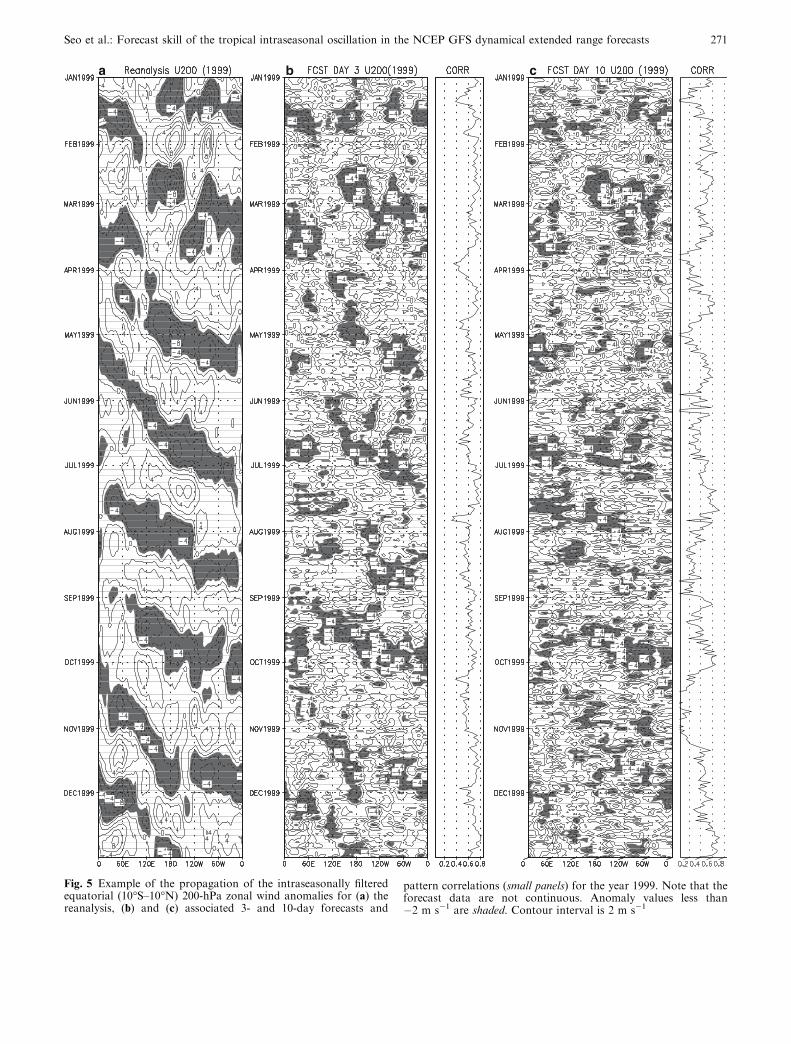
Fig. 5 Example of the propagation of the intraseasonally filteredequatorial (10�S–10�N) 200-hPa zonal wind anomalies for (a) thereanalysis, (b) and (c) associated 3- and 10-day forecasts and
pattern correlations (small panels) for the year 1999. Note that theforecast data are not continuous. Anomaly values less than�2 m s�1 are shaded. Contour interval is 2 m s�1
Seo et al.: Forecast skill of the tropical intraseasonal oscillation in the NCEP GFS dynamical extended range forecasts 271

lead time indicates the decreasing forecast skill withtime, which will be shown in results.
Figure 5 shows an example of the propagation ofthe intraseasonally filtered equatorial (5�S–5�N) upper-level zonal wind anomalies for the reanalysis andassociated 3- and 10-day forecasts and pattern corre-lations (small panels). Since the filtering was performedon each 30-day forecast separately, the forecast dataarranged according to verification dates as in the figureare discontinuous, and this introduces unavoidablehigh-frequency variations in the plots. Since theanomalies are taken along the equator, eastwardpropagating oscillation is most pronounced. Also un-like OLR anomalies, the U200 anomalies tend to ap-pear over the whole globe. The 3-day forecast datashow relatively modest resemblance to the reanalysiswith an indication of stationary tendency as in theprevious DERF runs (see Waliser et al. 1999a). Thecorrelation calculated is greater than 0.5 most of thetime in this case. The correct ISO signals appear toexist east of 120�E through the Western Hemisphere.This will be discussed in Fig. 10. However, the 10-dayforecasts exhibit irregular patterns. Some forecasts docapture the strong ISO events such as the one in Sep-tember 1999. But some do not appear to capture thestrong ISO events. For example, the October 1999event has a skill smaller than 0.2. In general, thecharacteristic eastward propagation is not apparent atthis lead time; rather anomalies seem to move west-ward sometimes.
4 Prediction skill during northern winter season
4.1 Life cycle of the MJO
Before examining a phase-dependent forecast skill,composite fields of analyzed OLR and 200-hPa zonalwind anomalies associated with the ISO are presented.Applying a two-sided t test, only the fields that are sta-tistically significant at the 95% level are considered.Figure 6 shows the composite of analyzed OLR anom-alies for positive phase (PC1+ and PC2+), negativephase (PC1� and PC2�), and null cases. The PC1� andPC2� phases represent the structure similar to thePC1+ and PC2+, respectively, but the sign is oppositeto the respective phases. The sequence of these plotsrepresents a canonical life cycle of the MJO convection:initiation of the cycle over the Indian Ocean, subsequenteastward propagation of the convection in the EasternHemisphere, and decay of the convection in the WesternHemisphere.
Associated with this life cycle of the MJO convection,a composite of U200 anomalies and vector winds in thereanalysis for each phase is shown in Fig. 7. The dis-tribution of upper level zonal winds shows the large-scale circulation response to the eastward moving con-vection, reminiscent of Gill-type spatial structure. Thereis an indication of Kelvin wave response, especially in
the PC2 phases over the Pacific Ocean. Also, equatorialRossby waves straddling the equator are evident, sug-gesting the dominance of the rotational component inzonal winds (Slingo et al. 1999). The forced Rossbywaves appear to propagate further into the extratropicalregions. The propagation of equatorial Kelvin-Rossbywaves can be better seen in sea level pressure anomalies(not shown) as in Matthews (2000) and Seo and Kim(2003).
4.2 Prediction skill of the MJO
Figure 8a shows the anomaly correlation of U200 as afunction of forecast lead time during the winter season.We define a useful skill as anomaly correlationexceeding 0.6. It is seen that the forecast skill rangesfrom 6 to 8 forecast days with a greater skill in the1999/2000 and 2000/2001 winter seasons. The averageskill (denoted as thick black line) is around 7 days.RMS error increases as forecast lead time increases(not shown). In Fig. 8b, the dotted line denotes theanomaly correlation for the 5-year winter mean derivedby using reanalysis climatology rather than forecastclimatology in the calculation of forecast anomaly.This shows only a slight difference between two ap-proaches (i.e., with model systematic error removedand retained). However, as Inness et al. (2003) pre-sented, the basic wind error tends to act as animpediment to the zonal propagation and fixing thebasic state error in the model prior to run time allowsthe ISO system to prognostically generate a morerealistic ISO. The dash-dotted line represents theanomaly correlation for the persistence for the entirewinter season. The anomaly correlation of the persis-tence forecast is about 0.6 for first 5 forecast lead days,but as lead time increases, the correlation drops rap-idly. The forecast skill of the MJO in the current GFSmodel is rather noticeably better than the 85–89 DERFexperiment (dashed line).
The anomaly correlations of U200 anomalies forthe different phases of the life cycle of the MJO areshown in Fig. 9. In general, extreme phases have askill greater than the null case, as in general forecasts(see van den Dool and Toth 1991), but PC1+ andPC1� have a skill similar to or slightly smaller thanthe total average winter skill. Interestingly, the skillassociated with PC2+ phase is greatest, indicatingbetter upper-level wind forecasts when MJO convec-tion is located over the Maritime Continents. Mean-while, the enhanced convection initially located overthe western or central pacific (PC1�) produces thesmallest skill. The above characteristics also appearedin the earlier NCEP MRF DERF runs as in Jones etal. (1999), whereas dynamic potential predictabilityexperiments using the National Aeronautics and SpaceAdministration Goddard Laboratory for the Atmo-spheres (NASA GLA) atmospheric general circulationmodel by Waliser (2003a) showed opposite properties,
272 Seo et al.: Forecast skill of the tropical intraseasonal oscillation in the NCEP GFS dynamical extended range forecasts

a
b
c
d
e
Fig. 6 Composite plots of analyzed AVHRR OLR anomalies forthe phase of (a) PC1+, (b) PC2+, (c) PC1�, (d) PC2�, and (e) nullcases during winter season. PC1+ (PC1�) denotes the eventswhere the magnitude of the first principal component time series isgreater (less) than plus (minus, respectively) 1.5 standard devia-tions. Similarly, PC2+ (PC2�) denotes the events where themagnitude of the second principal component time series is greater
(less) than plus (minus, respectively) 1.5 standard deviations. Nullcases correspond to the events where the magnitudes of both firstand second coefficient time series are between 0.5 standarddeviation and minus 0.5 standard deviation. Contour interval is4 Wm�2. Only statistically significant areas at the 95% level areplotted
Seo et al.: Forecast skill of the tropical intraseasonal oscillation in the NCEP GFS dynamical extended range forecasts 273

implying that the most skillful phases are model-dependent. Figure 10 shows a longitude-time plot ofanomaly correlation for each extreme phase. Typically,
the downstream side of the enhanced convection (solidarrows for PC1+, PC2+ and PC1�) or suppressedconvection (dashed arrow for PC2�) shows a larger
a
b
c
d
e
Fig. 7 Composite plots of 200-hPa zonal wind anomalies (shaded) and wind vector in the reanalysis for the phase of (a) PC1+, (b) PC2+,(c) PC1�, (d) PC2�, and (e) null cases during winter season. Contour interval is 1.5 m s�1. Only statistically significant areas at the 95%level are plotted
274 Seo et al.: Forecast skill of the tropical intraseasonal oscillation in the NCEP GFS dynamical extended range forecasts

skill mainly from Kelvin wave response so that thehigher skill tends to appear over the Pacific Ocean.The central and eastern Indian Oceans have a lowervalue. Another feature is a sharp drop in the corre-lation at the western edge of the South America. Thecorrelation is also large over the Atlantic Ocean and
Africa. It is worth mentioning that forecast skill veri-fied at the time of extreme PCs is also calculated andthat this approach is not significantly different fromthat calculated at the date initialized for the time ofextreme PCs.
In order to compare our results with the previousDERF experiment (see Fig. 6 of Hendon et al. 2000), weplot the time evolution of 850-hPa zonal wind (U850)anomalies averaged between 5�S and 5�N for eachphase, which is shown in Fig. 11. Again the five extremephases are determined by the EOF PC of AVHRR OLRanomalies as in the previous figures. The upper panel is acomposite plot of the reanalysis U850. The lower panelillustrates the composite plot of forecast U850 for thecorresponding phase. It is seen that the observed windanomalies propagate east for the four extreme phases.On the other hand, the forecast zonal wind anomalies donot tend to move to the east; instead they are mostlyquasi-stationary or even move slowly westward, indi-cating that forecast intraseasonal variability cannotrepresent the eastward propagation of low-level circu-lation. The evolution of the forecast convection anom-alies was also examined. As consistent with thepropagation of the lower-level circulation, predictedOLR anomalies tend to stay at their initial location anddecay rather more quickly as forecast time increases (notshown).
Anomaly correlations of U850 and OLR as a func-tion of forecast lead times are illustrated in Figs. 12 and13, respectively. It is seen in Fig. 12 that the average skillof U850 (thick black line) is about 5 days, which is lessthan the U200 case. OLR anomaly correlation shows theaverage skillful forecast less than 4 days (Fig. 13) withdiminished lead 1 day skill by �0.1 compared to U200anomaly (Fig. 8b). This lowest skill in OLR comparedto other variables is in agreement with the lowest esti-mate of potential predictability associated with anoma-lous convection (Waliser et al. 2003a). These diminishedskills relative to that of U200 anomaly appear to arisefrom the fact that convection and U850 perturbationsare largely confined to the Eastern Hemisphere and havea higher zonal wavenumber (Hendon and Salby 1994),whereas U200 anomaly associated with the MJO is moreglobal in extent.
5 Prediction skill during northern summer season
5.1 Life cycle of the BSISO
The boreal summer intraseasonal oscillation (BSISO)exhibits a complex propagation pattern. Eastwardpropagating convection anomalies along the equatorcoexist with northward propagating convection anom-alies from the Indian Ocean to the Indian subcontinentand northwestward moving anomalies from the westernPacific (e.g., Yasunari 1979; Krishnamurti and Subrah-manyam 1982; Wang and Xie 1997; Annamalai andSlingo 2001). This is illustrated in Fig. 14, which is the
Anomaly Correlation (Winter)
0 5 10 15 20 25 30Forecast Days
0.0
0.2
0.4
0.6
0.8
1.0C
orre
latio
n 98/99 winter99/00 winter00/01 winter01/02 winter98-02 winter
Comparison of Anomaly Correlation (Winter)
0 5 10 15 20 25 30Forecast Days
0.0
0.2
0.4
0.6
0.8
1.0
Cor
rela
tion
85-89 DERF winter mean
98-02 winter w/ model error98-02 winter mean
98-02 winter persistence
a
b
Fig. 8 a Anomaly correlation of U200 as a function of forecastlead time averaged over [20�S, 20�N] for individual winters (thinlines) and 5-year winter average (thick line). b Anomaly correlationof U200 as a function of forecast lead time averaged over [20�S,20�N] for 5-year winter average (thick), the case with model errorretained (dotted), persistence forecast (dash-dotted) and previous(1985–1989) dynamic extended range forecast experiments (dashed)
Anomaly Correlation (Winter)
0 5 10 15 20 25 30Forecast Days
0.0
0.2
0.4
0.6
0.8
1.0
Cor
rela
tion
PC1+PC2+PC1-PC2-NULL
Fig. 9 Anomaly correlation of U200 as a function of forecast leadtime averaged over (20�S, 20�N) for the different phases of theMJO during winter season
Seo et al.: Forecast skill of the tropical intraseasonal oscillation in the NCEP GFS dynamical extended range forecasts 275

composite of AVHRR OLR anomalies for each phase ofthe life cycle of the BSISO. Initiation of the cycle ismarked by growth of the convection in the equatorialIndian Ocean (denoted as PC1+). This convectionanomaly strengthens and moves eastward with time. Inthe Indian Ocean, the convection anomaly elongates tothe north and south as Rossby waves are emitted(PC2+). The northern lobe propagates steadily north-westward, while the southern one is diminished (PC1�).A Kelvin wave response extends toward the date line.This northern lobe of the Rossby waves and the east-ward moving convective anomaly from the Kelvin wavesform a diagonally elongated convective band. Alongwith these, reduced convection of the previous cycle inthe South China Sea and new reduced convection in theequatorial Indian Ocean form a quadruple-like config-uration. This pattern suggests that the Indian monsoongenerally exhibits an opposite phase variation with theChina monsoon (Krishnan et al. 2000). The convectionanomaly near the Maritime Continents, which is isolatedby the eastward moving reduced convection anomaly,propagates northward (PC2�) and subsequently decaysnear the southern China continent (back to PC1+).
5.2 Prediction skill of the BSISO
Figure 15a shows anomaly correlation of U200 aver-aged over 30�–240�E and 30�S–30�N for the summerintraseasonal oscillation. The average skill is 7 days,similar to the winter case (Fig. 8a). However, the year-to-year variation of anomaly correlation is larger thanthe winter anomaly correlation. In Fig. 15b, like thewinter case, the removal of mean model error onlyslightly increases the summertime forecast skill duringthe first 8 days and anomaly correlation by persistenceforecast (dash-dotted line) drops quickly as timeincreases. Note that moderate variation in the aboveselected area for the calculation of anomaly correlationdoes not affect the main results.
The anomaly correlation of U200 for each phase ofthe BSISO is shown in Fig. 16. It is noticed that extremephases have a prediction skill extending to more than9 days; PC1� phase has a prediction skill extending to12 days. PC2+ phase shows the lowest prediction skillscore among four extreme phases during first 8 days.This behavior is similar to the results of potential pre-dictability experiments performed by Waliser et al.
a b
c d
Fig. 10 Longitude-time plot ofanomaly correlation of U200for each phase during winterseason. Vertical axis denotes theforecast lead time. Correlationsare shown for (a) PC1+,(b) PC2+, (c) PC1�, and(d) PC2�. Anomaly correlationgreater than 0.5 is shaded.Contour interval is 0.1. Thesolid (dashed) arrow representsthe propagation of enhanced(suppressed) convectionanomaly
276 Seo et al.: Forecast skill of the tropical intraseasonal oscillation in the NCEP GFS dynamical extended range forecasts

a b
c d
e
Fig. 11 Time evolution of 850-hPa zonal wind anomalies (U850)averaged between 5�S and 5�N for (a) PC1+, (b) PC2+, (c) PC1�,(d) PC2�, and (e) null cases for the winter season. Upper (lower)
panel is the composite plot of the reanalysis (forecast, respectively)U850. Contour interval is 0.5 m s�1. Only statistically significantfields at the 95% level are plotted
Seo et al.: Forecast skill of the tropical intraseasonal oscillation in the NCEP GFS dynamical extended range forecasts 277

(2003b) using the NASA GLA model. That is, theirpotential predictability is considerably greater for fore-casts that begin when the convection anomalies are lo-cated over the Indian subcontinent, the Bay of Bengal,Indo-China peninsula, the Philippines and subtropicalfar-western Pacific Ocean (i.e., PC1� phase in Fig. 14),whereas it is the smallest when the convection anomaliesare formed as Rossby waves over the Indian Ocean andKelvin waves extending from the eastern Indian Oceanand Maritime region through the west Pacific (i.e.,PC2+ phase in Fig. 14). On the other hand, null epi-sodes yield a prediction skill less than 5 days since nullperiods are related to the weather phenomena withconsiderably weaker predictability. Thus, extreme epi-sodes during the summer season provide a higher skillthan their winter counterparts, whereas summertime nullevents produce smaller anomaly correlations than in thewinter cases. Yet, it is true that extreme cases are moreskillful than null events for both the seasons. It shouldbe noted that each extreme phase takes up only 5–7% ofthe total summer events, so that the null plus normalcases lower the seasonal skillful days down to �7 days(solid thick line in Fig. 15b).
Then, there is a possibility that the predicted circu-lation anomalies for the extreme phases really exhibitnorthward propagation in this season. To investigatethis, latitude-time composite plots of U850 averagedbetween 125�E and 170�E for each phase are presentedin Fig. 17. The upper and lower panels are the compositeplots of the reanalysis U850 and forecast U850, respec-tively. The observed low-level wind anomalies propagateto the north for the four extreme phases. Indeed, theforecast zonal wind anomalies also tend to movenorthward even though they are rather weaker than thereanalysis. The characteristic northward propagation isalso evident in the OLR anomalies (not shown). Unlikethe northern winter cases, the GFS summertime forecastanomalies are seen to propagate to the north as in theobservations. The BSISO also contains an eastwardpropagating component. Figure 18 shows time evolu-tion of eastward propagating 850-hPa zonal windanomalies averaged from 5�S to 5�N for extreme phasesfor the summer season. Interestingly, eastward propa-gation along the equator in summer shows a behaviorvery similar to the winter case (Fig. 11): the observedanomalies propagate east but forecast anomalies tend tobe quasi-stationary.
Figures 19 and 20 show anomaly correlations ofU850 and OLR, respectively, as a function of forecastlead times. It is seen that the average prediction skill ofthe northward component (thick black line) is between 5and 6 days, which is about 1 or 2 days less than theU200 case. Anomaly correlation of the northwardpropagating OLR shows the average skillful forecast tobe less than 5 days (Fig. 20), but this is still greater thanthe winter case (Fig. 13) by �1 day. The eastwardpropagating component (dashed lines in Figs. 19 and20) for U850 and OLR has a skill comparable to thenorthward propagating counterpart. This comparableskill can be seen in U200 anomaly (not shown). Similarto the winter case, anomalous convection has the lowestskill.
6 Summary and discussion
This study examines the prediction performance of thetropical intraseasonal oscillation in recent DERF runsconducted with the NCEP GFS model. For the 5 yearperiod from 1 January, 1998 to 31 December, 2002,30-day forecasts were performed once a day. The modelhas been updated many times since 1996, including anupgrade of radiation package, and horizontal resolutionof T126 that is higher than the T62 version of the pre-vious MRF run. The present study extends the earlierwork by comparing prediction skill of the MJO in thecurrent and previous DERF experiments. Predictionskill for the northern summer ISO has been investigatedas well.
As in the previous DERF experiment, the GFS modelstill has difficulties in sustaining MJO variability duringthe northern winter. The forecast does not maintain the
Anomaly Correlation for U850 (Winter)
0 5 10 15 20 25 30Forecast Days
0.0
0.2
0.4
0.6
0.8
1.0C
orre
latio
n
98-02 winter w/ model error98-02 winter mean
98-02 winter persistence
Fig. 12 Anomaly correlation of U850 as a function of forecast leadtime averaged over (20�S, 20�N) in the Eastern Hemisphere for 5-year winter average (thick), the case with model error retained(dotted) and persistence forecast (dash-dotted)
Anomaly Correlation for OLR (Winter)
0 5 10 15 20 25 30Forecast Days
0.0
0.2
0.4
0.6
0.8
1.0
Cor
rela
tion
98-02 winter w/ model error98-02 winter mean
98-02 winter persistence
Fig. 13 Anomaly correlation of OLR as a function of forecast leadtime averaged over (20�S, 20�N) in the Eastern Hemisphere for 5-year winter average (thick), the case with model error retained(dotted) and persistence forecast (dash-dotted)
278 Seo et al.: Forecast skill of the tropical intraseasonal oscillation in the NCEP GFS dynamical extended range forecasts

observed eastward propagating signals of large-scalecirculation; rather the forecast anomalies seem to bestationary at their initial location and decay as time
increases. However, compared to the previous experi-ment, the model has shown some improvements inforecasting the MJO during the winter season, such that
a
b
c
d
e
Fig. 14 Composite plots of analyzed AVHRR OLR anomalies for the phase of (a) PC1+, (b) PC2+, (c) PC1�, (d) PC2�, and (e) nullcases during summer season. Contour interval is 4 Wm�2. Only statistically significant fields at the 95% level are plotted
Seo et al.: Forecast skill of the tropical intraseasonal oscillation in the NCEP GFS dynamical extended range forecasts 279

skillful forecasts (anomaly correlation>0.6) extend outto 7 days lead-time. On average, skill level is comparableduring the summer season to the winter case. Thedynamical model results in forecast skill much lowerthan that from the statistical models by Waliser et al.(1999a), Lo and Hendon (2000) and Jones et al. (2004b)
and the dynamical potential predictability experimentsby Waliser et al. (2003a, 2003b). Those provide skillfulforecasts in the order of 15–25 days. However, the GFSforecast is better compared to the empirical modepropagation method developed by van den Dool andSaha (2005) (see their real-time forecast in http://www.cpc.ncep.noaa.gov/products/people/wd51hd/mjo.html).
It should be mentioned that the period of the currentanalysis (1998–2002) is different compared to the earlierDERF runs (1985–1995). This factor may cause a dif-ference in prediction skill mainly due to the differentamplitude of intraseasonal events between the twoperiods. To examine this, the MJO activity index hasbeen calculated according to the method by Slingo et al.(1999). The index is calculated as the variance of thebandpass filtered equatorial zonal mean of the U200zonal wind (not shown). For the two DERF run periods,there is no significant difference in the MJO activity in-dex. Therefore, the interannual variation of the MJOactivity does not seem to play a critical role in thechange of forecast skill of the ISO between the twospecific periods.
Recently, the NCEP has performed a long-termclimate simulation (referred to GFS AMIP run), inwhich observed SST is used as boundary forcing (notshown). Also the NCEP has coupled the GFS modelwith the GFDL (Geophysical Fluid Dynamics Labo-ratory) Modular Ocean Model version 3 (referred toCoupled Forecast System or CFS) (e.g., Wang et al.2004). Preliminary analyses on ISO variations in thesesimulations show that the eastward propagation inCFS is much more evident compared to the GFS long-term climate (AMIP) run and GFS forecasts (i.e., thisstudy). But the ISO simulated by CFS seems too strongand slow. However, the phase relationships among thewinter ISO (MJO) convection, large-scale circulationand surface variables (surface fluxes and surface tem-perature) in CFS seem to be more consistent withobservations compared to the AMIP run. For theboreal summer ISO (BSISO), CFS simulated realisticsummer intraseasonal variations and meridional prop-agation. Also, on coupling, the phase relationshipsbetween model precipitation and various surface vari-ables are more consistent with observations. Therefore,when SSTs are fixed or specified, model surface fluxes,surface temperature, surface moisture convergence arephased rather incorrectly relative to model convectionas in previous studies by Fu and Wang (2004) andZheng et al. (2004). Full interactive coupling betweenatmosphere and ocean tends to warrant correct ISOstructure and dynamics. All these aspects of the GFSAMIP and CFS free runs will be documented in thenear future. Additionally, 45 day data from NCEPCFS operational forecasts has been archived on a dailybasis so that the ISO forecast skill can be evaluated.With this improved signal from the air–sea coupling inthe CFS run, improved forecast skill of the ISO isexpected.
Anomaly Correlation (Summer) [30E-240E, 30S-30N] avg
0 5 10 15 20 25 30Forecast Days
0.0
0.2
0.4
0.6
0.8
1.0
Cor
rela
tion 98 summer
99 summer00 summer01 summer02 summer98-02 summer
Anomaly Correlation (Summer) [30E-240E, 30S-30N] avg
0 5 10 15 20 25 30Forecast Days
0.0
0.2
0.4
0.6
0.8
1.0
Cor
rela
tion
98-02 persistence98-02 summer w/ model error98-02 summer mean
a
b
Fig. 15 a Anomaly correlation of U200 as a function of forecastlead time averaged over (30�–240�E, 30�S–30�N) for individualsummers (thin lines) and 5-year summer average (thick line). bAnomaly correlation as a function of forecast lead time for 5-yearsummer average (thick), the case with model error retained (dotted)and persistence forecast (dash-dotted)
Anomaly Correlation (Summer)
0 5 10 15 20 25 30Forecast Days
0.0
0.2
0.4
0.6
0.8
1.0
Cor
rela
tion
PC1+PC2+PC1-PC2-NULL
Fig. 16 Anomaly correlation of U200 as a function of forecast leadtime averaged over (30�–240�E, 30�S–30�N) for the different phasesof the intraseasonal oscillation during summer season
280 Seo et al.: Forecast skill of the tropical intraseasonal oscillation in the NCEP GFS dynamical extended range forecasts

a b
c d
e
Fig. 17 Time evolution of northward propagating 850-hPa zonalwind anomalies (U850) averaged between 30�–240�E and 30�S–30�N for (a) PC1+, (b) PC2+, (c) PC1�, (d) PC2�, and (e) nullcases for the summer season. Upper (lower) panel is the composite
plot of the reanalysis (forecast, respectively) U850. Contourinterval is 0.5 m s�1. Only statistically significant fields at the95% level are plotted
Seo et al.: Forecast skill of the tropical intraseasonal oscillation in the NCEP GFS dynamical extended range forecasts 281

a b
c d
e
Fig. 18 Time evolution of eastward propagating 850-hPa zonalwind anomalies (U850) averaged from 5�S to 5�N for (a) PC1+,(b) PC2+, (c) PC1�, (d) PC2�, and (e) null cases for the summer
season. Upper (lower) panel is the composite plot of the reanalysis(forecast, respectively) U850. Contour interval is 0.5 m s�1. Onlystatistically significant fields at the 95% level are plotted
282 Seo et al.: Forecast skill of the tropical intraseasonal oscillation in the NCEP GFS dynamical extended range forecasts

Acknowledgements We would like to thank Drs. Huug van denDool and Wanqiu Wang for their valuable comments and sug-gestions. We would also like to thank Drs. Ken Sperber and DuaneWaliser for their careful reviews and constructive comments, whichimproved the manuscript. We are also grateful to Dr. EdwinSchneider for his kind proofreading. C. Jones was supported by aNational Science Foundation grant (ATM-0094387).
References
Annamalai H, Slingo JM (2001) Active/break cycles: diagnosis ofthe intraseasonal variability of the Asian summer monsoon.Clim Dyn 18:85–102
Chen T-C, Alpert JC (1990) Systematic errors in the annual andintraseasonal variations of the planetary-scale divergence cir-culation in NMC medium-range forecasts. J Atmos Sci118:2607–2623
Chou MD, Lee KT (1996) Parameterizations for the absorption ofsolar radiation by water vapor and ozone. J Atmos Sci 53:1203–1208
van den Dool HM, Saha S (2005) Analysis of propagating modes inthe tropics in short AMIP runs. WMO to appear
van den Dool HM, Toth Z (1991) Why do forecasts for ‘‘nearnormal’’ often fail? Weather and forecasting 6:76–85
Fels SB, Schwarzkopf MD (1975) The simplified exchangeapproximation: a new method for radiative transfer calcula-tions. J Atmos Sci 32:1475–1488
Ferranti L, Palmer TN, Molteni F, Klinker E (1990) Tropical-extratropical interaction associated with the 30–60 day oscilla-tion and its impact on medium and extended range prediction.J Atmos Sci 47:2177–2199
Flatau M, Flatau PJ, Phoebus P, Niiler PP (1997) The feedbackbetween equatorial convection and local radiative and evapo-rative processes: the implications for intraseasonal oscillations.J Atmos Sci 54:2373–2386
Fu X, Wang B (2004) The boreal-summer intraseasonal oscillationssimulated in a hybrid coupled atmosphere-ocean model. MonWeather Rev 132:2628–2649
Hendon HH, Salby ML (1994) The life cycle of the Madden-Julianoscillation. J Atmos Sci 51:2225–2237
Hendon HH, Salby ML (1996) Planetary-scale circulations forcedby intraseasonal variations of observed convection. J Atmos Sci51:2225–2237
Hendon HH, Liebmann B, Newmann M, Glick JD, Schemm JE(2000) Medium-range forecast errors associated with activeepisodes of the Madden-Julian oscillation. Mon Weather Rev128:69–86
Higgins RW, Schubert SD (1996) Simulations of persistent NorthPacific circulation anomalies and interhemispheric teleconnec-tions. J Atmos Sci 53:188–207
Hsu H-H, Weng C-H (2001) Northwestward propagation of theintraseasonal oscillation in the Western North Pacific duringthe boreal summer: structure and mechanism. J Clim 14:3834–3850
Inness PM, Slingo JM, Guilyardi E, Cole J (2003) Simulation of theMadden-Julian oscillation in a coupled general circulationmodel. Part II: the role of the basic state. J Clim 16:365–382
Jones C (2000) Occurrence of extreme precipitation events in Cal-ifornia and relationships with the Madden-Julian oscillation.J Clim 13:3576–3587
Jones C, Waliser DE, Schemm J-KE, Lau WKM (2000) Predictionskill of the Madden-Julian oscillation in dynamical extendedrange forecasts. Clim Dyn 16:273–289
Jones C, Carvalho LMV, Higgins RW, Waliser DE, Schemm J-KE(2004a) Climatology of tropical intraseasonal convectiveanomalies: 1979–2002. J Clim 17:523–539
Jones C, Carvalho LMV, Higgins RW, Waliser DE, Schemm J-KE(2004b) A statistical forecast model of tropical intraseasonalconvective anomalies. J Clim 17:2078–2095
Kalnay E and co-authors (1996) The NCEP/NCAR 40-yearreanalysis project. Bull Am Meteorol Soc 77:437–471
Kemball-Cook S, Wang B (2001) Equatorial waves and air-seainteraction in the boreal summer intraseasonal oscillation.J Clim 14:2923–2942
Kemball-Cook S, Wang B, Fu Z (2002) Simulation of the ISO inthe ECHAM4 model: the impact of coupling with an oceanmodel. J Atmos Sci 59:1433–1453
Krishnamurti TN, Subrahmanyam D (1982) The 30–50 day modeat 850 mb during MONEX. J Atmos Sci 39:2088–2095
Krishnamurti TN, Oosterhof DK, Metha AV (1988) Air-seainteraction on the timescale of 30–50 days. J Atmos Sci45:1304–1322
Krishnan R, Zhang C, Sugi M (2000) Dynamics of breaks in theIndian summer monsoon. J Atmos Sci 57:1354–1372
Lacis AA, Hansen JE (1974) A parameterization for the absorptionof solar radiation in the Earth’s atmosphere. J Atmos Sci57:118–133
Lau K-M, Chan PH (1986a) Aspects of the 40–50 day oscillationduring the northern summer as inferred from the outgoinglongwave radiation. Mon Weather Rev 14:1354–1367
Lau K-M, FC Chang (1992) Tropical intraseasonal oscillation andits prediction by the NMC operational model. J Clim 5:1365–1378
Lau K-M, Phillips TJ (1986b) Coherent fluctuations of extratrop-ical geopotential height and tropical convection in intraseasonaltime scales. J Atmos Sci 43:1164–1181
Lawrence DM, Webster PJ (2001) Interannual variations of theintraseasonal oscillation in the South Asian summer monsoonregion. J Clim 14:2910–2922
Anomaly Correlation for U850 (Summer)
0 5 10 15 20 25 30Forecast Days
0.0
0.2
0.4
0.6
0.8
1.0C
orre
latio
n
98-02 eastward98-02 persistence (northward)98-02 northward w/ model error98-02 northward
Fig. 19 Anomaly correlation of U850 as a function of forecast leadtime averaged over (20�S, 20�N) in the Eastern Hemisphere for 5-year summer average (thick), the case with model error retained(dotted), persistence forecast (dash-dotted) for northward propa-gating component. Anomaly correlation for eastward propagatingcomponent along the equator is dashed
Anomaly Correlation for OLR (Summer)
0 5 10 15 20 25 30Forecast Days
0.0
0.2
0.4
0.6
0.8
1.0
Cor
rela
tion
98-02 eastward98-02 persistence (northward)98-02 northward w/ model error98-02 northward
Fig. 20 Same as Fig. 19 except for OLR
Seo et al.: Forecast skill of the tropical intraseasonal oscillation in the NCEP GFS dynamical extended range forecasts 283

Liebmann B, Hartmann DL (1984) An observational study oftropical midlatitude interaction on intraseasonal time scalesduring winter. J Atmos Sci 41:3333–3350
Liebmann B, Smith CA (1996) Description of a complete (inter-polated) OLR dataset. Bull Am Meteorol Soc 77:1275–1277
Lo F, Hendon HH (2000) Empirical extended-range prediction ofthe Madden-Julian oscillation. Mon Weather Rev 128:2528–2543
Madden RA, Julian PR (1994) Observations of the 40–50-daytropical oscillation – a review. Mon Weather Rev 122:814–837
Maloney ED, Hartmann DL (2000) Modulation of eastern northPacific hurricanes by Madden-Julian oscillation. J Clim13:1451–1460
Maloney ED, Kiehl JT (2002) MJO-related SST variations over thetropical eastern Pacific during Northern Hemisphere summer.J Clim 15:675–689
Matthews AJ (2000) Propagation mechanisms for Madden-Julianoscillation. QJR Meteorol Soc 126:2637–2651
McPhaden MJ (1999) Genesis and evolution of the 1997–98 ElNino. Science 283:950–954
McPhaden MJ (2004) Evolution of the 2002/03 El Nino. Bull AmMeteorol Soc 85:677–695
Mo KC, Higgins RW (1998) Tropical influences on Californiaprecipitation. J Clim 11:412–430
Murakami M (1979) Large-scale aspects of deep convective activityover the GATE area. Mon Weather Rev 107:994–1013
Schemm J-KE, van den Dool H, Saha S (1996) A multi-year DERFexperiment at NCEP. 11th Conference on numerical weatherprediction, August 19–23, 1996, Norfolk, Virginia, pp 47–49
Seo K-H, Kim K-Y (2003) Propagation and initiation mechanismsof the Madden-Julian oscillation. J Geophys Res 108(D13),4384, doi:10.1029/2002JD002876
Seo K-H, Xue Y (2005) MJO-related oceanic Kelvin waves and theENSO cycle: a study with the NCEP global ocean data assim-ilation system. Geophys Res Lett 32, L07712, doi:10.1029/2005GL022511
Sikka DR, Gadgil S (1980) On the maximum cloud zone and theITCZ over Indian longitudes during the south west monsoon.Mon Weather Rev 108:1840–1853
Slingo JM, Powell DP, Sperber KR, Nortley F (1999) On thepredictability of the interannual behaviour of the Madden-Ju-lian oscillation and its relationship with El Nino. QJR MeteorolSoc 125:583–609
Sperber KR (2003) Propagation and veritical structure of theMadden-Julian oscillation. Mon Weather Rev 131:3018–3037
Sperber KR, Slingo JM, Inness PM, Lau K-M (1997) On themaintenance and initiation of the intraseasonal oscillation inthe NCEP/NCAR reanalysis and in the GLA and UKMOAMIP simulations. Clim Dyn 13:769–795
Waliser DE, Jones C, Schemm J-KE, Graham NE (1999a) A sta-tistical extended-range tropical forecast model based on theslow evolution of the Madden-Julian oscillation. J Clim12:1918–1939
Waliser DE, Lau K-M, Kim J-H (1999b) The influence of coupledsea surface temperatures on the Madden-Julian oscillation: amodel perturbation experiment. J Atmos Sci 56:333–358
Waliser DE, Lau K-M, Stern W, Jones C (2003a) Potential pre-dictability of the Madden-Julian oscillation. Bull Am MeteorolSoc 84:33–50
Waliser DE, Stern W, Schubert S, Lau K-M (2003b) Dynamicpredictability of intraseasonal variability associated with theAsian summer monsoon. QJR Meteorol Soc 129:2897–2925
Waliser DE, Schubert SD, Kumar A, Weickmann KL, Dole R(2003c) Modeling, simulation, and forecasting of subseasonalvariability. Technical report series on global modeling and dataassimilation, NASA/CP-2003–104606, 25, p 65
Wang B, Xie X (1997) A model for the boreal summer intrasea-sonal oscillation. J Atmos Sci 54:72–86
Wang W, Saha S, Pan H-L (2004) Simulation and prediction of theMJO with the NCEP models. In: Proceedings of CMWF/CLIVAR workshop on simulation and prediction of intra-sea-sonal variability with emphasis on the MJO, Reading, UnitedKingdom, pp 237–249
Weickmann KM (1983) Intraseasonal circulation and outgoinglongwave radiation modes during Northern Hemisphere winter.Mon Weather Rev 111:1838–1858
Woolnough SJ, Slingo JM, Hoskins BJ (2000) The relationshipbetween convection and sea surface temperature on intrasea-sonal timescales. J Clim 13:2086–2104
Yansunari T (1979) Cloudiness fluctuations associated withthe Northern Hemisphere monsoon. J Meteorol Soc Jpn58:225–229
Zeng Y, Waliser DE, Stern WE, Jones C (2004) The role of coupledsea surface temperatures in the simulation of the tropical in-traseasonal oscillation. J Clim 17:4109–4134
284 Seo et al.: Forecast skill of the tropical intraseasonal oscillation in the NCEP GFS dynamical extended range forecasts