Habituation of Neurosecretory Responses to Extracellular ATP ...

Hindawi Publishing CorporationBioMed Research InternationalVolume 2013, Article ID 760963, 10 pageshttp://dx.doi.org/10.1155/2013/760963
Research ArticleJIS Definition Identified MoreMalaysian Adults with Metabolic Syndrome Compared tothe NCEP-ATP III and IDF Criteria
Anis Safura Ramli,1,2 Aqil Mohammad Daher,2,3 Mohamed Noor Khan Nor-Ashikin,2,4
Nafiza Mat-Nasir,1,2 Kien Keat Ng,1,2 Maizatullifah Miskan,1,2 Krishnapillai S. Ambigga,1,2
Farnaza Ariffin,1,2 Md Yasin Mazapuspavina,1,2 Suraya Abdul-Razak,1,2
Hasidah Abdul-Hamid,1,2 Fadhlina Abd-Majid,2 Najmin Abu-Bakar,2
Hapizah Nawawi,2,5 and Khalid Yusoff2,6
1 Primary Care Medicine Discipline, Faculty of Medicine, Universiti Teknologi MARA, 47000 Sungai Buloh, Selangor, Malaysia2 Centre for Translational Research and Epidemiology (CenTRE), Faculty of Medicine, Universiti Teknologi MARA,47000 Sungai Buloh, Selangor, Malaysia
3 Population Health & Preventive Medicine Discipline, Faculty of Medicine, Universiti Teknologi MARA,47000 Sungai Buloh, Selangor, Malaysia
4 Physiology Discipline, Faculty of Medicine, Universiti Teknologi MARA, 47000 Sungai Buloh, Selangor, Malaysia5 Centre for Pathology & Diagnostic Research Laboratory (CPDRL), Faculty of Medicine, Universiti Teknologi MARA,47000 Sungai Buloh, Selangor, Malaysia
6Cardiology Discipline, Faculty of Medicine, Universiti Teknologi MARA, 47000 Sungai Buloh, Selangor, Malaysia
Correspondence should be addressed to Anis Safura Ramli; rossanis [email protected]
Received 28 April 2013; Accepted 22 June 2013
Academic Editor: Leo J. Schouten
Copyright © 2013 Anis Safura Ramli et al. This is an open access article distributed under the Creative Commons AttributionLicense, which permits unrestricted use, distribution, and reproduction in any medium, provided the original work is properlycited.
Metabolic syndrome (MetS) is a steering force for the cardiovascular diseases epidemic in Asia. This study aimed to compare theprevalence of MetS in Malaysian adults using NCEP-ATP III, IDF, and JIS definitions, identify the demographic factors associatedwith MetS, and determine the level of agreement between these definitions. The analytic sample consisted of 8,836 adults aged ≥30years recruited at baseline in 2007–2011 from the Cardiovascular Risk Prevention Study (CRisPS), an ongoing, prospective cohortstudy involving 18 urban and 22 rural communities inMalaysia. JIS definition gave the highest overall prevalence (43.4%) comparedto NCEP-ATP III (26.5%) and IDF (37.4%), 𝑃 < 0.001. Indians had significantly higher age-adjusted prevalence compared to otherethnic groups across all MetS definitions (30.1% by NCEP-ATP III, 50.8% by IDF, and 56.5% by JIS). The likelihood of having MetSamongst the rural and urban populations was similar across all definitions. A high level of agreement between the IDF and JIS wasobserved (Kappa index = 0.867), while there was a lower level of agreement between the IDF and NCEP-ATP III (Kappa index =0.580). JIS definition identifiedmoreMalaysian adults withMetS and therefore should be recommended as the preferred diagnosticcriterion.
1. Introduction
Metabolic syndrome (MetS), which is also known as “Syn-drome X,” was first described by Reaven in his 1988 BantingLecture [1]. It is characterized by clustering of cardiovascularrisk factors, namely, central obesity, elevated blood pressure,
elevated plasma glucose, and dyslipidaemia [2]. Insulin resis-tance and adipose tissue dysfunction are thought to be theprimary mediators of MetS [3, 4].
Since it was first introduced,MetS has become the subjectof paramount research interest and also a subject of ongoingdebate with regard to its clinical value as a distinct diagnostic

2 BioMed Research International
entity [5, 6]. Nevertheless, several diagnostic criteria forMetScontinued to emerge over the last few decades. The firstdefinition was introduced by the World Health Organization(WHO) in 1998 [7] followed by the National CholesterolEducation Program Expert Panel on Detection, Evaluation,and Treatment of High Blood Cholesterol in Adults (NCEP-ATP III) in 2001 [8]. Subsequently, the International DiabetesFederation (IDF) established a new worldwide definition forMetS in 2005 [9]. In contrast to the previous definitions,IDF made abdominal obesity a mandatory criterion usingwaist circumference (WC) cut-points based on gender andethnicity [9]. In the same year, the NCEP-ATP III was mod-ified to incorporate a lower fasting glucose threshold of≥5.6mmol/L and the same WC criteria as proposed by theIDF for Asians living in the United States [10]. However,the modified NCEP-ATP III maintained that the diagnosis ofMetS should be made based on the presence of any 3 out of5 risk factors. After several years of continuing debate anddiscussion, the various stakeholders finally agreed to har-monize the definition. A Joint Interim Statement (JIS) onMetS definition was issued in 2009 by the IDF Task Forceon Epidemiology and Prevention; National Heart, Lung, andBlood Institute; American Heart Association; World HeartFederation; International Atherosclerosis Society; and Inter-national Association for the Study of Obesity [11]. The JIScommittee agreed that the presence of any 3 out of 5 riskfactors constitutes a diagnosis of MetS. Abdominal obesityis no longer a prerequisite for diagnosis, as more evidenceis needed to relate WC with the risk of developing type 2diabetesmellitus (T2DM) and cardiovascular diseases (CVD)[11]. Long-term prospective studies are also required to estab-lish more reliable WC cut-points for different ethnic groups[11]. In the interim, the committee proposed that theWC cut-points as recommended by IDF are used until new evidenceemerges [11].Thenew JIS “harmonized” definition is expectedto have the advantage of identifying a larger number of MetScases in a population, compared to the other definitions.Table 1 shows the summary of NCEP-ATP III, IDF, modifiedNCEP-ATP III, and JIS definitions for MetS.
Robust evidence showed that individuals diagnosed withMetS using these definitions have a greater risk of significantclinical consequences, the two most prominent of which arethe development of T2DMandCVD[12–15]. IndividualswithMetS have a fivefold greater risk of developing T2DM [12],while a systematic review of 37 studies involving more than170,000 patients has shown that MetS doubles the risk ofcardiovascular events [15].
Irrespective of the diagnostic criteria used, epidemio-logical studies from various parts of the world have clearlydemonstrated that MetS is an increasing global health prob-lem, not only in the western societies, but also in the Asianpopulations [16, 17]. The clustering of CVD risk factors thatcharacterizes MetS is a powerful driving force for the emerg-ing CVD epidemic in Asia [17, 18]. The prevalence of MetSin East Asia was found to range from 8% to 13% in men andfrom 2% to 18% in women, depending on the population anddefinition used [17]. In Malaysia, epidemiological evidencedescribing prevalence of MetS is still scarce. Most localstudies on MetS prevalence involved small sample size [19,
20], with the exception of a cross-sectional survey involving4341Malaysian adults (>18 years old) [21].The survey showedthat crude prevalence of MetS using WHO, NCEP-ATPIII, IDF, and JIS definitions was 32.1%, 34.3%, 37.1%, and42.5%, respectively [21]. More evidence is needed to describethe prevalence of MetS in Malaysia. This study aimed tocompare the overall and age-adjusted prevalence of MetS inMalaysian adults using the NCEP-ATP III, IDF, and JISdefinitions, identify the demographic factors associated withMetS, and determine the level of agreement between thesedefinitions.
2. Methods
2.1. Study Design and Population. The Cardiovascular RiskPrevention Study (CRisPS) is an ongoing, prospective, com-munity-based, cohort study involving Malaysian adults ≥30years of age from 18 urban and 22 rural communities from thestates of Selangor, Negeri Sembilan, Pahang, Kelantan, andSabah.
Subjects in CRisPS were selected in a four-stage sam-pling process: selecting the states and then “communities,”followed by households within them and finally individualswithin households. This design enables identification of bothindividual and environmental determinants of health.
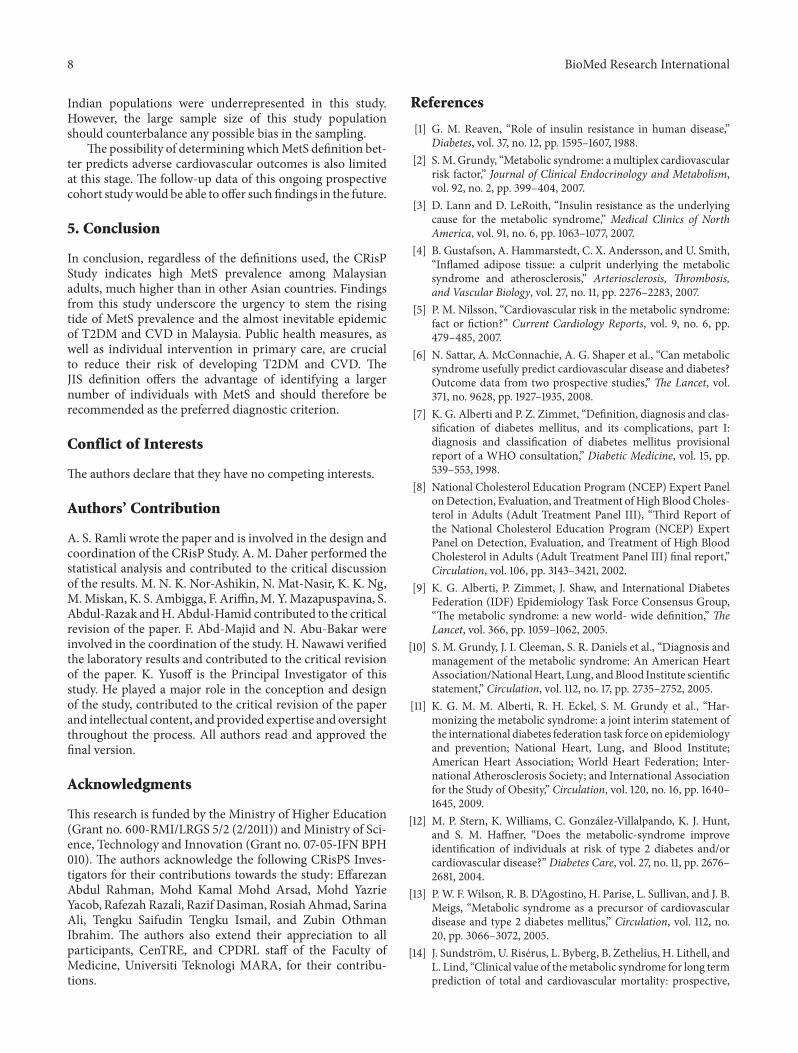
2.2. Sampling Methods: State and Site Selection. The 5 stateswere pragmatically chosen to ensure adequate representationof the major ethnic groups in Malaysia. The main ethnicgroups in Peninsular Malaysia are Malays, Chinese, andIndian, while the main ethnic groups in Sabah are theKadazan-Dusun, Bajau, and Murut. For the purpose of thisstudy, the Kadazan-Dusun, Bajau, Murut, and several otherethnic minorities were categorized as the indigenous groups.Selangor, Negeri Sembilan, and Pahang have a good mixtureof Malay, Chinese, and Indian populations. Kelantan offersa predominant Malay population while Sabah represents theindigenous population. Figure 1 shows the map of CRisPStudy sites illustrating the distribution of the urban and ruralcommunities across the 5 states.
Community was defined as groups of people residing inthe same locality who have common characteristics such asculture, socioeconomics, and use of amenities, goods, andservices. Urban and rural areas were defined according tothe Malaysian Population and Housing Census (2000) [22].Gazetted areas with a combined population of 10,000 ormorewere defined as urban areas, while areas with a population ofless than 10,000 were classified as rural.
Both urban and rural communities were selected with theaim of achieving within-community homogeneity in demo-graphic and socioeconomic profiles. In view of the fact thatthis study was designed as a prospective cohort study, thesecommunities were also selected based on the pragmaticrequirement of optimizing the capacity of investigators tomaintain long-term follow-up of participants and coopera-tion by community leaders. These factors were important toensure continuity of data collection which is being scheduledevery 3 years, for a period of 15 years.

BioMed Research International 3
Table 1: Diagnostic criteria for metabolic syndrome.
Risk factors (RF) NCEP-ATP III (2001) IDF (2005) Modified NCEP-ATP III(2005) JIS (2009)
Waist circumference(WC)
M ≥ 102 cm F ≥ 88 cm(Caucasian cut-points)
M ≥ 90 cm F ≥ 80 cm(South Asian cut-points)
M ≥ 90 cm F ≥ 80 cm(Asian cut-points)
M ≥ 90 cm F ≥ 80 cm(South Asian cut-points)
Blood pressure (BP) Systolic BP ≥ 130 and/ordiastolic BP ≥ 85mmHg
Systolic BP ≥ 130 and/ordiastolic BP ≥ 85mmHg oron treatment for HPT
Systolic BP ≥ 130 and/ordiastolic BP ≥ 85mmHg oron treatment for HPT
Systolic BP ≥ 130 and/ordiastolic BP ≥ 85mmHg oron treatment for HPT
Fasting plasmaglucose (FPG) ≥6.1mmol/L ≥5.6mmol/L or previously
diagnosed T2DM
≥5.6mmol/L or ontreatment for elevatedglucose
≥5.6mmol/L or ontreatment for elevatedglucose
Triglycerides (TG) ≥1.7mmol/L ≥1.7mmol/L or on treatmentfor TG
≥1.7mmol/L or ontreatment for TG
≥1.7mmol/L or ontreatment for TG
HDL-C M < 1.03mmol/LF < 1.29mmol/L
M < 1.03mmol/LF < 1.29mmol/L or ontreatmentfor HDL-C
M < 1.03mmol/LF < 1.29mmol/L or ontreatment for HDL-C
M < 1.0mmol/LF < 1.3mmol/L or ontreatment for HDL-C
Metabolic syndromedefinitions At least 3 RF WC + 2 or more RF At least 3 RF At least 3 RF
RF: risk factors.
RuralUrban
Figure 1: The Cardiovascular Risk Prevention Study (CRisPS) sitesmap.
2.3. SamplingMethods: Subjects Recruitment. A standardizedmethod of recruitment was adopted, in which announce-ments and invitations were made through local communityleaders. All household members aged ≥30 years residingin each locality were invited to attend a screening sessionat their local community centre through written invitation.Participants were given information regarding the purpose ofthe study and were requested to fast for at least 8 hours priorto the screening. A response rate of 60–70% was recorded foreach site. At the screening centre, subjects were screened foreligibility. They were given an information leaflet regardingthe study, and written informed consent was obtained.
The study protocol was approved by the institutionalethics committee.
2.4. Study Procedures. All interviewers and investigatorsweretrained regarding the study procedures prior to the conductof the study to minimize variability in the method of datacollection. Standardized, interviewer-based questionnaireswere used to collect information regarding age, gender, ethnicgroup, and educational attainment.
Anthropometrical measures which included waist cir-cumference (WC) and blood pressure (BP) were obtained.WC was measured to the nearest 0.1 cm by using non-stretchable measuring tape with the subjects standing in arelaxed position and arms at the side. The measurement wastaken at the midpoint between the lower rib margin (12thrib) and the iliac crest. BP was measured twice 2 minutesapart on the right arm in sitting position, using Omronautomatic digital blood pressure monitor (Omron HEM-757). Subjects were advised not to smoke, exercise, or eat inthe last 30 minutes and not to climb stairs in the last 15–30minutes and were made to rest for at least 5 minutes beforethe measurements were taken. Subjects were seated uprightwith his/her right arm supported at heart level. The averageof the first and second measurements was used as the BPvalue for individual subjects. If the measurements differ by5mmHg of either systolic or diastolic readings, subsequentmeasurements were taken at 5–10 minutes apart. The processwas repeated until two BP values which did not differ bymorethan 5mmHg of either systolic or diastolic readings wereobtained. The average of these two BP readings was used asthe BP value for that particular subject.
Fasting venous blood samples were collected for plasmaglucose and serum lipid profile (total cholesterol (TC),triglycerides (TG), low-density lipoprotein cholesterol (LDL-C), and high-density lipoprotein cholesterol [HDL-C]). TG,TC, HDL-C, and glucose levels were measured by enzymaticreference method on an automated analyzer (Cobas Integra400 plus, Roche Diagnostic, Basel, Switzerland).
2.5. Metabolic Syndrome Definitions. MetS was defined ac-cording to 3 sets of criteria proposed by the NCEP-ATPIII 2001 [8], IDF 2005 [9], and JIS 2009 [11] as previouslyshown in Table 1. Instead of themodifiedNCEP-ATP III 2005[10], the first version of NCEP-ATP III 2001 which appliedCaucasian cut-points for WC was chosen to define MetS forthe purpose of this paper as it allows better comparison with

4 BioMed Research International
other western studies. Furthermore, the MetS criteria in themodified NCEP-ATP III 2005 are very similar to those in JIS2009. Consequently, the analysis using these two definitionsyielded similar results. Therefore, the modified NCEP-ATPIII 2005 definition was excluded as it does not add furthervalue to this paper.
2.6. Data Collection. The baseline data was collected from2007 to 2011, and follow-up data is currently being collectedevery 3 years for a period of 15 years. The analytic samplepresented in this paper consisted of 8,836 subjects who wererecruited at baseline.
2.7. Statistical Analysis. All data were entered and analyzedusing STATA software version 11.1. Numerical variables weredescribed with mean (±Standard Deviation (SD)). Categori-cal variables were described with frequency and percentage.Age-adjusted prevalence was computed using direct stan-dardization method and presented with 95% CI. Multiplelogistic regressions were used to determine the associationbetween MetS according to the various definitions andthe site of dwelling, age, gender, ethnicity, and educationalattainment. Sensitivity, specificity, and level of agreementusing Kappa index were determined for MetS diagnoses asdefined by the NCEP-ATP III and JIS definitions, against theIDF definition. Significance level was set at 𝑃 value of <0.05.
3. Results
A total of 8,836 adults (mean age 53.21±10.6) participated inthis study.The sociodemographic characteristics of the studysubjects are shown in Table 2. It is noted that there werehigher percentages of urban compared to rural popula-tions and more females compared to male participants.With regard to ethnic group distributions, Malays comprised72.5%, Chinese 12.3%, Indians 3.2%, and indigenous groups12.0% of the study population. More than a third of theparticipants attained secondary education and about a fifthattained tertiary educational level.
Table 3 shows the overall and age-adjusted prevalence ofMetS according to theNCEP-ATP III, IDF, and JIS definitionsby location, gender, ethnic group, and education attainment.JIS definition gave the highest overall prevalence (43.4%)compared to IDF (37.4%) and NCEP-ATP III (26.5%). Therewas significantly higher age-adjusted prevalence of MetS inthe urban compared to the rural population according tothe IDF (39.0% versus 36.3%, 𝑃 = 0.002) and JIS (44.6%versus 42.5%, 𝑃 = 0.018). In comparison to males, femaleparticipants had significantly higher age-adjusted prevalenceaccording to the NCEP-ATP III (24.1% versus 28.9%, 𝑃 <0.001) and IDF (36.1% versus 39.3%, 𝑃 = 0.001) but notsignificant according to the JIS definition (43.8% versus43.9%, 𝑃 = 0.777). The Chinese had the lowest age-adjustedprevalence according to the NCEP-ATP III definition (15.4%,𝑃 < 0.001), while the indigenous groups had the lowest age-adjusted prevalence by IDF (26.3%, 𝑃 < 0.001) and JIS(32.5%, 𝑃 < 0.001) definitions. Indians had significantlyhigher age-adjusted prevalence compared to other ethnicgroups by all MetS definitions (30.1% by NCEP-ATP III,
Table 2: Demographic characteristics of the study subjects.
Demographic characteristicsAll subjects, n (%) 8836 (100)Mean age in years (±SD) 53.21 (±10.6)Location, n (%)
Urban 4757 (53.8)Rural 4079 (46.2)
Gender, n (%)Male 3766 (42.6)Female 5070 (57.4)
Ethnic group, n (%)Malays 6408 (72.5)Chinese 1085 (12.3)Indians 280 (3.2)Indigenous groups 1063 (12.0)
Education attainment, n (%)∗
No formal education 1227 (14.7)Primary 2182 (26.1)Secondary 3236 (38.7)Tertiary 1715 (20.5)
∗Number not equal to 𝑛 = 8836 due to missing data (𝑛 = 8360).
50.8%by IDF, and 56.5%by JIS). According to theNCEP-ATPIII, those with tertiary education had the lowest age-adjustedprevalence (19.5%, 𝑃 < 0.001). On the contrary, those withno formal education had the lowest age-adjusted prevalenceby IDF definition (32.3%, 𝑃 = 0.03).
Table 4 shows the association between MetS and thesociodemographic factors. The likelihood of having MetSamongst rural and urban populations was similar across alldefinitions. Female participants were found to be more likelyto have MetS compared to males according to the NCEP-ATP III and IDF definitions but not by JIS definition. Thelikelihood of having MetS also increased with age wherethe odds ratio (OR) was highest in those aged ≥60 years.With regard to ethnicity, Chinese and indigenous groupswere found to be less likely to have MetS compared to theMalays across all definitions. Indians were found to be morelikely to have MetS compared to the Malays according to theIDF and JIS definitions. In terms of education attainment,subjects with tertiary education were less likely to have MetSaccording to the NCEP-ATP III definition compared to thosewith no formal education. According to the IDF and JISdefinitions, subjects with primary education weremore likelyto have MetS compared to those with no formal education.
Table 5 shows the sensitivity and specificity of MetS asdefined by the NCEP-ATP III and JIS against IDF definitionas the reference criteria for diagnosis. The NCEP-ATP IIIdefinition was only able to identify 60.7% as having MetSout of the total IDF defined cases. There was a high falsenegative rate at 39.3%.The level of agreement as expressed bythe Kappa index was 0.580. The JIS definition was successfulin diagnosing 99.4% of those diagnosed with MetS accordingto the IDF definition. The false negative rate was very low

BioMed Research International 5
Table 3:The overall and age-adjusted prevalence of metabolic syndrome according to the NCEP-ATP III, IDF, and JIS definitions by location,gender, ethnic group, and education attainment.
Demographic characteristics Total number of subjects NCEP-ATP III (2001) IDF (2005) JIS (2009)Prevalence (95% confidence interval)
Overall 8836 26.5 (25.6–27.4) 37.4 (36.3–38.4) 43.4 (42.3–44.4)P value <0.001∗
LocationUrban 4757 25.0 (23.8–26.2) 39.0 (37.7–40.4) 44.6 (43.2–46.0)Rural 4079 28.5 (27.1–29.9) 36.3 (34.8–37.7) 42.5 (41.0–44.0)
P value 0.001∗ 0.002∗ 0.018∗
GenderMale 3766 24.1 (22.7–25.4) 36.1 (34.6–37.7) 43.8 (42.3–45.4)Female 5070 28.9 (27.6–30.1) 39.3 (38.0–40.6) 43.9 (42.6–45.2)
P value <0.001∗ 0.001∗ 0.777Ethnic group
Malays 6408 29.1 (28.0–30.2) 40.2 (39.1–41.4) 46.0 (44.8–47.1)Chinese 1085 15.4 (13.3–17.6) 27.9 (25.3–30.5) 33.4 (30.7–36.0)Indians 280 30.1 (25.3–34.9) 50.8 (45.6–56.0) 56.5 (51.4–61.7)Indigenous groups 1063 20.7 (18.5–23.2) 26.3 (23.6–29.1) 32.5 (29.6–35.4)
P value <0.001∗ <0.001∗ <0.001∗
Education attainmentNo formal education 1227 25.4 (22.6–28.2) 32.3 (29.2–35.4) 39.8 (36.6–43.0)Primary 2182 29.4 (27.4–31.3) 38.5 (36.4–40.5) 44.4 (42.3–46.6)Secondary 3236 27.1 (25.5–28.8) 39.4 (37.7–41.2) 44.9 (43.1–46.7)Tertiary 1715 19.5 (17.4–21.6) 35.3 (32.8–37.7) 40.8 (38.3–43.4)
P value <0.001∗ 0.03∗ 0.362∗P value < 0.05.
at 0.6%. The level of agreement between the JIS and IDFdefinitions was very good with a Kappa index of 0.867.
4. Discussion
TheCRisP Study reinforces the findings of a previous nation-wide survey [21] that the overall prevalence of MetS amongMalaysian adults was much higher compared with otherAsian countries [17, 23]. This study found that the overallprevalence of MetS among Malaysian adults was 26.5%,37.4%, and 43.4% according to the NCEP-ATP III, IDF,and JIS definitions, respectively. Comparison to other Asiancountries can be made using the IDF definition (with similarWC cut-points), where the prevalence was much lower inJapan (11%) [24], Singapore (17.7%) [25], and Nepal (22.5%)[26]. Comparison to other populations is harder to makeas different WC cut-points were used to define abdominalobesity. MetS prevalence in the Greek population, however,was higher at 43.4% by IDF and 45.7% by JIS [27]. Similarly,prevalence by NCEP ATP III in the United States (34.0%)[28] and Iran (34.7%) [29] was much higher compared to thefinding in the CRisP Study.
With regard to ethnicity, this study found that MalaysianIndians had significantly higher age-adjusted prevalencecompared to other ethnic groups by all MetS definitions(30.1% by NCEP-ATP III, 50.8% by IDF, and 56.5% by JIS).Another study also found that the prevalence inAsian Indians
was high at 35.8% by NCEP-ATP III and 39.5% by IDFcriteria [30]. It is well recognized that Indians, in particularof South Asian origin, have an ethnic predisposition toabdominal obesity, glucose intolerance, hypertension, anddyslipidaemia, resulting in increasedmorbidity andmortalityrates due to CVD [31]. On the contrary, this study showsthat Malaysian Chinese had the lowest MetS prevalenceby NCEP-ATP III, while the indigenous groups had thelowest prevalence by IDF and JIS definitions. MalaysianChinese and indigenous groups were also found to be lesslikely to have MetS compared to the Malays according toall definitions. Variations in the MetS prevalence in differentethnic groups living in the same country had also been shownin several other studies [32]. This variation may be due tothe environmental and genetic factors, which have long beenrecognized to play a pivotal role in the pathophysiology ofMetS [33].
As expected, the JIS definition gave the highest overallprevalence of MetS compared to NCEP-ATP III and IDFdefinitions. The JIS definition offers an advantage of identi-fying a larger number of individuals with MetS due to thepresence of other multiple risk factors, despite having WCof less than the recommended cut-points. In this study, thelikelihood of males being identified to have MetS was similarto females according to JIS definition, but female participantswere found to bemore likely to haveMetS compared tomalesaccording to the NCEP-ATP III and IDF definitions. This

6 BioMed Research International
Table 4: Factors associated with metabolic syndrome according to the ATP III, IDF, and JIS definitions among Malaysian adults ≥30 yearsof age.
Metabolic syndrome definitionsNCEP-ATP III (2001) IDF (2005) JIS (2009)
Odds ratio(95% CI) P value Odds ratio
(95% CI) P value Odds ratio(95% CI) P value
LocationUrban 1.00 1.00 1.00Rural 1.06 (0.94–1.20) 0.326 0.87 (0.79–1.02) 0.086 0.89 (0.80–1.00) 0.058
GenderMale 1.00 1.00 1.00Female 1.29 (1.17–1.44) <0.001∗ 1.19 (1.09–1.31) <0.001∗ 1.02 (0.93–1.12) 0.616
Age (years)30–39 1.00 1.00 1.0040–49 1.39 (1.13–1.73) <0.001∗ 1.63 (1.35–1.97) <0.001∗ 1.56 (1.30–1.87) <0.001∗
50–59 2.26 (1.83–2.79) <0.001∗ 2.72 (2.25–3.27) <0.001∗ 2.72 (2.27–3.25) <0.001∗
≥60 2.34 (1.87–2.92) <0.001∗ 2.67 (2.18–3.26) <0.001∗ 3.08 (3.54–3.70) <0.001∗
EthnicityMalay 1.00 1.00 1.00Chinese 0.44 (0.36–0.53) <0.001∗ 0.53 (0.45–0.62) <0.001∗ 0.56 (0.49–0.66) <0.001∗
Indian 1.02 (0.77–1.37) 0.867 1.48 (1.14–1.92) 0.003∗ 1.54 (1.18–1.99) <0.001∗
Indigenous groups 0.60 (0.50–0.72) <0.001∗ 0.56 (0.47–0.66) <0.001∗ 0.63 (0.54–0.73) <0.001∗
Education levelNo formal education 1.00 1.00 1.00Primary 1.16 (0.99–1.37) 0.067 1.34 (1.15–1.58) <0.001∗ 1.18 (1.01–1.37) 0.029∗
Secondary 1.05 (0.89–1.25) 0.544 1.25 (1.06–1.48) 0.009∗ 1.12 (0.96–1.31) 0.147Tertiary 0.77 (0.63–0.95) 0.012∗ 1.04 (0.86–1.27) 0.673 0.92 (0.76–1.10) 0.350
∗P value < 0.05.
Table 5: Sensitivity, specificity, and level of agreement for metabolic syndrome as defined by the NCEP-ATP III and JIS definitions againstthe IDF definition.
Definitions IDFNo MetS Yes MetS Sensitivity Specificity Kappa index P value
NCEP-ATP IIINo MetS 5194 (93.9%) 1299 (39.3%) 60.7% 93.9% 0.580 <0.001∗Yes MetS 337 (6.1%) 2006 (60.7%)
JISNo MetS 4981 (90.1%) 19 (0.6%) 99.4% 90.1% 0.867 <0.001∗Yes MetS 550 (9.9%) 3286 (99.4%)
∗P value < 0.05.
may be explained by the fact that a higher number of maleswere diagnosed to have MetS according to the JIS definition,despite having WC of less than 90 cm (hence not classifiedas having MetS by IDF criteria). The ORISCAV-LUX studyinvolving 1349 European subjects found thatMetS prevalenceby JIS definition was significantly higher in men than inwomen, as were all components of MetS except abdominalobesity [34]. A prospective analysis ofmortality inmen foundthat these males were still at high risk of CVD mortality dueto the presence of multiple risk factors despite the absence ofabdominal obesity [35]. A recent review has suggested that
JIS definition may better identify those at increased risk ofCVD, while IDF definition may be more appropriate for theidentification of those with insulin resistance and increasedrisk of T2DM [36].
In terms of location, this study shows that the likelihoodof having MetS amongst the rural population was similarto their urban counterparts. The results are comparable tothe NHMS III cohort study group whose data indicates thatcardiovascular risk-factor clustering was similar in urban andrural populations [18]. The findings support the hypothesisthat rapid economic development leads to urbanization of

BioMed Research International 7
rural areas in Malaysia, resulting in the rural populationadopting sedentary lifestyle, akin to their urban counterparts,and, therefore, have similar T2DM and CVD risks.
Consistent with the findings from another study [34],the CRisP Study also shows the likelihood of having MetSincreased with age, where the OR was highest in those aged≥60 years. This is thought to be due to age-related risesof blood pressure and plasma glucose level [37]. AlthoughMalaysia is still considered as a relatively young nation, itsageing population of ≥60 years is rising steadily from 5.7% in1990 to 6.3% in 2000 and is expected to be 9.8% in 2020 [38].The increasing number of elderly population with multiplerisk factors and comorbidities is poised to become a majorchallenge to the Malaysian healthcare system in the nearfuture [39].
With regard to determining the level of agreementbetween the three definitions, IDF was used as the referencecriterion as it is the most widely accepted in Malaysia. Thisstudy found a very high level of agreement between the JISand IDF definitions (Kappa index = 0.867). The finding isexpected in view of similar reference range of the attributesincluding WC cut-points used in both definitions. On thecontrary, there was a lower level of agreement (Kappaindex = 0.580) between NCEP-ATP III and IDF. This maybe attributed to the difference in the reference ranges andWC cut-points in the NCEP-ATP III definition. Similarly, theORISCAV-LUX study showed a remarkable level of agree-ment between the JIS and IDF definitions (Kappa index =0.93), and lower level of agreement was found betweenNCEP-ATP III and IDF definitions (Kappa index = 0.84)[34]. JIS should be recommended as the preferred diagnosticcriterion as it shows a very high level of agreement with IDFand also has the advantage of identifying a larger number ofindividuals with MetS.
This study underlines the magnitude of cardiovascularrisk factor clustering in the Malaysian population. TheNational Health and Morbidity Survey (2011) shows similartrend of escalating cardiovascular risk factor prevalence overthe last two decades [40]. A higher MetS prevalence wouldtranslate into higher numbers with established diabetes,cardiovascular diseases, and events, leading to increasedutilization of healthcare services, escalating health care costs,increased premature deaths, reduced productivity, and catas-trophic economic implications [41]. This CVD epidemic hasalready begun in Malaysia where there is a trend towards ayounger age at first myocardial infarction [42] and highercardiovascular mortality than in developed countries [43].
MetS has now become a major public health threat andclinical problem. In response to the urgent needs to addressthis phenomenon, theMinistry ofHealth,Malaysia, launchedthe National Strategic Plan for the Non CommunicableDisease (NSPNCD) in 2010, focusing on seven strategieswhich include prevention and health promotion, clinicalinterventions, partnership with patients, public engagement,research and surveillance, capacity building, and regulatoryinterventions [44]. However, when resources are limited,priorities should be given to the most cost-effective strategieswhich can produce swift changes [45]. At the public healthlevel, more attention should be given to the modification
of lifestyle of the general public through health promotioncampaigns,multisectoral collaborations, and regulatorymea-sures [45, 46]. Preventive strategies should begin early inchildhood as 3.9% (0.3 million) of Malaysian children below18 years were found to be obese [40]. Children who areobese have a greater likelihood of being obese in adulthoodwhich would lead to the development of MetS, diabetes, andcardiovascular diseases [47]. Therefore, preventing obesityamong young children is a vital strategy for reversing theepidemic [44]. The preschool and primary school years pro-vide numerous opportunities to promote healthy eating andphysical activity behaviors among children. Strategies whichhave been proven to be effective include integrating educationon healthy eating, physical activity, and body image intoclassroom curriculum, increasing opportunities for physicalactivity throughout the school week, improving nutritionalquality of the food supply in schools, engaging parentsand promoting home activities, and supporting teachers toimplement health promotion strategies [48]. Implementationof these interventions in Malaysian schools would requiremultisectoral collaborations between the education andhealth ministries. Regulatory measures should also includea requirement for the canteen operators to provide healthyfood choices in Malaysian schools.
At the primary care level, individual patients with MetSneed to be identified so that their multiple risk factors can bemanaged early to reduce complications [45]. Recent evidencefrom a middle income country has proven that treatment ofmultiple risk factors such as hypertension and dyslipidaemiahad a much higher disability-adjusted life year (DALY) savedcompared to enforced salt reduction in bread and tobaccocessation campaigns in mass media [49]. Concerted effortsshould also be made to screen healthy individuals who areat risk of developing MetS. However, this attempt is oftenhampered by the shortage of multidisciplinary primary careteam personnel in Malaysia [50]. Solutions therefore lie inenhancing the primary care delivery system and capacitybuilding of primary care workforce [45, 50]. The recentlyannounced proposal by the Malaysian government to inte-grate all public and private primary care workforces under acommon network of care, supported by the national healthfinancing scheme, offers a promise of better coordination,continuity, and quality of care, especially to individuals withmultiple risk factors [51].
4.1. Limitation. This study has several limitations. In con-trast to other cross-sectional epidemiological studies wheremultistage stratified random sampling designs were used,this ongoing prospective cohort study pragmatically selectedthe urban and rural communities based on the feasibilityfor long-term follow-up and cooperation by the communityleaders. The findings of this study, however, are similar andcomparable to the findings of a previous nationwide surveyusing a two-stage stratified random sampling design [21].
Malaysia’s ethnic population comprises 53.3% Malays,26.0% Chinese, and 7.7% Indians, and the remaining 13% areof other ethnic groups [22]. Although measures had beentaken to ensure adequate representation of the country’s pop-ulation, Malays were overrepresented, while Chinese and
8 BioMed Research International
Indian populations were underrepresented in this study.However, the large sample size of this study populationshould counterbalance any possible bias in the sampling.
The possibility of determining whichMetS definition bet-ter predicts adverse cardiovascular outcomes is also limitedat this stage. The follow-up data of this ongoing prospectivecohort studywould be able to offer such findings in the future.
5. Conclusion
In conclusion, regardless of the definitions used, the CRisPStudy indicates high MetS prevalence among Malaysianadults, much higher than in other Asian countries. Findingsfrom this study underscore the urgency to stem the risingtide of MetS prevalence and the almost inevitable epidemicof T2DM and CVD in Malaysia. Public health measures, aswell as individual intervention in primary care, are crucialto reduce their risk of developing T2DM and CVD. TheJIS definition offers the advantage of identifying a largernumber of individuals with MetS and should therefore berecommended as the preferred diagnostic criterion.
Conflict of Interests
The authors declare that they have no competing interests.
Authors’ Contribution
A. S. Ramli wrote the paper and is involved in the design andcoordination of the CRisP Study. A. M. Daher performed thestatistical analysis and contributed to the critical discussionof the results. M. N. K. Nor-Ashikin, N. Mat-Nasir, K. K. Ng,M.Miskan, K. S. Ambigga, F. Ariffin,M. Y.Mazapuspavina, S.Abdul-Razak andH. Abdul-Hamid contributed to the criticalrevision of the paper. F. Abd-Majid and N. Abu-Bakar wereinvolved in the coordination of the study. H. Nawawi verifiedthe laboratory results and contributed to the critical revisionof the paper. K. Yusoff is the Principal Investigator of thisstudy. He played a major role in the conception and designof the study, contributed to the critical revision of the paperand intellectual content, and provided expertise and oversightthroughout the process. All authors read and approved thefinal version.
Acknowledgments
This research is funded by the Ministry of Higher Education(Grant no. 600-RMI/LRGS 5/2 (2/2011)) and Ministry of Sci-ence, Technology and Innovation (Grant no. 07-05-IFN BPH010). The authors acknowledge the following CRisPS Inves-tigators for their contributions towards the study: EffarezanAbdul Rahman, Mohd Kamal Mohd Arsad, Mohd YazrieYacob, Rafezah Razali, Razif Dasiman, Rosiah Ahmad, SarinaAli, Tengku Saifudin Tengku Ismail, and Zubin OthmanIbrahim. The authors also extend their appreciation to allparticipants, CenTRE, and CPDRL staff of the Faculty ofMedicine, Universiti Teknologi MARA, for their contribu-tions.
References
[1] G. M. Reaven, “Role of insulin resistance in human disease,”Diabetes, vol. 37, no. 12, pp. 1595–1607, 1988.
[2] S.M. Grundy, “Metabolic syndrome: amultiplex cardiovascularrisk factor,” Journal of Clinical Endocrinology and Metabolism,vol. 92, no. 2, pp. 399–404, 2007.
[3] D. Lann and D. LeRoith, “Insulin resistance as the underlyingcause for the metabolic syndrome,” Medical Clinics of NorthAmerica, vol. 91, no. 6, pp. 1063–1077, 2007.
[4] B. Gustafson, A. Hammarstedt, C. X. Andersson, and U. Smith,“Inflamed adipose tissue: a culprit underlying the metabolicsyndrome and atherosclerosis,” Arteriosclerosis, Thrombosis,and Vascular Biology, vol. 27, no. 11, pp. 2276–2283, 2007.
[5] P. M. Nilsson, “Cardiovascular risk in the metabolic syndrome:fact or fiction?” Current Cardiology Reports, vol. 9, no. 6, pp.479–485, 2007.
[6] N. Sattar, A. McConnachie, A. G. Shaper et al., “Can metabolicsyndrome usefully predict cardiovascular disease and diabetes?Outcome data from two prospective studies,” The Lancet, vol.371, no. 9628, pp. 1927–1935, 2008.
[7] K. G. Alberti and P. Z. Zimmet, “Definition, diagnosis and clas-sification of diabetes mellitus, and its complications, part I:diagnosis and classification of diabetes mellitus provisionalreport of a WHO consultation,” Diabetic Medicine, vol. 15, pp.539–553, 1998.
[8] National Cholesterol Education Program (NCEP) Expert PanelonDetection, Evaluation, andTreatment ofHigh BloodCholes-terol in Adults (Adult Treatment Panel III), “Third Report ofthe National Cholesterol Education Program (NCEP) ExpertPanel on Detection, Evaluation, and Treatment of High BloodCholesterol in Adults (Adult Treatment Panel III) final report,”Circulation, vol. 106, pp. 3143–3421, 2002.
[9] K. G. Alberti, P. Zimmet, J. Shaw, and International DiabetesFederation (IDF) Epidemiology Task Force Consensus Group,“The metabolic syndrome: a new world- wide definition,” TheLancet, vol. 366, pp. 1059–1062, 2005.
[10] S. M. Grundy, J. I. Cleeman, S. R. Daniels et al., “Diagnosis andmanagement of the metabolic syndrome: An American HeartAssociation/NationalHeart, Lung, andBlood Institute scientificstatement,” Circulation, vol. 112, no. 17, pp. 2735–2752, 2005.
[11] K. G. M. M. Alberti, R. H. Eckel, S. M. Grundy et al., “Har-monizing the metabolic syndrome: a joint interim statement ofthe international diabetes federation task force on epidemiologyand prevention; National Heart, Lung, and Blood Institute;American Heart Association; World Heart Federation; Inter-national Atherosclerosis Society; and International Associationfor the Study of Obesity,” Circulation, vol. 120, no. 16, pp. 1640–1645, 2009.
[12] M. P. Stern, K. Williams, C. Gonzalez-Villalpando, K. J. Hunt,and S. M. Haffner, “Does the metabolic-syndrome improveidentification of individuals at risk of type 2 diabetes and/orcardiovascular disease?”Diabetes Care, vol. 27, no. 11, pp. 2676–2681, 2004.
[13] P. W. F. Wilson, R. B. D’Agostino, H. Parise, L. Sullivan, and J. B.Meigs, “Metabolic syndrome as a precursor of cardiovasculardisease and type 2 diabetes mellitus,” Circulation, vol. 112, no.20, pp. 3066–3072, 2005.
[14] J. Sundstrom, U. Riserus, L. Byberg, B. Zethelius, H. Lithell, andL. Lind, “Clinical value of themetabolic syndrome for long termprediction of total and cardiovascular mortality: prospective,

BioMed Research International 9
population based cohort study,”BritishMedical Journal, vol. 332,no. 7546, pp. 878–882, 2006.
[15] A. S. Gami, B. J. Witt, D. E. Howard et al., “Metabolic syndromeand risk of incident cardiovascular events and death. A system-atic review andmeta-analysis of longitudinal studies,” Journal ofthe American College of Cardiology, vol. 49, no. 4, pp. 403–414,2007.
[16] S. M. Grundy, “Metabolic syndrome pandemic,” Arteriosclero-sis,Thrombosis, andVascular Biology, vol. 28, pp. 629–636, 2008.
[17] W.-H. Pan, W.-T. Yeh, and L.-C. Weng, “Epidemiology of met-abolic syndrome in Asia,” Asia Pacific Journal of Clinical Nutri-tion, vol. 17, no. 1, pp. 37–42, 2008.
[18] S. Selvarajah, J. Haniff, G. Kaur et al., “Clustering of cardio-vascular risk factors in a middle-income country: a call forurgency,” European Journal of Preventive Cardiology, vol. 20, no.2, pp. 368–375, 2013.
[19] H. M. Termizy and M. Mafauzy, “Metabolic syndrome and itscharacteristics among obese patients attending an obesity clin-ic,” Singapore Medical Journal, vol. 50, no. 4, pp. 390–394, 2009.
[20] L. R. M. Zainuddin, N. F. Isa, W. M. Wan Muda, and H. J.Mohamed, “The prevalence of metabolic syndrome accord-ing to various definitions and hypertriglyceridemic-waist inMalaysian adults,” International Journal of Preventive Medicine,vol. 2, no. 4, pp. 229–237, 2011.
[21] W. N.Mohamud, A. A. Ismail, A. Sharifuddin et al., “Prevalenceof metabolic syndrome and its risk factors in adult Malaysians:results of a nationwide survey,” Diabetes Research and ClinicalPractice, vol. 96, no. 1, pp. 91–97, 2012.
[22] Department of Statistics Malaysia Census, “Changing patternsof utilization and analysis of population census data,” in Pro-ceedings of the 24th Population Census Conference, Hong Kong,China, March 2009, http://www.ancsdaap.org/cencon2009/Papers/Malaysia/Malaysia.paper%2Bappendix.pdf.
[23] P. Nestel, R. Lyu, P. L. Lip et al., “Metabolic syndrome: recentprevalence in East and Southeast Asian populations,” AsiaPacific Journal of Clinical Nutrition, vol. 16, no. 2, pp. 362–367,2007.
[24] C.M.Y. Lee, R. R.Huxley,M.Woodward et al., “Comparisons ofmetabolic syndrome definitions in four populations of the Asia-Pacific region,” Metabolic Syndrome and Related Disorders, vol.6, no. 1, pp. 37–46, 2008.
[25] J. Lee, S. Ma, D. Heng et al., “Should central obesity be anoptional or essential component of the metabolic syndrome?Ischemic heart disease risk in the Singapore cardiovascularcohort study,” Diabetes Care, vol. 30, no. 2, pp. 343–347, 2007.
[26] S. K. Sharma, A. Ghimire, J. Radhakrishnan et al., “Prevalenceof hypertension, obesity, diabetes, and metabolic syndrome inNepal,” International Journal of Hypertension, vol. 2011, ArticleID 821971, 9 pages, 2011.
[27] V. G. Athyros, E. S. Ganotakis, K. Tziomalos et al., “Comparisonof four definitions of the metabolic syndrome in a Greek (Med-iterranean) population,”CurrentMedical Research and Opinion,vol. 26, no. 3, pp. 713–719, 2010.
[28] R. B. Ervin, “Prevalence of metabolic syndrome among adults20 years of age and over, by sex, age, race and ethnicity, andbody mass index: United States, 2003–2006,” National HealthStatistics Reports, no. 13, pp. 1–7, 2009.
[29] A. Delavari, M. H. Forouzanfar, S. Alikhani, A. Sharifian, andR. Kelishadi, “First nationwide study of the prevalence of themetabolic syndrome and optimal cutoff points of waist circum-ference in the middle east: the national survey of risk factors for
noncommunicable diseases of Iran,” Diabetes Care, vol. 32, no.6, pp. 1092–1097, 2009.
[30] M. Ravikiran, A. Bhansali, P. RaviKumar et al., “Prevalence andrisk factors of metabolic syndrome among Asian Indians: acommunity survey,”Diabetes Research and Clinical Practice, vol.89, no. 2, pp. 181–188, 2010.
[31] A. Misra and L. Khurana, “The metabolic syndrome in SouthAsians: epidemiology, determinants, and prevention,”MetabolicSyndrome and Related Disorders, vol. 7, no. 6, pp. 497–514, 2009.
[32] M. P. Reilly and D. J. Rader, “The metabolic syndrome: morethan the sum of its parts?”Circulation, vol. 108, no. 13, pp. 1546–1551, 2003.
[33] P. Poulsen, A. Vaag, K. Kyvik, and H. Beck-Nielsen, “Geneticversus environmental aetiology of the metabolic syndromeamong male and female twins,” Diabetologia, vol. 44, no. 5, pp.537–543, 2001.
[34] A. Alkerwi, A.-F. Donneau, N. Sauvageot et al., “Prevalence ofthe metabolic syndrome in Luxembourg according to the JointInterim Statement definition estimated from the ORISCAV-LUX study,” BMC Public Health, vol. 11, article 4, 2011.
[35] P. T. Katzmarzyk, I. Janssen, R. Ross, T. S. Church, and S. N.Blair, “The importance of waist circumference in the definitionof metabolic syndrome: prospective analyses of mortality inmen,” Diabetes Care, vol. 29, no. 2, pp. 404–409, 2006.
[36] C. M. Khoo, C. F. Liew, S. K. Chew, and E. S. Tai, “The impact ofcentral obesity as a prerequisite for the diagnosis of metabolicsyndrome,” Obesity, vol. 15, no. 1, pp. 262–269, 2007.
[37] C.M. Alexander, P. B. Landsman, and S.M. Grundy, “The influ-ence of age and body mass index on the metabolic syndromeand its components,” Diabetes, Obesity and Metabolism, vol. 10,no. 3, pp. 246–250, 2008.
[38] M. Mafauzy, “The problems and challenges of the aging popu-lation of Malaysia,” Malaysian Journal of Medical Sciences, vol.7, pp. 1–3, 2000.
[39] K. S. Ambigga, A. S. Ramli, A. Suthahar, N. Tauhid, L. Cleari-han, and C. Browning, “Bridging the gap in ageing: translatingpolicies into practice in Malaysian primary care,” Asia PacificFamily Medicine, vol. 10, no. 1, article 2, 2011.
[40] Institute for Public Health, Ministry of Health Malaysia, “TheNationalHealth andMorbidity Survey (NHMS) 2011: factsheet,”Institute for Public Health, Ministry of Health Malaysia, KualaLumpur, Malaysia, 2012.
[41] J. Scholze, E. Alegria, C. Ferri et al., “Epidemiological andeconomic burden of metabolic syndrome and its consequencesin patients with hypertension in Germany, Spain and Italy; aprevalence-based model,” BMC Public Health, vol. 10, article529, 2010.
[42] National Cardiovascular Disease Database, “Annual report ofthe NCVD-ACS registry Malaysia 2013,” Tech. Rep., NationalCardiovascular Disease Database, Kuala Lumpur, Malaysia,2013.
[43] H. Ueshima, A. Sekikawa, K. Miura et al., “Cardiovasculardisease and risk factors in Asia: a selected review,” Circulation,vol. 118, no. 25, pp. 2702–2709, 2008.
[44] Non-Communicable Disease Section, Disease Control Divi-sion, Ministry of Health Malaysia, “National Strategic Plan forNon-Communicable Disease (NSPNCD): medium term strate-gic plan to further strengthen the cardiovascular diseases anddiabetes prevention and control program in Malaysia (2010-2014),” Non-Communicable Disease Section, Disease ControlDivision, Ministry of Health Malaysia, Putrajaya, Malaysia,2010.

10 BioMed Research International
[45] WHO, “Preventing chronic diseases: a vital investment,” WorldHealth Organization, Geneva, Switzerland, 2005, http://www.who.int/chp/chronic disease report/full report.pdf.
[46] S. Capewell andM. O’Flaherty, “Rapid mortality falls after risk-factor changes in populations,” The Lancet, vol. 378, no. 9793,pp. 752–753, 2011.
[47] S. S. Guo, W. Wu, W. C. Chumlea, and A. F. Roche, “Predictingoverweight and obesity in adulthood from body mass indexvalues in childhood and adolescence,” American Journal ofClinical Nutrition, vol. 76, no. 3, pp. 653–658, 2002.
[48] E. Waters, A. de Silva-Sanigorski, B. J. Hall et al., “Interventionsfor preventing obesity in children,” Cochrane Database of Sys-tematic Reviews, vol. 12, Article ID CD001871, 2011.
[49] A. Rubinstein, L. Colantonio, A. Bardach et al., “Estimationof the burden of cardiovascular disease attributable to modifi-able risk factors and cost-effectiveness analysis of preventativeinterventions to reduce this burden in Argentina,” BMC PublicHealth, vol. 10, article 627, 2010.
[50] A. S. Ramli and S. W. Taher, “Managing chronic diseases in theMalaysian primary health care—a need for change,”MalaysianFamily Physician, vol. 3, no. 1, pp. 7–13, 2008.
[51] New Straits Times, “Healthcare for FREE,” 2010, http://www.malaysia-today.net/index.php?option=com content&view=article&id=33023:healthcare-for-free&catid=19:newscommen-taries&Itemid=100131.

Submit your manuscripts athttp://www.hindawi.com
Stem CellsInternational
Hindawi Publishing Corporationhttp://www.hindawi.com Volume 2014
Hindawi Publishing Corporationhttp://www.hindawi.com Volume 2014
MEDIATORSINFLAMMATION
of
Hindawi Publishing Corporationhttp://www.hindawi.com Volume 2014
Behavioural Neurology
EndocrinologyInternational Journal of
Hindawi Publishing Corporationhttp://www.hindawi.com Volume 2014
Hindawi Publishing Corporationhttp://www.hindawi.com Volume 2014
Disease Markers
Hindawi Publishing Corporationhttp://www.hindawi.com Volume 2014
BioMed Research International
OncologyJournal of
Hindawi Publishing Corporationhttp://www.hindawi.com Volume 2014
Hindawi Publishing Corporationhttp://www.hindawi.com Volume 2014
Oxidative Medicine and Cellular Longevity
Hindawi Publishing Corporationhttp://www.hindawi.com Volume 2014
PPAR Research
The Scientific World JournalHindawi Publishing Corporation http://www.hindawi.com Volume 2014
Immunology ResearchHindawi Publishing Corporationhttp://www.hindawi.com Volume 2014
Journal of
ObesityJournal of
Hindawi Publishing Corporationhttp://www.hindawi.com Volume 2014
Hindawi Publishing Corporationhttp://www.hindawi.com Volume 2014
Computational and Mathematical Methods in Medicine
OphthalmologyJournal of
Hindawi Publishing Corporationhttp://www.hindawi.com Volume 2014
Diabetes ResearchJournal of
Hindawi Publishing Corporationhttp://www.hindawi.com Volume 2014
Hindawi Publishing Corporationhttp://www.hindawi.com Volume 2014
Research and TreatmentAIDS
Hindawi Publishing Corporationhttp://www.hindawi.com Volume 2014
Gastroenterology Research and Practice
Hindawi Publishing Corporationhttp://www.hindawi.com Volume 2014
Parkinson’s Disease
Evidence-Based Complementary and Alternative Medicine
Volume 2014Hindawi Publishing Corporationhttp://www.hindawi.com
Copyright © 2022 FDOKUMEN