
Seasonal variability of GPS-derived Zenith Tropospheric Delay (1994-2006) and climate implications
Upload
independentCategory
view
1download
0
Journal of the Meteorological Society of Japan, Vol. 81, No. 4, pp. 829--850, 2003 829
Seasonal Variations of Tropospheric Wind over Indonesia:
Comparison between Collected Operational Rawinsonde Data and
NCEP Reanalysis for 1992–99
Noriko OKAMOTO, Manabu D. YAMANAKA1, Shin-Ya OGINO
Graduate School of Science and Technology, Kobe University, Kobe, Japan
Hiroyuki HASHIGUCHI
Radio Science Center for Space and Atmosphere, Kyoto University, Kyoto, Japan
Noriyuki NISHI
Department of Geophysics, Kyoto University, Kyoto, Japan
Tien SRIBIMAWATI
Agency for the Assessment and Application of Technology (BPPT), Jakarta Pusat, Indonesia
and
Atusi NUMAGUTI2
Graduate School of Environmental Earth Science, Hokkaido University, Sapporo, Japan
(Manuscript received 10 October 2000, in revised form 1 May 2003)
Abstract
Seasonal variations of wind in the troposphere are analyzed based on operational rawinsondes at 11stations over Indonesia for 1992–1999 and the results are compared with NCEP reanalysis. For meri-dional wind, an annual oscillation caused by north-south shift of a meridional (Hadley-type) circulationis clearly found. Winter-poleward flow of the upper-tropospheric meridional circulation is stronger thansummer-poleward flow. The winter (southern) hemispheric cell in northern summer has a larger inva-sion across the equator (as suggested in the zonal-mean Hadley cell), and weaker meridional flows thanthe winter (northern) hemispheric cell in northern winter. Along the boundary of twin meridional circu-lation cells, a zonal (Walker-type) circulation seems to exist, and has easterly (westerly) wind in the
Corresponding author: Noriko Okamoto, Gradu-ate School of Science and Technology, Kobe Uni-versity, Kobe 657-8501, Japan.E-mail: [email protected]
1 Also working at Frontier Observation ResearchSystem for Global Change, Minato-ku, Tokyo105-0013, Japan.
2 Passed away on 30 Jul 2001.( 2003, Meteorological Society of Japan
upper (lower) troposphere in the Indonesian region. The zonal circulation is also shifted from theequator associated with the meridional circulation cell boundary. However, a semiannual oscillation,which has easterly maxima in January–February and July–August is more clearly observed in theupper-tropospheric zonal wind, which is consistent with a consideration on conservation of absoluteangular momentum for the upper-tropospheric winter-poleward (equatorward) air mass transport asso-ciated with the winter-hemispheric meridional circulation cell, invading the summer hemisphere acrossthe equator.
In comparison with the seasonal-vertical variations based on the operational rawinsonde data, theNCEP reanalysis seems to overestimate the upper-tropospheric northerly and easterly maxima duringnorthern summer. In other words, the NCEP reanalysis produces a winter hemispheric side meridionalcirculation cell with similar intensities between both solsticial seasons, in spite that in the operationalrawinsonde data the winter hemispheric side meridional circulation cell in northern summer is weakerthan that in northern winter. The overestimation of easterly may also be related with an insufficient re-production of the winter-hemispheric meridional circulation cell—such as too large northward invasion.
1. Introduction
Climate in the tropics has been studiedmainly by surface meteorological observations,satellite cloud imageries and/or products of ob-jective analysis (e.g., Murakami and Matsu-moto 1994). Satellite cloud imageries can covervast fields, but have limitations for graspingthree-dimensional structures. Objective analy-sis may provide wind and temperature fieldsin the troposphere and lower stratosphere, butthey are considered to be less reliable in thevicinity of the equator, mainly due to invalidityof geostrophic approximation, and scarcity ofaerological observations. For India, and thenorth-western and southeastern Pacific regions(east of about 130�E), Hartmann and Gross(1988) analyzed the annual variations of 200-and 850-hPa zonal winds based on operationalrawinsonde data. In the central and easternPacific, tropospheric wind observed continu-ously by the Trans-Pacific Profiler Network hasshown that annual variation of zonal wind isquite different at each station (Piura, Christ-mas Island, Pohnpei and Biak), and that it isstrongest during La Nina, and weakest duringEl Nino at Christmas Island (Gage et al. 1994,1996). In global climate studies by zonal-meandescription, Oort and Yienger (1996) have dis-cussed seasonal intensity of Hadley circulationon the basis of operational rawinsonde data,except for data around the Indonesian mari-time continent. For vertical distributions ofwind variations over Indonesia, a wind profilerstation has been constructed near Jakarta (seeSubsection 2.3), and several case studies have
been done: a convection center passage at thebeginning of rainy season (Hashiguchi et al.1995b), a mixed Rossby-gravity wave activity inthe rainy season (Widiyatmi et al. 1999, 2001),and others. Much longer-period data analysishas also been done (H. Hashiguchi, privatecommunication), and striking year-to-year vari-ations have been found, although these resultshave not been published.
Concerning the definition of Hadley circula-tion, original depiction is a simple atmosphericcirculation with an upward flow over the equa-tor, and downward flow at higher latitudescaused by latitudinal heat gradient in eachhemisphere, and structure of the Hadley circu-lation is homogeneous in zonal direction (zonalmean circulation). However, local circulationsin the meridional-vertical plane has been calledvarious names—such as north-south circulation(Young 1987), Hadley-type circulation (Young1987; Shukla 1987), local Hadley circulationand local meridional circulation (Webster 1987;Murakami 1987), in spite that the driving rea-son of the local circulations are the same withthat of the Hadley circulation. In a similarmanner, longitudinal circulation resulted fromthe gradient of sea surface temperature alongthe equator in the Pacific Ocean is called theWalker circulation, but other circulations inzonal-vertical plane in other longitudinal sec-tions are called east-west or Walker type circu-lation (Krishnamurti 1971; Young 1987; Web-ster 1987) (Sometimes the Walker circulationitself is expressed as a east-west circulation).In a monsoon view point, Webster et al. (1998)considered that Asian-Australian monsoon con-
Journal of the Meteorological Society of Japan830 Vol. 81, No. 4
sists of three major circulations, and calledthem lateral monsoon, transverse monsoon andWalker circulation.
In this study, operational rawinsonde datais collected for about seven years (November1991–May 1999), and have made a reliabilitycheck for scientific analyses and discussions. Inaddition, fundamental analysis is made to re-veal seasonal variations and spatial structureof wind in the whole troposphere (below about20 km altitude) over Indonesia, based on theoperational rawinsonde data, as well as NCEP(National Centers for Environmental Predic-tion of the United States) rawinsonde archive.We have also compared them with objectiveanalysis (NCEP reanalysis) data, to discuss sig-nification of operational rawinsonde data overIndonesia. In Section 2 the data collection andanalysis procedures are described as well astheir reliability. In Section 3 the results ofanalysis on the seasonal variations of wind ateach station over Indonesia and surroundingregions. In Section 4 meridional cross-sectionsproduced by the rawinsonde data in the Indone-sian sector are shown. In Section 5, these sea-
sonal variations and meridional cross-sectionsare compared with those derived from NCEPreanalysis data. In Section 6 the results arediscussed in view of three-dimensional struc-tures and seasonal variations of the Hadley andWalker circulations, and significance of opera-tional rawinsonde data over Indonesia in com-parison with NCEP reanalysis data. In Section7 the conclusions are summarized.
2. Data and analysis methods
2.1 Operational rawinsonde data overIndonesia
Indonesian Meteorological and GeophysicalAgency (BMG) operationally conducts almostdaily (at some stations twice a day, or bidaily)rawinsonde observations at 11 stations3. Loca-tion and rawinsonde system of each station areshown in Fig. 1, and Table 1. Data transmis-
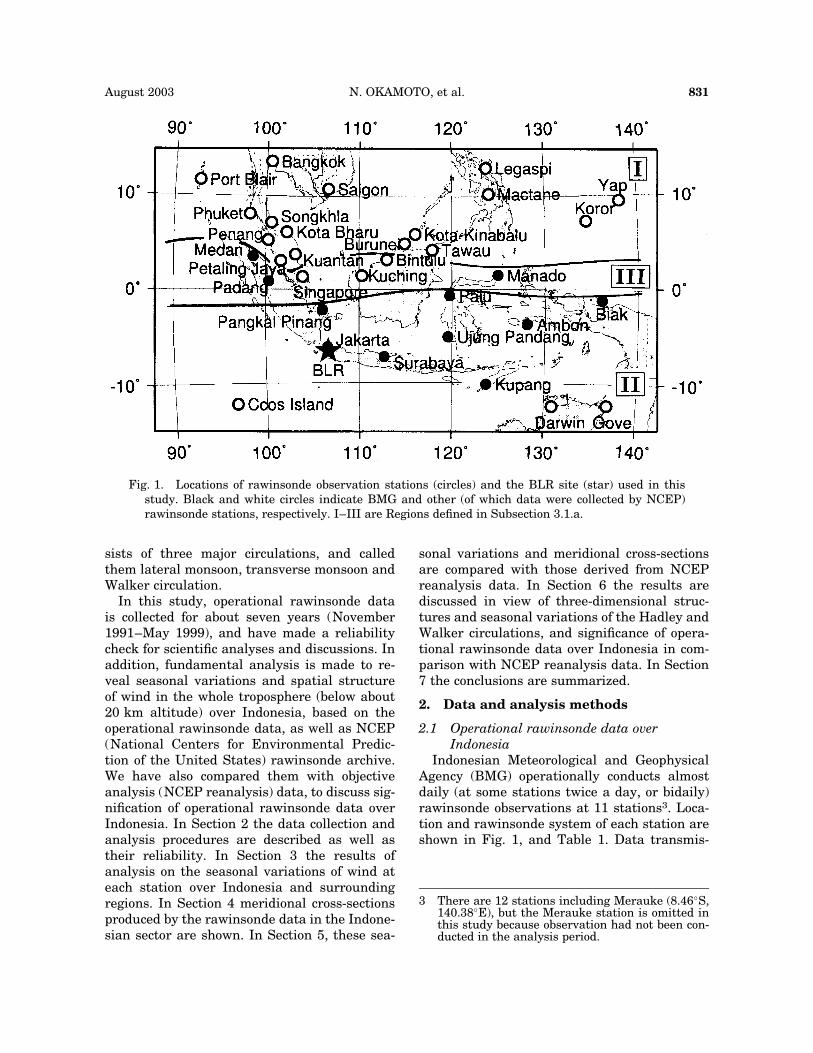
Fig. 1. Locations of rawinsonde observation stations (circles) and the BLR site (star) used in thisstudy. Black and white circles indicate BMG and other (of which data were collected by NCEP)rawinsonde stations, respectively. I–III are Regions defined in Subsection 3.1.a.
3 There are 12 stations including Merauke (8.46�S,140.38�E), but the Merauke station is omitted inthis study because observation had not been con-ducted in the analysis period.
N. OKAMOTO, et al. 831August 2003

sion procedures inside Indonesia for the analy-sis period of this study (until May 1999) are asfollows. First, after observation, each stationprepares telex format data (TEMP and PILOTreports). At Jakarta station, the telex data aremade automatically, but at other stations oper-ators make them manually by reading valuesat standard and significant levels from a plot-ted profile. Then, the data are sent to a regionalcenter by telex. There are five regional centersin Indonesia (Medan, Jakarta, Denpasar, UjungPandang and Jayapura), and the data receivedat each regional center are forwarded to AMSC(automatic message switching center) of theBMG headquarters at Jakarta. At AMSC, op-erators input the data into a computer, andsent them to outside of Indonesia (Singapore orMelbourne), through GTS (global telecommuni-cation system). However, transmission of datais not always perfect because of an artificialerror occurred in above-mentioned procedures.Report of the data for GTS often out of time,too. BMG Jakarta and the other 10 stationskeep original data, but most of them are writ-ten in a paper form. These original rawinsondedata are collected by ourselves (hereafter, theBMG data), and in this paper daily observationdata are used (mostly at 00 UTC) from Novem-ber 1991 to May 1999. Many missing data orperiods are included without observations, forexample more than one year at Ambon.
Data quality is checked. The data are at bothstandard pressure levels (1000, 850, 700, 500,400, 300, 250, 200, 150, 100, 70, 50, 30, 20 and10 hPa), and significant levels. There are someduplicated data with different values, probablybecause some errors might occur in digitizingthe data. Such different duplicated data arechecked carefully and they are not used fordata analysis. In this study the data are usedat standard pressure levels at 00 UTC, and haveomitted data with wind speed exceeding 100 m/sin the absolute value, or exceeding 60 m/s inthe difference from the total mean value overthe whole analyzed period at each level at eachstation. Monthly mean data sets (to be used inSection 4) have been calculated from the dailydata after these quality check procedures.
In order to recover lacked data and also tofilter out day-to-day variations, we have madepentad (five-day) mean data sets at each year,at each standard pressure level, and at eachstation, as long as observation was done atleast one time for a five-day period. Data onFebruary 29 of a leap year have been omitted.By this pentad-mean procedure some equatorialwave-like components such as two- or four-dayperiod modes (cf., Takayabu and Nitta 1993;Sato et al. 1994; Widiyatmi et al. 1999, 2001)may be almost filtered out. Furthermore, theintraseasonal variations with 30- to 60-day pe-riods have been removed from the pentad mean
Table 1. Rawinsonde observation stations of Indonesian Meteorological and Geographical Agency(BMG). Data rate is the percentage of days on which data were obtained at any standard pressurelevels during each observational data period (Period).
Station Lat. (�N) Long. (�E) Elv. (m)Rawinsonde
systemz PeriodData
rate (%)
Medan 3.57 98.68 25 VIZ manual 3 Apr 1992–20 May 1999 45.6Padang �0.88 100.35 3 Meisei manual 11 Apr 1992–21 May 1999 42.8Pangkal Pinang 2.17 106.13 33 Meisei manual 3 Apr 1992–3 May 1999 37.8Jakarta �6.12 106.65 8 Meisei automatics/
VIZ manual19 Nov 1991–21 May 1999 36.0
Surabaya �7.22 112.72 58 VIZ manual 5 Apr 1992–21 May 1999 48.9Manado 1.53 124.92 80 VIZ manual 17 Feb 1992–15 Dec 1998 43.4Palu �0.68 119.73 6 Meisei manual 20 Jun 1992–21 May 1999 49.3Ujung Pandangy �5.07 119.55 14 VIZ manual 5 Apr 1992–21 May 1999 45.8Kupang �10.16 123.67 108 VIZ manual 3 May 1992–1 May 1999 42.0Biak �1.18 136.11 11 VIZ manual 8 May 1992–11 May 1999 37.3Ambon �3.70 128.08 12 Meisei manual 3 Apr 1992–11 Apr 1999 20.9
y Ujung Pandang has been re-named as Makassar (an old name) in 1999. z Rawinsonde system is based on in-formation in April 1997 information in April 1997. After that, some stations have changed their systems.
Journal of the Meteorological Society of Japan832 Vol. 81, No. 4
data by a low-pass filter with cut off period of90 days.
Finally, the low-pass filtered pentad-meandata have been averaged for the eight years ateach pentad number, at each standard pressurelevel and at each station. The results obtainedafter this procedure are regarded as the meanseasonal (73 pentads) data sets.
2.2 Supplement and comparison withGTS data
Rawinsonde data collected by NCEP throughGTS (hereafter we call them GTS data) in anarea of 15�S–15�N and 90�–140�E from 1992 to
1997 are also used in order to supplement andexamine the BMG data. There are 142 stationsin total (listed in the NCEP archive) in the area.We have checked the data availability at eachstation and have selected 33 stations (includingthe eleven BMG stations) as listed in Table 2and also indicated in Fig. 1, at which wind datawere obtained at 00 UTC on more than 657days (30%) for the whole period (1992–97, 2192days). The procedures mentioned in Subsection2.1 are applied to make data sets. However, ifthe data were obtained twice a day (at 00 and12 UTC), both the data have been used for thecalculation.
Table 2. Rawinsonde stations over South-East Asia (15�S–15�N, 90–140�E) at which data were col-lected by NCEP. Data rate is the percentage of days on which data were obtained at any standardpressure levels during 1 Jan 1992–31 Dec 1997 (2192 days).
WMO No. (Station) Lat. (�N) Long. (�E) Elv. (m) PeriodData
rate (%)
96035 (Medan) 3.57 98.68 25 1 Jan 1992–30 Dec 1997 73.896163 (Padang) �0.88 100.35 3 1 Jan 1992–16 Dec 1997 76.096237 (Pangkal Pinang) �2.17 106.13 33 2 Jan 1992–16 Dec 1997 67.396749 (Jakarta) �6.12 106.65 8 1 Jan 1992–31 Dec 1997 62.496935 (Surabaya) �7.37 112.77 3 2 Jan 1992–31 Dec 1997 81.997014 (Menado) 1.53 124.92 80 1 Jan 1992–31 Dec 1997 74.697072 (Palu) �0.68 119.73 6 1 Jan 1992–31 Dec 1997 72.297180 (Ujung Pandang) 5.07 119.55 14 1 Jan 1992–31 Dec 1997 78.297372 (Kupang) �10.17 123.67 108 2 Jan 1992–31 Dec 1997 62.897560 (Biak) �1.18 136.12 11 1 Jan 1992–31 Dec 1997 43.497724 (Ambon) �3.70 128.08 12 1 Jan 1992–6 Jun 1997 31.943333 (Port Blair) 11.67 92.72 79 1 Jan 1992–31 Dec 1997 79.748455 (Bangkok) 13.73 100.50 16 1 Jan 1992–31 Dec 1997 98.248565 (Phuket) 8.10 98.30 3 1 Jan 1992–31 Dec 1997 71.048568 (Songkhla) 7.20 100.60 4 1 Jan 1992–31 Dec 1997 89.648601 (Penang) 5.30 100.27 3 1 Jan 1992–31 Dec 1997 97.748615 (Kota Bharu) 6.17 102.28 5 1 Jan 1992–31 Dec 1997 96.348648 (Petaling Jaya) 3.10 101.65 57 1 Jan 1992–31 Dec 1997 98.248657 (Kuantan) 3.78 103.22 18 1 Jan 1992–31 Dec 1997 97.748698 (Singapore) 1.37 103.98 3 1 Jan 1992–31 Dec 1997 97.748900 (Saigon) 10.82 106.67 6 1 Jan 1992–31 Dec 1997 82.391408 (Koror) 7.33 134.48 30 1 Jan 1992–31 Dec 1997 96.191413 (Yap) 9.48 138.08 14 1 Jan 1992–31 Dec 1997 99.294120 (Darwin) �12.43 130.87 29 1 Jan 1992–31 Dec 1997 99.794150 (Gove) �12.27 136.82 54 1 Jan 1992–31 Dec 1997 97.796315 (Brunei Airport) 4.93 114.90 15 2 Jan 1992–31 Dec 1997 91.596413 (Kuching) 1.48 110.33 26 1 Jan 1992–31 Dec 1997 97.496441 (Bintulu) 3.20 113.03 5 1 Jan 1992–31 Dec 1997 93.696471 (Kota-Kinabalu) 5.95 116.05 3 1 Jan 1992–31 Dec 1997 96.496481 (Tawau) 4.27 117.87 20 1 Jan 1992–31 Dec 1997 92.596996 (Cocos Island) �12.18 96.83 5 1 Jan 1992–31 Dec 1997 95.898444 (Legaspi) 13.13 123.73 17 1 Jan 1992–17 Feb 1997 29.298646 (Mactan) 10.30 123.97 26 8 Nov 1992–29 Nov 1997 36.4
N. OKAMOTO, et al. 833August 2003
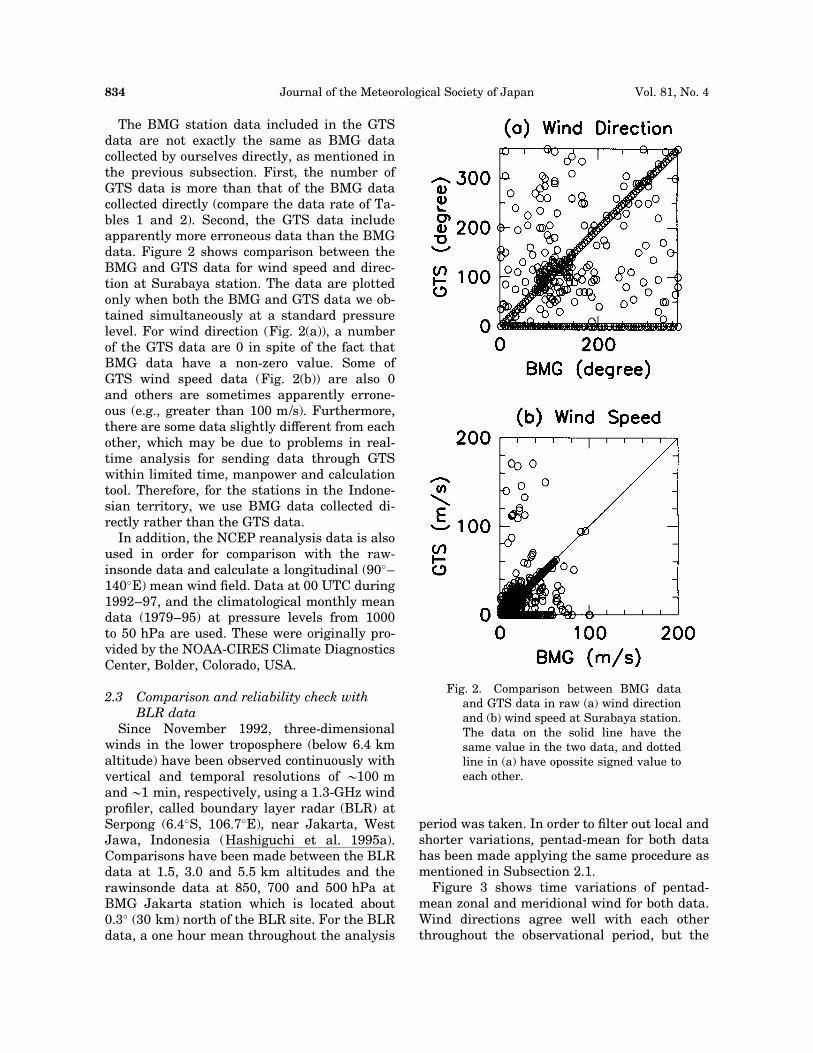
The BMG station data included in the GTSdata are not exactly the same as BMG datacollected by ourselves directly, as mentioned inthe previous subsection. First, the number ofGTS data is more than that of the BMG datacollected directly (compare the data rate of Ta-bles 1 and 2). Second, the GTS data includeapparently more erroneous data than the BMGdata. Figure 2 shows comparison between theBMG and GTS data for wind speed and direc-tion at Surabaya station. The data are plottedonly when both the BMG and GTS data we ob-tained simultaneously at a standard pressurelevel. For wind direction (Fig. 2(a)), a numberof the GTS data are 0 in spite of the fact thatBMG data have a non-zero value. Some ofGTS wind speed data (Fig. 2(b)) are also 0and others are sometimes apparently errone-ous (e.g., greater than 100 m/s). Furthermore,there are some data slightly different from eachother, which may be due to problems in real-time analysis for sending data through GTSwithin limited time, manpower and calculationtool. Therefore, for the stations in the Indone-sian territory, we use BMG data collected di-rectly rather than the GTS data.
In addition, the NCEP reanalysis data is alsoused in order for comparison with the raw-insonde data and calculate a longitudinal (90�–140�E) mean wind field. Data at 00 UTC during1992–97, and the climatological monthly meandata (1979–95) at pressure levels from 1000to 50 hPa are used. These were originally pro-vided by the NOAA-CIRES Climate DiagnosticsCenter, Bolder, Colorado, USA.
2.3 Comparison and reliability check withBLR data
Since November 1992, three-dimensionalwinds in the lower troposphere (below 6.4 kmaltitude) have been observed continuously withvertical and temporal resolutions of @100 mand@1 min, respectively, using a 1.3-GHz windprofiler, called boundary layer radar (BLR) atSerpong (6.4�S, 106.7�E), near Jakarta, WestJawa, Indonesia (Hashiguchi et al. 1995a).Comparisons have been made between the BLRdata at 1.5, 3.0 and 5.5 km altitudes and therawinsonde data at 850, 700 and 500 hPa atBMG Jakarta station which is located about0.3� (30 km) north of the BLR site. For the BLRdata, a one hour mean throughout the analysis
period was taken. In order to filter out local andshorter variations, pentad-mean for both datahas been made applying the same procedure asmentioned in Subsection 2.1.
Figure 3 shows time variations of pentad-mean zonal and meridional wind for both data.Wind directions agree well with each otherthroughout the observational period, but the
Fig. 2. Comparison between BMG dataand GTS data in raw (a) wind directionand (b) wind speed at Surabaya station.The data on the solid line have thesame value in the two data, and dottedline in (a) have opossite signed value toeach other.
Journal of the Meteorological Society of Japan834 Vol. 81, No. 4
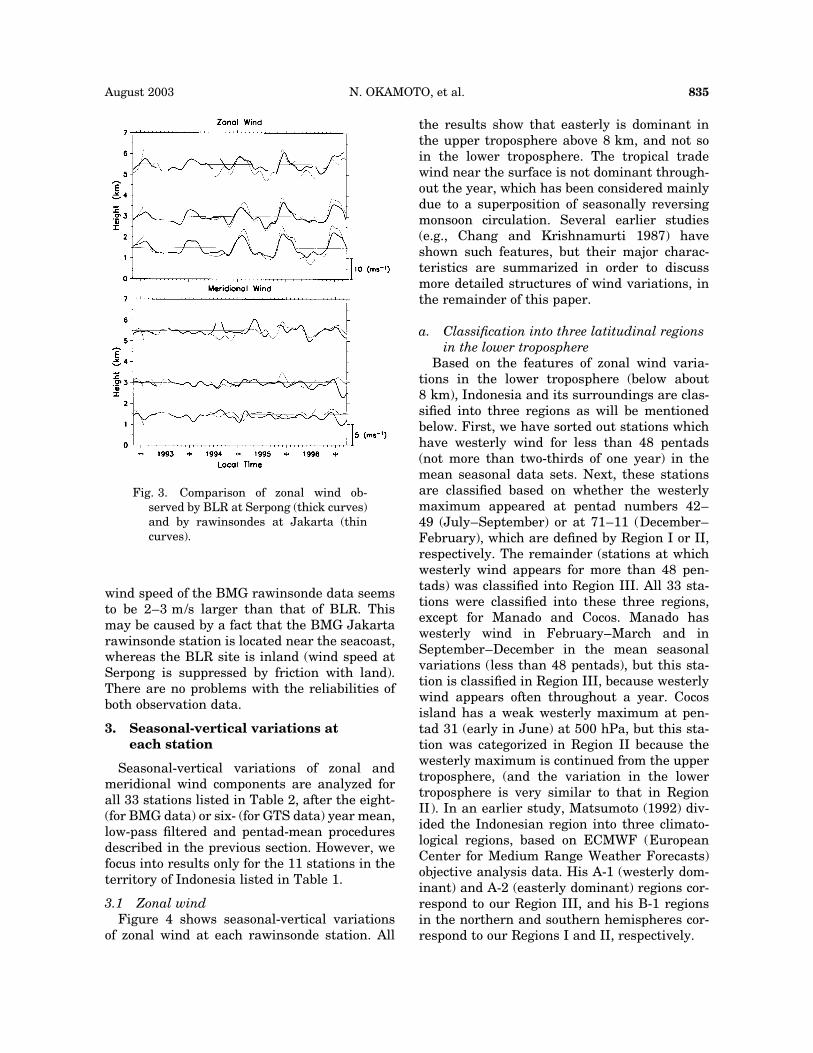
wind speed of the BMG rawinsonde data seemsto be 2–3 m/s larger than that of BLR. Thismay be caused by a fact that the BMG Jakartarawinsonde station is located near the seacoast,whereas the BLR site is inland (wind speed atSerpong is suppressed by friction with land).There are no problems with the reliabilities ofboth observation data.
3. Seasonal-vertical variations ateach station
Seasonal-vertical variations of zonal andmeridional wind components are analyzed forall 33 stations listed in Table 2, after the eight-(for BMG data) or six- (for GTS data) year mean,low-pass filtered and pentad-mean proceduresdescribed in the previous section. However, wefocus into results only for the 11 stations in theterritory of Indonesia listed in Table 1.
3.1 Zonal windFigure 4 shows seasonal-vertical variations
of zonal wind at each rawinsonde station. All
the results show that easterly is dominant inthe upper troposphere above 8 km, and not soin the lower troposphere. The tropical tradewind near the surface is not dominant through-out the year, which has been considered mainlydue to a superposition of seasonally reversingmonsoon circulation. Several earlier studies(e.g., Chang and Krishnamurti 1987) haveshown such features, but their major charac-teristics are summarized in order to discussmore detailed structures of wind variations, inthe remainder of this paper.
a. Classification into three latitudinal regionsin the lower troposphere
Based on the features of zonal wind varia-tions in the lower troposphere (below about8 km), Indonesia and its surroundings are clas-sified into three regions as will be mentionedbelow. First, we have sorted out stations whichhave westerly wind for less than 48 pentads(not more than two-thirds of one year) in themean seasonal data sets. Next, these stationsare classified based on whether the westerlymaximum appeared at pentad numbers 42–49 (July–September) or at 71–11 (December–February), which are defined by Region I or II,respectively. The remainder (stations at whichwesterly wind appears for more than 48 pen-tads) was classified into Region III. All 33 sta-tions were classified into these three regions,except for Manado and Cocos. Manado haswesterly wind in February–March and inSeptember–December in the mean seasonalvariations (less than 48 pentads), but this sta-tion is classified in Region III, because westerlywind appears often throughout a year. Cocosisland has a weak westerly maximum at pen-tad 31 (early in June) at 500 hPa, but this sta-tion was categorized in Region II because thewesterly maximum is continued from the uppertroposphere, (and the variation in the lowertroposphere is very similar to that in RegionII). In an earlier study, Matsumoto (1992) div-ided the Indonesian region into three climato-logical regions, based on ECMWF (EuropeanCenter for Medium Range Weather Forecasts)objective analysis data. His A-1 (westerly dom-inant) and A-2 (easterly dominant) regions cor-respond to our Region III, and his B-1 regionsin the northern and southern hemispheres cor-respond to our Regions I and II, respectively.
Fig. 3. Comparison of zonal wind ob-served by BLR at Serpong (thick curves)and by rawinsondes at Jakarta (thincurves).
N. OKAMOTO, et al. 835August 2003
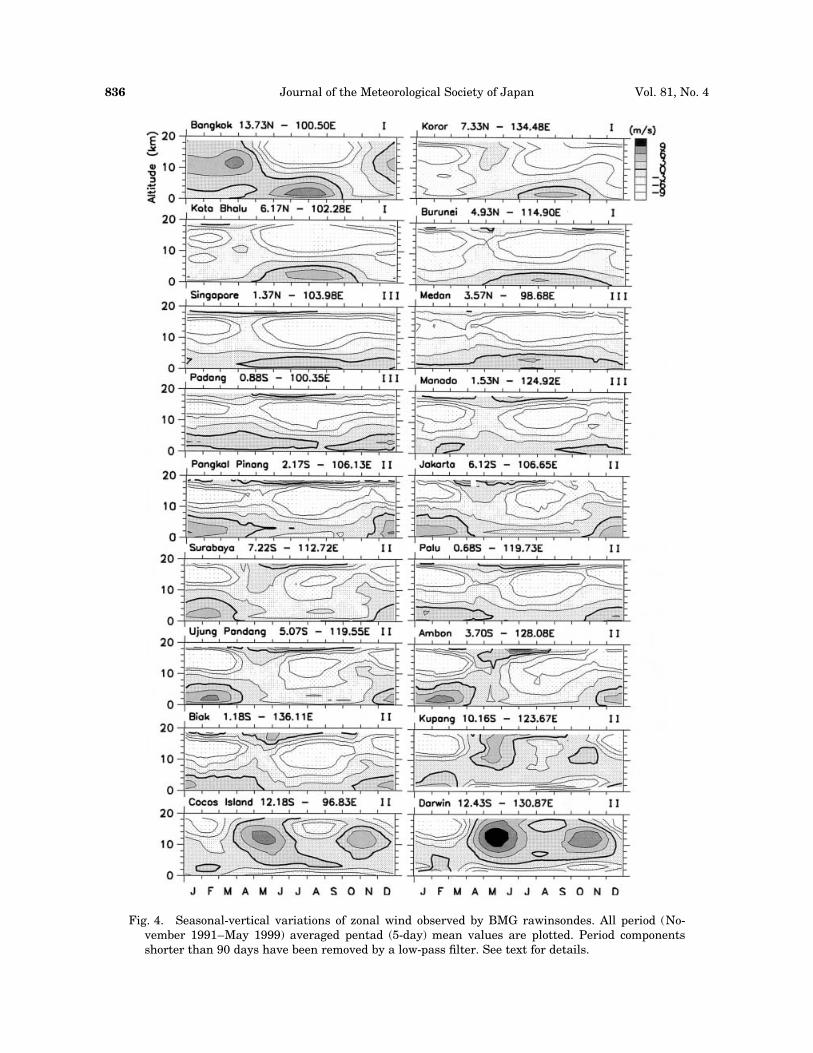
Fig. 4. Seasonal-vertical variations of zonal wind observed by BMG rawinsondes. All period (No-vember 1991–May 1999) averaged pentad (5-day) mean values are plotted. Period componentsshorter than 90 days have been removed by a low-pass filter. See text for details.
Journal of the Meteorological Society of Japan836 Vol. 81, No. 4
The climatological classification mentionedabove is indicated in Fig. 1. Region I is mainlyin the northern hemisphere. This region has aclear annual oscillation with westerly (easterly)during northern summer (winter). Westerly be-comes stronger with increasing latitude, andexceeds 6 m/s in the northern side of 7�N in theMalay Peninsula (see, Bangkok in Fig. 4). Thephase (appearance date of positive peak) has alongitudinal dependence, with about 1 monthdelay for about 30�. The westerly maximumappears in July–August near 100�E (Indochinaand Malay Peninsula; see Bangkok andKota Bhalu in Fig. 4) and August–Septembernear 130�E (Koror, shown in Fig. 4, and YapIslands).
Region II is in the southern hemisphere. Thisregion has an annual oscillation with inversephases against Region I; westerly (easterly)wind appears during northern winter (summer).These two regions have symmetric geographi-cal features about the equator: westerly windbecomes stronger with increasing latitude, andthe maximum appearance has an eastward de-lay from December–January near 100�E (Pang-kal Pinang) to February near 130�E (Ambon).At the most southern stations (Kupang, CocosIsland, Darwin and Gove; see Darwin in Fig. 4),the length of westerly period is shorter thanthat at northern stations in Region I, but windmagnitudes of easterlies in the residence sea-son are very strong.
Region III is in the vicinity of the equator.Zonal winds are weaker than 3 m/s throughouta year, and their seasonal variations are quiteunclear. Looking more carefully, the center ofRegion III (@1�S–@4�N) is not just at the equa-tor, but slightly shifted to the northern hemi-sphere.
b. Upper troposphereIn the upper troposphere, the easterly jet
stream exists and has two maxima in January–February and in July–August, that is, a semi-annual oscillation appears at almost all thestations. The amplitude of this semiannual os-cillation is largest near the equator (RegionIII). Each winter easterly maximum (January–February in Region I and July–August in Re-gion II) is generally weaker than the summermaximum, and such a winter-summer differ-ence becomes clearer with increasing latitude.
The easterly finally turns to westerly at sta-tions located north of 10�N in Region I (seeBangkok in Fig. 4), and also at stations in Aus-tralia (@12�S, see Darwin in Fig. 4) in RegionII, so that the annual oscillation becomes grad-ually dominant toward each mid-latitude. Ap-pearance of the summer maximum in eachhemisphere has a longitudinal dependence, be-ing in good agreement with that of the westerlyin the lower troposphere mentioned in the pre-vious subsection. On the other hand, the wintermaximum has no systematic longitudinal de-pendence.
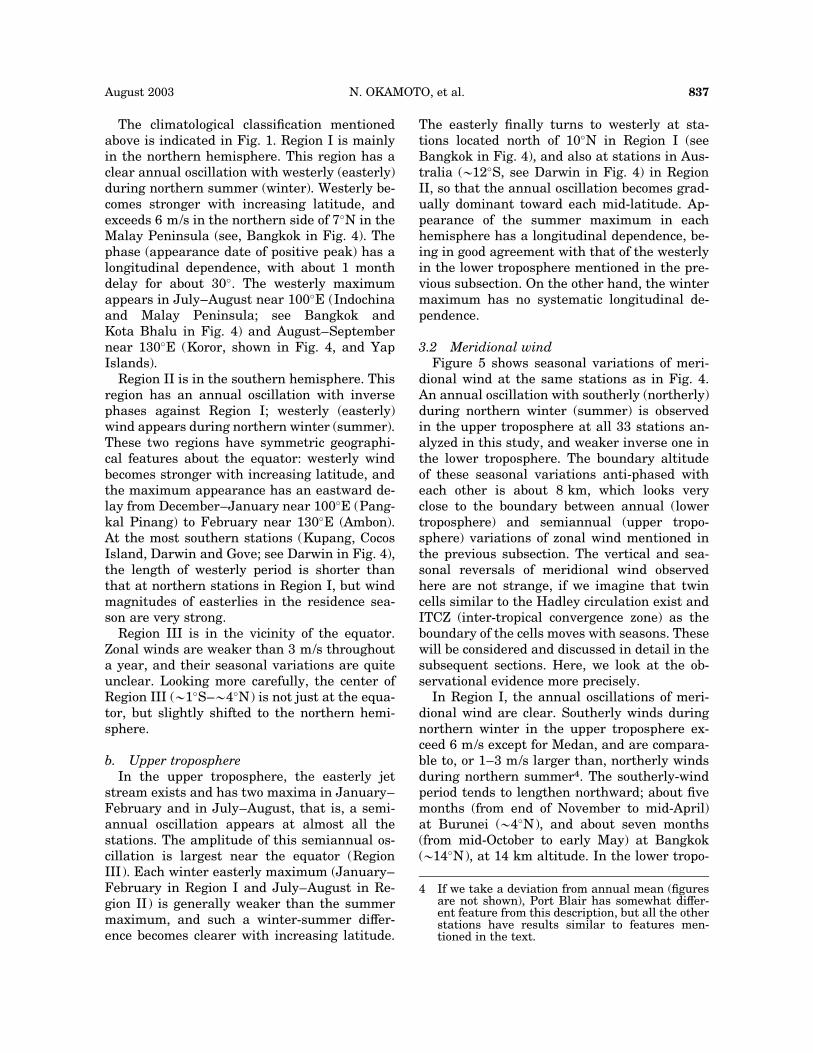
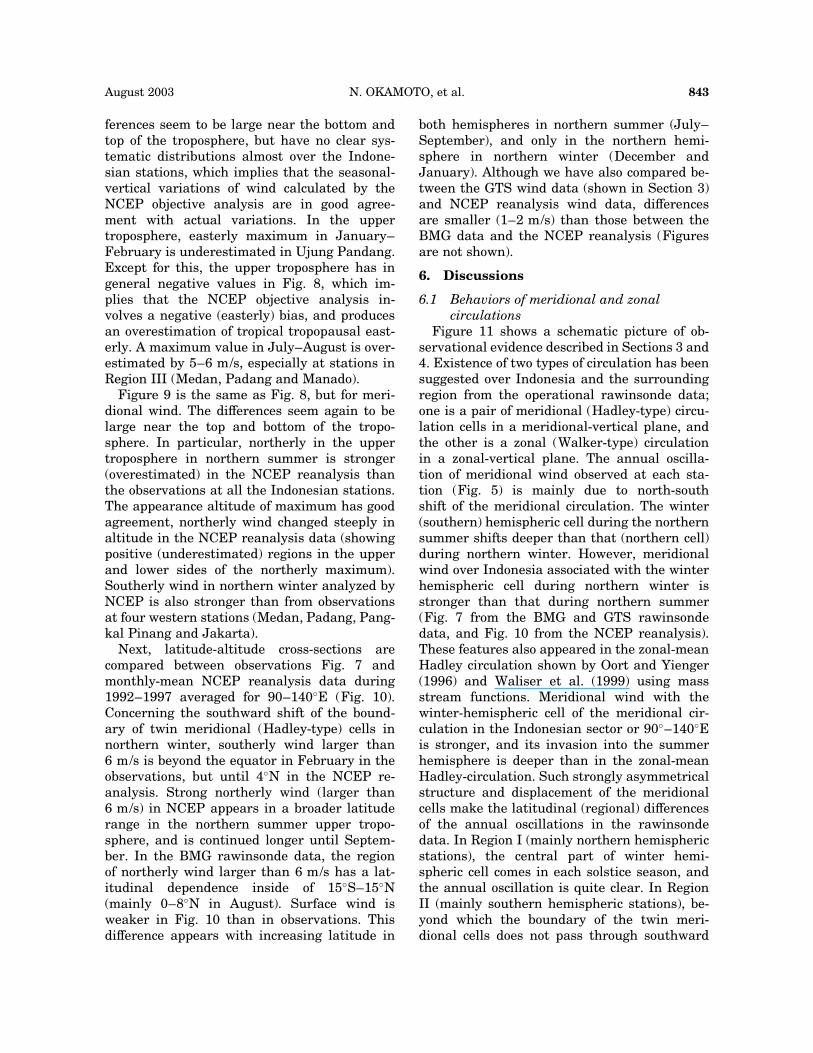
3.2 Meridional windFigure 5 shows seasonal variations of meri-
dional wind at the same stations as in Fig. 4.An annual oscillation with southerly (northerly)during northern winter (summer) is observedin the upper troposphere at all 33 stations an-alyzed in this study, and weaker inverse one inthe lower troposphere. The boundary altitudeof these seasonal variations anti-phased witheach other is about 8 km, which looks veryclose to the boundary between annual (lowertroposphere) and semiannual (upper tropo-sphere) variations of zonal wind mentioned inthe previous subsection. The vertical and sea-sonal reversals of meridional wind observedhere are not strange, if we imagine that twincells similar to the Hadley circulation exist andITCZ (inter-tropical convergence zone) as theboundary of the cells moves with seasons. Thesewill be considered and discussed in detail in thesubsequent sections. Here, we look at the ob-servational evidence more precisely.
In Region I, the annual oscillations of meri-dional wind are clear. Southerly winds duringnorthern winter in the upper troposphere ex-ceed 6 m/s except for Medan, and are compara-ble to, or 1–3 m/s larger than, northerly windsduring northern summer4. The southerly-windperiod tends to lengthen northward; about fivemonths (from end of November to mid-April)at Burunei (@4�N), and about seven months(from mid-October to early May) at Bangkok(@14�N), at 14 km altitude. In the lower tropo-
4 If we take a deviation from annual mean (figuresare not shown), Port Blair has somewhat differ-ent feature from this description, but all the otherstations have results similar to features men-tioned in the text.
N. OKAMOTO, et al. 837August 2003
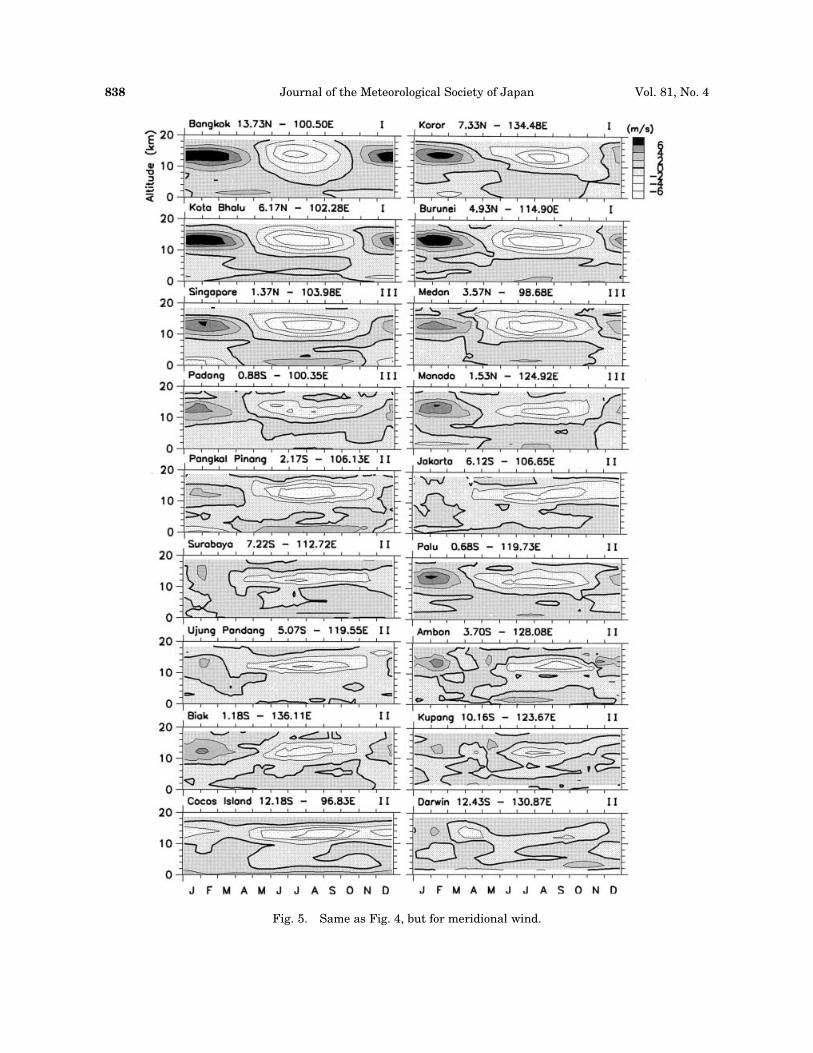
Fig. 5. Same as Fig. 4, but for meridional wind.
Journal of the Meteorological Society of Japan838 Vol. 81, No. 4
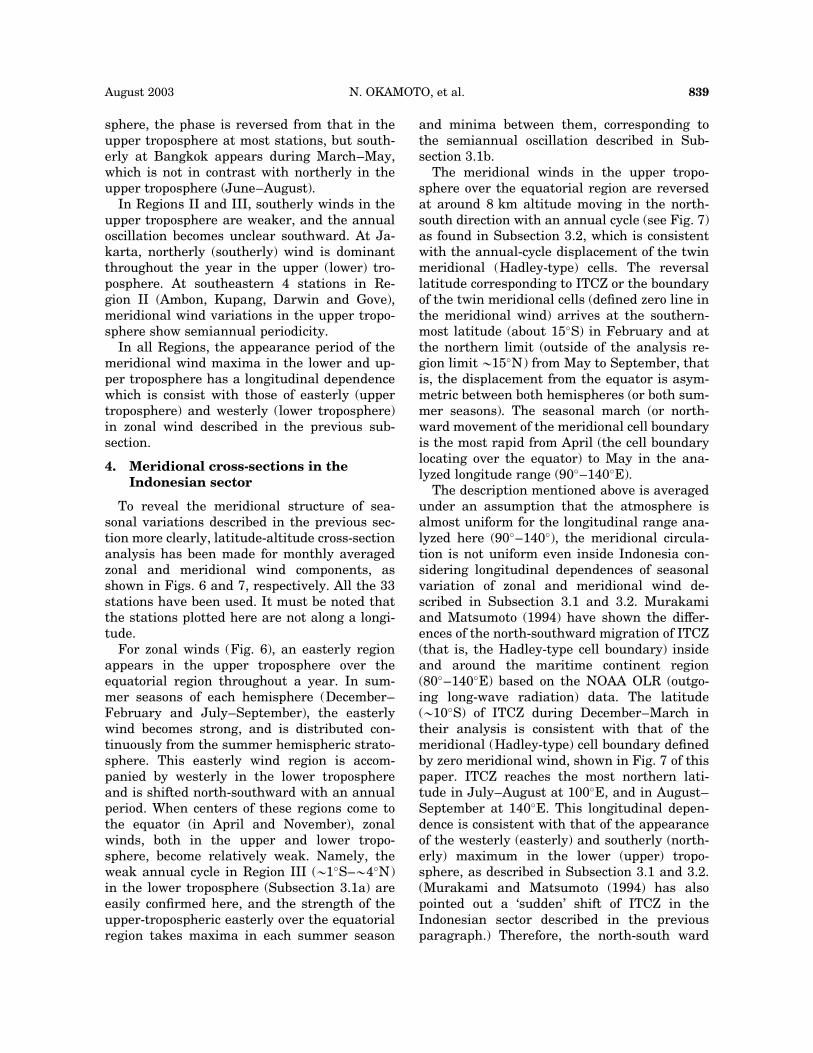
sphere, the phase is reversed from that in theupper troposphere at most stations, but south-erly at Bangkok appears during March–May,which is not in contrast with northerly in theupper troposphere (June–August).
In Regions II and III, southerly winds in theupper troposphere are weaker, and the annualoscillation becomes unclear southward. At Ja-karta, northerly (southerly) wind is dominantthroughout the year in the upper (lower) tro-posphere. At southeastern 4 stations in Re-gion II (Ambon, Kupang, Darwin and Gove),meridional wind variations in the upper tropo-sphere show semiannual periodicity.
In all Regions, the appearance period of themeridional wind maxima in the lower and up-per troposphere has a longitudinal dependencewhich is consist with those of easterly (uppertroposphere) and westerly (lower troposphere)in zonal wind described in the previous sub-section.
4. Meridional cross-sections in theIndonesian sector
To reveal the meridional structure of sea-sonal variations described in the previous sec-tion more clearly, latitude-altitude cross-sectionanalysis has been made for monthly averagedzonal and meridional wind components, asshown in Figs. 6 and 7, respectively. All the 33stations have been used. It must be noted thatthe stations plotted here are not along a longi-tude.
For zonal winds (Fig. 6), an easterly regionappears in the upper troposphere over theequatorial region throughout a year. In sum-mer seasons of each hemisphere (December–February and July–September), the easterlywind becomes strong, and is distributed con-tinuously from the summer hemispheric strato-sphere. This easterly wind region is accom-panied by westerly in the lower troposphereand is shifted north-southward with an annualperiod. When centers of these regions come tothe equator (in April and November), zonalwinds, both in the upper and lower tropo-sphere, become relatively weak. Namely, theweak annual cycle in Region III (@1�S–@4�N)in the lower troposphere (Subsection 3.1a) areeasily confirmed here, and the strength of theupper-tropospheric easterly over the equatorialregion takes maxima in each summer season
and minima between them, corresponding tothe semiannual oscillation described in Sub-section 3.1b.
The meridional winds in the upper tropo-sphere over the equatorial region are reversedat around 8 km altitude moving in the north-south direction with an annual cycle (see Fig. 7)as found in Subsection 3.2, which is consistentwith the annual-cycle displacement of the twinmeridional (Hadley-type) cells. The reversallatitude corresponding to ITCZ or the boundaryof the twin meridional cells (defined zero line inthe meridional wind) arrives at the southern-most latitude (about 15�S) in February and atthe northern limit (outside of the analysis re-gion limit @15�N) from May to September, thatis, the displacement from the equator is asym-metric between both hemispheres (or both sum-mer seasons). The seasonal march (or north-ward movement of the meridional cell boundaryis the most rapid from April (the cell boundarylocating over the equator) to May in the ana-lyzed longitude range (90�–140�E).
The description mentioned above is averagedunder an assumption that the atmosphere isalmost uniform for the longitudinal range ana-lyzed here (90�–140�), the meridional circula-tion is not uniform even inside Indonesia con-sidering longitudinal dependences of seasonalvariation of zonal and meridional wind de-scribed in Subsection 3.1 and 3.2. Murakamiand Matsumoto (1994) have shown the differ-ences of the north-southward migration of ITCZ(that is, the Hadley-type cell boundary) insideand around the maritime continent region(80�–140�E) based on the NOAA OLR (outgo-ing long-wave radiation) data. The latitude(@10�S) of ITCZ during December–March intheir analysis is consistent with that of themeridional (Hadley-type) cell boundary definedby zero meridional wind, shown in Fig. 7 of thispaper. ITCZ reaches the most northern lati-tude in July–August at 100�E, and in August–September at 140�E. This longitudinal depen-dence is consistent with that of the appearanceof the westerly (easterly) and southerly (north-erly) maximum in the lower (upper) tropo-sphere, as described in Subsection 3.1 and 3.2.(Murakami and Matsumoto (1994) has alsopointed out a ‘sudden’ shift of ITCZ in theIndonesian sector described in the previousparagraph.) Therefore, the north-south ward
N. OKAMOTO, et al. 839August 2003
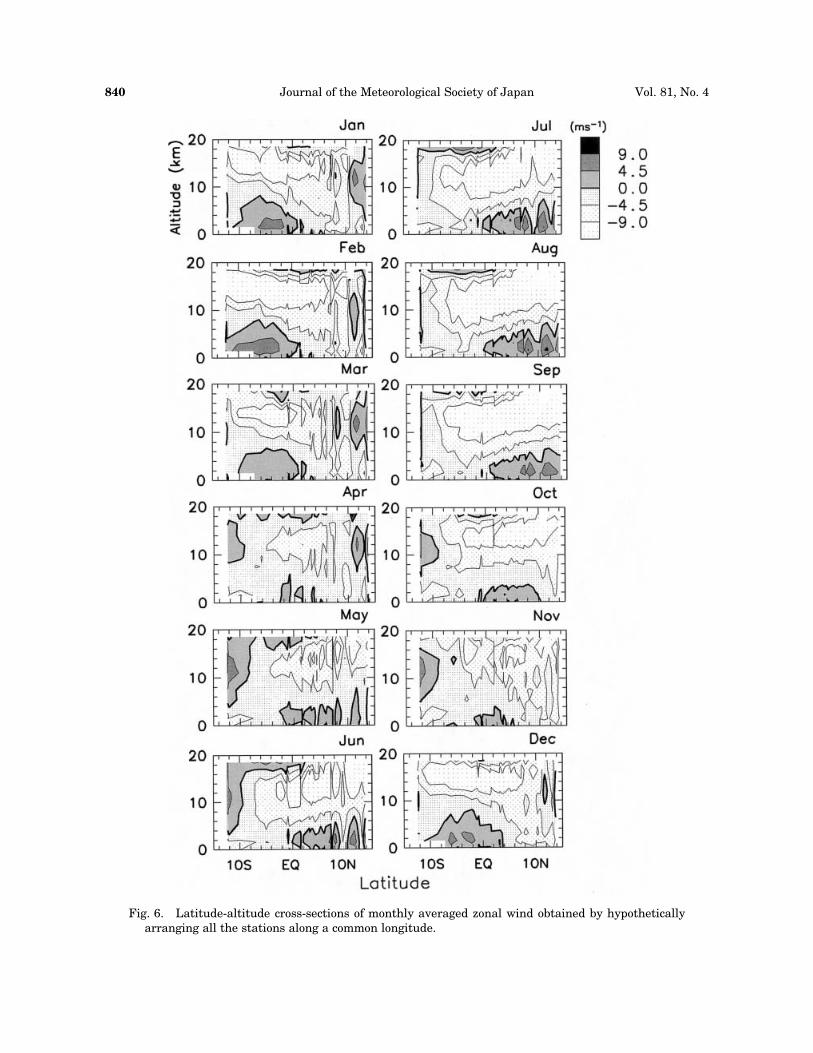
Fig. 6. Latitude-altitude cross-sections of monthly averaged zonal wind obtained by hypotheticallyarranging all the stations along a common longitude.
Journal of the Meteorological Society of Japan840 Vol. 81, No. 4
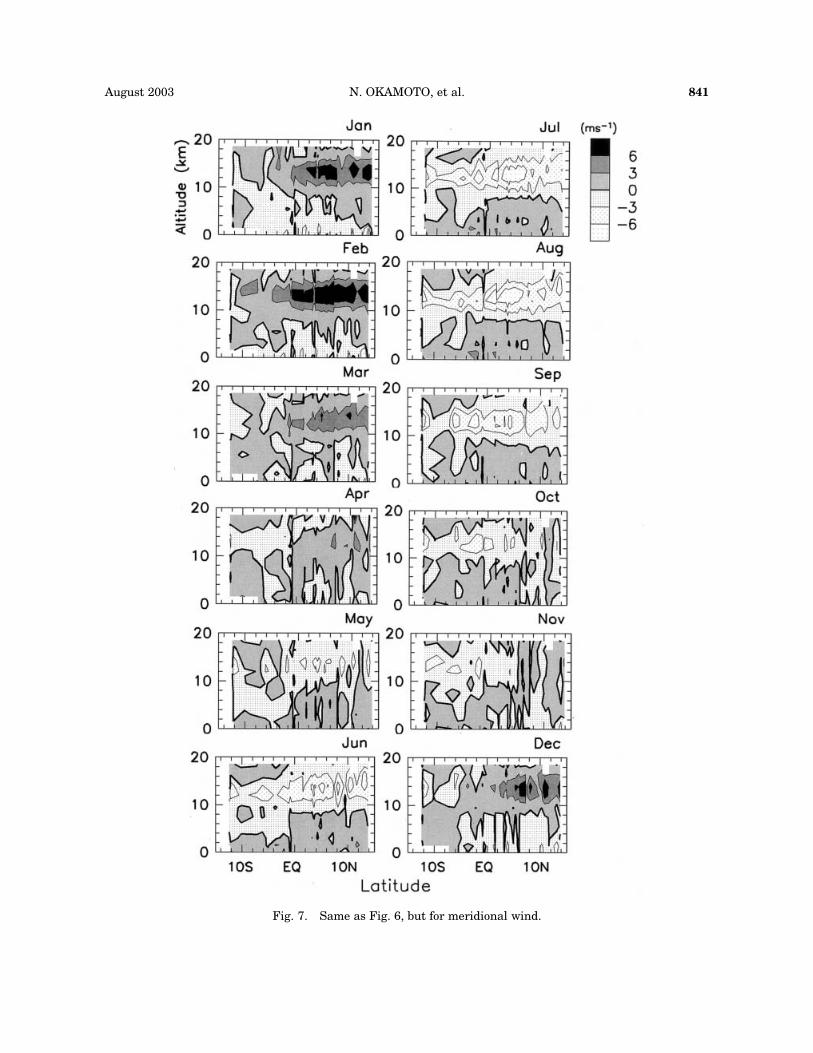
Fig. 7. Same as Fig. 6, but for meridional wind.
N. OKAMOTO, et al. 841August 2003
migration of meridional circulation is differentbetween the western and eastern parts of Indo-nesia.
5. Comparison with NCEP reanalysis data
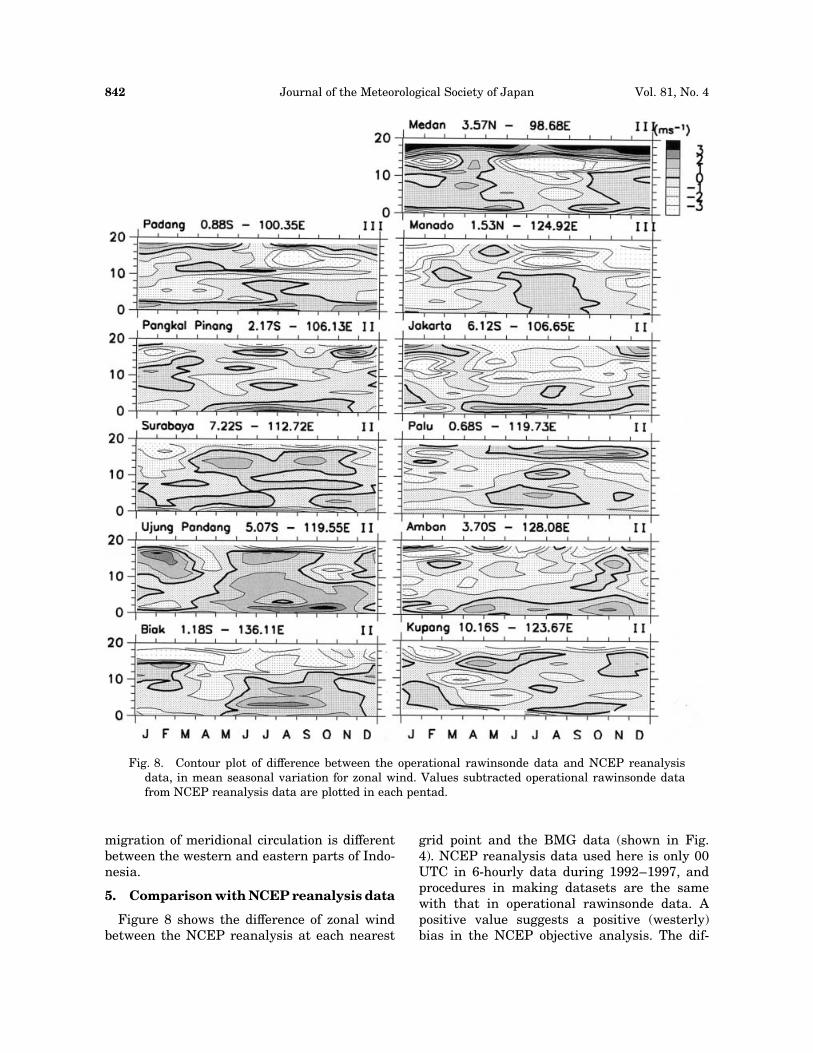
Figure 8 shows the difference of zonal windbetween the NCEP reanalysis at each nearest
grid point and the BMG data (shown in Fig.4). NCEP reanalysis data used here is only 00UTC in 6-hourly data during 1992–1997, andprocedures in making datasets are the samewith that in operational rawinsonde data. Apositive value suggests a positive (westerly)bias in the NCEP objective analysis. The dif-
Fig. 8. Contour plot of difference between the operational rawinsonde data and NCEP reanalysisdata, in mean seasonal variation for zonal wind. Values subtracted operational rawinsonde datafrom NCEP reanalysis data are plotted in each pentad.
Journal of the Meteorological Society of Japan842 Vol. 81, No. 4
ferences seem to be large near the bottom andtop of the troposphere, but have no clear sys-tematic distributions almost over the Indone-sian stations, which implies that the seasonal-vertical variations of wind calculated by theNCEP objective analysis are in good agree-ment with actual variations. In the uppertroposphere, easterly maximum in January–February is underestimated in Ujung Pandang.Except for this, the upper troposphere has ingeneral negative values in Fig. 8, which im-plies that the NCEP objective analysis in-volves a negative (easterly) bias, and producesan overestimation of tropical tropopausal east-erly. A maximum value in July–August is over-estimated by 5–6 m/s, especially at stations inRegion III (Medan, Padang and Manado).
Figure 9 is the same as Fig. 8, but for meri-dional wind. The differences seem again to belarge near the top and bottom of the tropo-sphere. In particular, northerly in the uppertroposphere in northern summer is stronger(overestimated) in the NCEP reanalysis thanthe observations at all the Indonesian stations.The appearance altitude of maximum has goodagreement, northerly wind changed steeply inaltitude in the NCEP reanalysis data (showingpositive (underestimated) regions in the upperand lower sides of the northerly maximum).Southerly wind in northern winter analyzed byNCEP is also stronger than from observationsat four western stations (Medan, Padang, Pang-kal Pinang and Jakarta).
Next, latitude-altitude cross-sections arecompared between observations Fig. 7 andmonthly-mean NCEP reanalysis data during1992–1997 averaged for 90–140�E (Fig. 10).Concerning the southward shift of the bound-ary of twin meridional (Hadley-type) cells innorthern winter, southerly wind larger than6 m/s is beyond the equator in February in theobservations, but until 4�N in the NCEP re-analysis. Strong northerly wind (larger than6 m/s) in NCEP appears in a broader latituderange in the northern summer upper tropo-sphere, and is continued longer until Septem-ber. In the BMG rawinsonde data, the regionof northerly wind larger than 6 m/s has a lat-itudinal dependence inside of 15�S–15�N(mainly 0–8�N in August). Surface wind isweaker in Fig. 10 than in observations. Thisdifference appears with increasing latitude in
both hemispheres in northern summer (July–September), and only in the northern hemi-sphere in northern winter (December andJanuary). Although we have also compared be-tween the GTS wind data (shown in Section 3)and NCEP reanalysis wind data, differencesare smaller (1–2 m/s) than those between theBMG data and the NCEP reanalysis (Figuresare not shown).
6. Discussions
6.1 Behaviors of meridional and zonalcirculations
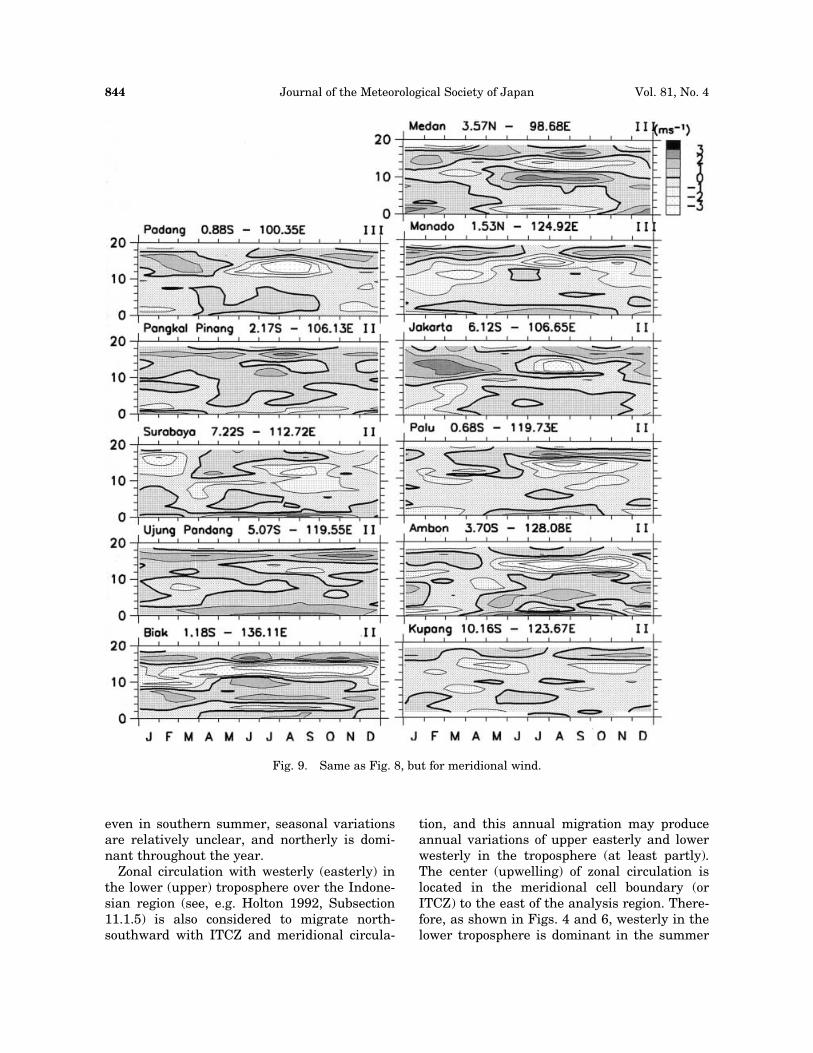
Figure 11 shows a schematic picture of ob-servational evidence described in Sections 3 and4. Existence of two types of circulation has beensuggested over Indonesia and the surroundingregion from the operational rawinsonde data;one is a pair of meridional (Hadley-type) circu-lation cells in a meridional-vertical plane, andthe other is a zonal (Walker-type) circulationin a zonal-vertical plane. The annual oscilla-tion of meridional wind observed at each sta-tion (Fig. 5) is mainly due to north-southshift of the meridional circulation. The winter(southern) hemispheric cell during the northernsummer shifts deeper than that (northern cell)during northern winter. However, meridionalwind over Indonesia associated with the winterhemispheric cell during northern winter isstronger than that during northern summer(Fig. 7 from the BMG and GTS rawinsondedata, and Fig. 10 from the NCEP reanalysis).These features also appeared in the zonal-meanHadley circulation shown by Oort and Yienger(1996) and Waliser et al. (1999) using massstream functions. Meridional wind with thewinter-hemispheric cell of the meridional cir-culation in the Indonesian sector or 90�–140�Eis stronger, and its invasion into the summerhemisphere is deeper than in the zonal-meanHadley-circulation. Such strongly asymmetricalstructure and displacement of the meridionalcells make the latitudinal (regional) differencesof the annual oscillations in the rawinsondedata. In Region I (mainly northern hemisphericstations), the central part of winter hemi-spheric cell comes in each solstice season, andthe annual oscillation is quite clear. In RegionII (mainly southern hemispheric stations), be-yond which the boundary of the twin meri-dional cells does not pass through southward
N. OKAMOTO, et al. 843August 2003
even in southern summer, seasonal variationsare relatively unclear, and northerly is domi-nant throughout the year.
Zonal circulation with westerly (easterly) inthe lower (upper) troposphere over the Indone-sian region (see, e.g. Holton 1992, Subsection11.1.5) is also considered to migrate north-southward with ITCZ and meridional circula-
tion, and this annual migration may produceannual variations of upper easterly and lowerwesterly in the troposphere (at least partly).The center (upwelling) of zonal circulation islocated in the meridional cell boundary (orITCZ) to the east of the analysis region. There-fore, as shown in Figs. 4 and 6, westerly in thelower troposphere is dominant in the summer
Fig. 9. Same as Fig. 8, but for meridional wind.
Journal of the Meteorological Society of Japan844 Vol. 81, No. 4

Fig. 10. Same as Fig. 7, but for meridional wind averaged for 90–140�E based on the NCEP re-analysis (1979–1997).
N. OKAMOTO, et al. 845August 2003
hemisphere over Indonesia (Regions I and II),and the period of dominance becomes shorterwith latitude. Similar variations with differentphases have been observed in zonal wind overthe equatorial Pacific (Gage et al. 1996). In In-donesia studied here, associated with the meri-dional cell boundary and ITCZ, the westerlydominant zone is deviated to the northernhemisphere, and annual wind variation in Re-gion III (Medan, Padang, Singapore, Bintulu,Kuching and Manado) is unclear, or westerlydominant throughout a year. However, this ex-planation cannot give the origin of the semian-
nual oscillation of zonal wind which is moredominant than the annual oscillation in theupper troposphere over Indonesia.
In order to consider why semiannual varia-tions are dominant in the upper-troposphericeasterly, a simple situation such as an air par-cel starting from the top (near the tropopause)of the meridional circulation cell boundary isflown to the equator with the top of the winter-hemispheric meridional circulation cell. Asshown in Section 3.1, the upper troposphericeasterly has a maximum more than 20 m/s ineach solstice season, and becomes @10 m/s in
Fig. 11. Schematic figure of seasonal variations over Indonesia. The Hadley circulation shiftssouthward in the northern winter and northward in the northern summer. Along the boundary ofthe two cells (that is, ITCZ), the Walker circulation which has westerly in the lower troposphereand easterly in the upper troposphere is superimposed.
Journal of the Meteorological Society of Japan846 Vol. 81, No. 4
other seasons. It takes about three days for anair parcel to go across the analysis region fromeast to west (@5000 km) with 20 m/s, and takessix days with 10 m/s. On the other hand, asshown in Sections 3.2 and 4, upper troposphericmeridional wind speed is @6 m/s, so an airparcel can cross over the analysis region north-southward (@3000 km) in six days. Because thedistance between the meridional circulationcell boundary and the equator is shorter thanhalf of the north-south width of the analysisregion (except for northern summer), it takesless than three days for a parcel to travel fromthe cell boundary to the equator with thewinter-poleward flow at the top of the winterhemispheric cell; in other words, an air parcelmoving with the meridional circulation can re-main in the analysis region (does not go towestern outside of the analysis region), anda one-dimensional (meridional) problem of theconservation of absolute angular momentumcan be approximately applied
W � ða cos jÞ2 þ uðjÞ � a cos j ¼ W � a2 þ uð0Þ � a;ð1Þ
to the air parcel transported from a latitude j
to the equator ðj ¼ 0Þ, where uðjÞ is the zonalwind at latitude j, W is the angular velocity ofthe earth’s rotation, and a is the earth’s radius(see, e.g. Holton 1992, Section 10.3, pp. 323–329).
If the boundary of the meridional circulationcells is shifted from the equator and is locatedat j ¼ jH , the zonal velocity of this air parcel atthe equator is given by (1) as
uð0Þ ¼ uðjHÞ � cos jH þW � a � ðcos2 jH � 1Þ;ð2Þ
where uðjHÞ has been assumed as an almostconstant (small negative) value, because theequatorial lower atmosphere (the momentumsource) is sufficiently homogeneous within thelatitudinal range 0 < jjj < jjH j. Thus, uð0Þ be-comes minimum when the north-south shift jjH jof the meridional circulation cell boundary ismaximum.
Furthermore, because the southward shift ofthe meridional circulation cell boundary jjH j innorthern winter is smaller than the northwardshift in summer, the easterly maximum innorthern winter becomes weaker than that insummer. Therefore, a weak annual variation is
generated. Combined with the discussion in theprevious paragraph, the seasonal variation ofzonal wind over the Indonesian region is re-lated to the effect of meridional (Hadley-type)circulation mentioned above (strong semi-annual plus weak annual) and the superposi-tion of zonal (Walker-type) circulation (mainlyannual), as long as the zonal displacement isnot so long as to go out of the analyzed re-gion. Contribution of the former is relativelylarge in the vicinity of the equator, and thelatter is dominant in particular over the sum-mer hemisphere-side relatively higher latitudes(near ITCZ), as shown in Fig. 6. This consider-ation is also consistent in quality with theobservational fact that easterly maximum insummer of each hemisphere becomes strongerthan the other maximum (in winter of eachhemisphere) and annual oscillation becomesgradually dominant with increasing latitude, asshown in Subsection 3.1.b and Section 4.
Other effects such as eddy viscosity work-ing on the zonal flow must be considered toexplain the origin of the behaviors of theannually-oscillating meridional circulation ac-companied with semi-annual variations ofupper-tropospheric easterly. Monsoon circula-tion between the northern (land) and southern(ocean) hemispheres may induce flows in thesame direction as the meridional (Hadley-type)cell (winter-poleward in the upper troposphere)in the winter hemisphere. However, quantita-tive discussions on such effects are beyond thescope of this paper.
6.2 Significance of operational rawinsondedata over Indonesia
In this subsection, based on comparison withNCEP reanalysis data shown in Section 5,the significance and utility of the operationalrawinsonde data over Indonesia are discussed,many of which have not been included in suchobjective analysis mainly because of worsetelecommunication infrastructure as describedin Subsection 2.1.
Analysis results in this paper, based on theoperational rawinsonde data, have revealed theexistence of regional differences of large-scalecirculations, even inside of the Indonesian sec-tor. In general, differences in wind velocitiesseem to be larger near the top and bottom ofthe troposphere. As shown in Figs. 8 and 9,
N. OKAMOTO, et al. 847August 2003
maximum values of wind speed are differentbetween the observations and the reanalysis,and seasonal alternation in the lower tropo-sphere is inverse at a station. In the observa-tions, the upper-tropospheric northerly wind innorthern summer is weaker than southerly innorthern winter and is larger than 6 m/s in anarrow latitude range (Figs. 4 and 7). However,in the NCEP reanalysis, the northerly wind innorthern summer is over-estimated and has amagnitude similar to that of the southerly innorthern winter. This suggests that the meri-dional circulation cells are not well reproducedin the NCEP reanalysis.
Furthermore, in the NCEP reanalysis, thenortherly in northern summer is distributedbroadly over the analyzed latitude range inboth sides of the equator and the boundary ofmeridional circulation (v ¼ 0 line) in 200 hPa isextended to @35�N. Although the rawinsondestations used in this study (latitude < 15�) donot cover the cell boundary in northern sum-mer, observations of ITCZ in the analysis lon-gitude range (90�–140�E) shows that it is lo-cated over the Bay of Bengal and Indo-ChinaPeninsula (@20�N). This suggests that thenorthward invasion of the winter hemisphericmeridional circulation cell across the equatoris overestimated in the NCEP reanalysis. Asimilar feature has been suggested for winterhemispheric Hadley cell in northern summeranalyzed from zonal mean of the NCEP rean-alysis (Waliser et al. 1999). Overestimation ofeasterly maxima in July–August in the NCEPreanalysis may occur as a result of such errors(too large northward invasion) in the meri-dional circulation cells which are related to theabsolute angular momentum conservation asdiscussed in the previous subsection.
7. Conclusions
Operational rawinsonde data from 11 sta-tions over the whole territory of Indonesia forabout seven years (November 1991–May 1999)has been collected. Rawinsonde data at sta-tions in countries surrounding Indonesia for sixyears (1992–1997), and objective analysis datahave been obtained from NCEP for comparison.BLR data near Jakarta also has been used for areliability check. Based on these datasets, sea-sonal variations of general circulation over In-donesia have been investigated, and the vari-
ations have been compared with the NCEPreanalysis data. Major conclusions are sum-marized as follows:
(i) Meridional wind in the troposphere variesby an annual period associated with anorth-south shift of meridional (Hadley-type) circulation. The summer-polewardshift of the twin meridional circulationcell boundary is larger in northern sum-mer (southern winter), but the intensityof winter-hemispheric meridional cell isstronger during northern winter. The lattermakes upper (lower) tropospheric south-erly (northerly) in the northern winterstronger than each inverse flow in north-ern summer;
(ii) Annual oscillation of zonal wind is not sostrong, but becomes clear with increas-ing latitude [westerly (strong easterly) insummer of each hemisphere in the lower(upper) troposphere]. A possible explana-tion is due to a north-south shift of zonal(Walker-type) circulation (westerly andeasterly in the lower and upper tropo-sphere, respectively, over Indonesia) su-perimposed along the boundary of twinmeridional circulation cells;
(iii) Zonal wind in the upper troposphere variesmore clearly by a semiannual period whichhas easterly maxima in both the solsticeseasons. This is consistent with a consid-eration on the absolute angular momen-tum conservation of air parcels trans-ported equatorward (winter-poleward) bythe annually shifting twin meridionalcirculation cells (semiannually replacingwinter-hemispheric cells). Differences be-tween the two maxima (a kind of annualvariation) are also induced by an asymme-try of annual variation of the meridionalcirculation; and,
(iv) Seasonal alternation of wind in NCEP re-analysis data are almost consistent withthat in operational rawinsonde data. How-ever, in magnitude of wind, overestima-tions of upper tropospheric northerly andeasterly are seen in the NCEP reanalysisdata, especially in northern summer. Theoverestimations may be associated with aworse reproduction of the winter (south-ern) hemispheric meridional circulation
Journal of the Meteorological Society of Japan848 Vol. 81, No. 4
cell, such as too large invasion to thesummer (northern) hemisphere across theequator.
We are continuing our efforts to collect ob-servation data in Indonesia for a much longerperiod, in order to analyze interannual varia-tions and investigate correlations with ENSO(El Nino-southern oscillation; cf. Hamada et al.2002 for rainfall data) or other long-periodicvariations, which will be presented in a subse-quent paper. Furthermore, longitudinal differ-ences of the tropical general circulation (themeridional and zonal circulations), which havebeen suggested even inside the Indonesian sec-tor, will be studied also between Indonesia andother equatorial regions, and then latitudinaldifferences (or tropics-extratropics interactions)will be studied in parallel with the interannualvariation analysis.
Acknowledgments
We are indebted to Mr. Andri Purwandari ofBPPT and colleagues of BPPT and BMG forpermission to use valuable data and help indata collections. We are grateful to Dr. M. Fu-jiwara of Hokkaido University, Dr. J. Matsu-moto and Prof. T. Yamagata of the Universityof Tokyo, Dr. K. Masuda of Frontier ResearchSystem for Global Change, and Prof. M. Shio-tani of the RASC, Kyoto University for giv-ing constructive comments. We thank Dr. T.Iwayama and other colleagues of the Laboratoryfor Atmospheric and Hydrospheric Sciences atKobe University for their useful suggestionsand comments, and grateful to Prof. S. Fukaoand colleagues at RASC, Kyoto University fortheir encouragement. Thanks are also due toMr. Ismail Hassenpflug of RASC for his carefulreading of the first manuscript. Criticisms of-fered from one editor (Dr. Ose) and two anony-mous reviewers are also acknowledged. Thefirst author (Okamoto) was supported by a grant(04973) from the Japan Society for the Promo-tion of Science (JSPS) under the Fellowshipsfor Japanese Junior Scientists. The presentstudy was also financially supported by Grants-in-Aids (10041117) of Japanese Ministry of Ed-ucation, Science, and Culture, and partly by aresearch grant of Frontier Observational Re-search System for Global Change.
References
Chang, C.-P. and C.N. Krishnamurti (eds.), 1987:Monsoon Meteorology. Oxford University Press,544pp.
Endlich, R.M., R.C. Singleton and J.W. Kaufman,1969: Spectral analysis of detailed verticalwind speed profiles. J. Atmos. Sci., 26, 1030–1041.
Gage, K.S., J.R. McAfee, W.L. Ecklund, D.A. Carter,C.R. Williams, P.E. Johnston and A.C. Riddle,1994: The Christmas island wind profiler: Aprototype VHF wind-profiling radar for thetropics. J. Atmos. Ocean. Tech., 11, 22–31.
———, ——— and C.R. Williams, 1996: On theannual variation of tropospheric zonal windsobserved above Christmas Island in the cen-tral equatorial Pacific. J. Geophys. Res., 101,15061–15070.
Hamada, J., M.D. Yamanaka, J. Matsumoto, S. Fu-kao, P.A. Winarso and T. Sribimawati, 2000:Spatial and Temporal variations of the rainyseason over Indonesia and their Link to ENSO.J. Meteor. Soc. Japan, 80, 285–310.
Hartmann, D.L. and J.R. Gross, 1988: Seasonalvariability of the 40–50 day oscillation in windand rainfall in the tropics. J. Atmos. Sci., 45,2680–2702.
Hashiguchi, H., S. Fukao, T. Tsuda, M.D. Yamanaka,D.L. Tobing, T. Sribimawati, S.W.B. Harijonoand H. Wiryosumarto, 1995a: Observations ofthe planetary boundary layer over equatorialIndonesia with an L-band clear-air Doppler ra-dar: Initial results. Radio Sci., 30, 1043–1054.
———, ———, M.D. Yamanaka, T. Tsuda, S.W.B.Harijono and H. Wiryosumarto, 1995b: Bound-ary layer radar observations of the passage ofthe convection center over Serpong, Indonesia(6�S, 107�E) during the TOCA COARE inten-sive observation period. J. Meteor. Soc. Japan,73, 535–548.
Holton, J.R., 1992: An Introduction to Dynamic Me-teorology. 3rd Ed., Academic Press, 511pp.
Krishnamurti, T.K., 1971: Tropical east-west circu-lations during the northern summer. J. Atmos.Sci., 28, 1342–1347.
Matsumoto, J., 1992: The seasonal changes in Asianand Australian monsoon regions. J. Meteor.Soc. Japan, 70, 257–273.
Murakami, T., 1987: Orography and monsoons inMonsoons edited by J.S. Fein and P.L. Ste-phens, 331–364, Wilwy-Interscience Publuca-tion, John Wiley and Sons, New York.
——— and J. Matsumoto, 1994: Summer monsoonover the Asian Continent and western NorthPacific. J. Meteor. Soc. Japan, 72, 719–745.
Oort, H.A. and J.J. Yienger, 1996: Observed Inter-
N. OKAMOTO, et al. 849August 2003
annual variability in the Hadley circulationand its connection to ENSO. J. Climate, 9,2751–2767.
Sato, K., F. Hasegawa and I. Hirota, 1994: Short-period disturbances in the equatorial lowerstratosphere. J. Meteor. Soc. Japan, 72, 859–872.
Shukla, J., 1987: Long-range forecasting of mon-soon in Monsoons edited by J.S. Fein and P.L.Stephens, 523–3548, Wilwy-Interscience Pub-lucation, John Wiley and Sons, New York.
Takayabu, Y.N. and Ts. Nitta, 1993: 3–5 day-perioddisturbance coupled with convection over thetropical Pacific ocean. J. Meteor. Soc. Japan,71, 221–246.
Waliser, D.E., Z. Shi, J.R. Lanzante and A.H. Oort,1999: The Hadley circulation: assessing NCEP/NCAR reanalysis and sparse in-situ estimates.Clim. Dyn., 15, 719–735.
Webster, P.J., 1987: The variable and interactivemonsoon in Monsoons edited by J.S. Fein andP.L. Stephens, 269–330, Wilwy-IntersciencePublucation, John Wiley and Sons, New York.
———, V.O. Magana, T.N. Palmer, J. Shukla, R.A.Tomas, M. Yanai and T. Yasunari, 1998: Mon-soons: Process, predictability, and the pros-pects for prediction. J. Geophys. Res., 103,14451–14510.
Widiyatmi, I., M.D. Yamanaka, H. Hashiguchi, S.Fukao, T. Tsuda, S.-Y. Ogino, S.W.B. Harijonoand H. Wiryosumarto, 1999: Quasi 4 day modeobserved by a boundary layer radar at Serpong(6�S, 107�E), Indonesia. J. Meteor. Soc. Japan,77, 1177–1184.
———, H. Hashiguchi, S. Fukao, M.D. Yamanaka,S.-Y. Ogino, Kenneth, S. Gage, S.W.B. Har-ijono, S. Diharto and H. Djojodihardjo, 2001:Examination of 3–6 day disturbances overequoatorial Indonesia based on during 1966–1999 at Bukittingi, Serpong and Biak. J. Me-teor. Soc. Japan, 79, 317–331.
Young, J.A., 1987: Physiscs of Monsoons: The cur-rent view in Monsoons edited by J.S. Fein andP.L. Stephens, 211–244, Wilwy-IntersciencePublucation, John Wiley and Sons, New York.
Journal of the Meteorological Society of Japan850 Vol. 81, No. 4
Copyright © 2022 FDOKUMEN