Cognitive Mechanisms Underlying Recovered-Memory Experiences of Childhood Sexual

Fuel 93 (2012) 273–283
Contents lists available at SciVerse ScienceDirect
Fuel
journal homepage: www.elsevier .com/locate / fuel
The solid recovered fuel Stabilat�: Characteristics and fluidised bed gasification tests
G. Dunnu a, K.D. Panopoulos b, S. Karellas c,⇑, J. Maier a, S. Touliou b, G. Koufodimos d, I. Boukis d,E. Kakaras b,c
a Institute of Combustion and Power Plant Technology, University of Stuttgart, Pfaffenwaldring 23, D-70569 Stuttgart, Germanyb Institute for Solid Fuels Technology and Applications, Centre for Research and Technology Hellas, 4th km N.R. Ptolemais-Kozani, P.O. Box 95, 50200 Ptolemais, Greecec Laboratory of Steam Boilers and Thermal Plants, National Technical University of Athens, Heroon Polytechniou 9, 15780 Athens, Greeced HELECTOR S.A., Energy and Environmental Applications, 25 Ermou Str., 145 64 N. Kifissia, Greece
a r t i c l e i n f o
Article history:Received 26 August 2010Received in revised form 24 August 2011Accepted 25 August 2011Available online 9 September 2011
Keywords:Stabilat�
GasificationWaste-to-energySRF
0016-2361/$ - see front matter � 2011 Elsevier Ltd. Adoi:10.1016/j.fuel.2011.08.061
⇑ Corresponding author.E-mail address: [email protected] (S. Karellas).
a b s t r a c t
The solid recovered fuel Stabilat� has a low water content which makes it ideal for thermochemical con-version processes such as gasification. The paper presents fuel characterisation and fluidised bed gasifi-cation experiments of the Stabilat� solid waste recovered fuel in two experimental facilities, aiming atassessing the product gas quality and bed agglomeration phenomena. The energy content of the gasifica-tion product gas was about 4.3 MJ Nm�3 and the process efficiency reached the value of 64.4%. Theamount of HCl measured in the product gas ranged between 61.0 mg Nm�3 (700 �C, k = 0.25) and37.6 mg Nm�3 (800 �C, k = 0.3). The total tar content was found between 2 and 6 g Nm�3 according tothe gravimetric method, while the same range with GC measurements was 4–13 g Nm�3 (N2 free). Nosevere loss of fluidisation occurred up to 850 �C while electron microscopy investigation of the bed mate-rial and ash material revealed that some agglomerates were present, due to melting of glass particlesinherent in the material while lower amount of ash and original bed material conglomerates. In all casesthese phenomena did not cause any severe problems to fluidisation.
� 2011 Elsevier Ltd. All rights reserved.
1. Introduction
The biodegradable part of the Municipal Solid Wastes (MSW) isconsidered to be a renewable energy source [1] as its properties aresimilar to the ones of other biomass fuels. Furthermore, the contin-uously growing business of waste recycling applications produceenormous amounts of secondary fuels of high heating value suchas the Refuse Derived Fuel (RDF) and Solid Recovered Fuel (SRF).Nevertheless, mature final markets for these fuels have not beendeveloped yet in all EU countries. Moreover, depositing MSW andsecondary fuels in landfills has to be abandoned in EU accordingto directive 1999/31/EU [2]. Therefore there is a great need to de-velop specific processes that best utilise these fuels.
The focus of this work is to investigate the thermal utilisation ofthe secondary fuel from a Waste Treatment Facility technologydeveloped by Herhof GmbH and implemented in more than tensites worldwide. The technology incorporates an MSW RecyclingPlant, and a novel Mechanical Biological Treatment (MBT) of un-sorted MSW with a patented mechanical biological drying stepwhich removes most of the moisture, followed by a mechanicalrecycling step. Through this process, reusable materials (ferrousmetals, aluminium and glass) are separated and can be sold as a
ll rights reserved.
genuine high-quality raw material and returned into the materialcycle. The remaining organic waste fraction is turned into an SRFmarketed product under the name ‘‘Trockenstabilat�’’ or, simply,‘‘Stabilat�’’, which is delivered after being pressed into hygienic,nearly odour-free, energy resource known as pellets or after beingshredded and retained in fluffy form. Nowadays, this product fuelis being utilised as coal substitute in cement plants or large, centralwaste to energy plants [3]. The overall mass balance of the processis shown in Fig. 1.
The Stabilat� fuel has a low water content which makes it idealfor thermochemical exploitation processes such as combustion orgasification. Gasification is the conversion of a solid fuel to a mix-ture of combustible gases (mainly H2, CO and CH4) through a ther-mochemical process comprised of pyrolysis, partial oxidation andgasification reactions [4–6]. When air is used as gasification med-ium the result is the occurrence of non-combustible gasses CO2 andN2 (apart from the above-mentioned combustible species) leadingtherefore to the production of a low calorific value fuel gas (4–5 MJ Nm�3) [7]. Combustion technologies have several weak-nesses, such as low efficiency of refuse derived combustion steamcycles (�20%) and higher capital and operating costs for flue gastreatment associated with stringent emission regulations for diox-ins and furans in the increased volumes of flue gases. Neverthelessthe combustion technologies have the advantage of being moremature and have the predominant application examples through-out the world for thermal treatment of waste derived secondary
Inerts (to landfill)
Metals (Fe/ Non-Ferrous)
MSW 100 %
H2O and condensates
Solid Recovered Fuel (SRF) - Stabilat®
~ 0.5 kg/ Mg BatteriesGlass (recycled)
~ 30 %
~ 53 %
~ 5 %
~ 3 %
~ 9 %
Fig. 1. Mass balance for the incoming MSW in a Herhof GmbH recycling plant.
274 G. Dunnu et al. / Fuel 93 (2012) 273–283
fuels. On the other hand, many gasification technologies havestayed long time in the level of the so-called ‘‘threshold for com-mercialization’’ and face technical problems associated withincreasing efficiencies. For example the use of syngas into the gasturbine combustor causes problems of turbine blade corrosion be-cause of chlorine, and alkali traces in the product gas. The advan-tage of gasification based technologies is the inherent potentialto be more easily brought to the emission regulations standardsand that this technology allows several other energetic end-prod-ucts (i.e. polygeneration) apart from what combustion has to offerheat and low efficiency electricity.
During the gasification of a solid recovered fuel, the product gasalso contains a series of other species in solid phase outputs (likebottom ash & char) or as gas phase entrained species (tars and par-ticles). The difficulty in removing these impurities is one of themain barriers against the commercialisation of gasification tech-nology [8]. Furthermore, fluidised bed gasifiers face significantoperating problems due to the sintering of the bed material, espe-cially with low-grade, high ash content fuels. This is due to the for-mation of low alkali eutectics that melt at relative lowtemperatures (750–950 �C) [9]. Table 1 summarises the profile ofsome of the predominant MSW or RDF/SRF (i.e. secondary fuelby-products) technology demonstration/efforts in Europe the lastyears with regard to gasification conversion approaches and thestatus of tackling the above mentioned problems.
The aim of this paper is to present results from fuel character-isation and gasification experiments of the Stabilat� fuel in two
Table 1Examples of MSW to energy technologies.
Name Description of technology
Thermoselect High temperature gasification with the use of O2 and NG
Unsorted raw MSW
Värnamo Pressurised air gasification IGCC
E nerkem Atmospheric gasification and use of gas in ICE
TPS TermiskaAB
Fluidised bed gasification coupled with dolomite bed – RDF fuel wasused
Lahti Gasification of mixed woody biomass and selected office wastesderived fuel (REF) and use of syngas into existing coal fired boiler
Corenso BFB gasification technology (developed by Corenso United Oy Ltd.with FW and VTT)
fluidised bed gasification experimental facilities, to assess theproduct gas quality and agglomeration problems in order to evalu-ate the applicability of the Stabilat� fluidised bed gasification tech-nology in commercial applications.
2. Fuel characterisation
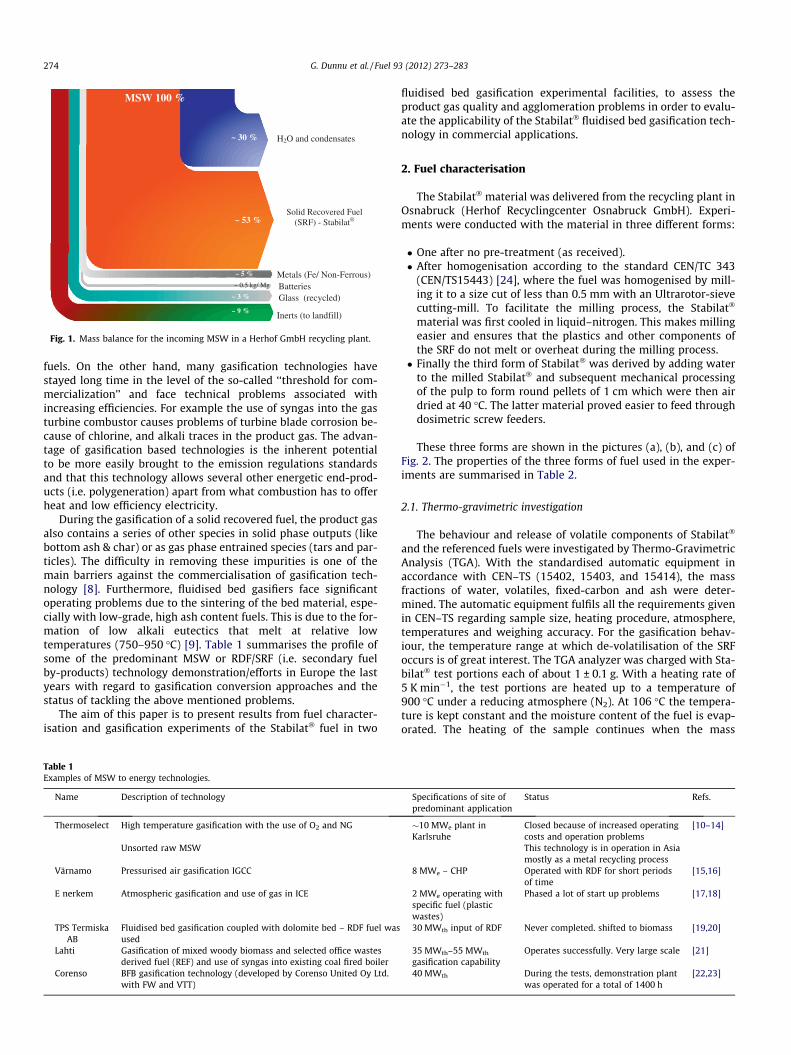
The Stabilat� material was delivered from the recycling plant inOsnabruck (Herhof Recyclingcenter Osnabruck GmbH). Experi-ments were conducted with the material in three different forms:
� One after no pre-treatment (as received).� After homogenisation according to the standard CEN/TC 343
(CEN/TS15443) [24], where the fuel was homogenised by mill-ing it to a size cut of less than 0.5 mm with an Ultrarotor-sievecutting-mill. To facilitate the milling process, the Stabilat�
material was first cooled in liquid–nitrogen. This makes millingeasier and ensures that the plastics and other components ofthe SRF do not melt or overheat during the milling process.� Finally the third form of Stabilat� was derived by adding water
to the milled Stabilat� and subsequent mechanical processingof the pulp to form round pellets of 1 cm which were then airdried at 40 �C. The latter material proved easier to feed throughdosimetric screw feeders.
These three forms are shown in the pictures (a), (b), and (c) ofFig. 2. The properties of the three forms of fuel used in the exper-iments are summarised in Table 2.
2.1. Thermo-gravimetric investigation
The behaviour and release of volatile components of Stabilat�
and the referenced fuels were investigated by Thermo-GravimetricAnalysis (TGA). With the standardised automatic equipment inaccordance with CEN–TS (15402, 15403, and 15414), the massfractions of water, volatiles, fixed-carbon and ash were deter-mined. The automatic equipment fulfils all the requirements givenin CEN–TS regarding sample size, heating procedure, atmosphere,temperatures and weighing accuracy. For the gasification behav-iour, the temperature range at which de-volatilisation of the SRFoccurs is of great interest. The TGA analyzer was charged with Sta-bilat� test portions each of about 1 ± 0.1 g. With a heating rate of5 K min�1, the test portions are heated up to a temperature of900 �C under a reducing atmosphere (N2). At 106 �C the tempera-ture is kept constant and the moisture content of the fuel is evap-orated. The heating of the sample continues when the mass
Specifications of site ofpredominant application
Status Refs.
�10 MWe plant inKarlsruhe
Closed because of increased operatingcosts and operation problems
[10–14]
This technology is in operation in Asiamostly as a metal recycling process
8 MWe – CHP Operated with RDF for short periodsof time
[15,16]
2 MWe operating withspecific fuel (plasticwastes)
Phased a lot of start up problems [17,18]
30 MWth input of RDF Never completed. shifted to biomass [19,20]
35 MWth–55 MWth
gasification capabilityOperates successfully. Very large scale [21]
40 MWth During the tests, demonstration plantwas operated for a total of 1400 h
[22,23]
Fig. 2. Stabilat� material (a) as received (M1), (b) milled to <5 mm (M2) and (c) asround pellets of 1 cm (M3).
Table 2Proximate and ultimate analysis of the Stabilat� materials gasified.
Parameter Stabilat� asreceived (M1)
PretreatedStabilat � (M2)
PretreatedStabilat � (M3)
Proximate analysis (% wt)Moisture 22.1 15.2 3.6Volatiles (d.b) 66.3 64.9 66.3Fixed carbon
(d.b)10.2 7.7 10.2
Ash (d.b) 23.5 27.4 23.5
Ultimate analysis (% wt, d.b)C 42.1 42.8 42.0H 5.8 5.5 5.8N 1.3 1.3 1.3S 0.5 0.3 0.5Cl 1.1 1.1 1.1Oa 25.7 21.5 25.7Ash 23.5 27.4 23.5HHV d.b (kJ/
kg)18,472 18,140 18,472
a by difference.
G. Dunnu et al. / Fuel 93 (2012) 273–283 275
deviation of the samples is less than 0.1%. The weight loss curve ofthe heat-up ramp from 106 to 900 �C with nitrogen atmospheregives information about the release of the volatile matter whichis composed mainly of hydrocarbon groups. Under the same reduc-ing conditions, the samples are cooled to a temperature just below400 �C after which the atmosphere is changed from reducing to anoxidising one. In this case, information on the amount of fixed-car-bon and the ash content were derived.
Fig. 3 presents the differential weight loss of the fuel with re-spect to differential change in temperature (dm/dT). It shows onsetand cessation of major volatile release from the Stabilat�, i.e.150 �C and 720 �C with a peak release at 600 �C. The closeness of
the curves, from repeated tests, shows that the fuel has a goodhomogeneity, with reference to other RDF. The data here also serveas a guide in selecting the minimum bed temperature required toensure an optimum amount of combustible volatile matter re-leased into the gas phase in a gasification process.
2.2. Major and trace elements
The Stabilat� fuel ash was analysed for oxides of the 9 mostabundant constituent elements, other than oxygen and sulphur:Si, Al, Fe, Ca, Mg, Mn, K, Na, and Ti. The results are normalised toCO2, SO3 and Cl-free basis and are shown in Table 3, together withthe measured amount of CO2, SO3 and Cl in the ash. Furthermore,the amounts of trace elements in the fuel were estimated andare also presented in Table 3. Due to the lack of homogeneity ofthe Stabilat� and the small amounts of sample analysed at eachanalysis, the resulted values had a standard deviation ranging from25% to 100%.
2.3. Ash melting behaviour
In accordance with CEN–TS 15404 [25], the characteristic tem-peratures of the Stabilat� were found to be the following: shrink-ing temperature 1140((±10) �C, deformation temperature1140(±20) �C, hemisphere temperature 1160(±20) �C, and flowtemperature 1190 (±20) �C.
In addition, real-time graphical representations of the test piecesduring the ash fusion tests are represented in Fig. 4. The curves werebased on a combination of the CEN/TS 15404 – photographic andthe French standard NF M03-048 – graphical) to generate a visualimpression of the fusion process. In this case, changes in specimenheight (ht) with respect to their initial height (ho) at 550 �C were ob-tained photographically and are plotted against the correspondingtemperatures. Distinct positions on these curves represent the soft-ening, the deformation, the hemisphere, and the flow temperaturesof the ashes. Swelling of the test pieces occurred between the tem-perature range 600 �C and 1100 �C. This phenomenon could be as aresult of the release of gaseous compounds, e.g. volatile alkali met-als, and CO2 mostly from carbonates. The inflexion point of thecurves immediately following the gaseous release is believed tobe the onset temperature of slag-liquid formation [26].
2.4. Metallic aluminium
The metallic aluminium in solid recovered fuels is very prob-lematic in combustion and other thermal processes. Aluminium

0
10
20
30
40
50
60
70
0 50 100 150 200 250 300 350 400 450
Time, min
wei
ght l
oss
(dm
/dT)
, %
0
100
200
300
400
500
600
700
800
900
1000
Tem
pera
ture
, °C
dm/dT Temperature
N2 atmosphere air
dm/dT Temperature
Fig. 3. D-TGA-differential weight loss soft pellets (as received).
Table 3Major elements in the ash (%) and trace elements in the fuel.
% Oxides of major elements in ash – normalised to SO3, CO2 and Cl free basisSiO2 Al2O2 CaO MgO K2O Na2O Fe2O3 P2O5 TiO2 Mn3O4
53.5 6.9 22.0 3.0 3.4 4.2 3.7 1.5 1.7 0.2
% SO3, CO2 and Cl in the ashSO3 CO2 Cl3.75 6.61 0.95
Trace elements in the fuel (mg/kg)Cd Cr Cu Hg Ni Pb Zn<1 390 980 0.34 140 35 3030
0%
20%
40%
60%
80%
100%
120%
500 600 700 800 900 1000 1100 1200 1300 1400 1500
Rel
ativ
e he
ight
of
sam
ple
(ht/h
o)
Temperature, °C
Fig. 4. Ash fusibility curve of Stabilat�.
276 G. Dunnu et al. / Fuel 93 (2012) 273–283
can form deposit on heat transfer surfaces and superheaters. Forthis reason the determination of metallic aluminium is necessaryin SRF characterisation. In Stabilat�, the metallic Al was deter-mined in accordance with CEN/TS 15412 [27]. The test portionof 1 mm maximum particle size is leached with 0.14 mol L�1
nitric acid solution and shaken. After that the mixture is filtered.The elemental aluminium is digested with the help of strong alka-li basic solution. The mixture is then filtered and the aluminiumcontent is determined by inductively coupled plasma opticalemission spectrometry (ICP-OES). The result from the analysis

Table 4Classification system for Stabilat�.
SRF classes
Parameter 1 2 3 4 5LHV, MJ kg�1 (a.r.) average value P25 P20 P15 P10 P3Chlorine (Cl), % db, average value 60.2 60.6 61.0 61.5 63.0
Mercury (Hg), mg/MJMedian 60.02 60.03 60.08 60.15 60.5080th% percentile 60.04 60.06 60.16 60.30 61.00
G. Dunnu et al. / Fuel 93 (2012) 273–283 277
on water free bases was found to be between 0.21 and 0.27 wt.%wf.
2.5. Classification of Stabilat� (NCV, Hg, and Cl)
Based on three properties, the net calorific value (NCV) whichserves as the economic indicator, the chlorine content as the tech-nological indicator and the mercury content as the emission key,the classification system for SRF according to CEN–TC 343 is pre-sented in Table 4.
The LHV a.r. of the Stabilat� is 14.1 MJ kg�1 (LHV of Stabilat�
milled down to particle sizes <0.5 mm = 14.35 MJ kg�1), the chlo-rine content is 1.12% db, and the mercury content is 0.02 mg MJ�1
(equivalence: 0.34 mg kg�1) in the respective order. The resultsfrom the characterisation put Stabilat� in two different categories.The first is the category with classification number 4 when consid-ering two classification parameters LHV and Cl, and the second inthe category with classification number 1 when considering theenvironmental indicator mercury Hg content.
The characterisation results place Stabilat� into first, the classi-fication number 4 when considering two classification parametersLHV and Cl, and second into classification number 1 when consid-ering the environmental indicator mercury Hg content.
3. Fluidised bed gasification experiments
Tests were performed in two different locations and experimen-tal set ups. The first experiments were conducted in the ELWIRAgasifier set up at IFK Stuttgart, in order to determine gas qualityfrom air gasification while the second set of experiments was con-ducted in a lab scale fluidised bed facility of ISFTA/CERTH andNTUA in Athens – with a main purpose to determine any possiblebed agglomeration problems as well as collect bed and cyclone ashmaterial for examination with SEM/EDS.
3.1. Description of test facility ELWIRA at IFK Stuttgart – Reactor R1
The main element of the reactor is a stainless steel tube withdiameter of 108 mm in the bed section and 135 mm in the free-board section. The reactor has an overall height of 3000 mm. Aschematic overview is given in Fig. 5.
In the reactor there is the possibility of secondary air injectionalong its axis. The reactor has five separately controlled electricalheating zones, each with a capacity of approximately 3.6 kW. Themaximum operating temperature is up to1000 �C. The fluidisationvelocity ranges between 0.2 and 1.0 m s�1 for bubbling mode, andbetween 1.0 and 2.0 m s�1 for circulating mode. Ash is separated ina staged process: A cyclone operated at 700 �C and a ceramic can-dle filter at 150 �C. Quartz sand particle size between 200 and400 lm was used as bed material. The composition of the syngasis continuously analysed after the ceramic candle filter for the spe-cies: CO2, CO, H2, O2, and CH4.
The mass concentration of gaseous chlorides expressed as HClwas measured in accordance with the German guideline, DIN38405-D 1–1&2. The sampling of HCl from syngas was however
based on a non-isokinetic method as outlined in DIN EN1911:2010. The use of Ion Chromatography (IC) to analyse the con-densate for chloride content was not possible due to interferencesof some dissolved organic compounds.
The mass concentration of tar in the syngas was determined bygas chromatography–mass spectrometer (GC–MS) analysis as wellas gravimetric measurement. The tar sampling set-up was in accor-dance with the Tar Guideline [28] with an incorporated liquidquench based on the idea of Hasler et al. [29].
3.2. Description of fluidised bed reactor in Athens – Reactor R2
The main element of the reactor is a 1.3 m height stainless steeltube with diameter of 89 mm in the bed section, and 135 mm in thefreeboard section (which has a 300 mm height). A schematic over-view is given in Fig. 6. The reactor is placed in an electrically heatedoven used to preheat and make up for heat loss from the bed. Flu-idizing air is preheated up to 400 �C and enters the bed through aperforated type distributor. The total bed height is kept around200 mm. The fuel is fed into the dense bed 80 mm above the air dis-tributor plate. A small constant nitrogen flow is introduced in solidfeeding system in order to avoid gas back flow. Entrained particlesare separated from the product gas by two cyclones electricallykept hot at 300 �C. Fluidisation is monitored by a differential pres-sure transducer between inlet air and freeboard. The air and nitro-gen flows are regulated by mass flow metres & controllers based onthe thermal mass flow sensing technique. Temperature profiles,pressure, nitrogen and air flows are displayed and logged on a PCvia a data acquisition unit. Two heated sampling lines are used tointroduce gas samples to the on-line monitoring of O2, CO2, CO,H2, CH4 with Sick Maihak Multor 710.
3.3. Test matrix
The tests were performed under 6 different configurations. Thematrixes of the experimental tests are shown on Table 5, togetherwith the fuel used. The basic gasification settings calculated withregards to fuel mass flow and air demand, as well as the theamounts of bed material used in each configuration are shownon Table 6.
4. Results
4.1. Gasification gas quality results
The major product gas species composition results are summa-rised in Table 7. At constant fuel to air ratio (k = 0.3), the H2 and CH4
content in the product gas increases with increasing temperatureswhile CO remains appreciable constant until 800 �C after which itincreases slightly. Fig 7 shows a real-time syngas composition incorrelation to the fuel feeding for the configuration R1. The fuelfeeding was constantly fluctuating, but this effect was not trans-ferred to the quality of the syngas, as shown in Fig. 7. The compo-sitions of the syngas were relatively constant. This can beattributed to the good mixing of the fuel and bed material, but alsolong residence time. These factors serve as a system buffer whichsignificantly reduces the fluctuation of the syngas compositions.
The calculated NCV of the syngas at the respective configura-tions gave the highest value at 850 �C, i.e. 4.25 MJ Nm�3. For tem-perature (T = 700 �C) the H2 and CH4 content in the syngasdecreases with increasing fuel-to-air ratio whereas the CO compo-sition was almost constant. The calculated NCV of the syngas at therespective configurations gave the highest value (4.26 MJ Nm�3, tarfree) at k value 0.25.
The amount of tar content in the syngas decreased considerablywith increasing k (Table 7). The results for the tars measured using

Fig. 5. Gasification test facility ELWIRA at IFK R1 – Stuttgart.
1 Pressurised air flow 13/14 primary/secondary cyclone2 Alternative input (e.g. steam) 15 Ash collection bin3 Air/N2/steam/flue gas mass flow meter 16 Gas cooler 4 Steam – air valve distributor 17 Condensate collector5 Preheater 18 Sampling line for GC6 Distributor 19 Filter 7 Fluidised bed 20 Product gas destruction system (flare)8 Electric resistance 21 Heated sampling probe 9 N2 flow for backflow prevention 22 Heated ceramic filter 10/11 Fuel silo / Inverter/electric motor 24 PC/data collection system12 Freeboard
Fig. 6. The lab-scale bubbling fluidised bed gasification reactor ISFTA/CERTH & NTUA R2, Athens.
278 G. Dunnu et al. / Fuel 93 (2012) 273–283

Table 5The operational configurations of the gasification tests performed using the different fuel formats.
Experiment No 1 2 3 4 5 6 7 8 9 10
Reactor R1 R1 R1 R1 R1 R1 R2 R2 R2 R2Temperature (�C) 700 700 700 750 800 850 800 850 800 850Fuel to air ratio (k) 0.25 0.3 0.35 0.3 0.3 0.3 0.3 0.3 0.3 0.3Fuel M2 M2 M2 M2 M2 M2 M1 M1 M3 M3
Table 6Basic gasification settings.
Experiment No 1 2 3 4 5 6 7 8 9 10
Fuel feeding rate (kg h�1) 2.8 2.8 2.8 2.8 2.8 2.4 0.2 0.2 0.2 0.2Air demand (nm3 h�1) 2.2 2.7 3.1 2.7 2.7 2.4 0.19 0.19 0.19 0.19Bed material (kg) 3 3 3 3 3 3 2 2 2 2
0.0
0.5
1.0
1.5
2.0
2.5
3.0
3.5
4.0
4.5
5.0
0
2
4
6
8
10
12
14
16
18
20
15:36 15:50 16:04 16:19 16:33
Fuel
fee
ding
rat
e, k
g/h
Syng
as, v
ol.-
%dr
y
CO2 CO H2 CH4 Fuel
Fig. 7. Real-time syngas composition at test conditions: 700 �C and 0.25 fuel-to-airratio (R1).
G. Dunnu et al. / Fuel 93 (2012) 273–283 279
GC–MS and gravimetric analyses are presented in Fig. 8. The GC–MS tars reflect more the lighter and relatively low boiling tars,while the gravimetric reflects the heavier tar compounds. This isdue to the limitations of the different methods. As there are GC tarsin the gravimetric tars and vice versa, a balance has to be made forthe actual total tar concentration [30]. In a case where the GC tar ingravimetric tar is unknown, it can be assumed that the gravimetrictar is the theoretical minimum of the total tar concentration, andthe sum of GC and gravimetric tars is the total maximum tar con-centration [31]. From the GC–MS, the two main identifiable com-pounds forming the larger parts of the tar were toluene andnaphthalene. For a real application such as gas turbine power pro-duction, tar cracking or removal prior to utilisation need to be em-ployed to remove the heavier species of tars.
4.2. Bed material and fly ash characterisation
Observations made with SEM/EDS on the bed material after theend of the experiments revealed the presence of various larger par-ticulates of different dimensions and shapes. The most representa-tive ones are discussed hereafter. The SEM pictures on Fig. 9a andthe SEM cross section in Fig. 9b show the variability of larger par-ticulates parts found in the obtained bed material during the gas-ification tests 7 & 8 of the material M1 (as received Stabilat�).Round shaped objects with a diameter ranging between 0.5 mm(point 1 on Fig. 9a) to 2 mm were very characteristic. EDS analysisrevealed that these are pieces of glass consisting mainly from Siand appear to remain unaffected at the end of the experiment.However, glass pieces of the same dimension range, with quartzsand glued on them, covering them entirely (Fig. 10a) or partly(Fig. 10b) were also found.
Table 7Summarised gas quality results.
Experiment No 1
H2 % 4.1CO % 6.6CO2 % 17.0CH4 % 2.5C2H4 % 2.2C2H6 % 0.17C3H6 % 0.43C3H8 % 0.01C4H10 % 0.128HCl(g) mg Nm�3 61.1Tars (GC/MS) g Nm�3 12.59Tars (Gravimetric analysis) g Nm�3 4.75NCV with grav. Tar (napthalene assumed) MJ Nm�3 4.45NCV with GC/MS Tars (napthalene assumed) MJ Nm�3 4.70NCV (tar free) MJ Nm�3 4.26
Fig. 11 shows typical examples of other larger bed ash. Morespecifically:
� Stainless steel wires (90% Fe) from 2 to 7 mm (Fig. 11a)� Small pieces of bone of 50 lm wide and 150 lm long (Fig. 11b)
consisting mainly of 58% Ca and 22% of P.� Aluminium pieces (90%) 1 mm wide and around 2 mm long
(Fig. 11c)� Unidentified pieces (35% Ca, 32% Si and 8,5% Al) with size of 1–
2 mm (Fig. 11d)� Larger pieces 2–4 mm consisting of 34% Ca, 24% Cl, 15% K, 8% Fe,
6% Al (Fig. 11e).
2 3 4 5 6
3.3 2.1 4.5 5.4 7.26.9 6.5 6.8 6.6 7.516.1 15.4 16.5 16.7 16.91.9 1.3 2.2 2.3 3.01.6 1.0 1.8 1.7 1.70.10 0.04 0.09 0.05 0.030.21 0.07 0.10 0.04 0.020.01 0.00 0.00 0.00 0.000.08 0.03 0.06 0.03 0.0256.8 60.0 47.6 37.6 –10.29 3.76 11.21 10.55 10.243.97 1.94 4.99 5.29 5.643.51 2.47 3.86 3.81 4.483.71 2.52 4.04 3.94 4.573.35 2.39 3.67 3.60 4.25

0
3
6
9
12
15
700 °C @ 0,25 700 °C @ 0,3 700 °C @ 0,35 750 °C @ 0,3 800 °C @ 0,3 850 °C @ 0,3
Configurations
g/Nm3
Grav. Tar Unidentified Toluol Naphtalene Indene Phenanthrene Phenol
Fig. 8. Results of gravimetric tar analysis and GC/MS tar analysis.
Fig. 9. (a) SEM photographs and (b) crossectional photograph of larger particulates accumulated in the fluidised bed inventory during the gasification of Stabilat� as received(tests 7&8).
Fig. 10. (a) SEM photographs of glass pieces from the bed material with quartz sand glued (a) entirely and (b) partially.
280 G. Dunnu et al. / Fuel 93 (2012) 273–283
� Char of threadlike pieces of around 1–2 mm long, composedmainly of C (Fig. 11f)
Only a few agglomerated particles were found in the bed mate-rial from the experiments performed at 850 �C. A methodology formonitoring any sudden de-fluidization by recording the constantpressure difference levels across the bed [9] revealed no such prob-lem during the experiments. Particles of the quartz sand togetherwith fuel’s ash were found in conglomerates of sizes from around
200 lm to 1 mm shaped like the one depicted in Fig. 12a. A closerview of these particles is shown on the SEM picture in Fig. 12b. EDSAnalyses on the 3 points noted, showed Ca, Cl and Si for points 1and 2 proving that the melting occurred due to the influence ofCl, while point 3 is the sand fraction (mainly Si).
The melted fraction of the bed ash had a low mobility withinand was detained into these small agglomerates which in a realapplication could be removed together with the bed ash from thebottom of the bed.

Fig. 11. SEM/EDS photographs of (a) wire, (b) bone, (c) aluminium, (d), (e), and (f) unidentified pieces accumulated in the bed inventory.
Fig. 12. SEM/EDS photographs of an agglomerate in (a) full view and (b) zoomed in ash glueing sections where EDS analyses were performed.
G. Dunnu et al. / Fuel 93 (2012) 273–283 281
At the end of each experiment, ash from the cyclones and thebed material where weighted. It was estimated that more than90% (wt) of the ash is retained in the bed. Proximate and ultimateanalyses from the fly ash obtained at the cyclones were performedthat showed a 10% carbon content of unconverted char material in
the fly ash. Identifiable char fly ash particles were very small in therange of 1 lm (Fig. 13) that easily escape the bed before being con-verted completely. This problem in real applications needs to betackled with more carefully designed fluidised bed vessel possiblyoperating at slightly higher temperatures, and at the same time

Fig. 13. SEM/EDS photographs of ash particles in magnitudes of (a) 10 lm and (b) 5 lm.
282 G. Dunnu et al. / Fuel 93 (2012) 273–283
securing larger residence times, with a mild flow regime. A specialsection of gas cleaning employed would have to be able to separatethe un-reacted char and return it back to the gasification vesselwithout returning most of the inorganic matter.
5. Conclusions
The Stabilat� material showed to be a very promissing fuel forgasification applications. The main findings are:
Syngas quality based of the tests at reactor R1: From the energypoint of view, two configurations, fuel-to-air ratio (k) equals 0.25 ata temperature of 700 �C and k equals 0.3 at a temperature of850 �C, yielded the gases with the highest energy contents (approx.4.3 MJ Nm�3). However, on the basis of fuel-to-syngas conversionefficiency, the configuration with the highest efficiency (64.4%)was achieved at 850 �C and k equals 0.3.
The concentrations of HCl measured in the syngases showed ahigh of 61 mg Nm�3 (700 �C, k = 0.25) and a low of 37.6 mg Nm�3
(800 �C, k = 0.3). Furthermore, tar concentrations based on GC–MSanalysis showed a high of 12.6 g Nm�3 at k equals 0.25 at 700 �Cand a low of 3.76 g Nm�3 at k equals 0.35 at 700 �C. For gravimetrictars, a high of 5.64 g Nm�3 occurred at the configuration k equals0.3 at 850 �C and a low of 1.94 g Nm�3 at k equals 0.35 at 700 �C.
For a real application such as gas turbine power production, tarcracking or removal prior to utilisation need to be employed to re-move the heavier species of tars.
Feeding problems based on reactor R1: There were difficultiesachieving constant feeding. For solving this the fuel was grindedto particle sizes less than 5 mm, The problem was not solved en-tirely because the resulting material was light causing bridge for-mation into the silos; however these fluctuations did not haveany direct impact on the syngas quality. Thus, the compositionsof the syngas were relatively constant which is attributed to thegood mixing of fuel and bed material, but also long residence timeof the fuel particles in the bubbling bed.
Bed agglomeration based on reactors R1 and R2: No loss of flu-idisation occurred up to temperatures of 850 �C. Inspections of thebed material and ash material revealed that some agglomerates arepresent due to melting of glass particle while very low amounts ofash and original bed material conglomerates appeared in the ash.In all cases these did not cause any severe problems to the process.After the accumulation of some agglomerated particulates theseclusters become inert and do not grow to larger problematic sizes.
Acknowledgments
The experiments presented in this paper are funded by theEuropean Commission within the 7th Framework Programme (Pro-ject: Polystabilat; Contract TREN/FP7/EN219062).
References
[1] Directive 2001/77/EC of the European parliament and of the council of 27September 2001 on the promotion of electricity produced from renewableenergy sources in the internal electricity market OJ L 283; 27.10.2001. p. 33–40.
[2] Council Directive 1999/31/EC of 26 April 1999 on the landfill of waste. OJ L182, 16.7.1999. p. 1–19.
[3] Herhof GmbH. <http://www.herhof.com>, date of access: 10.08.2010.[4] Basu Pr. Combustion and Gasification in Fluidised Beds. FL USA: CRC Press;
2006.[5] Higman C, van de Burgt M. Gasification. 2nd ed. Oxford: Elsevier; 2008.[6] Bridgewater AV, Toft AJ, Brammer JG. A techno-economic comparison of power
production by biomass fast pyrolysis with gasification and combustion. RenewSustain Energy Rev 2002;6:181–248.
[7] McKendry P. Energy production from biomass (part 3): gasificationtechnologies. Bioresour Technol 2002;83:55–63.
[8] Abatzoglou N, Milne TA, Evans RJ. Biomass gasifier ‘‘Tars’’ their nature,formation, and conversion, NREL/TP-570-25357; 1998.
[9] Fryda LE, Panopoulos KD, Kakaras E. Agglomeration in fluidised bedgasification of biomass. Powder Technol 2008;181(/3):307–20.
[10] Thermoselect SA. <http://thermoselect.com> [accessed 10.08.10].[11] Heininger W. Skepticism from Hanau Opponents Proves True: Karlsruhe
Thermoselect Garbage Oven on the Verge of Closing Completely. [inGerman: Die Skepsis der Hanauer Gegner bestätigt sich. KarlsruherThermoselect-Müllofen droht endgültiges Aus] Frankfurter Rundshau; 29July 2003.
[12] Baldas B. Closure Threatens the Karlsruhe Garbage Miracle. [in German: DemKarlsruher Mo9llwunder droht das Aus.], Die Tageszeitung; 28 October 2003[Germany].
[13] Article in: Süddeutsche Zeitung [Munich, Germany]. The End for Thermoselect[Aus für Thermoselect]; 5 March 2004.
[14] Article in: Frankfurter Allgemeine Zeitung [Frankfurt, Germany], No Future forThermoselect [Keine Zukunft für Thermoselect]; 3 March 2004.
[15] Stahl K, Neergaard M. IGCC power plant for biomass utilisation, värnamoSweden. Biomass Bioenergy 1998;15/3:205–11.
[16] Stahl K, Waldheim L, Morris M, Johnson U, Gardmark L. Biomass IGCC inVärnamo, Sweden – past and future, GCEP Energy Workshop, Frances C.Arrillaga Alumni Center, Stanford University, CA, USA; 27 April 2004.
[17] Ajax energy from waste project. Existing waste problem. Proposed wastesolution; 2006. <http://www.ene.gov.on.ca/envision/env_reg/er/documents/2006/Ajax%20Overview.pdf>.
[18] University of California Riverside. Contractor’s Report to the Board. Technologyevaluation and economic analysis of waste tire pyrolysis. Gasification andliquefaction; 2006.
[19] Kwant K. Status of gasification in the IEA bioenergy gasification activity; March2001.
[20] Thermal methods of municipal waste treatment, a Biffaward Programme onSustainable Resource use. C-Tech Innovation Ltd.; 2003. <http://www.hm-treasury.gov.uk/media/9/A/Thermal_Methods_mass_balance.pdf>.
[21] Palonen J, Nieminen J, Berg E. Thermie demonstrates biomass CFB gasifier atLahti. Mod Power Syst 1998;18(2):37–41.
[22] Palonen J, Anttikoski T, Eriksson T. The Foster Wheeler gasification technologyfor biofuels: refuse-derived fuel (RDF) power generation. Foster wheeler.<http://www.fwc.com/publications/tech_papers/files/TP_PC_06_05.pdf.>.
[23] Wilèn C. Review of Waste Processing Technology for SRF, for IEA Bioenergyagreement – task 36, VTT Processes, Espoo; 2004.
[24] CEN. TS 15443 Solid recovered fuels – methods for laboratory samplepreparation. European Committee for Standardization CEN, Brussels; 2006.
[25] CEN. TS 15404 Solid recovered fuels – methods for the determination of ashmelting behavior by using characteristic temperatures. European Committeefor Standardization CEN, Brussels; 2006.
[26] Dunnu G, Maier J, Scheffknecht G. Ash fusibility and compositional data ofsolid recovered fuels. Fuel 2009. doi:10.1016/j.fuel.2009.09.008.

G. Dunnu et al. / Fuel 93 (2012) 273–283 283
[27] CEN. TS 15412 Solid recovered fuels – methods for the determination ofmetallic aluminium; 2006.
[28] Neeft JPA et al. Guideline for sampling and analysis of tar and particles inbiomass producer gases. V3.3 V2. European Commission; 2004.
[29] Hasler P et al. Testing of a sampling train with a liquid quench system for tarsand particles from biomass gasifiers. Bundesamt für Energie Schweiz; 2000.
[30] Brage C, Sjöström K. An outline of R&D work supporting the Tar Guidline. KTH,Sweden; 2002.
[31] Kübel M, Teerbildung und Terrkonversion bei der Biomassevergasung –anwendung der nasschemischen Teerbestimmung nach CEN-Standard.Dissertation IFK Universiaet Stuttgart; 2007.
Copyright © 2022 FDOKUMEN