The SAPRIN Report: An assessment of the empirical analysis ...
27
The SAPRIN Report: An assessment of the empirical analysis supporting main conclusions Espen Villanger Siegfried Pausewang Alf Morten Jerve WP 2003: 2
-
Upload
khangminh22 -
Category
Documents
-
view
3 -
download
0
Transcript of The SAPRIN Report: An assessment of the empirical analysis ...
The SAPRIN Report: An assessment of the empirical analysis supporting main conclusions
Espen Villanger Siegfried Pausewang Alf Morten Jerve
WP 2003: 2
The SAPRIN Report: An assessment of the
empirical analysis supporting main conclusions
Espen Villanger Siegfried Pausewang
Alf Morten Jerve
WP 2003: 2
Chr. Michelsen Institute Development Studies and Human Rights
CMI Reports This series can be ordered from: Chr. Michelsen Institute P.O. Box 6033 Postterminalen, N-5892 Bergen, Norway Tel: + 47 55 57 40 00 Fax: + 47 55 57 41 66 E-mail: [email protected] www.cmi.no Price: NOK 50 ISSN 0805-505X ISBN 82-8062-047-8 This report is also available at: www.cmi.no/public/public.htm Indexing terms Structural adjustment programme Assessment SAPRIN World Bank Ghana Bangladesh Ecuador © Chr. Michelsen Institute 2003
1 TERMS OF REFERENCE AND BACKGROUND ...............................................................................1
2 SOME GENERAL COMMENTS ON METHODS ................................................................................3
3 SOME GENERAL COMMENTS ON ANALYSIS ................................................................................6
4 THE EMPIRICAL FOUNDATIONS OF SOME MAIN CONCLUSIONS: GHANA, BANGLADESH AND ECUADOR.........................................................................................................................8
4.1 GHANA.......................................................................................................................................................8 4.2 BANGLADESH ..........................................................................................................................................11 4.3 ECUADOR.................................................................................................................................................12 4.4 CONCLUSIONS.........................................................................................................................................15
5 SOME COMMENTS ON THE SAPRI PROCESS ............................................................................. 16
6 REFERENCES .............................................................................................................................................. 18 Persons interviewed........................................................................................................................................ 19
1
1 Terms of Reference and Background
This paper was commissioned by the Norwegian Ministry of Foreign Affairs (MFA) primarily to serve as an input into the Norwegian public and parliamentary debate on the main findings of the SAPRIN report.1 Our paper has been written in English to be accessible to a wider audience.
In 1996, the World Bank and a network of non-governmental organizations (SAPRIN) started cooperating on an evaluation of 15 years of structural adjustment programs (SAPs)2 and seven countries were selected for closer scrutiny (Bangladesh, Ecuador, Ghana, Hungary, Mali, Zimbabwe and Uganda). Each of the governments also contributed to the work, and this tripartite evaluation is known as the Structural Adjustment Participatory Review Initiative (SAPRI).3 In each country there was a steering committee with representatives of all three parties, deciding on methodology, selection of staff, groups to include, and topics to focus.
The main approach was to be participatory, mainly by arranging a series of public hearings in each of the countries on selected topics pertaining to the SAPs, and by collecting information and views from individuals and local non-governmental groups. In addition, the country teams reviewed relevant literature and carried out their own field studies to verify findings. In each country an Open Forum was organized in which the final results were presented and debated publicly. Subsequently, the results from all country studies were debated in a ”Global Forum” in Washington D.C. in July 2001, which marked the end of the formal cooperation between SAPRIN, the World Bank and the governments. In the following year, SAPRIN produced their own report based on the SAPRI work, in which they also included two additional country studies (from Mexico and El Salvador). In the following we refer to this report as the “SAPRIN Report”, and the country reports as “SAPRI country studies”. The background of this paper is the criticism raised with respect to the scientific quality of the SAPRIN Report. Critics have pointed out discrepancies between the conclusions drawn in the report and acknowledged scholarly research. While this in itself would not invalidate the analytical outcome of the SAPRI process, several critics have hinted at selective use and even manipulation of publicly available statistical data to fit preconceived conclusions.
1 SAPRIN = Structural Adjustment Participatory Review International Network (see www.saprin.org). 2 By structural adjustment program (SAP), we mean a multi-year program of market-oriented changes in economic policies implemented by the government to increase growth, with the financial backing of international financial institutions and donor agencies. 3 In Zimbabwe, the government backed out of the process and individual World Bank employees and Government ministries continued the process.
2
We were asked by MFA to look at some of the material in the report to give a professional assessment of the methodology and empirical analysis underpinning important conclusions in the SAPRIN Report with respect to the social and economic effects of SAPs. It was not possible within the time available to do this on a broad and systematic basis, and we have limited ourselves to comment on the analysis of economic trends and levels of poverty in three countries (Bangladesh, Ecuador and Ghana) and the attribution of causality to the SAPs. Broadly speaking, two types of scientific criticism may be valid, focusing on research methods and analysis respectively: – Are the methodologies used adequately explained and with explicit
references to which data derive from what data collection methods or sources? Deficiencies in this regard pose problems for other researchers to test and build upon the findings of the study.
– Has the analysis of causality, which in general is extremely challenging in the social sciences, been adequately documented both with respect to its theoretical foundations and empirical analysis?
We find deficiencies in all the reports when measured against such academic standards, but do recognize that these reports have been written with a different audience in mind and with the purpose of stimulating a political rather than academic debate. We have, therefore, also contacted a few persons, scholars and advocacy activists, to get more information on the process, and to elicit their assessment of its validity. Discrepancies in conclusions from various sources do not necessarily mean that one side must be wrong, given the scale and complexity of the issues at hand. Moreover, the SAPRIN Report should also be viewed as a contribution to the debate on how to formulate policies for reducing poverty and as yielding evidence on the importance of public support of these policies. In our assessment below we have attempted to make two types of fairly simple “quality check”, being less concerned with formal criteria of academic rigor: – Firstly, are the findings and conclusions presented in the SAPRIN Report
with respect to trends and changes in poverty indicators corroborated when we compare them with poverty indicators in SAPRI country studies, standard reference literature and public statistics?
– Secondly, are the inferences about the causality and attributed effects of SAP plausible given other major factors that have impacted on the countries’ economies in the period concerned?
3
2 Some general comments on methods
There exists a broad consensus on the advantages of combining qualitative and quantitative methods.4 In addition, participatory methods that give a voice to those being studied have been accorded increasing emphasis as a supplement to traditional socio-economic poverty research, see for example World Development Report 2000/2001 and the three “Voices of the Poor” books (World Bank 1999, 2000, 2002). The SAPRI country studies combine qualitative, quantitative and participatory methods, and the general methodology lies well within the contemporary research paradigm and best practice for poverty research. This includes interviews with selected focus groups, search conferences with NGO representatives, descriptive statistics, and regression analyses using available household data. Below is a brief overview of which conclusions may be drawn from each of the methods used in the SAPRI country studies:
Participatory reviews: Conclusions from participatory appraisal techniques, workshops and focus-group discussions are usually not representative beyond the actual participating group. Hence, any results derived from these methods need to refer to which sample provided the conclusions, and ideally, how this sample was chosen (i.e. whether there were elements of self-selection into the sample or representative organizations were chosen, and so on). Statistics: Descriptive statistics could be used to display poverty rates over years for a country, or comparing unemployment before and after a SAP. However, the conclusions from such an exercise do not say anything about causality and one should be cautious in explaining impact based on these methods (Bherman and Srinivasan 1995). Note also that the data frequently contains measurement errors, especially the data used for deriving poverty rates (consumption/income data from household surveys, see Deaton 1997). Econometrics: This research yields the correlation between variables in a data set. Probable causality is then suggested from the results in combination with an economic theoretical model. Measurement error and data contamination may bias the results. Conclusions are representative for a larger population when sample selection is properly conducted by the standard random procedure.
The SAPRI country studies have received criticism of their use of statistical information, see for example World Bank (2001c). However, if the main
4 See http://www.people.cornell.edu/pages/sk145/papers/QQZ.pdf for an overview and discussion of ”best practice”.
4
objective of the country studies is to bring forward a “voice of the poor” and the experiences of vulnerable groups in light of SAP, then a lack of proper statistical inference or background material need not invalidate the main conclusions. If the analysis pretends to explain aggregate trends, however, the methodological requirements are greater, as stated in the SAPRI Ecuador report: “The causality linkages coming from participatory workshops, which display the explanations given by social actors to their experience of structural adjustment, were tested, contrasted, and complemented with the views that stem from the work of economists and representatives of the productive sector” (SAPRI Ecuador p.1). For this combination (often referred to as triangulation) of methods to work, it is important that the study attributes the findings to the right source. If a forum of NGOs representing the poor agrees on a causal relationship between a policy and an outcome, this source must be referenced. It is not sufficient to display the agreement from the forum as a general valid conclusion of the actual relationship.
We find that the SAPRI country studies are usually explicit in attributing the suggested causality between SAP and economic and social outcomes to the forum participants’ views when conclusions are drawn from these sessions. Hence, these conclusions are not presented necessarily to reflect empirical facts for the country as a whole or the total impact of SAP, but rather as important information to policy makers on how important groups experience SAP.
The methodology of the SAPRIN Report is less rigorous. Claiming to be based on the SAPRI work (see front page of the SAPRIN Report), we would expect that the conclusions in the report would not deviate much from the conclusions in the country studies, but we find that the source of many of the claims in the SAPRIN Report is not revealed to the reader. This pertains to conclusions such as: “In many countries the benefits of export growth went primarily to the multinational corporations at the cost of domestic producers” (p.37); and “In the 1980s, exports of manufactured goods declined more than 40%, from US$626 million in 1980 to US$367 million in 1990. This drop in Ecuadorian manufactured exports, an important impact stemming from adjustment policies during the decade, occurred within a period in which the world trade of manufactured goods was growing at three times the pace of trade in primary products” (p.38).
The last statement above assigns the cause of the change to the SAP. Generally, it is a severe problem in a report trying to synthesize a multi-methodological approach that we are too often left to guess which method and sources lie behind the conclusion. In this particular example, it is worth noting that the SAPRI Ecuador study does not support such causality, but merely displays the export figures of manufactured goods and ascribes the decline to SAP without any justification or reference.5
5 See section 3 for a discussion of other reasons for this decline, for example drought, floods and economic crisis.

5
The frequent lack of reference to methodology in the SAPRIN Report is particularly troublesome because we need to know if the results presented stem from participatory research, from descriptive statistics, from econometric work, or a combination of methods. This is not to say that the conclusions are wrong, but only that the SAPRIN Report cannot be evaluated as a scientific document.
6
3 Some general comments on analysis
At the outset, we want to underline that there is broad agreement on the SAPs in the 1980s taking too little account of the potential negative impact on the poor of the short-term consequences of the programs (Lipton and Ravallion 1995). From the end of the 1980s, the economic reform programs did increasingly incorporate measures to protect poor and vulnerable groups, and currently most economic reform programs include safety nets and measures targeted at poverty alleviation. To evaluate the effects of the reforms and impacts on the poor one must proceed with great caution given the scale and complexities of the processes involved. One of the most critical factors in impact evaluation is to what extent it is possible to say something about the counterfactual, i.e. what the result would be without the program. Since the counterfactual is not observable, this is always a very difficult task. In particular, when trying to evaluate SAPs the conditions of a country at the starting point of the reforms are critical. Some countries were in severe economic crisis, others struggling with the transition from centrally planned systems to market economies, and others attempting to boost economic growth from a fairly solid foundation. Given the initial conditions when the SAP was initiated, the question becomes how to attribute any change in poverty to the program versus other factors. If poverty has increased, is that due to the economic crises, or to SAP? Or could it be that other factors like world recession, declining export prices or natural disasters such as floods, drought or earthquakes were more important? Since it is not possible to observe the counterfactual, i.e. the outcome without SAP, care has to be taken in attributing causal relations between the program and poverty trends for countries already in economic difficulties before reform. A second critical point when evaluating the impact of SAPs is that one must decide on the time frame for measurement. Given that SAP is meant to create long-run benefits, and almost always has short-run costs for at least some people, then the timing of the judgement may influence the conclusion. Consider the privatization and splitting up of a large inefficient parastatal monopoly. In this case, one would expect that the immediate impact would be negative for a large number of workers losing their jobs. However, if efficiency is achieved in the longer term, increased production and lower prices may imply more revenue for the government and cheaper products for the consumers. A third point is that evaluating the impact of SAP requires a measurement of the degree of implementation of the policies in the reform. We note the difficulties this involves because of the complexity of the programs and the large number of specific, technical instruments. Moreover, the literature finds that SAP policies are frequently not implemented (see for example the bank’s own evaluation in World Bank 1992, Mosley et al. 1995 and Collier 1997). Despite this, the World Bank has continued disbursing funds. So, using
7
disbursement as an indicator of a country implementing SAP policies may yield severe flaws in the analysis. Finally, we must take account of diversity in outcomes. Although researchers agree upon the correlation between economic trends and poverty – i.e. that poverty declines in times of economic growth and increases in times of recession – it does not follow that growth will always reduce poverty, even if economic growth has reduced poverty in the past and stagnation most often hurts the poor (Lipton and Ravallion 1995). Identical policy reforms and programs would have different effects in different countries. Take liberalization of trade, for example. This would normally change relative prices: some products get more expensive, while others get cheaper. The impact on the poor is then dependent on which products they produce and consume. If the poor produce the products that get more expensive (cheaper) and consume those that become cheaper (more expensive), we would expect a reduction (increase) in poverty. More realistically, some groups of poor may benefit while others lose from the policy change. The argument of those promoting SAP has then been that those who lose must be compensated. We note that the World Bank, in principle, has accepted that no one should be worse off as a consequence of its projects and programs, and that a human rights approach maintains that each individual has a right to rehabilitation in case of adverse effects from planned development. But it proves difficult to put such noble principles into practice (Jerve 1998, p. 65).
8
4 The empirical foundations of some main conclusions: Ghana, Bangladesh and Ecuador
In this section we shall review some of the main conclusions of the SAPRIN Report, and compare these with the SAPRI country studies and empirical material from other sources. The SAPRIN Report’s main focus is on the “problems, dislocations and increased poverty and inequities generated by economic adjustment policies…” (pp.16-17), and in Chapter 9 it identifies “four basic ways in which adjustment policies have contributed to the further impoverishment and marginalization of local populations, while increasing economic inequality.” These four ways are: – trade liberalization and reform of the financial sector have led to higher
unemployment and a loss of income (p.174); – agricultural reform has increased poverty and rural marginalization
(p.176); – labor market reforms and privatization have reduced wages (pp.179-80);
and – privatization, user fees and the reduced role of the state have resulted in
fewer people having access to public services, which in turn has increased poverty (p.182).
Since “higher unemployment and loss of income” and “reduced wages” in practice imply higher poverty rates, the main conclusion from the above is that different parts of SAP have increased poverty. Moreover, it is claimed that “poverty and inequality is far more intense and pervasive than they were 20 years ago…” (p.185). In the following we shall discuss these conclusions by examining more closely poverty trends in each of the three countries and possible causes of these trends.
4.1 Ghana6 There are several explanations for Ghana’s negative growth rate during the 1970s and early 1980s. One of the most important factors in a country where agriculture is the largest sector was the 1975-77 droughts. This had a severe negative impact on food production, which declined by 18% during the 1970s. A second explanation for the economic decline may be attributed to the emergence of widespread corruption and moral decline after the implementation of a rigid import license scheme and high taxes around 1975 (World Bank 2001d). The high level of corruption also weakened most state institutions, and Ghana experienced an emigration of educated people to other countries. A third key explanation for the poor economic performance seems to have been the deterioration in the terms of trade in 1981-83. In this latter period of worsening terms of trade, GNP declined by 4.6% annually, the average inflation rate was 76%, and there were large fiscal and current
6 If no reference is given in the text, then the data on Ghana is taken from Corbo and Fisher (1995) in Handbook of Development Economics, which is one of the most recognized reference works within development economics.
9
account deficits. In 1983, Ghana initiated its first SAP as a response to several years of crisis. Despite the decline in the international price of Ghana’s main export commodity (cocoa) in the period 1987-89, we find an average GNP growth rate of 4% from 1983 to 1990.7 Inflation was reduced from 142% in 1983 to 20% in 1991, real wages increased, and both exports and imports increased annually by 15% in the same period (1983-90). As a result of increasing income and the provision of social services, poverty fell during the last period of the 1980s, but this achievement may also be a result of the separate governmental program initiated to protect the poor from the negative effects of SAP.8 In 1990, the economic performance worsened due to a drought, an increase in oil prices and a 26% drop in the terms of trade. Indicators for the later part of the 1990s, however, point in the same direction as in the last half of the 1980s. Data for the period 1992/93 to 1998/99 yield a picture of less poverty, even if the reduction is not evenly distributed over geographical regions (Ghana Statistical Services 2000). The share of persons living below the poverty line was reduced from 52% to 40% in that period (World Bank 2001e), and a 10% increase in primary school enrollment during the 1990s is reported (Ghana Statistical Services 2000). At the same time, life expectancy increased and access to safe water improved (World Bank 2001e). Given the severe problem of poverty in Ghana, and that the main objective of the SAPRI project is to contribute to an understanding of the “relationship between economic policy reforms and the generation of poverty” (SAPRIN p.173), it is surprising that poverty trends are not analyzed in the SAPRI Ghana study.9 A simple before and after appraisal, as is frequently conducted in the other SAPRI reports, would have indicated a possible positive causal relationship between SAP and reduction in poverty. Still, the SAPRIN Report draws firm conclusions regarding the negative effects on the poor of SAP, claiming that:
“Virtually all the principal adjustment measures have had profound effects on small-farm food production and the cost of food. … Rising food prices have hit the poor in Ghana, for example, very hard in an environment marked by increasing layoffs and stagnating wages.” (SAPRIN p. 179).
We note that SAPRI Ghana does not provide evidence supporting this conclusion. It does not evaluate the impact of rising food prices on the poor and provides no analysis of the effects of SAP on food prices. The only claims regarding food prices in SAPRI Ghana are found on pages 38-39: 7 The average annual population growth was 2.6% in the same period. 8 The program is named the Ghanaian PAMSCAD, ”Programme of action to mitigate the social costs of adjustment”, see World Bank (1990). 9 The choice of issues to study was the result of a participatory process, see SAPRI Ghana p.13.
10
“One of the known negative effects of mining is the high cost of living within communities near mining locations. All the indices - food, accommodation …have a price tag beyond the reach of the average person. Two main factors are responsible for the high cost of living in Tarkwa. First, there is the disparity in incomes in favour of mining company staff whose remuneration is indexed to the dollar. Secondly, the mining industry has withdrawn a significant percentage of the labour force from agriculture and other income-earning activities by taking farmland away and holding out the false promise of employment. ”
These assertions must stem from participatory research, but SAPRI Ghana does not reveal their sources to us. On the issue of winners and losers from changes in agricultural prices, it is widely recognized that the impact on the poor depends on whether they are net producers or consumers of food (Deaton 1997). The lack of thorough analysis is also evident in SAPRI Ghana’s treatment of employment. A survey presented in the SAPRI Ghana study documents that 51% of the companies in the sample increased their employment after the SAP was implemented in 1983 (SAPRI Ghana p.25). The study does not give any figures on total employment. The study also reports from participatory research marked improvements in employment in their sample of sectors:
“The indicators involving changes in employment, production output, market and enterprise growth were used to assess the sectoral performance. Production and employment is quite impressive for all these sub-sectors, except that of textiles.”
When the SAPRIN Report asserts that a result of SAP has been an increase in unemployment (SAPRIN, table of contents and p.174), this seems to be based on misreading of SAPRI Ghana or, alternatively, other non-documented sources. Or worse, it can be seen as deliberate omission of findings that point in the opposite direction from what seems to be the desired conclusion. We conclude from this assessment that: – Several indicators point towards a reduction in poverty in Ghana after
SAP. Using a simple before and after SAP appraisal for Ghana might not support the general SAPRIN conclusion that SAP increased poverty. We question why a poverty analysis for Ghana was omitted.
– The SAPRIN conclusion that rising food prices have hit the poor in Ghana has no support in the SAPRI Ghana report.
– It is not possible to draw any conclusion about a linkage between SAP and employment based on the SAPRI Ghana report. Moreover, findings that point towards increased employment after SAP are omitted in the SAPRIN conclusion.
11
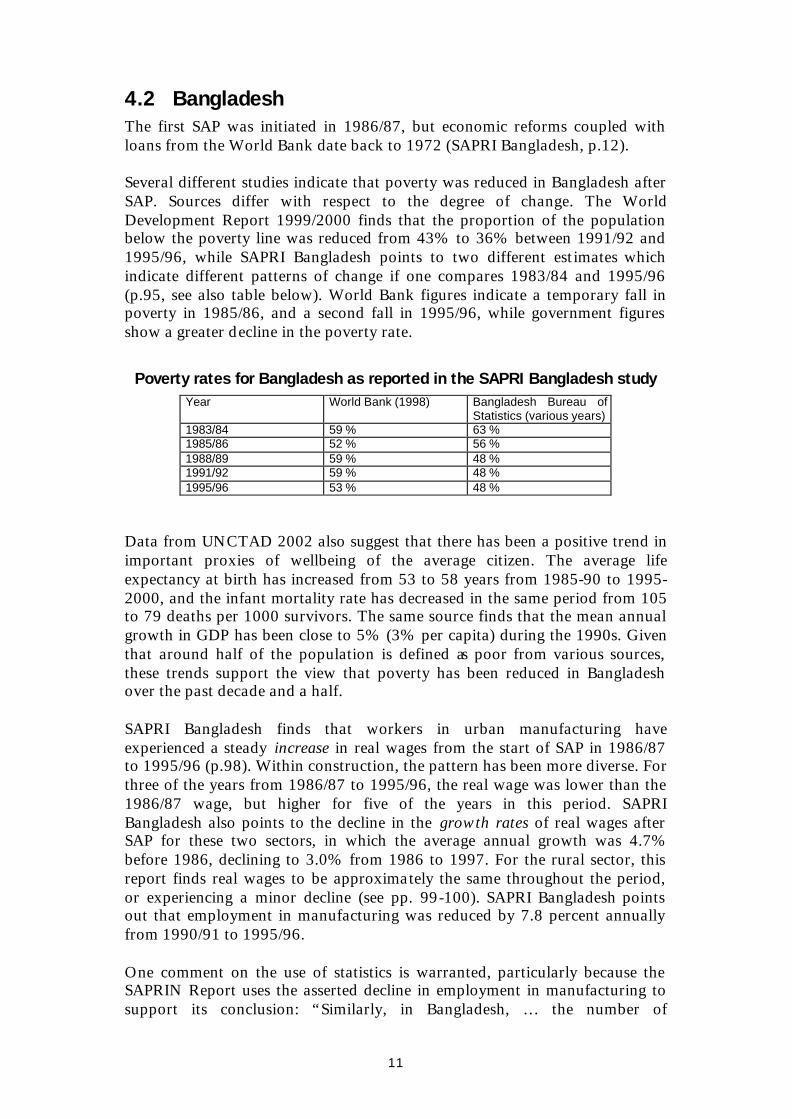
4.2 Bangladesh The first SAP was initiated in 1986/87, but economic reforms coupled with loans from the World Bank date back to 1972 (SAPRI Bangladesh, p.12). Several different studies indicate that poverty was reduced in Bangladesh after SAP. Sources differ with respect to the degree of change. The World Development Report 1999/2000 finds that the proportion of the population below the poverty line was reduced from 43% to 36% between 1991/92 and 1995/96, while SAPRI Bangladesh points to two different estimates which indicate different patterns of change if one compares 1983/84 and 1995/96 (p.95, see also table below). World Bank figures indicate a temporary fall in poverty in 1985/86, and a second fall in 1995/96, while government figures show a greater decline in the poverty rate.
Poverty rates for Bangladesh as reported in the SAPRI Bangladesh study Year World Bank (1998) Bangladesh Bureau of
Statistics (various years) 1983/84 59 % 63 % 1985/86 52 % 56 % 1988/89 59 % 48 % 1991/92 59 % 48 % 1995/96 53 % 48 %
Data from UNCTAD 2002 also suggest that there has been a positive trend in important proxies of wellbeing of the average citizen. The average life expectancy at birth has increased from 53 to 58 years from 1985-90 to 1995-2000, and the infant mortality rate has decreased in the same period from 105 to 79 deaths per 1000 survivors. The same source finds that the mean annual growth in GDP has been close to 5% (3% per capita) during the 1990s. Given that around half of the population is defined as poor from various sources, these trends support the view that poverty has been reduced in Bangladesh over the past decade and a half. SAPRI Bangladesh finds that workers in urban manufacturing have experienced a steady increase in real wages from the start of SAP in 1986/87 to 1995/96 (p.98). Within construction, the pattern has been more diverse. For three of the years from 1986/87 to 1995/96, the real wage was lower than the 1986/87 wage, but higher for five of the years in this period. SAPRI Bangladesh also points to the decline in the growth rates of real wages after SAP for these two sectors, in which the average annual growth was 4.7% before 1986, declining to 3.0% from 1986 to 1997. For the rural sector, this report finds real wages to be approximately the same throughout the period, or experiencing a minor decline (see pp. 99-100). SAPRI Bangladesh points out that employment in manufacturing was reduced by 7.8 percent annually from 1990/91 to 1995/96. One comment on the use of statistics is warranted, particularly because the SAPRIN Report uses the asserted decline in employment in manufacturing to support its conclusion: “Similarly, in Bangladesh, … the number of
12
manufacturing jobs has nearly halved since the reforms were instituted” (SAPRIN p.174). The employment figures in manufacturing seem to have been influenced by a switch to a new definition of labor force introduced in 1989. If the large registered growth in manufacturing in the period from 1992 to 1996, which amounted to 48.3 %, is correct then the decline in employment in the same sector is not very plausible (World Bank 2001c). So even if we do not know which figure is the best approximation of the true pattern, this incompatibility should have been discussed in both the SAPRI Bangladesh and SAPRIN Reports. Moreover, since the conclusions in SAPRI Bangladesh are based on a comparison of data before and after 1989, they are likely not to be valid because of the different definitions of labor force (see SAPRI Bangladesh pp.45-48). With regards to the SAPRIN conclusions that trade and financial sector liberalization led to increased unemployment (p.174), one should also note that the increase of employment in other sectors more than compensated for the asserted decrease in manufacturing. For the country as a whole, employment increased by 2.2% annually in this period (SAPRI Bangladesh, table 8.5, p.99), while the average annual growth rate of the population amounted to 1.6 % in the 1990s (UNCTAD 2002). Moreover, SAPRI Bangladesh (table 4.10, p. 46) notes that while the labor force increased by 3.6 million workers from 1990-91 to 1995-96, the unemployment rate was not much affected: it increased by 0.5 % (that is, 0.4 million workers), implying that a net 3 million jobs were created in the period. We conclude from our assessment that: – Based on existing studies, including SAPRI Bangladesh, poverty is reduced
in Bangladesh after the SAP, although moderately. – Existing work, including SAPRI Bangladesh, agrees that wages and
employment for the population as a whole have increased after SAP. – The SAPRIN Report is not supported by SAPRI Bangladesh in asserting
that SAP has increased poverty and reduced wages and employment, if we confine ourselves to a simple before and after appraisal.
4.3 Ecuador The discovery of large oil and natural gas deposits in the 1960s resulted in rapid economic growth and a structural change in the Ecuadorian economy. New social benefits and entitlements were implemented, and the economy became more and more dependent on the oil price. So when the collapse of the oil price occurred in the early 1980s, Ecuador was no longer able to sustain its debt service payments. Thrown into a deep macroeconomic and structural crisis, the Ecuadorian government turned to its first SAP at the beginning of the 1980s. The real international oil price is an important factor for all economic studies of this economy after 1960, especially for SAPRI Ecuador because it focuses on the period 1980 to 1997, when the oil price fluctuated considerably. Since it is widely recognised that the exceptionally low oil prices in the 1990s had a
13
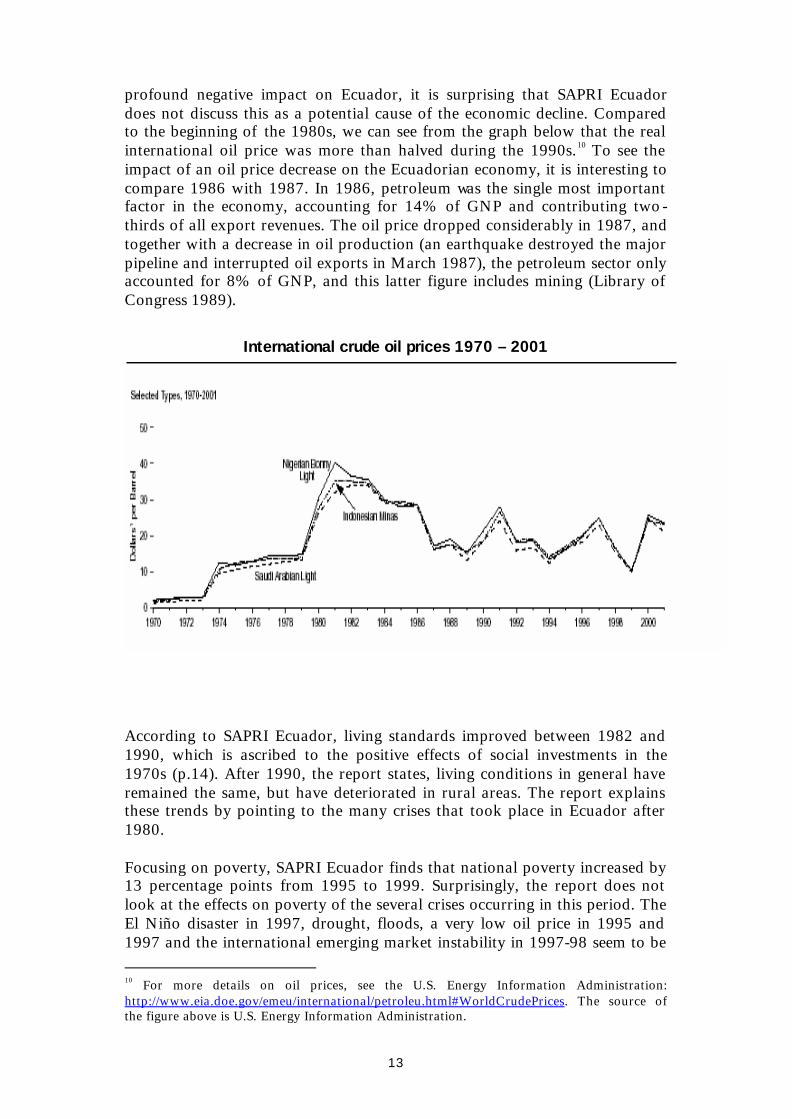
profound negative impact on Ecuador, it is surprising that SAPRI Ecuador does not discuss this as a potential cause of the economic decline. Compared to the beginning of the 1980s, we can see from the graph below that the real international oil price was more than halved during the 1990s.10 To see the impact of an oil price decrease on the Ecuadorian economy, it is interesting to compare 1986 with 1987. In 1986, petroleum was the single most important factor in the economy, accounting for 14% of GNP and contributing two-thirds of all export revenues. The oil price dropped considerably in 1987, and together with a decrease in oil production (an earthquake destroyed the major pipeline and interrupted oil exports in March 1987), the petroleum sector only accounted for 8% of GNP, and this latter figure includes mining (Library of Congress 1989).
International crude oil prices 1970 – 2001
According to SAPRI Ecuador, living standards improved between 1982 and 1990, which is ascribed to the positive effects of social investments in the 1970s (p.14). After 1990, the report states, living conditions in general have remained the same, but have deteriorated in rural areas. The report explains these trends by pointing to the many crises that took place in Ecuador after 1980. Focusing on poverty, SAPRI Ecuador finds that national poverty increased by 13 percentage points from 1995 to 1999. Surprisingly, the report does not look at the effects on poverty of the several crises occurring in this period. The El Niño disaster in 1997, drought, floods, a very low oil price in 1995 and 1997 and the international emerging market instability in 1997-98 seem to be
10 For more details on oil prices, see the U.S. Energy Information Administration: http://www.eia.doe.gov/emeu/international/petroleu.html#WorldCrudePrices. The source of the figure above is U.S. Energy Information Administration.
14
important explanatory variables of the increase in poverty in the latter half of the decade.11 Natural disasters have a huge impact on poverty in Ecuador mainly because of poor peoples’ dependence on agriculture, but also because the economy in general is dependent on the foreign currency generated by primary agricultural commodity exports (shrimps, bananas and cacao). Other sources point out that the political chaos in the country has contributed to a withdrawal of foreign investors (Yearbook of Latin America 1998). We find that the annual growth of GNP per capita has been close to zero (-0.1% to - 0.2 %) from 1980 to 1997. However, even if there is a broad agreement on a disappointing growth and economic poverty record, other indicators of quality of life not mentioned in SAPRI Ecuador suggest a more balanced picture. Ecuadorians managed to reduce the under-five mortality rate by 60% from 1980 to 1997 (World Development Report 1999/2000),12 and average life expectancy increased by 9 years from 1980-85 (61 years) to 1990-95 (70 years).13 UNDP’s Human Development Index also suggests that Ecuador has experienced progress on the social dimensions of poverty. This index rose from 0.485 (1970) to 0.775 (1996), which implies substantial improvements in health and education. SAPRI Ecuador asserts that:
“During the period analyzed, the growth of unemployment, self employment and precarious employment is mostly due to the contraction of production that stems from the implementation of structural adjustment policies. The growth of poverty and the worsening of living conditions have increased sharply as a consequence of the current growth model, which fosters a stronger concentration of wealth and cannot generate enough new jobs. Although unemployment and poverty do stem from long-term historical processes, our research shows clearly that the growth model associated with structural adjustment policies has only deepened them, demonstrating its unfeasibility.”
We read the quoted conclusion as summing up the participatory findings of the main text of SAPRI Ecuador. Then the conclusion is valid, but the precise source of the above quotation should have been included. This does not imply, however, that SAPRI Ecuador has found a causal relationship between poverty and SAP, but only that some group has claimed that SAP has “deepened” poverty. We conclude from our assessment that: – The study has not provided evidence of SAP increasing poverty in Ecuador.
Any study trying to explain the causes behind the increased poverty levels in recent times must take into account the possible impact of the
11 Note also that the GNP was reduced by 7.3 % in 1999, which in itself predicts growing overall poverty. It is asserted that poverty has doubled in the past 5 years (U.S. Department of State 2001). 12 In 1980, the under-five mortality rate was 101 per 1000, in 1997 it was 39 per 1000. 13 World Bank (2001b).
15
international price fluctuation in the export commodities of Ecuador, as well as the economic crisis and natural disasters that occurred in the period.
– Other indicators of quality of life suggest a more balanced picture of living standards in Ecuador than economic figures alone. These indicators are not mentioned in SAPRI Ecuador.
4.4 Conclusions In our review of the Ghana, Bangladesh and Ecuador studies we have found evidence from a scientific point of view of two types of weakness, which relate to description of trends and analysis of causality. Trends. There is a tendency to depict trends in poverty as being more severe than what generally is supported by available statistics. This may be attributed to the fact that participatory methods have generated the bulk of the empirical data collected in the SAPRI process. This is of course valid information, but its source and its representativity ought to have been better documented in the reports. Causality. Neither the SAPRI country studies nor alternative data sources support the conclusions in the SAPRIN Report that SAP caused increased poverty and unemployment in the three countries concerned. Existing data for Ghana and Bangladesh indicate that poverty was reduced and social indicators improved during the period of study, despite a history of severe crisis both before and during the SAP. The major causes of the poor performance of Ecuador, especially in recent times, are probably related to the large external shocks.
16
5 Some comments on the SAPRI process
The criticism above does not rule out a causal relationship between SAP and observable trends in poverty increase or reduction, for that matter, only that the analyses presented do not convincingly explain the mechanisms involved. It may be advisable to distinguish between the SAPRIN Report and the SAPRI process. Dr. Helmut Asche, Lead Economist for the Africa Section of GTZ, argued that the SAPRI process has highlighted the continuing problem of poverty in developing countries, in spite of twenty years of structural adjustment, and that almost nowhere were the envisaged growth rates achieved. The World Bank has accepted its main findings, but is unresolved as to where to go from here. It might entail substantial adjustment in economic policies which would be highly controversial. It is fair to say that the so-called Washington consensus on economic policies has yet to come up with a coherent response to what constitutes a pro-poor policy agenda. This was amply demonstrated in the recent ABCDE conference in Oslo (June 2002). The scientific weaknesses of the SAPRIN Report notwithstanding, its contribution to the international development policy discourse must be assessed in this wider perspective. The SAPRI work has given important information on how vulnerable groups and NGOs in poor countries themselves experience SAP. This has important implications for the design of economic reform programs, most notably to win public support for the desired measures. The SAPRI process is definitely unique in many ways. It brought together people from high and low – local people from different groups affected by SAP with politicians, World Bank researchers, government representatives, and independent researchers. It attempted to give a voice to the disadvantaged and victims of harsh reform measures. According to central actors in the SAPRI process whom we consulted, the process emphasized qualitative approaches. It wanted to give voice to those who normally are not heard in the SAP processes, as a complement to the research conventionally done by the Bank. It collected thousands of witness accounts and personal experiences. To some degree at least, it succeeded in “infusing the economic policy debate with local knowledge” (SAPRIN p.15). And it integrated qualitative and quantitative methods of research in a large effort at gathering data from widely different sources.
We are astonished that the report does not dwell more on presenting the wealth of experience collected, but instead bears the characteristics of an argument with the World Bank. It argues on figures and general trends, and follows their jargon. More emphasis on the “voices of the people” could have made it a report on “structural adjustment seen from below”, and could have avoided much of the well founded criticism raised. This approach would
17
probably better reflect the SAPRI process, and be a more effective complement to World Bank reports, rather than an argument with them. As it is, the report suffers from the weaknesses of a “counter-report”, instead of documenting the wealth of information derived from a rich and unique process. This is why we believe it is essential to distinguish the SAPRIN Report from the SAPRI process. Note, however, that official statistics are not off limits for challenge and criticism. SAPRIN has challenged the World Bank and volunteered to provide the contact points for a process designed to confront World Bank staff (and government officials) with the “view from below” on structural adjustment. In our opinion, the SAPRI process attempted to discover the losers from SAP, and it demonstrates that national average figures can hide the negative effects of the program on some affected groups. They may be minorities, and their losses may be outweighed by gains in other sectors, and for more people. But they are not negligible for that reason.
18
6 References
Behrman and T.N Srinivasan (1995): “Policy Reform, Stabilization, Structural Adjustment and Growth”, in Handbook of Development Economics, part 9, Introduction in Vol. 3b. Elsevier, Amsterdam. Collier, Paul. (1997): “The Failure of Conditionality”, in C. Gwin and J. Nelson (eds.), Perspectives on Aid and Development, Overseas Development Council. Corbo and Fisher (1995): ”Structural Adjustment, Stabilisation and Policy Reform: Domestic and International Finance”, in Handbook of Development Economics, part 9, Introduction in Vol. 3b. Elsevier, Amsterdam. Deaton, Angus (1997): The Analysis of Household Surveys. A Microeconometric Approach to Development Policy. Baltimore MD and London: Johns Hopkins University Press. Ghana Statistical Services (2000): “Poverty Trends in Ghana in the 1990s”. Jerve, Alf Morten (1998): “ Social Consequences of Development in a Human Rights Perspective. Lessons from the World Bank”. Human Rights in Development: Yearbook 1998. Den Haag: Kluwer, p. 35-66. Library of Congress (1989): “Ecuador: A Country Study”, Federal Research Division, Washington, D.C. Lipton and Ravallion (1995): ”Policy and Policy” in Behrman and Srinivasan (1995), Handbook of Development Economics, Vol. 3b, Elsevier, Amsterdam. Mosley, P., J. Harrigan and J. Toye (1995): Aid and Power: The World Bank and Policy Based Lending. Routledge. SAPRI Bangladesh (2001): SAPRI Bangladesh country report. SAPRI Ecuador (2001): “The Social and Economic Impacts of Structural Adjustment Policies in Ecuador 1982-1999, Executive Summary”. SAPRI Ghana (2001): SAPRI Ghana Country Report. SAPRIN report (2002): “The Policy Roots of Economic Crisis and Poverty. A Multi-Country Participatory Assessment of Structural Adjustment”. UNCTAD (2002): “The Least Developed Countries Report 2002. Escaping the Poverty Trap”, UN publications, New York. U.S. Department of State (2001): “Country Background Note: Ecuador”, http://www.state.gov/r/pa/ei/bgn/2906.htm U.S. Energy Information Administration (2002): http://www.eia.doe.gov/emeu/international/petroleu.html#WorldCrudePrices World Bank (1990): “Adjustment Lending Policies for Sustainable Growth”, Policy and research paper series, paper 14, World Bank, Washington D.C. World Bank (1992): “World Bank Structural and Sectoral Adjustment Operations: The Second OED Review,” Operations Evaluation Department Report no. 10870, World Bank, Washington D.C.
19
World Bank (1999): “Voices of the Poor. Can anyone hear us?”, Oxford University Press, New York. World Bank (2000): “Voices of the Poor. Crying out for Change”, Oxford University Press, New York. World Bank (2001a): ” Bangladesh 2001 Country brief”, mimeo, Washington DC. World Bank (2001b): “Ecuador Country Assistance Evaluation”, Report No. 21825, Operations Evaluation Department, Washington D.C. World Bank (2001c): “Comments on the Draft Synthesis Report on the Bangladesh SAPRI Research”, World Bank Dhaka office. World Bank (2001d): Aid and Reform in Africa. World Bank, Washington D.C. World Bank (2001e): Adjustment from Within. Lessons from the Structural Adjustment Participatory Review Initiative. World Bank, Washington D.C. World Bank (2002): “Voices of the Poor. From Many Lands”, Oxford University Press, New York and World Bank, Washington. World Development Report 1999/2000 (2000): “Entering the 21st Century”, Oxford University Press, New York. World Development Report 2000/2001(2001): Attacking Poverty, Oxford University Press, New York. Yearbook of Latin America (1998) [In Norwegian]:Latin-Amerikaårboka 1998, Solidaritet forlag.
Persons interviewed Dr. Helmut Asche Lead Economist, Africa Region, GTZ (Gesellschaft für technische Zusammenarbeit) Eschborn, Germany Telephone interview Aug. 26 Meeting Aug. 27 Anne Katrin Schneider WEED (World Economy, Ecology and Development) Berlin Telephone interview Aug. 27 and Sept. 2 Doug Hellinger Development Gap, Washington, D.C. (one of the initiators of the SAPRIN initiative) Telephone interview Sept. 4 and Sept. 8 Prof. Fantu Cheru, The American University, Washington D.C.
Summary In 1996, the World Bank and a network of non-governmental
organizations (SAPRIN) started cooperating on an evaluation of 15
years of structural adjustment programs (SAPs). The background of
our paper is the criticism raised with respect to the scientific quality
of the summary report produced by the SAPRIN network. We make
two types of fairly simple “quality checks” of their conclusions.
Firstly, are the findings and conclusions presented in the
SAPRIN Report with respect to trends and changes in poverty
indicators corroborated when we compare them with poverty
indicators in the underlying country studies, standard reference
literature and public statistics? We find a tendency to depict trends
in poverty as being more severe than what generally is supported by
available statistics. This may be attributed to the fact that
participatory methods have generated the bulk of the empirical data
collected in the SAPRI process. This is of course valid information,
but its source and its representativity ought to have been better
documented in the reports.
Secondly, are the inferences about the causality and
attributed effects of SAP plausible given other major factors that
have impacted on the countries’ economies in the period concerned?
Neither the country studies nor alternative data sources support the
conclusions in the SAPRIN Report that SAP caused increased
poverty and unemployment in the countries concerned. Existing data
for Ghana and Bangladesh indicate that poverty was reduced and
social indicators improved during the period of study, despite a
history of severe crisis both before and during the SAP. The major
causes of the poor performance of Ecuador, especially in recent
times, are probably related to the large external shocks.
The scientific weaknesses of the SAPRIN Report
notwithstanding, its contribution to the international development
policy discourse must be assessed in a wider perspective. The work
has given important information on how vulnerable groups and
NGOs in poor countries themselves experience SAP. This has
important implications for the design of economic reform programs,
most notably to win public support for the desired measures.
ISSN 0804-3639 ISBN 82-8062-044-3
Recent Working Papers WP 2001: 15 SKAAR, Elin Judicial independence and human rights policies in Chile and Argentina. Bergen, 2001, 24 pp. WP 2001: 16 TJØNNELAND, Elling N. Rainbow justice and peace building. South Africa 1994-2001. Bergen, 2001, 11 pp. WP 2001: 17 ANDVIG, Jens Chr., Odd-Helge Fjeldstad and Amit Shrivastava Corruption: Critical assessments of contemporary research. Report from a multidisciplinary workshop. Bergen, 2001, 29 pp. WP 2001: 18 ANDVIG, Jens Chr. and Odd-Helge Fjeldstad (eds.) Research on corruption in Bangladesh, Nepal, Sri Lanka, Tanzania and Uganda. What who and where? Bergen, 2001, 19 pp. WP 2002: 1 GRANBERG, Per Updating the IO based Macmod functions. Bergen, 2002. WP 2002: 2 GRANBERG, Per An analysis of Tanzania’s 1998 imports. A sector of origin and end use analysis of Tanzania’s good imports, undertaken for the Macmod model. Bergen, 2002. WP 2002: 3 FJELDSTAD, Odd-Helge Fighting fiscal corruption: The case of the Tanzanian Revenue Authority. Bergen, 2002, 15 pp. WP 2002: 4 ISAKSEN, Jan Energy cooperation in Southern Africa: What role for Norway? Report from the Seminar on Regional Energy Co-operation, Luanda 12-14 February 2002. Bergen, 2002, 66 pp. WP 2002: 5 TOSTENSEN, Arne Urban dimensions of donors’ poverty-reduction strategies. Bergen, 2002, 17 pp. WP 2002: 6 FJELDSTAD, Odd-Helge The fight against corruption and the role of parliamentarians. Bergen, 2002, 10 pp. WP 2002: 7 SUMAILA, Ussif Rashid and Joseph Apaloo A selected survey of traditional and evolutionary game theory. Bergen, 2002, 14 pp. WP 2003: 1 KOLSTAD, Ivar The evolution of social norms. Bergen, 2003, 14 pp.
A complete list of publications, CMI’s Annual Report and CMI’s quarterly newsletter are available on CMI’s homepage www.cmi.no. For priced publications: Surface mail (B-economique) free with prepared orders. For airmail (A-prioritaire) outside the Nordic counries add 20%. Three easy ways to pay: Cheque, issued in Norwegian kroner Post office giro, paid by International Giro: 0808.5352661 SWIFT: DNBANOBB, Den norske Bank no: 5201.05.42308 Order from: Chr. Michelsen Institute PO Box 6033, Postterminalen, N-5892 Bergen, Norway Fax: +47 55574166, Phone: +47 55574000 E-mail: [email protected]