AN EMPIRICAL EVALUATION OF THE PERFORMANCE OF TRAMO/SEATS ON SIMULATED SERIES
Upload
khangminh22Category
view
1download
0
EMPIRICAL EVALUATION OF THE STEYN-BOERS
STRUCTURAL MODEL OF PSYCHOLOGICAL WELL-
BEING AT WORK
thesis presented in partial fulfilment of the requirements for the degree of
MCOMM (PSYCH)
INDUSTRIAL PSYCHOLOGY
AT
THE UNIVERSITY OF STELLENBOSCH
MARITSA BOERS
SUPERVISOR: DR G GöRGENS

i
DECLARATION
By submitting this thesis electronically, I declare that the entirety of the work contained
therein is my own, original work, that I am the sole author thereof (save to the extent
explicitly otherwise stated), that reproduction and publication thereof by Stellenbosch
University will not infringe any third party rights and that I have not previously in its entirety or
in part submitted it for obtaining any qualification.
Signed: Maritsa Boers Date: February 2014
Copyright © 2014 Stellenbosch University
All rights reserved
Stellenbosch University http://scholar.sun.ac.za

ii
ABSTRACT
This study recognised the importance of well-being of employees in today’s turbulent
working environment. It departed from the notion that the sustainability of organisations is
determined by the quality of its workforce and therefore employee well-being is a major
priority. The well-being of employees is not a random occurrence, but rather a complex
phenomenon. Any attempt to influence or change the well-being of employees should be
grounded in a firm understanding of the complexity of the well-being phenomenon.
Steyn (2011) developed a Salotogenic Model of Occupational Well-being in an attempt to
depict how positive psychological variables can be combined in a dynamic depiction of the
nomological net of variables underlying the phenomenon of well-being in the workplace. The
rationale for her study was that state-like Optimism and Self-efficacy will have a significant
and direct positive effect on their Occupational Well-being, partly because of these
psychological resources’ ability to foster positive expectations about the future, and partly
because of the heightened sense of Organisational Commitment and Work Engagement
facilitated by higher levels of Optimism and Self-efficacy.
As a first adaption to the Steyn (2011) study, this study attempted to explicate the arguments
that motivated the adaption and expansion of the original Steyn (2011) Salutogenic Model of
Occupational Well-being, into the Steyn-Boers Structural Model of Psychological Well-being
at Work. Set within the theoretical frameworks of Positive Organisational Behaviour (POB),
the Broaden-and-Build theory (Fredrickson, 2001), as well as Hobfoll’s (1989) Conservation
of Resource (COR) theory, the focus in this study was on explicating the nomological net
ofariables underlying Subjective Well-being (SWB) and Psychological Well-Being at Work
(PWBW), as two contemporary constructs well integrated into the Occupational Well-being
literature. SWB was defined as both Hedonic Well-being (HWB) and Eudaimonic Well-being
(EWB). HWB was further defined as Positive Affect (PA) and Negative Affect (NA). Well-
being was contextualised in the work domain with Dagenais-Desmarais and Sovoie’s (2012)
Psychological Well-being at Work (PWBW) construct. Hope, Resilience and Gratitude were
included as additional psychological resources. Work Engagement was retained in the
current study due to its central role in well-being. It was argued that Perceived
Organisational Support (POS) and Psychological Ownership should further translate into
better well-being and were therefore included in this study.
A non-experimental research design (i.e. survey study) was used to explore the relationships
between the various constructs. A convenience sample of 199 respondents was recruited via
a social media network platform, Facebook, (i.e. non probability sampling technique). The
Stellenbosch University http://scholar.sun.ac.za

iii
measurement instruments included were the Positive and Negative Affect Schedule
(PANAS) (Watson, Clark & Tellegen, 1988); Ryff’s (1989) Psychological Well-being Scale;
and the Index of Psychological Well-Being at Work, developed by Dagenais-Desmarais and
Savoie (2012). The four constructs that constitute Psychological Capital (Hope, Optimism,
Self-efficacy and Resilience) were measured with the Psychological Capital Questionnaire
(Luthans, Avey & Avolio 2007a). Gratitude was measured with the Gratitude Questionnaire-
Six-Item form (GQ-6), (McCullough, Emmons & Tsang, 2002) and Work Engagement was
measured with the 9-item Utrecht Work Engagement Scale (UWES-9) (Schaufeli & Bakker,
2003). Perceived Organisational Support was measured by the Perceived Organisational
Support Scale, (Eisenberger, Huntington, Hutchinson & Sowa, 1986) and Psychologocal
Ownership was measured with the Psychological Ownership Questionnaire (Pierce,
O’Driscoll & Coghlan, 2004).
Confirmatory factor analysis (CFA) and item analysis were conducted to evaluate the
reliability and validity of the measurement instruments. SEM was used to fit the structural
model to the data to investigate the extent to which the abovementioned constructs were
significant predictors of SWB and PWBW.
The results of the study revealed that different positive psychological resources predicted
different aspects of well-being. For example, Hope had an indirect effect on both PA and
PWBW, whilst Optimism had a direct effect on EWB and NA, with an indirect effect on PA
and PWBW. Self-efficacy had a direct effect on EWB and Resilience a direct effect on PA.
Optimism, as found in the Steyn (2011) study, thus played a very central role in overall well-
being. Gratitude, although it had no direct effect on any of the well-being constructs, affected
NA, PA, EWB and PWBW indirectly by working mainly through Optimism. Strong support
that Work Engagement and Perceived Organisational Support contribute to the well-being of
employees emerged. Psychological Ownership was the only construct that had no direct or
indirect effect on well-being. It was argued that a possible explanation for this may be that
Psychological Ownership might not be an antecedent to well-being, but rather a dimension
thereof.
The importance of this study was thus condensed in the knowledge that there are certain
important antecedents to the management of PWBW. The results provide a probable
explanation of the complex nomological net of variables and their interrelationships with
each other, which influence Psychological Well-being at Work.
Stellenbosch University http://scholar.sun.ac.za

iv
OPSOMMING
Hierdie studie herken die belangrikheid van werknemer welstand in vandag se ontwrigtende
werksomgewing. Dit het vertrek vanaf die idee dat die volhoubaarheid van organisasies
bepaal word deur die gehalte van sy werksmag en dus is werknemer welstand ‘n belangrike
prioriteit. Die welstand van werknemers is nie ‘n ewekansige gebeurtenis nie, maar eerder ‘n
komplekse verskynsel. Enige poging om die welstand van werknemers te beïnvloed of te
verander, moet gegrond wees in ‘n ferm begrip van die kompleksiteit van die welstand
verskynsel.
Steyn (2011) het ‘n Salutogeniese Model van Beroepswelstand ontwikkel in ‘n poging om uit
te beeld hoe positiewe sielkundige veranderlikes gekombineer kan word in ‘n dinamiese
voorstelling van die nomologiese net van veranderlikes, onderliggend aan die verskynsel
van welstand in die werksplek. Die rasionaal vir haar studie was dat Optimisme en Self-
doeltreffendheid ‘n beduidende en direkte positiewe effek op Beroepswelstand sou hê, deels
as gevolg van die sielkundige hulpbronne se vermoë om positiewe verwagtinge vir die
toekoms te bevorder, en deels as gevolg van die verhoogte gevoel van
Organisasieverbintenis en Werksbetrokkenheid wat gefasiliteer word deur hoër vlakke van
Optimisme en Self-doeltreffenheid.
As ‘n eerste aanpassing tot die Steyn (2011) studie, het hierdie studie gepoog om die
argumente wat die aanpassing en uitbreiding van die oorspronklike Steyn (2011)
Salutogeniese Model van Beroepswelstand tot die Steyn-Boers Strukturele Model van
Sielkundige Welstand by die Werk, te verduidelik. Met inagneming van die teoretiese
raamwerke van Positiewe Organisasie Gedrag (POG), Uitbrei-en-Bou teorie (Fredrickson,
2001) en Hobfoll (1989) se Bewaring van Hulpbronne (BH) teorie, was die fokus van die
studie op die uitspel van die nomologiese net van veranderlikes onderliggende aan
Subjektiewe Welstand (SW) en Sielkundige Welstand by die Werk (SWW) as twee
kontemporêre konstrukte goed geïntegreer in die Beroepswelstand literatuur. SW was
omskryf as beide Hedoniese Welstand (HW) en Eudimoniese Welstand (EW). HW was
verder gedefinieer in terme van Positiewe Affek (PA) en Negatiewe Affek (NA). Welstand is
gekontekstualiseerd in die werk domein met Dagenais-Desmarais en Savoie (2012) se
konstruk van Sielkundige Welstand by die Werk (SWW). Hoop, Veerkragtigheid en
Dankbaarheid is ingesluit as addisionele Sielkundige Kapitaal. Werksbetrokkenheid is in die
huidige studie behou oor sy sentrale rol tot welstand. Dit is aangevoer dat Waargenome
Organisasie Ondersteuning (WOO) en Sielkundige Eienaarskap werkers se welstand verder
sal bevorder en was dus ingesluit in die studie.
Stellenbosch University http://scholar.sun.ac.za

v
‘n Nie-eksperimentele navorsingsontwerp (d.w.s. ‘n vraelys studie) was gebruik om die
verwantskappe tussen die verskillende konstrukte vas te stel. ‘n Gerieflikheidsteekproef van
199 respondente was gewerf via ‘n sosiale media netwerk platvorm, Facebook (d.w.s. ‘n nie
waarskynlikheidsteekproefneming tegniek). Die meetinstrumente het ingesluit die Positiewe
en Negatiewe Affek Skedule (PANAS) (Watson et al., 1988); Ryff (1989) se Sielkundige
Welstand Skaal en die Indeks vir Sielkundige Welstand by die Werk wat ontwikkel is deur
Dagenais-Desmarais en Savoie (2012). Die vier konstrukte waaruit Sielkunidge Kapitaal
bestaan (Hoop, Optimisme, Self-doeltreffendheid en Veerkragtigheid) was gemeet met die
Sielkundige Kapitaal Vraelys-24 (Luthans et al., 2007a). Dankbaarheid was gemeet met die
Dankbaarheid Vraelys–Ses-Item vorm (DV-6) (McCullough et al., 2002) en
Werksbetrokkenheid was gemeet met die 9-item Utrecht Werksbetrokkenheid Skaal (UWBS-
9) (Schaufeli & Bakker, 2003). Waargenome Organisasie Ondersteuning is gemeet deur die
Waargenome Organisasie Ondersteuning Skaal (Eisenberger et al., 1986) en Sielkundige
Eienaarskap is gemeet met die Sielkundige Eienaarskap Vraelys (Pierce et al., 2004).
Bevestigende faktorontleding en item analise is gebruik om die betroubaarheid en geldigheid
van die meetinstrumente te evalueer. Strukturele vergelyking modellering was gebruik om
die strukturele model op die data te pas om vas te stel tot watter mate die bogenoemde
konstrukte beduidende voorspellers van SW en SWW is.
Die resultate van die studie het getoon dat die verskillende positiewe sielkundige
hulpbronne, verskillende aspekte van welstand voorspel. Hoop het, byvoorbeeld, ‘n indirekte
uitwerking op beide PA en SWW gehad; terwyl Optimisme n direkte invloed op EB en NA,
met ‘n indirekte effek op PA en SWW getoon het. Self-doeltreffendheid het ‘n direkte invloed
op EB, en Veerkragtigheid ‘n direkte invloed op PA, gehad. Optimisme, soos gevind in die
Steyn (2011) studie, het ‘n baie sentrale rol in algehele welstand gespeel. Alhoewel
Dankbaarheid geen direkte invloede op enige van die welstand konstrukte gehad het nie,
het dit wel ‘n indirekte effek op PA, NA, EB en SWW gehad, meestal deur Optimisme. Sterk
steun het na vore gekom dat Werksbetrokkenheid en Waargenome Organisasie
Ondersteuning tot die welstand van werknemers bydra. Sielkundige Eienaarskap was die
enigste konstruk wat geen direkte of indirekte invloed op welstand gehad het nie. Dit was
geargumenteer dat ‘n moontlike verduideliking hiervoor mag wees dat Sielkundige
Eienaarskap moontlik nie ‘n voorspeller van welstand is nie, maar eerder ‘n dimensie
daarvan.
Die belangrikheid van hierdie studie is dus gekonsentreerd in die wete dat daar sekere
belangrike voorspellers tot die bestuur van SWW is. Die resultate verskaf ‘n moontlike
Stellenbosch University http://scholar.sun.ac.za

vi
verduideliking van die komplekse nomologiese net van veranderlikes en hul onderlinge
verbande met mekaar, wat sodoende Sielkundige Welstand by die Werk beïnvloed.
Stellenbosch University http://scholar.sun.ac.za

vii
ACKNOWLEDGEMENTS
This thesis brings me to the end of my academic journey at the University of Stellenbosch. I
would like to thank all those people who contributed and supported me and thereby made
this thesis possible and an unforgettable experience.
Firstly, I want to give recognition to my Creater – throughout this journey, I was aware of
where my strengths came from. God has given me the opportunity and motivation to
complete this thesis. He has ensured that my journey was filled with supportive and
encouraging people for which I am truly grateful.
I would further like to express my sincere gratitude to my family. Firstly, my parents, Arno
and Elize, thank you for your constant love and support. You have made this dream a
possibility. Thank you to Francois and Sanette for giving me your unequivocal support
throughout this journey. To the rest of my family thank you for always showing your interest
and encouraging me.
This thesis would not have been possible without the help, support and patience of my
supervisor, Dr Gina Görgens. Her support has been invaluable on both an academic and a
personal level, for which I am extremely grateful. I would also like to thank all the staff at the
Industrial Psychology Department for your help throughout my studies and also for those
lecturers who were present at the presentation of my proposal.
I want to thank all my friends for their support and encouragement throughout this journey.
Thank you for your motivation and inspiration; you will never understand what it meant to
me.
Stellenbosch University http://scholar.sun.ac.za

viii
TABLE OF CONTENTS DECLARATION ..................................................................................................................... i
ABSTRACT ............................................................................................................................ii
OPSOMMING ....................................................................................................................... iv
ACKNOWLEDGEMENTS .................................................................................................... vii
LIST OF FIGURES .............................................................................................................. xii
LIST OF TABLES ................................................................................................................ xiii
CHAPTER 1 .......................................................................................................................... 1
INTRODUCTION .................................................................................................................. 1
1.1 INTRODUCTION............................................................................................................. 1
1.1.1 Research aim, question and objectives .............................................................................. 8
1.1.2 Structure of the thesis ........................................................................................................... 9
CHAPTER 2 ........................................................................................................................ 10
THEORETICAL FRAMEWORK OF THIS RESEARCH ....................................................... 10
2.1 INTRODUCTION........................................................................................................... 10
2.2 THE STEYN (2011) SALUTOGENIC STRUCTURAL MODEL OF OCCUPATIONAL
WELL-BEING ...................................................................................................................... 10
2.3 INTRODUCTION TO THE CURRENT STUDY ............................................................. 14
2.4 SUBJECTIVE WELL-BEING AND PSYCHOLOGICAL WELL-BEING AT WORK ......... 14
2.4.1 Outcomes of SWB and PWBW .......................................................................................... 23
2.4.2 Antecedents of SWB and PWBW ...................................................................................... 24
2.5 PSYCHOLOGICAL CAPITAL (PsyCap) ........................................................................ 25
2.5.1 Hope ....................................................................................................................................... 27
2.5.1.1 Hope Defined ................................................................................................................ 27
2.5.1.2 Hope and SWB ............................................................................................................. 29
2.5.1.3 Hope in the Workplace ................................................................................................ 31
2.5.2 Optimism ............................................................................................................................... 31
2.5.2.1 Optimism Defined ......................................................................................................... 31
2.5.2.2 Optimism and SWB ...................................................................................................... 33
2.5.2.3 Optimism in the Workplace ......................................................................................... 36
2.5.3 Self-efficacy .......................................................................................................................... 37
2.5.3.1 Self-efficacy Defined .................................................................................................... 37
2.5.3.2 Self-efficacy and SWB ................................................................................................. 39
2.5.3.3 Self-efficacy in the Workplace .................................................................................... 41
Stellenbosch University http://scholar.sun.ac.za

ix
2.5.4 Resilience .............................................................................................................................. 42
2.5.4.1 Resilience Defined ....................................................................................................... 42
2.5.4.2 Resilience and SWB .................................................................................................... 42
2.5.4.3 Resilience at Work ....................................................................................................... 44
2.5.5 Hope, Optimism, Self-efficacy and Resilience ................................................................ 44
2.6 GRATITUDE ................................................................................................................. 48
2.7 WORK ENGAGEMENT ................................................................................................. 51
2.8 PERCEIVED ORGANISATIONAL SUPPORT ............................................................... 58
2.9 PSYCHOLOGICAL OWNERSHIP ................................................................................. 62
2.10 SUMMARY .................................................................................................................. 65
CHAPTER 3 ........................................................................................................................ 66
RESEARCH METHODOLOGY ........................................................................................... 66
3. 1 INTRODUCTION .......................................................................................................... 66
3.2 RESEARCH PURPOSE ................................................................................................ 66
3.3 RESEARCH AIM, QUESTION AND OBJECTIVES ....................................................... 68
3.4 RESEARCH HYPOTHESES ......................................................................................... 68
3.5 RESEARCH DESIGN AND PROCEDURE .................................................................... 76
3.5.1 Research Design.................................................................................................................. 76
3.5.2 Sampling ............................................................................................................................... 76
3.5.3 Research Participants ......................................................................................................... 77
3.5.4 Data Collection ..................................................................................................................... 78
3.5.5 Data Analysis ........................................................................................................................ 79
3.6 MEASUREMENT INSTRUMENTS ................................................................................ 83
3.6.1 Hedonic Well-Being (HWB) ................................................................................................ 84
3.6.1.1 Descriptive statistics and item analyses ................................................................... 85
3.6.1.2 Confirmatory Factor Analysis ..................................................................................... 85
3.6.2 Eudaimonic Well-Being ....................................................................................................... 89
3.6.2.1 Descriptive statistics and item analyses ................................................................... 91
3.6.2.2 Confirmatory Factor Analysis ..................................................................................... 92
3.6.3 Psychological Well-Being at Work..................................................................................... 95
3.6.3.1 Descriptive statistics and item analyses ................................................................... 96
3.6.3.2 Confirmatory Factor Analysis ..................................................................................... 96
3.6.4 PsyCap-24 ............................................................................................................................ 99
3.6.4.1 Descriptive statistics and item analyses ................................................................. 100
Stellenbosch University http://scholar.sun.ac.za

x
3.6.4.2 Confirmatory Factor Analysis ................................................................................... 101
3.6.5 Gratitude Questionnaire-6 ................................................................................................ 103
3.6.5.1 Descriptive statistics and item analyses ................................................................. 104
3.6.5.2 Confirmatory Factor Analysis ................................................................................... 104
3.6.6 Work Engagement ............................................................................................................. 108
3.6.6.1 Descriptive statistics and item analyses ................................................................. 109
3.6.6.2 Confirmatory Factor Analysis ................................................................................... 109
3.6.7 Perceived Organisational Support................................................................................... 111
3.6.7.1 Descriptive statistics and item analyses ................................................................. 112
3.6.7.2 Confirmatory Factor Analysis ................................................................................... 112
3.6.8 Psychological Ownership .................................................................................................. 114
3.6.8.1 Descriptive statistics and item analyses ................................................................. 114
3.6.8.2 Confirmatory Factor Analysis ................................................................................... 115
3.7 CONCLUSION REGARDING PSYCHOMETRIC INTEGRITY OF THE MEASURMENT
INSTRUMENTS ................................................................................................................ 120
3.8 SUMMARY .................................................................................................................. 121
CHAPTER 4 ...................................................................................................................... 122
RESULTS ......................................................................................................................... 122
4.1 INTRODUCTION......................................................................................................... 122
4.2 SAMPLE CHARACTERISTICS ................................................................................... 122
4.3 ITEM PARCELS .......................................................................................................... 126
4.4 MEASUREMENT MODEL ........................................................................................... 127
4.4.1 Screening the Data ............................................................................................................ 127
4.4.2 Measurement Model Fit .................................................................................................... 128
4.5 STRUCTURAL MODEL .............................................................................................. 141
4.5.1 Evaluating the fit of the Structural Model ....................................................................... 141
4.5.1.1 Fit of the structural model (Original form) ............................................................... 141
4.5.1.2 Interpretation of structural model parameter estimates (original model) ........... 143
4.5.2 Modification of Structural Model (A) ................................................................................ 145
4.5.2.2 Fit of the modified structural model (Model A) ....................................................... 146
4.5.3 Parameter Estimates and Modifications suggested by Model A ................................ 147
4.5.3.1 Fit of the modified structural model (Model B) ....................................................... 151
4.5.4 Parameter Estimates and Modifications suggested by Model B ................................ 153
4.5.4.1 Fit of the modified Structural Model (C) .................................................................. 156
Stellenbosch University http://scholar.sun.ac.za

xi
4.5.5 Parameter Estimates and Modifications suggested by Model C ................................ 158
4. 5.5.1 Fit of the modified Structural Model (Model D) ..................................................... 162
4.5.6 Parameter Estimates and Modifications suggested by Model D ................................ 164
4.5.6.1 Fit of the modified structural model (Model E) ....................................................... 167
4.5.7 Parameter Estimates and Modifications suggested by Model E ................................ 169
4.5.7.1 Fit of the modified structural model (Model F) ....................................................... 172
4.5.8 Parameter Estimates and Modifications suggested by Model F ................................ 174
4.5.9.1 Fit of the modified structural model (Model G) ...................................................... 177
4.5.9 Parameter Estimates and Modifications suggested by Model G ................................ 178
4.6 ASSESSING THE OVERALL GOODNESS-OF-FIT OF THE FINAL MODIFIED
STRUCTURAL MODEL (MODEL H) ................................................................................. 181
4.6.1 Overall fit statistics ....................................................................................................... 181
4.5 SUMMARY .................................................................................................................. 186
CHAPTER 5 ...................................................................................................................... 187
DISCUSSION AND CONCLUSION ................................................................................... 187
5.1 INTRODUCTION......................................................................................................... 187
5.2 BACKGROUND OF THIS STUDY .............................................................................. 187
5.3 DISCUSSION OF RESULTS ...................................................................................... 191
5.3.1 Measurement Model .......................................................................................................... 191
5.3.2 Structural Model ................................................................................................................. 193
5.3.3 Main Findings ..................................................................................................................... 197
5.3.3.1 Psychological Well-being at Work ........................................................................... 198
5.3.3.2 Hedonic Well-being .................................................................................................... 201
5.3.3.3 Eudaimonic Well-being .............................................................................................. 206
5.3.3.4 Structural Model of Psychological Well-being at Work ......................................... 207
5.4 LIMITATIONS OF THIS STUDY .................................................................................. 209
5.6 IMPLICATIONS FOR PRACTICE ............................................................................... 213
5.5 RECOMMENDATIONS FOR FUTURE RESEARCH ................................................... 214
5.7 CONCLUSION ....................................................................................................... 215
REFERENCES ................................................................................................................. 216
Stellenbosch University http://scholar.sun.ac.za

xii
LIST OF FIGURES Figure Number Page
Figure 2.1: Steyn's (2011) Salutogenic Structural Model of Occupational Well-Being 12
Figure 3.1: Steyn-Boers Structural Model of Psychological Well-being at Work 75
Figure 3.2: Measurement model of the PANAS scale (Standardised Solution 86
Figure 3.3: Measurement model of Ryff’s PWB scale (Standardised Solution) 94
Figure 3.4: Measurement model of the PWBW scale (Standardised Solution) 98
Figure 3.5: Measurement model of PsyCap-24 (Standardised Solution) 102
Figure 3.6: Measurement model of the GQ-6 (Standardised Solution) 105
Figure 3.7: Measurement model of the two factor GQ-6 (Standardised Solution) 107
Figure 3.8: Measurement model of the UWES (Standardised Solution) 110
Figure 3.9: Measurement model of the POSS (Standardised Solution) 113
Figure 3.10: Measurement model of the Psych Own Questionnaire before
EFA (Standardised Solution) 116
Figure 3.11: Measurement model of the Psych Own. Questionnaire after the
EFA (Standardised Solution) 119
Figure 4.1 Representation of the fitted measurement model (standardised solution) 129
Figure 4.2: Fitted structural model (Standardised solution) 142
Figure 4.3: Representation of the structural model (Model A) (Standardised solution) 146
Figure 4.4: Representation of the structural model (Model B) (Standardised solution) 152
Figure 4.5: Representation of the structural model (Model C) (Standardised solution) 157
Figure 4.6: Representation of the structural model (Model D) (Standardised solution) 163
Figure 4.7: Representation of the structural model (Model E) (Standardised solution) 168
Figure 4.8: Representation of the structural model (Model F) (Standardised solution) 173
Figure 4.9: Representation of the structural model (Model G) (Standardised solution) 177
Figure 4.10: Representation of the structural model (Final model)
(Standardised solution) 182
Figure 4.11: Steyn-Boers structural model of psychological well-being at work 185
Figure 5.1: Final proposed and tested Steyn-Boers structural model of
psychological well-being 197
Stellenbosch University http://scholar.sun.ac.za

xiii
LIST OF TABLES Table Number Page
Table 3.1: Path coefficient statistical hypotheses 74
Table 3.2: Suggested cut-off values of fit indices demonstrating Goodness-of-Fit
given differential model complexity (Hair et al., 2006) 82
Table 3.3: The means, standard deviation and reliability statistics for the PANAS 85
Table 3.4: Test of Multivariate normality (PANAS) 86
Table 3.5: Goodness of fit statistics for the PANAS measurement model 87
Table 3.6: Rotated factor matrix of the PANAS (free EFA) 88
Table 3.7: Rotated factor matrix of the PANAS (forced EFA) 89
Table 3.8: The means, standard deviation and reliability statistics for the Ryff’s PWB subscales 92
Table 3.9: The mean, standard deviation and reliability statistic for the Ryff’s PWB scale 92
Table 3.10: Test of multivariate normality (Ryff PWB scale) 93
Table 3.11: The Goodness of Fit Statistics for Ryff’s PWB Scale 95
Table 3.12: The means, standard deviation and reliability statistics for the PWBW subscales 96
Table 3.13: The mean, standard deviation and reliability statistics for the PWBW scale 96
Table 3.14: Test of multivariate normality (PWBW scale) 97
Table 3.15: The Goodness of fit statistics for the PWBW scale 99
Table 3.16: The means, standard deviation and reliability statistics for the PsyCap-24 subscales 101
Table 3.17: The mean, standard deviation and reliability statistics for the PsyCap-24 101
Table 3.18:Test of multivariate normality (PsyCap-24) 101
Table 3.19: The Goodness of fit statistics for the PsyCap-24 103
Table 3.20: The means, standard deviation and reliability statistics for the GQ-6 104
Table 3.21: Test of multivariate normality (GQ-6) 104
Table 3.22: The Goodness of Fit Statistics for the GQ-6 105
Table 3.23: Structure matrix of the GQ-6 loading on one factor 106
Table 3.24: Structure matrix of the GQ-6 loading on two factors 107
Table 3.25: The Goodness of Fit Statistics for the GQ-6 revised measurement model 108
Table 3.26: The means, standard deviation and reliability statistics for the UWES-9 109
Table 3.27: The means, standard deviation and reliability statistics for the UWES-9 109
Table 3.28: Test of multivariate normality (UWES-9) 110
Table 3.29: The Goodness of Fit Statistics for the UWES-9 111
Stellenbosch University http://scholar.sun.ac.za

xiv
Table 3.30: The means, standard deviation and reliability statistics for the POSS 112
Table 3.31: Test of multivariate normality (POSS) 112
Table 3.32: The Goodness of Fit Statistics for the POSS 114
Table 3.33: The means, standard deviation and reliability statistics for the Psychological
Ownership Scale 115
Table 3.34:Test of multivariate normality (Psychological Ownership Scale) 115
Table 3.35: The Goodness of Fit Statistics for the Psychological Ownership Scale 116
Table 3.36: Structure matrix of the Psychological Ownership Questionnaire (one factor) 117
Table3.37: Structure matrix of Psychological Ownership Scale (Before item 6 was removed) 118
Table 3.38: Structure matrix of Psychological Ownership Scale (After item 6 was removed) 118
Table 3.39: The Goodness of Fit Statistics for the Psychological Ownership Scale 119
Table 3.40: A summary of the reliability results of the expanded learning potential
questionnaire latent variable scales 120
Table 4.1: Mid-year population estimates for South Africa by population
group and sex, 2013 123
Table 4.2: Sample characteristics in terms of gender, race, age, location and language 124
Table 4.3: Sample characteristics in terms of education, industry and years of service
in organization 125
Table 4.4: Test of multivariate normality of the Measurement Model 127
Table 4.5: The Goodness of Fit for the measurement model CFA 130
Table 4.6: Modification Indices for the lambda-X matrix (Measurement Model) 132
Table 4.7: Modification Indices for the lambda-X matrix (Measurement Model) (CONTINUED) 133
Table 4.8: The unstandardised factor loading matrix for Lambda –X matrix for the
Measurement Model 135
Table 4.9: Completely standardised solution of factor loadings of the fitted measurement model 139
Table 4.10: Phi values of the fitted measurement model 141
Table 4.11: The Goodness of fit statistics for the structural model (Original model) 143
Table 4.12: Structural model unstandardised beta matrix (Original model) 144
Table 4.13: Structural model unstandardised gamma matrix 145
Table 4.14: The Goodness of fit statistics for the modified structural model (Model A) 147
Table 4.15: Structural model unstandardised beta matrix (Model A) 148
Table 4.16: Structural model unstandardised gamma matrix (Model A) 148
Table 4.17: Modified (Model A) structural model modification indices for the beta matrix 150
Stellenbosch University http://scholar.sun.ac.za

xv
Table 4.18: Modified (Model A) structural model modification indices for the gamma matrix 150
Table 4.19: The Goodness of fit statistics for the modified structural model (Model B) 153
Table 4.20: Structural modified model (Model B) unstandardised beta matrix 154
Table 4.21: Structural modified model (Model B) unstandardised gamma matrix 154
Table 4.22: Modified structural model (Model B) modification indices for beta matrix 155
Table 4.23: Modified structural model (Model B) modification indices for gamma matrix 155
Table 4.24: The Goodness of fit statistics for the structural model (Model C) 158
Table 4.25: Structural model (Model C) unstandardized beta matrix 159
Table 4.26: Structural modified model (Model C) unstandardized gamma matrix 159
Table 4.27: Modified structural model modification indices for beta matrix (Model C) 160
Table 4.28: Modified structural model modification indices for gamma matrix (Model C) 160
Table 4.29: The Goodness of fit statistics for the structural model (Model D) 164
Table 4.30: Structural model (Model D) unstandardized beta matrix 165
Table 4.31: Structural modified model (Model D) unstandardized gamma matrix 166
Table 4.32: Modified structural model modification indices for beta matrix (Model D) 166
Table 4.33: Modified structural model modification indices for gamma matrix (Model D) 166
Table 4.34: Goodness of Fit statistics for the modified model (Model E) 169
Table 4.35: Structural model (Model E) unstandardised beta matrix 170
Table 4.36: Structural modified model (Model E) unstandardised gamma matrix 170
Table 4.37: Modified structural model modification indices for beta matrix (Model E) 171
Table 4.38: Modified structural model modification indices for gamma matrix (Model E) 171
Table 4.39: Goodness of Fit statistics for the modified model (Model F) 174
Table 4.40: Structural model (Model F) unstandardized beta matrix 175
Table 4.41: Structural modified model (Model F) unstandardized gamma matrix 175
Table 4.42: Modified structural model modification indices for beta matrix (Model F) 176
Table 4.43: Modified structural model modification indices for gamma matrix (Model F) 176
Table 4.44: The Goodness of fit statistics for the structural model (Model G) 178
Table 4.45: Structural model (Model G) unstandardised beta matrix 179
Table 4.46: Structural modified model (Model G) unstandardised gamma matrix 179
Table 4.47: Modified structural model modification indices for beta matrix (Model G) 180
Table 4.48: Modified structural model modification indices for gamma matrix (Model G) 180
Table 4.49: The Goodness of fit statistics for the structural model (Final model) 183
Stellenbosch University http://scholar.sun.ac.za

xvi
Table 4.50: Completely standardised beta coefficients (Final Model) 184
Table 4.51: Completely standardised gamma coefficients (Final Model) 184
Table 5.1: Decomposition of composite model into measure and structural model components 192
Stellenbosch University http://scholar.sun.ac.za

1
CHAPTER 1
INTRODUCTION
1.1 INTRODUCTION
There is no doubt that the world of work in the 21st century is a completely different world
than in previous eras. Technological advances have paved the way for a number of
changes, including globalisation, the rise of the knowledge worker, as well as the creation of
significantly more niche markets (Davis, 2010). The net result is a highly competitive
marketplace with a strong focus on products and services to meet the needs and
requirements of the consumer. In order to keep up with such a fast paced system, there is
an intensified need for creativity and innovation in all domains of work, as this will ensure the
organisation’s competitive positions in the market. Hence, there is a dire need to capitalise
on the unique intellectual and personal strengths of employees (Davis, 2010; McAdam &
Keogh, 2004; Kanter, 1988).
The sustainability of an organisation is largely determined by the quality of its human
resources. For this reason, organisations make significant investments in recruiting
applicants with the right educational credentials, work experience and talents. From these
applicant pools, important attention is regularly given to selecting the right employees, with
many selection assessments showing strong validity in predicting subsequent work
performance (Harter, Hayes, & Schmidt, 2004; Schmidt & Rader, 1999). While these are
important activities, it is not enough just to hire the right people – organisations need to
maintain such a workforce, ensure they are well, motivated and competent. Human
Resources (HR) justify their existence by committing themselves to pursuing organisational
goals, with the main goal being economic utility. This is achieved through the acquisition and
maintenance of a competent and motivated workforce, as well as the effective and efficient
management of such a workforce (Theron, 2011).
As companies pursue maximum economic utility, they implement practices that attempt to
reduce costs and increase productivity, which often leads to a mentality that favours
profitability over the welfare of its employees (Turner, Barling, & Zacharatos, 2002).
Financially, it would make sense to prioritise the well-being of employees, as their well-being
would contribute to the profitability of the organisation. Better employee well-being will mean
more energy, innovation, creativity, positive competition and also a lack of absenteeism and
medical costs. In this sense, well-being can be seen as a financial investment, which when
managed effectively, will lead to a “high rate on return” (Turner et al., 2002).
Stellenbosch University http://scholar.sun.ac.za

2
The well-being of employees has become a serious and worrisome issue. The enhancement
of psychological well-being at work has been described as one of the most pressing
dilemmas of contemporary times, with institutions globally, identifying health and stress-
induced problems amongst the most frequent stress-related diseases. In addition to its
tremendous social impact, it also poses significant costs related to performance, i.e.
workplace safety, absenteeism and early retirement (Sanderson, Nicholson, Graves, Tilse &
Oldenburg, 2008).
The well-being of employees is not a random occurrence, but rather a complex
phenomenon. Any attempt to influence or change employee well-being should be grounded
in a firm understanding of the complexity of the well-being phenomenon. This presupposes
an understanding of the nomological network of the latent variables which characterises the
person and the perceived environment in which they operate (Theron, 2011). This
information should assist HR and line management to rationally and purposefully affect the
well-being and subsequent work behaviour of employees. Employee psychological health
and well-being could then be regarded as a strategic driver of talent attraction, retention, as
well as individual and organisational performance excellence (Lockwood, 2007). For these
reasons, HR should actively promote positive psychological health and organisational well-
being, as it could assist in harnessing the full potential of the workforce and increase
organisational performance.
However, the management of well-being should not only be geared towards minimising the
incidences of work performance pathology, but it should actively promote employee well-
being. It should thus aim to ensure the optimal functioning of all employees, to motivate them
to strive for self-actualisation (Seligman, 2003). By analogy it can be said that the pendulum
should swing through to the positive side of psychology. It should thus be a “build what’s
right” approach as opposed to the traditional “fix what’s wrong” approach (Seligman, 2003).
It is about going beyond fixing problems into promoting excellence. It is precisely because of
this perspective that the business world needs to turn to the branch of psychology that deals
with human flourishing and human strengths, namely positive psychology (Donaldson & Ko,
2010).
The idea of focusing on the positive side of behaviour, was first introduced by Antonovsky
(1979), and was named, salutogenesis (Latin salus = health, Greek genesis = origin).
Antonovsky (1979) proposed that health, as opposed to the disease should be studied. This
concept was later expanded to not only include health, but also the nature, manifestations
and methods to enhance psychological well-being (Wissing & Van Eden, 1997). Within the
Stellenbosch University http://scholar.sun.ac.za

3
positive framework, the salutogenesis concept has evolved in the Organisational
Behavioural domain into the paradigm of Positive Organisational Scholarship (POS). This
concept is largely concerned with the investigation of positive outcomes, processes and
attributes of organisations and their employees (Luthans & Youssef, 2007). The POS
approach allows researchers to be proactive. That is, instead of focusing on how to correct
problems in a reactive sense, POS aims to study organisations and employees in their most
effective form and then draw conclusions and develop appropriate interventions. Closely
related to POS is Positive Organisational Behaviour (POB). Like positive psychology, POB
does not proclaim to represent some new discovery of the importance of positivity, but rather
emphasise the need for more focused theory building, research, and effective application of
positive traits, states and behaviours of employees in organisations (Luthans & Youssef,
2007). According to Luthans (2002a), POB is interested in “the study and application of
positively oriented human resource strengths and psychological capacities that can be
measured, developed and effectively managed for performance improvement in today’s
workplace” (p.59).
Wright (2003) argued that the mission of POB must also include the pursuit of employee
happiness and health as viable goals in themselves. According to Zwetsloot and Pot (2004),
employee well-being is a business value that is of strategic importance and should be
viewed as an investment rather than a cost or an expense. Based on these two
perspectives, the organisation-centred view of Luthans (2002b) and the employee-centered
view of Wright (2003), an integrated positive business value model of employee health and
well-being can be proposed. This refers to an approach that can be labelled “Integral Health
Management” (Zwetsloot & Pot, 2004) that constitutes a win-win situation for both the
organisation and its employees.
Given these approaches it is argued here that both research and practice must focus on
employees’ strengths and psychological capabilities that will allow them to have a buffer
against negative working conditions. According to Spector (2003), it is well known that
individuals differ in their reactions to various organisational conditions and demands placed
on them. From a positive psychological perspective it could be argued that certain
psychological strengths and characteristics embedded within the individual could decrease
the amount of strain experienced by individuals. For example, research has shown that the
individual level POB characteristics of being hopeful, optimistic, self-efficient and resilient
(together known as the higher-order construct of Psychological Capital, PsyCap; Luthans,
Youssef, & Avolio, 2007) may possibly act a buffer against stress and burnout (Avey, Avolio,
Crossly & Luthans, 2009; Fredrickson, Tugade, Waugh & Larkin, 2003). It is therefore
Stellenbosch University http://scholar.sun.ac.za

4
argued that the prevalence of these constructs in an individual and the development of them
could potentially have an influence on the way employees respond to stress and experience
well-being. This, in turn, may positively affect their work quality, and subsequently the
profitability of the organisation (Herbert, 2011). The development of these strengths and
capabilities would thus assist employees in attaining well-being. This phenomenon can be
explained within the framework of the Broaden-and-Build theory of Positive Emotions
(Fredrickson, 1998, 2001), which provides a valuable framework within which to understand
the functional significance of positive emotions in well-being. Whereas negative emotions
heighten one’s sympathetic activity and narrow one’s attention to support specific action
tendencies (e.g., attack, escape), positive emotions have the potential to supress autonomic
arousal generated by negative emotions and broaden one’s attention, thinking, and
behavioural repertoires. The key proposition of the Broaden-and-Build theory is that certain
discrete positive emotions – including joy, interest, contentment, pride and love – although
phenomenologically distinct, all share the ability to broaden people’s momentary thought-
action repertoires and build their enduring personal resources, ranging from physical and
intellectual resources to social and psychological resources.
Supportive evidence for the Broaden-and-Build theory comes from research demonstrating
that positive emotions produce patterns of thought that are notably unusual, flexible,
creative, integrative, open to information, and efficient. In addition, induced positive emotions
increase one’s preferences for variety and broaden one’s arrays of acceptable behavioural
options. These cognitive effects of positive emotions have been linked to increases in
dopamine levels in the brain, thereby enhancing one’s ability to switch set, or modify and
adjust efforts, rather than fixate on a particular decision rule (Ashby, Isen, & Turken, 1999).
Corroborating research shows that relative to neutral states and negative emotions, low- and
high-activation, positive emotions (e.g., contentment, joy) broaden the scope of an
individual’s visual attention as well as momentary thought-action repertoires (Fredrickson &
Branigan, 2003). By broadening an individual's momentary thought-action repertoire,
whether through play, exploration or similar activities, positive emotions promote discovery
of novel and creative actions, ideas and social bonds, which in turn build that individual's
personal resources (Fredrickson, 2001). Together, these studies provide evidence for
cognitive broadening associated with positive emotions.
Furthermore, according to the theory, positive emotions can momentarily broaden one’s
scopes of thought and allow for flexible attention, which, in turn, can improve one’s well-
being. Over time, and with repeated experiences of positive emotions, this broadened mind-
set might become habitual. By consequence, then, the often-incidental effect of experiencing
Stellenbosch University http://scholar.sun.ac.za

5
a positive emotion results in an increase in one’s personal resources. These resources
function as reserves that can be drawn on in subsequent moments and in different emotional
states (Fredrickson, 2001). Tugade and Fredrickson (2004), for example, found that positive
emotions may fuel psychological Resilience, build psychological Resilience and trigger
upward spirals toward enhanced emotional well-being. Furthermore, the complementary
upward spiral which occurs through both the experience of positive emotions and broadened
thinking is argued to influence one another reciprocally, leading to substantial increases in
emotional well-being over time (Fredrickson & Joiner, 2002; Fredrickson, 2004; Garland,
Gaylord, Boettiger & Howard, 2010). Hence, it is argued that the benefits of giving
prevalence to, as well as promoting and developing positive psychological capabilities within
individuals could hold multiple benefits within the organisational environment (e.g. increased
well-being of employees resulting in better commitment, Engagement and ultimately
performance).
A related theory, which was used as a framework for this study and that should be
considered in conjunction with the Broaden-and-Build theory, is Conservation of Resource
theory (COR; Hobfoll, 1989). The basic tenet of COR theory is that individuals strive to
obtain, retain, protect and foster those things that they value. These valued entities are
termed resources and can be defined as any object, personal characteristic or energy that is
valued in its own right or are valued as a means to attain or protect an ends i.e. other
resources (Diener & Fujita, 1995). Hobfoll (1998) states that psychological stress will occur
when individuals’ resources are threatened with loss, or actual lost, or where individuals fail
to gain sufficient resources following significant resource investment. Two main principles
follow from COR’s central theory. The first principle is The Primacy of Resource Loss
stipulating that resource loss is disproportionally more salient than resource gain. This
means that with equal amounts of loss and gain, loss will have a bigger impact. The other
important principle in this theory is Resource Investment, which proposes that people must
invest resources in order to protect against resource loss, recover from losses and gain
resources. Hobfoll (2001) states that those individuals with more resources are less
vulnerable to resource loss and more capable of coordinating resource gain. On the other
hand those individuals who have fewer resources are more vulnerable to lose their
resources and struggle more to gain resources. In this study the COR theory is important as
it will be utilised to explain why individuals with certain resources will have the ability to
easily acquire other resources. The Resource Investment principle will further be applied to
explain why certain individuals will easily gain resources and also why they can easily
recover from losses.
Stellenbosch University http://scholar.sun.ac.za

6
Steyn (2011) developed a structural model of Occupational Well-being in an attempt to
depict how positive psychological variables can be combined in a dynamic depiction of the
nomological net of variables underlying the phenomenon of Occupational Well-being. Her
study was grounded in the salutogenisis and POS paradigms to elucidate the arguments that
motivated the conceptualisation of the proposed Salutogenic Model of Occupational Well-
Being. The rationale for her study was that state-like Optimism and Self-efficacy would have
a significant and direct positive effect on perceived Psychological Health. The relationships
between Optimism (Life Orientation Test-Revised; Scheier, Carver & Bridges, 1994), Self-
efficacy (General Self-efficacy Scale; Sherer, Maddux, Mercandante, Prentice-Dunn, Jacobs
& Rogers, 1982) and Occupational Health [(measured with the GHQ-28; Goldberg, 1972;
and an adapted version of Diener, Emmons, Larsen and Griffin’s (1985) Satisfaction with
Life Scale] was furthermore hypothesised to be reinforced through indirect associations that
acted through a combination of Work Engagement (measured with the Utrecht Work
Engagement Scale, Schaufeli & Bakker, 2003) and Organisational Commitment (measured
with the Organisational Commitment Questionnaire, Mowday, Porter & Steers, 1979), both of
which was urgued to foster a sense of individual Meaningfulness. She thus proposed that
optimistic and self-efficacious individuals will experience greater levels of health (evident in
better Psychological Health and more Satisfaction with Work-life) than their more cynical
counterparts. It was argued that this was due, partly, because of their ability to foster positive
expectations about the future, and partly because of their heightened sense of Commitment
and Work Engagement facilitated by their higher levels of Optimism and Self-efficacy.
As a first adaption to the Steyn (2011) model, this study focus on explicating the nomological
net of variables underlying Subjective Well-being (SWB) and Psychological Well-Being at
Work (PWBW), as two contemporary constructs well integrated into the Occupational Well-
being literature. SWB is defined as both Hedonic Well-being (HWB) and Eudaimonic Well-
being (EWB). HWB focuses on the experience of maximising pleasure and minimising pain,
where EWB is found in the expression of virtue – doing what is worth doing (Ryan & Deci,
2001). Thus, the distinction is between purely subjective felt needs and objectively valid
needs. Straume and Vittersø (2012) states that HWB is typically experienced when life is
easy or a goal is reached, where EWB is typically experienced when facing challenges or
goal attainment. Rather than focusing on either one of these views on SWB, Ryan and Deci
(2001) followed by other researchers (Keyes, Shmotkin, Ryff, 2002; Keyes & Magyar-Moe,
2003; Lent, 2004), have suggested that it could be optimal to consider SWB as constituting
both these two constructs, since each perspective sheds a different light on the construct of
SWB. Moreover, a recent development in contextualising SWB within the workplace has
Stellenbosch University http://scholar.sun.ac.za

7
been the work of Dagenais-Desmarais and Savoie (2012) with the development of the Index
of Psychological Well-being at Work (IPWBW). According to these authors, traditional HWB
and EWB measures measure the construct of context-free SWB. The construct of PWBW is,
“a construct describing an individual’s subjective positive experience at work, and
compromise five primary Eudaimonic dimensions, namely Interpersonal Fit at Work, Thriving
at Work, Feeling of Competency at Work, Perceived Recognition at Work, and Desire for
Involvement at Work” (Dagenais-Desmarais & Savoie, 2012, p. 676). It is argued that
context-free SWB will lead to higher levels of well-being in the workplace, i.e. higher levels of
PWBW as indicated in the proposed structural model (see figure 3.1). Hence, this construct
will also be included in the adapted Steyn (2011) model, providing a contemporary and
contextualised view of SWB in the workplace.
As a further elaboration and adaption of the Steyn (2011) study, this study propose an
argument which states that positive psychological capital will have a significant and direct
positive impact on employees’ Subjective Well-being in the workplace. PsyCap is an
individual’s positive psychological state of development and includes Self-efficacy (having
confidence to take on and put in the necessary effort to succeed at challenging tasks);
Optimism (making a positive attribution about succeeding now and in the future); Hope
(persevering towards goals and, when necessary, redirecting paths to goals) and Resilience
(when beset by problems and adversity, sustaining and bouncing back and even beyond to
attain success) (Luthans, et al., 2007c). The addition of PsyCap to the original Steyn (2011)
model elaborates the model by the inclusion of Hope and Resilience (as complimentary to
the Optimism and Self-efficacy variables that were included in the original model), as further
positive psychological capabilities that influence well-being. It is further argued in this study
that Gratitude (i.e. a generalised tendency to recognise and respond with grateful emotion to
the roles of other people’s benevolence in the positive outcomes that one obtains) may lead
to higher levels of well-being within an individual (McCullough et al., 2002). Hence, the
model is further elaborated with the inclusion of Gratitude in the nomological net of variables
explaining well-being. As argued in the Steyn (2011) model, Work Engagement, which is a
positive, fulfilling, work-related state of mind characterised by Vigour, Dedication and
Absorption (Schaufeli & Bakker, 2001), can be a product of the expanded repertoire of
positive emotions resulting from the PsyCap variables and Gratitude, when the Broaden-
and-Build theory is applied. The construct of Work Engagement was therefore retained in the
current study.
Social support, according to Cohen (2004) is considered a coping resource in difficult and
demanding situation. Perceived Organisational Support was included in this study as an
Stellenbosch University http://scholar.sun.ac.za

8
emotional and material resource which employees can draw from when handling demanding
situations. POS, according to Eisenberger et al., (1986) is the employees’ perception
concerning the extent to which the organisation values their contribution and cares about
their well-being. POS is nurtured by conditions such a fair treatment, supervisory support,
rewards and favourable job conditions (Rhoades & Eisenberger, 2002). Therefore POS can
be seen as a resource that employees can draw from to increase their well-being within the
workplace. Moreover, the positive emotions experienced by resilient, hopeful, self-efficacious
and optimistic employees that exhibit Gratitude should translate into better interpersonal
relationship in the workplace, further building social networks. It is therefore argued that POS
would influence Work Engagement and SWB through the heightened positive emotions
experienced when good interpersonal relationships translate into emotional and instrumental
support in the workplace. Together with the established support system, it is also argued that
Psychological Ownership (i.e. the authority to make decisions and complete a whole task)
should empower and motivate employees to excel in the work environment. This should
further translate into better well-being. Thus, it is proposed that hopeful, optimistic, self-
efficacious, resilient employees who show Gratitude and are engaged in their work; perceive
organisational support and have ownership in their jobs, will experience greater levels of
SWB, which should translate into better PWBW.
1.1.1 Research aim, question and objectives
This study will consequently draw from the Positive Organisational Behaviour (POB)
paradigm to explain the arguments that motivated the adaption and expansion of the original
Steyn (2011) Salutogenic Model of Occupational Well-being, into the Steyn-Boers Structural
Model of Psychological Well-being at Work. The aim of this study is to attempt to depict the
nomological network of latent variables (presented in figure 3.1) that explains variance in the
underlying psychological processes of PWBW.
In line with the rationale of the study as outlined above, arguments will be proposed
(presented in chapter 2) which states that the four PsyCap variables (Hope, Optimism, Self-
efficacy and Resilience), together with Gratitude and Perceived Organisational Support will
have direct positive effects on SWB, as well as indirect positive effects on PWBW through
mediators, such as SWB, Work Engagement and/or Psychological Ownership.
Given the theoretical framework of this research, the following research question has been
formulated:
Stellenbosch University http://scholar.sun.ac.za

9
Are the proposed constructs related to each other, as well as to Subjective Well-being and
Psychological Well-being at Work in the sense that it permits the stryctural model of
Psychological Well-Being at Work (as hypothesised by Boers) as a possible approach to
explaining variance in PWBW?
The research question will be addressed by attempting to achieve the following research
objectives:
expand and adapt the structural model of Psychological Well-being at Work as
originally defined and tested by Steyn (2011);
test the fit of the model;
evaluate the significance of the hypothesised paths in the model; and
consider the modification of paths in the model by inspecting the modification indices
and how the possible modification of paths are supported theoretically.
1.1.2 Structure of the thesis
This thesis will firstly, in chapter 2, present the theoretical framework of the study by defining
each construct, and explaining how the constructs relate to each other as well as to well-
being in the workplace. Chapter 3 will introduce the rationale, aims and objectives of the
research and present details regarding the sample. The measurement instruments and
means of data analyses are discussed in depth. The results will be discussed in chapter 4.
The thesis ends of with a discussion chapter (chapter 5) which will include a brief summary
of the study and the results, the main limitations of the study, implications for practice, and
recommendations for future research.
Stellenbosch University http://scholar.sun.ac.za

10
CHAPTER 2
THEORETICAL FRAMEWORK OF THIS RESEARCH
2.1 INTRODUCTION
In this chapter an overview of Steyn’s (2011) study will be provided and thereafter the
literature in support of the current study will be presented. Each construct will be individually
defined and discussed in order to systematically uncover the logic underlying the structure of
the proposed expanded model. More specifically, the reasoning of how it was decided to
include each construct, as well as how each construct fits into the nomological network will
be explained.
2.2 THE STEYN (2011) SALUTOGENIC STRUCTURAL MODEL OF
OCCUPATIONAL WELL-BEING
Steyn (2011) developed a Salutogenic Model of Occupation Well-being. The goal was to
depict the nomological network of latent variables1 that directly and/or indirectly influence
Occupation Well-being. Optimism (the ability to expect good things, despite being faced with
adversity; Carver & Scheier, 2004), Self-efficacy (an individual’s perceived expectations of
their ability to reach a specific goal; Wu, 2009), and Meaningfulness, both in (defined as
Work Engagement) and at work (defined as Organisational Commitment) were combined in
a structural model to provide one plausible explanation for the interaction of these variables
in explaining variance in Occupational Well-being. Occupational Well-being was defined by
two constructs, namely Psychological Health and Satisfaction with Work-Life. These
constructs were measured with the General Heath Questionnaire (GHQ, Goldberg, 1972)
and the Satisfaction with Life Scale (Diener, et al., 1985), adapted to the Satisfaction with
Work-Life scale.
Optimism was measured with the Life Orientation Test-Revised (Scheier, et al., 1994). The
General Self-efficacy Scale (Sherer, et al., 1982) was used to measure the construct of Self-
efficacy. Steyn (2011) also included Meaningfulness into the model as she argued that
mankind have an inherent need to engage in activities that they believe have the result of
leading a rewarding life. Steyn (2011) further acknowledged Pratt and Ashworth’s (2003)
stance that finding meaning at work implies the cultivation of a strong sense of
organisational membership, while meaningfulness in work relates to employees being
1 Steyn’s model offers one possibility of the network of latent variables leading to well-being. Her
study was the first in a series of studies with the aim of gaining a better understanding of the
complexity of the constructs underlying individual and organisational well-being.
Stellenbosch University http://scholar.sun.ac.za

11
engaged in work, i.e. nurturing their callings (Gardner, Csikszentmihalyi & Dammon, 2001).
She used the Organisational Commitment Questionnaire (Mowday, et al., 1979) and the
Utrecht Work Engagement Scale (Schaufeli & Bakker, 2003) to measure these two
dimensions of Meaningfulness respectively (Steyn, 2011). Steyn (2011), therefore, proposed
that optimistic and self-efficacious individuals will experience greater levels of health (evident
in more Psychological Health and more Satisfaction with Work-life) than their more cynical
counterparts (Steyn, 2011). It was argued that this could be, partly, because of such
individual’s ability to foster positive expectations about the future, and partly because of their
heightened sense of Commitment and Engagement, facilitated by their higher levels of
Optimism and Self-efficacy.
The rational for developing the model was based upon previous research of the included
constructs. Firstly, Optimism, as defined by Carver and Scheier (2004), has been empirically
linked to several aspects of Subjective Well-being. Three-way interactions have been noted
between ratings of Optimism, social support and stress on physical and Psychological Well-
being (Sumi, 1997). Those individuals who, thus, reported higher Optimism and social
support were inclined to experience higher levels of SWB, regardless of their perceived
levels of stress. Optimism has additionally been linked to greater performance, persistence,
the ability to transform problems into opportunities and being open-minded in order to seek
novel solutions (Peterson, 1991; Snyder, 2000; Snyder, Rand & Sigmon, 2005).
Self-efficacy was used to describe individuals’ perceived expectations of their ability to reach
a specific goal (Wu, 2009). Expectations of personal efficacy thus determine whether an
individual’s coping behaviour will be initiated, how much task-related effort will be exercised,
and the duration of that effort in the face of disconfirming evidence. Research has indicated
that individuals with high levels of Self-efficacy are much more confident and more self-
assured in their ability to accomplish goals. This consequently makes them achievers within
the organisational setting (Stajkovic & Luthans, 1998). Higher levels of Self-efficacy are
additionally associated with an individual preference for challenging tasks, as well as the
effort, motivation and persistence to follow through with tasks (Bandura, 1986), which, in
turn, are linked to the regulation of the stress process for improved well-being.
Steyn (2011) tested the model on a sample of 202 employees, across three organisations.
Of the 202 employees, 71.78% of the participants were employees of a medium sized South
African property management and development company, 17.82% were educators at a
primary institution, while a further 9.5% were in the employment of a small tobacco
organisation. The ethnic composition was 42.6% White; 40.1% Coloured; 14.4% African, and
Stellenbosch University http://scholar.sun.ac.za

12
3% Indian / Asian. Tenure at the respective organisation was recorded to be 12.2% 0 - 12
months, 25.8% between 1 - 4 years; 27.7% between 5 - 8 years; 33.8% more than 8 years of
service.
CFA and item analyses were conducted to evaluate the reliability and validity of the
measuring instruments after which the proposed structural model was fitted to the data. The
results of the model suggested that Optimism influenced Psychological Health directly. The
relationship between Optimism and Occupational Well-being (i.e. Psychological Health) was
further highlighted through an indirect causal effect, as mediated through Work Engagement
(i.e. Meaningfulness). Optimism also causally influenced Satisfaction with Work-Life (the
other aspect of Occupational Well-being). This indirect effect was mediated by Work
Engagement and Organisational Commitment. The structural model indicated no significant
paths between Self-efficacy and any of the other variables (Steyn, 2011).
Figure 2.1 depicts the results obtained for the structural model and indicates the supported
paths between the positive psychological antecedents of Optimism, Self-efficacy, and
Meaningfulness (Work Engagement and Organisational Commitment) and Occupational
Well-Being (Psychological Health and Satisfaction with Work Life).
Figure 2.1: Steyn's (2011) Salutogenic Structural Model of Occupational Well-Being
Self-efficacy
Org.
commitment
Psych Health
SWWL
Engagement
Optimism -.400
-.021 (n.s)
.01 (n.s)
-.250
.594
.004 (n.s)
.756
.410
.054 (n.s)
.392
-.080 (n.s)
(n.s)
Stellenbosch University http://scholar.sun.ac.za

13
The Steyn (2011) study revealed insights into the salutogenic2 structure of Occupational
Well-being. It focused on the complexity of Occupational Well-being in terms of the possible
nomological net of variables that underlies it in terms of the positive psychology antecedents
of Optimism, Self-efficacy and Meaningfulness. Although the study generated unique
insights into the well-being paradigm, some limitations could be identified.
A first limitation is that Occupational Well-being, as the main construct in the study, was
defined very narrowly. Steyn (2011) defined the concept of Occupational Well-being as
synonymous to Psychological Well-being, according to the Cotton and Hart (2003)
framework. Cotton and Hart (2003) have argued that Occupational Well-being consists of a
framework of both emotional and cognitive components. The emotional components are
conceptualised in terms of two independent dimensions of Positive and Negative Affect
(Watson, 1988), which are termed morale and distress. The emotional components can
operate at the individual, employee or workgroup levels. Steyn (2011) only focused on the
individual emotional component of the absence of distress as an indicator of well-being, by
measuring Psychological Well-being with the General Health Questionnaire (GHQ;
Goldberg, 1972). Furthermore, according to Cotton and Hart (2003), the cognitive
component of Occupational Well-being is termed job satisfaction and reflects employees’
judgements about their levels of satisfaction with their work (Cotton & Hart, 2003). Steyn
(2011) measured the individual cognitive component with an adapted version of the
Satisfaction with Life Scale (Diener, et al., 1985) in an attempt to contextualise the
satisfaction of life construct within the workplace. Given the limitations of the
conceptualisation and measures of well-being used in the Steyn (2011) study, it is argued
that a more comprehensive conceptualisation and operationalisation of the well-being
construct (i.e. EWB, HWB and PWBW) as proposed in this study, will provide more practical
utility to studies in this field.
A further significant limitation to the Steyn (2011) study was the finding that the results
revealed no support for a causal link between Self-efficacy and any of the other variables.
This finding stands in stark contrast to existing research trends on Self-efficacy in the well-
being domain. Although the use of the Generalised Self-efficacy Scale could have influenced
these results, this needs further investigation. Therefore the current study will also include
the Self-efficacy construct within the adapted Steyn-Boers Structural Model of Psychological
2 Antonovsky (1979) introduced the notion of salutogenesis (Latin salus = health; Greek genesis =
origin), proposing that the origins of health, rather than disease should be studied.
Stellenbosch University http://scholar.sun.ac.za

14
Well-being at Work in an attempt to investigate whether these results were sample specific,
or whether it can be replicated.
Lastly, given the strong path between Work Engagement and Organisational Commitment in
the Steyn (2011) results which replicated other research in this regard, the current study will
omit the Organisational Commitment variable from the structural model. However, the more
contemporary variable of Psychological Ownership will be included in the revised model to
provide more insight into how this variable in combination with the other variables in this
study could account for variance in SWB and PWBW. The rationale for the further
elaboration of the model with the inclusion of the constructs of Gratitude and Perceived
Organisational Support will also be theoretically outlined in the following section.
2.3 INTRODUCTION TO THE CURRENT STUDY
This study has the aim of elaborating and adapting Steyn’s (2011) Salotogenic Model of
Occupational Well-being. In order to do this, the included constructs need to be discussed in
terms of their definitions, the arguments as to why these specific constructs could have an
effect on SWB and PWBW, as well as the underlying relationships these constructs may
have with one another.
2.4 SUBJECTIVE WELL-BEING AND PSYCHOLOGICAL WELL-
BEING AT WORK
Human happiness, also often referred to as Subjective Well-being (SWB), has been a topic
of interest for many centuries, starting with Ancient Greek philosophy, post-enlightenment
western-European moral philosophy, and economic sciences. Being happy is of great
importance to people, and happiness has been found to be a highly valued “goal” in
societies (Diener, 2000). The rise of positive psychology (Seligman & Csikszentmihalyi,
2000) has legitimised attention to happiness and other positive states as opposed to the
previously dominant disease model (Fisher, 2010). Organisational researchers soon adapted
this concept into the world of work where the concepts Positive Organisational Behaviour
(POB) and Positive Organisational Scholarship (POS) were born. Although the two terms,
SWB and Happiness, are used interchangeably by layman, in research they are viewed
separately. SWB refers to how people experience their quality of life and includes both
emotional reactions and cognitive judgments (Diener, 1984), whereas Happiness is defined
as a combination of life satisfaction and the relative frequency of Positive and Negative
Affect (Diener, Colvin, Pavot & Allman., 1991). SWB therefore encompasses moods and
emotions, as well as evaluations of one’s satisfaction with general and specific areas of
Stellenbosch University http://scholar.sun.ac.za

15
one’s life (Diener, Suh, Lucas, Smith, 1999). Therefore, concepts encompassed by SWB
include Positive and Negative Affect, happiness and life satisfaction (Diener, 2000). SWB is
therefore a multidimensional construct, evaluated by both cognitive and emotional
judgements and comprises of high Positive Affect, low Negative Affect and a cognitive
emotional evaluation of one’s life. The cognitive element refers to what one thinks about his
or her life satisfaction in global terms (life as a whole) and in domain terms (in specific areas
of life such as work, relationships, etc.). The affective element refers to emotions, moods
and feelings. Affect is considered positive when emotions, moods and feelings experienced
are pleasant and negative when it is unpleasant (Diener et al, 1999).
According to Diener (1984) the construct of SWB has three hallmarks. Firstly, it is subjective,
as it resides within the experience of the individual. Diener (2000) points out that the key in
Subjective Well-being is that the person himself/herself is making the evaluation of life – not
experts, philosophers or anyone else. Thus, the person him/herself is the expert here: “Is my
life going well, according to the standards that I choose to use?” Secondly, it includes
positive measures and is not just the absence of negative measures. This means that
individuals should not just view their happiness in terms of the absence of negativity, but
positive events, emotions etc., must also be present. Thirdly, it can be viewed as a global
assessment of all aspects of a person’s life, as emphasis is usually placed on the integrated
judgement of the person’s life, even though satisfaction within a certain domain may be
assessed (Diener, 1984).
SWB is often also conceptualised as Hedonic Well-being (HWB) or alternatively, Eudaimonic
Well-being (EWB), or an integration of the two concepts. The Hedonic approach focus on life
satisfaction more or less in the same light as previously defined by Diener et al., (1999),
stating that well-being is indicated through Positive Affect, Negative Affect and life
satisfaction (Andrews & McKennell, 1980; Campbell, Converse & Rodgers, 1976; Diener,
1984). Equating well-being with Hedonic pleasure or happiness has a long history.
Aristippus, a Greek philosopher from the fourth century B.C., taught that the goal of life is to
experience the maximum amount of pleasure, and that happiness is the totality of one’s
Hedonic moments (Ryan & Deci, 2001). His early philosophical hedonism conceptualisation
has been followed by many others. Hobbes (as cited in Ryan & Deci, 2001) argued that
happiness lies in the successful pursuit of our human appetites, and DeSade (as cited in
Ryan & Deci, 2001) believed that pursuit of sensation and pleasure is the ultimate goal of
life. Utilitarian philosophers such as Bentham argued that it is through individuals’ attempts
to maximize pleasure and self-interest that the good society is built. Hedonism, as a view of
well-being, has thus been expressed in many forms and has varied from a relatively narrow
Stellenbosch University http://scholar.sun.ac.za

16
focus on bodily pleasures to a broad focus on appetites and self-interests (Ryan & Deci,
2001). Hedonic philosophers believed that humans essentially desire to maximise their
experience of pleasure and to minimise pain; where pleasure and pain were seen as
powerful indicators of good and bad, and hence maximising pleasure was seen as a way of
maximising the good in one’s life. These philosophers traditionally took a ‘subjectivist’
position, in that the individual is considered to be in the best position to determine how well
they are (Diener, 2009).
The predominant view among Hedonic psychologists is that SWB consists of subjective
happiness and concerns the experience of pleasure versus displeasure, broadly construed
to include all judgments about the good/bad elements of life. HWB is thus not reducible to
physical hedonism, for it can be derived from attainment of goals or valued outcomes in
varied realms (Diener, Gohm, Suh & Oishi, 1998). According to Fisher (2010) SWB is seen
as having two correlated components: judgement of life satisfaction (assessed globally, as
well as in specific domains, such as work), and affect balance, or having many positive
feelings and relatively few or rare negative feelings (Diener et al., 1999), which is similar to
HWB.
Ryff and Singer (1998) define eudaimonia as the idea of striving towards excellence, based
on one’s own unique potential. Eudaimonia is more precisely defined as "the feelings
accompanying behaviour in the direction of, and consistent with, one's true potential"
(Waterman, 1984, p. 16). Aristotle was the first person to come up with the concept of EWB,
when he proclaimed that living a life of contemplation and virtue, in accordance with one’s
inherent nature (i.e. living authentically, or in truth to one’s ‘daimon’3) was the pathway to
well-being (Norton, 1976). Daimon, then, is an ideal in the sense of an excellence, a
perfection towards which one strives, and it gives meaning and direction to one's life. The
Eudaimonic 4 approach criticises the exclusive focus on pleasure, as embodied in the
Hedonic approach, as being too narrowly self-indulgent and state that an individual should
strive for more than mere pleasure. Aristotle defined acting virtuously as behaving in a way
that is noble and is worthwhile for its own sake; often emphasising the virtues of justice,
kindness, courage, and honesty. What becomes immediately apparent is that eudaimonia
3 Daimon is the Greek derivative for the term demon. In this sense the term "demon" means "replete with knowledge." The ancient Greeks thought there were good and bad demons called 'eudemons' and 'cacodemons.' The term 'daimon' means "divine power," "fate" or "god." Daimons, in Greek mythology, included deified heroes. They were considered intermediary spirits between men and the gods. Good daimons were considered to be guardian spirits, giving guidance and protection to the ones they watched over. Bad daimons led people astray (Urban Dictionary, 2010). 4 The Eudaimonic approach in this study is similar to Steyn’s (2011) “meaningfulness” construct. Both hold the argument that individuals want to engage in meaningful matters and that this contributes to their well-being.
Stellenbosch University http://scholar.sun.ac.za

17
seems a more complex and elusive concept than hedonia. Eudaimonic approaches also
emphasise that well-being and happiness are on-going processes, not end states (Ryan &
Deci, 2001). Aristotle, for example, considered Hedonic happiness to be a vulgar ideal,
making humans slavish followers of desires. He posited, instead, that true happiness is
found in the expression of virtue — that is, in doing what is worth doing (Ryan & Deci, 2001).
Fromm (1981), drawing on this Aristotelian view, argued that optimal well-being requires
distinguishing between those needs (desires) that are only subjectively felt and whose
satisfaction leads to momentary pleasure, and those needs that are rooted in human nature
and whose realisation is conducive to human growth and produces eudaimonia, i.e. “well-
being.”
In this light i.e. eudaimonia, SWB is seen as the ultimate level of functioning and it is referred
to in terms of optimal functioning, meaning and self-actualisation (Ryan & Deci, 2000).
Within this approach true SWB derives from personal growth and actively contributing to
doing what is right and virtuous. From the Eudaimonic perspective, subjective happiness
cannot be equated with well-being. Waterman (1993) stated that, whereas happiness is
hedonically defined, the Eudaimonic conception of well-being calls upon people to live in
accordance with their daimon, or true self. He suggested that eudaimonia occurs when
people’s life activities are most congruent or meshing with deeply held values and are
holistically or fully engaged. Under such circumstances people would feel intensely alive and
authentic, existing as whom they really are — a state Waterman labelled personal
expressiveness (PE) (Ryan & Deci, 2001). Empirically, Waterman (1993) showed that
measures of Hedonic Well-being and enjoyment and PE were strongly correlated, but were
nonetheless indicative of distinct types of experience. For example, whereas both PE and
Hedonic measures were associated with drive fulfilments, PE was more strongly related to
activities that afforded personal growth and development. Furthermore, PE was more
associated with being challenged and exerting effort, whereas Hedonic enjoyment was more
related to being relaxed, away from problems, and happy.
Ryff and Singer (1998) have explored the question of well-being in the context of developing
a lifespan theory of human flourishing. Also drawing from Aristotle, they describe well-being
not simply as the attaining of pleasure, but as “the striving for perfection that represents the
realization of one’s true potential” (Ryff 1995, p. 100). Ryff and Keyes (1995) thus refer to
Psychological Well-being (PWB) in terms of the Eudaimonic approach and presented a
multidimensional approach to the measurement of PWB that taps into six distinct aspects of
human actualization: Autonomy (a strong sense of individuality and personal freedom);
Environmental Mastery (creation of a surrounding context so as to satisfy one’s needs and
Stellenbosch University http://scholar.sun.ac.za

18
desires); Personal Growth (a sense of dynamic life-long learning and continues development
of one’s potential); Positive Relations with Others (developed and kept warm ties with
others); Purpose in Life (a sense of direction in life that unifies one’s efforts and challenges);
and Self-Acceptance (positive self-regard that includes awareness of personal limitations)
(Gustainiene, 2012). These six constructs define PWB (also referred to as Eudaimonic Well-
being) both theoretically and operationally and they specify what promotes emotional and
physical health (Ryff & Singer 1998).
The debate between what really constitutes well-being is complicated and won’t be settled
easily. Both these views (HWB and EWB) offer theoretical and practical approaches of
importance. Evidence from a number of investigators has indicated that well-being is
probably best conceived as a multidimensional phenomenon that includes aspects of both
the Eudaimonic and Hedonic conceptions of well-being. For example, Compton, Smith,
Cornish and Qualls (1996) investigated the relation among 18 indicators of well-being and
mental health, identifying two factors, one that seemed to reflect SWB and the other,
personal growth. These two factors were themselves moderately correlated. The results of
this study thus suggested that the Hedonic and Eudaimonic foci are both overlapping and
distinct and that an understanding of well-being may be enhanced by measuring it in
differentiated ways. King and Napa (1998) asked people to rate features of the good life and
found that both happiness and meaning were implicated. Similarly, McGregor and Little
(1998) analysed a diverse set of mental health indicators and also found two factors, one
reflecting happiness and the other, meaningfulness. These researchers showed that, when
pursuing personal goals, doing well and feeling happy may be disconnected from finding
meaning and acting with integrity. Since the state of research regarding the conceptual
debate, of (i.e. how SWB should be defined) does not allow for a clear theoretical frame on
which to base empirical work, Ryan and Deci (2001), followed by Keyes and his colleagues
(Keyes et al. 2002; Keyes 2006; Keyes & Magyar-Moe, 2003), and Lent (2004), have
suggested that it would be optimal to consider SWB as integrating these two research
trends, since each perspective sheds a different light on the construct. To that end, Diener et
al. (1998) acknowledge that neither the Hedonic nor the Eudaimonic approach is sufficient in
itself to explain the entirety of the construct of well-being. Therefore, in the PWBW structural
model proposed in this study, both the Hedonic and Eudaimonic approaches to well-being
were included. Hedonic well-being is presented separately by the two components of PA and
NA in the model, whilst the higher order construct of EWB were also included in the model.
Dagenais-Desmarais and Savoie (2012) argue that work is a specific life domain, distinct
from other domains which comprise specific parameters leading to unique experiences for
Stellenbosch University http://scholar.sun.ac.za

19
individuals. Most individuals spend at least half their waking hours at work, making this life
domain a primary focus for most. Work is also a life domain offering individuals great
opportunities to use their full potential while requiring them to embrace imposed
responsibilities and externally prescribed expectations. For this reason, these authors
(Dagenais-Desmarias & Savoie, 2012) argue that it is inadequate to only use context-free
measures to determine employees’ true psychological functioning. Another reason for
conceptualising SWB to be domain-specific, is Diener and his co-workers’ concern (Diener,
Scollon, Lucas, 2003) that SWB can fluctuate between specific life domains. Studies have
shown that general SWB is moderately correlated with SWB in specific life domains
(Campbell et al., 1976). Furthermore, in the case of job or life satisfaction as components of
HWB, research evidence provides mixed support for the relationship between life
satisfaction and job satisfaction (e.g. Hart, 1999; Judge & Watanabe 1993; Rode, 2004). The
cross-sectional correlations between life and work satisfaction reported ranged from r = .19
to r = .49 (Judge & Klinger, 2008). This suggests that one is not simply the contextualised
transposition of the other. Empirical studies have also shown that work frame-of-reference
measures grant incremental validity over context-free measures when predicting important
organisational outputs such as performance (English, 2001; Hunthausen, Truxillo, Bauer &
Hammer, 2003). This empirical evidence, combined with the rational argument favouring
context oriented measures, support the hypothesis of a unique, yet related,
conceptualisation of PWBW over context-free SWB.
Before the work of Dagenais-Desmarias and Savoie (2012) no adequate conceptual
framework has been devoted specifically to Psychological Well-being at Work (PWBW).
Previous research has focused mainly on identifying organisational characteristics leading to
overall employee SWB (Warr, 2006), or on the effect of SWB (e.g. Cropanzano & Wright,
1999; Wright, Cropanzano, Denney & Moline, 2002). Research has also been conducted on
job satisfaction, equating it with HWB (Ilies, Schwind & Heller, 2007). However, Cropanzano
and Wright (1999) have argued that researchers too often measure one or several
components of context-free SWB without questioning the adequacy of such a
methodological choice when predicting organisational outcomes, such as performance.
Stellenbosch University http://scholar.sun.ac.za

20
Dagenais-Desmarais and Savoie (2012) utilised an inductive approach to develop the
Psychological Well-being at Work (PWBW) construct. To ensure content validity, the Index
of Psychological Well-being at Work (IPWBW) was developed using a bottom-up approach5.
The model’s fit indices were calculated through CFA to provide initial estimates for further
efforts toward the confirmation of the PWBW structure. The CFA was performed on raw
data, with the Maximum Likelihood estimation method in Amos (Arbuckle, 2006). The
following fit indices were obtained X2 = 1982.354 (p < .001); CFI = .906; RMSEA=.77 (.074;
.080). Exploratory factor analysis (EFA) allowed for the identification of a sound and
parsimonious five-dimension structure for the PWBW construct, namely Interpersonal Fit at
Work (the perception of experiencing positive relationships with individuals interacting with
oneself within the work context); Thriving at Work (the perception of accomplishing a
significant and interesting job that allows one to fulfil oneself as an individual); Feeling of
Competency at Work (the perception of possessing the necessary aptitudes to do one’s job
efficiently and have mastery of the tasks to perform); Perceived Recognition at Work (the
perception of being appreciated within the organisation for one’s work and one’s
personhood) and Desire for Involvement at Work (the will to involve oneself in the
organisation and to contribute to its good functioning and success). According to Dagenais-
Desmarais and Savoie (2012) these themes that emerged are not separate constructs
manifesting themselves independently, but is rather an all-encompassing construct, PWBW,
that interact with one another to reflect a larger theme.
In the only published (2012) study of the instrument (available at the time of this study),
Dagenais-Desmarais and Savoie (2012) determined PWBW’s convergent and discriminant
validity by including other measures of well-being in their study. One of these measures was
the PANAS. A correlation of .526 was found between PWBW and PA supporting the “related
but distict” nature of PWBW with regard to the context-free hedonic (PA) PWB dimensions.
These authors also conducted a hierarchical regression analysis to further define PWBW’s
relationship with other well-being variables. The total score (PWBW) was used as the
dependent variable to be predicted by overall scores of context-free PWB, psychological
distress, PA, NA and satisfaction with life. After entry of the five indicators of psychological
distress the total variance explained by the model as a whole was 34% of the variance of
PWBW. In the final model, only context-free PWB, PA and satisfaction with life were
5 A series of 20 critical incident interviews were conducted with French-speaking workers from a variety of industry sectors. The participants were then asked to report critical incidents of PWBW that they had experienced. After identifying a manifestation pool derived from the participants’ experiences, a further quantitative study was conducted to investigate the dimensional structure of PWBW.
Stellenbosch University http://scholar.sun.ac.za

21
statistically significant. This once again underscores the importance of PA for the PWBW
construct.
According to Dagenais-Desmarais and Savoie (2012) PWBW incorporates both job
satisfaction and Positive Affect components. Fredrickson’s (2001) Broaden-and-Build theory
states that positive emotions may foster more well-being in the sense that the positive
emotions broaden a person’s thought-action repertoire, encouraging them to discover novel
lines of thought or action. Experiments have also shown that positive emotions produce
patterns of thoughts that are notably unusual, flexible, creative and receptive (Isen, 1987). In
more general terms, positive emotions “enlarge” the cognitive context, an effect linked to
increases in brain dopamine. Therefore, it is argued in this study that an increase in PA will
lead employees to experience more PWBW as the upward spiral will assist them to
accumulate more resources, which should result in them experiencing more PWBW, noted
through more experiences of Interpersonal Fit at work, Thriving at Work, Feeling of
Competency at Work, Perceived Recognition at Work and a Desire for Involvement at Work.
Therefore, it is hypothesised that PA will have a significant positive effect on PWBW.
Hypothesis 36: In the proposed PWBW model it is hypothesised that PA positively
influences PWBW.
Dagenais-Desmarais and Savoie (2012) further revealed in their study that a correlation of -
.357 was found between PWBW and NA, indicating that a negative relationship between
these two constructs exists. However, the results of the regression analysis from this study
revealed that support was not obtained for NA being a predictor of PWBW (-.074) when the
regression model also included the PA predictor. It is, however, proposed in this thesis that
NA will have a significant negative effect on PWBW. It is argued here that if individuals
experience more negative emotions such as feeling “distressed”, “upset”, “guilty”, “scared”,
“hostile” 7 etc., they will be less able to experience “Thriving at Work”, nor have a “Desire for
Involvement at Work” or a “Feeling of Competency at Work”, which are core dimensions in
PWBW.
Hypothesis 4: In the proposed PWBW model it is hypothesised that NA negatively
influences PWBW.
6 The hypotheses start with number 3, as Hypothesis 1 and 2 are set out for the exact fit and close fit of the structural model. This will be discussed in section 3.4. 7 These words are some of the items on the Negative Affect subscale of the Positive and Negative Affect Schedule (PANAS) which was used in this study. The Scale will be introduced in section 3.6.1.
Stellenbosch University http://scholar.sun.ac.za

22
Work is a life domain offering individuals with great opportunities to use their full potential
while requiring them to embrace imposed responsibilities and externally prescribed
expectations (Dagenais-Desmarais & Savoie, 2012). The construct of PWBW seems to carry
a strong Eudaimoic connotation as Dagenais-Desamarais and Savoie (2012) found
Eudaimonic themes such as congruence and self-realization undelying the conceptualisation
of the construct. Therefore, the subscales of PWBW show close similarities with the key
EWB dimensions (as defined by Ryff 1989). For example, Feeling of Competency at Work
(i.e. perception of possessing the necessary aptitutes to do one’s job efficiently and have
mastery of the tasks to perform) is conceptually close to the EWB Environmental Mastery
component (i.e. a sense of mastery and competence in managing the environment).
Moreover, it could be argued that Interpersonal Fit at Work (i.e. perception of experiencing
positive relationships with individuals interacting with oneself within the work context) is
conceptually similar to Positive Relations with Others (i.e. having warm, satisfying and
trusting relationships with others and being concerned about the welfare of others); whilst
Desire for Involvement at Work (i.e. will to involve oneself in the organisation and to
contribute to its good functioning and success) can be related to some extent to Ryff’s
Purpose in Life (i.e. holds beliefs that give life purpose and has aims and objectives for
living) dimension. However, on the other hand, the PWBW dimensions such as Thriving at
Work and Perceived Recognition at Work clearly do not have equivalence in the context-free
SBW (i.e. EWB) dimensions listed in this study, and represent distinctive components of
PWBW (Dagenais-Desmarais & Savoie, 2012).
In order to investigate the convergent and divergent validity of the PWBW construct with
EWB, Dagenais-Desamarais and Savoie’s (2012) included the Psychological Well-being
Manifestation Scale (Massé, Poulin, Dassa, Lambert, Bélair & Battaglini, 1998) in their study
to measure EWB. This scale comprises of six dimensions, namely, Self-Esteem, Mental
Balance, Social Involvement, Sociability, Control of Self and Event and Happiness. A
correlation of .500 was found between this measure of EWB and PWBW (Dagenais-
Desamarais & Savoie, 2012). According to Kline (1998), correlations in the order of 0.60
(and less) may be interpreted as providing support for discriminant validity (i.e. the various
constructs do not overlap to such an extent that they measure exactly the same thing). It
was therefore confirmed in their study that these two constructs share some variance, but
also measure unique constructs. Based on these results it is argued here EWB would have
an effect on PWBW.
Hypothesis 5: In the proposed PWBW model it is hypothesised that EWB positively
influences PWBW.
Stellenbosch University http://scholar.sun.ac.za

23
2.4.1 Outcomes of SWB and PWBW
When it comes to happiness and success, Fisher (2010) argues that happy individuals are
successful across multiple life domains, including income, work performance and health.
These relationships are found not only because success brings happiness, but because
happiness, in the form of trait and/or state Positive Affect, has a causal effect on success.
Those who are happy, engage in behaviours that cascade to create improved outcomes in
psychological, tangible and even psychological domains (Fisher, 2010). More than 90% of
people agree with the statement that a happy worker is a productive worker (Fisher, 2003;
Kluger & Tikochinsky, 2001; Ledford, 1999; Staw & Barsade, 1993). One explanation could
be that happy individuals are more active, approach-oriented, energetic, interested in their
work, sympathetic to their colleagues and persistent in the face of difficulties compared to
their unhappy counterparts. The other reason, argued within the framework of the Broaden-
and-Build theory (Fredrickson, 2001), is that happy employees may generate more job-
related resources. For instance, happy employees may act in a more pleasant way so that
colleagues are more inclined to provide instrumental, social and emotional support (Fisher,
2003). When reviewing studies of SWB in the workplace, it is important to note that in
organisational research the terms SWB, happiness and job satisfaction are often used
interchangeable (Hosie, Sevastos & Cooper, 2006). This is not theoretically correct, as
argued earlier, but nevertheless, does happen.
Various researchers have engaged in studies to determine the correlation between “the
happy worker” and “the productive worker”. A review that incorporated 254 studies showed
an average correlation between overall job satisfaction and performance of .30 after
correcting for measurement errors, with a stronger correlation for employees who performed
tasks of higher complexity (Judge, Thoresen, Bono & Patton, 2001). Lee and Allen (2002)
showed that work-related Positive Affect (e.g. enthusiasm, excitation) was positively
correlated with colleagues’ ratings of help provided to other individuals (r = .18) and with
ratings of citizenship behaviour directed at the organisation more broadly (r = .24). Other
studies have operationalised performance as financial turnover. For instance, Koys (2001)
showed that overall employee satisfaction correlated .35 with store profitability in the
subsequent year. Lyubomirsky, King and Diener, (2005) analysed 10 studies with
longitudinal research designs that included a diverse set of SWB measures that were
affective in nature (e.g. PANAS, one-item happiness, positive emotions on the job) as well
as job performance (e.g. supervisory evaluations, salary, absenteeism, second interviews)
across different time frames (ranging from 3 months to 19 years). On the whole, the authors
reported an average longitudinal correlation of .24, suggesting that happiness precedes job
Stellenbosch University http://scholar.sun.ac.za

24
performance. Bakker (2009) concluded in his study that positive affective states of SWB that
are characterised by high levels of pleasure and activation, such as Work Engagement and
happiness at work, are positively related to high levels of job performance. A recent meta-
analysis of the happiness-success relationship included more than 25 workplace studies and
observed correlations to outcomes such as supervisor ratings, organizational citizenship
behaviour, turnover intentions, satisfaction with work, customer service, job autonomy, and
job performance (Lyubomirsky et al., 2005).
2.4.2 Antecedents of SWB and PWBW
Numerous studies have reported on the relations between well-being, personality and
genetics. Well-being research, including studies with twins, indicates that nearly half of
reported level of happiness is determined by a genetic set point or set range (Diener et al.,
1999). While much of happiness appears to be determined at birth, it is believed that
individuals can move within the upper and lower bounds of their happiness set range.
When it comes to personality, the Big 5’s relations to well-being have been thoroughly
researched. Extraversion and Neuroticism have received the most empirical attention in
relation to SWB. Fujita (1991) determined the correlation between Extraversion and Positive
Affect to be .80 and that Neuroticism and the experience of Negative Affect were virtually
indistinguishable. Costa and McCrae (1980) discovered that Extraversion predicted Positive
Affect and Neuroticism predicted Negative Affect over a ten-year period. DeNeve and
Cooper (1998) have conducted a meta-analysis where they identified Extraversion and
Agreeableness as consistently positively correlated with global SWB, whilst Neuroticism was
consistently negatively related. Conscientiousness and Agreeableness both correlate
moderately with SWB but at lower levels than Extraversion and Neuroticism. The fifth trait of
the Big Five, Openness to Experience, is generally not related to an individual’s experience
of Positive- or Negative Affect or life satisfaction (Gottfredson, 1994).
Other happiness-relevant circumstances may include the region in which one lives, or life
status variables such as job status, income, health, marital status, or religion (Diener et al.,
1999). Contrary to popular belief, as little as 8-15% of variance in happiness levels is
accounted for by all circumstantial factors combined (Argyle, 1999; Diener et al., 1999).
While it seems likely that a positive change in circumstance will have an initial positive
impact on one’s happiness, the concept of Hedonic adaptation (Fredrick & Loewenstein,
1999; Kahneman, 1999) suggests that humans readily adapt to change, whether the change
is positive or negative. As a result, the excitement of a new car, home, or job, or the sadness
Stellenbosch University http://scholar.sun.ac.za

25
that accompanies losing a colleague or experiencing bodily injury, typically wears off over
time as people return to their previously-established happiness level.
Although many other variables, as discussed above, have an influence on SWB, this study
will solely focus on positive state-like constructs (e.g. PsyCap) that can be developed within
the workforce. It is argued in this study that being able to develop these constructs, it
provides HR with leverage to develop and maintain a healthy workforce. The importance of
the influence of personality on SWB is well researched, whilst the variables included in the
POB field provides a unique opportunity of incremental exploration.
2.5 PSYCHOLOGICAL CAPITAL (PsyCap)
The concept of Positive Psychology was introduced by Martin Seligman in 1998 (Seligman &
Csikszentmihalyi, 2000). This movement placed emphasis on the study of optimal human
functioning and the variables that promote positive human emotions, traits and institutions
(Seligman & Csikszentmihalyi, 2000). Positive psychology focuses on building strengths and
competencies, as opposed to merely treating disorders, deficits and pathologies (Seligman,
2003). Most research in this field include multiple theoretical and research areas that share a
communal focus on positive (optimal) human functioning, psychological (or subjective)
health, peoples’ adaption to illnesses and other forms of adversity. The increased focus on
these positive phenomena has generated a corresponding upswing, in both scientific and lay
interest, in such topics as Positive Affect, meaning, mastery, personal growth, forgiveness,
Gratitude, Hope, Optimism and spirituality. These concepts have also been explored in their
relation to mental and physical health, and their potential application to promote well-being
and health (Selegman & Csikszentmihalyi, 2000).
In this study where the focus is on understanding the unique interplay between the
psychological strengths of individuals in the workplace to explain variance in PWBW, it is
argued that positive psychological capital plays a key role. It is argued that individuals with
higher levels of PsyCap use intentional efforts to produce creative ways of attaining goals.
These individuals possess the confidence (Self-efficacy) necessary to arrive at desired
goals, develop alternative paths when obstructions arise (Hope), have a positive attribution
and outlook for the future (Optimism), and are able to bounce back from setbacks
(Resilience) in case of any difficulty or failure that may arise due to implementing innovative
ideas (Avey, Wernsing, & Luthans, 2008; Luthans et al., 2007c). For example, it has been
shown that individuals with higher levels of PsyCap, at difficult times of organisational
change, show positive Work Engagement and Organisational Citizenship Behaviours
(OCBs) (Avey et al., 2008). Together, these PsyCap resources have cognitive, affective,
Stellenbosch University http://scholar.sun.ac.za

26
motivational and decisional components (Bandura, 1997; Bandura, & Locke, 2003; Carver &
Scheier, 1999; Peterson, 2000) that facilitate the attainment of higher levels of well-being in
the workplace. For example, Avey, Luthans, Smith and Palmer (2010) have proposed that
Psycap is related to, and may help facilitate, the occupational health objective of attaining
higher levels of employee Psychological Well-being. Other researchers in occupational
health and health psychology have demonstrated that well-being is indeed impacted by
PsyCap (Avey et al., 2009), as well as its individual constructs of Hope (Snyder, Lehman,
Kluck & Monsson, 2006), Resilience (Britt, Adler & Bartone, 2001), Self-efficacy (Bandura,
1997), and Optimism (Carver, Smith, Antoni, Petronis, Weiss & Derhagopian, 2005).
The Broaden-and-Build theory has specific relevance to this argument. Fredrickson and
Joiner (2002) provide both theoretical and empirical evidence that positive emotions trigger
“upward spirals” of broader thinking, functioning and well-being. This could thus serve as a
framework for introducing positive psychology within the well-being domain, as these
broadening processes act in a synergistic way with each other and help to build enduring
personal resources. For example, multiple researchers (e.g. Fredrickson & Joiner, 2002;
Fredrickson, 2004; Garland et al., 2010) have been able to show that the complementary
upward spiral which occurs through the experience of positive emotions and broadened
thinking influences one another reciprocally, leading to substantial increases in emotional
well-being over time. Hence it is proposed that the positive psychological capacities
embodied within PsyCap (i.e. Hope, Optimism, Self-efficacy and Resilience) would, due to
the positive emotional affect underlying the capacities, act in an integrative, interactive and
broadening way to affect SWB.
Another relevant theory to be applied in this study is Conservation of Resource Theory
(COR) (Hobfoll, 1989). This theory emerged from resource and psychosocial theories of
stress and human motivation and has the premise that individuals strive to obtain, retain,
protect and foster resources and that individuals with more resources are less vulnerable to
resource loss and more capable of orchestrating resource gain (Hobfoll, 2001). Social
scientists who study stress have found that personal resources (e.g. perceived self-control,
Self-efficacy, and perception of improvement) and social resources (e.g. emotional support,
assistance from managers and co-workers) buffer against the negative impact of stressful
life events. Resources are defined as objects, conditions, personal characteristics, and
energies that are either itself valued for survival, directly or indirectly as a means of
achieving these resources (Alvaro, Lyons, Warner, Hobfoll, Martens, Labonte & Brown,
2010). The type of resources that are relevant in this study are personal resources /
capabilities (which include skills and traits, such as Gratitude or PsyCap) as well as social
Stellenbosch University http://scholar.sun.ac.za

27
resources (Organisational Support). Individuals with fewer personal (e.g. less PsyCap) and
social resources (e.g. less support) are more vulnerable to resource loss, less capable of
resource gain and highly risk-adverse – which would all translate into less SWB and PWBW.
Their high-resource counterparts are just the opposite (Hobfoll, 2001). COR theory also
suggests that having one major resource is typically linked with having others (Hobfoll,
2001). For this reason, resources must be invested to gain additional resources and to offset
the potential or actual loss of resources (Alvaro et al., 2010).
Within the framework set by the Broaden-and-Build theory, as well the COR theory, the four
PsyCap constructs will now be discussed in terms of their definitions, relevance to well-being
and underlying relationships with the other constructs included in this study.
2.5.1 Hope
2.5.1.1 Hope Defined
Most people think of Hope as simply wishful thinking or sunny advice offered by friends and
family “hoping for the best” in times of trouble. Throughout history, such Hope has been
portrayed as both a positive and negative human attribute, with famed mental health
physician Karl Menninger (1959) referring to Hope as “a motive force for a plan of action” (p
439), whereas the early philosopher and statesman Francis Bacon warned: “Hope is a good
breakfast, but a bad supper”, insinuating that one should be hopeful at the beginning of a
task, journey, search, etc., but at the end of it, one should have accomplished what one
intended to. If Hope still exists, the “journey” is either not completed or has not been
satisfactory. The absence of Hope, however, does not indicate that the journey was a
success.
These loose terms do not offer a measureable construct and is restricted to lexical use. To
use this construct in its full, positive, measurable domain, the PsyCap Hope construct
embodies the definition provided by Snyder (2002, p.250): “Hope is a positive motivational
state that is based on an interactively derived sense of successful (a) agency (a sense of
willpower, or determination to begin and maintain the effort needed to achieve goals) and (b)
pathways (a sense of waypower, or belief in one’s ability to generate successful plans and
alternatives when obstacles are met in order to achieve goals).” Agency is further described
by Snyder (2000) as reflecting a person’s desire to get started towards a goal as well as the
“stick to it” aspect of not prematurely abandoning the attempted journey. It refers to the
motivation we have to undertake the routes towards the goals. It also refers to the successful
determination in meeting goals in the past, present and future. These self-referential
thoughts involve the mental energy to begin and continue using a pathway through all
Stellenbosch University http://scholar.sun.ac.za

28
stages of the goal pursuit. Related to this point, there are evidence that high-Hope
individuals embrace such self-talk agency phrases as, “I can do this,” and “I am not going to
be stopped” (Snyder, Laponite, Crowson, & Early, 1998).
Pathways, on the other hand, are characterised as the ability to come up with alternative
plans of action should an initial path towards a goal be blocked. As such, high - as compared
to low - Hope individuals should be more decisive (and certain) about the pathways for their
goals (Woodbury, 1999). For a low-Hope person, the pathway thinking is far more fragile,
and the resulting route is not well articulated. Beyond the primary route, the high-Hope
person also should be very good at producing plausible alternate routes. High-Hope
individuals describe themselves as being flexible thinkers who are facile at finding alternative
routes, whereas low-Hope persons report that they are less flexible (Irving, Snyder &
Crowson, 1998). Pathway thinking should become increasingly refined and precise as the
goal pursuit sequence progress toward the goal attainment. Differences in this process
should appear, however, depending on the trait Hope level of the person. That is to say,
high-Hope individuals, more so than low-Hope individuals, should more quickly tailor their
routes effectively so as to reach their goals (Snyder, 2002). Snyder (2000) asserted that an
individual low in planfulness is disadvantaged under normal circumstances and is especially
problematic during difficult times. However, a person with a definite sense of pathway
thinking is not hindered by obstacles but instead look for alternative means to achieve a
desired goal or outcome.
For hopeful thinking to exist, it necessitates both pathways and agency thoughts. These two
concepts feed on each other and are thus iterative, as well as additive, over a given goal
pursuit sequence (Snyder, 1995). Because of varying levels of hopeful thoughts, however,
differing robustness should emerge in pathways and agency thoughts. The full high-Hope
person (i.e. high pathways and high agency) will have iterative pathway and agency
thoughts that are fluid and fast throughout the goal pursuit sequence. Contrariwise, the full
low Hope person (i.e. low pathways and low agency) will have iterative pathway and agency
thoughts that are halting and slow in the goal sequence. The mixed pattern of high pathways
and low agency would entail active routing thoughts that are not energised by the necessary
motivational thinking. On the other hand, the mixed pattern of low pathways and high agency
would entail active motivation that is basically useless without the necessary pathway
thoughts. In these missed Hope patterns, the weakest agency or pathways component slows
the iterative thinking (Snyder, 2002).
Stellenbosch University http://scholar.sun.ac.za

29
Goals are the cognitive component that anchors the Hope theory (Snyder, 1994). These
goals are necessarily valuable and uncertain and provide both direction and an endpoint in
hopeful thinking. Goals remain but unanswered calls without the requisite means to reach
them. Accordingly, people approach particular goal pursuits with thoughts of generating
usable routes (Snyder, 2002). For a high-Hope person pursuing a specific goal, this pathway
thinking entails the production of one plausible route, with a connected sense of confidence
in this route. Barriers can come to the foreground during the pursuit of the goals. In these
circumstances one has a decision to either give up, or use one’s pathway thoughts to create
new routes. High-Hope individuals will persevere to reach their goals and thereby redirect
their path to overcome the obstacle. Snyder, Irving and Anderson (1991) have found that
high-Hope individuals cope with obstacles more effectively as they tend to have several
alternative routes, allowing them to better handle or avoid stress and negative emotions
associated with setbacks (Snyder, et al., 1991).
According to Snyder (2000), Hope has been theoretically and psychometrically shown to be
both dispositional and state-like. In order to include Hope in the POB framework, the focus
will fall on the state-like properties, as it is subjective to development and change. Snyder
(2000) describes Hope as a relatively enduring mind-set, but also emphasised that there
exists a more transitory state form of Hope that can be developed and managed.
There are two general types of desired goals in Hope theory; the first reflect positive or
“approach” goals and the second involves the prevention of a negative goal outcome. The
approach goal may (a) be envisioned for the first time; (b) relate to the sustaining of a
present goal; or (c) represent the longing to improve a positive goal wherein one already has
made progress. Prevention of a negative goal, in its strongest form, is stopping something
before it happens, or delaying the unwanted.
2.5.1.2 Hope and SWB
In the Hope theory, emotions are reflections of responses to the perception as to how one is
doing (or has done) in the goal-pursuit activities. Positive emotions should thus flow from the
perceptions of successful goal pursuit. The perception of successful goal pursuit may result
from unobstructed movement towards desired goals or it may be that the individual has
effectively overcome obstacles or blockages that have appeared in the goal pursuit. For
persons that are high as compared to low in Hope, there should be differing emotional sets
that they have about their lives (Snyder, 2002). Other researchers have also stated that goal
attainment is associated with positive emotions (Snyder, Sympson, Ybasco, Borders,
Babyak & Higgins, 1996), whereas goal blockages are related to negative emotions (Diener,
Stellenbosch University http://scholar.sun.ac.za

30
1984). Snyder (2000) states that this is not always the case as high-Hope individuals do not
react in the same way to barriers as low-Hope individuals, instead they view barriers as
challenges to overcome and use their pathway thoughts to plan alternative routes to their
goal (Snyder, 2000). A high-Hope individual should have enduring positive emotions, with a
sense of an effective “appetite” in the pursuit of goals. A low-Hope person, on the other
hand, is predicted to have negative emotions, with a sense of affective lethargy about the
pursuit of goals. Therefore, the dispositional Hope levels also should have associated
emotional sets that are brought to bear on particular goal pursuit activities (Snyder, 2002).
Diener (1984) found that low Hope is associated with negative outcomes including a
reduction in well-being.
In this sense, it is argued that the positive emotions derived from the attainment of goals can
be seen in a Hedonic light and hence lead to higher Positive Affect (PA). In the same sense
it can be argued that these individuals do not experience a great deal of negative emotions
(i.e. Negative Affect; NA), as it will only lead to obstruction in their goal pursuing exertions.
Therefore, the following hypotheses were included in this study:
Hypothesis 6: In the proposed PWBW model it is hypothesised that Hope positively
influences PA.
Hypothesis 7: In the proposed PWBW model it is hypothesised that Hope negatively
influences NA.
Although the above argument provides sufficient evidence that Hope may most likely have a
positive effect on HWB (defined as both PA and NA), it can also be argued that Hope
constitutes the very essence of a healthy mind, as goal-directed behaviour is so inherently
part of human behaviour. Overcoming unforeseen obstacles by redirecting the pathways to
these goals is only a possibility for those with an open and clear mind.
In terms of Eudaimonic Well-being it can be argued that the motivational state imbedded in
Hope will lead to the ability to regulate behaviour from within, thereby being self-determinant
and independent (Autonomy). The motivation component, together with the will- and
waypower will further lead the individuals to develop a sense of mastery and competence in
managing the environment. By overcoming obstacles i.e. pathway thinking, they will learn to
make effective use of surrounding opportunities and thereby also choose or create contexts
suitable to personal needs and values (Environmental Mastery). The pathway thinking will
further lead the individuals to see themselves grow and they will thus open themselves to
new experiences and see improvement in themselves and their behaviour overtime
Stellenbosch University http://scholar.sun.ac.za

31
(Personal Growth). As Hope is the “stick to it” aspect and high-Hope individuals will not
prematurely abandon a journey, it could be argued that high-Hope individuals will also not
easily abandon people they treasure, provided that these high-Hope individuals enjoy the
company of others. In this case, it could be argued that high-Hope individuals may more
regularly develop trusting relationships and will be concerned about the well-fare of others
(Positive Relations with Others). Lastly high-Hope individuals will, due to their perseverance,
develop a sense of directedness with aims and objectives, thereby developing Purpose in
Life. They will also develop positive attitudes towards the self (Self-Acceptance). It is
therefore proposed that Hope will have a positive effect on EWB.
Hypothesis 8: In the proposed PWBW model it is hypothesised that Hope positively
influences EWB.
2.5.1.3 Hope in the Workplace
In the workplace it is often evident that some employees get discouraged, lose motivation
and give up, while others remain hopeful, create alternative plans and persevere. Recent
theory on POS (Cameron, Dutton & Quinn, 2003) and POB (Luthans 2002a, 2002b)
suggests that Hope play an important role in employee performance. Accordingly, high-Hope
individuals are likely to be more productive and higher performing employees. However,
merely stating that hopeful employees are more likely to reach their goals, and therefore,
perform at higher levels is not sufficient. The argument is rather that Hope is positively
related to job performance because of the cognitive process underlying Hope (i.e. pathways
and agency thinking) and the behaviours that are likely associated with these cognitive
processes (Peterson & Byron, 2007).
According to Luthans and Jensen (2002), Hope can be developed in employees to help
them better cope and thrive within the uncertain and turbulent environments and also have
the bonus effects of making employees more effective organisational performers. Moreover,
it can then be argued that the Hope theory has considerable power that needs to be
recognised and understood to become a vital part of human resource development (Luthans
& Jensen, 2002).
2.5.2 Optimism
2.5.2.1 Optimism Defined
Optimism can be defined as making an internal, relatively stable and global attribution
regarding positive events, such as global achievement, and an external, relatively unstable,
and specific cause for negative events such as a failed attempt of reaching a goal
Stellenbosch University http://scholar.sun.ac.za

32
(Seligman, 1990). The inference can thus be drawn that optimists attribute positive events to
personal, permanent and pervasive causes and interpret negative events in terms of
external, temporary and situation specific factors. In layman terms optimists can be defined
as “people who expect good things to happen to them” while pessimists are “people who
expect bad things to happen to them” (Carver & Scheier, 2005; p. 231). Scheier and Carver
(1993) define Optimism as a generalised expectancy that one will experience good
outcomes in life. This definition of Optimism was used in the development of the PsyCap
questionnaire (and construct). This definition makes no distinction regarding the agency
through which Optimism occurs, whether through the individual’s efforts, the efforts of
others, or outside forces. According to Scheier and Carver (1992) Optimism leads to
persistence in goal-directed striving and some authors have characterised Optimism as the
most powerful predictor of behaviour. Scheier and Carver (1985) further regard Optimism as
a goal-based construct which is present when an outcome has significant value. The theory
of dispositional Optimism (Scheier & Carver, 1985) states that one’s thoughts about the
future affect one’s circumstances because by expecting to do well, one will work more
effectively and persist more to achieve the set goals.
There are currently two main views of Optimism, one being an explanatory style and the
other a dispositional Optimism view. The explanatory style seeks to determine people’s
beliefs based on past experiences and constitutes a more indirect approach to studying
Optimism. It is based on an individual’s attributional style, i.e. formed by the way we perceive
or explain past life experiences. People who believe their past experiences were positive
and that negative memories were out of their control (external factors) are said to have a
positive explanatory style, or are deemed to be optimistic. Seligman (1998) believes there
are three major factors that determine what a person's explanatory style is: permanence,
pervasiveness, and personalisation. Permanence embodies the idea that people believe
they are the cause of negative events and that bad experiences will always be with them.
Such individual’s views are pessimistic in nature. The way we interpret and cope with life
events determines the way we let them interfere with our functioning. Speaking in terms of
"sometimes" and "under certain conditions" is healthier than using phrases such as "always"
and "forever” (Seligman, 1998, p. 44). The second factor in defining a person's explanatory
style, as described by Seligman (1998), is pervasiveness. Pervasiveness (specific vs.
universal) is based on the way individuals allow unfortunate circumstances to affect their
entire lives. Individuals who look at disappointment, such as getting a bad grade in a class,
as being a total failure in everything they do, will describe their misfortune in "universal"
terms. On the other hand, individuals who get a bad grade, and can isolate the bad grade to
Stellenbosch University http://scholar.sun.ac.za

33
just that grade, are said to be making a "specific" explanation of the event. The specific
pervasiveness style allows such individuals to not explain things in black and white terms
and view misfortunes as situation specific. Therefore, they are able to reinforce and enhance
the positive qualities that they do have; even when they are faced with negative life events
(Seligman, 1998, p. 47). The third and final part of a person’s explanatory style is
personalisation (internal vs. external). Personalisation deals with the way people describe
the cause of bad events. They either blame themselves (internal), which causes low self-
esteem, or they blame others (external), and tend to like themselves better.
The second type of Optimism, termed dispositional Optimism, attempts to study Optimism
through direct beliefs individuals have regarding future life events. These direct beliefs are
measured directly by using measures such as the Life Orientation Test-Revised (LOT-R;
Scheier et al., 1994). This approach is more focused on optimistic beliefs about future
events, compared with the attributional theory, which aims to understand why people are
optimistic or pessimistic and how they became that way. Through the direct beliefs optimistic
individuals have regarding their future events, optimists can easily be studied. It also allows
for studying Optimism with other known variables that promote psychological and physical
well-being (Scheier& Carver, 1992). However, only identifying the beliefs of Optimism and
not the causes, does not allow for the origin of negative belief systems to be studied.
Therefore, the use of an attributional style model appears to be a better way to understand
why people are optimistic or pessimistic, while the direct belief model is more capable of just
measuring if a person has an optimistic or pessimistic view of future events.
Gillham and Seligman (1999) stated that the beneficial effects of Optimism have been shown
to enhance one’s ability to deal with stress and depression. Seligman (1998) reported that
optimistic people experience less depression and increased enjoyment in social interaction.
This is due to their ability to expect positive future outcomes based on positive past
experiences.
2.5.2.2 Optimism and SWB
The positive psychology movement has built upon working towards the positive aspects of
‘human strengths and virtues’ (Sheldon & King, 2001) and the aspect of the human
conditioning that leads to happiness rather than being focused on healing (Seligman &
Csikszentmihalyi, 2000). The power of positive thinking to promote well-being is encouraged
with confident thoughts providing an optimistic outlook on life (Marshall, Wortman, Kusulas,
Hervig & Vickers, 1992). This stance is supported by Diener et al. (1999) which reported that
Optimism correlates significantly with SWB. Carver (2006) further states that because
Stellenbosch University http://scholar.sun.ac.za
34
optimists believe adversity can be handled successfully and because they expect good
outcomes, they are likely to experience a more positive mix of feelings. These positive
feelings experienced by individuals in their state of Optimism, is purely Hedonic, as the
absence of pain and the presence of pleasure and positivity are what is experienced. At the
opposing end, pessimists believe that the final result will be negative, causing these
individuals to be more susceptible towards the experience of negative emotions such as
anxiety, guilt, anger and grief (Carver & Scheier, 2004). The results of a meta-analysis on
“happiness” research clearly provided empirical support for the view that happy, positive
people have better physical and mental health (Lyubomirsky et al., 2005). According to
Strutton and Lumpkin (1992) optimists are expected to use more effective coping strategies
that may buffer them against the detrimental effects of stress and other strain-related
diseases associated with ill health, resulting in better well-being. Moreover, Gillham and
Seligman (1999) hold that the beneficial effects of Optimism have been shown to enhance
one’s ability to deal with stress and depression. Steyn (2011) included Optimism in her study
and measured it with the LOT-R (positive) scale. Occupational well-being was measured
with the General Health Questionnaire. The findings revealed that low to moderate
significant negative8 correlations between LOT-R scores and the GHQ subscales emerged:
GHQ Somatic symptoms (r = -.386, n = 202, p <.01), GHQ Anxiety (r = -.371, n = 202, p
<.01), GHQ Dysfunction (r = -.359, n = 202, p <.01), and GHQ Depression (r = -.433, n =
202, p <.01). Since higher scores on the GHQ as a clinical measure are indicative of the
possible presence of pathology (Goldberg, 1972), these negative correlations corroborate
the relationship between Optimism and good Psychological Health. Steyn (2011) thus found
full support for the hypothesis that a positive relationship exists between Optimism and
general Psychological Health, defined as a component of Occupational Well-being.
Moreover, the results of the structural model indicated that Optimism directly predicted
Psychological Health, as measured by the GHQ, as well as through an indirect link through
Engagement. Optimism furthermore, had an indirect effect on Satisfaction with Work-Life
through Engagement and Organisational Commitment (Steyn, 2011).
The effect of Optimism on Psychological Health has also been studied by Taylor, Kemeny,
Reed, Bower and Gruenewald (2000). Their research suggested that if an individual can
practise optimistic habits then they can enhance their Psychological Health. Positive and
optimistic thoughts are deemed to have protective psychological effects on preserving
mental health as well as improving it (Taylor, et al., 2000). Furthermore, research by Carver
8 Lower scores on the GHQ scale indicate better psychological health.
Stellenbosch University http://scholar.sun.ac.za

35
and Scheier (2002) has confirmed that positive thinking impacts the way that individuals
respond to difficult situations.
Lyubomirksy, Dickerhoof, Boehm and Sheldon (2011) conducted an 8-month-long
experimental study to examine the immediate and longer term effects of regularly practicing
two assigned positive activities of which ‘expressing Optimism’ was one. It was found that
the amount of effort that participants applied to the intervention activities, including imagining
their best possible future, was directly related to improvements in their subsequent well-
being. Lucas, Diener, and Suh (1996) revealed that Optimism correlates with measures of
SWB such as life satisfaction, pleasant affect and unpleasant affect. It is, therefore,
proposed in this study that higher levels of Optimism would be related to higher levels of
HWB, i.e. an increase in self-reported Positive Affect and a decrease in self-reported
Negative Affect.
Hypothesis 9: In the proposed PWBW model it is hypothesised that Optimism
positively influences PA.
Hypothesis 10: In the proposed PWBW model it is hypothesised that Optimism
negatively influences NA.
Scheier and Carver (1985) have referred to Optimism as a goal-based construct which is
present when an outcome has significant value. This leads to the argument that Optimism
has to be present when individuals engage in a meaningful task, as they have to be
optimistic to achieve the outcome they desire. Optimism is a generalised tendency to expect
favourable outcomes in one’s life (Scheier & Carver, 1985). Specifically, those who believe
that positive outcomes will follow when working towards a goal are more likely to achieve
their goal, whereas, those who expect failure are more likely to disengage from their goal.
This pattern leads optimists to achieve their goals more often than pessimists. Scheier and
Carver (1993) reviewed findings showing that optimists maintain higher levels of SWB when
facing a stressor. Scheier, Weintraub, and Carver (1986) found that optimists tend to use
problem-focused coping, seek social support, and emphasise positive aspects of the
situation upon encountering difficulties. Pessimists tend to use denial, focus on stressful
feelings, and disengage from relevant goals. It appears that those who think positively use
more effective forms of coping.
It could therefore be proposed that Optimism may be a significant contributor to EWB as it
can be argued that Optimism may affect several of the EWB’s core dimensions. For
example, it could be argued that the achievement orientation of optimistic individuals could
Stellenbosch University http://scholar.sun.ac.za

36
enhance / impact on the sense of mastery and competence such individuals experience in
managing their environments (Environmental Mastery). Optimists’ ability to easily make
decisions will possibly lead to an increase in Autonomy, i.e. being self-determined and
independent (Ryff, 1989) and thereby making decisions without being pressured by social
forces. Furthermore, the optimists’ belief that people are inherently good may possibly lead
to higher levels of Positive Relations with Others, as they should more easily form warm
satisfying relationships with others due to being more concerned about others’ welfare (Ryff,
1989).
Hypothesis 11: In the proposed PWBW model it is hypothesised that Optimism
positively influences EWB.
Scheier et al., (1986) revealed that optimists seek social support. A supportive climate may
create positive conditions which will allow PsyCap to flourish (Luthans, Avolio, Avey &
Norman, 2007b). When it comes to optimists in the organisation, mistakes are more likely
attributed to external, unstable and specific causes. If employees make mistakes in a
supportive climate, the climate may contribute to them feeling confident in their abilities,
allowing them to attribute failures to external circumstances vs. low personal knowledge,
skills and abilities (Luthans et al., 2007b). Following this argument, because of the positive
attributional style held by such individuals, they will more easily perceive the working
environment to be supportive than their pessimistic counterparts. It is therefore argued that
Optimism will lead to Perceived Organisational Support (POS)9.
Hypothesis 12: In the proposed PWBW model it is hypothesised that Optimism
positively influences POS.
2.5.2.3 Optimism in the Workplace
In the workplace, optimistic employees tend to use more problem-solving techniques to deal
with stressful or difficult tasks, whereas pessimists were found to make more use of avoidant
behaviours, such as overeating, sleeping and drinking (Strutton & Lumpkin, 1992). A study
was conducted by Phelps and Waskel (1994) to determine the relationship between
Optimism and increased performance and production. Among women between the ages of
40 and 75 years old, those who had a more positive explanatory style were found to be more
9 Perceived Organisational Support (POS) refers to employees’ perception concerning the extent to which the organisation values their contribution and cares about their well-being (Eisenberger, Huntington, Hutchinson & Sowa, 1986). This construct will be introduced at a later stage in this chapter.
Stellenbosch University http://scholar.sun.ac.za

37
productive at work, enjoyed being at their job and were more creative with their skills. Other
research on Optimism in the workplace has examined the physical and psychological health
of women. A study by Fry (1995) aimed to determine if Optimism played a role in the
physical and psychological health of women executives in Canada. The participants were
104 women with 79% between the ages of 36 and 52. Various assessment tools were used
to determine levels of Optimism, self-esteem, and physical complaints. The authors
measured Optimism using the Life Orientation Test (LOT). Self-esteem was measured by
the Rosenberg Self-Esteem Inventory (RSEI) and health was assessed by the Health
Opinion Survey (HOS). Results of the study found that Optimism was associated with higher
self-esteem, less physical complaints, and lower burnout rates among the women
executives. The researchers point out that these findings have important implications for
helping women acclimate to both the psychological and physical stressors in high stress
jobs. This research suggests that developmental interventions and prevention programs,
focused on increasing Optimism levels to enhance the physical/Psychological Well-being of
employees, may lead to increased production and satisfaction in the workplace.
2.5.3 Self-efficacy
2.5.3.1 Self-efficacy Defined
According to Luthans et al., (2007b) PsyCap was founded on theoretical frameworks that
have been widely recognised. One of the frameworks is Bandura’s (1986) Social Cognitive
Theory. Self-efficacy expectations, according to Bandura (1977, 1986), can be defined as
one’s belief of being able to cope with specific tasks and situational demands. Bandura
(1986) further postulates that Self-efficacy operates as a cognitive mechanism through which
perceived controllability reduces stress reaction. The concept has its roots in Bandura’s
Social Learning Theory and can also be defined as one’s confidence in one’s ability to
mobilise the motivation, cognitive resources, and courses of action necessary to execute a
specific course of action within a given context (Stajkovic & Luthans, 1998). Those
individuals who are high on Self-efficacy tend to choose more challenging tasks and
activities, extend their motivation and effort to successfully accomplish their goals and
persevere when faced with obstacles (Luthans & Youssef, 2004).
The early development of the Self-efficacy theory was influenced primarily by two interacting
factors (Bandura, 1977). It was firstly influenced by the development of the capacity for
symbolic thought, particularly the capacity for understanding cause-and-effect relationships
and the capacity for self-observation and self-reflection. In infancy, one starts to develop a
sense of personal agency. This moves from the perception of the causal relationship
between events, to an understanding that actions produce results, to the recognition that
Stellenbosch University http://scholar.sun.ac.za

38
one can produce actions that cause results. Secondly, the development of Self-efficacy is
influenced by the responsiveness of environments, particularly social environments, to the
youngster’s attempts at manipulation and control. Those environments that are responsive to
the child’s action facilitate the development of efficacy beliefs, where non-responsive
environments will inhibit this development. Efficacy beliefs and a sense of agency continue
to develop throughout the life-span as one integrates information from five primary sources,
i.e. performance experiences (successful attempts at control that one attributes to one’s own
efforts will strengthen Self-efficacy for that behaviour or domain); vicarious experiences
(one’s observations of the behaviour of others and the consequences of those behaviours);
imaginal experiences (imagining oneself or others behaving effectively or ineffectively in
hypothetical situations); verbal persuasion (what others say to one, regarding what they
believe one can or cannot do), and physiological and emotional states (influence Self-
efficacy when one learns to associate poor performance or perceived failure with aversive
physiological arousal and success with pleasant feeling states) (Bandura, 1997).
Self-efficacious individuals have specific traits and characteristics. According to Luthans et
al., (2007c) these individuals can be identified or distinguished by five important
characteristics. They (1) set high goals for themselves and select themselves to enter these
difficult tasks; (2) they welcome and thrive on challenges; (3) these individuals are highly
self-motivated; (4) they devote the required effort to accomplish the tasks; and (5) they will
persevere when faced with obstacles (Luthans, et al., 2007a). These individuals will
continuously challenge themselves with higher self-set goals by seeking and voluntarily
opting for difficult tasks (Luthans, et al., 2007a). These individuals thus have the ability to
persevere in their goal-directed behaviour.
Self-efficacy theory has proposed that all forms of psychotherapy and behavioural change
operate through a common mechanism: the alteration of the individual’s expectations of
personal mastery and success (Bandura, 1977). According to this theory, two types of
expectancies exert powerful influences on behaviour, namely outcome expectancies and
Self-efficacy expectancies. The former refers to the belief that certain behaviours will lead to
certain outcomes; and the latter that one can successfully perform the behaviour in question
(Sherer, et al., 1982).
One last theoretical comment that needs to be made regarding the conceptualisation of this
construct is that it exists in two forms; namely specific Self-efficacy (SSE) and general Self-
efficacy (GSE). The former refers to efficacy beliefs that are task specific, where the latter
refers to the concept in a more global nature. Both forms have self-confidence as the basis
Stellenbosch University http://scholar.sun.ac.za

39
of self-evaluation. Although originally described as applying to a very specific domain of
activity, there is increasing recognition that individuals can also have a “generalised” level of
Self-efficacy across a common domain of challenges and tasks, such as the workplace
(Parker, 1998). GSE is a motivational state as it involves the individual’s beliefs regarding
their abilities to perform and succeed at tasks across different situations (Kanfer &
Heggestad, 1997).
2.5.3.2 Self-efficacy and SWB
Research has indicated that high levels of Self-efficacy constantly enable individuals to
confront formerly fear and anxiety provoking stimuli (Bandura, 1977). Jex and Bliese (1999)
conducted research on the buffering effect of Self-efficacy with regards to the negative
impact of work stressors of the Psychological Well-being of employees. It was argued that
individuals high on Self-efficacy are more likely to confront their stressors, while those low on
Self-efficacy are more likely to be consumed by it (Kinicki & Latack, 1990). Therefore, by
relying on their problem-focused coping, employees higher on Self-efficacy are better
equipped to have more adaptive reactions to setbacks and stressors in their work
environment, and are accordingly more likely to preserve healthy levels of SWB (Sivanathan,
Arnold, Turner & Barling 2004). It has also been determined by previous research that Self-
efficacy affects positive adaptation to healthy actions, as well as the facilitation of
constructive behavioural modifications when confronted with adversity. On a physiological
level Bandura (1977) has argued that high levels of Self-efficacy can initiate the emission of
catecholamine and serotonin within the human body. Catecholamine is crucial to the
effective stress management while serotonin is known as the “happy hormone” which allows
us to feel moments of ecstasy.
The ability of highly efficacious individuals to foster feelings of competence in particular
domains through the extent of effort, may accordingly lead them to flourish and expect
similar, positive outcomes in future (Bandura, 1986). Hence, they may be better equipped to
regulate their personal notions of perceived stress and strain (Bandura, 1997). Steyn (2011)
stated that individuals high on Self-efficacy may exhibit better Psychological Well-being,
simply because after having failed once, they will continue to persist in their efforts without
being burdened by feelings of inadequacy and low self-worth that are often associated with a
lack of mental well-being. Research has indicated that individuals with high levels of Self-
efficacy are much more confident and more self-assured in their ability to accomplish goals.
This consequently makes them achievers within the organisational setting (Stajkovic &
Luthans, 1998). It could be argued that this central role of self-regulation and motivation,
together with confidence being embedded in the construct will lead to certain dimensions of
Stellenbosch University http://scholar.sun.ac.za

40
EWB. It could, firstly, lead to Environmental Mastery in the sense that the self-regulation and
motivation component might lead the individual to make effective use of surrounding
opportunities and will be able to develop a sense of mastery and competence in managing
their environment (Ryff, 1989). Furthermore, it could facilitate more Autonomy as the self-
regulation will lead to a sense of independence. Individuals higher in Self-efficacy might also
more readily develop a positive attitude toward the self; acknowledge and accept multiple
aspects of self, including good and bad qualities i.e., the Self-Acceptance component of
EWB. Self-efficacy equip individuals with the confidence that they can utilise the necessary
skills for coping with stress, engage in self-regulation and mobilising the resources required
to meet situational demands (Chen, Gully & Eden, 2001). For this reason, it is argued in this
study that Self-efficacy will positively influence EWB.
Hypothesis 13: In the proposed PWBW model it is hypothesised that Self-efficacy
positively influences EWB.
On the other hand, it has been shown that low levels of Self-efficacy have been found in
depression patients (Bandura, 1997; Maddux & Meier, 1995). Maddux (2004) have argued
that this is due to their incapability to effectively cope in important domains of life. High
frequencies of experienced anxiety and avoidant behaviour are most likely to manifest in
those persons possessing low Self-efficacy beliefs about their coping skills in situations that
appear as threatening (Bandura, 1997). Bandura (1997) further states that this experienced
anxiety can further lead to reduced performance, which subsequently further reduces one’s
perceived competence within a particular domain. The argument can thus be reversed that
individuals having high Self-efficacy beliefs will have low levels of depression and anxiety
and therefore exhibit lower levels of Negative Affect (NA).
Hypothesis 14: In the proposed PWBW model it is hypothesised that Self-efficacy
negatively influences NA.
The feeling that an individual holds that is needed to accomplish important goals, termed
Self-efficacy, has been shown to predict life satisfaction and positive emotions (Feasel,
1995). Additionally, Feasel (1995) showed that experiencing higher Self-efficacy towards
more important goals was a stronger predictor of well-being, than experiencing Self-efficacy
in relation to less important goals. This demonstrates that feeling efficacious is important in
terms of well-being, but also highlights the need to feel competent in areas of life that one
feels are significant. In addition, there are considerable evidence regarding the positive
effects of Self-efficacy on performance and well-being in different domains, including the
Stellenbosch University http://scholar.sun.ac.za

41
workplace (Bandura, 1986). These positive emotions relate to HWB. It can thus be argued
that Self-efficacy will have a positive effect on the Positive Affect component of SWB.
Hypothesis 15: In the proposed PWBW model it is hypothesised that Self-efficacy
positively influences PA.
2.5.3.3 Self-efficacy in the Workplace
Stajkovic and Luthans (1998; p. 66) define the concept of Self-efficacy in the workplace as
“one`s conviction (or confidence) about his or her abilities to mobilize the motivation,
cognitive resources or courses of action needed to successfully execute a specific task
within a given context.” According to this definition Self-efficacy may play a central role in the
development of occupational stress. Occupational stress will occur when an individual
perceive the demands of their environment as exceeding their coping ability and resources,
while Self-efficacy refers to the person’s belief about their ability and cognitive resources.
Therefore, Self-efficacy can act as a buffer against the development of occupational stress.
Self-efficacy is the PsyCap construct that has the strongest theoretical underpinning. This
statement is based on the extensive theory building and empirical research of well-known
social psychologist Albert Bandura (1997) and the meta-analysis of 114 studies that found a
positive 0.38 relationship between efficacy and work-related performance (Stajkovic &
Luthans, 1998). In the workplace, high efficacious individuals will show extra effort and
tenacious perseverance in accomplishing a given task. It is expected that individuals who
have the belief in their capabilities to complete a task will put a lot of effort into that task and
display higher levels of Engagement (Stajkovic & Luthans, 1998).
The strength of an individual’s conviction in their own effectiveness is likely to affect whether
they will try to cope with a given situation (Bandura, 1977). In the workplace, those
individuals with high efficacious beliefs will be more likely to engage in difficult tasks and
have a higher threshold towards stress. People fear and tend to avoid threatening situations
they believe exceed their coping skills, whereas they get involved in activities and behave
assuredly when they judge themselves capable of handling situations that would otherwise
be intimidating. Efficacy expectations determine how much effort people will expend and
how long they will persist in the face of obstacles and aversive experiences (Bandura, 1977).
In a study conducted by Matsui and Onglatco (1992), it was found that higher Self-
efficacious women, equipped with the knowledge that they have the capability to handle
heavy job demands, should be able to develop strategies to cope with these demands.
These strategies can involve changing the degree of effort exerted, decrease the allocated
Stellenbosch University http://scholar.sun.ac.za

42
time needed to complete tasks, etc. On the other hand, people with low Self-efficacy
expectations will tend to submit to the pressure brought about by the heavy work demands.
2.5.4 Resilience
2.5.4.1 Resilience Defined
The Resilience construct incorporated into the PsyCap construct is based on the work of
Wagnild and Young (1993). Resilience is defined as the positive psychological capacity to
rebound, to bounce back from adversity, uncertainty, conflict, failure or even positive
change, progress and increased responsibility (Luthans, 2002a). Individuals with high
resiliency have the ability to cope and adapt more easily during risk and adversity (Masten,
2001; Masten & Reed, 2002). Bandura and Locke (2003) state that individuals high on
Resilience believe they have what it takes to succeed. High Resilience provides the
necessary staying power in the face of repeated failures, setbacks, and sceptical or even
critical reactions that are inherently discouraging. Even during highly changing and uncertain
situations, Resilience help individuals to be more flexible and to adapt themselves (Coutu,
2002). High-Resilience individuals literally bounce back from setbacks and difficult situations
(Tugade & Fredrickson, 2004). It can also be said that these individuals display “the capacity
to remain well, recover or even thrive on adversity” (Hardy, Concato & Gill, 2004, p. 257).
People that are high on Resilience tend to be more effective in a variety of life experiences,
including adjustment and development, especially under life-course threatening conditions
(Block & Kremen, 1996; Coutu, 2002; Masten 2001). The concept Resilience, therefore,
helps us to understand why one person reacts in a stressed way to an objectively minor
event when someone else may not experience distress even in the face of apparent
misfortune (Dyer & McGuinness, 1996). Something very unique to individuals with high
levels of Resilience is that after a negative event, the employee rebounds to a higher level of
motivation, therefore rebounding beyond homeostasis (Richardson, 2002). High-Resilience
individuals also have (a) a firm acceptance of reality, (b) a deep belief, often supported by
strongly held values, that life is meaningful and (c) an astounding ability to improvise and
adapt to significant change (Coutu, 2002).
2.5.4.2 Resilience and SWB
Fredrickson et al., (2003) found a significant relationship between Resilience and stress in
that highly resilient individuals exhibited faster psychological and emotional recovery from
stress. Research indicates that resilient individuals are better equipped to deal with the
stressors in a constantly changing workplace environment, as they are open to new
experiences, are flexible to changing demands, and show more emotional stability when
Stellenbosch University http://scholar.sun.ac.za

43
faced with adversity (Tugade & Fredrickson, 2004). It could thus be argued that individuals
with a higher level of Resilience would be more likely to experience less occupational stress.
It could, furthermore, be argued that when these individuals do experience stress, their
ability to better cope with these demands may protect them to a certain extent from the
development of burnout. It has also been shown that elasticity, a latent variable consisting of
measures of ego Resilience, ego control and hardiness; negatively predict emotional
distress (Gramzow, Sedikides, Panter, & Insko, 2000). This supports the hypothesis that
more Resilience will result in increased well-being. In this study it is argued that Resilience
will affect EWB, as being resilient, i.e. going “back” into (sometimes very negative)
circumstances to continue to face the setback or difficulties is about persevering in doing
what is right and virtuous, without experiencing direct positive feelings. Such Resilience
rather becomes a motivation, coming from within an individual, of doing what needs to be
done to accomplish a certain goal (EWB). It has been also shown that resilient individuals
have zestful and energetic approaches to life, and they are curious and open to new
experiences (Klohnen, 1996; Masten, 2001; Werner & Smith, 1992; Wolin & Wolin, 1993).
Ryff, Singer, Love and Essex (1998) discussed Resilience and adult life in terms of
psychological well-being. They define Resilience in terms of 1) positive reactions to adverse
events and stress, 2) the ability to function and adapt following incapacity, and 3) retained
competence under adversity. Resilience, according to these authors (Ryff, et al., 1998) is
more than just the absence of illness, it is the ability to flourish after hardship and stress,
more specifically, moving toward a state of physical, mental and emotional well-being. It is
thus evident that Resilience could influence certain EWB dimensions, of which the most
obvious one is Environmental Mastery. It could be argued, for example, that being able to
cope with adversity will help individuals in managing their environment and thereby to control
a complex array of external activities. These individuals will have the competency to regulate
behaviour from within (Autonomy) and will change and grow as a result of the faced
adversity in ways that reflect more self-knowledge and effectiveness (Personal Growth).
Resilience is an inner strength guided by a positive mind-set, individuals high on Resilience
might thus find meaning in their suffering or adversity. They might see this perceived
meaning as a possible resource aiding them in overcoming the adversity (Purpose in Life).
With this mind-set, individuals will accept that “everything happens for a reason” leading
them to feel positive about past life experiences and accepting themselves for who they are
(Self-Acceptance). These individuals might further use the resources available to them as a
means of overcoming their hardships, one of which could be support from others, which will
lead them to have positive relations with others and thereby forming warm and trusting
Stellenbosch University http://scholar.sun.ac.za

44
relationships with others (Positive Relations with Others). It can therefore be argued that
Resilience will have a positive influence on EWB.
Hypothesis 16: In the proposed PWBW model it is hypothesised that Resilience
positively influences EWB.
2.5.4.3 Resilience at Work
Resilience is also found in the workplace. Employees are now experiencing more stress than
at any other time in history. Not only are employees experiencing more jobs throughout their
life time, but downsizing and the resulted lay-offs also tend to put more strain and pressure
on (remaining) employees. These increasing levels of stress point to the importance of
having and developing resilient employees (Luthans, Vogelgesang & Lester, 2006).
Resiliency has been correlated with work performance (Luthans, Avolio, Walumbwa & Li,
2005). Moreover, organisations that have developed Resilience in their employees have
shown to be more adaptive and successful over time (Luthans et al., 2005). A bad
experience or failure on a task in an individual’s organisational life does not have to be a
reason for career derailment. Resilient employees may use an adverse experience to
increase performance on subsequent tasks and may actually be more valuable to the
organisation in terms of their adaptability in times of subsequent change or uncertainty
(Hind, Frost & Rowley, 1996).
2.5.5 Hope, Optimism, Self-efficacy and Resilience
When it comes to the interplay between the four PsyCap constructs, Cozzarelli (1993) stated
that psychological resources seem to act in concert, as many of the psychological resources
are related. This suggests that if an individual is high in one psychological resource, they are
often high on the others as well. Before discussing the interplay between the four PsyCap
constructs, it is important to mention that their empirically based discriminant validity has
been proven in various studies and by various researchers internationally (Bandura, 1997;
Luthans & Jensen, 2002; Luthans, et al., 2007c; Snyder 2000, 2002) and also in South
Africa (Görgens-Ekermans & Herbert, 2013). It is proposed that PsyCap presents the
common source variance (i.e. common mechanistic processes) connecting the four
constructs of Hope, Optimism, Self-efficacy and Resilience (Luthans et al., 2007b). It is this
common underlying link that runs between the four constructs that ties them together into a
higher-order core factor. As indicated in the definition of PsyCap, this commonality or
underlying link is a mechanism shared across each of the facets that contribute to a
motivational propensity to accomplish tasks and goals (Luthans et al., 2007b). In addition,
theoretical support for PsyCap as a second-order core construct can be found in
Stellenbosch University http://scholar.sun.ac.za

45
psychological resources theory (Hobfoll, 2002), as well as Fredrickson’s (2001) Broaden-
and-Build theory. Fredrickson (2001) confirms that these constructs acts in a synergistic way
and therefore act in an integrated, interactive, and broadening way with its factors of Hope,
Optimism, Self-efficacy and Resilience in the motivated and motivating pursuit of success
and desirable organisational outcomes (Luthans, et al., 2007b; Luthans & Youssef, 2007;
Luthans, et al, 2007c).
Law, Wong and Mobley (1998) have also recommended that multidimensional constructs
such as psychological resources, like PsyCap, may be better understood in terms of an
underlying core factor. This is especially evident when constructs are highly related, yet
integrated with each other, like PsyCap is. For example, faced with a setback, if highly
resilient employees with the ability to bounce back are also self-efficacious and highly
hopeful, they will most probably be motivated to persist and put forth the required effort to
overcome the problem. In addition, they would also pursue alternate pathways in order to
return to their original level of functioning or beyond where they were before the adverse
event. Moreover, those high in Optimism may have a positive perspective in general, but
combined with Self-efficacy and Hope, may also have the persistence to pursue many
alternative pathways when necessary to achieve their optimistic expectations and goals
(Herbert, 2011).
Snyder (2000) found that individuals high in Hope tend to be more confident on specific
tasks (Self-efficacy) and will be able to quickly bounce back (Resilience) after temporary
hopelessness. In accordance with Snyder (2000), Bandura (1997) has also shown that those
high in Self-efficacy will be more resilient to adversity. Moreover, according to Luthans,
Avey, Avolio, Norman and Combs, (2006) Self-efficacy training can also help develop and
build Optimism. In addition, Hope training can have a positive impact on Optimism
development. Furthermore, in a study by Magaletta and Olivier (1999) significant positive
relationships between Hope (measured by the Hope Scale; Snyder, et al., 1991) and
Optimism (measured by the LOT; Scheier & Carver, 1985) (r = .550, n = 204, p<0.001),
between Hope and Self-efficacy (measured by the SES; Sherer et al., 1982) (r = .592, n =
204, p<0.001) and between Self-efficacy and Optimism (r = .507, n = 204, p<0.001)
emerged. Similar results between Hope and Optimism were also reported by Holleran and
Snyder (1990) as well as Scheier and Carver (1985). It was argued that these associations
are due to the fact that that all three concepts (Hope, Optimism and Resilience) are
conceptually tied to positive expectancies for the future. They concluded that their findings
provided evidence that Hope, Optimism and Self-efficacy are related but not identical
constructs. This was further corroborated by the multiple regression analysis results which
Stellenbosch University http://scholar.sun.ac.za

46
indicated that all three constructs made a unique contribution in the prediction of well-being
(measured by the General Health Questionnaire; Goldberg, 1972). Other research that
confirms the strong relationships between the four constructs comprising PsyCap was
conducted by Luthans et al. (2007c). They conducted two studies to analyse the PCQ-24
(Luthans et al., 2007b) and test their various hypotheses related to it. Strong correlations
emerged from the data analysis of Study 1 between Hope and Optimism (r = .61, n = 115,
p<0.01), Hope and Self-efficacy (r = .51, n = 115, p<0.01), Hope and Resilience (r = .47, n =
115, p<0.01), Optimism and Self-efficacy (r = .44, n = 115, p<0.01), Optimism and
Resilience (r = .49, n = 115, p<0.01) as well as between Self-efficacy and Resilience (r = .40,
n = 115, p<0.01). Similar results were found in study 2, as significant relationships between
all of these constructs emerged in a similar fashion.
Although these four constructs are very similar in certain aspects, it is important to clearly
distinguish between them in order not to proxy an already existing theory (Snyder et al.,
2005). Hope, for example, has various similarities with Optimism. Although these two
constructs share a common perspective regarding the importance of expectancies and both
are within the context of goal-directed behaviour, the two constructs differ in how the
expectancies operate. Scheier and Carver (1985) defined Optimism as a generalised
expectancy that one will experience good outcomes in life and that Optimism leads to
persistence in goal-directed striving. Whereas Snyder’s agency component of Hope is
similar to this expectancy explanation, the pathway component is not explicitly addressed by
Optimism theory. Even though an optimist may believe that “good things will result,” he or
she may lack the vital pathway thinking (i.e. the ability to generate new alternative paths)
needed to overcome barriers and attain the desired result. In other words, Optimism has the
willpower of Hope, but not the waypower (Luthens & Jensen, 2002). Another distinction is
found in the agency through which outcomes will occur, whether through the individual’s own
effort, the efforts of others, or outside forces. According to Snyder (2000), Optimism and
Hope diverge in that Optimism includes expectations about outcomes obtained through
others and forces outside the self, whereas Hope draws from the agency within the
individual. The pathway component of Hope pertains uniquely to the outcomes obtained and
the actions initiated by the self. Again, Hope theory explicitly emphasises the iterative,
combined impact of the willpower and the waypower processes. Although optimists believe
that good things will happen to them, a theoretical analysis indicates Optimism per se does
not imply clear plans for where one wants to go, and when optimists encounter obstacles,
they may get stuck or give up. A hopeful person, as opposed to an optimistic one, the theory
Stellenbosch University http://scholar.sun.ac.za

47
would predict, is adept at thinking of ways around the obstacles and thus is better equipped
to deal with stressful, negative situations (Luthans & Jensen, 2002).
According to Bandura (1997) for Self-efficacy to be activated, a goal-related outcome must
be important enough to capture attention, which is similar to the premise held in the Hope
theory. The goals emphasis parallels Hope theory, but it differs in that for Hope theory there
may be enduring, cross-situational and situational goal-directed thoughts. Within Self-
efficacy theory, the person is posited to analyse the relevant contingencies in a given goal
attainment situation (called outcome expectancies, somewhat similar to pathways thoughts
in the Hope theory). Relative to the outcome expectancies wherein the focus is on the given
contingencies, pathway thinking reflects the self-analysis of one’s capabilities to produce
initial routes to goals, as well as additional routes, should the first become impeded.
Thereafter the person is hypothesised to evaluate his/her capacity to carry out the actions
inherent in the outcome expectancies (called efficacy expectations, with some similarity to
agency thought). Whereas the efficacy expectancy emphasis the personal perception about
how a person can perform the requisite activities in a given situational context, Hope theory
emphasises the person’s self-referential belief that he/she will initiate and continue the
requisite actions (Snyder et al., 2005). Magaletta and Oliver (1999) reported that Hope
accounted for unique variance, independent of Self-efficacy, in predicting well-being and that
the factor structure of the two constructs varies. One final difference is that Bandura’s Self-
efficacy theory does not address the issue of emotions per se, whereas Hope theory gives
an explicit hypothesis about emotions being the result of goal-directed behaviour.
Bandura (1997) made a distinction between efficacy expectations (a person’s confidence
that he/she has the ability to successfully perform a specific task) and outcome expectancies
(a person’s belief that a specific behaviour will produce a given outcome). The agency
component of Hope is on the surface similar to Bandura’s notion of efficacy expectations,
and outcome expectancies appear similar to the pathways component of Hope. Snyder
(2000) acknowledged that Bandura’s theory noted the bi-directionality of efficacy and
outcome expectancies, but emphasised that Bandura (1997) asserted the efficacy
expectations (i.e., Self-efficacy) to be a stronger predictor of behaviour than outcome
expectancies. Snyder’s Hope theory, in contrast, posits that agency and pathway are equally
essential and operate in a combined, iterative manner. Also, Bandura has emphatically
asserted that efficacy expectancies are situation specific, whereas Snyder’s Hope theory
takes a cross-situational perspective.
Stellenbosch University http://scholar.sun.ac.za

48
Bandura (1977) stated that performance accomplishments are based on personal mastery
experiences and successes raise mastery expectations; repeated failures lower them,
particularly if the mishaps occur early in the course of events. After strong efficacy
expectations are developed through repeated success, the negative impact of occasional
failures is likely to be reduced (Bandura, 1977). Efficacy expectations determine how much
effort people will expend and how long they will persist in the face of obstacles and aversive
experiences (Bandura, 1977).
Based on this discussion it is clear that the four PsyCap constructs share a lot of variance,
primarily reflected in the higher order PsyCap construct. However, it is also clear from the
discussion that there are fundamental differences between the four individual constructs.
Because of the current research compilation in this domain there is no question that the four
individual constructs are interrelated. The nature of these interrelationships has been
substantiated by correlation studies (Gorgens-Ekermans & Herbert, 2013; Luthans et al.,
2007a; Luthans et al., 2007b) as well as some recent SEM studies that have started to
emerge (e.g. Prinsloo, 2013). Given the fact that it is well known that these constructs are
interrelated, it was decided to not hypothesise any paths between the PsyCap four
constructs, themselves, in this study (and therefore in the model). This was done in the
interest of allowing for other paths in the model, without ending up with an almost fully
saturated, extremely complex model to be fitted to the data. Research clearly indicates that
the probability is high that significant paths will be found, but as this study has the aim of
proving incremental findings on the relationships between the PsyCap constructs and other
well-being variables, it was decided rather to omit these paths (between the PsyCap
constructs themselves) from the model.
2.6 GRATITUDE
Gratitude, which is mainly viewed as an affective state, also called grateful disposition or
disposition toward Gratitude, can be defined as a generalised tendency to recognise and
respond with grateful emotions to the roles of other people’s benevolence in the positive
outcomes that one obtains (McCullough, et al., 2002). The essential message of Gratitude is
that a life orientated around gratefulness is the solution for insatiable yearnings and life’s ills.
Moreover, highly grateful people may possess a worldview in which everything they have,
and even life itself, is a gift. This level of appreciation for the good things in life may lead
grateful people to avoid taking benefits for granted. In this sense, they always have a sense
of appreciation for what they have and never accept it as mere possessions that they
deserve or earned. This may help sustain their happiness and SWB (McCullough et al.
Stellenbosch University http://scholar.sun.ac.za

49
2002). A grateful response to life, can lead to peace in mind, happiness, physical health, and
deeper more satisfying personal relationships (Emmons & McCullough, 2003).
It is known that affective traits lower one’s threshold for experiencing certain emotional
states (Rosenberg, 1998). For example, hostility lowers the threshold for experiencing anger.
Insofar as the Gratitude disposition creates a reduced threshold for recognising and
responding with Gratitude to the role of other people’s benevolence in one’s positive
outcomes, this disposition might cause several discrete emotional experiences (McCullough
et al. 2002). In other words, it will lower the threshold to experience Gratitude more
frequently and more easily. Although a variety of life experiences can elicit feelings of
Gratitude, prototypically Gratitude stems from the perception of a positive personal outcome,
not necessarily deserved or earned, but that is due to actions of another person. Gratitude
has been defined as “the willingness to recognize the unearned increments of value in one’s
experience” (Bertocci & Millard, 1963, p. 389), and “an estimate of gain coupled with the
judgment that someone else is responsible for that gain” (Solomon, 1977, p. 316).
Certain elements in Gratitude exist that seems not to be distinct, but rather co-occurring. The
first facet of the grateful disposition is called ‘intensity’. A dispositionally grateful person who
experiences a positive event is expected to feel more intensely grateful than would someone
less disposed towards Gratitude. A second facet can be called ‘frequency’. A dispositionally
grateful person might report feeling grateful many times a day and Gratitude might even be
elicited by even the simplest favour or act of politeness. A third facet is called ‘span’.
Gratitude span refers to the number of life circumstances for which a person feels grateful at
a given time. Dispositionally grateful people might be expected to feel grateful towards a
variety of domains, e.g. their families, their jobs, their health and life itself, along with a
variety of other benefits. A fourth aspect is called ‘density’, which refers to the number of
people to whom one feels grateful for a single positive outcome. When asked to whom one
feels grateful for a single positive outcome, a dispositionally grateful person might list many
other people than a less disposed grateful person (McCullough et al. 2002).
A grateful response to life circumstances may be an adaptive psychological strategy and an
important process by which people positively interpret everyday experiences. The ability to
notice, appreciate, and savour the elements of one’s life has been viewed as a crucial
determinant of well-being (Bryant, 1989; Janoff-Bulman & Berger, 2000; Langston, 1994).
Recent research in mainstream psychology suggests that Gratitude plays a role in promoting
psychological and physical well-being (Emmons & McCullough, 2003). Based on a series of
self-report assessments, McCullough et al. (2002) found that a disposition of Gratitude is
Stellenbosch University http://scholar.sun.ac.za

50
positively associated with Positive Affect, well-being, pro-social traits, and spirituality. In
another study Emmons and McCullough (2003) also found that an intentional grateful focus
for daily life circumstances may be a useful cognitive appraisal strategy that can positively
impact long-term levels of well-being. Lyubomirsky, et al., (2005) conducted two 6-week-long
interventions that isolated two specific activities thought to enhance well-being, committing
acts of kindness and “counting one’s blessings”. The one relevant here, “counting one’s
blessings”, was based on previous research demonstrating that Gratitude can bolster
feelings of satisfaction and well-being (Emmons & McCullough, 2003). In this study,
participants were instructed to regularly think about things for which they were grateful (e.g.
“a healthy body”, “my mother” and “having a Valentine”) and it was found that Gratitude did
enhance levels of well-being. These levels of well-being can be related to increased levels of
PA, as being grateful will elicit positive feelings and emotions.
There are two reasons why this specific construct are deemed important to this study. Firstly,
Weiner (1986) proposed that when people recognise that they have obtained a positive
outcome (i.e. exhibit Gratitude), it causes happiness. Given that happiness is interpreted as
falling under the umbrella term of SWB – i.e. HWB, it may be expected that Gratitude could
be a direct antecedent to HWB. Secondly, people experiencing Gratitude, attribute the
happiness they experience to an external source, e.g. they feel that someone has
contributed or even given them the moment of happiness and then they feel grateful towards
that person/object. Consequently, happiness stems from Gratitude. Therefore it is proposed
that Gratitude will have a direct positive effect on PA.
Hypothesis 17: In the proposed PWBW model it is hypothesised that Gratitude
positively influence PA.
It can further be argued that attributions are central to Gratitude and attributional style may
be central to the disposition toward Gratitude (MCullough et al, 2002). The attributional style
should inherently be positive as these individuals will attribute their gratuity to positive
surroundings. According to MCullough et al, (2002) grateful people are prone to experience
positive emotions and SWB. This leads to the argument that Gratitude may possibly
influence Optimism by influencing the optimistic view of the individual and expanding the
level of experienced positive emotions even further.
Hypothesis 18: In the proposed PWBW model it is hypothesised that Gratitude
positively influences Optimism.
Stellenbosch University http://scholar.sun.ac.za

51
Several theorists and researchers (e.g. Lazarus & Lazarus, 1994; Mayer, Salovey,
Gomberg-Kaufman, & Blainey, 1991; Ortoney, Clore, & Collins, 1998; Weiner, 1986) have
noted that Gratitude typically has a positive emotional valence. Hence it is argued that the
disposition toward Gratitude is rooted in basic tendencies to experience positive emotions.
Seeing oneself as the beneficiary of other people’s generosity may lead one to feel affirmed,
esteemed and valued which may boost self-esteem and perceived social support
(McCullough et al. 2002). Although this argument reinforces the hypothesis that Gratitude
will have a positive effect on PA, it also provides reason to argued that a link may exist
between Gratitude and Perceived Organisational Support. Emmons and McCullough (2003)
state that a grateful response to life can lead to deeper, more satisfying relationships.
Therefore, if a person is positive, by exhibiting positive emotions related to Gratitude, the
person will more easily attract people and thereby build a social support network. In this
sense it makes sense to argue that Gratitude will have a positive effect on POS.
Hypothesis 19: In the proposed PWBW model it is hypothesised that Gratitude
positively influences POS.
One of the ways certain people cope well with adversity is through the use of positive
emotions and laughter. Historically, the possible usefulness of positive emotion in the
context of extremely aversive events was either ignored or dismissed as a form of unhealthy
denial (Bowlby, 1980). Recently, however, research has shown that positive emotions can
help reduce levels of distress following aversive events both by quieting or undoing negative
emotions and by “increasing continued contact with and support from important people in the
person’s social environment” (Bonanno & Keltner, 1997, p. 134). It is, therefore, argued
here that this undoing of negative emotions could mean that people with high levels of
Gratitude would more intentionally silence negative feelings and emotions. It is therefore
argued that Gratitude will negatively influence Negative Affect.
Hypothesis 20: In the proposed PWBW model it is hypothesised that Gratitude
negatively influences NA.
2.7 WORK ENGAGEMENT
The emergence of knowledge work has resulted in an increased focus on employees’
performance. Psychological Well-being and employee health have therefore become
essential for organisations to survive (Weehuizen 2008, as cited in Ouweneel, Le Blanc,
Schaufeli & Van Wijhe, 2012). In this sense, it is important for employees to be engaged in
their work. Research suggest that high levels of Work Engagement and Psychological Well-
Stellenbosch University http://scholar.sun.ac.za

52
being play a central role in delivering some of the important outcomes that are associated
with successful, high performing organisations (Ouweneel et al., 2012). Work Engagement
was thus included in this study, as it plays a central role in the health and well-being of
employees. Although the relationship between Work Engagement and perceived
psychological health is not widely documented, a number of recent studies successfully
tested a model that linked Work Engagement and perceived health, and accordingly
demonstrated the negative relationship between burnout (i.e. viewed as the opposite of
Work Engagement by some researchers; Maslach and Leiter, (1997)) and health (Schaufeli
& Bakker, 2004; Hakanen, Bakker & Schaufeli, 2006). Furthermore in a recent study by
Schaufeli, Taris and Van Rhenen (2008) in which the authors used a sample of 527 telecom
managers to empirically distinguish between the constructs of workholism, burnout and Work
Engagement, a positive correlation between Work Engagement and unimpaired social
functioning, as well as between Work Engagement and physical health was found.
The appearance of Work Engagement coincides with the rise of positive psychology that has
shifted the focus from malfunctioning towards human strengths and optimal functioning
(Seligman & Csikszentmihalyi, 2000). Work Engagement is a particularly interesting well-
being measure in that it can be considered as an active measure of well-being instead of a
passive measure, like job satisfaction that is characterised by satiation. Hence, it is argued
by Bakker and Demerouti (2008) that engaged employees are activated towards performing
better and behaving positively in the workplace. According to Fredrickson (2003), there are
four reasons why engaged workers perform better than “non-engaged workers”. Firstly,
engaged workers often experience positive emotions, including happiness, joy and
enthusiasm. Secondly, engaged employees tend to experience better psychological and
physical health. Thirdly, they create their own job and personal resources (e.g. support from
others); and lastly, they transfer their Engagement to others. Fredrickson (2003) further
states that good health (as a result of being engaged) facilitates performance because
individuals can use all their mental and physical resources (skills, abilities, knowledge etc).
Although there is some broad agreement about Work Engagement and its role in the
workplace, there is a lack of clarity about its definition. Robinson, Perryman and Hayday
(2004, p.9) state that it is “A positive attitude held by the employee towards the organisation
and its values. An engaged employee is aware of business context, and works with
colleagues to improve performance within the job for the benefit of the organisation”. Many
other authors assume that Work Engagement is the opposite of burnout. For example,
Maslach and Leiter (1997) assumed that Work Engagement is characterised by energy,
involvement and efficacy which are considered the direct opposites of the three burnout
Stellenbosch University http://scholar.sun.ac.za

53
dimensions - exhaustion, cynicism and lack of professional efficacy, respectively. Engaged
employees have a sense of energetic and effective connection with their work activities and
they see themselves able to deal well with the demands of their job. However, some
researchers argue that it is not plausible to study these two constructs on the same
continuum, i.e. as opposites, but rather as two separate axes. The argument put forward is
that when an employee is not burned-out, it does not necessarily mean he/she is engaged
and vice versa. Secondly, it has been argued that the relationship between burnout and
Work Engagement cannot be empirically studied when they are measured with the same
questionnaire. Therefore, both concepts cannot be included simultaneously in one model in
order to study their concurrent validity. For this reason burnout and Work Engagement has
been defined as two distinct concepts, and it has been argued that it should be assessed
independently (Schaufeli & Bakker, 2001). This means that, at least theoretically, an
employee who is not burned-out may score high or low on Work Engagement, and an
engaged employee may score high or low on burnout. In practise, however, it is likely that
burnout and Work Engagement are substantively negative correlated. In contrast to Maslach
and Leiter’s (1997) approach, Schaufeli and Bakker’s (2003) approach enables the
assessment of the strength of the association between Work Engagement and burnout since
different instruments assess both constructs independently.
Work Engagement, according to Schaufeli and Bakker (2001), is a positive, fulfilling, work-
related state of mind that can be characterised by Vigour, Dedication and Absorption. It is a
persistent and pervasive affective-cognitive state that is not focused on any particular object,
event, individual or behaviour. It is a desirable condition with organisational purpose which
suggests involvement, commitment, passion, enthusiasm, focused effort, and energy
(Schaufeli & Bakker, 2001). The three dimensions of Work Engagement, namely Vigour,
Absorption and Dedication, can be viewed as interdependent constructs. Vigour is
characterised by high levels of energy and mental resiliency while working, the willingness to
invest effort in one’s work, not being easily fatigued and persistence even in the face of
difficulties (Schaufeli & Bakker, 2001). Individuals high on Vigour will have a sense of
competence and their willingness to invest effort will allow them to make effective use of
surrounding opportunities. Hence it could be argued that higher levels of Vigour may
contribute to more Environmental Mastery, a EWB component. Furthermore, studies have
repeatedly shown that interest (as defined in Eudaimonic terms) is strongly associated with
feelings of Work Engagement (e.g. Thrash, 2007; Vittersø, Overwien & Martinsen, 2009).
The interest component will most probably be linked to the Vigour subdimension of Work
Engagement. Dedication is characterised by deriving a sense of significance from one’s
Stellenbosch University http://scholar.sun.ac.za

54
work, by feeling enthusiastic and proud about one’s job, and by feeling inspired and
challenged by it (Schaufeli & Bakker, 2001). Dedicated individuals will have a sense of
directedness, have meaning in what they do and have aims and objectives in their work and
personal life. Therefore, it could be argued that more dedicated individuals may experience
more Purpose in Life, in terms of their EWB. Absorption, the third dimension of Work
Engagement, is characterised by being totally and happily immersed in one’s work and
having difficulties detaching oneself from it. Time passes quickly and one forgets everything
else that is around (Schaufeli & Bakker, 2001). This dimension is very similar to the
construct of flow. Csikszentmihalyi (1975) introduced the concept of flow and defined it as “a
highly enjoyable psychological state that refers to the holistic sensation people feel when
they act with total involvement in an activity” (p.36). According to Csikszentmihalyi (1990),
individuals who experience flow are so intensively involved in an activity, that nothing else
matters while doing it, they are extremely intrinsically motivated and take great pleasure in
the activity. Fritz and Avsec (2007) further state that flow occurs only when the individual
moves beyond his or her average experience of challenge and skills and where there is an
investment of psychic energy into a task. Fritz and Avsec (2007) conducted a research study
where they found that flow was positively related to SWB. They concluded that the
experience of flow is more related to emotional than cognitive aspects of SWB, which,
according to them, is not surprising as flow is an extremely emotional experience. According
to Seligman (2011), Engagement is about flow.
Moreover, Moneta (2004) summarises the relation between flow and well-being as follows:
Flow theory constitutes a synthesis of Hedonic and Eudaimonic
approaches to Subjective Well-being. Consistent with the Hedonic
perspective, flow theory states that flow has a direct impact on
Subjective Well-being by fostering the experience of happiness in the
here and now. Consistent with the Eudaimonic perspective, flow theory
states that flow has an equally important indirect effect on Subjective
Well-being by fostering the motivation to face and master increasingly
difficult tasks, thus promoting lifelong organismic growth. In particular,
flow theory states that the frequency and intensity of flow in everyday life
pinpoint the extent to which a person achieves sustained happiness
through deliberate striving, and ultimately fulfils his or her growth
potential (p. 116).
Stellenbosch University http://scholar.sun.ac.za

55
Based on these arguments it is proposed that in the Steyn-Boers Structural Model of
Psychological Well-being at Work, Engagement will have a positive effect on both EWB and
HWB (positive effect on PA and negative effect on NA).
Hypothesis 21: In the proposed PWBW model it is hypothesised that Work
Engagement positively influence EWB.
Hypothesis 22: In the proposed PWBW model it is hypothesised that Work
Engagement positively influences PA.
Hypothesis 23: In the proposed PWBW model it is hypothesised that Work
Engagement negatively influences NA.
According to Bakker and Demerouti (2007), the Job Demands–Resources Model (JD–R),
divides the work environment into job demands and job resources. Job demands refer to
physical, psychological, social, or organisational features of a job that require sustained
physical and/or psychological effort from an employee that can result in physiological and/or
psychological costs. Common job demands, which initiate a health impairment process,
include work overload, job insecurity, role ambiguity, and role conflict. On the other hand, job
resources refer to physical, psychological, social, or organisational features of a job that are
functional in that they (1) help achieve work goals; (2) reduce job demands and the
associated physiological and psychological costs; and (3) stimulate personal growth,
learning, and development. It is this last job resource of employees’ personal development,
growth and learning that could also be applicable to the development of the state-like
constructs of PsyCap (Hope, Optimism, Self-efficacy and Resilience) which may lead to an
increase in the Work Engagement of employees. Job resources, which initiate a motivational
process, can come from the organisation (pay, career opportunities and job security),
interpersonal and social relations (supervisor support, co-worker support and team climate),
the organisation of work (role clarity and participation in decision making), as well as from
the task itself (skill variety, task identity, task significance, autonomy and performance
feedback) (Bakker & Demerouti, 2007). Higher PsyCap, which is a personal resource, may,
for example, predispose an individual to have a more positive evaluation of available job
resources and the utilisation thereof (e.g. better support utilisation, utilisation of career
opportunities, of better interpersonal relationships and team climate). The basic premise of
the JD-R model is that high job demands exhaust employees' physical and mental resources
and lead to a depletion of energy and health problems. Job resources are motivational and
can lead to positive attitudes, behaviour and well-being (Bakker & Demerouti, 2007). Job
resources (which could be influenced by the personal resources of Hope, Optimism, Self-
Stellenbosch University http://scholar.sun.ac.za

56
efficacy and Resilience) can help individuals cope with job demands and have been found to
buffer the effect of job demands on job strain (Bakker & Demerouti, 2007). Research on the
JD-R model has found that job demands are related to burnout and health problems while
job resources predict Work Engagement, extra-role performance, and organisational
commitment (Bakker & Demerouti, 2007). Job resources have also been repeatedly
identified as significant predictors of Work Engagement by a number of researchers (Bakker
& Demerouti, 2008; Llorens, Bakker, Schaufeli & Salanova, 2007; Mauno, Kinnunen &
Ruokolainen, 2007; Schaufeli & Bakker, 2004; Schaufeli & Salanova, 2007; Xanthopoulou,
Bakker, Demerouri & Schaufeli, 2007). Employees who create their own resources (e.g.
support) are better able to deal with their job demands and to achieve their work goals
(Bakker & Demerouti, 2007). Judge, Bono, Erez and Locke (2005) have argued that access
to more individual personal resources, leads to more positive self-regard, and then more
goal self-concordance is expected to be experienced. Individuals with goal self-concordance
are intrinsically motivated to pursue their goals, and as a result generally experience higher
performance and satisfaction (Luthans & Youssef, 2007). Based on this argument, it could
be argued that certain PsyCap constructs will influence Work Engagement.
PsyCap Resilience was defined as the positive capacity to bounce back from adversity,
uncertainty, conflict, failure or even positive change with the ability to cope and adapt more
easily during risk and adversity (Luthans, 2002a; Masten, 2001). Individuals with Resilience
thus have the ability to show mental vitality as they are not prone to give up when faced with
hardships. It can therefore be argued that Resilience will have a positive effect on Vigour (as
a component of Work Engagement) as Vigour is characterised by high levels of energy and
mental resilience while working. These high-Vigour individuals further have a willingness to
invest effort in their work, they do not get easily fatigued and can persist even in the face of
difficulties (Schaufeli & Bakker, 2001).
Hypothesis 24: In the proposed PWBW model it is hypothesised that Resilience
positively influences Work Engagement.
Self-efficacy was defined in this study as a general, stable trait that reflects an individual’s
expectation regarding their ability to perform tasks successfully in a variety of achievement
situations (Bandura, 1977). Research has established that work-related Self-efficacy is
related to both in-role and extra-role performance, through employees’ Work Engagement
(Xanthopoulou, et al., 2008). When employees believe they are able to effectively deal with
their work requirements, it is more likely that they would be willing to put more effort into the
task. If they have a higher level of Self-efficacy and are able to perform a task, they will be
Stellenbosch University http://scholar.sun.ac.za

57
more likely to engage in that specific task, i.e. show Vigour, Dedication and Absorption. It is
further expected that Self-efficacy is positively related to Work Engagement as it leads to a
greater willingness to spend additional energy and effort on completing a task, and hence
more task involvement and Absorption (Schaufeli & Salanova, 2007). It can thus be
hypothesised that Self-efficacy will have a positive effect on Work Engagement.
Hypothesis 25: In the proposed PWBW model it is hypothesised that Self-efficacy
positively influences Work Engagement.
Optimistic individuals tend to exhibit unique characteristics, such as their effortless
motivation to work hard (Luthans, 2003), which can be linked to the Dedication component of
Work Engagement. Their high morale and exhibition of more goal-directed behaviour
(Luthans, 2003), could also be linked to the Absorption component of Work Engagement.
Furthermore, optimists have the ability to persist under severe conditions, regard
disappointments as temporary and valuable life experiences and have a general inclination
to be cheerful and mentally and physically energised (Luthans, 2003). It is therefore argued
that certain characteristics inherent to Optimism, as a psychological resource, may act as a
driver for the Vigour, Dedication and Absorption components, which defines Work
Engagement behaviours.
To this end the results of the Steyn (2011) structural model revealed that a significant path
existed between Optimism and Work Engagement. She also reported significant correlations
between the Life Orientation Test Revised (LOT-R; measure used for Optimism) and all
three subscales of the UWES.
Hypothesis 26: In the proposed PWBW model it is hypothesised that Optimism
positively influences Work Engagement.
Hope has been defined as a positive cognitive state that is based on a sense of successful
goal-directed determination and planning to meet these goals (Snyder et al., 1991). It can
therefore be said that Hope is the motivated persistent pursuit of goals and the expectation
that work-related goals can be achieved (Sweetman & Luthans, 2010). Hope will thus lead to
the expectation of attaining current work-related goals (Bryant & Cvengros, 2004). It can
thus be expected that individuals high on Hope will exhibit the necessaru mental resiliency to
attain their set goals en persist in the face of difficulties, i.e. Vigour. These high-Hope
individuals will be dedicated to their tasks in the sense that they will feel challenged by it, i.e.
Dedication, which might further lead them to be totally immersed by the tasks, i.e.
Absorption. It is therefore argued that Hope represents an individual characteristic that is
Stellenbosch University http://scholar.sun.ac.za

58
expected to initiate Work Engagement. High-Hope individuals will set work goals for
themselves and then they will be engaged in attaining these goals and work-related activities
(Ouweneel et al., 2012). Subsequently, it is argued that Hope enables a person to direct
energy in dedicating pursuing a goal (i.e. Work Engagement) (Gallagher & Lopez, 2009).
There is thus a strong theoretical argument for hypothesising a path between Hope and
Work Engagement.
Hypothesis 27: In the proposed PWBW model it is hypothesised that Hope positively
influences Work Engagement.
Schaufeli, Bakker and Van Rhenen (2009), in their study among 201 telecom managers,
found that Work Engagement itself can also predict more Work Engagement. In their results,
they found a positive gain spiral, which indicates that initial Work Engagement (measured by
the UWES; Schaufeli & Bakker, 2003) predicts an increase in job resources (measured by a
shortened version of the Questionnaire on the Experience and Evaluation of Work, QEEW;
Van Veldhoven, De Jonge, Broersen, Kompier & Meijman, 2002), which, in its turn, further
increased Work Engagement. This argument can be linked with the Broaden-and-Build
theory (Fredrickson, 2001) that resources will trigger the upward spiral to generate more
resources. Knowing this, it can be argued that organisations should invest in interventions
and programmes in order to improve the job resources of their employees by developing
their personal state-like resources of Hope, Optimism, Self-efficacy and Resilience – which
may improve the positive utilisation of job resources. This may improve the Work
Engagement of their workforce.
2.8 PERCEIVED ORGANISATIONAL SUPPORT
A growing body of literature has stressed the importance of social support in the reduction of
stress and the improvement of well-being (Nahum-Shani, Bamberger & Bacharach, 2011).
According to Cohen (2004) social support is considered a coping resource, a social “fund”
containing emotional and material resources which people may draw from when handling
demanding and stressful circumstances. Support in an organisation is defined in terms of
Perceived Organisational Support. POS refers to employees’ perception concerning the
extent to which the organisation values their contribution and cares about their well-being
(Eisenberger et al., 1986). The perception of organisational support is usually fostered by
conditions such as fair treatment, supervisory support, rewards and favourable job
conditions (Rhoades & Eisenberger, 2002). POS is believed to influence health and well-
being as it creates a set of positive conditions that employees can draw from to increase
their subjective well-being within the workplace. Luthans et al., (2007b) state that a
Stellenbosch University http://scholar.sun.ac.za

59
supportive climate may create positive conditions which will allow PsyCap to flourish.
Furthermore, if individuals are positive they will more likely attract other people and thereby
easily create their own social support networks which will further enhance their well-being.
POS has thus been included in this study as it is believed to contribute to this study as it will
foster conditions for increased well-being and have a positive effect on stress reduction. The
inclusion of POS in this study, therefore, allows for the investigation of whether some of the
positive psychological resources (e.g. Optimism and Gratitude) included in this study act
through POS to indirectly effect well-being, or as well as to investigate the direct relationship
between POS and well-being.
The inclusion of this construct can further be linked to Conservation of Resources (COR)
theory (Hobfoll, 1989). COR theory proposes that people’s well-being is dependent upon
their sense of access to resources within their environment. Those individuals in possession
of more resources are less likely to encounter stressful circumstances that negatively affect
their Psychological Well-being. Hobfoll (2001) further states that individuals strive to obtain,
retain, protect and foster valued resources. Hobfoll (2001) has found 74 resources that have
validity in the Western context. Of these 74 resources, five can be related to the context of
organisational support. These include: “feeling valuable to others”, “acknowledgement of my
accomplishments”, “understanding from by employer”, “support from co-workers” and “help
with tasks at work”. This indicates that a supportive environment within an organisation plays
a large role when it comes to employees’ perceived resources.
According to Ryff (1989) “Positive Relations with Others”, is one of the six dimensions of
Psychological Well-being / EWB. Hence it is argued in this study that within the business
environment, POS is very often also equated to positive relations and subsequent support
networks, and that it is a necessary and important dimension for employees to be
subjectively and psychologically well in the workplace. Individuals who have positive
relations with others (or supportive networks within the organisation) are concerned about
the welfare of others and understand the basic requirements of human relationships.
Based on the social exchange theory (Blau, 1964; Homans, 1958), researchers have
suggested that people implicitly and explicitly calculate the amount of support they receive
and give, and perceive their support in terms of three patterns of supportive exchange: (1)
reciprocal, in which an equal amount of support is given and received; (2) under-
reciprocating, in which support given exceeds that received; and (3) over-reciprocating, in
which support received exceeds that given (Rook, 1987). Accordingly, perceiving the
exchange of support as under-reciprocating tends to evoke feelings of unfairness,
Stellenbosch University http://scholar.sun.ac.za

60
exploitation, resentment and burden (Rook, 1987), while perceiving the exchange as over-
reciprocating tends to generate feelings of indebtness, guilt and shame. From this point of
view, individuals who perceive their supportive relationships as being reciprocal are likely to
have a greater sense of well-being. According to Gouldner (1960), the norm of reciprocity is
also a key in Organisational Support Theory (OST) which can be applied to the employee-
employer relationship. It suggests that employees who receive favourable treatment from
their organisation, would feel an obligation that they should care about the organisation’s
benefits and contribute to the achievement of organisational goals. Therefore, if managers
are concerned about the employees’ commitment to the organisation, the employees are
concerned with the organisations commitment to them (Eisenberger et al., 1986). Employees
regard the organisation as an important source of socio-emotional resources, such as
respect, caring and tangible benefits such as wages and medical benefits. If the employees
perceive the organisation to have a high regard of them, it will help to meet the employees’
needs for approval, esteem and affiliation. They will also perceive justice, as they view
positive evaluation by the organisation as an indication that increased effort will be noted
and rewarded. For this reason, employees will take an active interest in the regard with
which they are held by their employer (Eisenberger, Cummings, Armeli & Lynch, 1997;
Eisenberger et al. 1986; Rhoades & Eisenberger, 2002). In this sense a healthy culture of
caring and respect in an organisation, will have a beneficial effect on interpersonal
relationships which will increase feelings of justice and recognition and thereby lead to
increased Psychological Well-being. Furthermore it can be argued that POS will lead to
certain core dimensions of EWB in the sense that if individuals receive support from the
organisation, they will feel more confident in making their own decisions, and thereby a
learning environment will be fostered. This could lead to increased levels of Autonomy (a
component of EWB) in that employees could become more independent. The supportive
environment will further allow individuals to choose or create contexts that are suitable to
their personal needs and the environment will assist employees to make effective use of
surrounding opportunities, thereby increasing their Environmental Mastery (another
component of EWB). Ryff (1989) describes individuals undergoing Personal Growth (sub-
dimension of EWB) as having feelings of continued development, they see themselves as
growing and expanding and is open to new experiences. These individuals further have a
sense of realising their own potential and change in ways that reflect more self-knowledge
and effectiveness. It can thus be argued that a supportive environment will result in
employees growing and developing their potential. Furthermore, from the reciprocal point of
view, getting support from the organisations will result in employees wanting to give support
Stellenbosch University http://scholar.sun.ac.za

61
to the organisation. This will thus foster conditions for warm, satisfying relationship with co-
employees (the Positive Relations with Others component of EWB).
Hypothesis 28: In the proposed PWBW model it is hypothesised that POS positively
influence EWB.
According to Eisenberger et al., (1986), behavioural outcomes of POS would include
increases in in-role and extra-role performance and decreases in withdrawal, such as
absenteeism and turnover. According to Organisational Support Theory (OST), the
development of POS is encouraged by employees’ tendency to assign humanlike
characteristics to the organisation (Eisenberger at al., 1986). On the basis of the
personification, employees view their favourable or unfavourable treatment as an indication
that the organisation favours or disfavours them. OST also addresses the psychological
aspects underlying consequences of POS. The first aspect is what is known as the
reciprocity norm, which was introduced earlier in this section. The argument leads that POS
should produce a felt obligation to care about the organisation’s welfare and to help the
organisation reach its objectives. The second aspect stipulates that the caring, approval, and
respect implied by POS should fulfil socio-emotional needs, leading workers to incorporate
organisational membership and role status into their social identity. The third psychological
aspect underlying POS is that support should strengthen employees’ beliefs that the
organisation recognises and rewards increased performance (i.e., performance-reward
expectancies). These processes should have favourable outcomes both for employees (e.g.,
increased job satisfaction and heightened positive mood) and for the organisation (e.g.,
increased affective commitment and performance, reduced turnover) (Rhoades &
Eisenberger, 2002).
By looking at the underlying psychological aspects of POS, it can be argued that POS will
have a positive and direct influence on Work Engagement. By taking the reciprocal
relationship into account, employees who perceive the organisation to be supportive and
thereby also perceive increases justice, will want to, in return, support the organisation by
striving to achieve its goals. Secondly, by incorporating organisational membership into their
social identity, they will exhibit higher levels of Work Engagement by having high levels of
energy and persistence in the face of difficulties (Vigour). The sense of identity will further
lead them to have feelings of enthusiasm and pride (Dedication), and ultimately these
individuals should be more inclined to be totally and happily immersed in their work
(Absorption) (Schaufeli & Bakker, 2001).
Stellenbosch University http://scholar.sun.ac.za

62
Hypothesis 29: In the proposed PWBW model it is hypothesised that POS positively
influence Work Engagement.
2.9 PSYCHOLOGICAL OWNERSHIP
To have a place is, according to the French political philosopher Simone Weil (1952), an
important “need of the human soul” (p.41). A number of scholars have linked this need for
place to feelings of ownership (e.g. Ardrey, 1966; Darling, 1939; Duncan, 1981; Porteous,
1976; Weil, 1952). Darling (1939) state that ownership is in essence a psychological
expression. It is because of this need that people devote significant amounts of time, energy,
and resources to acquire, protect, decorate, and display their homes.
Psychological Ownership (PO) was included in this study as it believed to contribute to well-
being. It is argued here that individuals will evaluate a target more favourable when they own
it (Nesselroade, Breggan & Allison, 1999) and possessions closely integrated with the self
tend to be more positively valenced. According to Van Dyne and Pierce (2004) when
individuals have PO, they will experience the target as an extension of the self and therefore
feel a sense of responsibility towards the target object. Thereby PO towards a target object
has psychological and emotional consequences. According to Formanek (1991),
experiencing feelings of ownership produce a positive and uplifting effect that makes owned
objects to be more attractive and favourable. In context, feelings of ownership are naturally
pleasure producing because possessions can result from self-enhancing biases, individual
effort, controllability, and approval and acceptance from others (Pierce, Kostova & Dirks,
2003). Pierce et al., (2003) state that PO will have both positive and negative consequences
for the individual. On the positive side, it is likely to lead to assumption of responsibility,
caring, protection, nurturance, stewardship, and a willingness to make personal sacrifices
and assume risk on behalf of the target. On the negative side, it may lead to alienation,
frustration, and stress. Recognising both the positive and the dark side of this state
suggests that there may be a limit to what constitutes a “healthy” level of PO.
The core of Psychological Ownership (PO) is a sense of possession (Furby, 1978). James
(1963) state that possessive feelings are universal and can refer to tangible or intangible
objects. These feelings can be based on either legal Ownership or on the absence of such
legality. More precisely, PO has been described as a cognitive-affective construct defined as
“the state in which individuals feel as though the target of Ownership or a piece of that target
is theirs” and reflects “an individual’s awareness, thoughts and beliefs regarding the target
of ownership (Pierce, et al., 2003, p.86). Luthans et al. (2007b) propose that PO falls within
the emerging literature of POB. These authors argue that PO has much in common with
Stellenbosch University http://scholar.sun.ac.za

63
more widely recognised constructs and approaches such as psychological capital (Luthans,
et al., 2007c), POS (Cameron, et al., 2003), and PWB (Quick & Quick, 2004; Wright &
Cropanzano, 2004; Wright, 2005). Not only does PO share a sense of positivity and striving
for accomplishment and success (i.e. EWB) with these related POB constructs, but PO also
fits the specific POB inclusion criteria (Luthans, 2002a, 2002b; Luthans et al., 2007b).
Conventional wisdom suggests that people will take better care of, and strive to maintain and
nurture the possessions they own. This “sense” of ownership and this “motivation” to protect
and improve the object of ownership, has stimulated organisational behaviour scholars to
better understand the positive construct of Psychological Ownership (Avey et al., 2009).
Based on research conducted by Pierce, Kostova and Dirks, (2001) on what constitute
possession and ownership, they concluded that: (1) the feeling of ownership is innately
human, (2) PO can occur towards both tangible and intangible objects (targets) and (3) PO
has important emotional, attitudinal and behavioural effects on those that experience
Ownership.
Pierce et al., (2001) described PO as an attitude with both affective and cognitive elements.
They illustrate this with the following phrases that denote feelings of ownership or
possession: “She is MY daughter”, or “That is OUR house”. The authors hereby propose that
PO consists, in part, of an emotional attachment to the organisation that transcends the
mere cognitive evaluation of the firm. They further propose that this tight connection between
possession and feelings of ownership can be directed to the organisation as a whole or at
specific aspects of the organisation as the group, job, work-tools, or work itself. For example,
some employees have PO for their work and others might have ownership feelings for the
overall organisation. In this study, the focus will be on the organisation, i.e. PO for the
organisation.
The work of Locke (1690), Sartre (1969), and Rochberg-Halton (1980), among others,
provides us with insight into the relationship between work and Psychological Ownership. As
part of his political philosophy, Locke (1690) argued that we own our labour and ourselves,
and therefore, we are likely to feel that we own that which we create, shape, or produce.
Through our labour, we not only invest our time and physical effort but also our psychic
energy into the product of that labour. As noted by O’Reilly (2002, p.19) “when managers
talk about ownership, what they typically want to instil is not financial ownership, but
Psychological Ownership - a feeling on the part of the employees that they have a
responsibility to make decisions that are in the long term interest of the company”. Van Dyne
and Pierce (2004) further states that employees do not have to own stock in a company to
Stellenbosch University http://scholar.sun.ac.za

64
consider themselves as owners. Experiencing feelings of ownership will result in higher
organisational commitment, job satisfaction and organisational-based self-esteem.
Pierce, et al., (2001) state that these feelings of ownership allow individuals to fulfil three
basic human motives: to have a sense of place, or home, efficacy and effectance and self-
identity. These motives, therefore, are among the reasons for experiencing feelings of
ownership. To have a sense of belongingness is the basic need. It is thus argued that this
type of ‘possession’, captured symbolically by ‘home’, provides employees with a sense of
place. Therefore, if employees have the perception that their organisation values them and
cares about their well-being (Eisenberger et al., 1986), they will possibly feel at home and
feel that “the organisation is theirs” (Pierce et al., 2003).
Hypothesis 30: In the proposed PWBW model it is hypothesised that POS positively
influence PO.
Self-identity is another motive that leads to experiencing PO. Pierce et al., (2001) defined
self-identity as a clear sense of self. Researchers have noted that groups of people (Abrams
& Hogg, 2004) and possessions often act as symbols through which people identify
themselves. Specifically, it has been noted that individuals establish, maintain, reproduce
and transform their self-identity through interactions of tangible possessions and intangibles
such as an organisation (Rousseau, 1998). Albert, Ashton and Dutton (2000) suggest that by
internalising the organisational identity as a definition of the self, the individual gain a sense
of meaningfulness and connectedness. It is important to note here that a sense of
connectedness would refer to being connected with the mission or goal of the organisation,
which is different to having a sense of belongingness to a place or a group.
According to Van Dyne and Pierce (2004) feelings of possession will create a sense of
responsibility. These feelings of responsibility will lead employees to invest time and energy
to benefit the organisation. This will furthermore lead the employees to “do what is right and
virtuous” and allow them to discover “meaning and self-actualisation”, which are two
important dimensions of EWB (Ryan & Deci, 2001). Furthermore, when employees feel a
sense of PO or possession toward the organisation, work acquires existential significance or
purpose that triggers active participation. This significance or purpose can be linked to Ryff’s
dimension of “Purpose in Life” stating that these individuals have a sense of directedness,
aims and objectives. If individuals feel ownership towards an object they will be more
inclined to use their own initiatives instead of seeking advice from superiors. This will lead
the individuals to be more self-determinant and independent (Autonomy). A hypothesis is
thus proposed stating that PO will have a direct significant effect on EWB.
Stellenbosch University http://scholar.sun.ac.za

65
Hypothesis 31: In the proposed PWBW model it is hypothesised that PO positively
influences EWB.
2.10 SUMMARY
The literature study offered a theoretical argument which was presented in an attempt to
depict the nomological network of latent variables that explain variance in the underlying
psychological processes of PWBW. The research was initiated by a need to adapt and
expand on the Steyn (2011) study in an attempt to get “closer to the truth” of the factors that
interplay to predict well-being in the workplace. This theoretical argument can be
summarised in the form of a structural model (figure 3.1). The model will be tested to
determine whether the theoretical arguments outlined above are legitimate. The next chapter
will state the various research hypotheses and the methodology to be used to test these
relationships.
Stellenbosch University http://scholar.sun.ac.za

66
CHAPTER 3
RESEARCH METHODOLOGY
3. 1 INTRODUCTION
The previous chapter focused on the literature review of the various constructs and their
relationships with each other. The literature has culminated in the formulation of certain
research hypotheses. In this chapter a discussion will be presented regarding the purpose
and aim of this study, followed by an overview of the research objectives, hypotheses and
design. The chapter will conclude with an in-depth discussion on the measurement
instruments utilised in this study, and the psychometric integrity of each instrument (i.e.
reliability and validity).
3.2 RESEARCH PURPOSE
For an organisation to sustain its competitive advantage in today’s turbulent environment,
the quality of its human resources is of paramount importance. The human resource
department justify their existence by committing themselves to pursuing organisational
goals, with the main goal being economic utility. This is achieved through the acquisition and
maintenance of a competent and motivated workforce, as well as the effective and efficient
management of such a workforce (Theron, 2011). It is also well known, and frequently
acknowledged, that the human resources are the most costly and unpredictable component
of a business. Most departments within an organisation have the ability to directly and/or
indirectly show their contribution to company success by means of financial measures. With
the human resource department, this is more challenging. However, if employees are
developed and managed correctly, the human resources of an organisation can provide a
significant competitive advantage to the organisation. For example, research has shown that
the effectiveness and productivity of employees directly impact on the profitability of the
business (Slaski & Cartwright, 2002). Financially it would thus make sense to prioritise the
well-being of employees. Better employee well-being should translate into more energy,
innovation, creativity, positive competition and also a lack of absenteeism and medical costs
(Turner, Baling & Zacharatos, 2002). In this sense, well-being can be viewed as a financial
investment, which when managed effectively, will lead to a “high rate on return”.
The Psychological Well-being of current day employees has become a serious and
worrisome issue. Sanderson et al., (2008) state that stress-related diseases poses
significant costs related to performance, e.g. workplace safety, absenteeism and early
retirement (Sanderson, et al., 2008). Employee psychological health and well-being could be
Stellenbosch University http://scholar.sun.ac.za

67
regarded as a strategic driver of talent attraction, retention, and individual and organisational
performance excellence. HR should therefore promote organisational well-being as well as
positive psychological health as it could incseems repetitive rease organisational
performance.
This study has drawn from the Positive Organisational Behaviour (POB) paradigm to
explicate the arguments that motivated the adaption and expansion of the original Steyn
(2011) Salutogenic Model of Occupational Well-being, into the Steyn-Boers Structural Model
of Psychological Well-being at Work.
This is a first adaption to Steyn’s study. The adaption and expansion was motivated by
certain limitations posed by the Steyn (2011) study. These limitations include that
Occupational Well-being was defined too narrowly, no significant link existed between Self-
efficacy and any of the other included constructs and Organisational Commitment emerged
as a very strong predictor of Work Engagement, which resulted in the decision to omit the
construct of Organisational Commitment in this study (refer to section 2.1 of Chapter 2 for a
more in-depth discussion on the Steyn (2011) study.) As an adaption and expansion to the
Steyn (2011) study, in this study Subjective Well-being is defined, in a generic sense, as
both Hedonic Well-being (HWB) and Eudaimonic Well-being (EWB). HWB focuses on the
experience of maximising pleasure and minimising pain, where EWB is found in the
expression of virtue – doing what is worth doing (Ryan & Deci, 2001). The construct of
Psychological Well-being at Work (PWBW) developed by Dagenais-Desmarais and Savoie
(2012) was therefore also included as a domain specific, i.e. work, measure of SWB. This
study further elaborated on the Steyn (2011) study by including additional variables not
included in the original model. Hope (persevering towards goals and, when necessary,
redirecting paths to goals) and Resilience (when beset by problems and adversity,
sustaining and bouncing back and even beyond to attain success) (Luthans, et al., 2007c)
was included as further positive psychological capabilities that influence well-being. It was
argued that Gratitude would also have an effect on the well-being of individuals. In this study
it is further argued that the organisation can foster psychological capital (e.g. Luthans, Avey,
Clapp-Smith & Li, 2008) which could result in higher levels of well-being. This could be done
by providing employees with the necessary (Perceived Organisational) Support to flourish in
their work. Together with the established support system, it is also argued that Psychological
Ownership should empower and motivate employees to excel in the work environment. This
should further translate into better well-being.
Stellenbosch University http://scholar.sun.ac.za

68
3.3 RESEARCH AIM, QUESTION AND OBJECTIVES
The aim of this study was to depict the nomological network of latent variables (see figure
3.1) that explain variance in the underlying psychological processes of PWBW. The benefits
of the research may be that organisations could obtain more insight into human resource
interventions that could be applied, related to the variables included in this research. The HR
department of organisations can, for example develop appropriate training initiatives (e.g.
PsyCap) or actively help establish a corporate culture of positive well-being if these factors
have empirically been shown to influence well-being at work.
Given the theoretical framework of this research, the following research question has been
formulated:
Are the proposed constructs related to each other, as well as to Subjective Well-being
(SWB) and Psychological Well-being at Work (PWBW) in the sense that it permits the
construction of the Steyn-Boers Structural Model of Psychological Well-being at Work as a
possible approach to explaining variance in PWBW?
The research question was addressed by attempting to achieve the following research
objectives:
expand and adapt the Steyn (2011) structural model that will best explain the
interaction/influence among the various variables;
test the fit of the model;
evaluate the significance of the hypothesised paths in the model; and
consider the modification of paths in the model by inspecting the modification indices
and how the possible modification of paths are supported theoretically.
3.4 RESEARCH HYPOTHESES
The proposed research methodology served the aim and objectives of the study. The aim
was to expand and adapt Steyn’s (2011) original Salutogenic Model of Occupational Well-
being and to empirically test the validity of the adapted Steyn-Boers Structural Model of
Psychological Well-being at Work.
The overarching substantive research hypothesis of this study is that the structural model
depicted in figure 3.1 provides a valid account of the psychological processes that
determines variance in psychological well-being at work. The substantive hypothesis was
Stellenbosch University http://scholar.sun.ac.za

69
dissected into 29 more detailed path-specific research hypotheses. The hypotheses that
have been formulated in line with the objectives of the study will be tested.
The ideal in a research study would be to find an exact fit, i.e. the model perfectly explains
the co-variance between the indicator variables. LISREL 8.8 was thus used to test the null
hypothesis of exact fit.
H01 exact fit: RMSEA = 0
Ha1 exact fit: RMSEA > 0
However, exact fit is very rarely a possibility. Therefore, the close fit null hypothesis should
be considered as it takes the error of approximation into account (Diamantopoulos &
Siguaw, 2000). Close fit is implied if the difference between the observed and reproduced
score is equal to or less than .05. LISREL 8.8 will be used to test the following null
hypothesis for close fit.
H02 close fit: RMSEA 0.05
Ha2 close fit: RMSEA > 0.05
In accordance with the aim of this study, the findings of previous studies as discussed in the
literature review, and the proposed structural model (depicted in figure 3.1), the substantive
research hypothesis can be dissected into the following 29 path-specific research
hypotheses and their respective path coefficient statistical hypotheses:
Hypothesis 3: In the proposed PWBW model it is hypothesised that PA positively influences
PWBW.
H03: β64=0
Ha3: β64>0
Hypothesis 4: In the proposed PWBW model it is hypothesised that NA negatively
influences PWBW.
H04: β63=0
Ha4: β63<0
Hypothesis 5: In the proposed PWBW model it is hypothesised that EWB positively
influences PWBW.
H05: β65=0
Stellenbosch University http://scholar.sun.ac.za

70
Ha5: β65>0
Hypothesis 6: In the proposed PWBW model it is hypothesised that Hope positively
influences PA
H06: 41=0
Ha6: 41>0
Hypothesis 7: In the proposed PWBW model it is hypothesised that Hope negatively
influences NA.
H07: 31=0
Ha7: 31<0
Hypothesis 8: In the proposed PWBW model it is hypothesised that Hope positively
influences EWB.
H08: 51=0
Ha8: 51>0
Hypothesis 9: In the proposed PWBW model it is hypothesised that Optimism positively
influences PA.
H09: β41=0
Ha9: β41>0
Hypothesis 10: In the proposed PWBW model it is hypothesised that Optimism negatively
influences NA.
H010: β31=0
Ha10: β31<0
Hypothesis 11: In the proposed PWBW model it is hypothesised that Optimism positively
influences EWB.
H011: β51=0
Ha11: β51>0
Stellenbosch University http://scholar.sun.ac.za

71
Hypothesis 12: In the proposed PWBW model it is hypothesised that Optimism positively
influences POS.
H012: β71=0
Ha12: β71>0
Hypothesis 13: In the proposed PWBW model it is hypothesised that Self-efficacy positively
influences EWB.
H013: 52=0
Ha13: 52>0
Hypothesis 14: In the proposed PWBW model it is hypothesised that Self-efficacy
negatively influences NA.
H014: 32=0
Ha14: 32<0
Hypothesis 15: In the proposed PWBW model it is hypothesised that Self-efficacy positively
influences PA.
H015: 42=0
Ha15: 42>0
Hypothesis 16: In the proposed PWBW model it is hypothesised that Resilience positively
influences EWB.
H016: 53=0
Ha16: 53>0
Hypothesis 17: In the proposed PWBW model it is hypothesised that Gratitude positively
influences PA.
H017: 44=0
Ha17: 44>0
Stellenbosch University http://scholar.sun.ac.za
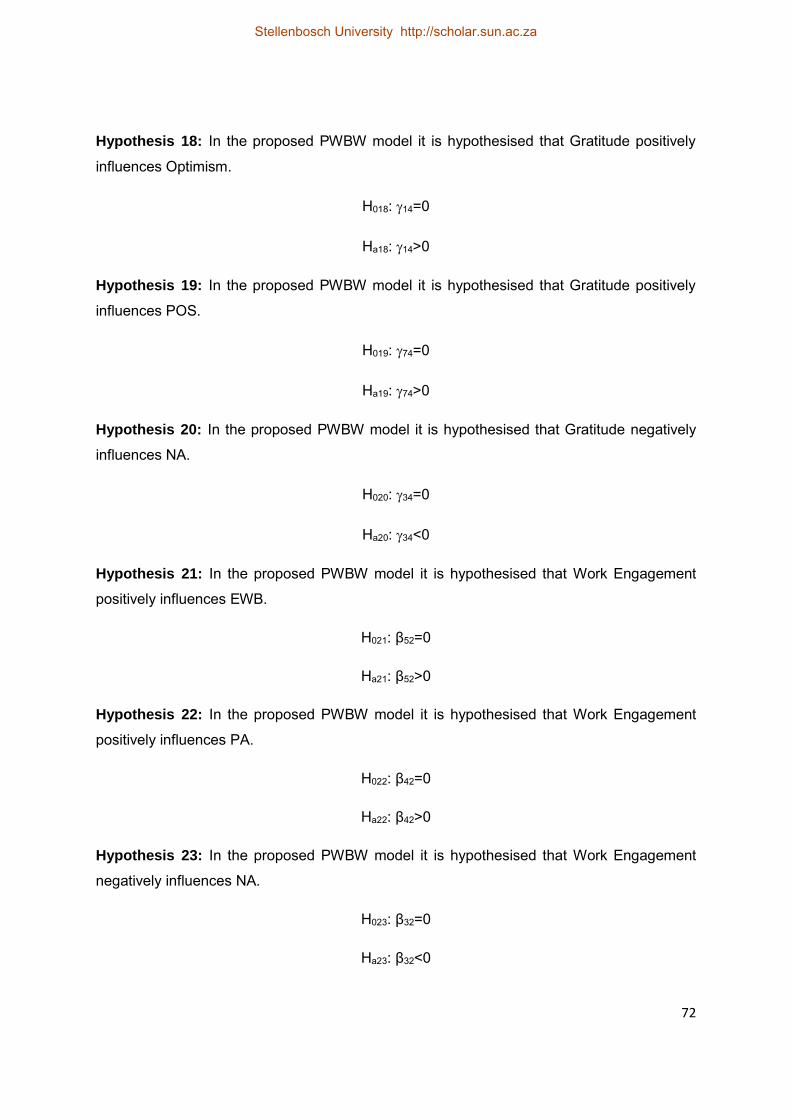
72
Hypothesis 18: In the proposed PWBW model it is hypothesised that Gratitude positively
influences Optimism.
H018: 14=0
Ha18: 14>0
Hypothesis 19: In the proposed PWBW model it is hypothesised that Gratitude positively
influences POS.
H019: 74=0
Ha19: 74>0
Hypothesis 20: In the proposed PWBW model it is hypothesised that Gratitude negatively
influences NA.
H020: 34=0
Ha20: 34<0
Hypothesis 21: In the proposed PWBW model it is hypothesised that Work Engagement
positively influences EWB.
H021: β52=0
Ha21: β52>0
Hypothesis 22: In the proposed PWBW model it is hypothesised that Work Engagement
positively influences PA.
H022: β42=0
Ha22: β42>0
Hypothesis 23: In the proposed PWBW model it is hypothesised that Work Engagement
negatively influences NA.
H023: β32=0
Ha23: β32<0
Stellenbosch University http://scholar.sun.ac.za

73
Hypothesis 24: In the proposed PWBW model it is hypothesised that Resilience positively
influences Work Engagement.
H023: 23=0
Ha23: 23>0
Hypothesis 25: In the proposed PWBW model it is hypothesised that Self-efficacy positively
influences Work Engagement.
H025: 22=0
Ha25: 22>0
Hypothesis 26: In the proposed PWBW model it is hypothesised that Optimism positively
influences Work Engagement.
H026: β21=0
Ha26: β21>0
Hypothesis 27: In the proposed PWBW model it is hypothesised that Hope positively
influences Work Engagement.
H027: 21=0
Ha27: 21>0
Hypothesis 28: In the proposed PWBW model it is hypothesised that POS positively
influences EWB.
H028: β57=0
Ha28: β57>0
Hypothesis 29: In the proposed PWBW model it is hypothesised that POS positively
influences Work Engagement.
H029: β27=0
Ha29: β27>0
Stellenbosch University http://scholar.sun.ac.za

74
Hypothesis 30: In the proposed PWBW model it is hypothesised that POS positively
influences PO.
H030: β87=0
Ha30: β87>0
Hypothesis 31: In the proposed PWBW model it is hypothesised that PO positively
influences EWB.
H031: β58=0
Ha31: β58>0
Table 3.1
Path coefficient statistical hypotheses
Hypothesis 3:
H03: β64=0
Ha3: β64>0
Hypothesis 9:
H09: β41=0
Ha9: β41>0
Hypothesis 15:
H015: 42=0
Ha15: 42>0
Hypothesis 21:
H021: β52=0
Ha21: β52>0
Hypothesis 27:
H027: 21=0
Ha27: 21>0
Hypothesis 4:
H04: β63=0
Ha4: β63<0
Hypothesis 10:
H010: β31=0
Ha10: β31<0
Hypothesis 16:
H016: 53=0
Ha16: 53>0
Hypothesis 22:
H022: β42=0
Ha22: β42>0
Hypothesis 28:
H028: β57=0
Ha28: β57>0
Hypothesis 5:
H05: β65=0
Ha5: β65>0
Hypothesis 11:
H011: β51=0
Ha11: β51>0
Hypothesis 17:
H017: 44=0
Ha17: 44>0
Hypothesis 23:
H023: β32=0
Ha23: β32<0
Hypothesis 29:
H029: β27=0
Ha29: β27>0
Hypothesis 6:
H06: 41=0
Ha6: 41>0
Hypothesis 12:
H012: β71=0
Ha12: β71>0
Hypothesis 18:
H018: 14=0
Ha18: 14>0
Hypothesis 24:
H023: 23=0
Ha23: 23>0
Hypothesis 30:
H030: β87=0
Ha30: β87>0
Hypothesis 7:
H07: 31=0
Ha7: 31<0
Hypothesis 13:
H013: 52=0
Ha13: 52>0
Hypothesis 19:
H019: 74=0
Ha19: 74>0
Hypothesis 25:
H025: 22=0
Ha25: 22>0
Hypothesis 31:
H031: β58=0
Ha31: β58>0
Hypothesis 8:
H08: 51=0
Ha8: 51>0
Hypothesis 14:
H014: 32=0
Ha14: 32<0
Hypothesis 20:
H020: 34=0
Ha20: 34<0
Hypothesis 26:
H026: β21=0
Ha26: β21>0
Stellenbosch University http://scholar.sun.ac.za

75
Hope
ξ1
Optimism
1
Eng
2 Self-efficacy
ξ2
Resilience
ξ3
Gratitude
ξ4
NA
3
POS
7
Psychological
Ownership
8
EWB
5
PWBW
6
Figure 3.1: Steyn-Boers Structural Model of Psychological Well-being at Work
PA
4
Stellenbosch University http://scholar.sun.ac.za
Stellenbosch University http://scholar.sun.ac.za

76
3.5 RESEARCH DESIGN AND PROCEDURE
3.5.1 Research Design
A non-experimental research design was used in this research. A researcher uses this type
of research design when he/she wants to observe relationships between variables without
controlling or manipulating the variables in any way (Kerlinger & Lee, 2000). More
specifically, an ex post facto correlation design was utilised to test the validity of the
hypothesised structural model. The nature of this specific research design precluded the
drawing of casual inferences from significant path coefficients, as correlations do not
suggest causation.
3.5.2 Sampling
A sample refers to a sub-set of the population and then using it as representative of that
population (Bryman & Bell, 2003). Kerlinger and Lee (2000) also refer to sampling as taking
a portion of the population with the aim of obtaining a representative indication of the
population’s opinions and attitudes about the phenomenon being studied.
Structural Equation Modelling (SEM) requires an appropriate sample size in order to produce
reliable estimates (Hair, Black, Balbin, Anderson & Tatham, 2006). Gorsuch (1983)
suggested at least five participants per construct and not less than 100 individuals per data
analysis. Kline (2010) suggested that a very complicated path model needs a sample size of
200 or larger, while Bagozzi and Yi (2012) proposed that the sample size should be above
100, preferably above 200. This is supported by Hair et al. (2006) who recommend a sample
size of at least 200 but not exceeding 400. According to Hair et al., (2006) when a sample
exceeds 400 – 500 participants the SEM analysis becomes too sensitive and almost any
differences is detected, making goodness of fit measure show poor fit. According to the
guidelines specified above, it is argued that this study’s sample size of 199 is close enough
to 200 to allow for the calculation of reliable SEM results.
Convenience sampling via a social media network (i.e. non probability sampling technique)
was employed in this study. Due to the fact that SWB and PWBW are such generalised
concepts and necessary and important factors in all organisations, it was decided to include
possible respondents from a range of various companies and industries. The chosen social
media platform was Facebook where individuals who met specific criteria were sent a link to
access the online electronic composite questionnaire.
As part of the process of obtaining ethical clearance, an informed consent template had to
be submitted to the ethical committee. A standard informed consent template which covers
Stellenbosch University http://scholar.sun.ac.za

77
all general issues (e.g. confidentiality) was used, however some additional information had
to be included as Facebook10 has its own policy on informed consent. There were thus
additional matters related to the use of a social media platform that had to be considered in
order to ensure that all ethical requirements regarding the data collection was met. The
informed consent template of this study (see appendix A), which preceded the questionnaire,
was thus created to be aligned with the general informed consent content (e.g. procedures,
risks and discomforts, information on confidentiality and anonymity etc.) as well as the
requirements set out by the Facebook policy on data gathering. Given that the invitation was
extended to Facebook friends of the researcher and the supervisor, it was assumed that
these individuals have, voluntarily, already shared their contact information with the
researchers. The (contact) information was therefore already freely available to the
researcher and supervisor and the possible participants were well informed through the
informed consent preamble to the questionnaire of their rights to voluntary participation,
confidentiality and further rights as research participants.
3.5.3 Research Participants
As a social media platform was used for gathering the data, inclusion criteria for the possible
participants were specified. The inclusion criteria for participants were as follows:
permanent resident of South Africa;
at least 18 years or older;
employed full-time in the formal job market;
employed for at least six months in their present job; and
willing to share their information for research purposes
This means of data collection offered some benefits, but it also posed some disadvantages
and limitations. This data collection procedure had the benefit of allowing the researcher to
tap into a possible participant pool from a wide range of industries and occupations. This, to
a certain extent, ensured that any organisation-specific confounding variables (e.g.
organisation culture) were controlled for. Another benefit of the data collection method was
10 A search of policies on the Facebook site regarding any policy documents relating to the use of Facebook as a platform to access possible participants, revealed that the following information was available in the “Protecting of People’s Rights” section: “If you collect information from users, you will: obtain their consent, make it clear you (and not Facebook) are the one collecting their information, and post a privacy policy explaining what information you collect and how you will use it. You will not tag users or send email invitations to non-users without their consent. Facebook offers social reporting tools to enable users to provide feedback about tagging.“ The informed consent formulation that accompanied the online questionnaire covered the relevant issues as stipulated in the Facebook requirements regarding the protection of participant’s rights.
Stellenbosch University http://scholar.sun.ac.za

78
that due to the online administration of the questionnaire, no missing data was evident in the
final dataset.
The main disadvantage of using Facebook relates to the generalisability of the sample. Most
participants were acquainted with the researcher and study leader. As a result the majority of
the sample live in the same province (Western Province), have the same ethnic origin
(Caucasian), share a first language (Afrikaans) and are mostly in their 20’s - 30’s. The
sample is thus not a good reflection of the general population of South Africa. This will be
discussed in greater depth in section 4.2 in chapter 4.
3.5.4 Data Collection
Upon receipt of ethical clearance to conduct the research, all the researcher’s “friends11” on
Facebook which met the inclusion criteria, were invited to participate in this study. Upon
completion of the online questionnaire the anonymous data went straight into an access data
base with a unique identification number. The participants’ identities were therefore not
known to the researchers. The link was sent to the Facebook friends of the principle
investigator (and the supervisor, as insufficient numbers were achieved with the former
approach). Participation was completely voluntary and all information was kept confidential.
To further ensure that the sample was large enough, the study relied on snowball sampling
(Babbie & Mouton, 2002), where each participant that the researcher and supervisor invited,
was asked to forward the link to one other individual on their Facebook “friends list” who met
the necessary inclusion criteria. Snowball sampling is a non-probability sampling technique
where existing study subjects recruit subjects among their acquaintances (Babbie & Mouton,
2002). The sample group thus appear to grow like a rolling snowball.
Participants were required to complete the survey within a specific time limit, i.e. one month.
Participation was encouraged through the incentive of a lucky draw. However, in order to
enter participants for the lucky draw, a valid email address was required. Therefore
participants were informed by the informed consent formulation that by providing an email
address their anonymity was sacrificed. However, the assurance was still given that all data
would be kept confidential. The survey included sections addressing informed consent and
demographic information, accompanied with a composite questionnaire that measured the
11 Friends on Facebook refer to those individuals that are acquainted with the researcher and have previously accepted a “friend request”. This implies that the person who sent the request may, after the acceptance, view the newly added “friend’s” personal information and vice versa. By sending invitations to participate in the research to “friends” of the researcher and supervisor it was argued that this was not deemed to be an invasion of privacy, as the informed consent formulation clearly allowed the possible participant to accept or reject the request.
Stellenbosch University http://scholar.sun.ac.za

79
various constructs. Given the method of data collection, it was impossible to calculate a
response rate.
3.5.5 Data Analysis
The choice of data analyses techniques are dependent on the type of research questions
the study is aiming to answer. In general, data analyses techniques focus on relationships,
significance or group membership, and the factor structures of utilised instruments (Field,
2005; Hair et al., 2006). This study’s main research question was guided by several research
hypotheses, each investigated through the data analysis applied in this research. More
specifically, the data in this study was analysed by means of quantitative techniques (e.g.
structural equation modelling). This section will elaborate on the various data analysis
techniques that were employed to investigate the research hypotheses as well as certain
aspects of the measurement instruments (e.g. factor structure and internal consistency).
3.5.5.1.1 Item Analysis
The various measurements that were used to measure the latent variables were developed
with the specific intention to measure a specific construct or a specific dimension of a
construct. According to Smuts (2011), the items comprising these scales have been
specifically developed to indicate an individual’s standing on the specific dimensions of the
latent variables.
Item analysis was thus used to determine the internal consistency of the responses of
respondents to items of the various measuring instruments used. Item analysis was further
used to establish whether the items successfully reflected the intended latent variable and to
identify those items not successfully measuring the intended dimension. Items that did not
contribute to the internal consistency of the latent dimension in question were flagged and
considered for elimination (Steyn, 2011). From the results of all the analyses, a set of item
statistics were investigated to flag possible problematic items. Based on an analysis of the
results per instrument or subscale, decisions were made regarding the retention or deletion
of items in the respective scales.
3.5.5.1.2 Exploratory Factor Analyses (EFA)
Typically, the goal of EFA is to allow the data to determine the interrelationships amongst a
set of variables. In this study it was decided to use EFA to inspect the factor structures of the
instruments in question when the confirmatory factor analysis (CFA) results suggested a
poor fit between the observed data and the original theoretical model. Consequently, EFA
were only performed on three scales (the PANAS, the Gratitude Questonnaire and the
Stellenbosch University http://scholar.sun.ac.za

80
Psychological Ownership Questionnaire). The objective of the analyses was to inspect the
factor structures of these scales. In cases where the uni-dimensionality was not met, the
possibility of meaningful factor fusion was investigated. The question, therefore, was
whether the extracted factors constitute meaningful subthemes within the original latent
variable in question. Furthermore, the ability of a single factor to account for the observed
inter-item correlation matrix was also investigated. This approach was taken to investigate
the magnitude of the factor loadings when a single factor (as per the a priori model) was
forced and to examine the magnitude of the factor loadings. In all cases, the credibility of the
extracted factor structure as an explanation of the observed inter-item correlation matrix
were evaluated by examining the matrix of residual correlations. The percentage of large
residual correlations was regarded as reflecting on the credibility of the extracted factor
solution as an explanation for the observed correlation matrix.
Principal component factor analysis (PCA) with varimax rotation was used to analyse the
variance shared between the items comprising the scale/subscales in question. The decision
on the number of factors to extract was based on the Eigen-value-bigger-than-one rule, as
well as the scree plot. A factor loading was considered acceptable if λij > .50.
3.5.5.1.2 Confirmatory factor analysis
To evaluate the quality of the measurement instruments (i.e. measurement models) in terms
of the data obtained, CFA may be conducted as a way of testing how well measured
variables represent a smaller number of constructs (Hair et al., 2006).
CFA is similar to EFA in many respects, but according to Hair et al. (2006), philosophically it
is quite different. With CFA, the researcher must specify the number of factors that exist
within a set of variables, as well as the relationships between observed variable and factors,
before results can be computed. This information is often obtained from the EFA or theory12,
and therefore the CFA serves to confirm the observed structures of the constructs. Structural
equation modelling (SEM) is then used to test how well a priori pattern of factor loadings fits
the actual data. Therefore, CFA assists researchers to either reject or accept their
preconceived measurement theory of the constructs included in their study. Only once the
factor structure is accepted with confidence, can the researcher continue to evaluate the
research questions.
12 In the case of this study all CFAs that were conducted were specified to test the original theoretical structure of the instruments used in this research.
Stellenbosch University http://scholar.sun.ac.za

81
Variable type
Before CFA can be conducted the variable type must be specified and the normality of the
data should be investigated. The responses of the items on all the questionnaires utilised in
this study were captured on ordinal scales. Jöreskog (2005) has argued that the ordinal
nature of the data requires that polychoric correlations and the asymptotic covariance matrix
should be analysed. Conversely, a Monte Carlo study by Muthén and Kaplan (1985)
investigated results that were obtained from different estimation techniques (i.e. ML,
Generalized Least-Squares, Asymptotically Distribution Free, Categorical variable
methodology) when applied within a CFA SEM framework on non-normal categorical
variables, dealt with as interval scale (continuous) non-normal variables. The outcome of
their research indicated that using Maximum Likelihood (ML) estimation, where scales are
classified as continuous and, where these variables are reasonably skewed and kurtotic, is
permissible as the standard error and chi-square estimates were not critically
misrepresented. Therefore, for the purpose of this study, the items (i.e. observed variables)
for all the questionnaires were specified to be continuous in all the CFA analyses.
Normality and estimation technique
To further ensure that SEM statistical assumptions were not violated, the univariate and
multivariate normality of the indicator variables for the various subscales, i.e. for all the
measurement instruments used in this research, were routinely inspected with PRELIS
(Jöreskog & Sörbom, 1996). The results of the normality analyses are reported at the
beginning of each section that reports on the CFA analysis for each separate measurement
instrument, as well as for the final measurement model for the structural model tested in this
research. In cases where the null hypothesis of the univariate and multivariate normality was
rejected, Robust Maximum Likelihood (RML) was specified as the estimation technique
(Tabachnick & Fidell, 2001) for the specific analysis. Conversely, in cases where the null
hypothesis of the univariate and multivariate normality could not be rejected, Maximum
Likelihood13 estimation would be utilised.
Goodness of fit indices
Goodness-of-fit indices are numerical indices that evaluate how well the model accounts for
the data. A wide range of goodness of fit indices have been developed that can be used as a
summary of the model’s overall fit. However, Diamantopoulos and Siguaw (2000) warn that
none of these indices are unambiguously superior to the rest in all conditions, and that
13 ML estimation was never employed as the null hypothesis for the multivariate normality of all the instruments were always rejected, requiring RML estimation to be used.
Stellenbosch University http://scholar.sun.ac.za

82
specific indices have been shown to operate fairly differently under a range of conditions.
These authors assert that sample size, estimation procedure, model complexity, degree of
multivariate normality and variable independence, or any combination thereof, may influence
the statistical power of the resulted indices.
Several goodness of fit statistics were used to determine the validity of the measurement
models in the current study. These include the Satorra- Bentler chi-square (S-Bχ2),
standardised root mean square residual (SRMR), root mean square error of approximation
(RMSEA), non-normed fit index (NNFI), the comparative fit index (CFI) and the P-Value for
Test of Close Fit. These indices were selected, as they are the most widely reported in other
studies (Byrne, 1998; Hair et al., 2006). Simulation research by Hair et al. (2006), suggest
that model characteristics such as sample size and the number of observed variables in the
model, should be used to set the appropriate cut-off values for the above-mentioned GOF
indices. For a sample smaller than 250 participants (as is the case in this research with n =
199) the fit indices in table 3.2 are applicable (Hair et al., 2006) and will be referred to
throughout this chapter.
Table 3.2
Suggested cut-off values of fit indices demonstrating Goodness-of-Fit given differential model
complexity (Hair et al., 2006)
N < 250
GOF statistics m ≤ 12 12 < m < 30 m ≥ 30
CFI / NNFI > .97 > .95 > .92
SRMR Could be biased upward, use other indices
≤ .08 < .09
RMSEA < .08 < .08 < .08
Models in this study that comply with the different
criterion.
GQ6 PANAS Ryff PWB Scale
UWES-9 PsyCap-24 Measurement Model
POSS PWBW Scale Structural Model
PsyOwn Quest.
Note: m = number of observed variables; N applies to number of observations per group when applying CFA to multiple groups at the same time; CFI = comparative fit index (CFI); NNFI = non-normed fit index; GQ6 = Gratitude Questionnaire; PANAS = Positive and Negative Affect Schedule; Ryff PWBW Scale = Ryff Psychological well-being scale; UWES-9 = Utrecht Work Engagement Scale; PsyCap 24 = Psychological Capital Questionnaire; POSS = Perceived Organisational Support Scale; PWBW Scale = Psychological Well-being at Work Scale; PsyOwn Quest. = Psychological Ownership Questionnaire; Measurement model = Measurement model of the Steyn-Boers Model of Psychological Well-being at Work; Structural Model = Structural Model of Psychological Well-being at work.
a.) Satorra – Bentler scaled chi square (S-BX2)
Satorra and Bentler (2001) proposed a family of scaling corrections aimed at improving the
chi-square approximation of goodness-of-fit test statistics in small samples, large models
Stellenbosch University http://scholar.sun.ac.za

83
and non-normal data. The Satorra-Bentler scaled chi-square is generated when robust
estimation techniques are employed. Robust estimation techniques are used when data
deviates from the normal distribution. If the data departs markedly from multivariate
normality, the Satorra-Bentler scaled chi square statistic (S-Bχ2) should be used to provide
an improved estimate of the fit of a model (Satorra & Bentler, 2001).
b.) Standardised root mean residual (SRMR)
The SRMR is the standardised square root of the mean of the squared residuals, in other
words, an average of the residuals between individual observed and estimated covariance
and variance terms. Lower SRMR values represent better fit and higher values represent
worse fit. The average SRMR value is 0, meaning that both positive and negative residuals
can occur (Hair et al., 2006). In research with a sample size of less than 250 respondents
(as is the case in this study), and with number of observed variables ranging between 12
and 30 (which applies to most of the measurement models tested in this study), a cut-off
value to indicate good model fit of .08 can be suggested for the SRMR (Hair et al., 2006).
Kelloway (1998) has a more strict view and suggests that SRMR-values that are smaller
than .05 are indicative of an acceptable fit.
c.) The root mean square error of approximation (RMSEA)
The RMSEA is a good representation of how well the model fits the population, not just the
sample used for estimation. Lower RMSEA values indicate a better fit (Hair et al., 2006). In
general, values below .08 for the RMSEA are indicative of acceptable fit, with values below
.05 suggesting a very good fit (Hair et al., 2006).
d.) Comparative fit index (CFI) and non-normed fit index (NNFI)
A general guideline for the interpretation of the CFI and NNFI is that values of .92 and higher
indicates satisfactory fit between the postulated model and empirical data (Hair et al., 2006)
for a sample with a population with less than 250 and more than 30 observed variables. This
cut-off value may, however, change if less observed variables are present in the specified
model. Table 3.2 contains the different cut-off values deemed appropriate for the different
models tested in this study.
3.6 MEASUREMENT INSTRUMENTS
To evaluate the fit of the Steyn-Boers Structural Model of Psychological Well-being at Work,
the latent variables comprising the model had to be operationalised. Diamantopoulos and
Siguaw (2000) emphasised that if the quality of the measures used cannot be trusted, then
Stellenbosch University http://scholar.sun.ac.za

84
any evaluations of the relationships presented in the structural model will be problematic.
Consequently, available literature was reviewed on the reliability and validity of the selected
instruments to justify the selection of these specific measures at the onset of the research.
The existing research evidence that supported the psychometric integrity of each measure is
presented below. Additionally, the successes with which the indicator variables represent the
latent variables comprising the structural model in this specific study were empirically
evaluated via item analysis, exploratory factor analysis (EFA), where it was necessary, and
confirmatory factor analysis (CFA).
Item analyses were performed to determine whether the items of each measure reflected a
common underlying variable and that all the items of each measure sensitively differentiate
between the different states of the latent variable being measured. Poor items were flagged
and considered for deletion. EFA was performed only in those instances where the CFA
results suggested a poor fit between the observed data and the original theoretical model.
Due to the fact that the data was gathered through the means of an electronic survey,
participants had to answer all the questions14 once they voluntarily agreed to participate.
This had the benefit of the data being free from random missing values and therefore no
missing values had to be imputed.
3.6.1 Hedonic Well-Being (HWB)
The Positive and Negative Affect Schedule (PANAS) was used in this study to measure
employees’ HWB. The scale was developed by Watson, et al., (1988) with the goal of
assessing the distinct dimensions of Positive Affect (PA) and Negative Affect (NA). The
scale consists of two 10-item subscales for the two affects respectively.
The psychometric properties of the PANAS have been well researched, and the measure
has consistently been identified as a reliable and valid measure for both Positive and
Negative Affect (Crawford & Henry, 2004; Watson, et al., 1988). The scale takes the form of
a 5-point Likert scale ranging from 1 (very slightly or not at all) to 5 (extremely). Positive
Affect items include words such as Interested, Strong and Proud, where Negative Affect
items include words such as Guilty, Scared and Hostile. It can be used with various time
frames, ranging from “at this specific moment” to “during the last year”. Internal consistency
estimates range from good to excellent in community and psychiatric samples for both the
Positive Affect (α = .83 – .90) and the Negative Affect subscale (α = .85 – .90) (Petrie,
14 The electronic survey was designed with a built-in function where a participant could not move to a next page if all the questions on the current page were not completed.
Stellenbosch University http://scholar.sun.ac.za

85
Chapman & Vines, 2012). The two scales are minimally correlated with each other (r = - .05
to – .35), suggesting that they indeed measure separate constructs. Petrie et al. (2012)
reported good internal consistency for the PA subscale (α = .89) and the NA subscale (α =
.92).
3.6.1.1 Descriptive statistics and item analyses
Item analyses were conducted with the SPSS Scales Reliability Procedure on both
subscales, namely the Positive Affect subscale and the Negative Affect subscale. The
results of the item analyses, as well as the descriptive statistics are presented in table 3.3.
The results of the analysis were very good as both of the subscales obtained values
comfortably exceeding the .70 benchmark for an acceptable reliability coefficient (Nunnaly,
1978). No poor items were identified after inspection of the two sets of item statistics, and all
the items on the two subscales were retained for further data analysis.
Table 3.3
The means, standard deviation and reliability statistics for the PANAS
PANAS subscale Number of
Items
M SD α
Positive Affect 10 34.45 7.376 .883
Negative Affect 10 40.77 6.616 .836
3.6.1.2 Confirmatory Factor Analysis
3.6.1.2.1 Measurement Model Specification and Data Normality
Structural equation modelling (SEM) was used to perform CFA on the set of indicator
variables for the PANAS. The measurement model was specified to consist of 20 observed
variables (X’s), two unmeasured latent factors (ξs; i.e. the PANAS subscales) with single-
headed arrows from the ξ’s to X’s representing the proposed regression of the observed
variable onto the latent factors (λs). Next, the univariate and multivariate normality of the
indicator variables for the two subscales were investigated with PRELIS (Jöreskog &
Sörbom, 1996). The null hypothesis of multivariate normality was rejected (skewness and
kurtosis: χ2=540.260, p=.000). Hence, RML estimation was employed to derive model
parameter estimates.
Stellenbosch University http://scholar.sun.ac.za

86
Table 3.4
Test of Multivariate normality (PANAS)
Skewness Kurtosis Skewness and Kurtosis
Value Z-score P-value Value Z-score P-value Chi-Square P-Value
89.144 20.230 .000 523.577 11.446 .000 540.269 .000
3.7.1.2.2 Evaluation of the measurement model
The measurement model, in this instance, represents the relationship between the Positive
Affect (PA) and Negative Affect (NA) constructs and its manifest indicators. The aim of the
confirmatory factor analysis (CFA) was to determine whether the operationalisation of the PA
and NA latent variables were successful.
Figure 3.2: Measurement model of the PANAS scale (Standardised Solution)
The results of this analysis (and all the rest to follow) will be discussed by evaluating the
overall fit statistics based on the selected array of model fit indices, discussed previously,
produced by LISREL. Thereafter a conclusion on the psychometric integrity of the respective
Stellenbosch University http://scholar.sun.ac.za

87
scale will be drawn. The purpose of assessing the overall fit of a model is to determine the
degree to which the model as a whole is consistent with the empirical data at hand.
The results of the single group CFA conducted with LISREL 8.80 (Jöreskog & Sörbom,
2002) for the measurement model of the PANAS are reported in table 3.5. The exact fit of
the measurement model is tested by evaluating the S-Bχ2 statistic. In this model a Satorra
Bentler Scaled chi-square value of 458.801 with 169 degrees of freedom and p = .000 was
obtained. Thus, the null hypothesis of exact fit was rejected (p < .05). The null hypothesis of
close fit has also been tested by LISREL and is shown in table 3.5 as the P-Value for Test of
Close Fit (RMSEA < .05) = 0.00. Based on this result the close fit null hypothesis was
rejected (p <.05) and it was concluded that the measurement model did not obtain close fit.
According to Hair et al., (2006) when the sample is smaller than 250 with between 12 and 30
observed variables, as in this case, the CFI should be higher than .95 and the SRMR and
RMSEA should be lower than .08. According to these general guidelines, the model results
indicated mediocre fit. All the factor loadings were statistically significant and ranged from
.431 (item 11 = Irritable) to .818 (item 9 = Enthusiastic), with the exception of one factor
loading being below .40. This was item 12 (Alert) with a loading of .398.
Table 3.5
Goodness of fit statistics for the PANAS measurement model
Model X2 S-Bχ2 df S-Bχ2/
df
NNFI CFI RMR SRMR RMSEA
(CI)
P(close)
540.260 458.801 169 2.714 .892 .904 .104 .0914 .0931
(.0829;
.103)
.000
Note: X2, Chi-square; S-BX2, Satorra-Bentler Scaled Chi-square; NNFI, non-normed fit index; CFI, comparative fit index; RMR, root mean square residuals; SRMR, standardised root mean residual; RMSEA, root mean square error of approximation *p < 0.05.
3.7.1.3 Exploratory Factor Analysis
As the CFA yielded results that did not indicate good fit, it was decided to conduct an EFA
on the original scale. Firstly, an unrestricted EFA was conducted on the 20-item scale. The
results suggested that five factors could be extracted (table 3.6) accounting for 64.587% of
the variance being explained. For the five factor solution, 30% of non-redundant residuals
had absolute values greater than .05. The rotated factor solution therefore provided a fairly
credible explanation for the observed inter-item correlation matrix. The content of the five
factors were investigated to determine whether the five factors would make theoretical
sense. However, no meaningful subthemes could be established for the five extracted
factors. As an alternative an EFA was conducted where a two factor solution was forced
Stellenbosch University http://scholar.sun.ac.za

88
onto the data (table 3.7). The two factors explained 46.122% variance. In the two factor
solution, however, 50% of the non-redundant residual had absolute values greater than .05.
Although the two factor solution had a higher percentage of non-redundant residuals, than
the five factor solution, theoretically it made more sense as the factor structure that was
derived from the analysis was similar to the factor structure of the PANAS (see table 3.7).
Given the results of the item analysis, as well as the sufficient loadings obtained for the
items in the two factor EFA, no items were removed from the instrument. However, the
results of the initial EFA (five factor structure) were used to calculate the item parcels for the
measurement model of the structural model.
Other research seems to suggest that there have been some inconsistencies regarding the
factor structure of the PANAS. Kwon, Kalpakjian and Roller (2010) conducted a study to
determine the factor structure of the PANAS and the relationship between Positive and
Negative Affect. EFA was performed on the sample to examine the underlying dimensions of
the PANAS. Two factors were extracted and oblique rotation was applied to interpret pattern
of loadings. Kwon et al., (2010), however, concluded that the factor analyses suggested the
possibility of a third dimension reflecting Negative Affect and that Affect may consist of more
than two general dimensions. Watson et al., (1988) conducted an EFA with varimax rotation
that revealed the first two factors accounted for a very high proportion of the common
variance, with all items loading cleanly on their designated factor. Although no other studies
were found to report the same factor structure as found in this study (five factors),
Terracciano, McCrae and Costa Jr. (2003) did report that in light of the strong empirical
robustness of the PANAS scales, there are surprising inconsistencies among CFA studies of
the two-factor model.
Table 3.6
Rotated factor matrix of the PANAS (free EFA)
Factors
1 2 3 4 5
Interested .744 -.062 .133 -.145 -.019
Distressed -.013 .247 -.049 .756 .022
Excited .848 .027 .099 -.020 -.008
Upset -.176 .091 .022 .795 .120
Strong .416 -.183 .531 .039 -.102
Guilty -.078 .205 -.020 .169 .827
Scared -.038 .753 .051 .107 .317
Hostile -.151 .198 .163 .540 .224
Enthusiastic .825 .042 .191 -.215 .020
Proud .622 .073 .239 -.197 -.171
Stellenbosch University http://scholar.sun.ac.za

89
Irritable -.185 .120 -.048 .705 .049
Alert .033 .092 .826 .011 -.040
Ashamed -.021 .285 -.094 .132 .807
Inspired .764 -.070 .297 -.142 -.029
Nervous .129 .780 -.070 .341 -.061
Determined .523 -.052 .526 .057 -.020
Attentive .344 .068 .740 -.050 .001
Jittery .024 .650 .034 .349 .192
Active .378 .006 .636 .037 .003
Afraid -.115 .859 .039 .054 .205
Table 3.7
Rotated factor matrix of the PANAS (forced EFA)
Component
Positive Affect Negative Affect
Interested .684 -.181
Distressed -.080 .615
Excited .746 -.053
Upset -.193 .585
Strong .622 -.131
Guilty -.088 .576
Scared .058 .725
Hostile -.061 .566
Enthusiastic .799 -.134
Proud .668 -.157
Irritable -.227 .520
Alert .510 .127
Ashamed -.073 .592
Inspired .794 -.176
Nervous .115 .704
Determined .715 -.005
Attentive .714 .060
Jittery .070 .737
Active .667 .055
Afraid .007 .729
3.6.2 Eudaimonic Well-Being
Ryff’s (1989) Psychological Well-being scale (RPWB) was used to measure Eudaimonic
Well-being. The RPWB was originally validated on a sample of 321 well-educated, socially
connected, financially-comfortable and physically healthy men and women (Ryff, 1989). The
Stellenbosch University http://scholar.sun.ac.za

90
scale consists of six subscales namely, Positive Relations with Others, Autonomy,
Environmental Mastery, Self-Acceptance, Personal Growth and Purpose in Life. People who
score high on Positive Relations with Others have warm satisfying relationships and are
concerned about the welfare of others. These individuals are capable of strong empathy,
affection and intimacy (Ryff, 1989). An example of an item on this subscale is: “It is important
for me to be a good listener when close friends talk to me about their problems.” Autonomy
refers to the characteristics of being self-determining and independent; and being able to
resist social pressure to think and act in certain ways. This subscale thus has items that refer
to how people view themselves in terms of Autonomy (Ryff, 1989). An example of an item is
“I am not afraid to voice my opinions, even when they are in opposition to the opinions of
most people”. Individuals scoring high on Environmental Mastery (example item: “My efforts
to find the kind of activities and relationships that I need have been quite successful”) have a
sense of mastery and competence in managing their environment. These individuals make
effective use of surrounding opportunities and are able to choose or create contexts suitable
to personal needs and values (Ryff, 1989). Individuals who display high levels of Self-
Acceptance possesses a positive attitude toward the self, acknowledges and accepts
multiple aspects of self, including good and bad qualities (Ryff, 1989). An example item is:
“When I compare myself to my friends and acquaintances, it makes me feel good about who
I am”. Personal Growth (example item: “For me, life has been a continuous process of
learning, changing and growth”) refers to the feeling of continued development. Individuals
high on this construct are open to new experiences, have a sense of realising his or her
potential and are changing in ways that reflect more self-knowledge and effectiveness (Ryff,
1989). The last subscale, Purpose in Life, refers to individuals that have goals in life and a
sense of directedness. These individuals feel there is meaning to present and past life, hold
beliefs that give life purpose and have aims and objectives for living (Ryff, 1989). An
example item for this subscale is: “I am an active person in carrying out the plans I set for
myself.”
The internal consistency coefficients for the subscales, in the original validation sample
(Ryff, 1989), were as follows: Self-Acceptance, .93; Positive Relations with Others, .91;
Autonomy, .86; Environmental Mastery, .90; Purpose in Life, .90; and Personal Growth, .87.
The test-retest reliability coefficients over a six week period on a subsample of the
respondents (n = 117) that participated in the validation study, were as follows: Self-
Acceptance, .85; Positive Relations with Others, .83; Autonomy, .88; Environmental Mastery,
.81; Purpose in Life, .82; and Personal Growth, .81 (Ryff, 1989).
Stellenbosch University http://scholar.sun.ac.za

91
The scale utilises a Likert scale response format, ranging from 1 (strongly disagree) to 6
(strongly agree). There are three different versions of the scale, namely a 14-item, 9-item
and a 6-item per subscale version. The 9-item per subscale version was used in this study.
Therefore, each of the six subscales contained nine items which resulted in a total of 54
items for the scale. The items are presented in a random order.
3.6.2.1 Descriptive statistics and item analyses
Item analyses were conducted on all the subscales using SPSS Scale Reliability Procedure
(SPSS Version 16, 2007).
On the Autonomy subscale, the Cronbach alpha of .692 pointed towards the fact that the
items do not seem to respond in unity to the systematic differences in the latent variable,
although all the items were designed with the intention to measure Autonomy. By evaluating
the inter-item correlation matrix, the inter-item correlations of item 19 were all negative.
Although item 19’s squared multiple correlation (.313) were comfortable within the range
(.159 - .464), the deletion of item 19 would have incurred an increase in alpha (∆ = .113) and
result in a Cronbach alpha of .742. The results thus suggested that item 19 on the total scale
should have been flagged as a poor item. Item 19 (“Being happy with myself is more
important to me than having others approve of me”) was thus deleted. After the deletion of
item 19, the subscale’s reliability coefficient (.741) exceeded the .70 benchmark for an
acceptable reliability coefficient (Nunnaly, 1978).
On the Environmental Mastery subscale, item 7 (“I do not fit very well with the people and
the community around me”) was flagged as a poor item. The initial Cronbach alpha of the
subscale was .764, which was above the recommended .70 level. However, the results of
the item analysis indicated that should item 7 be removed, the Cronbach alpha will increase
to .778. The squared multiple correlation of this item was the lowest of all the items on this
subscale with a value of .130. The other squared multiple correlations ranged between .200 -
.472. The inter-item correlations for this item with the others were somewhat lower than the
rest. Although the Cronbach’s alpha before and after deletion of this item were both above
Nunnaly’s (1978) benchmark, taking the basket of evidence into account, it was decided to
remove item 7 from the item pool.
The subscale Purpose in Life, also contained a poor item. The item that was flagged was
item 8 (“I live life one day at a time and don’t really think about the future”). The initial
Cronbach alpha for this subscale was above .70 (Nunnaly 1978) with a value of .75. The
Item-Total Statistics table indicated that the Cronbach alpha will increase to .766 if this item
were to be deleted from the subscale. The squared multiple correlation for this item was the
Stellenbosch University http://scholar.sun.ac.za

92
lowest compared to the others on the subscale with a value of .112. The other items’
squared multiple correlations ranged from .188 - .397. The inter-item correlation matrix
revealed that the inter-item correlations of this item were low in relation to the other items’
inter-item correlations. It was decided to remove this item from the item pool.
Table 3.8 contains the mean, standard deviations and Cronbach alphas for all the subscales
after the respective poor items were deleted. Descriptive statistics for the total scale are
presented in table 3.9. The Cronbach alpha (α = .928) indicated that the overall scale also
obtained sufficient reliability according to Nunnaly’s (1978) benchmark.
Table 3.8
The means, standard deviation and reliability statistics for the Ryff’s PWB subscales
Ryff’s PWB scale Number of
Items
M SD α
Autonomy 8 34.00 6.492 .742
Environmental Mastery 8 34.92 6.803 .778
Personal Growth 9 44.80 5.957 .716
Relationships 9 42.46 7.319 .775
Purpose in Life 8 38.19 6.264 .766
Self-Acceptance 9 40.76 7.722 .837
Table 3.9
The mean, standard deviation and reliability statistic for the Ryff’s PWB scale
Ryff’s PWB scale Number of
items
M SD α
EWB 51 235.13 31.168 .928
3.6.2.2 Confirmatory Factor Analysis
3.6.2.2.1 Measurement Model Specification and Data Normality
SEM was used to perform CFA on the set of indicator variables for the Ryff Psychological
Well-being scale. The measurement model was specified to consist of 51 observed variables
(X’s), six unmeasured latent factors (ξs; i.e. the various subscales) with single-headed
arrows from the ξ’s to X’s representing the proposed regression of the observed variables
onto the latent factors (λs). The univariate and multivariate normality of the indicator
variables for the six subscales were investigated with PRELIS, before the CFA was
conducted (Joreskog & Sörbom, 1996). The null hypothesis of multivariate normality was
rejected (skewness and kurtosis: χ2=1767.796, p=.000). Once again RML Estimation was
employed to derive model parameter estimates.
Stellenbosch University http://scholar.sun.ac.za

93
Table 3.10
Test of multivariate normality (Ryff PWB scale)
Skewness Kurtosis Skewness and Kurtosis
Value Z-score P-value Value Z-score P-value Chi-Square P-Value
994.896 39.280 .000 2989.083 14.997 .000 1767.796 .000
3.7.2.2.2 Evaluation of the measurement model
This measurement model represents the relationship between the six subscales, namely
Autonomy, Positive Relationship with Others, Environmental Mastery, Purpose in Life, Self-
Acceptance and Personal Growth, and their manifest indicators.
Stellenbosch University http://scholar.sun.ac.za

94
Figure 3.3: Measurement model of Ryff’s PWB scale (Standardised Solution)
Stellenbosch University http://scholar.sun.ac.za

95
The results of the CFA conducted with LISREL 8.8 (Jöreskog & Sörbom, 2002) are
presented in table 3.11. The results indicated reasonable fit. The revised measurement
model contained 51 observed variables (after the deletion of the three items described in the
previous section). Based on the Hair et al., (2006) recommended cut-off values (table 3.2)
for good model fit (for a model of this complexity) the CFI and NNFI should be above .92, the
SRMR less than .09, and the RMSEA less than .08. The NNFI (.888) and the CFI (.893)
were slightly below the required level. However, the SRMR (.0940) marginally missed the
cut-off value, whilst the RMSEA was below the suggested cut-off value. Both the exact fit
and close fit hypotheses were rejected and it was concluded that the basket of evidence
showed reasonable model fit. Of the 51 items, 44 obtained significant factor loadings above
the .40 cut-off. These loadings ranged from .426 - .750.
Table 3.11
The Goodness of Fit Statistics for Ryff’s PWB Scale
Model X2 S-Bχ2 df S-Bχ2/
df
NNFI CFI RMR SRMR RMSEA
(CI)
P(close)
2700.272 2647.196 1209 2.19 0.888 0.893 0.157 0.0940 0.0775
(0.0735;
0.08150
0.000
Note: X2, Chi-square; S-BX2, Satorra-Bentler Scaled Chi-square; NNFI, non-normed fit index; CFI, comparative fit index; RMR, root mean square residuals; SRMR, standardised root mean residual; RMSEA, root mean square error of approximation *p < 0.05.
3.6.3 Psychological Well-Being at Work
The Index of Psychological Well-being at Work (IPWBW) was developed by Dagenais-
Desmarais and Savoie (2012). According to Dagenais-Desmarais and Savoie (2012) the
PWBW construct intends to describe an individual’s subjective positive experience at work,
which comprises of primarily Eudaimonic dimensions. These include Interpersonal Fit at
work, Thriving at Work, Feeling of Competency at Work, Perceived Recognition at Work and
a Desire for Involvement at Work. The IPWBW utilises a 5-point Likert response scale
ranging from 0 (Disagree) to 5 (Completely Agree). There are two forms of the scale, a 25
item scale and an 80 item scale. The 25 item scale was used for this study.
The IPWBW has been shown to have adequate internal consistency, both at scale and
factor level. Dagenais-Desmarais and Savoie (2012) reported that the Cronbach alpha for
the entire scale was .964 and that the subscales’ alphas were as follows: Interpersonal Fit at
work α = .920; Thriving at Work α = .907; Feeling of Competency at Work α = .861;
Perceived Recognition at Work α = .833; and A Desire for Involvement at Work α = .888.
Stellenbosch University http://scholar.sun.ac.za

96
These Cronbach alphas are high, suggesting strong internal consistency for the dimensions
(Dagenais-Desmarais & Savoie, 2012).
3.6.3.1 Descriptive statistics and item analyses
Item analyses were conducted with the SPSS Scales Reliability Procedure on all the
subscales, as well as on the whole scale as the higher order construct of PWBW was
included in the final model. The results of the item analyses, as well as the descriptive
statistics for the subscales are contained in table 3.12.
The results of the item analyses indicated that all the subscales’ reliability coefficients
comfortably exceeded the .70 benchmark for an acceptable reliability coefficient (Nunnaly,
1978). Moreover, very good reliability was indicated by the fact that three of the subscales
obtained values above .90. This reflected very favourably on the internal consistency of
these subscales. No poor items in any of the subscales were identified through inspection of
the item analysis statistics and all the items on the subscales were retained in further
analyses. In addition, the item analysis results for the total scale also showed very good
reliability with a coefficient of .960 (table 3.13).
Table 3.12
The means, standard deviation and reliability statistics for the PWBW subscales
PWBW subscales
Number of
Items
M SD α
IFW 5 24.17 5.578 .909
TW 5 22.26 6.920 .949
FCW 5 25.22 4.652 .835
PRW 5 22.27 6.659 .918
DIW 5 24.99 5.182 .841
Note: IFW = Interpersonal Fit at Work; TW = Thriving at Work; FCW = Feeling of Competency at Work; PRW = Perceived Recognition at Work; DIW = A Desire for Involvement at Work.
Table 3.13
The mean, standard deviation and reliability statistics for the PWBW scale
PWBW M SD α
PWBW 118.91 24.753 .960
3.6.3.2 Confirmatory Factor Analysis
3.6.3.2.1 Measurement Model Specification and Data Normality
Structural Equation Modelling (SEM) was used to perform CFA on the set of indicator
variables for the IPWBW. The measurement model was specified to consist of 25 observed
variables (X’s), and the five unmeasured latent factors (ξs; i.e. the IPWBW subscales). The
Stellenbosch University http://scholar.sun.ac.za

97
univariate and multivariate normality of the indicator variables for the five subscales were
investigated with PRELIS (Joreskog & Sörbom, 1996). The null hypothesis of multivariate
normality was rejected (skewness and kurtosis: χ2=2400.986, p=.000). RML estimation was
employed to derive model parameter estimates.
Table 3.14
Test of multivariate normality (PWBW scale)
Skewness Kurtosis Skewness and Kurtosis
Value Z-score P-value Value Z-score P-value Chi-Square P-Value
240.210 45.504 .000 934.626 18.176 .000 2400.986 .000
3.6.3.2.2 Evaluation of the measurement model
The measurement model, in this instance, represented the relationships between the PWBW
subscales and its manifest indicators.
Stellenbosch University http://scholar.sun.ac.za

98
Figure 3.4: Measurement model of the PWBW scale (Standardised Solution)
Stellenbosch University http://scholar.sun.ac.za

99
The results of the CFA conducted with LISREL 8.8 (Jöreskog & Sörbom, 2002) are
presented in table 3.15. The GOF for the model was evaluated in terms of the set of indices /
cut-off values for measurement models with between 12 and 30 observed variables (refer to
table 3.2). A Satorra Bentler Scaled chi-square value of 672.434 with 265 degrees of
freedom and p = .000 emerged. The null hypothesis for exact fit was rejected (p < 0.05). The
results further revealed that the null hypothesis for close fit was also rejected (p < .05).
However, both the CFI and NNFI (.973 and .970 respectively) were above .95 which
indicated good model fit. The SRMR value of .0684 was under the .08 cut-off (Hair et al.,
2006), further indicating good model fit. The RMSEA was slightly above the .08 cut-off point.
However, given all the other results it could be concluded that overall good model fit was
achieved. All the items on the scale obtained significant factor loadings. The loadings ranged
from .609 (item 25) to .903 (item 17).
Table 3.15
The Goodness of fit statistics for the PWBW scale
Model X2 S-Bχ2 df S-Bχ2/ df NNFI CFI RMR SRMR RMSEA
(CI)
P(close)
879.856 672.434 265 2.537 .970 .973 .123 .0684 .0881
(.0799;
.0964)
.000
Note: X2, Chi-square; S-BX2, Satorra-Bentler Scaled Chi-square; NNFI, non-normed fit index; CFI, comparative fit index; RMR, root mean square residuals; SRMR, standardised root mean residual; RMSEA, root mean square error of approximation *p < 0.05.
3.6.4 PsyCap-24
The four constructs that make out Psychological Capital, namely Hope (example item:
“There are lots of ways around any problem”); Optimism (example item: “I always look on the
bright side of things regarding my job”), Self-efficacy (example item: “I feel confident
analysing a long-term problem to find a solution”); and Resilience (example item: “I usually
manage difficulties one way or another at work”) were measured with the PCQ-24
(Psychological Capital Questionnaire – Self Rater Version; Luthans, et al., 2007a). The
instrument makes use of a 6-point Likert response scale, ranging from strongly disagree (1)
to strongly agree (6). Each of the four subscales in the PCQ-24 was drawn from established
scales which have been previously tested for a range of psychometric characteristics.
Luthans et al., (2007b), conducted two studies in order to examine the psychometric
properties of the PCQ-24, and evaluate the underlying relations of the four PsyCap
constructs. They had four samples, the first two being management students, the third
engineering students and the fourth sample were insurance service employees (Luthans et
Stellenbosch University http://scholar.sun.ac.za

100
al., 2007b). The Cronbach alphas for each of the six-item subscales and the overall PsyCap
measure for the four samples were as follow: Hope (.72, .75, .80, .76); Resilience (.71, .71,
.66, .72); Self-efficacy (.75, .84, .85, .75); Optimism (.74, .69, .76, .79); and overall PsyCap
(.88, .89, .89, .89). Although there were two Cronbach alphas which fell below the
recommended .70 level (Nunnally, 1987), the reliability of the overall PsyCap measure in all
four samples were consistently above conventional standards (Luthans et al., 2007b). The
PCQ-24 also demonstrated adequate confirmatory factor analytic structure across multiple
samples as well as strong internal reliability (α = .92) (Luthans, et al., 2007b).
Görgens-Ekermans and Herbert (2013) conducted a validation study on the PCQ-24 within
the South African context. The following Cronbach Alphas were reported; Hope: α = .81;
Optimism: α = .67; Self-efficacy: α = .83 and Resilience α = .69. Although two of the values
fell below the recommended .70 value (Nunnally, 1987), it was pointed out that there is a
general clear trend in most research for these two subscales (Optimism and Resilience) to
obtain lower reliability values (Görgens-Ekermans & Herbert, 2013).
3.6.4.1 Descriptive statistics and item analyses
Item analysis, using the SPSS Reliability Procedure (SPSS Version 16, 2007), was
conducted. The Cronbach alphas were similar to those found in the studies conducted by
Luthans et al., (2007b), with all subscales attaining values above .70 (Nunnally, 1987). On
the Resilience subscale one item was flagged as a possible poor item. This conclusion was
reached after an inspection of the squared multiple correlations and the inter-item-
correlations. This negatively keyed item, had the lowest squared multiple correlation on the
subscale (.075). The other five items had squared multiple correlations ranging from .319 to
.492. The inter-item correlations were also much lower than the rest, ranging from .010 to
.210 and none of the others were below .30. The results revealed that the Cronbach alpha of
the subscale will increase from .726 to .814 if the item was to be deleted. However, due to
the fact that the initial Cronbach alpha for this subscale was acceptable, and there are only
six items measuring Resilience, it was decided to rather protect the integrity of the original
scale and not delete the item from the subscale. All the items of the PCQ-24 were therefore
included in the subsequent analyses. The reliability statistics for the four subscales are
presented in table 3.16 and for the entire scale in table 3.17. The Cronbach alpha for the
PCQ-24 was .927, indicating high reliability.
Stellenbosch University http://scholar.sun.ac.za

101
Table 3.16
The means, standard deviation and reliability statistics for the PsyCap-24 subscales
PsyCap 24 Subscales Number of
Items
M SD α
Self-efficacy 6 28.70 5.620 .895
Hope 6 27.42 5.344 .854
Optimism 6 26.27 5.002 .708
Resilience 6 28.43 4.285 .726
Table 3.17
The mean, standard deviation and reliability statistics for the PsyCap-24
PsyCap 24 Number of
Items
M SD α
PsyCap 24 24 110.82 301.715 .927
3.6.4.2 Confirmatory Factor Analysis
3.6.4.2.1 Measurement Model Specification and Data Normality
SEM was used to perform CFA on the sets of indicator variables for the four PsyCap
constructs. The measurement model was specified to consist of 24 observed variables (X’s),
and the four unmeasured latent factors (ξs; i.e. the PsyCap subscales). The null hypothesis
of multivariate normality was rejected (skewness and kurtosis: χ2=1650.850, p=.000) and
hence RML estimation was employed to derive model parameter estimates.
Table 3.18
Test of multivariate normality (PsyCap-24)
Skewness Kurtosis Skewness and Kurtosis
Value Z-score P-value Value Z-score P-value Chi-Square P-Value
191.374 37.488 .000 802.396 15.668 .000 1650.850 .000
6.4.2.2. Evaluation of the measurement model
The measurement model, in this instance, represented the relationship between the PsyCap
variables (Hope, Optimism, Self-efficacy and Resilience) and its manifest indicators. A visual
representation of the measurement model is provided in figure 3.5.
Stellenbosch University http://scholar.sun.ac.za

102
Figure 3.5: Measurement model of PsyCap-24 (Standardised Solution)
The results of the CFA are presented in table 3.19. The GOF for the model was evaluated in
terms of the Hair et al., (2006) guidelines for models with between 12 and 30 observed
variables (refer to table 3.2). A Satorra Bentler Scaled chi-square value of 407.933 with 246
degrees of freedom emerged. The null hypothesis for exact fit was rejected (p < 0.05).
However, the results further revealed that the null hypothesis for close fit could not be
rejected (p = .102; p > .05). Hence, close fit was obtained. Both the CFI and NNFI (.980 and
.978 respectively) far exceeded the .95 cut-off, which indicated good model fit. The SRMR
Stellenbosch University http://scholar.sun.ac.za

103
value of .0697 was well under .08 (Hair et al., 2006) further indicating a good fitting model.
Furthermore, the RMSEA was well below the cut-off point of .08, also indicating very good
fit. All the factor loadings were statistically significant, except for two items, namely item 1315,
on the Resilience subscale, with a value of .152 and item 17 in the Optimism subscale with a
loading of .234. The other values ranged from .456 (items 23 and 24) to .884 (item 4).
Table 3.19
The Goodness of fit statistics for the PsyCap-24
Model X2 S-Bχ2 df S-Bχ2/
df
NNFI CFI RMR SRMR RMSEA
(CI)
P(close)
608.004 407.933 246 1.658 0.978 0.980 0.0966 0.0697 0.0577
(0.0476;
0.0674)
0.102
Note: X2, Chi-square; S-BX2, Satorra-Bentler Scaled Chi-square; NNFI, non-normed fit index; CFI, comparative fit index; RMR, root mean square residuals; SRMR, standardised root mean residual; RMSEA, root mean square error of approximation *p < 0.05.
3.6.5 Gratitude Questionnaire-6
A self-report measure of Gratitude, called the Gratitude Questionnaire six item form (GQ-6)
was used in the study. It was designed by McCullough et al., (2002) to assess individual
differences in the proneness to experience Gratitude in daily life. An example of an item on
this questionnaire is “I have so much in life to be thankful for”. The questionnaire response
format is in the form of a Likert scale, ranging from 1 (strongly disagree) to 7 (strongly
agree), with six items related to Gratitude. The GQ-6 has been shown to have good internal
reliability, obtaining Cronbach alphas between .82 and .87 (McGullough, et al., 2002).
Through a series of exploratory and confirmatory factor analyses, a robust one-factor scale
was developed (McGullough, et al., 2002). Confirmatory factor analysis (CFA) specifying a
one-factor congeneric measurement model yielded goodness-of-fit indices that were typically
considered to be within acceptable ranges (i.e., Comparative fit indices (CFI) ranged from
.90 to .95, and Standardised Root Mean Residuals (SRMR) typically ranged from .05 to .10).
Cronbach’s alpha estimates for the six-item totals have ranged from .76 to .84 (McCullough,
et al., 2002).
15 This is a reverse keyed item and has also posed problems in other studies (e.g. Görgens-Ekermans & Hebert, 2013). It was also revealed in the results of the item analysis that this item should be flagged as a possible poor item.
Stellenbosch University http://scholar.sun.ac.za

104
Scores on the GQ-6 have been found to have significant correlations with other measures
hypothesised to measure the experience of Gratitude in everyday life, and there is evidence
that the GQ-6 relates to other positive traits such as life satisfaction, Hope, spirituality and
religiousness, forgiveness, empathy and pro-social behaviour, and is negatively related to
depression, anxiety, materialism and envy (McCullough et al., 2002).
3.6.5.1 Descriptive statistics and item analyses
Item analysis of the GQ-6 revealed a reliability coefficient of .787 (table 3.20), which was
comfortably above the cut-off point stipulated by Nunnaly (1978). The item statistics were
reviewed and the results of the item analysis indicated that if item 3 and item 6 would be
deleted, the Cronbach alpha would increase. The deletion of item 3 would have incurred an
increase (∆ = 0.015) in the Cronbach alpha resulting in .802. The deletion of item 6 would
have incurred a very small increase in the alpha (∆ = 0.004) and result in the alpha being
.791. Items 3 and 6 were the only two negatively keyed items on this scale. These two items
were investigated for elimination as it might improve the scale internal consistency. It was
determined that if these two items were to be deleted, the Cronbach alpha would only be
marginally higher. As this scale only has six items, it was decided to rather protect the
integrity of the scale and not to remove these two items.
Table 3.20
The means, standard deviation and reliability statistics for the GQ-6
Gratitude -6Q Number of
items
M SD α
Gratitude 6 37.52 4.950 .787
3.6.5.2 Confirmatory Factor Analysis
3.6.5.2.1 Measurement Model Specification and Data Normality
A CFA was conducted on the GQ-6 measurement model which was specified to consist of
six observed variables (X’s), and one unmeasured latent factor (ξs; i.e. Gratitude). The null
hypothesis of multivariate normality was rejected (skewness and kurtosis: X2 = 1066.123, p
= .000). RML was used as the estimation method. A graphical representation of the GQ-6
measurement model is presented in figure 3.6
Table 3.21
Test of multivariate normality (GQ-6)
Skewness Kurtosis Skewness and Kurtosis
Value Z-score P-value Value Z-score P-value Chi-Square P-Value
39.852 29.725 .000 115.327 13.512 .000 1066.123 .000
Stellenbosch University http://scholar.sun.ac.za

105
3.6.5.2.2 Evaluation of the gratitude measurement model
Figure 3.6: Measurement model of the GQ-6 (Standardised Solution)
The results of the CFA conducted with LISREL 8.8 (Jöreskog & Sörbom, 2002) are
presented in table 3.22. A Satorra Bentler Scaled chi-square value of 36.102 with 9 degrees
of freedom and p = .000 emerged. The null hypothesis for exact fit was rejected (p < .05).
The results further revealed that the null hypothesis for close fit should also be rejected (p <
.05). The GOF for the model was evaluated in terms of the Hair et al., (2006) guidelines for
models with less than 12 observed variables. The CFI (.958) fell marginally below the .97
recommended value indicating reasonable fit, whilst the NNFI (.930) fell even further below
.97, also suggesting only reasonable fit. An SRMR value of .0672 was obtained, indicative of
good model fit. However, the RMSEA was well above the cut-off point of .08 (RMSEA =
.123). Four of the six factor loadings were above the .50 recommended loading, ranging
from .626 (item 4) to .963 (item 1). The two loadings which were below .50 were .363 (item
3) and .377 (item 6) and thus also the two flagged, as well as negatively-keyed items.
Table 3.22
The Goodness of Fit Statistics for the GQ-6
Model X2 S-Bχ2 df S-Bχ2/
df
NNFI CFI RMR SRMR RMSEA
(CI)
P(close)
47.922 36.102 9 4.011 .930 .958 0.122 .0672 .123
(.0829;
.167)
.00234
Note: X2, Chi-square; S-BX2, Satorra-Bentler Scaled Chi-square; NNFI, non-normed fit index; CFI, comparative fit index; RMR, root mean square residuals; SRMR, standardised root mean residual; RMSEA, root mean square error of approximation *p < 0.05.
Stellenbosch University http://scholar.sun.ac.za

106
3.6.5.3 Exploratory Factor Analysis
Given that three of the four GOF results did not meet the suggested cut-off values for good
model fit, it was concluded that the factor structure of the instrument should be further
investigated with EFA. At first an unrestricted EFA was conducted, i.e. SPSS was allowed to
freely determine how many factors to extract. The results showed that one factor with an
eigen value greater than one could be extracted, explaining 57.88% of the variance. The
loadings for the rotated factor solution are presented in table 3.23. After an investigation of
the non-redundant residuals with absolute values greater than .05 for this factor solution, it
was noted that it was unacceptably high (86%). It was further evident that the second eigen
value approached one (.973), which suggested that a possible second factor underlies the
scale. Based on this information, it was decided to force a two factor solution in a
subsequent analysis (table 3.24). The two factor model explained 71.097% of the variance.
The percentage of non-redundant residuals came down to 40%, which, although still high,
was markedly better than for the one factor solution. Hence, it seemed that the two factor
solution was a more permissible account of the structure of the scale in this sample. All the
positively keyed items loaded onto one factor (Gratitude-positive) and the two negatively
keyed factors loaded onto the other factor (Gratitude-negative). For this solution all the
loadings were above .70 (table 3.24). A CFA was therefore conducted on the derived two-
factor solution displayed below.
Table 3.23
Structure matrix of the GQ-6 loading on one factor
Factor 1
GRAT 1 .897
GRAT 2 .840
GRAT 3 (-) .513
GRAT 4 .772
GRAT 5 .795
GRAT 6 (-) .538
Stellenbosch University http://scholar.sun.ac.za

107
Table 3.24
Structure matrix of the GQ-6 loading on two factors
Factor 1 Factor 2
GRAT 1 .887 .234
GRAT 2 .838 .203
GRAT 3 (-) .162 .820
GRAT 4 .773 .182
GRAT 5 .817 .145
GRAT 6 (-) .206 .787
3.6.5.4 Confirmatory Factor Analysis
The revised measurement model, in this instance, represented the relationship between
Gratitude-positive and Gratitude-negative and its manifest indicators.
Figure 3.7: Measurement model of the two factor GQ-6 (Standardised Solution)
The exact fit of the measurement model was tested by the S-Bχ2 statistic. In this model a
Satorra Bentler Scaled chi-square value of 28.133 with 8 degrees of freedom and p = .000
was obtained. Thus the null-hypothesis of exact fit was rejected (p < .05). The null
hypothesis of close fit was also tested by LISREL and is shown in table 3.25 as the P-Value
for Test of Close Fit (RMSEA < .05) was equal to .0113. Based on the result the close fit null
hypothesis was rejected (p < .05) and it is concluded that the measurement model did not
obtain close fit. All the GOF indices improved, compared to the one-factor CFA model
(reported in table 3.22). The CFI (.969) and NNFI (.942) increased marginally and the
SRMR (.0473) decreased. Unfortunately, the RMSEA was still above the recommended .80
level (.113). However, in this model the lower boundary for the RMSEA did, at least, include
Stellenbosch University http://scholar.sun.ac.za

108
the 0.08 cut-off value (at .06) – which was not the case for the previous model. Based on the
basket of evidence derived for this model it was concluded that the two factor model
provided a better account (although still only reasonable fit) of the structure of the instrument
in this sample, than the one factor model. The completely standardised loadings (all
significant) ranged from .589 (item 3) to .966 (item 1).
Table 3.25
The Goodness of Fit Statistics for the GQ-6 revised measurement model
Model X2 S-Bχ2 df S-Bχ2/
df
NNFI CFI RMR SRMR RMSEA
(CI)
P(close)
36.410 28.133 8 3.517 .942 .969 .0548 .0473 .113(.0693
;.159)
.0113
Note: X2, Chi-square; S-BX2, Satorra-Bentler Scaled Chi-square; NNFI, non-normed fit index; CFI, comparative fit index; RMR, root mean square residuals; SRMR, standardised root mean residual; RMSEA, root mean square error of approximation *p < 0.05.
3.6.6 Work Engagement
Work Engagement was measured with the 9-item Utrecht Work Engagement Scale (UWES-
9). The instrument consists of three subscales, namely Vigour, Dedication and Absorption.
Each subscale comprises of three items (Shaufeli & Bakker, 2003). The instrument response
format is in the form of a 7-point Likert-scale, ranging from never (1) to always (7).
According to confirmatory factor analysis (CFA) results (Shaufeli & Bakker, 2003), the
UWES-9 seems to have a three-dimensional structure, although these three dimensions
seem closely related. The internal consistency of the three scales of the UWES-9 is good.
That is, in most studies Cronbach alphas for the scales range between .80 and .90
(Demerouti, Bakker, De Jonge, Jansen & Schaufeli, 2001; Salanova, Brescó & Schaufeli,
2003; Salanova, Schaufeli, Llorens, Pieró & Gray, 2000; Schaufeli, Taris & Van Rhenen,
2008). Lastly, scores on the UWES-9 have been shown to be relatively stable across time.
Two year stability coefficients for Vigour, Dedication and Absorption have been reported to
be .30, .36 and .46, respectively (Bakker, Euwema, & Van Dierendonck, 2003).
Görgens-Ekermans and Herbert (2013) used the UWES-9 on a South African sample and
reported acceptable psychometrics with Cronbach alphas close to or above .70: Vigour =
.86, Dedication = .85 and Absorption =.68. Steyn (2011) also used this scale to measure
Work Engagement i.e. meaning in work, in a South African sample. The item analysis of the
subscales yielded very good results. All three subscales obtained Cronbach alphas well
above .70 (Vigour = .832, Dedication = .827 and Absorption = .770).
Stellenbosch University http://scholar.sun.ac.za

109
3.6.6.1 Descriptive statistics and item analyses
Consistent with previous research the item analyses of the UWES subscales yielded very
good results. All three subscales obtained Cronbach alpha values well above .70. Vigour
and Dedication both achieved values above .85, suggesting strong evidence of more than
sufficient reliability of these subscales. The item statistics of all three subscales were
investigated. On two of the subscales (Vigour and Absorption), no items were flagged as
poor items. On the Dedication subscale, it was evident that if item 7 (“I am proud of the work
that I do”) was to be deleted, the Cronbach alpha would increase from .886 to .917. The
squared multiple correlation of item 7 (.465) was lower than the other two squared multiple
correlations on the subscale (.731 and .747). The inter-item correlation matrix also revealed
that item 7’s inter-item correlations were lower than the other. As the UWES-9 only has three
items per subscale and the Cronbach alphas of the subscales were above .70 (Nunnally,
1987), it was decided to rather protect the integrity of the scale and therefore not to remove
the flagged item. Item analysis was also conducted on the entire scale. A Cronbach alpha of
0.935 was obtained, suggesting high reliability for the composite scale (table 3.27).
Table 3.26
The means, standard deviation and reliability statistics for the UWES-9
UWES-9 Number of
Items
M SD α
Vigour 3 13.79 3.933 .900
Dedication 3 15.72 3.891 .886
Absorption 3 15.67 3.523 .799
Table 3.27
The means, standard deviation and reliability statistics for the UWES-9
UWES-9 Number of
Items
M SD α
UWES-9 9 45.18 10.390 .935
3.6.6.2 Confirmatory Factor Analysis
3.6.6.2.1 Measurement Model Specification and Data Normality
SEM was again used to perform CFA on the set of indicator variables for the UWES-9. The
measurement model was specified to consist of nine observed variables (X’s), three
unmeasured latent factors (ξs; i.e. the three UWES-9 subscales) with single-headed arrows
from the ξ’s to X’s representing the proposed regression of the observed variables onto the
latent factors (λs). Before the CFA was conducted the univariate and multivariate normality
of the indicator variables for the scale was investigated with PRELIS (Jöreskog & Sörbom,
Stellenbosch University http://scholar.sun.ac.za

110
1996). The null hypothesis of multivariate normality was rejected (skewness and kurtosis:
χ2=467.693, p=.000) and hence RML estimation was employed to derive model parameter
estimates. The measurement model is presented in figure 3.8.
Table 3.28
Test of multivariate normality (UWES-9)
Skewness Kurtosis Skewness and Kurtosis
Value Z-score P-value Value Z-score P-value Chi-Square P-Value
22.983
18.170 .000 152.276 11.727 .000 467.693 .000
3.6.6.2.2 Evaluation of the measurement model
The measurement model, in this instance, represented the relationships between the
dimensions of Work Engagement (Vigour, Dedication and Absorption) and its manifest
indicators.
Figure 3.8: Measurement model of the UWES (Standardised Solution)
Table 3.29 contains the results of the single group CFA of the three factor measurement
model. The exact fit of the measurement model was tested by the S-Bχ2. A Satorra Bentler
chi-square value 43.874 with 24 degrees of freedom and p = .000 was obtained. Thus, the
null hypothesis of exact fit was rejected (p < 0.05). The null hypothesis for close fit was not
rejected (p = .198) and therefore it could be concluded that this measurement model
obtained close fit. The RMSEA value fell well below the cut-off value of .08, indicating good
fit. The incremental fit indices (NNFI = .989 and CFI = .993), as well as the value of the
SRMR = .0467 provided further strong evidence of good model fit (all comfortably meeting
the cut-off values specified by Hair et al, 2006, for a model of this complexity). This finding
was further corroborated by the fact that all nine completely standardised factor loadings
obtained values larger than .70, ranging from .711 (item 8) to .928 (item 3). It was therefore
Stellenbosch University http://scholar.sun.ac.za

111
concluded that sufficient evidence existed to verify the validity of the three-factor
measurement model within the current sample.
Table 3.29
The Goodness of Fit Statistics for the UWES-9
Model X2 S-Bχ2 df S-Bχ2/
df
NNFI CFI RMR SRMR RMSEA
(CI)
P(close)
80.715 43.847 24 1.827 .989 .993 .0914 .0467 .0646
(.0327;
.0945)
.198
Note: X2, Chi-square; S-BX2, Satorra-Bentler Scaled Chi-square; NNFI, non-normed fit index; CFI, comparative fit index; RMR, root mean square residuals; SRMR, standardised root mean residual; RMSEA, root mean square error of approximation *p < 0.05.
3.6.7 Perceived Organisational Support
The Perceived Organisational Support Scale (POSS) was used to measure POS. The scale
was developed by Eisenberger, et al., (1996) and utilises a Likert response scale which
range from strongly disagree (1) to strongly agree (6). The original scale consists of 36
items, but the 8-item version was used in this study. An example of an item is “The
organisation values my contribution to its well-being”. Rhoades and Eisenberger (2002,
p.699) indicated that “because the original scale is uni-dimensional and has high internal
reliability, the use of shorter versions does not appear problematic. Prudence nevertheless
dictates that both facets of the definition of POS (valuation of employees’ contribution and
care about employees’ well-being) be represented in shorter versions of the questionnaire”.
Eisenberger et al., (1986) performed a reliability and item analysis on the scale, which
resulted in a Cronbach alpha of .97, with item-total correlations ranging from .42 to .83. The
mean and median item-total correlations were .67 and .66 respectively. They concluded that
every one of the 36 items showed a strong loading on the main factor, with minimal evidence
for the existence of other factors. In a study conducted by Uçar and Ötken (2010), a
Cronbach alpha of .88 was reported for the 36-item version of the scale, which is well above
the recommended level of .70 (Nunnally, 1987). The substantial factor loading of each item
and the high proportions of relative variance and total variance accounted for were notable
since the items were constructed to include a wide variety of ascribed organisational
attitudes and possible actions relevant to employees' interests (Uçar & Ötken, 2010). These
findings indicate that employees develop global beliefs concerning the degree to which the
organisation values their contributions and cares about their well-being (Eisenberger et al.,
1986).
Stellenbosch University http://scholar.sun.ac.za

112
3.6.7.1 Descriptive statistics and item analyses
The item analysis of the POSS yielded very good results. A Cronbach alpha value well
above .70 (α = .926) indicated strong evidence of sufficient reliability of the scale. The items
statistics revealed that there were no poor items. No items, if deleted, would result in a
Cronbach alpha higher than the existing one of .926.
Table 3.30
The means, standard deviation and reliability statistics for the POSS
POSS Number of
Items
M SD α
8 40.44 11.768 .926
3.6.7.2 Confirmatory Factor Analysis
3.6.7.2.1 Measurement Model Specification and Data Normality
SEM was again used to perform CFA on the set of indicator variables for the POSS. The
measurement model was specified to consist of eight observed variables (X’s), one
unmeasured latent factor (ξs; i.e. the POS latent factor) with single-headed arrows from the ξ
to X’s representing the proposed regression of the observed variables onto the latent factor
(λs). The univariate and multivariate normality of the indicator variables for the scale was
investigated with PRELIS (Jöreskog & Sörbom, 1996). The null hypothesis of multivariate
normality was rejected (skewness and kurtosis: χ2=398.695, p=.000). RML estimation was
employed to derive model parameter estimates.
Table 3.31
Test of multivariate normality (POSS)
Skewness Kurtosis Skewness and Kurtosis
Value Z-score P-value Value Z-score P-value Chi-Square P-Value
17.921
16.417 .000 127.137 11.366 .000 398.695 .000
Stellenbosch University http://scholar.sun.ac.za

113
3.6.7.2.2 Evaluation of the measurement model
The measurement model, in this instance, represented the relationships between Positive
Organisational Support and its manifest indicators.
Figure 3.9: Measurement model of the POSS (Standardised Solution)
Table 3.32 contains the results of the single group CFA of the one factor measurement
model. The exact fit of the measurement model was tested by the S-BX2. A Satorra Bentler
chi-square value of 45.726 with 20 degrees of freedom and p = .00 was obtained. Thus, the
null hypothesis of exact fit was rejected (p<0.05). However, the close fit null hypothesis
could not rejected (p = .0512) and it could therefore be concluded that the model obtained
close fit. The RMSEA value fell slightly above the cut-off value of .08. However, the
incremental fit indices (NNFI=.983 and CFI=.988), as well as the value obtained for the
SRMR=.0464 provided strong evidence of good model fit (based on the Hair et al., 2006,
cut-off values, table 3.2). Based on the basket of evidence derived for this model, it was
concluded that good model fit was achieved. All completely standardised loadings obtained
significant values larger than .70, ranging from .715 (item 3) to .913 (item 7).
Stellenbosch University http://scholar.sun.ac.za

114
Table 3.32
The Goodness of Fit Statistics for the POSS
Model X2 S-Bχ2 df S-Bχ2/
df
NNFI CFI RMR SRMR RMSEA
(CI)
P(close)
87.741 45.726 20 2.2863 .983 .988 .145 .0464 .0806
(.0498
;.112)
.0512
Note: X2, Chi-square; S-BX2, Satorra-Bentler Scaled Chi-square; NNFI, non-normed fit index; CFI, comparative fit index; RMR, root mean square residuals; SRMR, standardised root mean residual; RMSEA, root mean square error of approximation *p < 0.05.
3.6.8 Psychological Ownership
Psychological Ownership was measured with a scale initially developed and validated by
Pierce, Van Dyne and Cummings (1992). This scale was developed through an exploratory
study due to limited previous research on the development of a scale that measures
Psychological Ownership. The reason was that the authors weren’t aware of any empirical
work on the construct of Psychological Ownership within organisations. Pierce et al., (2004)
examined the homogeneity and dimensionality of the Ownership items with CFA (LISREL
8.8) using maximum likelihood estimation and listwise deletion. The results supported
homogeneity and uni-dimensionality of their Psychological Ownership measure. Cronbach’s
alpha results showed acceptable internal consistency reliability (.87, .90 and .93) in three
samples (Pierce et al., 1992).
The Measure of Psychological Ownership comprises of seven items with a 7-point Likert
response scale ranging from 1 (strongly disagree), to 7 (strongly agree). In a study
conducted by Pierce, et al., (2004), a Cronbach Alpha of .92 for the scale was reported.
3.6.8.1 Descriptive statistics and item analyses
An item analysis was conducted with the SPSS Scales Reliability Procedure. The results of
the item analysis, as well as the descriptive statistics are presented in table 3.33. The results
of the analysis revealed that the Cronbach alpha far exceeded the .70 benchmark for
acceptable reliability coefficients (Nunnaly, 1978), indicating very good internal consistency
for this scale. Item 6 on this scale was flagged as a potentially poor item, as the Cronbach
alpha would increase from .921 to .933 should this item be deleted. The squared multiple
correlation (.247) was lower than the other items’ squared multiple correlations which ranged
from .529 to 879. The inter-item correlations of this item were also lower than the other and
in some instances even negative, which further corroborated that the item should be flagged.
However, given the fact that the scale already had obtained a very high reliability coefficient
Stellenbosch University http://scholar.sun.ac.za

115
(.921) and that the scale only consist of seven items, the flagged item was not deleted from
the item pool.
Table 3.33
The means, standard deviation and reliability statistics for the Psychological Ownership Scale
PsyOwn Number of
Items
M SD α
7 27.72 11.589 .921
3.6.8.2 Confirmatory Factor Analysis
3.6.8.2.1 Measurement Model Specification and Data Normality
SEM was again used to perform CFA on the set of indicator variables for the Psychological
Ownership scale. The measurement model was specified to consist of seven observed
variables (X’s), one unmeasured latent factor with single-headed arrows from the ξ to X’s
representing the proposed regression of the observed variables onto the latent factor (λs).
The univariate and multivariate normality of the indicator variables for the scale was
investigated with PRELIS (Jöreskog & Sörbom, 1996). As with all the previous models, the
null hypothesis of multivariate normality was rejected (skewness and kurtosis: χ2=146.216,
p=.000). RML estimation was once again employed to derive model parameter estimates.
The measurement model is presented in figure 3.10.
Table 3.34
Test of multivariate normality (Psychological Ownership Scale)
Skewness Kurtosis Skewness and Kurtosis
Value Z-score P-value Value Z-score P-value Chi-Square P-Value
8.321
9.512 .000 82.599 7.466 .000 146.216 .000
3.6.8.2.2 Evaluation of the measurement model
The measurement model, in this instance, represents the relationships between
Psychological Ownership and its manifest indicators.
Stellenbosch University http://scholar.sun.ac.za

116
Figure 3.10: Measurement model of the Psych Own Questionnaire before EFA (Standardised Solution)
To investigate the dimensionality of the proposed one factor model of the original scale, a
CFA was conducted with LISREL 8.8 (Jöreskog & Sörbom, 2002). The results are described
in the table 3.35. The CFA results indicated weak evidence for the single factor structure of
the scale. All of the fit indices indicated poor model fit, as the RMSEA of .214 far exceeded
the .08 cut-off level and the NNFI (.888) and CFI (.925) both fell well below .97. As expected
both the hypotheses of exact and close model fit (p < 0.05) were rejected.
Table 3.35
The Goodness of Fit Statistics for the Psychological Ownership Scale
Model X2 S-Bχ2 df S-Bχ2/
df
NNFI CFI RMR SRMR RMSEA
(CI)
P(close)
273.658 140.703 14 10.050 .888 .925 .301 .0777 .214
(.183;
.247)
.000
Note: X2, Chi-square; S-BX2, Satorra-Bentler Scaled Chi-square; NNFI, non-normed fit index; CFI, comparative fit index; RMR, root mean square residuals; SRMR, standardised root mean residual; RMSEA, root mean square error of approximation *p < 0.05.
3.6.8.3 Exploratory Factor Analysis
Given the results of the CFA, an EFA was conducted to further investigate the factor
structure of the instrument in the current sample. At first an unrestricted EFA was conducted,
i.e. SPSS was allowed to freely determine how many factors to distract. The results showed
that there was one factor with an eigen value greater than one that explained 68.608% of the
variance. The loadings for this factor solution are presented in table 3.36.
Stellenbosch University http://scholar.sun.ac.za

117
Table 3.36
Structure matrix of the Psychological Ownership Questionnaire (one factor)
Factor 1
PO 1 .893
PO 2 .852
PO 3 .908
PO 4 .917
PO 5 .833
PO 6 .576
PO 7 (-) .766
After an investigation of the non-redundant residuals with absolute values greater than .05
for the one factor solution, it was noted that it was unacceptably high (71%). This suggested
that the one factor solution was probably not the best representation of the factor structure of
the scale in this sample, suggesting the possibility of more factors underlying the scale.
Although there was only one eigen value greater than one, the unacceptably high residuals
motivated further analyses. Based on the content of the items of the scale, i.e. some items
referred to “MY” company/organisation and others to “OUR” company/organisation, it was
decided to force a two factor solution. In this instance 79.267% of the variance were
declared be the two factors.
The percentage non-redundant residuals for this solution came done to 33%, which,
although still high, was markedly better than the one factor solution. All the loadings were
above .70 (table 3.37). Hence, it seemed that the two factor solution was a more permissible
account of the structure of the scale in this sample. From the results it was evident that items
1, 3, 4, 7 loaded significantly on factor 1, while items 2 and 5 loaded significantly on factor 2.
The item content were investigated and it was determined that there were indeed underlying
themes in the items that loaded on the two different factors. The item loadings on factor 1
represented a more individualistic approach to Psychological Ownership consisting of items
such as: “This is MY organisation” and “I sense that this is MY company”. The second factor
had a collectivistic approach and consisted of items such as: “I sense that this organisation
is OUR company” and “This is OUR company”. Item six revealed itself as a complex item as
it loaded on both factors and both the loadings were relatively weak. It was decided to delete
this item to ensure both factors have items with strong loadings. In the item analysis, the
Cronbach alpha was .921 if no items were removed. The item-total statistics did, however,
Stellenbosch University http://scholar.sun.ac.za

118
indicate that if item 6 was to be removed, the Cronbach alpha would increase to .933. This
item was initially flagged during the item analysis, but as the Cronbach alpha of the scale
was high and the scale only consists of seven items, it was at first decided not to delete this
item. However, after investigating the results of the dimensionality analysis, it was decided to
deleted item 6. After the deletion of item 6 the EFA analysis was re-run and the loadings
presented in table 3.38 were obtained.
Table3.37
Structure matrix of Psychological Ownership Scale (Before item 6 was removed)
Factor
1 2
PO1 .821 .423
PO2 .331 .902
PO3 .729 .548
PO4 .856 .422
PO5 .301 .907
PO6 .328 .495
PO7 .849 .205
Table 3.38
Structure matrix of Psychological Ownership Scale (After item 6 was removed)
Factor
1 2
PO1 .834 .401
PO2 .352 .910
PO3 .741 .542
PO4 .868 .397
PO5 .322 .917
PO7 .850 .194
Stellenbosch University http://scholar.sun.ac.za

119
3.6.8.4 Re-evaluation of the measurement model
The graphical representation of the measurement model after the CFA was conducted on
the two-factor model is presented in figure 3.11
Figure 3.11: Measurement model of the Psych Own. Questionnaire after the EFA (Standardised Solution)
CFA on the two-factor structure derived from the EFA results yielded significantly better
results. Although the RMSEA was still above the .08 cut-off point, it was much lower than the
value obtained in the first analysis. With regards to the incremental fit indices, the NNFI
(.969) was marginally below the required level and the CFI (.979) exceeded the cut-off level.
This indicated evidence of good fit. Moreover, the SRMR of .0356 further indicated a good
fitting model. The completely standardised loadings ranged from .737 (item 7) to .974 (item
2).
Table 3.39
The Goodness of Fit Statistics for the Psychological Ownership Scale
Model X2 S-Bχ2 df S-Bχ2/
df
NNFI CFI RMR SRMR RMSEA
(CI)
P(close)
39.850 39.468 8 4.934 .969 .979 .144 .0356 .141
(.0989;
.186)
.000393
Note: X2, Chi-square; S-BX2, Satorra-Bentler Scaled Chi-square; NNFI, non-normed fit index; CFI, comparative fit index; RMR, root mean square residuals; SRMR, standardised root mean residual; RMSEA, root mean square error of approximation *p < 0.05.
Stellenbosch University http://scholar.sun.ac.za

120
3.7 CONCLUSION REGARDING PSYCHOMETRIC INTEGRITY OF
THE MEASURMENT INSTRUMENTS
The item analyses conducted on the range of scales and subscales used in this study
achieved the results presented in table 3.40
Table 3.40
A summary of the reliability results of the expanded learning potential questionnaire latent variable
scales
Scale Sample
Size
Number of
items
Mean Standard
Deviation
Cronbach
Alpha
PA 199 10 34.45 7.376 .883
NA 199 10 40.77 6.616 .836
EWB 199 51 235.13 31.168 .928
PWBW 199 25 118.91 24.753 .960
HOPE 199 6 27.42 5.344 .854
OPT 199 6 26.27 5.002 .708
SELF-EFF 199 6 28.70 5.620 .895
RES 199 6 28.43 4.285 .726
GRAT 199 6 37.52 4.950 .787
ENG 199 9 45.18 10.390 .935
POSS 199 8 40.44 11.769 .926
PSYOWN 199 6 27.72 11.589 .921
Note: PA=Positive Affect; NA=Negative Affect; EWB= Ryff’s Psychological well-being questionnaire; PWBW = Psychological well-being at work scale; Hope=PsyCap Hope; Opt=PsyCap Optimism; Self-Eff=PsyCap Self-efficacy; Res=PsyCap Resilience; Grat=Gratitude Questionnaire-6; Eng=Utrecht Work Engagement Scale-9; POSS=Perceived Organisational Support Scale; PSYOWN=Psychological Ownership Questionnaire
The item analyses results revealed that all of the scales that were used in this study
obtained Cronbach alphas greater than 0.70, with nine out of the 12 achieving values in
excess of 0.80. This provided evidence of satisfactory internal consistency of all the
scales/subscales utilised in this study. Only four items from the composite questionnaire that
contained all the scales and subscales for this study, were deleted and not included in any
further analyses. The item analyses results suggested that three items were to be removed
from the Ryff (1989) PWB Scale, one item from each of the subscales: Autonomy,
Environmental Mastery and Purpose in Life. One item was removed from the Psychological
Ownership questionnaire after the dimensionality analysis was conducted. The item was
flagged in the item analyses and during the EFA it didn’t load well on either of the two
factors, resulting in the decision to delete the item from the final item pool.
For all the scales, except for the PANAS, Gratitude Questionnaire and Psychological
Ownership Questionnaire, the results of the CFA were sufficient. For the remaining three
Stellenbosch University http://scholar.sun.ac.za

121
scales, dimensionality analyses were performed to determine the underlying factor
structures. To strengthen the psychometric support of these scales, CFA analyses were
again conducted on the structures derived from the EFA results. The CFA results of the
various scales yielded adequate to good results.
In conclusion it can be said that the basket of evidence provided sufficient justification to use
all of the scales in the subsequent analyses to represent the latent variables they were
earmarked to reflect.
3.8 SUMMARY
The purpose of this chapter was to address the rationale, aims and objectives of this
research and set out the research hypotheses which were formulated in the literature review.
An overview of the research design, sampling technique and statistical techniques were
provided. This chapter concluded with an in-depth analysis of the measurement instruments.
Chapter 4 will discuss the results in detail.
Stellenbosch University http://scholar.sun.ac.za

122
CHAPTER 4
RESULTS
4.1 INTRODUCTION
The aim of this study was to depict the nomological network of latent variables (see figure
3.1) that explain variance in the underlying psychological processes of PWBW. This was
done by investigating the respective relationships between the proposed constructs and its
effects of Psychological Well-being at Work (PWBW).
Chapter 4 reports on the empirical evidence attained in this research. The sample will firstly
be discussed, followed by the fit of the measurement model. The measurement model was
evaluated in terms of its parameter estimates after which the structural model was evaluated
in terms of its model fit. The beta and gamma matrices were investigated to establish
whether the hypothesised paths were significant and modification indices were inspected to
determine whether the inclusion of additional paths would lead to a better fitting model. All
model modifications are described and the final structural model fit is discussed at the end of
this chapter.
4.2 SAMPLE CHARACTERISTICS
Overall, 199 employees from various industries completed the composite questionnaire that
was used for this research. The sample’s demographics which relate the gender, ethnic
group, age, demographic location and language are presented in table 4.2. From the table it
is evident that almost two thirds (63.7%) of the sample comprised of females. A clear
majority of the sample was White (89.5%). This was followed by a 7% representation of the
Coloured group, whilst the remaining 4% was made up of the remaining ethnic groups
(African, Asian and Indian). Given the current general population demographics for South
Africa reported in table 4.1 (Statistics South Africa, 2013), it was clear that the demographics
of the sample were not in line with the demographics of the general population of South
Africa, which has obvious limitations in terms of the generalisability of the results obtained
from this study. This is a result of the sample characteristics which were fairly homogenous
(i.e. mostly white, fairly well educated females). This phenomenon could perhaps be
explained by the data collection method utilised (Facebook) and that the “Facebook friends”
of the researcher and her supervisor, closely resembled the profiles of the researcher and
her supervisor (both white females, whom had both obtained post graduate qualifications).
This phenomena can possibly be explained by the rule of similarity (Neimeyer & Mitchell,
1998) in which the theory states that if we can identify with another person by having certain
Stellenbosch University http://scholar.sun.ac.za

123
similarities, you will have more attraction towards that person. Therefore we tend to become
friends with people that are similar to us. The above argument poses a plausible argument
for the relative homogeneity of the sample characteristics. Additionally, “Facebook friends”
tend to be people you have met in real life and therefore the majority of the sample will most
probably share your geographical location, i.e. Western Cape.
Although sample homogeneity was a definite limitation of the study, the means of data
collection also had two major advantages. A first major advantage is that it provided a
platform to gather data from various industries and from numerous organisations. This would
have been a major logistical challenge if pen and paper versions of the survey had to be
distributed within a range of companies. Secondly, the fact that a large range of companies
were represented in the sample has guarded the data against possible confounding
variables, i.e. organisational culture, that could contaminate the results16.
Table 4.1
Mid-year population estimates for South Africa by population group and sex, 2013
Population Group
Male Female Total
Number % of male
population
Number % of female
population
Number % of total
population
African 20 607 800 79.8 21 676 300 79.8 42 284 100 79.8
Coloured 2 306 800 8.9 2 459 400 9.1 4 766 200 9.0
Indian/Asian 669 200 2.6 660 100 2.4 1329 300 2.5
White 2 239 500 8.7 2 362 900 8.7 4 602 400 8.7
Total 25 823 300 100.0 27 158 700 100.0 52 982 000 100
Seventy six percent of the participants were sourced from the Western Cape, followed by
13% that resided in Gauteng. The remaining portion of the sample was equally distributed
across the other South African provinces. Afrikaans was reported to be the first language of
the majority of the sample (84%), with English being the second most popular first language
(14.5%). A reverse pattern was observed when the second language self-report
demographic data was analysed.
16 When data is gathered in only one organisation, the impact of organisational specific variables (e.g. organisational culture) is often underestimated. Including participants of lots of different companies in a sample, therefore, to a certain extent controls for such confounding variables.
Stellenbosch University http://scholar.sun.ac.za

124
Table 4.2
Sample characteristics in terms of gender, race, age, location and language
Gender
Category Frequency Percentage
Female 127 63.8
Male 72 36.2
Race
Category Frequency Percentage
African / Black 3 1.5
Asian 1 0.5
Caucasian / White 178 89.5
Coloured 14 7
Indian 3 1.5
Age
Category Frequency Percentage
20-29 147 73.9
30-39 33 16.6
40-49 6 3
50-59 11 5.5
60+ 2 1
Geographical Location
Category Frequency Percentage
Western Cape 152 76
Eastern Cape 3 1.5
Gauteng 25 13
Free state 4 2
Kwazulu Natal 6 3
Limpopo 2 1
Mapumalanga 2 1
Northern Cape 2 1
North West 3 1.5
First Language
Frequency Percentage
Afrikaans 167 84
English 29 14.5
Xhosa 1 0.5
Other 2 1
Second Language
Category Frequency Percentage
Afrikaans 30 15
Stellenbosch University http://scholar.sun.ac.za

125
English 167 84
Xhosa 0 0
Other 2 1
Table 4.3 describes the sample in terms of education, industry and length of service at the
specific company. From the table it is evident that 87.5% of the sample had obtained some
form of tertiary education. Almost half the sample (45.5%) held postgraduate qualifications.
In comparison with the general tendency in the country, it was obvious that the participants
of this study had more educational opportunities than the average person of the general
population in South Africa. With regards to the different industries, the sample was more or
less fairly equally spread across 17 different industries. A large proportion of the sample
(78%) had been working in their current companies for four years or less.
Table 4.3
Sample characteristics in terms of education, industry and years of service in organisation
HIGHEST QUALIFICATION
CATEGORY FREQUENCY PERCENTAGE
Grade 10 1 0.5
Grade 12/Matric 23 12
Post Matric Certificate 6 3
Diploma 32 16
Undergraduate Degree 46 23
Honours Degree 48 24
Master’s Degree 38 19
Doctoral Degree 5 2.5
INDUSTRY
CATEGORY FREQUENCY PERCENTAGE
Accounting 14 7
Agriculture 6 3
Construction 3 1.5
Customer Services 7 3.5
Design 7 3.5
Education 29 15
Engineering 11 5.5
Finance 12 6
Health 6 3
Human Resources 20 10
Information Technology 5 2.5
Legal 3 1.5
Logistics 7 3.5
Marketing 17 8.5
Stellenbosch University http://scholar.sun.ac.za

126
Media/Entertainment 7 3.5
Sales 13 6.5
Science 6 3
Other 25 13
YEARS AT ORGANISATION
CATEGORY FREQUENCY PERCENTAGE
6-12 months 54 27
1-2 years 62 31
3-4 years 39 20
5-8 years 26 13
9-16 years 12 6
17-24 years 3 1.5
+25 years 3 1.5
4.3 ITEM PARCELS
During the assessment of the measurement model and the structural model, item parcels
were formed. Item parcels consist of indicator variables which are computed from the items
of each scale or subscale. The alternative to utilising item parcels would be to use the
individual items that comprise the scales or subscales. This, however, would have led to
extensively comprehensive models in which a very large number of parameters would have
to be estimated. By using item parcels, the number of parameters to be estimated is
reduced. It is known that this procedure generally results in more reliable estimates. The
idea of creating and using item parcels is not a new one – it was originally introduced by
Cattell (1956), and further explored by Catell and Burdsal (1975). According to Hall, Snell
and Foust (1999) item parcels may be preferred over individual items as indicators for a
variety of reasons. For example, the composite-level indicators tend to be more reliable and
normally distributed. In addition, some Monte Carlo research suggests that as the number of
indicators per factor increases, there are accompanying decreases in the value of a number
of commonly used fit indices (Williams & Holahan, 1994). This may occur due to the fact that
as the number of indicators increases, there are potential for shared secondary influences
and cross-loadings among the indicators. These sources of contamination are frequently not
explicitly modelled, and thus contribute to overall lack of fit of the model. Thus, many
researchers opt for an indicator structure that avoids this problem by using three or four
indicators per latent construct rather than a larger number of indicators (Williams & Holahan,
1994).
In this study the Hedonic Well-being (HWB) item parcels were formed by dividing the items
into the five groups suggested by the five factors that were extracted during the exploratory
Stellenbosch University http://scholar.sun.ac.za

127
factor analyses (EFA)17. Eudaimonic Well-being’s (EWB) item parcels were formed by using
the six different subscales of the Ryff’s Psychological Well-being scale as parcels.
Psychological Well-being at Work’s (PWBW) parcels was also formed by grouping the items
according to the five different subscales. For each of the four PsyCap constructs (Hope,
Optimism, Self-efficacy and Resilience) two random item parcels were formed. The UWES-
9’s parcels were formed based on the three subscales (Vigour, Dedication and Absorption).
For Perceived Organisational Support (POS) random parcels were formed and for
Psychological Ownership, parcels were formed on the basis of the factor loadings after the
EFA.
4.4 MEASUREMENT MODEL
The measurement model signifies the relationships between the various variables and their
corresponding item parcel indicator variables. According to Diamantopolous and Siguaw
(2000) the measurement model estimates provide information about the validities and
reliabilities of the observed variables. To evaluate the fit of the measurement model
confirmatory factor analysis (CFA) was conducted. The aim of the CFA was to determine
whether the operationalisation of the item parcels/composites in terms of its latent variables
was successful. Based on the fit indices produced by LISREL 8.8, the overall fit of the
measurement model was evaluated. Measurement model fit refers to the extent to which the
theoretical model is consistent with, or explains the data (Steyn, 2011).
4.4.1 Screening the Data
LISREL 8.8 (Jöreskog & Sörbom, 2002) was used to perform CFA on the measurement
model of this PWBW structural model to determine the model fit. Robust maximum likelihood
estimation was utilised to produce estimates due to the failure of the data to satisfy the
multivariate normality assumption (skewness and kurtosis: 936.582, p < .05).
Table 4.4
Test of multivariate normality of the Measurement Model
Skewness Kurtosis Skewness and Kurtosis
Value Z-score P-value Value Z-score P-value Chi-Square P-Value
313.141 28.561 .000 1310.658 13.070 .000 936.582 .000
17 This was conducted as there is research evidence to suggest that the uni-dimensionality assumption of the parcels should not be violated. Therefore the EFA results (where available) were utilised to construct parcels.
Stellenbosch University http://scholar.sun.ac.za

128
4.4.2 Measurement Model Fit
The aim of the CFA was to determine whether the operationalisation of the item parcels in
terms of its latent variables was successful. Good fit would be observed if the measurement
model could successfully reproduce the observed covariance matrix, i.e. if the model fitted
the data well, the item parcels loaded statistically significant on the latent variables they were
assigned to reflect, and the completely standardised factor loadings exceeded .71 (Hair et
al., 2006). The measurement model is visually presented in figure 4.1.
Stellenbosch University http://scholar.sun.ac.za

129
Figure 4.1 Representation of the fitted measurement model (standardised solution)
Stellenbosch University http://scholar.sun.ac.za

130
The purpose of assessing the overall fit indices of the model is to determine the degree to
which the model is consistent with the empirical data at hand. There exists a wide range of
goodness-of-fit (GOF) indices that have been developed to evaluate the model’s overall fit.
However, none of these indices are unambiguously superior to the rest in all conditions and
specific indices have been shown to operate fairly differently under a range of conditions
(Diamantopoulos & Siguaw, 2000). The GOF indices obtained for the measurement model fit
are presented in table 4.5.
Table 4.5
The Goodness of Fit for the measurement model CFA
Model X2 S-Bχ2 df S-Bχ2/
df
NNFI CFI RMR SRMR RMSEA
(CI)
P(close)
967.183* 829.125* 429 1.93 .974 .979 .324 .0605 .0686
(.0616;
.0756)
.000
Note: X2, Chi-square; S-BX2, Satorra-Bentler Scaled Chi-square; NNFI, non-normed fit index; CFI, comparative fit index; RMR, root mean square residuals; SRMR, standardised root mean residual; RMSEA, root mean square error of approximation *p < 0.05.
A Satorra Bentler Scaled chi-square value of 829.125 with 429 degrees of freedom, and p =
.000 was obtained. The chi-square test statistics tests the null hypothesis that the model fits
the population in an exact way, i.e. exact fit. The null hypothesis for exact fit was
consequently rejected (p < 0.05). Moreover, the hypothesis for close fit was also rejected
(p(close) < .05). Therefore, the model unfortunately did not obtain close fit. However, when
examining the rest of the indices, the model showed good fit. According to the Hair et al.,
(2006) simulation studies (see table 3.2), in a sample with less than 250 people and a model
with more than 30 observed variables (the guidelines which apply to this model) a RMSEA
smaller than .08 indicate good fit. The RMSEA of .0686 thus showed good fit and was quite
acceptable according to Hair et al., (2006)’s guidelines.
Both the incremental fit indices were well above the .92 recommended value (Hair et al.,
2006; table 3.2). The NNFI with a value of .974 was comfortably above the .92 level, as well
as the CFI (.979). The closer these values are to unity (1.00), the better the fit of the
measurement model. However, Diamantopoulos and Siguaw (2000) recommend that .90
provides a strong suggestion of a well-fitting model.
The standardised root mean residual (SRMR) is considered as a summary measure of
standardised residuals, which represent the average difference between the elements of the
sample covariance matrix and the fitted covariance matrix. Lower SRMR values indicate
better fit and higher values symbolise worse fit. So, if the model fit is good, the fitted
Stellenbosch University http://scholar.sun.ac.za

131
residuals should be small in comparison to the enormity of the elements (Diamantopoulos &
Siguaw, 2000). According to Hair et al., (2006) the SRMR should be below .09 where the
number of observed variables is above 30. The SRMR of this model (.0605) was well below
the .09 guideline, further indicating good model fit.
Overall, the goodness of fit indices indicated good fit. However, it was rather disappointing
that the model did not obtain close fit. A possible explanation of this result can be found
when investigating the measurement model’s modification indices.
4.4.2.2 Modification Indices
The item parcels were created with the intention to reflect respondents’ standing on specific
latent variables. Although it is acknowledged that no item parcel will be a perfectly valid
measure of the latent variable it was assigned to reflect, the item parcels were created with
the belief that the systematic measurement error component of each item parcel does not
have a common source. The intention was therefore that the measurement error terms
should be uncorrelated. The measurement model reflected these intentions. In X each item
parcel was allowed to load on only one latent variable. The other loadings were fixed to zero.
In all off-diagonal elements were fixed to zero. Model modification indices are aimed at
answering the question whether any of the currently fixed parameters, when freed in the
model, would significantly improve the fit of the model. Modification indices (MI) show the
extent to which the X2 fit statistic will decrease if a currently fixed parameter in the model is
freed and the model re-estimated (Jöreskog & Sörbom, 2002). MI’s with values larger than
6.64 is indicative of parameters that if set free, would improve the fit of the model
significantly (p < .01) (Theron, 2011).
The modification indices (tables 4.6 and 4.7) were evaluated with the intention to further
evaluate the current fit of the model. The intention was, however, not to free any paths and
re-evaluate the model fit. Modification index values greater than 6.64 are highlighted.
Stellenbosch University http://scholar.sun.ac.za

132
Table 4.6
Modification Indices for the lambda-X matrix (Measurement Model)
PA NA EWB PWBW HOPE OPT SE RES GRAT ENG POS PO
GRAT_P 8.534
GRAT_N 5.354 1.513 9.370 5.027 2.199 2.872 8.797 .220 1.724
HWB_P1 1.150 1.559 3.178 .919 1.684 1.596 4.418 1.723
HWB_P2 1.155 1.850 13.412 1.016 .626 11.362 3.149 2.447 2.916
HWB_N1 20.259 2.734 14.635 .381 1.740 2.784 1.142 6.167 18.775 2.425 1.047
HWB_N2 15.355 .016 12.592 1.738 4.604 1.632 1.540 .036 13.849 14.486 5.900
HWB_3 1.176 70.315 .248 .878 5.222 .892 .007 8.278 .829 6.733 3.951
REL 6.114 .094 7.728 7.993 3.284 1.897 3.161 1.923 5.205 1.375 .706
PG 3.161 2.863 24.042 .297 1.284 .086 11.727 2.237 3.422
SA 5.186 1.013 2.254 .019 4.674 .779 2.877 1.258 2.860 2.832 3.382
AUT 2.267 1.962 .001 3.365 11.636 13.911 10.715 2.036 2.062 1.269
EM .150 5.177 2.510 4.916 .476 .024 5.294 3.855 1.162 .251 .069
PL 1.166 10.353 .287 .114 .106 .000 .002 2.130 2.362 .026 .255
PWBW_1 2.358 1.278 .635 2.243 7.259 .071
PWBW_2 8.878 8.638 9.224 5.146 5.133 21.640 17.502 9.311 12.035 .995 .480
PWBW_3 4.029 714.341 114.837 149.058 76.136 124.008
PWBW_4 6.867 4.872 0.289 .149 1.187 .317 .333 .143 5.247 13.529 1.119
PWBW_5 11.808
Note: PA = Positive Affect; NA = Negative Affect, EWB = Eudaimonic Well-being; PWBW = Psychological well-being at work; HOPE = PsyCap Hope; OPT = PsyCap Optimism; SE = PsyCap Self-efficacy; RES = PsyCap Resilience; GRAT = Gratitude; ENG = Work Engagement; POS = Perceived Organisational Support; PO = Psychological Ownership; GRAT_P = Gratitude Parcel 1; GRAT_N = Gratitude Parcel 2; HWB_P1 = PANAS Parcel 1; HWB_P2 = PANAS Parcel 2; HWB_N1 = PANAS Parcel 3; HWB_N2 = PANAS Parcel 4; HWB_N3 = PANAS Parcel 5; REL = Ryff’s PWBS Parcel 1; PG = Ryff’s PWBS Parcel 2; SA = Ryff’s PWBS Parcel 3; AUT = Ryff’s PWBS Parcel 4; EM Ryff’s PWBS Parcel 5; PL = Ryff’s PWBS Parcel 6; PWBW_1 = PWBW scale Parcel 1; PWBW_2 = PWBW scale Parcel 2; PWBW_3 = PWBW scale Parcel 3; PWBW_4 = PWBW scale Parcel 4 ; PWBW_5 = PWBW scale Parcel 5.
Stellenbosch University http://scholar.sun.ac.za
Stellenbosch University http://scholar.sun.ac.za

133
Table 4.7
Modification Indices for the lambda-X matrix (Measurement Model) (CONTINUED)
PA NA EWB PWBW HOPE OPT SE RES GRAT ENG POS PO
VIG 3.237 3.063 1.415 4.629 16.716 1.029 4.278 .328 3.519 7.765
DED 7.546 1.868 7.909 2.002 .033 5.611 .049
ABS .525 .060 .137 .019 1.385 2.277 4.484 4.832 .283 .260 3.890
OPT_1 .018 3.666 5.071 .010 .510 2.898 .550 6.461 .720 19.066
OPT_2 .058 4.291 27.627 7.463
HOPE_1 68.732 .609 41.989 4.471 .004
HOPE_2 .521 12.328 4.158 26.376 10.731 3.857 .002
RES_1 .008 7.936 11.295 .742 5.955 2.688 .055 .974 .001
RES_2 4.365 1.262 .001
SE_1 .388 3.527 .136 1.503 .736 .887 1.817 .331 1.602 1.024 4.285
SE_2 .410 3.844 .219 2.049 6.180 .000 2.150 .349 1.885 1.230 4.761
POS_1 .025 .066 .372 4.069 13.677 117.423 18.002
POS_2 .012 .067 .168 .652 3.661 .887 4.347 3.640 .031 1.081 7.465
PSYOWN_1 .591 .179 1.676 2.757 .685 .000 .008 .010 .757 1.371 .410
PSYOWN_2 .937 .189 1.926 4.710 .013 .014 .765 6.621
Note: PA = Positive Affect; NA = Negative Affect, EWB = Eudaimonic Well-being; PWBW = Psychological well-being at work; HOPE = PsyCap Hope; OPT = PsyCap Optimism; SE = PsyCap Self-efficacy; RES = PsyCap Resilience; GRAT = Gratitude; ENG = Work Engagement; POS = Perceived Organisational Support; PO = Psychological Ownership; VIG = UWES-9 Parcel 1; DED = UWES-9 Parcel 2; ABS = UWES-9 Parcel 3; OPT_1 = Optimism Parcel 1; OPT_2 = Optimism Parcel 2; HOPE_1 = Hope Parcel 1; HOPE_2 = Hope Parcel 2; RES_1 = Resilience Parcel 1; RES_2 = Resilience Parcel 2; SE_1 = Self-efficacy Parcel 1; SE_2 = Self-efficacy Parcel 2; POS_1 = POSS Parcel 1; POS_2 = POSS Parcel 2e; PSYOWN_1 = Psychological Ownership Questionnaire Parcel 1; PSYOWN_2 = Psychological Ownership Questionnaire Parcel 2.
Stellenbosch University http://scholar.sun.ac.za
Stellenbosch University http://scholar.sun.ac.za

134
Tables 4.6 and 4.7 revealed that 56 of the currently fixed elements in the X, if set free,
would improve the fit of the model significantly (p > .01). The lambda-X modification results
suggest that these additional paths would significantly improve the fit of the model. The
matrix thus suggested that 56 out of the 363 possible ways of modifying the model (15.4%)
would result in significant improvements to the model fit. This percentage is sufficiently small
and further comments favourably on the fit of the current model. However, it should be noted
that one particular MI obtained a very large value. There was evidence to suggest that a
cross-loading between one of the PWBW parcels on EWB would improve the measurement
model fit significantly (MI=714.341). This made sense as the PWBW construct has been
conceptualised to, “comprise of five primary Eudaimonic dimensions…” (Dagenais-
Desmarais & Savoie, 2012, p.676). Hence, overlap between these two variables were
expected to a certain degree. However, this cross-loading was not allowed in the
subsequent analysis as the structure of the original observed measures of their intended
latent traits were retained.
4.4.2.2 Interpretation of the Measurement Model Parameter Estimates
Taking the range of fit indices and the percentage large modification indices calculated for
X into consideration, good measurement model fit was concluded. This permitted the
interpretation of the measurement model parameter estimates. By examining the magnitude
and the statistical significance of the slope of the regression of the observed variables on
their respective latent variables, an indication of the validity of the measures can be obtained
(Prinsloo, 2013). Therefore, if a measure is designed to provide a valid reflection of a
specific latent variable, then the slope of the regression of Xi, the observed variable, on ξj,
the respective latent variable, in the fitted measurement model has to be substantial and
significant (Diamantopoulos & Siguaw, 2000).
The unstandardized lambda-X matrices provide an indication of the average change
expressed in the original scale units in the manifest variable associated with one unit change
in the latent variable. The regression coefficients/loadings of the manifest variables on the
latent variables are significant (p < .05) if the value of the t-values exceed 1.96 in its absolute
form, i.e. |1.96|. Significant indicator loadings provide validity evidence in favour of the item
parcel indicators (Diamantopoulos & Siguaw, 2000). Table 4.8 contains the unstandardised
factor loading matrix for lambda-X.
Stellenbosch University http://scholar.sun.ac.za

135
Table 4.8
The unstandardised factor loading matrix for Lambda –X matrix for the Measurement Model
PA NA EWB PWBW HOPE OPT SE RES GRAT ENG POS PsyOwn
HWB_P1 4.118
(.285)
14.427*
HWB_P2 2.481
(.316)
7.854*
HWB_N1 2.816
(.267)
10.529*
HWB_N2 1.970
(.263)
7.481*
HWB_N3 0.807
(.179)
4.505*
REL 5.171
(.425)
12.173*
PG 3.743
(.476)
7.865*
SA 6.495
(.507)
12.819*
Stellenbosch University http://scholar.sun.ac.za
Stellenbosch University http://scholar.sun.ac.za

136
AUT 3.345
(.540)
6.193*
EM 5.247
(.425)
12.344*
PL 5.703
(.488)
11.679*
PWBW_1 4.556
(.444)
10.272*
PWBW_2 6.104
(.358)
17.055*
PWBW_3 3.514
(.409)
8.591*
PWBW_4 5.866
(.392)
14.972*
PWBW_5 3.586
(.486)
7.388*
HOPE_1 2.007
(.201)
10.007*
HOPE_2 2.995
Stellenbosch University http://scholar.sun.ac.za
Stellenbosch University http://scholar.sun.ac.za

137
(.186)
15.858*
OPT_1 2.547
(.176)
14.464*
OPT_2 1.876
(.214)
8.748*
SE_1 2.516
(.203)
12.398*
SE_2 2.876
(.230)
12.503*
RES_1 1.568
(.164)
9.538*
RES_2 2.337
(.198)
11.808*
GRAT_P 2.366
(.348)
6.792*
GRAT_N 1.521
(.249)
6.109*
VIG 3.423
(.225)
Stellenbosch University http://scholar.sun.ac.za
Stellenbosch University http://scholar.sun.ac.za

138
15.217*
DED 2.774
(.281)
9.887*
ABS 3.667
(.220)
16.683*
POS_1 6.042
(.307)
19.663*
POS_2 5.305
(.271)
19.555*
PSY_I 6.095
(.414)
14.719*
PSY_C 3.334
(.245)
13.609*
Note: PA = Positive Affect; NA = Negative Affect, EWB = Eudaimonic Well-being; PWBW = Psychological well-being at work; HOPE = PsyCap Hope; OPT = PsyCap Optimism; SE = PsyCap Self-efficacy; RES = PsyCap Resilience; GRAT = Gratitude; ENG = Work Engagement; POS = Perceived Organisational Support; PO = Psychological Ownership; GRAT_P = Gratitude Parcel 1; GRAT_N = Gratitude Parcel 2; HWB_P1 = PANAS Parcel 1; HWB_P2 = PANAS Parcel 2; HWB_N1 = PANAS Parcel 3; HWB_N2 = PANAS Parcel 4; HWB_N3 = PANAS Parcel 5; REL = Ryff’s PWBS Parcel 1; PG = Ryff’s PWBS Parcel 2; SA = Ryff’s PWBS Parcel 3; AUT = Ryff’s PWBS Parcel 4; EM Ryff’s PWBS Parcel 5; PL = Ryff’s PWBS Parcel 6; PWBW_1 = PWBW scale Parcel 1; PWBW_2 = PWBW scale Parcel 2; PWBW_3 = PWBW scale Parcel 3; PWBW_4 = PWBW scale Parcel 4 ; PWBW_5 = PWBW scale Parcel 5; VIG = UWES-9 Parcel 1; DED = UWES-9 Parcel 2; ABS = UWES-9 Parcel 3; OPT_1 = Optimism Parcel 1; OPT_2 = Optimism Parcel 2; HOPE_1 = Hope Parcel 1; HOPE_2 = Hope Parcel 2; RES_1 = Resilience Parcel 1; RES_2 = Resilience Parcel 2; SE_1 = Self-efficacy Parcel 1; SE_2 = Self-efficacy Parcel 2; POS_1 = POSS Parcel 1; POS_2 = POSS Parcel 2e; PSYOWN_1 = Psychological Ownership Questionnaire Parcel 1; PSYOWN_2 = Psychological Ownership Questionnaire Parcel 2;*t-values > |1.96| indicates significant path coefficients, values in brackets represent standard error estimates.
Stellenbosch University http://scholar.sun.ac.za
Stellenbosch University http://scholar.sun.ac.za

139
All the indicator variables loaded significantly on the latent variables that they were designed
to reflect. By solely relying on the unstandardised loadings and associated t-values, it may
be difficult to compare the validity of different indicators measuring a particular construct
(Diamantopoulos & Siguaw, 2000). It is consequently recommended to also consider the
completely standardised factor loading matrix. The completely standardised estimates
indicate the average change in standard deviation units in the indicator variable associated
with one standard deviation change in the latent variable to which it has been linked
(Prinsloo, 2013). The factor loading estimates were considered to be satisfactory if the
completely standardised factor loading estimates exceeded a stringent cut-off of .71 (Hair et
al., 2006). Table 4.9 reveals that 25 of the 33 parcels obtained loadings greater than .71.
However, 8 parcels fell below the stringent .71 cut-off value (HWB_P2, HWB_N2, HWB_N3,
PG, AUT, PWBW_5, RES_1 and GRAT_NEG, indicated in bold in table 4.9). Based on
these results, the identified item parcels could be regarded as problematic to some degree.
The factor loadings of these eight item parcels on their designated latent variables were,
however, not that excessively low to warrant serious concern (all above .50).
Table 4.9
Completely standardised solution of factor loadings of the fitted measurement model
Constructs PA NA EWB PWBW HOPE OPT SE RES GRAT ENG POS PO
HWB_P1 .946
HWB_P2 .640
HWB_N1 .828
HWB_N2 .582
HWB_N3 .563
REL .707
PG .628
SA .841
AUT .515
EM .771
PL .790
PWBW_1 .801
PWBW_2 .882
PWBW_3 .755
PWBW_4 .881
PWBW_5 .692
HOPE_1 .791
HOPE_2 .922
OPT_1 .879
OPT_2 .706
Stellenbosch University http://scholar.sun.ac.za

140
SE_1 .925
SE_2 .923
RES_1 .701
RES_2 .953
GRAT_POS .707
GRAT_NEG .615
VIG .870
ABS .787
DED .942
POS_1 .972
POS_2 .887
PSYOWN_I .810
PSYOWN_C .867
Note: PA = Positive Affect; NA = Negative Affect, EWB = Eudaimonic Well-being; PWBW = Psychological well-being at work; HOPE = PsyCap Hope; OPT = PsyCap Optimism; SE = PsyCap Self-efficacy; RES = PsyCap Resilience; GRAT = Gratitude; ENG = Work Engagement; POS = Perceived Organisational Support; PO = Psychological Ownership; GRAT_P = Gratitude Parcel 1; GRAT_N = Gratitude Parcel 2; HWB_P1 = PANAS Parcel 1; HWB_P2 = PANAS Parcel 2; HWB_N1 = PANAS Parcel 3; HWB_N2 = PANAS Parcel 4; HWB_N3 = PANAS Parcel 5; REL = Ryff’s PWBS Parcel 1; PG = Ryff’s PWBS Parcel 2; SA = Ryff’s PWBS Parcel 3; AUT = Ryff’s PWBS Parcel 4; EM Ryff’s PWBS Parcel 5; PL = Ryff’s PWBS Parcel 6; PWBW_1 = PWBW scale Parcel 1; PWBW_2 = PWBW scale Parcel 2; PWBW_3 = PWBW scale Parcel 3; PWBW_4 = PWBW scale Parcel 4 ; PWBW_5 = PWBW scale Parcel 5; VIG = UWES-9 Parcel 1; DED = UWES-9 Parcel 2; ABS = UWES-9 Parcel 3; OPT_1 = Optimism Parcel 1; OPT_2 = Optimism Parcel 2; HOPE_1 = Hope Parcel 1; HOPE_2 = Hope Parcel 2; RES_1 = Resilience Parcel 1; RES_2 = Resilience Parcel 2; SE_1 = Self-efficacy Parcel 1; SE_2 = Self-efficacy Parcel 2; POS_1 = POSS Parcel 1; POS_2 = POSS Parcel 2e; PSYOWN_1 = Psychological Ownership Questionnaire Parcel 1; PSYOWN_2 = Psychological Ownership Questionnaire Parcel 2.
Table 4.10 contains the inter-correlation matrix of the latent variables. Some of the variables
were highly inter-related. The latent variables included in this study were, however, expected
to correlate to some degree. This was due to the fact that the twelve latent variables were
conceptualised as qualitatively distinct, although all are constructs related to well-being.
However, it is not ideal for these variables to correlate exceptionally high with each other.
The results in table 4.10 suggest that all the inter-latent variable correlations were
statistically significant (p < .05), except for the two correlations in bold (PA and NA; NA and
Gratitude). Correlations are considered excessively high if they exceed a value of .90. Only
one correlation in the phi matrix is excessively high (PWBW and Work Engagement).
Although there were some other inter-correlations between latent variables with a value
exceeding .80, they didn’t warrant too much concern.
Stellenbosch University http://scholar.sun.ac.za

141
Table 4.10
Phi values of the fitted measurement model
Construct PA NA EWB PWBW HOPE OPT SE RES GRAT ENG POS PO
PA 1.00
NA -.17 1.00
EWB .50 -.46 1.00
PWBW .72 -.44 .67 1.00
HOPE .67 -.40 .68 .82 1.00
OPT .63 -.48 .78 .81 .77 1.00
SE .42 -.29 .65 .62 .81 .66 1.00
RES .47 -.30 .62 .61 .75 .71 .76 1.00
GRAT .37 -.22 .81 .59 .51 .69 .55 .58 1.00
ENG .77 -.34 .63 .94 .80 .77 .57 .56 .59 1.00
POS .50 -.40 .51 .78 .55 .76 .44 .35 .45 .66 1.00
PO .45 -.42 .42 .67 .56 .64 .51 .41 .36 .62 .70 1.00
Note: PA = Positive Affect; NA = Negative Affect, EWB = Eudaimonic Well-being; PWBW = Psychological well-being at work; HOPE = PsyCap Hope; OPT = PsyCap Optimism; SE = PsyCap Self-efficacy; RES = PsyCap Resilience; GRAT = Gratitude; ENG = Work Engagement; POS = Perceived Organisational Support; PO = Psychological Ownership; Values in bold indicate values that were not significant.
Based on the results in this section it was concluded that sufficient merit for the
measurement model existed, and that the operationalisation of the model was successful. It
was therefore permissible to test the fit of the structural model to the data.
4.5 STRUCTURAL MODEL
4.5.1 Evaluating the fit of the Structural Model
The structural model is that element of the general model that imposes relations between
latent variables and manifest variables that are not indicators of latent variables (Hoyle,
1995). The objective of the structural model is to justify the way in which the variables are
correlated. The purpose is therefore to determine whether the hypotheses, which were
culminated through the literature review, are supported by the data obtained from the sample
(Diamantopolous & Siguaw, 2000). The Steyn-Boers Structural Model of Psychological Well-
being at Work as proposed in chapter 3, figure 3.1, was tested by making use of structural
equation modeling (SEM). LISREL 8.8 was used to evaluate the fit of the model.
4.5.1.1 Fit of the structural model (Original form)
Figure 4.2 shows a representation of the fitted original structural model. The model’s fit
statistics are discussed thereafter.
Stellenbosch University http://scholar.sun.ac.za

142
.
Figure 4.2: Fitted structural model (Standardised solution)
The purpose of assessing the overall fit is to determine to what extent the model is
consistent with empirical data gathered (Diamanopoulus & Siguaw, 2000). The GOF
statistics of the original model is presented in table 4.11. Robust maximum likelihood was
employed to derive the model estimates.
Stellenbosch University http://scholar.sun.ac.za

143
Table 4.11
The Goodness of fit statistics for the structural model (Original model)
Model X2 S-Bχ2 df S-Bχ2/
df
NNFI CFI RMR SRMR RMSEA
(CI)
P(close)
1097.573* 938.007* 460 2.039 .971 .975 1.504 .0684 .0724
(.0658
;.0791)
.000
Note: X2, Chi-square; S-BX2, Satorra-Bentler Scaled Chi-square; NNFI, non-normed fit index; CFI, comparative fit index; RMR, root mean square residuals; SRMR, standardised root mean residual; RMSEA, root mean square error of approximation *p < 0.05.
A Satorra-Bentler Chi-square with a value of 938.007 and 460 degrees of freedom (p = .000)
was achieved. The exact fit null hypothesis was rejected, and the p-value for close fit
(RMSEA < .05) was considered. It showed that the close fit null hypotheses should also be
rejected (p < .05). According to the benchmarks set through the Hair et al., (2006) simulation
studies (see table 3.2), the RMSEA of .0724 indicated good model fit. The SRMR was well
below the .90 cut-off value (Hair et al., 2006) (.0684) further substantiating the conclusion of
good model fit. In addition, the NNFI and CFI (.971 and .975) were both well above .92. This
showed that satisfactory comparative fit existed.
Overall, the interpretation of the selected GOF indices indicated that the proposed structural
model was able to reproduce the observed covariance matrix to a degree of accuracy that
warranted sufficient faith in the structural model and the derived parameter estimates to
permit the interpretation of these estimates.
4.5.1.2 Interpretation of structural model parameter estimates (original model)
The unstandardised beta matrix, table 4.12, revealed that the following path specific
hypotheses could not be rejected, and were therefore not corroborated: H04, H05, H012, H021,
H023, H026, H028, H029, and H031. The path specific hypotheses H03, H09, H010, H011, H022, and H030
were rejected in favour of the Ha hypotheses, and were therefore corroborated. The original
structural unstandardised beta matrix is presented in table 4.12.
Stellenbosch University http://scholar.sun.ac.za

144
Table 4.12
Structural model unstandardised beta matrix (Original model)
OPT ENG NA PA EWB PWBW POS PSYOWN
OPT
ENG .551
(.307)
1.739
.064
(.187)
.342
NA -.734
(.290)
-2.534*
.33
(.225)
1.482
PA .485
(.150)
3.225*
.709
(.132)
5.379*
EWB 1.915
(.644)
2.975*
-.195
(.215)
-.910
-.709
(.363)
-1.956
-.128
(.094)
-1.361
PWBW -.089
(.055)
-1.615
.926
(.136)
6.788*
.010
(.114)
.085
POS 5.949
(9.475)
.628
PSYOWN .724
(.071)
10.230*
Note: OPT = PsyCap Optimism; ENG = Work Engagement; NA = Negative Affect, PA = Positive Affect; EWB = Eudaimonic Well-being; PWBW = Psychological well-being at work; POS = Perceived Organisational Support; PSYOWN = Psychological Ownership. *t-values > l1.96l indicates significant path coefficients, values in brackets represent standard error estimates.
The six paths that received support included: PA positively influences PWBW (H03);
Optimism positively influences PA (H09); Optimism negatively influences NA (H010); Optimism
positively influences EWB (H011); Work Engagement positively influences PA (H022) and POS
positively influence PsyOwn (H030). The beta matrix reflecting the statistically significance of
the βij estimates revealed that nine of the 15 hypothesised paths between the endogenous
latent variables were not supported while six of the 15 hypothesised paths between the
endogenous latent variables were supported.
Table 4.13 shows the unstandardised gamma matrix. The following hypothesis could not be
rejected and were therefore not corroborated: H06, H07, H08, H013, H014, H015, H016, H017, H019,
H020, and H024. The hypothesis stating that Self-efficacy should have a positive influence on
Work Engagement (H025) did exceed the critical value of |1.96|, but the results stated that the
Stellenbosch University http://scholar.sun.ac.za

145
relationship was negative. There is no theoretical justification for this negative path and
therefore this hypothesis was not rejected in favour of the alternative hypothesis. The
following two hypothesised relationships were rejected in favour of the alternative
hypotheses, and were therefore corroborated: Gratitude positively influences Optimism
(H018) and Hope positively influences Work Engagement (H027). The gamma matrix reflecting
the statistically significance of the ij estimates revealed that only two of the 14 hypothesised
paths between the exogenous latent variables and the endogenous latent variables were
supported, 11 were not supported and one’s sign was not in accordance with the
hypothesised direction of the relationship. Therefore, in total only eight of the 29
hypothesised paths in the original model were supported while 20 were not supported and
one did not indicate the direction of the relationship, as was theorised.
Table 4.13
Structural model unstandardised gamma matrix
HOPE SE RES GRAT
OPT .980 (.073)
13.387* ENG .639
(.185) 3.448*
-.277 (.121)
-2.284*
-.120 (.120) -1.003
NA -.301 (.308) .977
.335 (.239) 1.405
-.053 (.285) -.185
PA .153 (.118) 1.294
-.067 (.083) -.805
-.260 (.186) -1.394
EWB -.057 (.289) -.198
.058 (.201) .290
-.314 (.203) -1.543
PWBW POS -5.225
(9.402) -.556
PSYOWN
Note: HOPE = PsyCap Hope; SE = PsyCap Self-efficacy; RES = PsyCap Resilience; GRAT = Gratitude; OPT = PsyCap Optimism; ENG = Work Engagement; NA = Negative Affect, PA = Positive Affect; EWB = Eudaimonic Well-being; PWBW = Psychological well-being at work; POS = Perceived Organisational Support; PO = Psychological Ownership. *t-values > l1.96l indicates significant path coefficients, values in brackets represent standard error estimates.
4.5.2 Modification of Structural Model (A)
Based on these results, it was decided to first delete the 21 paths from the original model
that were not statistically significant. The modified model (A) was subsequently fitted to the
data.
Stellenbosch University http://scholar.sun.ac.za

146
4.5.2.2 Fit of the modified structural model (Model A)
A visual representation of the modified structural model (A) is presented in figure 4.3. The fit
statistics are contained in table 4.14.
Figure 4.3: Representation of the structural model (Model A) (Standardised solution)
Stellenbosch University http://scholar.sun.ac.za

147
Table 4.14
The Goodness of fit statistics for the modified structural model (Model A)
Model X2 S-Bχ2 df S-Bχ2/
df
NNFI CFI RMR SRMR RMSEA
(CI)
P(close)
1097.573* 1066.280* 480 2.22 .966 .969 1.945 .0800 .0785
(.0722;
.0849)
.000
Note: X2, Chi-square; S-BX2, Satorra-Bentler Scaled Chi-square; NNFI, non-normed fit index; CFI, comparative fit index; RMR, root mean square residuals; SRMR, standardised root mean residual; RMSEA, root mean square error of approximation *p < 0.05.
The results revealed that the Satorra-Bentler Chi-square was 1066.280, with 480 degrees of
freedom (p = .000), which showed that the null hypothesis of exact fit was rejected.
Moreover, close fit was not achieved (p-value of close fit < .05). According to the Hair et al.,
(2006) guidelines, good fit could be concluded from the RMSEA value of .0785 and
incremental fit indices which comfortably exceeded the .92 cut-off value (CFI = .969; NNFI =
.966). However, the SRMR of .0800 was markedly higher than for the previous model. Given
the basket of fit indices it could be concluded that good fit was still achieved according to the
Hair et al., (2006) guidelines, however, the model fit was clearly not as good as the previous
model.
Taking this into account, however, it could still be concluded that the modified hypothesised
structural model was able to reproduce the observed covariance matrix to a reasonable
degree of accuracy that warranted some faith in the modified structural model (model A) and
the derived parameter estimates. The next step was to investigate the parameter estimates
for gamma and beta, as well as the modification indices, calculated by LISREL, to determine
if there was possible ways to improve the model’s overall fit.
4.5.3 Parameter Estimates and Modifications suggested by Model A
Tables 4.15 and 4.16, respectively, show the unstandardised beta and gamma matrices
derived for the modified model A. The tables indicate that all the paths that were retained
from the original model in model A were supported (i.e. obtained t-values > |1.96| which
indicates significant path coefficients).
Stellenbosch University http://scholar.sun.ac.za

148
Table 4.15
Structural model unstandardised beta matrix (Model A)
OPT ENG NA PA EWB PWBW PSYOWN
OPT
ENG
NA -.489
(.099)
-4.932*
PA .289
(.053)
5.415*
.777
(.070)
11.037*
EWB .820
(.094)
8.696*
PWBW .961
(.105)
9.115*
Note: OPT = PsyCap Optimism; ENG = Work Engagement; NA = Negative Affect, PA = Positive Affect; EWB = Eudaimonic Well-being; PWBW = Psychological well-being at work; PSYOWN = Psychological Ownership; *t-values > l1.96l indicates significant path coefficients; values in brackets represent standard error estimates. Table 4.16
Structural model unstandardised gamma matrix (Model A)
POS HOPE SE RES GRAT
OPT 1.050
(.073)
14.297*
ENG .822
(.074)
11.170*
NA
EWB
PWBW
PSYOWN .722
(.072)
10.020*
Note: POS = Perceived Organisational Support; HOPE = PsyCap Hope; SE = PsyCap Self-efficacy; RES = PsyCap Resilience; GRAT = Gratitude; OPT = PsyCap Optimism; ENG = Work Engagement; NA = Negative Affect, PA = Positive Affect; EWB = Eudaimonic Well-being; PWBW = Psychological well-being at work; PO = Psychological Ownership. *t-values > l1.96l indicates significant path coefficients; values in brackets represent standard error estimates.
Stellenbosch University http://scholar.sun.ac.za

149
Given the fact that all the current paths were supported, it was important to determine
whether any theoretically justifiable additional paths should be added to possibly improve the
fit of the model. To inform this decision the modification indices calculated for the beta and
gamma matrices (derived from the model A outputs) were inspected. Modification indices
(MI) assist in identifying fixed parameters that if freed, would statistically significantly improve
the fit of the model. This is determined by calculating the extent to which the X2 fit statistic
decreases when each of the currently fixed parameters in the model is freed and the model
re-estimated (Jöreskog & Sörbom, 1993). Structural parameters currently fixed to zero with
modification index values greater than 6.64 are classified as parameters, that if set free,
would improve the fit of the model significantly (p < .01) (Van Heerden, 2013).
Parameters with high MI-values should only be freed if it makes sense in a theoretical
manner to do so (Kelloway, 1998). Consequently, a very convincing theoretical argument
should be formulated before it is decided to free the parameter and thereby include the path
in the modified model (e.g. model B). The completely standardised expected change for the
parameters should also be considered, as these suggest the extent to which it would change
from its currently fixed value of zero in the completely standardised solution, if freed. The
magnitude of the completely standardised expected change should be substantial enough to
warrant freeing the parameter, and the sign of the completely expected change should in
addition make sense in terms of the theoretical argument proposed in support of the
suggested path (Jöreskog & Sörbom, 1993). If no convincing theoretical argument exists,
nor the magnitude or sign is appropriate, then the parameter with the second highest MI-
value should be considered. Due diligence was applied to ensure that any of the additional
paths considered for inclusion were theoretically justifiable, and that the direction of the
relationship, i.e. positive or negative, as suggested by the sign of the completely
standardised expected change for the respective coefficient, was in accordance with the
theoretical justification. If this was not the case, the path was not considered for inclusion in
the modified model. The MI’s (for model A) calculated for the beta matrix is presented in
table 4.17 and those calculated for the gamma matrix are presented in table 4.18.
Stellenbosch University http://scholar.sun.ac.za

150
Table 4.17
Modified (Model A) structural model modification indices for the beta matrix
OPT ENG NA PA EWB PWBW POS PSYOWN
OPT .149 ENG 1.523 9.726 61.246 25.559 NA 2.048 5.613 PA .156 3.537 27.155 4.173
EWB .002 1.728 .003 .143 12.541 6.607 PWBW 5.278 .069 39.326 9.349
POS 19.775 1.571 21.865 9.875 37.748 1.801 PSYOWN 4.566 7.608 4.499 7.959 .902 6.827
Note: OPT = PsyCap Optimism; ENG = Work Engagement; NA = Negative Affect, PA = Positive Affect; EWB = Eudaimonic Well-being; PWBW = Psychological well-being at work; POS = Perceived Organisational Support; PSYOWN = Psychological Ownership; the value in bold represents the MI with the highest value. Table 4.18
Modified (Model A) structural model modification indices for the gamma matrix
HOPE SE RES GRAT
OPT
ENG 12.774
NA
PA 1.304 .003
EWB 16.244 4.721
PWBW .036 .000
POS .071 2.351 19.939
PSYOWN 9.733 10.131 6.972 4.914
Note: HOPE = PsyCap Hope; SE = PsyCap Self-efficacy; RES = PsyCap Resilience; GRAT = Gratitude; OPT = PsyCap Optimism; ENG = Work Engagement; NA = Negative Affect, PA = Positive Affect; EWB = Eudaimonic Well-being; PWBW = Psychological well-being at work; POS = Perceived Organisational Support; PSYOWN = Psychological Ownership.
By examining the MI’s it was clear that the highest MI was found in the beta-matrix. The
parameter with the highest value (61.246) suggested that if a path should be added between
Perceived Organisational Support (POS) and Work Engagement, the fit of the model would
improve significantly. The completely standardised expected change for the beta coefficient
was of sufficient magnitude (.690) and obtained a positive sign. This path was originally
included in the model (H029), but at first it did not receive statistical support and was therefore
deleted from the model. In the theorisation of this study, which led to the culmination of the
research hypotheses, it was theorised that that the POS, Work Engagement link can be
explained through the Job Demands-Resources Model (JD-R). According to Bakker and
Demerouti, (2007) the JD–R divides the work environment into job demands and job
resources. Job demands refer to organisational features that require sustained psychological
effort, i.e. job insecurity or role ambiguity. Job resources refer to those organisational
features that help one to achieve work goals, reduce job demands and stimulate personal
growth, learning, and development. POS refers to employees’ perception concerning the
extent to which the organisation values their contribution and cares about their well-being
(Eisenberger, et al., 1986). In this instance POS can act as a job resource that will lead to
Stellenbosch University http://scholar.sun.ac.za

151
higher levels of Work Engagement. Work Engagement is thus the motivational process that
is initiated through the job resource, i.e. POS. Furthermore, it can be argued that an
underpinning of POS is social exchange theory, whereby workers tend to trade effort and
dedication to a workplace for tangible incentives such as pay, but also for socio-emotional
benefits such as esteem, approval and caring (Mael & Ashforth, 1992). The norm of
reciprocity suggests that high levels of POS would engender concerns amongst employees
for the welfare of the organisation as well as the achievement of its goals (Rhoades et al.,
2001). It stands to reason then that employees who have higher levels of POS will also
experience more feelings of Work Engagement and therefore exert the required effort to help
the organisation achieve its stated objectives. Because this path was initially included
through thorough theorisation, and given the current results, it was argued that it made
theoretical sense to include the positive relationship between POS and Work Engagement in
the subsequent modified (model B) structural model.
Therefore, all the current paths in the model were retained (as they were all supported) and
the hypothesised path that shows a positive relationship between POS and Work
Engagement were included in the next model. This additional path made theoretical sense,
the magnitude of the expected change was satisfactory, and the sign of the expected
change was in line with the theorised argument.
4.5.3.1 Fit of the modified structural model (Model B)
Figure 4.4 gives a visual representation of the modified structural model B and the fit
statistics for this model are presented in table 4.19.
Stellenbosch University http://scholar.sun.ac.za

152
Figure 4.4: Representation of the structural model (Model B) (Standardised solution)
Stellenbosch University http://scholar.sun.ac.za

153
Table 4.19
The Goodness of fit statistics for the modified structural model (Model B)
Model X2 S-Bχ2 df S-Bχ2/
df
NNFI CFI RMR SRMR RMSEA
(CI)
P(close)
1164.785* 1039.657* 479 2.17 .967 .970 1.556 .0700 .0769
(.0705;
.0833)
.000
Note: X2, Chi-square; S-BX2, Satorra-Bentler Scaled Chi-square; NNFI, non-normed fit index; CFI, comparative fit index; RMR, root mean square residuals; SRMR, standardised root mean residual; RMSEA, root mean square error of approximation *p < 0.05.
For this model the Satorra-Bentler Chi-square was 1039.657, with 479 degrees of freedom
(p = .000), which showed that the null hypothesis of exact fit was rejected. Moreover, close
fit was not achieved (p-value of close fit < .05). According to the Hair et al., (2006)
guidelines, good fit could be concluded from the RMSEA value of .0769 and incremental fit
indices which comfortably exceeded the .92 cut-off value (CFI = .970; NNFI = .967). The
SRMR (.700) also fell comfortably below the .90 cut-off value. In this model, the Hair et al.,
(2006) guidelines were met and based on the slightly better RMSEA, CFI, NNFI and SRMR
it could be concluded that this model obtained a slightly better fit than the previous model.
Therefore, the basket of GOF indices suggested that the proposed model was able to
reproduce the observed covariance matrix to a degree of accuracy that warranted some faith
in the structural model and the derived parameter estimates. The question, however, still
remained whether there were ways to improve the fit of the model. For this reason, the
unstandardised beta and gamma matrices, as well as the MI’s were expected to determine
if, and how, the fit could be improved.
4.5.4 Parameter Estimates and Modifications suggested by Model B
Table 4.20 depicts the unstandardised beta matrix for model B. All the relationships
hypothesised between the endogenous latent variables in the model were found to be
statistically significant (t-values > |1.96|), including the recently added path between POS
and Work Engagement (indicated in bold).
Stellenbosch University http://scholar.sun.ac.za

154
Table 4.20
Structural modified model (Model B) unstandardised beta matrix
OPT ENG NA PA EWB PWBW POS PSYOWN OPT ENG .397
(.069) 5.767*
NA -.502 (.101)
-4.985*
PA .198 (.062) 3.197*
.850 (.082)
10.359*
EWB .838 (.097) 8.602*
PWBW .963 (.103) 9.337*
POS .725 (.060)
12.006*
PSYOWN .729 (.075) 9.742*
Note: OPT = PsyCap Optimism; ENG = Work Engagement; NA = Negative Affect, PA = Positive Affect; EWB = Eudaimonic Well-being; PWBW = Psychological well-being at work; POS = Perceived Organisational Support; PSYOWN = Psychological Ownership; *t-values > l1.96l indicates significant path coefficients, values in brackets represent standard error estimates; the value in bold represents the latest added MI.
The results depicted in table 4.21 for the unstandardised gamma matrix revealed similar
results where all the hypothesised relationships were found to be statistically significant (t-
values > |1.96|). All the previously included paths were therefore retained in the subsequent
modified model (model C). The MI’s for the beta matrix are presented in table 4.22 and the
MI’s for the gamma matrix in table 4.23.
Table 4.21
Structural modified model (Model B) unstandardised gamma matrix
HOPE SE RES GRAT
OPT .980 (.079)
12.352* ENG .568
(.088) 6.453*
NA PA
EWB PWBW
POS PSYOWN
Note: HOPE = PsyCap Hope; SE = PsyCap Self-efficacy; RES = PsyCap Resilience; GRAT = Gratitude; OPT = PsyCap Optimism; ENG = Work Engagement; NA = Negative Affect, PA = Positive Affect; EWB = Eudaimonic Well-being; PWBW = Psychological well-being at work; POS = Perceived Organisational Support; PSYOWN = Psychological Ownership; *t-values > l1.96l indicates significant path coefficients, values in brackets represent standard error estimates.
Stellenbosch University http://scholar.sun.ac.za

155
Table 4.22
Modified structural model (Model B) modification indices for beta matrix
OPT ENG NA PA EWB PWBW POS PSYOWN OPT .741 ENG .092 2.664 1.974 NA 6.063 PA .198 17.170 1.805
EWB .004 1.644 .002 .063 9.484 5.711 PWBW 5.102 .096 57.823 6.703
POS .979 1.919 1.060 8.018 .584 1.579 PSYOWN 3.916 8.376 4.438 8.803 .849 7.444
Note: OPT = PsyCap Optimism; ENG = Work Engagement; NA = Negative Affect, PA = Positive Affect; EWB =
Eudaimonic Well-being; PWBW = Psychological well-being at work; POS = Perceived Organisational Support;
PSYOWN = Psychological Ownership; the value in bold represents the highest MI.
Table 4.23
Modified structural model (Model B) modification indices for gamma matrix
HOPE SE RES GRAT
OPT
ENG
NA
PA .706 .442
EWB 9.800 14.615 3.743
PWBW .098 .173
POS .430 1.923 16.498
PSYOWN 9.558 1.446 7.145 4.481
Note: HOPE = PsyCap Hope; SE = PsyCap Self-efficacy; RES = PsyCap Resilience; GRAT = Gratitude; OPT =
PsyCap Optimism; ENG = Work Engagement; NA = Negative Affect, PA = Positive Affect; EWB = Eudaimonic
Well-being; PWBW = Psychological well-being at work; POS = Perceived Organisational Support; PSYOWN =
Psychological Ownership
The parameter with the highest MI-value was found in the beta matrix. The highest MI-value
was indicated for the path between POS and PWBW (57.823). This suggested that if this
path would be added to the structural model, hypothesising the relationship between these
two constructs, the fit of this model would improve significantly. The completely standardised
expected change for the beta coefficient was .754 and it obtained a positive sign.
The question was therefore whether a theoretical justification could be provided to include
this hypothesised path in the subsequent modified model. POS refers to employees’
perception concerning the extent to which the organisation values their contribution and
cares about their well-being (Eisenberger, et al., 1986). Employees regard the organisation
as an important source of socio-emotional resources, where their needs such as respect,
caring and tangible benefits such as wages and medical benefits are fulfilled. If employees
perceive the organisation to have a high regard of them (i.e. the organisation values their
contribution and cares about their well-being), it will help to meet the employees’ needs for
approval, esteem and affiliation. Such employees will most likely perceive justice and
fairness, as they view positive evaluation by the organisation as an indication that increased
Stellenbosch University http://scholar.sun.ac.za

156
effort will be noted and rewarded. For this reason, employees will take an active interest in
the regard with which they are held by their employer (Eisenberger, et al.,1997; Eisenberger
et al. 1986; Rhoades & Eisenberger, 2002). These perceived feelings of justice and
recognition could have a positive effect on their Psychological Well-being at Work. For
example, it may lead them to be more immersed in their work and thereby lead to higher
levels of well-being. The theoretical definition of PWBW can be defined by viewing the five
subscales, namely Interpersonal Fit at Work, Thriving at Work, Feeling of Competency at
work, Perceived Recognition and Desire for Involvement at Work (Dagenais-Desmarais &
Savoie, 2012). It could, for example, be argued that if an employee perceives the
organisation to value their contribution and recognise their input (higher POS), such an
employee may find it easier to thrive at their work and feel competent, which will also lead to
an increase desire to be even more involved. Such an employee (with higher levels of POS)
may also find it easier to establish and maintain good interpersonal relationships at work
(resulting in more Interpersonal Fit at Work). Therefore it was decided to add the
hypothesised path that a positive relationship exists between POS and PWBW to the
subsequent modified model, seeing that it made theoretical sense to do so, the magnitude of
the expected change was satisfactory, and the sign of the expected change was in line with
the theoretical argument. The modified model (model C) was subsequently fitted to the data.
4.5.4.1 Fit of the modified Structural Model (C)
The modified structural model C can be viewed in figure 4.5 and the fit indices are contained
in table 4.24.
Stellenbosch University http://scholar.sun.ac.za

157
Figure 4.5: Representation of the structural model (Model C) (Standardised solution)
Stellenbosch University http://scholar.sun.ac.za

158
Table 4.24
The Goodness of fit statistics for the structural model (Model C)
Model X2 S-Bχ2 df S-Bχ2/
df
NNFI CFI RMR SRMR RMSEA
(CI)
P(close)
1143.562* 1015.059* 478 2.12 .969 .972 1.500 .0697 .0753
(.0689;
.0818)
.000
Note: X2, Chi-square; S-BX2, Satorra-Bentler Scaled Chi-square; NNFI, non-normed fit index; CFI, comparative fit index; RMR, root mean square residuals; SRMR, standardised root mean residual; RMSEA, root mean square error of approximation *p < 0.05.
The results revealed that a Satorra-Bentler Chi-square of 1015.059, with 478 degrees of
freedom (p = .000) was obtained, indicating that the null hypothesis of exact fit was rejected.
Moreover, close fit was not achieved (p-value of close fit < .05). According to the
benchmarks set through the Hair et al., (2006) simulation studies (see table 3.2), the
RMSEA of .0753 indicated good model fit. The SRMR (.0697) was well below the .90 cut-off
value (Hair et al., 2006) further substantiating the conclusion of good model fit. In addition,
the NNFI and CFI (.969 and .972) were both well above .92. The NNFI and the CFI obtained
slightly lower values than in the previous model, whilst the SRMR and the RMSEA both
improved (i.e. lower values). Therefore, these marginal changes indicated that the model
obtained more or less similar fit than the previous one.
Given the evidence considered it was concluded that the proposed model was able to
reproduce the observed covariance matrix to a degree of accuracy that warranted faith in the
structural model and the derived parameter estimates. The unstandardised beta and gamma
matrices, as well as the MI’s were again investigated to determine if there were ways to
improve the fit of the model.
4.5.5 Parameter Estimates and Modifications suggested by Model C
The unstandardised beta matrix, presented in table 4.25, showed that the path between
Optimism and PA were no longer significant. This path was therefore removed in the
subsequent model. All the other paths were significant (t-values > |1.96|) and therefore
supported. This included the path between POS and PWBW that was added into the current
modified model (model C) (indicated in bold). The unstandardised gamma matrix, depicted in
table 4.26, revealed that all these paths were significant and therefore no further paths were
considered for deletion from this model. The MI-values for the beta matrix are presented in
table 4.27, and the MI-values for the currently fixed gamma parameters are shown in table
4.28.
Stellenbosch University http://scholar.sun.ac.za

159
Table 4.25
Structural model (Model C) unstandardized beta matrix
OPT ENG NA PA EWB PWBW POS PSYOWN OPT ENG .342
(.072) 4.723*
NA -.498 (.101)
-4.950*
PA .116 (.073) 1.589
.906 (.093) 9.790*
EWB .845 (.097) 8.664*
PWBW .777 (.097) 8.013*
.225 (.058) 4.431*
POS .709 (.060)
11.887*
PSYOWN .723 (0.074) 9.837*
Note: OPT = PsyCap Optimism; ENG = Work Engagement; NA = Negative Affect, PA = Positive Affect; EWB = Eudaimonic Well-being; PWBW = Psychological well-being at work; POS = Perceived Organisational Support; PSYOWN = Psychological Ownership. *t-values > l1.96l indicates significant path coefficients; values in brackets represent standard error estimate; the value in bold represents the latest added MI. Table 4.26
Structural modified model (Model C) unstandardized gamma matrix
HOPE SE RES GRAT
OPT .989 (.080)
12.392* ENG .606
(.089) 6.817*
NA
PA
EWB
PWBW
POS PSYOWN
Note: HOPE = PsyCap Hope; SE = PsyCap Self-efficacy; RES = PsyCap Resilience; GRAT = Gratitude; OPT = PsyCap Optimism; ENG = Work Engagement; NA = Negative Affect, PA = Positive Affect; EWB = Eudaimonic Well-being; PWBW = Psychological well-being at work; POS = Perceived Organisational Support; PSYOWN = Psychological Ownership. *t-values > l1.96l indicates significant path coefficients; values in brackets represent standard error estimates.
Stellenbosch University http://scholar.sun.ac.za

160
Table 4.27
Modified structural model modification indices for beta matrix (Model C)
OPT ENG NA PA EWB PWBW POS PSYOWN OPT .496 ENG .081 5.252 2.147 NA 6.366 PA .000 .874
EWB .003 1.633 .009 .426 7.485 5.131 PWBW 3.975 .028
POS 1.634 2.669 1.728 6.252 .987 1.728 PSYOWN 4.348 9.104 4.377 9.174 1.043 7.571
Note: OPT = PsyCap Optimism; ENG = Engagement; NA = Negative Affect, PA = Positive Affect; EWB =
Eudaimonic Well-being; PWBW = Psychological well-being at work; POS = Perceived Organisational Support;
PSYOWN = Psychological Ownership.
Table 4.28
Modified structural model modification indices for gamma matrix (Model C)
HOPE SE RES GRAT
OPT
ENG
NA
PA .053 10.679
EWB 4.600 11.487 2.270
PWBW 4.555 9.428
POS .126 1.363 14.010 1.912
PSYOWN 9.976 10.695 7.403 4.359
Note: HOPE = PsyCap Hope; SE = PsyCap Self-efficacy; RES = PsyCap Resilience; GRAT = Gratitude; OPT =
PsyCap Optimism; ENG = Work Engagement; NA = Negative Affect, PA = Positive Affect; EWB = Eudaimonic
Well-being; PWBW = Psychological well-being at work; POS = Perceived Organisational Support; PSYOWN =
Psychological Ownership; the values in bold represent the highest and second highest MI’s.
The parameter with the highest MI-value resided in the gamma matrix (14.010), which
indicated a path between Resilience and POS. The magnitude of the completely
standardised expected change for the gamma coefficient was -0.390. It therefore suggested
that Resilience has a negative relationship with POS. Therefore, the critical question that
had to be asked was whether a negative relationship between these two latent variables
made substantive theoretical sense.
Resilience has been defined as the positive psychological capacity to rebound, to bounce
back from adversity, uncertainty, conflict, failure or even positive change, progress and
increased responsibility (Luthans, 2002a). Individuals with high Resilience have the ability to
cope and adapt more easily during risk and adversity (Masten, 2001; Masten & Reed, 2002).
According to the suggestive MI, it would thus mean that individuals who have high levels of
Resilience would perceive less organisational support, i.e. they would be less likely to
perceive the organisation to value their contribution or to care about their well-being. From
one viewpoint it could be argued that this make sense as Resilience is an inner strength. It
Stellenbosch University http://scholar.sun.ac.za

161
could therefore be said that individuals that have this inner strength, may not be so reliant on
POS as such individuals would overcome adversity by harnessing their inner strength
(Resilience) and not Perceived Organisational Support received from the organisation. For
example, when barriers to well-being are present in the workplace (e.g. workplace
stressors), the high Resilience individual may rely more on their inner strength to overcome
this barrier than tapping into their beliefs regarding the perceived support received from the
organisation. However, upon further consideration it was realised that a counter argument
can also apply. Optimism and Resilience act in concert due to an underlying mechanism
shared across each of the four PsyCap constructs that contribute to a motivational
propensity to accomplish tasks and goals (Luthans et al., 2007b). Avey et al., (2010) argue
that most research in the PsyCap field include areas that share a communal focus on
positive, optimal human functioning. Individuals with higher levels of PsyCap use intentional
efforts to produce creative ways of attaining goals. This suggests that if an individual is high
in one psychological resource i.e. Resilience, they are often high on the others i.e. Optimism.
Therefore, individuals high on Resilience will quite possibly also make internal, relative
stable and global attributions regarding positive events (Optimism). It could therefore be
argued that resilient employees will most probably have a positive mind-set and create
resources to help them overcome difficult times. One of these resources may be perceived
support from the organisation or even co-employees, hence, providing a reason to argue
that Resilience and POS may be positively related. However, these are only possible
arguments for the relationships between these variables. No empirical justification from
previous research could be found to substantiate any of these claims. For this reason, as
well as the ambiguity regarding the nature of relationship (whether positive or negative), it
was decided to not include this path in the subsequent modified model.
The next highest MI-value indicated that a path should be added between Self-efficacy and
EWB. The magnitude of the completely standardised expected change for the gamma
coefficient (.449) was substantial, and the sign was positive. This hypothesised path, that
more Self-efficacy would result in better EWB, was also included in the original model (H013).
It was argued that the ability of highly efficacious individuals to foster feelings of competence
in particular domains, may accordingly lead them to flourish and expect similar, positive
outcomes in future (Bandura, 1986). Hence, they may be better equipped to regulate their
personal notions of perceived stress and strain (Bandura, 1997). Steyn (2011) stated that
individuals high in Self-efficacy may exhibit better Psychological Well-being, simply because
after having failed once, they will continue to persist in their efforts without being burdened
by feelings of inadequacy and low self-worth that are often associated with a lack of mental
Stellenbosch University http://scholar.sun.ac.za

162
well-being. These efficacy beliefs are related to a state of eudaimonia in the sense that one
is willing to commit the effort in order to enhance oneself in terms of work or life. Put
differently, if one has the confidence to believe one can successfully accomplish a given task
(Self-efficacy), one will be more motivated to engage in that task and come to a state where
you thrive in it (EWB). Moreover, Conservation of Resources theory (Hobfoll, 1989)
stipulates that individuals strive to obtain, retain, protect and foster resources, and that
individuals with more resources (e.g. Self-efficacy) are less vulnerable to resource loss and
more capable of organising resource gain (e.g. better well-being) (Hobfoll, 2001). According
to the theory these resources include physical objects, personal characteristics (such as
PsyCap), energies and conditions (Görgens-Ekermans & Herbert, 2013). For example,
Culberson, Fullagar and Mills (2010) have demonstrated that PsyCap, of which Self-efficacy
is a dimension, is related to both Hedonic and Eudaimonic Well-being. For this reason, Self-
efficacy was argued to have a positive relationship with EWB. Therefore, it made theoretical
sense to include the path between Self-efficacy and EWB in the subsequent modified model.
Based on the presented results, it was decided to delete the statistically insignificant path
between Optimism and Positive Affect (PA) and to add the hypothesised positive relationship
between Self-efficacy and EWB into the subsequent modified model. The decision was
based on the strength of the theoretical argument presented above, the fact that the
magnitude of the expected change was satisfactory (.449), and that the sign of the expected
change was in line with the theorised argument. The modified model (D) was fitted to the
data.
4. 5.5.1 Fit of the modified Structural Model (Model D)
The modified structural model D is presented visually in figure 4.6. The fit statistics for this
model are presented in table 4.29
Stellenbosch University http://scholar.sun.ac.za

163
Figure 4.6: Representation of the structural model (Model D) (Standardised solution)
Stellenbosch University http://scholar.sun.ac.za

164
Table 4.29
The Goodness of fit statistics for the structural model (Model D)
Model X2 S-Bχ2 df S-Bχ2/
df
NNFI CFI RMR SRMR RMSEA
(CI)
P(close)
1139.391* 1017.342* 478 2.13 .969 .972 1.498 .0697 .0755
(.0691;
.0819)
.000
Note: X2, Chi-square; S-BX2, Satorra-Bentler Scaled Chi-square; NNFI, non-normed fit index; CFI, comparative fit index; RMR, root mean square residuals; SRMR, standardised root mean residual; RMSEA, root mean square error of approximation *p < 0.05.
The results in table 4.29 show that the Satorra-Bentler Chi-square was 1017.342, with 478
degrees of freedom (p = .000). The null hypothesis of exact fit was therefore rejected.
Moreover, close fit was not achieved (p-value of close fit < .05). According to the Hair et al.,
(2006) guidelines, the RMSEA of .0755 indicated good model fit. The SRMR (.0697) was
well below the .90 cut-off value (Hair et al., 2006) further substantiating the conclusion of
good model fit. In addition, the NNFI and CFI (.969 and .972) were both well above .92.
Compared to the previous model, the NNFI, CFI and SRMR remained the same, but the
RMSEA increased marginally. The results indicated that a similar fit was obtained than for
the previous model.
The parameter estimates for beta and gamma, as well as the modification indices calculated
by LISREL were explored to investigate further additional possible ways in which this model
could be modified through either the deletion or addition of paths that may result in an
improved fit.
4.5.6 Parameter Estimates and Modifications suggested by Model D
From the unstandardised beta matrix presented in table 4.30 it was evident that none of the
current paths between the endogenous latent variables included in the model should be
deleted in the subsequent modified model. All the paths were supported and found to be
statistically significant (t-values > |1.96).
Stellenbosch University http://scholar.sun.ac.za

165
Table 4.30
Structural model (Model D) unstandardized beta matrix
OPT ENG NA PA EWB PWBW POS PSYOWN OPT ENG .341
(.071) 4.807*
NA -.506 (.099)
-5.108*
PA .996 (.076)
13.186*
EWB .654 (.104) 6.277*
PWBW .759 (.093) 8.172*
.281 (.053) 5.286*
POS .738 (.061)
12.026*
PSYOWN .723 (.073) 2.467*
Note: OPT = PsyCap Optimism; ENG = Work Engagement; NA = Negative Affect, PA = Positive Affect; EWB = Eudaimonic Well-being; PWBW = Psychological well-being at work; POS = Perceived Organisational Support; PSYOWN = Psychological Ownership. *t-values > l1.96l indicates significant path coefficients; values in brackets represent standard error estimates.
The unstandardised gamma matrix, depicted in table 4.31, shows that all the paths between
the exogenous and endogenous latent variables were statistically significant (t-values >
|1.96). This included the recently added path between Self-efficacy and EWB (indicated in
bold). Consequently, all the current paths were retained in the subsequent modified model.
Tables 4.32 and 4.33 contain the modification indices for the beta matrix and for the
currently fixed gamma parameters.
Stellenbosch University http://scholar.sun.ac.za

166
Table 4.31
Structural modified model (Model D) unstandardized gamma matrix
HOPE SE RES GRAT
OPT .946 (.079)
11.933* ENG .616
(.087) 7.042*
NA
PA
EWB .229 (.093) 2.467*
PWBW
POS
PSYOWN
Note: HOPE = PsyCap Hope; SE = PsyCap Self-efficacy; RES = PsyCap Resilience; GRAT = Gratitude; OPT = PsyCap Optimism; ENG = Work Engagement; NA = Negative Affect, PA = Positive Affect; EWB = Eudaimonic Well-being; PWBW = Psychological well-being at work; POS = Perceived Organisational Support; PSYOWN = Psychological Ownership. *t-values > l1.96l indicates significant path coefficients; values in brackets represent standard error estimates; the value in bold represents the latest added MI.
Table 4.32
Modified structural model modification indices for beta matrix (Model D)
OPT ENG NA PA EWB PWBW POS PSYOWN OPT .213 ENG .021 6.389 2.016 NA 5.386 PA 8.535 .268 4.788 8.425 .636 EWB .347 2.651 .392 .002 4.260 4.793 PWBW 4.985 6.239 .027 POS 1.556 1.875 1.708 4.251 1.286 1.634 PSYOWN 3.787 9.066 4.184 8.974 1.137 7.315
Note: OPT = PsyCap Optimism; ENG = Work Engagement; NA = Negative Affect, PA = Positive Affect; EWB =
Eudaimonic Well-being; PWBW = Psychological well-being at work; POS = Perceived Organisational Support;
PSYOWN = Psychological Ownership
Table 4.33
Modified structural model modification indices for gamma matrix (Model D)
HOPE SE RES GRAT
OPT
ENG
NA 1.947 3.918
PA 1.773 12.836
EWB .687
PWBW 7.533 12.016
POS .149 .638 11.641 1.456
PSYOWN 9.945 10.346 7.216 5.136
Note: HOPE = ; PsyCap Hope; SE = PsyCap Self-efficacy; RES = PsyCap Resilience; GRAT = Gratitude; OPT =
PsyCap Optimism; ENG = Work Engagement; NA = Negative Affect, PA = Positive Affect; EWB = Eudaimonic
Well-being; PWBW = Psychological well-being at work; POS = Perceived Organisational Support; PSYOWN =
Psychological Ownership; the value in bold represents the highest MI.
Stellenbosch University http://scholar.sun.ac.za

167
When evaluating the MI’s, it was clear that highest MI was in the gamma matrix indicating
that if a path would be included between Resilience and Positive Affect (PA), the model
would improve significantly. The completely standardised expected change for the beta
coefficient was of sufficient magnitude (.259) and obtained a positive sign. Again, the critical
question was, whether it would make theoretical sense to include a positive relationship
between Resilience and Positive Affect in the revised model. Resilience, the positive
psychological capacity to rebound, to bounce back from adversity, uncertainty, conflict,
failure or even positive change, progress and increased responsibility (Luthans, 2002a), is
an inner psychological strength that individuals use when they are in a difficult or challenging
situation. An argument is therefore proposed that if an individual has the ability to bounce
back from adversities, positive emotions will result from this. According to Bonano and
Keltner (1997) bereaved individuals who exhibited genuine laughs and smiles when
speaking about a recent loss had better adjustment over several years of bereavement and
also evoked more favourable responses in observers (Bonano & Keltner, 1997). Recently,
Fredrickson et al., (2003) demonstrated that the links between measures of Resilience and
adjustment following the 9/11 attacks were mediated by the experience of positive emotions
(e.g. gratitude, interest, love). Therefore, Resilience could be linked to increased levels of
PA.
The results presented and explained in this section warranted the inclusion of the positive
hypothesised path between Resilience and PA in the modified structural model (model E).
This path made substantial theoretical sense, the magnitude of the expected change was
satisfactory (.259) and the sign of the expected change was in line with the theorised
argument, i.e. positive. The results for model D further revealed that no existing paths should
be deleted from this model. The modified model (model E) was fitted to the data.
4.5.6.1 Fit of the modified structural model (Model E)
Figure 4.7 gives a visual representation of the modified structural model E and the fit
statistics for this model are presented in table 4.34.
Stellenbosch University http://scholar.sun.ac.za

168
Figure 4.7: Representation of the structural model (Model E) (Standardised solution)
Stellenbosch University http://scholar.sun.ac.za

169
Table 4.34
Goodness of Fit statistics for the modified model (Model E)
Model X2 S-Bχ2 df S-Bχ2/
df
NNFI CFI RMR SRMR RMSEA
(CI)
P(close)
1132.423* 1011.137* 477 2.120 .969 .972 1.486 .0690 .0752
(.0688;
.0816)
.000
Note: X2, Chi-square; S-BX2, Satorra-Bentler Scaled Chi-square; NNFI, non-normed fit index; CFI, comparative fit index; RMR, root mean square residuals; SRMR, standardised root mean residual; RMSEA, root mean square error of approximation *p < 0.05.
The Satorra-Bentler Chi-square was 1011.137, with 477 degrees of freedom (p = .000),
which showed that the null hypothesis of exact fit was rejected. Close fit was still not
achieved (p-value of close fit < .05). According to the Hair et al., (2006) guidelines, good fit
could be concluded from the RMSEA value of .0752 and incremental fit indices which
comfortably exceeded the .92 cut-off value (CFI = .972; NNFI = .969). The SRMR (.0690)
was also comfortably below the .09 cut-off level. Given the basket of fit indices it could be
concluded that good fit was achieved according to the Hair et al., (2006) guidelines.
Compared to the previous model, the NNFI and CFI remained the same, but the SRMR and
RMSEA both decreased slightly indicating that the model fit, although marginally, has
improved somewhat.
Therefore, the basket of GOF indices suggested that the proposed model was able to
reproduce the observed covariance matrix to a degree of accuracy that warranted some faith
in the structural model and the derived parameter estimates. The question, however, still
remained whether there were ways to improve the fit of the model. For this reason, the
unstandardised beta and gamma matrices, as well as the MI’s were inspected to determine if
the fit could be improved.
4.5.7 Parameter Estimates and Modifications suggested by Model E
The unstandardised beta matrix shown in table 4.35 illustrated that all the current paths in
the model should be retained as all the hypothesised paths were found to be statistically
significant (t-values > |1.96|) and were therefore supported. Table 4.36 depicts the
unstandardised gamma matrix which shows that all of the freed gamma paths were
statistically significant (t-values > |1.96|). The results also revealed that empirical support
was found for the positive relationship between Resilience and Positive Affect (indicated in
bold), which was added to this modified version of the model. The MI’s for model E are
presented in table 4.37 (beta matrix) and table 4.38 (gamma matrix).
Stellenbosch University http://scholar.sun.ac.za

170
Table 4.35
Structural model (Model E) unstandardised beta matrix
OPT ENG NA PA EWB PWBW POS PSYOWN OPT ENG .354
(.072) 4.937*
NA -.507 (.099)
-5.106*
PA .901 (.081)
11.191*
EWB .655 (.104) 6.274*
PWBW .753 (.090) 8.341*
.289 (.052) 5.584*
POS .735 (.061)
11.962*
PSYOWN .721 (.073) 9.931*
Note: OPT = PsyCap Optimism; ENG = Work Engagement; NA = Negative Affect, PA = Positive Affect; EWB = Eudaimonic Well-being; PWBW = Psychological well-being at work; POS = Perceived Organisational Support; PO = Psychological Ownership. *t-values > l1.96l indicates significant path coefficients; values in brackets represent standard error estimates.
Table 4.36
Structural modified model (Model E) unstandardised gamma matrix
HOPE SE RES GRAT
OPT .946 (.079)
11.915* ENG .592
(.088) 6.745*
NA
PA .138 (.059) 2.320*
EWB .229 (.093) 2.470*
PWBW
POS
PSYOWN
Note: HOPE = PsyCap Hope; SE = PsyCap Self-efficacy; RES = PsyCap Resilience; GRAT = Gratitude; OPT = PsyCap Optimism; ENG = Work Engagement; NA = Negative Affect, PA = Positive Affect; EWB = Eudaimonic Well-being; PWBW = Psychological well-being at work; POS = Perceived Organisational Support; PO = Psychological Ownership. *t-values > l1.96l indicates significant path coefficients; values in brackets represent standard error estimates, the value in bold represents the latest added MI.
Stellenbosch University http://scholar.sun.ac.za

171
Table 4.37
Modified structural model modification indices for beta matrix (Model E)
OPT ENG NA PA EWB PWBW POS PSYOWN OPT .257 ENG .023 5.475 2.001 NA .015 5.342 PA .001 .050 .882 4.732 .763
EWB .316 2.630 .557 .002 4.189 4.720 PWBW 3.899 1.836 .001
POS 1.601 1.909 3.474 4.371 1.873 1.745 PSYOWN 4.035 8.910 4.282 9.839 1.284 7.837
Note: OPT = PsyCap Optimism; ENG = Work Engagement; NA = Negative Affect, PA = Positive Affect; EWB =
Eudaimonic Well-being; PWBW = Psychological well-being at work; POS = Perceived Organisational Support;
PSYOWN = Psychological Ownership.
Table 4.38
Modified structural model modification indices for gamma matrix (Model E)
HOPE SE RES GRAT
OPT
ENG
NA 1.898 3.845
PA 5.010
EWB 1.033
PWBW 1.362
POS .153 .738 12.676 1.780
PSYOWN 10.245 10.773 7.743 5.423
Note: HOPE = PsyCap Hope; SE = PsyCap Self-efficacy; RES = PsyCap Resilience; GRAT = Gratitude; OPT =
PsyCap Optimism; ENG = Work Engagement; NA = Negative Affect, PA = Positive Affect; EWB = Eudaimonic
Well-being; PWBW = Psychological well-being at work; POS = Perceived Organisational Support; PSYOWN =
Psychological Ownership
The parameter with the highest MI-value was the same one that emerged in a previous
modified model’s gamma matrix indicating that a path should be added between Resilience
and POS. In this instance the magnitude for the completely standardised expected change
for the gamma coefficient magnitude (-.329) was substantial and the sign was negative.
Given the lack of previous empirical evidence to substantiate the inclusion of this path, as
well as the ambiguous nature of the direction of the influence of Resilience on POS, it was
decided, once again, not to include this path in the subsequent modified model.
The next highest MI-value indicated that a path should be added between Self-efficacy and
Psychological Ownership. The completely standardised expected change for the gamma
coefficient (.235) was positive. The critical question was whether it would make theoretical
sense to include a positive relationship between Self-efficacy and Psychological Ownership
in the revised model. According to Bandura (1977, 1986), Self-efficacy expectations is one’s
belief of being able to cope with specific tasks and situational demands. It is one’s
confidence in one’s ability to mobilise the motivation, cognitive resources, and courses of
Stellenbosch University http://scholar.sun.ac.za

172
action necessary to execute a specific course of action within a given context (Stajkovic &
Luthans, 1998). Individuals with high Self-efficacy beliefs have the ability to extend their
motivation and effort to successfully accomplish their goals and preserve when faced with
obstacles (Luthans & Youssef, 2004). On the other hand Psychological Ownership (PO) has
earlier been defined as a sense of possession or more precisely, as a cognitive-affective
construct defined as “the state in which individuals feel as though the target of ownership or
a piece of that target is theirs” and reflects “an individual’s awareness, thoughts and beliefs
regarding the target of ownership (Pierce, et al., 2003, p.86). Conventional wisdom suggests
that people will take better care of, and strive to maintain and nurture the possessions they
own. It is, therefore, argued here that those individuals who have the confidence to execute
a given task will eventually developed ownership over the task. Such individuals may thus
eventually end up to perceive the task as an extension of their identity. The argument further
follows that if an employee has the necessary motivation, commitment and competence to
do a certain task, they will identify with the task more easily and this identification process
will lend itself to the formation of Psychological Ownership. It therefore seems plausible to
argue that individuals whom show high levels of Self-efficacy would be more prone to show
high levels of Psychological Ownership. Consequently, it seemed theoretically justifiable to
include this path in the modified structural model (model F).
The results presented and explained in this section, therefore, warranted the inclusion of the
positive hypothesised path between Self-efficacy and Psychological Ownership in the
modified structural model (model F). This path made substantive theoretical sense, the
magnitude of the expected change was satisfactory (.235) and the sign of the expected
change was in line with the theorised argument, i.e. positive. The results for model E further
revealed that no existing paths should be deleted from this model. The modified model
(model F) was fitted to the data.
4.5.7.1 Fit of the modified structural model (Model F)
The modified structural model F can be viewed in figure 4.8. The fit statistics derived for this
model is contained in table 4.39.
Stellenbosch University http://scholar.sun.ac.za

173
Figure 4.8: Representation of the structural model (Model F) (Standardised solution)
Stellenbosch University http://scholar.sun.ac.za

174
Table 4.39
Goodness of Fit statistics for the modified model (Model F)
Model X2 S-Bχ2 df S-Bχ2/
df
NNFI CFI RMR SRMR RMSEA
(CI)
P(close)
1121.230* 1002.779* 476 2.107 .969 .972 1.483 .0669 .0748
(.0683;
.0812)
.000
Note: X2, Chi-square; S-BX2, Satorra-Bentler Scaled Chi-square; NNFI, non-normed fit index; CFI, comparative fit index; RMR, root mean square residuals; SRMR, standardised root mean residual; RMSEA, root mean square error of approximation *p < 0.05.
The Satorra-Bentler Chi-square was 1002.779 with 476 degrees of freedom (p = .000),
which showed that the null hypothesis of exact fit was rejected. Moreover, close fit was not
achieved (p-value of close fit < .05). According to the Hair et al., (2006) guidelines, good fit
could be concluded from the RMSEA value of .0748 and incremental fit indices which
comfortably exceeded the .92 cut-off value (CFI = .972; NNFI = .969). The SRMR (.0669)
was comfortably below the .09 cut-off level, although slightly higher than in the previous
model fit results. Again, the NNFI and CFI remained the same as in the previous model, but
the RMSEA decreased slightly, indicating improved model fit. Given the basket of fit indices
it could be concluded that good fit was achieved according to the Hair et al., (2006)
guidelines.
The results of the parameter estimates for beta and gamma, as well as the modification
indices calculated by LISREL were explored to investigate additional possible ways in which
this model could be modified through either the deletion or adding of additional paths that
may result in an improved fit.
4.5.8 Parameter Estimates and Modifications suggested by Model F
The unstandardised beta matrix shown in table 4.40 illustrated that all the current paths in
the model should be retained as all the hypothesised paths were found to be statistically
significant (t-values > |1.96|). Table 4.41 depicts the unstandardised gamma matrix which
shows that all of the freed gamma paths were statistically significant (t-values > |1.96|). The
results also revealed that empirical support was found for the positive relationship between
Self-efficacy and Psychological Ownership (indicated in bold), which was added into this
modified version of the model. The MI’s for model E are presented in table 4.42 (beta
matrix) and table 4.43 (gamma matrix).
Stellenbosch University http://scholar.sun.ac.za

175
Table 4.40
Structural model (Model F) unstandardized beta matrix
OPT ENG NA PA EWB PWBW POS PSYOWN OPT ENG .348
(.071) 4.874*
NA -.506 (.099)
-5.099*
PA .899 (.080)
11.216*
EWB .656 (.104) 6.281*
PWBW .758 (.090) 8.382*
.285 (.051) 5.560*
POS .724 (.061)
11.781*
PSYOWN .601 (.077) 7.849*
Note: OPT = PsyCap Optimism; ENG = Work Engagement; NA = Negative Affect, PA = Positive Affect; EWB = Eudaimonic Well-being; PWBW = Psychological well-being at work; POS = Perceived Organisational Support; PSYOWN = Psychological Ownership. *t-values > l1.96l indicates significant path coefficients; values in brackets represent standard error estimates. Table 4.41
Structural modified model (Model F) unstandardized gamma matrix
HOPE SE RES GRAT
OPT .946 (.080)
11.890*
ENG .600 (.088) 6.837*
NA .0141 (.059) 2.385*
PA
EWB .228 (.093) 2.451*
PWBW
POS
PSYOWN .237 (.072) 3.308*
Note: HOPE = PsyCap Hope; SE = PsyCap Self-efficacy; RES = PsyCap Resilience; GRAT = Gratitude; OPT = PsyCap Optimism; ENG = Work Engagement; NA = Negative Affect, PA = Positive Affect; EWB = Eudaimonic Well-being; PWBW = Psychological well-being at work; POS = Perceived Organisational Support; PSYOWN = Psychological Ownership. *t-values > l1.96l indicates significant path coefficients; values in brackets represent standard error estimates, the value in bold represents the latest added MI.
Stellenbosch University http://scholar.sun.ac.za
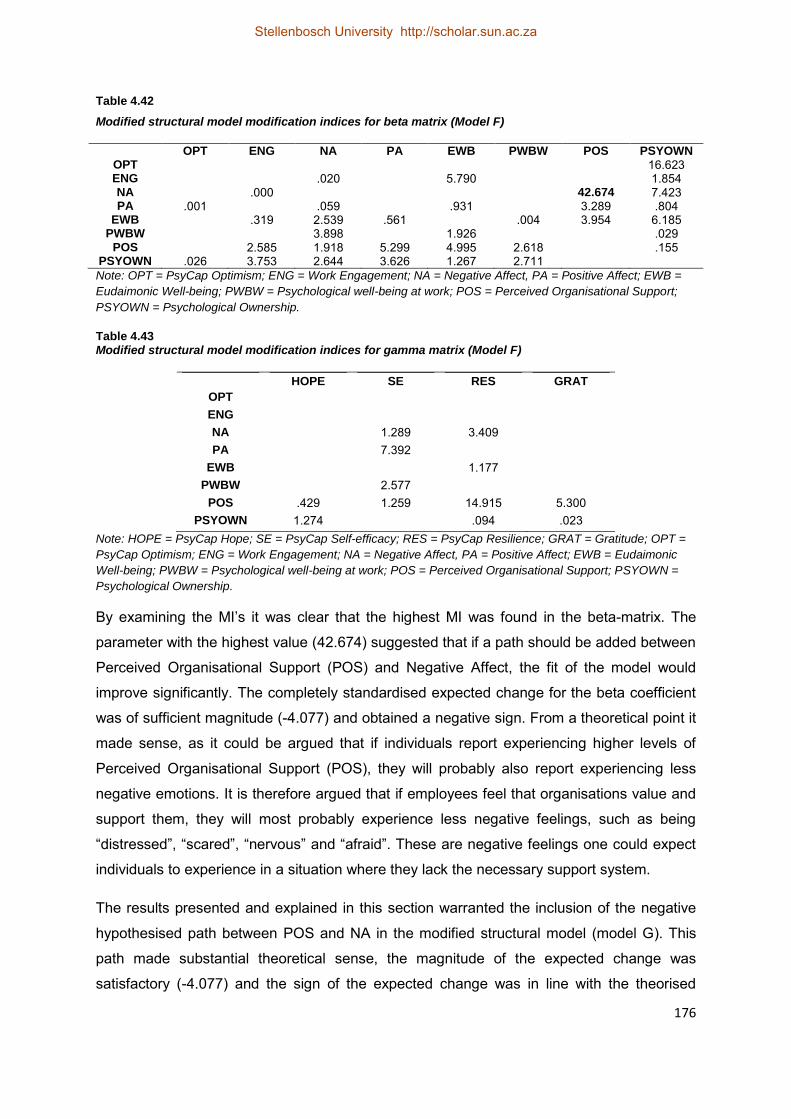
176
Table 4.42
Modified structural model modification indices for beta matrix (Model F)
OPT ENG NA PA EWB PWBW POS PSYOWN OPT 16.623 ENG .020 5.790 1.854 NA .000 42.674 7.423 PA .001 .059 .931 3.289 .804
EWB .319 2.539 .561 .004 3.954 6.185 PWBW 3.898 1.926 .029
POS 2.585 1.918 5.299 4.995 2.618 .155 PSYOWN .026 3.753 2.644 3.626 1.267 2.711
Note: OPT = PsyCap Optimism; ENG = Work Engagement; NA = Negative Affect, PA = Positive Affect; EWB =
Eudaimonic Well-being; PWBW = Psychological well-being at work; POS = Perceived Organisational Support;
PSYOWN = Psychological Ownership.
Table 4.43 Modified structural model modification indices for gamma matrix (Model F)
HOPE SE RES GRAT
OPT
ENG
NA 1.289 3.409
PA 7.392
EWB 1.177
PWBW 2.577
POS .429 1.259 14.915 5.300
PSYOWN 1.274 .094 .023
Note: HOPE = PsyCap Hope; SE = PsyCap Self-efficacy; RES = PsyCap Resilience; GRAT = Gratitude; OPT =
PsyCap Optimism; ENG = Work Engagement; NA = Negative Affect, PA = Positive Affect; EWB = Eudaimonic
Well-being; PWBW = Psychological well-being at work; POS = Perceived Organisational Support; PSYOWN =
Psychological Ownership.
By examining the MI’s it was clear that the highest MI was found in the beta-matrix. The
parameter with the highest value (42.674) suggested that if a path should be added between
Perceived Organisational Support (POS) and Negative Affect, the fit of the model would
improve significantly. The completely standardised expected change for the beta coefficient
was of sufficient magnitude (-4.077) and obtained a negative sign. From a theoretical point it
made sense, as it could be argued that if individuals report experiencing higher levels of
Perceived Organisational Support (POS), they will probably also report experiencing less
negative emotions. It is therefore argued that if employees feel that organisations value and
support them, they will most probably experience less negative feelings, such as being
“distressed”, “scared”, “nervous” and “afraid”. These are negative feelings one could expect
individuals to experience in a situation where they lack the necessary support system.
The results presented and explained in this section warranted the inclusion of the negative
hypothesised path between POS and NA in the modified structural model (model G). This
path made substantial theoretical sense, the magnitude of the expected change was
satisfactory (-4.077) and the sign of the expected change was in line with the theorised
Stellenbosch University http://scholar.sun.ac.za

177
argument, i.e. negative. The results for model F further revealed that no existing paths
should be deleted from this model. The modified model (model G) was fitted to the data.
4.5.9.1 Fit of the modified structural model (Model G)
The fitted model can be viewed in figure 4.8. The fit indices can be viewed in table 4.44
which is followed by a more in-depth discussion thereof.
Figure 4.9: Representation of the structural model (Model G) (Standardised solution)
Stellenbosch University http://scholar.sun.ac.za

178
Table 4.44
The Goodness of fit statistics for the structural model (Model G)
Model X2 S-Bχ2 df S-Bχ2/
df
NNFI CFI RMR SRMR RMSEA
(CI)
P(close)
1119.390 1001.070 475 2.108 .969 .972 1.461 .0660 .0748
(.0683;
.0813)
.000
Note: X2, Chi-square; S-BX2, Satorra-Bentler Scaled Chi-square; NNFI, non-normed fit index; CFI, comparative fit index; RMR, root mean square residuals; SRMR, standardised root mean residual; RMSEA, root mean square error of approximation *p < 0.05.
The results in table 4.44 show that the Satorra-Bentler Chi-square was 1001.070, with 475
degrees of freedom (p = .000). Hence, the null hypothesis of exact fit was rejected. The
results further revealed that close fit was still not achieved (p-value of close fit < .05). The
RMSEA of .0748 indicated good model fit (Hair et al., 2006). The SRMR (.0660) was well
below the .90 cut-off value (Hair et al., 2006) further substantiating the conclusion of good
model fit. In addition, the NNFI and CFI (.969 and .972) were both well above .92. This
showed that satisfactory comparative fit existed. All the discussed fit indices remained the
same as in the previous model, except for the SRMR, which decreased marginally, indicting
a slightly improved model fit.
Given the evidence considered, it was concluded that the proposed model was able to
reproduce the observed covariance matrix to a degree of accuracy that warranted faith in the
structural model and the derived parameter estimates. The unstandardised beta and gamma
matrices, as well as the MI’s were again investigated to determine if there were ways to
improve the fit of the model.
4.5.9 Parameter Estimates and Modifications suggested by Model G
Unfortunately the unstandardised beta matrix portrayed in table 4.45 illustrated that the
recently included path (POS negatively influences NA) was not empirically supported. All the
other paths were significant (t-values > |1.96|). The unstandardised gamma matrix, depicted
in table 4.46, revealed that all the paths were significant and therefore no further paths was
considered for deletion from this model. The modification indices for the beta matrix are
presented in table 4.47, and the MI-values for the currently fixed gamma parameters are
shown in table 4.48.
Stellenbosch University http://scholar.sun.ac.za

179
Table 4.45
Structural model (Model G) unstandardised beta matrix
OPT ENG NA PA EWB PWBW POS PSYOWN OPT ENG .349
(.071) 4.893
NA -.369 (.171)
-2.161*
-0.175 (.151) -1.155
PA .899 (.080)
11.195*
EWB .663 (.106) 6.267*
PWBW .757 (.090) 8.373*
.286 (.051) 5.591*
POS .717 (.061)
11.751*
PSYOWN .602 (.076) 7.921*
Note: OPT = PsyCap Optimism; ENG = Work Engagement; NA = Negative Affect, PA = Positive Affect; EWB = Eudaimonic Well-being; PWBW = Psychological well-being at work; POS = Perceived Organisational Support; PSYOWN = Psychological Ownership; *t-values > l1.96l indicates significant path coefficients, values in brackets represent standard error estimates, the value in bold represents the latest added MI.
Table 4.46
Structural modified model (Model G) unstandardised gamma matrix
HOPE SE RES GRAT
OPT .952 (.079)
12.024* ENG .601
(.088) 6.845*
NA
PA .142 (.059) 2.388*
EWB .220 (.094) 2.334*
PWBW
POS
PSYOWN .236 (.071) 3.309*
Note: HOPE = PsyCap Hope; SE = PsyCap Self-efficacy; RES = PsyCap Resilience; GRAT = Gratitude; OPT = PsyCap Optimism; ENG = Work Engagement; NA = Negative Affect, PA = Positive Affect; EWB = Eudaimonic Well-being; PWBW = Psychological well-being at work; POS = Perceived Organisational Support; PSYOWN = Psychological Ownership. *t-values > l1.96l indicates significant path coefficients; values in brackets represent standard error estimates.
Stellenbosch University http://scholar.sun.ac.za

180
Table 4.47
Modified structural model modification indices for beta matrix (Model G)
OPT ENG NA PA EWB PWBW POS PSYOWN OPT 15.763 ENG .021 6.116 1.806 NA .195 .502 3.422 PA .000 .034 .902 3.453 .0849
EWB .285 2.931 .497 .005 3.537 5.863 PWBW 3.984 1.841 .018
POS 2.456 5.236 4.303 2.558 .103 PSYOWN .006 3.667 2.550 3.532 1.312 1.613
Note: OPT = PsyCap Optimism; ENG = Work Engagement; NA = Negative Affect, PA = Positive Affect; EWB =
Eudaimonic Well-being; PWBW = Psychological well-being at work; POS = Perceived Organisational Support;
PO = Psychological Ownership; the value in bold represents the highest MI.
Table 4.48
Modified structural model modification indices for gamma matrix (Model G)
HOPE SE RES GRAT
OPT
ENG
NA .821 .839
PA 7.233
EWB .798
PWBW 2.561
POS .237 1.080 14.326 6.164
PSYOWN 1.207 .0909 .005
Note: HOPE = PsyCap Hope; SE = PsyCap Self-efficacy; RES = PsyCap Resilience; GRAT = Gratitude; OPT =
PsyCap Optimism; ENG = Work Engagement; NA = Negative Affect, PA = Positive Affect; EWB = Eudaimonic
Well-being; PWBW = Psychological well-being at work; POS = Perceived Organisational Support; PO =
Psychological Ownership; the values in bold represents the highest and second highest MI.
The parameter with the highest MI-value was found in the beta matrix. This MI suggests that
if a path should be added between Psychological Ownership (PO) and Optimism the model’s
fit would improve significantly. In this instance the magnitude for the completely standardised
expected change for the beta coefficient (1.070) was substantial and the sign was positive.
The question thus existed whether a theoretical argument exists that would justify the
inclusion of the path between Psychological Ownership and Optimism. Optimism was
defined in this study as a generalised expectancy that one will experience good outcomes in
life. Psychological Ownership (PO), a cognitive-affective construct, has been defined as “the
state in which individuals feel as though the target of ownership or a piece of that target is
theirs” and reflects “an individual’s awareness, thoughts and beliefs regarding the target of
ownership” (Pierce, et al., 2003, p.86). When individuals have high levels of PO, it can be
expected that they will have a generalised expectancy to experience good outcomes which
is the definition of Optimism (Scheier & Carver, 1993). COR theory (Hobfoll, 1989) would
also apply here in the sense that ownership is a positive resource which will lead to the
attainment of other possible resources, i.e. Optimism. On the other hand, a path from
Stellenbosch University http://scholar.sun.ac.za

181
Optimism to PO would also make theoretical sense as it could be argued that people who
would expect positive things to happen to them may experience more enduring positive
states and thereby be more involved and immersed by their work and consequently develop
a sense of ownership. It was decided that neither of these arguments outweigh the other or
were strong enough to justify the inclusion of this path.
The next highest MI-value indicated a path which previously emerged, indicating that a path
between Resilience and POS should be added into the model. In this instance the
magnitude for the completely standardised expected change for the gamma coefficient (-
.369) was substantial and the sign was, once again, negative. Given the lack of previous
empirical evidence and ambiguity regarding the positive or negative association between
these variables to substantiate the inclusion of this path, it was decided, once again, not to
include this path in the subsequent modified model.
Inspection of the remaining modification indices revealed that only one value was larger than
6.64. Theron (2011) states that MI’s with values larger than 6.64 is indicative of parameters
that if set free, would improve the fit of the model significantly (p < .01). This MI indicated
that when a path is included between Self-efficacy and Positive Affect (PA), the model would
improve significantly. However, the completely standardised expected change for the
gamma coefficient (-5.48) was negative. A positive relationship between Self-efficacy and
PA was originally included in the model (H015). From a theoretical point of view a negative
path would not make sense and no empirical information could be found to justify an
argument in support of this path. It was decided not to include the path in the model.
Based on the presented results, it was decided to delete the statistically insignificant path
between Perceived Organisational Support (POS) and Negative Affect (NA). The modified
model (H) was fitted to the data. This was the final modified model.
4.6 ASSESSING THE OVERALL GOODNESS-OF-FIT OF THE FINAL
MODIFIED STRUCTURAL MODEL (MODEL H)
4.6.1 Overall fit statistics
An admissible final solution of the parameter estimates for the modified model was obtained
after 170 iterations. The completely standardised LISREL structural model is shown in figure
4.10. The fit indices produced by LISREL, to provide a final assessment of the overall fit of
the model, are presented in table 4.49.
Stellenbosch University http://scholar.sun.ac.za

182
Figure 4.10: Representation of the structural model (Final model) (Standardised solution)
Stellenbosch University http://scholar.sun.ac.za

183
Table 4.49
The Goodness of fit statistics for the structural model (Final model)
Model X2 S-Bχ2 df S-Bχ2/
df
NNFI CFI RMR SRMR RMSEA
(CI)
P(close)
1121.230* 1002.779* 476 2.107 .969 .972 1.483 .0669 .0748
(.0683;
.0812)
.000
Note: X2, Chi-square; S-BX2, Satorra-Bentler Scaled Chi-square; NNFI, non-normed fit index; CFI, comparative fit index; RMR, root mean square residuals; SRMR, standardised root mean residual; RMSEA, root mean square error of approximation *p < 0.05.
Table 4.49 revealed that this model achieved a Satorra-Bentler Chi-square value of
1002.779 (p = .000). This meant that the null hypothesis of exact fit was rejected (H0:
RMSEA=0). However, it is generally known that the assumption made by the exact fit null
hypothesis constitutes a rather ambitious unrealistic position (Brown & Cudeck, 1993). In
addition, a test of close fit (in contrast to exact fit) is performed by LISREL by testing Ho:
RMSEA .05 against Ha: RMSEA > .05. That is, if a p-value for close fit >0.05 is obtained,
close fit has been achieved. The results revealed that the model did not obtain close fit.
The 90 percent confidence interval for RMSEA (.0683; .0812) was narrow and its upper
bound fell only marginally above the critical cut-off value of .08 (Hair et al., 2006). Hence,
although the model did not obtain close fit, there was still evidence for reasonable to good fit.
Based on these results, it was concluded that the model provided a plausible explanation
and a fairly close reproduction of the observed covariance matrix.
The comparative fit indices presented in table 4.49 illustrated a non-normed fit index value of
.969 and a comparative fit index value of .972, which are both well above .92. This showed
that satisfactory comparative fit existed.
The standardised root mean residual (SRMR) is regarded as a summary measure of
standardised residuals, which represent the average difference between the elements of the
sample covariance matrix and the fitted covariance matrix. The model produced a SRMR of
.0669, which was below the .09 recommended value (Hair et al., 2006). This was therefore
regarded as satisfactory, and thus emphasised the acceptability of the fit achieved by the
structural model.
Further information on the model parameter estimates are given in tables 4.50 and 4.51. All
the loadings in the completely standardised beta and gamma coefficient matrices were
significant.
Stellenbosch University http://scholar.sun.ac.za

184
Table 4.50
Completely standardised beta coefficients (Final Model)
OPT ENG NA PA EWB PWBW POS PSYOWN OPT ENG .348 NA -.506 PA .899
EWB .656 PWBW .758 .285
POS .724 PSYOWN .601
Note: OPT = PsyCap Optimism; ENG = Enga Work gement; NA = Negative Affect, PA = Positive Affect; EWB =
Eudaimonic Well-being; PWBW = Psychological well-being at work; POS = Perceived Organisational Support;
PSYOWN = Psychological Ownership
Table 4.51
Completely standardised gamma coefficients (Final Model)
HOPE SE RES GRAT OPT .946 ENG .600 NA PA .141
EWB .228 PWBW
POS PSYOWN .237
Note: HOPE = ; PsyCap Hope; SE = PsyCap Self-efficacy; RES = PsyCap Resilience; GRAT = Gratitude; OPT =
PsyCap Optimism; ENG = Work Engagement; NA = Negative Affect, PA = Positive Affect; EWB = Eudaimonic
Well-being; PWBW = Psychological well-being at work; POS = Perceived Organisational Support; PSYOWN =
Psychological Ownership
The original hypotheses that received support in the final model included: PA positively
influences PWBW (H03), Optimism negatively influences NA (H010), Optimism positively
influence EWB (H011), Optimism positively influences POS (H012), Self-efficacy positively
influences EWB (H013), Gratitude positively influences Optimism (H018), Work Engagement
positively influences PA (H022), Hope positively influences Work Engagement (H027), POS
positively influences EWB (H029) and POS positively influences Psychological Ownership
(H030). Based on the modification indices three additional paths were included and received
support in the final modified model. These paths included: POS positively influences PWBW,
Self-efficacy positively influences Psychological Ownership, and Resilience positively
influences Positive Affect.
Figure 4.11 indicates the parameter estimates for all the hypothesised paths in the final
version (Model H) of the structural model that was fitted to the data. Of the 28 original
hypotheses, 10 were maintained and three new paths were added. Although the majority of
the paths were removed, the final model is satisfactory in that it supports the main argument
of this study.
Stellenbosch University http://scholar.sun.ac.za

185
Hope
ξ1
Optimism
1
Eng
2
Self-efficacy
ξ2
Gratitude
ξ4
NA
5
POS
3
Psychological
Ownership
4
EWB
7
PWBW
8
Figure 4.11: Steyn-Boers structural model of psychological well-being at work
PA
6
.600 -.506
.899
.758
.946
.285
.348
.656
.724
.601 .228
.237
Resilience
ξ3
.141
Stellenbosch University http://scholar.sun.ac.za
Stellenbosch University http://scholar.sun.ac.za

186
4.5 SUMMARY The purpose of this chapter was to discuss the research results obtained in this study. The
analyses of the data were discussed, which included the steps that were followed to derive
the final modified structural model. In the final chapter of this thesis the results will be
discussed, as well as the limitations of the study and recommendations for future research.
Stellenbosch University http://scholar.sun.ac.za

187
CHAPTER 5
DISCUSSION AND CONCLUSION
5.1 INTRODUCTION
The research findings of this study were presented in chapter 4. In this final chapter of the
thesis, an overview of the study will firstly be provided. This will be followed by a discussion
of the results. The main limitations of the study will also be addressed, accompanied by
recommendations for future research in this particular field. The chapter will conclude with
the implications that the findings in this study could have for practitioners in the I/O
Psychology field.
5.2 BACKGROUND OF THIS STUDY
The focus of well-being has shifted in recent years from minimising the incidences of work
performance pathology, to focusing more on actively promoting employee well-being. The
aim of this approach is to ensure the optimal functioning of employees and to motivate them
to strive towards self-actualisation. The approach has thus shifted away from a “fix what’s
wrong” approach to developing a more “build what’s right” approach (Seligman, 2003).
Donaldson and Ko (2010) stated that this is the reason that the business world needs to turn
to positive psychology which can help them deal more effectively with human flourishing and
human strengths. It is argued here that positive psychology and POB should be applied in
organisations to develop a pro-active approach to well-being in the workplace.
The well-being of employees is not a random occurrence, but rather a complex
phenomenon. Any attempt to influence or change employee well-being should be grounded
in a firm understanding of the complexity of the well-being phenomenon. This presupposes
an understanding of the nomological network of the latent variables which characterises the
person and the perceived environment in which they operate.
Steyn (2011) developed a Salutogenic Model of Occupational Well-being in an attempt to
depict how positive psychology variables can be combined in a dynamic depiction of the
nomological net of variables underlying the phenomenon of Occupational Well-being. The
Steyn (2011) study was grounded in the POS paradigm. The rationale for her study was that
state-like Optimism and Self-efficacy will have a significant and direct positive effect on
perceived Psychological Health. The relationships between Optimism (measured with the
Life Orientation Test-Revised; Scheier, et al., 1994), Self-efficacy (measured with the
General Self-efficacy Scale; Sherer, et al., 1982) and Occupational Health (measured with
Stellenbosch University http://scholar.sun.ac.za

188
the GHQ-28; Goldberg, 1972); and an adapted version of Diener et al., (1985) Satisfaction
with Life Scale, was furthermore hypothesised to be reinforced through indirect associations
that act through a combination of Work Engagement (measured with the Utrecht Work
Engagement Scale, Schaufeli & Bakker, 2003) and Organisational Commitment (measured
with the Organisational Commitment Questionnaire, Mowday, et al., 1979). The Steyn (2011)
study thus proposed that those individuals who are optimistic and self-efficacious would
experience higher levels of Occupational Well-being (defined as Psychological Health and
Satisfaction with Work-Life) than people who are lower on these constructs. It was argued
that this was due to their ability to foster positive expectations about the future and their
heightened sense of Commitment and Engagement (meaning) facilitated by their higher
levels of Optimism and Self-efficacy.
This current study was a first adaptation to the Steyn (2011) model. The adaption and
expansion was motivated by certain limitations posed by the Steyn (2011) study. These
limitations included that Occupational Well-being was defined very narrowly in the Steyn
(2011) study, the results, further, revealed no significant link existed between Self-efficacy
and any of the other included constructs in the model, and that Organisational Commitment
had a very strong link with Work Engagement, which resulted in the decision to omit the
construct (Organisational Commitment) from this study. Moreover, the current study focused
on well-being from a positive perspective and defined it in a more holistic sense by firstly
defining well-being in a context-free manner and then evaluating it in the context of work. As
positive resources play such an important role in establishing well-being, the study further
had a more comprehensive focus on the various positive psychological resources and their
interplay on each other and there contribution to higher levels of well-being.
The aim of the current study was to depict the nomological network of latent variables that
explain variance in the underlying psychological processes of PWBW. SWB was
contextualised within the workplace by Dagenais-Desmarais and Savoie (2012) with the
development of the Index of Psychological Well-being at Work (IPWBW). PWBW is defined
as “a construct describing an individual’s subjective positive experience at work, and
comprise of five primary Eudaimonic dimensions, namely Interpersonal Fit at Work, Thriving
at Work, Feeling of Competency at Work, Perceived Recognition at Work, and Desire for
Involvement at Work” (Dagenais-Desmarais & Savoie, 2012, p. 676). Hence, this construct
was included in the adapted Steyn (2011) model, providing a contemporary and
contextualised view of SWB in the workplace. The ultimate goal of being able to explain
variance in PWBW would be to gain a more clear understanding of the complexity of the
nomological net of variables that could help explain the phenomenon of PWBW. Such
Stellenbosch University http://scholar.sun.ac.za

189
knowledge of the complexity of the well-being phenomenon could then be used to influence
the well-being of employees by developing the antecedents of well-being (e.g. PsyCap) or by
managing elements of the work environment. Therefore, such information should assist HR
and line management to rationally and purposefully affect the well-being and subsequent
work behaviour of employees. Psychological health and well-being can then further become
a strategic driver of talent attraction, retention, as well as individual and organisational
performance excellence.
As PWBW is context (i.e. work) specific, a broader understanding of well-being was firstly
introduced in this study, by defining SWB in a context-free manner. It was argued that SWB
would be an important antecedent to domain specific well-being (PWBW) in this study.
Subjective well-being was separated into Hedonic (maximising pleasure and minimising
pain) and Eudaimonic (expression of virtue – doing what is worth doing) components. Rather
than focusing on either one of these views on SWB, Ryan and Deci (2001) as well as other
researchers (Keys, et al., 2002; Keyes & Magyar-Moe, 2003; Lent, 2004), have suggested
that it could be optimal to consider SWB as constituting of both these two constructs, since
each perspective sheds a different light on the construct of SWB.
Psychological Capital, i.e. PsyCap, was defined as an individual’s positive psychological
state of development and include Self-efficacy (having confidence to take on and put in the
necessary effort to succeed at challenging tasks); Optimism (making a positive attribution
about succeeding now and in the future); Hope (persevering towards goals and, when
necessary, redirecting paths to goals) and Resilience (when beset by problems and
adversity, sustaining and bouncing back and even beyond to attain success) (Luthans, et al.,
2007c). Steyn (2011) included Self-efficacy and Optimism in the Salutogenic Model of
Occupational Well-being. Although the Steyn (2011) study didn’t find any support for Self-
efficacy, it was decided to retain the construct and to investigate the Self-efficacy – Well-
being path to determine whether there does exist a link between these variables. Optimism
was also retained to determine if previous findings could be replicated. The model was
further elaborated by the inclusion of Hope and Resilience. It was argued that positive
psychological capital will have a significant and direct positive impact on employees’ SWB,
thereby affecting their Psychological Well-being in the Workplace. These PsyCap constructs
are thus personal resources that individuals could use to buffer against stress and strain and
thereby further lead to increased well-being.
It was further argued in this study that Gratitude (i.e. a generalised tendency to recognise
and respond with grateful emotion to the roles of other people’s benevolence in the positive
Stellenbosch University http://scholar.sun.ac.za

190
outcomes that one obtains) may lead to higher levels of well-being within an individual
(McCullough et al., 2002). Hence, the model was further elaborated with the inclusion of
Gratitude in the nomological net of variables explaining PWBW. As argued in the Steyn
(2011) model, Work Engagement, which is a positive, fulfilling, work-related state of mind
characterised by Vigour, Dedication and Absorption (Schaufeli & Bakker, 2001), can be a
product of the expanded repertoire of positive emotions resulting from the PsyCap variables
and Gratitude, when the Broaden-and-Build theory is applied. Therefore Work Engagement
was retained in the current model.
POS was introduced as a construct explaining employees’ perceptions regarding the extent
to which the organisation values their contribution and cares about their well-being
(Eisenberger et al., 1986). POS is fostered by conditions such as fair treatment and
supervisory support, and can also be seen as a resource that employees can draw from
when dealing with stressful and demanding situations. It was argued that positive emotions,
experienced by those individuals with high PsyCap levels, should translate into better
interpersonal relationships and thereby further establishing a support system which will
contribute to an increased perception of organisational support. The inclusion of POS could
further be explained by Hobfoll’s (1989) COR theory which stipulates that individuals strive to
obtain, retain, protect and foster resources. POS can thus be seen as a resource that will
lead to the accumulation of other resources. Hobfoll (1989) has stated that those individuals
who have more resources are less vulnerable to resource loss and more capable of
resource gain. The Resource Investment principle further stipulates that people must invest
in resources in order to protect against resource loss, recover from losses and ultimately
gain additional resources (Hobfoll, 2002). Therefore it can be argued that POS would assist
with the protection of resource losses and in the attainment of additional resources. It was
further argued that POS would influence Work Engagement (directly), EWB (directly and
indirectly through Work Engagement; and HWB (i.e. indirectly through Work Engagement,
resulting in less NA and more PA). These influences would take place through the
heightened positive state experienced when good interpersonal relationships translate into
emotional and instrumental support in the workplace. POS will thus lead to higher levels of
well-being mainly by the higher levels of Work Engagement caused by the support.
Employees would thus want to organisation to reach their goals and therefore they will be
more Dedicated, which is a core dimension of Work Engagement. Together with an
established support system, it was argued that Psychological Ownership (i.e. the authority to
make decisions and complete a whole task) should empower and motivate employees to
excel in the work environment. This should further translate into better Eudaimonic Well-
Stellenbosch University http://scholar.sun.ac.za

191
being, ultimately resulting in better PWBW (Dagenais-Desmarais & Savoie, 2012). Thus, it
was proposed that hopeful, optimistic, self-efficacious, resilient employees whom show
Gratitude and are engaged in their work; perceive organisational support and have
Psychological Ownership of their jobs, will experience greater levels of PWBW, mediated
through better EWB and HWB (as a combination of more PA and less NA).
The purpose of the arguments presented in this study was to build on the Steyn (2011)
model, and further elaborate on the findings by Steyn (2011) with regards to well-being in the
workplace. The focus was to attempt to obtain a closer approximation of the nomological net
of variables that may explain well-being in the workplace in light of notions on optimal
functioning and personal flourishing. The Positive Organisational Behavior (POB) paradigm,
together with Fredickson’s (2002) Broaden-and-Build theory and the Conservation of
Resource Theory (COR; Hobfoll, (1989) were used to formulate the framework of positive
traits and affective states that was posited to influence the individual experience of well-
being. The effect that the above-mentioned constructs have on PWBW in the workplace was
(i.e. Steyn-Boers Structural Model of Psychological Well-being at Work) proposed and
investigated, which intended to explain the inherent connection and working of the
constructs in relation to each other, in order to attempt to explicate the complexity that
underlies Psychological Well-being in the workplace.
5.3 DISCUSSION OF RESULTS
5.3.1 Measurement Model
After item analyses were conducted on all the measurement instruments, CFA was
performed to test how well the measured variables represent a smaller number of
constructs. Where the interrelationships amongst a set of variables were unclear, EFA was
performed. EFA was thus used to identify the reasons for the poor fitting CFA results.
Following this, the fit of the measurement model of the structural model was analysed to
determine the extent to which the indicator variables successfully operationalised the various
latent variables in the structural model. The overall goodness-of-fit (GOF) was tested via
LISREL 8.8 by making use of structural equation modelling (SEM). The GOF statistics were
interpreted and it was clear that the model did not have a close fit, but that the selection of
indices that were interpreted indicated at least a reasonable to good fitting model. According
to Lance and Vandenberg (2009) it is imperative to realise that the final composite model
(which consists of measurement and structural components) that it tested, is composed of
independent additive non-centrality chi-squares – one for the measurement model and one
Stellenbosch University http://scholar.sun.ac.za

192
for the structural model. That is, the structural model is nested within the measurement
model. Therefore, it has been argued that “it is often the case that the measurement
component of latent variable models fits well and contributes a high proportion of the total
degrees of freedom (i.e. the total number of restrictions imposed). In such cases, the result
is often a well-fitting composite model that masks a poor fitting structural model” (Lance and
Vandenberg, 2009, p. 175). Hence, for the purposes of this research an inverse argument
could be applied. It may, therefore, be argued that a reasonable / good fitting measurement
model, where no close fit has been obtained (as in this study), may be masking the obtained
result of an reasonable fitting composite model (evidenced by the structural model GOF
indices), when in reality very good fit (evidenced in close fit results) of the structural model
components should have been obtained. This may be the case in this research study. This
was empirically investigated through the calculation of the RMSEA of the structural model
component, when the RMSEA of the composite and measurement models have been taken
into account. To conduct this calculation a macro was devised. The factors that were utilised
to achieve the decomposition are listed in table 5.1. The result of the RMSEA for the
structural model component clearly pointed to the fact that it could reasonably be concluded
that the reasonable measurement model fit may be masking possibly good fitting structural
model components (evidenced in the small RMSEA obtained for the structural model
component). However, further replication of the measurement model / structural model on
another sample should be conducted to clarify the current results.
Table 5.1
Decomposition of composite model into measure and structural model components
Hypot S-Bχ2 X2 df cd SD
S-Bχ2
Prob
S-Bχ2 Diff
Prob
Scaled S-
Bχ2 Diff
Prob X2 Diff F0 RMSEA
Comp 1002.77
9
1121.23 476 2.6
61
.0748
Meas 829.125 967.183 429 2.0
21
.0686
Struct 173.654 154.047 47 .6765 227.727 2.04162E-
16
1.52629E-
25
2.6049E-13 .0062
Note: Hypot = Hypothesis; S-BX2, Satorra-Bentler Scaled Chi-square; X2, Normal Theory Chi-square; df, degrees of freedom; cd, divider in the Scaled Satorra-Bentler chi-square statistic S-Bχ2 Diff, Scaled Difference in Satorra-Bentler Chi Square; Prob S-Bχ2 Diff, Probability Sarorra-Bentler Chi Square difference; Prob S-Bχ2 Diff, Probability Normal Theory Chi Square Difference; F0, population discrepancy function; RMSEA, root mean square residuals; Comp, Comprehensive Model; Meas, Measurement Model; Struct, Structural Model.
Stellenbosch University http://scholar.sun.ac.za

193
However, given this limitation, it was concluded that sufficient evidence existed that the
operationalisation of the measurement model was reasonably successful and hence the
structural model was fitted to the data.
5.3.2 Structural Model
The original proposed Steyn-Boers Structural Model of Psychological Well-being at Work
(figure 3.1) was fitted to the data and the initial fit was reasonable to good (as interpreted by
the Hair et al., 2006 guidelines). The unstandardised beta and gamma matrices, however,
revealed that 20 of the 29 original paths were not supported. Moreover, the direction of the
result for one of the significant paths (negative), namely the relationship between Self-
efficacy and Work Engagement (H025), were not in accordance with the hypothesised effect
(positive). No theoretical argument justified this negative relationship and it was decided to
remove this path together with the 20 insignificant paths. The remaining eight paths that
were retained in the first modification of the structural model included: PA positively
influences PWBW (H03); Optimism positively influences PA (H09); Optimism negatively
influences NA (H010); Optimism positively influences EWB (H011); Gratitude positively
influences Optimism (H018); Work Engagement positively influences PA (H022); Hope
positively influences Work Engagement (H027) and POS positively influences Psychological
Ownership (H030).
After the first modification (i.e. deletion of all the non-significant paths, as well as the Self-
efficacy, Work Engagement relationship), the fit of the structural model (model A) was
subsequently re-evaluated. The fit results, although still reasonably well, were slightly poorer
than the original model’s statistics. However, all the paths were found to be significant and
therefore supported. The modification indices (MI’s) for the beta matrix contained the
parameter with the largest MI-value, suggesting that a relationship should be added
depicting the positive influence of Perceived Organisational Support (POS) on Work
Engagement. This was one of the original hypotheses which were previously deleted due to
a lack of support (in the original model). As it was already theorised that this path should be
included, it was found theoretically justifiable to include this path in the modified structural
model (B).
The GOF results for model B, differed marginally from the results of model A, still indicating
reasonable to good fit. The gamma and beta matrices revealed that support was obtained for
all the included paths, whilst the modification indices suggested that the structural model
could be further expanded to improve the fit of the model. The parameter with the highest
MI-value was for the influence of POS on PWBW. This hypothesis was not initially included
Stellenbosch University http://scholar.sun.ac.za

194
in the theorisation of the original model paths, but made theoretical sense (arguments
presented in section 4.5.4 of chapter 4). Therefore, this path was included in the next model.
The modified structural model (model C) yet again obtained marginally better fit than model
B, as was evident from the GOF indices. The model parameters were investigated to
establish whether it could be justified to add paths and thereby improve the fit even more.
The unstandardised beta matrix indicated that a path that had received support up to this
point, namely the path between Positive Affect (PA) and Optimism, was no longer significant.
This path was thus deleted in the subsequent model. The modification indices revealed that
the fit would improve if a path indicating a negative relationship between Resilience and
POS was added into the model. At first, inclusion of the path was considered as it made
theoretical sense to some extent. It was first argued that if employees are resilient, they may
rely on their own inner strength and may unconsciously perceive the organisation not to be
supportive, as this will encourage them to be more Resilient. However, upon further
consideration it was realised that a counter argument could apply. That is, it could be argued
that resilient employees will most probably have a positive mind-set18 and create resources
to help them overcome difficult times. One of these resources may be perceived support
from the organisation or even co-employees, hence, providing a reason to argue that
Resilience and POS may be positively related. Therefore due to lack of other empirical
evidence and the ambiguity of the direction of the relationship (positive or negative) for this
path, it was decided not to include this path in the model. The second highest modification
index revealed that if a path would be included between Self-efficacy and EWB, the fit of the
model would improve. This path was included in the original model and therefore the original
theorisation (presented in section 4.5.5) warranted the justification to include the path in the
modified model.
The fit of the revised model (model D) was re-evaluated and found to be fairly similar to the
previous model (i.e. still reasonable / good fit). The modification indices revealed that the fit
would improve further if a path indicating a positive relationship between Resilience and PA
was added to the model. This hypothesis was not included in the theorisation of the original
model paths as Resilience was seen to rather be a predictor of EWB, given that EWB is
typically experienced when facing with challenges or goal attainment (Ryan & Deci, 2001).
However, a theoretical argument was proposed (arguments presented in section 4.5.6 of
chapter 4), that justified the inclusion of the path in the subsequent model.
18 This argument is supported by die positive manifold of correlations observed in all studies on the PsyCap sub-dimensions (e.g. Gorgens-Ekermans & Herbert. 2013) which indicates that as one of the sub-dimensions (e.g. Resilience) increases, so does the others (e.g. Optimism).
Stellenbosch University http://scholar.sun.ac.za

195
The fit of the revised model (model E) was re-evaluated and again, found to be fairly similar
to the previous model as evidenced from the GOF indices. All the included paths were
supported and found to be statistically significant. The parameter with the highest MI-value
was the same one that emerged in a previous modified model’s gamma matrix, indicating
that a negative path should be added between Resilience and POS. Given the lack of
previous empirical evidence to substantiate the inclusion of this path it was decided, once
again, not to include this path in the subsequent modified model. The next highest MI-value
in the gamma matrix (for model E) was investigated revealing that a path should be added
between Self-efficacy and Psychological Ownership. To theoretically justify the inclusion of
the path it was argued that individuals who have the confidence to execute a given task
(Self-efficacy) will be more prone to eventually developed ownership over the task. Such
individuals will thus come to perceive the task as an extension of their identity (Pierce et al.,
2003). The argument further followed that if an employee has the necessary motivation and
competence to do a certain task, they will identify with the task and this identification process
will lend itself to the formation of Psychological Ownership. It was concluded that the
argument made substantial theoretical sense and the path was included in the subsequent
model (model F).
The fit of the revised model (model F) was re-evaluated and obtained marginally better fit
than model E, as evidenced in the GOF indices. All the included paths were supported and
found to be statistically significant. The parameter with the highest value suggested that if a
path should be added between Perceived Organisational Support (POS) and Negative
Affect, the fit of the model would improve significantly. From a theoretical point this path
made substantial sense (arguments presented in section 4.5.8 of chapter 4). The path was
thus included in the modified structural model (model G).
For model G, the beta matrix revealed that support was not obtained for the recently
included path between POS and NA. The path thus had to be removed. The parameter with
the highest MI-value indicated that a path should be added between Psychological
Ownership and Optimism. In this study, Optimism was defined as a generalised expectancy
that one will experience good outcomes in life. Psychological Ownership (PO) has been
described as “the state in which individuals feel as though the target of ownership or a piece
of that target is theirs” and reflects “an individual’s awareness, thoughts and beliefs
regarding the target of Ownership (Pierce, et al., 2003, p.86). At first it was argued that it
would make sense to include a path between Psychological Ownership and Optimism based
on the COR theory. Ownership would thus be seen as a resource that would allow for the
accumulation of other resources i.e. Optimism. On the other hand it was also argued that
Stellenbosch University http://scholar.sun.ac.za

196
Optimism could be a predictor for PO as people who would expect positive things to happen
to them will experience an enduring positive state and thereby easily develop a sense of
ownership. However, given the lack of empirical evidence to substantiate the inclusion of this
path, as well as the ambiguity of the direction of influence, it was decided not to include this
path in a revised model. The next highest MI-value indicated a possible path that had
previously emerged, suggesting a negative relationship between Resilience and POS. Given
the lack of previous empirical evidence to substantiate the inclusion of this path, it was
decided, once again, not to include this path in the subsequent modified model. By
evaluating the remaining modification indices, it was evident that only one value was larger
than 6.64. This MI indicated that a negative path should be included between Self-efficacy
and PA. A path between Self-efficacy and PA was originally included in the model (H015);
however, the hypothesis was that the constructs should be positively related. From a
theoretical point of view a negative path did not make sense as no logical reasoned
argument, or previous empirical information could be found to justify the inclusion of this
path. It was decided not to include this path in the subsequent model. Therefore, the
statistically insignificant path between Perceived Organisational Support (POS) and
Negative Affect (NA) were deleted and it was concluded that the subsequent model would
be the final model. The modified model (H) was fitted to the data. A visual representation of
the final model can be seen in figure 5.1.
Stellenbosch University http://scholar.sun.ac.za

197
Figure 5.1: Final adapted and tested Steyn-Boers structural model of psychological well-being at work
5.3.3 Main Findings
The results of the final structural model indicated that a multitude of positive psychological
resources play a role in Psychological Well-being at Work. The effect of these resources
(e.g. Optimism), in most cases, were mediated by other resources (POS) to explain PWBW.
The structural model, therefore, attempted to provide a first overview of the nature of the
direct and indirect relationships between the set of variables that were included in this study,
to explain variance in PWBW. However, it was initially proposed that Subjective Well-being
defined as both HWB and EWB, will mostly be influenced directly by positive psychological
resources (Hope, Optimism, Self-efficacy, Resilience, Gratitude), as well as Work
Engagement, POS and Psychological Ownership and thereby lead to higher levels of
PWBW. Although the results provided some support for these direct relationships it was
evident that in most cases, the indirect effects of psychological resources on well-being were
mediated by other factors (e.g. Work Engagement, POS). Moreover, the final model
provided useful knowledge on the fact that different positive psychological resources predict
different aspects of well-being. For example, whilst Optimism were shown to affect HWB and
EWB (directly), Hope and Resilience were shown to be antecedents of only HWB (either
Stellenbosch University http://scholar.sun.ac.za

198
directly and indirectly), whilst Self-efficacy predicted only EWB. The main results will be
discussed in this section.
5.3.3.1 Psychological Well-being at Work
It was initially hypothesised that both SWB components (i.e. EWB as well as PA and NA)
would directly influence PWBW. However, given the conceptual overlap between EWB and
the Eudiamonic dimensions of PWBW, it was expected that EWB would be a stronger
predictor of PWBW than the Hedonic well-being components. Dagenais-Desmarais and
Savoie (2012) confirmed that the PWBW construct carry a strong Eudaimonic connotation
with themes like congruence and self-realization.
The results of the current study revealed that PA was a significant contributor to PWBW, but
not EWB. The lack of support for the EWB-PSWB path was suprising, as strong empirical
support for this relationship was anticipated. Dagenais-Desmarais and Savoie (2012),
however, found similar results in their analysis regarding the relationships between PWBW,
EWB and HWB. In their study it was firstly found that PA correlated the strongest with
PWBW (.526), while NA had a slightly less strong correlation of .357 with PWBW. Secondly,
it was determined that when EWB, PA and NA were put in a regression analysis to
determine PWBW, PA was a stronger predictor than EWB (both were significant) and NA
was not a significant predictor at all. These results correspond with the results in the current
study as (1) NA was not a significant predictor of PWBW when PA was also included in the
model, which is similar to what Dagenais-Desmarais and Savoie (2012) found and (2) EWB
is a weaker predictor of PWBW than PA. This was replicated, to a certain extent, in the
current study, as EWB did not emerge as a significant predictor of PWBW. In this study, PA
emerged as the strongest direct predictor of PWBW, which was also found in the Dagenais-
Desmarais and Savoie (2012) study.
The strong link between PA and PWBW can be accounted for by applying Fredrickson
Broaden-and-Build theory (Fredrickson & Joiner, 2002), where positive emotions broaden a
person’s thought-action repertoire, encouraging them to discover novel lines of thought or
action. A key, incidental outcome of these broadened mind-sets is an increase in personal
resources: as individuals discover new ideas and actions, they build their resources.
Experiments have also shown that positive emotions produce patterns of thought that are
notably unusual, flexible, creative and receptive (Isen, 1987). In more general terms, positive
emotions “enlarge” the cognitive context, an effect linked to increases in brain dopamine.
Therefore, it could be argued that an increase in PA will lead employees to experience more
PWBW as the upward spiral will assist them to accumulate more resources, which will result
Stellenbosch University http://scholar.sun.ac.za

199
in them experiencing Interpersonal Fit at work, Thriving at Work, Feeling of Competency at
Work, Perceived Recognition at Work and a Desire for Involvement at Work.
POS emerged as a second direct predictor for PWBW, with a completely standardised beta
coefficient of .285. The path between POS and PWBW was not included in the initial
proposed model. However, the support received for the path in the final model highlighted
the importance of the antecedent role of POS in the experience of PWBW. Employees
regard the organisation as an important source of socio-emotional resources, such as
respect, caring and tangible benefits i.e. wages and medical benefits. According to
Eisenberger et al., (1986) employees’ needs for approval, esteem and affiliation would be
satisfied if employees perceive the organisation to care about them. This will lead employees
to want to give back to the organisation and thereby take an active interest in the regard with
which they are held by the employer (Eisenberger, et al., 1997; Eisenberger et al. 1986;
Rhoades & Eisenberger, 2002). Therefore, when employees experience POS the results
suggest that more PWBW would be experienced. For example, such individuals may
experience an elevated Desire for Involvement at Work, i.e. will to involve oneself in the
organisation and to contribute to its good functioning and success; and possibly more
Perceived Recognition at Work, i.e. perception of being appreciated within the organisation
for one’s work and one’s personhood (Dagenais-Desmarais & Savoie, 2012). A further
possible explanation for the path lies within the notion that receiving social support is a
phenomenon embedded in the broader context of an individual’s supportive exchange
relationships (Väänänen, Buunk, Kivimaki, Pentti & Vahtera, 2005). Research based on this
explanation has focused on the degree of balance between receiving and giving support,
suggesting that the effectiveness of receiving social support is perceived as reciprocal (i.e.,
receiving and giving equal amounts of support) or either under-reciprocating (i.e. giving more
support than receiving) or over-reciprocating (i.e., receiving more support than giving) (Rook,
1987). Therefore, drawn from COR theory, it could be argued that receiving organisational
support will be associated with better well-being to the extent that it is received in the context
of an exchange pattern that maximises the resource gain while minimising the resource loss
associated with being a recipient. COR theory proposes that people’s well-being (e.g.
PWBW) is dependent upon their sense of access to resources (e.g. POS) within their
environment (Hobfoll, 1989).
Hope and Optimism emerged as indirect predictors of PWBW. The path of Hope on PWBW
was mediated through Work Engagement and PA, whilst the path of Optimism on PWBW
was mediated through POS, as well as the Work Engagement, PA path. These findings,
again, can be explained by the Broaden-and-Build theory as the individuals who have
Stellenbosch University http://scholar.sun.ac.za

200
positive resources will use it to expand their momentary thought-action repertoires and build
their enduring personal resources, which according to Fredrickson (2001) will range from
physical and intellectual resources to social and psychological resources. In addition,
induced positive emotions increase one’s preferences for variety and broaden one’s arrays
of acceptable behavioural options. In this sense it could be said that the individual high on
Hope and Optimism, will use these resources to build other enduring personal resources,
where POS can be seen as a social resource and Work Engagement as a psychological
resource. These enduring psychological resources will lead to increased levels of PWBW,
either directly or through increased experiences of PA.
Apart from the PsyCap resources, it was originally also hypothesised that Work
Engagement, POS and PO would all affect PWBW through EWB. For example it was argued
that a healthy culture of caring and respect in an organisation, i.e. POS, will have a
beneficial effect on feelings of justice and recognition leading to increased psychological
well-being. It was furthermore argued that POS could be linked to certain EWB dimensions,
in that if employees perceive support from the organisation they will feel more confident and
thereby become more independent, leading to increased levels of Autonomy. POS would
then, further, indirectly, through EWB, influence PWBW in the sense that it contributes to, for
example, Desire for Involvement at Work, i.e. will to involve oneself in the organisation and
to contribute to its good functioning and success. Therefore, it was proposed that POS would
influence PWBW through the mediator, EWB. The results revealed that POS directly
influenced PWBW. It could be argued that this may be, partially, accounted for by the
absence of support for the EWB, PWBW relationship in the current model.
Similar arguments were put forth for Work Engagement and Psychological Ownership and
their relationships with EWB and PWBW. Unfortunately, no empirical support was found for
any of these paths. It was rather disappointing that the Psychological Ownership, EWB
relationship did not receive support, as it suggests that Psychological Ownership is not
directly related to EWB. The arguments for this relationship entailed that the feelings of
ownership should create a sense of responsibility which will lead employees to “to do what is
right and virtuous” and to allow them to discover “meaning and self-actualisation (Ryna and
Deci, 2001). Psychological Ownership could, furthermore, be linked to some of Ryff’s EWB
dimensions, such as Purpose in Life, in that the work would acquire existential significance
or purpose that trigger active participation. A possible explanation for why the PO, well-being
relationship did not receive substantial support could be the fact that PO is not an
antecedent of well-being, but rather a dimension of well-being in itself. This can be argued
by the fact that the target of PO, i.e. the job or task at hand, becomes more than the object
Stellenbosch University http://scholar.sun.ac.za

201
or the idea itself, it becomes part of the extended self. From a psychological perspective,
possessions play a vital role within the identity of people (Pierce et al., 2001). Feelings of
ownership generates a positive and enriching effect (Formanek, 1991). It enhances our
sense of identity and belonging, which, according to Seligman (1991) has a positive impact
on our well-being. Accordingly, it could be argued that PO is possibly an end state in itself
comprising a unique dimension of well-being. This argument should be explored in future
studies.
5.3.3.2 Hedonic Well-being
The Hedonic approach to well-being utilised in this study was fairly similar to the Diener et
al., (1999) definition of SWB, stating that it comprises of high Positive Affect, low Negative
Affect and life satisfaction. In this study it was hypothesised that those constructs that would
have a positive effect on PA, would at the same time have a negative effect on NA. This
was, however, not the case.
The results suggested that it did not make theoretical sense to argue that those constructs
that would lead to an increase in PA will also lead to a decrease in NA (Hope, Optimism,
Self-efficacy and Gratitude). Hope, for example had an indirect effect on PA through Work
Engagement, but no effect on NA. Optimism had a direct negative effect on NA, and only an
indirect effect on PA though POS and Work Engagement. Gratitude had an indirect effect on
NA through Optimism, as well as an indirect effect on PA through Optimism, POS and Work
Engagement. Resilience, although it was hypothesised that it would not affect HWB,
emerged as a direct predictor of PA. A possible explanation of these results is perhaps
embedded in the nature of the PA and NA constructs. It has been argued that PA and NA
are not the opposing ends of one continuum, but in fact two fairly separate constructs. This
claim has been substantiated by investigating the correlation between these two constructs.
Petrie et al., (2012) revealed that the two scales (PA and NA) are minimally correlated with
each other (r = - .05 to – .35), suggesting that they indeed measure separate constructs.
Therefore it could be argued, in hindsight, that both would have a different set of
antecedents, as evidenced through the results obtained in this study. These results,
therefore, provided valuable insights into the nature of the predictors of the two different
components of HWB included in this study.
The final structural model results revealed that Work Engagement was a very strong direct
predictor of PA, with a completely standardised beta coefficient of .899. Bakker (2009)
revealed in a study that PA is correlated with high levels of activation such as Work
Engagement. Therefore, it could be argued that the positive emotions underlying Work
Stellenbosch University http://scholar.sun.ac.za

202
Engagement will most probably lead to elevated levels of PA (Bakker, 2009). Taking the
core definitions and subscales of Work Engagement into account, it would make sense that
Work Engagement is one of the predictors of PA. Work Engagement, according to Schaufeli
and Bakker (2001) is a positive, fulfilling, work-related state of mind that can be
characterised by Vigour, Dedication and Absorption. It is a persistent and pervasive
affective-cognitive state that is not focused on any particular object, event, individual or
behaviour. It was further defined as a desirable condition with organisational purpose which
suggests involvement, commitment, passion, enthusiasm, focused effort, and energy
(Schaufeli & Bakker, 2001). The PANAS was used to measure PA. Some of the words that
reflected PA were “interested”, “enthusiastic”, “alert”, “inspired” and “attentive” (Wastson et
al., 1988). What could be deduced from the results is that Work Engagement’s underlying
positive, full-filling component will lead to an increase in the experience of PA.
Resilience was the other direct predictor of PA. Resilience was defined as the positive
psychological capacity to rebound, to bounce back from adversity, uncertainty, conflict,
failure or even positive change, progress and increased responsibility (Luthans, 2002a). It is
thus an inner psychological strength that individuals use when they are in a difficult or
challenging situation. Although this path between Resilience and PA was not included in the
original model, the modification indices revealed that this path should be added into the
model. In hindsight it could be argued that if an individual has the ability to bounce back from
adversities, positive emotions would most probably result from this. Support for this
argument was, for example, found in research evidence that suggest when bereaved
individuals exhibit genuine laughs speaking about their sadness, they show better
adjustment (Bonanno & Keltner, 1997). Fredrickson et al., (2003) demonstrated that the links
between measures of Resilience and adjustment following the 9/11 attacks were mediated
by the experience of positive emotions (e.g. gratitude, interest, love). Fredrickson (2000)
states that one way people experiences positive emotions in the face of adversity is by
finding positive meaning in ordinary events and within the adversity itself. The link between
Resilience and PA can also be explained by COR theory (Hobfoll, 1989). In this sense,
individuals with more Resilience (resource), seems to report more PA (resource), which then
influence their PWBW. It can also be explained by the Broaden-and-Build theory
(Fredrickson, 2001) where Resilience will broaden attention and cognition which could
enable flexible and creative thinking leading to increased PA.
The results revealed that Hope and POS had direct effects on Work Engagement (.600 and
.348). Therefore, the psychological resources of Hope and POS indirectly affected PA with
Work Engagement as a mediator in this relationship. Hope has been defined by Snyder
Stellenbosch University http://scholar.sun.ac.za

203
(2002, p.250) as “a positive motivational state that is based on an interactively derived sense
of successful (a) agency (a sense of willpower, or determination to begin and maintain the
effort needed to achieve goals) and (b) pathways (a sense of waypower, or belief in one’s
ability to generate successful plans and alternatives when obstacles are met in order to
achieve goals).” Work Engagement is assumed by many authors to be the opposite of
burnout (e.g. Maslach & Leiter, 1997; Schaufeli & Bakker, 2001). Maslach and Leiter (1997)
assumed that Work Engagement is characterised by energy, involvement and efficacy which
are considered the direct opposites of the three burnout dimensions exhaustion, cynicism
and lack of professional efficacy, respectively. Bakker et al., (2003) describes in the Job-
Demand Resource model that although these two constructs are highly negatively
correlated, they are evoked by two distinct processes, named energetic process and
motivational process, which stem from demands and resources inherent in every job. The
energetic process refers to the negative demanding aspects of work that employees may
sometimes experience as so strenuous and depleting that they lead to stress, and eventually
to burnout (Demerouti et al.,2001). These negative demands can be any physical,
psychological, social or organisational aspect of the job that requires physiological or
psychological effort on behalf of the employee. The demands, which are job and role
specific, are hence associated with a certain level of costs. When these costs become too
high and in the absence of balancing resources, employees cannot cope with them and, as a
consequence, they wear out (Demerouti et al., 2001). This results in burnout and can reduce
employee Work Engagement. Every job has certain resources, whether physical,
psychological, and organisational, that aid employees to carry out their work and that are
intrinsically fulfilling and rewarding, creating a motivational process (Schaufeli & Bakker,
2004). Based on the results found in this study, it is argued here that Hope is one such
psychological resource. The results suggest that Hope my help counterbalance the job
demands and help employees to cope with the occasionally consuming aspects of their
work, thereby buffering against the negative effect of demands on well-being and the costs
associated with them. Consequently, as empirical research suggests, job related resources
(i.e. Hope) are positively associated with employee Work Engagement and help prevent
burnout (Schaufeli & Bakker, 2004; Hakanen, et al., 2006). Hope can thus be viewed as a
psychological resource that leads to an increased level of Work Engagement and thereby
increase the well-being of employees.
Perceived Organisational Support (POS) refers to employees’ perception concerning the
extent to which the organisation values their contribution and cares about their well-being
(Eisenberger, et al., 1986). The norm of reciprocity is a key in the POS theory suggesting
Stellenbosch University http://scholar.sun.ac.za

204
that employees who receive favourable treatment from their organisation (increased POS)
would feel an obligation that they should care about the organisation’s benefits and
contribute to the achievement of organisational goals (Gouldner, 1960). Väänänen et al.,
(2005) state that this reciprocal relationship should have a degree of balance between
receiving and giving support. Hereby suggesting that as the support goes up, the effort will
also goes up. The result of the direct effect of POS on Work Engagement obtained in this
study would seem to suggest that employees that report high levels of POS, that would
therefore also experience higher levels of perceived appreciation from fellow colleagues and
the organisation, would report higher Work Engagement levels. These higher levels of Work
Engagement would ultimately influence SWB, by elevating the levels of PA experienced.
The results further revealed that Optimism affected PA indirectly through POS and Work
Engagement. A similar finding was reported in the Steyn (2011) study. Steyn (2011) found
that Optimism had an effect on Psychological Health and Satisfaction with Work Life,
mediated through Work Engagement. However, Steyn (2011) used the General Health
Questionnaire (GHQ; Goldberg, 1972) to measure Psychological Health, and the
Satisfaction with Life Scale (Diener, et al., 1985), adapted to the Satisfaction with Work-Life
scale to measure Satisfaction with Work-Life. The four subscales of the General Health
Questionnaire measure the degree of somatic symptoms, anxiety and insomnia, social
dysfunction and severe depression (Goldberg & Hillier, 1979). The scale, therefore,
measures the absence of pathologies and do not measure the positive side of well-being.
The adapted Satisfaction with Work-Life scale did, however, measure the positive side of
experienced well-being in the work environment, but cannot be equated to the PA subscale
of the PANAS which tap into positive emotions. Hence, the indirect effect of Optimism on
well-being found in this study was only a partial replication of the Steyn (2011) results, given
that well-being was defined differently in the two studies.
Negative Affect (NA) as the second component of HWB included in this study, was, on the
other hand, only influenced directly by Optimism and indirectly through Gratitude. Neither
Work Engagement nor POS that affected PA was found to predict NA. According to Watson
and Clark (1984) high-NA is characterised by subjective distress and unpleasurable
engagement. PsyCap Optimism is defined as an attributional style and refers to making
internal, relatively stable and global attributions regarding positive events, such as global
achievement, and external, relatively unstable and specific causes for negative events
(Seligman, 1990). Therefore, these results suggests that an optimistic attributional style may
result in less experienced negative emotions and feelings such as guilt, being scared,
hostility, irritability and being afraid. It would, therefore, seem that an optimistic mind-set may
Stellenbosch University http://scholar.sun.ac.za

205
thus act as a resource or buffer “protecting” the individual from such negative emotions. In
addition to the hypothesis that Optimism would directly affect NA, for which support was
found in this study, it was also initially argued that Optimism would directly affect PA. The
current results provided no support for this hypothesis. However, Optimism did affect PA
indirectly through a combination of mediators (i.e. POS and Work Engagement). This
suggests that Optimism is an important psychological resource that acts to affect various
other resources, which ultimately act to increase levels of SWB. This can be explained by
COR theory, which states that having one major resource (in this case Optimism) is typically
linked with having others (Work Engagement / POS, and ultimately better well-being)
(Hobfoll, 1989). The results, however, point to the fact that Optimism was the only
psychological resource that affected NA. This is an interesting finding, which suggests that
from all the psychological resources included in the model (e.g. the other PsyCap variables,
Gratitude), Optimism was the only one that affected both components of HWB. This
reiterates the central role of Optimism – also found in the Steyn (2011) study – in the
nomological net of variables (included in these two studies) that explain well-being in the
workplace. This is in line with other research which has duly recognised the central role that
Optimism play in the establishment of a sense of personal well-being. Steyn (2011), for
example, noted that the most noticeable research area is where Optimism has been
associated with a reduced risk of depression (Alloy, Abrahamson, Whitehouse, Hogan,
Panzarella & Rose as cited in Steyn, 2011) and been shown to buffer against stressful life
events as a result of the effect of positive coping mechanisms (Ellicott, Hammen, Gitlin,
Brown & Jamieson as cited in Steyn, 2011).
Gratitude, which is viewed as mainly an affective state, was defined as a generalised
tendency to recognise and respond with grateful emotions to the roles of other people’s
benevolence in the positive outcomes that one obtains (McCullough, et al., 2002). The
results revealed that Gratitude directly predicted Optimism. This could again be explained by
the Broaden-and-Build theory (Fredrickson 2002) where people with many positive emotions
i.e. Gratitude will expand their repertoire to generate other positive emotions i.e. Optimism. It
can further be linked to the Resource Investment principle which forms part of the COR
theory (Hobfoll, 2001) stipulating that people must invest in resources in order to protect
against resource loss and gain additional resources. Therefore, individuals with greater
resources (e.g. Gratitude) are capable of attaining even more resources (i.e. being
optimistic). Hence it may be concluded that the generalised tendency to recognise and
respond with grateful emotions would thus foster the development of an optimistic mind-set
and thereby enhance SWB through decreasing experienced NA. The magnitude of the
Stellenbosch University http://scholar.sun.ac.za

206
standardised beta coefficient (.946), however, could raise some questions regarding the
discriminant validity of the nature of the Gratitude and Optimism variables, that should be
investigated in future studies.
5.3.3.3 Eudaimonic Well-being
Ryff and Singer (1998) described Eudaimonic Well-being (EWB) as the idea of striving
towards excellence, based on one’s own unique potential. It is further defined as the ultimate
level of functioning and is referred to in terms of optimal functioning, meaning and self-
actualisation (Ryan & Deci, 2000). According to this approach true EWB derives from
personal growth and actively doing what is right and virtuous. Waterman (1993) suggests
that eudaimonia occurs when people’s life activities are most congruent or meshing with
deeply held values and are holistically or fully engaged. The six subscales included in the
EWB measure utilised in this study included Positive Relations with Others, Autonomy,
Environmental Mastery, Self-Acceptance, Personal Growth and Purpose in Life. It was
initially hypothesised that the four PsyCap variables, as well as Work Engagement, POS and
PO would all directly influence EWB. These hypotheses were generated through the
literature review (chapter 2). However, the results revealed that EWB was only influenced
directly by Optimism (.656) and Self-efficacy (.228). Moreover, an indirect effect of Gratitude
on EWB was evident through the mediating effect of Optimism. Optimism, as stated by
Steyn (2011) may also equip individuals with improved cognitive, coping and contextual
resources, and is therefore conducive to Psychological Health, i.e. EWB in the current study.
Optimism can enhance EWB due to the fact that optimistic people are more achievement
oriented in the tasks they execute, feel easy in taking decisions and find better solutions in
handling problems (Powers & Bendall, 2004). They also generally believe people and events
are inherently good so that most situations will work out for the best (Powers & Bendall,
2004). The achievement orientation of these individuals could lead to a sense of mastery
and competence in managing their environments (i.e. the Environmental Mastery component
of EWB). Their ability to more easily make decisions will possibly lead to an increase in
Autonomy (another component of EWB), i.e. being self-determined and independent (Ryff,
1989) and thereby making decisions without being pressured by social forces. Lastly, their
belief that people are inherently good could lead to higher levels of Positive Relations with
Others (another component of EWB) where they form warm satisfying relationships with
others and are concerned about others’ welfare (Ryff, 1989).
In this study PsyCap Self-efficacy was defined as one’s belief of being able to cope with
specific tasks and situational demands. It is generally regarded as the basis of human
agency because of its central role in the self-regulation of motivation through goal challenges
Stellenbosch University http://scholar.sun.ac.za

207
and outcome beliefs. Bandura (1986) further postulates that Self-efficacy operates as a
cognitive mechanism through which perceived controllability reduces stress reaction. Based
on the results of this study, it can be concluded that the central role of self-regulation and
motivation, together with confidence being embedded in the Self-efficacy construct, will lead
to the elevation of EWB. For example, the self-regulation and motivation embedded within
Self-efficacy might lead the individual to make effective use of surrounding opportunities and
should enhance a sense of mastery and competence in managing the environment (i.e. the
Environmental Mastery component of EWB) (Ryff, 1989). It could further lead to Autonomy
as the self-regulation might lead to independence. Individuals might also develop a positive
attitude toward the self; acknowledge and accept multiple aspects of self-including good and
bad qualities i.e., Self-Acceptance (another component of EWB). Self-efficacy equip
individuals with the confidence that they can utilise the necessary skills for coping with
stress, engage in self-regulation and mobilising the resources required to meet situational
demands (Chen et al., 2001). The direct effect of Self-efficacy on EWB (.228) was not
strong, but nevertheless, received sufficient statistical support in this research. This is an
important finding in this study, as Steyn (2011) included the construct in her study, but did
not find any support for the effect of SE on well-being. The nature of the results in this study
suggests that SE predicts a different type of well-being. i.e., EWB, which was not included in
the Steyn (2011) study. EWB is the motivational component of well-being which is described
by Ryan and Deci (2000) as the ultimate level of functioning in terms of optimal functioning
meaning and self-actualisation. Therefore, the lack of results regarding the effect of SE on
well-being in the Steyn (2011) study is partially accounted for in this study. In addition, the
knowledge that SE does in fact affect EWB allows for a closer approximation of the reality of
which latent variables explain variance in the underlying psychological processes of PWBW.
5.3.3.4 Structural Model of Psychological Well-being at Work
Set within the Positive Organisational Behaviour (POB) paradigm, this study attempted to
explicate the arguments that motivated the adaption and expansion of the original Steyn
(2011) Salutogenic Model of Occupational Well-being, into the Steyn-Boers Structural Model
of Psychological Well-being at Work. A nomological net of contributing variables was
therefore proposed and investigated in order to attempt to explicate the complexity that
underlies PWBW.
Drawing from Fredrickson’s Broaden-and-Build theory (1998), it was argued that the
constructs mentioned in this study (Hope, Optimism, Self-efficacy, Resilience, Gratitude,
Work Engagement, POS and Psychological Ownership) on their own, as well as in
conjunction with each other, are rooted in a framework that may elicit positive emotions to
Stellenbosch University http://scholar.sun.ac.za

208
establish and maintain durable, long-term well-being (PA, NA, EWB and ultimately PWBW).
Positive emotions can transform organisations because they expand upon people’s routine
modes of thinking, and in doing so, make organisational members more adaptable,
accommodating, empathic and creative, amongst others (Steyn, 2011). Tugade and
Fredrickson (2004), for example, found that positive emotions may fuel psychological
resilience, build psychological resilience and trigger upward spirals toward enhanced
emotional well-being. The theory makes a bolder prediction that experiences of positive
emotions might also, over time, build psychological resilience and not just reflect it
(Fredrickson, 2004). Furthermore, the complementary upward spiral which occurs through
the experience of positive emotions and broadend thinking is argued to influence one
another reciprocally, leading to substantial increases in emotional well-being over time
(Fredrickson & Joiner, 2002; Fredrickson, 2004; Garland et al., 2010). To the extent that
organisational outcomes are dependent on these individual-level attributes, positive
emotions encountered within organisations may also improve organisational performance
and functioning. Over time, such broadening is argued to build stronger organisational
associations, improved organisational climates and cultures, and exceptional organisational
outcomes (Fredrickson, 2004). Fredrickson (2000) further argue that in the exploration to
find ways of developing positive emotions, it should be noted that emotions cannot be
directly instilled.
Based on the findings presented above, certain fundamental inferences can be made from
the results of this study. A first inference is that reasonable to good / fair model fit was
obtained. This comments on the extent to which the compilation of the model was empirically
validated19. That is, the complexity of PWBW can, to a certain extent, be explained in terms
of the chosen variables and the supported paths between them, implied by the final
structural model. This does not, however, affirm the non-existence of other variables that
may possibly aid in the understanding of the intricacies that underlie an attempt to account
for variance in PWBW.
Secondly, the significant paths in the model divulge important information regarding the
psychological resources believed to exert the greatest influence on Psychological Well-being
within the workplace. PA and POS were the only two direct predictors of PWBW, with PA
being the strongest predictor. Many of the other variables (Hope, Work Engagement, PA,
19 It needs to be emphasised, however, that the model, modified through the modification indices, cannot
strictly claim to be an empirical model. At most, it serves to genereate hypotheses which need to be tested
with a new sample.
Stellenbosch University http://scholar.sun.ac.za

209
Gratitude, Optimism, POS and Resilience) had indirect influences on PWBW. The chain of
variables that influence PWBW is thus a complex one, and cannot be reduced to a few
simple linear explanations.
A third conclusion from the results is that different positive psychological resources have
different effects on different dimensions of well-being. Optimism has direct effects on NA and
EWB, with an indirect effect on PA through POS and Work Engagement. Hope was found to
have an indirect effect on PA through Work Engagement. Self-efficacy directly predicted
EWB and none of the Hedonic components of well-being, whilst Resilience had a direct
positive effect on PA, but not on EWB as was initially hypothesised. Work Engagement was
found to be a significant predictor of PA. Work Engagement was influenced directly by Hope
and POS and indirectly by Gratitude, Optimism and POS. This central role of Work
Engagement in well-being suggests that organisational interventions geared towards
increasing Work Engagement may hold a manifold of positive outcomes for employees’ well-
being. Steyn (2011) also found support for the central role of Work Engagement in well-
being, in her study.
Fourthly, the results suggest that by fostering supportive conditions at work, i.e. POS, well-
being and Work Engagement will be affected in a positive way. The environment in which an
employee works can thus add to the positive working experience and the wellness of the
employee within the workplace. The last important inference that can be made from the
results is that although Psychological Ownership played an important role in the structural
model, the results revealed that it did not affect well-being as defined in this study. A
possible explanation was proposed stating that PO is possibly not an antecedent of well-
being, but rather a dimension in itself in that the feeling of ownership itself plays a vital role in
an individual’s well-being.
It can be concluded that all of the constructs (Hope, Optimism, Self-efficacy, Resilience,
Gratitude, Work Engagement and POS), except for Psychological Ownership, played a
significant role in the structural model, in that it directly and indirectly determined whether an
employee would experience well-being (HWB, EWB and PWBW) in the workplace or not.
Additionally, these constructs were shown to influence each other in a complex manner.
5.4 LIMITATIONS OF THIS STUDY
This study had several limitations which could have affected the overall results and
conclusions about the specific constructs. Although some of the limitations have been
Stellenbosch University http://scholar.sun.ac.za

210
mentioned throughout the chapters, the most important issues will be emphasised in more
depth in this section.
One of the most obvious limitations is the fact that all the data was collected by means of
self-report measuring instruments. According to Babbie and Mouton (2002), this way of data
collection is very often used in social science research, but nevertheless, it poses a few
disadvantages. Firstly, the problem of common method variance exists, in that the
inferences made by the researcher, i.e. the correlation and causal relationships between the
variables in question, may be artificially inflated. Secondly, self-report data can be prone to
response biases from the respondents. One such response bias that is very common is
social desirable responding. This type of bias influence the results of studies, as
respondents tend to create a more favourable view of themselves by over-reporting
admirable attitudes and behaviours and under-report attitudes and behaviours that they view
as less socially acceptable (Zammuner & Galli, 2005). Another common response bias is
acquiescence bias which occurs when a respondent is in agreement with all statements
(Foxcroft & Roodt, 2009). This study relied solely on self-report measures and the results
should be interpreted in terms of this (possible) limitation.
Another limitation related to the original factor structures of three of the instruments that
were utilised in this research. The CFA results for the PANAS, the Gratitude Questionnaire
and Psychological Ownership Questionnaire showed evidence of different factor structures
obtained in the current sample, than what was originally hypothesised by the developers of
the instruments. The dimensionality analysis of the PANAS showed that five factors could be
extracted from the scale. The content of the five factors were investigated to determine
whether the five factors would make theoretical sense. However, no meaningful subthemes
could be established for the five extracted factors. As an alternative an EFA was conducted
where a two factor solution was forced to the data. This explanation made theoretically more
sense as the factor structure was the same as the factor structure of the PANAS. With
regards to the Gratitude Questionnaire (initially proposed to be a uni-dimensional construct),
the positive worded items loaded on one factor and the negatively worded items loaded on
another factor. The results of the Psychological Ownership Questionnaire (also initially
proposed to be a uni-dimensional construct) revealed the items worded in terms of an
individualistic ownership (e.g. This is MY company), loaded on one factor and the items
worded in terms of a collectivistic approach (e.g. This is OUR company) loaded on another
factor. These results influenced the validity of these measures to a certain extent.
Stellenbosch University http://scholar.sun.ac.za

211
With regards to the sample and data collection, some definite advantages and
disadvantages can be acknowledged. Making use of Facebook as a platform to collect data
on a topic such as well-being was beneficial. It allowed the researcher to tap into a pool of
possible participants from various industries and occupations, which would not easily have
been executed by another data collection method. This variety that was obtained further
allowed for less uncontaminated inferences, as the data was not uniformly tainted by
organisational specific factors, such as culture or specific leadership styles embedded within
companies. It could, therefore be argued that the data collection method allowed for more
valid inferences for this universal construct, that is important in all organisations. It also had
the benefit of accumulating a relative large sample in a short period of time. Unfortunately,
there were also certain disadvantages. Due to the demographics of the researchers, a very
specific pool of participants was invited to take part in this study. The sample, therefore, was
restricted in terms of age, geographical residency, level of education and native languages.
The sample is thus not a good representation of the general population in South Africa,
which one would ideally want in a research study like this.
Another limitation relates to the absence of any results regarding the Psychological
Ownership (PO), well-being relationship in this study. It was argued that PO would have a
strong influence on employees’ EWB. The argument that was put forth was that individuals
will evaluate a target more favourable when they own it (Nesselroade et al., 1999). Similarly
those possessions closely integrated with the self tend to be more positively valenced.
Individuals that experience PO will experience the target (i.e. work) as an extension of the
self and therefore feel a sense of responsibility towards the target object (Van Dyne &
Pierce, 2004). Hence, PO towards a target object has psychological and emotional
consequences. According to Formanek (1991), experiencing feelings of ownership produce
a positive and uplifting effect that makes owned objects to be more attractive and favourable.
In context, feelings of ownership are naturally pleasure producing because possession can
result from self-enhancing biases, individual effort, controllability, and approval and
acceptance from others (Pierce, et al., 2003). Feelings of possessions will furthermore
create a sense of responsibility (Van Dyne & Pierce, 2004). It was therefore argued that
when employees feel a sense of PO or possession toward the organisation, work acquires
existential significance that triggers active participation leading to increased EWB. The
argument, unfortunately, did not stand the test. It was, however, argued that a possible
explanation could be that the PO is not an antecedent of well-being, but rather a possible
dimension thereof. The positive and uplifting feeling one feels when experiencing ownership
Stellenbosch University http://scholar.sun.ac.za

212
(Formanek, 1991) could thus a possible additional dimension of well-being. This result
should be further researched in future studies.
Furthermore, there were certain challenges regarding the operasionalisation of the PO
construct that could have influenced the results. Various participants contacted the
researcher to indicate they do not fully comprehend the scale, indicating low face validity. An
alternative would have been to use The Measure of Psychological Ownership in
Organisations, developed by Avey et al., (2009). These authors define Psychological
Ownership in terms of Preventive- and Promotive Psychological Ownership. Preventive
Psychological Ownership is characterised as territoriality. Therefore, when individuals
develop Preventive Psychological Ownership over objects in the organisation including
physical, informational and social objects, they may seek to mark those possessions as
belonging exclusively to themselves. In addition, if individuals anticipate infringement on their
targets of ownership, they may engage in protective territoriality to maintain levels of
ownership and to communicate ownership to potential threats (Avey et al., 2009). Promotive
Psychological Ownership, on the other hand, is promotive in nature and comprises four
distinct, yet related dimensions, namely Self-efficacy, accountability, sense of belongingness
and self-identity (Avey & Avolio 2009). Although this scale was identified and considered for
operationalising the PO construct in this study, it was decided to not use the scale, due to
certain reasons. Firstly, the preventive dimension is defined in a negative way. Psychological
Ownership was included in this study as a possible predictor of well-being. The territoriality
that is included in Avey et al., (2009) measure of Psychological Ownership hold the premise
that there is a negative, possessive element embedded in the construct. It was argued, for
the purposes of this study, that this negativity would not foster conditions for increased well-
being. A further objection was that Self-efficacy is included as a dimension of Promotive
Psychological Ownership. Self-efficacy was already included in the proposed structural
model as one of the PsyCap constructs. Both the Measure of Psychological Ownership in
Organisations and the PCQ-24 were developed by the same authors, i.e. Avey and Avolio.
However, the conceptual distinction of Self-efficacy as a dimension of both these constructs
(PO and PsyCap) was not clear. It was argued, therefore, that if an effect for Self-efficacy
would be found, it might have been because the same construct was measured (by both the
instruments), instead of Self-efficacy actually being a true antecedent of Psychological
Ownership. Therefore, it was decided not to use the Measure of Psychological Ownership in
Organisations to measure PO in this study.
Another limitation of this study could be attributed to the relatively small sample size. This,
together with the fairly homogenous nature of the sample, restricts the generalisability of the
Stellenbosch University http://scholar.sun.ac.za

213
results to larger populations. A greater degree of confidence can be placed in the results of
studies with large sample sizes (Steyn, 2011).
Finally, some authors would argue that the four PsyCap constructs (Hope, Optimism, Self-
efficacy and Resilience) should rather have been included as a higher-order construct (i.e. a
total PsyCap score) in the structural model. The PsyCap construct, developed by Luthans
and colleagues (Luthans, 2002; Luthans & Youssef, 2004; Luthans et al., 2007) as
consisting of the four PsyCap resources of Hope, Optimism, Self-efficacy and Resilience,
have been empirically determined to be a higher-order core construct embedded within the
four sub-dimensions. This higher-order construct thus reflects the shared variance between
the four first-order constructs. Although there are various advantages and disadvantages for
the two options (using the four dimensions of PsyCap separately, or the higher-order
construct), it is argued here that the greatest advantage for including the four PsyCap
dimensions separately into the model was to obtain a better understanding of the
relationships between the four PsyCap constructs and the different dimensions of well-being.
5.6 IMPLICATIONS FOR PRACTICE
Wright (2003) has argued that the mission of POB must include the pursuit of employee
happiness as a viable goal in itself. On the other hand, Zwetsloot and Pot (2004) state that
employee well-being is a business value that is of strategic importance and should be
viewed as an investment and not an expense. Based on these two-perspectives an
integrated business value model of employee well-being should be used that constitutes a
win-win situation for both the organisation and its employees.
The importance of the present study is condensed in the knowledge that there are necessary
antecedents to the management of Psychological Well-being at Work. Hence, it is suggested
that organisations consider the following broad categories to increase the well-being of
employees: (1) create intervention programmes to develop positive psychological capacities
such as Hope, Optimism, Self-efficacy, Resilience and Gratitude, and (2) develop an
organisational culture and environment that fosters a supportive atmosphere. According to
the results obtained in this research these initiatives should increase the levels of Work
Engagement, Psychological Ownership and more importantly, Psychological Well-being at
work. Dagenais-Desmarais and Savoie (2012) suggested that in order to increase PWBW,
HR should create interventions that improve job design (based on the model introduced by
Hackman and Oldham (1976)), that reinforce social relationships at work, that recognise
individual and team contributions, that set challenging performance objectives, and that
Stellenbosch University http://scholar.sun.ac.za

214
develop employee competence. These interventions are very likely to generate an optimal
working experience.
Luthans and Youssef (2004) argue that a sustainable competitive advantage can best be
accomplished through context-specific, cumulative, renewable, thus hard-to-imitate factors
and propose that such advantage can be gained through investing, leveraging, developing,
and managing Psychological Capital (PsyCap). Published research on PsyCap has further
indicated that it is related to multiple performance outcomes in the workplace, lower
employee absenteeism, less employee cynicism and intention to quit, and higher job
satisfaction (Luthans et al., 2007). Besides this positive relationship that PsyCap has with
desired employee outcomes, there are also conceptual (Luthans et al., 2006; Luthans et al.,
2007c) and empirical evidence that PsyCap can be developed. As these constructs are
defined in terms of being state-like, PsyCap has been developed by short training sessions
in both classroom and field settings, as well as electronically through the internet (Luthans,
et al., 2007c). Research has also found PsyCap can be enhanced by a supportive work
climate. Although the empirical research on PsyCap is still emerging, human resource
managers in general can at least be confident that at this stage of the research, PsyCap has
a strong and significant relationship with established desirable outcomes, especially
employee performance (Avey, Reichard, Luthans & Mhatre, 2011). It is therefore concluded
that drawing from the emerging repertoire of positive psychologically-based interventions,
the development of these constructs may yield substantial returns for organisations.
Organisations are beginning to recognise that positive psychology concepts can help them
meet their challenges in today’s turbulent, unpredicted environment. Organisations should
thus take full advantage of developing these positive constructs.
5.5 RECOMMENDATIONS FOR FUTURE RESEARCH
The above discussion evidently stresses the need for continued research in this domain.
From the literature review it became evident that exploring the identified constructs requires
rigorous quantitative research, in order to further this knowledge domain within the
organisational sciences, specifically within the South African context.
In this study the various positive psychological resources obtained significant relationships
with the various components of well-being. It is therefore possible that those relationships
may hold true for future studies using a larger sample. As the social media as means of data
collection was very valuable, it would be recommended that it is also replicated in future
studies. However, it is recommended that researchers experiment with other forms of social
media, for example Linkedin. This website specifically caters for people in the formal job
Stellenbosch University http://scholar.sun.ac.za

215
sector, stating that they are “The world’s largest professional network” (za.linkedin.com).
They thus possibly offer higher credibility in terms of access to an appropriate participant
pool, than Facebook.
Future research could focus on including other positive psychological constructs in the
nomological of variables to explain variance in PWBW. To expand on the spiritual dimension
of well-being, Spirituality or Forgiveness can be included. Forgiveness is defined as an
increase in pro-social motivation toward another so that there is 1) less desire to avoid the
transgressing person and to harm or seek revenge toward that individual, and 2), increased
desire to act positively toward the transgressing person (McCullough, Hoyt, Larsen, Koenig
& Thoreson, 2000). Wisdom is another construct that can be fruitfully applied in follow-up
studies. It can be defined as the “power of judging rightly and following the soundest course
of action, based on knowledge experience, and understanding” (Webster’s New World
College Dictionary, 1997, p. 1533).
It is recommended that in future studies the model should be elaborated by including certain
job characteristics that could play a role in influencing well-being at work. By including the
interaction between personal resources and workplace factors, a more complete picture of
variables that influence well-being in the workplace will be created. This would be in line with
the JD-R model stating that there are certain demands and resources that are in interaction
with one another (Schaufeli & Bakker, 2004). When demands are too high it can reduce an
employee’s Work Engagement. The resources (physical, psychological, social and
organisational) counterbalance the job demands and help employees to cope with the
challenges thereby buffering against the negative effects of job demands (Schaufeli &
Bakker, 2004). Therefore, by including other resources, but also job demand components in
upcoming studies, the complex interplay of variables that underlie variance in Psychological
Well-being at Work can be further unravelled.
5.7 CONCLUSION
The aim of this study was to depict the nomological network of latent variables that explain
variance in the underlying psychological processes of PWBW. Although certain limitations
have been revealed, the study has shown valuable insight into the complexity of the
nomological net that underlies PWBW.
The Positive Organisational Behavior (POB) paradigm, together with Fredrickson’s (2002)
Broaden-and-Build theory and the COR theory (Hobfoll, 1989) were used to formulate the
framework of positive traits and affective states that was posited to influence the individual
Stellenbosch University http://scholar.sun.ac.za

216
experience of well-being. All of the constructs (Hope, Optimism, Self-efficacy, Resilience,
Gratitude, Work Engagement and POS), apart from Psychological Ownership played a
significant role in the structural model, in that it directly and/or indirectly determined whether
an employee would experience well-being (HWB, EWB and PWBW) or not. Additionally,
these constructs were shown to influence each other in a complex manner.
Future studies should be geared to explore ways that organisations can intervene to
increase the levels of employees’ well-being in order for organisations to obtain a
competitive edge and sustainable growth.
REFERENCES Abrams, D., & Hogg, M.A. (2004). Metatheory: Lessons from social identity research.
Personality and Social Psychology Review , 8, 98-106. Albert, S., Ashforth, B. and Dutton, J. (2000). Organizational identity and identification:
Charting new waters and building new bridges. Academy of Management Review, 25(1), 13-17.
Alvaro, C., Lyons, R., Warner, G., Hobfoll, S., Martens, P.J., Labonte, R., & Brown, R.
(2010). Conservation of resources theory as a framework for knowledge translation: an overview of a program of research. Knowledge Utilization Conference, Halifax NS.
Andrews, F.M., & McKennell, A.C. (1980). Measures of self-reported well-being: Their
affective, cognitive, and other components. Social Indicators Research, 8, 127–155. Antonovsky, A. (1979). Health, stress and coping: New perspectives on mental and physical
well-being. San Francisco: Jossey-Bass. Arbuckle, J.L. (2006). Amos (Version 7.0.0) [Computer software]. Spring House, PA:SPSS. Ardrey, R. (1966). The territorial imperative: A personal inquiry into the animal origins of
property and nations. New York: Dells. Argyle, M. (1999). Causes and correlates of happiness. In D. Kahneman, E. Diener, & N.
Schwarz (Eds.). Well-being: The foundations of hedonic psychology (pp. 353- 373). New York: Russell Sage Foundation.
Ashby, F.G., Isen, A.M., & Turken, A.U. (1999). A neuropsychological theory of positive
affect and its influence on cognition. Psychological Review, 106, 529-550. Avey, J.B., Avolio, B.J., Crossly, C.D., & Luthans, F. (2009). Psychological Ownership:
theoretical extensions, measurements and relation to work outcomes. Journal of Organizational Behaviour, 30(2), 173-191.
Avey, J.B., Luthans, F., Smith, R.M., & Palmer, N.F. (2010). Impact of Positive Psychological
Capital on Employee Well-Being over time. Journal of Occupational Health Psychology, 15(1), 17-28.
Stellenbosch University http://scholar.sun.ac.za

217
Avey, J.B., Reichard, R.J., Luthans, F., & Mhatre, K.H. (2011). Meta-analysis of the impact
of positive psychological capital on employee attitudes, behaviors, and performance. Human Resource Development Quarterly , 22 (2), 127-152.
Avey, J.B., Wernsing, T.S., & Luthans, F. (2008). Can positive employees help positive
organization change? Impact of psychological capital and emotions on relevant attitudes and behaviors. Journal of Applied Behavioral Science, 44, 48–70.
Babbie, E. & Mouton, J. (2002). The practice of social research. Oxford: O.U.P. Bagozzi, R. P.& Yi, Y. (2012) 'Specification, evaluation, and interpretation of structural
equation models', Journal of the Academy of Marketing Science, 40, 8-34. Bakker, A.B. (2009). Building engagement in the workplace. In R. J. Burke & C.L. Cooper
(Eds.), The peak performing organization (pp. 50-72). Oxon, UK: Routledge. Bakker, A.B., & Demerouti, E. (2007). The Job Demands-Resources model: State of the art.
Journal of Managerial Psychology, 22, 309-328. Bakker, A.B., & Demerouti, E. (2008). Towards a model of work engagement. Career
Development International, 13, 209-223. Bakker, B., Euwema, C.F., & van Dierendonck, A. (2003). Job resources foster engagement
and motivation to change. Manuscript in preparation. Bandura, A. (1977). Social Learning Theory. New York: General Learning Press. Bandura, A. (1986). Social Foundations of Thought and Action. Englewood Cliffs, NJ:
Prentice-Hall. Bandura, A. (1997). Self-efficacy: The exercise of control. New York: Freeman. Bandura, A., & Locke, E. A. (2003). Negative self-efficacy and goal effects revisited. Journal
of Applied Psychology, 88(1), 87-99. Bertocci, P. A. & Millard, R.M. (1963). Personality and the Good: Psychological and Ethical
Perspectives. McKay: New York. Blau, P. (1964). Exchange and power in social Life. New York: John Wiley. Block, J., & Kremen, A.M. (1996). IQ and ego-resiliency: Conceptual and empirical
connections and separateness. Journal of Personality and Social Psychology, 70(2), 349-361.
Bonanno, G.A., & Keltner, D. (1997). Facial expressions of emotion and the course of
conjugal bereavement. Journal of Abnormal Psychology, 106, 126– 137. Bowlby, J. (1980). Loss: Sadness and Depression: Attachment and loss. New York: Basic
Books. Britt, T.W., Adler, A.B., & Bartone, P.T. (2001). Deriving Benefits from Stressful Events: The
role of engagement in meaningful work and hardiness. Journal of Occupational Health Psychology, 6, 53–63.
Stellenbosch University http://scholar.sun.ac.za

218
Brown, M. W., & Cudeck, R. (1993). Alternative ways of assessing model fit. In K. A. Bollen
& J. S. Long (Eds.), Testing structural equation models. Newbury Park: Sage Publications.
Bryant, F. B., & Cvengros, J. A. (2004). Distinguishing hope and optimism: Two sides of a
coin, or two separate coins? Journal of Social and Clinical Psychology, 23, 273-302. Bryant, F.B. (1989). A four-factor model of perceived control: Avoiding, coping, obtaining,
and savoring. Journal of Personality, 57, 773-797. Bryman, A., & Bell, E. (2003). Business Research methods. Oxford University Press Inc:
New York. Byrne, B.M. (1998). Structural equation modelling with LISREL, PRELIS, and SIMPLIS:
Basic concepts, applications, and programming. Mahwah: Lawrence Erlbaum. Cameron, K.S., Dutton, J.E., & Quinn, R. E. (2003). Positive Organisational Scholarship.
San Francisco: Berret-Koehler. Campbell, A., Converse, P.E. & Rodgers, W.L. (1976) The quality of American life:
perceptions, evaluations and satisfactions Russel Sage Foundation, New York USA. Carver, C. S. (2006). Approach, avoidance, and the self-regulation of affect and action.
Motivation and Emotion, 30, 105-110. Carver, C.S., & Scheier, M.F. (1999) Themes and issues in the self-regulation of behaviour.
In R.S. Wyer, JT. (Ed.) Advances in social cognition (Vol. 12). Mahwah, NJ: Lawrence Erlbaum.
Carver, C.S., & Scheier, M.F. (2002). Optimism. In C.R. Snyder & S.J. Lopez (Eds.),
Handbook of positive psychology (pp. 231- 243). Oxford: Oxford University Press. Carver, C.S., & Scheier, M.F. (2004). Perspectives on personality (5th Ed.). Boston, MA:
Allyn & Bacon. Carver, C.S., & Scheier, M.S. (2005). Optimism. In C.R Snyder & S.J Lopez (Eds.),
Handbook of positive psychology (231-243). New York: Oxford University Press. Carver, C.S., Smith, R.G., Antoni, M.H., Petronis, V.M., Weiss, S., & Derhagopian, R.P.
(2005). Optimistic personality and psychosocial well-being during treatment predict psychosocial well-being among long-term survivors of breast cancer. Health Psychology, 24, 508-516.
Cattell, R. B. (1956). Validation and intensification of the sixteen personality factors
questionnaire. Journal of Clinical Psychology, 12, 205-214. Cattell, R. B., & Burdsal, C. A., Jr. (1975). The radial parcel double factoring
design:Asolution to the item-vs-parcel controversy. Multivariate Behavioral Research, 10, 165-179.
Chen, G., Gully, S. M., & Eden, D. (2001). Validation of a new general self-efficacy scale.
Organizational Research Methods, 4(1), 62-83. Cohen, S. (2004). Social relationships and health. American Psychologist, 59, 676–684.
Stellenbosch University http://scholar.sun.ac.za

219
Compton, W.C., Smith, M.L., Cornish, K.A., & Qualls, D.L. (1996). Factor structure of mental
health measures. Journal of Personality and Social Psychology, 71, 406-413. Costa P.T., & McCrae R.R. (1980) Influence of Extraversion and Neuroticism on subjective
well-being: happy and unhappy people. Journal of Personality and Social Psychology, 38, 668 -678.
Cotton, P., & Hart P.M. (2003). Occupational wellbeing and performance: A review of
organisational health research. Australian Psychologist, 38(2), 118-128. Coutu, D. L. (2002). How Resilience works. Harvard Business Review, 80(3), 46-55. Cozzarelli, C. (1993). Personality and self-efficacy as predictors of coping with abortion.
Journal of Personality and Social Psychology, 65, 1224–1236. Crawford, J.R., & Henry, J.D. (2004). The positive and negative affect schedule (PANAS):
construct validity, measurement properties and normative data in a large non-clinical sample. British Journal of Clinical Psychology, 43, 245-265.
Cropanzano, R., & Wright, T.A. (1999). A 5-year study of change in the relationship between
well-being and job performance. Consulting Psychology Journal: Practice and Research, 51(4), 252-265.
Csikszentmihalyi, M. (1975). Beyond Boredom and Anxiety: Experiencing Flow in Work and
Play. San Francisco: Jossey-Bass. Csikszentmihalyi, M. (1990). Flow: The Psychology of Optimal Experience. New York:
Harper and Row. Culbertson, S.S., Fullagar, C.J., & Mills, C.J. (2010). Feeling good and doing great: the
relationship between psychological capital and well-being. Journal of Occupational Health Psychology, 15(4), 421 – 433.
Dagenais-Desmarais, V. & Savoie, A. (2012). What is Psychological Well-Being, Really? A
Grassroots Approach from the Organizational Sciences. Journal of Happiness Studies, 13, 659 -684.
Darling, F. F. (1939). A naturalist on Rona. New York: Clarendon Press. Davis, O.C. (2010). Using waiting time well: Toward a theory of microflow. (Doctoral thesis,
Claremont Graduate University, 2010). Thesis Abstracts International, 72, 1. Demerouti, E., Bakker, A.B., De Jonge, J., Janssen, P.P.M., & Schaufeli, W.B. (2001).
Burnout and engagement at work as a function of demands and control. Scandinavian Journal of Work Environment and Health, 27(4), 279-286.
DeNeve, K.M., & Cooper, H. (1998). The happy personality: A meta-analysis of 137
personality traits and subjective well-being. Psychological Bulletin, 124, 197–229. Diamantopoulos, A. and Siguaw, J.A. (2000), Introducing LISREL. London: Sage
Publications. Diener, E. (1984). Subjective well-being. Psychological Bulletin, 95, 542-575.
Stellenbosch University http://scholar.sun.ac.za

220
Diener, E. (2000). Subjective well-being: The science of happiness, and a proposal for a
national index. American Psychologist, 55, 34–43. Diener, E. (2009). Subjective Well-Being. In E. Diener (Ed.) The Science of Well-Being (Vol.
37, pp. 11-58). New York: Springer. Diener, E., & Fujita, F. (1995). Resources, personal strivings and subjective well-being: A
nomothetic and idiographic approach. Journal of personality and Social Psychology, 68, 926 -935.
Diener, E., Colvin, C.R., Pavot, W.G., & Allman, A. (1991). The psychic costs of intense
positive affect. Journal of Personality and Social Psychology, 61, 492-503. Diener, E., Emmons, R.A., Larsen, R.J. & Griffin, S. (1985). The satisfaction with life scale.
Journal of Personality Assessment, 49, 71-75. Diener, E., Gohm, C., Suh, E., & Oishi, S. (1998). Similarity of the relations between marital
status and subjective well-being across cultures. Journal of Cross-Cultural Psychology, 31(4), 419-436.
Diener, E., Scollon, C.N., & Lucas, R.E. (2003). The evolving concept of subjective well-
being: The multifaceted nature of happiness. Advances in Cell Aging and Gerontology, 15, 187–219.
Diener, E., Suh, E., Lucas, R. E., & Smith, H. (1999). Subjective wellbeing: Three decades of
progress. Psychological Bulletin, 125, 276-302. Donaldson, S., & Ko, I. (2010) Positive Organizational Psychology, Behavior, and
Scholarship: A Review of the Emerging Literature and Evidence Base. The Journal of Positive Psychology, 5 (3), 171 – 199.
Duncan, N. G. (1981). Home ownership and social theory. In J. S. Duncan (Ed.), Housing
and Identity:Cross-cultural Perspectives (pp. 98-134). London: Croom Helm. Dyer, J.G., & McGuinness, T.M. (1996). Resilience: Analysis of the concept. Archives of
Psychiatric Nursing, 10(5), 276–282. Eisenberger, R., Cummings, J., Armeli, S., & Lynch, P. (1997). Perceived organizational
Support, Discretionary Treatment, and Job Satisfaction. Journal of Applied Psychology, 82, 812-820.
Eisenberger, R., Huntington, R., Hutchison, S., & Sowa, D. (1986). Perceived organizational
support. Journal of Applied Psychology, 71, 500-507. Emmons, R.A. & McCullough, M.E. (2003). Counting blessings versus burdens: An
experimental investigation of gratitude and subjective well-being in daily life. Journal of Personality and Social Psychology, 84, 377-389.
English, A.D. (2001). When personality traits need a frame of reference: Enhancing the
predictive validity of non-cognitive measures. Thesis Abstracts International, 64(11), 5829.
Stellenbosch University http://scholar.sun.ac.za

221
Feasel, K.E. (1995). Mediating the relations between goals and subjective well-being: Global and domain specific variations of self-efficacy. Journal of Personality and Social Psychology 85, 41-48.
Field, A. (2005). Discovering statistics using SPSS (2nd ed.). Thousand Oaks, CA: Sage. Fisher, C. D. (2010). Happiness at work. International Journal of Management Reviews,
12(4), 384-412. Fisher, C.D. (2003). Why do lay people believe that satisfaction and performance are
correlated? Possible sources of a commonsense theory. Journal of Organizational Behavior, 24, 1–25.
Formanek, R. (1991). Why they collect: Collectors reveal their motivations. In F. W. Rudmin
(Ed.), To have possessions: A handbook on ownership and property. Special Issue, Journal of Social Behavior and Personality, 6(6), 275-286.
Foxcroft, C., & Roodt, G. (2009). Introduction to psychological assessment. Oxford
University Press: Southern Africa. Fredrick, S., & Loewenstein, G. (1999). In D. Kahneman, E. Diener & N Schartz (Eds). Well-
Being: The Foundations of Hedonic Psychology. (pp. 302-329). New York: Russell Sage Foundation Press.
Fredrickson, B.L. (1998). What good are positive emotions? Review of General Psychology,
2, 300-319. Fredrickson, B.L. (2001). The role of positive emotions in positive psychology: The broaden-
and-build theory of positive emotions. American Psychologist, 56, 218-226. Fredrickson, B.L. (2003). The value of positive emotions. American Scientist, 91, 330- 335. Fredrickson, B.L. (2004). The broaden-and-build theory of positive emotions. Philosophical
transactions of the Royal society of London Series B – biological sciences, 359, (1449), 1367 – 1377.
Fredrickson, B.L., & Joiner, T. (2002). Positive emotions trigger upward spirals toward
emotional well-being. Psychological Science, 13, 172–175. Fredrickson, B.L., Tugade, M.M., Waugh, C.E., & Larkin, G.R. (2003). What good are
positive emotions in crisis? A prospective study of resilience and emotions following terrorist attacks on the United States on September 11th 2001. Journal of Personality and Social Psychology, 84(2), 365-376.
Fritz, B., & Avsec, A. (2007). The experience of flow and subjective well-being of music
students. Horizons of Psychology, 16(2), 5-17. Fromm E. (1981). Primary and secondary process in waking and in altered states of
consciousness. Academic Psychological Bulletin, 3, 29-45. Fry, P.S. (1995). Perfectionism, humor, and optimism as moderators of health outcomes and
determinant of coping styles of women executive. Genetic, Social and General Psychology Monograph, 121, 213-245.
Stellenbosch University http://scholar.sun.ac.za

222
Fujita, F. (1991). An investigation of the relation between extroversion, neuroticism, positive affect, and negative affect. Unpublished master’s thesis, University of Illinois at Urbana-Champaign.
Furby, L. (1978). Possession in humans: an exploratory study of its meaning and motivation.
Social Behavior and Personality, 6, 49–65. Gallagher, M. W. & Lopez, S. J. (2009). Positive expectancies and mental health: Identifying
the unique contributions of hope and optimism. The Journal of Positive Psychology: Dedicated to furthering research and promoting good practice, 4(6), 548-556.
Gardner, H., Csikszentmihalyi, M., & Dammon, W. (2001). The Conditions of Good Work –
chapter in Gardner, H., Csikszentmihalyi, M., Damon, W. Good work: when excellence and ethics meet. New York: Basic Books, pp. 15 – 36.
Garland, E.L., Gaylord, S.A., Boettiger, C.A., & Howard, M.O. (2010). Mindfulness training
modifies cognitive, affective, and physiological mechanisms implicated in alcohol dependence: Results from a randomized controlled pilot trial. Journal of Psychoactive Drugs, 42, 177−192.
Gillham, J.E. & Seligman, M.E.P. (1999). Footsteps on the road to positive psychology.
Behaviour Research and Therapy, 37, 163-173. Goldberg, D. P. (1972). The detection of psychiatric illness by questionnaire: A technique for
the identification and assessment of non-psychotic psychiatric illness. London, New York: Oxford University Press.
Goldberg, D.P., & Hillier, V.F. (1979). A scales version of the General Health Questionnaire.
Psychological Medicine, 9, 139-145. Görgens-Ekermans, G., & Herbert, M. (2013). Psychological capital: Internal and external
validity of the Psychological Capital Questionnaire (PCQ-24) on a South African sample. SA Journal of Industrial Psychology/SA Tydskrif vir Bedryfsielkunde, 39(2).
Gorsuch, R.L. (1983). Factor Analysis (2nd Ed). Hillsdale, NJ:Erlbaum. Gottfredson, G. (1994). The person in person-environment interactions. 102nd Annual
Convention of the American psychological Association, Los Angeles, CA. Gouldner, A.W. (1960). The Norm of Reciprocity: A Preliminary Statement. American
Sociological Review 25: 165-170. Gramzow, R.H., Sedikides, C., Panter, A.T., & Insko, C.A. (2000). Aspects of self-regulation
and self-structure as predictors of perceived emotional distress. Personality and Social Psychology Bulletin, 26, 188–206.
Gustainiene, L. (2012). Psychological well-being and its relation to work-family interaction
and work engagement in a sample of Lithuanian employees. Retrieved on 16/04/2013 from http://www.ntnu.edu/documents/8445058/16026786/Gustainiene.pdf
Hackman, J. R. & Oldham, G. R. (1976). Motivation through the design of work: Test of a
theory. Organizational Behavior and Human Performance, 16, 250-279.
Stellenbosch University http://scholar.sun.ac.za

223
Hair, J.F., Black, B., Balbin, B., Anderson, R.E., & Tatham, R.L. (2006). Multivariate Data Analysis (6th ed.). Tatham: Prentice Hall.
Hakanen, J., Bakker, A.B., & Schaufeli, W.B. (2006). Burnout and work engagement among
teachers. Journal of School Psychology, 43, 495–513. Hall, R.J., Snell, A., F., & Foust, M.S. (1999). Item Parcelling Strategies in SEM:
Investigating the subtle effects of unmodeled secondary constructs. Organizational Research Methods, 2(3), 233 – 256.
Hardy, S., Concato, J., & Gill, T. (2004). Resilience of community-dwelling older persons.
Journal of American Geriatrics Society, 52, 257-262. Hart, P.M. (1999). Predicting employee life satisfaction: A coherent model of personality,
work and nonwork experience, and domain satisfaction. Journal of Applied Psychology, 84, 564-584.
Harter, J.K., Hayes, T.L., & Schmidt, F.L. (2004). Meta-analytic predictive validity of Gallup
Selection Research Instruments (SRI). Omaha, NE: The Gallup Organization. Herbert, M. (2011). An Exploration of the relationships between psychological capital (Hope,
Optimism, Self-efficacy, Resilience) occupational stress, burnout and employee engagement. Master’s thesis, University of Stellenbosch, South Africa.
Hind, P., Frost, M., & Rowley, S. (1996). The resiliency audit and the psychological contract.
Journal of Managerial Psychology, 11(7), 18-30. Hobfoll, S. E. (2001). The Influence of Culture, Community, and the Nested-Self in the
Stress Process: Hobfoll, S.E. (2002). Social and psychological resources and adaptation. Review of General Psychology, 6, 307–324.
Hobfoll, S. E. (2002). Social and Psychological Resources and Adaptation. Review of
General Psychology, 6(4), 307-324. Hobfoll, S.E. (1989). Conservation of resources: A new attempt at conceptualizing stress.
American Psychologist, 44 (3), 513–24. Holleran, S., & Snyder, C.R. (1990). Discriminant and convergent validation of the
Hope Scale. Unpublished manuscript. University of Kansas, Lawrence. Homans, G. (1958). Social Behaviour as Exchange. American Journal of Sociology, 62, 597
– 606. Hosie, P., Sevastos, P., & Cooper, C L. (2006). Happy-Productive Managers: The Impact of
Psychological Wellbeing on Performance. Cheltenham, UK: Northhampton, MA, US: Edgar Elgar.
Hoyle, R. H. (1995). The structural equation modeling approach: Basic concepts and
fundamental issues. In Structural equation modeling: Concepts, issues, and applications, R. H. Hoyle (editor). Thousand Oaks, CA: Sage Publications, Inc., pp. 1-15.
Hunthausen, J. M., Truxillo, D. M., Bauer, T. N., & Hammer, L. B. (2003). A field study of
frame-of-reference effects on personality test validity. Journal of Applied Psychology, 88, 545-551.
Stellenbosch University http://scholar.sun.ac.za

224
Ilies, R., Schwind, K.M., & Heller, D. (2007). Employee well-being: A multilevel model linking
work and non-work domains. European Journal of Work and Organizational Psychology, 16(3), 326-341.
Irving, L.M., Snyder, C.R., & Crowson, J.J., Jr. (1998). Hope and the negotiation of career
facts by college women. Journal of personality, 66, 195-214. Isen, A. M. (1987). Positive affect, cognitive processes and social behavior. In L. Berkowitz
(Ed.), Advances in experimental social psychology (pp. 203–253). New York: Academic Press.
James, W. (1963). Principles of psychology. New York: Macmillan. Janoff-Bulman, R., & Berger, A. R. (2000). The other side of trauma: Towards a psychology
of appreciation. In J. Harvey & E. D. Miller (Eds.), Loss and Trauma Handbook. NY: Bruner/Mazel.
Jex, S.M. & Bliese, P.D. (1999). Efficacy beliefs as a moderator of the impact of work-related
stressors: A multilevel study. Journal of Applied Psychology, 84, 349-361. Jöreskog, K.G. & Sörbom, D. (1993). LISREL 8: Structural Equation Modelling with SIMPLIS
Command Language. Chicago: Scientific Software International. Jöreskog, K.G. & Sörbom, D. (1996). PRELIS 2: User’s reference guide. Chicago: Scientific
Software International. Jöreskog, K.G. & Sörbom, D. (2002). LISREL 8: Structural Equation Modelling with SIMPLIS
Command Language.Lincolnwood, IL: Scientific Software International. Jöreskog, K.G. (2005). Structural equation modeling with ordinal variables using LISREL.
Retrieved August 10, 2013, from: http:// www.ssicentral. com/lisrel/techdocs. Judge, T.A. & Klinger, R. (2008). Job satisfaction: Subjective well-being at work. In M. Eid &
R.J. Larsen (Eds.) The science of subjective well-being. NY: Guilford Press. Judge, T.A., & Watanabe, S. (1993). Another look at the job satisfaction-life satisfaction
relationship. Journal of Applied Psychology, 78(6), 939-948. Judge, T.A., Bono, J.E., Erez, A., & Locke, E.A. (2005). Core self-evaluations and job and
life satisfaction: The role of self-concordance and goal attainment. Journal of Applied Psychology, 90(2), 257-268.
Judge, T.A., Thoresen, C.J., Bono, J.E., & Patton, G.K. (2001). The job satisfaction-job
performance relationship: A qualitative and quantitative review. Psychological Bulletin, 127(3), 376-407.
Kahneman, O. (1999). Objective happiness. In E Diener, N. Schwarz, & 0. Kahneman (Eds.)
Well-being: the foundations of hedonic psychology, pp. 3-27. Russell Sage Foundation, NewYork.
Kanfer, R., & Heggestad, E.D. (1997). Motivational traits and skills: A person-centered
approach to work motivation. Research in Organisational Behavior, 19, 1-56.
Stellenbosch University http://scholar.sun.ac.za

225
Kanter, R. M. (1988). When a thousand flowers bloom: Structural, collective and social conditions for innovation in organizations. In B. M. Straw & L. L. Cummings (Eds.), Research in Organizational Behavior, 10, 123-167.
Kelloway, E.K. (1998). Using LISREL for structural equation modelling: A researcher’s guide.
Thousand Oaks, CA: Sage. Kerlinger, F.N. & Lee, H.B. (2000). Foundations of Behavioral Research (4th ed.). USA: Fort
Worth. Keyes, C.L.M, & Magyar-Moe, J.L. (2003). The measurement and utility of adult subjective
well-being. In S. J. Lopez & and C. R. Snyder (Eds.), Positive Psychological Assessment: A Handbook of Models and Measures (pp. 411-425). Washington, DC: American Psychological Association.
Keyes, C.L.M. Shmotkin, D., & Ryff, C.D. (2002). Optimizing well-being: The empirical
encounter of two traditions. Journal of Personality and Social Psychology, 82, 1007-1022.
King, L. A., & Napa, C.K. (1998). What makes a life good? Journal of Personality and Social
Psychology, 75, 156–165. Kinicki, A.J. & Latack, J.C. (1990). Explication of the construct of coping with involuntary job
loss. Journal of Vocational Behaviour, 36, 339 – 360. Kline, R. B. (2010) Principles and Practice of Structural Equation Modelling. (3rd ed.), The
Guilford Press, New York. Kline, R. B. 1998. Principles and practice of structural equation modelling. New York:
Guilford. Klohnen, E.C. (1996). Conceptual analysis and measurement of the construct of ego-
resiliency. Journal of Personality and Social Psychology, 70, 1067–1079. Kluger, A.N. & Tikochinsky, J. (2001). The Error of Accepting the ‘Theoretical’ Null
Hypothesis: The Rise, Fall, and Resurrection of Common sense Hypotheses in Psychology. Psychological Bulletin, 127, 408-423.
Koys, D.J. (2001). The effects of employee satisfaction, organizational citizenship behavior,
and turnover on organizational effectiveness: A unit-level, longitudinal study. Personnel Psychology, 54, 101-114.
Kwon, C., Kalpakjian, C. Z., & Roller, S. (2010). Factor structure of the PANAS and the
relationship between positive and negative affect in polio survivors. Disability and Rehabilitation: An International, Multidisciplinary Journal, 32, 1300-1310.
Lance, C. E. & Vandenberg, R. J. (2009). Statistical and Methodological Myths and Urban
Legends. New York: Routledge. Langston, C.A. (1994). Capitalizing on and coping with daily-life events: Expressive
responses to positive events. Journal of Personality and Social Psychology, 67, 1112–1125.
Stellenbosch University http://scholar.sun.ac.za

226
Law, K.S., Wong, C., & Mobley, W.H. (1998). Toward a taxonomy of multidimensional constructs. Academy of Management Review, 23, 741-755.
Lazarus, R. S., & Lazarus, B. N. (1994). Passion and reason: Making sense of our emotions.
New York: Oxford University Press. Ledford, G.E. Jr. (1999). Comment: happiness and productivity revisited. Journal of
Organizational Behavior, 20 (1), 25–30. Lee, R., & Allen, N. J. (2002). Predictors and outcomes of workplace violence and
aggression. Joural of Applied Psychology, 87, 444-453. Lent, R.W. (2004). Toward a unifying theoretical and practical perspective on well-being and
psychosocial adjustment. Journal of Counseling Psychology, 51, 482–509. Linkedin. (2013). Linked in. Retreived on 10/10/2013 from za.linkedin.com Llorens, S., Bakker, A., Schaufeli, W.B. & Salanova, M. (2006). Testing the robustness of
Job Demands-Resources Model. International Journal of Stress Management, 13, 378-391.
Locke, J. (1690). Two treatises of government. Oxford: Oxford University Press. Lockwood, N. R. (2007). Leveraging employee engagement for a competitive advantage.
Alexandria, VA: Society for Human Resource Management. Lucas, R.E., Diener, E., & Suh, E.M. (1996). Discriminant validity of well-being measures.
Journal of Personality and Social Psychology, 71, 616-628. Luthans, F. (2002a). Positive approach to OB. In Luthans, F. (Ed.), Organisational Behavior
(9th ed.) (pp. 286-322). New York, NY: McGraw-Hill/Irwin. Luthans, F. (2002b). Positive organisational behavior (POB): Developing and managing
psychological strengths. Academy of Management Executive, 16(1), 57-72. Luthans, F. (2003). Positive organizational behaviour (POB): Implications for leadership and
Human Resource Development and motivation. New York: McGraw-Hill/ Irwin. Luthans, F. Avolio, B.J. & Avey, J.B. (2007a). Psychological Capital Questionnaire Self-
Rater Form, Other Rater Form, Scoring Scale. Published by Mind Garden, Inc. Luthans, F., & Jensen, S.M. (2002). Hope: A new positive strength for human resource
development. Human Resource Development Review, 1, 304-322. Luthans, F., & Youssef, C.M. (2004). Human, social, and now positive psychological capital
management: Investing in people for competitive advantage. Organizational Dynamics, 33(2), 143-160.
Luthans, F., & Youssef, C.M. (2007). Emerging Positive Organizational Behaviour. Journal of
Management, 33, 321-349. Luthans, F., Avey, J. B., Avolio, B.J., Norman, S.M., & Combs, G.J. (2006). Psychological
capital development: Toward a micro-intervention. Journal of Organizational Behavior, 27, 387-393.
Stellenbosch University http://scholar.sun.ac.za

227
Luthans, F., Avey, J. B., Clapp-Smith, R., & Li, W. (2008). More evidence on the value of Chinese workers’ psychological capital: A potentially unlimited competitive resource? The International Journal of Human Resource Management, 19, 818–827.
Luthans, F., Avolio, B J., Walumbwa, F. O., & Li, W. (2005). The psychological capital of
Chinese workers: Exploring the relationship with performance. Management and Organisation Review, 1, 247-269.
Luthans, F., Vogelgesang, G. R., & Lester, P. B. 2006. Developing the psychological capital
of resiliency. Human Resource Development Review, 5: 25–44. Luthans, F., Youssef, C. M., & Avolio, B. J. (2007c). Psychological Capital: Developing the
Human Competitive Edge. New York: Oxford University Press. Luthans, F.,Avolio, B.J., Avey, J. B., & Norman, S. M. (2007b). Psychological capital:
Measurement and relationship with performance and satisfaction. Personnel Psychology, 60: 541–572.
Lyubomirsky, S., Dickerhoof, R., Boehm, J.K., & Sheldon,K. M. (2011). Becoming happier
takes both a will and a proper way: An experimental longitudinal intervention to boost well-being. Emotion, 11, 391-402.
Lyubomirsky, S., King, L., & Diener, E. (2005). The benefits of frequent positive affect: Does
happiness lead to success? Psychological Bulletin, 131, 803-855. Maddux, J. E. (2004). Self-efficacy: The power of believing you can. In C. R. Snyder & S. J.
Lopez (Eds.). Handbook of positive psychology. Oxford: Oxford University Press. Maddux, J. E., & Meier, L. J. (1995). Self-efficacy and depression. In J. E. Maddux (Ed.),
Self-efficacy, adaptation, and adjustment: Theory, research and application (pp. 143-169). New York: Plenum.
Mael, F., & Ashforth, B. E. (1992). Alumni and their alma mater: A partial test of the
reformulated model of organizational identification. Journal of Organizational Behavior, 13, 103–123.
Magaletta, P.R., & Oliver, J.M. (1999). The Hope construct, Will, and Ways: Their Relations
with self-Efficacy, Optimism, and General Well-Being. Journal of Clinical Psychology, 55(5), 539 – 551.
Marshall, G.N., Wortman, C.B., Kusulas, J.W., Hervig, L.K., & Vickers, R.R., Jr. (1992).
Distinguishing optimism from pessimism: Relations to fundamental dimensions of mood and personality. Journal and Social Psychology, 62, 1067- 1074.
Maslach, C. & Leiter, M. (1997). The truth about burnout. San Francisco: Jossey-Bass. Massé, R., Poulin, C., Dassa, C., Lambert, J., Bélair, S., & Battaglini, A. (1998). The
structure of mental health higher-order confirmatory factor analyses of psychological distress and wellbeing measures. Social Indicators Research, 45, 475-504.
Masten, A.S. (2001). Ordinary Magic: Resilience processes in development. American
Psychologist, 56(3), 227-239.
Stellenbosch University http://scholar.sun.ac.za

228
Masten, A.S., & Reed, M.G.J. (2002). Resilience in development. In Snyder, C.R., & Lopez, S.J. (Eds.), Handbook of Positive Psychology (pp. 74-88). Oxford: Oxford University Press.
Matsui, T., & Onglatco, M.L. (1992). Career self-efficacy as a moderator of the relationship
between occupational stress and strain. Journal of Vocational Behaviour, 41, 79 – 88.
Mauno, S., Kinnunen, U., & Ruokolainen, M. (2007). Job demands and resources as
antecedents of work engagement: A longitudinal study. Journal of Vocational Behavior 70, 149-171
Mayer, J.D., Salovery, P., Gromberg-Kaufman, S. & Blainey, K. (1991). A Broader Conception of Mood Experience. Journal of Personality and Social Psychology, 60, 100-111.
McAdam, R. & Keogh, W. (2004). Transitioning towards creativity and innovation
measurement in SMEs. Creativity and Innovation Management, 13(2), 126-139. McCullough, M. E., Hoyt, W. T., Larson, D. B., Koenig, H. G., & Thoresen, C. (2000).
Religious involvement and mortality: A meta-analytic review. Health Psychology, 19, 211-222.
McCullough, M.E., Emmons, R.A., & Tsang, J. (2002). The grateful disposition: A conceptual
and empirical topography. Journal of Personality and Social Psychology, 82, 112-127.
McGregor, I., & Little, B. R. (1998). Personal projects, happiness and meaning: on doing well
and being yourself. Journal of Personality and Social Psychology 131, 803 -855. Menninger, K. (1959). The academic lecture on hope. The American Journal of Psychiatry,
109, 481-491. Moneta, G.B. (2004). The flow experience across cultures. Journal of Happiness Studies, 5,
115-121. Mowday, R., Porter, R. & Steers, L. (1979). The measurement of organizational
commitment. Journal of Vocational Behaviour, 14, 224-247. Muthén, B., & Kaplan D. (1985). A comparison of some methodologies for the factor analysis
of non-normal Likert variables. British Journal of Mathematical and Statistical Psychology, 38, 171-189.
Nahum-Shani, I., Bamberger, P.A., & Bacharach, S.B. (2011). Social Support and Well-
Being among Blue Collar Workers: The Conditioning Effects of Perceived Patterns of Supportive Exchange. Journal of Health and Social Behavior, 52, 123-139.
Neimeyer, R. A. & Mitchell, K. A. (1998). Similarity and attraction: A longitudinal study.
Journal of Social and Personality Relationships, 5, 131-148. Nesselroade, K. P. Jr., Beggan, J. K., & Allison, S. T. (1999). Possession enhancement in an
interpersonal context: An extension of the mere ownership effect. Psychology & Marketing, 16, 21-34.
Norton, D. L. (1976). Personal Destinies. Princeton: Princeton University Press.
Stellenbosch University http://scholar.sun.ac.za

229
Nunnally, J.C. (1978). Psychometric theory. New York: McGraw-Hill. O’Reilly, C. E. (2002). The wrong kind of ownership. Across the Board, Sept/Oct, 19–20. Ortoney, A., Clore, G.L. & Collins, A. (1998). The cognitive structure of emotions. New York:
Cambridge University Press. Ouweneel, E., Le Blanc, P.M., Schaufeli, W.B., & Van Wijhe, C.I. (2012). Good morning,
good day: A diary study on positive emotions, hope and work engagement. Human Relations,65(9), 1129-1154.
Parker, S. (1998). Enhancing role-breadth self-efficacy. Journal of Applied Psychology, 83, 835-852.
Peterson, C. (1991). Health and Optimism. The Free Press: New York. Peterson, C. (2000). The Future of Optimism. American Psychologist, 55 (1), 44-55. Peterson, S.J., & Byron, K. (2007). Exploring the role of hope in job performance: Results
from four studies. Journal of Organizational Behavior, 28, 785-803. Petrie, J., Chapman, L. K., & Vines, L. (2013). The clinical utility of the Positive and Negative
Affect Scales-Extended Version (PANAS-X) in predicting anxiety disorders in African American adults: A receiver operating characteristic analysis. Journal of Black Psychology, 39(2), 131 – 155.
Phelps, L. H. & Waskel, S. A. (1994). Work reinforcers and explanatory style for women
aged 40 to 75 years. Journal of Psychology, 128, (4) 403-407. Pierce, J.L., Kostova, T., & Dirks, K.T. (2001). Toward a theory of psychological ownership in
organizations. Academy of Management Review, 26, 298–310. Pierce, J.L., Kostova, T., & Dirks, K.T. (2003). The state of psychological ownership:
integrating and extending a century of research. Review of General Psychology, 7, 84–107.
Pierce, J.L., O’Driscoll, M.P., & Coghlan, A.M. (2004). Work environment structure and
psychological ownership: The mediating effects of control. Journal of Social Psychology, 144, 507–534.
Pierce, J.L., Van Dyne, L., & Cummings, L.L. (1992). Psychological ownership: A construct
validation study. In M. Schnake (Ed.) Proceedings of the Southern Management Association. Valdosta, GA: Valdosta State University.
Porteous, J. D. (1976). Home: The territorial core. Geographical Review, 66, 383-390. Powers, T. L., & Bendall, D. (2004). Improving Health Outcomes through Patient
Empowerment. Journal of Hospital Marketing and Public Relations, 15, 45-59. Pratt, M.G. & Ashforth, B.E. (2003). Fostering meaningfulness in working and at work. In K.
Cameron, J. Dutton & R. Quinn (Eds.). Positive organizational scholarship. San Francisco: Berret-Koehler.
Prinsloo (2013). Modification, elaboration and empitical evaluation of the Burger learning
potential structural model. Master’s thesis, University of Stellenbosch, Stellenbosch.
Stellenbosch University http://scholar.sun.ac.za

230
Quick, J.C., & Quick, J.D. (2004). Health, happy, productive work: A leadership challenge.
Organizational Dynamics, 33, 329–337. Rhoades, L. & Eisenberger, R. (2002). Perceived Organisational Support: A review of the
literature. Journal of Applied Psychology, 87(4), 698-714. Richardson, G.E. (2002). The meta-theory of resilience and resiliency. Journal of Clinical
Psychology, 58(3), 307-321. Robinson D., Perryman S., and Hayday, S. (2004). The Drivers of Employee Engagement.
Brighton, Sussex: IES Research report. Rochberg-Halton, E. (1980). Cultural signs and urban adaptation: The meaning of cherished
household possessions. Doctoral thesis, University of Chicago. Thesis Abstracts International, 40(8-A), 4754-4755.
Rode, J. C. (2004). Job satisfaction and life satisfaction revisited: A longitudinal test of an
integrated model. Human Relations, 57(9), 1205-1230. Rook, K.S. (1987). Reciprocity of social exchange and social satisfaction among older
woman. Journal of Personality and Social Psychology, 52, 145-154. Rosenberg, E.L. (1998). Levels of analysis and the organization of affect. Review of General
Psychology, 2, 247–270. Rousseau, D.M. (1998). Why workers still identify with organizations. Journal of
Organizational Behavior, 19, 217–233. Ryan, R.M. & Deci, E.L. (2001). On Happiness and Human Potentials: A Review of
Research on Hedonic and Eudaimonic Well-Being. Annual Review of Psychology, 52, 141-166.
Ryan, R.M., & Deci, E.L. (2000). Self-determination theory and the facilitation of intrinsic
motivation, social development, and well-being. American Psychologist, 55, 68-78. Ryff, C. (1989). Happiness is everything, or is it? Explorations on the meaning of
psychological well-being. Journal of Personality and Social Psychology, 57, 1069–1081.
Ryff, C.D. (1995). Psychological well-being in adult life. Current Directions in Psychological
Science, 4, 99-104. Ryff, C.D., & Keyes, C.L.M. (1995). The structure of psychological well-being revisited.
Journal of Personality & Social Psychology, 69(4), 719-727. Ryff, C.D., & Singer, B.H. (1998). The contours of positive human health. Psychological
Inquiry, 9(1), 1-28. Ryff,C.,D., Singer, B., Love, G.D., & Essex, M.J. (1998). Resilience in Adulthood and Later
Life: Defining Features and Dynamic Processes. Pp. 69-96 in Handbook of Aging and Mental Health: An Integrative Approach, edited by J. Lomranz. New York:Plenum Press
Stellenbosch University http://scholar.sun.ac.za

231
Salanova, M., Brescó, E. & Schaufeli, W.B. (2003). Hacia un modelo espiral de la autoeficacia en el estudio del burnout y engagemen [Towars a spiral model of self-efficacy in the study of burnout and engagement]. Submitted for publication.
Salanova, M., Schaufeli, W. B., Llorens, S., Pieró, J. M., & Grau, R. (2000). Desde el
“burnout” al “engagement”: Una nueva perspectiva [From burnout to engagement] Revista de Psicologia del Trabajó y las Organizaciones, 16(2), 117-134.
Sanderson, K., Nicholson, J., Graves, N., Tilse, E., Oldenburg B. (2008). Mental health in the
workplace: using the ICF to model the prospective associations between symptoms, activities, participation and environmental factors. Disability & Rehabilitation, 30, 1289-1297.
Sartre, J. P. (1969). Being and nothingness: An phenomenological essay on ontology. New
York: Philosophical Library. London: Melhuen & Co, Ltd. Satorra, A., & Bentler, P.M. (2001). A scaled difference chi-square test statistic for moment
structure analysis. Psychometrika, 66, 507-514. Schaufeli, W. B., Bakker, A. B. & Van Rhenen, W. (2009), How changes in job demands and
resources predict burnout, work engagement, and sickness absenteeism. Journal of Organizational Behavior, 30, 893–917.
Schaufeli, W.B. & Bakker, A.B. (2004). Job demands, job resources and their relationship
with burnout and engagement: A multi-sample study. Journal of Organisational Behaviour, 25, 293-315.
Schaufeli, W.B., & Bakker, A.B. (2001). Work and well-being: Towards a positive
occupational health psychology. Gedrag en Organizatie, 14(5), 229-253. Schaufeli, W.B., & Bakker, A.B. (2003). The Utrecht Work Engagement Scale. Preliminary
Manual – Version1: Occupational Health Psychology Unit, Utrecht University. Schaufeli, W.B., & Salanova, M. (2007). Work engagement: An emerging psychological
concept and its implications for organizations. In S. W. Gilliland, D. D. Steiner & D. P. Skarlicki (Eds.), Managing social and ethical issues in organizations (pp. 135−177). Greenwich, CT: Information Age Publishing.
Schaufeli, W.B., Taris, T.W., & Van Rhenen, W. (2008). Workaholism, Burnout, and Work
Engagement: Three of a Kind or Three Different Kinds of Employee Wellbeing? Applied Psychology: An International Review, 57(2), 173–203.
Scheier, M.F. & Carver, C.S. (1985). Optimism, coping and health: Assessment and
implications of generalised outcome expectancies. Health Psychology, 4, 219-247. Scheier, M.F., & Carver, C.S. (1992). Effects of optimism or psychological and psysical well-
being: Theoretical overview and empirical update. Cognitive therapy and research, 16, 201-228.
Scheier, M.F., & Carver, C.S. (1993). On the power of positive thinking: The benefits of
being optimistic. Current Directions in Psychological Science, 2, 26-30.
Stellenbosch University http://scholar.sun.ac.za

232
Scheier, M.F., Carver, C.S., & Bridges, M.W. (1994). Distinguishing optimism from neuroticism (and trait anxiety, self-mastery, and self-esteem): A re-evaluation of the Life Orientation Test. Journal of Personality and Social Psychology, 67, 1063-1078.
Scheier, M.F., Weintraub, J.K., & Carver, C.S. (1986). Coping with stress: Divergent
strategies of optimists and pessimists. Journal of Personality and Social Psychology, 51, 1257–1264.
Schmidt, F.L, & Rader, R. (1999). Exploring the boundary conditions for interview-validity:
Meta-analytic validity findings for a new interview type. Personnel Psychology, 52, 445-464.
Seligman, M. E. P. (2011). Flourish: A Visionary New Understanding of Happiness and
Well-being. New York: Free Press. Seligman, M.E.P. & Csikszentmihalyi, M. (2000). Positive psychology: An introduction.
American Psychologist, 55, 5-14. Seligman, M.E.P. (1990). Learned Optimism. New York: Knopf. . Seligman, M.E.P. (1998). Learned Optimism. Second edition. New York. Seligman, M.E.P. (2003). Positive psychology: Fundamental assumptions. Psychologist, 16,
126-127. Sheldon, K.M. & King, L. (2001). Why positive psychology is necessary. American
Psychologist, 56, 216-217. Sherer, M., Maddux, J.E., Mercandante, B., Prentice-Dunn, S., Jacobs, B. & Rogers, R.W.
(1982). The Self-Efficacy Scale: Construction and validation. Psychological Reports, 51, 663-671.
Sivanathan, N., Arnold, K. A., Turner, N. & Barling, J. (2004). Leading well: Transformational
leadership and well-being. In Linley, P. A. & Joseph, S. (Eds.). Positive psychology in practice. Hoboken: John Wiley and Sons.
Slaski M. and Cartwright S. (2002). ‘Health, Performance and Emotional Intelligence: An
Exploratory Study of Retail Managers’. Stress and Health, 18 (2) pp. 63-68. Smuts, N. (2011). The elaboration and empirical evaluation of a partial talent management
competency model in the nursing profession. Master’s thesis, University of Stellenbosch, South Africa.
Snyder, C. R. (1994). The psychology of hope: You can get there from here. New York: Free
Press. Snyder, C. R. (1995). Conceptualizing, measuring, and nurturing hope. Journal of
Counselling and Development, 73, 355-360. Snyder, C. R., Lehman, K. A., Kluck, B., Monsson, Y. (2006). Hope for rehabilitation and vice
versa. Rehabilitation Psychology 51(2), 89-112. Snyder, C.R. (2000). Handbook of hope. San Diego, CA: Academic Press.
Stellenbosch University http://scholar.sun.ac.za

233
Snyder, C.R. (2002). Hope theory: Rainbows in the mind. Psychological Enquiry, 13(4), 249-276.
Snyder, C.R., Irving, L., & Anderson, J. (1991). Hope and Health: Measuring the will and the
ways. In Snyder, C.R., & Forsyth, D.R. (Eds.), Handbook of Social and Clinical Psychology. (pp. 285-305). New York: Pergammon.
Snyder, C.R., Laponite, A.B., Crowson, J.J., & Early, S. (1998). Preferences of High- and
low-hope people for self-reverential input. Cognition & Emotion, 12, 807-823. Snyder, C.R., Rand, K. & D.R. Sigman. (2005). Hope theory: A member of the positive
psychology family. In Handbook of Positive Psychology, ed. C.R. Snyder and S.L. Lopez, 257-276. New York: Oxford University Press.
Snyder, C.R., Sympson, S.C., Ybasco, F.C., Borders, T.F., Babyak, M.A., & Higgins, R.L.
(1996). Development and validation of the State Hope Scale. Journal of Personality and Social Psychology, 70, 321–335.
Solomon, R. C. (1977). The passions. Garden City, NY: Anchor Books. Spector, P.E. (2003). Individual differences in Health and Well-Being in organizations in D.A.
Hofmann & L.E. Tetrick (Eds.), Health and safety in organizations (pp. 29- 55). San Francisco: John Wiley & Sons, Inc.
Srutton, D., & Lumpkin, J. (1992). Relationship between optimism and coping strategies in
the work environment. Psychological Reports, 71, 1179-1186. Stajkovic, A. D. & Luthans, F. (1998). Social cognitive theory and self-efficacy: Going beyond
traditional motivational and behavioural approaches. Organization Dynamics, 26, 62-74.
Statistics South Africa. (2013). Mid-year population estimates 2013. Retrieved on 5/10/2013
from www.statssa.gov.za/Publications/P0302/P03022013.pdf Staw, B.M., & Barsade, S.G. (1993). Affect and managerial performance: A test of the
sadder-but-wiser vs. happier-and-smarter hypothesis. Administrative Science Quarterly, 38(2), 304–331.
Steyn, R. (2011). Optimism, self-efficacy and meaningfulness: towards a salutogenic model
of occupational wellbeing. Master’s thesis, University of Stellenbosch, Stellenbosch. Straume, L. V., & Vittersø, J. (2012). Happiness, Inspiration and the Fully Functioning
Person: Separating Hedonic and Eudaimonic Well-Being in the Workplace. Journal of Positive Psychology, 7, 387-398.
Sumi, K. (1997). Optimism, social support, stress, and physical and psychologicalwellbeing
in Japanese women. Psychological Reports, 81, 299-306. Sweetman, D. & Luthans, F. (2010). The power of positive psychology: Psychological capital
and work engagement. In Bakker, A.B., & Leiter, M.P. (eds), Work engagement: A handbook of essential theory and reserach (pp. 54–68). New York: Psychology Press.
Stellenbosch University http://scholar.sun.ac.za

234
Tabachnick, B.G. & Fidell, L.S. (2001). Using multivariate statistics (4th ed.). Needham Heights, MA: Allyn & Bacon.
Taylor, S.E., Kemeny, M.E. Reed, G.M., Bower, J.E., & Gruenewald, T.L. (2000).
Psychological Resources, Positive Illusions, and Health. American Psychologist, 55 (1), 99-109.
Terracciano A, McCrae RR, & Costa, PT Jr. (2003). Factorial and construct validity of the Italian Positive and Negative Affect Schedule (PANAS). European Journal of Psychological Assessment, 19, 131-141.
Theron, C.C. (2011). Learning Priciples. Unpublished class notes (Research Methodology
712), University Of Stellenbosch. Thrash, T.M. (2007). Differentiation of the distributions of inspiration and positive affect
across days of the week: An application of logistic multilevel modeling. In A.D. Ong & M. Van Dulmen (Eds.), Oxford handbook of methods in positive psychology (pp. 515–529). New York, NY: Oxford University Press.
Tugade, M.M., Fredrickson, B.L. (2004). Resilient individuals use positive emotions to
bounce back from negative emotional experiences. Journal of Personality and Social Psychology, 86(2), 320–33.
Turner, N., Barling, J. & Zacharatos, A. (2002). Positive psychology at work. In C.R. Snyder
& S.J. Lopez (Eds.), Handbook of positive psychology (pp. 715–728). Oxford, UK: Oxford University Press.
Ucar, D. & Ötken, A.B. (2010). Perceived Organizational Support and Organizational
Commitment: The Mediating Role of Organization Based Self-Esteem. Dokuz Eylül Üniversitesi ktisadi ve dari Bilimler Fakültesi Dergisi,25(2),85
Urbandictionary.com Site Info". Alexa Internet. Retrieved on 22/05/2013. Väänänen, A., Buunk, B.P., Kivimaki, M., Pentti, J., & Vahtera, J. (2005). When it is better to
give than to receive: Long-term effects of perceived reciprocity in support exchange. Journal of Personality and Social Psychology, 89, 176-193.
Van Dyne, L. & Pierce, J. L. (2004). Psychological ownership and feelings of possession:
three field studies predicting employee attitudes and organisational citizenship behaviour. Journal of Organisational Behaviour, 25, 439-459.
Van Heerden, S. (2013). Elaboration and empirical evaluation of the De Goede Learning
Potential Structural model. Master’s thesis, University of Stellenbosch, Stellenbosch. Van Veldhoven, M., De Jonge, J., Broersen, S., Kompier, M., & Meijman, T.F. (2002).
Specific relations between psychosocial job conditions and job-related stress: A three-level analytic approach. Work & Stress, 16(3), 207–228.
Vittersø, J., Overwien, P., & Martinsen, E. (2009). Pleasure and Interest are Differentially
Affected by Replaying versus Analyzing a Happy Life Moment. Journal of Positive Psychology, 4, 14-20.
Wagnild, G., M. & Young, H. M. (1993). Development and psychometric evaluation of the
resiliency scale. Journal of Nursing Management, 1 (2), 165 – 178.
Stellenbosch University http://scholar.sun.ac.za

235
Warr, P. (2006). Differential activation of judgments in employee well-being. Journal of Occupational and Organisational Psychology, 79(2), 225-244.
Waterman, A.S. (1984). The psychology of individualism. New York: Praeger. Waterman, A.S. (1993). Two conceptions of happiness: Contrasts of personal
expressiveness (eudaimonia) and hedonic enjoyment. Journal of Personality and Social Psychology 64,678-691.
Watson, D. (1988). Intra-individual and inter-individual analyses of Positive and Negative
Affect: Their relation to health complaints, perceived stress, and daily activities. Journal of Personality and Social Psychology, 54, 1020-1030.
Watson, D., & Clark, L. A. (1984). Negative Affectivity: The disposition to experience
aversive emotional states. Psychological Bulletin, 96, 465-490. Watson, D., Clark, L.A., & Tellegen, A. (1988). Development and validation of brief
measures of Positive and Negative Affect: The PANAS Scales. Journal of Personality and Social Psychology, 54(6), 1063-1070.
Webster’s New World College Dictionary (3rd ed.). (1997). New York: Simon& Schuster. Weil, S. (1952). The need for roots: Prelude to a declaration of duties toward mankind.
London: Routledge & Kegan Paul. Weiner, B. (1986). An attributional theory of motivation and emotion. New York: Springer-
Verlag. Werner, E. F., & Smith, R. (1992). Overcoming the odds: High-risk children from birth to
adulthood. Ithaca, NY: Cornell University Press. Williams, L., & Holahan, P. (1994). "Parsimony based fit indices for multiple indicator
models: Do they work?, Structural Equation Modeling, (1), 161-189. Wissing, M.P., & Van Eeden, C. (1997). Psychological well-being: A fortigenic
conceptualisation and empirical clarification. Paper presented at Annual Congress of the Psychological Society of South Africa, Durban, South Africa.
Wolin, S.J., & Wolin, S. (1993). The resilient self. New York: Villard Books. Woodbury, C.A.J. (1999). The relationship of anxiety, locus of control and hope to career
indecision of African American college students. Thesis Abstracts International, 59, 4072.
Wright, T.A. (2003). Positive organisational behaviour: An idea whose time has truly come.
Journal of Organizational Behavior, 24, 437 – 442. Wright, T.A. (2005). The role of ‘‘happiness’’ in organizational research: Past, present, and
future directions. In P. L. Perrewe, & D. C. Ganster (Eds.), Research in occupational stress and well-being (Vol. 4, pp. 221–264). Amsterdam: JAI Press.
Wright, T.A., & Cropanzano, R. (2004). The role of psychological well-being in job
performance. Organizational Dynamics, 33, 338–351.
Stellenbosch University http://scholar.sun.ac.za

236
Wright, T.A., Cropanzano, R., Denney, P.J., & Moline, G.L. (2002). When a happy worker is a productive worker: A preliminary examination of three models. Canadian Journal of Behaviour Science, 34(3), 146-150.
Wu, C. H. (2009). Factor analysis of the general self-efficacy scale and its relationship with individualism / collectivism among twenty-five countries: Application of multilevel confirmatory factor analysis. Personality and Individual Differences, 46, 699-703.
Xanthopoulou, D., Bakker, A. B., Demerouti, E., & Schaufeli, W. B. (2007). The role of
personal resources in the job demands-resources model. International Journal of Stress Management, 14, 121-141.
Zammuner, V.L. & C. Galli. 2005. Wellbeing: Causes and consequences of emotion
regulation in work settings. International Review of Psychiatry 17, no. 5: 355-64. Zwetsloot, G., & Pot, F. (2004). The business value of health management. Journal of
Business Ethics, 55, 115-124.
Stellenbosch University http://scholar.sun.ac.za

237
Addendum A: Consent form attached to Research Questionnaire
STELLENBOSCH UNIVERSITY
CONSENT TO PARTICIPATE IN RESEARCH: SUBORDINATES
EMPIRICAL EVALUATION OF THE STEYN-BOERS STRUCTURAL MODEL OF
PSYCHOLOGICAL WELL-BEING AT WORK
You are asked to participate in a research study conducted by Miss Maritsa Boers from the
Industrial Psychology Department at Stellenbosch Univeristy. The results obtained will
contribute to the completion of a Masters of Commerce degree in Industrial Psychology. The
results of this study will contribute to the completion of the component of this postgraduate
programme. You are selected as a possible participant in this study because you can give
valuable input to the data gathering process of this study.
1. PURPOSE OF THE STUDY
Steyn (2011) developed a structural model of occupational well-being in an attempt to depict
how positive psychology variables can be combined in a dynamic depiction of the
nomological net of variables underlying the phenemenon of occupational well-being. As a
first adaption to the Steyn (2011) model, this study will focus on explicating the nomological
net of variables underlying subjective well-being (SWB) and psychological well-being at work
(PWBW), as two contemporary constructs well integrated into the occupational well-being
literature. The proposed study will consequently draw from the Positive Organisational
Behaviour (POB) paradigm to explicate the arguments that motivated the adaption and
expansion of the original Steyn (2011) salutogenic model of (occupational) well-being, into
the Steyn-Boers structural model of psychological well-being at work.
2. PROCEDURE
If you volunteer to participate in this study, you will be asked to evaluate yourself by means
of filling out a composite questionnaire. There are no right or wrong responses; we are
Stellenbosch University http://scholar.sun.ac.za

238
merely interested in how you view yourself. The completion of the composite questionnaire
will take place in your own time and comfort as you will be able to access it online, and
would require approximately 20 minutes of your time.
3. POTENTIAL RISKS AND DISCOMFORTS
This is a relativedly risk-free study. The only potential risks and/or discomforts that could
result from participating in this study include the time that is required to fill out the
questionnaire and the potential discomfort of having to evaluate yourself. You may
experience some discomfort, for example, when you reflect on you personal happiness and
well-being levels, as you may realise that you are not as happy as you perhaps want to be. If
you experience any severe emotional distress during the completion of the questionnaire,
please be advised that you have the right to discontinue participation at any stage. The data
will only be utilised for research purposes and no consequences, positive or negative, will
result from the findings.
4. POTENTIAL BENEFITS TO SUBJECTS AND/OR TO SOCIETY
Participation in this study has no direct benefit to the individual participant. The benefits of
such knowledge will be focused on helping organisations to develop human resource
practices designed to ensure the development of employees’ strength and positive personal
resources through appropriate training initiatives as well as through the establishment of a
corporate culture of positive well-being.
5. PAYMENT FOR PARTICIPATION
No payment will be made to participants for taking part in this study. As a token of our
appreciation for your effort to participate in this study, you will be granted an opportunity to
stand a chance to win a gift voucher to the amount of R1000 from a well-known outdoor
shop. To be eligible for the draw of the prize you would have to enter your e-mail address
into a required field in the questionnaire. This will have some consequences for your
anonymity in this study. Section 6 will explain these consequences.
6. CONFIDENTIALITY AND ANONYMITY
Anonymity will be maintained by means of a coding procedure as the online survey will
generate a unique code when you complete the questionnaire. You will not have to fill in
your name on the questionnaire; hence your responses will be anonymous. Please note,
Stellenbosch University http://scholar.sun.ac.za

239
however, that if you want to be entered into the draw for the gift voucher, your identity will be
revealed when you enter you e-mail address into the required field in the quesionnaire.
Therefore, although anonymity will be forfeited in such a case, note that all data will be kept
confidential and will only be utilised for the purposes of this study. The results of this study
will be published in the form of an academic thesis and academic peer-reviewed article in an
academic journal and confidentiality of all data will be maintained at all times.
7. PARTICIPATION AND WITHDRAWAL
You may withdraw your consent at any time and discontinue participation without
penalty. The investigator may withdraw you from this research if circumstances arise which
warrant doing so.
8. IDENTIFICATION OF INVESTIGATORS
If you have any questions or concerns about the research, please feel free to contact Maritsa
Boers ([email protected] / 082 455 4146) or Dr G Görgens ([email protected] / 021
808 3596). Please note that the researchers are directly responsible for the collecting of the
data from the participant. This data collection activity should not be viewed as a Facebook
initiative.
9. RIGHTS OF RESEARCH SUBJECTS
You may withdraw your consent at any time and discontinue participation without
penalty. You are not waiving any legal claims, rights or remedies because of your
participation in this research study. If you have questions regarding your rights as a
research subject, contact Ms Maléne Fouché [[email protected]; 021 808 4622] at the
Division for Research Development, Stellenbosch University.
CONSENT FORM (please tick the appropriate box):
I hereby consent to voluntarily participate in this study. I agree that my data may
be integrated into a summary of the results of all the questionnaires without
identifying me personally.
I don’t want to participate in this study.
quot
e
from
the
docu
men
t or
the
sum
Stellenbosch University http://scholar.sun.ac.za

240
Stellenbosch University http://scholar.sun.ac.za
Copyright © 2022 FDOKUMEN