Portland Self-Service Fare Collection Evaluation ... - CORE
302
Portland State University PDXScholar TriMet Collection Oregon Sustainable Community Digital Library 1982 Portland Self-Service Fare Collection Evaluation Implementation Technical Memorandum: Pre-Implementation Data Collection and Analysis Transportation Systems Center Peat, Marwick, Mitchell & Co. Tri-County Metropolitan Transportation District of Oregon Let us know how access to this document benefits you. Follow this and additional works at: hp://pdxscholar.library.pdx.edu/oscdl_trimet Part of the Transportation Commons , Urban Studies Commons , and the Urban Studies and Planning Commons is Article is brought to you for free and open access. It has been accepted for inclusion in TriMet Collection by an authorized administrator of PDXScholar. For more information, please contact [email protected]. Recommended Citation Transportation Systems Center; Peat, Marwick, Mitchell & Co.; and Tri-County Metropolitan Transportation District of Oregon, "Portland Self-Service Fare Collection Evaluation Implementation Technical Memorandum: Pre-Implementation Data Collection and Analysis" (1982). TriMet Collection. Paper 16. hp://pdxscholar.library.pdx.edu/oscdl_trimet/16
-
Upload
khangminh22 -
Category
Documents
-
view
1 -
download
0
Transcript of Portland Self-Service Fare Collection Evaluation ... - CORE
Portland State UniversityPDXScholar
TriMet Collection Oregon Sustainable Community Digital Library
1982
Portland Self-Service Fare Collection Evaluation ImplementationTechnical Memorandum: Pre-Implementation Data Collectionand AnalysisTransportation Systems Center
Peat, Marwick, Mitchell & Co.
Tri-County Metropolitan Transportation District of Oregon
Let us know how access to this document benefits you.Follow this and additional works at: http://pdxscholar.library.pdx.edu/oscdl_trimet
Part of the Transportation Commons, Urban Studies Commons, and the Urban Studies andPlanning Commons
This Article is brought to you for free and open access. It has been accepted for inclusion in TriMet Collection by an authorized administrator ofPDXScholar. For more information, please contact [email protected].
Recommended CitationTransportation Systems Center; Peat, Marwick, Mitchell & Co.; and Tri-County Metropolitan Transportation District of Oregon,"Portland Self-Service Fare Collection Evaluation Implementation Technical Memorandum: Pre-Implementation Data Collection andAnalysis" (1982). TriMet Collection. Paper 16.http://pdxscholar.library.pdx.edu/oscdl_trimet/16

I
I
I
I
I
I
I
I
I
I
I I I
I
I ,I
,I
I
I
PORTLAND SELF-SERVICE FARE COLLECTION EVALUATION IMPLEMENTATION
TECHNICAL MEMORANDUM
Peat,Marwick,Mitchell&Co.

Section
I
II
APPENDIX
A
B
c
D
TABLE OF CONTENTS
OVERVIEW
Objectives Memorandum Organization
PRE-IMPLEMENTATION DATA COLLECTION AND ANALYSIS
OPERATOR ATTITUDES AND EFFECTS Data Collection and Analysis Approach survey Results and Interpretation
RIDER ATTITUDES AND EFFECTS Data Collection and Analysis Approach survey Results and Interpretation
OPERATING IMPACT STUDY Data Collection and Analysis Approach Survey Results and Interpretation
Survey Instruments
Operator Survey Computer
Rider On-Board/Mailback Computer Printouts
Tri-Met Fare Compliance Survey and Results
i
I.,l
I .. l I .. l
II .. l
II .. l II .. l II.2
II.l9 II .. 21 II .. 24
II .. SO II.52 II .. 56
B .. l
C .. l
D.l

Exhibit
II-1
II-2
II-3
II-4
II-5
II-6
II-7
II-8
II-9
II-10
II-11
II-12
II-13
II-14
LIST OF EXHIBITS
Fare Evasion Rate Perceived by Tri-Met Operators
Extent of Fare Evasion by Type as Perceived by Tri-Met Operators
Likelihood of Tri-Met Operators Confronting or Questioning Fare Evaders by Type of Fare Evasion
Operator Actions When Riders Misuse the Fare System
Reactions of Riders Who Misuse the Fare System to Operator Requests to Pay the Proper Fare According to Tri-Met Operators
Attitudes of Other Riders When Operators Try to Collect Fares from Cheaters as Perceived by Tri-Met Operators
Operator Perceptions of the Relative Ease or Difficulty of Bus Operating Tasks
Reasons for Riders Paying the Wrong Fare -as Perceived by Tri-Met Operators
Age Characteristics of Fare Evaders as Perceived by Tri-Met Operators
Time-of-Day Characteristics of Fare Evaders as Perceived by Tri-Met Operators
Locational Characteristics of Fare Evaders as Perceived by Tri-Met Operators
Observation of Repeat Cheaters as Perceived by Tri-Met Operators
Tri-Met Operator Attitudes toward Misuse of the Fare System and self-Service Fare Collection
Preliminary Validation of Raw Rider Data from Pre-Implementation on-Board survey With Tri-Met Quarterly Line Performance Report (Spring 1982)
ii
II.3
II .. S
II.6
II.8
II.9
II.ll
II.l2
II.l3
II.l4
II.l6
II.l7
II.l8
II.20
II.23

Exhibit
II-15
II-16
II-17
II-18
II-19
II-20
II-21
II-22
II-23
II-24
II-25
II-26
II-27
II-28
II-29
LIST OF EXHIBITS (Continued)
Tri-Met Bus Rider survey Demographics
Tri-Met Bus Rider survey Travel Characteristics
Fare Payment Characteristics of Tri-Met Bus Riders
Convenience of Transfers to Tri-Met Riders Using cash or Bus Ticket Fares
Principal Reasons Tri-Met Riders Find Transfers Inconvenient
vendor Distribution of Bus Tickets and Passes
Likelihood of Cash Riders Purchasing Bus Tickets or Passes if Readily Available from Vending Machines and Their Reasons
Willingness of Tri-Met Riders to Purchase Bus Tickets or Passes from vending Machines Accepting Major Credit Cards
Tri-Met Bus Rider Reasons for Paying Individual Rides Rather Than Purchasing a Monthly Pass
Rider Attitudes on Discounts for Advance Purchase of Ten-Ride Tickets
Rider Opinions on Fare Collection System Problems
Percent of Tri-Met Riders in survey Sample Who Feel Factor Should be Considered in Determining Fares
Tri-Met Rider Attitudes on Optimal zone Structure
Tri-Met Rider Attitudes on Incremental Zone Fares
Tri-Met Rider Perceptions of the Extent of Fare Evasion
iii
Page
II .. 25
II~26
II.28
II.31
II.33
II.35
II.36
II.37
II.38
II.40
II.41
II.42
II.44
II.45
Exhibit
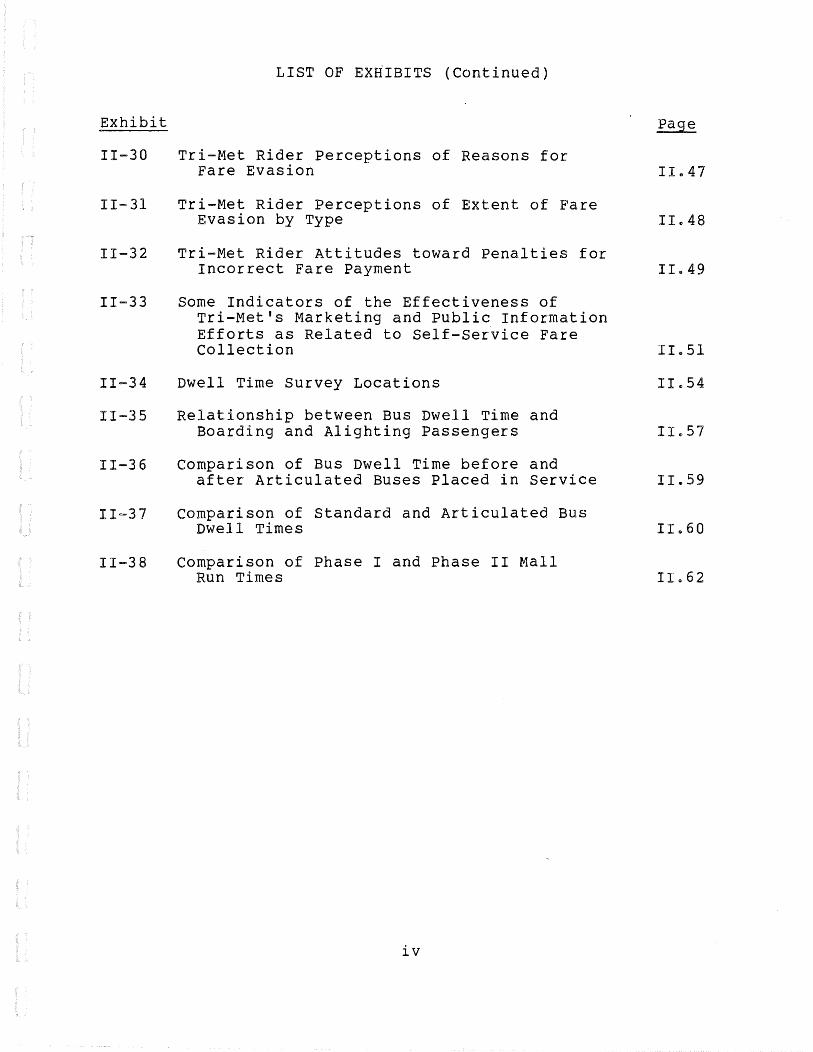
II-30
II-31
II-32
II-33
II-34
II-35
II-36
II-38
LIST OF EX~IBITS (Continued)
Tri-Met Rider Perceptions of Reasons for Fare Evasion
Tri-Met Rider Perceptions of Extent of Fare Evasion by Type
Tri-Met Rider Attitudes toward Penalties for Incorrect Fare Payment
Some Indicators of the Effectiveness of Tri-Met's Marketing and Public Information Efforts as Related to Self-Service Fare Collection
Dwell Time survey Locations
Relationship between Bus Dwell Time and Boarding and Alighting Passengers
Comparison of Bus Dwell Time before and after Articulated Buses Placed in Service
Comparison of Standard and Articulated Bus Dwell Times
Comparison of Phase I and Phase II Mall Run Times
iv
IIe47
II.,48
II .. 49
II .. 54
II .. 57
II.59
II .. 60
II .. 62

I. OVERVIEW
The evaluation of the self-service fare collection demonstration has three principal purposesc The first is to determine how well, or to what extent, the project accomplished its stated objectives~ The second is to measure the impacts of the project on the transit operator, transit users, persons who do not use transit, and the general communityG The third purpose is to explain why the project succeeded or failed and why certain effects occurred while others did noto The latter is particularly important for determining the legal, institutional, social, and political circumstances under which a similiar project would work in other areas or its transferability.
OBJECTIVES
This memorandum describes data collection activities undertaken by Tri-Met and its contractors prior to implementation of self-service fare collection and presents the preliminary analyses of this datao Analyzing the pre-implementation data at an early enough stage will permit the Transportation systems Center (TSC), Peat, Marwick, Mitchell & Co., and Tri-Met to refine post-implementation data collection techiques and focus on those areas which the pre-implementation studies suggest are likely to be most fruitfule
MEMORANDUM ORGANIZATION
The remainder of this memorandum discusses data collection and analysis used to evaluate operator attitudes and effects, rider attitudes and effects, and operating impacts prior to the implementation of self-service fare collection. The technical appendices contain copies of the survey instruments, computer printouts of the response to the surveys, and also a copy of Tri-Met's study of fare comploance. The latter is currently being reviewed as it was received too late for substantive evaluation or discussion in this memorandum.
I.l
II. PRE-IMPLEMENTATION DATA COLLECTION AND ANALYSIS
OPERATOR ATTITUDES AND EFFECTS
Tri-met expects self-service fare collection to help clarify driver roles and responsibilities in collecting fares, reducing fare collection tasks, and also reducing absenteeism and stress related to fare disputes. Drivers will continue to monitor and collect cash fares, and also issue receipts, under self-service fare collection. Fare disputes, however, which are often cited as a primary source of rider/operator friction will be eliminated& This in turn may reduce driver absenteeism and stress.
The evaluation effort focuses on:
. comparing operator responsibilities and tasks before and after the implementation of self-service fare collection;
• determining operator attitudes toward fare violations prior to the implementation of self-service fare collection; and
c assessing the attitudes of operators toward selfservice fare collection.
Data Collection and Analysis Approach
The primary means of obtaining data on operator attitudes toward fare collection and fare evasion, and more specifically the impacts of self-service fare collection on them, is through the administration of before and after surveys to Tri-Met operators. Areas to be covered by the surveys include:
. operator perceptions of the extent and type of fare evasion and their responses;
. operator attitudes-toward their role and responsibilities in collecting fares and toward fare evaders;
• operator perceptions of fare evader characteristics; and
. rider-operator interactions related to fare collection.
A draft pre-implementation survey instrument was developed by Tri-Met. After receipt of the Transportation systems Center's and Peat Marwick's comments, and subsequent
II.l

pre-testing, Tri-Met refined the survey instrumento 1 It was administered during February and March 1982 when operators were taking instructional classes on self-~ervice fare collectiono Tri-Met reported that operators were very cooperative in answering the survey questions, as evidenced by the receipt of 800 completed surveys representing more than 82 percent of the operator work force. A post-implementation survey is planned for April or May 1983 to assess changes in operator perceptions of the extent and type of fare evasion, their responsibilities in the new fare collection process, and their overall attitude toward self-service fare collection. No problems are anticipated in obtaining the cooperation of operators in providing this data.
The high number of completed surveys suggests that the sample is representative of the total Tri-Met operator work force, therefore the results of the survey and its interpretation are discussed in that context. Furthermore, the high response rate to nearly all of the individual survey questions permits an analogous assumption regarding their interpretation.
Survey Results and Interpretation2
The results of this survey are discussed in the following order:
extent and type of fare evasion;
e operator fare collection responsibilities and rideroperator interactions;
0 operator perceptions of fare evader and other rider characteristics; and
o operator attitudes toward self-service fare collection and the prior (existing) systeme
Extent and Type of Fare Evasion
Exhibit II-1 presents the distribution of fare evasion rates, that is the percent of total riders who misuse or cheat the fare system on purpose or by mistake, as perceived by
1 A copy of the pre-implementation operator survey may be found in Appendix A of this memorandum.
2 The response to each question on the pre-implementation survey may be found in the attached computer printout in Appendix B.

CIJ a: 0 1-<C a: w Q.
0 ...1 <C 1-0 t-u. 0 1-z w 0 a: w a..
H
30 1--
20 ~
10
0 0-2 3·5
EXHIBIT 11-1
FARE EVASION RATE PERCEIVED BY TRimMET OPERATORS
6-10 11-20 21-30 31-40
PERCEIVED FARE EVASION RATE
Source: Tri-Met Bus Operator Attitude Survey, February, 1982
II.3
I r I l
41-50 50 OR OVER

Tri-Met operators. The largest proportion of operators, approximately 33 percent, feel that the fare evasion rate is between 6 and 10 percent. The majority of operators, accounting. for 63 percent of the respondents, feel that the fare evasion rate lies between 3 and 10 percent. The perceived fare evasion rate tapers off drastically beyond the 11 to 20 percent category, only 8 percent of the operators believing that the fare evasion rate exceeds 20 percent.
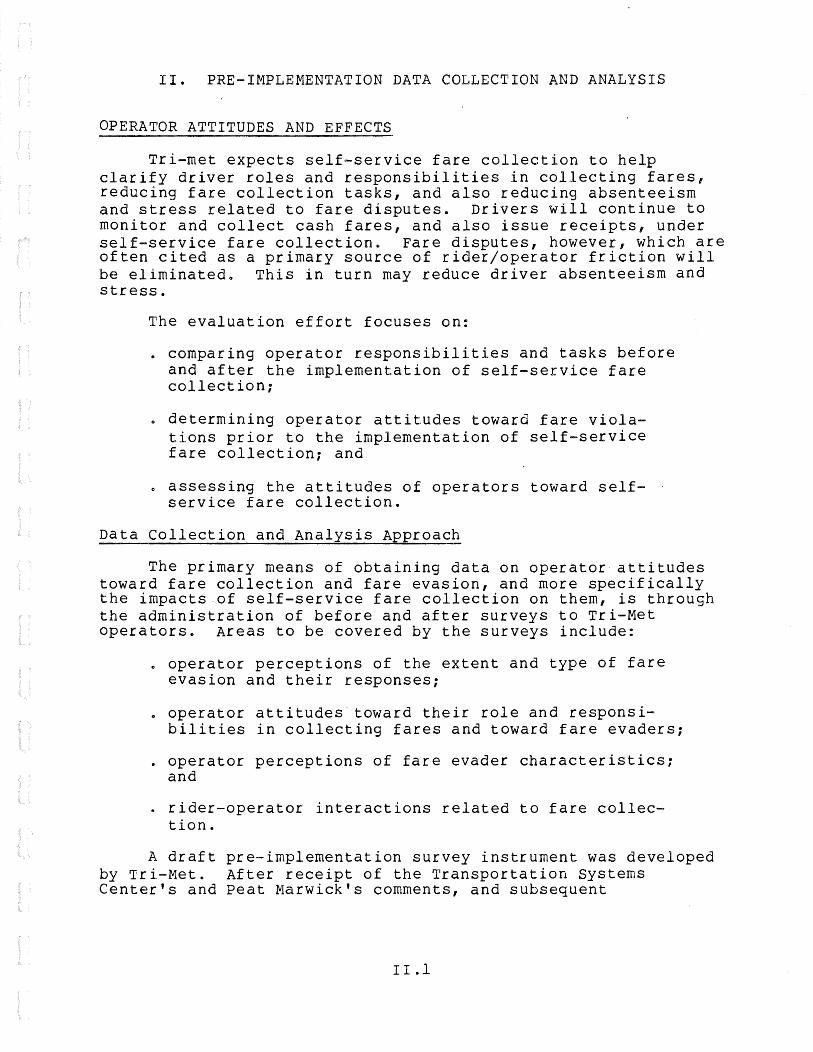
Tri-Met operators were asked "When misuse or cheating of the fare system occurs, how often or frequently does it occur for various types of cheating?" Exhibit II-2 is a graphic representation of the extent of fare evasion, by type, as perceived by operators. The survey questionnaire permitted operators to check one of the following five choices: very rarely; rarely; sometimes; often; and very often. In order to display the results in a comprehensible manner, the responses rarely and very rarell have been combined as have the responses often and very often. The most common types of fare evasion are thought to be the use of bad transfers and the incorrect use of two-zone passes for three zones~ Between 56 and 59 percent of all operators feel that this type of fare evasion occurs often or very often. It is noteworthy that operators feel that the use of forged passes, mutilated currency (e.g., slugs, half bills), or no payment at all, is the least likely type of fare evasion to occur, about 81 percent of operators indicating that it occurs rarely or very rarely. In the case of the most common types of fare evasion, i.e., misuse of two-zone passes for three-zone and the use of bad transfers, self-service fare collection appears to offer an opportunity for reducing their occurrence.
Operator Fare Collection Responsibilities and Rider-Operator Interaction
Operators were asked how often they question or confront a rider for various types of fare evasion when a rider misuses or cheats the fare system. Exhibit II-3 summarizes the liklihood of Tri-Met operators questioning or confronting fare evaders according to specific fare evasion categories. Operators are most likely to confront riders when they evade fares by not making a payment at all or by use of a bad transfer. Nearly 60 percent of all operators indicated that they frequently or very frequently question riders for these
1 The more detailed response to questions may be found in the attached computer printout in Appendix B.
II.4
tn a: 0 1-cC a: w a., 0 1-w ::E . i:c 1-...J ·ce 1-0 1-u.. 0 1-z w (.) a: w 0.
EXHIBIT II -2
EXTENT OF FARE EVASION BY TYPE AS PERCEIVED BY TRIQMET OPERATORS
~ Often or Very Often
D Sometimes
D Rarely or Very Rarely
100r-------~------~------~------~-------r------~-------r------~
80
60
40
20
o-•m No Payment Misuse Of Youth, Wrong Use At All Base Fare Cash Fare Passes Senior or Of 2 Zone Transfers
Disabled Passes Pass For 3 Zones
TYPE OF FARE EVASION
Source: Tri·Met Bus Operator Attitude Survey, February 1982
II.S

U) a: 0 1--cc a:: w a.. 0 t-w :E
I
iE t-_, <C ..... 0 ..... LL 0 ..... z w (.) a: w a.,
EXHIBIT 11-3
LIKLIHOOD OF TRI-MET OPERATORS CONFRONTING OR QUESTIONING
FARE EVADERS BY TYPE OF FARE EVASION
~ Often or Very Often
D Sometimes
0 Rarely or Very Rarely
10or-------~------~------~------~------~-------r------~------~
80
60
40
20
0
At All Base Fare Cash Fare
TYPE OF FARE EVASION
Source: Tri·Met Bus Operator Attitude Survey, February, 1982
II.6
Misuse rong Youth, Senior 2 Zone Pass Transfers
or Dlabled Passes For 3 Zones
types of fare evasione In comparing Exhibit II-3 with II-2, the following observations may be made:
c The low perceived incidence of riders making no payment at all (81 percent of all operators feeling that this type of fare evasion occurs rarely or vary rarely as compared to a mere 2 percent that fe~l it occurs often) is quite consistent with the high probability of operators confronting riders who pay no fare at all under the former fare system;
. The high perceived incidence of bad transfers and the misuse of two-zone passes for three zones, despite the relatively high likelihood of being challenged by operators (57 percent and 30 percent of all operators, respectively, indicated that they often or very often challenge this type of fare evasion) suggests that the former fare system wasn't well suited to curbing this type of fare evasion;
e As a general rule, it appears that the more complicated the type of fare evasion, iee., those types that are related to the amount or sufficiency of the fare paid and those related to the misuse of the zone fare structure, are the least likely to be questioned by operators. Moreover, they appear to be the least susceptible to enforcement or control under the former fare system.
Exhibits II-4 and II-5 describe, respectively, the range of actions taken by operators when an attempt at fare evasion is encountered and the various reactions of riders to operator requests to pay the proper fare~ The most common action taken by operators when they observe a rider attempting to evade a fare is to request the proper fare. This is reflected in Exhibit II-4 which shows that nearly 70 percent of all operators often, or very often, pursue this course of action. Operators generally agree that they very rarely, if ever, call security or police.
When riders are requested by operators to pay the proper fare, almost 50 percent of all operators feel that most riders comply. Riders are least likely to leave the bus with no fare payment. Between 20 to 26 percent of all operators feel that they frequently encounter riders who respond to their requests for paying the proper fare by remaining on the bus with no fare payment, verbally abusing or swearing at them, or complaining about poor service or high fares. This latter finding may be significant insofar as it could account for part of the stress associated with driving a bus.
II.7

en a: 0 t-< a: w CL 0 .... w ::!
I a: .... u. 0 1-z w 0 a: w c.
EXHIBIT 11-4
OPERATOR ACTIONS WHEN RIDERS MISUSE THE FARE SYSTEM
• Often or Very Often
Osometimes
D Rarely or Very Rarely
100~---------~---------------~---------r-----~
8
6
Ask Them Call Security No Action ~o Pay or or Police
Pay Fare Leave Bus
Source: Tri·Met Bus Operator Attitude Survey, February, 1982
II.8

Cl) a:: 0 1-c( a: w Q.,
0 .... w ::e
I a: 1-...I c( .... 0 1-Ll.. 0 .... z w (,) a:: w Q.,
REACTIONS OF RIDERS WHO MISUSE THE FARE SYSTEM TO OPERATOR REQUESTS TO PAY THE
PROPER FARE ACCORDING TO TRI-MET OPERATORS
~ Often or Very Often
D Sometimes
D Rarely or Very Rarely
100-------------------------~~----~------~------~
80
40
20
0 l..OITIUI<IIn
Bus With No Abuse Or About Poor Fare Payment Fare Payment Swearing Service Or
High Fares
RIDER RESPONSE
Source: Tri-Met Bus Operator Attitude Survey, February, 1982
II.9

At least one factor which may influence what actions are likely to be taken by operators when encountering attempts to evade fares is the operators' perceptions of the attitudes of other riders when they confront potential fare evaders. Exhibit II-6 summarizes operator perceptions of the attitudes of other riders in those situations where a fare evader is questioned. Fifty percent of all operators perceive the reactions of other riders to the attempt to collect fares as one of quiet disapproval, while an additional 33 percent feel riders are apathetic. Only 10 percent of all operators perceive other riders as actively voicing anger at the cheater, and an even smaller minority, totalling less than 8 percent, feel riders quietly voice disapproval of the operator or support the cheaterQ
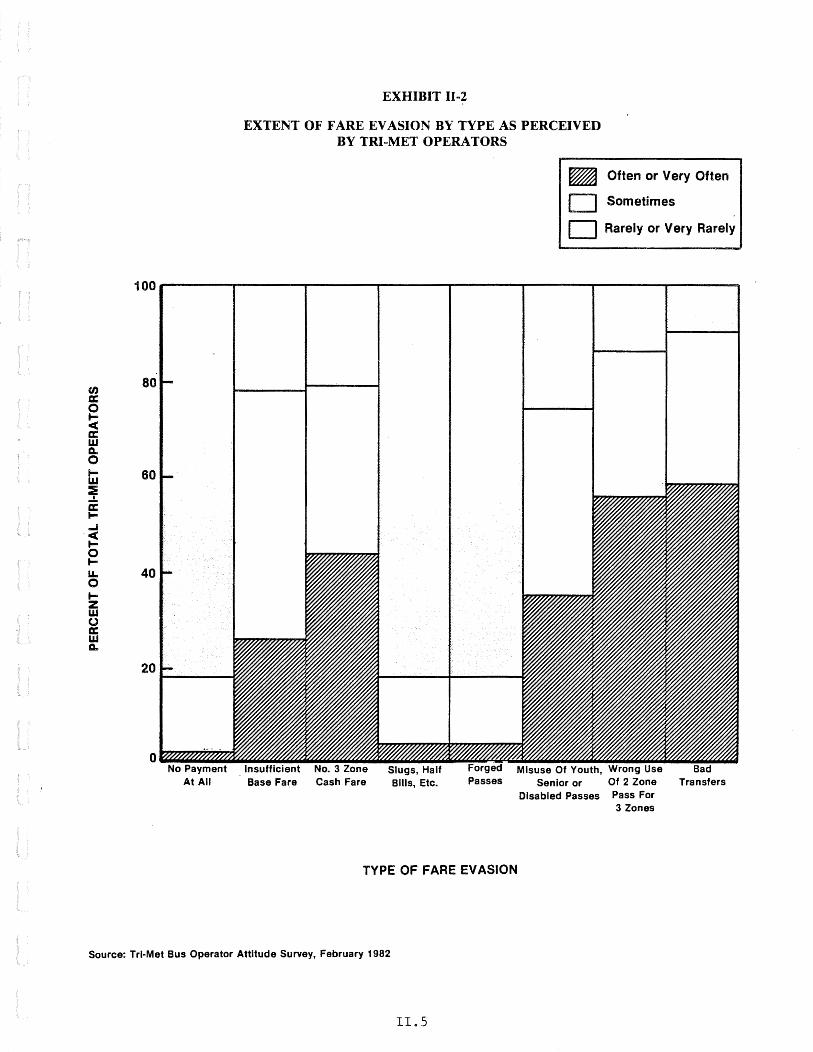
It has been suggested that operator tasks related to fare collection tend to be relatively more difficult or unpleasant than other operator tasks involved in driving a bus. Exhibit II-7 presents operator perceptions of the relative ease of bus operating tasks. Of the many tasks involved in operating a bus, the largest percentages of operators feel that dealing with fights on the bus, overcrowding, and students is the most difficult. Operator tasks relating to fare collection, transfers, and rider complaints, all of which relate to dealing with riders, tend to be perceived as more difficult than those relating to mechanical tasks or intra-organizational relationships, i.e., staying on schedule, helping the elderly or handicapped, paperwork (load counts, reports, trip sheets, etc.) and dealing with supervisors. To the extent that self-service fare collection clarifies, or reduces,· operator responsibilities in the fare collection process, operators may perceive their work as becoming easier. These findings suggest that a larger portion of Tri-Met operators would benefit from improvements in the fare collection system than from improvements related to reducing driving in traffic, reducing paperwork, or improving relations between supervisors and operators.
Operator Perceptions of Fare Evader and Other Rider Characteristics
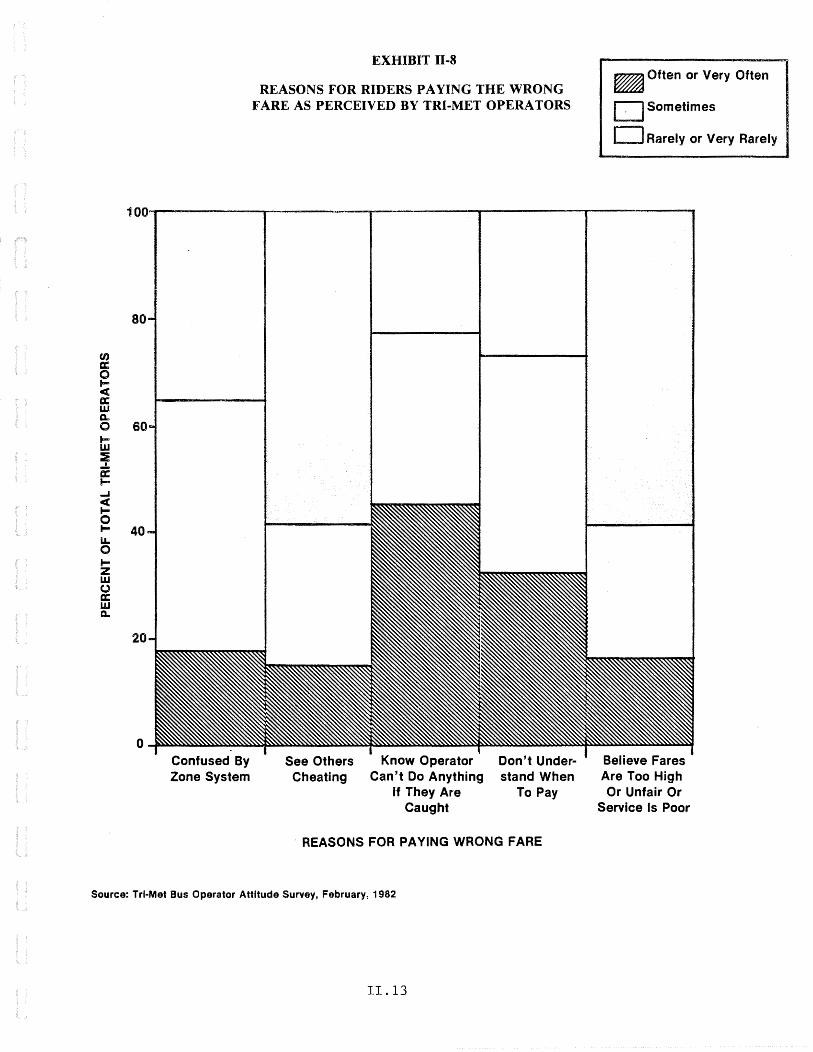
Operators were asked why they feel riders pay the wrong fare. The reason cited most frequently was "they know the operator can't do anything if they are caught." Exhibit II-8 shows the distribution of responses to this question. Assigning fare inspectors specific enforcement powers under self-service fare collection would appear to meet the need for greater enforcement authority to discourage cheating
Operators feel that fare violations are most likely to occur: with persons under the age of 25; with repeat cheaters; and during the rush and evening hours. Exhibit II-9 shows the distribution of age characteristics of fare evaders as perceived by Tri-Met operators. Fifty-seven percent of all operators
II.lO

EXHIBIT II -6
ATTITUDES OF OTHER RIDERS WHEN OPERATORS TRY TO COLLECT FARES FROM
CHEATERS AS PERCEIVED BY TRI-MET OPERATORS
Quietly Indicate Disapproval of Cheater
(49%)
Voice Support for Cheater
(1 %)
No Response/Don't Care (33%)
Quietly Indicate
Disapproval of
Driver (7%)
Voice Anger
at Cheater (10%)
Source: Tri-Met Bus Operator Attitude Survey, February 1982
II.ll
100
CIJ a: 0 .... 80 <( a: w a.. 0 .... w
H :iE 60 H I . a: !--' t-N _.
<( .... 0 .... 40 u. 0 .... z w 0 a:
20 w a..
0
EXHIBIT 11-7
OPERATOR PERCEPTIONS OF THE RELATIVE DIFFICULTY OR EASE OF BUS OPERATING TASKS
Helping uucumg Hanaung Elderly or with Students Complaints
Handicapped
BUS OPERATING TASK
Source: Tri-Met Bus Operator Attitude Survey, february. 1982
~ Difficult or Very Difficult
D Not Difficult
D Easy or Very Easy
tJ) £t: 0 1-< a: w Q..
0 ...., w :e
I
cc 1-...1 < 1-0 1-LL. 0 1-z w (.) £t: w Q.
EXHIBIT II -8
REASONS FOR RIDERS PAYING THE WRONG FARE AS PERCEIVED BY TRI-MET OPERATORS
~Often or Very Often
osometimes
0Rarely or Very Rarely
100~------------~----------~----------------------~------------
80
60
40
20
0 Know Operator
Can't Do Anything If They Are
Caught
Don't Understand When
To Pay
-REASONS FOR PAYING WRONG FARE
Believe Fares Are Too High Or Unfair Or
Service Is Poor
Source: Tri-Met Bus Operator Attitude Survey, February, 1982
II.13

en a: 0 .... < a: w c.. 0 .... w ::i
I a: .... ..... < .... 0 .... u. 0 1-z w (,) a: w c..
60
40
20
0 High School or Younger
EXHIBIT II c9
AGE CHARACTERISTICS OF FARE EVADERS AS PERCEIVED BY TRJaMET OPERATORS
~ Often or Very Often
osometimes
D Rarely or Very Rarely
High School to Age 25
25 to 40 Years 40 to 65 Years Over 65 Years
AGE CHARACTERISTICS
Source: Tri-Met Bus Operator Attitude Survey, February, 1982
11.14
feel that riders age 25 or less often, or very often, cheat the fare system. They generally feel that cheating declines with increasing rider age until 65 years, after which their. perception of the amount of fare evasion begins to risee
Exhibit II-10 presents operator perceptions of the time of day when fare evasion is most likely to occur. The largest percentages of operators believe cheating is most predominant during the rush (39 percent feel cheating occurs often or very often) and evening (37 percent feel cheating occurs often or very often) hourse The least fare evasion is believed to occur during the midday travel period.
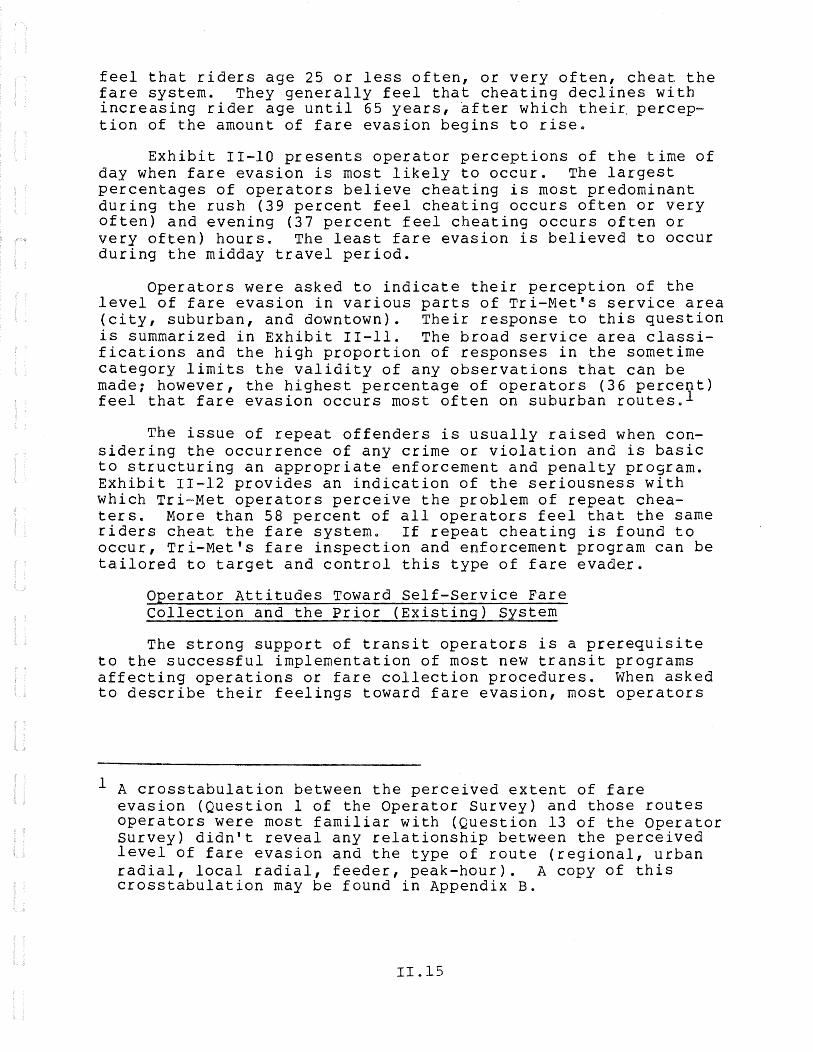
Operators were asked to indicate their perception of the level of fare evasion in various parts of Tri-Met's service area (city, suburban, and downtown). Their response to this question is summarized in Exhibit II-11. The broad service area classifications and the high proportion of responses in the sometime category limits the validity of any observations that can be made; however, the highest percentage of operators (36 percent) feel that fare evasion occurs most often on suburban routesel
The issue of repeat offenders is usually raised when considering the occurrence of any crime or violation and is basic to structuring an appropriate enforcement and penalty program. Exhibit II-12 provides an indication of the seriousness with which Tri-Met operators perceive the problem of repeat cheaterse More than 58 percent of all operators feel that the same riders cheat the fare systeme If repeat cheating is found to occur, Tri-Met's fare inspection and enforcement program can be tailored to target and control this type of fare evader.
Operator Attitudes Toward Self-Service Fare Collection and the Prior (Existing) System
The strong support of transit operators is a prerequisite to the successful implementation of most new transit programs affecting operations or fare collection procedures. When asked to describe their feelings toward fare evasion, most operators
1 A crosstabulation between the perceived extent of fare evasion (Question 1 of the Operator Survey) and those routes operators were most familiar with (Question 13 of the Operator Survey) didn't reveal any relationship between the perceived level of fare evasion and the type of route (regional, urban radial, local radial, feeder, peak-hour). A copy of this crosstabulation may be found in Appendix B.
II.lS

Cl) a: 0 .... ct a: w a.. 0 1-w ::E
I
a: .... ...I ct .... 0 1-LL 0 .... z w (.) a: w Q.
80
60
20
0 Rush Hours
EXHIBIT IlclO
TIME OF DAY CHARACTERISTICS OF FARE EVADERS AS PERCEIVED BY TRicMET OPERATORS
Mid-Day Evening
OPERATING TIME PERIOD
~ · Often or Very Often
D Sometimes
CJ Rarely or Very Rarely
Weekends
Source Tri·Met Bus Operator Survey, February, 1982
II.l6
UJ a: 0 .... c( a: w a. 0 .... w :&
I a: 1-...I c( .... 0 .... u.. 0 ..... z w (.) a: w a.
LOCATIONAL CHARACTERISTICS OF FARE EVADERS AS PERCEIVED BY
TRicMET OPERATORS
100~----------~------------~----------~
80
60
40
20
0
LOCATION
Source: Tri·Met Bus Operator Attitude Survey, February, 1982
11.17
~ D D
Often or Very Often Rarely or Very
Rarely
Sometimes

30 U'J a: 0 1->u; eta: a::w w...., Q.< Ow 1-::E:: W() :Et-...!.<( a:w
20 1-a., ....!W <a: 1-(!J Oz .... _ u.2! ow ...,o za:: wW oa.. a: w a..
10
EXHIBIT II e 12
OBSERVATION OF REPEAT CHEATERS AS PERCEIVED BY TRI-MET OPERATORS
Very Rarely
Rarely Sometimes
OCCURANCE OF REPEAT CHEATING
Source: Tri-Met Bus Operator Attitude Survey, February, 1982
II.l8
Often Very Often

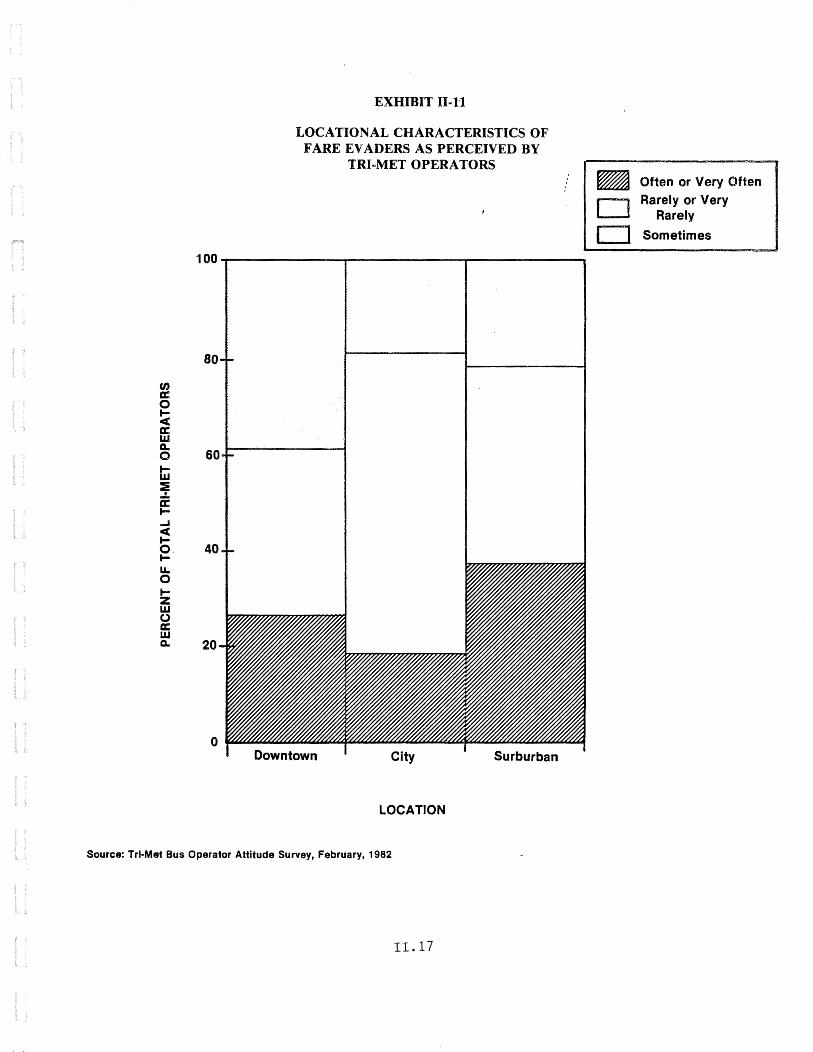
(33 percen.t) responded that "better enforcement is needed but not by the operator." This is quite consistent with operator responses to other questions which su~gests that riders know that the operator can't do anything to them if they are caught cheating. Exhibit II-13 summarizes operator attitudes toward misuse of the fare system and self-service fare collection. Examination of the pattern of responses in Exhibit II-13 shows that operators overwhelmingly support better fare collection enforcement but perceive shortcomings in their powers and capabilities to assume this responsibility.
When asked whether self-service fare collection will be an improvement over the current system, 87 percent of all operators answered yes. Of course, since this survey was administered during a training course on the new fare collection system, some positive bias in this response is likely. The most common reasons cited by operators who feel self-service fare collection would be an improvement were: reduced cheating; easier for riders to_use; and more equitable fareso The small minority of operators who feel self-service fare collection would not be an improvement cited problems related to increased cheating, greater complexity for the rider, and higher fares.
RIDER ATTITUDES AND EFFECTS
The main purpose of this part of the evaluation is to measure and assess the attitudes of transit riders toward the fare collection system before and after self-service fare collection implementation. Additional information on rider travel behavior, fare p~yment characteristics, and rider perceptions of the level of fare evasion is also needed in order to more thoroughly analyze rider attitudes toward the fare collection system. A secondary purpose is to measure the effectiveness of Tri-Met's marketing program with respect to promotion, instruction, and information related to self-service fare collection.
In order to analyze rider attitudes toward the fare collection system, the approach chosen involves conducting the following surveys:
• pre-implementation rider on-board/mailback survey (May 1982);
. post-implementation rider on-board/mailback survey (March 1983);
. post-implementation household survey (October 1982); and
. post-implementation panel survey (March 1983) ~
EXHIBIT Ilal3
TRimMET OPERATOR ATTITUDES TOWARD MISUSE OF THE FARE
SYSTEM AND SELF SERVICE FARE COLLECTION
(a) Best Description of Operator Feelings Toward Misuse of the Fare System
MOST CHARACTERISTIC FEELING PERCENT OF TOTAl TRI·MET OPERATORS
Better Enforcement Needed But Not By Operator
, ................................. 33%
Don't Want To Enforce Because Manag& ment Doesn't Support Or Encourage
Angry When Cheating Observed But Feel Enforcement Useless
Angry When Cheating Observed And Try To Catch Fare Evaders
Don't Want To Enforce Because Of Threat Of Verbal Abuse Or Violence
Don't Want To Enforce Since Operators Can't Do Much
Enforce The Worst Cheating But Feel Enforcement Is A Waste Of Time
Other
~ ................... 22%
............... 16%
·----10%
·--·1% ·--6%
·-·4% -2%
(b) Whether Self Service Fare Collection Will Be An Improvement Over The Current Systems and Why
It Will Be An Improvement .. 87 Percent Of Operators
REASONS CITED NO. OF TIMES CITED PERCENT OF TOTAL TIMES CITED
• Reduced Cheating • Easier For Rider To Use • More Equitable Fares • Easier For Driver • Will Improve Operations • Will Reduce Costs
409 291 279 246 239 115
26 18 18 16 15
7
It Will Not Be An Improvement - 13 Percent Of Operators
REASONS CITED
• Increased Cheating • Too Complicated For Rider • Fare Too High • More Complicated For The Driver • Too Expensive • Unreliable Equipment
NO. OF TIMES CITED
43 42 18 17 12
8
Source: Tri-Met Bus Operator Attitude Survey, February, 1982
II.20
PERCENT OF TOTAL TIMES CITED
31 30 13 12
8 6
Tri-Met issued a Request for Proposal and subsequently awarded a contract to a firm to carry out these four surveys. The remainder of this discussion deals ex6lusively with the preimplementation rider on-board/mailback surveye
Data Collection and Analysis
A two-part bus rider survey questionnaire, one part to be filled out onboard the bus and the other to be mailed back within a few weeks, was prepared by Tri-Mete The mailback survey was a separable portion of the on-board survey which requested additional information on rider attitudes toward the fare collection system as well as their names, addresses and telephone numbers if they desired to participate in a follow-up surveyo An incentive of two bus tickets was offered to riders who would complete both the on-board and mailback portions of the survey, and a further incentive of five bus tickets was promised to those riders agreeing to participate in postimplementation surveys. After a review of the questionnaires by the Transportation Systems Center and Peat Marwick, and subsequent pretesting, the final survey instrument was prepared. A copy of this survey form may be found in Appendix A of this memorandum.
The on-board survey was conducted over a two week period in May 1982. The contract issued by Tri-Met to the survey firm required that a minimum of 5,000 usable on-board surveys and 2,000 mailback surveys be completed and returned. The total number of surveys distributed by the survey firm to bus riders was 13,308. Of these, 6,108 or 46 percent were analyzed. Although 4,176 mailback surveys were completed only 3,365 were analyzed. This difference may be attributed to the elimination of 311 mailback surveys when corresponding on-board surveys were not coded because of budget limitations and a higher survey return rate than anticipated, and also to the elimination of 500 mailback surveys where the age and/or sex of the person completing it didn't match that from the on-board survey. In summary, of the average 167,028 boarding rides (excluding Owl Service), 8 percent were sampled. useful responses to the on-board survey accounted for 3.7 percent of average weekday ridership as compared to 2.0 percent for the mailback portion.
Sampling Procedures
Routes and buses on which the rider survey was distributed were randomly selected within stratifications by route type, and were representative of Tri-Met ridership. The survey sampling frame was checked for day of the week (weekday/Saturday or Sunday): time of day (peak hour or off-peak); geographic sector of the city; and type of route (regional trunkline, urban radial, local radial, grid feeder, or crosstown). The sampling
II.21

process was conducted by surveyors operating in three work shifts: 6 a.m. to 2 p.m.; 2 pQm. to 10 pem.; and a split 6 a.m. to 10 a.m./3 p.m. to 7 p.m. shift ove~ a two week period. Surveyors were assigned to a simple bus all day.
Validation of Rider Survey Data
At the time Peat Marwick received the data from Tri-Met, the raw rider survey data had not yet been validated against actual ridership characteristics~ Therefore, Peat Marwick compared the distribution of returned on-board surveys according to their route, geographic, and weekday/weekend characteristics with data from Tri-Met's Quarterly Line Performance Report (Spring 1982). Exhibit II-14 summarizes the results of this comparison. The characteristics of riders returning surveys reasonably approximate the comparable actual ridership characteristics with the following two exceptions: (1) weekend riders are over-represented as compared to weekday riders; and (2) feeder bus route riders are under-represented, while local radial routes are over-represented. Tri-Met has hypothesized that the lower survey response rate from feeder bus riders may be partly due to the relatively shorter average travel distances, and therefore limfted time, such riders would have to complete an on-board survey. Although Peat Marwick didn't compare the time-of-day distribution of returned surveys with the actual distribution, Tri-Met did and found an excellent fit for the a.m. and p.m. peaks.2
In the following section the results of the on-board and rnailback portions of the survey will be discussed. In this preliminary analysis, all survey responses have been analyzed as a single group, i.e., no attempt has been made to separately analyze weekend and weekday riders or surveys from a particular geographic area or group thereof. After the completion of post-implementation data collection, if it is deemed desirable to stratify and analyze the survey results in this manner, it can be easily done. Moreover, this survey sample has not been expanded for the preliminary analysis. Therefore, all results should be referenced to the survey sample rather than the total ridership. The survey sample, however, appears representative of total Tri-Met ridership based on the previously cited, albeit limited, comparisons of rider characteristics.
1 Telephone conversation with Mr. Phil Selinger, Tri-Met, November 4, 1982.
2 Telephone conversation with Mr. Phil Selinger, Tri-Met, October 25, 1982.
II.22

EXHIBIT 11-14
PRELIMINARY VALIDATION OF RAW RIDER DATA FROM PRE~IMPLEMENTATION ON-BOARD SURVEY WITH TRI-MET QUARTERLY LINE PERFORMANCE REPORT (SPRING 1982)
QUARTERLY LINE PERFORMACE REPORT ON-BOARD SURVEY RESPONSE ROUTE TYPE
AVERAGE WEEKDAY RIDERS PERCENT RIDERS PERCENT
REGIONAL 41069 24.6 1646 26.9
URBAN RADIAL 88198 52.8 3022 49.5
PEAK 3586 2.2 114 1.9
LOCAL RADIAL 17392 10.4 914 15.0
FEEDER 16783 10.0 412 6.7
QUARTERLY LINE PERFORMANCE REPORT ON-BOARD SURVEY RESPONSE
GEOGRAPHIC REGION AVERAGE WEEKDAY RIDERS PERCENT RIDERS PERCENT
EAST 103300 62.5 3897 63.8
SOUTHEAST 8670 5.2 507 8.3
SOUTHWEST 23274 14.1 884 14.5
NORTHWEST 8933 5.4 104 1.7
WEST 21062 12.7 716 11.7
QUARTERLY LINE PERFORMANCE REPORT ON-BOARD SURVEY RESPONSE DAY-OF-WEEK
PERCENT OF RIDERS PERCENT OF RIDERS
WEEKDAY 89.8 84.7
WEEKEND DAY 10.2 15.3
Source: Tri·Met Bus Rider Survey, May and June, 1982 (ON-BOARD)
11.23

survey Results and Interpretation1
The results of the on-board and ~ailback surveys are presented together in order to discuss the findings in a topical or issue-oriented format. Findings are presented in the following order:
. Survey Demographics and General Travel Characteristics;
e Fare Payment Characteristics and Rider Attitudes Toward the Fare Collection System;
. Rider Attitudes toward Fare Evasion and Enforcement; and
. Effectiveness of Tri-Met Marketing and Public Information Efforts.
Survey Demographics and General Travel Character1St1cs
In order to gauge how representative the on-board and mailback portions of the rider survey are of the actual Tri-Met rider population, and also to examine possible relationships between demographic variables (e.g., income, sex, age, etc.) and rider travel behavior or attitudes, demographic and travel behavior data was collected. Exhibits II-15 and II-16 present this data. Examination of Exhibit II-15 shows that with respect to age and gender, respondents to both the on-board and mailback portions of the survey had relatively similar characteristics. Moreover, these results are generally consistent with those reported in a Spring 1980 transit ridership survey which showed that 52 percent of all riders are female (compared to 57.2 percent of riders completing the on-board survey and 59.9 percent of riders completing the mailback survey) and 70 percent of all transit trips are made by persons between the ages of 16 and 44 (compared to 75 percent of riders completing the on-board survey and 73 percent of riders completing the mailback survey).2 Data on rider income was requested only in the on-board portion of the survey. The distribution of rider incomes shows that Tri-Met draws its ridership from a broad spectrum of income groups.
1 The response to each question on the pre-implementation surveys may be found in the computer printout in Appendix c.
2 Tri-Met, Five Year TDP 1980-1985, Reference to Tri-Net Attitude and Awareness study, April 1980, p. III.7.
II.24

EXHIBIT 11-15
TRI-MET BUS RIDER SURVEY DEMOGRAPHICS
CHARACTERISTICS ON-BOARD (%) MAIL BACK (%)
GENDER
MALE 42.8 40.1 FEMALE 57.2 59.9
AGE
15 OR UNDER 4.4 3.4 16 TO 24 34.6 29.8 25 TO 44 40.4 43.2 45 TO 64 14.7 17.2 65 OR OVER 5.8 6.3
INCOME
UNDER $5000 19.5 $5000 TO $9,999 18.2 $1 0,000 TO $14,999 18.9 $15,000 TO 24,999 21.2 $25,000 OR MORE 22.2
Source: Tri-Met Bus Rider Survey, May and June, 1982 (On-Board/Mail Back)
11.25

EXHIBIT 11-16
TRicMET BUS RIDER SURVEY TRAVEL CHARACTERISTICS
Average Number of Bus Trips Per Week By Purpose (Each Direction)
Work
Shopping
School
Social/Recreational
Usual Time Bus Ridden Percent Of Riders
Rush Hour
Mid-Day
Evening/Night
Saturday or Sunday
7.12
2.05
4.10
3.24
56.3
21.7
4.2
15.9
Most Frequently Used Bus Routes Percent Of Riders*
Regional 47.3
Urban Radial 28.4
Peak 3.4
Local Radial 6.7 Feeder 14.3
* Based on the first of three bus lines cited by riders in response to this question
Source: Tri-Met Bus Rider Survey, May and June, 1982 (On-Board)
II.26

Exhibit II-16 highlights some basic travel characteristics of Tri-Met bus riders. It should be noted that the questions asking the usual travel times of riders, and the bus routes they use most frequently are primarily indicators of rider familiarity, therefore they do not correspond exactly to comparable distributions based on survey responses~! When riders were asked in the on-board survey to cite the three bus lines they used most often, the distribution of responses for the first bus line cited, by route type, was nearly identical to the comparable distribution from the returned on-board surveyse
Fare Payment Characteristics and Rider Attitudes toward the Fare Collection system
Both the on-board and mailback portions of the rider survey asked riders to indicate their usual means of fare payment; however, more than one answer was permitted on the on-board portion of the survey. This somewhat limits the comparability of responses from the two surveys. Exhibit II-17 summarizes the fare payment characteristics of Tri-Met riders who responded to the survey. Of the 6,108 riders who completed the on-board portion of the survey; 40e5 percent usually paid their fare by cash; 12e9 percent usually paid by ticket; and 53.0 percent usually paid by pass.2 Comparable figures for the mailback survey, based on 3,365 responses, were 33.4, 10.1 and 56.5 percent, respectively.
Riders were asked, in the on-board survey, to indicate their usual fare amount and means of payment. Their response to this question is shown at the bottom of Exhibit II-17. Nearly one-half of all riders usually pay a two-zone or $0.65 fare, and an additional 25 percent of all riders pay a three-zone or $e90 fare. It may also be observed that within the groups of pass and ticket users, greater proportions of fares (29.3 percent for passes and 27.3 percent for tickets) are used for three-zone or $0.90 fares than those for cash fares (only 17.2 percent). This suggests that riders paying three-zone or $0.90 rides tend to rely more heavily on passes and tickets than riders traveling two-zones or less or at lower fares.
1 The returned survey distributions were discussed earlier in the section "Validation of Rider Survey Data."
2 The total doesn't add to 100 percent since more than one response was permitted.
II.27

FARE PAYMENT TYPE
CASH
TICKET
PASS
FARE AMOUNT
$0.65 (2 .. zone)
$0.90 (3mZone)
$0.45 (Youth)
$0.25 (Honored Citizen)
$1.00 (Vancouver)
Multiple
Other
EXHIBIT 11-17
FARE PAYMENT CHARACTERISTICS OF TRI-MET BUS RIDERS
ON-BOARD MAIL BACK
PERCENT OF RIDERS
40.5 33.4
12.9 10.1
53.0 56.5
PERCENT OF PERCENT OF PERCENT OF ALL RIDERS CASH RIDERS TICKET RIDERS
48.9 49.7 50.7
24.5 17.2 27.3
15.3 16.1 10.9
5.6 7.9 6.0
0.8 1.1 0.6
3.3 7.1 3.7
1.6 1.0 0.8
PERCENT OF PASS RIDERS
47.9
29.3
15.7
3.8
0.6
0.4
2.3
The On-Board Survey total doesn't add to 100% since multiple answers allowed. The mail back survey total is slightly under 100% since 24 riders didn't answer the question.
Source: Tri-Met Bus Rider Survey, May and June, 1982 (On-Board/Mail Back)
11.28

Several crosstabulations were performed relating the type of fare payment li.eo, cash, ticket, or pass) to various rider characteristics. Key findings are highlighted below: .
. In a crosstabulation of the type of fare payment with rider age, it was found that cash use is higher for riders age 65 or more than other age groups (51.2 percent versus 34.8 percent overall). Moreover, pass use for riders age 65 or more tends to be correspondingly lower than that for other age groups (28.2 percent versus 48.6 percent overall);
. In crosstabulating the type of fare payment with family annual income, it was found that the use of cash fares declines dramatically with rising income. Cash fares decline from 40 percent for riders with family incomes under $5,000 to 29 percent for riders with family incomes over $25,000 or by more than 27 percent. Ticket and pass use rise with increasing family income, ticket use rising from 6 percent for incomes below $5,000 to 13 percent for incomes above $25,000 and pass use rising from 43 to 53 percent over the comparable range of family incomes.
Transfer usage and Rider Attitudes
Tri-Met riders use 4 transfer slips per week on the average. It has been suggested by various transit professionals and others that transfers are viewed by many riders as a major inconvenience in using transit. When those riders who normally use cash or bus tickets to pay fares were asked whether they found transfers inconvenient, 44 percent of those responding indicated that they feel transfers are very convenient. A relatively small percentage, less than 11 percent, considered transfers inconvenient. The remaining 45 percent were somewhat more uncertain in their attitudes, although there was a definite tendency to perceive transfers as being a convenient mechanism for changing buses. Exhibit II-18 portrays the attitudes of those riders who pay their fare through the use of cash or tickets toward transfers.
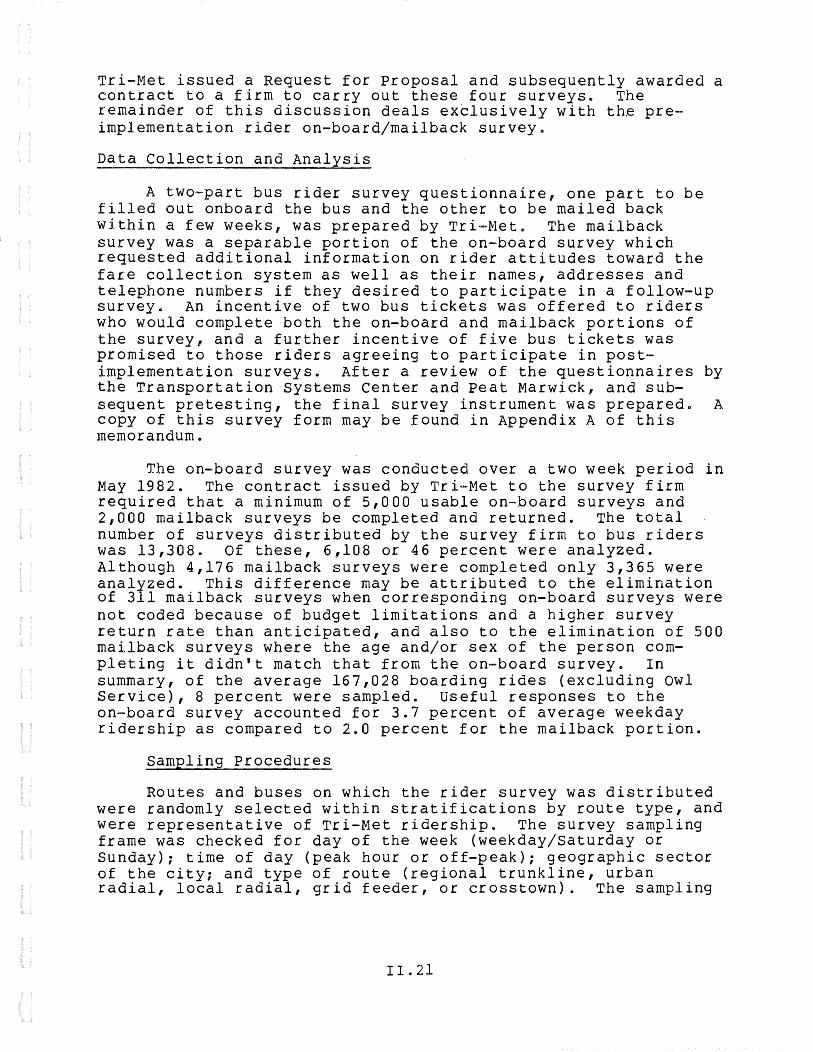
Riders who felt that transfers were inconvenient were asked, "Why do you feel that way?" Exhibit II-19 summarizes their response. Lack of understanding of how or when to use
1 These crosstabulations maybe found in the computer printout for the Tri-Met Bus Rider Survey in Appendix B.
II.29

40 -
0 30 ~ a: w Q
~ ..... w ::.::: (.)
t= 0 ;::) m a: 0 20 1--
:t: 0 < (.)
LL 0 ..... z w (.) a: w a..
10 -
0
EXHIBIT II e 18
CONVENIENCE OF TRANSFERS TO TRI-MET RIDERS USING CASH OR BUS TICKET FARES
1 2 I I
3 4
NOT CONVENIENT
CONVENIENCE OF TRANSFERS
5 VERY
CONVENIENT
Source: Tri-Met Bus Rider Survey, May and June, 1982 (On-Board)
11.30
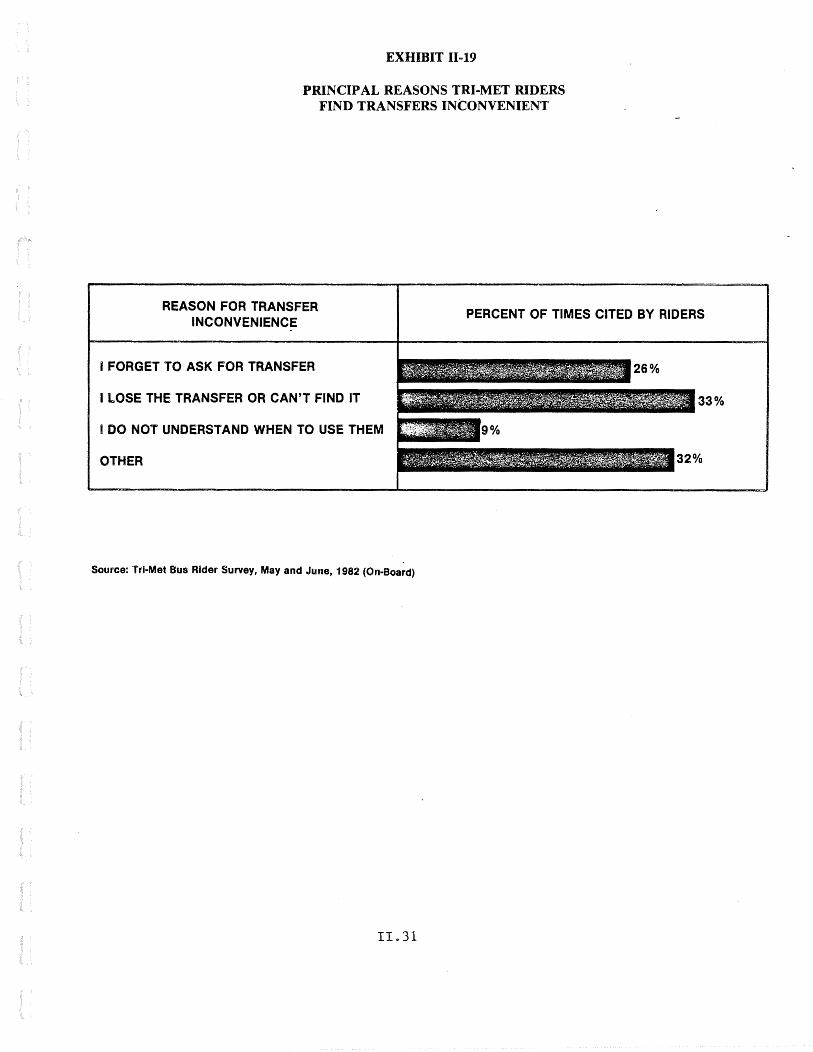
EXHIBIT II~ 19
PRINCIPAL REASONS TRimMET RIDERS FIND TRANSFERS INCONVENIENT
REASON FOR TRANSFER INCONVENIENCE
I FORGET TO ASK FOR TRANSFER
I LOSE THE TRANSFER OR CAN'T FIND IT
I DO NOT UNDERSTAND WHEN TO USE THEM
OTHER
Source: Tri·Met Bus Rider Survey, May and June, 1982 (On-Board)
II.31
PERCENT OF TIMES CITED BY RIDERS

transfers appears to be relatively less significant reason for finding transfers inconvenient than fprgetting to ask for them or losing them.
Pass and Bus Ticket Purchase Patterns and Att1tudes
In order to ensure that the potential benefits of selfservice fare collection are realized, it is vital that the vending distribution system for tickets and passes be designed to encourage their purchase by transit riderse Tri-Met ticket and pass riders were asked, "Where do you usually buy your pass or bus tickets?" Their response is shown in Exhibit II-20e Tri-Met's customer assistance offices provide tickets or passes to nearly 34 percent of such riders and they are the primary vendors. Another 25 percent of those riders usually purchase tickets and passes from bank and savings and loan offices. Together, these two sources distribute tickets or passes to 59 percent of ticket and pass users that responded to the surveye
Crosstabulating the fare level, and then the type of pass, with the vendor source showed that:
e Tri-Met's customer assistance offices provide tickets and passes to a much broader range of fare levels than bank and savings and loan offices, i.e., 93 percent of bank and savings and loan pass and ticket sales are $0e65 or $0o90 as compared to 80 percent for customer assistance offices; and
e Bank and savings and loan offices in combination with customer assistance offices provide 61 percent of two-zone passes and 63 percent of three-zone passes.
Increasing the market penetration or share of pass and multi-ride ticket users may require that additional vending sources; characterized by high availability, more convenience and low operating or maintenance costs, be promoted or provided by Tri-Met. cash riders were asked about their willingness to purchase bus tickets or passes if they were readily available from vending machines. Sixty-seven percent of current cash riders said they would be more likely to purchase passes or tickets under such circumstances, their primary reasons being greater convenience (67 percent) and increased availability (66 percent). Of those cash riders who said they would not purchase tickets or passes from vending machines, 52 percent prefer paying cash, 40 percent don't trust vending machines, and 21 percent felt comfortable with their current practice of paying cash. Although marketing and public information efforts, and also increased positive experience in using vending
II.32
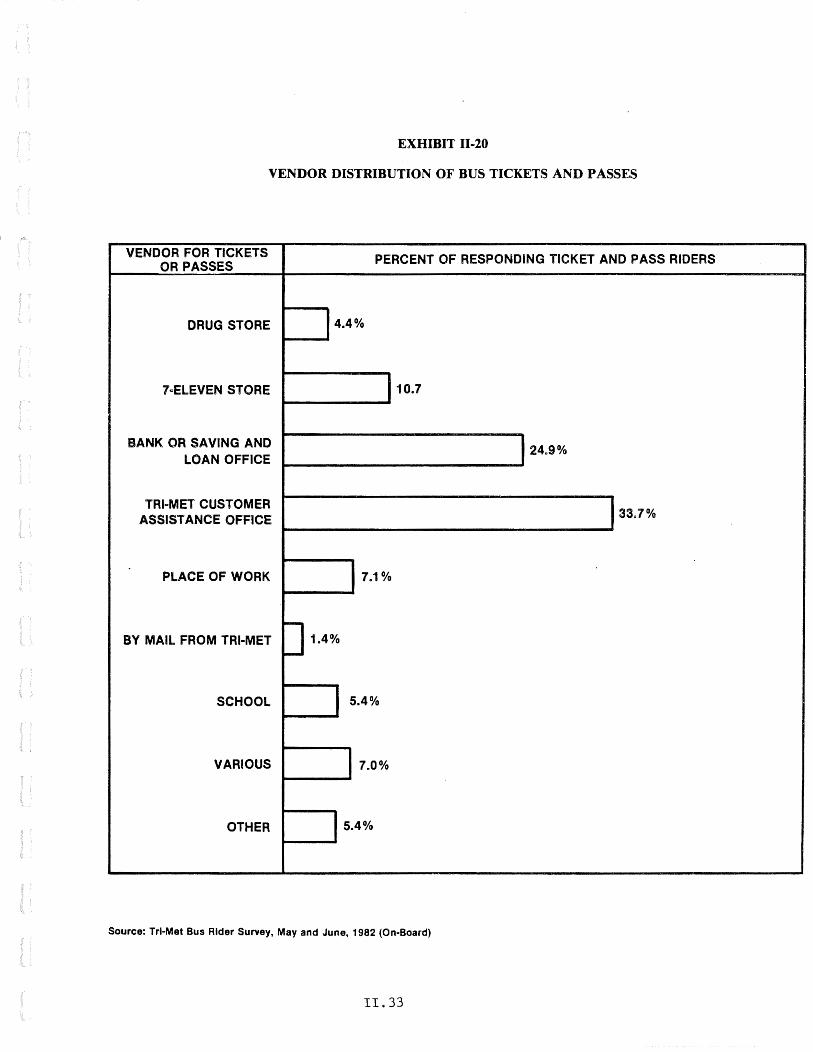
EXHIBIT 11-20
VENDOR DISTRIBUTION OF BUS TICKETS AND PASSES
VENDOR FOR TICKETS OR PASSES
DRUG STORE
7 .. ELEVEN STORE
BANK OR SAVING AND LOAN OFFICE
TRI·MET CUSTOMER ASSISTANCE OFFICE
PLACE OF WORK
PERCENT OF RESPONDING TICKET AND PASS RIDERS
J 4.4% ~-----
110.7 ...... ____ _..
J 24.9%
~------------------------
133.7%
~--------------------------------~
J 7.1% .,..._. ___ ...... BY MAIL FROM TRI-MET D 1.4%
SCHOOL J 5.4% ~----
VARIOUS 17.0% .,.._ __ ..... OTHER 15.4%
t-----
Source: Tri·Met Bus Rider Survey, May and June, 1982 (On-Board)
II.33

machines, may be used to encourage people to purchase bus tickets and passes from vending machines, convincing cash users who prefer to pay in cash or who are comfortable with their current practice presents a greater challengee Exhibit II-21 illustrates these points.
It has been hypothesized that if transit riders could purchase bus tickets or passes through the use of major credit cards from vending machines more riders would elect to do soe When asked this question, only 31 percent of responding riders said they would use a credit card to purchase bus tickets or passes. As shown in Exhibit II-22, the major categories of riders who would not use a major credit card for purchasing bus tickets or passes from vending machines comprise those who do not have a credit card (39 percent) and those who prefer cash (25 percent). Only 7 percent of survey respondents felt they would not use a credit card to purchase tickets from a vending machine because of limited confidence in the technology.
In trying to increase and maintain the proportion of transit riders using monthly passes, which is a prerequisite for maximizing the potential benefits of self-service fare collection, Tri-Met sought to obtain information on current barriers to using passes. Pass users were asked if showing their passes to drivers is inconvenient. Slightly more than 8 percent of those riders who answered this question answered in the affirmative. For these people, self-service fare collection may make using a pass a more attractive option; nevertheless, they comprise a relatively small fraction of total pass users who usually do not mind showing their passes to drivers.
Cash and bus ticket riders were asked, "Why do you pay for individual rides rather than purchase a monthly pass?" Exhibit II-23 presents their response. Nearly one-half responded that they don't ride the bus often enough to need a pass. No more than 10 percent of responding riders cited any other single reason, although 10 percent felt that bus passes were to expensive and 8 percent felt that pass outlets were inconvenient to access.
Tri-Met riders were asked, "What discount, if any, do you think purchasers of ten-ride tickets should receive?" About 91 percent of those riders responding felt a discount should be offered to riders purchasing ten-ride tickets in advance. Of these, 59 percent felt a 10 to 20 percent discount would be most appropriate, while 30 percent didn't know what discount should be provided. Exhibit II-24 presents the distribution of rider responses to this question. When self-service fare collection was initiated, Tri-Met began to offer ten-ride tickets for two
II.34

H H . w lJl
EXHIBIT 11-21
LIKLIHOOD OF CASH RIDERS PURCHASING BUS TICKETS OR PASSES IF READILY AVAILABLE FROM VENDING MACHINES
AND THEIR REASONS
I PERCENT OF CASH RIDERS - J
SOUNDS MORE CONVENIENT (7 4%)
COULD BUT THEM ANYTIME (66%)
MORE LIKELY TO PURCHASE PASSES OR TICKETS (67%)
OTHER(9%)
NOT MORE LIKELY TO PURCHASE PASSES OR TICKETS (33%) PERFER PAYING CASH (52%)
COMFORTABLE WITH CURRENT PRACTICE (21 %)
DON'T TRUST VENDING MACHINES (40%)
OTHER (15%)
Source: Tri·Met Bus Rider Survey, May and June. 1982 (Mall Back)

H H
w 0\
EXHIBIT 11-22
WILLINGNESS OF TRI-MET RIDERS TO PURCHASE BUS TICKETS OR PASSES FROM VENDING MACHINES
ACCEPTING MAJOR CREDIT CARDS
WOULD NOT PURCHASE BUS TICKETS OR PASSES (69%)
FROM VENDING MACHINES WITH CREDIT CARDS
WOULD PURCHASE BUS TICKETS OR PASSES (31 %)
FROM VENDING MACHINES WITH CREDIT CARDS
Source: Trl-Met Bus Rider Survey, May and June 1982 (Mall Back)
PERCENT RIDERS UNWILLING TO PURCHASE PASSES OR BUS TICKETS USING A CREDIT CARD VENDING MACHINE
NO CREDIT CARD (39%)
PREFER CASH (25%)
DISTRUST MACHINE (7%)
INCONVENIENT (10%)
NO (OTHER) ( 3%)
NO REASON (13%)

50
40
CJ) a: w c a: .... w 30 ~ 0
H i= H . c l.0 z -......! <
:t: CJ)
< 0 20 LL 0 t-z w 0 a: w 0..
10
0
-
-
-
r-
r-
I I Don't Ride The Don't Know
Bus Often Enough Bus Passes To Need A Pass Were Available
EXHIBIT II -23
TRI-MET BUS RIDER REASONS FOR PAYING INDIVIDUAL RIDES RATHER THAN PURCHASING A MONTHLY PASS
Pass Sales Outlet lncon
velnent To Get To
I I Don't Know
Where To Buy Passes
Passes Are To Expensive
Pass Not Fully Used Due To
Schedule Uncertainty
I Beyond Budget
I
Source: Tri-Met Bus Rider Survey, May and June, 1982 (Mall Back)
Poor Value Various Other
c:J z 2i z 0 a., tJ) w
30
a: 20 fi'J a: w c ;: ..... w ::e • a: .... u. 0 1-ffi 10 0 a: w a..
0
-
-
~
-
EXHIBIT 11-24
RIDER ATTITUDES ON DISCOUNTS FOR ADVANCE PURCHASE OF TENcRIDE TICKETS
J I No Dtscount 5% or aoq: 10% or ssq: 20% or $1.30 Don't Know Other
Source: Tri-Met Bus Rider Survey, May and June, 1982 (On-Board)
II.38

zones at a 13~3 percent discount, for three zones at a 10.0 percent discount, and for four or more zones at a 8.0 percent discount. These discounts seem to coriservatively approximate the feelings of transit riders on the appropriate discount level.
Rider Attitudes toward the Fare Collection System and the Fare Structure
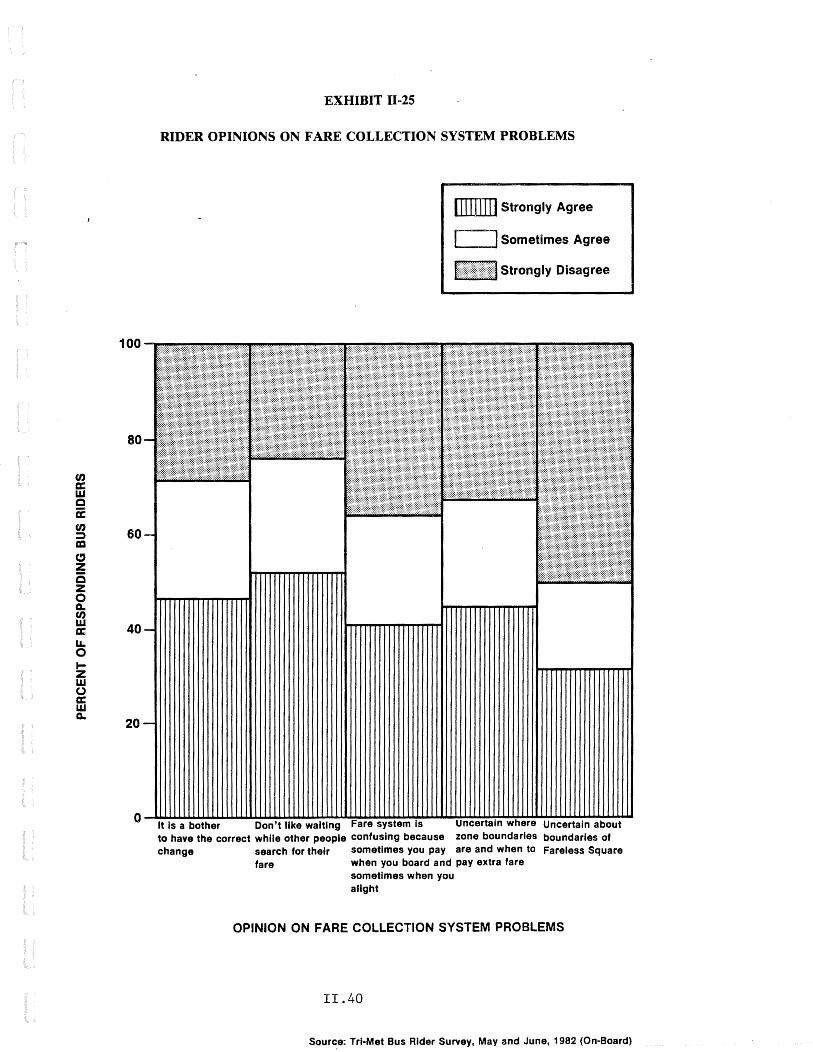
Tri-Met riders were asked their opinion on fare collection problems, and also on aspects of the fare structure, i.e., the number of zones, incremental fares, and factors which should be used in determining or setting fares. Exhibit II-25 highlights their opinions on five fare collection system problems often associated with the traditional fare collection system. A major problem is the additional delay imposed upon other riders while waiting for passengers to search for their fares. About 52 percent of responding bus riders agreed this was a problem with the fare collection system. It is generally believed that the introduction of high capacity articulated buses would have heightened the seriousness of this problem if the fare collection system was not changed to self-service fare collection. Forty-seven percent of responding riders found it inconvenient to have the correct change while 43 percent cited problems in determining zone boundaries and when to pay the extra fare. To the extent that self-service fare collection succeeds in shifting fare payment from single cash fares to passes and ten-ride tickets, these problems are likely to diminish.
When asked to indicate those factors which should be considered in determining fares, most riders indicated distance of the trip (62 percent of riders surveyed) and age (61 percent of riders surveyed) e The refined zone structure accompanying the introduction of self-service fare collection (four or more zones versus only three under the prior fare collection system) and the continuation of reduced fare Honored Citizen and Youth fares suggest that the new fare structure is responsive to those criteria Tri-Met riders feel should be considered in setting fares. Exhibit II-26 summarizes the attitudes of Tri-Met riders on these and other factors.
Tri-Met riders were asked, in two sequential questions which were related, "What do you feel the ideal number of fare zones should be and also what the incremental fare should be for each zone?" The largest percentage of responding riders, almost 33 percent, preferred three zones (e.g., downtown Portland, inside Portland, and outside Portland), however, more than 34 percent felt five or more zones would be most desirable. Only 10 percent felt that a single zone, i.e., a flat fare for everyone, was preferable. The distribution of rider attitudes on the optimal zone structure is shown in Exhibit II-27.
II.39
U) a: w c a: U) ;::::) CD c.::J z c z 0 a. U) w a: LL 0 1-z w 0 a: w a.
100
80
60
40
20
EXHIBIT Ila25
RIDER OPINIONS ON FARE COLLECTION SYSTEM PROBLEMS
1111111 [J Strongly Agree
..___ ..... I Sometimes Agree
lt::Iiii:Ii:i:II Strongly Disagree
0-~~~~~~~~~~~~~uw~~~~~~~~ It Is a bother Don't like waiting are system s Uncertain about to have the correct while other people confusing because zone boundaries boundaries of change search for their sometimes you pay are and when to Fareless Square
fare when you board and pay extra fare sometimes when you alight
OPINION ON FARE COLLECTION SYSTEM PROBLEMS
II.40
Source: Tri-Met Bus Rider Survey, May and June, 1982 (On-Board)

6
I~ :E c 5 <w
I en a: >w we >en a:z
1 ~8 zw ~ m 4 a:O W...l
lc::;, a:~ en en :;)a: =o
lljj 5 :E <C 3 ..:.u. a: .... 1-w
I ~~ 1-0 z::r:
o-
0-
0-
0-
~3: I~ 2
0-
1 o-
0 D1stance Of Trip
EXHIBIT II a26
PERCENT OF TRI-MET RIDERS IN SURVEY SAMPLE WHO FEEL FACTOR SHOULD BE CONSIDERED IN DETERMINING FARES
T T1me Of
Day
I Ability To
Pay
I Age
I Cost Of
Operating Route
I Amount Of Time For
Trip
FACTORS POTENTJALL Y CONSIDERED IN DETERMINING FARES
T
Source: Tri·Met Rider Survey, May and June, 1982 (Mall Back)
II.41
Other I

CJ z a: 0 > c( LL. 0 a: w c a: CJ z c z 0 a.. en w a: LL. 0 t-z w 0 a: w a..
30
20
10
0
-
.__
-
ONE ZONE (FLAT FARE)
I TWO ZONES
I
TRI-MET RIDER ATTITUDES ON OPTIMAL ZONE STRUCTURE
THREE ZONES
I FIVE
ZONES
ZONE STRUCTURE
I SEVEN OR
MORE ZONES
SOURCE: TRI-MET BUS RIDER SURVEY, MAY AND JUNE, 1982 (MAIL BACK)
II.42
l I
' DON T KNOW
I
' OTHER I
Tri-Met's choice of a five-zone system, only the first four of which count toward determining the fare, appears to balance the desire of riders to be charged fares on the basis of d.istance traveled with their overall concern for a simple zone structuree
Given their attitudes on the optimal number of zones, riders were asked to indicate what incremental fare was most appropriate for each additional zone traversed. Most riders, about 24 percent, felt a $0.10 incremental fare should be imposede overall, 74 percent of responding riders favored imposing incremental zone fares, while the remainder felt that fares should not change. Exhibit II-28 displays rider attitudes on incremental zone fares. It can be observed that more than 48 percent of riders favored incremental zones fares between $0.15 and $0.25. Tri-Met has decided to charge an incremental zone fare of $0.25, more than most riders felt appropriate.
A crosstabulation of the preferred number of zones with the suggested fare for each additional zone revealed the following:
0 Of those riders that felt one zone was preferred, 77 percent felt that fares should not change for each additional zone and 11 percent felt that a $0.05 incremental fare would be appropriate;l
As the number of preferred zones increase from two to seven or more, there is a gradual increase in the percentage of riders favoring lower incremental fares; i.e., for two zones 31 percent of riders feel $0.05 or $0.10 is appropriate versus 50 percent at seven or more zones; and
o Concurrently, as the number of preferred zones increase from two to seven, there is a gradual decrease in the percentage of riders favoring higher incremental fares; i.e., for two zones 32 percent of riders feel $0.20 or $0.25 is appropriate versus 17 percent at seven or more zones.
Rider Attitudes toward Fare Evasion and Enforcement
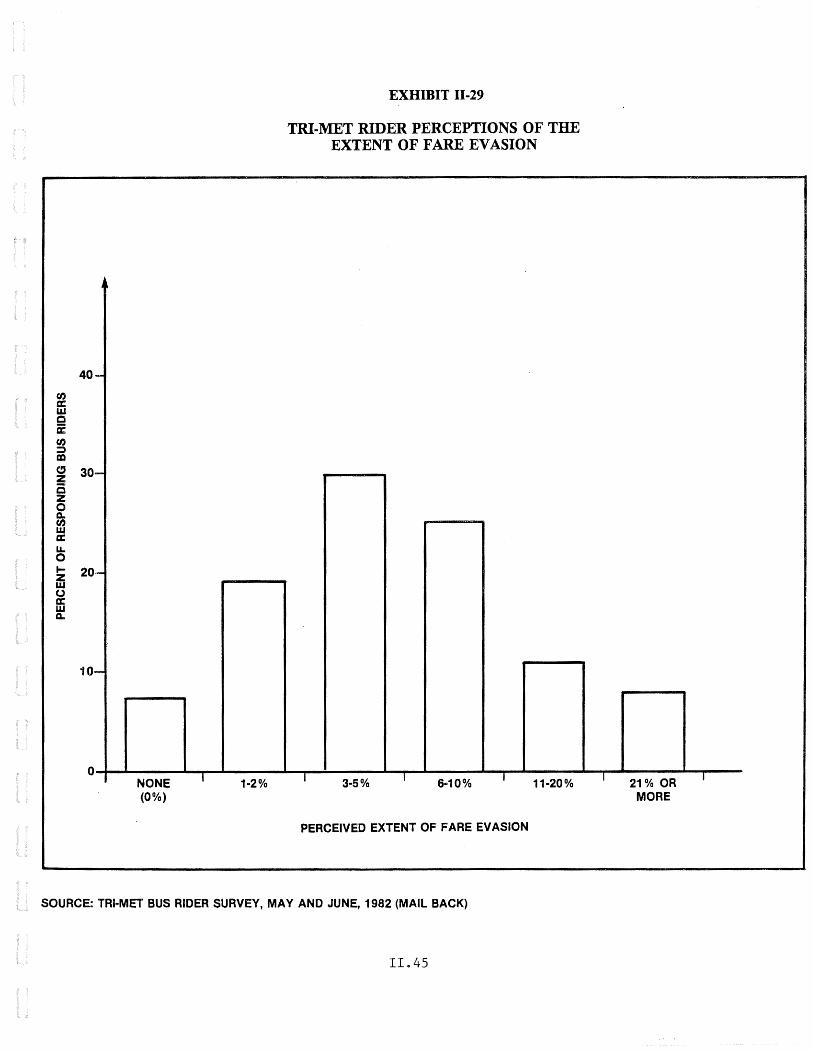
Exhibit II-29 characterizes the rate of fare evasion perceived by Tri-Met riders. Fifty-six percent of those riders
1 There may have been confusion in how riders interpreted the response "SHOULD NOT CHANGE" when asked how much they think fares should increase for each additional zone (i.e., in addition to the first zone or in addition to the number of preferred zones).
II.43

" z a: 0 30 > -
,c Lt. f/) a: w c a: " z c 20 z -0 a.. f/) w a: Lt. 0 .... z w 10 (.) -a: w a.
0 .05 l .10 I
EXHIBIT 11-28
TRI-MET RIDER ATTITUDES ON ffiCREMENTALZONEFARES
.15 I .20 I .25
INCREMENTAL ZONE FARE($)
SOURCE: TRI-MET BUS RIDER SURVEY, MAY AND JUNE, 1982 (MAIL BACK)
II.44
I NO I MULTIPLE I
CHANGE
UJ a: w Q
a: UJ ::;) m
40
Cl 30 z 2i z 0 0.. Cl) w a: LL 0
~ 20 w (.) a: w Q.,
10
0
-
-
·-
-
NONE (0%)
I 0 1·2 Yo
EXHIBIT 11-29
TRI-MET RIDER PERCEPTIONS OF THE EXTENT OF FARE EVASION
I - 0 3 5 Vo I 0 &-1 0 Yo I 0 11·20 Yo
PERCEIVED EXTENT OF FARE EVASION
SOURCE: TAl-MET BUS RIDER SURVEY, MAY AND JUNE, 1982 (MAIL BACK)
II.45
I 0 21 Vo OR MORE
I

responding to a question on the likely fare evasion rate felt that it was between 3 and 10 percent,. and of these more than half felt it was between 3 to 5 percent. These findings are consistent with those found in the Tri-Met Bus Operator survey {February 1982). Slightly less than 7 percent of riders felt that no fare evasion occurs.
Riders were asked, "Why do you think riders fail to pay the correct fare?" Of those riders who feel that fare evasion occurs, 69 percent felt that lack of correct change was a key reason for failing to pay the proper fare while 59 percent felt that others think that drivers can't or won't do anything. The latter reason is consistent with the results of the Tri-Met Bus Operator Survey {February 1982) in which more than 40 percent of Tri-Met's operators said they felt riders often or very often cheated because they "know the operator can't do anything if they are caught." The use of fare inspectors for monitoring and enforcement of fare payment under self-service fare collection may reduce fare evasion attributable to rider attitudes that "operators can't or won't do anything. Exhibit II-30 presents rider perceptions of the reasons for fare evasion.
Riders who believe fare evasion occurs were asked, "How do fare evaders typically underpay their fares?" Eighty-three percent believe that insufficient fare payment is one of the primary means. Forty-four percent of riders feel that the use of bad transfers is also frequently used to evade fares. Comparable results from the Tri-Met Bus Operator Attutude survey {Feburary 1982) reinforce the notion that bad transfers comprise a major means of fare evasion; however, operators tend to perceive wrong use of a two-zone pass for three zones and no three-zone cash fare as a more common occurrence than riders, while riders tend to perceive insufficient fare payment as a more common occurrence than operators. These different perceptions may result partly from the difficulty operators would be likely to have in estimating the number of passengers who pay insufficient fares. Exhibit II-31 highlights rider perceptions of the extent of fare evasion by type.
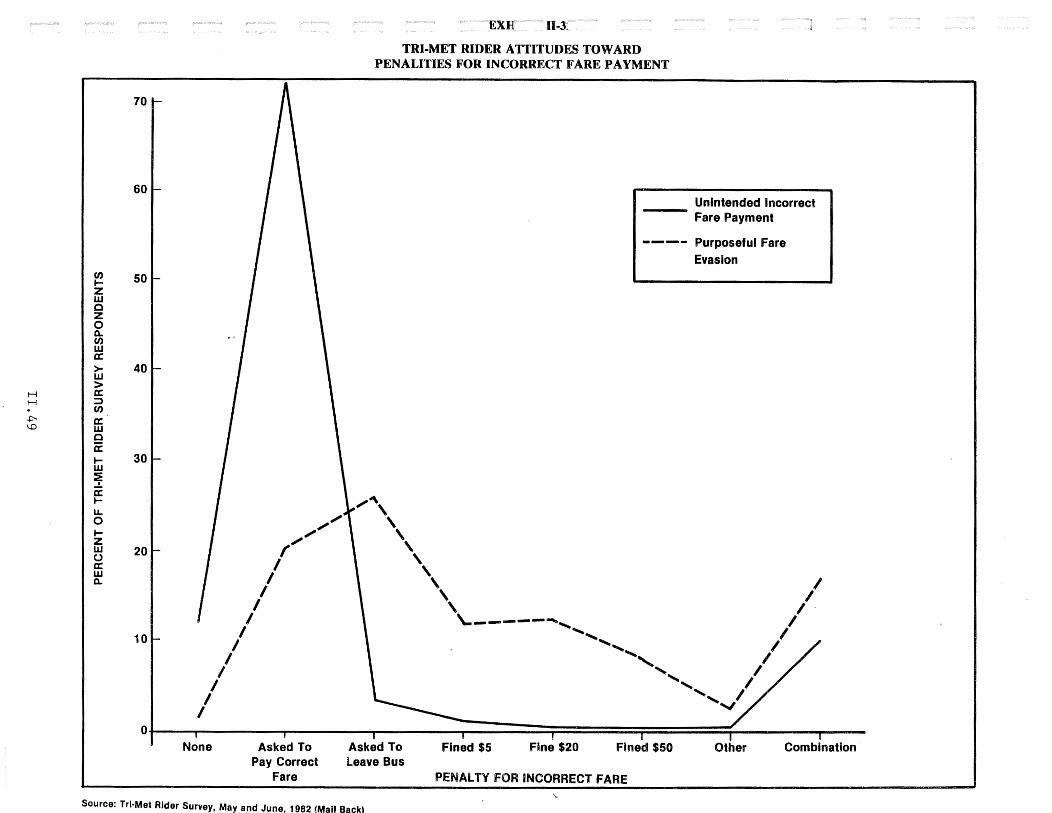
Exhibit II-32 compares rider attitudes on penalties for unintended fare evasion with their attitudes on penalties for purposeful fare evasion. The sharp differences between the two curves point out the need for Tri-Met to consider the general sympathy riders feel toward those who unintentionally pay incorrect fares and make sure that the enforcemeht and penalty system differentiate between intended fare evasion and unintended incorrect fare payment. For unintended incorrect fare evasion, 72 percent of riders feel that the fare evader should simply be asked to pay the correct fare. For willful fare evasion, the largest percentage of riders, nearly 26 percent, felt that the rider should be asked to leave the bus. Of the 33 percent of responding riders favoring imposition of a fine for purposeful cheating, 40 percent favored a $20 penalty.
II.46

H H . +:---......J
70
en 60 a: ;::) 0 0 0 z 0 u; c(
> 50 w w a: c( LL ....1 w w LL
I! 40
>-w > a: ;::) en en a: w 30 0 a: LL 0 t-z w 0 a: w Q. 20
10
0
-
-
-
-
-
-
-
THEY FORGET TO PAY
I
THEY DON'T HAVE
CORRECT CHANGE
_4{HIL. ~ a. ·30
TRI-MET RIDER PERCEPTIONS OF REASONS FOR FARE EVASION
THEY ARE CONFUSED BY ZONE SYSTEM
I
THEY SEE OTHERS
CHEATING
THEY THINK DRIVER CAN'T OR WON'T DO
ANYTHING
UNHAPPY WITH SERV·
iCE OR FARES
NO MONEY
SOURCE: TRI-MET BUS RIDER SURVEY, MAY AND JUNE, 1982 (MAIL BACK)
COMMON CROOKS
I I OTHER

(/'J a: ;:)
0 0 0 z 0 en c( > w w a: oc( u., -~
w w u.,
0 ::t:
== c w > w :> a: ;:) (/'J
en a: w Q
a: u., 0 .... z w 0 a: w a..
80% -
70% ·-
60% -
50% -
40% -
30% -
-
10% -
0%
"•
INSUFFICIENT FARE
I
EXHIBIT 11-31
TRI-MET RIDER PERCEPTIONS OF THE EXTENT OF FARE EVASION BY TYPE
BAD TRANSFER
I T NO PAYMENT WRONG USE
AT ALL OF 2-ZONE PASS FOR 3-ZONES
TYPE OF FARE EVASION
I MISUSE OF YOUTH OR HONORED
CITIZEN PASS
SOURCE: TRI-MET BUS RIDER SURVEY, MAY AND JUNE, 1982 (MAIL BACK) 11.48
I --SLUGS9 HALF
DOLLAR BILLS, ETC.
I FORGED
PASS
I
H H . ..r::--\.0
{/) .... z w c z 0 0.. {/) w a: > w >
I~ c a: .... w ~ a: .... LL 0 .... z w 0 a: w 0..
70
60
50
40
30
20
10
,~
// /'
I
/
,, ,,
EXE 11-3:
TRI-MET RIDER ATTITUDES TOWARD PENALITIES FOR INCORRECT FARE PAYMENT
""""'
Unintended Incorrect Fare Payment
---- Purposeful fare Evasion
\ I
\ / \\ I \ I \
--- I \..
-- --, I -- ,, ..... , I
-....., I ,, I ,,
.......,
0~~------~------~----~======~====~======~----~-------None Asked To
Pay Correct Fare
Asked To leave Bus
Fined $5 Fine $20 Fined $50 Other Combination
PENALTY FOR INCORRECT FARE '-.
Source: Tri·Met Rider Survey, May and June, 1982 (Mall Back)

Although the survey allowed riders to select only one penalty, 17 percent of riders checked a combin~tion of measurese If this had been clearly permitted, it is likely that the proportion of riders favoring this option would have been higher. Nevertheless, in view of the response of riders on appropriate penalties for fare evasion, the $20 penalty selected by Tri-Met is likely to be perceived by most riders as a relatively tough penalty.
Effectiveness of Tri-Met Public Information and Marketing Efforts
Tri-Met has expended considerable time and resources in trying to inform both its ridership and the general public about the planned shift to self-service fare collection and its potential benefits to riders and Tri-Met. Although the rider survey comprises only one aspect of the evaluation of the public information and marketing efforts for self-service fare collection, the results of the survey provide an early indication of their success.
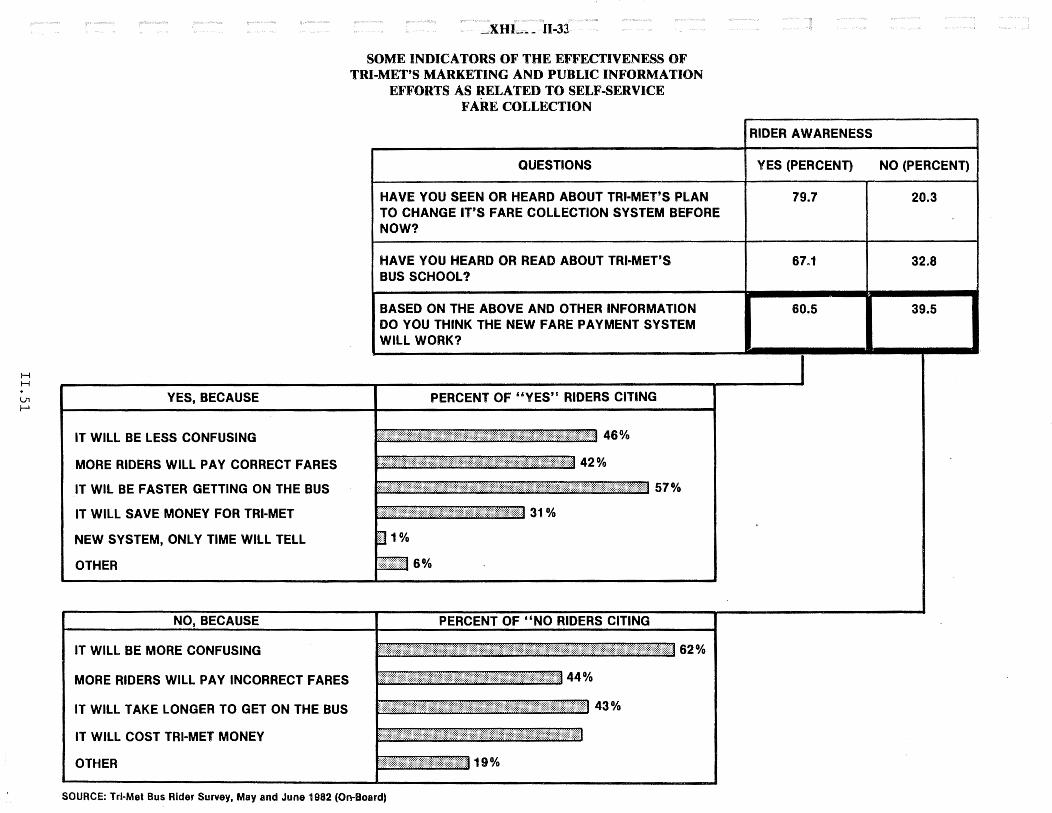
Exhibit II-33 shows the findings of the rider survey most pertinent to Tri-Met's marketing and public information programs. Nearly 80 percent of those riders surveyed were aware of Tri-Met's plan to introduce self-service fare collection.
·Moreover, 67 percent had heard or read about Tri-Met's bus school program to inform and educate both riders and the general public on the use of self-service fare collection equipment. Unfortunately, the fraction of riders familiar with plans to change the fare collection system exceeded those believing the new changes will work. Of those riders answering the question on whether or not self-service fare collection will be successful, 60 percent feel it wouldo These riders feel self-service fare collection will be successful because it will be faster boarding and alighting (52 percent) and less confusing (46 percent). Of those riders that believe self-service fare collection will not be successful, most felt that it would be more confusing.
OPERATING IMPACT STUDYl
It has been hypothesized that the introduction of highcapacity articulated buses on Tri-Met's more heavily patronized
1 Peat Marwick received three memorandums prepared by Tri-Met and relied heavily upon them for insight into dwell time and run time impacts: Mall Dwell Time survey (Spring 1981), Mall Running Time Survey (Spring 1981), and SSFC Operating Impact Study: Phases I and II (September 23, 1982). All analyses were redone and checked, and some modifications were made.
II.SO
H H
ln 1---1
YES, BECAUSE
IT WILL BE LESS CONFUSING
MORE RIDERS WILL PAY CORRECT FARES
IT WIL BE FASTER GETTING ON THE BUS
IT WILL SAVE MONEY FOR TRI-MET
NEW SYSTEM, ONLY TIME WILL TELL
OTHER
NO, BECAUSE
IT WILL BE MORE CONFUSING
MORE RIDERS WILL PAY INCORRECT FARES
IT WILL TAKE LONGER TO GET ON THE BUS
IT WILL COST TRI·MET MONEY
OTHER
_XHJ ___ H-3J
SOME INDICATORS OF THE EFFECTIVENESS OF TRI-MET'S MARKETING AND PUBLIC INFORMATION
EFFORTS AS RELATED TO SELF~SERVICE FARE COLLECTION
QUESTIONS
HAVE YOU SEEN OR HEARD ABOUT TRI·MET'S PLAN TO CHANGE IT'S FARE COLLECTION SYSTEM BEFORE NOW?
HAVE YOU HEARD OR READ ABOUT TAl-MET'S BUS SCHOOL?
BASED ON THE ABOVE AND OTHER INFORMATION DO YOU THINK THE NEW FARE PAYMENT SYSTEM WILL WORK?
PERCENT OF "YES" RIDERS CITING
~:~~~rr~rrtr~:r=:~===r~r~~=~t~t:~:tt=~=~=~:=~r:=~:r:~:::~=~=~=::::::~::::::=~=~::~Irt:::::=:~=:=~=~=::::::::::rt:=:::::::?}:J 4 6 %
=ttt:trrrr:~::~:rTIIIJIIIFmrr:~=rm;rr:rr?:wr:wrmnm 42%
PERCENT OF "NO RIDERS CITING
l:ttt==t:t\ttt:\tttt=t:ttt/\tttrttttttttr::=r:=::t:::=titt:\:=::rr:t:::tt\tt\t:trt:=tt=t\W\ttttJ 62%
l:r:=t:::rr=r:r::rmr:::tr::rr:::t:r::=::tr::r::r:::t:tf:tit:(::r:::r:rr::=t:l 44%
l:ttttttt:r:;.:=tttittt::::r::t{tttt=ttr:=:==tttt\t:\:\ttt':i=:trrwl 43 %
.JimiTfJITlttt:r::::::::=t::tJ19%
SOURCE: Trl-Met Bus Rider Survey, May and June 1982 (On-Board)
RIDER AWARENESS
YESWERCENn NOWERCENn
79.7 I 20.3
67.1 I 32.8
60.5 I 39.5
I

routes will increase overall bus travel times because of (1) higher dwell times from increased boarding and alighting volumes past a single door and (2) gr~ater bus interference from operational difficulties associated with longer articulated busese In recommending the adoption of self-service fare collection, Tri-Met argued that it would counter the effects of increasing travel times on articulated buses by decreasing dwell time per passenger, i.e., passengers would be able to board through all doors. Moreover, it was pointed out that dwell time per passenger on standard buses would also be reduced. If lower dwell times, and therefore bus travel times were realized, a decrease in total driver hours while maintaining existing service levels would be possible. This would permit operator productivity to rise.
The operating impact study consists of the following three phases or stages:
c Phase I - Mall Dwell and Running Time survey. Conducted prior to placing articulated buses in service and before implementation of self-service fare collection to measure dwell and running times of standard buses in the traditional fare collection mode (Spring 1981);
Phase II - Mall and Non-Mall Dwell and Running Time survey. Conducted before self-service fare collection but with ~ large proportion of the 87 articulated buses in service to measure dwell and running times of a mix of buses in the traditional fare collection mode. Select combined line dwell and running time studies were also conducted (Spring 1982); and
. Phase III - Dwell and Running Time survey. Conducted after implementation of self-service fare collection and all articulated buses are in revenue service, to measure a mix of buses in self-service fare collection operation. ,select combined line dwell and running time studies on the same routes as in Phase II will also be conducted before and after comparison (Spring 1983).
Data Collection and Analysis Approach
Phase I and II of the operating impact study have been completed; however, data from the Phase II survey dealing with combined line dwell and running times is not in a suitable form for analysis at this time. Both Phase I and Phase II focused largely on the Downtown Transit Mall since this is where the greatest travel volumes occur, and therefore where the greatest operating impacts of self-service fare collection and articulated buses are likely to be observed.
II.52

Dwell Time Survey
The dwell time survey is designed to measure the .impacts of self-service fare collection and articulated bus operation on bus dwell times. The following two hypotheses will be tested:
. Operation of articulated buses in a traditional fare collection mode increases bus dwell times because of higher passenger boarding and alighting volumes past a single door, relative to that for standard buses; and
. Self-service fare collection reduces average bus dwell time, particularly for articulated buses, because of the use of all doors for boarding and alighting.
Dwell time is the total time a vehicle spends stopped at a station or stop. Dwells may influence headway, patronage, and average travel speeds. Boarding and alighting comprise the largest portion of total dwell and have a high variability based on the fare structure and passenger queuing. Passenger queuing, in turn, is influenced by the bus load, vehicle design (particularly the number, width and placement of doors), and stop or station design (e.g., passenger waiting area).
Phases I and II survey locations and the number of bus lines passing each location are summarized in Exhibit II-34. The survey was conducted for two time periods: Midday (10:00 a.m. - 11:30 a.m.--lunch hour was avoided to eliminate Fareless Square activity) and P.M. Peak (4:30 p.m. -5:30p.m.). Observers were positioned at the locations specified in Exhibit II-34 and asked to record route and bus numbers, boarding and alighting counts through front and back doors, estimated bus loads (upon departing a stop) and bus dwell time. Timing began after the bus came to a complete stop or the front door was opened; however, for those rare cases where the only activity was rear door alighting (requiring the passenger to manually open the door) timing began when the bus came to a complete stop (usually simultaneous with rear door opening, but occasionally there was a delay due to standing passenger loads or tardiness of the passengers queuing to alight).
Timing was terminated based on various conditions. Since drivers often keep the front door open while waiting for traffic signals, closing the front door cannot be used in all cases to end timings. Therefore, if boarding passengers constituted the end of dwell time activity, timing would end when the final boarding passenger (excluding stragglers) paid a fare, collected a transfer slip or generally cleared their presence with the driver. If alighting passengers constituted the final dwell
II.53

EXHIBIT II-34
DWELL TIME SURVEY LOCATIONS
PHASE I SURVEY LOCTIONS
On-Mall
Beaver stop: s.w. 5th at Alder Beaver stop: s.w. 5th at Salmon Snowflake stop: s.w. 6th at Morrison Snowflake stop: s.w. 6th at Oak
Cross-Mall
s.w. Morrison at 6th s.w. Yamhill at 4th
PHASE II SURVEY LOCATIONS
On-Mall
Rose stop: s.w. 5th at Taylor Deer stop: s.w. 5th at Alder Fish stop: s.w. 6th at Alder Snowflake stop: SoW. 6th at Morrison
Cross-Mall
SeW. Washington at 5th s.w. Salmon at 3rd
Major Transfer Points
Barbur Transit Center S.E. 39th and Hawthorne N.W. 23rd and Lovejoy N.E. 42nd and Sandy Blvd. s.w. Commercial and Main, Tigard s.w. Capital Highway and Sunset Blvd.
Shopping Center
Lloyd Center: N.E. 11th and Multnomah
II.54
BUS LINES
9 9 8 8
6 6
8 8 6 6
6 6
4 3 2 4 4 4

activity, timing ended as soon as the last passenger exited the front or rear door. Surveyors were asked to exclude not only stragglers but also others boarding while a bus waited for a traffic signalo In addition, they were asked to note excessive time spent by drivers giving instructions to riders and eliminate this time so as to avoid skewing the results.
Oftentimes groups of buses arrive at stops simultaneously. Survey observers were asked to select the first bus in each group to keep the data more random.
Running Time survey
The objective of the running time survey is to measure the impacts of self-service fare collection and articulated bus operation on run times. The following two hypotheses will be tested:
• Operation of articulated buses in a traditional mode of fare collection increases bus dwell times because of higher boarding and alighting volumes past a single door relative to that experienced with standard buses; and
. Self-service fare collection reduces average bus dwell time and overall run time, particularly for high capacity articulated buses, because of the use of all doors for boarding and alighting.
The method of fare collection has a direct effect on bus dwell time and a consesequent effect on run time. The running time survey is measuring the same time changes as the dwell time survey except the time impact is measured over a distance, and the effect of changes in dwell time on vehicle movement in and out of bus stops is also measured~
Observers were positioned on Fifth Street, at the intersections of Pine and Madison, and on Sixth Street at the intersections of Main and Burnside. The survey was conducted for two time periods: Midday (10:30 a.m.- 12:30 p.m.) and P.M. Peak (4:00p.m. -6:00p.m.). Elapsed time was measured by placing observers at both ends of the Mall to record bus line number, bus number, time, and estimated load. During the Midday period, all buses passing the observer were included. However, during the P.M. Peak, because of the large volume of buses on the Mall, checks were only made for buses with odd number routes and lines #44 and #88 which used articulated buses during Phase II. Checks for bus density were made by counting all buses even though not all were checked~
II.55

Time was recorded when the bus proceeded through an intersection. Therefore, at the end of the section (Fifth and Madison and Sixth and Burnside), the time spent waiting for the signal was included, but it wasn't at the beginning of the section (Fifth and Pine and Sixth and Main)e The signal waiting time at Sixth and Burnside was sometimes relatively long due to traffic at Burnside blocking the intersectione The bus counts for Phase II were also verified against scheduled buses and found to be accuratee
Survey Results and Interpretation
The results of the dwell time survey will be discussed first. Then, the discussion of the running time survey will follow.
Dwell Time survey Resultsl
Tri-Met tested various relationships between the volumes of boarding and alighting passengers and total dwell time using regression analysis. Regression equations were determined two ways: first using total passenger activity and then using front door activity only. Tri-Met found, as one might expect, that back door passenger activity (alighting passengers) has little effect on dwell timee Peat Marwick replicted the regression analyses conducted by Tri-Met in order to verify their findings. The resulting equations are summarized in Exhibit II-35 and generally are consistent with Tri-Met's analyses with some minor modifications to the constant term in the Phase I equation they derived.
For the Phase I equation relating total dwell time at a stop to passenger boarding and alighting activity, the coefficient of determination (R2) equals 0.88, indicating that 88 percent of variation in dwell time is explained by variables in the equation. If it can be assumed that the observed dwell times are normally distributed around the predicted dwell time values, and also if the variance of the distributions around
1 Peat, Marwick, Mitchell & Co. didn't repeat the early investigations conducted by Tri-Met on the relationship between dwell time and various ways of stratifying boarding and alighting passengers. These have been adequately documented by Tri-Met in their earlier technical memoranda. During Phase I Tri-Met tested the hypothesis tht an individual getting off the front door would cause a greater than normal dwell. By stratifying the data; i.e., separating those cases where no one got off the front from those where one or more did get off from the front, it was found that this hypothesis wasn't true.
II.56
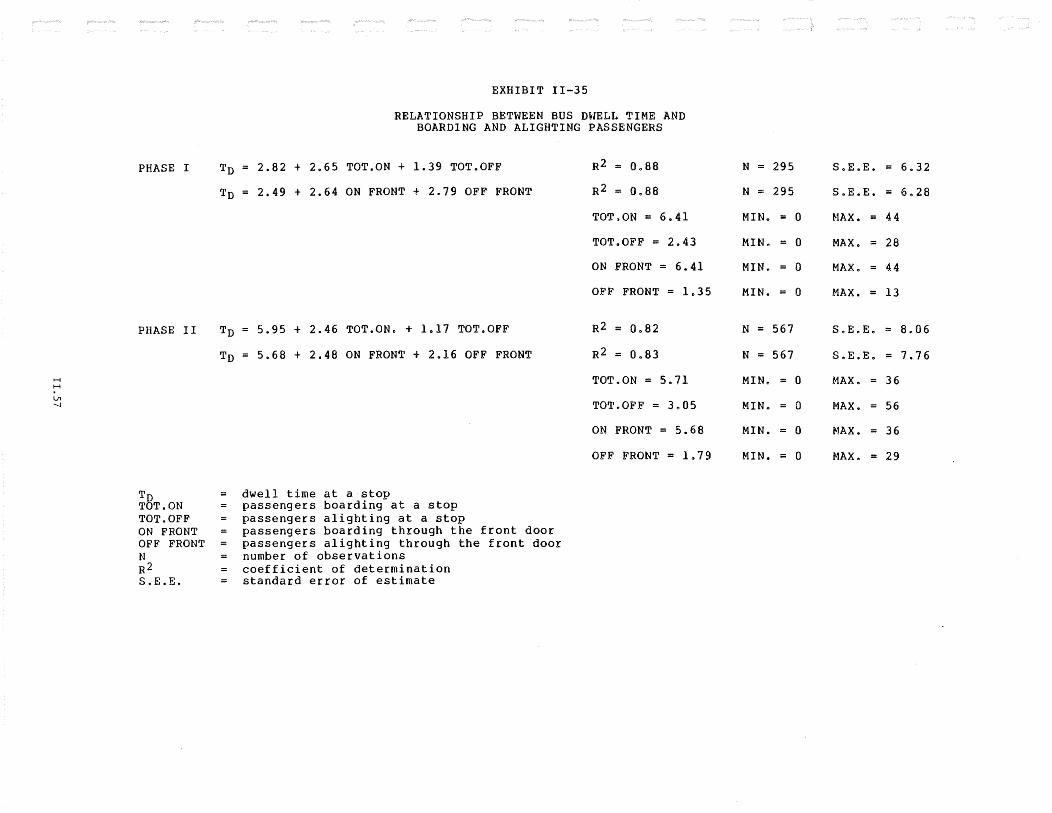
H
~ VI -....)
PHASE I
PHASE II
To TOT.ON TOT.OFF ON FRONT OFF FRONT N R2 S.E.E.
EXHIBIT II-35
RELATIONSHIP BETWEEN BUS DWELL TIME AND BOARDING AND ALIGHTING PASSENGERS
To = 2.82 + 2.65 TOT.ON + 1.39 TOT.OFF
To= 2.49 + 2.64 ON FRONT+ 2.79 OFF FRONT
To = 5.95 + 2.46 TOT.ON. + 1.17 TOT.OFF
To = 5.68 + 2.48 ON FRONT + 2.16 OFF FRONT
dwell time at a stop passengers boarding at a stop passengers alighting at a stop passengers boarding through the front door passengers alighting through the front door number of observations coefficient of determination standard error of estimate
R2 = 0.88
R2 = 0.88
TOT.ON = 6.41
TOT.OFF = 2e43
ON FRONT = 6.41
OFF FRONT = 1.35
R2 = 0.82
R2 = 0.83
TOT.ON = 5.71
TOT.OFF = 3.05
ON FRONT = 5.68
OFF FRONT= 1.79
N = 295 S.E.E. = 6.32
N = 295 S.E.E. = 6.28
MIN. = 0 l-IAX. = 44
MIN. = 0 MAX. = 28
MIN. = 0 MAX. = 44
MIN. = 0 MAX. = 13
N = 567 S.E.E. = 8.06
N = 567 S.E.E. = 7.76
MIN. = 0 HAX. = 36
MIN. = 0 MAX. = 56
MIN. = 0 NAX. = 36
MIN. = 0 HAX. = 29

each possible value of predicted dwell time is the same, then the value of the standard error of estimate can be used as an approximate prediction intervals With a 90 percent confidence level we can feel certain that the actual dwell time is within plus or minus 10.4 seconds of the value predicted by the regression equation.l The form of the regression equation, that is, the presence of a constant term in regression equation and the positive signs on the independent variables, suggests that average dwell time per passenger will decrease with increasing passenger boarding and alighting activity at a declining rate. This may reflect the assumption that as passengers queue at a bus stop, more rapid or efficient boarding occurs.
The relationship developed using the dwell time survey data from Phase II also shows a good fit; however, somewhat less than that in Phase I. This may reflect, at least partly, the effect of making measuring dwell time on a less homogeneous fleet consisting of both articulated and standard buses rather than just standard buses. If the same assumptions are made in Phase II as in Phase I, then the value of the standard error of estimate can be used as an approximate prediction interval. Therefore, with a 90 percent confidence level we can feel certain that the actual dwell time in Phase II is within plus or minus 13.3 seconds of the value predicted by the regression equation. The form of the equation and the signs of the independent variables are identical to those in Phase I, again suggesting that average dwell time per passenger will decline with increasing passenger boarding ot alighting activity.
The dwell time regression relationships may merit further investigation, particularly with respect to examining separate equations for articulated versus standard buses under a traditional fare collection mode. Pending discussions with Tri-Met and the Transportation Systems Center, Peat Marwick may undertake additional investigations of these relationships.
Exhibit II-36 compares bus dwell times before and after articulated buses were placed in service while Exhibit II-37 compares standard and articulated bus dwell times. As Tri-Met stated in its study memorandum, it can be observed that2:
. The average boarding (dwell) time per passenger is not generally greater during pay-as-you-enter
1 10.4 seconds is equal to 1.645 times the standard error of estimates and may be considered an approximate confidence interval.
2 Tri-Met, SSFC Operating Impact Study Memorandum, September 1982.
II.S8

H H
Vl 1.0
PHASE I (Pre-Articulated, Spring 1981
On-Mall (22)
Cross-Hall (73)
Fareless Square (118)
Non-Fareless Square (175)
Average Total (293)
PHASE II (Post-Articulated, Spring 1982)
on-Mall (270)
Cross-Mall (122)
Transfer Points (134)
Shopping Centers (39)
Fareless Square (391)
Non-Fareless Square (174)
Average Total (565)
EXHIBIT II-36
COMPARISON OF BUS DWELL TIME BEFORE AND AFTER ARTICULATED BUSES PLACED IN SERVICE
Average.Dwell Time (Seconds)
20.70
31.05
22.06
24.10
23.28 ((r = 18.25)
21.63
42.22
12.61
22.05
24.40
22.54
23.83 (tr= 19.00)
Average Passengers!
7.94
11.66
8.89
8.86
8.87 (0""= 7.50)
7.61
17.76
4.13
5.46
8.94
8.58
8.83 (0"'= 8.40)
Average Dwell Time2 Per Passenger
2.61
2.66
2.48
2.72
2.62
2.84
2.32
3.06
3.67
2.73
2.63
2.70
) = Number of observations tr= standard Deviation
1 Total on and Total off (front and back)
2 Cumulative Dwell time Cumulative Passengers
3 Average Ratio of Dwell Time Per Passenger
Average Dwell Time •system Average• or Ratio of Averages Average Number of Passengers
Average Dwell Time Per Bus •Average of Ratios• Passengers Boarding/Alighting
Average Ratio of3 Dwell Time Per Passenger
2.95
3.11
2.97
3.01
2.99 ((J'"= 1.20)
3.22
2.57
3.96
4.45
3.36
3.30
2.34 (CJ= 2.15)
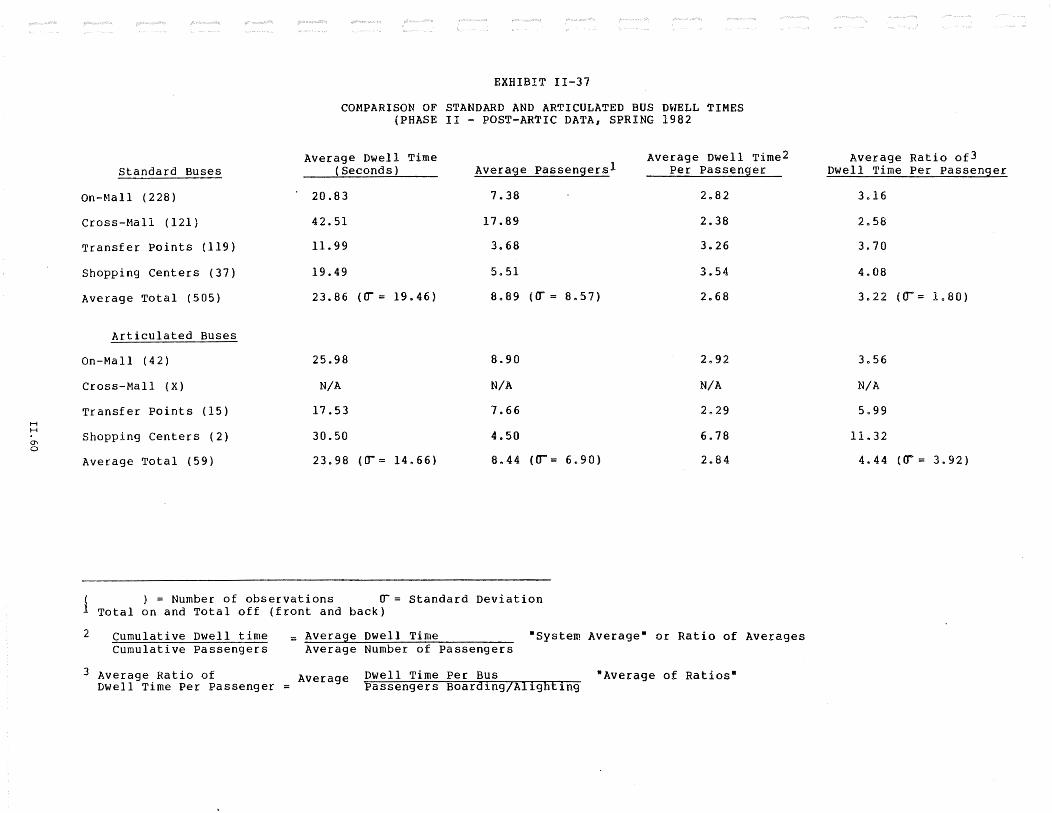
EXHIBIT II-37
COMPARISON OF STANDARD AND ARTICULATED BUS D\rlELL TIMES (PHASE II - POST-ARTIC DATA, SPRING 1982
Average Dwell Time Avera~e Passen9ersl
Average Dwell Time2 Average Ratio of3 Standard Buses (Seconds) Per Passenger Dwell Time Per Passenger
on-f.1all (228) 20.83 7e38 2.82 3.16
Cross-Mall (121) 42.51 17.89 2.38 2.58
Transfer Points (119) 11.99 3.68 3.26 3.70
Shopping Centers (37) 19.49 5.51 3.54 4.08
Average Total (505) 23.86 (IT= 19.46) 8.89 (IT= 8.57) 2.68 3.22 (IJ= 1.80)
Articulated Buses
On-Mall (42) 25.98 8.90 2.92 3.56
Cross-Mall (X) N/A N/A N/A N/A
Transfer Points (15) 17.53 7.66 2.29 5.99 H H
0'\ Shopping Centers (2) 30.50 4.50 6.78 11.32
0
Average Total (59) 23.98 (tr= 14.66) 8.44 ((J"'= 6.90) 2.84 4.44 ((J""= 3.92)
1 ) =Number of observations cr= Standard Deviation Total on and Total off (front and back)
2 cumulative Dwell time = Avera9e Dwell Time •system Average• or Ratio of Averages Cumulative Passengers Average Number of Passengers
3 Average Ratio of Average Dwell Time Per Bus •Average of Ratios• Dwell Time Per Passenger = Passengers Board1ng/Al1ght1ng
~ operation (non-Fareless Square.PM Peak) than pay-as-youleave operation. Although contrary to expectation, Tri-Met partly attributes this to the fact that pay-asyou-enter operation occurs during the peak hours when regular riders, many with passes, use the system;
Q Average total dwell time for articulated buses tends to be greater for articulated buses than standard buses (reflecting greater passenger boarding and alighting activity). Average dwell time on the Mall is 25 percent higher for articulated buses than for standard ones. Average dwell time per passenger, however, is only slightly greater for articulated buses. While dwell time per passenger is nearly the same for both types of buses, the larger total dwell time of articulated buses slows the operation of the articulated buses and those that queue behind it at the same stop. This is anticipated to become a more serious problem when articulated buses are fully utilized. The delays due to higher loads were not fully felt because schedules were not completely adjusted to utilize articulated buses; however, the probable delay under full utilization and traditional fare collection can be estimated when post-implementation boarding counts are recorded in Phase III; and
c Average dwell time per passenger is generally lower on the Mall or Cross-Mall stops than at non-Mall locations. This may be due to a variety of reasons including the large number of commuters on the Mall or Cross-Mall who are regular riders, the better visibility of approaching buses on the Mall, and improved bus operation on the Mall.
Running Time survey Results
Exhibit II-38 presents the results of the Phase I and Phase II running time survey. It can be observed that:
. Articulated buses operated at nearly the same speed as standard buses during the day base period and at slightly faster speeds during the peak; and
. Although it was anticipated that the introduction of articulated buses would slow the Mall, the Mall operated at slightly faster speeds with articulated buses than without. This is true despite the fact that bus density was slightly greater.
The survey didn't measure the effect of passenger activity on bus speed since measurements were made at the ends of the Mall. It is assumed that bus density is also a factor; however, it is
!!.61
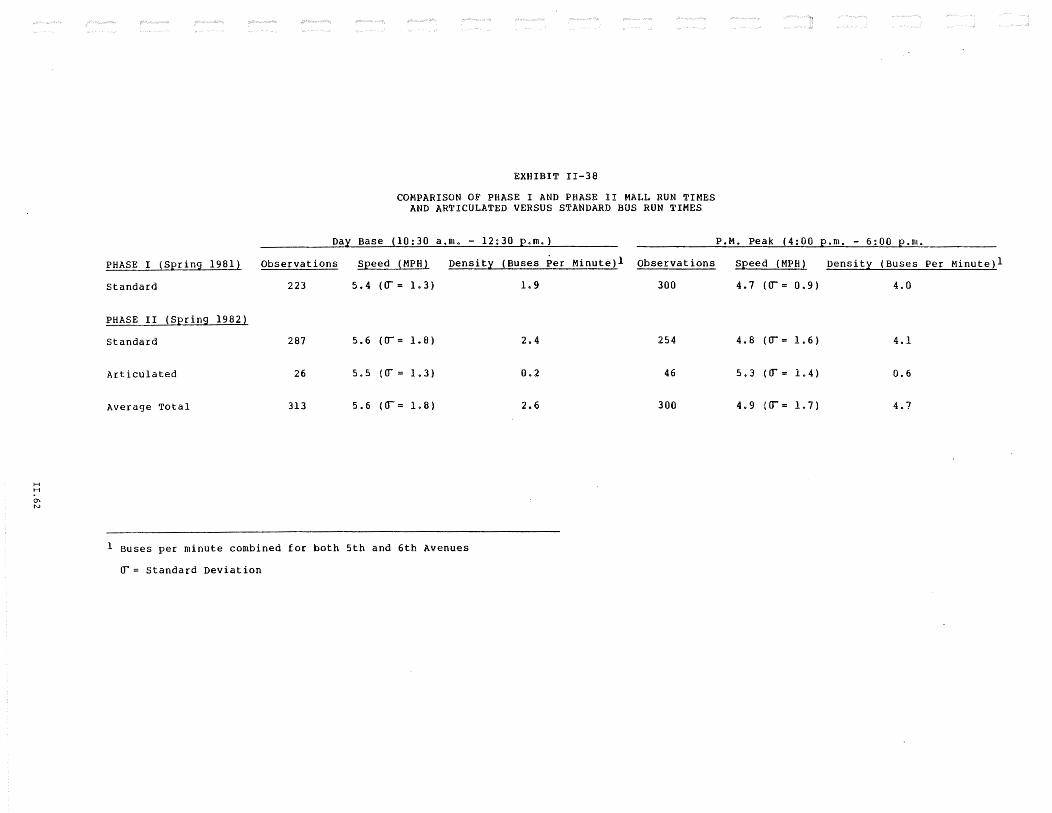
H H
0\ N
EXHIBIT II-38
COMPARISON OF PHASE I AND PHASE II MALL RUN TIMES AND ARTICULATED VERSUS STANDARD BUS RUN TIMES
Day Base (10:30 a.m. - 12:30 p.m.)
PHASE I (Spring 1981) Observations Speed (MPH) Density (Buses Per Minute)! Observations
Standard 223 5.4 (IJ= 1.3) 1.9 300
PHASE II (Spring 1982)
Standard 287 5.6 (tr= 1.8) 2.4 254
Articulated 26 5.5 (Cf' = 1.3) 0.2 46
Average Total 313 5.6 ({f'= 1.8) 2.6 300
1 Buses per minute combined for both 5th and 6th Avenues
IJ= standard Deviation
P.M. Peak (4:00 p.m. - 6:00 p.m.
Speed (MPH) Density (Buses Per Minute)l
4.7 (IT'= 0.9) 4.0
4.8 (tr= 1.6) 4.1
5.3 (IT= 1.4) 0.6
4.9 ((J= L7) 4.7

difficult to separate their effects •. It appears that the presence of articulated buses on the Mall did not lower overall operating speeds.
The Mall run time survey is perceived as a second way to measure the effects of self-service fare collection on dwell time, since it is unlikely that self-service fare collection will affect actual bus running time between stops. Phase III of the running time survey is expected to yield results similar to those from the dwell time survey.
II.63

Ao SURVEY INSTRUMENTS
A.l

OPERATOR SURVEY
Please answer all questions as completely and honestly as you can. Answers should be your own and reflect the average situation based on your experience. For questions 1 to 8, please check ~box for each line of the question.
1.. Bus riders can make mistakes paying the fare, either on purpose or because they are confused by the fare system. Of every 100 riders who board the bus, please estimate how many rider:s misuse or cheat the fare system: (Check one)
0 - 2
3 - 5
6 - 10
11 - 20
D D 0 0
21 - 30
31 - 40 41 - so SO or over
0 D D D
2~ Misuse or cheating of the fare system can occur in several ways. When misuse or cheating happens, how often is it done for each of these types of misuse or cheating:
VERY RARELY RAR£1.Y SOMETlMES OF'niN
No payment at all 0 0 0 0 Insufficient base fare 0 0 0 [J No 3-zone cash fare 0 0 0 0 Slugs, half bills, etc. 0 0 0 0 Forged passes 0 0 0 D Misuse of youth, senior or disabled pass 0 0 0 0 Wrong use of 2-zone pass for 3 zones 0 0 0 0 Bad transfer D 0 0 0
3. How often do you question ur confront a rider when they misuse or cheat the fare ~ system for each of these types of misuse or cheating :
VERY RARELY RARELY SOMET1MES OFTSN
No payment at all 0 0 0 0 Insufficient base fare 0 0 D 0 No 3-zone cash fare 0 0 D 0 Slugs, half bills, etc. 0 0 0 D Forged passes 0 0 D 0 Misuse of youth, senior or disabled pass 0 0 0 0 Wrong use of 2-zone pass for 3 zones D 0 0 0 Bad transfer 0 0 D 0
VERY· OFT:N:
0 0 D· D 0 D 0 0
VERY· OFTT:M:
D 0 0 0 0 0 0 0

VERY VERY
RARELY RARELY SOMETIMES OF"reN OFTEN - ---··-··-
4. Do your riders pay the wrong fare because:
- They are confused by the zone system? D 0 0 D 0 - They see others cheating? 0 0 0 D D - They know the operator can't do anything
0 0 D 0 D if they are caught?
- They don •t understand when to pay? 0 0 D D D - They believe fares are too high or unfair
0 D D 0 D or service is poor?
= Other
0 0 0 D D VERY VERY
s. How often do you think the following types RARELY RARELY SOMETIMES OF'l"£N OFTE\1:
of riders misuse the fare system?
Age:
":" High school or younger D D D 0 0 - High school to age 25 D 0 D D D - 25 to 40 years D 0 D 0 0 - 40 to 65 years D D D D D - Over 65 years D D D 0 0
Time of Day:
- Rush hours D D D D 0 -Mid-day D 0 D 0 0 - Evening 0 0 D 0 D - Early AM/Late PM D 0 D 0 D -Weekends 0 D D D 0 Part of Service Area:
-Downtown 0 D D D D -City 0 D D D 0 -Suburban D 0 D 0 0 Repeat Cheaters D 0 0 0 0
VERY VERY 6. What action do you usually use with riders
RARELY RARELY SOMETIMES .OFT"af OFTEN
who misuse the fare system?
_- Ask them to pay the fare D 0 0 0 0 - Ask them to pay or leave the bus D 0 0 q 0 - Call security /police D 0 0 D D - No action D 0 0 D D - Other 0 D 0 0 0

'VERY VERY RARELY RARELY SOMETIMES OFTEN OFTEN -- ..... --~ ·~ -- ~ - -- . -
______ ...,..
7. What is the response of riders who misuse the fare system to your asking for full fare?
- Pay the full fare due 0 0 0 0 0 - Pay part of the fare due 0 D D D 0 - Leave the bus with no payment D 0 0 D 0 - Stay on the bus with no payment D D D 0 D - Verbal abuse/ swearing D 0 0 D D - Compla.in about poor service or high fares D D D D D - Other
VERY NOT. VERY EASY EASY DIFFICULT. OIFFtCUt.T HARD
a. What are the hardest or easiest parts of operating the bus for you?
- Staying on schedule D D D D 0 - Driving in traffic D D D 0 D -· Collecting cash fares D D 0 0 0 - Transfers D 0 D 0 0 .... Helping elderly or handicapped 0 D D D 0 - Dealing with students D D D D D - Handling complaints D D D D 0 - Dealing with overcrowding D D D 0 0 - Dealing with fights on the bus D D D D D - Paper work (load counts, reports, trip
D D D 0 0 sheets, etc.)
- Dealing with supervisors 0 D 0 D D - Other
D 0 D D 0
9. What best describes your feelings towards misuse of the fare system ? (Check one) :
- Feel very angry when you see cheating and try to catch anyone who cheats? D - Feel very angry when you see cheating but feel enforcement is useless? 0 - Think better enforcement is needed but not by the operator? 0 - Enforce the worst cheating but feel that enforcement is a waste of time? 0 - Don't want to enforce because operators can't do much anyway? 0 - Don't want to enforce because management doesn't encourage or suppo.Ft
operators? 0 - Don't want to enforce because of threat of violence or verbal abuse from the
rider? 0 _ _::__Qtf1er ----------------------------------
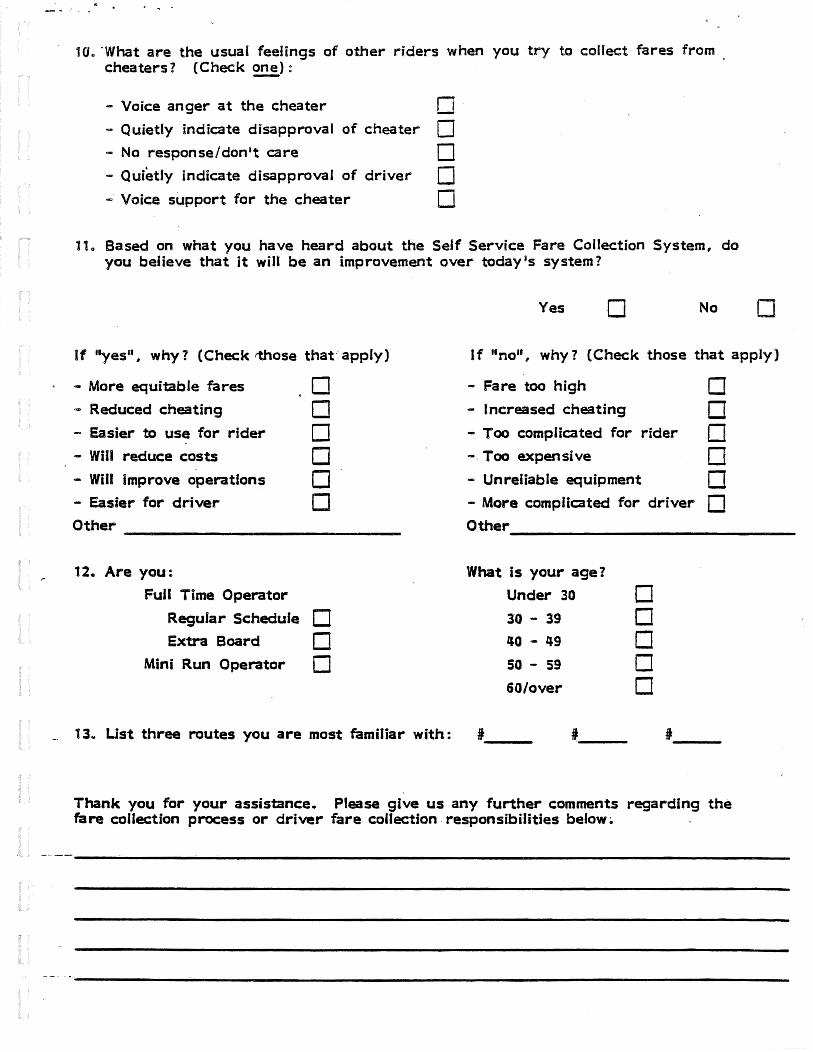
' . .
HJ., ·what are the usual feelings of other riders when you try to collect fares from cheaters? (Check one):
- Voice anger at the cheater n · - Quietly indicate disapproval of cheater 0 - No response/don't care 0 - Quietly indicate disapproval of driver 0 - Voice support for the cheater 0
11" Based on what you have heard about the Self Service Fare Collection System, do you believe that it will be an improvement over today•s system?
Yes 0 No 0
If 11yes11 , why? (Check rthose that· apply) If "no11 , why? (Check those that apply)
- More equitable fares
- Reduced cheating
- Easier to use for rider
- Will reduce costs
- Will improve operations
- Easier for driver
Other
0 D D 0 D 0
-------------------------------12. Are you:
FuJI Time Operator
Regular Schedule 0 Extra Board 0
Mini Run Operator 0
- Fare too high 0 - Increased cheating D - Too complicated for rider 0 -. Too expensive 0 - Unreliable equipment 0 - More complicated for driver 0 Other -------------------------------What is your age?
Under 30
30 - 39
'10 - 49
so - 59
60/over
0 D 0 0 D
13. Ust three routes you are most familiar with: I __ _ '---
Thank you for your assistance. Please give us any further comments regarding the fare collection process or driver fare collection. responsibilities below~

1243l BUS RIDERS SURVEY
IF YOU HAVE ALREADY COMPLETED THIS SURVEY, PLEASE RETURN THIS QUESTIONNAIRE TO THE SURVEYOR WITHOUT FILLING IT OUT.
The purpose of the following questions is to evaluate Tri-Met's fare collection system. Your answers will help Tri-Met understand how well the current fare system is working and whether the new fare collection system will be an improveo ment for riders like you.
Since you are part of a relatively small number of riders being surveyed, your answers are very important to the accuracy of this study. Tri-Met has h!red an outside research firm to gather this information. You can be assured that the information you give is confidential, and will only be used in combination with the answers from other riders.
We would like you to complete the white part of the survey while on the bus and return it to the surveyor or place it in the box near the rear door. The yellow portion is to be completed as soon as possible and mailed postage free to Tri-Met.
THANK YOU FOR YOUR TIME AND HELPc
1. How many bus trips on ·the average do you usually take each week for each of the following trip purposes? (PLEASE COUNT EACH DIRECTION AS A SEPARATE TRIP.) (Write your answer on the line. Put "0" if none.)
NUMBER OF NUMBER OF ___ WORK TRIPS SCHOOL TRIPS
NUMBER OF NUMBER OF ___ SHOPPING TRIPS SOCIAURECREATION TRIPS
2. At what time do you usually ride the bus? (Circle· the one number next to your answer.) 1 RUSH HOUR - 3 EVENING/NIGHT
(7°9 a.m. & 4-6 p.m.) (6 p.m.o7 a.m.) 2 MID-DAY 4 SATURDAY OR SUNDAY
(9 a.m.o4 p.m.) 3. What bus lines do you ride most often?
NUMBER LINE NAME
4~, How do you usually pay your fare? (Circle the number under the proper column.) . CASH BUS TICKET PASS
1·'-:-$ .65 (2-zone) 1 $ .65 (2-zone) 1 $21 (2-zone) 2 s--·-.~ (3-zone) 2 $ .90 (3-zone) '2 $29 (3-zone) 3 $ .45' (youth) 3 $ .45 (Youth) 3 $14 (Youth) 4 $ .25 (Hdnored Citizen) 4 $ .25 (Honored Citizen) 4 $ 6 (Honored Citizen) 5 $1.00 (Vancouver) 5 $1.00 (Vancouver) 5 $35 (Vancouver) 6 Other 6 Other 6 Other
IF YOU USE A PASS, PLEASE SKIP TO QUESTION #7 5. How many transfer slips do you use on an average in a week? . 6. How convenient is it to use transfer slips with 1 being "not at all convenient" and 5 being "very convenient"?
(Please circle the number which corresponds to your reply.)
NOT CONVENIENT VERY CONVENIENT
f1 21 3 4. 5
....__,..L_6_a_._W_h_i-ch_o_f -th_e_r_e-as...,ons below best describes why you rated the convenience of transfer slips as you did in Question #6? : 1 I FORGET TO ASK FOR THE TRANSFER 2 I LOSE THE TRANSFER OR HAVE TROUBLE FINDING IT 3 I DO NOT UNDERSTAND WHEN TO USE THEM 4 OTHER ____________________________________ ~~~==~~-----------------------
IF YOU PAY CASH FARES, PLEASE GO TO QUESTION #8 (PLEASESPECIFY>
7. Where do you usually buy your pass or bus tickets? (Circle the one number next to your answer.) 1 DRUG STORE 5 PLACE OF WORK 2 7-ELEVEN STORE 6 BY MAIL FROM TAl-MET
3 BANK OR SAVINGS & LOAN OFFICE 7 OTHER--------------4 TAl-MET CUSTOMER ASSISTANCE OFFICE
(please complete other side)

.l ·'
8. How much discoun1 do you think people should get for purchasing tenoride tickets in advance? 1 NO DISCOUNT 4 20°/o (or $1.30)
2 5% (or 30¢) 5 DON'T KNOW 3 10% (or 65¢)
9. Please circle the rating number below which best describes your opinion of the following statements regarding fare collection.
STRONGLY STRONGLY DISAGREE AGREE
a. It is a bother to have the 1 2 3 4 5 correct change.
b. I don't like waiting while other people search 1 2 3 4 5 for their fare.
c. The fare system is confusing because sometimes 1 2 3 4 5 I pay when getting on and sometimes when getting off.
d. I'm uncertain about where zone boundaries are 1 2 3 4 5 and when to pay the extra fare.
e. I'm uncertain of the boundaries of fareless square. 1 2 3 4 5
9a. What other problems do you have with the method of collecting fares? (Write "none"· if you have no problems.)
TrioMet is changing its fare payment system in September. You, the rider, will be responsible for paying the correct fare when entering the bus and having proof that you did pay that fare (a pass or receipt). Inspectors will occasionally enter buses and check to see if you have paid. ·
10. Before now, had you seen or heard about these·· changes? 1 YES 2 NO
10a.Have you heard or read 'about Tri-Met's Bus Schoof? 1 YES 2 NO
11. Based on the explanation above and anything else you may have heard, do you think this type of fare system would .·~"J work? (Circle YES or NO.~ . . .~~;t;.·_,~~·
YES, BECAUSE . NO, BECAUSE . .-~., ... (Circle all that apply.) (Circle all that apply.) . . J!;:;:> -' 1 IT WILL BE LESS CONFUSING 1 IT WILL BE MORE CoNFUSINGi~··
.;..C,
2 MORE RIOERS WILL PAY CORRECT FARES 2 MORE RIDERSWIL~ P"':'·JNCORRECT FARES 3 lT WfLL BE FASTER GETTING ON BUS 3 IT WILL TAKE LO~Gr;R TO G.ET ON THE BUS 4 IT WILL SAVE MONEY FOR TRJ-MET
5 OTHER-----~=-=-====----<PLEAsE SPECIFY)
4 IT WILL COST TRI-MET MONEY
5 OTHER------::-:-:-:-::::':=-====-=-----(PLEASE SPECIFY)
THE FOLLOWING QUESTIONS ARE FOR CLASSIFICATION PURPOSES. 12. Are you:
1 MALE 13. What is your age?
1 15 OR UNDER 2 16TO 24, .. 3 25 TO 44
14. What was your approximate tami1y income in 1981? 1 UNDER $5,000 2 $5,000 TO $9,999 3 $10,000 TO $14,999
2 FEMALE
4 45T064 5 65 OR OVER
4 $15,000 TO $24,999 5 $25,000 OR OVER
AGAIN, THANK YOU! PLEASE TEAR OFF THE WHITE FORM AND RETURN IT TO THE PERSON WHO GAVE IT TO YOU OR PUT IT IN THE BOX NEAR THE REAR DOOR. PLEASE FILL OUT THE YELLOW FORM AT YOUR CONVENIENCE AND MAIL (POSTAGE FREE) TO TAl-MET BY JUNE 10, 1982. IN RETURN FOR YOU HELP ON BOTH PORTIONS, TAlMET WOULD LIKE TO SEND YOU TWO FREE BUS TICKETS. WE APPRECIATE YOUR HELP!

12430 BUS RIDERS MAIL·BACK SURVEY
Your responses to the second portion of this survey will help us determine how well the fare collection system is work· ing. In return for your time and cooperation, Tri-Met would like to send you two free bus tickets. Please fill out the following questions and return, free of postage, to Tri-Met by June 10, 1982. Thank you!
1. How do you usually pay your fare? (Circle the one number next to your answer.) 1 CASH (PLEASE GO TO QUESTION #2.)
2 BUS TICKET (PLEASE GO TO QUESTION #3.) 3 BUS PASS (PLEASE GO TO QUESTION #4.)
2. Would you be more likely to buy bus tickets or passes if they were readily available from vending machines? (Circle YES or NO, then circle reasons below that answer.)
YES, BECAUSE NO, BECAUSE 1 SOUNDS MORE CONVENIENT 1 PREFER PAYING CASH
2 COULD BUY THEM AT ANY TIME 2 HAVE A COMFORTABLE WAY OF DOING THINGS
3 OTHER~------~~~===e=~=~=,=ffl~-------- 3 DON'T TRUST VENDING MACHINES
4 OTHER ________ ~~~~~~E~S~PE~CI~ffl~--------
3. Why do you pay for individual rides rather than buy a monthly pass? 1 DON'T RIDE THE BUS OFTEN ENOUGH TO NEED A PASS 2 DIDN'T KNOW BUS PASSES WERE AVAILABLE 3 PASS SALES OUTLETS ARE NOT CONVENIENT TO GET TO 4 DON'T KNOW WHERE TO BUY PASSES 5 PASSES ARE TOO EXPENSIVE
6 OTHER--------------------------~~~~==s~~~ffl=---------------------------
IF YOU DO NOT USE A PASS. PLEASE GO TO QUESTION #5.
4. Is showing your pass to the driver an inconvenience? 1 YES IF YES, WHY? 2 NO
5. Would you buy bus tickets or a pass from a conveniently locating vending machine if It accepted major credit cards only (such as a VISA, MasterCard, or a banking card)?
1 YES 2 NO IFNO,WHYNOTI __________________________________________ __
6. What factors should be considered In determining fares? (Circle all that apply.) 1 DISTANCE OF TRIP (PAY BY THE MILS) 2 TIME OF DAY (RUSH HOUR, NIGHT, WEEKEND) 3 ABIUTY TO PAY 4 AGE (UNDER 6 YEARS, STUDENTS, ADULTS, OVER 65 YEARS) 5 COST OF OPERATING THE ROUTE 6 AMOUNT OF TIME FOR THE TRIP 7 OTHER
7. Fares are set according to the length of trip by using fare zones. How many zones would you consider best? (Circle one choice.)
1 ONE ZONE: the same fare for everyone 2 TWO ZONES: for example (a) inside Portland; (b) outside Portland 3 THREE·ZONES: for exampl&(a) downtown Portland; (b) inside Portland; (c) outside Portland 4 FIVE ZONES: for example (a) downtown Portland; (b) inner-city; (c) outer-city; (d) suburbs (such as Beaverton
or Gresham; (e) outlying areas (such as Vancouver or Forest Grove) 5 SEVEN OR MORE ZONES: based on actual miles travelled
8~ Based on your answer to the last question, how much do you think fares should increase for each additional zone?
t $.05 4 $.20 2 $.10 5 $.25 3 $ .15 6 SHOULD NOT CHANGE
9. Based on your best estimate, of every 100 riders who get on the bus, how many do you think do not pay the correct fare?
1 NONE (PLEASE GO TO QUESTION #12.) 2 1. 2 3 3. 5 4 6 ·10 5 11·20 6 21 OR MORE
10. Of those persons who pay too little fare, why do you think they fail to pay the correct fare? (Circle all that apply.) 1 THEY FORGET TO PAY 2 THEY DON'T HAVE THE CORRECT CHANGE 3 THEY ARE CONFUSED BY THE ZONE SYSTEM 4 THEY SEE OTHERS CHEATING 5 THEY THINK THE DRIVER WON'T OR CAN'T DO ANYTHING ABOUT IT 6 UNHAPPY WITH SERVICE OR FARES
7 OTHER-----------------------------------------------------------------
(please comclete other sidel

· 11. How do you think these people usually underpay their fares? (Circle all that apply.) 1 INSUFFICIENT FARE 2 BAD TRANSFER 3 NO PAYMENT AT ALL 4 WRONG USE OF 2-ZONE PASS FOR 3-ZONES OF TRAVEL 5 MISUSE OF YOUTH OR HONORED CITIZEN PASS 6 SLUGS, HALF DOLLAR BILLS, ETC. 7 FORGED PASS
12. What kind of penalty, if any, should there be for people who do not know they paid the wrong fare? (Circte the ~ number next to your answer.)
1 NONE 2 ASKED TO PAY THE CORRECT FARE
5 FINED $20.00 6 FINED $50.00
3 ASKED TO LEAVE THE BUS 7 OTHER---------------4 FINED $5.00
13. What kind of penalty, If any, should there be for people who do not pay the correct fares on purpose? (Circle the ~ number next to your answer.)
1 NONE 2 ASKED TO PAY THE CORRECT FARE
5 FINED $20.00 6 FINED $50.00
3 ASKED TO LEAVE THE BUS 7 OTHER _________________________ __
4 FINED $5.00
~---------------------------Fold Here--·-------------------=---
14. Are you: 1 MALE
15. What is your age?' 'f 150R UNDER 2 18TO 24 3 2ST044 4 45T064 S 650ROLOER
2 FEMALE
In- return for your time and coo.peratlon, Trf-Met would like to mall you two bus tickets. Please fill in your name and ad· dress below~
NAME-------------------------------------------------------------STREETADDRESS --------------------------------------------------------CITY ___________________________________ STATE-------------~PCOO----------------
Tri-Met will be conducting a similar survey in ten months. Participants In the second survey wiH be contacted by mail or phone. In return for your: time and cooperation, you·would be sent five bus tickets. Would you be willing to help us in the second portion of this survey?
1 YES (Please include phone number •. l-----------------2 NO
THAHKVOUr
-------------------------- Fold Here·-----------------------
Business Reply Mail ARSTCIASS PERMIT NO. A-40
POSTAGE WILL BE PAID BY ADDRESSEE
Trf·Met Rider Survey 4012 S.E.. 17th Avenue Portland, Oregon 97202
F'ORTI.ANO. OR
1 ~ Ill NO POSTAGE NECESSARY
IF MAILED IN THE
UNITED STATES

B. OPERATOR SURVEY COMPUTER PRINTOUTS
B.l

SPSS 8.1\TCH SYSTEM 09/30/82 PAGE 1
SPSS FOR OS/360~ VERSION Mt RElEASE 9.0, JUNE 10, 1981
CURRENT OOCUME~TATION FO~ THE SPSS BATCH SYSTEM ORDER FROM MCGRAW-Hill: SPSS, 2ND ED. (PRINCIPAL JEXTI ORDER FROM SPSS I~C.: ·sPSS STATISTIC~l ALGORITHMS
SPSS UPDATE 7-9 IUSE W/SPSSt2~0 FOR REL. 7, a, 9) KEYWORDS: THE SPSS INC .. NEWSLEffE:t SPSS POCKET GUIDE, RELEASE 9 SPSS PRIMER IBRJEF INTRO TO SPSS)
DEFAULT SPACE AllOCATION •• AllOWS FOR... 102 TRANSFORMATIONS WORKSPACE 716AO RYTES TRANSPACE 10240 BYTES
1 NUMBERED 2 RUN NAME 3 f ll E NAME 4 VARIABLE LIST 5 6 7 INPUT MEDIUM 8 INPUT FORMAT
409 RECODE VALUES + LAG VARIABLES 1641 If/COMPUTE OPERATIONS
YES 00001700 ON BOARD - UNF4CTO~EO 00001800 ONBRO 00001900 TYPE,IO,OlA 1 QlB,QlC,QlD,Q2,Q3A,Q38 1 Q3C 1 Q4A,Q4B,Q4C,Q5, 00002000 Q6,Q6A,Q68,Q6C,Q60,Q7,Q8,Q9A,Q98 1 Q9C 1 Q90 1 Q9E,Q9F,Ql0 1 QlOA00002100 ,Qll,QllA,OllB,QllC,QllD,Ql1E,Qllf 1 Ql2,Ql3,Q14 00002200 TAPE 00002300 FIXED ffl.0 1 F5.0,4F2.0,FI.0 1 3F3.0 1 3Fl.0 1 F2.0 1 25Fl.OJ 00002400
ACCORDING TO YOUR INPUT FORMAT, VARIABLES ARE TO BE READ AS FOLLO~S
VARIABLE FORMAT RECORD COLJMNS
TYPE F L, 0 1 1- l 10 F 5. 0 1 2- 6 QlA f 2. 0 1 7- 8 QlB F 2. 0 1 9- 10 Q1C F 2. 0 1 11- 12 QlO F 2. 0 1 13- 14 Q2 F 1. 0 1 15- 15 031\ f 3. 0 1 16- 18 QlR F 3. 0 1 19- 21 Q3C F 3. 0 1 22- 24 Q4A f l. 0 1 25- 25 Q4B F 1. 0 1 26- 26 Q4C F 1. 0 1 27- 27 05 F 2. 0 1 2B- 29 06 F l. 0 1 30- 30 Q6A F l. 0 1 31- 31 068 f l. 0 1 32- 32 Q6C F l. 0 1 33- 33 Q6D f lo 0 l 34- 34 0.7 f 1. 0 1 35- 35

~·· BOf- - UN~ - - -·oREf 0~ 82
THE INPUT FORMAT IT PROVIDES FOR
ACCORDING TO YOUR INPUT FORMATe VARIABLES ARE TO BE READ AS FOLLOnS
VARIABLE FORMAT RECORD COLUH~ S
Q8 F 1. 0 1 36- 36 094 F 1. 0 1 37- 37 098 F 1. 0 1 38- 38 Q9C F t. 0 1 39- 39 Q90 F 1. 0 1 40- 40 09E F 1. 0 1 41- 41 Q9F F 1. 0 1 42- 42 Q10 F 1. 0 1 43- 43 0101\· f 1. 0 1 44- 44 Q1l F 1. 0 1 45- 45 QllA F 1. 0 1 46- 46 Q11B F 1. 0 1 47- 47 011C F 1. 0 1 48- 48 QllD F 1. 0 1 49- 49 Ql1E f 1· 0 1 50- 50 Qllf F 1. 0 1 51- 51 Q12 F 1. 0 1 52- 52 013 F 1. 0 1 53- 53 014 f 1. 0 1 54- 54
PROVIDES FOR 39 VARIABLES. 39 Will BE READ 1 RECORDS I 'CARDS• I PER CASE. A MAl< IMUM OF 54 1 COLUMNS 1 ARE USED ON A RECORD.
9 N OF CASES 10 Cm1PUTE 11 IF 12 IF 13 IF 14 IF 15 IF 16 VAR LABELS 17 18 19 20 21 22 23 24 25 26 27 28 29 30 31 32
UNKNOWN 00002500 PAV=O 00002600 IQ4A NE 01 PAY=l 00002700 (Q4B NE 0 AND PAY EJ 0) PAY=2 00002800 1048 NE 0 AND PAY EQ 1) PAY=4 00002900 (Q4C NE 0 AND PAY \IE 01 PAY=4 00003000 fQ4C NE 0 AND PAY EQ 01 PAY=3 00003100 Q1A,WORK TRIPS/Q1B,SHOPPING TRIPS/QlCeSCHOOl TRIPS/ 00003200 Q10,RECREATION TRIPS/Q2,USUAL TIME OF DAY OF TRIP/ 00003300 Q3A,BUS LINE/Q3B,8US liNE/Q3CtBUS LINE/Q4A,CASH FARE/ 00003400 Q4R,TICKET FARE/Q4C,TYPE OF PASS/Q5,NUMBER OF WEEKLY TRANOJ003500 SFERS/Q6,CONVENIE~CE OF TRANSFERS/Q6A,REASON,FORGOT TO 00003600 ASK FOR ONE/Q6B,REASON, LOSE TRANSFER/Q6C 1 REASON, DO NOT 00003700 UNDERSTAND TRANSFERS/Q6D,OTHER/Q7 1 LOCATION OF PURCHASE OF00003800 TICKETS/08,~MOUNT OF DISCOUNT FOR BOOK OF 10/Q9A,ATTITJDE00003900
ON NEEDING CORRECT FARE CHANGE/Q98,ATTlTUDE TOWARDS 00004000 WAITING fOR OTHER TO FINO FARE/Q9C 1 THE FARE SYSTEM IS 00004100 CONFUSJNG/Q9D,ATTITUDF,UNCERTAIN OF ZONE 80UNDARIES/ 00004200 Q9E,ATTITUDE, UNCERTAIN OF BOUNDARIES TO FARELESS SQUARE/00004300 Q9F,OTHER PROBLEMS NITH FARE COLLECTION/Q10tAWARENESS OF 00004400 NEW FARE SYSTEM/QlOA,AWARENESS OF BUS SCHOOL/Ql1,w1Ll 00004500 NEW FARE SYSTEM WORK/Q11A,NEW SYSTEM MORE-LESS CONFUSING/00004600 Q11B,NEW SYSTEM MJ~E-LESS RIDERS PAY RIGHT FARE/ 00004700 01lC,NfW SYSTEM FASTER-SLOWER GETTING ON BUS/ 00004800

ON BOARD - UNFACTORED
13 34 35 36 VALUE lABELS 37 18 3q 40 41 42 43 44 45 46 47 48 49 50 51 52 MISSING VAlUES 53 FREQUENCIES 54 55 STA Tl ST ICS
09/30/82
Ql1D,NEW SYSTEM CJSJ-S~VE HONEY FOR TRI-HET/ 00004900 011E,NfW SYSTEM OTHER/Qllf,NEW SYSTEM NOT SURE-TICKETS 00005000 INCONVENIENCE/Ql2,GENDER/Ql3tAGE/Ql4,JNCUME/ 00005100 Q2 C1JRUSH HOUR 12t~IDDAY (3)EVENING-NIGHT (4JHEEKENO 00005200 (5JOTHER/Q4A,Q4B (1).65 12t.90 131.45 C4J.25 (5)1.00 00005300
PAGE
(6tOTHER 17JMUlT. FARES/Q4C 1112 ZONE (2)3 ZONE ())YOUTH 00005400 (4)HONORED CITIZEN 15)VANCOUVER 16JOTHER 17JMORE THAN 00005500 ONE/Q6 ClJNOT CONVENIENT (5)VERY CONVENJENT/Q6A TO Q60, 00005600 QlO,QlOA,Ql1 Cl)YES C2JNO I31NO RESPONSE 141CONFLICTING 00005700 ANSWERS/Q7 CltORUG STORE 1217-11 STORE (3JBANK-Sl 00005800 (41CUSTOHER ASSJSTA~CE C51WORK (6JMAIL C710THER C8JSCHOOL00005900 C9JVARIOUS/Q8 ll)NO DISCOUNT 1215' (3)10~ 14t20' 45JOONT 00006000 KNOW I6JOTHER/Q9A TO Q9E ClJSTRONGLY AGREE (5JSTRONGlY 00006100 OISAGREE/Q9F (1)0RJVERS NOT UNDST. (2iDRIVERS UNWil. 00006200 I31TIHE CONSUMING 14JSOME OONT PAY 19JOTHER/ Ql2 ClJMALE 00006300 12)FEMALE/Ql3 (l)UNOER 16 12)16-24 13)25-44 (4)45-64 00006400 C5JOVER 64/ Ql4 CliUNOER $5K 121$5 TO lOK 131$10 TO l5K OOC06500 14)15 TO $25K 15IOVER $25K/PAY flJUSE CASH (2)USE TICKET ~0006600 (3JUSE PASS (4)USE \tUL TIPLE/ 00006700 QlA TO Ql4 (0) 00006600 INTEGER=QlA TO QlO,Q5 (0,99)/Q2,Q4A TO Q4C,Q6 TO Qll,Ql2 OOOC6900 TO Ql4C0,9J/Q3A TO Q3Cl0t2551 00007000 1,6 00007100
•FREQUENCIES' PROBLEM REQUIRES 11116 BYTES OF SPACE
56 READ INPUT DATA
AFTER READING 6108 CASES fROM SUBfllE ONBRO ~
00007200
E~~ OF DATA W'S ENCOUNTERED ON lOGICAl UNIT I 8
3

11/0l/~~ PAGI:. 2
ON o~·~"i) - vi·n-ACTOKLiJ
FILE ONBRO (CREATION DATE -= 09/30/821
OlA WORK TRIPS
RflHIJ\If. llf:Jl.JSlFD C.ll~""LLJITJ\/1:.
lltSOll.Jll F~t-:Cutf\C't F ~.-: (Jtf "r.v Alt._ f"PfU ( J\ If ui.H-< Y L!·Ht.L ( uL.t-.. fhlUllt:NC't (Pt:Rl.tf\1) (PfRfEI\ l) (Pt11Cfl\l)
0 ~HJ )'t•S l7eS l7.Q
Hl .1.•3 lef: }•«;. c;
( c 211 J•S 4.3 c~.A
) '}6 i•E 1·'~ 2·5 eA
4 213 3•5 4.3 ;JO •l
5 366 b•O 7e·4 .Jl.s
6 188 3·1 J,e ·4le3
1 48 o.e }.0 ·142. J 8 252 4•1 s.1 ·4·7.4
9 42 0·7 o.·9 ·[email protected]
10 2192 35•9 44e5 ·92e7
11 14 0•2 o •. J ·9~.0
12 137 ~·2 2.e ·9~.8
13 4 0•1 Oel •95.9
14 63 l•O 1··3 •97.1
15 19 0•3 Oe4 •c;7 .s
16 12 0•2 o.2 •97.8
17 4 \h1 o.1 •97.9
18 2 o.o o.o •Cj7 .9
19 o.o o.o '97.9
20 63 l•O 1.3 ·9Cj .2
21 3 o.o o.1 •9Cj ·2
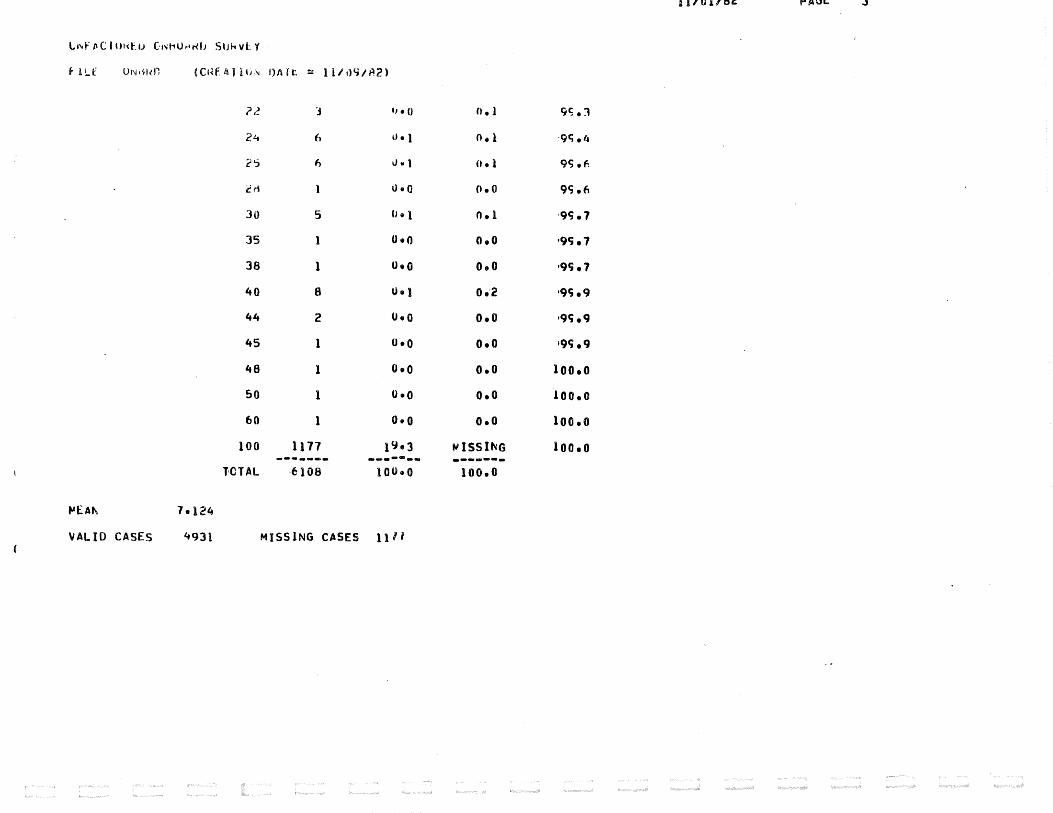
11/0l/82 PAGE:. J
Lt\of f\C i IH<EU Ci-.JhU~\I'<IJ SIJh vl Y
f llt ONtildi (Ct<f4JjU".: !)Alt. = l l/1) <; I A 2 )
?~ ] iJ. 0 n.l 9S .1
24 6 4Je 1 Oel ·9Cj .4
2'5 f., v .. l o.l qc;.f.
~ti U•O o.o 9c;.ft
30 5 (hl o.l ·9c;. 7
35 o.o o.o ·9c;. 7
38 1 o.o o.o •9c;. 7
40 8 OeJ o.-2 •9Cj .9
44 2 thO o.o •9c; .9
45 1 o.o o.o •9c;. 9
48 1 o.o o.o loo.o so 1 o.o o.o 1oo.o 60 1 o.o o.o 1oo.o
100 1177 }'JeJ t~ISSII\:G loo.o -----~- ------- -------
T·CTAL ·6108 lOOeO 100.0
t-AEAt-. 7el24
VALID CASES 4931 MISSING CASES 1111

11101/Hi! PAGt. 4
ON BO~RO - UNFACTOREO
FILE ONBRO (CREATION DATE 09/30/821
01 B SHOPPING TRIPS nfL A 1 1 vt. "C JL•S IF: n CIW·l.L 11 T T VE
-·--,..",..... .. 4 /.It: SoU ... Tt fl-<f:.Cut:.l\('t' ft..'E UUtl\C'Y At...~ Fflf c; (#I 1 f GtHc Y L llf~FL c (JIJF. fkt-.OUfi\C't' (Pt~Lt.t\l) C Pf J~CEl\ T) (PtM(f.'r"T)
lJ l')dti 2~•1 37.c .]1. f,
443 I•] }2.0 Lf<;.F,
f,J '3f>H ltt•2 ?3.5 1.~. 1
j 174 ·f,,
~': ~·P. 4. -, 77. ft .. t. t.tl2 b•7 11·2 eoc;.o
., kH !•4 2.4 <;).4
6 \34 ~·2 3.t: c;~.o
7 21 Ve4 o.7 ·<;~.1
H 50 \h~ 1.4 &;7. 1
9 6 V•l n.2 ·&;'7.?
111 57 U•<f 1 • 5 ·CjF. .A
ll 4 0•1 o.l ·Cj~. 9
12 8 0•1 o.2 ·9Cj ••
13 1 OeO o.o •9<; ·1
14 9 Oe} o.2 •9Cj .4
15 5 0•1 o.1 •9Cj .s 16 2 o.o o.1 ·9'i.6
18 2 o.o o.1 •9Cj .6
20 8 Ue} 0.2 •9c;. 8
21 0•0 o.o •9Cj .9
24 1 o.o o.o •9c; .9
25 1 o.o o.o •9Cj. 9

11101/82 PAGI:. 5 ':1\j BOARD G UNF ACTOREO
c.1 1 ~hO o.o •9Cj .. 9
JO 0•0 o.o loo.o 40 1 (h0 o.o too.o
100 2416 .JYe6 t-tlSSII\G 1oc.o _ .. _____ _ ___ ... _ .. -------lCTAL 6108 IOU•O too.o
MEAl\
VAllO CASES J692 MISSING CASES 241e

11/0i/82 PAGt: 6
ON BOARD - UNFACTOREO
FILE ONARD (CREATION DATE = 09/30/82,
QlC SCHOOL TRIPS 1-lflAII\If fiCJUSTFn ClJI""'l.LliTJVt:.
Ab50LlJTt:. FREGut.t-.C'r' F~fUt.f"-CY 1\U.., f~EQ
CATEGORY LfiHEL CODE Ft-.tUUENC'r' (Pff1l,t.f\1) CPERCEI\T) (PtRCEt-.T)
0 1776 2'1•1 53.2 ·5~.2
1 46 O•A }.4 ·S4.6
~ 121 2•0 Jef: [email protected]
3 41 0•7 1·2 .9c;.s
4 93 1•5 2e8 .e2.3
5 175 2·~ s.2 .fi7 .s
6 73 1·2 2·2 ·E'~. 7
7 24 0•4 o.7 70.4
8 55 0•9 1·6 12 •l
9 6 0•1 o.2 12·2
10 716 11•7 21 •. s .q~.7
11 2 o.o o.l .q~.e
12 43 0•7 1··3 •t;S el
13 4 0•1 o.l •t;S.2
14 30 0•5 o.c; •'if. 1
15 21 OeJ o.6 •t;f. 7
16 6 Oe} o.2 •«;f .9
1 7 1 o.o o.o •«if. 9
18 1 0·0 o.o •t;f .9
19 1 0•0 o.o •97 .o
20 72 1•2 2·2 ·9c; .t
21 0•0 o.o •9Cj ·2
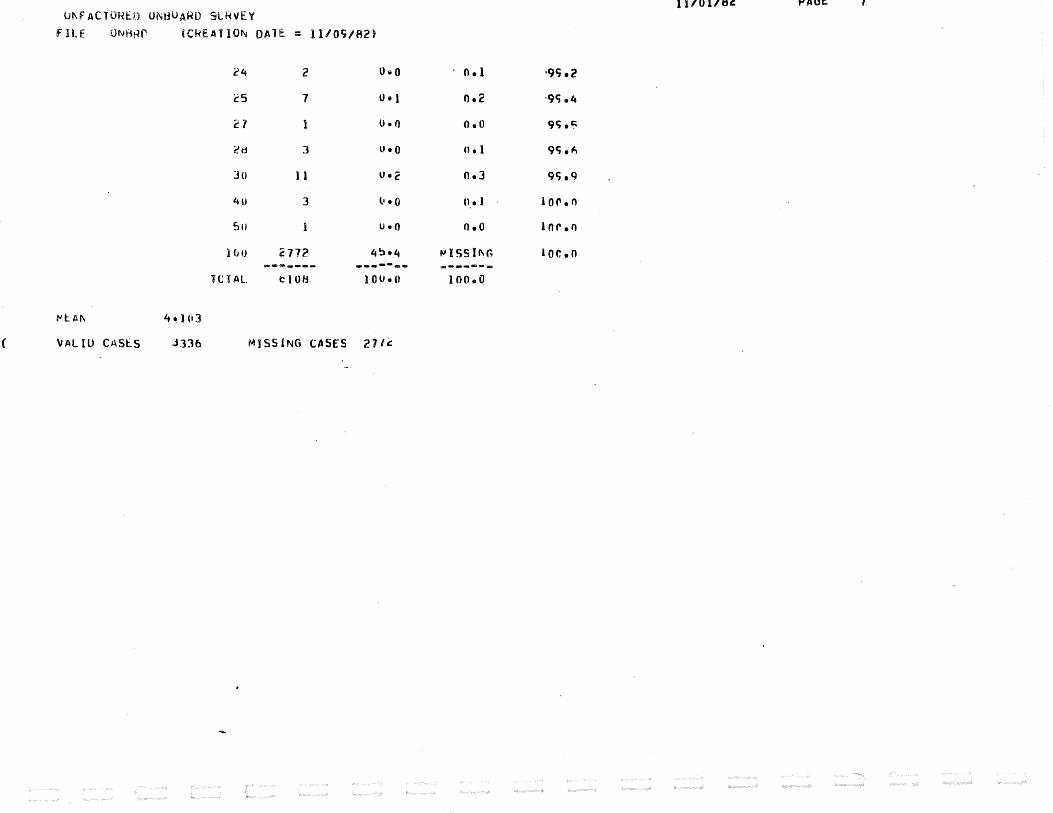
11/0l/82 PAGE. 7. u~fACTOH£0 ON~UARO SLkVEY
FILE ONARr (C~EAT!ON OAl[ = ll/0~/82)
~4 2 o.o o.l •9c;.2
£:5 7 o • I o.2 ·9c; .4
21 o.o o.o 9c;.c:;
cd 3 0•0 u.l 9c;.~;
JO ll 0•2 o.J 9c; .q
41) ] l•• 0 Cl .• 1 lOf'.O
511 u.o o.o lor.o
) fHJ c772 4~•4 ~ISSif\r, Joc.o P>------- ------- ........ -...
H.: TAL tlOH !00•0 too.o
( VAllO CASES J]36 MJSSJNG CASES 211~

11/0l/8~ PAGI:. 8
llE ·mRD (CR1 DN f = ( 1/82
OlD RECREATION TRIPS /
RELAIIVE .A'(~JUSTF:D CliMlJLATIVE ABSOLlJTE FRECUt.f\CY FREOUEt-.CY AU-.~ FREQ
CATEGORY LAAEl COOE FktQUfNCY (PEJ;Ct.t\T) (PERCEt\T) (Pf.RCENT)
0 1242 20•3 32.4 <~~ ·4
357 !l•B 9 •. 3 -41.7
2 751 }i:!•3 19e6 ·E 1. 3 3 185 J.o 4e8 ·6f. ·1
4 451 1·4 u.e 77.9
5 136 2·2 3e5 .fH .4
6 200 3t3 s.2 -8E e6
7 46 0•8 1·2 .f!7 .a
H 94 1•5 2e·S •Cj 0. J
9 8 Ot} o.2 ·CjO eS
10 169 2·8 4.4 •Cjlt. 9
11 4 Oo} Oe1 •«;5. 0
12 36 0•6 Oe9 •«;5. 9
13 3 o.o Oel •9E • 0
14 32 0•5 o.e •9E, A
15 30 OeS o.e •97.6
16 9 Oel o.·2 19'7.9
18 9 Ue} o.·2 •Sfle 1
20 45 Oe7 le2 •9Cj .J
22 0•0 o.o ·9c; ,J
24 (Je 0 o.o ·9c; .J
2~ 3 0•0 o.1 .qc; .4
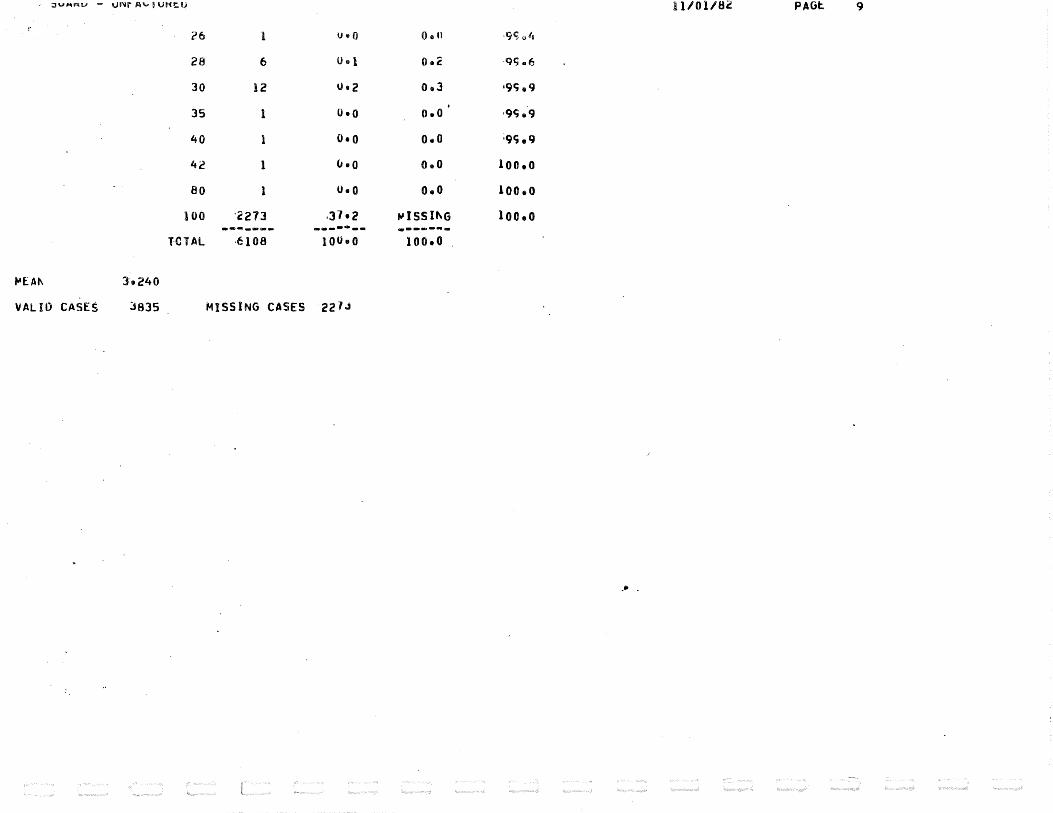
;JVJ.\F!{U..B - Ul'<llr A'-' D UKt.IJ ll/Ol/82 PAGt. 9
26 l V•O o.u ·9~ oio
28 6 (]$ 1 o.2 .qc; ·6
30 12 Ue2 Oo3 •9«;. 9
35 1 o.o o.o ·9«;. 9
40 o.o o.o ·9~.9
42 1 (leO o.o loo.o
80 l o.o o.o 1oo.o
100 '2273 .J7•2 ~ISSit\G loo.o -----4a- ------- ---.. -- .. lCTAl ·6108 lOOeQ 100.0
~EAt\ 3e240
VALlO CASES JBJS MISSING CASES 221.J
...

11/01/82 PAGI:. 10
FILE ONBRO (CREATION DATE = 09/30/82)
0~ EXAMINATION Of TRANSFEHS
fiLE TRANS (CREATION OAT~ = ll/08/A2)
as
RELAIIVE ACJUS1EO CUMlL,TTVE At! SOLUTE FRfCUtf\CY FPEOLJff\CY ALIJ FREQ
CAH·bOI-<Y LA8E:.L COuE fkEQlJEf\CY (PfRI..t.l\1) ( Pf RCE.f\ T) (PtRCEI\1)
0 941 1~•4 34ef: -34 e6
219 ]e(:, A eO 42.6
2 285 4•7 10.5 5~.}
3 117 l•'i 4.3 ·~1 .4
4 194 3·2 7.1 f-4 .s
5 248 4 •1 -9.1 7.~ 8 f,
6 125 ~•0 4ef 1·E • ~
7 44 0•7 leE: 7'fi. ~
8 67 l•l 2e5 Pt=.~
9 15 0•2 o.~ P.2.~
10 279 4ef: l0e2 -9~ el
11 19 OeJ Oe7 ·9~ .a
12 44 Oe7 leE: ·<;~ .4
13 3 u.o Oel .c;~ .5
14 22 Oe4 o.e ·9~. 3
15 23 Ue4 o.e ·~7.2
16 9 Ue} o.J •97.5
17 2 o.o Oel •97.6
1ij 4 Oe} o.1 •97. 7
19 2 OeO o.1 •97.8
20 34 Uo6 1·2 ·9':; .o
21 2 o.o o.t ·9c; .r

11/0l/82 PAGt. 1! lJNf AClOREO CNBOI'RU SlJRV~- Y
filE ONliRO iCREATJU~ DATE = !1109182)
22 2 0•0 Otl ·9'i ·2
24 J OtO o.l •9c;. 3
25 1 0•1 o •. J •9'ie6
26 2 0•0 o.l •9'i. 6
28 1 o.o o.o •9'i. 7
30 5 U•l o.2 ·9'i .9
35 1 o.o o.o •9'i .9
50 2 o.o o.l too.o 94 1 o.o o.o too.o
100 .JJ86 ·55•4 f'ISSI"G loo.o -------- ------- --------( TCTI1L t:)08 lOOeO Joo.o
( !"'f:A~ . 3•9Q)
VI'LIU CASES l!.1i!2 MISSING CASES J3tjb

~N 80AKU - LN~ACTO~tU 09/30/82 PAGE 14
FILE ONRRD (CREATION DATE = 09/30/82)
02 USUAL TIME OF DAY OF TRIP
RELATIVE AOJUS TEO CUMULATIVE ABSOLUTE FREQUENCY FREQUENCY AOJ FREQ
CATEGORY lABEL CODE fREQUENCY f PERC ENTt (PERCENT) (PERCENT)
RUSH HOUR 1 3251 53.2 56.3 56.3
MIDDAY 2 1251 20.5 21.7 78.0
EVEN lNG-NlGHT 3 244 4.0 4 .. 2 82.2
WEEKEND 4 108 1.8 1. 9 84.1
OTHER 5 918 15.0 15.9 100.0
9 2 o.o o.o 100.0
0 334 5.5 MISSING 100.0 ------- ---- ------
TOTAL 6108 100.0 100.0
MEAN 1.996 VARIANCE 2.128
VALID CASES 5774 HISSING CASES 334

ON BOARD - UNFACTOREO 09/30/82 PAGE 15
filE ONBRD «CREATION DATE = 09/30/82)
Q4A CASH FARE
RElATIVE ADJUSTED CUMULATIVE ABSOlUTE FREQUENCY FREQUENCY AOJ FREQ
CATEGORY lABEl CODE fREQUENCY C PERC ENTJ CPERCENT J IPERCENTJ
.65 1 1229 20.1 49.7 49.7
.90 l 425 7.0 17.2 66.9
.45 3 396 6.5 16. 1 83.0
.25 4 195 3.2 7.9 90.9
1.00 5 27 0.4 ... l 92.0
OTHER 6 24 .0.4 1.0 92.9
HULT. FARES 1 175 2.9 1. 1 100.0
0 3635 59.5 MISSING 100.0 -------- ..------- --------
TOTAL 6108 100.0 100.0
MEAN 2e247 VARIANCE 2.936
VAl 10 CASES 2473 MISS lNG CASES 3635

ON BO~RD - UNfACTORED 09/30/82 PAGE 16
FILE ONBRD (CREATION DATE = 09/30/82)
Q48 TICKET FARE
RELATIVE AOJUS TEO C UHULATI VE ABSOLUTE FREQUENCY FR EQJENCV AOJ FREQ
CATEGORY LABEL CODE FREQUENCY f PERCENH I PERCENT) I PERCENT)
.65 1 399 6.5 50.7 50.7
.90 2 215 3.5 27.3 78.0
.45 3 86 1.4 10.9 88.9
.25 4 47 o.8 6.0 94.9
1.00 5 5 o.t o. 6 95.6
OTHER 6 6 0.1 0.8 96.3
MULT. FARES 1 29 0.5 3.1 100.0
0 5321 87.1 'tiSSING 100.0 ------- ------ -------
TOTAL 6108 100 .o 100.0
MfAN 1.956 VARIANCE 1.956
VAllO CASES 181 H I S S I NG C A SE S 5321
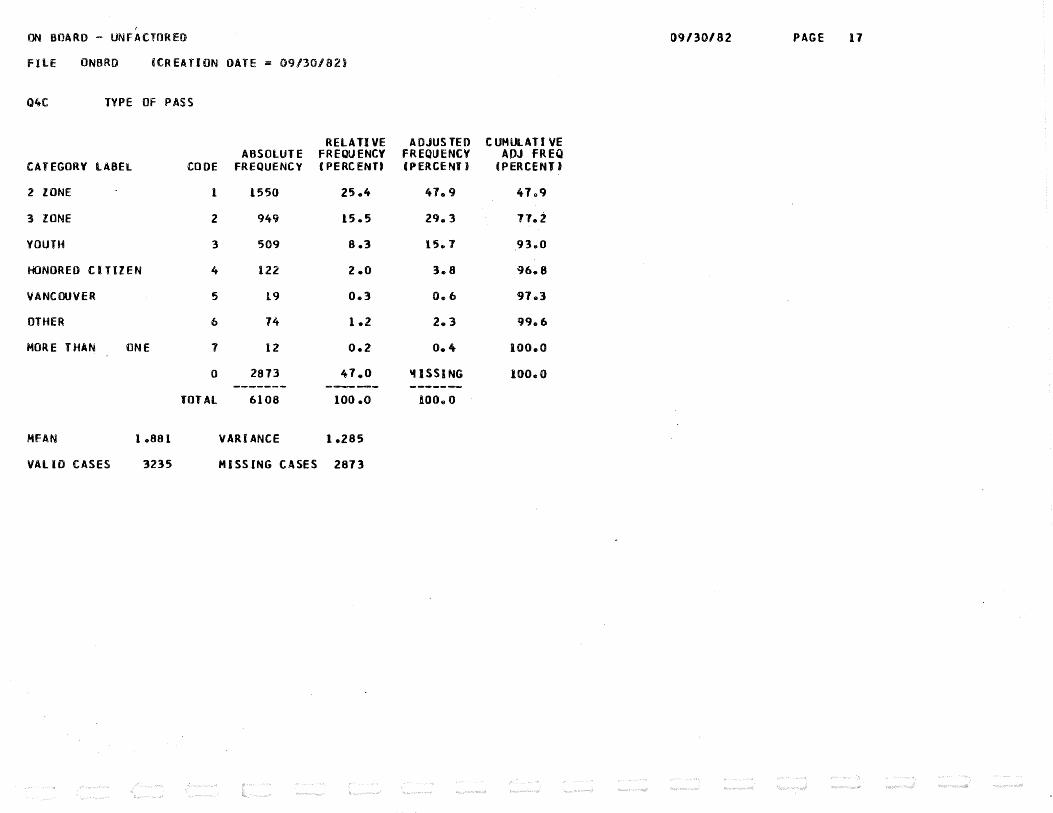
I
ON BOARD - UNFACTOREO 09/30/82 PAGE 17
FILE ONBRO (CREATION OATE = 09/30/82»
QltC TYPE OF PASS
RELATIVE ADJUS TEO CUHULATI VE ABSOLUTE FREQUENCY FREQUENCY ADJ FREQ
CATEGORY lABEl CODE FREQUENCY I PERCENTt CPERCENT J (PERCENT I
2 ZONE l 1550 25.4 47.9 47o9
3 ZONE z 949 15.5 2953 77.2
YOUTH 3 509 8.3 15.7 93.0
HONORED CITIZEN 4 122 2.0 3.8 96.8
VANCOUVER 5 19 0.3 0.6 97.3
OTHER 6 74 1 .2 2. 3 99o6
MORE THAN ONE 7 12 0.2 0.4 100.0
0 2873 47.0 'tiSSING 100.0 ------- ---- _.., _______
TOTAl 6108 100.0 100.0
HFAN I .881 VARIANCE 1.285
VAllO CASES 3235 HISSING CASES 2873
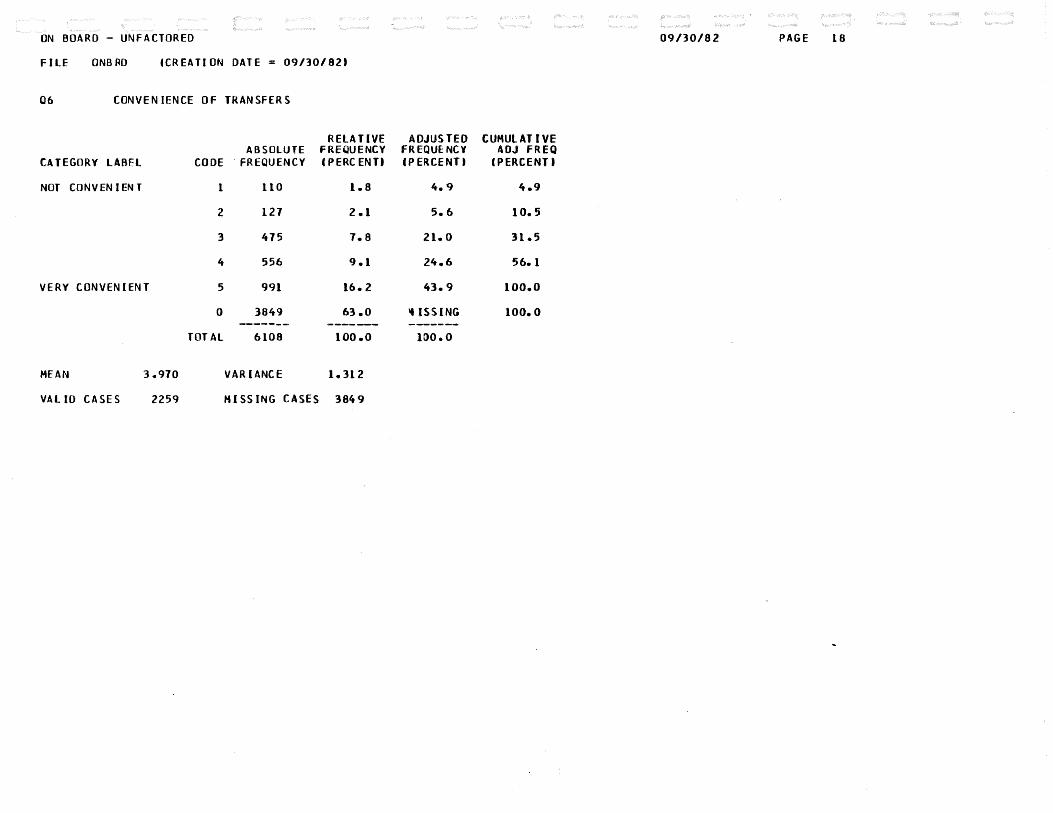
ON BOARD - UNFACTOREO 09/30/82 PAGE 18
FILE ONBRO (CREATION DATE = 09/30/821
06 CONVENIENCE Of TRANSFERS
RELATIVE AOJUS TEO CUMULATIVE ABSOLUTE FREQUENCY FREQUENCY AOJ FREQ
CATEGORY LAAEL CODE "fREQUENCY f PERC ENTJ CPERCENTJ (PERCENT I
NOT CONVEN lENT 1 110 1.8 4. 9 4.9
2 127 2.1 5. 6 10.5
3 475 7.8 21.0 31.5
4 556 9.1 24.6 56.1
VERY CONVENIENT 5 991 16.2 43.9 100.0
0 3849 63 .o 'IISSING 100.0 ------ ------- ------
TOTAL 6108 100.0 1()0. 0
HfAN 3.970 VARIANCE 1. 312
VAllO CASES 2259 HISSING CASES 3849

ON BOARD - UNFACTORED 09/30/82 PAGE 19
filE ONBRO CCREATION DATE = 09/30/82)
C6A REASON,FORGOT TO ASK FOR ONE
RELATIVE ADJUSTED .CUHULAT I VE ABSOLUTE fREQUENCY FREQUENCY AOJ FREQ
CATEGORY LABEL CODE FREQUENCY IPERCENTI CPERCENTt (PERCENT I
YES 1 66 1.1 98.5 r 98.5
5 1 o.o 1. 5 100.0
0 6041 98.9 HISSING 100.0 ------- ------ _____ ..., __
TOTAL 6108 100.0 100.0
MEAN I .060 VARIANCE 0.239
VALID CASES 67 HISSING CASES 6041

DN BuA~~ - uNr~CTOk~u 09/30/82 PAGE _. 20
FILE ONBRO (CREATION DATE 09/30/82)
068 REASON, LOSE TRANSFER
RElATIVE AOJUS TEO CUMULATIVE ABSOLUTE FREQUENCY FREQUENCY ADJ FREQ
CATEGORY LABEL CODE FREQUENCY fPERCENTI IP ERCENT I (PERCENT I
V~5 2 83 1 .4 98.8 98.8
CONFliCTING ANSWERS 4 1 o.o 1. 2 100.0
0 6024 98.6 HISSING 100.0 ------ ---- -------
TOTAL 6108 100 .o 100.0
MEAN 2.024 VARIANCE 0.048
VAllO CASES 84 MISS lNG CASES 6024

ON BOARD - UNFACTORED 09/30/82 PAGE 21
FILE ONBRO (CREATION DATE : 09/30/821
06C REASONj DO NOT UNDERSTAND TRANSFERS
RELATIVE ADJUSTED CUHULATI VE ABSOLUTE FREQUENCY FREQUENCY ADJ FREQ
CATEGORY lABEl CODE FREQUENCY I PERC ENTI I PERCENT J CPERCENTJ
ye.s 3 24 0.4 100.0 100.0
0 6084 99.6 HISSING 100.0 ------- ---- -----TOTAl 6108 100.0 100.0
MEAN 3o000 VARIANCE o.o VAllO CASES 24 HISSING CASES 6084

ON llOAKO - dNt-ACTOKED 09/30/82 PAGE 22
FILE ONBRO (CREATION DATE = 09/30/821
Q60 OTHER
RELATIVE AOJUS TEO CUMULATIVE ABSOlUTE FREQUENCY FREQUENCY AOJ FREQ
CATEGORY lABEl CODE FREQUENCY IPERCENTI (PERCENT J (PERCENT J
'lfS 4 80 1.3 100.0 100.0
0 6028 98.7 MISSING 100.0 ------ ----- ------
TOTAl 6108 100.0 100.0
MEAN 4.000 VARIANCE o.o
VALID CASES 80 MISSING CASES 6028
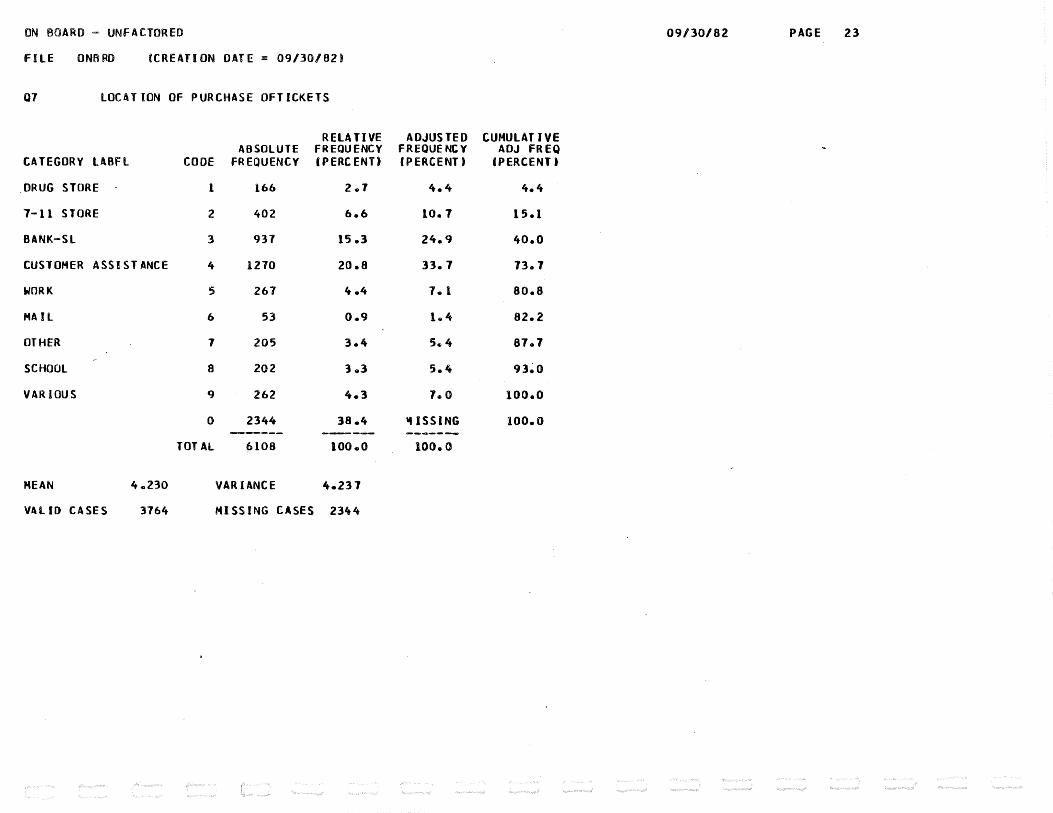
ON BOARD - UNFACTOREO 09/30/82 PAGE 23
FilE ONRRD CCREIHI ON DATE = 09/30/82)
07 lOCATION OF PURCHASE OFTICKETS
RElATIVE AOJUS TEO CUMUlATIVE ABSOLUTE FREQUENCY FREQUENCY AOJ FREQ
CATEGORY lABFl CODE FREQUENCY f PERC ENTt I PERCENT I CPERCENTI
DRUG STORE 1 166 2.7 4.4 4.4
7-11 STORE 2 402 6.6 10.7 15.1
BANK-Sl 3 937 15.3 24.9 40.0
CUSTOMER ASSISTANCE 4 1270 20.8 33.7 73.7
WORK 5 267 lt.4 1. 1 80.8
MAll 6 53 0.9 1.4 82.2
OTHER 7 205 3.4 5. 4 87.7
SCHOOl 8 202 3.3 5.4 93.0
VARIOUS 9 262 4.3 7.0 100.0
0 2344 38.4 'IISSING 100.0 ------ ---- ---------TOTAl 6108 100.0 100.0
MEAN 4.230 VARIANCE 4.237
VALID CASES 3764 HISS lNG CASES 23't4
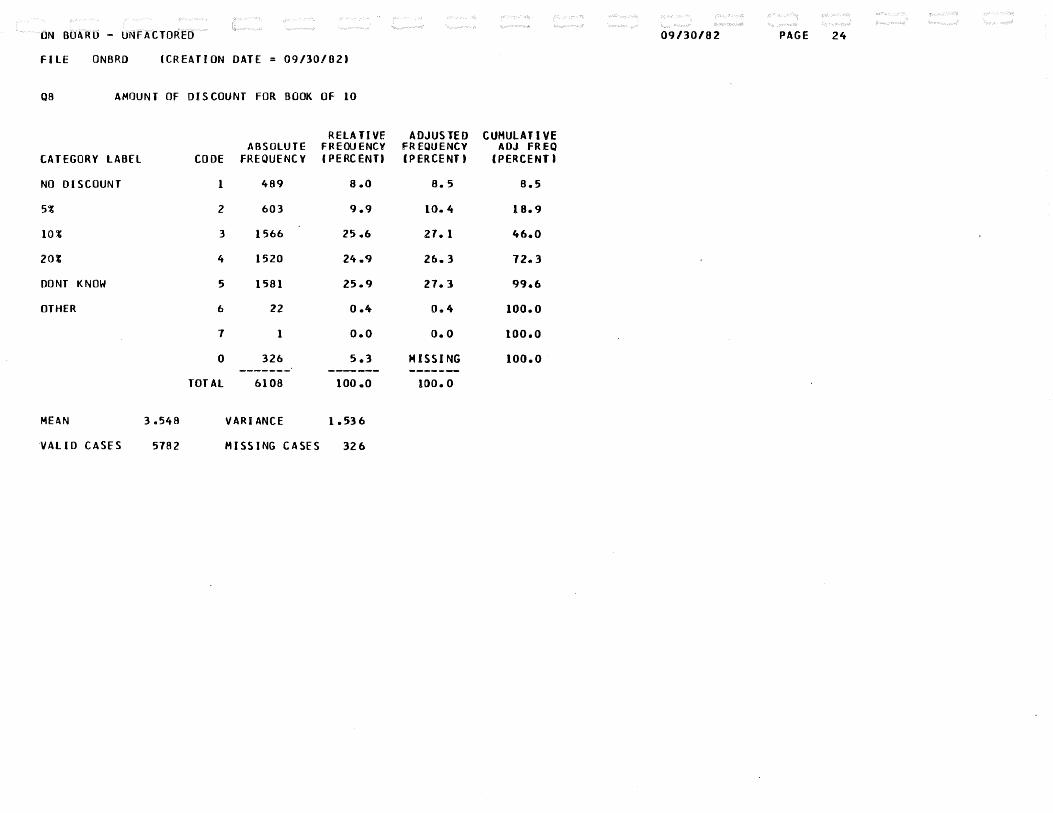
ON BUARU - UNFACTOREO 09/30/82 PAGE 24
FILE ONBRD (CREATION DATE = 09/30/82)
08 AMOUNT OF DISCOUNT FOR BOOK Of 10
RELATIVE ADJUS TEO CUMULATIVE ABSOLUTE FREQUENCY fREQUENCY ADJ FREQ
CATEGORY LABfL CODE FREQUENC V C PERCENT) I PERCENT) CPERCENTt
NO DISCOUNT 1 489 8.o 8. 5 8.5
5~ 2 603 9.9 10.4 18.9
lOt 3 1566 25.6 27. 1 46.0
20% 4 1520 24.9 26.3 72.3
DONT KNOW 5 1581 25.9 27.3 99.6
OTHER 6 22 0.4 0.4 100.0
1 1 o.o o.o 100.0
0 326 5.3 HISSING 100.0 ------- ----- ------
TOTAL 6108 100 .o 100.0
MEAN 3.548 VARIANCE 1.53 6
VALID CASES 5782 HISS I NG CASES 326

ON BOARD - UNfACTORED l9/30/82 PAGE 25
FILE ONBRO fCR EAT I ON OAJE = 09/30/821
Q9A ATTITUDE ON NEEDING CORRECT FARE CHA~ GE
RELATIVE ADJUSTED CUMULATIVE ABSOLUTE fREQUENCY FREQUENCY ADJ FR EQ
CATEGORY LABEL CODE FREQUENCY C PERCENTJ I PERCENT» IPERCENT»
STRONGLY i>t~ft6-ii.E.E 1 845 13.8 l5o 3 15.3
2 745 12.2 13 .. 5 28.8
3 1339 21.9 24.2 53.0
4 971 15.9 17.6 70.6
STRONGLY AGREE 5 1622 26.6 29.4 100.0
0 586 9.6 atiSSING 100.0 ----- ------ ____ ..,_,_..
TOTAl 6108 100.0 100.0
MEAN 3.322 VARIANCE 1.994
VAllO CASES 5522 MISSING CASES . 586

ON 8UAK0 - UNfACTO~EO 09/30/82 PAGE 26
FILE ONARO ( CREATION DATE = 09/30/82)
09R A TTl TUDE TOWARDS WAITING FOR OTHER T
RELATIVE AOJUS TEO CUMULATIVE ABSOLUTE FREQUENCY FREQUENCY ADJ FREQ
CATEGORY lABEl CODE FREQUENCY (PERCENT) (PERCENT) I PERCENT I
STRONGLY pfsr.G21!'E' 620 10.2 11.3 11.3
2 700 u. 5 12. 7 24.0
3 1348 22 .1 2ft.5 48.5
4 940 15.4 17.1 65.6
STRONGLY AGREE 5 1890 30.9 34.4 100.0
0 610 10.0 ,.ISSING 100.0 ------- ------ -------
TOTAl 6108 100.0 100.0
HEAN 3.506 VARIANCE 1.869
VALID CASES 5498 MISSING CASES 610

ON BOARD - UNFACTOREO 09/30/82 PAGE 27
fFU.E ONBRO «CREATION DATE = 09/30/82t
Q9C THE fARE SYSTEM IS CONFUS lNG
RELA liVE ADJUSTED CUMULATIVE ABSOLUTE FREQUENCY FREQUENCY ADJ FREQ
CATEGORY lABEl CODE FREQUENCY IPERCENTt IP ERCENT I CPERCENTJ
STRONGL YDISA-6-RC.E l 1132 18.5 20" 5 20.5
2 860 14.1 15.6 36.1
3 1240 20.3 22.5 58.6
4 848 13.9 l5elt 74.0
STRONGLY AGREE 5 1431 23.4 26.0 100.0
0 597 9.8 HISSING too.o ------- ------ -------
TOTAL 6108 100.0 100.0
MEAN 3.106 VARIANCE 2.159
VALID CASES 5511 MISSING CASES 597

UN BUARO - UNFACTOREO 09/30/82 PAGE 28
FILE ONBRO (CREATION DATE = 09/30/821
090 ATTITUOE,UNCERTAIN OF ZONE BOUNDARIES
RELA Tl VE AOJUS TEO CUMULATIVE ABSOLUTE FREQUENCY FREQUENCY AOJ FREQ
CATEGORY LABEL CODE FREQUENCY IPERCENTt I PERCENT J (PERCENT J
STRONGlY l>\~MrRt.f' 1 1032 16.9 19.2 19.2
2 710 11.6 13.2 32.4
3 1202 19.7 22.3 54.7
4 983 16.1 18.3 73.0
STRONGLY AGREE 5 1454 23.8 27.0 100.0
0 121 11.9 HISSING 100.0 ------ _..., _____ ------
TOTAL 6108 100.0 100.0
MEAN 3.208 VARIANCE 2.120
VAllO CASES 5381 HISSING CASES 121

09/30/82 PAGE 29
filE ONBRD (CREATION DATE = 09/30/82)
09E ATTITUDE, UNCERTAIN OF BOUNUARIES TO FAR
RELA liVE ADJUSTED CUMULATIVE ABSOLUTE FREQUENCY FREQUENCY AOJ FREQ
CATEGORY lABEl CODE FREQUENCY I PERCENTI I PERCENT I CPERCENTI
STRONGlY ~t$A-ri'EE 1 1789 29.3 33.7 33.7
2 865 14.2 16.3 50.0
3 1033 16.9 19.5 69.4
4 664 10.9 12.5 81.9
STRONGLY AGREE 5 959 15.7 18. 1 100.0
0 798 13.1 'tiSSING 100.0 ------- ------- ------TOTAl 6108 100.0 100.0
MEAN 2.650 VARIANCE 2.236
VALID CASES 5310 MISSING CASES 798

ON BO~RO - UNFACTOREO 09/30/82 PAGE 30
FILE ONBRD (CREATION DATE = 09/30/82)
09F OTHER PROBLEMS WITH FARE COLLECTION
RELATIVE AOJUS TED CUMULATIVE ABSOLUTE FREQUENCY FREQUENCY AOJ FREQ
CATEGORY LABEL CODE FREQUENCY (PERCENT) (PERCE NT) CPERCENT)
DRIVERS NOT UNDST. 1 11 0.2 2.6 2.6
DRIVERS UNW IL. 2 21 0.3 4. 9 7.5
TIME CONSUMING 3 12 0.2 2.8 10.3
SOME OONT PAY 4 33 0.5 1. 7 t8.o
5 1 0 .o 0.2 18.2
8 1 o.o 0.2 18.5
OTHER 9 349 5.7 81.5 100.0
NotJf. 0 5680 93 .o '41SSING 100.0 ------ ------ -----
TOTAL 6108 100.0 100.0
MEAN 7.886 VARIANCE 5.797
VALID CASES 428 MISSING CASES 5680

~ON BOARD- UNFACTOREO 09/30/82 PAGE 31
filE ONBRO «CREATION DATE = 09/3J/82)
010 AWARENESS Of NEW fARE SYSTEM
RELATIVE AOJUS TEO CUHULAT I VE ABSOLUTE FREQUENCY FREQUENCY ADJ FREQ
CATEGORY lABEl CODE fREQUENCY C PERC ENTI CPERCENTt CPERCENT J
YES l 4785 78.3 79.7 79.7
NO 2 1222 20.0 20.3 100.0
0 101 1 .7 HISSING 100.0 ------- ------ .at------
TOTAL 6108 100.0 100. 0
MEAN 1.203 VARIANCE 0.162
VALID CASES 6007 HISS lNG CASES 101

ON BOARD - UNFACTORED 09/30/82 PAGE 32
FILE ONBRD (CREATION DATE = oq/J0/82t
QlOA AW4RENESS OF BUS SCHOOL
RELA JIVE ADJUS TEO CUMULATIVE ABSOLUTE FREQUENCY' FREQUENCY ADJ FREQ
CATEGORY LABEL CODE FREQUENCY I PERCENT» I PERCENT) IPERCENTt
YES 1 3965 64.9 67.1 67.1
NO 2 1940 31.8 32.8 100.0
3 1 o.o o.o 100.0
4 1 o.o o.o 100.0
0 201 3.3 MISSING 100.0 ------- ------ -------
TOTAL 6108 100.0 100.0
MEAN 1.32q VARIANCE 0.222
VALID CASES 5qo1 HISSING CASES 201

ON BOARD - UNFACTORED 09/30/82 PAGE 33
FILE ONBRO (CREATION DATE = 09/30/82)
Qll WILL NEW FARE SYSTEM ~ORK
RELA TJVE ADJUSTED CUMULATIVE ABSOLUTE FREQUENCY FREQUENCY AOJ FREQ
CATEGORY lABEl CODE FREQUENCY C PERC ENTI IP ERCENT J CPERCENTI
YES 1 2968 48.6 52.9 52.9
NO 2 1937 31.7 34.5 87.4
NO RESPONSE 3 219 3.6 3.9 91.3
CONfl lC TING ANSWERS 4 489 8.0 8.7 100 .. 0
0 495 8.1 MISSING 100.0 ------ ------ -------=-
TOTAl 6108 100.0 100.0
MEAN 1.684 VARIANCE 0.817
VAllO CASES 5613 HISS lNG CASES 495
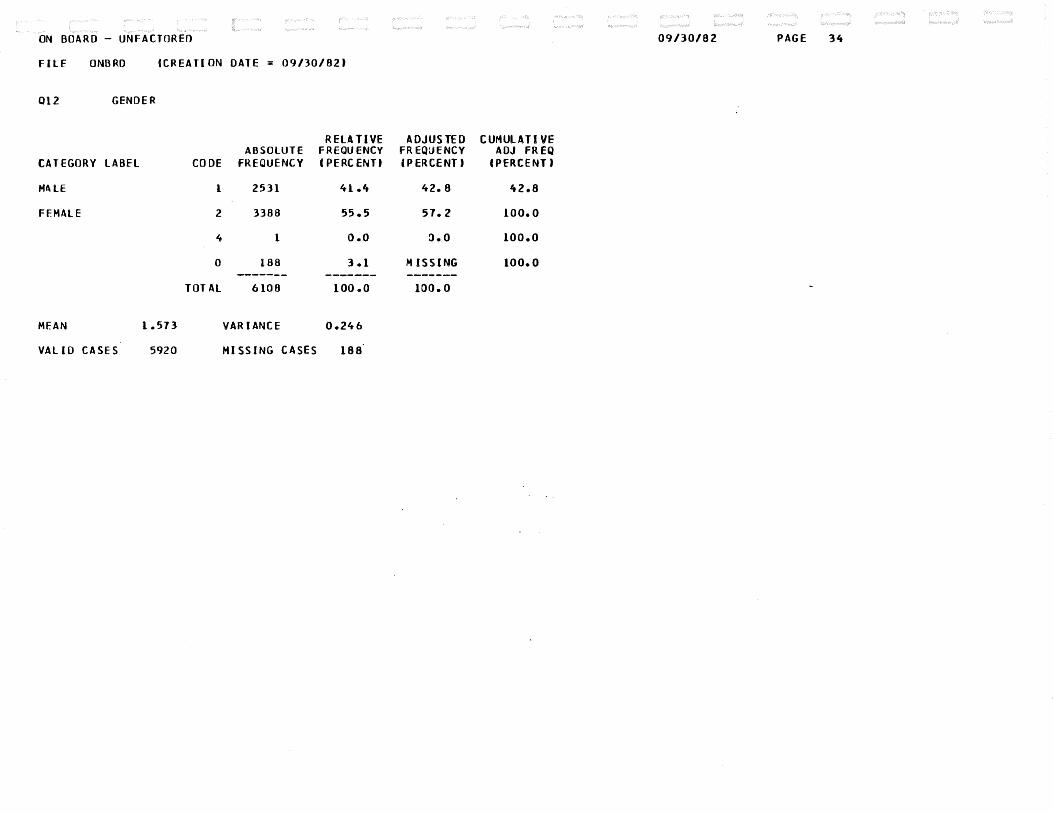
ON BOARD - UNFACTOREO 09/30/82 PAGE 34
FILE ONBRD ICREA Tl ON DATE 09/30/821
012 GENDER
RELATIVE AOJUS TED CUMULATIVE ABSOLUTE FREQUENCY FR EQLJENCY ADJ FR EQ
CATEGORY lABEl CODE FREQUENCY C PERCENT) CPERCENT) (PERCENT)
MALE 1 2531 41.4 42.8 42.8
FfMAlE 2 3388 55.5 57.2 100.0
4 1 o.o :l.O 100.0
0 188 3.1 MISSING 100.0 ------- ------- -------
TOTAl 6108 100.0 100.0
MEAN 1.573 VARIANCE 0.246
VALID CASES 5920 MISSING CASES 188

ON BOARD - UNFACTOREO 09/30/82 PAGE 35
filE ONBRO «CREATION DATE = 09/30/82»
013 AGE
RElATIVE ADJUSTED CUMULATIVE ABSOLUTE FREQUENCY FREQUENCY AOJ FREQ
CATEGORY lABEl CODE FREQUENCY f PERCENTI I PERCENT) iPERCENTJ
UNDER 15 l 261 4.3 4 .. 4 4.4
16-24 2 2058 33.7 34.6 39e0
25-44 3 2403 39.3 ~0.4 79.5
45-64 4 875 14.3 14.7 94.2
OVER 64 5 344 5.6 5. B 100.,0
0 167 2.7 MISSING 100.0 ------- ---- -------
TOTAL 6108 100.0 100.0
MEAN 2.829 VARIANCE 0.872
VAllO CASES 5941 HI S S I NG C A SE S 167

ON BOARD - UNFACTOREO 09/30/82 PAGE 36
FILE ONE\RO (CREATION OATE 09/30/82)
014 INCOME
RELATIVE AOJUS TEO CUMULATIVE ABSOLUTE FREQUENCY FR E;}UENC't ADJ FRE Q
CATEGORY LABEL CODE FREQUENCY (PERCENT) (, E:tCENT t (PERC:Ntt
UNDER $5K 1 1057 17.3 19.5 19.5-
$5 TO 10K 2 988 16.2 18.2 37.7.
$10 TO l5K 3 1028 16.8 18.9 56.6
15 TO $25K 4 1151 18 .a 21.2 11.8
OVER $25K 5 1204 19.7 22.2 100.0
,0 680 11.1 HISSING lll.J ------- ------ -------
TOTAL 6108 100.0 100.0
MFAN 3.084 VARIANCE 2.054
VALID CASES 5428 HISSING CASES 680

ON BOARD - UNFACTOREO ()9/]0/82 PAGE 53
FILE ONBRO CCREAT I ON DATE = 09/30/82)
QllA NEW S YSTEH ~ CONFUSING
RELA liVE ADJUSTED CUMULATIVE ABSOlUTE FREQUENCY FREQUENCY ADJ FR EQ
CATEGORY lABEl CODE FREQUENCY CPERCENTI I PERCENT t (PERCENT J
t 1357 45~7 99.7 99.7
2 4 0.1 0.3 100.0
0 1607 54.1 HISSING too.o ------- ------- -------
TOTAL 2968 100.0 100.0
V~LIO CASES 1361 HISSING CASES 1607

UN BOARD - UNFACTOREO 09/30/82 PAGE 54
filE ONBRD CCREATI ON DATE = 09/30/82)
0118 NEW SYSTEM 1'\o'-E. RIDERS PAY RIGHT FARE.
RELATIVE AOJUS TEO CUMUlATIVE ABSOLUTE FREQUENCY FREQUENCY AOJ FREQ
CATEGORY lABEL CODE FREQUENCY C PERC ENTt C PERCE NT I CPERCENTt
1 1 o.o 0.1 0.1
2 1261 42.5 99.7 99.8
3 3 0.1 0.2 100.0
0 1703 57.4 HISSING 100.0 ------- ------ -------
TOTAl 2968 100.0 100 .. 0
VALID CASES 1265 MISSING CASES 1703

ON BOARD - UNFACTOREO 09/30/82 PAGE 55
fiLE ONBRO «CREATION DATE = 09/30/82)
OllC NEW SYSTEM FASTER GETT lNG ON BUS
RELATIVE ADJUS TEO CUMULATIVE ABSOLUTE FREQUENCY FREQUENCY ADJ FREQ
CATEGORY LABEl CODE FREQUENCY I PERCENT) ·I PERCENT J IPERCENlJ
2 3 0.1 J.2 0.2
3 1687 56.8 99.6 99.8
4 3 0.1 o. 2 100.0
0 1275 43.0 'tiSSING 100.0 ------- ---- --....----
TOTAL 2968 100.0 100.0
V4ll0 CASES 1693 MISSING CASES 1275

ON BOARD - UNFACTORED 09/30/82 PAGE 56
FILE ONBRD ICREAT I ON DATE = 09/30/82)
0110 NEW SYSTEM ·SAVE MONEY FOR TR I-HE T
RELA Tl VE AOJUS TED CUMULATIVE ABSOLUTE FREQUENCY FR E:)UENC Y AOJ FREQ
CATEGORY lABFI., CODE FREQUENCY (PERCENT) I PERCENT t I PERCENT I
3 2 0.1 0.2 o.z 4 931 31.4 99.7 99.9
5 1 o.o Oel 100.0
0 2034 68.5 HISSING 100.0 ------- ------ -------
TOTAL 2968 100.0 Ill. 0
VALID CASES 934 MISSING CASES 2034

ON BOARD - UNFACTOREO 09/30/82 PAGE 57
filE ONBRO «CREATION DATE = 09/30/821
Ql!E NEW SYSTEM OTHER
RELATIVE ADJUSTED. CUMULATIVE ABSOLUTE FREQUENCY FREQUENCY AOJ FREQ
CATEGORY lABEl CODE FREQUENCY CPERCENTI CPERCENTI IPERCEN.T I
5 187 6.3 100.0 100.0
0 2781 93.7 HISSING 100.0 ------- ---- ------
TOTAl 2968 100.0 100.0
VAllO CASES 187 HISSING CASES 2781
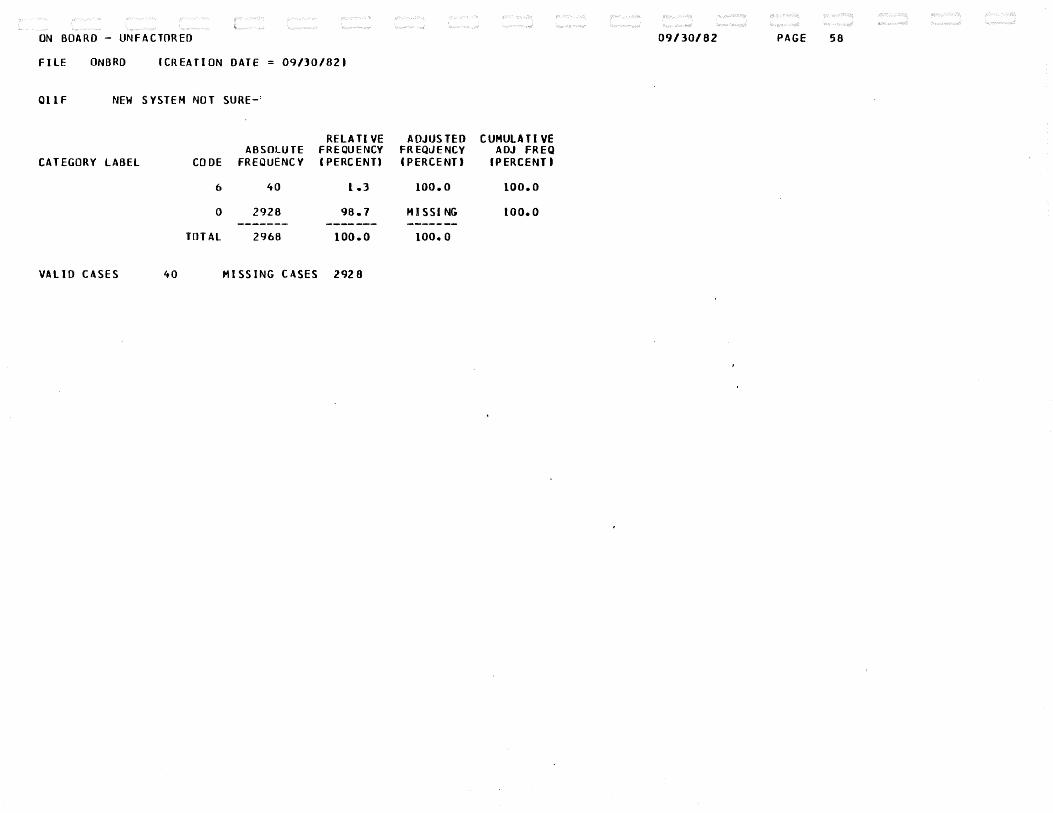
ON BOARD - UNFACTOREO 09/30/82 PAGE 58
Fl LE ONBRO (CREATION DATE 09/l0/82»
Qll F NEW SYSTEM NOT SURE-'
RELA Tl VE AOJUS TEO CUMULATIVE ABSOLUTE FREQUENCY FR EQlJENCY ADJ FREQ
CATEGORY LABEL CODE FREQUENCY (PERCENT) C PERCE NT I CPERCENTI
6 40 1.3 100.0 100.0
0 2928 98.7 HISSING 100.0 ------- ------- -------
TOTAL 2968 100.0 100.0
VALID CASES 40 MISSING CASES 2928

ON BOARD - UNFACTORED 09/30/82 PAGE 60
FILE ONBRD (CREATION DATE = 09/10/828
QllA NEW SYSTEM MOREe I CONFUS lNG
RELATIVE AOJUS TEO CUMULATIVE ABSOlUTE FREQUENCY FREQUENCY AOJ FREQ
CATEGORY lABEL CODE FREQUENCY I PERC ENTI IPERCENT J IPERCENT I
l 1206 62.3 99.9 99.9
2 1 0.1 o. 1 100.0
0 730 17.7 HISSING 100.0 ------- ---- ----a:a--
TOTAL 1937 100.0 100-.0
VAllO CASES 1207 HISS lNG CASES 730
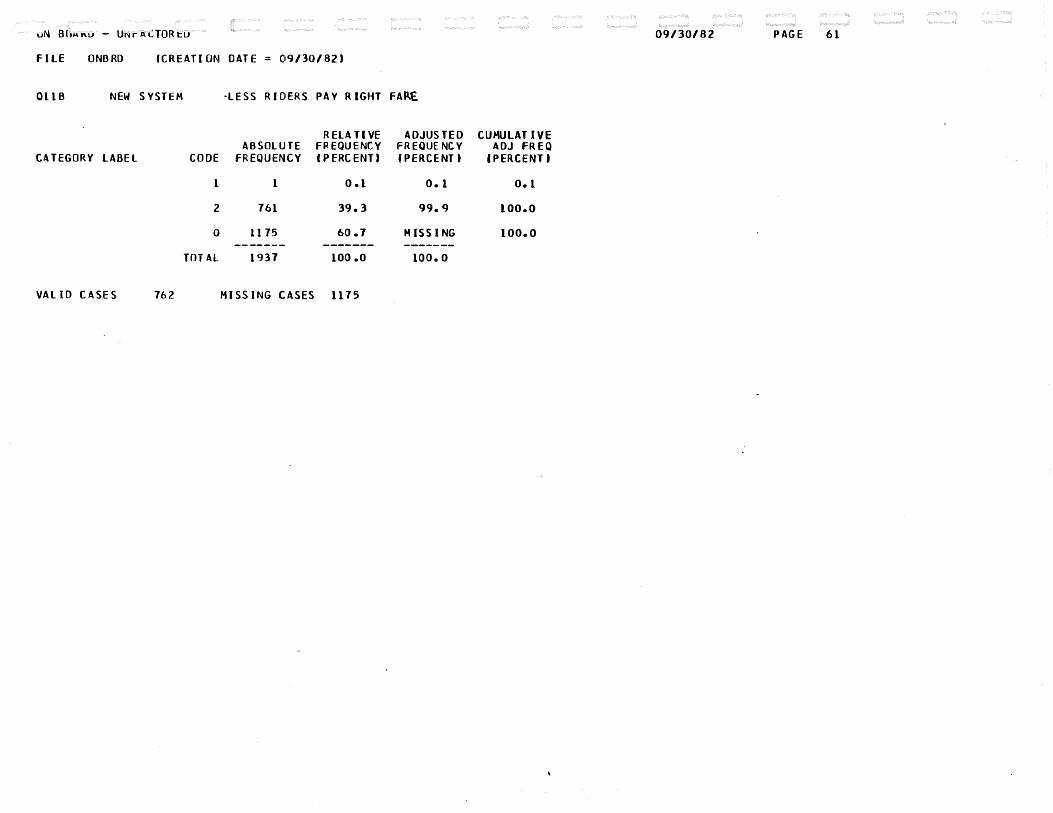
uN Bh~~u - UNrA(TORtu 09/30/82 PAGE 61
FILE ONBRO ICREATI ON DATE = 09/30/82)
0118 NEW SYSTEM ·LESS RIDERS PAY RIGHT FAll.£.
RELA Tl VE AOJUS TEO CUMULATIVE ABSOLUTE FPEQUENCY fREQUENCY AOJ FREQ
CATEGORY LABEL CODE FREQUENCY CPERCENTI (PERCENT t &PERCENT I
1 1 0.1 0.1 0.1
2 761 39.3 99.9 100.0
0 1175 60.7 HISSING 100.0 ------ ------- -------
TOTAL 1937 100.0 100.0
VALID CASES 762 MISSING CASES 1175
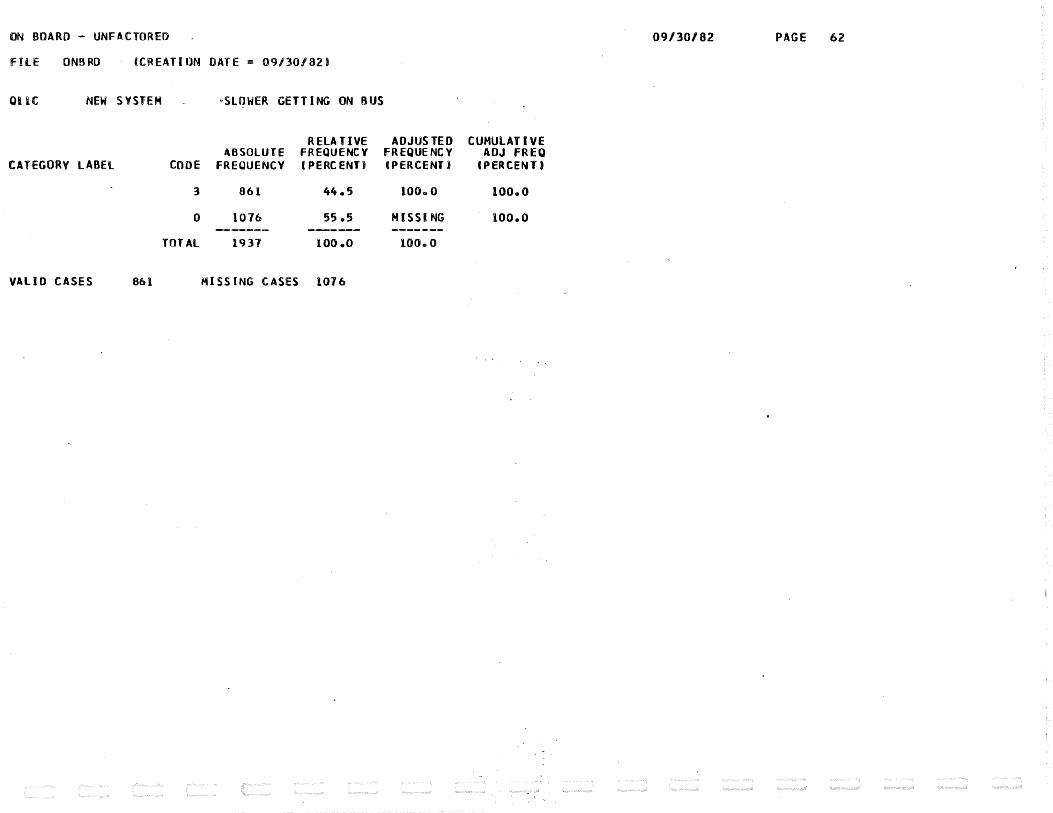
ON BOARD - UNFACTOREO 09/30/82 PAGE 62
fiLE ONBRO «CREATION DATE = 09/30/82&
QllC NEW S YSTEH ·SlOWER GETTING ON BUS
RELA TJVE AOJUS TEO CUMUlATIVE ABSOLUTE FREQUENCY FREQUENCY AOJ FREQ
CATEGORY lABEl CODE FREQUENCY (PERCENT» (PERCENT» CPERCENT)
3 861 44.5 100.0 100.0
0 1076 55.5 HISSING 100.0 ----- ----- ____ ..,_.,
TOTAl 1937 100.0 100.0
VAliD CASES 861 HISSING CASES 1076
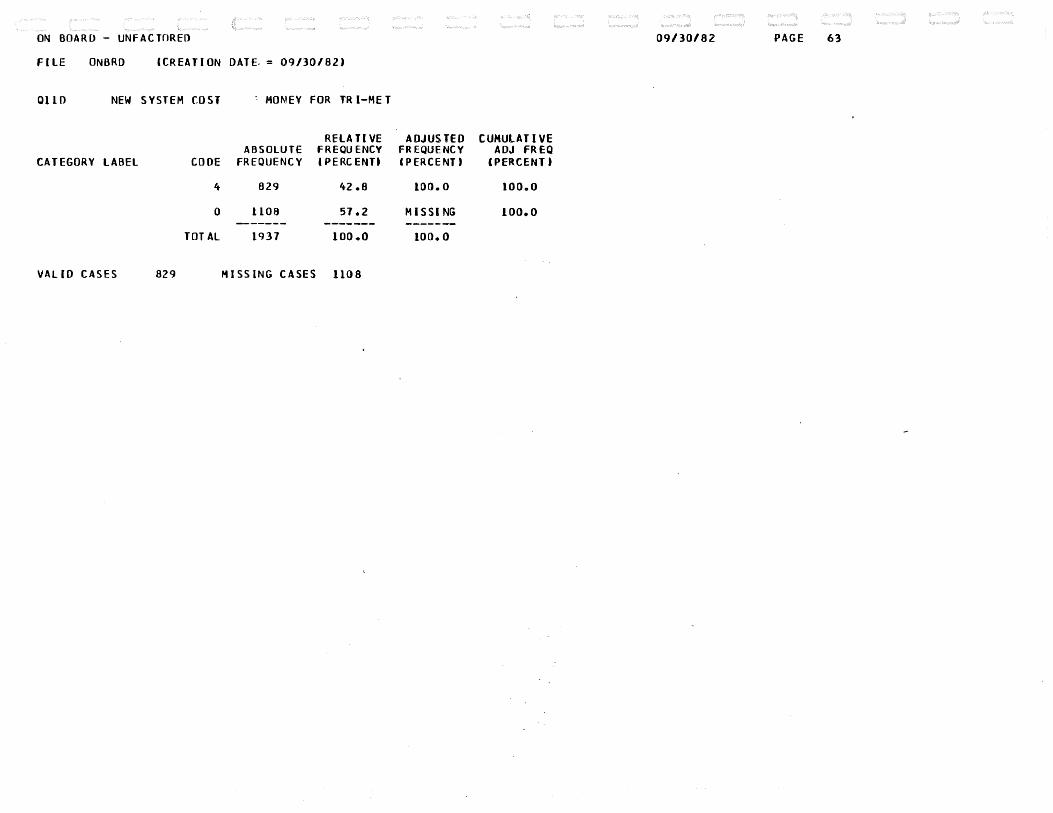
ON BOARD - UNFACTOREO 09/30/82 PAGE 63
FILE ONBRD (CREATION DATE.= 09/30/82)
0110 NEW SYSTEM COST ·. HONEY FOR TR I-HE T
RELA Tl VE AOJUS TEO CUMUlATIVE ABSOLUTE FREQUENCY FREQUENCY AOJ fREQ
CATEGORY lABEl CODE FREQUENCY C PERCENTt I PERCENT) (PERCENT t
4 829 42.8 100.0 100.0
0 1108 57.2 MISSING 100.0 ------ ------- ------
TOTAL 1937 100.0 100.0
VALID CASES 829 MISSING CASES 1108
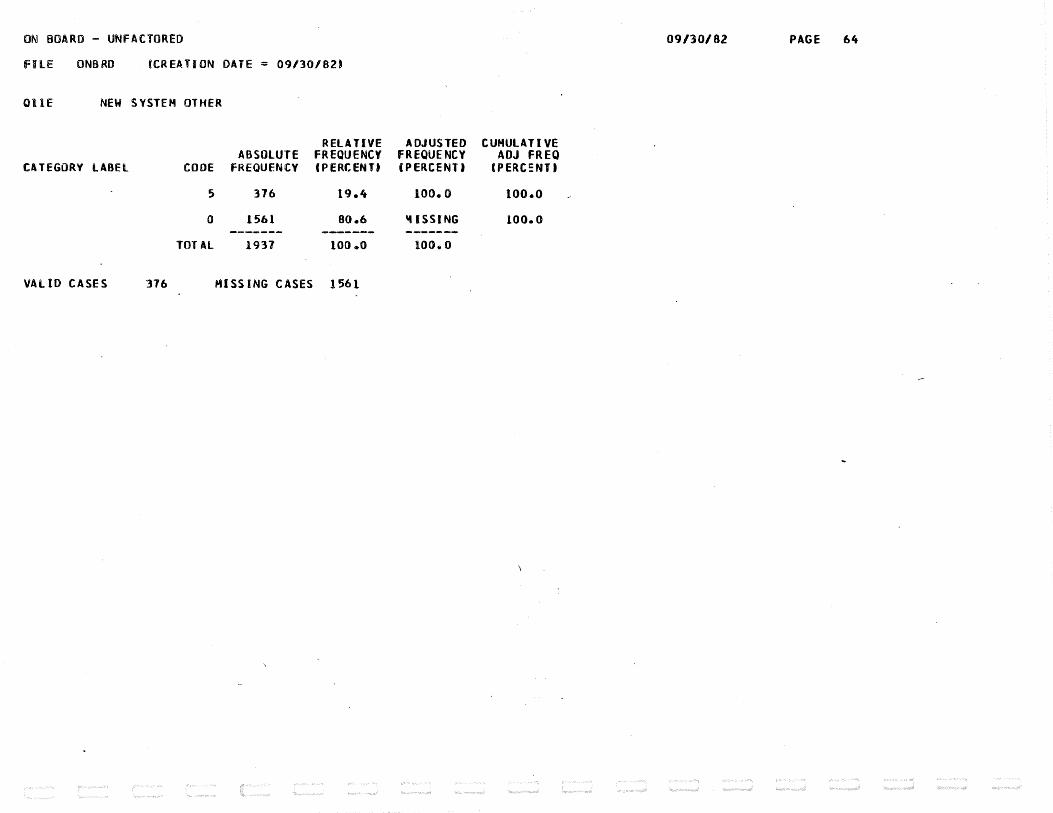
ON BOARD - UNFACTORED 09/30/82 PAGE 64
filE ONBRD (CREATION OATE = 09/30/82J
OllE NEW SYSTEM OTHER
RELATIVE ADJUSTED CUMULATIVE ABSOLUTE FREQUENCY FREQUENCY ADJ FREQ
CATEGORY lABEl CODE FREQUENCY C PERCENTJ CPERCENTJ CPERC~NTJ
5 376 19.4 100.0 100.0
0 1561 80.6 'tiSSING 100.0 ------- ------ ------
TOTAl 1937 100 .o 100.0
VALID CASES 376 MISSING CASES 1561

ON BOARD - UNF~CTOREO 09/30/82 PAGE 65
fiLE ONBRO (CREATION DATE = 09/30/82)
QllF NEW SYSTEM NOT SURE-TICKETS INC ONVENIE
RELATIVE ADJUSTED CUMULATIVE ABSOLUTE FREQUENCY FREQUENCY AOJ FREQ
CATEGORY LABEL CODE FREQUENCY I PERCENT) IPERCENTJ IPERCENT J
6 5 0.3 100.0 100.0
0 1932 99.7 MISSING 100.0 ------- ----- -------
TOTAL 1937 100.0 100.0
VALID CASES 5 MISSING CASES 1932

ON 80AkD - UNFACTOREO 10/0l/82 PAGE 5
fiLE ONBRO «CREATlOH OAT~ : 10/01/82)
* * * * * * * * * * * * * * * * * * C R 0 S S T A 8 U l A T I 0 N 0 f * * * * * * * * * * * * * * * * * * PAY BY 014 INCOME
* * * * * * * * * * * * * * * * * * * * * * * * * * * * * * * * * * * * * * * * * * * * * * * * * PAGE 1 Of l
014 COUNT I
R01J PCT lUNDER $5 $5 TO 10 $10 TO 1 15 TO S2iOVER $25 _ COl PCT IK K 5K 5K K
PAY
NO ANSWER
USE CASH
TOT PC T I 1 I 2 I 3 I It I 5 I -------J--------I--------1-------I------l------l
0 I 18 I 19 I 10 I 10 I 9 I i 27.3 I 28.8 l 15.2 J 15.2 I 13.6 I I 1.7 I 1.9 I 1.0 1 0.9 I 0.7 I I· 0. 3 I 0. 4 I o. 2 J 0.2 1 o. 2 I
.-1------1-------I ----1-------1--------1 1. I 418 1 3 8 5 I 3 5 1 I 3 7 3 I 34 3 I
I 2 2 • 4 • I 20 • 6 I 18. 8 I 19 • 9 I 18. 3 I I 39.5 I 39.0 l 34.1 J 32.4 I 28.5 I 1 7. 7 1 7. 1 I 6. 5 J 6. 9 I 6. 3 I
-I--------1-------1------I-----1-------I 2 I 62 1 69 I 8 5 I 95 I 152 t
USE TICKET I 13.4 I 14.9 i 18.4 I 20.5 I 32.8 I I 5.9 1 7.0 I 8.3 I 8.3 I 12.6 I I 1.1 I 1.3 I 1.6 I 1.8 I 2.8 I
USE PASS
-1--------I-------1----1-------I-------I 3 I 449 I 438 I 515 I 622 I 642 I
J 16.6 I 16.4 I 19.3 I 23.3 I 24.1 I I 42.~ I 44.3 I 50.1 I 54.0 l 53.3 I I 8.3 1 8.1 I 9.5 I 11.5 I 11.8 I
-1-------1--------1-----I------1-------1 4 I 110 l 11 I 6 7 J 51 I 58 I
USE MUlTIPlE I 30.3 I 21.2 I 18.5 I 14.0 I 16.0 I I 10.4 J 1.8 I 6.5 I 4.lt I 4.8 I I 2.0 I 1.4 I 1.2 I 0.9 I 1.1 I
-1------1--------l------1-------1-------1 COLUMN 1057 988 1028 1151 1204
TOTAL 19.5 18.2 16.,9 21.2 22.2
NUMBER Of MISSING OBSERVATIONS = 680
ROW TOTAl
66 1.2
1870 34.5
463 8.5
2666 49.1
363 6.7
5428 1.00. 0

ON BUAHD - UNFACTOREO 10/01/82
FILE ONBRO fCREATiuN UATE = 1u/01/82)
* * * * * * * * • * * * * * * * * • PAY CRUSSTABULATION
BY Q13 0 F * * * * * * * * * * ~ * * * * * * * AGE * * * * * * * * * * * * * * * * * * * * * * * * * * * * * * * * * * * * * * * * * * * * * * * * * PAGE 1 OF 1
013 COUt-.T I
ROW PCT lUNDER 16 16-24 25-44 45-64 OVER 64 ROW COL PCT I TOTAL
. TOT PCT I 1 ! 2 I 3 I 4 I 5 I PAY ------ 1-------1--------1---. ---1-------1-------1
0 1 4 I 3 5 I 2 6 I 11 I 5 I 81 I 4.9 I 43.2 I 32el I 13.6 I 6.2 1 1.4
NO ANSWER I 1 • 5 l 1 • 7 I 1 .. 1 I 1 • 3 I 1. 5 I I 0.1 I 0.6 I 0.4 I 0.2 I 0.1 I
-I--------l--------I--------J-------1--------1 1 I 100 I 788 I 182 I 219 I 176 I 2065
USE tASH I 4.8 1 38.2 I 37.9 I 10.6 I 8.5 l 34·8 I 38.3 1 38.3 J 32.5 I 25.0 I 51.2 I I 1.7 I 13.3 I 13.2 I 3.7 I 3.0 I
-I--------I--------I--------I--------1--------1 2 I 11 I 122 I 210 I 138 I 24 I 505
USE TICKET I 2.2 1 24.2 I 41.6 I 27.3 I 4.8 I 8.5 I 4.2 I 5.9 I 8.7 I 15.8 I 7.0 I I 0.2 I 2.1 I 3.5 I 2.3 I 0.4 I
-I--------I--------l--------l--------1--------1 3 I 123 I 960 I 1236 I 473 I 97 I 2889
USE PASS I 4.3 I 33.2 I 42.8 I l6e4 I 3.4 I 48.6 I 47.1 I 46.6 I 51.4 I 54·1 I 28.2 I I 2.1 I 16.2 I 20.8 I 8 .. 0 I 1.6 I
-I--------1--------I--------J--------1--------I 4 I 2 3 I 1 53 I 14 9 I 34 I 4 2 I . 401
USE MULTIPLE I 5.7 I 38.2 I 37.2 I 8.5 I 10.5 I 6.7 I 8.8 1 7.4 I 6.2 I 3.9 I 12.2 I I 0. 4 I 2. 6 I 2. 5 I 0.6 I o. 7 I
-1--------1--------1--------1--------1--------1 COLU.,N 261 2058 240 3 8 75 344 5941
TOTAl 4.4 34.6 40.4 14e7 5.8 100.0
NUMBER OF MISSI~G OBSERVATIONS 167

ON BOARD - UNFACTOREO 09/30/82 PAGE 67
filE ONBRO (CREATION DATE = 09/30/82)
* * * * * * * * * * * t * * * * * * C R 0 S S T A 8 U l A T I 0 N 0 F * * * * * * * * * * * * * * * * * * Q4B TICKET FARE BY 07 LOCATION OF PURCHASE OFTICKETS
* * * * * * * * * * * * * * * * * * * * * * * * * • * * * * * * * * * * * * * * * * * * * * * * * PAGE 1 Of 1
Q7 COUNT I
ROW PCT IORUG STO 7-11 STO BANK-Sl CUSTOMER WORK HAIL OTHER SCHOOL VARIOUS ROW COL PCT IRE RE .ASSISTA TOTAL TO T PC T I 1 I 2 I 3 I 4 I 5 I 6 I 7 I 8 I 9 I
048 --------I--------I--------I--------I--------I--------I--------I--------I--------1--------I
.90
.. 45
.. 25
t .. oo
OTHER
1 I 12 I 23 I 110 I 101 I 32 I 1 I 15 I 16 I 32 I I 3.5 I 6.7 I 32.2 I 29.5 I 9.4 I 0.3 I 4.4 I 4.7 I 9.4 I I 50.0 I 48.9 I 57.3 I 51.8 I 61.5 I 25.0 I 41.7 I 59.3 I 47.8 I I 1.9 I 3.6 l 17.1 I 15.7 I 5.0 I 0.2 I 2.3 I 2.5 I 5.0 I
-I--------I--------I--------I--------1--------I--------J--------I--------I--------I 2 I 2 I 9 I 6 8 I 54 I 18 I 0 I 9 I 1 I 1 5 I
I 1e1 I 4.9 I 37.4 I 29.7 I 9.9 I 0.0 I 4.9 I 3.8 I 8.2 I I 8.3 I 19.1 I 35.4 I 27.7 I 34.6 I 0.0 I 25e0 I 25.9 I 22e4 I I 0.3 I le4 I 10e6 I Belt I 2.8 I OeO I le4 I 1.1 I 2e3 I
-I--------I--------I--------I--------I--------J--------I--------1--------I--------I 3 I 9 I 10 I 5 I 13 I 0 I 1 I 4 I 4 I 13 I
I 1 5. 3 I 16. 9 I 8. 5 I 2 2 e 0 I 0. 0 I 1 • 7 I & • 8 I 6 e 8 I 22 e 0 I I 37.5 I 21·3 I 2e6 I 6.7 I 0.0 I 25.0 I 11.1 I 14.8 I 19.4 I I 1e 4 I 1e 6 I Oe 8 I 2. 0 I o. 0 I 0 e2 I 0.6 I 0 e 6 I 2. 0 I
-l--------•--------l--------1--------l--------l--~-~---l--------l--------l--------l 4 I 0 I 3 I 2 I 14 I 0 I 2 I 3 I 0 I 2 I
I 0 • 0 I 11 e 5 I 7 e 1 I 53 .. 8 I 0. 0 I 7. 7 I 11. 5 I 0. 0 I 1. 7 I I 0.0 I 6.4 I 1.0 I 7e2 I 0.0 I 50.0 I 8.3 I 0.0 I 3.0 I I 0.0 I 0.5 I Oe3 I 2.2 I o.o I 0.3 I 0.5 I 0.0 I 0.3 I
-I------I--------I-------I-------I-------I-·-----1-------I--------I-------I 5 I 0 I 0 I 2 I 1 I 0 I 0 I 0 I 0 I 0 I
I 0.0 I 0.0 I 66.7 I 33.3 I OeO I 0.0 I 0.0 I 0.0 I 0.0 I I 0.0 I 0.0 I 1.0 I 0.5 I 0.0 I 0.0 I 0.0 I 0.0 I OeO I I 0.0 I OeO 1 0.3 I 0.2 I 0.0 I OeO I 0.0 I OeO I 0.0 I
-1--------r--------l--------l--------•--------l--------l--------l--------l--------l 6 I 0 I 0 I 1 I 2 I 1 I 0 I 0 I 0 I 0 I I 0.0 I 0.0 I 25.0 I 50.0 I 25.0 I 0.0 I 0.0 I 0.0 I 0.0 I I 0.0 I 0.0 I o .. 5 I leO I 1.9 I 0.0 I 0.0 I 0.0 I OeO I I 0.0 I 0.0 I 0.2 I 0.3 I 0.2 I 0.0 I OeO I 0.0 I 0.0 I
-I--------I--------I--------I--------I--------J--------I--------I--------1--------J 7 I 1 I 2 I 4 1 10 I 1 I 0 I 5 I 0 I 5 I
HULT·. FARES I 3.6 I 7.1 I 14.3 I 35.7 I 3.6 I o.o I 17.9 I 0.0 I 17.9 I l 4.2 I 4.3 I 2.1 I 5.1 I 1.9 I 0.0 I 13.9 I OeO J 7.5 I I 0.2 I 0.3 I 0.6 I le6 I 0.2 I 0.0 I 0.8 I o.o I Oe8 I
-I--------1--------I--------I--------I--------I--------I--------I--------I--------I COLUMN 24 47 192 195 52 4 36 27 67
TOTAl 3.7 7.3 29.8 30~3 8el 0.6 5.6 4e2 10.4
NUMBER Of HISSING OBSERVATIONS = 5464
342 53e1
182 28.3
59 9.2
26 4e0
3 0.5
4 0.6
28 lt.3
644 lOOeO

ON BOARD - UNFACTORED 09/30/82 PAGE 68
FILE ONBRD (CREATION DATE = 09/l0/82t
****************** CROSSTABULATilN OF ****************** Q4C TYPE OF PASS ey Q7 LOCATION OF PU~CHASE OFTICKETS
* * * * * * * * * * * * * * * * * * * * * * * * * * * * * * * * * * * * * * * * * * * * * * * * * PAGE 1 Of 1
07 COUNT I
ROW PCT IORUG STO 7-11 STO BANK-SL CUSTOMER WORK HAll OTHER SCHOOl VARIOUS ROW COL PCT IRE RE ASSISTA TOTAL TOT PCT I l I 2 I 3 I ~ I 5 I 6 I 7 I 8 I 9 I
04C --------l--------l--------1--------l--------l--------l--------l--------l--------l--------l 1 I 63 I 134 I 368 I 527 I 113 I 19 I 63 I 87 I 87 I 1461
2 ZONE I 4.3 I 9.2 I 25.2 I 36.1 I 7.7 I 1.3 I 4.3 I 6.0 I 6.0 I 47.9 . I 46.3 I 38.4 I 49.9 I 50.3 I 55.,4 I 44.2 I 39.6 J 50.0 I 43.1 I
I 2.1 I 4.4 I 12.1 I 17.3 I 3.7 I Oe6 I 2.1 I 2.8 I 2.8 I -I--------I--------I--------I--------I--------1--------I--------I--------I--------I
2 I 10 I 96 I 31 8 I 2 64 I 71 I 9 I 40 I 50 I 61 I 919 3 ZONE I 1.1 I 10.4 I 34.6 I 28.7 1' 7.7 I 1.0 I 4.4 I 5.4 I 6.6 I 30.1
I 7.4 I 27.5 I 43.1 I 25.2 I 34.8 I 20.9 I 25.2 I 28.7 I 30.2 I I 0.3 I 3.1 I 10.4 I 8.6 I 2.3 I 0.3 I 1.3 I 1.6 I 2.0 I
-l--------l--------l--------l--------l--------l--------1--------l--------l--------l 3 I 55 I 108 I 43 I 161 I 4 I 11 I 18 I 34 I 40 I 474
YOUTH I 11.6 I 22.8 I 9.1 I 34.0 I 0.8 I 2.3 I 3.8 I 7.2 I 8.4 I 15.5 I 40.4 I 30.9 I 5.8 I 15.,4 I 2.0 I 25.6 I 1le3 I 19.5 J 19.8 I I 1. 6 I 3. 5 I 1. 4 I . 5. 3 I O. 1 I 0 .,4 I 0. 6 I 1.1 I 1. 3 I
-I--------I--------I--------I--------I--------I--------I--------I--------I--------1 4 I 5 I 1 I 6 I 77 I 0 I 3 I 6 I ,o I 1 I 107
HONORED CITIZEN I 4.7 I 6.5 I 5.6 I 72.0 I 0.0 I 2.8 I 5.6 I 0.0 I 2.8 I 3.5 I 3.7 I 2.0 I 0.8 I 7.3 I 0.0 I 7•0 I 3.8 I 0.0 I 1.5 I I 0.2 I 0.2 I 0.2 I 2.5 I o.o I 0.1 I 0.2 I 0.0 I 0.1 I
-l--------l--------1--------l--------l--------l--------l--------l--------l--------l 5 I l I 1 I 0 I 9 I 0 I 0 I 6 I 0 I 0 I 17
VANCOUVER I 5.9 I 5.9 I 0.0 I 52e9 I 0.0 I o.o I 35.3 I 0.0 I 0.0 I 0.6 I 0. 1 I 0 • l I 0. 0 I 0 .. 9 I 0. 0 I 0 .o I 3 .. 8 I 0. 0 I 0. 0 I I o.o I o.o I o.o I 0.3 I o.o I o.o I 0.2 I 0.0 I 0.0 I
-I--------I--------I--------1--------I--------J--------I--------I--------I--------I 6 I 0 I 2 I 3 I 1 I 16 I 1 I 26 I 3 I 6 I 64
OTHER I 0 .. 0 I 3.1 I 4.7 I 10.,9 I 25.0 I 1.6 I 40.6 I 4.7 I 9.4 I 2.1 I 0.0 I O.b I p.4 I 0 .. 7 I 7.8 I 2·3 I 16.4 I 1.7 I 3.0 I I 0.,0 I 0.1 I 0.1 I J.2 I 0.5 I 0.0 I 0.9 I 0.1 I 0.2 I
-I--------I--------I------I------I--------I--------I--------I--------I--------1 7 I 2 I 1 I 0 I 3 I 0 I 0 I 0 I 0 I 5 I ll
MORE THAN ONE I 18.2 I 9.1 I 0.0 I 27.3 I o.o I o.o I 0.0 I Oo.O I 45.5 I 0.4 I 1.5 I 0.3 I 0.0 I 0 .. 3 I 0.0 I 0.0 I 0.0 I 0.0 I 2.5 I I 0.1 I 0.0 I 0.0 I 0 .. 1 I 0.0 I o.o I 0 .. 0 I 0.0 I 0.2 I
-l--------1--------l--------l--------l--------l--------l--------l--------l--------l COLUMN 136 349 736 1048 204 41 159 174 202 3053
TOTAL 4.5 11.4 24.2 34.3 6.7 1.4 5.2 5.7 6.6 100.0
NUMBER Of MISSING ORSF.RVATIONS = 3055

THE INPUT FORMAT IT PROVIOES FOR
10/29/81:
ACCORDING TO YOIUt~ INPUT tOR~~li VARIARlfS ARE 10 BE REAO AS FOLLOWS
VARIA~LE fORMAT HECORU COLUtJ.NS
Q8 f 1. 0 1 24- 24 Q9 F 1. 0 1 25· 25 010A F 1. 0 1 26· 26 0108 f 1. 0 1 27- 27 QlOC F 1. 0 1 28- 28 0100 F 1. 0 1 29· 29 QlOE F 1. 0 1 30· .3o QJOF f 1. 0 1 31· 31 ClOG f 1. 0 1 32- 32 Q llA f 1. 0 1 33- 33 0118 f 1. 0 1 34- 34 QllC F 1. 0 1 35- 35 Q 110 f 1. 0 1 36- 36 QJlE f 1. 0 1 37· 37 QJlf f 1. 0 1 38- 38 QllG F 1. 0 1 39- 39 Ql2 F 1. 0 1 40- 40 QlJ F 1. 0 1 41- 41 014 f 1. 0 1 42- 42 QlS F 1. (Jl 1 43- 43 FJQJA f 3. (Jl 2 16- 18 FJCJB f 3, (Jl 2 l9· 21 FJCJC f 3, 0 2 22- 24 SEX f 1. 0 2 52- 52 AGE F 1. 0 2 53· ·53
PROVIDES FOR 44 VARIABLES~ 44 WILL BE READ 2 RECORDS (tCAROSt) PER tASE,
10 N Of CASES 11 COMPUTE 12 COMPUTE 13 CCMPUTE 14 COt.1PUTE 15 COMPUTE 16 RECOOE 17 18 19 20 21 22 23 24 If 25 If 26 IF 27 IF
UNKNOWN REG=O UR=O LR=O f:O PE'AK=O
A MAXIMUM OF 53 •COLUMNS• ARE USED ON A RECORD,
fJQJA TO FJQJC flt55t3ltl0lt37,155tl5tl7 1 18,66t34t42t43t 144t45t46,Slt63,66t20lt234t244t144=4) C2t3t6t~t9tt9t20t2lt26 THRU 29,40t4lt53 9 12t106t206tl09t 209t112ti08~208tll9t219tl26t226tl28t228tl29t229tl40t240t l20t220=i:) CJ0,38t~l,88e89~91=3) C5tl4tll4t214~33t36t54,56,57tS9t44=1) CS2,60,65,67e70 THRU 78t8Q,81,134=5) (fJQJA E~ 1 OR FJQJB EO 1 OR ~3QJC EQ 1) REG•l CFJQJA f~ 2 ~R FJQJB EO 2 OR ~JQJC Ea· 2) UR=l CFJQJA l~ 3 ·OR F'JQJB EQ 3 OR f;JQJC EQ 3) PEAK=l CFJQJA l~ 4 OR FJQJB EQ 4 OR ~JQJC EO 4) LR•l
PAGt 2

""'WI",.,lL
2f:J H
29 CCMPUTE 30 IF 31 IF 32 VAR LABELS 33 34 35 36 37 38 39 40 41 42 43 44 45 46 4., 48 49 so 51 52 53 54 VALUE LABELS 55 56 57 SA 59 60 61 62 63 64 65 66 67 68 69 70 71 72 73 74 75 76 77 ~ISSING VALUES 78 SELECT IF 79 FREOUfNCIES 80 STATISTICS
,,JQ3A ~~ 5 0~ r~QJB tY 5 Oh ~JQJC tY ~) F;t NO=O
CAGE NE ~15) NC=l (SEX NE Y}4) NO:l
10/29/8C:
QJ,~EA~S OF PAY~ENT/02tlNCLI~ATION TO USE MACHINES/ Q2A,REA5UNS FOR-AGAINST VEND1~~/02BtREASONS FOR•AGAINST VENOINGIY2CtREASONS FOR•AGAI~ST VENDING/Q20eREASONS FOR• AGAINST VE~DING/03tW~Y PASS lS~T BOUGHT/ 04tPERCEPTION OF PASS INCO~VENIENCE/QS,INCL~~ATION TO uSE MACHINE/ 06A,FACTURS TO OETERMJN~ FARESJQ6BtFACTORS TO DETERMINE FARES/Q6~tFACTORS TO OETERMI~E FARES/060,FACTORS TO DETERMJNt FARES/Q6EtFACTORS lO DETERMINE FARES/Q6Ft FACTORS 10 DETER~INE FAHES/06G,FACTORS TO DETERMINE fARES/07tPREFERED NU~AER OF 2C~ES/08 9 SUGGESTED ZONE SU~CHARbt/09tESTIMATEO CHEATERS/OlOA,REASONS FOR WRONG fARE/Q}Ob,REASCNS FOR wHONG fARE/QlOCtREASONS FOR WRONG FARE/OlOU,REASCNS FOR WHONG fARE/OlOEtRtASONS FOR WRONG fARE/QtOt,REASCNS FOR W~ONG fARE/OlOGtRFASONS FOR WRONG FARE/OllA,~O~ FARE U~OEHPAJD/GllRt~OW FARE UNDER PAID/ OtlCtHOW FARE UNDER PAIO/QllO~~OW FARE UNDER PAID/Ollft HOW fARE U~OER PAID/OJIF,HOW FARE UNDER PAlO/QllGtHOW FARE IS UNDER PAID/Ol2tPENALTY SHOULD BE/013tPENALTY FOR INTENTIO~AL ~ISPAyMENT/014tGENDER/0}5tAGE/ F303AtBUS REGIONS/F3038tBUS REGIONS/F303CtBUS REGIONS/ URtURBAN RADIAL/LRtLOCAL RADIAL/ftfEEDER/REGtREGIONAL/ PEAKtPEAK BUS/ 01 (})CAS~ (2)BUS TICKET CJ)BUS PASS/02 fl)YES (2)NO/ 03 Cl)SlLDOM RJDE (2)Dl0 NOT KNOW OF (])OUTLETS INCONVe (4)00NTK~OW CUTLETS CS)EXPENSf~E (6)0THER C7)SCHEOULE UNCER. C~)BEYO~O BUDGET (9)POCR VALUE (O)VARIOUS/ 06A TO QbG (})DISTANCE (2)TIME OF DAY (J)ABILITY TO PAY (4)AGE (~)ROUTE COST (6)TRIP TIME(7)0T~ER/ 07 (})ON~ (2)TWO (J)THREE (4)FIVE CS)SEVEN + (6)0THER (7)00NT KNOW/OB ClleOS C2)el0 (3),15 (4).20 (5)e25 (6)NO CHANGE (7)~ULTIPLE/Q9 (})NONE (2)1-2 (3)3•5 (4)6-10 (5)11•20 (6)21 UR MO~E/OlOA TO Q]OG (l)fORGOT (2)1NCORkECT C~A~GE (3)ZONE CO~FUSION (4)0l~ER CHEATING CS)ORIVEk NO ·~ELP (6)P00R S~RVICE (7)0THER (8)N0 MONEY (9)CROOK~/Ql1A TO QllG (})SHORT FARE (2)AAD TRANSFER (3)00NT PAY (4)WRONG PASS (5)BAD AGE PASS (6)SLUGS (7)FORG~ PASSIQ12 (})NONE (2)PAY FARE (3)LEAVE BUS C4) fiNED 5 (5)FINEn 20 (6)f1NED ·50 (7)0THER (8)CO~BINATION/ 014 (})MALE (2)FEMALE/Ql5 (l)t5 OR UNDER (2) 16•24 (3)25·44 (4)~5·64 (5)65 AND ~P/05 Cl)YES (2)NO (3)NO CRtDIT CARC (4)PREFER CASH (5)DISTRUST ~ACHINE (6)1NCONVE~IENT (9)NO, OTHER /f3Q3A TU F3G3C (l)REGIUNAL (2)URBAN RADIAL (3)PEAK f4)l0CAL RADIAL CS)FEEDER/ REG TO PtAK Cl)VES CO)NO/ 01 TO Q2U,G4 TO F3QJCCO) CNO EQ 0) INTEGER=Ylt02,Q3 TO Q}SCO,}O) lt6
PAGt 3

R.Aw!VAlL
WfREQUENCIES' PHOBlEM REQUIRES 1676 BYTES Of SP~CE
81 READ INP~T DATA
10/29/82
AfTER READING 3676 ~ASES FROM SUBFILE MAIL ' END OF UATA •AS ENCOUNTERED ON LOGICAL U~JT I 8
PAGt.

t1A\Iii"A1L 10/29/BC: PAGt. 5
... AIL
01 MEANS Of PA~MENT
RELAIIVE ACJUSTEO CUMlJLATIVE ABSOLUTE FREQUtt-JCY FREQUEf'.tCY AOJ FREQ
CATEGORY LABEL CODE fHEQUENCY CPERCt.NT) (PERCE"T) (PERCENT)
CASH 1 1116 .J3•2 33e4 .J3e4
BUS TICKET 2 336 10•0 lOel 4~.5
BUS PASS 3 1889 56•1 56.5 loo.o
0 24 Oe7 ~ISSING loo.o ------ ... ------- -------TOTAL 3365 too.o 100.0
MEA~ 2•231 VARIANCE o.e46
VALID CASES 3341 MISSING CASES 24

10/29/8~ PAGt. 6
filE MAil «CREATION OATE = 10/29/82)
Q2 INCLINATION lO USE ~ACHINES
RELA1IVE ADJUSTED CUMlJLATIVE ABSOLUTE FREOU~NCY FREQUE~CY AOJ FREQ
CATEGORY LABEL CODE FREQUENCY CPERCt.r-.T) (PERCEf\T) (PERCENT)
YES 733 21•8 67o3 .6"1 .J
NO ·2 356 }0•6 32.7 loo.o 0 2276 67•6 ~ISSING loo.o ______ .., ------- ...........
TOTAL ·3365 }OOoO lOOoO
MEA~ 1•327 VARIANCE Oo220
VALID CASES 1089 MISSING CASES 2276
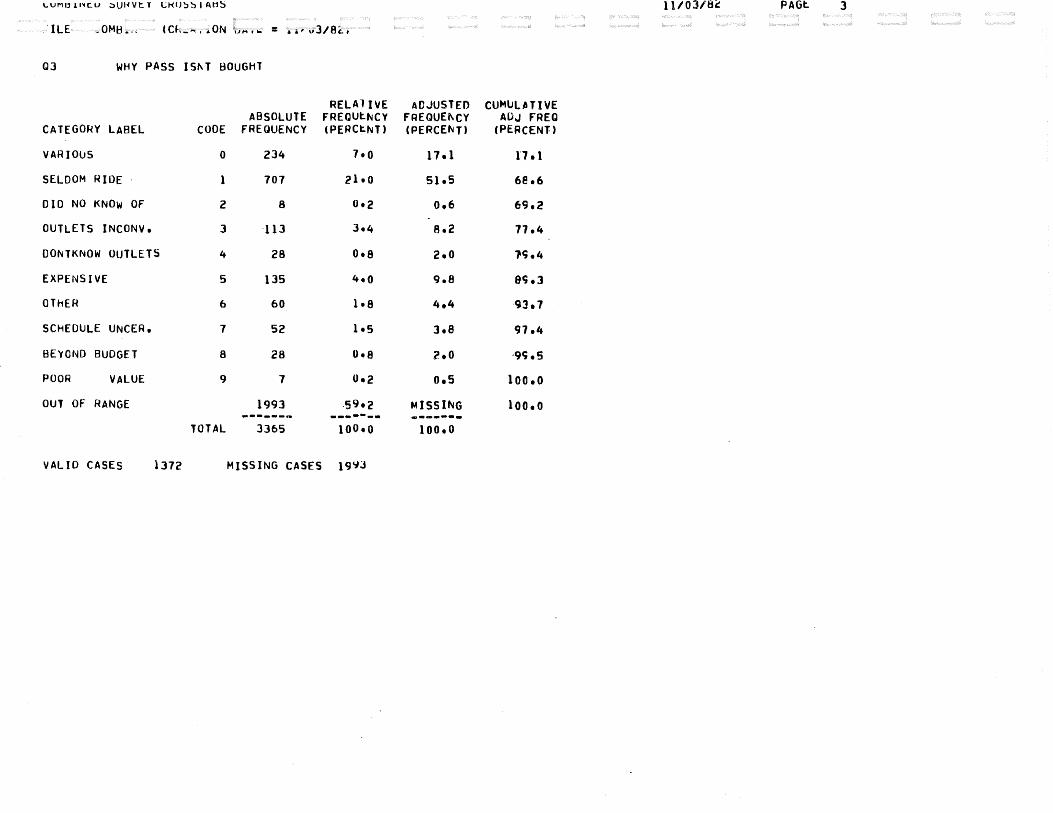
\..uMo l''~t.u :>Ut<(vt. r cr<o::,s T AtlS 11/03/8~ PAGt. 3
'ILE
Q3 WHY PASS IS~T BOUGhT
RELAliVE ADJUST EO CUMtJLt.TlVE ABSOLUTE FREQUt.NCY F'REOUEf\CY ADJ FREQ
CATEGORY LABEL CODE FREQUENCY (PERCt:.NT) (PERCENT) (PERCENT)
VARIOuS 0 234 7•0 17·1 1'7.1
SELDOM RIDE 1 707 21•0 51·5 6@,6
DID NO KNOW OF 2 8 0•2 o.6 6Q,2
OUTLETS INCONVe 3 ·113 3e4 8.2 77.4
OONTKNOW OUTLETS 4 28 o.a 2·0 ?Cj,4
EXPENSIVE 5 135 4e0 9.8 ec;.J
OThER 6 60 1•8 4.4 ·93.7
SCHEDLJLE UNCER, 7 52 1·5 3e8 97.4
BEYOND BUDGET 8 28 o.a 2e0 ·9Cj .s POOR VALUE 9 7 Oe2 o.s loo,o OUT OF RANGE 1993 ·59•2 MISSING loo.o ____ _,_ .. ------- ..-------
TOTAL 3365 100•0 too.o
VALID CASES 1372 MISSING CASES lQ'JJ

iiH\W,..Ail 10/29/82 PAGI:. 8
fiLE MAIL (CREATION DATE = 10/29/82»
Q4 PfRCEPTIO~ OF PASS lNCONVENIENC~
RELAIIVE ADJUSTED CUMtJLATIVE ABSOLUTE fREQUI:.NCY fREQUENCY AUJ fREQ
CATEGORY LABEL CODE fREQUENCY (PERCt.NT) CPERCEhT) (PERCENT)
1 19 0•6 t.o t.o
2 1698 50•5 91.6 ·92e7
3 49 1•5 2.6 ·95.3
9 87 2•6 4.7 loo.o
0 1512 ·44•9 ~ISSING loo.o ------- ------- ----~--(8 TOTAL 3365 100•0 lOOeO
MEAN 2•345 VARIANCE 2.-220
VALID CASES 1853 MISSING CASES 151~
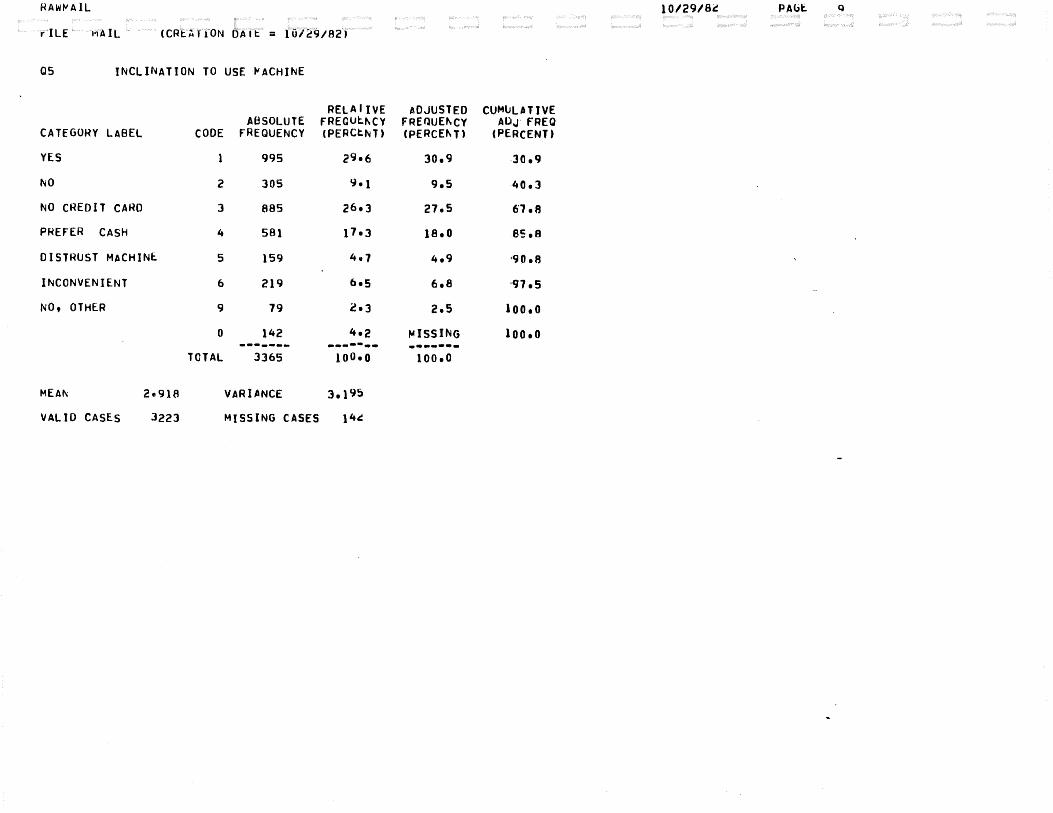
RAW~ AIL 10/29/81! PAbt:. Q
riLE MAIL (CR~~rtUN bAtt = 10/~9/82)
05 JNCLI~ATION TO USE ~ACHJNE
RELA liVE ADJUSTED CUMlJLt.TIVE ABSOLUTE FREQUt:.~CV FREQUEf\CY ADJ· fREQ
CATEGORY LABEL CODE FREQUENCY (PERCt.NT) CPERCEt-.T) (PERCENT)
YES 995 29•6 30.9 .J0,9
NO 2 305 9·1 9.5 40.3
NO CREDIT CARD 3 885 26•3 27.5 6'7 .a PREFER CASH 4 581 17•3 18.0 es.a DISTRUST MACHINE. 5 159 4e7 4t9 ·90,8
INCONVENIENT 6 219 6t5 6.8 ·97.5
NO, OTHER 9 79 2·3 2.5 loo.o
0 142 4e2 ~ISS lNG loo.o --- .. --.. -----... -------TOTAL 3365 lOOeO 1oo.o
MEAt\ 2e91A VARIANCE 3,}95
VALID CASES 3223 MISSING CASES 14~
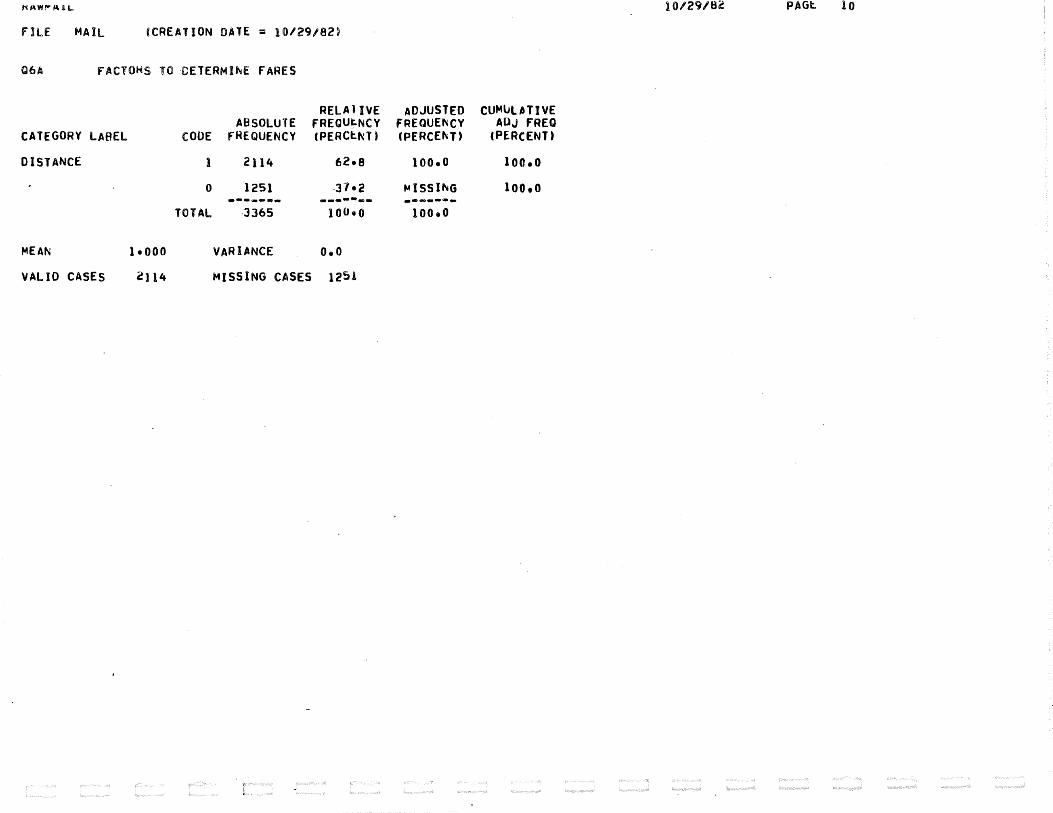
10/29/8~ PAGt. !O
FilE MAIL (CREATION DATE = 10129/82»
Q6A FACTOHS TO £ETERMI~E fARES
RELAliVE ADJUSTED CUMlilfiTIVE ABSOLUTE FREQUt::,NCY FREQUEt-.CY AUJ F'REQ
CATEGORY LABEL CODE FREQUENCY CPERCt.NT) (PERCEf\T) (PERCENT)
DISTANCE 1 2114 62•8 too.o loo.o
0 1251 .J7•2 t-tiSSI~G loo.o ---~--- -----eD- -------
T-OTAL .JJ65 100•0 lOOeO
MEAN 1•000 VARIANCE o.o VALID CASES c)l4 MISSING CASES 1251

HAWf'IA1L 10/29/82 PAGf:. 11
. ILE .. AIL
068 fACTOHS TO CETERMI~f FARES
RELAI I\JE ADJUSTED CUMliL!ATIVE ABSOLUTE FREQUt.~CY FREQUEt\CY AUJ FREQ
CATEGORY LABEL CODE FREQUENCY CPERCt.t\T) (PERCEt\T) (PERCENT)
TIME Of DAY 2 925 27•5 100.0 loo.o
0 2440 72·5 ~ISS lNG loo.o .. ------ ------- -------TOTAL 3365 }00•0 100.0
MEAt\ 2·000 VARIANCE o.o
VAL 10 CASES 925 MISSING CASES 2440

RAW~A!l 10/29/8~ PAGE. 12
fiLE MAIL (CREATION DATE = 10/29/82)
Q6C FACTOHS TO CETERMI~E FARES
RELA1IVE ADJUST EO CUMlJL/ITIVE ABSOLUTE FREQUt.NCY FREQUEt-.CY AOJ FREQ
CATEGORY LABEL CODE FREQUENCY (PERtt.r-. T) CPERCEt\T) (PERCENT)
ABILITY TO PAY 3 955 28•4 lOOoO loo.o
0 2410 71•6 MISSING loo.o ------.. -----.. - ------.. T·OTAL 3365 lOOoO lOOoO
MEAN JoOOO VARIANCE o.o
VALlO CASES 955 MISSING CASES 241U

RAW~ All 10/29/8~ PAul:. 13 r
, ILE .. AIL CCRL:<i.tON CHo~•a:. = \nn:•U821
Q60 FACTOHS TO OETI::RMINE FARES
RELAli\IE aDJUSTED CUMlJL~TIVE ABSOLUTE FREQUtNCY FREQUEt-.cy AOJ FREQ
.CATEGO~Y LABEL CODE FREQUENCY CPERCtt-.JT) CPERCEt\T) (PERCENT)
AGE 4 2037 60•5 100.0 loo.o
0 1328 39•5 MISSit-.G loo.o _ .... _ .. __ ------.. -------TOTAL .JJ65 lOOeO 100.0
MEAN 4•000 VARIANCE o.o
VALID CASES 2037 MISSING CASES }.32~
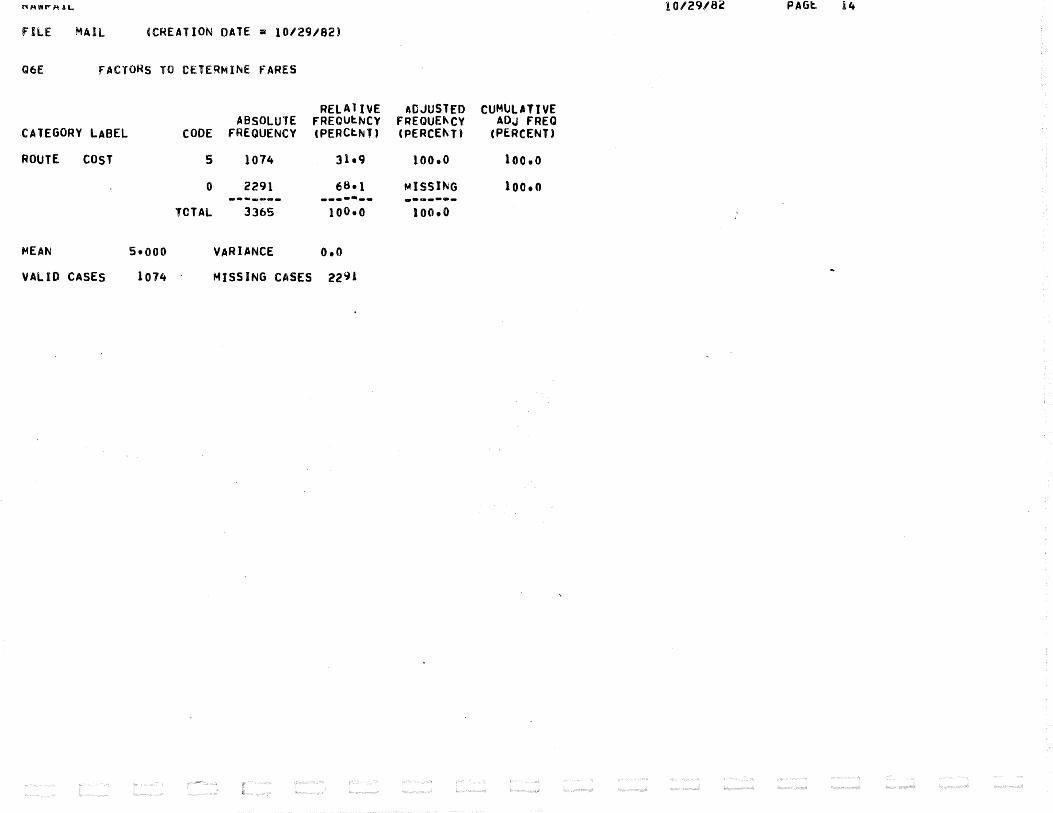
10/29/82 PAGt:. i4
FilE MAIL (CREATION OATE = 10129/82)
Q6E fACTORS TO CElERMI~E fARES
RELAliVE ADJUSTED CUMULATIVE ABSOLUTE FREQUt.NCY fREQUE~CY ADJ FREQ
.CATEGORY LABEL CODE FREQUENCY CPERCt.NT) (PERCE~T) (PERCENT)
ROUTE COST 5 1074 31·9 too.o 1oo.o
0 2291 68•1 MISSING 1oo.o ------- ------- -------TOTAl 3365 100•0 too.o
MEAN 5•000 VARIANCE o.n VALID CASES 1074 MISSING CASES 2291

10/29/Si! PAGt. 15
IAIL (Ct. JON
Q6F FACTOHS TO CETERMINE fARES
RELAIIVE ADJUST EO CUMlJL~TIVE ABSOLUTE FREQUt.NCY FREQUEf'.ICV AU.J FREQ
CATEGORY LABEL CODE FREQUENCY (PERCt.f\JT) (PERCEl\T) (PERCENT)
TRIP TIME 6 487 14•5 lOOeO loo.o 0 2878 es.s MISSING loo.o ------- ------- --------
TOTAL 3365 100•0 lOOeO
MEAl\ 6•000 VARIANCE o.o
VALID CASES 487 MISSING CASES 287b

10/29/82 PAGt. 16
FilE MAIL (CREATION DATE = 10129/82)
Q6G fACTOHS TO CETERMI~E FARES
RELAliVE ADJUSTED CUMliLATIVE ABSOLUTE FREQUt:.~CY FREQUE~CY AllJ fREQ
CATEGORY LABEL CODE FREQUENCY CPERCt.NT) (PERCE~T) (PERCENT)
OTHER 7 139 4•1 too.o loo.o
0 3226 ·95•9 t-tiSSI~G loo.o· .. ------ -.------ __ 'Ia ____
TOTAL 3365 100•0 100.0
MEAN 1•000 VARIANCE o.o VALID CASES 139 MISSING CASES 3226

n~wrr~''- 10/29/~~ PAGt. 17 r-
. ILE .AIL (Ch ....... , ~ON L~·- = ivn:.1/8L;
01 PREFEHEO NUt-'t:JER Of ZONES
RELAliVE ACJUSTEO CUMlJL~TIVE ABSOLUTE FREQUt.NCY FREQUEt\CY AOJ FREQ
CATEGORY L~BEL CODE FREQUENCY rPERCt.~T) (PERCEt\T) (PERCENT)
ONE 339 10•1 lOelt 10.4
TWO 2 690 20•5 21.2 .3t.s
THREE 3 1070 31•8 32.8 64.3
FIVE 4 866 25•7 26.5 90.9
SEVEN + 5 252 7e5 7.7 •9S.6
OTHER 6 7 0·2 0.2 •9e.e
OONT KNOW 7 38 1·1 1.2 loo.o
0 103 3e1 MISSit-JG 1oo.o -·------ ------- -------TOTAL 3365 100•0 100.0
MEAt\ 3·054 VARIANCE 1elt0~
VALlO CASES 3262 MISSING CASES )OJ

RAwtJAll 10/29/82 PAGE 18
FILE MAIL (CREATION DATE = 10/2~/82)
QB SUGGESTED ZONE SURCHARGE
RELA liVE ADJUSTED CUMllL~TtVE ABSOLUTE FREQUt.NCY FREQUENCY AOJ FREQ
CATEGORY LABEL CODE FHEQUENCY CPERCt.~T) (PERCEf\T) CPf.RCENT)
.os 1 359 10•7 l1e4 lle4
.to 2 742 22•1 23.6 35 ·1
.15 3 413 12•3 13.2 4e.2
.20 4 407 12•1 13.0 ·E 1e2
.25 5 382 11•4 12.2 l:!e4
NO CHANGE 6 806 24•0 25.7 ·9c; ·1
MULTIPLE 1 29 o.~ o.~ loo.o 0 227 6e7 MISSING loo.o ______ ,.. -----.. - ... ------
TOTAL .JJ65 100•0 100.0
MEAt\ 3·715 VARIANCE 3.25~
VALID CASES 3138 MISSING CASES 221

tcAWI"AlL 10/29/82 PAGl:. 19
ILE 1AIL
J9 ESTIMATED C~EATERS
RELAIIVE ACJUSTEO CUMULATIVE ABSOLUTE FREQUt.t-.iCY FREOUE~CY AOJ FREQ
·:ATE GORY LABEL CODE Ft1EQUENCY (PERCt.~T) (PERCEf\T) (Pl:.RCENT)
IWNE 217 6·4 6.8 ·E .a
·.-2 2 601 17•9 18e9 2-5.7
1-5 3 954 28•4 29.9 5Se6
i-1 0 4 813 24•2 25.5 81·1
1.1-20 5 352 10•5 1le0 92.2
~1 OR MORE 6 250 7•4 7e8 loo.o
0 178 5·3 MISSING loo.o ------- ------- -------TOTAL .J365 100•0 Joo.o
t-'EAN 3•387 VARIANCE J.7l!l
VALID CASES 3187 MISSING CASES }7b
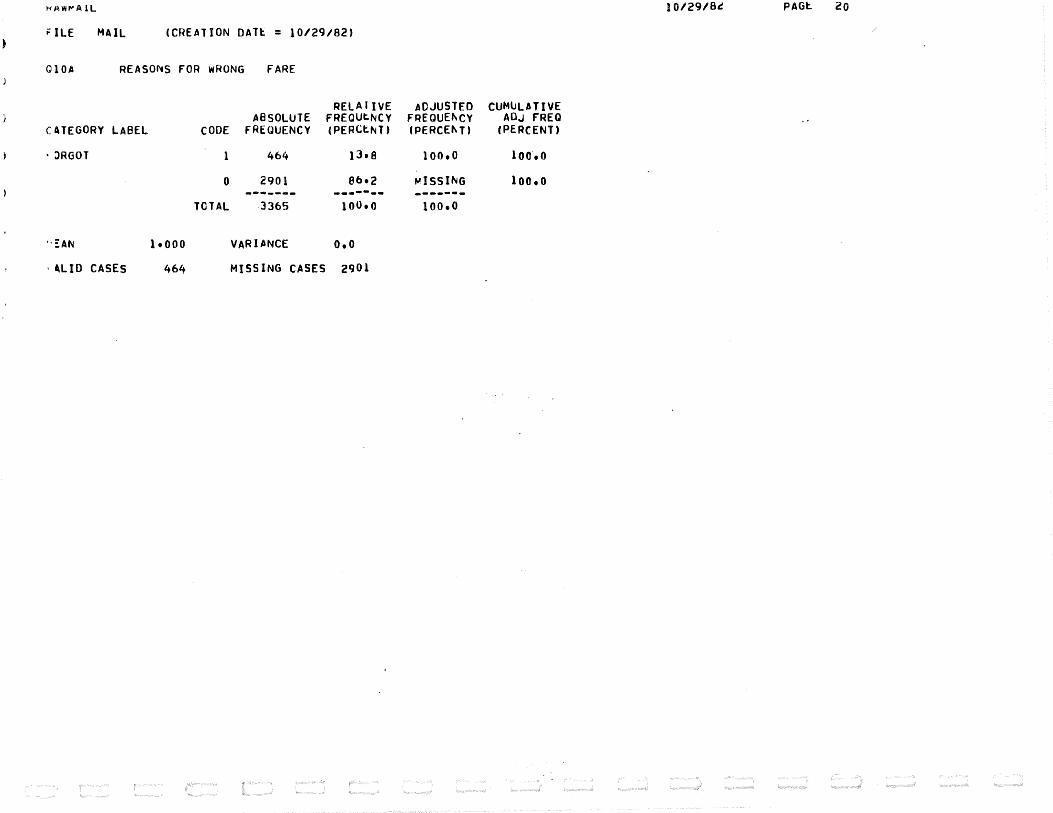
HAWI"'AlL 10/29/8~ PAGt. 20
MAIL (CREATION OATt = 10/29182)
OlOA REASONS FOR WRONG FARE
RELA fiVE ADJUSTED CUMULATIVE ABSOLUTE FREQUt.NCY FREQUEt-.CY AOJ F'REQ
CATEGORY LABEL CODE FREQUENCY CPERCt:NT) CPERCEt-.T) (PERCENT)
• JRGOT 464 13•8 too.o loo.o
0 2901 86•2 MISSING loo.o ______ .. _ ------- -------TOTAL 3365 100•0 100.0
··::AN leOOO VARIANCE o.o
·'LID CASES 464 MISSING CASES 2901

.... ".~.,., 4\- 10/29/82 PAul:. 21
Ill >1AIL
.. 108 REASONS fOR WRONG fARE
RELAII\IE ACJUSTED CUMlJLATIVE ABSOLUTE fREQUt.NCY FREQUE~CY AUJ FREQ
1. ~ TEGORY LABEL CODE fHEQUENCY (PERCt.NT) (PERCEtq) (PERCENT)
J~CORRECT CHANG~ 2 2040 60•6 100e0 loo.o
0 1325 39•4 MISSING loo.o ------- ------- -------TOTAL 3365 100•0 1oo.o
, ~At-. 2•000 VARIANCE o.o
' ~L 10 CASES 2040 MISSING CASES }.325

10/29/84:: PAGt.. 22
· ILE MAIL (CREATION DATE = 10/29/82)
lOC REASONS FOR WHONG fARE
RELAli\IE ADJUST EO CUMlJL~TIVE A~ SOLUTE FREQUt:.f\JCY FREOUEt\CY AUJ FREQ
,. ATE GORY LABEL CODE FREQUENCY CPERCt:.NT) CPERCEt\T) (PERCENT)
/Ot-.lE CONFUSION 3 1068 31•7 100.0 loo.o
0 2297 68•3 ~ISSING 1oo.o -----.. - ------- -------TOTAL 3365 100•0 100.0
EAN 3·000 VARIANCE o.o
ALID CASES 1068 MISSING CASES 2291
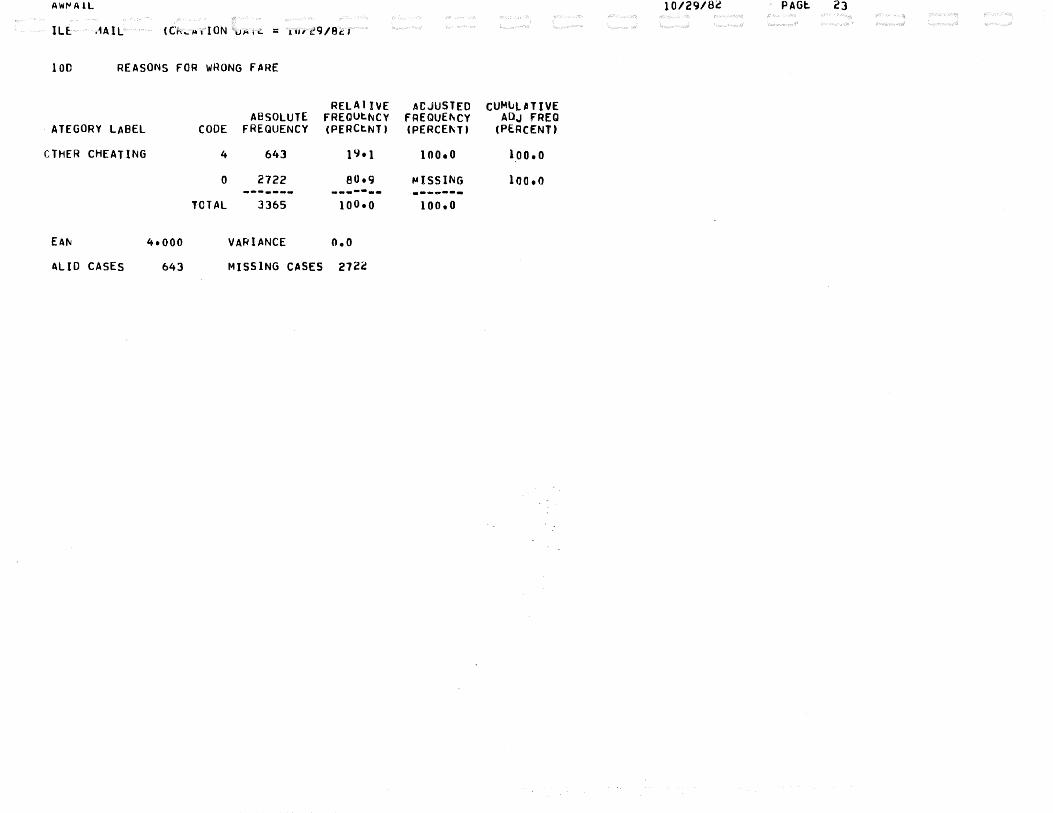
AW,...All 10/29/Bi: , PAGt 23
ILE. .1All
100 REASONS FOR WRONG F~RE
RELA l 1\JE ACJUSTEO CUMLL,TIVE AESOLUTE FREQUt.~CY FREQUE"CY AOJ fREQ
· ATEGORY LABEL CODE FREQUENCY CPERCt.NT) CPERCE"T) (PERCENT)
CTHER CHEATING 4 643 1~•1 1oo.o loo.o
0 2722 B0e9 ~ISSI~G 1oo.o __ .. ____ -.. ----- -------TOTAL 3365 100•0 too.o
EA~ 4•000 VARIANCE o.o
ALID CASES 643 MISSING CASES 2122
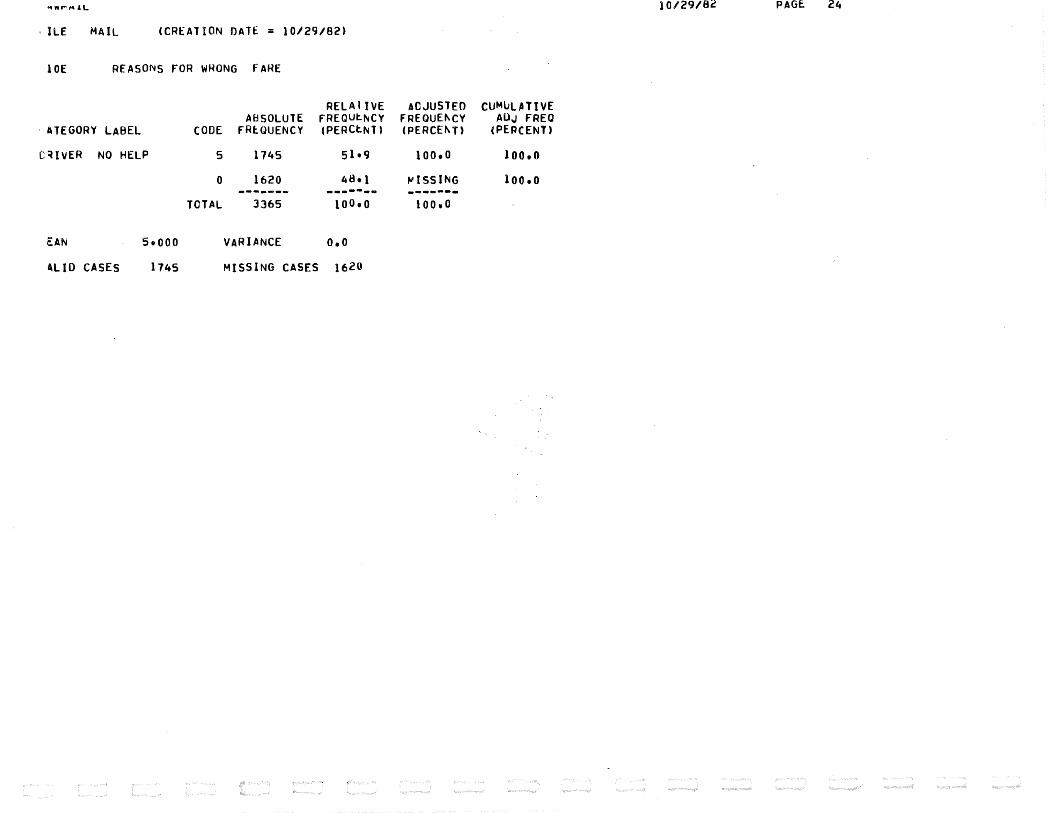
10/29/82 PAGE. 24
· llE MAIL (CREATION OATE = 10/29/82)
lOE REASONS FOR WRONG fARE
RELA I IVE ACJUSTEO CUMlJL~TIVE ABSOLUTE FREOUt.~~tCY FREOUEt-.CY AOJ FREQ
· ATEGORY LABEL CODE fREQUENCY (PERCtNT» (PERCEt-.T) (PERCENT)
C~IVER NO HELP 5 1745 51•9 100.0 Ioo.o
0 1620 48•1 tJISSING loo.o ______ .. ------- -------TOTAL 3365 100•0 1oo.o
~AN 5•000 VARIANCE o.o
ALID CASES 1745 MISSING CASES 1620

10/29/82 PAGt. 25
IL MAIL
lOf REASONS fOR WRONG f~RE
RELATIVE A·DJUSTED CUMlJL~TIVE ~8SOLUTE fREQlJt:.NCY FRfQUEt\CY AOJ FREQ
· ATEGORY LABEL CODE FREQUENCY CPERCt:.t-.T) (PERCEt\T) (PERCENT)
FOOR SERVICE 6 612 18•2 too.o loo.o
0 2753 81•8 MISSING loo.o --- ... --- ------· -------TOTAL 3365 100•0 lOOeO
fAN 6•000 VARIANCE o.o
ALID CASES 612 MISSING CASES 27SJ

10/29/8i: PAGt. 26
ILE MAll (CREATION DATE = 10/29/82)
lOG REASONS FOR WRONG fARE
RELAIIVE ADJUSTED CUMlJL~TtVE .ABSOLUTE FREQUt.NCY FREOUEf\CY AOJ fREQ
:ATE GORY LABEL CODE fREQUENCY CPERCt.NT) CPERCEt\T) (Pf.RCENTJ
lTHER 7 81 ~·4 19·3 l•Cj. 3
NO MONEY 8 178 5eJ 42.4 61.7
CROOKS 9 161 4·8 38.3 1oo.o
0 2945 B7•5 ~ISSING loo.o ------- ------- -------TOTAL .JJ65 100•0 lOOeO
MEAN 8el90 VARIANCE 0,541
VALID CASES 420 MISSING CASES 2945

10/29/8c PAGE. 27
FILL "1AIL CC. _ .... ION ....... ,.:.= av•.!<J/A ... ,
QllA HOW fARE UNCERPAID
RELA I IVE ACJUSTED CUMULATIVE At3SOLUTE FREOUtNCV FREQUEI\CY ADJ fREQ
CATEGORY LABEL CODE fREQUENCY (PERCtt-Jl) CPERCEI\T) (PERCENT)
SHORT fARE 2471 73•4 100e0 loo.o
0 894 26•6 tJISSING 1oo.o ------- ------- -------TOTAL 3365 100•0 lOOeO
MEAN 1•000 VARIANCE o.o
VALID CASES 2471 MISSING CASES 894

HAWI'-'A!L 10/29/82 PAGt. 28
FILE MAIL (CREATION DATE = 10/29/82)
0118 HOW FARE uNDER PAID
RELA1IVE ACJUSTEO CUMlJL~TIVE ABSOLUTE FREQUt.~CY fREQUEt\CY ADJ FREQ
CATEGORY LABEL CODE fkEQUENCY (PERCt.NT) (PERCE~T) (PERCENT)
BAD TRANSfER 2 1475 43•8 100.0 loo.o
0 1890 56•2 ~ISSI~G loo.o ------.. ------- _ .. _____ TOTAL 3365 100•0 100.0
MEAN 2•000 VARIANCE o.o VALID CASES 1475 MISSING CASES 1890

HAWI'w'All 10/29/82 PAGE.
FILl:. MAIL (L~~AfiO~ UAIE = 10129/82)
QllC HOW FARE UNDER PAID
RELAIIVE ADJUSTED CUMlJL~TIVE A~SOLUTE f'REQUt.NCY FREOUEt-.CY AOJ FREQ
CATEGORY LABEL CODE FREQUENCY CPERCt.~T) CPERCEt-.T) (PERCENT)
DONT PAY 3 587 17•4 too.o loo.o
0 2778 B2•6 ~ISSI~G loo.o ------- ------- ,_ ______ TOTAL 3365 100•0 100.0
MEAt-. 3•000 VARIANCE o.o
VALID CASES 587 MISSING CASES 2778

RAwtJAIL 10/29/82 PAGt. 30
FILE MAIL CCREATION DATE = 10/29/82)
QllD HOW FARE UNCER PAID
RELAIIVE ADJUSTED CUMuL,TIVE ABSOLUTE FREQUt.NCY FREQUEt\CV AOJ fREQ
CATEGORY LABEL CODE FREQUENCY (PERCt.NT) (PERCE~T) (PERCENT»
\IIROt\G PASS 4 996 29•6 100.0 loo.o
0 2369 70•4 ~ISSI~G loo.o ---........ --~---- -------TOTAL 3365 100•0 IOOeO
MEAN 4e000 VARIANCE o.o
VALID CASES 996 MISSING CASES 236'J

t<AWI'>'A1L 10/29/!:i~ PAGl:. 31
FILL
Qllf HOW fARE uNCER PAID
RELA I IVE ADJUST EO CUMULATIVE AfjSOLUTE fREQUtNCY fREOUEt\CY AOJ fREQ
CATEGORY LABEL CODE FREQUENCY CPERCt~T) (PfRCEt\T) (PERCENT)
BAD AGE PASS 5 502 14•9 100.0 loo.o 0 2863 85•1 ~ISSING loo.o _ .. ___ _._ ------- c-.------
TOTAL .JJ65 100•0 1oo.o
MEAN s.ooo VARIANCE o.o
VALID CASES 502 MISSING CASES 286J

t1AWI"'AlL 10/29/82 PAGt.
FILE MAIL (CREATION DAlE = 10/29/82)
Qllf HOW fARE UNCER PAID
RELA1IvE ADJUSTED CUMlJLt.TIVE ABSOLUTE FRECUtNCY FREQUEl\CY ADJ fREQ
CATEGORY LABEL CODE FREQUENCY CPERCt.NT) CPERCEt..T) (PERCENT)
SLUGS 6 374 11•1 1oo.o loo.o
0 2991 88•9 t-4ISSING Ioo.o ------- ------- .. -.. ----TOTAL 3365 lOU eO 1oo.o
MEAN 6t000 VARIANCE o.o
VALID CASES 374 MISSING CASES 2991

10/29/B~ PAGt. 33
71Ll 1A IL
QllG HOW FARE IS UNDER PAID
RELAIIVE ACJUSTEO CUMlJL~TIVE ABSOLUTE FREQUt.NCY FREQUEt\CY AO·J FREQ
CATEGORY LABEL CODE F~E.QUENCY CPERCt.~T) (PERCEt\T) (PERCENT)
FORGE PASS 1 650 19•3 lOOeO loo.o
0 2715 80•7 MISSit-4G loo.o ..... _ ... __ ------- -------TOTAL 3365 100•0 100.0
MEAt-. 1·000 VARIANCE 0.0
VALID CASES 650 MISSING CASES 271~

iKAWI"AlL 10/29/H~ PAut. 34
FILE MAIL (CREATION DATE = 10/29/82)
012 PENALTY ShOuLD BE
RELATIVE A·CJUSTEO CUMlJL~TIVE ABSOLUTE FREQUt.~CY FREQUEt-.CY AOJ FREQ
CATEGORY LAAEL CODE FREQUENCY CPERCI:.NT) CPERCE"T) (PERCENT)
NONE 394 11•7 11·9 11.9
PAY FARE 2 2374 70•5 71.5 83.3
LEAVE BUS 3 120 3•6 3.6 8f.9
FINED 5 4 39 1•2 1·2 ae.1
FINED 20 5 27 0•8 o.a ae.9
FI~EO 50 6 16 0·5 o.5 ec;.4
OTHER 7 17 0•5 0.5 ac;.9
CO~BINATION 8 335 10•0 l0e1 loo.o 0 43 leJ ~ISSit-.G loo.o ------- ------.. -------TOTAL 3365 100•0 too.o
MEA" 2•615 VARIANCE 3,733
VALID CASES 3322 MISSING CASES 43

tHH'II" A 1L 10/29/62 PAut 35
fiLl ,>1AIL ((, __ ,..,ION ·~~.i = av,i9/8~,
QlJ PENALTY fOR INTENTIONAL MISPAY~ENT
RELAliVE aOJUSTEO CUMULATIVE ABSOLUTE FREQUtNCY FREQUE~CY AUJ FREQ
CATEGORY LABEL CODE FREQUENCY CPERCt~T) CPERCE~TJ (PERCENT)
53 1•6 le6 1.6
2 670 19•9 20.3 '2le9
3 855 25•4 25.9 47.8
4 402 11•9 12e2 99.9
5 412 12•2 12.5 72.4
6 264 7•8 a.o 80,4
7 85 2·5 2.6 .a~.o
8 562 16•7 17·0 loo.o 0 62 1·8 MISSI~G loo.o -------- --·---- __ .. ____
TOTAL .JJ65 100•0 too.o
MEAt-. 4•330 VARIANCE 4.50b
VALID CASES 3303 MISSING CASES 6i!

RAWtJAll 10/29/82 PAGt. 36
FILE MAIL (CREATION DATE = 10/29/82)
Ql4 GENOEH
RELAIIVE ACJUSTEO CUMULATIVE A~ SOLUTE FREQUt.NCY FREQUEt\CY ADJ f'REQ
CATEGORY LABEL CODE ff1EQUENCY (PERCt.~T) CPERCE~T) CPf.RCENT)
~ALE 1 1347 It 0. 0 40.1 tto.t
FE~ ALE 2 2012 59•8 59e'il loo.o
0 6 Oe2 t>4ISSING too.o --·---- ------- --------TOTAL 3365 100·0 100.0
foiEA" 1·599 VARIANCE 0.240
VALID CASES 3359 MISSING CASES f:l
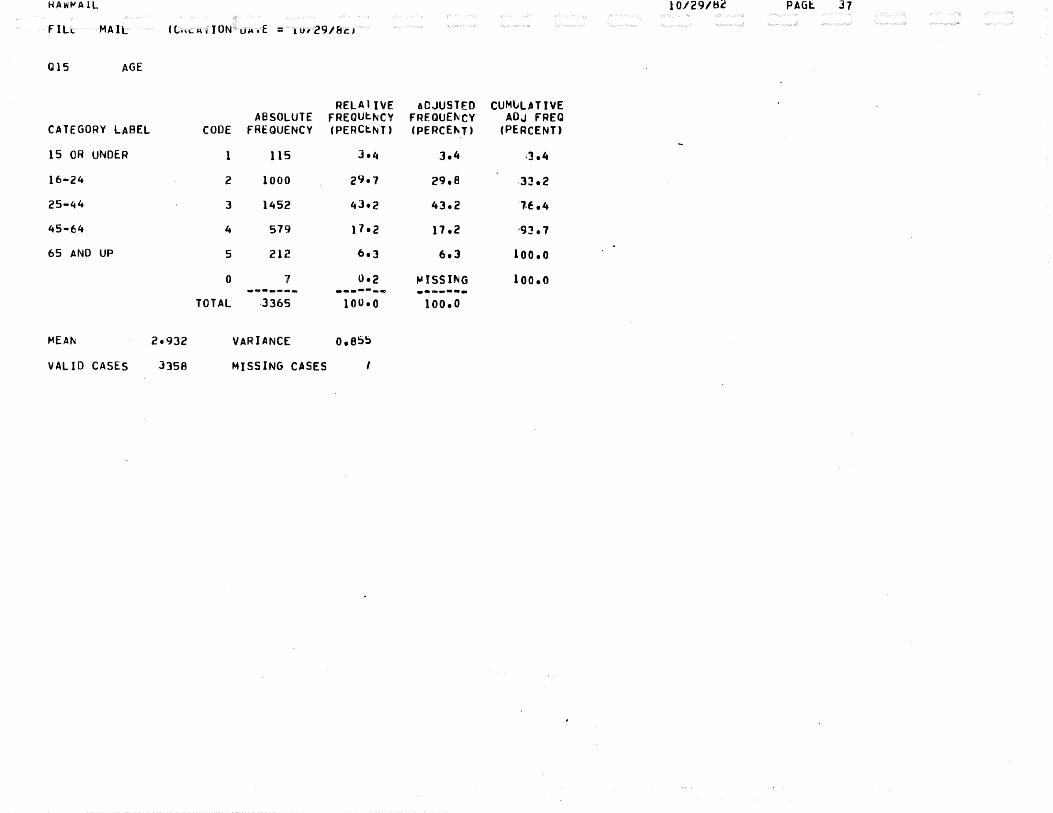
HAWiVAlL 10/29/8~ PAGt 37
fiLL MAIL
015 AGE
RELAliVE ADJUSTED CU~lJL~TtVE ABSOLUTE FREOUt.~CY fREOUE~CY AOJ FREQ
CATEGORY LABEL CODE FREQUENCY (PERCtNT) (PERCE"T) (PERCENT)
15 OR UNDER 1 115 3•4 J,4 ;J,4
16-24 2 1000 2'h7 29.e .J3.2
25-44 3 1452 43•2 43.2 ·1.E ,4
45-64 4 579 17•2 17e2 ·93. 7
65 AND UP 5 212 6e3 6.3 loo.o
0 1 0•2 t-'ISSING 1oo.o --------- ------410 --------TOTAL ·3365 100·0 1oo.o
MEAt-. 2•932 VARIANCE o.es~
VALID CASES 3)58 MISSING CASES
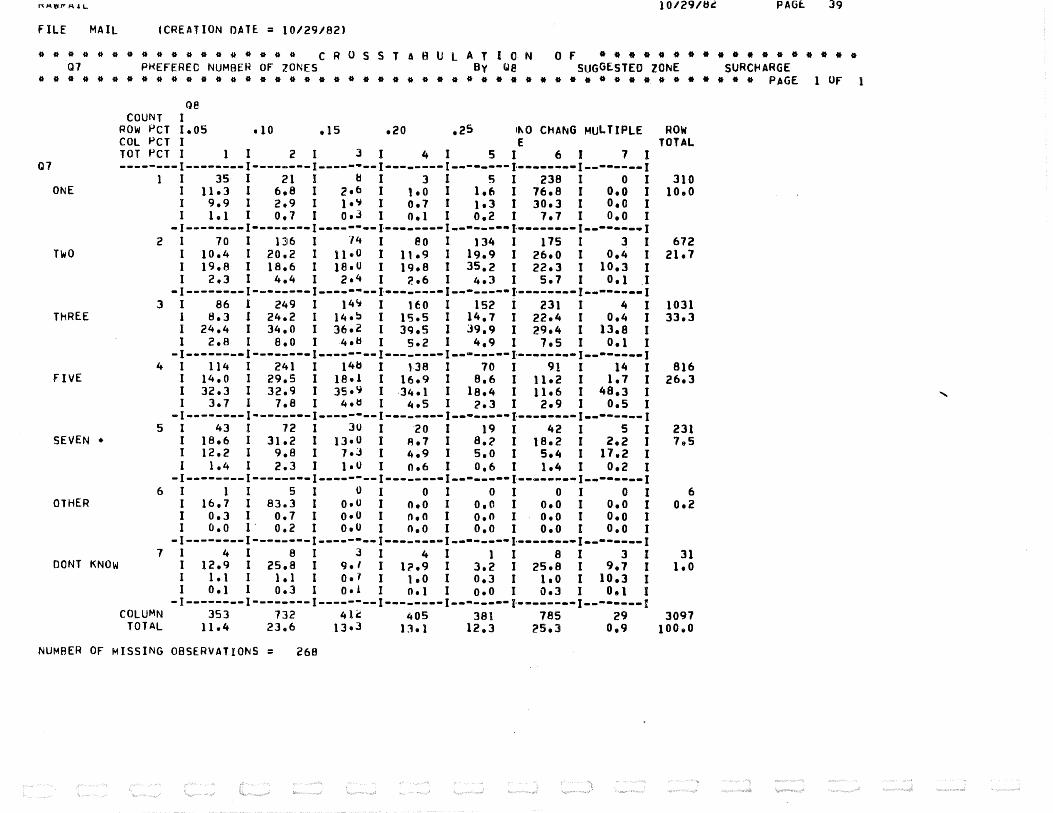
('(Jo\\'lfi"'~I.L 1 0/29/fU PAGt. 39
fiLE MAIL (CREATION OATE. = 10129/82)
.. .. .. .. .. .. .. .. .. .. .. .. .. it .. .. .. .. c R 0 s s T A 8 u L A T I 0 N 0 f .. • • * • • • • • • • • • • • • • • Q1 P~EFEREC NUMBEH OF ZONES By ue SUGGESTED lO~E SURC~ARGE
• .. .. .. .. .. .. .. .. .. .. .. .. .. .. .. .. .. .. • .. .. • .. .. • .. .. .. .. . • • * * * • • * • • • • * * • * * * PAGE 1 OF
ae COUNT I
ROW PCT I.o5 elO ,15 .20 ,25 ~0 C~A~G MULTIPLE ROW COL PCT I E TOTAL TOT PCT I 2 3 I 4 I 5 I 6 I 7 I
Q1 ------~~I~-~-~---I·----~--I-~---·--I-~------1-------·J·------·I---~----I 35 21 I ~ I 3 I 5 I 238 I 0 I 310 ONE 11.3 6,8 I 2e6 I leO I 1.6 I 76.8 I o.o I 10.0
9,9 2.9 I 1•~ I o.1 I le3 I 30e3 I o.o I 1.1 o.1 I OeJ I Oel I 0,2 I 1e1 I o.o I
·I--------I--------I-----·--I--·----·I--·----·f··------1--------I 2 I 70 I 136 I "74 I eo I 134 I 175 I 3 I 672
TwO I 10.4 I 20.2 I 11•0 I 11a9 I 19.9 I 26a0 I 0.4 I 21.7 I 19,8 I 18.6 I 18•0 I 19.8 I 35,2 I 22.3 I 10.3 I I 2.3 I 4.4 I 2•4 I 2e6 I 4e3 I 5.7 I 0,1 I
-I--------1--------I--------r--------r--------r--------r--------I 3 86 I 249 I 14'i I 1f0 I 152 i 231 I 4 I 1031
T~REE 8,3 l 24.2 I J4a!l I p;. 5 I 14,7 I 22·4 I Oe4 I 33e3 24.4 I 34.0 I 36e2 I Jq.s I 39,9 I 29e4 I 13.8 I 2.8 I 8,o I 4ets I s.2 I 4,9 I 7e5 I Oe1 I
-I--------l·----~--I----~---I---~----J--·---··I-·------·I--·----·1 4 114 I 241 I 14b I 138 I 70 I 91 I 14 I 816 fiVE 14,0 l 29,5 I 18•1 I l6e9 I 8,6 I lle2 I 1e7 I 26e3
32.3 I 32.9 I 35•11 I -34·1 I 18,4 I 11·6 I 48,3 I 3.7 I 7.8 I 4•~ I 4t5 I 2·3 I 2e9 I 0.5 I
-I--------I·-------I-------·1··------I--·----·I--------I-------·I 5 I 43 I 72 I 30 I 20 I 19 I 42 I 5 I 231
SEVEN • I 18.6 I 31.2 I 13•0 I Ae7 I 8,2 I l8e2 I 2.2 I 7.5 I 12.2 I 9,8 I 7·3 I 4.9 I 5,0 I 5e4 I 17e2 I I 1, 4 I 2.3 I }eO I o.6 I 0,6 I lt4 I 0.2 I
-I--------I------·-I------·-1···-----I-··---··l--~----·I--·----·I 6 I 1 I 5 I 0 I 0 I 0 I 0 I 0 I 6 OTHER I 16,7 I 83.3 I o.o I o.o I o.o I o.o I o.o I Oe2
I o.3 I 0.7 I 0•0 I n,o I o.n I o.o I o.o I I o,o 1 . 0,2 I o.o I OeO I o.o I OeO I o.o I
-I--------I-~------I-----···I·~------I--·----·l·-------I--------1 1 4 I 8 I 3 I 4 I 1 I 8 I 3 I 31 OONT KNOW 12,9 I 25,8 I 9tl I 1?.9 I 3,2 I 25e8 I 9,7 I 1e0
1. 1 I 1.1 I o.1 I leO I o,3 I leO I 10,3 I 0,} I o.3 I 0·1 I o.t I o.o I o.J I Oe1 I
-1--------I--------I--------I--------I--------f-------·I-------·I COLUMN 353 732 41~ 405 381 785 29 3097
TOTAL 11.4 23,6 13•3 l:lel 12,3 25.3 0,9 100,0
NUMBER OF MISSING OBSERVATIONS = 268
H1CCGCf>f>tG 555!:!3!1555555 00000000 55 555 5555 55 5 TTl TTTTTT TTl MM ,..,., "~OOt"n"' y GGGf"" .. ~GGC"' "'555,..-r--555"" no or - JOO ~55 555 rrn. . ~TT . MH , "OOOC!vuL'•' JT l'Y v • " ' ~ ?
GG t\] :>5 uo 00 55 TT ~Mt"~ ~"~"'"' r.o (10 YY yy GG 55 00 00 55 TT HH fo'H fiM ,_.,., (1(' 00 yy YY CG 55 00 00 ~5 TT MH HP'~M ~H f.(' 00 yy yy GG 555'555555 00 00 55~55!:555 TT ~M HH ,.,,., fl(l ro l'YYY GC cn;r.c 5555555555 00 00 555~~5!:555 TT P.,H P1f1 (1(' 00 yy cc CCtGG 55 00 00 55 TT MH P1M 00 ()0 Yl' CG GC 55 00 00 55 TT MH "'" ('0 (l0 yy CG GC 55 00 00 55 TT fi,H ... ,., ()(' (10 yy GGf.GGGff.GCGG 555'555!'55555 0000000000 ~5 55555555 55 TT MH ,..,.. coooooooco yy
CCCCGfCf,GG 555555~5555 00000000 5555~555555 TT JAM ,..,., 00000000 yy
ccccccr.ccc 5555~5!55555 00000000 5~55~5555555 TTl TTTTTTTTT MH HH 0000000(\ uu tl! GGGGGGfCGGGG 5555!i5~55555 0000000000 55555!'555555 TTTTTTTTTTTT t'HM t'MH rooooooooo uu tU GC tr. 55 00 00 155 TT fAHfo'M Ht'MH or. (l0 uu l'U CG 55 00 00 55 TT MM f4H ~H MM co 00 lfU l!U GG 55 00 00 55 TT f'H HHHH r.H Of.' 00 uu tU GC 555555555 00 00 55!5~·5555 TT HM HH ~M 00 ()0 uu l'U GG (;(;((;(; 5555555555 00 00 ~555~55555 TT fo'H t'H ()O 00 lltf uu CG tGGGG 55 00 00 55 TT HH MH 00 00 uu l'lJ GG Ct 55 00 00 55 TT fotH ..... ('0 00 uu ltJ cc GG 55 00 00 55 TT "'"'
,.,,., 00 ()0 Ul' ltJ ccr.ccr.rccccc 5'>5555555555 0000000000 ~55'555555555 TT HH ,..., ('000000000 UltU Ul!UUUUUl'U
GCGtGf.CCGG 55555555555 Ol'OOOOOO 55555555555 TT MH MH 00000000 l!U UUll l !tlliU l'
AAAAAAAAA1. ll PPPPPPPPPPP t-!H HH AAAAAAAAAA AAAAAAI>AAAiiA LL PPPPPPPPPPPP ~H HH AAAAAAAAAAAA AA I. A ll pp PP HH HH lA AA AA /.A Ll pp PP HH HH AA AA AA AA ll pp pp HH HH AA AA AAAAAAAAAAAA ll PPPPPPPPPPPP HHHHHHHHHHHH AAAA,.I-AAAAAA AAAAAAA/.ftAA/. ll PPPPPPPPPPP t'HHHHHHHHHHH AAAAAAAAAAAA AJ /.A ll PP HH HH AA IIA AA AA ll PP ~H HH AA AA AA AA ll pp HH HH AA AA All lA llllllllllll pp HH HH AA AA AA AA llllllllllll pp HH HH AA AA
~AAA/.J.A~At. 00000000 55555~'555555 444 COOOOCOf' 7222222222 777777777777 AAAAAAAAAA/./. OOOOCC'OOOO 555555555555 4444 OCOOOOOOf'C 222222222222 77777777777 AA AA 00 00 5') 44 44 (10 00 22 22 77 77 AA ,.,,., 00 00 55 44 ~4 00 00 22 11 AA AA 00 00 55 44 44 00 00 22 77 AAAA/.A/./.1-AAA 00 00 55555~555 4 44 ~444444 4 00 co 22 11 AAAAAAAI-AAAA 00 00 5555555555 ,, 4 4 , 4 4 4 4 , 4 4 ()0 00 22 11 AA AA 00 00 1)5 44 00 00 22 11 AA AA 00 00 5~ 44 00 00 22 77 AA ,., 00 00 55 ... 00 00 ?.2 77 AA AA 000('('(10000 51)~55551)5555 44 0000000000 2'22272222222 11 AA AA 00000000 55555!)1Jij 1)55 44 00000000 2222222?7222 77
11ASP- I I - COMNET STAPT JO~ ~ 6.38.14 AM 30 SfP P2 p(l~ 11(\54 PfHNTrf?J ((!J'fJET - HASP-II
C. RIDER ON-BOARD/MAILBACK COMPUTER PRINTOUTS
c.l


ORIV£R SURVEY RE~PPNSES 09/29/Pl f'ACF
l!CCOPOJNG T[l YOUP INPUT FORMAT, VARJ,PLES ARE TO P.E PEAO AS FOllPUS
VAPJA~lf FORMAT RfCORO COLUMNS
~7t> F t. 0 1 26- 2f. C27 F I • 0 J 27- 21 02A F I • 0 1 ze- 2B OZQ F I • 0 J 29- 29 Q3() F 1. 0 1 30- ~0 031 F 1. 0 1 3I- 31 Q32 F 1. 0 J 32- 32 033 F I. 0 1 33- 33 03~ F 1. 0 J 34- 3~ 035 F 1. 0 J 35- 3~ 03f. F J. 0 1 3f- 3f. 037 F 1. 0 J 37- 37 t'3P F 1. 0 1 38- 3f. 039 F 1. 0 1 39- 39 t'ltO F 1. 0 1 40- 4(1 041 F I. 0 J 41- ~I 042 F I. 0 J 42- 42 043 F 1. 0 1 ~3- 43 Clt~ F 1. 0 ] ~4- 44 0"5 F 1. 0 1 ~5- 4~ t'46 F J. 0 J 46- 46 047 F 1. 0 1 47- 47 Oltfl F 1. 0 1 46- ~p
049 F I. 0 1 49- 49 050 F 1. 0 1 50- ~()
O'il F 1. 0 I 51- ~~ 052 F 1. 0 ) 52- 52 053 F I. 0 ) 53- 53 054 F 1. 0 1 54- 54 055 F 1. 0 1 . 55- !'5 ('56 F l. 0 1 56- ~l>
057 F I. 0 ) 57- !7 05B F 1. 0 ) 58- 5P 05(} F 1. 0 ) 59- ~9 060 F 1. 0 1 60- 60 061 F 1. 0 1 61- (:,)
062 F 1. 0 1 62- f2 Of>3 F 1. 0 1 63- 63 0~4 F t. 0 1 64- f,lt
065 F 1. 0 1 65- f5 066 F 1. 0 1 66- t:f.

.HE HIPUT FOP~~ T T PR(lVJOFS F£1R
ACCnFOING Tl1 YOUR INPUT fORMAT, V'RllfLES 'Rf TO f£ PEAO AS FOLLOWS
V~RJJIBLE FPRMAT RECORO COLUt-ftJS
Cf.7 F t. 0 1 67- 67 ()f,fl F 1. 0 1 68- ff Cf.9 F t. 0 1 69- (,f)
C70 F I. 0 1 70- 7() C71 F J. 0 1 71- 71 012 F J. 0 1 12- 12 073 F 1. 0 1 73- 73 074 -F 1. 0 1 74- 74 Q75 F 1. 0 1 75- 7!1 C7t: F 1. 0 1 1~- 7t 077 F 1. 0 1 77- 77 07P F 1. 0 1 78- 7P C79 F 1. 0 1 79- 79
PPOVJOFS FOF! 76 VAPIAPL£S. 7f WILl Pf FEA.O J RffOPOS t•CAROS'J PFR CASE. A HAXI,..UM OF 79 'CPLUHNS' ARE USED ON A FffOPO.
1 N OF CASFS e VAR LABELS 9
10 1 1 12 13 Itt 15 16 17 JP ]9 20 2) £2 23 24 25 76 21 29 79 30 31 32 33 34 35 36
UNKNl1WN C~0~2300 05,PERCFNT FARf EVASIPN/06,HOW UFTFN IS THfRf NO PAYMf~T 000~2400 101, ~OW OFTEN IS THE PASE FARF INSUFFICIENT/ oorr2~00 Ofl, HOW OFTFN IS T~frF NP THRFE 70NF CASH FARE/ ~OOC2600 09,HOW £1FTFN APE TH£Pf SlUGS, HAlf PILl~/ 000('2700 OlO,HO~ OFTFN ARE T~FPE FORGED PASSES/ 00002800 OJJ,HOW OFT£~ ARE T~FR£ ~ISUSEO YOUTH,SE~IOR,P15SfS/ OOOr2900 017,~0~ rFTFN ARF THFPF WRONGlY USFP TWO lONF PASSES/ OOOP3000 013, HOW OFTEN ARf Tt-IFFF MJSUSFO TPA~·'SFERS/ 000('3100 C14,YOU CONFRONT PASSFNtERS FOR NO P~YHFNT AT ALL/ OCOf3700 015,YOU CONFRONT RICERS FOR INSUFFJ(JfNT AASF FAPE/ ~OCP3300 OJ6,YOU CONFRONT PIVFFS FOP NO THRFF ZONF (ASH FARE/ OOOC3~00 C17,YO~ CONFRONT PIPfPS FOR SlUCS, H~LF BILLS/ OOOC3~00 Cl~tYOU CONFRONT PIPrPS FOP FOPf.EO P~SSFS/ OCOC3600 QJ9,YOU CONFRONT FIOFPS FOR MJSUSfO YOUTH,SENiOR PASSfS/ r0003700 C20,YOU CONFRONT PIPFFS FOR WRONGlY USFO TWO lONE PASS/ OOOC3POO 021 ,YOU CONFRONT PIOEFS FOR BAO TFAN5FFRS/ OO~C3900 ~22,WRONG FARES ARE F~JO BECAUSE PF 70Nf SYSTE~ CONFUSJONOOOt4COO /023,WR£1NG FARFS HAPPF~ ~ECAU5E PTHfF ARE SFFN CPEATJNG/ OOOf4JOO 024,WRONG FARES HAPPE~ PECAUSE PPfRATOR CANT VO ANYTHING 00~04700 /fJ25 ,WfH1tiG FARFS t-tAf'Pf~ WHFN THFY Ofl~'T UNOfR STAt;P WHEN OOOC4300 TO PAY/026,WRONG FAPFS HAPPEN eFC~USF THE FARES ~RE TOO COC0~400 HIGH/027,WRONG FARES PAPPEN FOR OTHEP PFASrNS/ ~0004~00 O?P,HIGH SCHOOL AGES PISUSF THE SYSTFM/Q29,HIGH SCHOOL 000f.4~00 TP 25 MISUSE T~f SYSTfM/C30,25 TO 40 YFARS MISUSE THE OOOr4700 SYSTFM/031,4] TO 6~ ~ISUSF THF SYSTfH/032, OVER 65 OOOC4POO MISUSE THE SYSTEM/033,PUSH HOUR PJDFFS HJSUSE T~f SY~Tf~ OOCC4900 /C34,~IOOAY PIPFRS ,..ISUSE THE SYSTF~/ 035 1 fVENI~G RIOEFS CCOC5000 MISUSE THF SYSTFM/C~~.£~RLY A~-LAT£ PH P.JOFPS MISUSE 00005100 THf SYSTfM/037,WfEKF~P RIVERS MJSUSf THF SYSTEM/ 000~~200
PAtf
•
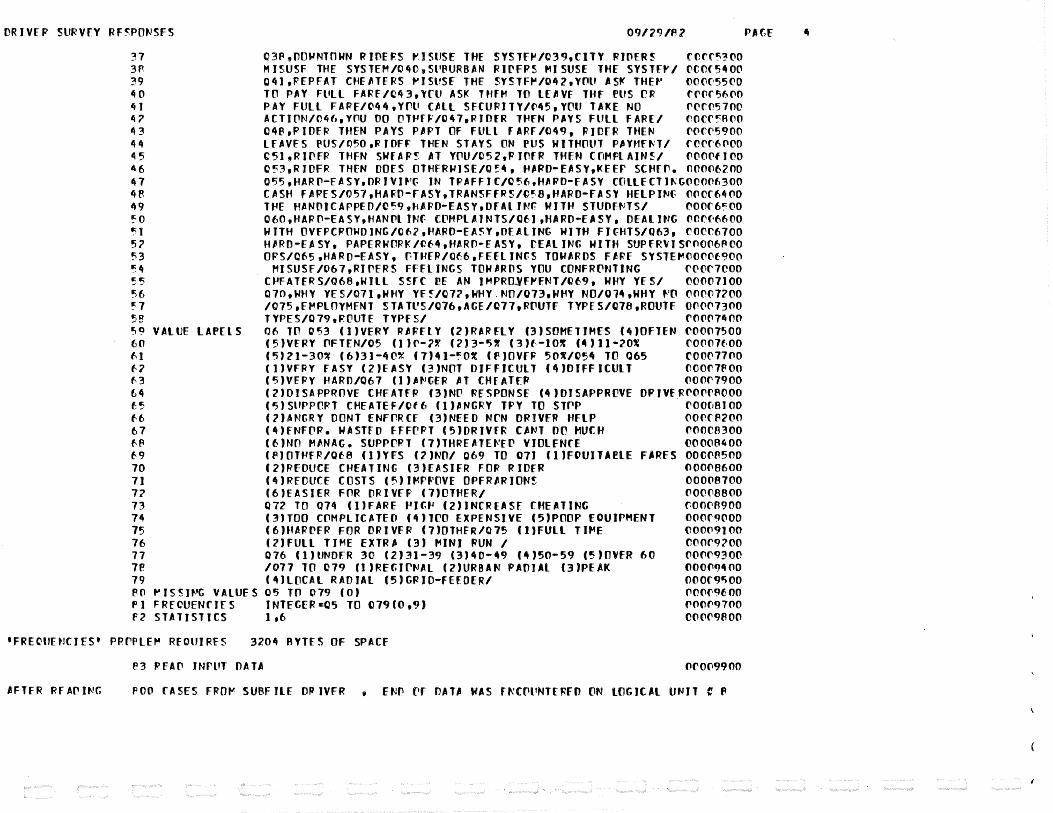
DRJVfF SURVFY ~f~PONSFS
37 3P 39 ~0
"l 47 43 44 ~5 46 lt1 4P. 49 !=0 '.']
57 !\3 ~It ~5 ~6 ~7 ~8 !J~ VALUE lAP£lS (,0
f,J f2 f3 f..4 f;~
f6 67 ~-~
f9 70 71 72 73 74 7'5 76 11 1e 79 PO ~JSSJVC VALUES Pl FRfCUENCifS f2 STATISTICS
09/2CJ/P?
Q3P,OO~NTOWN RJDEFS ~JSt~E THE SYSTF~/039,CITY RJDER5 CCff!\300 MJSUSF THE SYSTEM/CitD,Sl~URBAN RlrFPS MISUSE THE SYSTft/ ~CCC5400 C4J ,PEPFAT CHEATERS ~ISl'Sf THE SYSTF..-/042,YOU ASf( THE~· OCOC·55t'O TO PAY Hill FARF/C43,lTU ASI< THFM TO LEAVF THf PliS CR fC'f1f56PO PAY FULL FAPE/~44,YrU C~ll SECURJTY/~45,YPU TAKE NO C'~fP5700 ACTIPN/0~6,YOU 00 OT~FF/C47,RIOER T~EN PAYS FUll FAR£/ COCC''.'RPO Q4S,PIOfP THEN PAYS PIPT Of FUll FARF/C49, FIOFR THEN C'f1fC'5900 lfAVfS PUS/050,RJOFF THEN STAYS ON PUS WITHOUT PAYMf~T/ rcrr6~00 C5l,Ril'FR THFN SWfAF~ AT YOU/C52,PJOfR THFN CrtHf'l.AIN5/ ('IOOPflC'O C~3,RIOFR THEN OOES OTHFR~JSE/0~4, ~'RO-EASY,KEEP SCHFP. 00006200 055,HARl'-EASY,ORJVH'~ IN TPAFFIC/C~6.HAPO-FASY ((ILLECTJ~G(l0006300 CASH FAPES/057,HA~O-FASY,TPANSFFRS/C~8,HARO-FASY HELPINf OOCC6400 T~E HANOICAPPEO/C~9,~APO-EASY,OFAlJN~ WITH STUOF~TS/ roor6~00 C60,HAPP-EASY,HANPL JNf CPMPLAJNTS/06J,HARO-EASY, OEALJNG onrr6600 WITH OVFPCFOWOJNG/C62,HARO-EA~Y,OEALING WITH FJ~HTS/063, COCC6700 HJP.O-EASY, PAPERWORK/~f4,HAR0-FASY, rEALINt WITH SUPFRVJSr0006~VO OPS/C~5,HARO-EASY, fiT~fP/Qf6,FffltNfS TOWARDS F~Pf SYSTE~UOU0f900
MISUSF/C67,RJPERS FFELINGS TOW~RDS YOU CONFRPNTING C'OVf7COO C~FATFRS/06B,WILL S5FC eE AN IMPRuYF~FNT/~f9, WHY YFS/ 00007100 C70,WHY YES/07t,WHY Yf~/Q72 1 WHY.N0/073,WHY NO/Ol4,WHY ~0 OOOU7200 /075,f~PLOYMFNT STATVS/076,AGE/077,PPUTF TYPES/078,ROUTF 00007300 TYPES/C79,ROUTF TYPES/ f0007400 0~ TO 053 (l)VERY R'~flY (2)RARflY (3JSOMETJMES f4JOFTEN 00007500 {5)VfRY OFTEN/05 (l)O-;~ (2)3-5~ (3)~-JO~ (~Jll-20~ f0007~00 (5)21-30~ (6)31-40~ (7)41-50% ffJOVFF 50~/054 TO Q65 C0007700 flJVFRY EASY (2JfASY (3JNOT OJFFICULT (4JOIFFICULT COOr7POO (5)VfFY HAR0/067 (JJ,~tfR AT CHFATER OOOC'7900 (2)0JSAPPROVE CHFATfP (3)NO PfSPONSf (4JOJSAPPROVE OPJVEPOOOO~OOO (5)St1PPOPT CHEATEF/Ct6 (l)~NGRY TPY TO STI"'P C'00(J8l00 (2)ANGRY OONT ENFrRCF (3)NfEO NrN ORJVFR HflP OOCCP200 (4JfNFOP. WASTfO FFFP.PT (5)0RIVF~ CANT 00 MUCH POOC8300 (6JNO MANAG. SUPPCPT (7JTHREATEtfP VIOLENCE 00008400 (fJOTHFR/Qf8 (l)YfS (2)NO/ Q69 TO 071 (l)FOUJTAeLE F~RfS OOOPP500 (2)Pf0UCE CHEATING (3)EASIFR FOP. RIOFR OOOP8600 (4)RfUUCf COSTS (5JJ~PFUVE OPFR~RJON~ 00008700 (6JEASJER FOR ORIVFP (7)0THER/ 000~8800 072 TO 074 (])FARE ~It~ (2)1NCREASf CHEATING f.OOOA900 (3JTOO COMPLICATED (4JTrO EXPENSIVE (5JPOOF EOUIPHENT 000f9000 {6)HAFPfR FOR DP.JVfR (l)OTHfR/075 (l)FULL TI~E COOP9JOO (2JFUll TIME EXTR' (3J ~INJ RUN I C00f9200 076 (l)UNOFR 30 (2)31-39 (3)40-49 (4)50-59 (5JOVER 60 ~0('1P9300 /011 TO 079 (lJREtJP~Al (2JURBAN PAOJAL (3JPEAK OOOPq~OO (4JLUCAl RAOJAL (5)G~JO-FEEOER/ 000f9~00 C5 To 079 (OJ roor9~oo INTEG£R=Q5 TO 079(0,9) POOP9700 1 ,6 00('09800
'FRENJEtJCJES' PP.PPlE~ RFOUJRfS 3204 AYTES OF SPACF
P3 PFAP INPUT OATA croo9900
POO CASES FRO~ SUBFILE OPJVFR E~P rr DATA WAS F~CPl~T£RFO UN LOGICAL U~JT : P
PAt£

(fRFATinN OATF = 09/29/82)
~5 PFRCFNT FAPf FVASION
:A TEtCRY L APfl
··10~
1-20~
'1-301
1-40~
J-5('~
'VEF 50~
EAN
AL J[' C ~ ~E S
C(J[lf
1
l
3
4
5
6
1
e
9
0
TOT,L
2.1391
AI.\ 50l Ulf FP.fQUFNCY
79
246
252
151
42
12
4
5
1
B ---------POO
VARIANCE
fo4ISSING CASES
RFLATIVE FRF~llfNCY (PfPCfNT)
9.9
30.7
31.5
J 8.9
5.2
1.5
0.5
0.6
o.t
t.o ---------100.0
1.523
e
09/29/P2 PAt£
AOJUSTFD CUHULA TJVF FRE OUFNCY AOJ FRFO (PEFfft'T J (PERCENT)
10 .o JO.O
31 .1 '1 .o
31.A 72.9
19 .t 91 .9
5.3 97.2
1 .5 9B.7
0 .!i 99.2
o.t 99.9
0.1 too.o
t11 SS INC 100 .o -~---- ...
100.0
t
• • •
•

DRIVER SIJPVFY PF~rONSfS 0')/29/f!2 PAGF
FILE DRJVFR (fRf~TirN OAT£ & 09/29/~2)
06 HOW UFTFN IS THfR[ NP PAYMENT
REl.ATJ VE AOJUSTED CUMULATIVE AA SPLUTF FRfOUfNCY FRECJLIFNCY AOJ FRFO
C:ATfr-ppy LABFL CO[lf FREQUENCY (PERCENT J CPERCFNTJ CPERCfNTJ
VERY F' AP FLY 1 405 ~o.6 51.9 51.9
PARFLY 2 ?.26 28.2 20 .~ RO.A
SOHfTI~FS 3 132 16 .I) 16 .tf 97.7
OFTEN It lit 1.7 t.e 99.5
VERY OFTFN 5 4 0.5 0 .!- 100.0
0 19 2.4 fo'JSSJNG 100 .o-,.. ........ ~ ... ------- --------
TOTAL eoo 100.0 too.o
,..EAN 1.702 VARIANCE 0.717
VAL I 0 CASES 7PJ HISSING CASES 19
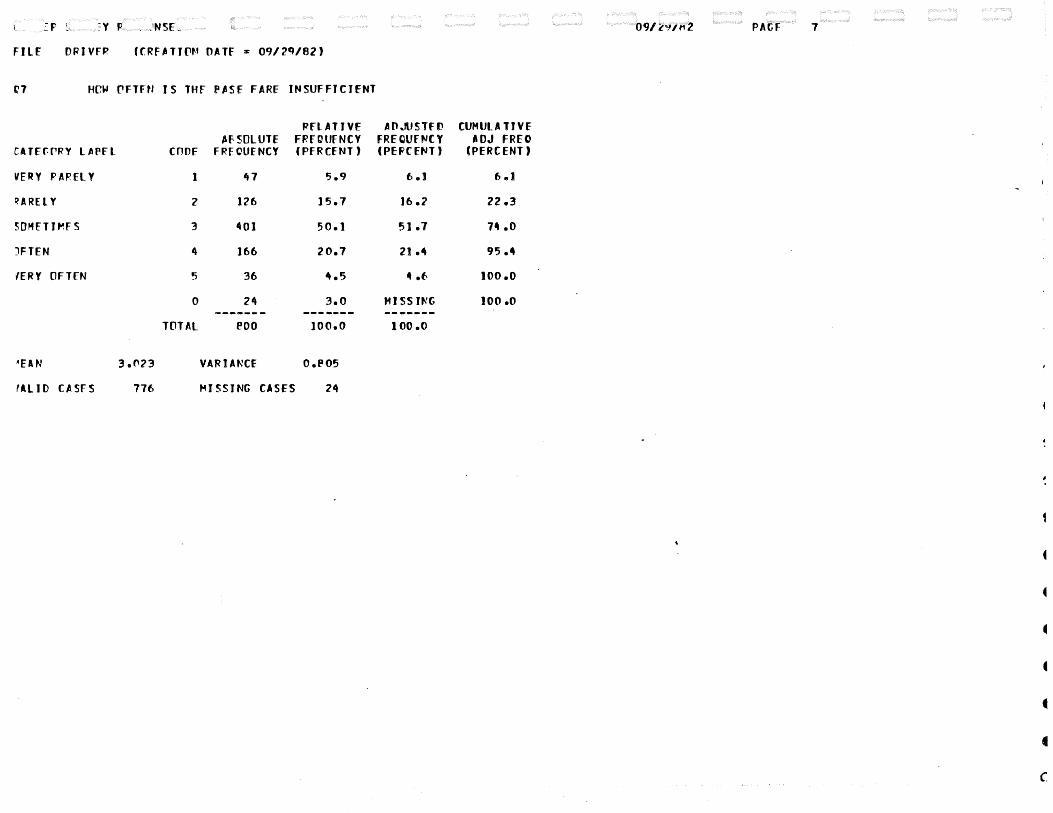
:y F _ )NSE ~ PAtf 1
FILE ORIVFP.
~7 HCW OFTFN IS THE P~Sf FARE INSUFFJCJfNT
PFLATIVE All .. IUSTF£l CUMULA TJVf ~F50LUTE FPFCUFNCY FREQUfNCY AOJ FREO
CATff.PRY LAPFL COOF FRFCUfNCY (PfRCfNT) (PEPCENT) (PERCENT)
VERY PARELY 1 47 5.9 6 .J 6 .J
~ARE l Y 2 126 15.7 16.2 22.3
SOI1fTJ~fS 3 401 50.1 51.7 74 .o
JFTEN 4 166 20.7 21.4 95 ...
ffRY OFTFN 5 36 4.5 4 .f. 100.0
0 24 3.0 HISSJt.'G 100 .o -------- -------.. -- .............
TOTAL eoo 100.0 100 .o
~rAN 3.t'23 VARIAt-:Cf o.eo5
fAl JO CASFS 776 f41 S S I NG C A Sf S 24
(

DRIVER SURVEY Rf~PONSES 09/29/P.2 PAGF A
FILE OPIVfR (fREATIPN OAT£ = 09/29/P.2J
08 HOW CFTEN IS THERE Nr THREE ZPNF CASH F'
Pfl ATIVF AOJUSTFD CUf.4ULATIVF ABSOLUTE FPfOUFNCY FREOUfP.ICY ADJ FRFO
CATffflRY LABEl COPE FF'ECUfNCY (PfFCFNT J (PfRCFNTJ (PERCENT)
VERY RM~FLY 1 57 7.1 1.~ 1.5
P~RfLY 2 101 12.6 13.3 20.9
SOio!fTJMFS 3 261 32.6 34 .5 55.4
[lfTfN It 240 30.0 31.7 f\7.1
VERY flFTFN '5 9A 12.2 12.9 100.0
0 43 5.4 MISSING too.o ---------- -------- _.., _____ TPT'l 800 100.0 too.o
IVEAN 3.292 VARIANCE J.JA6
VALID C~ SES 1~·1 MISSING CASfS 43
(

l,, ••• F SL,, ,L Y f([_,r·~ ,- 1 ~£S PAt£
'Jlf DPIVFP (fRfATION O~Tf = 09/29/e2)
19 HPW OFTFN tPE THFPf SlUGS, HALF BillS I
PflATIVE AOJUSlfl'l CUMULATIVE APSOlUTf FPEQUfNCY FREQUfNCY AOJ FRfO
"Tff£1PY LAPfl (f1()[ FREQUENCY (PER CENT J (PfRCft-11) (PERCFNTJ f
'fRY P.ftPfl Y 1 385 ~A.J 51 .1 51.1
:aREL Y 2 223 27.9 29.{) eo.6
:OMfTH1£S 3 115 14.4 15 .3 9'5.9
tfTEH 4 28 3.5 3.7 99.6
'fRY OFTEN 5 3 0.4 0.4 too.o
0 46 !i.7 ~~ SS lNG '100 .o 1 ____ ..._ ___ ------- --------TOTAl 800 JOO.O 100.0 1
fAN 1.128 VARIANCE 0.775 1 lll('l c~ srs 7!)4 MISSING CASES 46
f
t
•
• • • • • c

ORJVFP SURVFY Pf~PONSf5 09/29/82 PAtF 10
FILE ('RJVfP (fPfATJPN ~ATE : 09/29/82)
010 HPW OFTFN !PF THEPf FOPGED PASSES
RfLATJVF AOJUSTf('l Cl•HUL A TJ Vf AP SOLUTE FREQUENCY FREOUfNfY AOJ FRfO
fATfGrFY LA8fl CO Of FRfrUENCY (PERCENT) (PfRCfNT) (PERCENT)
VERY RAPFLY 1 381 1\7.6 ~3 .2 53.2
RARELY 2 201 25.1 28.1 et .3
~]14fTJP-4FS 3 103 12.9 14 .4 95.7
OFTEN 4 27 3.4 3 .e 99.4
VfRY OFTFN 5 4 0.5 0.6 100.0
• 0 elf 10.5 fo!ISSI"'t too.o ..---~--- ------- --------
TOTAL POO too.o 100.0
~fAN 1.7()4 VARIAttCf 0.791
VAllO CASFS 7Jf, MJ SSHtG CASfS A4
' {

09/29/Ei2 PJ\Gf J1
ORJVfR (fPEATIPN OATF ~ 09/29/82)
HI H£1W nFTfN AR£ THfPf MISUSFO YOlJT~,SEt\10
RflATJVf I'OJUSTFI' CUMULATIVE AP~OLUlf FtfOUfNCY FREoun:rv AOJ FPEO
:Arrrr~v L Af\EL ([1[1f FREQUENCY (Pff"CFNT J (Pff\CFNTJ (PERCENT)
IEPY FI:Rfl Y 78 9.7 JO.J JO .J
~Af"fLY 2 124 J!i.5 16.1 26.2
~a~fTIMFS 3 ?9.8 37.2 38.7 64.9
lFTfN 4 202 ?5.2 26.2 91 .J
fERY OFTEN 5 69 8.6 8.9 100.0
0 29 3.6 MISSING 100.0 ------. .. -------- ~------· TPTAL BOO 100.0 100.0
!fAN 3.078 VARIANCE I .181
'Al J[) CA ~fS 771 HISSING CASFS 29
1
4
4
r

VRJVfP SUPVFY ~f!PPNSFS 09/29/P:2 PAtf 12
Fllf 11PIVFP (fPF~TIPN O~T£ = 09/29/P.2J
012 HO~ PFTFN ARE THE~F ~RONGlY USED TWO ZON
Pfl ATIVf AOJUSTfr CUHUlA liVE AP SOl UTE FPfOUFNCY FRFOUENCY ADJ FREO
CA TE COPY l AP.f t COPE FF'fCUENCY (PER CENT) (PfRCfNTJ (PERCENT)
VERY F'~Pfl Y J 41 5.1 5 .4 5.4
f(ARflY 2 62 1.1 8.2 13.6
50HETH~FS 3 229 28.6 30.2 43 .e
OFTEN 4 280 35.0 3l:.9 eo.7
VERY PFT[N 5 146 J 8.2 )9 .3 too.o
0 42 5.2 MJSSJNt 100.0 ------- ~------ ---------TOTAL eoo 100.0 100.0
•
t'EAN 3.~(\5 VARIANCE 1 .J ?J
VAllO CASFS 758 t-f I S S I NG CASES 42
(

09/29/82 PAGE 13
=Jlf OPJVFR ((RfiTJON OATF = 09/2~/~2)
~13 HPW OFTFN A F'F THEPF fo'l SUSFO TRANSFERS
PELATJVE AOJIJSlfD CUMULATIVE IP SOLUTE FRfDllfNCY FREOUf~ICY AOJ fRfO
. ATECOPY l AeFL COOE FRfOUFNCY (PERCENT) (PERC HIT) (PERCENT)
'fRY FAPfl Y 26 3.2 3.3 3.3
'ARfl Y 2 5~ 6.7 6e9 )0.3
:OMfTJ ,_.FS 3 236 29.5 30.3 40.6
lfTFN It 2ltl 30.1 31.0 71.6
'fRY OFTFN 5 221 27.6 2P .~ 100.0
0 22 2.7 MISSJNt JOO.O _.. ___ ... ___ _., ____ ... .................. TPTAL POO too.o 100eC
'fAN 3.742 VARIANCE J.J 00
All£'! CASES 11~ "'ISS I NG CASES 22
f
4
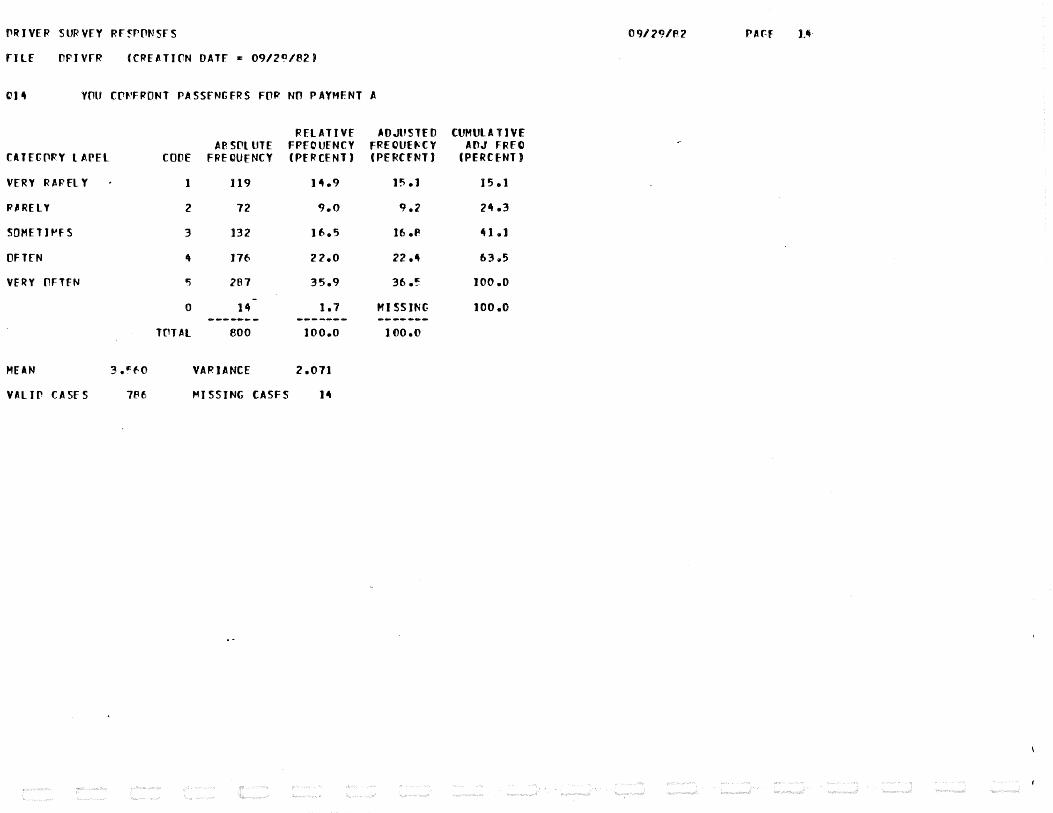
f'RIVER SURVEY R E ~PPN SF S 09/ 2CJ/P2 PAf-F 1.4·
fllf OPIVfR (Cf?fATI(1N DATF ., 09/2CJ/B2J
Cl4 YOU CPt-'FPONT PA SSFNG FRS FOR NO PAYMENT A
PflATIY£ ADJUSTED CUHULA TIV£ AP, SCll UTE FPECUFNCY FREOUEt-:CY A()J FP.fO
CATECllRY LAPEL COOE FRfOU[NCY (PERCENT) (PERCENT) (PERCfNTJ
VERY RAPEL Y 1 119 14.9 15 .J 15 .1
PH~EL Y 2 12 9.0 f:J.'2 24.3
SOHETJ,_.fS 3 132 16.5 16 .P It 1 .J
OFTfN It 176 22.0 22.4 63"5
VERY OFTEN lj 281 35.9 36.~ 1oo.o
0 14 1.7 HISSING 100.0 _.,. ______ ------- -------TOTAL 800 100.0 100.0
MEAN 3 .~~:f.O VAR lANCE 2.071
VALJC CASES 1B6 ,..ISSJNG CASFS 14

09/29/P2 PAtf
"ILF ORIVH'
H5 YOU crt-'FPONT PIOFR~ FOR JNSUFFif.IFNT BAS
f?FLATIVE ADJUSTFD CliMULATJVE Al\ SPL UTE FPECllfNCY FPfCUf"'fY ADJ FREO
:A TEtOFY l APFl COPF FPFCUENCY (PERCFNTJ (PERCENT) (PERCFNTJ
fERY RAPflY 1 79 9.9 10.2 10.2
~ARFlY 2 116 14.5 15 .o 25.2
mMETJ~fS 3 257 32.1 33.2 ~8.3
1FffN 4 220 27.5 28 .~ 86.7
IERY ('IF TfN 5 1('3 12.9 13.3 100.0
0 25 3.1 MISSU't 100 .o ----------- --------- ------------
TPTAL eoo 100.0 100.0
1EAN 3.19f. VARIANCE 1.336
'ALJO f. A Sf S 11~ MISSING CASES 25
(

~RIVFP SURVFY Ff~PPNSFS 09/29/82 PAtF 16
FilE Of<JV[R ((Rf~TJr.N O~T£ = 09/29/62)
016 YOU CntJFf<O"'l FJPEPS FOR NO Htf~ff ZONE CA
RELATIVF AOJU5lf(l ClJMUl ATIVF ~p SOLUTf FPFOUENCY FREOUFt.JCY AOJ FRfQ
CATftrF'Y LAFFL CO[lf fRfOUENCY ( PE Rtf NT J (PfRCfNT J (PERCFNT J
VERY R~PflY 119 14.9 )5 .7 15.7
RARELY 2 163 20.4 21 .5 37.3
SOHfTJ~fS 3 246 30.7 32 .!= 69.7
ClFTfN 4 )50 lf~.B ]9 .f f19 .6
VERY OFTFN 5 79 9.9 10 ... 100 .o
0 43 !'.4 "'' ss Jt.:t 100 .o -----~-~
..... ,. ... ___ -------TOTAl ~00 100.0 100 .(I
MEAN 2.fl11 VA FIANCE 1.447
VALJ(l CASES 1'51 HISSING CASFS 43

VR1V£F !URVfY Ff~P~~~ES 09/29/B'l 17
FILE ORJVfR (C~fATJrN DATE = 09/29/82)
017 YOU CP~FRONT FIOERS FOR SlUGS, HALF BILl
REL All VF ADJlJ!TfV CVHULATJVE ~P!.OLUTE FPf~UfNCY FRfOUFNfY AOJ FFfO
CATffP.PY LA~Fl COOE F Rft'UfNCY (PER CENT J (Pf ~CENT) (PERCENT)
VERY R ARFL Y 1 290 36.2 38.7 38.7
RARELY 2 135 16.9 lB eO 56.7
SOHfTIMfS 3 104 13.0 13.9 70.6
JFTEN 4 94 1 J. 7 12.f. 83.2
fERY OFTEN 5 126 J ~.7 16 .f 100.0
0 51 6.4 ,..,ssn:r 100.0 -----..... ........... ._. __ _. .............. TOT~l f.OO 100.0 1oo.o
'fAN 2.~07 VAFJANCf 2.2P8
fAl 10 CASES 749 MISSING CASES 51

ORJVFP SURVfY Pf~PON~F~ 09/29/P.Z
FILE f'F'JVfR (fRF~TJPN OAT£ z 09/29/~2)
018 YQU rr~F~ONT FIDFRS FOR FOPGfO PASSES
f"flATIVf AOJUSTFV CUMUlATIVf AP SOlUTE FRfCUfNCY FRf()lJfP.'CY AOJ FR£0
fATfGftRY l APFL corr FRF CUfNCY (PER CFNT J (PERCFNTJ (PERCENT)
VERY RARFL Y 1 353 ..... 1 4~.e 48 .e
RARELY 2 143 J 1.q 19.8 68.6
SOHETIMfS 3 07 J 0.9 J 2 .r EtO .6
OFTEN 4 64 e.o 8.9 89.5
VERY OFTEN 5 76 9.5 10.5 100.0
0 77 9.6 f41SSit\t 100 .o --------. ------- --------TPTAl 800 100.0 100.0
folfAN 2.124 VAf?IANCF J .896
VAL I 0 CASf S 173 MISSING CASES 77

09/29/f2 PAtf 19
=tLE rPIVfR {CRf~TirN OAT£ = 09/29/82)
319 YOU CONFPONT PI OFF S FOR HI SUSFO YOUTH ,Sf
RfLATIVF ADJU5TfV CUMULAlJVE APSOlUTf FPfCUENCY FRECllft.lfY AOJ FR£0
~ATftORY LABEL CO [If FRfCUENCY (PERCfNT) (PfRCFt:l) (PERCFNTJ
ff R Y P. II F' fl Y 1 151 Jf.9 19.~ 19.9
~ARFLY 2 JPO 22.5 23.1 43.6
\OHETJt-4f S 3 )99 24.9 26.2 69.8
JFTEN 4 141 17.6 JP. .f ft8 .4
'fRY OFlEN 5 f8 11.0 11.6 too.o
0 41 !'.1 tHSS JNt too.o _.,..~---- ------- ... -------
TOT~l 800 too.o 1~0.0
lEAN 2.7~3 VARIANCE 1.637
'All(' CASES 75~ fo4JSSING CA5fS 41
•
r
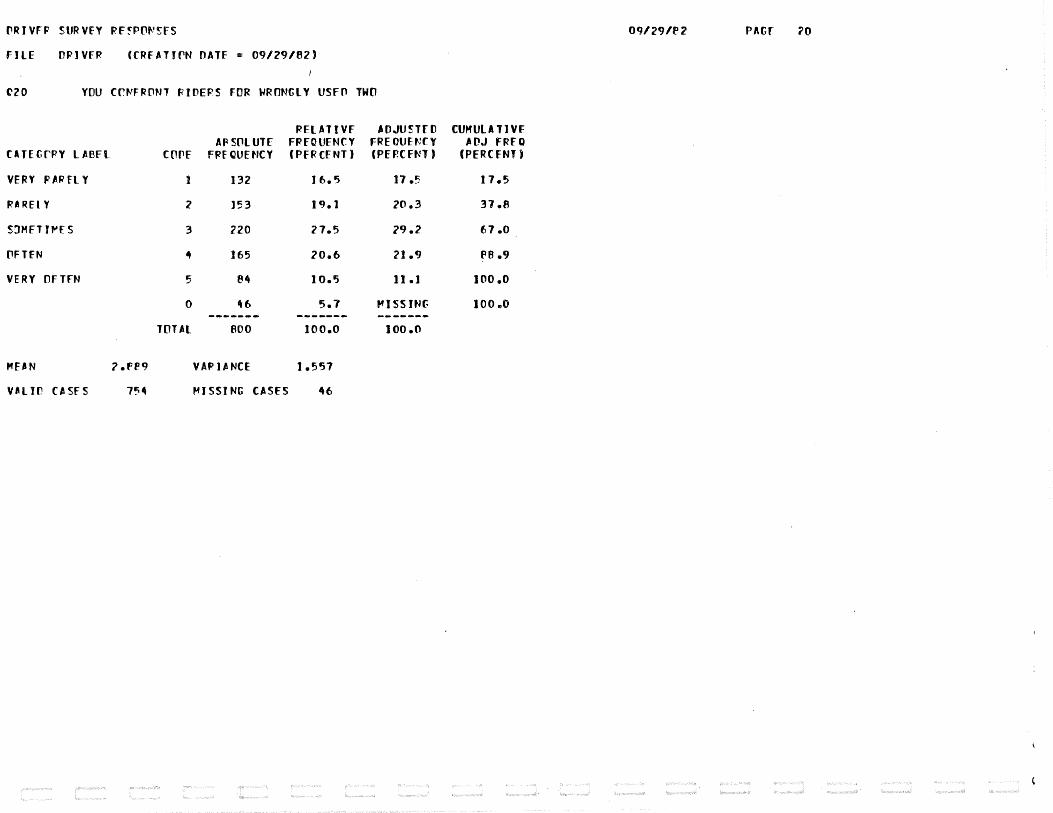
~RJVFP SURVEY Pf~PP~SFS OCJ/29/P2 PAtr
FILE OPJVFP (CRFATJrN OATF = 09/29/82)
~20 YOU rr~FRONT ~JOEPS FOR WRONGLY USFO TWO
PfLATJVF AOJUST£[1 CUMULATIVE AP S(lL UTf FRfQUFNfY FRE OUEt:ry ADJ FRfO
CATEGrPY LABFL (f!('f FPfQUENCY (Pff?CFNTJ (PEP.CFNT J (PERCENT)
VERY PARfL Y 1 132 16.5 17.5 I 7.5
RARElY 2 )53 I 9.1 20.3 37.8
SDMFTJ,..£5 3 220 21.5 29.2 67.0
PFTFN ~ 165 20.6 21.9 P8.9
VERY OFTFN 5 84 10.5 11 .t too.o
0 46 5.7 fo'ISSJNt JOO .0 -------- -------- --------TOTAL 800 Joo.o 1oo.o
f"flN ?.FP9 VAPJANCE 1.557
V~LH! CA SfS 7~4 "'ISSJNG CASES 46

)RlVfF SURVfY RF~POM5f5 09/29/e2 PAtf 21
PRJ VFR (fRFATION DATE = 09/29/82)
3ZJ YOU CP~FRONT PJOf~S FOR BAO TRANSFERS
RELATIVE AOJU!TFO CU~ULATIVE APSOLUTF FREQUENCY FRE CUENfY AOJ FRfO
:ATEfPRY LAPEL COOf FREOUfNCY (PEPCFNT) (PERCEt-'T J (PEP.CENTJ
fERY R1R flY I 60 7.5 7.7 1.1
~AREL Y 2 66 e.2 ~ .5 16.2
mMETH'fS 3 212 26.5 27.3 ~3.5
lFTEN ~ 231 2~.9 29.7 73.2
fFRY OFTEN 5 208 26.0 26.P. 100.0
0 23 2.9 PH SS It.'«: 100.0 -------- -------- -----.....
T(llAL eoo 100.0 too.o
lEAN 3.~~3 VAR lANCE 1 .~ 12
'ALIO CASES 777 MISSING CASFS 23
•

f'RIVfP ~URVfY Rf~PPNSfS 09/2CJ/A2 PAtf ~2
FJLF rPJVfR ((RfATJON OATF = 09/29/P?J
022 WPONt F~Jt'FS APE PAID BECAUSE (If 7£lNF SYS
PfLATJVf AOJUSTfl' CU~ULATJVE /.E' SOLUTE FRFt'UENCY FRE QUft'fY AOJ FRFO
fA TEf.OPY L AffL COPF FPFCUfNCY (PfRCfNTJ (PEPCFNT J (PERC£Nl)
VERY R /.R FlY 1 135 16.9 11.~ ] 7.4
PARELY z 141 17.6 JB.2 35.6
SOHFTJ~FS 3 361t ~5.5 47.0 82 .t
OFTEN It ](lJ 12.6 13.0 95.6
VERY OFTFN 5 34 4.2 4.~ 100 .o
0 25 3.1 HISS INC ]00.0 -------- ----.---- ._ ___ .. __
TOTAL BOO ]00.0 1 co·'-'
r-1EAN z.t.t~A VARIANCE 1.0AB
VAllO f.A Sf S 775 ,..I SSJ NG CA SfS 25
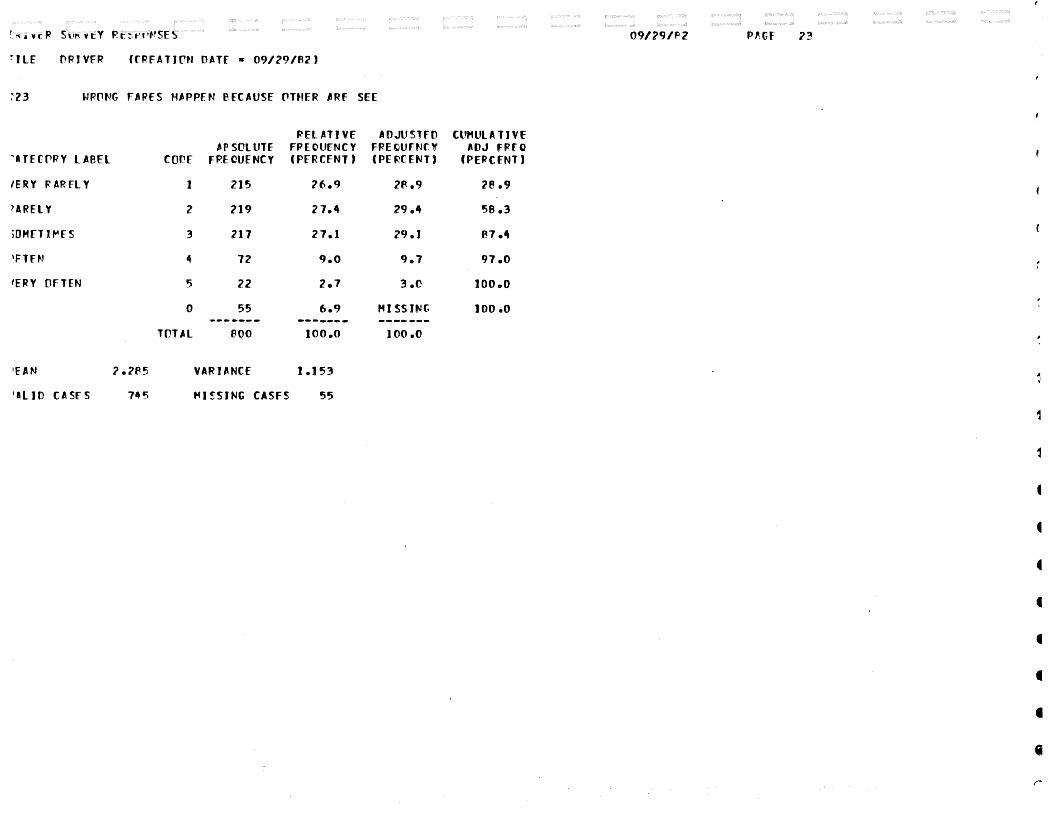
~. "\ .1 v r: R St'"' v t: Y R t: ~- t-' t •I'! SE ~ 09/29/f''l. P~GF
~JLE OPJVER (fRFATirN OAT£ = 09/29/82)
~23 WRONG FARES H~PPFN erCAUSE OTHER ARF SEE
RELATIVE AOJUSTFO tmRrLATJVf APSOLUTE FPfCUfNCY FREQUftJf.Y AOJ FP£0
~a TftPRY l ABfl CO £If FP.E OUfNCY (PfRCFNTJ (PE ~f EtJT) (PERCENT)
/ERY PARFL Y 1 215 2f..9 2P.9 28.9
~ARE L Y 2 219 27.4 29.4 58.3
iOHfT Jf'4fS 3 217 27.1 29.1 e7.4
'Flf~J 4 72 9.0 9.7 97.0
'fRY OFTEN 5 22 2.7 3.C too.o
0 55 6.9 Ml SS INt too.o -~------
.,.., ______ --------TUTAL eoo 100.0 too.o
VARIANCE 1.153
'ILJO CASES 7~5 ,.q ~SING CASFS 55
1
•
• • • •

O~JVEP SURVFY Rf~PPNSFS 09/29/P,'l PAGF 24
FilE OPIVEP (CPFATIPN OATF a 09/29/82)
C24 WPONG f~PES HIPPEN ~FCAUSF OPFR~TOR CANT
FflATIVf AOJUSTFO CUMULATIVf AP ~Ol UTE FPEOUENCY Ff?EQUft-JfY ADJ FRFO
fATEfl1RY lABEl en or FFFCUENCY (PERCFNTJ (PERCft-!l) (PERCENT)
VERY RAP.fl Y 1 89 11.1 n. 1 11 .7
RARELY 2 96 12.0 12 .f. 24.3
~JMETIMFS 3 209 26.1 27.4 51.7
PFTEN 4 193 24.1 25.3 11.0
VERY OFTEN 5 175 21.9 23 .o 100 .o
0 38 4.7 HISS Ir-'t 100.0 --------- ... -------- ... -------TOTAL 800 1oo.o too.o
~EAN 3.~~3 VARIANCE 1.643
VAll [I CASES 7(-,2 HISSING CASES 38
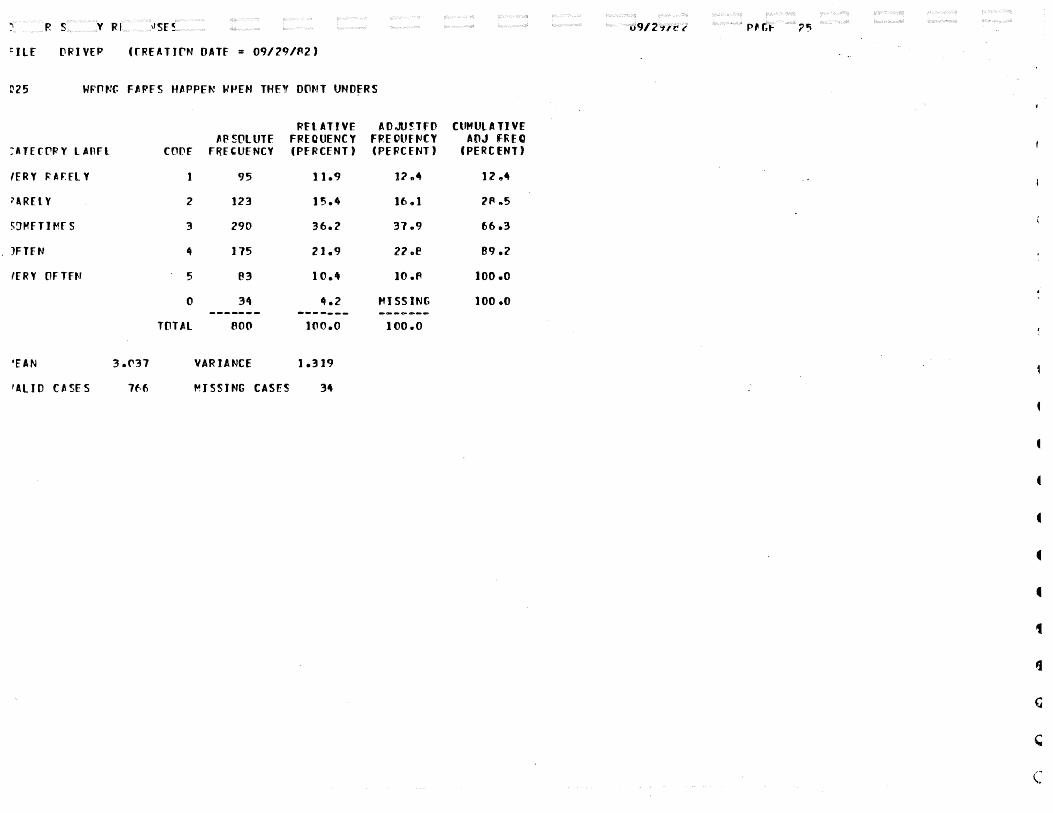
"• P. s Y Rl
CJlf ()f?IVfP (fRfATJrN OATf = 09/29/~2)
~25 WFONC F~~FS H~PPEN W~EN THFY OONT UNOfRS
FflATJVE AOJU~lf() CtiMUl A Tl VE ~~SOLUTE FREQUENCY FREOUf~J(Y AOJ ff\EO
:AT f f PR Y l A R F l CO Of f~fCUfNCY (PFRCENT J (PERCENT J (PERCENT)
If R Y FAr. fl Y 1 95 11.9 12 .~ 12 s4
~lR£l Y 2 123 15.4 16 .J 2P .5
~!JMFTJMfS 3 290 36.2 37.9 66.3
JFTFN 4 J 75 21.9 zz .. e 89.2
ffRY OfTFN 5 83 10.4 10 .~ 100 .o
0 34 4.2 MISSING 100.0 -~- ............
.., ______ ... ..... __ .., ...... TOTAl 800 100.0 tco.o
'fAN 3.C'37 VAR lANCE 1.319
'All D CASES 7f>6 ~JSSJNG CASES 34
•
c

VRJVFP SURVEY RF~PONSFS 09/29/£'.2 P~ff
FilE ORJVEP (CRF~TJPN O~IF ~ 09/29/~2J
C26 WRPNt FARES H~PPEN PfCAUSE THF FARES ARE
Rfl AT IVF AOJU5T£D CUHULA TIVF AP SOlUTE FPEQUFNCY F PE cun~r Y AOJ FRFO
ClTff.(lRY lABFL cor.r FREOUENCY (PERCENT) (PEF.CfNT) (PERCENT)
VFRY RARflY 1 208 26.0 2P.C' 28.0
fHRFl Y 2 231 28.9 31.1 59.2
~3METIMFS 3 190 24.7 26.7 e5 .e
PFTfN It 71 8.9 9 .f 95.4
VERY OFTEN 5 34 4.2 4 .f. 100.0
0 58 7.2 .. ISSJNt 100.0 ------- ------c.o ................ TOT"l eoo 100.0 100.0
MEAN 2.315 VARIANCE 1.245
VAll() CASES 742 MISSING CASFS 58
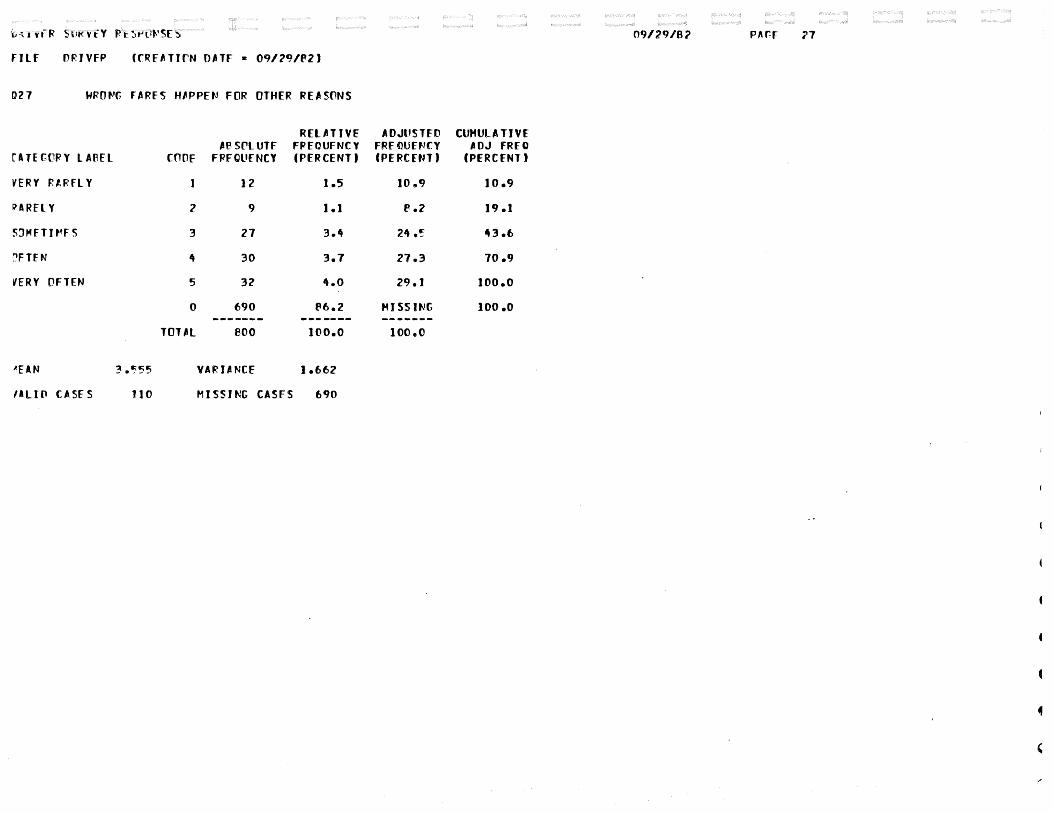
09/29/8? PJ\f.F :-7
Fllf ORIVFP
027 WRO~G FARFS H~PPEN FOR OTHER REASONS
RELATIVE AOJLJSTfO CUMULATIVE All SPl UTF FPEOUFNCY FRE CUEt!f.Y ADJ FR£0
[ATEtllPY LA~fl en or FPfQli£NCY (PERCENT) (PERCftJl J (PERCENT)
VERY RI.RFL Y 12 1.5 10.9 10.9
I?ARfLY 'l 9 1.1 ~.2 19.1
S:J~fTI~FS 3 21 3.4 24 .! 43.6
r'FTfN 4 30 3.7 27.3 70.9
~fRY OFTEN 5 32 4.0 29.1 100.0
0 690 ft6.2 HJSSJNt 100.0 _,__. _____ ~------ -~ .. -----
TOTAL 800 100.0 too.o
'-EAN 3.1"5~5 VAfHANCf 1.662
lllJ[l CASES 110 MISSING CASFS 690

D~IVFR StiRVFY F'F~PPNSFS 09/29/P.2
FJLF flRIVER (f~FATJPN OAT£ a 09/?9/~2)
Ql8 HIG~ SfHOOl Af.fS MISUSE THE SYSTf~
RflATJVE AOJUST£0 CUMULATIVE AP SOLUTE FPFOUfNCY FRECUft-!CY ADJ FPFO
Cl TrtrPY LAPFL CODF FFfQU[NCY (PERCENT J (PERCFNT J (PERCENT)
VERY PAPfL Y 1 40 5.0 5 .] 5 .J.
RlRflY 2 59 7.4 7.5 1?.7
~3M£TJ~FS 3 2~5 30.6 31.3 44 .o
PFTfN 4 273 34.1 34 .~ 78.9
VERY OFTFN I) 165 20.6 21 .J ]()0 .o
0 18 2.2 HISS INC 100 .o --------- ------ ... ...... _____
TOTAL fOO 100.0 1 (10 .o
MEAN 3.593 VARIANCE 1.123
VAll() CASES 182 HISSING CASES 18

09/2~J/fl2 P.ACf ;>Q
FILE OfH VER fCPE~TICN OATF = 09/29/f2J
~29 HIGH ~CHOOL TO 2~ ~ISUSE TH£ SYST£~
RELATIVE .AOJUSTFV CUMULATJVF APSOLUTf FRECUFNCY FRECLIFNCY AOJ FRFO
CAT E ~ (1P. Y L A P f l COllE FREQUENCY (PfRCFNTJ (Pffi'Cf~TJ (PERCFNT J
VERY PM'fL Y 21 2.6 2.7 2.7
HREL Y 2 71 8.9 9.1 J 1 .e
S:JMET H~f S 3 268 33.5 34.3 46 .t
OFTEN 4 265 33.1 33.t;) eo.o
VERY (lfTEN 5 ]56 19.5 20.0 100.0
0 19 2.4 HISS tNt: 100 .o _,... _____ -~ ........... _. ........ _ ..
TOTAL eoo too.o 100.0
"EAN 3.~'34 VARUNC£ 0.985
/Al JO CASES 7PJ MJ SSJtiG CASES 19
(

OIH VFR SURVEY Rf 5P(lNSfS OfJ/2CJIB? PAGE 30
FILE ['FJVfP (r.R£ATJON OATF = 09/29/52)
C30 SYSTFH
RELATIVE ADJUSTED CUHULA TJVF ~p SPLUTF FRfOUFNCY FREOUFNCY AOJ FREO
CATEGPPY lABEl COflf FRECUENCY (PfFCENTJ (PERCENT) (PERCFNTJ
VERY RAFEL Y l 10~ 13.0 13.f. 13 .6
FU~El Y 2 270 33.7 35 .~ 49.0
S~METJMfS 3 309 3B.6 40.5 89.5
OFTEN 4 66 6.2 f.7 91:\.2
VERY OFTFN 5 14 1.7 1.8 100.0
0 37 4.6 HI SSJNt 100 .o .......... -.... .-.-------- -------T[ll Al POO 100.0 100 .c
~fAN 2.497 VARIANCE o.eo7
VALID CASES 71-,3 MISSING CASES 37

09/29/P-2 P~tf 31
FILE CPJVEF (fPf~TirN O~TF c 09/29/82)
~'31 41 TO f.5 t'ISl•SF THE SYSTEM
PEL AliVE AOJUSTfll CUMULATIVE Af:l SPL Ulf FREt'tJENCY FPE CUf NCY AOJ FREO
~lTEtflPY LAPFL cnPE FFEQUENCY (PERCENT J (PERCFt-.'T J (PERCFNlJ
fERY FU?fl Y 252 31.5 32.6 32.6
URFL Y 2 330 ~1.2 ~2.7 75.3
S3Hfl IME S 3 158 19.7 20.~ 95.7
Jf=lFN ~ 21 2.6 2.7 98 .~
fERY £lF TEN 5 12 1.5 1 .f 100.0
0 27 3.~ HISS IN f. too.o ------- ~~----- -------TOT~L eoo 100.0 too.o
'EAN 1.~79 VARIANCE 0.779
fALJO CASF S 773 MISSING CASES 27
f
f
r

DR I VF F? SURVEY f?FSPO~'SFS 09/29/P.2 f'~{;£ ~2
Fllf rRIVFP (CRf ATH1N OAT£ = 09/29/82)
CH2 OVFP t-5 t'l SUSF THE SYSTEf-4
Rfl AliVE AOJl'STFD CUHUlAlJVF I! A S[1l UTE FPEOUfNCY FREQUE"'CY ADJ FREO
Cl Tff,OPY LAeFL fO[lf Ff:'EOUENCY (PEFCENT) (PfFCftH J (PERCENT)
VERY FAPFl Y 314 39.2 40.4 40 ...
F•RELJ 2 213 26.6 21.4 67.7
!JHfTIMES 3 148 16.5 19 .o 86.8
£lFTf~ 4 68 6.'5 A.7 95.5
VERY OFTEN 5 35 4.4 4 .5 too.o
0 22 2.7 fo'JSSJNG 100.0 _____ ,_,_ _ _____ _.. .. ..... -.......... Tr.TAL 600 too.o too.o
t'EAN 2 .o~:Jt. VARIANCE 1 .341
VAl IV CASES 11e MISSING CASES 22

:rtr l'lf?l VfP fCRfATIPN OATf = 09/29/82)
>33 RUSH HPUP PJOERS ~JSUSE THE SYSTEM
A TfGP.PY l AAFl
'fRY RAPfl Y
'l\Rfl Y
iJHETJ~fS
'FTEN
fRY OFTFN
EAN
ALIO CASES 7t.6
COOE
2
3
4
5
0
TOTAL
All SOLUTE FPEQUENCY
107
135
22B
195
101
34 -------eoo
VARIANCE
MISSING CASES
~El~TIVf FREOUfNCY (PEPCFNT J
) 3.4
16.9
2R.5
24.4
12.6
4.2 --------100.0
1.515
34
09/29/82 P~Gf 33
AOJUSlff.l CUMlJlA liVE FR£ Qllft.•CY AOJ FRfO CPEPCENTJ (PERCENT)
14 .o ) 4 .o
J7ef 31 .f;
29.f 61 .4
2!i .. !' 66.8
13.2 100.0
MISS INC too.o ........ _. .... 100.0
1
1
1
t
• • • • '

O~JV£P SURVfY RESPONSES 09/29/P2 34
Fllf [lPJVfP ((Pf~TJrN OAlf = 09/29/P.2J
034 MJPPAY PJrFrS MISUSE THE SYSTFM
PELATIVF I.OJU5TEO CUMULATIVE AP SOLUTE FPfOUENCY FRf()UfNCY AOJ FREO
ClTFCORY lAPEl CO('f FRECUENCY (PERCENT) (PFRCFNTJ (PERCENT J
VERY P.APfl Y 1 69 8.6 9.2 9.2
RARELY 2 178 22.2 23.6 32.~
5JHflit4fS 3 364 45.5 4fl.3 e I .1
fiFTEN 4 108 J 3.5 14.3 95.5
VERY [lfTEN 5 34 4.2 4 .!i 100.0
0 47 5.9 MISSJNt 100.0 --.----- --~------. -... ------TOTAL eoo 100.0 100.0
~EAN 7.PJ4 VARIANCE 0.~94
VAl IV CASES 7~3 HISSING CASES 47

09/29/f2 PAt£
FILE ORJVfP (fPfATJPN O~Tf = 09/29/e2)
035 EVFNJNG PIDFRS MJSUSF THE SYSTEM
PELATJVE AOJU!.TFV CUHUl A TJVF AP SOLUTE FRfClJENCY FPf()Uft-!f.Y AOJ FJ0'£0
CATFCOPY lABFl COPF FPFQUENCY (PERCENT) (Pff\CfNTJ IPfRCENTJ
VERY RAPFL Y I !l2 6.5 7.2 7.2
~~ RFL Y 2 Jl5 14.4 15 .'J 23.1
S[)METJp.ifS 3 291 36.4 40.2 63.3
~FTEN 4 188 23.5 2f>.(l 89.3
VERY OFTEN 5 77 9.6 10.7 too.o
0 77 'J.6 f41 SS UJt 100 .o ---~---- ------- -------
TOTAL eoo 100.0 1 oo.o
"fAN 3.170 VAFJANCE 1.105
tAll V fA SF S 7?3 f'4JSSJNG CASES 77
' (

pqJV£P SURV£Y P£SPONS£S 09/29/82 PAGF
fiLf ORIVEP (fRf~TION D~Tf = 09/29/P2)
f~RlY ~~-LATE PH RIDFRS MISUSE THE S
Rfl~TIVf AOJUSTFO CUMULATIVE J.f' SOL UTE Ff<'FOUENCY FPEOUft-.!fY ADJ fR£0
C-TECPPY LAPfl COPE FREOUENCY (PERCfNT J (Pffi'Cff-'T) (PERCfNTJ
VERY RARFLY 1 102 12.7 14 .{I 14 .o
RARELY 2 ]56 19.5 21.! 35.5
SDHETJ,_.ES 3 246 30.7 33.9 69.~
rFTfN It ]55 19.4 21.3 90.B
VERY OrTFN 5 67 P.4 9.2 Joo.o
0 74 9.2 MISSING too.o ..... --.-.-~ __ ... _____ --------
TOTAL f.OO 100.0 100 .o
fo'EAN 2.902 VARIANCE 1.352
VI LIP CASES 726 MISSING CASES 74

09/29/f:l PAGF ?7
=-JLE l1RIVER (CRFATJPN OATf = 09/29/82)
J37 Wff~fND RJOfRS ~JSUSE THf SYSTfM
PFlATIVf AOJUSTfl' ClJMUlATJVf /JP SOlUTE FREQUENfY FP.f CJllft..'CY AOJ FPFO
~a TffflFY l Af'fl COPE FPEQUENCY (PERCENT J (PERC ft-'T J (PERCENT J
IERY F ARfl Y 1 65 B.1 911f 9.8
~ARfLY ? 87 10.9 )3 .? 23.0
~lJMfTH'FS 3 298 37.? 45.2 68.2
3FTEN 4 147 J e.4 22.3 90.5
fERY OFTEN 5 63 7.9 9.5 100 .o
0 140 J 7.5 ~ISSJtJ( 100 .o -------- ----~- ... -----------TPTAL eoo 1oo.o 1oo.o
'EAN 3.0P5 VAPJANCf 1.125
'All() CASES f.fO MISSING CASES 140
•
r

oqJVfP SURVFY PfSPPNSfS 09/29/82 PAGF
FILE ORIVFP (fRfATJnN O~Tf c 09/29/B2J
03B OO~NTO~~ RJOEPS HJSUSE THF SYSTEM
RFLATJVF AOJUSTFil CUMULATIVE U~ SOLUTE FRFQUFNCY FREClUfNCY AOJ FREO
Cl TE fflRY L Al.'fl COOE FRFOUENCY (PFRCFNTJ (PEf(Cft-ITJ CPERCFNTJ
VfRY RAPFL Y 1 J 19 14.9 Jf:, .t. 16.6
RlRflY 2 ]50 1 e.e 21.0 37.(;
S)MET H'fS 3 255 31.9 35.7 73.3
OFTfN 4 137 17.1 JCJ.2 92.4
VfRY PFTFN 5 54 6.7 7.f too.o
0 e5 J 0.6 HISSING 100.0 --------- -------... --------
TOTAl 800 100.0 too.o
~fAN 2.POO VAR lANCE 1.331
Vllll' CASES 715 MISSING CASFS 85

=Jtf DRJVF~ (CRFATIPN OATE c 09/29/82)
B9 CITY RJCfPS
·a TEt(IRY l ABFL COPE
rERY RARfL Y 1
~l Rfl Y 2
~:tMETJt-1fS 3
'FTEN 4
rERY PFTfN 5
0
TPTAL
'ElN 3.1741
'Al J (l CA SfS 724
MJSUSF THE SYSTE~
AP SOl UTE FPEOUENCY
49
85
345
lP.l
64
76 --------a.. eoo
YAP- J ANCE
MISSING CASES
RELATIVE FRECUfNCY (PERCENT)
6.1
10.6
43.1
22.6
8.0
9.15 --------100.0
0.963
76
AOJUSlfO CUMULATIVE FRE~UfNCY AOJ FREO (PE~CENTJ (PERCFNTJ
6.f 6 .e
11.7 18.5
47.7 66.2
2!5.0 91 .2
e.e too.o
MISSINt: 100.0 ,.,._ ........ __ too.o
09/29/f2 PAC£
"' '
•
• r

IH JVFR SlJPVFY Rf~P(lt-JSFS 09/2CJ/P2 PAGF 40
fllf DRJVfP (fPfATJrN O~Tf 11: 09/29/f:\2)
('40 SUPURP'N RTOFRS "'' susr THf SYSTEM
RflATJVf AOJUSTFO CUMULATIVE /.P SOLUTE FRfOUFNCY FRfOUfNCY AOJ FREO
ClTft(lPY LA~Fl COI'f FPfQUfNCY (PfRCfNT J (PEFCENTJ (PERCENT J
VERY RARFL Y 1 57 7.1 7.fl 1 .e
RARELY 2 99 12.~ 13.5 21 .3
~~METJ~FS 3 315 39.4 43.(' 64.3
(lFTfN 4 ]84 23.0 25 .J 89.5
VfRY [lflEN 5 11 9.6 ]0.5 100.0
0 68 8.15 Ml SSUIG 100 .o .. ~ ... ------ ___ _.,... ........ ... _. ...... _ _. .. TflTAl BOO too.o 1oo.o
~EAN 3.171 VAR I ANCf 1.091
VAll 0 CASES 732 MISSING CASFS 68
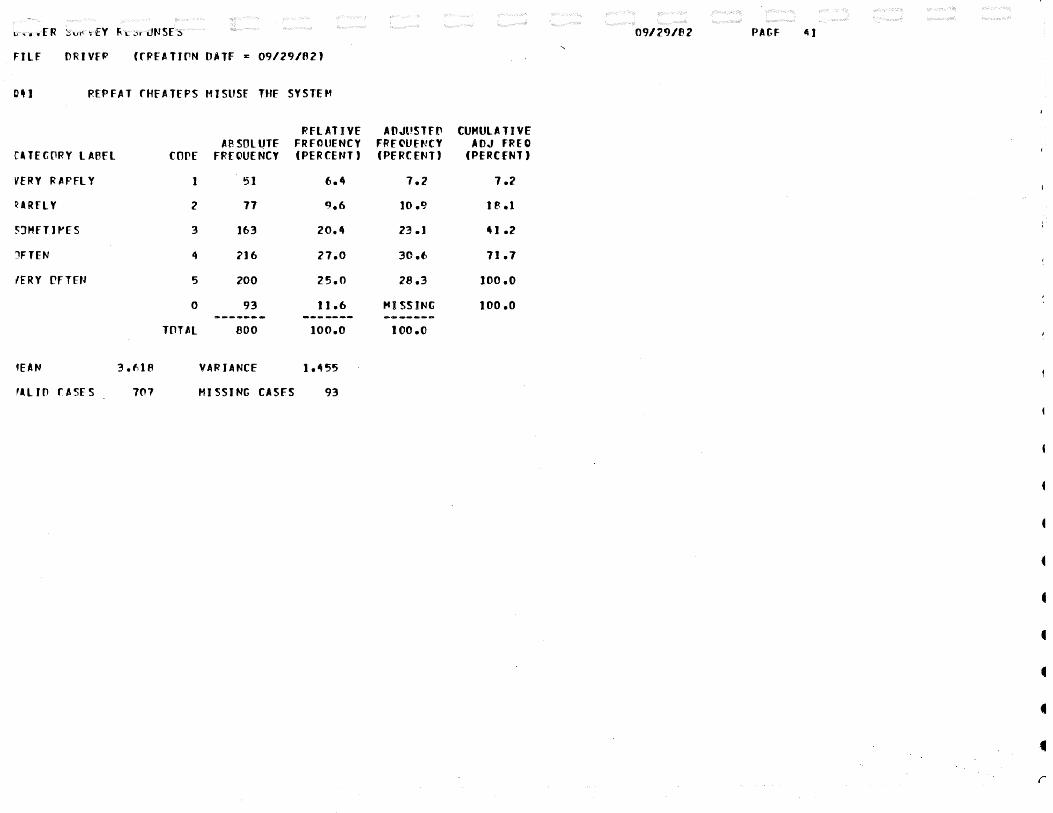
PAtF
Fllf ORI VEP (CFfATJPN OATF = 09/29/62)
D~l REPFAT fHfATfPS HJSUS£ THF SYSTEM
PFLATIVE AOJt!Slfl' CUMULATIVE ABSOLUTE FRFCHIENCY FRft'Uft!CY AOJ FREO
rl TE C(lRY l ABFL COVE FRECUENCY (PERCENT) (PERCENT) fPERCfNTJ
VERY R APFl Y 1 51 6.4 1.2 7.2
URFLY 2 77 9.6 10 .CJ 1 p. .1
~:JMFT J ~fS 3 163 20.4 23.1 41 .2
JFTEN 4 716 27.0 30.6 71.7
fERY l'FTfN 5 200 25.0 28.3 too.o
0 93 11.6 MISSING JOO.O -------.-. ----- ... - ~ .. ------TOTAL 800 100.0 too.o
'fAN 3.fl8 VARIANCE 1.455
fAL JO fASE S 707 MISSING CASFS 93
f

O~IVfR SURVEY PFSPPNSFS 09/29/fi2 rACF 6?
Fllf OPIVFR (CRF A Tl ON OAT£ = 09/29/62)
(),2 YOU A Slf THF ,_. TO PAY FUll FARE
RFLATIVF AllJUSTFV CUHULATJV£ ABSOLUTE FREQUENCY FREQUENCY AOJ FR£0
ClTEf:PPY lAPEl roor FPFOUENCY (PfRCFNT) (PE RCFtJT) (PERCENT)
VERY PAPflY 1 36 4.5 4 .f> 4.6
FARflY 2 28 3.5 3 .f. 8 .J
SJMFTJ~fS 3 178 22.2 22.f> 30.7
OF T£N 4 296 37.0 37 .t: 68.4
VERY nrTEN 5 249 31.1 31.f> 100.0
0 13 1.6 HISSING too.o ------- --------- _._. ............ TOTAL eoo too.o 100 .o
t'EAN 3.Pfl? VAPJANCE 1.084
VAllO CASES 7~7 ~ISSJNG CASES 13

09/?9/e2 PAGF ~3
"ILE f'P I VER (r~FATIPN OATf = 09/29/B2J
YOU A~r THF~ TO Lf~Vf THf BUS PP. PAY
RELATIVE ADJUSTff' CUMULATJVF AP SOLUTE FRfOliFNCY FRECUENCY AOJ FR£0
:lTftOPY LA~EL COllE FPfOUENCY (PfRCfNTJ (PfRCfNT J (PfRC£NT J
f E R Y J.: A P fL Y 1 250 31.3 34115 34.5
~A RELY 2 176 22.0 24.3 5R.e
~)HfTif'FS 3 tee 23.5 2f..O e4 .e
lFTftl 4 69 e.6 9.5 94.3
fERY OFTFN 5 lt1 5.1 5.7 100.0
0 76 9.5 f115SJNt 100 .o -... ---~- --.-.---- _.., ____ .. TOTAL fOO 100.0 100 .o
lEAN 2.71~ VARIANCE 1.4 22
'lLI [' CASES 724 HISSING CASES 76
•
f
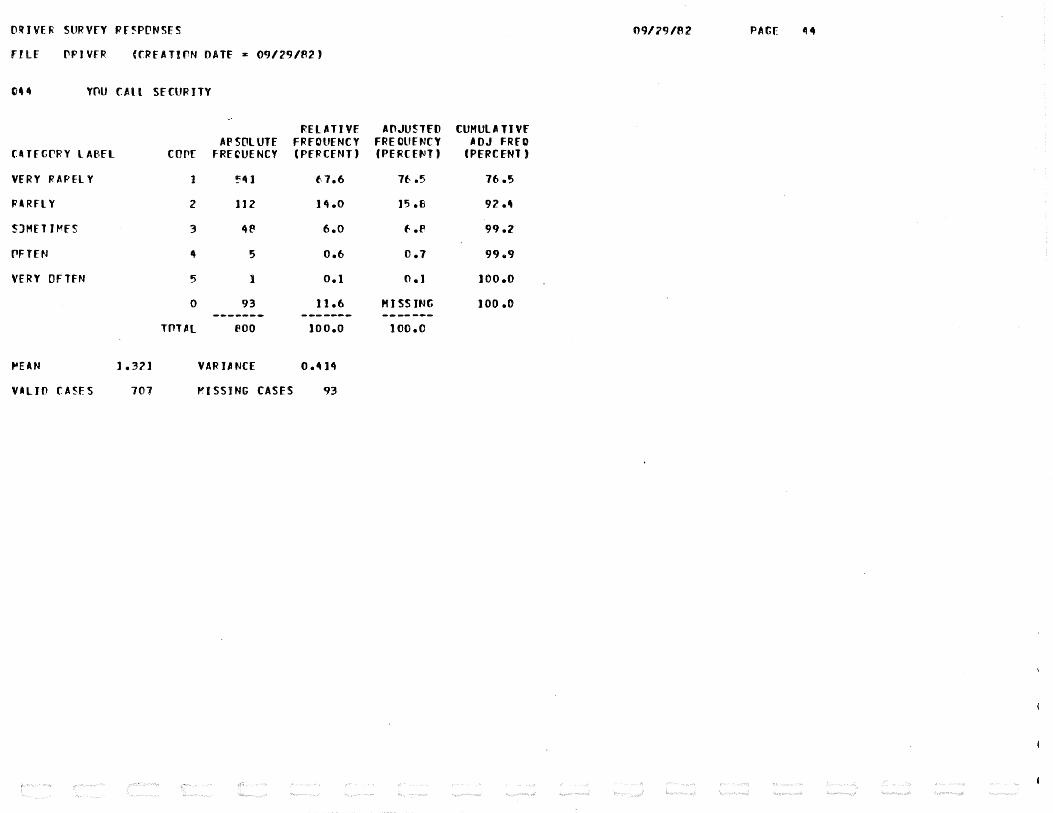
09/29/82 PAGE
Fllf l'PIVFR (f,.,fATirN OAT£ z 09/29/82)
RfLATJVf AOJUSTFO CUMULATIVE AP SOLUTE FRFCUENCY FRECllfNCY AOJ FR£0
f-TfC['RY lAP.fl COPE fRfCUENCY (PERCENT) (PERCENT) (PfRCfNT J
VERY R APEL Y 1 ~41 f:.1.6 1f:. .5 76.5
PlRfLY 2 lJZ 14.0 15 .fl 92.~
5JM£TJMES 3 4P 6.0 f .f 99.2
f1FTEN 4 5 0.6 0.7 99.9
VERY OFTFN 5 1 o.t 0 .J 100.0
0 93 11.6 MISSING 100 .o ................... ------- -------TOT~l eoo too.o too.o
F-'EAN 1.3?1 VARUNCE 0.414
VAllO fA5ES 707 MISSING CASES 93

09/29/e2 PAGF
=rLF I'PIVfP (fRfATifN OATF = 09/29/P2)
~· 5 YOU TAI'f Nr' ACTION
RflATIVf: AOJUSlFD CUMULATIVE /.P ~OLUTf FREQUENCY FRFCUENCY ~DJ ff(£0.
:A TEtff'Y lABEL COOE FREOUENCY (PERCENT) (PfflCENT) (PERCENT)
fERY P.APEL Y 261 32.6 37.3 37.3
lARFl Y 2 129 16.1 18.5 55-.e
i)HETJ t-'f S 3 187 23.4 26 .f 8Ze5
)FTFN 4 70 A.1 10.0 92.6
'ERY PFTfN 5 52 6.'5 7.4 too.o
0 101 12.6 HISSING too.o ------- ... --------- -------.-TOTAL AOO too.o too.o
'fAN 2.31P VARIANCE 1.612
'Allll CASFS l99 HISSING CASFS 101
f
(
(
c

~liVFR SURVEY Ff5PONSES 09/29/P2 PAGr
FilE ORJVrr (fRfATION O~TE z 09/29/82)
RflATJVF ADJUSTFll CliHUl A TJ Vf APSOLUTF FRfQUfNCY FREQUf .. 'CY AOJ FR£0
CATEf-OPY LAAEL COl'E fREQUENCY (PFP.CFNT) (PERtf~T J (PERCENT)
VERY RAPfl Y 30 3.7 21.3 27.3
RARELY 2 14 1.7 12.7 ltO.O
S:JMfTJ~fS 3 25 3.1 22.7 62.7
(1FTfN 4 22 2.7 20.(' f2.7
VERY OFTEN 5 19 2.4 17.3 too.o
0 l->90 A6.2 MISSING 100 .o ~----------. ._ .. --... -- ________ ... ,...
TOTJL 800 1oo.o 1oo.o
MEAN .2 .P73 VAPIANCf 2.112
VALIP CASES 110 MISSING CASFS 690
•

oro vt: f StJt< V'l: f P.f~PiJN!:fS 09/29/f.2 PAC£ ~1
FILE ['PIVFP (CPfATJ[!N DATE a 09/29/82)
~-7 PlllfP THEN PAYS FULL FARE
RELATIVE AllJUST£0 CUMULA liVE fl' SOLUTE FRfOUFNCY FRE Cl!£t-'CY AOJ FRFC
CATEGCF'Y LABEL COOE FPftUENCY (PfRCFNTJ (PERCENT J (PERCFNTJ
VERY P/tPFL Y 1 54 6.7 7.1 7.1
URFt Y 2 61 7.6 e.c 15. J
SJMFTifoffS 3 266 33.2 3~ .9 ~0 .o
JFTFN 4 272 34.0 3!' .7 f5.7
fERY flF TfN 5 )09 13.6 14.3 100.0
0 30 ~.1 HISS INC too.o ------- ... -.. --~-- -------TOTJ.l 800 too.o too.o
~fAN 3.421 VARIANCE J.J17
fALIO CASFS 1112 ~ISSING C~SES 3f.
c

O~JVFP SUPVFY PFSPONSFS 09/29/62 PACE
Fllf DRIVER (fRF~TJON OATF = 09/29/82)
048 PJOFP T~EN PAYS PART OF FULL FAPE
RFLATJVE AOJU5TEl'J CUMULATIVE A~ SOLUTE FPFCUFNCY FRE OUFfo.TY AOJ FRFO
c• Tf HlPY L APfL COOF FP.ECUENCY (PFRCFNT) (PfRCFP.'T) (PERCENT)
VERY P.~PELY 1 86 10.7 11.6 J 1 .6
PARELY 2 109 13.6 14.7 ?6 .z S:J .. FTJf-1ES 3 368 46.0 ~9.~ 75 .B
OFTEN 4 ~~ 1 17.6 19.0 94 .e
VERY OFTEN 5 39 ~.9 5.2 too.o
0 57 7.) MI SSJt.'t too.o ------ .. ------- ---------TOTAL AOO 100.0 100.0
~fAN 2.«lJ7 VARIA~CE 1.004
VAllO CA~FS 743 HISSING CASES 57

'IU vf F SlJRVl Y P£~PL'NSfS
llf ['RJVfP (CRf~TIUN DATE ~ 09/2~/P2)
··9 PIOER THEN
ATfGPPY l ~eft
'fRY F.'APfl Y
ARELY
JHETJt-'fS
FTEN
ERY PFTFN
EAN 2e7PO
ALJO CASES 747
lfAVFS BUS
AP SOL UTE COO£ FREQUENCY
1 228
2 200
3 221
4 66
5 26
0 53 ---------TOTAL eoo
VARIANCE
Ml SSI ~!G CASES
RFLATJVf FRfCliENCY (PfRCFNT)
28.1)
25.0
2 e.tt
e.2
3.2
6.6 ---------100.0
1.199
53
AOJIJSTFV FREOUFt-'CY CPERCftll)
30.!>
26 .e
30.It
e .e
3 .!>
Ml SS tt:G --------100.0
CUHULATJVE AOJ FREel
(PERCENT)
30 .~
57.3
e1.1
96.5
1oo.o
100.0
09/29/82 P~GF
I
r
(' ~
,, .....

O~JVfR SURVFY PfSrPNSES 09/29/f\2 PAGf !'0
Fllf ORJVFR (f~fATJrN OATF. = 09/29/82)
Q50 RIOFP T~FN STAYS ON ~US WITHOUT PAYMENT
RELATIVE AOJU5Tf() CUMUL A liVF A P SPl UTE FFfOUENCY FREOUFNCY AOJ FR£0
ClTFGPPY lAPEl cnf'F FREQUENCY (PFR CfNT J CPFRCFt-'T J (PERCENTJ
VERY RARfl Y 1 212 26.5 28.4 21:' ·"
RARELY 2 160 20.0 2l.lt 49.8
SOMfl H'fS 3 226 28.2 30.3 80.1
OFTEN 4 100 12.5 13 ... 93 ••
VERY PFTFN 5 lt9 6. J (:,.6 100.0
0 53 6.6 MISSJ~G too.o ...... ______ ................. .. _ ......... ~ TPTAL 800 too.o too.o
f"EAN 2.4P3 VARIANCE 1.481
VALlO CASES 747 MISSING CASES 53
'
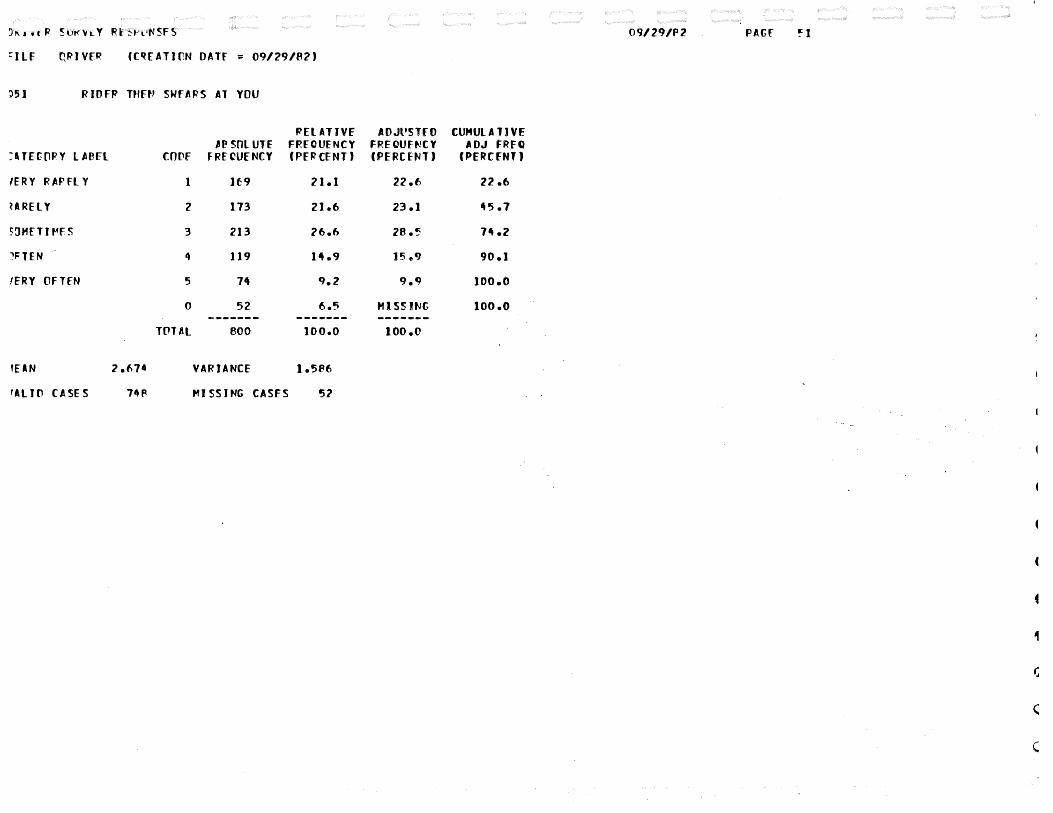
09/29/P2 PAGF !1
=tlf nPIVER ((qfATJrN OATF = 09/29/82)
)51 RJOFP THFN SWFAF<'S AT YOU
PELATIVf ADJl'SlFO CUHULA liVE IP SOLUTE FP.EOUfNCY FP.E our t!C v AOJ fRFO
:lTEt[lRY LAe.fL f.Ol'f FRECUENCY (PFR CENT J (PERC fNT J (PERCENT)
fERY RAPFLY 1 Jf9 21.1 22.6 22.6
URELY 2 173 21.6 23.1 45.7
~:JMfTH•FS 3 213 26.6 28.~ 7~.2
JF=TEN it 119 1~.9 15 e9 90.1
IERY OFTEN 5 71t '1.2 9.~ too.o
0 52 6.~ Ml SS INC too.o -------- -------- ___ ,. __ ...
T£1TAL 800 100.0 too.o
fEAN 2.61~ VARIANCE 1.5~6
rALIO CASES 74fl HISSING CASFS 52
1

D~IVFR SUPVFY PF~PON~FS 09/29/82 PAf.£ ~2
FilE OPIVFR (CREATirN DATE z 09/29/~2)
052 RJOFR T~FN CO~PLAINS
RFLATIVE AOJUSTF ll CUMULATIVE AP ~OLUTf FREQUENCY FP.EQUFNCY AOJ FP£0
C"TEt[lPY LAPEL ((l[lf FPE~UENCY (PER CFNT J (PEP.CfNT J (PERCENT)
VERY PAPU.Y 1 170 21.2 23.9 23.9
PI RELY 2 156 19.~ 21.9 45.9
S)Hfl H'ES 3 216 27.0 30.4 76.2
OFTEN 4 97 J 2.1 13.{1 89.9
VERY (lfTfN 5 72 9.0 JO .J 100.0
0 89 J 1.1 MISSit.if. 100.0 ___ ._ ..... _ ... ------- ........ _._. __ TOTAL fOO too.o 100 .o
11ElN 2.t-~J VARIANCE 1.591
VALJfl CASES 711 MISSING CASES 89
(
(
(
'
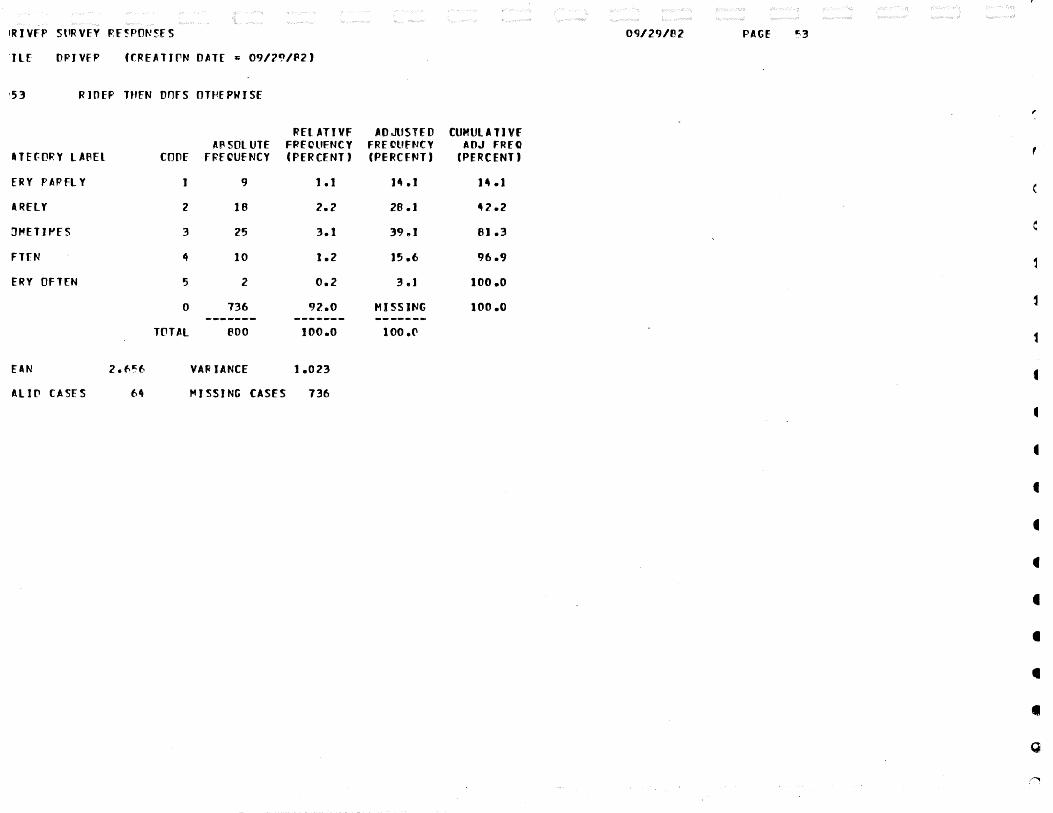
I
IIUVFP StiRVEY P.f~PONSES 09/29/E.i2 PAGE
'llf OPJVfP (CRfATirN OAT£ ~ 09/2~/~2)
'53 RJOEP THEN onrs OTP.fPWJSE
FfLATJVF ADJUSTED CUMULATIVF APSOLUTf FPECliFNCY FRE CllftJCY AOJ fR£0
ATEf-ORY LA~Et COOE FFECUFNCY (PERCENT J (PERCFNTJ (PERCENT)
ERY PAPFL Y 1 9 1 .t 14.1 14 .1
ARflY 2 18 2.2 28.1 42.2
!JHETJf'fS 3 25 3.1 39 81 81.3
FTEN 4 10 1.2 15.6 96.9
ERY OFTEN 5 2 0.2 3 .J 100.0
0 736 92.0 HISSING too.o -------- -------- ----------.
TflTAl eoo 100.0 100 .(\ 1
EAN 2.1-'56 VAPJANCE 1.023 t AliP CASES 64 HISSING CASES 736
• • • • • • Q

DRJVFR SURVEY RF~PO~SFS 09/29/13'2 PAtf ~4
FILE OPIVEP (fRE~TIUN O~Tf = 09/29/82)
054 HARO-fiSY,KfEP SCHEO.
RELATIVE ADJUSTED CUMULATIVE AP SOL Ulf FPfCUFNCY FREOUfNCY AOJ fRfO
Cl Tf CVRY L A13F L COOE fRfCUfNCY (PfRCFNT J (PEFCENTJ (PERCENT)
VERY EASY 1 92 11.5 12 .t 12 .J
EASY 2 187 23.4 24.6 36.7
NOT flJ FF IC ULT 3 359 44.9 41.2 83.8
DIFFICULT It 98 12.2 12.9 96.7
VERY HAPO 5 25 3.1 3.3 too.o
0 39 4.9 HI SSU!C too.o -.-------- _ _. ........... ____ ..... _. .. TOTAl AOO too.o too.o
MEAN 2.707 VARIANCE 0.905
VAllO C~ SfS 7~1 HISSING CASES 39
(
r

PI\GE !5
Fflf ORJVFP (fRFATJrN OATf c 09/2~/82)
RflATIVF AOJUSTFO CUHUlATJVf AP SOLUTE FREQlJ£NCY FRfCUftJfY AOJ FRFO
CATEGflRY l I.Pfl COllE FPECUENCY (PERCENT) (PfFCFP.~T) (PERCENT)
VERY f~SY 1 95 11.9 12.3 12.3
EASY 2 248 31.0 32e2 44.5
~OT OJFF JCUL T 3 334 41.7 43e3 ft7oft
H FF JCUL T 4 04 ]0.5 ]0 .CJ 98.7
VERY H~PO 5 10 1.2 J .3 100.,0
0 29 3.6 HISSINt 100.0 ~--~--- -------- ..,.._ ............
TOTAl eoo 100.0 100.0
~EAN 2.567 VAFIANCE 0.789
fAliO CASES 771 MISSING CASES 29
f
' '
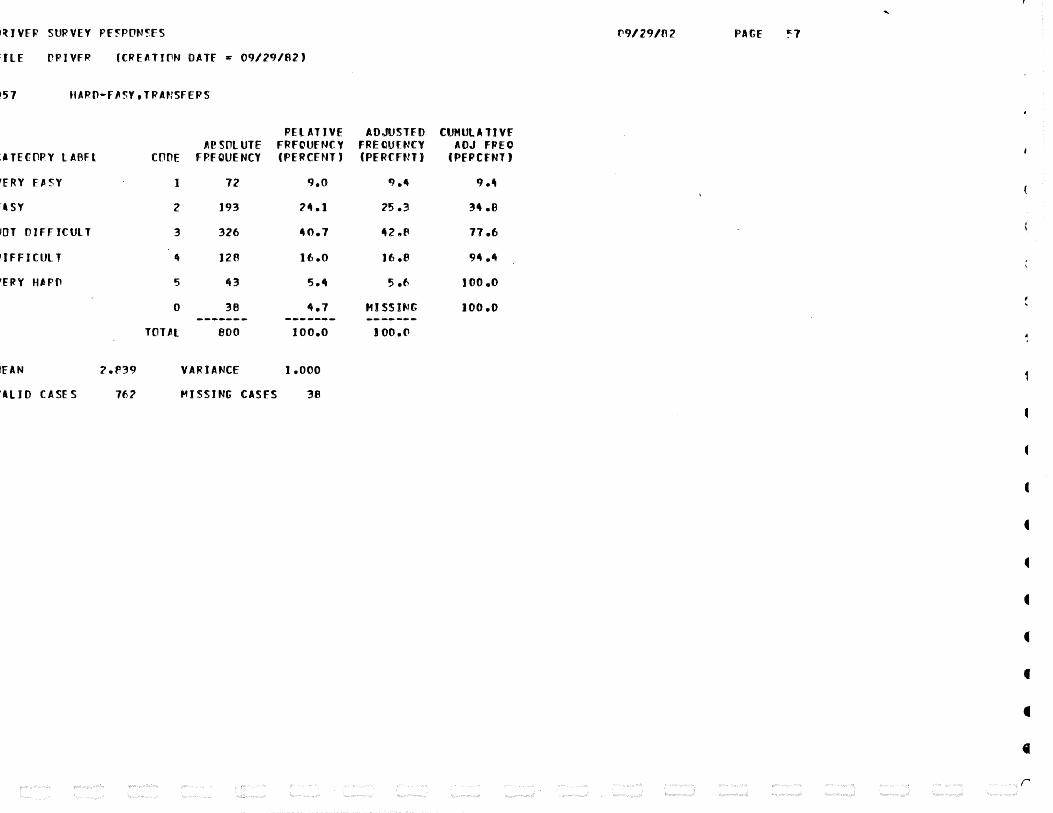
)~JVfP SURVEY Pf~PPN~fS {19/29/82 PAGE
DPI VFR (CRE~TI~N OATF = 09/29/82)
)57 HARO-F~SY,TFANSFEPS
PELATIVE AOJUSTFD CUHUlATJVf ~esot UTE FRFt'UfNf.Y FRECU£NCY ADJ FPEO
:ATEt£lPY lABFl COOE FPFQUENCY (!PERCENT J (PERfftH) (PEPCfNTJ
fERY f~SY 1 72 9.0 CJ.4 9.4
~· SY 2 193 24.1 25.3 34 .e
~ 0 T 0 I F F I C UL T 3 326 40.7 42e~ 77.6
~IFF I CUt T 4 12A 16.0 J6.e 94 ...
rEflY H~ PO 5 43 5.4 5.6 100.0
0 38 4.7 HJSSJNt 100.0 ...... ____ ---.-.---- ------.. TOTAL 800 too.o lOO.(l
lEAN 2.P3CJ VARIANCE ~.ooo
'ALID CASES 767 P.,JSSJNG CASES 38
•
• r
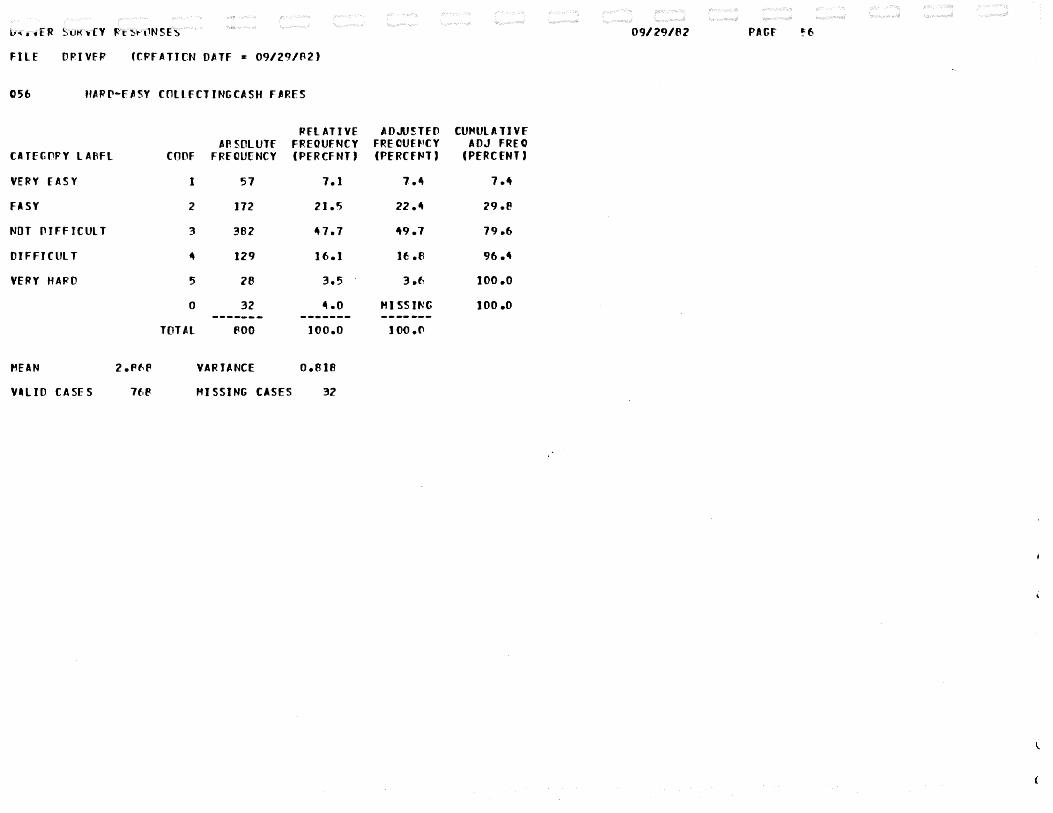
09/29/82 PAGE ~6
FILE OPI VfP CCPfATJCN OATF = 09/29/~2)
056 HAPr-FA5Y COLLFCTJNGCASH FARFS
RELATIVE AOJUSTfO CUHULATJVF AP. 50lUTf FREOUFNCY FRECUU'CY AOJ FREO
c•HEGf1PY l ABFl COOF FREQUENCY (PERCFNT J (PfRCFNTJ (PfRCENTJ
VERY EASY 1 57 7.1 1.~ 7.4
FASY 2 172 21.5 22.4 29.8
NOT ()JFFICULT 3 382 47.7 49.7 79.6
OIFFJCUl T 4 129 16.1 If .fl 96 ...
VERY HAf"O 5 28 3.5 3 .f. too.o
0 32 4.0 HISSJt.'G 100 .o ..... ____ .. --~---- -------
TOTAl flOO 1oo.o 100.(\
MEAN 2.Pf.P VARIANCE 0.818
VlLIO CASES 7foP HISSING CASES 32

DRJVER Sl'RVFY RFSPON~FS 09/'29/B2 PAGf 5P
FILE ORIVfP ff~fATirN OAlf z 09/29/8'2)
Q56 HAPP-FASY HELPING THE HANOJCAPPEO
RELATJVF ADJUST£0 CUMULATIVE Ae SOLUTF FREOUENCY FREOUFNCY ADJ FREQ
CA TE tOPY L A8Fl CODE FREQUENCY (PERCFNTJ fPERCfJ;l) (PERCENT)
VERY EASY 1 115 14.4 15 .J 15 .1
EASY 2 232 29.0 30.4 45.5
NOT ['J FF JCUl T 3 311 3P.9 40.fl 86.2
DIFFICULT 4 66 10.7 lJ .? 97.5
VERY HARD 5 19 2.4 2.5 100.0
0 37 4.6 HISS U't 100.0 ............ -. ... ------- .. ... ______
TOTAL BOO 100.0 lOO.fl
f'.EAN 2.~~1 VARIANCE 0.924
VALJ(l CASFS 763 Ml ~SING CASES 37
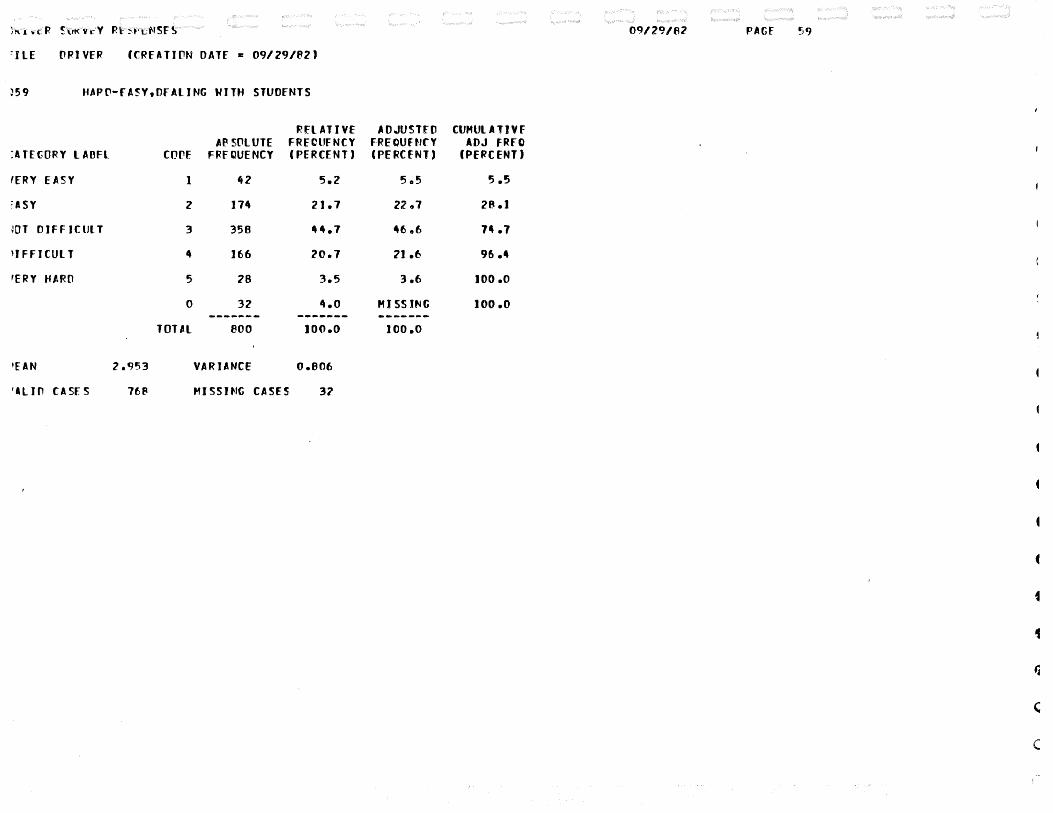
09/29/62 PAtE ~9
~ILE OP.I VER (CREATIPN OATf = 09/29/82)
l59 HAPP-fA5Y,OFALING WITH STUOFNTS
RELATIVE AOJU5T£0 CUHULATIVF AP S[llUTE FRECUFNCY FREOUFtlfY AOJ FRFO
:l TftORY l ABFL COPf FRFQUENCY (PERCENT) (PERCENT J (PERCENT)
fERY EASY 1 42 5.2 5.,5 5.5
=ASY 2 174 21.7 22s1 28.1
mT OIFF JCUL T 3 358 44.7 46 e6 74.1
lJfFICUL T 4 166 20.1 21.6 96.4
'fRY HARO 5 28 3.5 3.6 100 .o
0 32 4.0 Ml SS lNG 100 .o --- ......... -.. ................. ------- ... TOTIL 800 100.0 100.0
'EAN 2.'1!.)3 VARIANCE 0.606
'll 10 CASFS 768 MJSSJt-IG CASES 3?
c
' c

DRIVER SURVEY PFSPONSFS 09/29/A2 Pl!t£ f(l
filE OFJVFP (CRfATJrN OATf ~ 09/29/82)
060 HARD-fASY,HANrLJNG COMPLAINTS
Rfl-'lliVf AOJUSlfl'l CUHULA TIVf /.8 SOLUTE FPEOUfNCY fRE ()Uf "1CY AOJ FPFO
CATEtOPY tAPFl corr FPfQUfNCY (PfRCfNT J (PfRCfNTJ (PERCENT)
VERY EASY 1 59 7.4 7.P 1.e
flSY 2 JB7 23.4 24.6 32 .4
NOT OIFFICULT 3 364 45.5 47.CJ 80.3
DIFFICULT 4 128 16.0 16 .B 97.1
VERY HAJ?D ') 22 2.7 2.~ 100.0
0 40 5.0 MJSSJNt too.o __ ....,..... ____ -----..-- ----~--TOTAl 800 too.o tco.o
,.EAN 2.f25 VARIANCE 0.811
VALID CASES 760 MISSING CASES 40

I!UVER 5l1RVEY Rf~PPNSfS
llf ORIVER (CRE~TIPN O~Tf c 09/29/82)
·61 HARO-EASY • DEAL JNG ._, ITH OVERCROWOJNG
A TEtORY LABEL
ERY EASY
ASY
tJT fllFFICULT
I FFJCUL T
ERY HAPO
EAN 2.934
ALIO CASES 760
COPE
1
7
3
4
5
0
HHAL
RELATIVE Ae SOLUTE FREOUfNCY
FREQUENCY (PERCENT)
67 8.4
161 20. I
321 40.1
177 22.1
34 4.2
40 5.0 ---------- ...... -. ...... fOO 100.0
VARIANCE 0.973
MISSING CASES 40
(
09/29/82 PAGE f)
(
ADJUSTED CUMULA liVE fREOUfNCY AOJ fR£0 (PEFCfNT) CPfRCfNT J
e .r e .e
21.2 30.0
42.2 72 e2
23.3 95.5
4 .5 100 .o
HISSING 100 .o 1 .. ...... ___ _.
1oo.o 1
1
t
t
• • • • • •
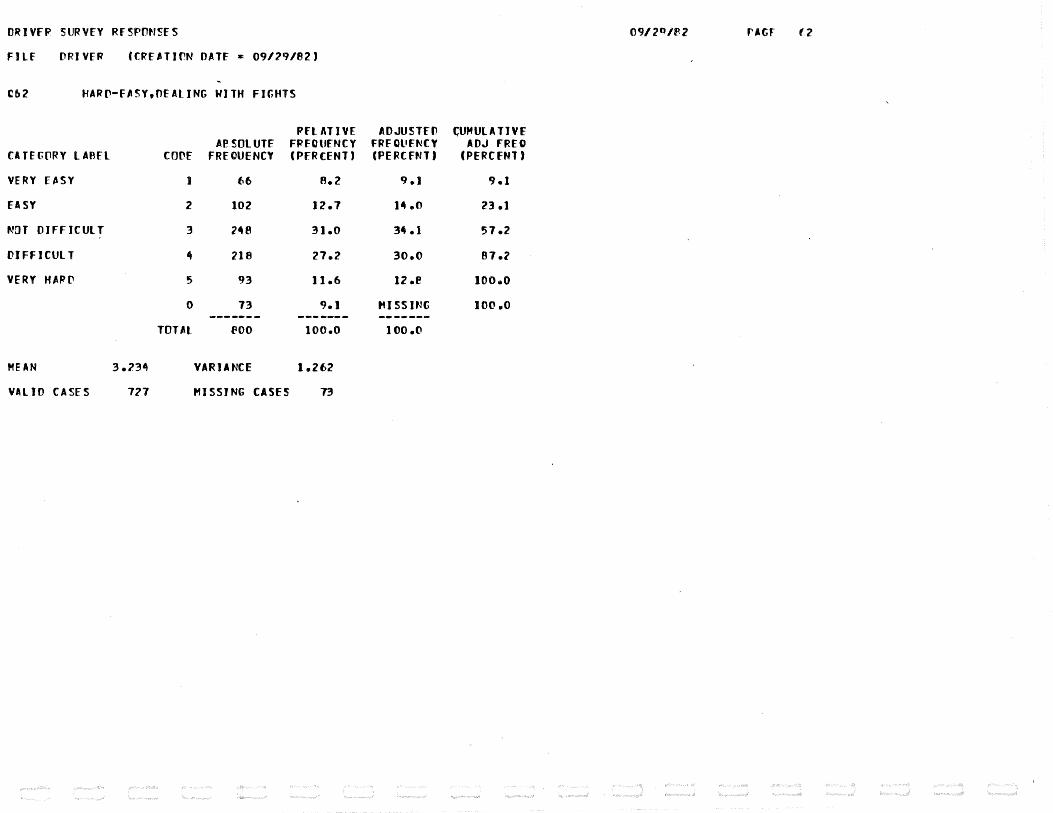
ORIVFR SURVEY RFSPONSES (2
FILE llRI Vff? (CREATIPN OATE c 09/29/62)
C62 HARll-FASY.OEALJNG WITH FIGHTS
Pfl AliVE AOJUST£0 (UMULATJVf AP. SOLUTE FREQUENCY FRFOl'ENCY AOJ FREO
ClTEtflRY LABFL COl'f fREOUENCY (PFRCENTJ (PERCENT J (PERCENT)
VERY fJISY 1 66 8.2 9.1 9.1
EASY 2 102 12.7 14 .o 23 .t
NDT OIFFJCUL T 3 248 31 .o 34 .J 57.2
IHFFJCULT 4 218 27.2 30.0 81.2
VERY HARl' 5 93 11.6 12 .e 100.0
0 73 9.1 tU SS INC 100.0 a.-. ....... _..., ................ _ ...............
TOTAL fOO too.o 1oo.o
MEAN 3.?34 VARIANCE 1.262
VAllO CASES 121 HISSING CASES 73

~RIVfR SUFVFY RESPONSES
ql£ ORJV[R (CRfATIPN OAT£ z 09/29/82)
)63 HARO-EA5Y, PAPERWORK
RflATJVF Af SOLUTE FREQUENCY
:ATE t[lRY l ABfl COOf FRFOUfNCY (PERffNT)
~fRY FASY 1 148 18.5
:A SY z 228 28.5
.JOT PJFFICULT 3 293 36.6
'tlfFJCULT 4 69 8.6
IERY HARO 5 23 2.9
0 39 4.9 -a.------ ----.. --TOTAL 800 100.0
~E AN 2.4f.? VARIANCE 1.002
fAl 10 CASES 761 HISSING CASES 39
AOJUSTEO FREOUENCY (PERCENT J
19.4
30.0
38.5
9 .J
3.0
MISSitiC --------1oo.o
CUMULATIVE AOJ FREQ
(PERCENT J
19.4
49.,4
87.9
97.0
100.0
100.0
('9/29/82 PAGF f3
, .
1
1

£\QIVFP. SURVEY FFSPONSFS 09/7.9/f.2
fllf ORJVEP {CRf~Tir.N DAlE • 09/29/82)
Q64 HARO-EA~Y, OEALJNG WITH SUPFRVJSOPS
RELATIVE AOJUSTFD CUMULATIVE ABSOLUTE FPEOUENCY FRE~UEt<CY AVJ FREO
c• TE tf!PY LABEL COVE FREQUENCY (PERCENT) (PERCENT) (PERCENT)
VERY FASY 1 191 23.9 26.8 26.8
EASY 2 243 30.4 34 .o t-o.a /
NrJT DJFF JCUL T 3 226 28.2 31.7 92.4
OIFFICULT 4 38 4.7 5.3 97.8
VERY HM~ 0 5 16 2.0 2.2 100.0
0 86 to. 1 HISS INC 100 .o ___ ._ ......... --------- ,. ............ TOT'L 800 ]00.0 100.0
MElN 2.?23 VARIANCE 0.950
VALID CASES 714 MISSING CASES 86
(
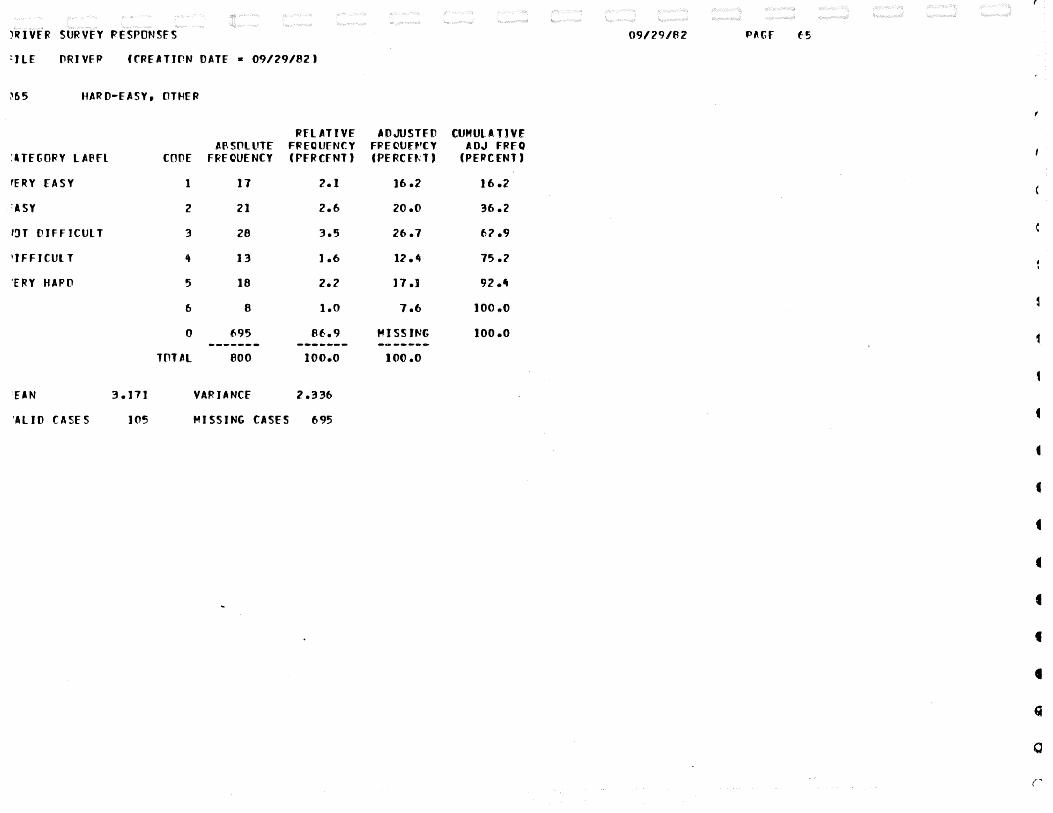
)~JV£R SURVFY PESPONSFS
=rLr (lRJVFP (fRFATJrN OATE • 09/29/82)
~65 HARO-fASY. OH-lER
:A TftOFY l A~FL
rERY EASY
I!JT 0 IFF JCUL T
'I FFJCUL T
'E'RY HAPO
'fAN
'AlJD CASES
3.171
105
(0(l£
1
2
3
4
5
6
0
TnT'l
RflATIVf A~ SOl liTE FREQUENCY
FRFOU£NCY (PFRCFNT J
17 2.1
21 2.6
28 3.5
13 1.6
18 2.2
8 1.0
(\95 Bf-.9 ..... -......... ...... -........ eoo 100.0
VARIANCE 2.336
MISSING CASES 695
09/29/62 P~tf f5
AOJUSTFD CUMULA TJV£ fPEOUft'CY ADJ FRFO (PERCft.'l J (PfPCfNT J
)6 .2 J 6.2
20.0 36.2
26.7 6?.9
12.4 75.2
17 .l 92 .~
7.6 JOO.O
MISSJfJC 100.0 .. c. ........ ~ ...
100.0
f
•

VRIVFP SURVfY RF~PPNSFS 09/2q/~2 PAtF f6
FILE PP. I Vff? ffREATION o.-.TF -= 09/29/82)
C66 FEFLJ~t~ TOWAPOS FARE SYSTEM MISUSE'
RELATIVE AOJUSTFO CUMULATIVE AI\ SOL Ulf FPfOU£NCY FRE OUFNCY AOJ FP.FO
Cl TE GOPY l APfl COOE FREQUENCY (PERCENT) (PfRCFNT J (PERCENT J
A~GRY TPY TO STPP 1 70 6.1 10.2 10.2
ANGRY OONT fNFORff 2 107 13.4 15 .fl 25.7
NEED NPN DRIVER ~ELP 3 226 26.2 32.8 58.6
f'IFOP. WASTEO EFFORT 4 29 3.6 4.2 62 eB
[lqJVER CANT 00 ~UC~ 5 39 4.9 5.7 68.5
NO MANAG. SUPPOPT 6 153 19.1 22.2 90.7
THREATENED VJ(llf~Jf.f 7 lt6 5.7 6.7 97.lt
OTHER 8 18 2.2 2.t:. 100.0
0 112 J It .o HISS INt 100 .o ...... _____ ------~- -------
TPTAL 800 100.0 100.0
MEAN 3.Pt-7 VAPJANCE 3.819
VAL IV CASE'S fPB ~ISSJNG CASES 112

09/29/82 P~f.f f7
CJlf rPI VFP ((~fAllON OATF : 09/29/62)
~67 RIOFPS FffliNtS TPWAFDS YOU CnNFPrNTING
REL /.liVE AOJUST£D ClfHULA 11Vf AP S(lL UTE Ffi'fOliFNf.Y rP.E C'l'ffJfY ADJ FREQ
~AlftCRY lAPEl CflOE FREQUENCY (PEP'CfNT J (PfF'CfNTJ (PERCENT)
H4CFR AT CHFATFP 1 79 9.9 10.6 10.6
'ISAPPROVF CHEATFP 2 362 45.2 46.1 59.3
~0 RESPONSE 3 245 30.6 32.~ 92.2
)J SArPROVE 0~ JVEP 4 51 6.4 6.9 99.1
iliPPORT CHFATFR 5 6 0.7 o.P 99.9
6 1 o.t 0 .J JOO .o
0 56 7.0 HISS INC too.o ---............. ........ -...... ___ _. ....... TOTAl eoo 100.0 1 ()0 .o
lEAN 2.?CJO VARIANCE 0.653
'lliO CASES 744 HISSING CASES 56
1
1
c
c

l'R I VFR SURVEY RESPONSES 09/2q/f32 PAtF ffl
FilE DRIVER (CRflTirN OAT£ = 09/29/132)
068 WILL SSFC 8F AN IHPR(lVfHENT
RELATIVE ADJUSTED CUMULA liVE ABSOlUTE FREQUENCY FRECUft-.'CY ADJ FREO
CATfC(lRY l Af\fl COPE FREQUENCY (PERCENT) (PEPCfNT) (PERCFNT J
YES 1 f>28 78.S 85 .J 85 .t
NO 2 93 11.6 12.6 97.7
3 6 0.7 O.f 9A .5
4 2 0.2 0.3 98.8
5 4 0.5 0.5 99.3
6 5 0.6 0.7 1oo.o
0 62 1.1 HISS INC too.o ........... -. ... __ .. _ ..... _. ...... -....... TOT'l BOO 1oo.o too.o
t'EAN 1.20f VARIANCE 0.397
VAliD CASES 73f MISSING CASFS f>2
{
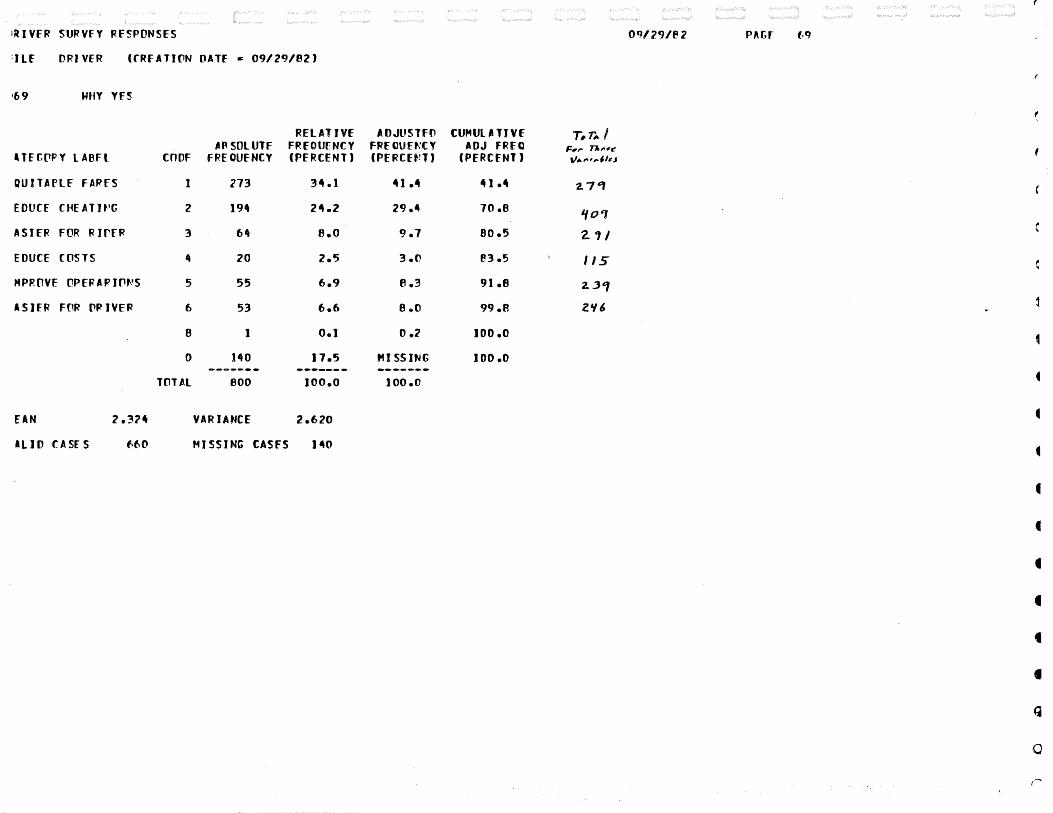
IRJVER SURVFY RESPONSES
DRIVER (fRFATJPN OATf s 09/29/82)
169 WtfY YfS
l TECPPY lABEL
OUITAPLF FARFS
EDUCE CUE ATH'G
ASIER FOR RJrfR
EDUCE COSTS
HPP.OVf OPERAPIP~S
A S If R F flR [lR IV E R
EAN 2.3?4
ALIO fASE S f.60
COOF
]
2
3
4
5
6
8
0
TOTAl
RELATIVE t.l' SOLUTF FP.EOU[NCY
FREQUENCY (PERCENT)
273 34.1
194 24.2
64 e.o
20 2.'.)
55 6.9
53 6.6
1 o.t
140 17.5 --~~--- ... ..................
BOO too.o
VARIANCE 2.620
HISSING CASES 140
(
09/29/f2
ADJUSlFV CUMUL- TJVE T, r,. I FRECUf~CY AOJ fRFO l!rr .,-,,. .. lit (PERCEt-!T) (PERCENT) v.,.,,.#le.s
41 .4 41 .4 '2.7t:f
29.4 70.8 lfo~
9.7 80.5 2. 1 I
3.0 P.3 .5 I IS
e .3 91.8 2.3'
8.o 99.A Z'16
0.2 too.o
MISS INC too.o ....... -......... JOO.C
c
•
• •
a (-..

OQIVER SURVEY PE~PONSES 09/'29/f.2 70
Fllf OPJ VfP (CPF~TJUN DATE = 09/29/8'2)
C.HO WHY YES
RELATIVE AOJUSTFO CUHULATJVf AP SOLUTF FRECUENCY FREOUENCY ADJ FRfO
CA TE GPRY l APFl. C[l(}f FRECUENCY (PERCENT) (PEPCENT) (PERCENT)
EOUITAetf FARES 1 5 0.6 1 .o 1 .o
REDUCE CHEATING 2 210 26.2 ~0 .5 41 .5
EASJFR FOR RJ[lffi' 3 104 13.0 20.1 61.6
RFOUff COSTS ~ 41 5.1 7.9 69.5
IMPROVE OPERARIO~S 5 95 11.9 18.3 rn.e
~ASIER FQR ORJVFP 6 63 7.9 12.2 100.0
0 282 ..... 35.2 HISSJNt 100.0 ------~ -------- ---------.
TOTAL 800 too.o too.o
MEAN 3.38f. VARIANCE 2.207
UlJ[l CASES !ilP HISSING CASES 282
{
(
(

O~JV£R SURVFY P.FSPPNSFS 09/29/132 PAtE 71
FilE ORIVF~ (CRFATI~N DATE c 09/29/82)
~71 WHY YFS
RELATIVE AOJUSTFD CUMUlATIVE AA SOlUTF FPEOlffNCY Ff?f QUF~JCY AOJ FREO
Cl Tft~RY lA£\Fl COPE FREQUENCY (PERCENT) (PEFCFNTJ (PERCENT J
~~UJTAPLE FARES 1 1 o.1 0.2 0.2
~:oucr CHEATING 2 5 0.6 1.2 1 .5
:AS I FR FOR RJOfR 3 123 15.4 30.6 32 .J
~EOUCF COSTS 4 54 6.7 13 .~ 45.5
IMPROVE OPERARJONS 5 89 1 J .t 22.1 ft7.7
:ASIFP FOR ORJVfF 6 130 16.2 32.3 100.0
0 398 ~9.7 MISSJt-JC 100.0 -.................. .. ..... _ ....... .... .... ______
TOTAl BOO 1oo.o l co .o
•EAN ~.!30 VARIANCE 1.6)6
flliD CASES •o2 .. ISSJNG CASES 39P.
' c

O~IVFR SURVEY Pf~PONSES 09/29/f2 PAtf 12
FILE DRIVER fCREATIPN OAT£ • 09/29/62)
072 WHY NO
RELATIVF AOJUSTFO CUMULATIVE r-r,./.J ~eSOLUTE FR£0UENCY FRE ('lJft-'C Y AOJ FRfO ) a .. ,,r,·,.,J ClTftOf"Y LABEL CODE FREQUENCY (PERCENT) (PERCENT) (PERCENT) ,:,.., . .,
FARE HltH 1 18 2.2 23.4 23.4 18" J~CRfASE CHEATJNC 2 31 3.9 40.3 63.6 H3 TOO COMPLICATED 3 14 1.7 18.2 81.8
'12. TOO FXPF~IS IVF 4 3 0.4 3.9 85.7 12-POOR fOUIPHENT 5 2 0.2 ?.f:. 88.3 8' HARDfR FPR DRIVFP 6 9 1.1 11.7 100 .o I!
0 723 90.4 MISSING too.o --------- -------- ---- ... --.
TOTAL eoo 100.0 1 ()0 .o
..,E Atl 2.~71 VARIANCE 2.360
VALID CASES 11 MISSING CASES 723

' ·RIVFF StiRVfY P£5PON5FS 09/29/B2 PAt£ 73
ILE ORIVEP (CPf~TIUN OATf c 09/29/62) ('
73 WHY N[l
' RELATIVE AOJUSTEO CUMULA TJVE
~ A~ SOLUTE FREOUENCY FRECUfNCY ADJ FREO
A TEGf'PY l ~fFl COPE FFFCUENCY fPERC£NTJ (PERCENT) (PERCENT)
NCREASE CHEATJNf- 2 12 1.5 31 .6 31 .~ ~
00 C0f4PLIC~Tf(l 3 19 2.4 50.0 e1 .6
no fXPFNSIVF 4 5 0.6 13.2 94.7 ~
OOR f(lll IP MENT 5 1 o.t 2.6 97.4 ~
lRDFR FOR OPIVff.' 6 1 o.t 2 .fl 100.0
0 762 95.2 fofiSSJNt 100 .o 1 ----.. --- -------- --.-.----
TOTAl fOO too.o tco.o ~
EAN 2.947 VAPJANCE o.eoe t llJO CASES 3P. MISSING CASES 762
t
• • t
t
I
t
' Q
0
(""

DRIVFR SURVFY Rf~PONSES 09/29/82 r~tF 74
FilE ORIV£P (CRf~TJON DATE c 09/29/82)
074 WHY Nl1
PflATIVE AOJUSTFO CUMULATIVE AP SOLUTE FREOUENCY FRf QUfttCY AOJ FRFO
CllftORY lAAEL COOF FREQUENCY (PERCENT) CPERCFNTJ (PfRCENTJ
TOO COt-'PLJCATfP 3 9 1.1 36 .o 36.0
T!lO FXPfNSIVf 4 4 0.5 IE .o 52.0
POOR fOUIPMFNT 5 5 0.6 20.0 72.0
HlROER FOR DPJVfR 6 7 0.9 28.0 1oo.o
0 775 96.9 MISSING too.o .......... -...... ....... ____ .. _. ............. TOTAl 800 100.0 100.0
14EAN 4.400 VARIANCE 1.583
ULIO CASES ?~ HI ss·r NG CASES 775

u~JYfF ~URVEY Rf~PON5fS 09/29/e2 PAtF 75
FILE OPJVEP. (CREATJPN OATf = 09/2q/62)
075 E~PLOY~fNT ST~TUS
RELATIVE ADJUSTED CUHULA liVE AL' SOLUTE FREQUENCY FRE()UfNCY ADJ FREO
fl TEGOPY LABFL COOE FP-EOUENCY (PFRCFNT) (PERCENT J fPERCFNT)
FULL Tlf-1£ 1 580 72.'5 74 .J 74.1
FULL TI~E EXTR' 2 202 25.2 25 .e 99.9
141 Nl FUN 3 1 o.1 0.1 1oo.o
0 17 2.1 HISSING 100.0 -__ ..,,__ ...... -------- ---------TOTAL BOO 100.0 too.o
~E AN 1. ?f· 1 VARIANCE 0.195
fALIO CASES 7P3 MISSING CASES 17

~RIVER SURVFY Rf~PPNSfS 09/29/82 PAf,f 76
FILE DRI VFP. (fRFATION OATf ~ 09/29/AZ)
076 AGF
RFLATJVE ADJUSTED CUMULATIVE AP SOLUTf FRfCllfNCY FRfCUFNfY AOJ FRFO
ClTft['P.Y LAPFI COOF FREQUENCY (PERCENT) CPERCENTJ (PERCENT)
U~OFF' 30 1 104 ) 3.0 13.5 13.5
31-39 2 295 36.9 38.3 51.e
40-49 3 ?26 ?f...2 29 .~ 81.2
5~-59 4 121 15.1 15.7 96.9
OVER 60 5 24 3.0 3 .J 100.0
0 30 3.7 fofl SS INt too.o ______ ... ___ ..,..,_., __ ... _____
TPTAl BOO 100.0 100.0
ME At1 2.~66 VAR I At-ICE t.ote
VllJO CASES 110 HISSING CASES 30
(
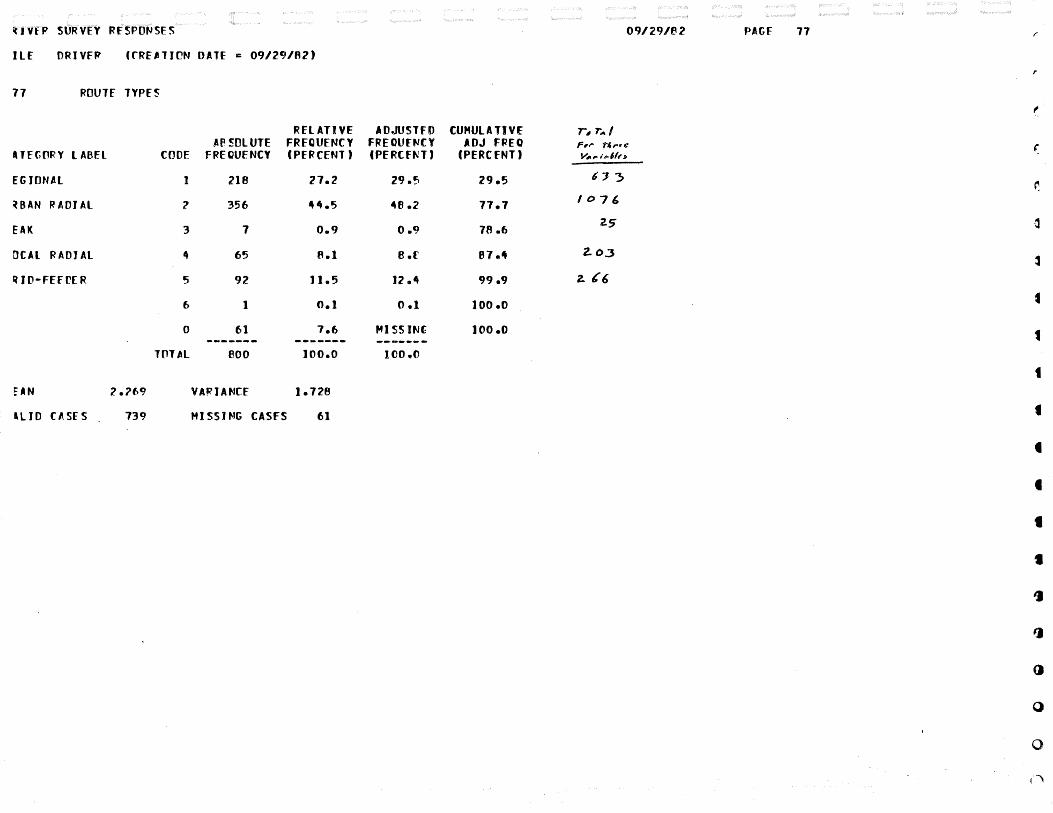
~IVEP SURVEY RfSPONSES 09/29/B2 PAGE 77
ILE ORIVFP (fRf~TJON OATf = 09/29/A2J r
77 ROUTE TYPE~
f
RELATIVE AOJUSTFD CUMULATIVE r~ r""l AP 50LUTE FREQUENCY FRECUfNCY ADJ FREO F~rr N,.,.e
l TEGORY LABEL COOE FREQUENCY (PERCENT) (PERCf~T J (PERC fNT) v.,. ... ,6>11,,
EGIONAL 1 218 21.2 29.5 29.5 6 :J 3
~BAN RADIAL ? 356 44.5 48.2 11.1 /071>
EAK 3 1 0.9 o.CJ 7A .6 2.5
OCAL RADIAL 4 65 8.1 e .r 87 e4 Z.0.3
IHO-Fffr£ R 5 92 11.5 12.4 99.9 2. 66
6 1 o.1 0 .1 ]00 .o
0 61 7.6 f41SSJNC? too.o __ .. ,... ...... ................. .. ........ -. ... TOTAL eoo too.o too.o
t ~AN 2.76CJ VARIA.ICf 1.728
aLtO CASES 739 HISSING CASFS 61
t
t
t
I
0

oqJVf~ ~URVEY RFSPONSFS 09/29/P2 PAtf 7P.
fiLE ORIVER ffP£ATJnN o~rr = 09/29/82)
C78 ROl1Tf TYPFS
RELATIVE AOJUSTFO CUMULATIVE A~ SOLUTE FREOUENCY FRE CUEt-!CY AOJ FREO
flTEGCPY L A8fl COllF FFfOUENCY (PERCENT) (PERCENT J (PERCENT J
~EGIPNAL 1 221 27.6 30 .o 30.0
lll~8 AN R AOI AL 2 362 4 5.2 49 .J 79 .J
PEAk 3 10 1.2 1 .4 80.5
LOCAL RADIAL 4 60 7.5 6 .J 88.6
G~ J 0-FFFOF R 5 84 10.5 11 .4 100.0
0 63 7.9 MISSING 100.0 --------- -.------ .... _.., ___ TOTAL 800 100.0 100.0
~EAN 2.2JP. VARIANCE 1.619
VAL JO CASFS 737 HISSING CASES 63
'··
'

D~IVER SURVEY RfSPONSfS 09/?CJ/82 PAGF 79
FILE ORIVfR (fRfATIPN OATF a 09/29/A2)
079 ROUTE TYPES
RELATIVf AOJUSlfD CUHULATJVF AP SOLUTE FRECUENCY FREQUENCY ADJ FRFC
r•TEtORY l APFL fOPF FPECUENCY (PERCENT) (PERCftJT J (PfRCENTJ
REGJ£1NAL 1 19~ 2~.2 26.f, 26.6
L'~BAN R MH AL 2 358 4~.7 49.1 75.7
PEAK 3 8 1.0 J .J 76.8
lOCAL RAOIAL 4 78 9.7 ]0.7 e7.5
l.R I O-Ff fOE R 5 90 11.2 12.3 99.9
6 ] o.1 0.1 100 .o
0 71 e.9 HISSJN(; 100 .o ------- ... ------ ..................... TOT~[ 800 100.0 J ()0 .o
1EAN 2.3?5 VARIANCE 1.72P
Ill JD f~ SES 729 HISSING CASES 71
1
D. TRI-MET FARE COMPLIANCE SURVEY AND ANALYSIS
D.l

TRI-r~ET
SELF-SERVICE FARE COLLECTION PRE-IMPLEMENTATION FARE COMPLIANCE STUDY
r~AY 1982
Management Information and Analysis Debra Hardmeyer Philip Selinger
November 15, 1982
PRE-SELF-SERVICE FARE COLLECTION
FARE COMPLIANCE STUDY
Introduction
The collection of fares has always been a difficult but essential part of public transit service operation. Many means have been tried--some more successfully than others. The more successful methods have generally been the ~ost expensive, usually due to labor costs (conductors), provision of structural barriers (turnstiles) or time delays (drivers). As shown in Figure 1, there is a direct trade-off between the fare collection level of effort and the loss of fare revenues due to fare violations. It is desirable for transit operators to ~inimize both the fare collection effort and the number of undetected fare violations.
North American bus transit operators have generally used fareboxes to collect fare, with payment checked by the bus driver. This approach is a practical one, but is not without problems. Drivers cannot always count a passenger's coin payment to verify correct fare payment; they must check many fares in a short time; they do not have time to closely check passes or transfers for misuse or counterfeit use; and in zone systems, they cannot always track the passenger's length of travel. The introduction of electronic registering fareboxes makes counting change easier, but other problems remain and electronic fareboxes are expensive. Transit operators, however, have come to largely accept these flaws and the accompanying loss of transit fare revenue. Fare revenue losses, depending on the capacity of the fare structure, are not usually assumed to be great.
Faced v1ith similar problems, many European transit operators have approached the fare collection task with the introduction of Self-Service Fare Collection, where the responsibility for correct fare payment is turned over to the transit rider. Realizing that riders will not always comply with the fare system, they are randomly spot-checked, unannounced by a fare inspector who issues penalties for incorrect or non-payment of fare. In Europe and, to a lesser extent, in North America, it was found that this method was closer to the optimization of minimal collection effort and minimal fare violation. The system made operations more efficient by allowing drivers to focus attention on operating the bus and by allowing passengers to enter or leave the bus by any door. Peer pressure and inspectors were able to minimize non-compliance with the fare system.
With the objective of improving the operation of large capacity articulated buses and light rail trains, Tri-Met has turned to self-service fare collection, the first application of such a system to bus operations in North America. While significant operational benefits are expected, it is hop ·d that, despite fears of many transit operators, the level of fare compliance would remain the same or even improve.

FIGURE 1
FARE COLLECT!O~~ EXPENDITURE TRADE-OFF
$
LOST
FARE
REVENUES
Minimum Cost
FARE COLLECTION EXPENDITURES
(Fareboxes, Conductors, Turnstiles, Operating Time)
$

~hile it was known that people do violate the fare system, no one at Tri-Met knew how much fare evasion was occurring and, in fact, there was very little such infon1ation anywhere in the United States~ A quick study rad been conducted at Tri-Met using drivers, which placed the violation rate at about nine percent, but the study was not considered to be particularly accurate.
In anticipation of the new far~e collection system at Tri-Met and, as part of its evaluation, a pre-Self-Service Fare Collection Fare Compliance Study was initiated to measure the extent of the fare evasion problem. It was quickly realized that the greatest barrier to conducting such a study was collecting violation data without violators knowing that they were being checked more closely than they usually were. It was recognized that drivers are often unable to spot violations and do not always confront riders when they spot one. On a survey conducted in Spring, 1982, Tri-Met operators said, on the average, that they ''sometimes" confront a rider who cheats the fare system. A fare compliance study, then, would require closer scrutiny of fare payment and a complete recording of all violations, no matter hovJ small or what the excusee For Tri--t··1et, the task included checking for fare zone travel and checking for counterfeit passes, which had already been identified as a problem. A postSelf-Service Fare Collection Fare Compliance Study would be easier to conduct since fare inspe~tors would be a direct source of data.
The pre-Self-Service Fare Collection phase of the Fare Compliance Study, conducted in May, 1982, was designed with three objectives:
1. To determine systemwide incidence of fare evasion.
2. To estimate loss in revenue from fare evasion.
3. To establish a basis for estimating the impact of Self-Service Fare Collection on fare evasion at Tri-Met.
This paper discusses the design and results of the pre-implementation portion of the Fare Compliance Study.
2


T r i - i, i e t Fa r e S t r u c t u r e
The extent and form of fare evasion is very much dependent on the fare structure and, to some extent, the design of transit routes. Tri-Met's fare structure prior to the introduction of Self-Service Fare Collection included cash fares, monthly transit passes, prepaid tickets and transfer slips. A three-zone fare system (Figure 2) consisted of an inner zone (central business district), an urban zone (most of the city of Portland) and a suburban/rural zone. TvJo-zone travel required a $.65 base cash fare and a premium cash fare of $.90 ·r~as charged for three-zone travel. Travel within the 300-square-block inner zone was free (Fareless Square) except from 3:00 to 7:00 PM when full b a s e fare ~,, .. a s r e q u i red . T ran s f e r s were pro v i de d free of c h a r g e , but were not valid for return travel. Special fare was avail able for senior citizens, handicapped persons and students. Payment was made on entering the bus inbound and when leaving the bus outbound, except from 3:00 to 7:00PM when all fares were paid upon entering the bus. Fares were always paid on entering the bus on crosstown routes.
TRI -t~iET FARES
The Tri-Met district is divided into three fare zones.
Fareless Square in Downtown Portland is Zone 1. N.W. Hoyt St. is the boundary to the north. The Willamette River is the boundary to the east. The Stadium Freeway is the boundary to the south and west.
The outer boundary between Zones 2 and 3 is at a designated point for each route.
Fare Structure:
Monthly Pass (Vancouver- Portland) Monthly Pass (travel through 3 zones) ~~ o n t h 1 y P a s s ( t r ave 1 t h r o u g h 2 zones ) Youth Pass (monthly pass for youths through
high sc ho o 1 ) Adults (travel through 3 zones) Adults (travel through 2 zones) Youth Fare (through high school)
Children under six years ride free with a fare-paying passenger. Limit of three children per passenger.
Vancouver-Portland (all other trips on Line 5 are $.65)
$35.00 $29.00 $21.00
$14.00 $ .90 $ .65 $ .45
s 1.00
. '

The use of the various types of fare payment for Spring, 1982 is shown in Table 1. A large percentage of Tri-Met riders used a monthly pass (44~). Slightly over half (53~~) paid cash. A small percentage of the ridership rode free in Fareless Square (1.5~~), used special employee or ~~ultnomah County passes or were assumed to evade fare payment (1%). Three-zone riders accounted for 24% of total ridership. Saturday ridership is characterized with a higher percentage of cash riders and fewer three-zone riders.
Cash Pass Three-Zone
A 11 Day
53 44 24
T /I.BLE 1
SYSTEMWIDE FARE CATEGORY DISTRIBUTION
WEEKDAY
Daybase
54 43 23
Peak
52 44 26
SATURDAY
All Day
60 38 1.5
Estimates shown in Table 1 are based on driver rider counts and fare revenues received. They use a conservative one-percent evasion rate. A detailed report of Fare Category Distribution for Spring, 1982 is included in the appendix.
The fare system in use at Tri-Met includes the use of zone-premium fares and monthly passes. Some transit agencies have eased the fare collection effort by eliminating these features. Both are difficult for the driver to enforce since passes are quickly flashed and drivers are unable to check zonal travel of many riders. The counterfeiting of monthly passes has been a recent concern of Tri-Met's Transit Police. Despite enforcement difficulties, the monthly pass is a great user convenience and reduces processing of coins by Tri-Met. A zone structure is desirable as it helps relate fares to distance traveled. Equity of fare payment has, in the past, been an issue with Tri-Met riders and local government.
Methodology
The task of doing fare checks of all riders for all types of violations is a formidable one when the fare structure includes zone payment and use of passes, particularly during rush hours. To ease this task, types of fare evasion v-1ere grouped and checked separately. These groups are:
Cash Evasion: passengers who shortchange the base cash fare, use an invalid transrer s11p, use coin slugs or half-dollar bills, or make no payment at all.
2

Pass Evasion: passengers who use a fraudulent (counterfeit) pass or who misuse a-pass rr~ adult using a student pass).
Zone Evasion: passengers 'r'lho travel through three zones but only pay for two zones or travel.
Instruction and tally sheets were designed for data particular to each type of evasion. The study utilized volunteer drivers and fare-inspectors-in-training for checking fare payment and recording evasion data. The methodology is summarized as follows:
Cash Check: The bus operator was responsible for recording the total number of cash-pay1ng passengers and those passengers who evaded the cash fare by shortchanging the farebox, not paying the fare, using bad cash or using an invalid transfer slip. This check required close inspection of money deposited into the fa r~ebox.
Zone Check: A fare inspector and operator worked as a team to identify the number ot riders who traveled three zones. Through this identification process, the fare inspector was able to take a count of those riders who paid for two-zone travel and rode three zones. A count was also taken of total threezone riders.
Pass Check: A uniformed fare inspector made an inspection of all passes that were d1splayed by the rider upon boarding. It was only possible to inspect passes when the mode of fare payment was "pay as you enter".
Driver Selection
In order to get an accurate picture of fare evasion, it is necessary to observe passenger behavior, introducing as little disruption as possible to the regular flow of operation. Therefore, regular route operators were selected to be responsible for collecting the data. It was necessary for fare inspectors to work with the operators in the zone and pass check.
Only operators who had indicated an interest in assisting with the study were considered (about one-half of the operators). A random selection of those drivers was made based on their work assignments, until the predetermined sample size was covered.
Once the operator and trip selections were completed, the types of checks that the operator 'tlas responsible for were detennined. Each bus route in the sample was assigned a cash, zone and/or pass check by (a) the number of days the operator had the route as a work assignment, and (b) the number of zones the route transversed. The cash check was taken during the first week followed by the zone and pass check in the second week.
Sample Determination
The sample for each of the three checks was based on five percent of trips selected randomly among those driven by volunteer drivers. A trip is defined as travel from one end of the route to the other end (one-half of a round trip). The time of day sampled was broken down into three categories: AM Peak (7:00- 9:00AM); Daybase (9:00AM-4:00PM), and PM Peak (4:00- 6:00PM).
3
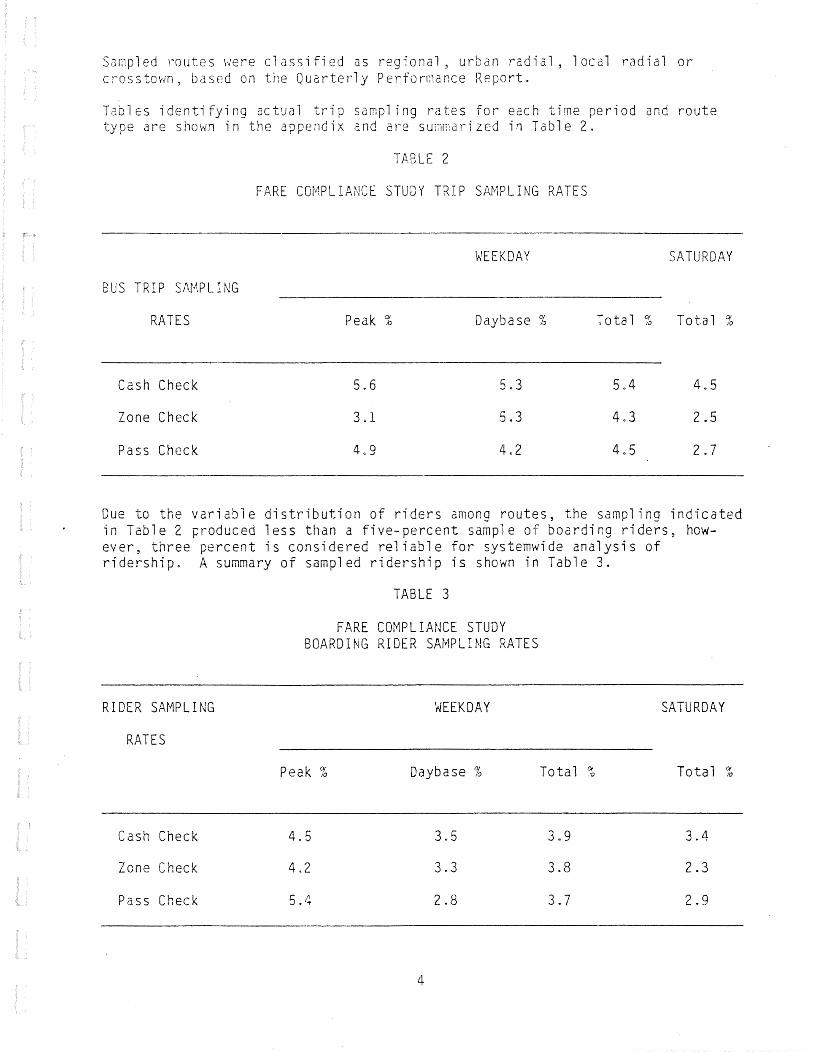
Sampled routes v:ere classified as reg~onal, urban radial, local radial or crosstown, based on the Quarterly Performance Report.
Tables identifying actual trip sampling rates for each time period and route type are shown in the appendix and are summarized in Table 2.
TA.BLE 2
FARE COMPLIANCE STUDY TRIP SAMPLING RATES
WEEKDAY SATURDAY
BUS TRIP SAMPLING
RATES Peak % Daybase % Total % Total %
Cash Check 5.6 5.3 5.4 4.5
Zone Check 3.1 5.3 4.3 2.5
Pass Check 4.9 4.2
Due to the variable distribution of riders among routes, the sampling indicated in Table 2 produced less than a five-percent sample of boarding riders, however, three percent is considered reliable for systemwide analysis of ridership. A summary of sampled ridership is shown in Table 3.
RIDER SAMPLU~G
RATES
Cash Check
Zone Check
Pass Check
TABLE 3
FARE COMPLIANCE STUDY BOARDING RIDER SAMPLING RATES
Peak %
4.5
4.2
5.4
WEEKDAY
Daybase ~0
4
3.5
3.3
2.8
Total %
3.9
3.8
3.7
SATURDAY
Total %
3.4
2.3
2.9

Results
A tabul2tion of results, inc-luded in the appendix, shov1s actual numbers of riders observed and numbers of fare violations. This data was transformed as percentages presented in the following summary tables.
The results of this study indicate an.evasion rate between eight and nine percent. One out of every 12 bus riders evade the fare to some extent, intentionally or unknowingly. Most evasion was in the form of shortchanging the fa·rebox or failure to pay for travel beyond two fare zones. Table 4 shows the evasion rate amor~g all riders for each fare category.
TABLE 4
F f\RE EVASION AS PERCENT OF TOTAL RIDERSHIP
Cash Zone Pass Total
Weekday 3.1 4.0 1.0 8.1
Saturday 3.1 4.6 0.7 8.4
There is little variation between weekday and ·saturday evasion rates, with Saturdays exp~riencing slightly higher zone evasion and lower pass evasion, due to different ridership patterns and demographics. Pass evasion is a small portion of the number of fare evasions, but as noted later, accounts for a large portion of lost revenue.
TABLE S
\~EEKDA.Y PERCENT FARE EVASION BY TIME OF DAY
Cash Zone Pass
Peak Hour 3.4 2.3 1.0
Daybase 2.9 5.4 1.0
Table 5 shows the fare evasion rate by time of day. While there is no variation in pass evasion rates, there are significantly greater zone evasions during the daybase period. This may in part be explained by more varied ridership habits with riders less knowledgeable of the zone boundaries. Cash evasion during the daybase is one-half of one percent less than during the peak period, perhaps because drivers have more time to inspect cash fares as they are deposited.
5
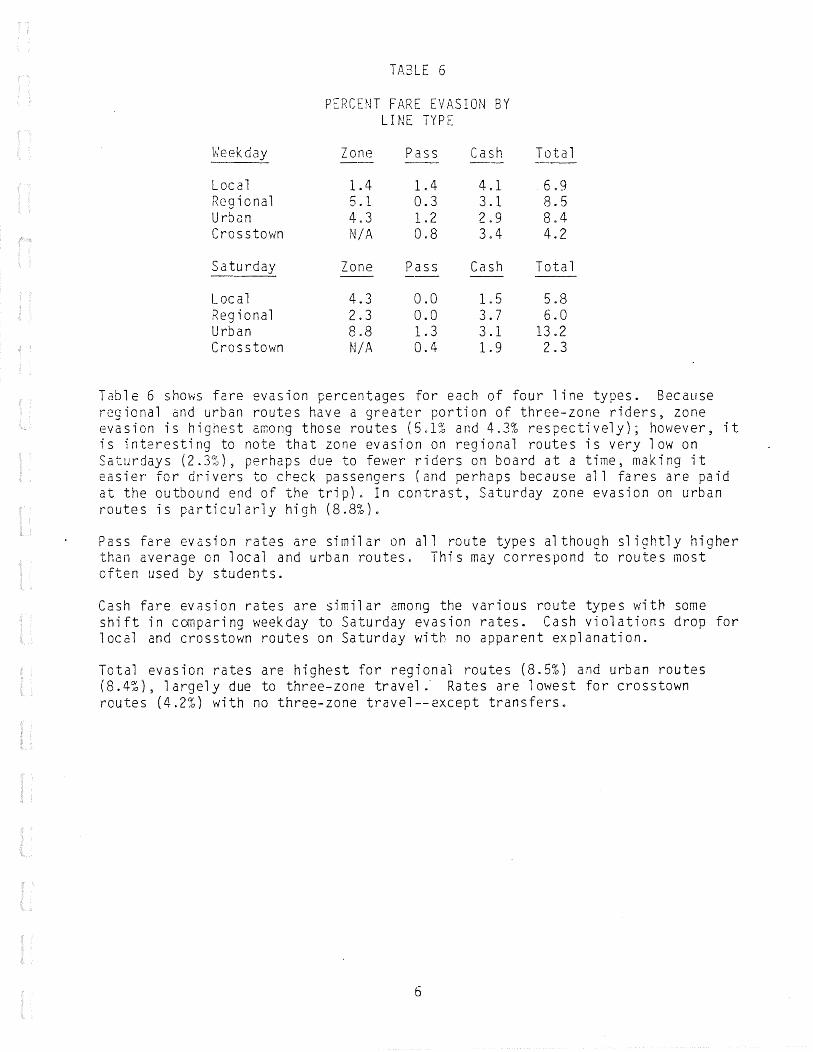
TJ\BLE 6
PERCENT FARE EVASION BY LINE TYPE
1-o,'eekday Zone Pass Cash Tot a 1
Local 1.4 1.4 4.1 6.9 Regional 5.1 0.3 3.1 8.5 Urban 4.3 1. 2 2.9 8.4 Crosstown N/A 0.8 3.4 4.2
Saturday Zone Pass Cash Total
Local 4.3 0.0 1.5 5.8 Regional 2.3 0.0 3.7 6.0 Urban 8.8 1.3 3.1 13.2 Crosstown N/A 0.4 1.9 2.3
Table 6 shows fare evasion percentages for each of four line types. Because regional and urban routes have a greater portion of three-zone riders, zone evasion is highest among those routes (5.1% and 4.3% respectively); however, it is interesting to note that zone evasion on regional routes is very low on Saturdays (2.3%), perhaps due to fewer riders on board at a time, making it easier for drivers to check passengers (and perhaps because all fares are paid at the outbound end of the trip). In contrast, Saturday zone evasion on urban routes is particularly high (8.8%).
Pass fare evasion rates are similar on all route types although slightly higher than average on local and urban routes. This may correspond to routes most often used by students.
Cash fare evasion rates are similar among the various route types with some shift in comparing weekday to Saturday evasion rates. Cash violations drop for local and crosstown routes on Saturday with no apparent explanation.
Total evasion rates are highest for regional routes (8.5%) and urban routes (8.4%), largely due to three-zone travel. Rates are lowest for crosstown routes (4.2%) with no three-zone travel--except transfers.
6
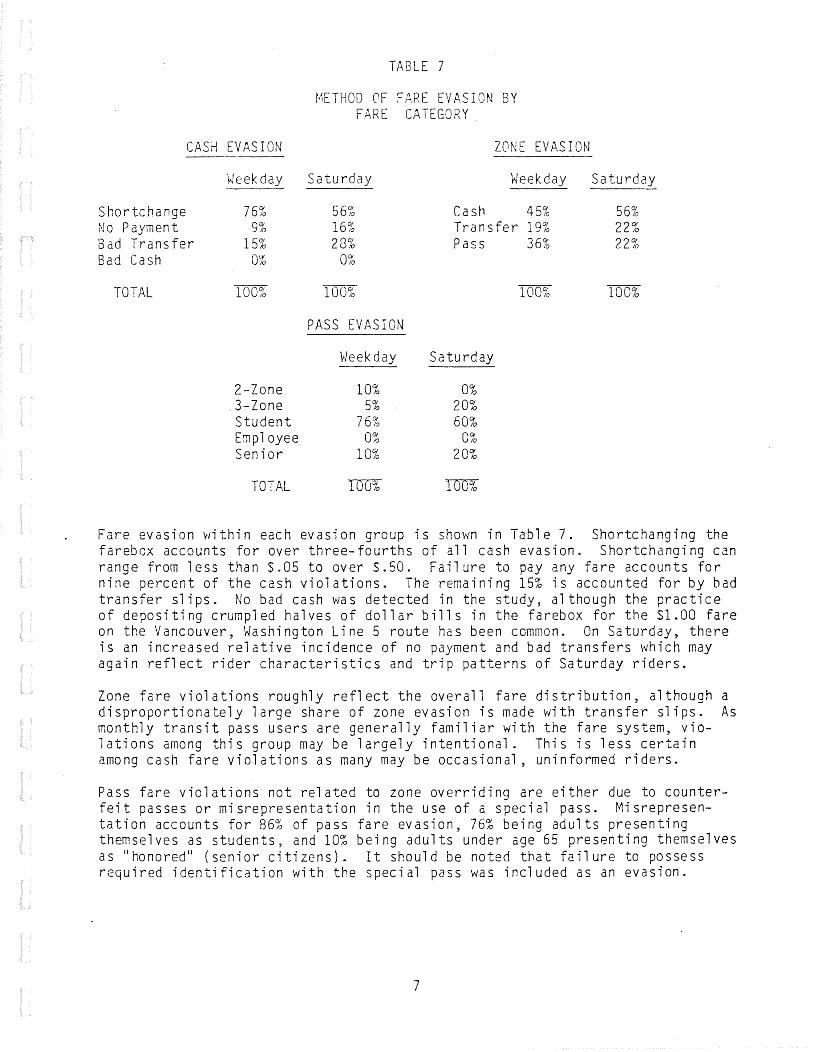
CASH EVASION
Weekday
Shortchange 76% ~Jo Payment 9% Bad Transfer 15% Bad Cash 0%
TOTAL 100~6
2-Zone .3-Zone Student Employee Senior
TOTAL
TABLE 7
METHOD OF FARE EVASION BY FARE CATEGORY.
ZONE EVJl.SION
Saturday
56~~ 16;6 28%
0%
100%
PASS EVASION
Weekday
10% 5%
76% 0%
10%
TOlJ%
Weekday
Cash 45% Transfer 19% Pass
Saturday
0% 20% 60%
0% 20%
36%
1007~
Saturday
56% 22% 22%
100%
Fare evasion within each evasion group is shown in Table 7. Shortchanging the farebox accounts for over three-fourths of all cash evasion. Shortchanging can range from less than $.05 to over S.50. Failure to pay any fare accounts for nine percent of the cash violations. The remaining 15% is accounted for by bad transfer slips. No bad cash was detected in the study, although the practice of depositing crumpled halves of dollar bills in the farebox for the Sl.OO fare on the Vancouver, Washington Line 5 route has been common. On Saturday, there is an increased relative incidence of no payment and bad transfers which may again reflect rider characteristics and trip patterns of Saturday riders.
Zone fare violations roughly reflect the overall fare distribution, although a disproportionately large share of zone evasion is made with transfer slips. As monthly transit pass users are generally familiar with the fare system, violations among this group may be largely intentional. This is less certain among cash fare violations as many may be occasional, uninformed riders.
Pass fare violations not related to zone overriding are either due to counterfeit passes or misrepresentation in the use of a special pass. Misrepresentation accounts for 86% of pass fare evasion, 76% being adults presenting themselves as students, and 10% being adults under age 65 presenting themselves as 11 honored 11 (senior citizens). It should be noted that failure to possess required identification with the special pass was included as an evasion.
7

Approximately 15~ of pass evasions are counterfeits of varying degrees of quality. i·1ost bad passes are very difficult for a driver to detect and even trc.inee fare inspectors had sor.1e difficulty making positive identification of bad passes although many were quite obvious. (No arrests or confiscations were made to avoid unusual influence on the study.) It should also be noted that there were 11 refusals to present the monthly pass to the trainee fare inspectors. Because fare inspection had not been officially introduced, no insistance was used to see all passes. Refusals are not included in the evasion totals.
Weekday
Saturday
TABLE 8
FARE EVASION RATES WITHIN EACH FARE CATEGORY
Cash Zone Pass
5.9% 13.6% 7.3%
5.2% 22.5% 1.8%
Fare evasion rates within each group are shown in Table 8. Between five and six percent of all cash riders violate the fare in some way. A larger percentage of zone riders cheat on their zone fare--approxf~ately 14% on weekdays and 23% on Saturdays. Of every seven three-zone riders, one failed to pay for the third zone of travel. On Saturday, better than one-in-five three-zone riders were fare violators. Pass riders tend to be fairly honest, excluding any zone violators. Because the fare is already paid, there is less opportunity to cheat the system, however, a fake pass represents a potentially large loss of revenue.
These results do not explain how many riders are intentional fare violators versus unintentional violators. The results of the onboard bus rider survey also conducted in Spring, 1982 should provide some insight into rider behavior and perception with respect to fare violations. These results are very much in accord with the results of the bus driver survey conducted early in the Spring, 1982 when drivers, on the average, felt that six to ten percent of the ridership evaded fares in some form. The results of the operator survey will be documented separately.
The study results do indicate that fare evasion most frequently occurs in areas not easily detected by drivers. Drivers have great difficulty tracking threezone-fare-paying riders and also have trouble counting fistfuls of change deposited in the farebox. These are the most common forms of fare evasion.
Financial Impact
The fare evasion rates indicated here have significant financial implications. Table 9 shows the daily and annual revenue loss due to fare evasion using calculations and assumptions noted in the appendix. Total fare evasion costs an estimated S775,466 annually. For the 1981 fiscal year, Tri-Met collected $18,291,348-in passenger revenues. Fare evasion, therefore, accounts for a
8

four percent loss of revenue. Because much of the overall eight to nine percent fare evasion is failure to pay only part of the fare, the financial impact is less than the evasion rate alone would suggest.
TABLE 9
REVENUE LOSS* DUE TO FARE EVASION
Cash Pass Zone
~~eek day $1208 $1073 $ 335
Saturday s 686 s 522 $ 111
Annua 1 \~eek day Revenue Loss s 667,210
Annual Weekend Revenue Loss s 108,256
Total Annual Revenue Loss $ 775,466
* Revenue loss assumptions are in the appendix.
It is hoped that Self-Service Fare Collection will reduce fare evasion and the subsequent loss of revenue. While this awaits later analysis, it is notable that much of the pre-Self--Service Fare Collection evasion is in the fonn of insufficient cash fare payment. While fewer cash riders are expected to use the self-service system, cash riders will continue to pay their fare as before and can be expected to continue to shortchange the farebox, undetected by the driver or the fare inspector.
9

GLOSSARY OF TERMS
AM Peak: The hours from 7:00 AM to 9:00 AM.
Base Fare: ($.65) Good for one- or two-zone travel.
Oaybase: The hours from 9:00 AM to 4:00 PM.
Fare Distribution Rate: Ridership stratified by mode and amount of fare payment.
Grid/Feeder: Service providing connections between non-downtown locations and between other transit service.
Inbound: The bus is traveling toward the central business districtQ
local Radial: Local service on neighborhood streets providing connections to central transit centers and other transit service
Outbound: Bus is traveling from the central business district.
"Pay-As-You-Enter 11: i~ode of fare payment. Payment is made when a person
boards the buse
11 Pay-As-You-Leave 11: t~ode of fare payment. Payment is made when a person
leaves the bus.
Peak Hour: Commuter-oriented service operating in AM and PM peak time periods only.
PM Peak: The hours from 4:00 PM to 7:00 PM.
Premium Fare: ($.90) Good for three-zone travel.
Regional Route: Direct, frequent bus service between major trip centers, pr1nc1pally downtown Portland and suburban centers.
Trip: From one end of the route to the other end of the route.
Urban Radial: Local, frequent bus service within the urbanized areas operating pr1nc1pally on major arterial streets.
A P P E N 0 I X

CALCULATION OF FARE EVASION
Cash
A revenue loss of $.10 for shortchanging the farebox assumes that most people will shortchange by $.05 to $.15. In all other categories (no payr.1ent~ bad transfer, bad cash) s the revenue loss is assu~ed to be the entire base fare ($.65) 0
Pass
The amount of revenue loss was determined by dividing the cost of the pass by the average number of trips per month of a pass user. For adults, the number was 50; for students, 35; for seniors, 42. For students and senior passes, the loss was further determined by finding the difference between the cost of the adult pass and the cost of the discounted pass assuming that the evasion is by misrepresentation and that the discounted pass was paid for.
Zone
Zone evasions were assumed to be the difference between the base fare and premium fare for both the cash and transfer portions. For the pass difference, it was the cost difference between the two passes divided by the average number of uses of the pass (50).
Systemwide percent of zone evasion= (Z I {T I F)) * 100
total number of zone evasions total number of three-zone passengers
where Z = T = F = fare distribution ratio of zone three passengers
Systemwide percent of pass evasion= (P I (T I F)) * 100
total number of pass evasions total number of pass passengers
where P = T = F = fare distribution ratio of pass passengers
Systemwide percent of cash evasion= (C I ((x + y + T) I F)* 100
where c· ::: total number of cash evasions X = number of cash no-payments y = number of bad transfers T = total number of cash-paying passengers F = Fare Distribution ratio for cash-paying
Evasion rate within each fare group
% Pass passengers who evade = (P + T) * 100
where P = T =
total number of pass evasions total number of pass passengers
passengers

% Cash-paying passengers who evade = C + T * 100
where C = T =
total number of cash evasions total number of cash-paying passengers
% 3-Zone passengers who evade = Z + (Z + T) * 100
where Z = T =
total number of zone-3 evasions total number of zone-3 passengers

CALCULATION OF LOST REVENUE DUE TO FARE EVASION
Assumed Revenue Loss Per Evasion
CASH PASS ZONE
Shortchange $.10 2-Zone ·s. 42 Cash $.25
~lo Payment .65 3-Zone · .58 Trans fer .25
Bad Transfer .65 Student .14 Pass .15
Bad Cash .65 Senior .30
Revenue Calculations
Revenue loss by subgroup = (E W) * (G -:- E) * M for cash and pass evasion
v1here E = number of total evasions in a group w = number of average daily ridership G = number of evasions in a subgroup of
a group M = revenue loss for the subgroup
Revenue loss by subgroup ::: (E ((R +F) * T) * (W 1.32 * R) * M for zone evasion
where E ::: number of total evasions in the R = Fare Distribution ratio for the SUb=
group F = Fare Distribution ratio for the
I T = total number of group passengers ,, ! w = number of average weekday riders
~1 = revenue loss for the subgroup 1.32 = transfer rate

FARE COMPLIANCE STUDY SAMPLE SELECTION
TABLE .I
TOTAL AND DESIGN SAMPLE BUS TRIP BY TIME AND ROUTE TYPE
BUS MORNING PEAK DAYBASE EVENING PEAK SATURDAY TRIPS TOTAL 5% TOTAL 50/
tO TOTAL 5% TOT.l\L 5%
Regional 217 11 421 21 209 11 406 20
Urban 542 27 1270 64 490 25 1228 61
Peak 40 2 -- -- 43 2 -- --
Local 146 7 376 19 135 7 356 18
Grid 160 8 448 22 158 8 374 19
Total 1105 55 2515 126 1035 52 2364 118 I
TABLE II
CASH CHECK NUMBER AND PERCENT BUS TRIPS SAMPLED
BUS MORNING PEA.K DAYBASE EVENING PEAK SATURDAY TRIPS .J.J. Of .J.J. Of .!.J. % .!.J. % iT iO iT tO Ti iT'
Regional 13 6 23 5 8 4 22 5
Urban 25 5 69 5 38 8 66 5
Peak 0 0 -- -- 0 0 -- --
Local 10 7 21 6 10 7 4 1
Grid 9 6 20 4 6 4 14 4
Tot a 1 57 5 133 5 62 6 106 4
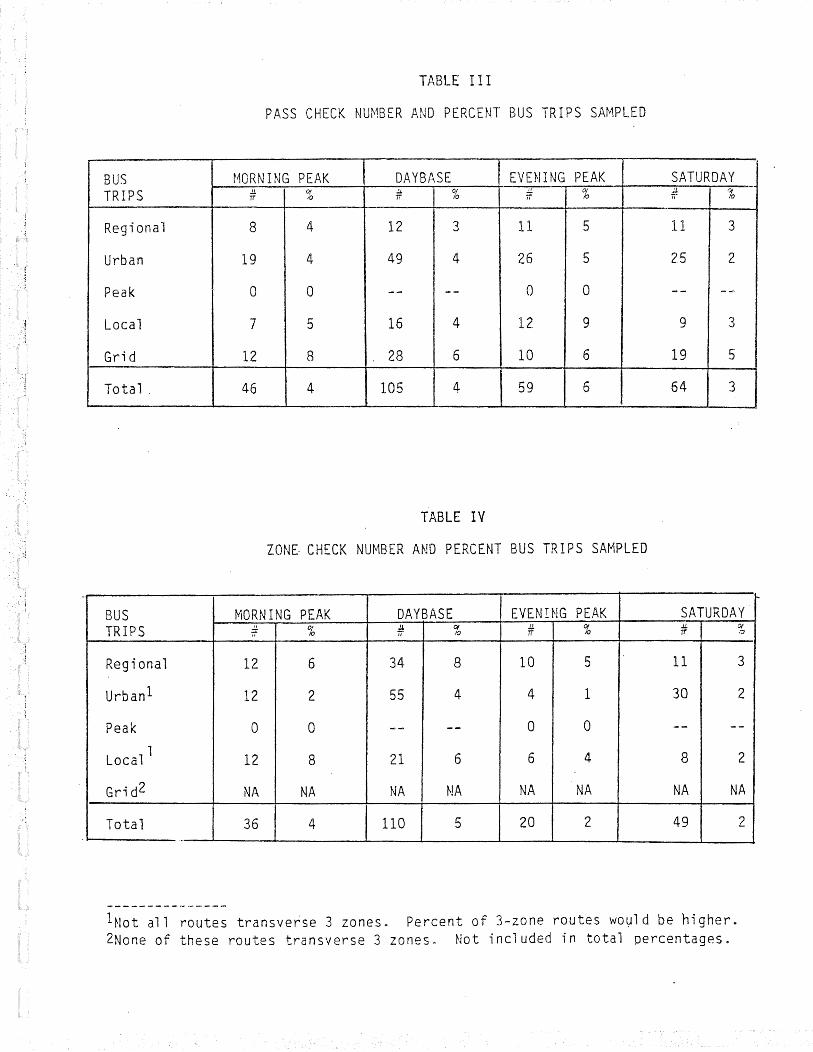
-
TABLE III
PASS CHECK NUMBER AND PERCENT BUS TRIPS SAMPLED
BUS ~10RN I NG PEAK DAYBASE EVENING PEAK SATURDAY TRIPS " Of .:.J. % " % .:.J. % Tf iO Ti ii ii
Regional 8 4 12 3 11 5 11 3
Urban 19 4 49 4 26 5 25 2
Peak 0 0 -- -- 0 0 -- --
Local 7 5 16 4 12 9 9 ,., ...)
Grid 12 8 28 6 10 6 19 5
Tot a 1 . 46 4 105 4 59 6 64 3
TABLE IV
ZONE CHECK NUMBER AND PERCENT BUS TRIPS SAMPLED
BUS MORNING PEAK DAYBASE EVENING PEAK SATURDAY TRIPS " % # 01 # % .J.! 01
" 10 1T 10
Regional 12 6 34 8 10 5 11 3
Urban1 12 2 55 4 4 1 30 2
Peak 0 0 -- -- 0 0 -- --
Local 1 12 8 21 6 6 4 8 2
Grid2 NA NA NA NA NA NA NA NA
Total 36 4 110 5 20 2 49 2 ..
lNot all routes transverse 3 zones. Percent of 3-zone routes WOl:Jl d be higher. 2None of these routes transverse 3 zones. Not included in total percentages.
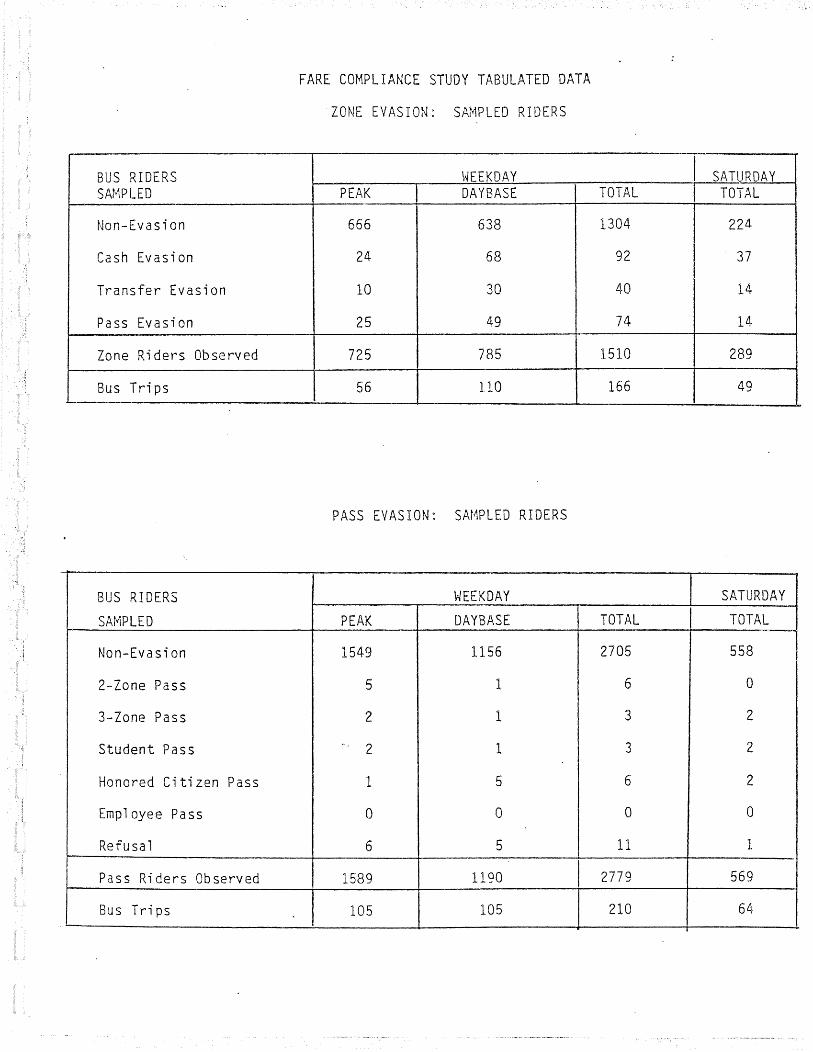
FARE COMPLIANCE STUDY TABULATED DATA
ZONE EVASION: SAMPLED RIDERS
BUS RIDERS \~EEKDAY I SATURDAY SAr~PLED PEAK DAYBASE TOTAL TOTAL
Non-Evasion 666 638 1304 224
Cash Evasion 24 68 92 37
Transfer Evasion 10 30 40 14
Pass Evasion 25 49 74 14
Zone Riders Observed 725 785 1510 289
Bus Trips 56 110 166 49
PASS EVASION: SAMPLED RIDERS
BUS RIDERS WEEKDAY SATURDAY
SAt~PLED PEAK DAYBASE TOTAL I TOTAL
-1 Non-Evasion 1549 1156 2705 558
2-Zone Pass 5 1 6 0
3-Zone Pass 2 1 3 2
Student Pass 2 1 3 2
Honored Citizen Pass 1 5 6 2
Employee Pass 0 0 0 0
Refusal 6 5 11 1
Pass Riders Observed 1589 1190 I 2779 569
Bus Trips 105 105 210 64
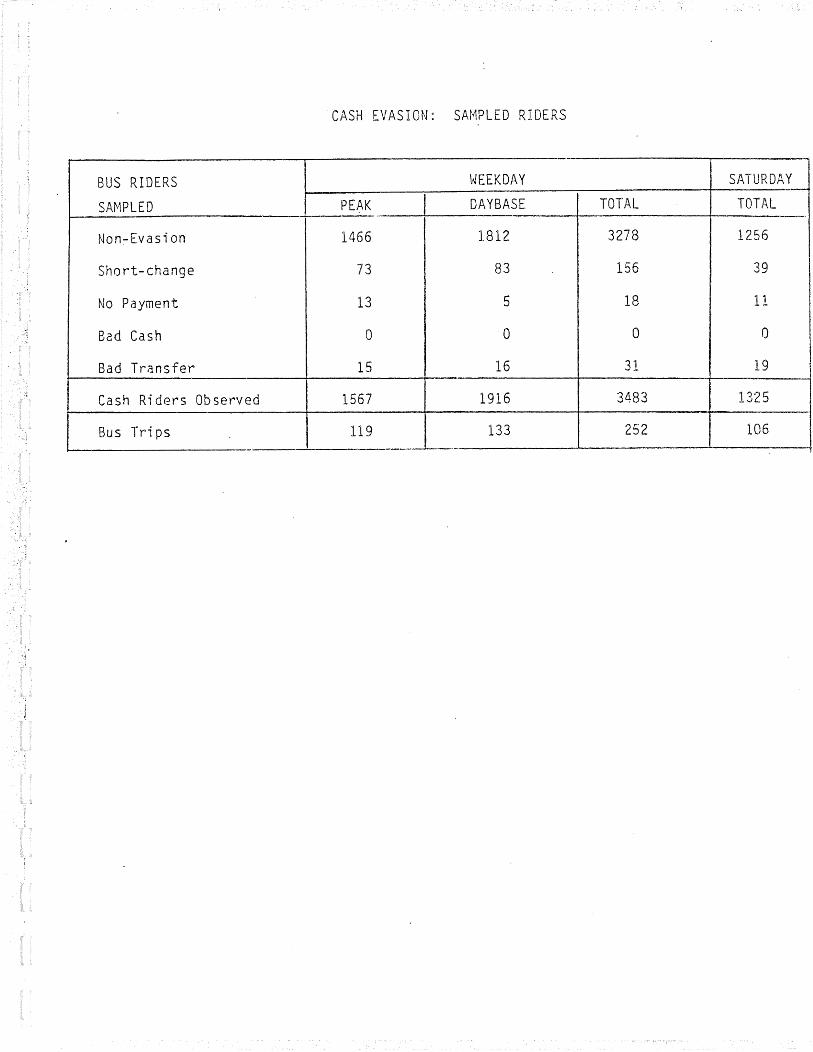
CASH EVASION: SAMPLED RIDERS
BUS RIDERS \~EEKDAY SATURDAY --SA~iPLED PEAK DAYBASE TOTAL TOTAL
Non:-Evasion 1466 1812 3278 1256
Short-change 73 83 156 39
No Payment 13 5 18 11
Bad Cash 0 0 0 0
Bad Transfer 15 16 31 19
Cash Riders Observed 1567 1916 3483 1325
Bus Trips 119 133 252 106 - -

.. FARE DISTRIBUTION REPORT
"'·C:-"':~·~·,.,..,.,.--------------------·-------------------------

FARE CATEGORY DISTRIBUTION SPRING, 1982 F.
DAY TYPE=WEEKDAY Ll r~ E TYPE=ALL TIME PERIOD=ALL
REPORTED ADJUSTED FARE CATEGORY DISTRIBUTION DISTRIBUTION FARE
FARE NON-COMPLIANCE 1 0 oo% 0.64% 0.0 ¢
FARELESS SQUARE 2.44% l. 55% 0.0 ¢
TRI-MET EMPLOYEES 0.81% 0.52% 0.0 ¢
25¢ HONORED CITIZENS 15.90% 1 0. 12% 25.00¢
45¢ YOUTH 17.40% 11.08% 45.00¢
65¢ ADULT 34. 17% 21 0 7 5% ' 65.00¢
90¢ ADULT 15.84% 10. 08%'---- 90.00¢ !---__../
$1.00 VANCOUVER 0.63% 0.40% 100.00¢
$14 YOUTH PASS 12.41% 7.90% 31.90¢ ---------- . '
\
$21 ADULT PASS 33. 15% 21 • 1 o% 50 0 14¢
·13 0 64% /
$29 ADULT PASS 2 1 0 42% 1.----- 53.62¢ \
I )
$35 VANCOUVER PASS 0.41% 0 0 26% ~23-:54¢-· __ )
COUNTY PASS 0 0 18% 0. 11% 88.23¢
$6 HONORED CITIZEN PASS 1. 32% 0.84% 51.21¢
157.08% 100.00%
AVERAGE FARE = 52.40¢ BOARDING FARE = 39. 14¢ TRANSFER SLIP RATE = 1 . 267 TOTAL TRANSFER RATE = 1 • 339
AVERAGE CASH FARE = 58.25¢ % FREE PASSENGERS = 2.71%
•/
PASS USES PER DAY = 1 0 789 $14 YOUTH 1 . 807 $21 ADULT = 1 . 717 $29 ADULT = 2 .. 342 $35 VANC. = 1 . 196 $6 ELDERLY = 0.465

FARE CATEGORY DISTRIBUTION SPRING, 1982. F. 2
DAY TYPE=SATURDAY LINE TYPE=ALL TIME PERIOD=ALL
REPORTED ADJUSTED FARE CATEGORY DISTRIBUTION DISTRIBUTION FARE
FARE NON-COMPLIANCE 1 .oo% 0.69% 0.0 ¢
FARELESS SQUARE 1 o55% 1 .06% OoO ¢
TRI-MET EMPLOYEES 1.35% 0.93% OoO ¢
25¢ HONORED CITIZENS 20.02% 13.74% 25.00¢
45¢ YOUTH 15.49% 10.63% 45.00¢
65¢ ADULT 39.76% 27.29% 65.00¢
90¢ ADULT 1 l 0 1 2% ].63% 90.00¢
$1 .00 VANCOUVER 0.]5% 0.51% 100.00¢
$14 YOUTH PASS 1 2 0 stt 8.62% 31 0 90¢
$21 ADULT PASS 2~.83% 20.47% 50. 14¢
$29 ADULT PASS 10o09% 6.92% 53.62¢
$35 VANCOUVER PASS 0.45% 0.31% 123.54¢
COUNTY PASS 0.06% 0.04% 88.23¢
$6 HONORED CITIZEN PASS 1. 6z% 1 . 15% 51.21¢
145.71% 100.00%
AVERAGE FARE = 51.07¢ BOARDING FARE 38.41¢ TRANSFER SLIP RATE = 1. 2 7 3 TOTAL TRANSFER RATE = 1 . 330
AVERAGE CASH FARE = 55-75¢ % FREE PASSENGERS = 2.68%
PASS USES PER DAY = 0.602 $14 YOUTH = 0.776 $21 ADULT 0.655 $29 ADULT = 0.468 $35 VANC. 0.557 $6 ELDERLY = 0.250

FARE CATEGORY DISTRIBUTION SPRING, 1982 F. 3
DAY TYPE=SUNDAY LINE TYPE=ALL TIME PERIOD=ALL
REPORTED ADJUSTED FARE CATEGORY DISTRIBUTION D I S T R I BUT I 0 ~J FARE
FARE NON-COMPLIANCE 1 .oo% 0.98% 0.0 ¢
FARELESS SQUARE 1. 46% 1 . 44% 0.0 ¢
TRI-MET EMPLOYEES 2.44% 2.40% 0.0 ¢
25¢ HONORED CITIZENS 13.45% 13.23% 25.00¢
45¢ YOUTH 1 3. 18% 12.95% 45.00¢
65¢ ADULT 22.68% 22.30% 65.00¢
90¢ ADULT 2.84% 2.79% 90.00¢
$1.00 VANCOUVER 0.0 % 0.0 % 100.00¢
$14 YOUTH PASS 7. 14% 7.02% 3 1 . 90¢
$21 ADULT PASS 2 7. 14% 26.68% 50. 14¢
$29 ADULT PASS 9. 1 o% 8.95% 53.62¢
$35 VANCOUVER PASS 0.0 % 0.0 % 123.54¢
COUNTY PASS 0.06% 0.06% 88.23¢
$6 HONORED CITIZEN PASS 1. 22% 1. 20% 51.21¢
l 01 & 7 2% 100.00%
AVERAGE FARE = 47.23¢ BOARDING FARE = 38.59¢ TRANSFER SLIP RATE = 1 . 105 TOTAL TRANSFER RATE = 1 • 224
AVERAGE CASH FARE 50.99¢ % FREE PASSENGERS = 4.82%
PASS USES PER DAY 0.352 $14 YOUTH = 0.316 $21 ADULT = 0.427 $29 ADULT 0.302 $35 VANC. = 0.0 $6 ELDERLY 0. 130
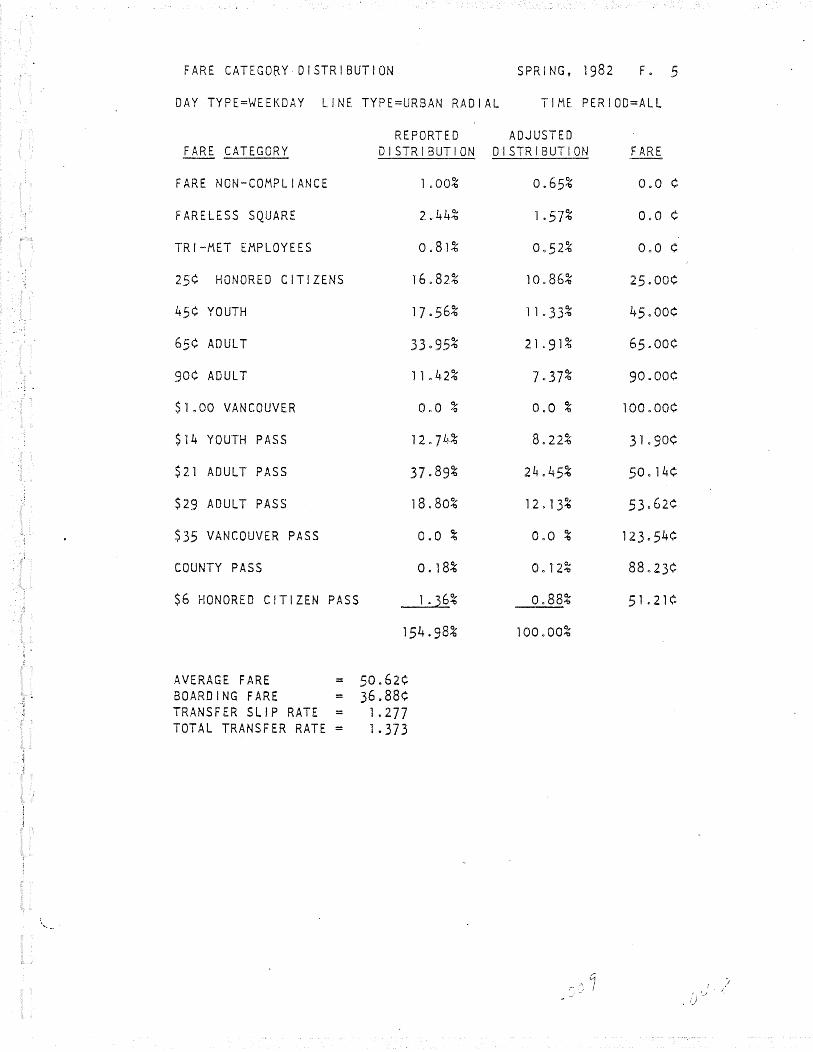
FARE CATEGORY·DISTRIBUTION SPRING, 1982 F. 5
DAY TYPE=WEEKDAY LINE TYPE=URBAN RADIAL TIME PERIOD=ALL
REPORTED ADJUSTED FARE CATEGORY DISTRIBUTION DISTRIBUTION
FARE NON-COMPLIANCE
FARELESS SQUARE
TRI-MET EMPLOYEES
25¢ HONORED CITIZENS
45¢ YOUTH
65¢ ADULT
90¢ ADULT
$1.00 VANCOUVER
$14 YOUTH PASS
$21 ADULT PASS
$29 ADULT PASS
$35 VANCOUVER PASS
COUNTY PASS
$6 HONORED CITIZEN PASS
AVERAGE FARE = 50.62¢ BOARDING FARE = 36.88¢ TRANSFER SLIP RATE = 1.277 TOTAL TRANSFER RATE= 1.373
1.00% 0.65%
2.44% 1.57%
0.81% Oo52%
16.82%
17.56%
33.95%
1 1 0 4 2%
0.0 %
12.]4%
37.89%
18.80%
0.0 %
0. 18%
11 0 33%
21 o9l%
0.0 %
8.22%
12 0 1 3%
0.0 %
0. 12%
0.88%
100.00%
FARE
0.0 ¢
OoO ¢
0.0 ¢
25.00¢
45.00¢
65.00¢
90.00¢
31.90¢
so. 14¢
53.62¢
123.54¢
88.23¢
51.21¢
I .i 1, I ,J (
':)

FARE CATEGORY DISTRIBUTION SPRING, 1982 F. 6
DAY TYPE=WEEKDAY LINE TYPE=PEAK HOUR TIME PERIOD=ALL
REPORTED ADJUSTED FARE CATEGORY DISTRIBUTION DISTRIBUTION FARE
FARE NON-COMPLIANCE 1. oo% 0.53% 0.0 ¢
FARELESS SQUARE 2.44% 1 . 29% 0.0 ¢
TRI-MET EMPLOYEES 0.81% 0.43% 0.0 ¢
25¢ HONORED CITIZENS 31 . 7 4% 16.72% 25.00¢
45¢ YOUTH 0.78% 0.41% 45.00¢
65¢ ADULT 24.77% 13.05% 65.00¢
90¢ ADULT 45.31% 23.87% 90.00¢
$1.00 VANCOUVER 0.0 % 0.0 % 100.00¢
$14 YOUTH PASS 3.64% 1 0 92% 31.90¢
$21 ADULT PASS 21 0 30% 11 . 22% 50. 14¢
$29 ADULT PASS ss.o6% 29.01% 53.62¢
$35 VANCOUVER PASS 0.0 % 0.0 % 123.54¢
COUNTY PASS 0. 18% 0.09% 88.23¢
$6 HONORED CITIZEN PASS 2.80% 1. 48% 51.21¢
189.84% 100.00%
AVERAGE FARE = 56.96¢ BOARDING FARE = 45.26¢ TRANSFER SLIP RATE = 1. 267 TOTAL TRANSFER RATE = 1 . 259

FARE CATEGORY DISTRIBUTION SPRING~ 1982 F. 7
DAY TYPE=WEEKDAY LINE TYPE=LOCAL RADIAL TIME PERIOD=ALL
REPORTED ADJUSTED FARE CATEGORY DISTRIBUTION DISTRIBUTION (ARE
FARE NON-COMPLIANCE 1 .00% 0.69% 0.0 ¢
FARELESS SQUARE 2.44% 1. 69% 0.0 ¢
TRI-MET EMPLOYEES 0.81% 0.56% 0.0 ¢
25¢ HONORED CITIZENS 11.99% 8.31% 25.00¢
45¢ YOUTH 16.44% 11.39% 45.00¢
., . 65¢ ADULT 3 1 . 48% 21.81% 65.00¢
90¢ ADULT 17.86% 12.37% 90.00¢
$1.00 VANCOUVER 0.0 % 0.0 % 100.00¢
$14 YOUTH PASS 12.91% 8.94% 31 . 90¢
$21 ADULT PASS 29.~7% 20.56% 50. 14¢
$29 ADULT PASS 18.49% 12.81% 53.62¢
$35 VANCOUVER PASS 0.0 % 0.0 % 123.54¢
COUNTY PASS 0.18% 0. 12% 88.23¢
$6 HONORED CITIZEN PASS 1 .0?% o.z4% 51.21¢
144.34% 100.00%
AVERAGE FARE = 53.03¢ BOARDING FARE = 42.73¢ TRANSFER SLIP RATE = 1 . l 78 TOTAL TRANSFER RATE = 1. 241
I '·· i.
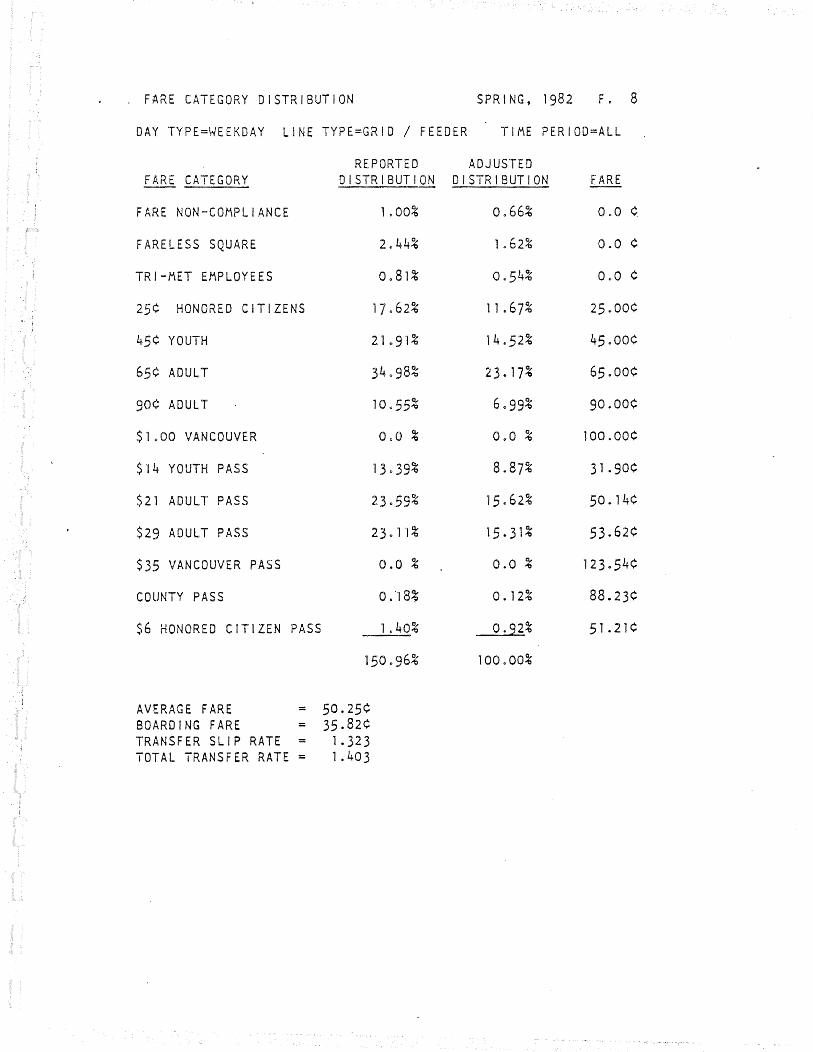
FARE CATEGORY DISTRIBUTION SPRING, 1982 F. 8
DAY TYPE=WEEKDAY LINE TYPE=GRID / FEEDER Tlsi.\E PERIOD=ALL
REPORTED ADJUSTED FARE CATEGORY DISTRIBUTION DISTRIBUTION
FARE NON-COMPLIANCE 1.00% 0.66%
FARELESS SQUARE 2.44% 1.62%
TRI-MET EMPLOYEES 0.81% 0.54%
25¢ HONORED CITIZENS 17.62% 11.67%
45¢ YOUTH 21.91% 14.52%
65¢ ADULT 34.98% 23.17%
90¢ ADULT 10.55% 6.99%
$1.00 VANCOUVER 0.0% 0.0%
$14 YOUTH PASS 13.39% 8.87%
$21 ADULT PASS 23.59% 15.62%
$29 ADULT PASS 23.11% 15.31%
$35 VANCOUVER PASS 0.0 % 0.0 %
COUNTY PASS 0 ."18% 0. 12%
$6 HONORED CITIZEN PASS 1.40% 0.92%
100.00%
AVERAGE FARE = 50.25¢ BOARDING FARE = 35.82¢ TRANSFER SLIP RATE = 1.323 TOTAL TRANSFER RATE= 1.403
0.0 ¢
0.0 ¢
25.00¢
45.00¢
65.00¢
90.00¢
31.90¢
50. 14¢
53.62¢
123.54¢
88.23¢
51.21¢

1
l' FARE CATEGORY DISTRIBUTION SPRING, 1982 F. 9
DAY TYPE=SATURDAY LINE TYPE=REGIONAL TIME PERIOD=ALL
i REPORT.ED ADJUSTED FARE CATEGORY DISTRIBUTION DISTRIBUTION FARE
FARE NON-COMPLIANCE 1 .oo% o.s5% 0.0 ¢
FARELESS SQUARE 1 .ss% 0.86% 0.0 ¢
TRI-MET EMPLOYEES 1 0 35% 0.]5% 0.0 ¢
·I 25¢ HONORED CITIZENS 26o59% 14.71% 25o00¢ ~
45¢ YOUTH 16.84% 9.32% 45.00¢
65¢ ADULT 32.59% 18.03% 65.00¢
90¢ ADULT 48.66% 26.92% 90.00¢
$1.00 VANCOUVER 0.0 % 0.0 % 100.00¢
$14 YOUTH PASS 50 17% 2.86% 31.90¢
$21 ADULT PASS 29.60% 16.37% so. 14¢
$29 ADULT PASS 15. 1 o% 8o36% 53.62¢
$35 VANCOUVER PASS OoO % 0.0 % 123.54¢
COUNTY PASS 0.06% 0.03% 88.23¢
$6 HONORED CITIZEN PASS 2.22% 1.22% 51 0 21¢
180.]6% 100.00%
AVERAGE FARE 58.09¢ BOARDING FARE = 44.27¢ TRANSFER SLIP RATE = 1 . 42 1 TOTAL TRANSFER RATE = 1 . 312

FARE CATEGORY DISTRIBUTION SPRING, 1982 F. 10
DAY TYPE=SATURDAY LINE TYPE=URBAN RADIAL TIME PERIOD=ALL·
REPORTED ADJUSTED· FARE CATEGORY DISTRIBUTION DISTRIBUTION FARE
FARE NON-COMPLIANCE 1 .00% 0.74% 0.0 ¢
FARELESS SQUARE 1 .ss% 1 . 15% 0.0 ¢
TRI-MET EMPLOYEES 1. 35% 1 .00% 0.0 ¢
25¢ HONORED CITIZENS 20.30% 15.08% 25.00¢
45¢ YOUTH 14.07% 10.45% 45.00¢
65¢ ADULT 38 ~ 11% 28.31% 65.00¢
90¢ ADULT 3.06% 2.27% 90.00¢
$1.00 VANCOUVER 0.0 % 0.0 % 100o00¢
$14 YOUTH PASS 15 0 1 o% 11 0 22% 31 0 90¢
$21 ADULT PASS 33.85% 25. 15% 50 0 14¢
$29 ADULT PASS 4.41% 3.28% 53.62¢
$35 VANCOUVER PASS OoO % 0.0 % 123.54¢
COUNTY PASS 0&06% 0.04% 88.23¢
$6 HONORED CITIZEN PASS 1. 73% 1 .29% 51.21¢
134.59% 100.00%
AVERAGE FARE = 47.57¢ BOARDING FARE = 36.55¢ TRANSFER SLIP RATE = 1 0 2 l 2 TOTAL TRANSFER RATE = 1.301
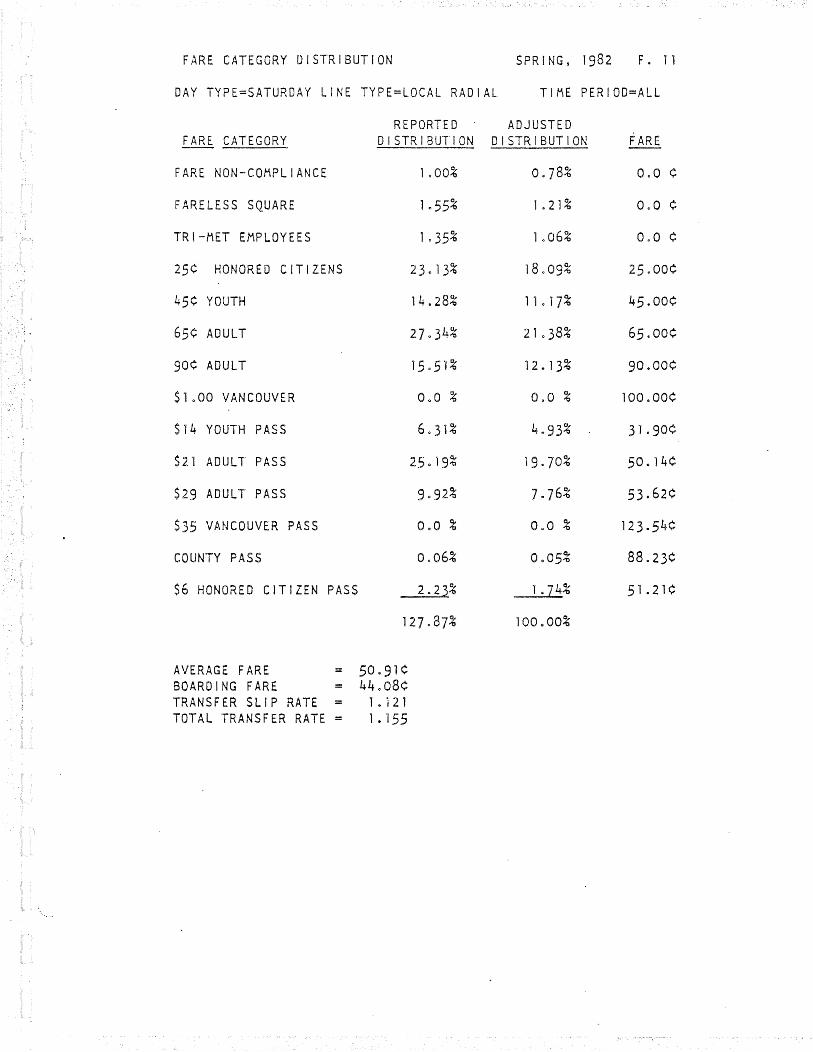
FARE CATEGORY DISTRIBUTION SPRING, 1982 F. 11
DAY TYPE=SATUROAY LINE TYPE=LOCAL RADIAL TIME PERIOD=ALL
REPORTED ADJUSTED FARE CATEGORY DISTRIBUTION DISTRIBUTION
FARE NON-COMPLIANCE 1.00% 0.]8%
FARELESS SQUARE 1.55% 1.21%
TRI-MET EMPLOYEES 1.35% 1.06%
25¢ HONORED CITIZENS 23.13% 18.09%
45¢ YOUTH 14.28% 11.17%
65¢ ADULT 2].34% 21.38%
90¢ ADULT 15.51% 12.13%
$1.00 VANCOUVER 0.0% 0.0%
$21 ADULT PASS 25.19% 19.70%
$29 ADULT PASS 9.92% ].]6%
$35 VANCOUVER PASS 0.0 % 0.0 %
COUNTY PASS 0.06% 0.05%
$6 HONORED CITIZEN PASS 2.23% 1.74%
127.87% 100.00%
AVERAGE FARE = 50.91¢ BOARDING FARE = 44.08¢ TRANSFER SLIP RATE = l. 121 TOTAL TRANSFER RATE= 1.155
FARE
0.0 ¢
0.0 ¢
25.00¢
45.00¢
65.00¢
90.00¢
100.00¢
31.90¢
50. 14¢
53.62¢
123.54¢
88.23¢
51.21¢

FARE CATEGORY DISTRIBUTION SPRING, 1982 F. 12
DAY TYPE=SATURDAY LINE TYPE=GRID /FEEDER TIME PERIOD=ALL
REPORTED ADJUSTED FARE CATEGORY DISTRIBUTION DISTRIBUTION
FARE NON-COMPLIANCE 1.00% 0.]0%
FARELESS SQUARE 1.55% laOS%
TRI-MET EMPLOYEES 1.35% Oe94%
25¢ HONORED CITIZENS 5.18% 3.62%
45¢ YOUTH 20623% 14.14%
65¢ ADULT 56.27% 39.33%
90¢ ADULT 4.53% 3.17%
$14 YOUTH PASS 12.60% 8.81%
$21 ADULT PASS 21.81% 15.24%
$29 ADULT PASS 18.14% 12.68%
$35 VANCOUVER PASS 0.0 % 0.0 %
COUNTY PASS 0.06% 0.04%
$6 HONORED CITIZEN PASS 0.37% 0.26%
14 3. 1 o%
AVERAGE FARE = 53.10¢ BOARDING FARE = 33.99¢ TRANSFER SLIP RATE = 1.450 TOTAL TRANSFER RATE = l .562
100.00%
FARE
0.0 ¢
0.0 ¢
0.0 ¢
25.00¢
45.00¢
65.00¢
90.00¢
31.90¢
so. 14¢
53.62¢
123.54¢
88.23¢
51.21¢

FARE CATEGORY DISTRIBUTION SPRING, 1982 F ~ 13
DAY TYPE=SUNDAY LINE TYPE=REGIONAL TIME PERIOD=ALL
REPORTED ADJUSTED FARE CATEGORY DISTRIBUTION DISTRIBUTION FARE
FARE NON-COMPLIANCE 1. oo% ·o .68% 0.0 ¢
FARELESS SQUARE 1. 46% 1.00% 0.0 ¢
TRI-MET EMPLOYEES 2.44% 1. 67% 0.0 ¢
25¢ HONORED CITIZENS 10. 13% 6.92% 25.00¢
45¢ YOUTH 17.05% 11 .65% 45.00¢
·:_! • 65¢ ADULT 38.64% 26.40% 65.00¢ .,
90¢ ADULT 26.77% 18.29% 90.00¢
$1.00 VANCOUVER 0.0 % 0.0 % 100.00¢
$14 YOUTH PASS 10.06% 6.87% 31.90¢
$21 ADULT PASS 28.47% 19.45% 50. 14¢
$2.9 ADULT PASS 9.42% 6.43% 53.62¢
$35 VANCOUVER PASS 0.0 % 0.0 % 123.54¢
COUNTY PASS 0.06% o'.o4% 88o23¢
$6 HONORED CITIZEN PASS o.8z% 0.60% 51.21¢
146.37% 100.00%
AVERAGE FARE = 56.33¢ BOARDING FARE = 43.74¢ TRANSFER SLIP RATE = 1 0 261 TOTAL TRANSFER RATE = 1 . 288

FARE CATEGORY DISTRIBUTION SPRING, 1982 F. 14
DAY TYPE=SUNDAY LINE TYPE=URBAN RADIAL TIME PERIOD=ALL
REPORTED ADJUSTED FARE CATEGORY DISTRIBUTION DISTRIBUTION
FARE NON-COMPLIANCE
FARELESS SQUARE
TRI-MET EMPLOYEES
25¢ HONORED CITIZENS
45¢ YOUTH
65¢ ADULT
90¢ ADULT
$1.00 VANCOUVER
$14 YOUTH PASS
$21 ADULT PASS
$29 ADULT PASS
$35 VANCOUVER PASS .
COUNTY PASS
$6 HONORED CITIZEN PASS
AVERAGE FARE = 48. 16¢ - 40.28¢ BOARDING FARE
TRANSFER SLIP RATE = TOTAL TRANSFER RATE =
1 .090 1.196
1 • oo% 1 • o 1%
1.46% 1.47%
2.44% 2.45%
26.20%
l 0 36%
0.0 %
3. 15%
28.87%
10.88%
0.0 %
0.06%
1. 22%
99.44%
9.]6%
26.35%
1. 36%
0.0 %
3 0 17%
29.04%
0.0 %
0.06%
1. 22%
100.00%
FARE
0.0 ¢
0.0 ¢
0.0 ¢
25~00¢
90.00¢
100.00¢
31 . 90¢
50. 14¢
53.62¢
123.54¢
88.23¢
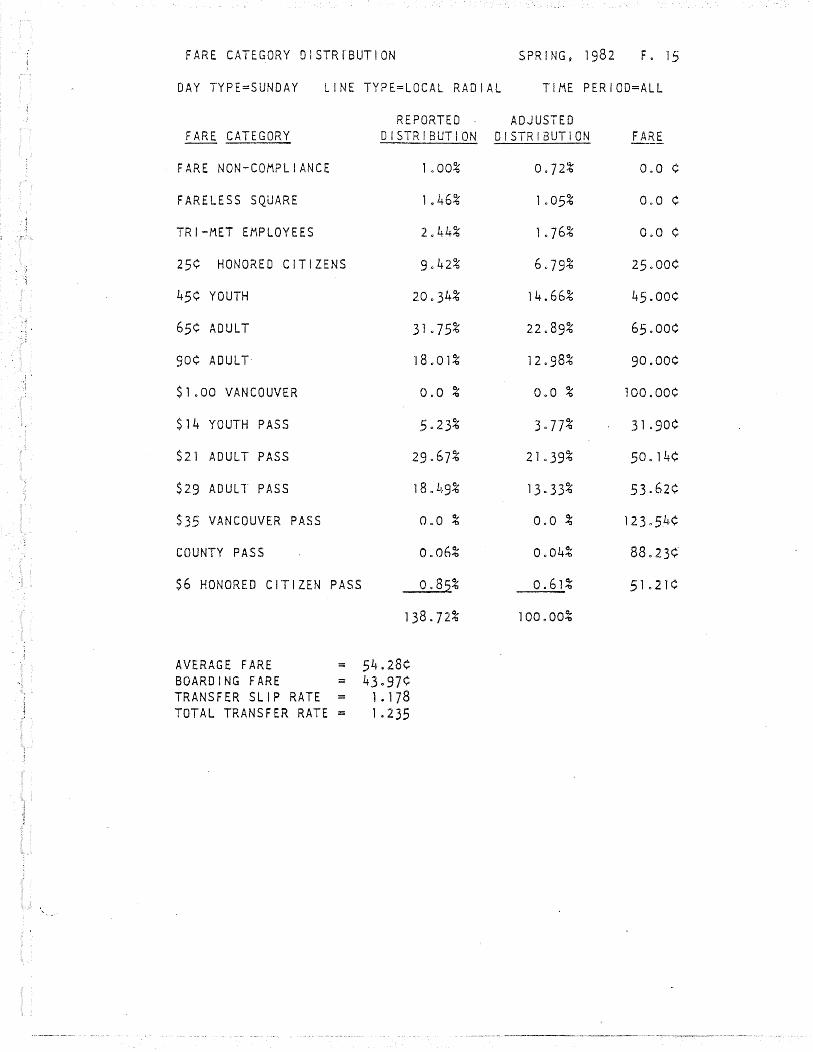
FARE CATEGORY DlSTRfBUTION SPRING1 1982 F. 15
DAY TYPE=SUNDAY LINE TYPE=LOCAL RADIAL TIME PERIOD=ALL
REPORTED ADJUSTED FARE CATEGORY DISTRIBUTION DISTRIBUTION FARE
FARE NON-COMPLIANCE 1.00% 0.]2% 0.0 ¢
FARELESS SQUARE 1. 46% 1 .os% 0.0 ¢
TRI-MET EMPLOYEES 2.44% 1. ]6% 0.0 ¢
25¢ HONORED CITIZENS g.42% 6.79% 25.00¢
45¢ YOUTH 20.34% 14.66% 45.00¢
65¢ ADULT 31.]5% 22.89% 65.00¢
90¢ ADULT- 18.01% 12.98% 90.00¢
$1.00 VANCOUVER 0.0 % 0.0 % 100.00¢
$14 YOUTH PASS 5.23% 3.77% 3 1 . 90¢
$21 ADULT PASS 29.67% 21.39% 50. 14¢
$29 ADULT PASS 18.49% 13.33% 53.62¢
$35 VANCOUVER PASS 0.0 % 0.0 % 123.54¢
COUNTY PASS 0.06% 0.04% 88.23¢
$6 HONORED CITIZEN PASS 0.82% 0.61% 51.21¢
138.]2% 100.00%
AVERAGE FARE = 54.28¢ BOARDING FARE 43.97¢ TRANSFER SLIP RATE = 1 • 1 78 TOTAL TRANSFER RATE 1 • 235

FARE CATEGORY DISTRIBUTION SPRING, 1982 F. 16
DAY TYPE=SUNDAY LINE TYPE=GRID / FEEDER TIME PERIOD=ALL
REPORTED ADJUSTED FARE CATEGORY DISTRIBUTION DISTRIBUTION FARE
FARE NON-COMPLIANCE 1 .oo% 0.63% 0.0 ¢
FARELESS SQUARE 1. 46% 0.92% 0.0 ¢
TRI-MET EMPLOYEES 2.44% 1 0 53% 0.0 ¢
25¢ HONORED CITIZENS 33.88% 21.30% 25.00¢
45¢ YOUTH 16.08% 10. 11% 45.00¢
65¢ ADULT 20. 15% 12.67% 65.00¢
90¢ ADULT 10.98% 6.91% 90.00¢
$1.00 VANCOUVER 0.0 % 0.0 % 100.00¢
$14 YOUTH PASS 10.88% 6.84~ 31 . 90¢
$21 ADULT PASS 36.0]%_ 22.67% so. 14¢
$29 ADULT PASS 23. 11% 14.53% 53.62¢
$35 VANCOUVER PASS 0.0 % 0.0 % 123.54¢
COUNTY PASS 0.06~ 0.04% 88.23¢
$6 HONORED CITIZEN PASS 2.95% 1 0 86% 51.21¢
159.06% 100.00%
AVERAGE FARE = 46.65¢ BOARDING FARE = 36.59¢ TRANSFER SLIP RATE = 1 . 2 1 2 TOTAL TRANSFER RATE = 1 .275
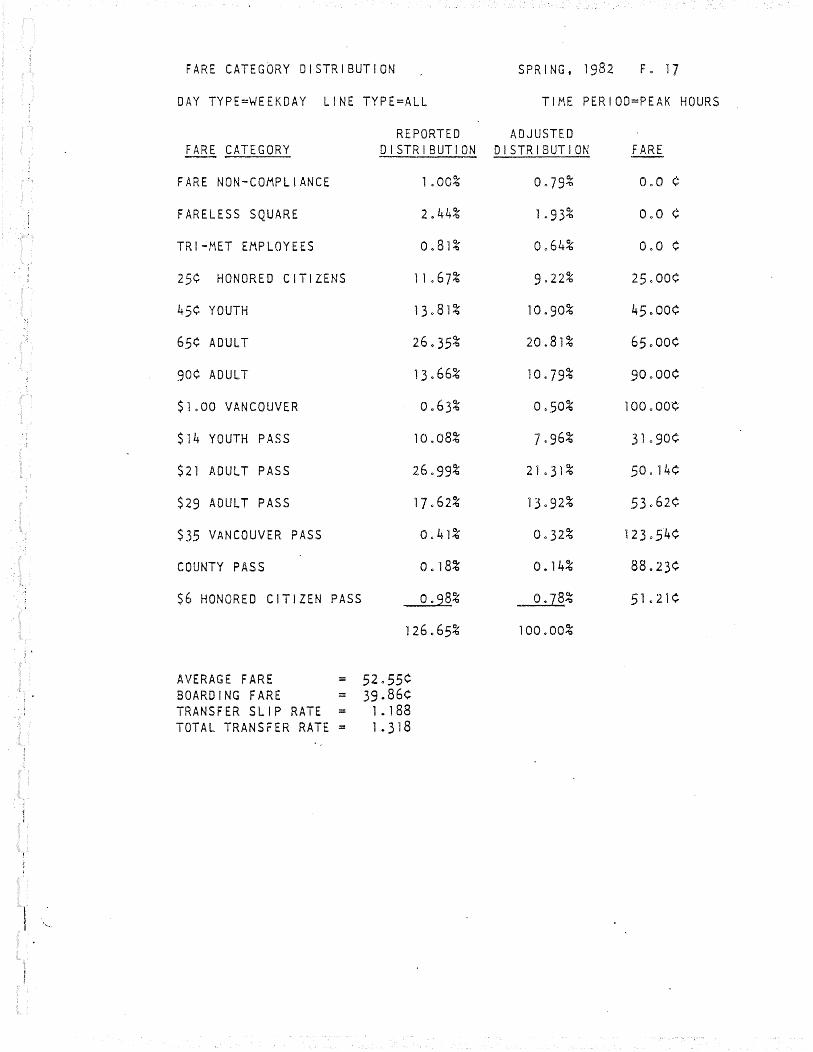
FARE CATEGORY DISTRIBUTION SPRING !I 1982 F • 17
DAY TYPE=WEEKDAY LINE TYPE=ALL TIME PERIOD=PEAK HOURS
REPORTED ADJUSTED FARE CATEGORY DISTRIBUTION DISTRIBUTION FARE
FARE NON-COMPLIANCE 1. oo% 0.79% 0.0 ¢
FARELESS SQUARE 2.44% 1.93% 0.0 ¢
TRI-MET EMPLOYEES 0.81% 0.64% 0.0 ¢
25¢ HONORED CITIZENS 11.67% 9.22% 25.00¢
45¢ YOUTH 13.81% 10.90% 45.00¢
65¢ ADULT 26.35% 20.81% 65.00¢
90¢ ADULT 13.66% 10.79% 90.00¢
$1.00 VANCOUVER 0.63% 0.50% 100.00¢
$14 YOUTH PASS 10.08% ].96% 3 1 0 90¢
$21 ADULT PASS 26.99% 21.31% 50. 14¢
$29 ADULT PASS 1].62% 13.92% 53.62¢
$35 VANCOUVER PASS 0.41% 0.32% 123 0 54¢
COUNTY PASS 0 018% 0.14% 88.23¢
$6 HONORED CITIZEN PASS 0.98% 0.]8% 51.21¢
126.65% 100.00%
AVERAGE FARE = 52.55¢ BOARDING FARE = 39.86¢
i TRANSFER SLIP RATE 1.188 J
TOTAL TRANSFER RATE = 1 . 318
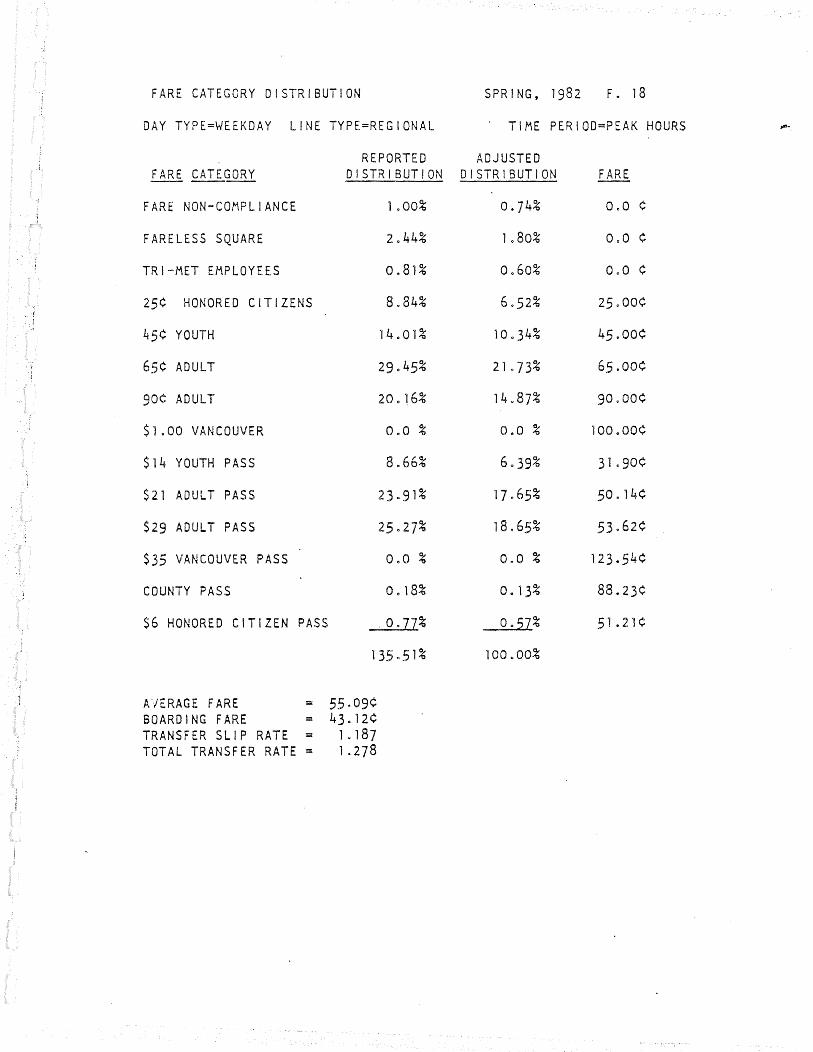
FARE CATEGORY DISTRIBUTION SPRING, 1982 F. 18
DAY TYPE=WEEKDAY LINE TYPE=REGIONAL TIME PERIOD=PEAK HOURS .,.
REPORTED ADJUSTED FARE CATEGORY DISTRIBUTION DISTRIBUTION FARE
FARE NON-COMPLIANCE 1 .oo% 0.]4% OQO ¢
FARELESS SQUARE 2.44% 1 0 80% 0.0 ¢
TRI-MET EMPLOYEES 0.81% 0.60% 0.0 ¢
25¢ HONORED CITIZENS 8.84% 6.52% 25.00¢
45¢ YOUTH 14.01% 10.34% 45.00¢
.. , 65¢ ADULT 29.45% 21 • 7 3% 65.00¢ •\
i
90¢ ADULT 20 0 16% 14.87% 90.00¢
$1.00 VANCOUVER 0.0 % 0.0 % 100.00¢
$14 YOUTH PASS 8.66% 6.39% 31 . 90¢
$21 ADULT PASS 23.91% 17.65% 50 0 14¢
$29 ADULT PASS 25.27% 18.65% 53.62¢
$35 VANCOUVER PASS 0.0 % 0.0 % 123.54¢
COUNTY PASS 0. 18% 0. 13% 88.23¢
$6 HONORED CITIZEN PASS 0.?7% 0.57% 51.21¢
135.51% 100.00%
'~
A"/ERAGE FARE = 55.09¢ BOARDING FARE = 43.12¢ TRANSFER SLIP RATE = l. 187 TOTAL TRANSFER RATE = 1 . 278

FARE CATEGORY DISTRIBUTION SPRING, 1982 F. 19
DAY TYPE=WEEKDAY LINE TYPE=URBAN RADIAL TIME PERIOD=PEAK HOURS
REPORTED ADJUSTED FARE CATEGORY DISTRIBUTION DISTRIBUTION FARE
FARE NON-COMPLIANCE 1 aOO% 0.82% 0.0 ¢
FARELESS SQUARE 2.44% 1 0 99% 0.0 ¢
TRI-MET EMPLOYEES 0.81% 0.66% 0.0 ¢
25¢ HONORED CITIZENS 12.51% 10.22% 25.00¢ 'i
45¢ YOUTH 13.73% 11.22% 45.00¢
65¢ ADULT 26.95% 22.01% 65.00¢
90¢ ADULT 9.50% ].]6% 90.00¢
$lo00 VANCOUVER 0.0 % 0.0 % 100.00¢
$14 YOUTH PASS 11 0 98% 9·79% 31.90¢
$21 ADULT PASS 28o88% 23.59% so. 14¢
$29 ADULT PASS 13.42% 10.96% 53.62¢
$35 VANCOUVER PASS 0.0 % 0.0 % 123.54¢
COUNTY PASS 0 0 18% 0 0 15% 88.23¢
$6 HONORED CITIZEN PASS 1 .02% 0.83% sr.21¢
122.43% 100.00%
AVERAGE FARE = 50o28¢ BOARDING FARE = 36.86¢ TRANSFER SLIP RATE = 1 0 201 TOTAL TRANSFER RATE = 1. 364

FARE CATEGORY DISTRIBUTION SPRING, 1982 F. 20 ~.,
DAY TYPE=WEEKDAY LINE TYPE=PEAK HOUR TIME PERIOD=PEAK HOURS
REPORTED ADJUSTED F ARE .cAT E G 0 R Y DISTRIBUTION DISTRIBUTION FARE
FARE NON-COMPLIANCE 1 .00% 0.60% 0.0 ¢
FARELESS SQUARE 2.44% 1 .48% 0.0 ¢
TRI-MET EMPLOYEES 0.81% 0.49% 0.0 ¢
25¢ HONORED CITIZENS 26.82% 16.22% 25.00¢
45¢ YOUTH 0.0 % 0~0 % 45.00¢
65¢ ADULT 18.03% 10.91% 65.00¢
90¢ ADULT 43.74% 26e46% 90.00¢
$1.00 VANCOUVER 0.0 % 0.0 % 100.00¢
$14 YOUTH PASS 3.64% 2.20% 31 0 90¢
$21 ADULT PASS 16.00% 9.68% so 0 14¢
$29 ADULT PASS 50.37% 30.47% 53.62¢
$35 VANCOUVER PASS 0.0 % 0.0 % 123.54¢
COUNTY PASS 0. 18% 0. 11% 88.23¢
$6 HONORED CITIZEN PASS 2.27% 1. 37% 51.21¢
165.30% 100.00%
AVERAGE FARE 57.66¢ BOARDING FA~E = 43.94¢ TRANSFER SLIP RATE = 1. 267 TOTAL TRANSFER RATE 1 . 3 l 2

..
FARE CATEGORY DISTRIBUTION SPRING, 1982 F. 21
DAY TYPE~WEEKDAY LINE TYPE=LOCAL RADIAL TIME PERIOD=PEAK HOURS
REPORTED ADJUSTED FARE CATEGORY DISTRIBUTION DISTRIBUTION FARE
FARE NON-COMPLIANCE
FARELESS SQUARE
TRI-MET EMPLOYEES
25¢ HONORED CITIZENS
45¢ YOUTH
65¢ ADULT
90¢ ADULT
$1.00 VANCOUVER
$14 YOUTH PASS
$21 ADULT PASS
$29 ADULT PASS
$35 VANCOUVER PASS
COUNTY PASS
$6 HONORED CITIZEN PASS
AVERAGE FARE = 52.56¢ BOARDING FARE = 44.11¢ TRANSFER SLIP RATE = 1.112 TOTAL TRANSFER RATE= 1.191
1.00% 0.83% 0.0 ¢
0.0 ¢
0.81% 0.6]% 0.0 ¢
11.42% 9.49% 25.00¢
13.82% 11.48% 45.00¢
21 . 30% 17.69% 65.00¢
16.22% 13.48% 90.00¢
0.0 % 100.00¢
9.63% 8.00% 31.90¢
23.33% 19.38% so. 14¢
l 5 • 9 4% -. . 53 . 6 2¢
0.0 % 0.0 % 123.54¢
0. 18% 0.15% 88.23¢
1 .06% 0.88% 51.21¢

FARE CATEGORY DISTRIBUTION SPRING9 1982 F. 22
DAY TYPE=WEEKDAY LINE TYPE=GRID / FEEDER TIME PERIOO=PEAK HOURS
REPORTED ADJUSTED FARE CATEGORY DISTRIBUTION DISTRIBUTION FARE
FARE NON-COMPLIANCE 1. oo% 0.]8% 0.0 ¢
FARELESS SQUARE 2.44% 1. 90% 0.0 ¢
TRI-MET EMPLOYEES 0.81% 0.63% 0.0 ¢
25¢ HONORED CITIZENS 14.49% 11.31% 25.00¢
45¢ YOUTH 19.90% 15.53% 45~00¢
65¢ ADULT 2].11% 21 • 16% 65.00¢
90¢ ADULT 9·79% ].64% 90.00¢
$1.00 VANCOUVER 0.0 % 0.0 % 100.00¢
$14 YOUTH PASS 12.30% 9.60% 31 . 90¢
$21 ADULT PASS 22.64% 1].67% so. 14¢
$29 ADULT PASS ·16. 33% 12.]4% 53.62¢
$35 VANCOUVER PASS 0.0 % 0.0 % 123.54¢
COUNTY PASS 0. 18% 0. 14% 88.23¢
$6 HONORED CITIZEN PASS 1 . 14% 0.89% 51.21¢
128.13% 100.00%
AVERAGE FARE = 49.78¢ BOARDING F~.RE = 35.26¢ TRANSFER SLIP RATE = 1. 262 TOTAL TRANSFER RATE = 1 . 41 2

FARE CATEGORY DISTRIBUTION SPRING, 1982 F. 23
DAY TYPE=WEEKDAY LINE TYPE=ALL TIME PERIOD=DAY BASE
REPORT.E D ADJUSTED FARE CATEGORY DISTRIBUTION DISTRIBUTION F. ARE
FARE NON-COMPLIANCE 1 .oo% 0.79% 0.0 ¢
FARELESS SQUARE 2.44% 1 ° 93% 0.0 ¢
TRI-MET EMPLOYEES 0.81% 0.64% 0.0 ¢
25¢ HONORED CITIZENS 13.63% 10.80% 25.00¢
45¢ YOUTH 13.70% 10.86% 45.00¢
65¢ ADULT 28.06% 22.24% 65.00¢
90¢ ADULT 11 0 95% .9 .47% 90.00¢ . ~ . " l $1.00 VANCOUVER 0.63% o.so% 100.00¢
$14 YOUTH PASS 11 0 04% 8.]5% 31 .90¢
$21 ADULT PASS 25.73% 20.39% 50. 14¢
$29 ADULT PASS 15.46% 12.25% - 53-.-62¢
$35 VANCOUVER PASS 0.41% 0.32% 123.54¢
C 0 Ul~ TY PASS 0. 18% 0.14% 88.23¢
$6 HONORED CITIZEN PASS 1 . 14% 0.90% 51.21¢
126 0 18% 100.00%
AVERAGE FARE = 51 . 64¢ BOARDING FARE = 38.80¢ TRANSFER SLIP RATE 1 0 20 1 TOTAL TRANSFER RATE = 1 . 3 3 1

FARE CATEGORY DISTRIBUTION SPRING9 1982 F o 24
DAY TYPE=WEEKDAY LINE TYPE=REGIONAL TIME PERIOD=DAY BA'SE
REPORTED ADJUSTED FARE CATEGORY DISTRIBUTION DISTRIBUTION FARE
FARE NON-COMPLIANCE 1 0 oo% 0.80% 0.0 ¢
FARELESS SQUARE 2.44% 1 0 95% 0.0 ¢
TRI-MET EMPLOYEES 0.81% 0.65% 0.0 ¢
25¢ HONORED CITIZENS 9o27% ].42% 25.00¢
45¢ YOUTH 13.39% 10.]2% 45.00¢
65¢ ADULT 29 0 13% 23.32% 65.00¢
90¢ ADULT 20.88% 16.]1% 90.00¢
$1.00 VANCOUVER 0.0 % 0.0 % 100.00¢
$14 YOUTH PASS 8.01% 6.41% 31.90¢
$21 ADULT PASS 20.84% 16.68% so. 14¢
$29 ADULT PASS 18 0 16% 14.53% 53.62¢ "\
$35 VANCOUVER PASS 0.0 % 0.0 % 123.54¢
COUNTY PASS 0 0 18% 0 014% 88.23¢
$6 HONORED CITIZEN PASS 0.81% 0.65% 51.21¢
124.92% 100.00%
AVERAGE FARE = 55.54¢ BOARDING FARE = 43.90¢ TRANSFER SLIP RATE = 1.180 TOTAL TRANSFER RATE 1. 265

FARE CATEGORY DISTRIBUTION SPRING9 1982 F. 25
DAY TYPE=WEEKDAY LINE TYPE=URBAN RADIAL TIME PERIOD=DAY BASE
REPORTED ADJUSTED FARE CATEGORY DISTRIBUTION DISTRIBUTION FARE
FARE NON-COMPLIANCE 1 .oo% 0.82% 0.0 ¢
FARELESS SQUARE 2.44% 1 ° 99% 0.0 ¢
TRI-MET EMPLOYEES 0.81% 0.66%. 0.0 ¢
25¢ HONORED CITIZENS 14.]2% 12.02% 25.00¢
45¢ YOUTH 1_3 .93% 11.37% 45.00¢
65¢ ADULT 2].36% 22.33% 65.00¢
90¢ ADULT ].82% 6.38% 90.00¢
$1.00 VANCOUVER 0.0 % 0.0 % 100.00¢
$14 YOUTH PASS 10.92% 8o9l% 31 .90¢
$21 ADULT PASS "28.05% 22.89% 50 0 14¢
$29 ADULT PASS 14.09% 11 . SO% 53.62¢
$35 VANCOUVER PASS 0.0 % 0.0 % 123.54¢
COUNTY PASS 0. 18% 0. 15% 88.23¢
$6 HONORED CITIZEN PASS 1 . 21% 0.98% 51.21¢
122.54% 100.00%
AVERAGE FARE = 49.50¢ BOARDING FARE = 36.50¢ TRANSFER SLIP 'RATE = 1 . 201 TOTAL TRANSFER RATE = 1. 356

FARE CATEGORY DISTRIBUTION SPRING, 1982 F. 26 -....,,
DAY TYPE=WEEKDAY LINE TYPE=PEAK HOUR TIME PERIOD=OAY BASE
REPO~TED ADJUSTED FARE CATEGORY DISTRIBUTION DISTRIBUTION FARE
FARE NON-COMPLIANCE 1. oo% 0.59% 0.0 ¢
FARELESS SQUARE 2.44% 1 . 4 3% 0.0 ¢
TRI-MET EMPLOYEES 0.81% 0.47% 0.0 ¢
25¢ HONORED CITIZENS 10. 14% 5.94% 25.00¢ ,,J ,-;1
45¢ YOUTH 0.0 % 0.0 % 45.00¢
65¢ ADULT 25.81% 15. 11% 65.00¢
90¢ ADULT 41 0 66% 24.40% 90.00¢
$1.00 VANCOUVER 0.0 % 0.0 % 100o00¢
$14 YOUTH PASS 1 0 92% l . 13% 3 l . 90¢
$21 ADULT PASS 33. 15% 19.42% so. 14¢
$29 ADULT PASS 52.80% 30.92% 53.62¢
$35 VANCOUVER PASS 0.0 % 0.0 % 123.54¢
COUNTY PASS 0 .. 18% 0. 1 1% 88.23¢
$6 HONORED CITIZEN PASS 0.82% 0.48% 51.21¢
170.73% 100.00%
AVERAGE FARE = 60.29¢ BOARDING FARE = 43.91¢ TRANSFER SLIP RATE = 1 . 267 TOTAL TRANSFER RATE = 1 . 3 7 3

FARE CATEGORY DISTRIBUTION SPRING9 1982 F. 27
DAY TYPE=WEEKDAY LINE TYPE=LOCAL RADIAL TIME PERIOD=DAY BASE
REPORTED ADJUSTED FARE CATEGORY DISTRIBUTION DISTRIBUTION
FARE NON-COMPLIANCE
FARELESS SQUARE
TRI-MET EMPLOYEES
25¢ HONORED CITIZENS
45¢ YOUTH
65¢ ADULT
90¢ ADULT
$1.00 VANCOUVER
$14 YOUTH PASS
$21 ADULT PASS
$29 ADULT PASS
$35 VANCOUVER PASS
COUNTY PASS
$6 HONORED CITIZEN PASS
1.00% 0.95%
2.44% 2.33%
0.81% 0.77%
9.47%
13.81%
25.80%
12.45%
9.73%
2 1 0 1 2%
7. 14%
0.0 %
0. 18%
0.81%
9.04%
13. 18%
24.63%
11 • 89%
0.0 %
20. 16%
6.81%
0.0 %
0. 17%
0.?8%
104.76% 100.00%
AVERAGE FARE = 52.17¢ 40.32¢
1 • 16 3 1. 294
BOARDING FARE TRANSFER SLIP RATE = TOTAL TRANSFER RATE =
FARE
0.0 ¢
0.0 ¢
0.0 ¢
25.00¢
45.00¢
65.00¢
90.00¢
100.00¢
31 . 90¢
50. 14¢
53.62¢
123.54¢
88.23¢
51.21¢
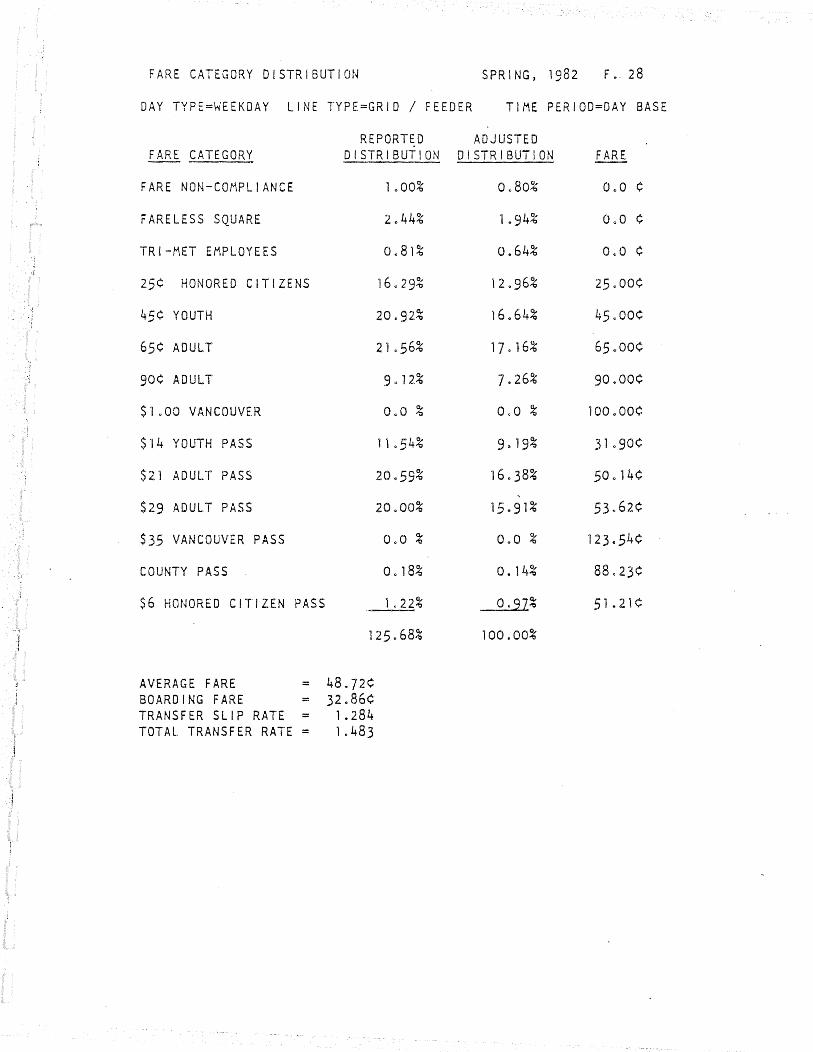
FARE CATEGORY DISTRIBUTION SPRING, 1982 F •. 28
DAY TYPE=WEEKDAY LINE TYPE=GRID I FEEDER TIME PERIOD=DAY BASE ' REPORTED ADJUSTED
FARE CATEGORY DISTRIBUTION DISTRIBUTION FARE
FARE NON-COMPLIANCE 1 .00% 0.80% 0.0 ¢
FARELESS SQUARE 2.44% 1. 94% 0.0 ¢
TRI-MET EMPLOYEES 0.81% 0.64% 0.0 ¢
25¢ HONORED CITIZENS 16.29% 12.96% 25.00¢
45¢ YOUTH 20.92% 16.64% 45.00¢
65¢ ADULT 21 . 56% 17. 16% 65.00¢
90¢ ADULT 9 0 12% ].26% 90.00¢
$1.00 VANCOUVER 0.0 % 0.0 % 100.00¢
$14 YOUTH PASS 11 • 54% 9. 19% 3lo90¢
$21 ADULT PASS 20.59% 16.38% 50 0 14¢
$29 ADULT PASS 20.00% 15.91% 53.62¢
$35 VANCOUVER PASS OoO % 0.0 % 123.54¢
COUNTY PASS o. 18% 0. 14% 88.23¢
$6 HONORED CITIZEN PASS 1. 22% o.~z% 51.21¢
·J 125.68% 100.00%
AVERAGE FARE = 48.]2¢ BOARDING FARE = 32.86¢ TRANSFER SLIP RATE = 1 . 284 TOTAL TRANSFER RATE = l. 483